Embed Size (px)
Citation preview
i
The 2009 Budget and Issues Relating to Women and
Children Welfare
Centre for Budget Advocacy (ISODEC) and UNICEF Ghana Report
August 2009
ii
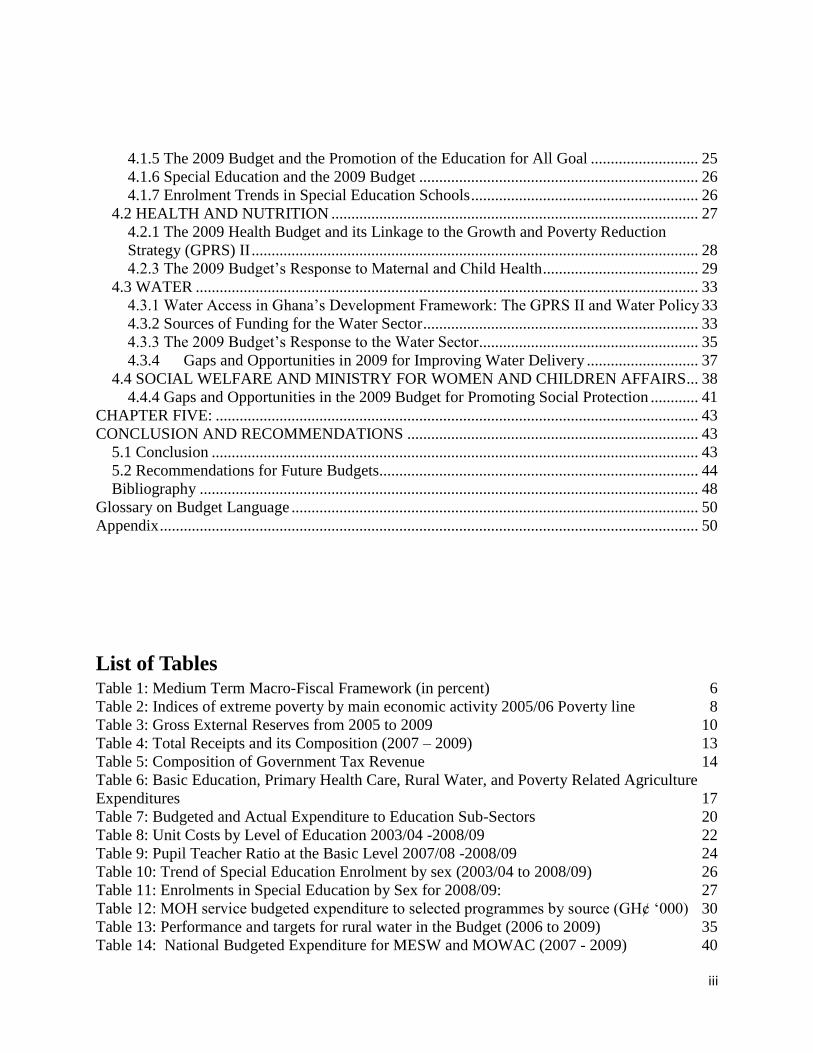
Table of Contents List of Tables ................................................................................................................................. iii Table of Figures ............................................................................................................................. iv Acknowledgements ......................................................................................................................... v Acronyms ....................................................................................................................................... vi
Key Definitions ......................................................................................................................... vii
Executive Summary ..................................................................................................................... viii
CHAPTER ONE – INTRODUCTION ........................................................................................... 1 1.1 Background ........................................................................................................................... 1 1.2 Context and Rationale for Study ........................................................................................... 1 1.3 Scope and objectives of study ............................................................................................... 3
1.4 Methodology ......................................................................................................................... 3 1.5 Limitations of study .............................................................................................................. 3
1.6 Structure of the report ........................................................................................................... 4 CHAPTER TWO THE MACROECONOMIC FRAMEWORK AND ITS IMPACTS ON
CHILDREN AND WOMEN‘S RIGHTS ....................................................................................... 5
2.1 Macroeconomic Framework ................................................................................................. 5 2.1.1 Real GDP Growth ..................................................................................................... 6 2.1.2 Inflation Rate Trends ................................................................................................ 8
2.1.3 Budget Deficits .............................................................................................................. 9
2.1.4 Gross International Reserves ....................................................................................... 10 2.2 The 2009 Budget and its Response to the Global Crisis ................................................ 11 2.3 Effect of the Global Crisis on the Macroeconomic Framework ......................................... 11
CHAPTER THREE: REVENUE MOBILIZATION AND BUDGETED EXPENDITURE FOR
THE PROMOTION OF WOMEN AND CHILDREN‘S RIGHTS ............................................. 13 3.1 Revenue Generation Analysis and its Relation to Children‘s and Women‘s Rights .......... 13
3.1.1 Composition of Total Receipts .................................................................................... 13 3.1.2 Building a Fair Tax System ......................................................................................... 14 3.1.3 Measures for Increasing Fiscal Space .......................................................................... 15
Tax Resources ....................................................................................................................... 15 3.1.4 Revenue Generation Sources and Counter-cyclical Policy ......................................... 16
3.2 Budgeted and Actual Expenditures in Selected Sectors ..................................................... 16 CHAPTER FOUR: SELECTED SECTORS THAT AFFECT WOMEN AND CHILDREN ..... 19
4.1 Education ........................................................................................................................... 19 4.1.1 The 2009 Education Budget and its Linkage to the Growth and Poverty Reduction
Strategy (GPRS) II ................................................................................................................ 19
4.1.2 Sources of Funding for the Education Sector .............................................................. 21 4.1.3 Budgeted Expenditure to the Education Sector ........................................................... 21 4.1.4 Unit Costs in Education Sector .................................................................................... 22
iii
4.1.5 The 2009 Budget and the Promotion of the Education for All Goal ........................... 25 4.1.6 Special Education and the 2009 Budget ...................................................................... 26 4.1.7 Enrolment Trends in Special Education Schools ......................................................... 26
4.2 HEALTH AND NUTRITION ............................................................................................ 27
4.2.1 The 2009 Health Budget and its Linkage to the Growth and Poverty Reduction
Strategy (GPRS) II ................................................................................................................ 28 4.2.3 The 2009 Budget‘s Response to Maternal and Child Health ....................................... 29
4.3 WATER .............................................................................................................................. 33 4.3.1 Water Access in Ghana‘s Development Framework: The GPRS II and Water Policy 33
4.3.2 Sources of Funding for the Water Sector ..................................................................... 33
4.3.3 The 2009 Budget‘s Response to the Water Sector....................................................... 35 4.3.4 Gaps and Opportunities in 2009 for Improving Water Delivery ............................ 37
4.4 SOCIAL WELFARE AND MINISTRY FOR WOMEN AND CHILDREN AFFAIRS... 38
4.4.4 Gaps and Opportunities in the 2009 Budget for Promoting Social Protection ............ 41 CHAPTER FIVE: ......................................................................................................................... 43
CONCLUSION AND RECOMMENDATIONS ......................................................................... 43 5.1 Conclusion .......................................................................................................................... 43 5.2 Recommendations for Future Budgets................................................................................ 44
Bibliography ............................................................................................................................. 48 Glossary on Budget Language ...................................................................................................... 50
Appendix ....................................................................................................................................... 50
List of Tables Table 1: Medium Term Macro-Fiscal Framework (in percent) 6
Table 2: Indices of extreme poverty by main economic activity 2005/06 Poverty line 8 Table 3: Gross External Reserves from 2005 to 2009 10 Table 4: Total Receipts and its Composition (2007 – 2009) 13 Table 5: Composition of Government Tax Revenue 14 Table 6: Basic Education, Primary Health Care, Rural Water, and Poverty Related Agriculture
Expenditures 17
Table 7: Budgeted and Actual Expenditure to Education Sub-Sectors 20
Table 8: Unit Costs by Level of Education 2003/04 -2008/09 22 Table 9: Pupil Teacher Ratio at the Basic Level 2007/08 -2008/09 24 Table 10: Trend of Special Education Enrolment by sex (2003/04 to 2008/09) 26 Table 11: Enrolments in Special Education by Sex for 2008/09: 27 Table 12: MOH service budgeted expenditure to selected programmes by source (GH¢ ‗000) 30 Table 13: Performance and targets for rural water in the Budget (2006 to 2009) 35 Table 14: National Budgeted Expenditure for MESW and MOWAC (2007 - 2009) 40
iv
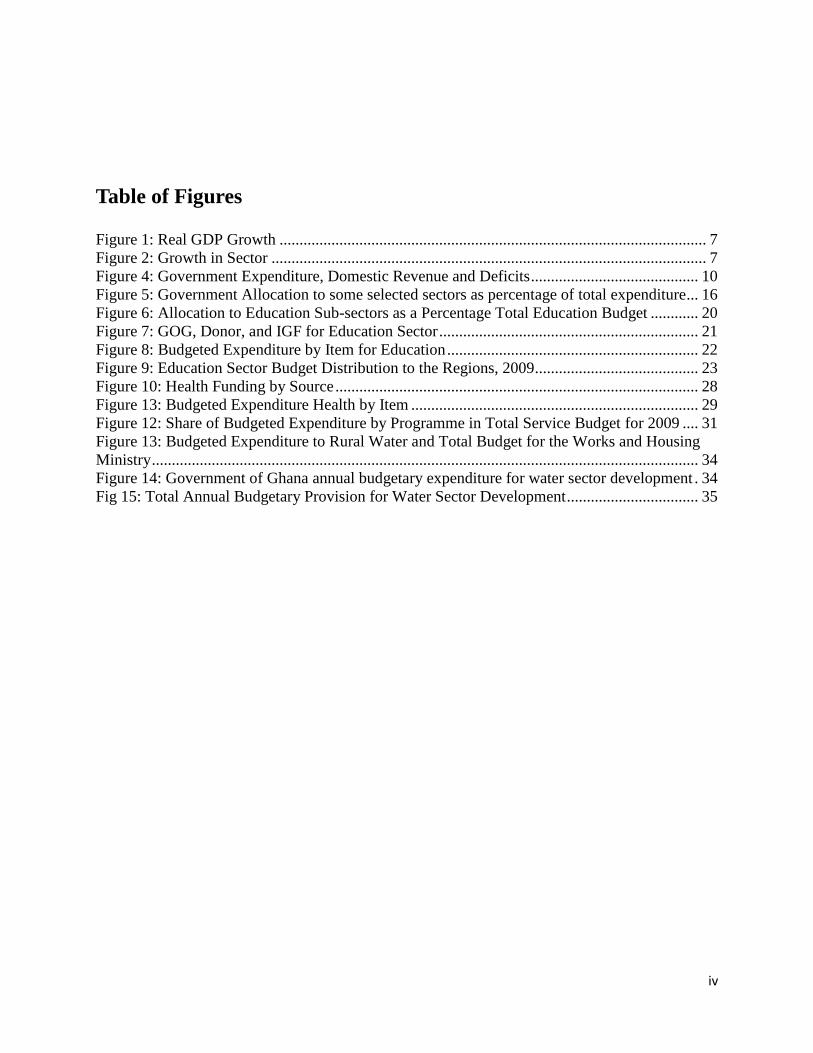
Table of Figures
Figure 1: Real GDP Growth ........................................................................................................... 7
Figure 2: Growth in Sector ............................................................................................................. 7 Figure 4: Government Expenditure, Domestic Revenue and Deficits .......................................... 10 Figure 5: Government Allocation to some selected sectors as percentage of total expenditure ... 16 Figure 6: Allocation to Education Sub-sectors as a Percentage Total Education Budget ............ 20 Figure 7: GOG, Donor, and IGF for Education Sector ................................................................. 21
Figure 8: Budgeted Expenditure by Item for Education ............................................................... 22
Figure 9: Education Sector Budget Distribution to the Regions, 2009......................................... 23 Figure 10: Health Funding by Source ........................................................................................... 28 Figure 13: Budgeted Expenditure Health by Item ........................................................................ 29
Figure 12: Share of Budgeted Expenditure by Programme in Total Service Budget for 2009 .... 31 Figure 13: Budgeted Expenditure to Rural Water and Total Budget for the Works and Housing
Ministry ......................................................................................................................................... 34 Figure 14: Government of Ghana annual budgetary expenditure for water sector development . 34 Fig 15: Total Annual Budgetary Provision for Water Sector Development ................................. 35
v
Acknowledgements
The team of analysts for this report were Nicholas Adamtey (team leader), Ama Blankson-
Anaman, Charlotte Bani, Joseph Chonia, Di Luong and Chachu Daniel.
This report would not have been possible without financial support from UNICEF Ghana. The
ACMA team of UNICEF Ghana deserves commendation for reviewing the first draft of the
report. To this end, Charles Dzradosi and Juliana Lindsey deserve special mention. In addition,
supporting information was provided by the Ministry of Finance and Economic Planning,
Ministry of Education, Ministry of Health and Ministry of Water Resources, Works and
Housing. Plaudits also go to the Department of Social Welfare and Department of Community
Development for making available additional budget data.
vi
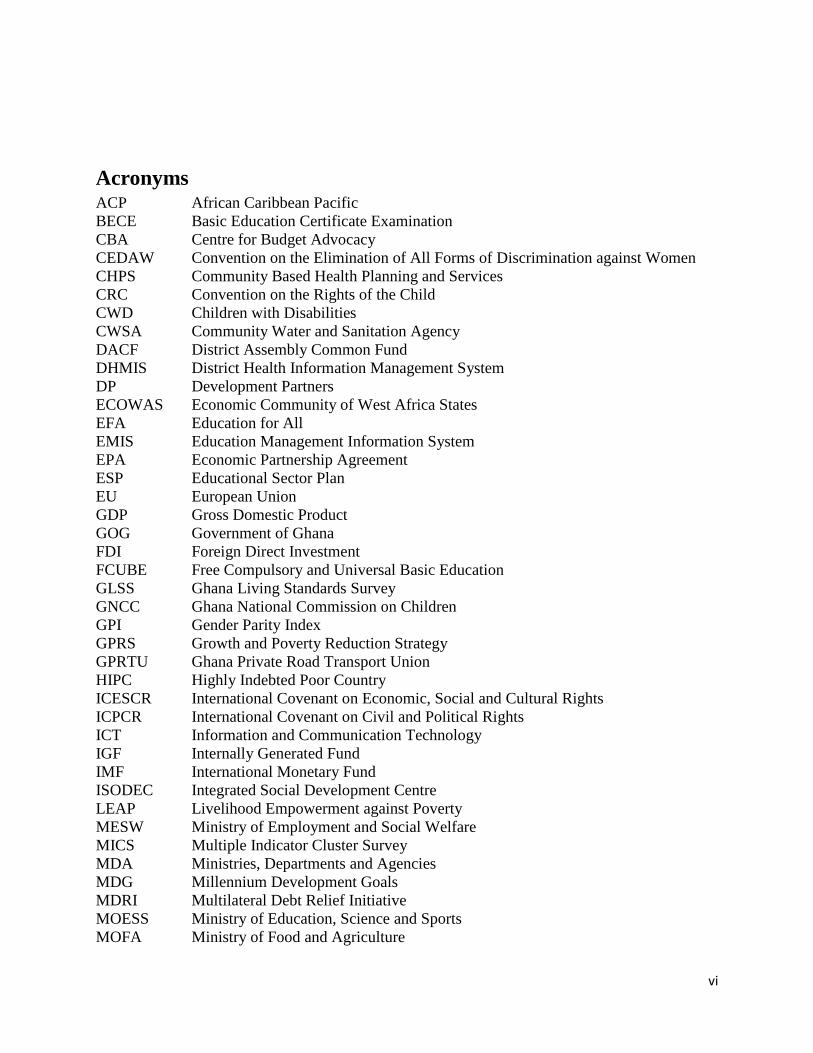
Acronyms ACP African Caribbean Pacific
BECE Basic Education Certificate Examination
CBA Centre for Budget Advocacy
CEDAW Convention on the Elimination of All Forms of Discrimination against Women
CHPS Community Based Health Planning and Services
CRC Convention on the Rights of the Child
CWD Children with Disabilities
CWSA Community Water and Sanitation Agency
DACF District Assembly Common Fund
DHMIS District Health Information Management System
DP Development Partners
ECOWAS Economic Community of West Africa States
EFA Education for All
EMIS Education Management Information System
EPA Economic Partnership Agreement
ESP Educational Sector Plan
EU European Union
GDP Gross Domestic Product
GOG Government of Ghana
FDI Foreign Direct Investment
FCUBE Free Compulsory and Universal Basic Education
GLSS Ghana Living Standards Survey
GNCC Ghana National Commission on Children
GPI Gender Parity Index
GPRS Growth and Poverty Reduction Strategy
GPRTU Ghana Private Road Transport Union
HIPC Highly Indebted Poor Country
ICESCR International Covenant on Economic, Social and Cultural Rights
ICPCR International Covenant on Civil and Political Rights
ICT Information and Communication Technology
IGF Internally Generated Fund
IMF International Monetary Fund
ISODEC Integrated Social Development Centre
LEAP Livelihood Empowerment against Poverty
MESW Ministry of Employment and Social Welfare
MICS Multiple Indicator Cluster Survey
MDA Ministries, Departments and Agencies
MDG Millennium Development Goals
MDRI Multilateral Debt Relief Initiative
MOESS Ministry of Education, Science and Sports
MOFA Ministry of Food and Agriculture
vii
MOH Ministry of Health
MOWAC Ministry of Women and Children‘s Affairs
NDC National Democratic Congress
NGO Non-Governmental Organization
NHIL National Health Insurance Levy
NHIS National Health Insurance Scheme
NSPS National Social Protection Strategy
ODA Official Development Assistance
OLPC One Laptop per Child
OVC Orphans and Vulnerable Children
PE Personnel Emoluments
PTR Pupil-Teacher Ratio
POW Programme of Work
PWD Persons with Disabilities
STC State Transport Company
SSNIT Social Security and National Interest Trust
UDHR Universal Declaration of Human Rights
UN United Nations
UNICEF United Nations Children‘s Fund
UPE Universal Primary Education
UTDBE Untrained Teachers Diploma in Basic Education
VAT Value Added Tax
Key Definitions Budgeted Expenditure- refers to the amount government has planned to allocate to a Ministry at
the beginning of the fiscal year
Actual Expenditure - refers the amount that the government actually disburses to the Ministry for
the fiscal year. This amount can be different from what was budgeted to the Ministry at the
beginning of the fiscal year.
viii
Executive Summary
This report is a joint study between the Centre for Budget Advocacy (CBA) of the Integrated
Social Development Centre and UNICEF Ghana on the 2009 budget and its implications for
women and children. A number of national, regional and international instruments make
provision for securing the rights of women and children. At the international level, the
International Bill of Rights, Convention on All Forms of Discrimination against Women
(CEDAW), Convention on the Rights of a Child (CRC), among others, provide key benchmarks
in assessing government policies and their implementation with regards to children and women.
Budgets are also instruments to achieve provisions made in these conventions and legal
documents. Analysis of the budgeted expenditure and the actual expenditure incurred
subsequently points to the priorities of the government towards securing the welfare of children
as well as promoting gender equity.
The global financial crisis is likely to cause serious financial constraints to the generation of
revenue for government as well as reduction in government expenditure. These occurrences are
very likely to affect efforts at generating revenue and expenditure utilization which will have
implications on women and children. It is therefore important to know how the budget policies
address the impacts arising from the crises as well as the social protection mechanisms in place
for women and children. The study sought to assess how the 2009 budget addresses these
concerns.
The study found that generally programmes in the 2009 budget, with respect to sectors critical
for promoting women‘s and children‘s rights, fell in line with the policy framework of the GPRS
II, even though there was more focus on selected macroeconomic targets including GDP growth,
the inflation rate, and gross international reserves among others. However, targets for some
macroeconomic indicators with welfare implications on the economy, like employment, were
neglected. The global financial crisis is expected to have negative impact on real GDP growth.
Inflation targets have also been missed over the years and budget deficits has been rising. The
2009 budget outlined some measures for addressing the effects of the current global crises;
however, the gains to be realized from these measures are not likely to be immediate.
The study found that even though actual expenditure at the end of 2008 was far in excess than
budgeted expenditure, actual expenditures in sectors critical to women and children, were far
below the budgeted expenditure. For example, the actual expenditure on basic education as a
percentage of total education expenditure in 2008 was 48.4 per cent, far below the budgeted
ix
expenditure of 67.21 per cent. Also, less than half of the 2008 budgeted expenditure on rural
water was actually spent. This revealed the low commitment level of government to such areas
where there is a possibility for additional expenditures.
The study also found that there were some regional disparities in the distribution of expenditures
(especially for education) with the three northern regions receiving lower education expenditure
for 2009. Information on enrollments for public education indicates that total public school
enrollment is higher in the Northern region than in the Volta and Greater Accra regions. It was
observed that Ashanti region‘s total enrollment is four times that of the Upper West, however,
the Ashanti region‘s budgeted expenditure is about seven times higher than that of the Upper
West region.
In addition, other important areas to the welfare of children have not been captured in the budget.
An example is protection for children with disability who are not provided with adequate
protection and welfare from the State. As these issues are not considered as priority to
government agencies responsible for women and children, budgetary allocations to address these
issues are non existent.
Most ministries, especially Education and Health, have extremely high Item 1 budgets for
personnel emoluments. Civil servants certainly need a living wage, but the price of these high
wages is lack of money for service delivery. Nurses find themselves in clinics with no
equipment and social workers pay for transport to monitor programmes out of their own pockets.
Little attention has been paid to the potential impact of the food, fuel, and financial crises on
households‘ wellbeing, though macro-economic impacts have been analyzed. It is possible that
households will be unable to cope with reduced remittances or reduced income from export
industries, especially on top of already high food prices since late 2007. Government should
explain how its budget priorities reflect its plans to assist households to withstand these shocks.
For the budget to be relevant to women and children, it is important that there is coordination
among the various government bodies. What is often lacking is monitoring and evaluation of
programmes and projects not only in the budgets but also in national plans to assess progress in
improving the welfare of women and children. Though sectors like education and health produce
reports that are relevant when it comes to women and children, there is no comprehensive report
(that is multi sector report) that assesses the overall performance in securing the welfare and
protection of women and children.
Finally, MOFEP and other MDAs should make available to the public information on the actual
amounts released from MOFEP to each MDA. This is a basic piece of information that the
public has a right to know, and the authors were disappointed to find that it was extraordinarily
difficult to obtain this information. Our experience is also reflected in Ghana‘s poor score on
this aspect in the Open Budget Index.
1
CHAPTER ONE – INTRODUCTION
1.1 Background
This report is a joint study between the Centre for Budget Advocacy (CBA) of the Integrated
Social Development Centre and UNICEF Ghana on the 2009 budget and its implications for
women and children1. Children under 15 years constitute close to 44 percent of the population
while the female population is more than half of the population in Ghana. With the high
population growth rate in the country, there is the need for development indicators to show
progress towards securing the welfare and delivering the basic rights of the greater majority of
the population (women and children).
A number of national, regional and international instruments make provision for securing the
rights of women and children. At the international level, the International Bill of Rights2,
Convention on All Forms of Discrimination against Women (CEDAW), Convention on the
Rights of a Child (CRC), among others, provide key benchmarks in assessing government
policies and its implementation with regards to children and women. At the regional level, the
African Charter on Human and Peoples Rights and their optional protocols relating to women
and children provide useful basis for national policies. Local laws, including national
constitutions also provide a context for securing human rights. In the case of Ghana, the 1992
constitution and the Children‘s Act of 1998, Act (560), the Domestic Violence Act, and several
others provide the legal basis and direction of policy toward enhancing the welfare and
protection of women and children.
Budgets are also documents that act as instruments to achieve provisions made in these
conventions and legal documents. Analysis of the allocations made in the budget and the actual
expenditure incurred subsequently in different sectors and programmes points to the priorities of
the government towards securing the welfare of children as well as promoting gender equity.
Poor investments on child protection and gender equity are in themselves a reflection of the low
priority governments attach to these sectors in terms of planning and implementation. The
neglect of vulnerable children - street children, orphans, migrant children, trafficked and sexually
abused children - in our policy and financial statements could become obvious when we review
budgetary allocations over the years. It is also important to state that better outcomes in any
sector, for instance, education, health, water or rural development, depend not just on allocations
but also on proper utilization of those allocations.
1.2 Context and Rationale for Study
Few studies have assessed the potential and actual impacts of the global crises on the Ghanaian
economy. According to IMF World Bank reports, Ghana is very vulnerable to the effects of the
global economic and financial crisis in several. Consequently, the IMF revised downward the
1 Unless specified, the use of the term child or children refers to the section of the population below the age of 18
years 2 The International Bill of Rights includes the United Nations Covenant on Economic, Social and Cultural Rights,
the International Covenant on Civil and Political Rights and the United Nations Declaration on Human Rights.
2
GDP growth forecast for 2009 by 3.4 percentage points since April 2008 and put Ghana on a list
of 26 countries highly vulnerable to an external shock of declining trade, remittances, foreign
direct investments and external assistance. Ghana is particularly vulnerable to a trade shock
resulting in very high current account deficit3. Some of the factors that will compound the crisis
are:
Very high budget deficit;
Aid dependency;
Export dependency (primary commodities); and
Exchange rate depreciation
The import dependency on rice and wheat has made Ghana vulnerable to increases in
international food prices. Higher international food prices have been transmitted to domestic
food prices in Ghana, for example because of substitution in consumption.4 A 2008 study by the
World Bank found that the ‗rising food prices for rice, maize, and other cereals would together
lead to an increase in poverty, but that by contrast to a number of other countries, this increase,
while not negligible, may not be as large as feared‘. Specifically, they found that a 25percent
increase in the price of rice maze and other cereals would lead to an increase in poverty below
one percentage point; however that could represents close to 200,000 persons falling into
poverty5. A 2009 study by the World Food Programmed has observed a number of occurrences
in Ghana due to the crises. This include a depreciated currency, the cedi has lost about 23% of its
value against the US$ and 19% against the euro in 2008, which has contributed to a very high
current-account deficit, rising debt, low international reserves and high and rising inflation.
Other effects include a reduction in capital inflows making it more difficult for the government
to finance the budget. Further there has been a fall in foreign remittances reducing the ability of
households, who depend largely on remittances, to access food and other basic needs. For
example, Quartey (2008) notes that 48% of remittances are used for living expenses, presumably
including food. The IMF therefore estimates that Ghana could need an additional US$1.4 billion
in balance-of-payment financing if the shocks regarding trade, remittances and foreign
materialize6
Politically, the year 2008 saw keenly contested elections with the swearing in of a new
government in early January 2009. The new government of the National Democratic Congress
(NDC) was able to present its budget statement before the end of the first quarter. The change in
government has resulted in some changes in policy direction as well as changes in the names of
3 IMF (2009) The Implications of the Global Financial Crisis for Low-Income Countries Washington, DC, and
World Bank (2008) IDA Program Document for a Proposed Credit. No. 41842-GH 4 World Food Programme (2009) Assessing the Impacts of the Global Economic and Financial Crisis on Vulnerable
Households in Ghana 5 World Bank, 2008 Assessing the Potential Impact on Poverty of Rising Cereal Proces: The Case of Ghana. WPS
4740 6 IMF (2009). The Implications of the Global Financial Crisis for Low-Income Countries
Washington, DC
3
some key ministries. With the current global crisis and the political environment, it would be
important to look at how budgetary allocations meet the conventions and the legal documents
mentioned above. The global financial crisis is likely to cause serious financial constraints to the
generation of revenue for government as well as reduction in government expenditure. One
wonders whether efforts at generating revenue and reduction in expenditure will have
implications on women and children. It is also important to know how the budget addresses the
crisis as well as the social protection mechanisms in place for women and children.
1.3 Scope and objectives of study The main goal of the study is to analyze the national budget with the view to provide decision-
makers and other stakeholders with information and data to make informed decisions during
policy formulation, plan preparation and budgeting regarding children and women. The study
used the 2009 Budget as the main source of reference. This was supported by other policies and
programme documents and reports for the three main social sectors: education, health and water.
The GPRS II was consulted in assessing linkages between programmes and the Budget. In
analyzing financial information and trends, earlier Budget statements and review reports were
referred to. The main objectives of the study were:
To assess the overall level of response by policies, programme and financial commitment
in the Budget to children and women‘s issues in Ghana
Provide an analysis of the Budgetary allocations in terms of their adequacy, efficiency or
equity to address children‘s and women‘s issues;
Identify gaps and opportunities in the Budget which UNICEF should address in
collaboration with Government and Development Partners (DPs); and
Use the outcomes of the Analysis to advocate for enhanced policies and budgetary
allocations by Government and DPs for women and children in the 2010 National
Budgets and other funding frameworks
1.4 Methodology The study was largely a desk review; hence input for analysis was based on policy documents
and secondary data. These were contained in the annual Budget statements, review reports for
the sector ministries and departments, national surveys and other research reports. The report
analyses the current state of women and children as far as some key indicators on water,
education and health and nutrition are concerned. The issue of social protection for women and
children in the face of the global economic crisis is given some attention. Policy initiatives and
budgetary allocations to the various sectors were assessed in relation to issues affecting women
and children in year 2009.
1.5 Limitations of study
4
The main challenge for studies of this nature has been the availability and adequacy of relevant
data and information. The level of thoroughness of the study was partly influenced by the
quantity and quality of information contained in the 2009 national budget and other relevant
documents. For instance the national budget hardly attaches cost to specific policy initiatives.
While the programmes of work for the sector ministries proved useful, some were lacking in
presenting for instance allocation of health expenditure to the various regions. Again, analysis of
trends in some sectors was often hampered by frequent changes in the names and composition of
ministries and their responsibilities through disengagement or mergers. A sector like water has
its performance often linked to electricity and gas when it comes to the budget. It is therefore
difficult to obtain indicators on growth in the water sector alone.
1.6 Structure of the report The first chapter introduces the background, local context and rationale for the study. Also
included in this chapter are the methodology and the limitations of the study. Chapter two
discusses the macroeconomic framework of analysis followed by a review of the 2009 Budget‘s
response to the global crisis. Chapter three then considers revenue mobilization and overall
expenditure allocations to some key sectors in the budgets that affect women and children.
Chapter four then examines policies and allocation to sectors that affect women and children
(health, education, and water) and assess gaps as well as opportunities for improving the
situation. It also provided a review of social protection programmes in the 2009 Budget. The last
chapter looks at conclusions, recommendations and suggestions for input into the 2010 budget.
5
CHAPTER TWO THE MACROECONOMIC FRAMEWORK AND ITS IMPACTS
ON CHILDREN AND WOMEN’S RIGHTS
2.1 Macroeconomic Framework
The Ghana Poverty Reduction Strategy (GPRS) II which is the main development framework for
sector planning and budgeting for the country provides macroeconomic policies, strategies, and
targets for the period 2006 and 2009. Some of the macroeconomic policies are:
Continued macroeconomic stability, especially by containing inflation within single digit;
A stable Cedi/ Dollar exchange rate with prudent management that will keep the Cedi
depreciation below a 4 percent per annum ceiling;
Reduced cost of investment loans as incentives for stimulating investment in support of
private sector-led growth;
Containment of fiscal deficits and preventing them from being a major source of
monetary instability and price inflation;
An aggressive domestic revenue mobilization and its efficient use in driving the
prioritized development targets; and,
An efficient expenditure re-prioritization in favour of development expenditure and to
ensure efficiency in the use of public resources.
The macroeconomic framework in the national budget often focuses on some few selected
indicators as targets. Among these are the real GDP growth, inflation rate, gross international
reserves and the budget deficit. These targets have over the years been central to the budget.
Unfortunately however, there has been less linkage between these targets and the broader welfare
issues confronting the economy. For instance, there have been concerns about the neglect of
unemployment and income distribution in deciding and implementing the macroeconomic
framework.
In the 2008 Budget Statement and Economic Policy of the Government of Ghana, the following
the key macroeconomic targets were set:
A real GDP growth of at least 7.0 percent;
An end period inflation rate of between 6.0 and 8.0 percent;
An average inflation of 7.0 percent;
An accumulation of gross international reserves equivalent to at least three months of
import cover; and
An overall budget deficit including divestiture of 4.0 per cent of GDP and a deficit
excluding divestiture of 5.7 per cent of GDP.
However, according the 2009 statement, all these targets were missed. Provisional results at the
end of 2008 were the following:
A real GDP growth of by 6.2 percent;
An inflation rate of 18.1 percent;
Average inflation for the year was 16.5 per cent;
Gross international reserves reduced to the equivalence of 1.8 months of import cover for
goods and services; and
6
An overall budget deficit, excluding divestiture, amounting to GH¢2,557.6 million,
equivalent to 14.9 of GDP. Including divestiture receipts, the total deficit amount stood at
GH¢1,982.9 million, equivalent to 11.5 per cent of GDP.
It might be argued that 2008 was an election year for Ghana, which may explain some of the
unmet targets of macroeconomic indicators for the year. This situation should however not be
encouraged in subsequent election years because it reduces the gains from previous years on
stabilizing and promoting growth in the economy as well as reducing poverty. Further, it makes
adjustment by a new government more difficult as it will have to restore the lost fortunes before
moving on with its plans and programmes for the economy. Further, the current financial crises
have even made things difficult for the new government in restoring the economy. For example,
the high budget deficit ratio at the end of 2008, coupled with the current financial crises has
become a major challenge for the new government.
The 2009 Budget Statement and Economic Policy of the Government of Ghana (issued in March
2009) have proposed a number of targets to be met with respect to the key macroeconomic
indicators. These targets are:
A real GDP growth of 5.9 percent;
An average inflation target of 15.3 percent;
An end of year inflation of 12.5 percent;
An overall budget deficit equivalent to 9.4 percent of GDP; and
Gross international reserves of more than two months of import cover of goods and
services.
The key macroeconomic targets for the medium term are outlined in Table 1 below
Table 1: Medium Term Macro-Fiscal Framework (in percent) Indicator 2009 2010 2011 2012 Real GDP Growth 5.9 6.5 7.5 8.0 Inflation 14.6 9.2 8.0 5.0
Real Per Capita GDP Growth 3.5 4.1 5.1 5.6
Government Revenue/GDP 30.0 29.3 34.3 35.1
Government Expenditure/GDP 36.7 37.9 41.0 40.3 Budget Deficit/GDP 9.4 6.0 4.5 2.8
Source: Guidelines for the preparation of the 2010-2012 budget proposals
From Table 1, it is hoped that the government will put in measures to address the current crisis.
The discussions following will be assessing how the past indicators can influence the above
medium term framework and also help in promoting women and children‘s rights.
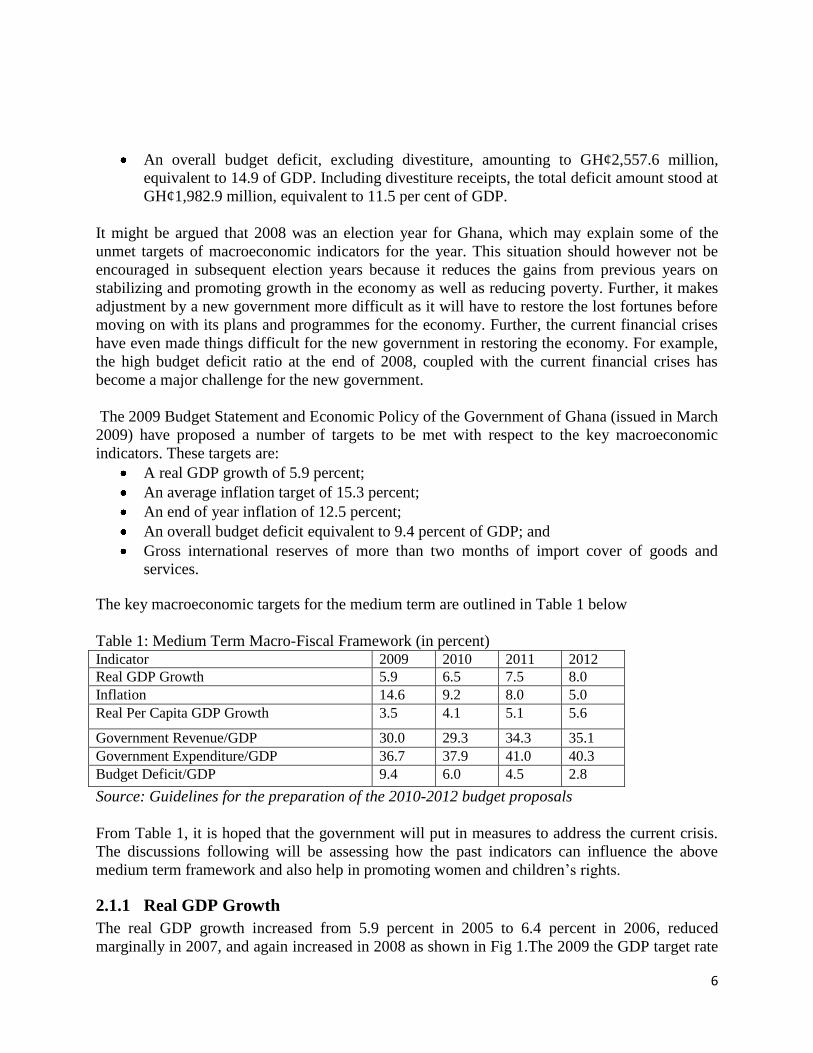
2.1.1 Real GDP Growth
The real GDP growth increased from 5.9 percent in 2005 to 6.4 percent in 2006, reduced
marginally in 2007, and again increased in 2008 as shown in Fig 1.The 2009 the GDP target rate
7
is 5.9 percent. Beginning from the last quarter of 2006 to the third quarter of 2007, the economy
encountered serious energy crises leading to inadequate supply of electricity. This impacted
negatively on the industrial and services sectors of the country. To make matters even more
difficult, the global financial, food and fuel crises followed the energy crises. These factors can
be seen as primarily the determining factors for the GDP trend over the years. It is in this regard
that it will be necessary for policies in the 2009 budget to be implemented with the aim of
reversing the current GDP trend and promoting economic growth in the country to cushion the
adverse effect of the current global crises on the Ghanaian economy.
Figure 1: Real GDP Growth
Real GDP Growth
0
2
4
6
8
2004 2005 2006 2007 2008 2009*
Year
Perc
ent
GDP
Source: 2009 Budget Statement
*2009 Figure was the projected
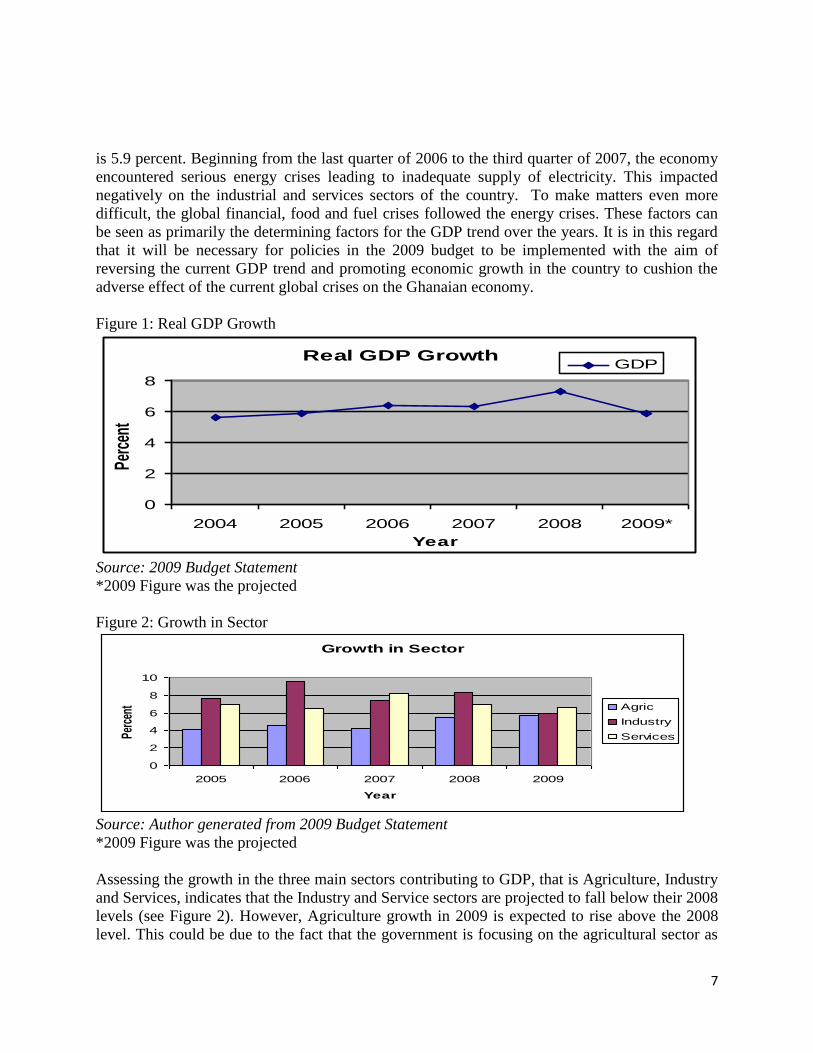
Figure 2: Growth in Sector
Growth in Sector
0
2
4
6
8
10
2005 2006 2007 2008 2009
Year
Perc
ent Agric
Industry
Services
Source: Author generated from 2009 Budget Statement
*2009 Figure was the projected
Assessing the growth in the three main sectors contributing to GDP, that is Agriculture, Industry
and Services, indicates that the Industry and Service sectors are projected to fall below their 2008
levels (see Figure 2). However, Agriculture growth in 2009 is expected to rise above the 2008
level. This could be due to the fact that the government is focusing on the agricultural sector as
8
one of the policy priorities in the budget. To address the current food crisis it is very important
the government emphasizes increases in agricultural productivity and food security as one of the
key budget policies. The current global crisis provides an opportunity for a country like Ghana
(capable of producing its domestic food requirements) to put in place policies to not only
produce enough food to meet the domestic population but also export to other countries.
Notwithstanding this fact, the respective ministries responsible for Services and Industry should
ensure that the right measures are in place to minimize the decline in those sectors.
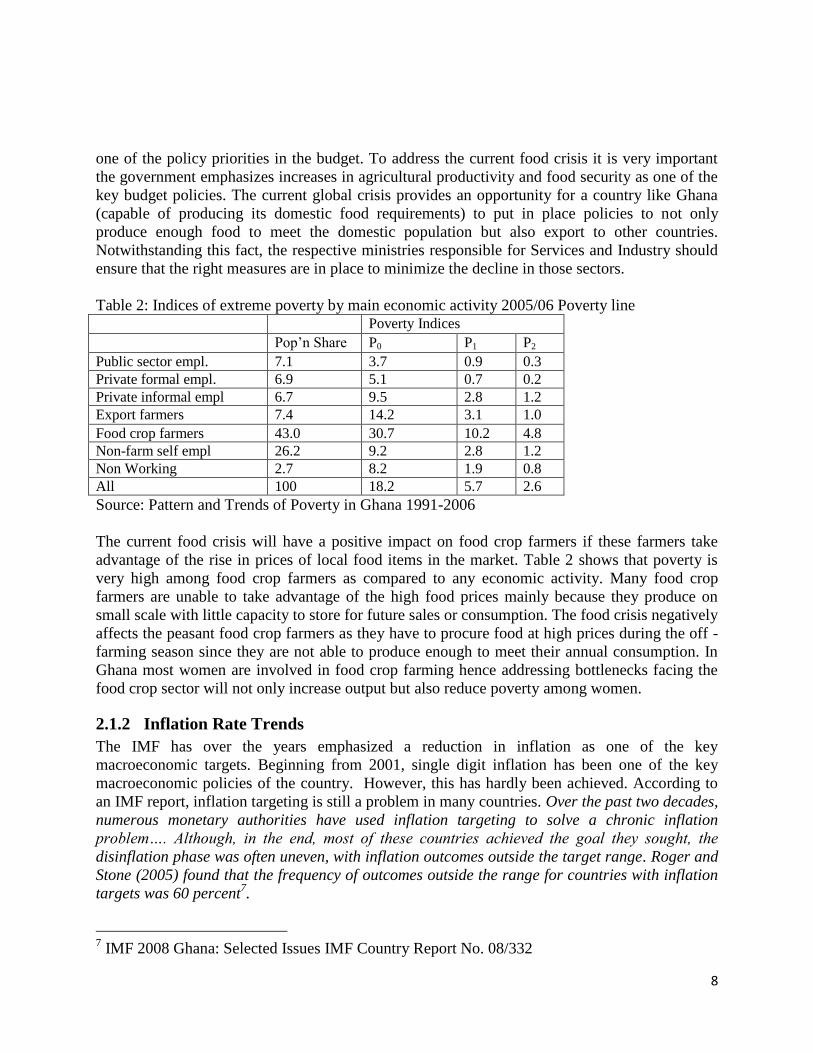
Table 2: Indices of extreme poverty by main economic activity 2005/06 Poverty line
Poverty Indices
Pop‘n Share P0 P1 P2
Public sector empl. 7.1 3.7 0.9 0.3 Private formal empl. 6.9 5.1 0.7 0.2 Private informal empl 6.7 9.5 2.8 1.2 Export farmers 7.4 14.2 3.1 1.0
Food crop farmers 43.0 30.7 10.2 4.8 Non-farm self empl 26.2 9.2 2.8 1.2 Non Working 2.7 8.2 1.9 0.8 All 100 18.2 5.7 2.6
Source: Pattern and Trends of Poverty in Ghana 1991-2006
The current food crisis will have a positive impact on food crop farmers if these farmers take
advantage of the rise in prices of local food items in the market. Table 2 shows that poverty is
very high among food crop farmers as compared to any economic activity. Many food crop
farmers are unable to take advantage of the high food prices mainly because they produce on
small scale with little capacity to store for future sales or consumption. The food crisis negatively
affects the peasant food crop farmers as they have to procure food at high prices during the off -
farming season since they are not able to produce enough to meet their annual consumption. In
Ghana most women are involved in food crop farming hence addressing bottlenecks facing the
food crop sector will not only increase output but also reduce poverty among women.
2.1.2 Inflation Rate Trends
The IMF has over the years emphasized a reduction in inflation as one of the key
macroeconomic targets. Beginning from 2001, single digit inflation has been one of the key
macroeconomic policies of the country. However, this has hardly been achieved. According to
an IMF report, inflation targeting is still a problem in many countries. Over the past two decades,
numerous monetary authorities have used inflation targeting to solve a chronic inflation
problem…. Although, in the end, most of these countries achieved the goal they sought, the
disinflation phase was often uneven, with inflation outcomes outside the target range. Roger and
Stone (2005) found that the frequency of outcomes outside the range for countries with inflation
targets was 60 percent7.
7 IMF 2008 Ghana: Selected Issues IMF Country Report No. 08/332
9
. From figure 3, Ghana‘s level of inflation reduced from 14.4 percent in 2005 to 10.5 percent in
2006, and then it increased marginally to 10.6 percent in 2007. In 2008 the level of inflation
increased further to 16.5 percent. Roger and Stone‘s (2005) conclusion on the effect of inflation
targeting is true in the case of Ghana as targets for inflation in the last few years have been
missed. The constant missing of our inflation targets provides a fundamental platform for
rethinking our current inflation targeting measures. Additionally, placing a major emphasis on
reduction of government expenditures to control inflation could be detrimental to the promotion
of the rights of children and women as the provision of the necessary infrastructure will not be
available for the advancement of their basic socio-economic rights like education, health and
water.
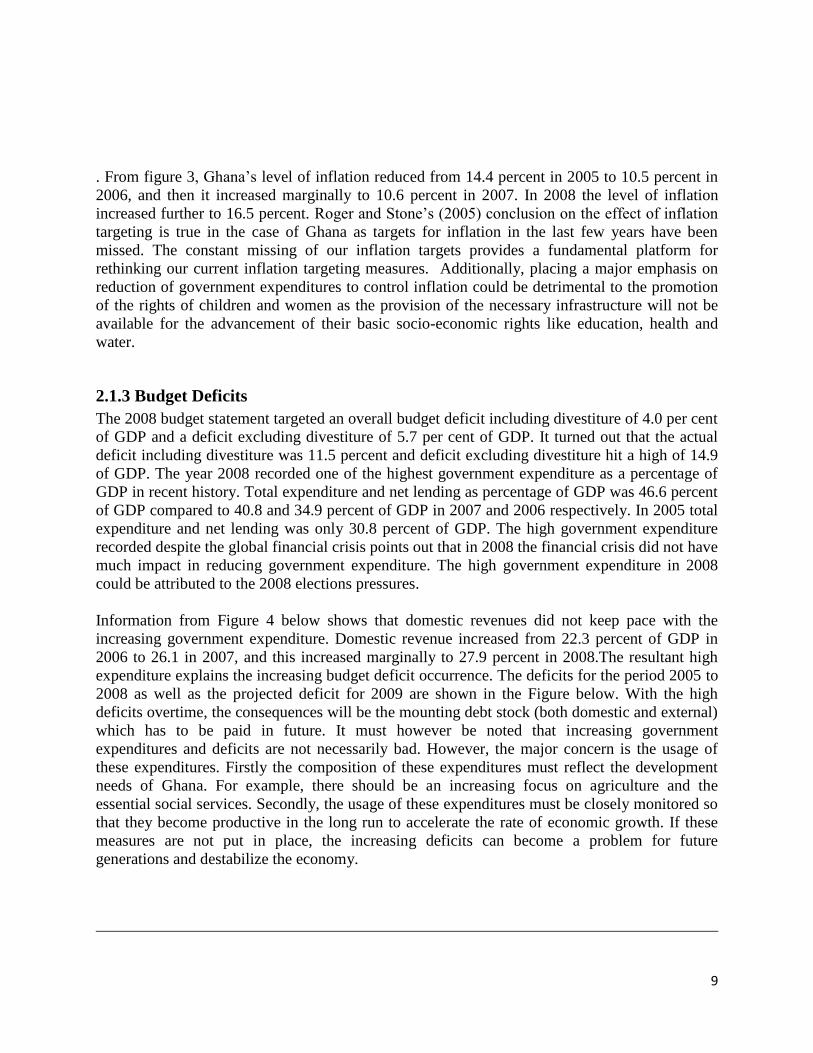
2.1.3 Budget Deficits
The 2008 budget statement targeted an overall budget deficit including divestiture of 4.0 per cent
of GDP and a deficit excluding divestiture of 5.7 per cent of GDP. It turned out that the actual
deficit including divestiture was 11.5 percent and deficit excluding divestiture hit a high of 14.9
of GDP. The year 2008 recorded one of the highest government expenditure as a percentage of
GDP in recent history. Total expenditure and net lending as percentage of GDP was 46.6 percent
of GDP compared to 40.8 and 34.9 percent of GDP in 2007 and 2006 respectively. In 2005 total
expenditure and net lending was only 30.8 percent of GDP. The high government expenditure
recorded despite the global financial crisis points out that in 2008 the financial crisis did not have
much impact in reducing government expenditure. The high government expenditure in 2008
could be attributed to the 2008 elections pressures.
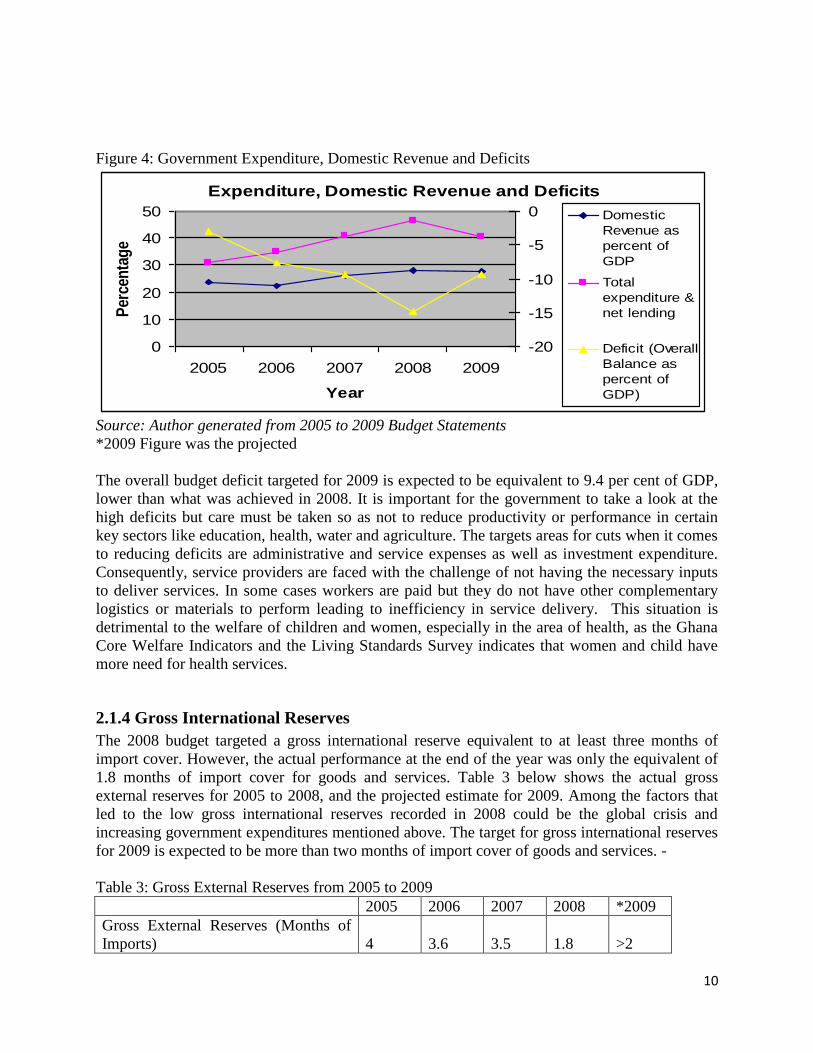
Information from Figure 4 below shows that domestic revenues did not keep pace with the
increasing government expenditure. Domestic revenue increased from 22.3 percent of GDP in
2006 to 26.1 in 2007, and this increased marginally to 27.9 percent in 2008.The resultant high
expenditure explains the increasing budget deficit occurrence. The deficits for the period 2005 to
2008 as well as the projected deficit for 2009 are shown in the Figure below. With the high
deficits overtime, the consequences will be the mounting debt stock (both domestic and external)
which has to be paid in future. It must however be noted that increasing government
expenditures and deficits are not necessarily bad. However, the major concern is the usage of
these expenditures. Firstly the composition of these expenditures must reflect the development
needs of Ghana. For example, there should be an increasing focus on agriculture and the
essential social services. Secondly, the usage of these expenditures must be closely monitored so
that they become productive in the long run to accelerate the rate of economic growth. If these
measures are not put in place, the increasing deficits can become a problem for future
generations and destabilize the economy.
10
Figure 4: Government Expenditure, Domestic Revenue and Deficits
Expenditure, Domestic Revenue and Deficits
0
10
20
30
40
50
2005 2006 2007 2008 2009
Year
Per
cen
tag
e
-20
-15
-10
-5
0 Domestic
Revenue as
percent of
GDP
Total
expenditure &
net lending
Deficit (Overall
Balance as
percent of
GDP)
Source: Author generated from 2005 to 2009 Budget Statements
*2009 Figure was the projected
The overall budget deficit targeted for 2009 is expected to be equivalent to 9.4 per cent of GDP,
lower than what was achieved in 2008. It is important for the government to take a look at the
high deficits but care must be taken so as not to reduce productivity or performance in certain
key sectors like education, health, water and agriculture. The targets areas for cuts when it comes
to reducing deficits are administrative and service expenses as well as investment expenditure.
Consequently, service providers are faced with the challenge of not having the necessary inputs
to deliver services. In some cases workers are paid but they do not have other complementary
logistics or materials to perform leading to inefficiency in service delivery. This situation is
detrimental to the welfare of children and women, especially in the area of health, as the Ghana
Core Welfare Indicators and the Living Standards Survey indicates that women and child have
more need for health services.
2.1.4 Gross International Reserves
The 2008 budget targeted a gross international reserve equivalent to at least three months of
import cover. However, the actual performance at the end of the year was only the equivalent of
1.8 months of import cover for goods and services. Table 3 below shows the actual gross
external reserves for 2005 to 2008, and the projected estimate for 2009. Among the factors that
led to the low gross international reserves recorded in 2008 could be the global crisis and
increasing government expenditures mentioned above. The target for gross international reserves
for 2009 is expected to be more than two months of import cover of goods and services. -
Table 3: Gross External Reserves from 2005 to 2009
2005 2006 2007 2008 *2009
Gross External Reserves (Months of
Imports) 4 3.6 3.5 1.8 >2
11
Source: Ghana National Budgets, 2009
*2009 Figure was the projected estimate in the 2009 Budget Statement
Gross international reserves often enable the government to stabilize imports in times of crisis
but continued fixation of this indicator can lead to the neglect of provision of certain basic
essential services. Investment in health, education, water and in areas that improve the
livelihoods for women will result in improved wellbeing than having much funds locked up in
external reserves. This is not to say monitoring external reserves is not important.
2.2 The 2009 Budget and its Response to the Global Crisis
The 2009 budget statement mentioned a number of measures to aid addressing the effects of the
global crisis on the economy. These measures, according to the 2009 budget, include the
following:
Enforcing the Foreign Exchange Act in terms of monitoring and reporting;
Reviewing mining, oil and forestry firms agreements to require companies to repatriate
part of their retentions in Ghana;
Renegotiate the Stability Agreement of the Mining Act; and
Re-activating the initiative of undertaking gold audits.
Some of the policy responses relating to particular sectors are scattered in bits and pieces under
the various sectors concerned, in the presentation of the 2009 budget.
An initial assessment of the above response is that the above mentioned measures seem to be
medium to long term responses hence hardly addressing the immediate effects on Ghanaians. As
has been stated earlier, GDP growth is expected to contract at the end of 2009, hence the need for
immediate responses to help cushion Ghanaians from these adverse effects. The immediate
measures required include adjusting the composition of budgetary expenditures with more
allocation to the provision of essential services for survival. Also there should be increased
resources allocated to the LEAP programme to ensure the programme is extended to those that
are expected to be adversely affected by the crises. Nonetheless, the measures indicated in
budget are necessary and would provide the government with more flexibility in dealing with
future crises. These measures seek to generate the required revenues from the country‘s abundant
natural resources and they are commendable.
2.3 Effect of the Global Crisis on the Macroeconomic Framework
It is likely that the drastic rise in food and fuel prices is undermining the Government‘s efforts at
reducing poverty and preserving macroeconomic stability, as it is likely to lead to higher
inflationary pressures, loss of purchasing power by households, a weak fiscal and balance of
payments position, and a reduction in our foreign exchange reserves. Other potential risks to our
economy from the financial crisis include a decline in Official Development Assistance (ODA)
and private Foreign Direct Investment (FDI) inflows, a decrease in demand for our exports,
associated with a fall in the prices of these exports and a reduction in remittances from relatives
and friends of Ghanaians abroad. There is the need to customize domestic policies to address the
12
current global crisis so as to move the economy on the path of a credible and stable economy
with equitable economic growth, and sustainable poverty reduction.
Beginning from the early 80‘s when Ghana started the implementation of the structural
adjustment policies; the government has focused on macroeconomic policies emphasizing almost
solely on macroeconomic stabilization above all other socially desirable outcomes. This strategy
even though necessary is not always the first best option, most especially in periods of financial,
food and fuel crises. Also, the continual missing of set targets indicates that the macroeconomic
policies are not comprehensive enough in addressing the real economic situation in the country
and hence capable of absorbing external shocks. It could also mean that the basis of the current
macroeconomic framework and the targets set are flawed hence their continuous implementation
may not be sustainable and growth enhancing.
This occurrence calls for a re-look at the fundamental macroeconomic framework for the
Ghanaian economy. The framework needed should be one that is pro-poor and growth
enhancing. The current global financial crisis also calls for more flexibility with our
macroeconomic policies to respond to any future external shocks. Interestingly, the ECOWAS
convergence criteria have similar targets of a constrained macroeconomic framework which
member countries are expected to comply with. It will be quite remarkable if our
macroeconomic policies have the ultimate goal of promoting the basic socio-economic rights of
all peoples, especially women and children who happen to be the most vulnerable to economic
shocks, through distributive policies, justice, equity, provisioning of essential services for all,
freedom from poverty and discrimination, social inclusion and development of human
capabilities. This will not only enable us to achieve the right framework for improving the
welfare and wellbeing of the citizenry but also ensure peace and harmony on our society. It is in
this vein that this report considers issues with regards to basic essential services in relation to
women and children.
13
CHAPTER THREE: REVENUE MOBILIZATION AND
BUDGETED EXPENDITURE FOR THE PROMOTION OF
WOMEN AND CHILDREN’S RIGHTS This section will look at revenue mobilization and budgeted expenditure in key sectors that
promote women‘s and children‘s rights. The ministries to be considered are education; health;
employment and social welfare; water resources, works, and housing; food and agriculture; and,
women and children affairs.
3.1 Revenue Generation Analysis and its Relation to Children’s and Women’s Rights
Generating revenue is essential to fulfill children and women‘s rights. This section discusses the
broad sources of revenue mentioned in the 2009 budget as well as how additional sources can be
identified. Reliance on domestic sources of revenue rather than foreign is crucial at this time of a
global crises as the country is increasing its dependence on foreign aid to finance its recurrent
spending.
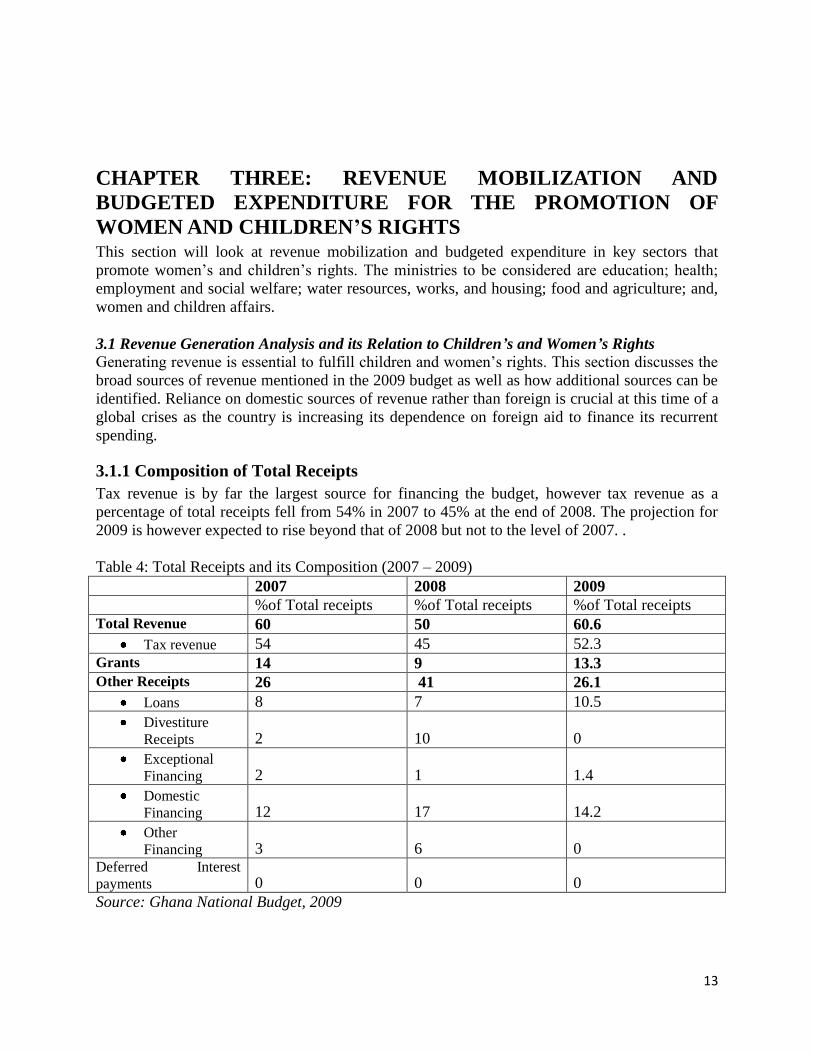
3.1.1 Composition of Total Receipts
Tax revenue is by far the largest source for financing the budget, however tax revenue as a
percentage of total receipts fell from 54% in 2007 to 45% at the end of 2008. The projection for
2009 is however expected to rise beyond that of 2008 but not to the level of 2007. .
Table 4: Total Receipts and its Composition (2007 – 2009)
2007 2008 2009
%of Total receipts %of Total receipts %of Total receipts
Total Revenue 60 50 60.6
Tax revenue 54 45 52.3
Grants 14 9 13.3
Other Receipts 26 41 26.1
Loans 8 7 10.5
Divestiture
Receipts 2 10 0
Exceptional
Financing 2 1 1.4
Domestic
Financing 12 17 14.2
Other
Financing 3 6 0 Deferred Interest
payments 0 0 0
Source: Ghana National Budget, 2009
14
Another area of concern is the rising reliance on domestic credit for financing development
because it reduces domestic investors‘ access to credit facilities and increases the domestic
interest rate. However, if extending credit results in provision of improved infrastructure that
can attract greater investment, then the credit issues may be offset by increased growth.
Nonetheless, the increased dependence on domestic credit for financing the government budget
should be minimized.
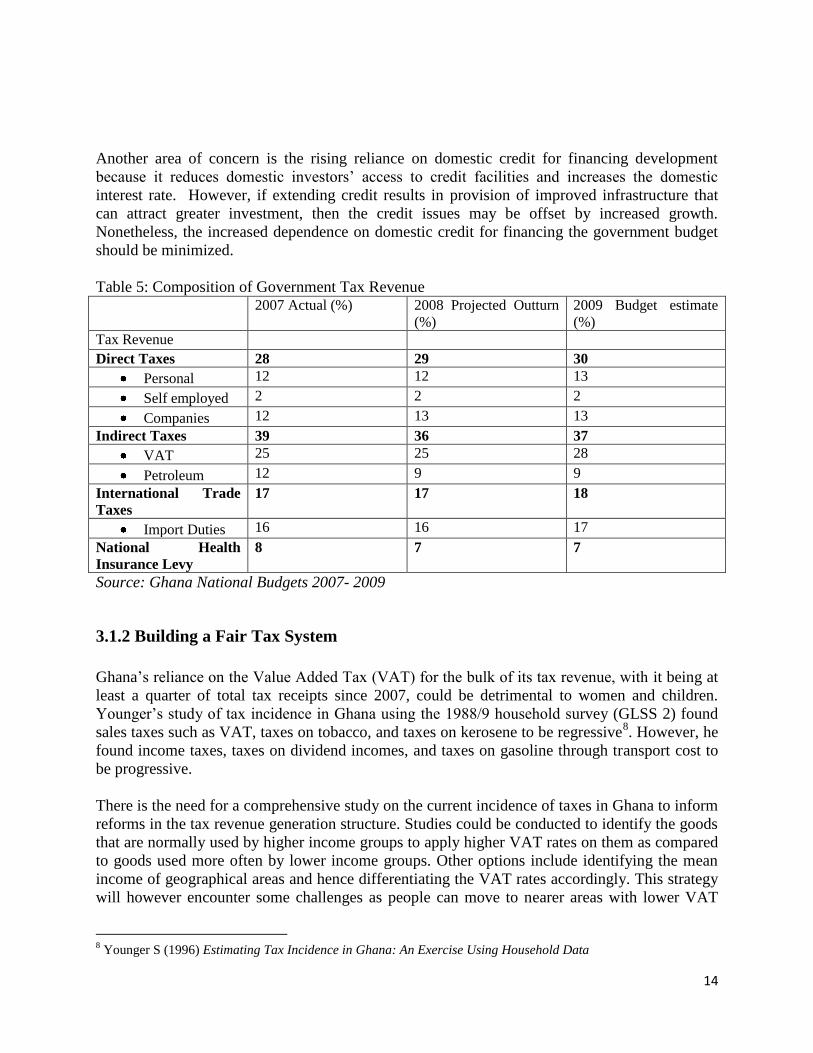
Table 5: Composition of Government Tax Revenue
2007 Actual (%) 2008 Projected Outturn
(%) 2009 Budget estimate
(%) Tax Revenue
Direct Taxes 28 29 30
Personal 12 12 13
Self employed 2 2 2
Companies 12 13 13
Indirect Taxes 39 36 37
VAT 25 25 28
Petroleum 12 9 9
International Trade
Taxes 17 17 18
Import Duties 16 16 17
National Health
Insurance Levy 8 7 7
Source: Ghana National Budgets 2007- 2009
3.1.2 Building a Fair Tax System
Ghana‘s reliance on the Value Added Tax (VAT) for the bulk of its tax revenue, with it being at
least a quarter of total tax receipts since 2007, could be detrimental to women and children.
Younger‘s study of tax incidence in Ghana using the 1988/9 household survey (GLSS 2) found
sales taxes such as VAT, taxes on tobacco, and taxes on kerosene to be regressive8. However, he
found income taxes, taxes on dividend incomes, and taxes on gasoline through transport cost to
be progressive.
There is the need for a comprehensive study on the current incidence of taxes in Ghana to inform
reforms in the tax revenue generation structure. Studies could be conducted to identify the goods
that are normally used by higher income groups to apply higher VAT rates on them as compared
to goods used more often by lower income groups. Other options include identifying the mean
income of geographical areas and hence differentiating the VAT rates accordingly. This strategy
will however encounter some challenges as people can move to nearer areas with lower VAT
8 Younger S (1996) Estimating Tax Incidence in Ghana: An Exercise Using Household Data
15
rates to access such rates. Nonetheless, a comprehensive measure should be developed in
graduating the VAT rates to ensure that poorer families are not over-burdened in the collection
of the VAT tax. This will also be beneficial for women in the informal sector since they mostly
bear the burden of this tax.
3.1.3 Measures for Increasing Fiscal Space
Tax Resources
Government could increase its tax revenue through several mechanisms. First, it could improve
identification of self-employed citizens who do not pay tax. A 1996 study on tax incidence in
Ghana using the Ghana Living Standard Survey (GLSS) 2 revealed that under-reporting of tax
revenues were particularly prevalent for self-employed businesses and income tax on rents. The
self employed category tax has only been 2% of total tax revenues for the country since 2007
(see Table 5).
Second, government could eliminate or reduce tax incentives and tax holidays. These incentives
were put in place to increase foreign investment in the country. However, a number of investors
have taken advantage of these concessions to deny the country of taxes. In addition, such tax
incentives complicate tax administration and serve as a major source for leakages in the tax
system.
Third, Government could tighten the collection of customs and excise duties. Some revenue
collection officials are corrupt, while facilities to track imported duties are inadequate. In this
regard, the tax agencies should collaborate with a number of institutions including the Ghana
Private Road Transport Union (GPRTU), the State Transport Company (STC) and other
transport operators who undertake cross border travels to ensure they hand in individuals who
evade duties by smuggling goods into the country.
Current international trade agreements pose a threat to future generation of revenue for the
country‘s development and securing essential rights for women and children. Ghana, as a
member of the African Caribbean Pacific (ACP), has signed unto the Economic Partnership
Agreement (EPA) with the European Union (EU). As part of the agreement, the government of
Ghana will eventually lose about 80% of its import duties on imports from the EU. Unfortunately
however, the EU is a major trading partner of the Government of Ghana, in 2007 imports from
the EU accounted for 32% of Ghana‘s total imports, implying that the country could lose a
substantial portion of its current import revenue due to the agreement. This could even be more if
importers take advantage of the agreement and import the majority of goods from the EU. A
number of studies have estimated that this will result in the loss of about 10% of government‘s
current revenue9. Government should therefore re-consider its stance on the EPA‘s since it has
not yet fully assented to it. As a member of ECOWAS, a sub-regional negotiation framework
would better serve the interest of the country rather than negotiating as a single country.
9 Mayur Patel 2007 Economic Partnership Agreements between the EU and African Countries: Potential
Development Implications for Ghana
16
Other measures required for increased revenue for Ghana focus on improved transparency in
revenue payments, especially revenues from the extractive sector. The government is
commended here for its interest in this area as it will result in reduced corruption due to the non-
disclosure of revenues from especially extractive companies. Another area of consideration
should be assessing a number of privatized companies which were profitably to the state. The
considerations should include both the efficiency and equity implications of the privatized
companies. The government should undertake a cost benefit analysis of prospective state
enterprises before privatizing them otherwise this may not be in the interest of the state.
3.1.4 Revenue Generation Sources and Counter-cyclical Policy
Ghana has financed its development through pro-cyclical means. That is, government
expenditures are tied closely to its revenue sources. The danger therefore is that in periods when
economic activities are lower, government expenditure will also have to fall as has been
experienced currently. Implementing the country‘s development objectives with this strategy is
not sustainable and will deny Ghanaian policy makers the required flexibility for extending
essential social services in periods of crises and economic downturn.
Government should increase the country‘s stabilization fund to ensure that enough resources will
be available for development in cases of severe economic downturn. This is particularly
necessary for government, given that a sizeable chunk of government revenue is realized from
the country exports of Cocoa, Gold and Timber and these prices have been very volatile over the
years. The fund has dropped from 1.4% of GDP in 2007 to a predicted 0.33% of GDP in 2010,
according to the 2009 Government of Ghana Budget.
3.2 Budgeted and Actual Expenditures in Selected Sectors
The analysis of budgeted expenditure (allocations) in this section will focus mainly on some
selected sectors relating to women and children. As mentioned earlier, the ministries to be
considered are education; health; employment and social welfare; water resources, works, and
housing; food and agriculture; and, women and children affairs
As we look at some of these sectors, it is important to mention that it is difficult to make accurate
comparisons over the recent past years because the names and the composition of some
ministries have been changed over the years. A typical example is the Ministry of Education
where the names and composition have been varied over the years
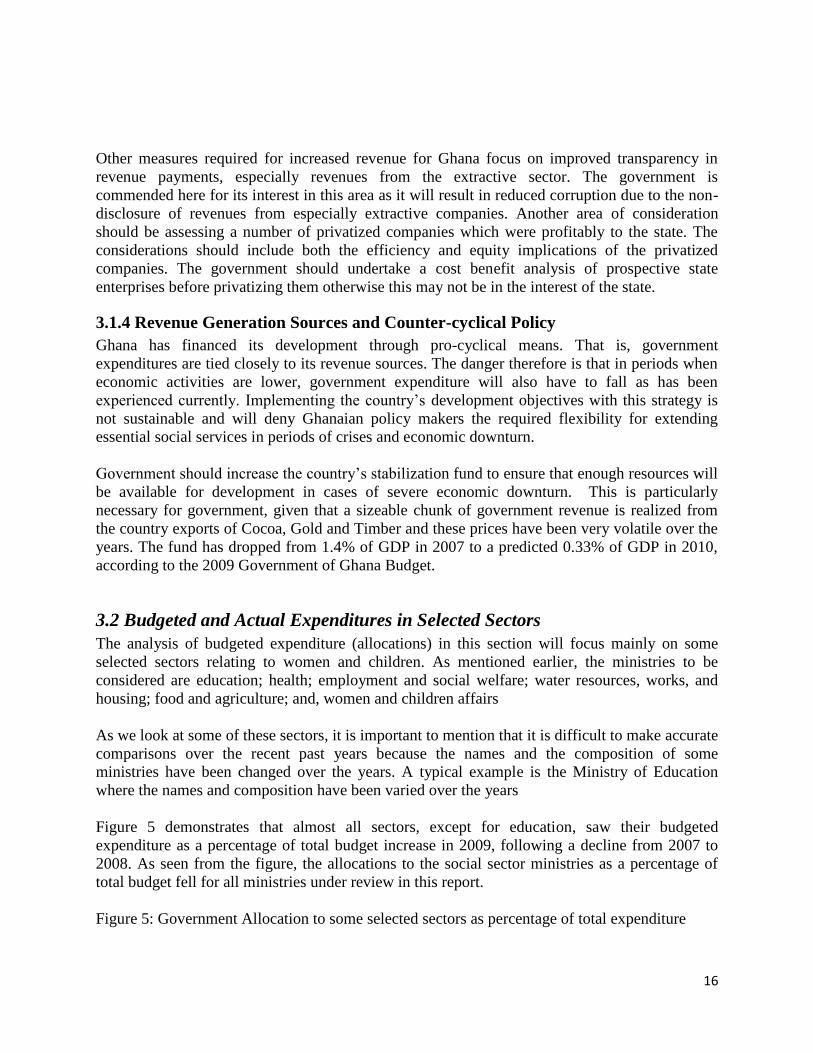
Figure 5 demonstrates that almost all sectors, except for education, saw their budgeted
expenditure as a percentage of total budget increase in 2009, following a decline from 2007 to
2008. As seen from the figure, the allocations to the social sector ministries as a percentage of
total budget fell for all ministries under review in this report.
Figure 5: Government Allocation to some selected sectors as percentage of total expenditure
17
Government Allocations as a % of Total Budget 2003-2009
0
5
10
15
20
25
2003 2004 2005 2006 2007 2008 2009Year
Perc
en
tag
e
Ministry of Education
Ministry of Health
Ministry of Manpower Youth
& EmploymentMinistry of Water Resources,
Works & HousingMinistry of Food & Agric
Ministry of Women & Children
Affairs
Source: Author generated from 2003 to 2009 Budget Statements
Poverty reduction expenditure on sectors related to women and children were far below the
budgeted expenditures in 2008. This is in stark contrast to the total government expenditures,
which exceeded the budgeted figures in 2008. The year 2008 was an election year, a period
which is normally characterized by increased expenditures, however Figure 5 shows that women
and children did not benefit from election year increases; if anything, they suffered
disproportionately since actual poverty reduction expenditures in sectors such as health,
education, and water resources dropped.
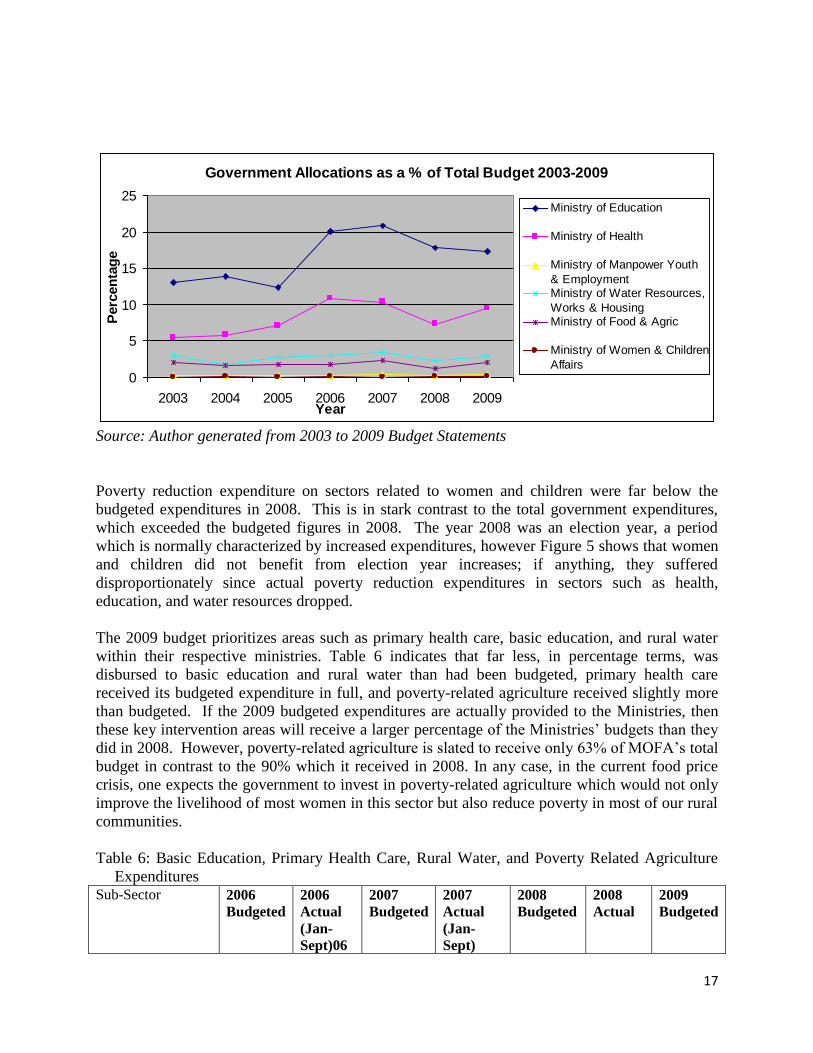
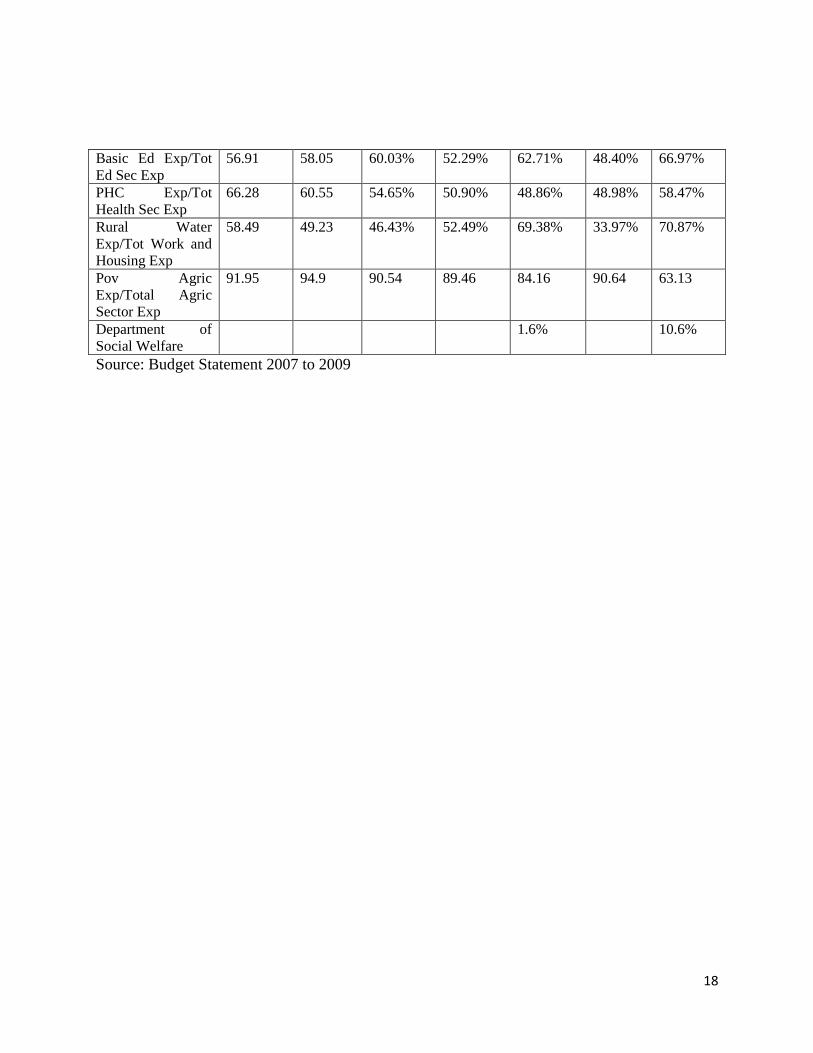
The 2009 budget prioritizes areas such as primary health care, basic education, and rural water
within their respective ministries. Table 6 indicates that far less, in percentage terms, was
disbursed to basic education and rural water than had been budgeted, primary health care
received its budgeted expenditure in full, and poverty-related agriculture received slightly more
than budgeted. If the 2009 budgeted expenditures are actually provided to the Ministries, then
these key intervention areas will receive a larger percentage of the Ministries‘ budgets than they
did in 2008. However, poverty-related agriculture is slated to receive only 63% of MOFA‘s total
budget in contrast to the 90% which it received in 2008. In any case, in the current food price
crisis, one expects the government to invest in poverty-related agriculture which would not only
improve the livelihood of most women in this sector but also reduce poverty in most of our rural
communities.
Table 6: Basic Education, Primary Health Care, Rural Water, and Poverty Related Agriculture
Expenditures Sub-Sector 2006
Budgeted
2006
Actual
(Jan-
Sept)06
2007
Budgeted
2007
Actual
(Jan-
Sept)
2008
Budgeted
2008
Actual
2009
Budgeted
18
Basic Ed Exp/Tot
Ed Sec Exp
56.91 58.05 60.03% 52.29% 62.71% 48.40% 66.97%
PHC Exp/Tot
Health Sec Exp
66.28 60.55 54.65% 50.90% 48.86% 48.98% 58.47%
Rural Water
Exp/Tot Work and
Housing Exp
58.49 49.23 46.43% 52.49% 69.38% 33.97% 70.87%
Pov Agric
Exp/Total Agric
Sector Exp
91.95 94.9 90.54 89.46 84.16 90.64 63.13
Department of
Social Welfare
1.6% 10.6%
Source: Budget Statement 2007 to 2009
19
CHAPTER FOUR: SELECTED SECTORS THAT AFFECT
WOMEN AND CHILDREN
This section looks at the GPRS II strategies and policy priorities in the 2009 budget in relation to
selected sectors whose activities affect women and children. The sectors are education, health,
water, social welfare and women and children affairs.
4.1 Education
Providing free and compulsory basic education is mandated in Ghana‘s Constitution (Article 25
section 1a) Moreover, Ghana has committed to achieving Millennium Development Goal
(MDG) 2, which seeks to achieve universal primary education by 2015. Other international
commitments include the six Education for All (EFA) goals adopted in Dakar in 2000, the Fast
Track Initiative, which was established to expedite the Education for All agenda. Ghana is
implementing these commitments through an Education Strategic Plan (ESP) to guide the
management and improvement of education for all children in the country by the year 2015.
4.1.1 The 2009 Education Budget and its Linkage to the Growth and Poverty
Reduction Strategy (GPRS) II
The GPRS II identifies educational programmes that are focused on improving and equalizing
access to a six-year primary education for all children under 12 years in line with the Education
for All agenda. The GPRS II policy objectives for education include:
Increase access to and participation in education and training.
Bridge the gender gap in access to education.
Improve quality of teaching and learning.
Improve quality and efficiency in delivery of education service.
Promote and extend the provision of science, mathematics, technology and ICT education
and training.
Mainstream issues of population, gender, health, HIV/AIDS/STI, fire safety, road safety
and environment in the curricula of schools and institutions of higher learning.
Another policy in Ghana‘s GPRS II is to make school attendance obligatory for all children for
11 years – from 4 to 15 years – including two years of kindergarten, and three years of Junior
High School with a genuine secondary content. The plan also includes improving the physical
environment of schooling and assuring quality standards, especially in basic numeracy and
literacy.
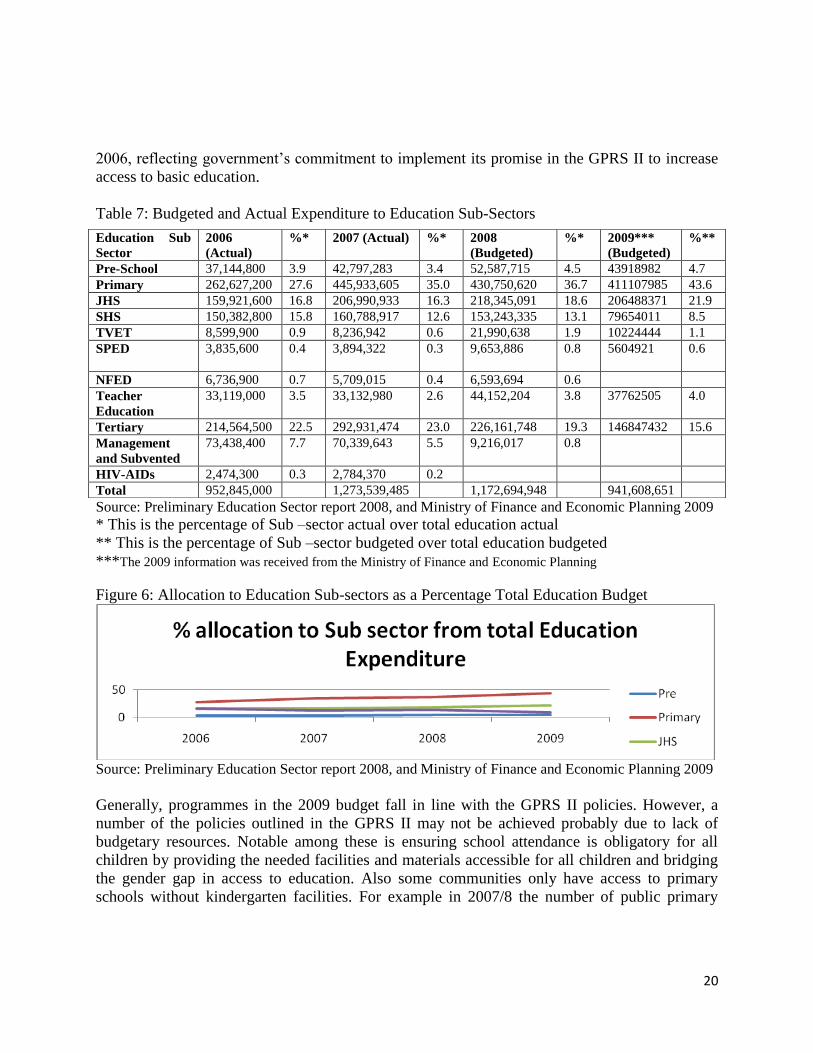
As seen in Table 7, primary education has been the priority of the Ministry of Education in the
last three years. Figure 6 indicates that the percentage of the total education budget allocated to
pre-school, primary, and JHS, all classified under basic education, has been increasing since
20
2006, reflecting government‘s commitment to implement its promise in the GPRS II to increase
access to basic education.
Table 7: Budgeted and Actual Expenditure to Education Sub-Sectors
Source: Preliminary Education Sector report 2008, and Ministry of Finance and Economic Planning 2009
* This is the percentage of Sub –sector actual over total education actual
** This is the percentage of Sub –sector budgeted over total education budgeted
***The 2009 information was received from the Ministry of Finance and Economic Planning
Figure 6: Allocation to Education Sub-sectors as a Percentage Total Education Budget
Source: Preliminary Education Sector report 2008, and Ministry of Finance and Economic Planning 2009
Generally, programmes in the 2009 budget fall in line with the GPRS II policies. However, a
number of the policies outlined in the GPRS II may not be achieved probably due to lack of
budgetary resources. Notable among these is ensuring school attendance is obligatory for all
children by providing the needed facilities and materials accessible for all children and bridging
the gender gap in access to education. Also some communities only have access to primary
schools without kindergarten facilities. For example in 2007/8 the number of public primary
Education Sub
Sector
2006
(Actual)
%* 2007 (Actual) %* 2008
(Budgeted)
%* 2009***
(Budgeted)
%**
Pre-School 37,144,800 3.9 42,797,283 3.4 52,587,715 4.5 43918982 4.7
Primary 262,627,200 27.6 445,933,605 35.0 430,750,620 36.7 411107985 43.6
JHS 159,921,600 16.8 206,990,933 16.3 218,345,091 18.6 206488371 21.9
SHS 150,382,800 15.8 160,788,917 12.6 153,243,335 13.1 79654011 8.5
TVET 8,599,900 0.9 8,236,942 0.6 21,990,638 1.9 10224444 1.1
SPED 3,835,600 0.4 3,894,322 0.3 9,653,886 0.8 5604921
0.6
NFED 6,736,900 0.7 5,709,015 0.4 6,593,694 0.6
Teacher
Education
33,119,000 3.5 33,132,980 2.6 44,152,204 3.8 37762505 4.0
Tertiary 214,564,500 22.5 292,931,474 23.0 226,161,748 19.3 146847432 15.6
Management
and Subvented
73,438,400 7.7 70,339,643 5.5 9,216,017 0.8
HIV-AIDs 2,474,300 0.3 2,784,370 0.2
Total 952,845,000 1,273,539,485 1,172,694,948 941,608,651
21
schools was 13,247. However, there were only 11,140 public kindergarten schools in 2007/810
.
Government should ensure access to kindergarten educational facilities for all children to
promote the Education for All goal.
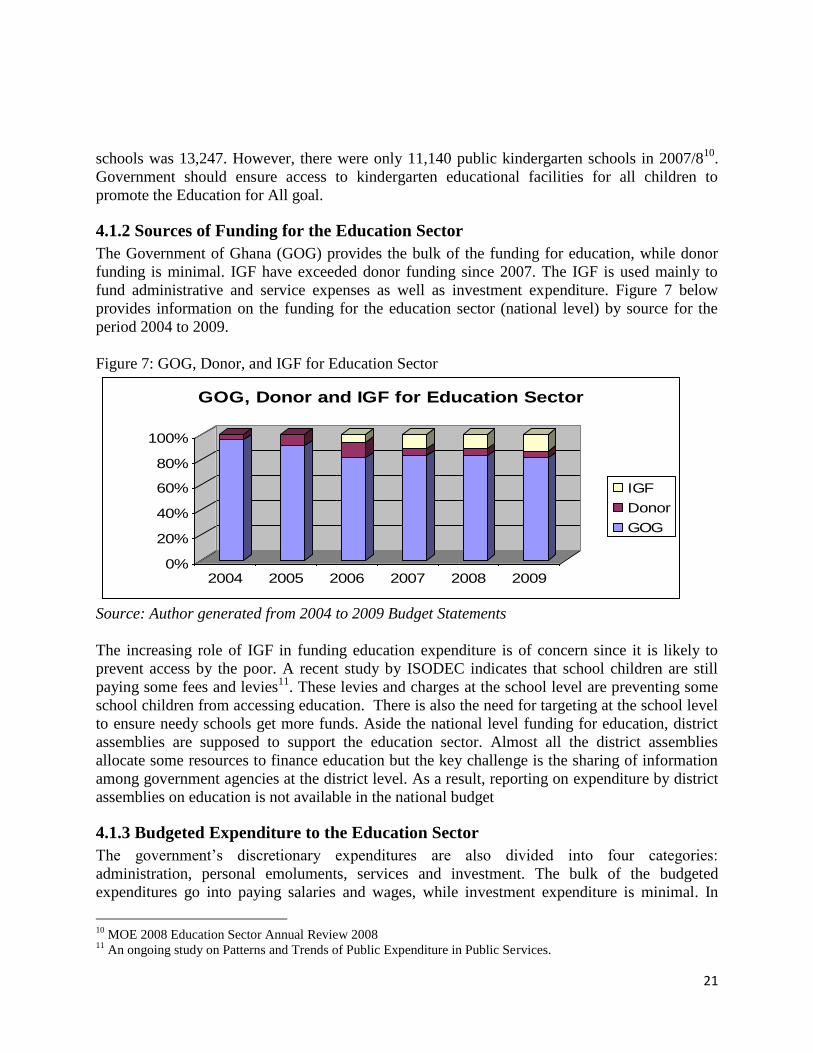
4.1.2 Sources of Funding for the Education Sector
The Government of Ghana (GOG) provides the bulk of the funding for education, while donor
funding is minimal. IGF have exceeded donor funding since 2007. The IGF is used mainly to
fund administrative and service expenses as well as investment expenditure. Figure 7 below
provides information on the funding for the education sector (national level) by source for the
period 2004 to 2009.
Figure 7: GOG, Donor, and IGF for Education Sector
0%
20%
40%
60%
80%
100%
2004 2005 2006 2007 2008 2009
GOG, Donor and IGF for Education Sector
IGF
Donor
GOG
Source: Author generated from 2004 to 2009 Budget Statements
The increasing role of IGF in funding education expenditure is of concern since it is likely to
prevent access by the poor. A recent study by ISODEC indicates that school children are still
paying some fees and levies11
. These levies and charges at the school level are preventing some
school children from accessing education. There is also the need for targeting at the school level
to ensure needy schools get more funds. Aside the national level funding for education, district
assemblies are supposed to support the education sector. Almost all the district assemblies
allocate some resources to finance education but the key challenge is the sharing of information
among government agencies at the district level. As a result, reporting on expenditure by district
assemblies on education is not available in the national budget
4.1.3 Budgeted Expenditure to the Education Sector
The government‘s discretionary expenditures are also divided into four categories:
administration, personal emoluments, services and investment. The bulk of the budgeted
expenditures go into paying salaries and wages, while investment expenditure is minimal. In
10
MOE 2008 Education Sector Annual Review 2008 11
An ongoing study on Patterns and Trends of Public Expenditure in Public Services.
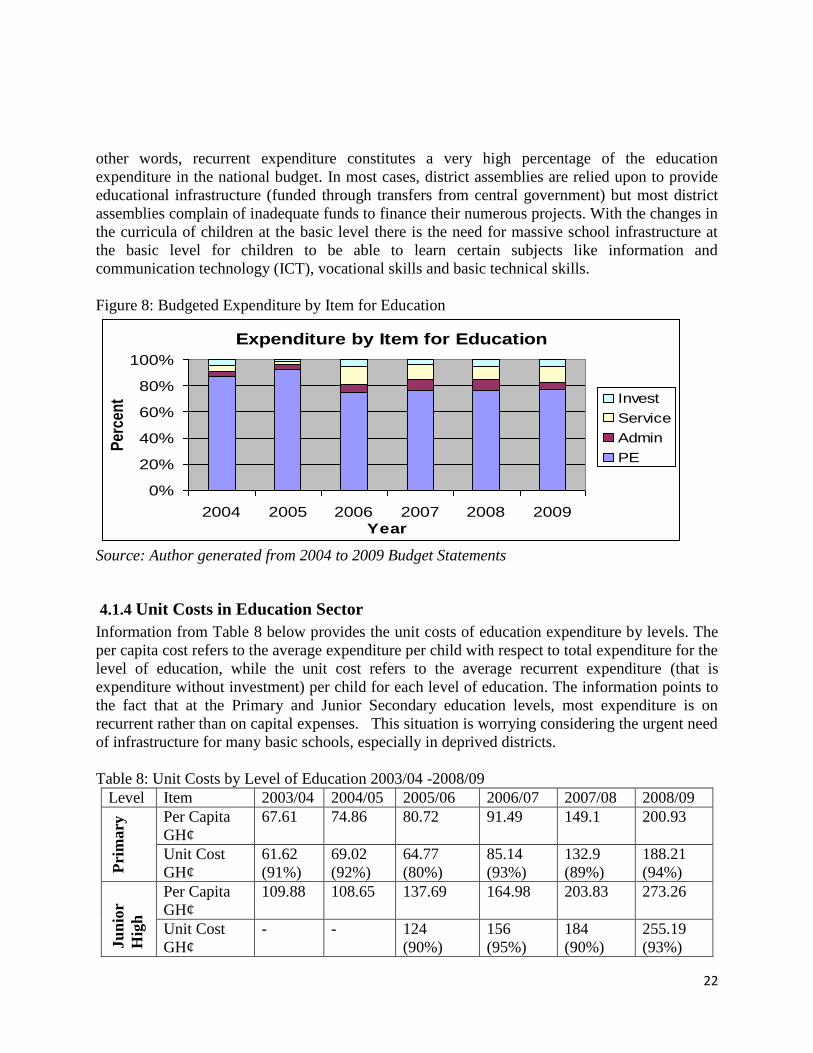
22
other words, recurrent expenditure constitutes a very high percentage of the education
expenditure in the national budget. In most cases, district assemblies are relied upon to provide
educational infrastructure (funded through transfers from central government) but most district
assemblies complain of inadequate funds to finance their numerous projects. With the changes in
the curricula of children at the basic level there is the need for massive school infrastructure at
the basic level for children to be able to learn certain subjects like information and
communication technology (ICT), vocational skills and basic technical skills.
Figure 8: Budgeted Expenditure by Item for Education
Expenditure by Item for Education
0%
20%
40%
60%
80%
100%
2004 2005 2006 2007 2008 2009Year
Per
cen
t Invest
Service
Admin
PE
Source: Author generated from 2004 to 2009 Budget Statements
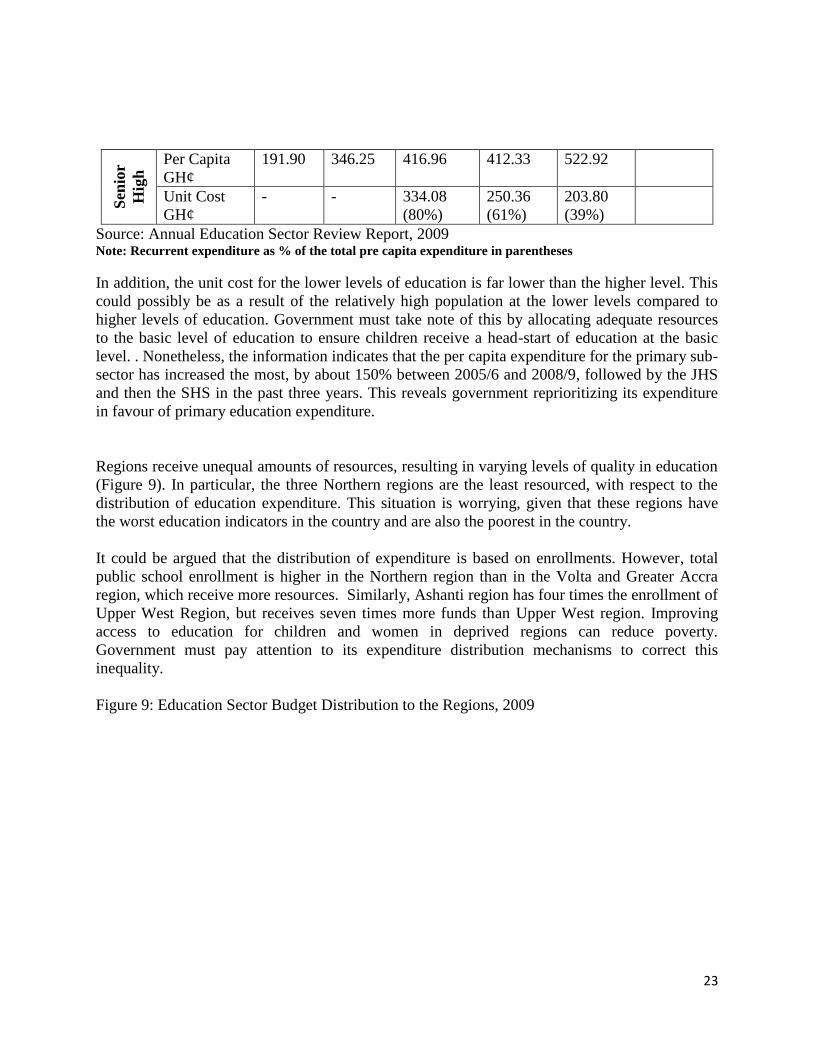
4.1.4 Unit Costs in Education Sector
Information from Table 8 below provides the unit costs of education expenditure by levels. The
per capita cost refers to the average expenditure per child with respect to total expenditure for the
level of education, while the unit cost refers to the average recurrent expenditure (that is
expenditure without investment) per child for each level of education. The information points to
the fact that at the Primary and Junior Secondary education levels, most expenditure is on
recurrent rather than on capital expenses. This situation is worrying considering the urgent need
of infrastructure for many basic schools, especially in deprived districts.
Table 8: Unit Costs by Level of Education 2003/04 -2008/09
Level Item 2003/04 2004/05 2005/06 2006/07 2007/08 2008/09
Pri
mary
Per Capita
GH¢
67.61 74.86 80.72 91.49 149.1 200.93
Unit Cost
GH¢
61.62
(91%)
69.02
(92%)
64.77
(80%)
85.14
(93%)
132.9
(89%)
188.21
(94%)
Ju
nio
r
Hig
h
Per Capita
GH¢
109.88 108.65 137.69 164.98 203.83 273.26
Unit Cost
GH¢
- - 124
(90%)
156
(95%)
184
(90%)
255.19
(93%)
23
Sen
ior
Hig
h Per Capita
GH¢
191.90 346.25 416.96 412.33 522.92
Unit Cost
GH¢
- - 334.08
(80%)
250.36
(61%)
203.80
(39%)
Source: Annual Education Sector Review Report, 2009 Note: Recurrent expenditure as % of the total pre capita expenditure in parentheses
In addition, the unit cost for the lower levels of education is far lower than the higher level. This
could possibly be as a result of the relatively high population at the lower levels compared to
higher levels of education. Government must take note of this by allocating adequate resources
to the basic level of education to ensure children receive a head-start of education at the basic
level. . Nonetheless, the information indicates that the per capita expenditure for the primary sub-
sector has increased the most, by about 150% between 2005/6 and 2008/9, followed by the JHS
and then the SHS in the past three years. This reveals government reprioritizing its expenditure
in favour of primary education expenditure.
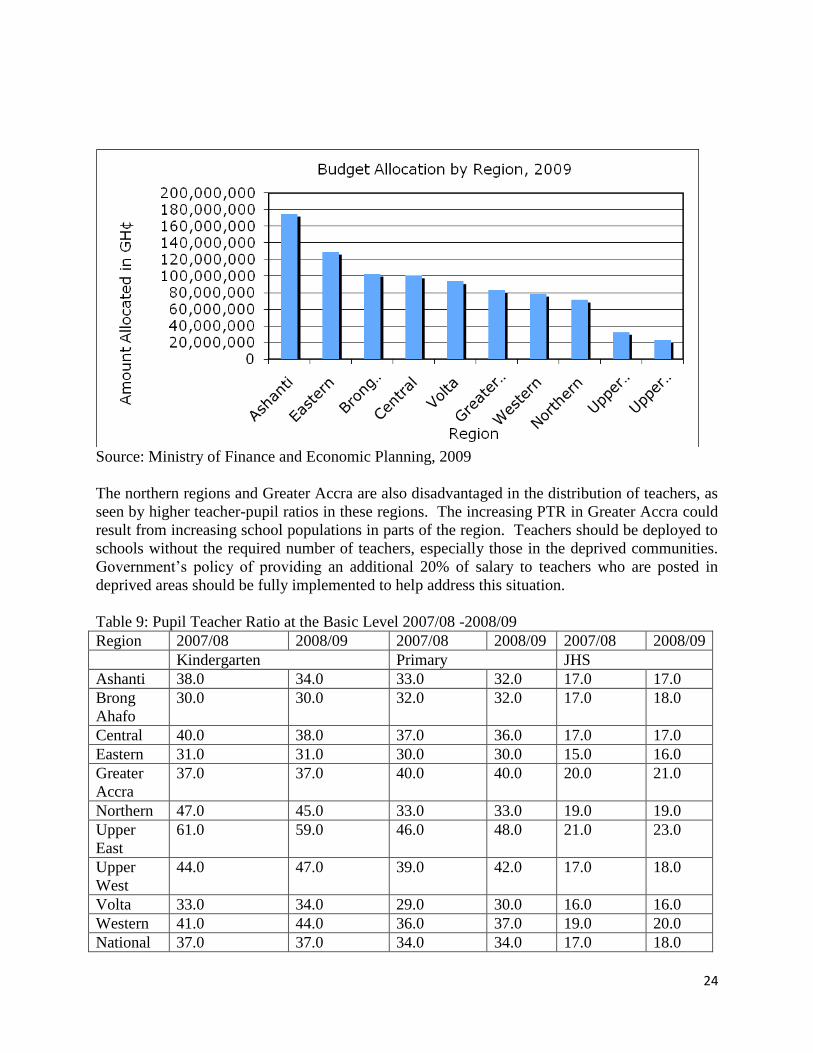
Regions receive unequal amounts of resources, resulting in varying levels of quality in education
(Figure 9). In particular, the three Northern regions are the least resourced, with respect to the
distribution of education expenditure. This situation is worrying, given that these regions have
the worst education indicators in the country and are also the poorest in the country.
It could be argued that the distribution of expenditure is based on enrollments. However, total
public school enrollment is higher in the Northern region than in the Volta and Greater Accra
region, which receive more resources. Similarly, Ashanti region has four times the enrollment of
Upper West Region, but receives seven times more funds than Upper West region. Improving
access to education for children and women in deprived regions can reduce poverty.
Government must pay attention to its expenditure distribution mechanisms to correct this
inequality.
Figure 9: Education Sector Budget Distribution to the Regions, 2009
24
Source: Ministry of Finance and Economic Planning, 2009
The northern regions and Greater Accra are also disadvantaged in the distribution of teachers, as
seen by higher teacher-pupil ratios in these regions. The increasing PTR in Greater Accra could
result from increasing school populations in parts of the region. Teachers should be deployed to
schools without the required number of teachers, especially those in the deprived communities.
Government‘s policy of providing an additional 20% of salary to teachers who are posted in
deprived areas should be fully implemented to help address this situation.
Table 9: Pupil Teacher Ratio at the Basic Level 2007/08 -2008/09
Region 2007/08 2008/09 2007/08 2008/09 2007/08 2008/09
Kindergarten Primary JHS
Ashanti 38.0 34.0 33.0 32.0 17.0 17.0
Brong
Ahafo
30.0 30.0 32.0 32.0 17.0 18.0
Central 40.0 38.0 37.0 36.0 17.0 17.0
Eastern 31.0 31.0 30.0 30.0 15.0 16.0
Greater
Accra
37.0 37.0 40.0 40.0 20.0 21.0
Northern 47.0 45.0 33.0 33.0 19.0 19.0
Upper
East
61.0 59.0 46.0 48.0 21.0 23.0
Upper
West
44.0 47.0 39.0 42.0 17.0 18.0
Volta 33.0 34.0 29.0 30.0 16.0 16.0
Western 41.0 44.0 36.0 37.0 19.0 20.0
National 37.0 37.0 34.0 34.0 17.0 18.0
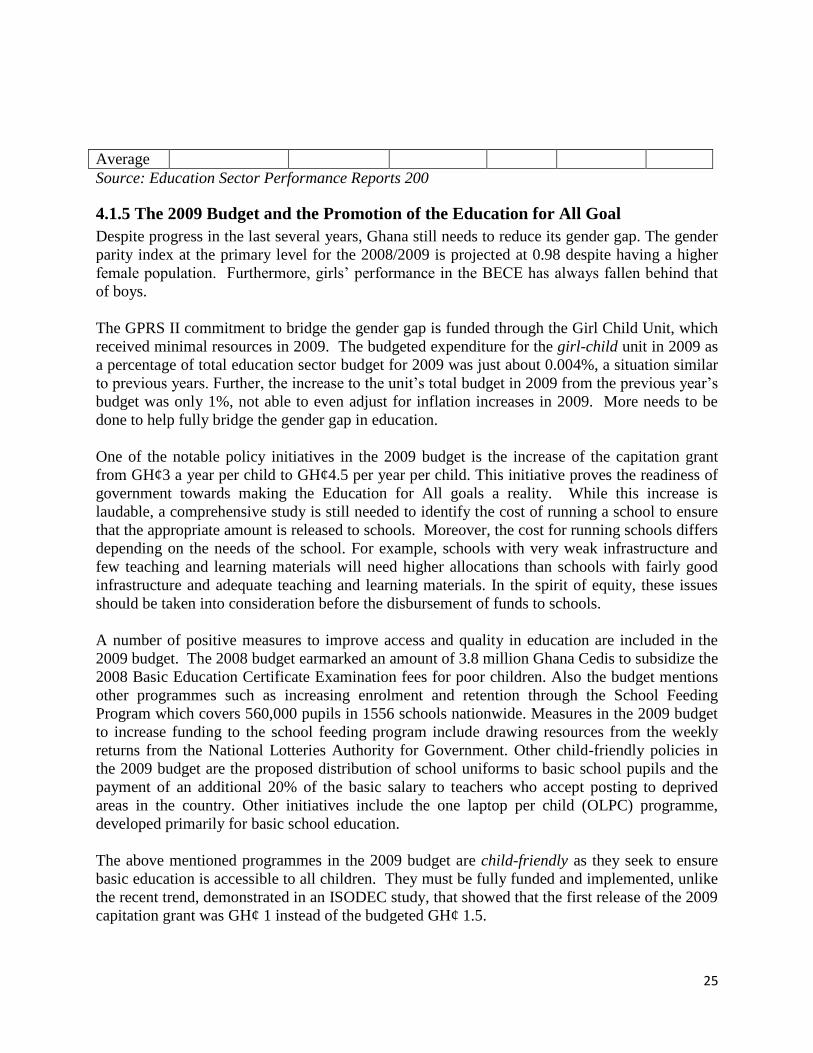
25
Average
Source: Education Sector Performance Reports 200
4.1.5 The 2009 Budget and the Promotion of the Education for All Goal
Despite progress in the last several years, Ghana still needs to reduce its gender gap. The gender
parity index at the primary level for the 2008/2009 is projected at 0.98 despite having a higher
female population. Furthermore, girls‘ performance in the BECE has always fallen behind that
of boys.
The GPRS II commitment to bridge the gender gap is funded through the Girl Child Unit, which
received minimal resources in 2009. The budgeted expenditure for the girl-child unit in 2009 as
a percentage of total education sector budget for 2009 was just about 0.004%, a situation similar
to previous years. Further, the increase to the unit‘s total budget in 2009 from the previous year‘s
budget was only 1%, not able to even adjust for inflation increases in 2009. More needs to be
done to help fully bridge the gender gap in education.
One of the notable policy initiatives in the 2009 budget is the increase of the capitation grant
from GH¢3 a year per child to GH¢4.5 per year per child. This initiative proves the readiness of
government towards making the Education for All goals a reality. While this increase is
laudable, a comprehensive study is still needed to identify the cost of running a school to ensure
that the appropriate amount is released to schools. Moreover, the cost for running schools differs
depending on the needs of the school. For example, schools with very weak infrastructure and
few teaching and learning materials will need higher allocations than schools with fairly good
infrastructure and adequate teaching and learning materials. In the spirit of equity, these issues
should be taken into consideration before the disbursement of funds to schools.
A number of positive measures to improve access and quality in education are included in the
2009 budget. The 2008 budget earmarked an amount of 3.8 million Ghana Cedis to subsidize the
2008 Basic Education Certificate Examination fees for poor children. Also the budget mentions
other programmes such as increasing enrolment and retention through the School Feeding
Program which covers 560,000 pupils in 1556 schools nationwide. Measures in the 2009 budget
to increase funding to the school feeding program include drawing resources from the weekly
returns from the National Lotteries Authority for Government. Other child-friendly policies in
the 2009 budget are the proposed distribution of school uniforms to basic school pupils and the
payment of an additional 20% of the basic salary to teachers who accept posting to deprived
areas in the country. Other initiatives include the one laptop per child (OLPC) programme,
developed primarily for basic school education.
The above mentioned programmes in the 2009 budget are child-friendly as they seek to ensure
basic education is accessible to all children. They must be fully funded and implemented, unlike
the recent trend, demonstrated in an ISODEC study, that showed that the first release of the 2009
capitation grant was GH¢ 1 instead of the budgeted GH¢ 1.5.
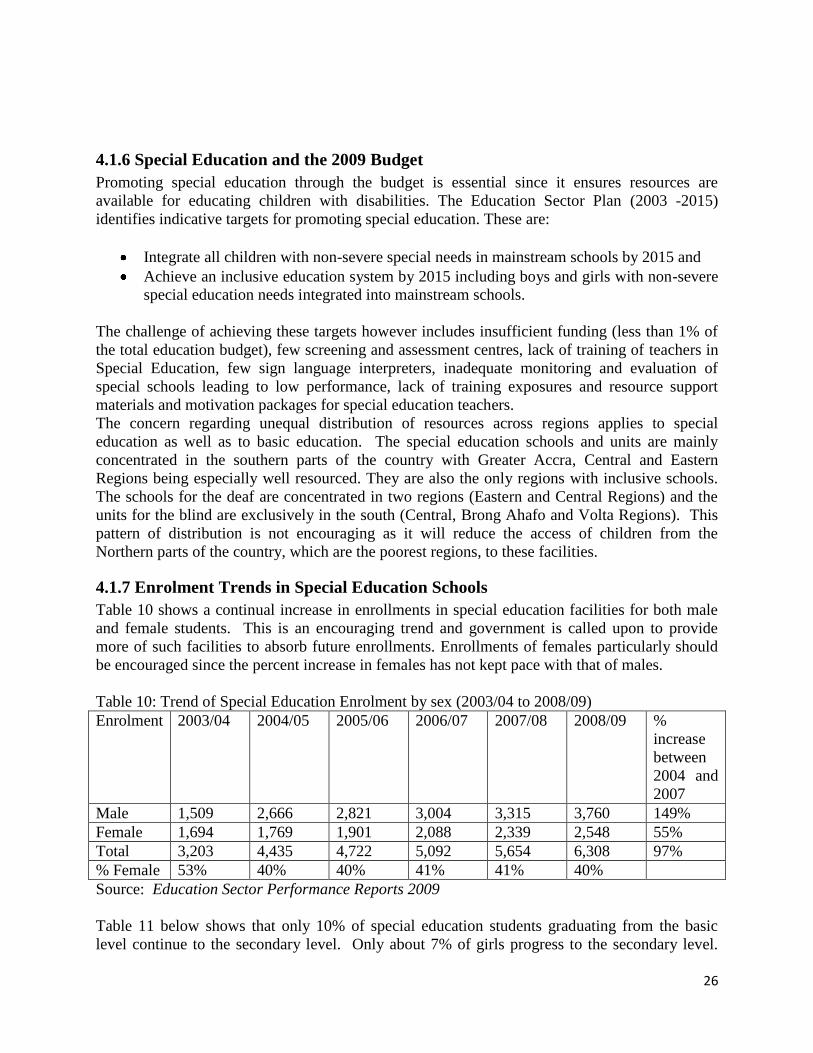
26
4.1.6 Special Education and the 2009 Budget
Promoting special education through the budget is essential since it ensures resources are
available for educating children with disabilities. The Education Sector Plan (2003 -2015)
identifies indicative targets for promoting special education. These are:
Integrate all children with non-severe special needs in mainstream schools by 2015 and
Achieve an inclusive education system by 2015 including boys and girls with non-severe
special education needs integrated into mainstream schools.
The challenge of achieving these targets however includes insufficient funding (less than 1% of
the total education budget), few screening and assessment centres, lack of training of teachers in
Special Education, few sign language interpreters, inadequate monitoring and evaluation of
special schools leading to low performance, lack of training exposures and resource support
materials and motivation packages for special education teachers.
The concern regarding unequal distribution of resources across regions applies to special
education as well as to basic education. The special education schools and units are mainly
concentrated in the southern parts of the country with Greater Accra, Central and Eastern
Regions being especially well resourced. They are also the only regions with inclusive schools.
The schools for the deaf are concentrated in two regions (Eastern and Central Regions) and the
units for the blind are exclusively in the south (Central, Brong Ahafo and Volta Regions). This
pattern of distribution is not encouraging as it will reduce the access of children from the
Northern parts of the country, which are the poorest regions, to these facilities.
4.1.7 Enrolment Trends in Special Education Schools
Table 10 shows a continual increase in enrollments in special education facilities for both male
and female students. This is an encouraging trend and government is called upon to provide
more of such facilities to absorb future enrollments. Enrollments of females particularly should
be encouraged since the percent increase in females has not kept pace with that of males.
Table 10: Trend of Special Education Enrolment by sex (2003/04 to 2008/09)
Enrolment 2003/04 2004/05 2005/06 2006/07 2007/08 2008/09 %
increase
between
2004 and
2007
Male 1,509 2,666 2,821 3,004 3,315 3,760 149%
Female 1,694 1,769 1,901 2,088 2,339 2,548 55%
Total 3,203 4,435 4,722 5,092 5,654 6,308 97%
% Female 53% 40% 40% 41% 41% 40%
Source: Education Sector Performance Reports 2009
Table 11 below shows that only 10% of special education students graduating from the basic
level continue to the secondary level. Only about 7% of girls progress to the secondary level.
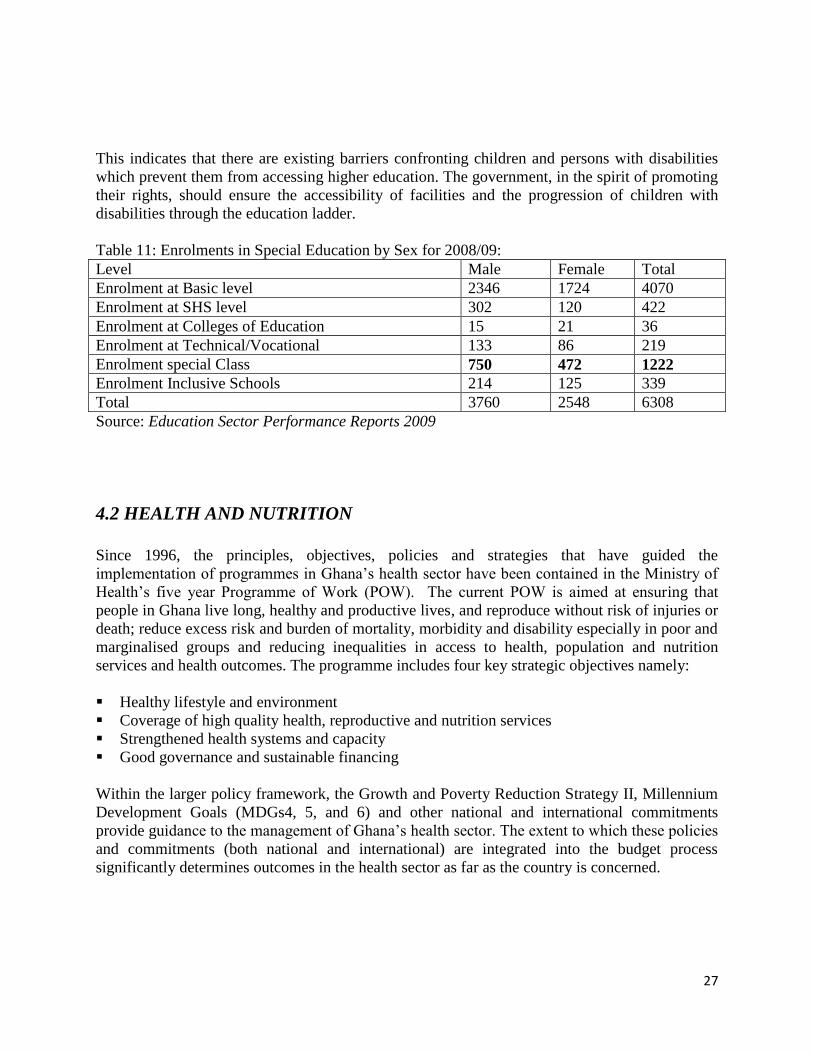
27
This indicates that there are existing barriers confronting children and persons with disabilities
which prevent them from accessing higher education. The government, in the spirit of promoting
their rights, should ensure the accessibility of facilities and the progression of children with
disabilities through the education ladder.
Table 11: Enrolments in Special Education by Sex for 2008/09:
Level Male Female Total
Enrolment at Basic level 2346 1724 4070
Enrolment at SHS level 302 120 422
Enrolment at Colleges of Education 15 21 36
Enrolment at Technical/Vocational 133 86 219
Enrolment special Class 750 472 1222
Enrolment Inclusive Schools 214 125 339
Total 3760 2548 6308
Source: Education Sector Performance Reports 2009
4.2 HEALTH AND NUTRITION
Since 1996, the principles, objectives, policies and strategies that have guided the
implementation of programmes in Ghana‘s health sector have been contained in the Ministry of
Health‘s five year Programme of Work (POW). The current POW is aimed at ensuring that
people in Ghana live long, healthy and productive lives, and reproduce without risk of injuries or
death; reduce excess risk and burden of mortality, morbidity and disability especially in poor and
marginalised groups and reducing inequalities in access to health, population and nutrition
services and health outcomes. The programme includes four key strategic objectives namely:
Healthy lifestyle and environment
Coverage of high quality health, reproductive and nutrition services
Strengthened health systems and capacity
Good governance and sustainable financing
Within the larger policy framework, the Growth and Poverty Reduction Strategy II, Millennium
Development Goals (MDGs4, 5, and 6) and other national and international commitments
provide guidance to the management of Ghana‘s health sector. The extent to which these policies
and commitments (both national and international) are integrated into the budget process
significantly determines outcomes in the health sector as far as the country is concerned.
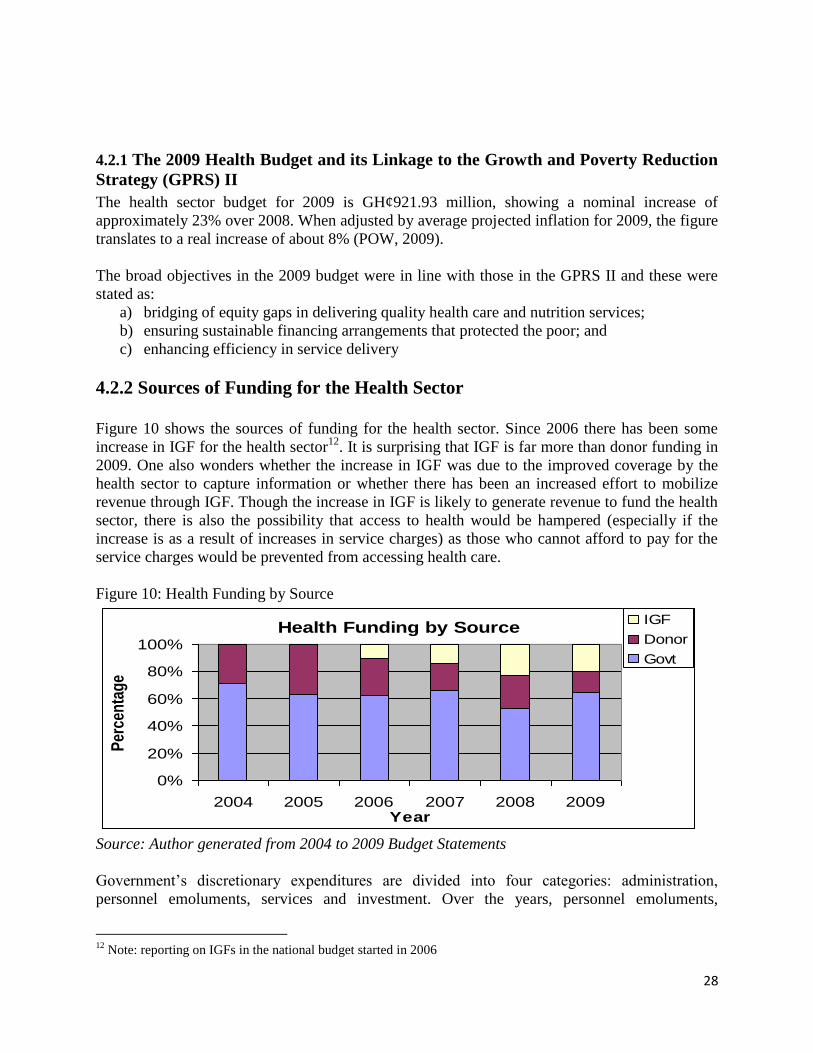
28
4.2.1 The 2009 Health Budget and its Linkage to the Growth and Poverty Reduction
Strategy (GPRS) II
The health sector budget for 2009 is GH¢921.93 million, showing a nominal increase of
approximately 23% over 2008. When adjusted by average projected inflation for 2009, the figure
translates to a real increase of about 8% (POW, 2009).
The broad objectives in the 2009 budget were in line with those in the GPRS II and these were
stated as:
a) bridging of equity gaps in delivering quality health care and nutrition services;
b) ensuring sustainable financing arrangements that protected the poor; and
c) enhancing efficiency in service delivery
4.2.2 Sources of Funding for the Health Sector
Figure 10 shows the sources of funding for the health sector. Since 2006 there has been some
increase in IGF for the health sector12
. It is surprising that IGF is far more than donor funding in
2009. One also wonders whether the increase in IGF was due to the improved coverage by the
health sector to capture information or whether there has been an increased effort to mobilize
revenue through IGF. Though the increase in IGF is likely to generate revenue to fund the health
sector, there is also the possibility that access to health would be hampered (especially if the
increase is as a result of increases in service charges) as those who cannot afford to pay for the
service charges would be prevented from accessing health care.
Figure 10: Health Funding by Source
Health Funding by Source
0%
20%
40%
60%
80%
100%
2004 2005 2006 2007 2008 2009Year
Per
cen
tag
e
IGF
Donor
Govt
Source: Author generated from 2004 to 2009 Budget Statements
Government‘s discretionary expenditures are divided into four categories: administration,
personnel emoluments, services and investment. Over the years, personnel emoluments,
12
Note: reporting on IGFs in the national budget started in 2006
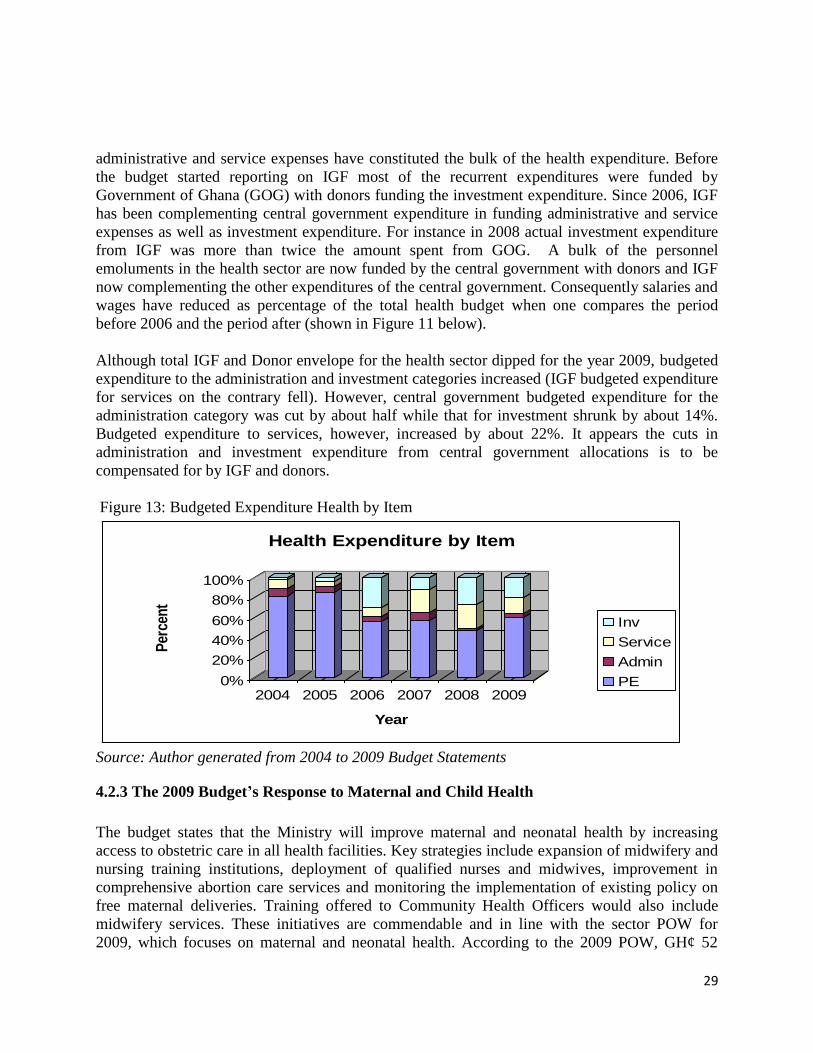
29
administrative and service expenses have constituted the bulk of the health expenditure. Before
the budget started reporting on IGF most of the recurrent expenditures were funded by
Government of Ghana (GOG) with donors funding the investment expenditure. Since 2006, IGF
has been complementing central government expenditure in funding administrative and service
expenses as well as investment expenditure. For instance in 2008 actual investment expenditure
from IGF was more than twice the amount spent from GOG. A bulk of the personnel
emoluments in the health sector are now funded by the central government with donors and IGF
now complementing the other expenditures of the central government. Consequently salaries and
wages have reduced as percentage of the total health budget when one compares the period
before 2006 and the period after (shown in Figure 11 below).
Although total IGF and Donor envelope for the health sector dipped for the year 2009, budgeted
expenditure to the administration and investment categories increased (IGF budgeted expenditure
for services on the contrary fell). However, central government budgeted expenditure for the
administration category was cut by about half while that for investment shrunk by about 14%.
Budgeted expenditure to services, however, increased by about 22%. It appears the cuts in
administration and investment expenditure from central government allocations is to be
compensated for by IGF and donors.
Figure 13: Budgeted Expenditure Health by Item
0%
20%
40%
60%
80%
100%
Per
cen
t
2004 2005 2006 2007 2008 2009
Year
Health Expenditure by Item
Inv
Service
Admin
PE
Source: Author generated from 2004 to 2009 Budget Statements
4.2.3 The 2009 Budget’s Response to Maternal and Child Health
The budget states that the Ministry will improve maternal and neonatal health by increasing
access to obstetric care in all health facilities. Key strategies include expansion of midwifery and
nursing training institutions, deployment of qualified nurses and midwives, improvement in
comprehensive abortion care services and monitoring the implementation of existing policy on
free maternal deliveries. Training offered to Community Health Officers would also include
midwifery services. These initiatives are commendable and in line with the sector POW for
2009, which focuses on maternal and neonatal health. According to the 2009 POW, GH¢ 52
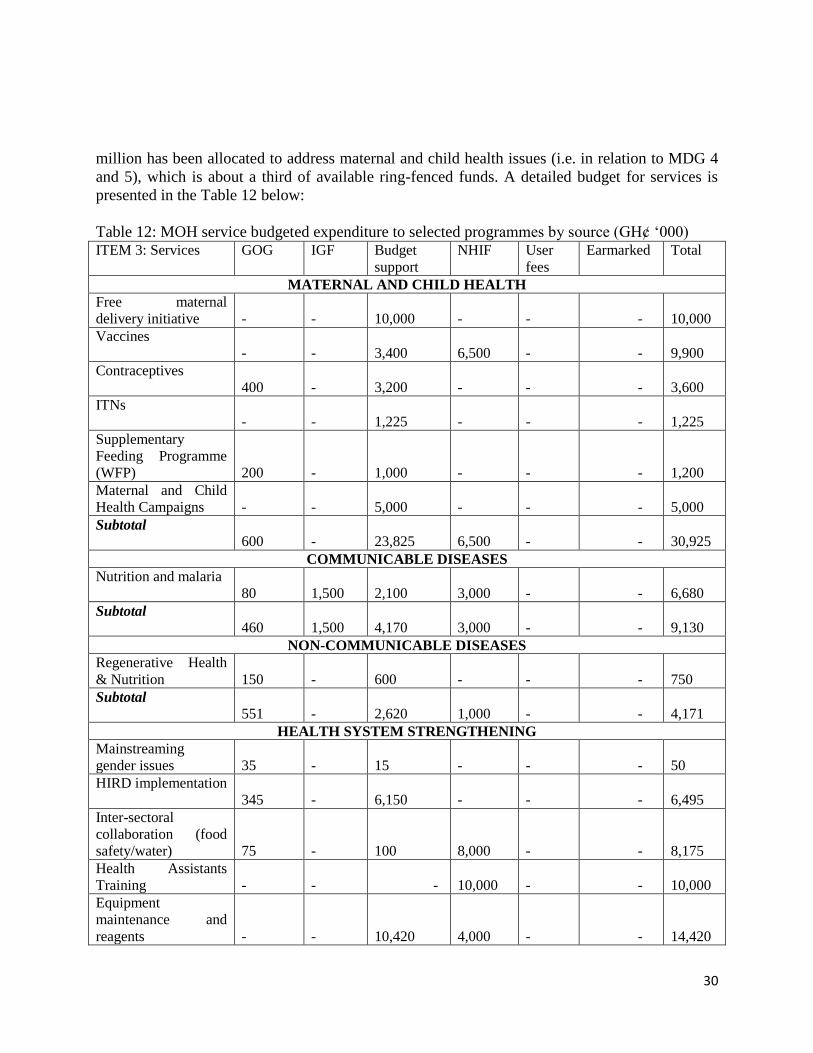
30
million has been allocated to address maternal and child health issues (i.e. in relation to MDG 4
and 5), which is about a third of available ring-fenced funds. A detailed budget for services is
presented in the Table 12 below:
Table 12: MOH service budgeted expenditure to selected programmes by source (GH¢ ‗000) ITEM 3: Services GOG IGF Budget
support NHIF User
fees Earmarked Total
MATERNAL AND CHILD HEALTH Free maternal
delivery initiative
-
-
10,000
-
- -
10,000 Vaccines
-
-
3,400
6,500
- -
9,900 Contraceptives
400
-
3,200
-
- -
3,600 ITNs
-
-
1,225
-
- -
1,225 Supplementary
Feeding Programme
(WFP)
200
-
1,000
-
- -
1,200 Maternal and Child
Health Campaigns
-
-
5,000
-
- -
5,000 Subtotal
600
-
23,825
6,500
- -
30,925 COMMUNICABLE DISEASES
Nutrition and malaria
80
1,500
2,100
3,000
- -
6,680 Subtotal
460
1,500
4,170
3,000
- -
9,130 NON-COMMUNICABLE DISEASES
Regenerative Health
& Nutrition
150
-
600
-
- -
750 Subtotal
551
-
2,620
1,000
- -
4,171 HEALTH SYSTEM STRENGTHENING
Mainstreaming
gender issues
35
-
15
-
- -
50 HIRD implementation
345
-
6,150
-
- -
6,495 Inter-sectoral
collaboration (food
safety/water)
75
-
100
8,000
- -
8,175 Health Assistants
Training
-
- -
10,000
- -
10,000 Equipment
maintenance and
reagents
-
-
10,420
4,000
- -
14,420
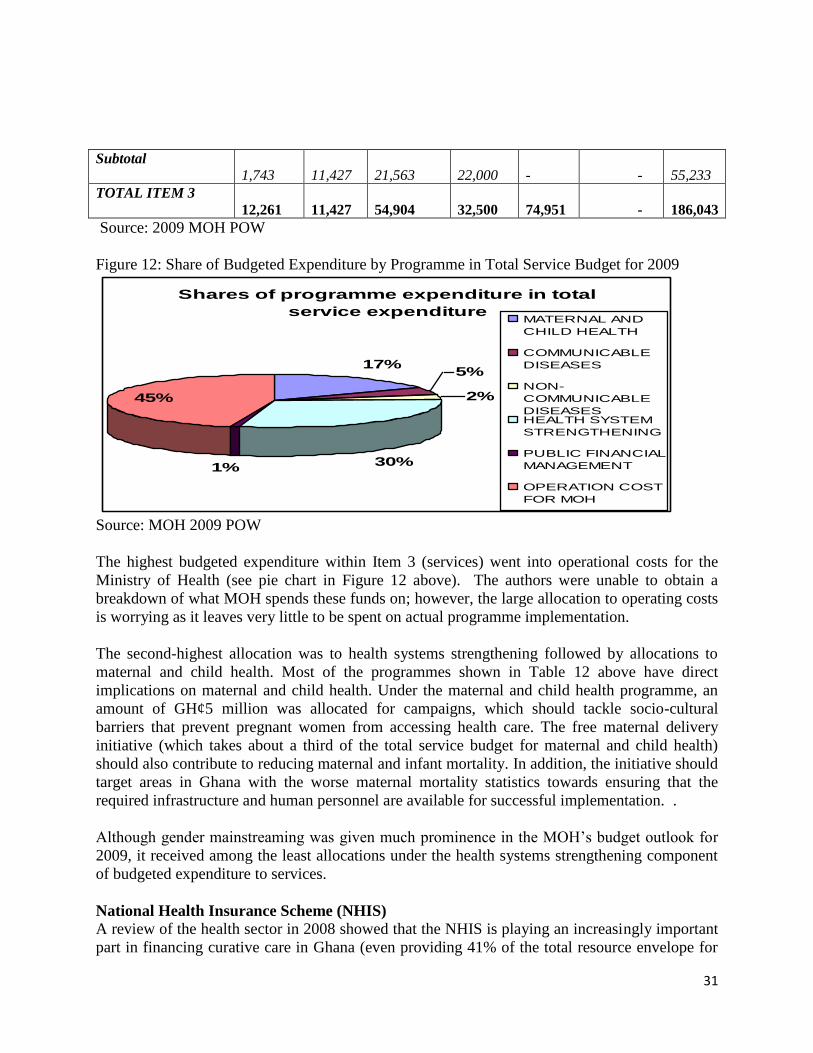
31
Subtotal
1,743
11,427
21,563
22,000
- -
55,233 TOTAL ITEM 3
12,261
11,427
54,904
32,500
74,951 -
186,043
Source: 2009 MOH POW
Figure 12: Share of Budgeted Expenditure by Programme in Total Service Budget for 2009
Shares of programme expenditure in total
service expenditure
17%5%
2%
1% 30%
45%
MATERNAL AND
CHILD HEALTH
COMMUNICABLE
DISEASES
NON-
COMMUNICABLE
DISEASESHEALTH SYSTEM
STRENGTHENING
PUBLIC FINANCIAL
MANAGEMENT
OPERATION COST
FOR MOH
Source: MOH 2009 POW
The highest budgeted expenditure within Item 3 (services) went into operational costs for the
Ministry of Health (see pie chart in Figure 12 above). The authors were unable to obtain a
breakdown of what MOH spends these funds on; however, the large allocation to operating costs
is worrying as it leaves very little to be spent on actual programme implementation.
The second-highest allocation was to health systems strengthening followed by allocations to
maternal and child health. Most of the programmes shown in Table 12 above have direct
implications on maternal and child health. Under the maternal and child health programme, an
amount of GH¢5 million was allocated for campaigns, which should tackle socio-cultural
barriers that prevent pregnant women from accessing health care. The free maternal delivery
initiative (which takes about a third of the total service budget for maternal and child health)
should also contribute to reducing maternal and infant mortality. In addition, the initiative should
target areas in Ghana with the worse maternal mortality statistics towards ensuring that the
required infrastructure and human personnel are available for successful implementation. .
Although gender mainstreaming was given much prominence in the MOH‘s budget outlook for
2009, it received among the least allocations under the health systems strengthening component
of budgeted expenditure to services.
National Health Insurance Scheme (NHIS)
A review of the health sector in 2008 showed that the NHIS is playing an increasingly important
part in financing curative care in Ghana (even providing 41% of the total resource envelope for
32
2009). Serious problems emerged in 2008, which resulted in long backlogs of re-imbursement to
health facilities. Some of the more basic issues, such as adequate staffing to process claims, were
being addressed (according to the report), but the underlying drivers such as cost escalation and
inadequate subsidies being paid to District Health Information Management System (DMHIS)
require a more fundamental review13
.
The 2009 budget mentioned that the National Health Insurance Scheme will be restructured to
respond to the needs of the population and improve upon the issue of claims management. The
budget indicated that ―It will also pursue the policy of de-linking children from their parents
registration and the provision of free maternal care. To this end, a proposal for amendment of
the NHIS Act has been put before parliament to decouple the registration of children from their
parents. Given the importance of the issue, it is hoped that parliament will expedite action on the
amendment.
Training and Deployment of Health Personnel
As mentioned earlier, the 2009 budget hopes to expand existing health training institutions in
order to increase the supply of health personnel. It is important that qualified health personnel are
deployed in a manner that addresses geographical inequality in access to maternal and child
health services. Moreover, there must be a clear demonstration of commitment to resolving the
recurrent challenge of medical personnel refusing postings to deprived areas of Ghana14
. Quite
apart from improving the service conditions of health personnel in general and the provision of
accommodation facilities in particular, sanctions must also apply to those who infringe upon
service rules and regulations.
Capital Investment
Equipping health centres requires heavy investment. For example, once facilities available at the
district hospitals are up to the required standard, they would be accredited by the Medical and
Dental Council to receive doctors on houseman-ship. However, total capital investment budgeted
expenditure from all expected sources for year 2009 fell short of the amount required for the
health sector by about 24%. This has implications on the ability of the ministry to carry out its
capital investment plan for the year.
Inter-sectoral collaboration
In 2008, the Ministry of Health collaborated with the then Ministry of Education, Science and
Sports in incorporating the Regenerative Health and Nutrition Programme into the School
Feeding Programme of the Ghana Education Service. This is expected to continue in 2009.
According to the 2009 budget, ―the Ministry will embark upon major multi-sector collaboration
with the view to improving sanitation and targeting safe food and water. Specifically, it will
collaborate with the Ministries of Local Government & Rural Development, Education, Women
& Children, Water Resources, Works & Housing and Food & Agriculture to develop relevant
13
MOH 2009 Independent Review Health Sector Programme of Work 2008 14
According a report in the Tuesday 6th
May 2009 edition of the Daily Graphic, only 2 out of 9 medical doctors
posted to the Upper West region reported for duty
33
regulations and guidelines to ensure safety of food, water and sanitation‖ The initiative is part of
the health system strengthening programme. It received the third highest allocation under the
programme. This is encouraging in the sense that if implemented it will promote inter sectoral
collaborations to address challenges facing the health sector.
4.3 WATER
Water is an essential service for realizing the right to an adequate standard of living, including
food and health. Everyone has a right to have access to safe, sufficient, affordable and accessible
drinking water that is adequate for daily individual requirements (UNOCHCR, 2OO2). Thus
access to water is defined by determinants such as availability, cost or affordability, distance and
time spent on getting water, among others.
4.3.1 Water Access in Ghana’s Development Framework: The GPRS II and Water
Policy
The GPRS II provides for accelerating the provision of safe water and environmental sanitation
in both rural and urban areas. It includes policies to ensure safe water in both rural and urban
areas.
In line with the GPRS II, a National Water Policy was launched on 27th
February 2008. The
policy is geared towards achieving ―sustainable development, management and use of Ghana‘s
water resources to improve health livelihoods, reduce vulnerability while assuring good
governance for present and future generations‖15
. The policy acknowledges the importance of
integrating women into decision making processes to ensure transparency and accountability in
the management of water. It proposes women‘s empowerment through training to facilitate
effective partnership with their male counterparts.
Government‘s responsibility to ensure provision of safe water is in line with its commitment to
achieving the Millennium Development Goal (MDG) of 73% of water coverage by 2015 as well
as achieving the Growth and Poverty Reduction Strategy objective of 85% coverage by 2015.
4.3.2 Sources of Funding for the Water Sector
The Ministry of Water Resources, Works and Housing is responsible for ensuring the provision
of safe water and the development of infrastructure in the areas of housing, drainage works,
coastal protection, hydrology and water related sanitation facilities throughout the country.
Figure 13 indicates that the share of the Ministry‘s budget devoted to rural water has risen from
around half in 2007 to approximately two-thirds in 2009. Although budgeted expenditure to
both rural water and the sector Ministry fell in 2007, it has been rising since then. Though the
15
National Water Policy, June 2007.
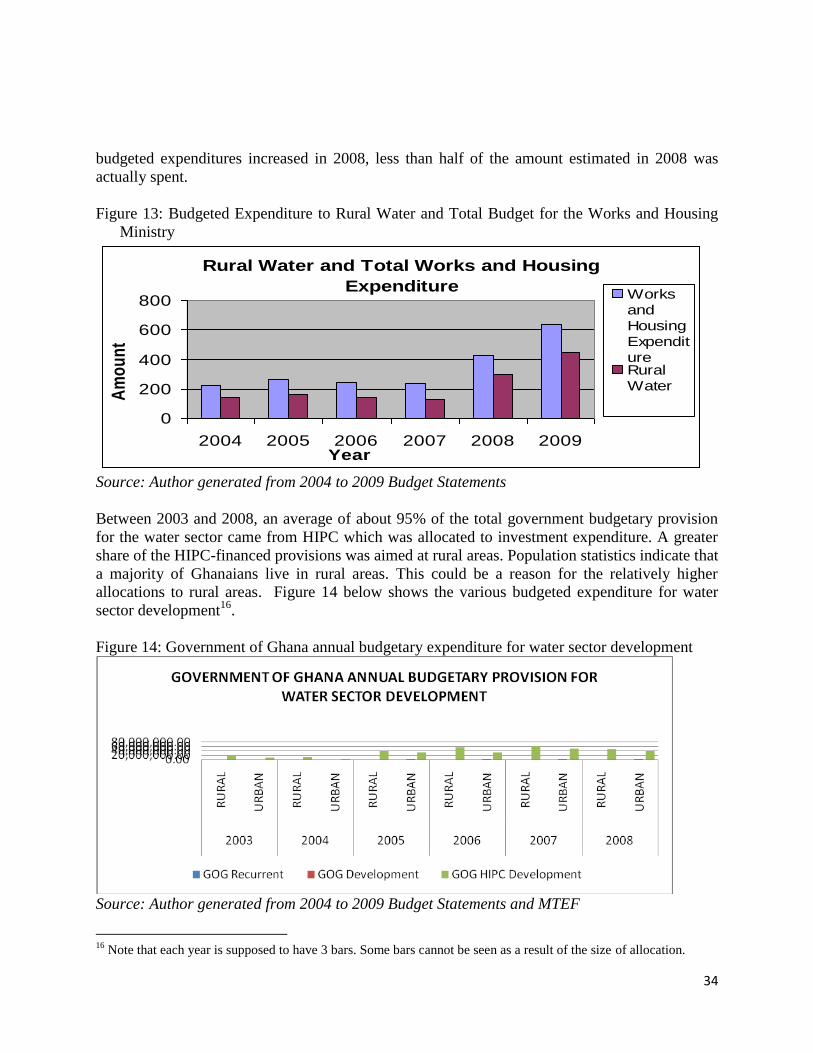
34
budgeted expenditures increased in 2008, less than half of the amount estimated in 2008 was
actually spent.
Figure 13: Budgeted Expenditure to Rural Water and Total Budget for the Works and Housing
Ministry
Rural Water and Total Works and Housing
Expenditure
0
200
400
600
800
2004 2005 2006 2007 2008 2009Year
Am
ou
nt
Works
and
Housing
Expendit
ureRural
Water
Source: Author generated from 2004 to 2009 Budget Statements
Between 2003 and 2008, an average of about 95% of the total government budgetary provision
for the water sector came from HIPC which was allocated to investment expenditure. A greater
share of the HIPC-financed provisions was aimed at rural areas. Population statistics indicate that
a majority of Ghanaians live in rural areas. This could be a reason for the relatively higher
allocations to rural areas. Figure 14 below shows the various budgeted expenditure for water
sector development16
.
Figure 14: Government of Ghana annual budgetary expenditure for water sector development
Source: Author generated from 2004 to 2009 Budget Statements and MTEF
16
Note that each year is supposed to have 3 bars. Some bars cannot be seen as a result of the size of allocation.
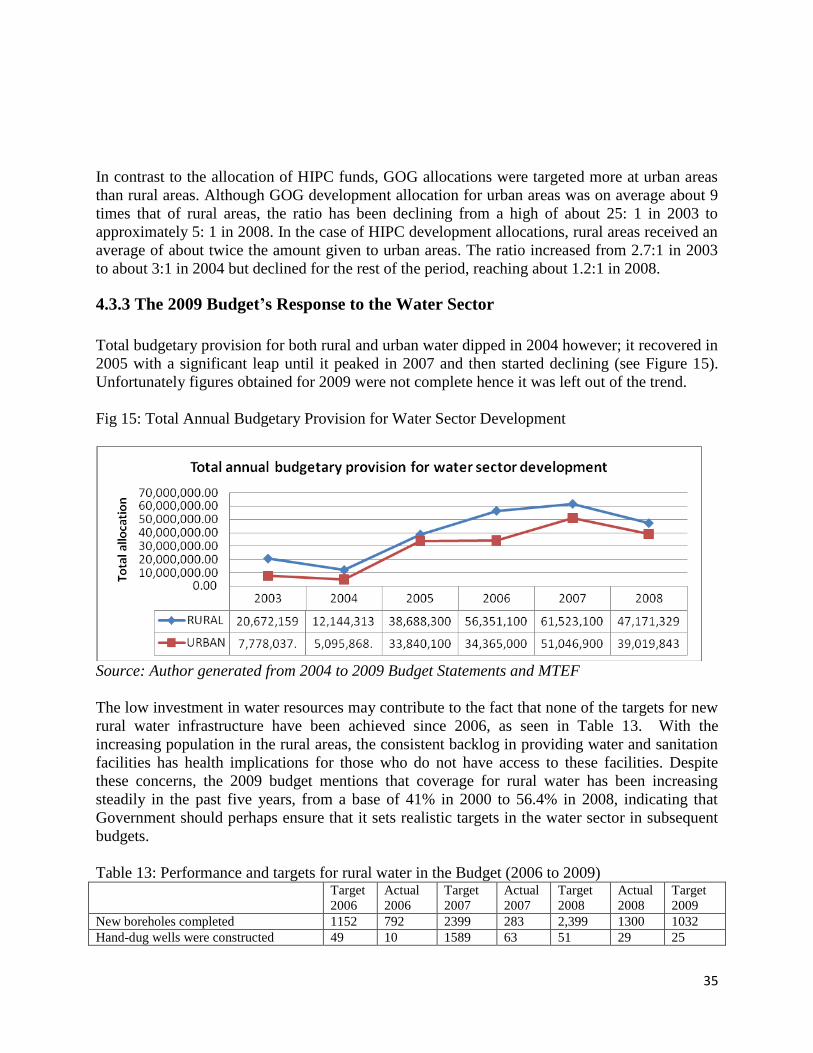
35
In contrast to the allocation of HIPC funds, GOG allocations were targeted more at urban areas
than rural areas. Although GOG development allocation for urban areas was on average about 9
times that of rural areas, the ratio has been declining from a high of about 25: 1 in 2003 to
approximately 5: 1 in 2008. In the case of HIPC development allocations, rural areas received an
average of about twice the amount given to urban areas. The ratio increased from 2.7:1 in 2003
to about 3:1 in 2004 but declined for the rest of the period, reaching about 1.2:1 in 2008.
4.3.3 The 2009 Budget’s Response to the Water Sector
Total budgetary provision for both rural and urban water dipped in 2004 however; it recovered in
2005 with a significant leap until it peaked in 2007 and then started declining (see Figure 15).
Unfortunately figures obtained for 2009 were not complete hence it was left out of the trend.
Fig 15: Total Annual Budgetary Provision for Water Sector Development
Source: Author generated from 2004 to 2009 Budget Statements and MTEF
The low investment in water resources may contribute to the fact that none of the targets for new
rural water infrastructure have been achieved since 2006, as seen in Table 13. With the
increasing population in the rural areas, the consistent backlog in providing water and sanitation
facilities has health implications for those who do not have access to these facilities. Despite
these concerns, the 2009 budget mentions that coverage for rural water has been increasing
steadily in the past five years, from a base of 41% in 2000 to 56.4% in 2008, indicating that
Government should perhaps ensure that it sets realistic targets in the water sector in subsequent
budgets.
Table 13: Performance and targets for rural water in the Budget (2006 to 2009) Target
2006
Actual
2006
Target
2007
Actual
2007
Target
2008
Actual
2008
Target
2009
New boreholes completed 1152 792 2399 283 2,399 1300 1032
Hand-dug wells were constructed 49 10 1589 63 51 29 25
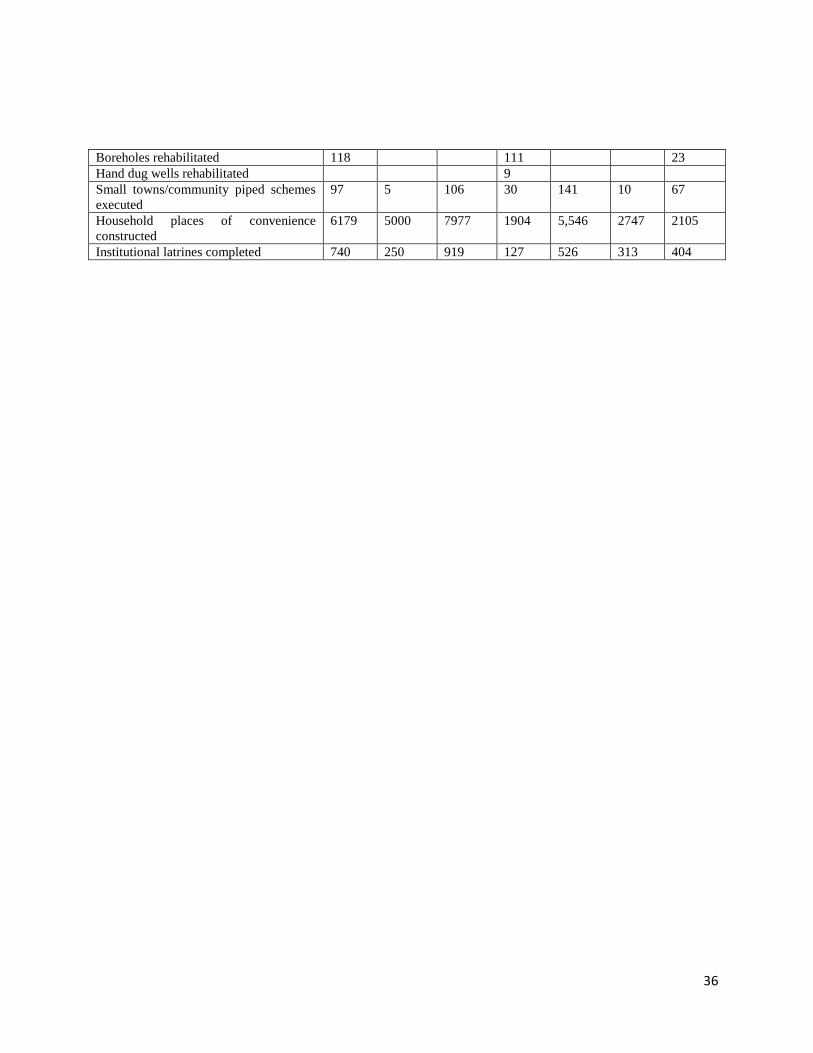
36
Boreholes rehabilitated 118 111 23
Hand dug wells rehabilitated 9
Small towns/community piped schemes
executed
97 5 106 30 141 10 67
Household places of convenience
constructed
6179 5000 7977 1904 5,546 2747 2105
Institutional latrines completed 740 250 919 127 526 313 404
37
In contrast to progress being made in rural areas, the 2008 budget stated that safe water
coverage for the urban population was 70% in 2000, dropping to 57% in 2007. Urban
water suffers from a rapidly increasing population being served by the same
infrastructure over the years. The current urban water production nationwide is about
127,600,000 million gallons per day as against a population demand of about
231,000,000 million gallons per day which was expected to increase to about
237,600,000 million gallons per day by the end of year 2007.17
Inadequate access to water has many implications for children and women. At the school
level for example, sanitary facilities are either closed or unused due to inadequate water
supply. Apart from exposing children to poor sanitary practices and therefore diseases,
studies have shown that poor sanitary facilities are a disincentive for school attendance,
especially for girls. In some cases children are late to school because they have to spend
long hours looking for water. Some urban areas do not have access to potable water,
while others have erratic supply. In other areas the water provided is salty and households
have to look for alternative means of getting potable drinking water. Women and children
are those most adversely affected in areas where the supply of water is inadequate. They
spend so much time looking for water making them have less time to do other important
activities. In the case of maternal health, the 2008 State of the World Children report
identifies lack of access to safe drinking water as one of the major causes of maternal
deaths.
As stated earlier the GPRS objective is to increase access to safe water and sanitation for
sustained poverty reduction. As such, the Community Water and Sanitation Agency
(CWSA) is mandated to provide several water-related facilities. A welcome policy in the
2009 budget in this regard is abolishing the 5% contribution to the cost of water projects
funded by donors and Government by District Assemblies and communities. Over the
years the contribution from communities has been a burden to a number of low income
communities preventing them from accessing safe drinking water.
4.3.4 Gaps and Opportunities in 2009 for Improving Water Delivery
The 2009 budget mentioned a number of targets for ensuring access to safe and potable
water for rural and urban areas. As mentioned earlier, provision of potable water in both
urban and rural areas has been handled by the water sub-sector under the Ministry of
Water Resources Works and Housing. It is difficult to assess budget performance in the
water sector alone since growth in the water sector is often linked with electricity and
gas.
17
(Gilbert Boyefio & Katie Drew, The Statesman newspaper, ―More Ghanaians to have easy access to
water‖, 7th
November 2007).
38
The other key area is for the water sector to have a multi sector collaboration to ensure
improved service delivery. The agriculture sector has a lot of programmes in the budget
to provide water and it is important that the water sector links up with the agriculture
sector so that the two complement each other. As mentioned earlier, the health sector
initiated this multi sector collaboration with other stakeholders and it is important that the
water sector takes a keen interest in this programme.
4.4 SOCIAL WELFARE AND MINISTRY FOR WOMEN AND
CHILDREN AFFAIRS
4.4.1 The Right to Protection from Exploitation and to Basic Welfare
Families in already unstable economic conditions are extremely vulnerable to the current
external shocks such as food price increases, climate change and natural disasters which
have negatively affected agriculture, economic growth, political instability, health
(HIV/AIDS) among others. Social welfare programs can play an important role in
ensuring adequate nutrition, utilisation of basic services (education, health, water and
sanitation) and access to social services by the poorest.
The UNCRC has provisions for child protection and welfare provisions, especially in
conditions where these are unavailable to the child. Ghana has developed a National
Social Protection Strategy from which the current LEAP programme was developed. In
addition, informal social protection in Ghana includes kin-based support systems,
remittances, trade associations, faith-based support networks, and credit societies. Other
formal social protection systems include the NHIS and government regulated social
security and national interest trust (SSNIT).
4.4.2 The 2009 Budget’s Response to Social Protection and Child Protection
A number of programmes relating to women and children were mentioned in the 2009
budget. These include sensitization of District Chief Executives, Queen-mothers and
Traditional Authorities on women and children‘s rights. Also, an information campaign
has been developed with the printing of about 1,000 copies of a directory on women
decision makers were distributed as well as the introduction of a web version of the
directory. Ministry of Women and Children Affairs (MOWAC) is also working in
collaboration with other stakeholders to provide training and financial assistance for
small business development, an intervention designed to improve mother and child
welfare beyond social welfare through direct cash grants.
National Social Protection Strategy and LEAP
39
The National Social Protection Strategy (NSPS) was completed and launched in 2008 as
a part of government‘s effort to address in a sustainable manner, the issues of risks and
vulnerability to extreme poverty. The NSPS targets the most vulnerable of society
including single mothers, minorities, orphans and vulnerable children (OVCs), the
disabled, aged, unemployed and low income earners. A key feature of the NSPS is the
LEAP, a 5-year pilot programme that aims at providing conditional18
cash transfers for
20% of the extreme poor and vulnerable. Beneficiaries are expected to receive a bi-
monthly cash transfer of between GH¢8.00 and GH¢15.00 to cover their basic needs such
as health and education.
The LEAP in 2009 targets at least 35,000 extremely poor households with social cash
transfers. Researchers have proposed that expanding LEAP to support a larger pool of
impoverished children will cost less than one per cent of GDP to sustain. The Ministry of
Employment and Social Welfare should therefore consider extending the LEAP to a
larger pool of impoverished and malnourished children to ensure their survival. The 2009
budget mentions that about 4 per cent of the total funding from the Multilateral Debt
Relief Initiative (MDRI) was also used to support the LEAP programme.
There is no specific budget item for the National Social Protection Strategy but the Youth
Employment and LEAP programmes that fall under this strategy will be supported with a
total of GH¢17.5 million. MESW has indicated that approximately GH¢ 7 million is
needed to pay for LEAP in 2009.
Programme for Child Labour in Cocoa
The programmes in the 2009 budget addressing child labour are mainly in the cocoa
sector. The 2009 budget proposes a Cocoa Scholarship Scheme which provides financial
aid to children and wards of cocoa farmers. Currently, 7,500 wards are a part of the
scheme at a cost of GH¢2,000,000 to run the programme, up from GH¢ 1,500,000 in
2008. This could indicate a greater need to provide scholarships for a great number of
students or an increase of educational cost. This increase in funding shows that the
National government sees the value and necessity for maintaining these scholarships over
the past five years.
The budget clearly states the intention of the government to ―…vigorously implement
policies and programmes that will protect children and give them equal opportunities to
develop their potentials to the maximum.‖ The strategy would require collaborating with
other stakeholders in order to eliminate the worst forms of child labour in all sectors
including cocoa and fishing. Government efforts should therefore not be concentrated in
18
Conditions include enrolling and retaining all children of school-going age in public basic schools, all
members of the household registering under the NHIS, all new born babies from 8 to 18 months being
registered with the Births and Deaths registry, among others.
40
the cocoa sector but be extended to other economic sectors to ensure that all child
labourers are provided with the opportunity of the highest standards of living.
Births and Deaths Registry Efforts to register all births and deaths within the country yielded increased registration
coverage of 62 percent of all infant births at the end of 2007 as against annual targets of
70 per cent for births. In 2009 the Registry will scale up the registration of births country
wide in a bid to move the registration coverage to 75 per cent for births, up from 70 per
cent in 2008. The Registry falls under the Ministry of Local Government and Rural
Development (MLGRD). The Ministry received an overall budgeted expenditure of
GH¢133,240,720 in 2008 and GH ¢179,102,552 in 2009.
Some of the Regional Offices will be automated to facilitate the capture and transfer of
information for the production of certificates with enhanced security features. In addition,
the registry will collaborate with the Ghana Health Service by participating in the annual
Child Health Promotion Week and Integrated Maternal and Child Health campaigns in
the bid to raise the coverage of infant birth registration and expand the Community
Population Register programme to 20 new communities in 2 additional Regions.
Trend In Allocations to MESW and MOWAC since 2007
Between 2007 and 2008, the amount budgeted for the Ministry of Employment and
Social Welfare fell marginally (close to 2%) however budgeted expenditure for the 2009
financial year saw about 54% increase over the 2008 figure. Budgeted expenditure for
the Ministry of Women and Children‘s Affairs has been rising consistently since 2007
however the increase from 2008 to 2009 of 92% is approximately twice the percentage
increase from 2007 to 2008. The scaling up of allocations to both ministries could
portend an increasing prioritization for social welfare spending.
Table 14: National Budgeted Expenditure for MESW and MOWAC (2007 - 2009)
Source: National Budgets 2007-2009
* Known as Manpower, Youth and Employment (MMYE) before 2008
The Department of Social Welfare within MESW is responsible for implementing many
of Ghana‘s social protection and child protection programmes, however their budgeted
expenditure and actual releases have dropped dramatically over the past three years (see
Agency 2007 (Amount
in GH¢)
2008 (Amount in
GH¢)
2009 (Amount in
GH¢)
Ministry of Employment
and Social Welfare*
21,677,100 GH¢21,310,291 GH¢32,896,982
Ministry of Women and
Children‘s Affairs
(MOWAC)
GH ¢3,406,400
GH¢4,981,677 GH¢9,570,786
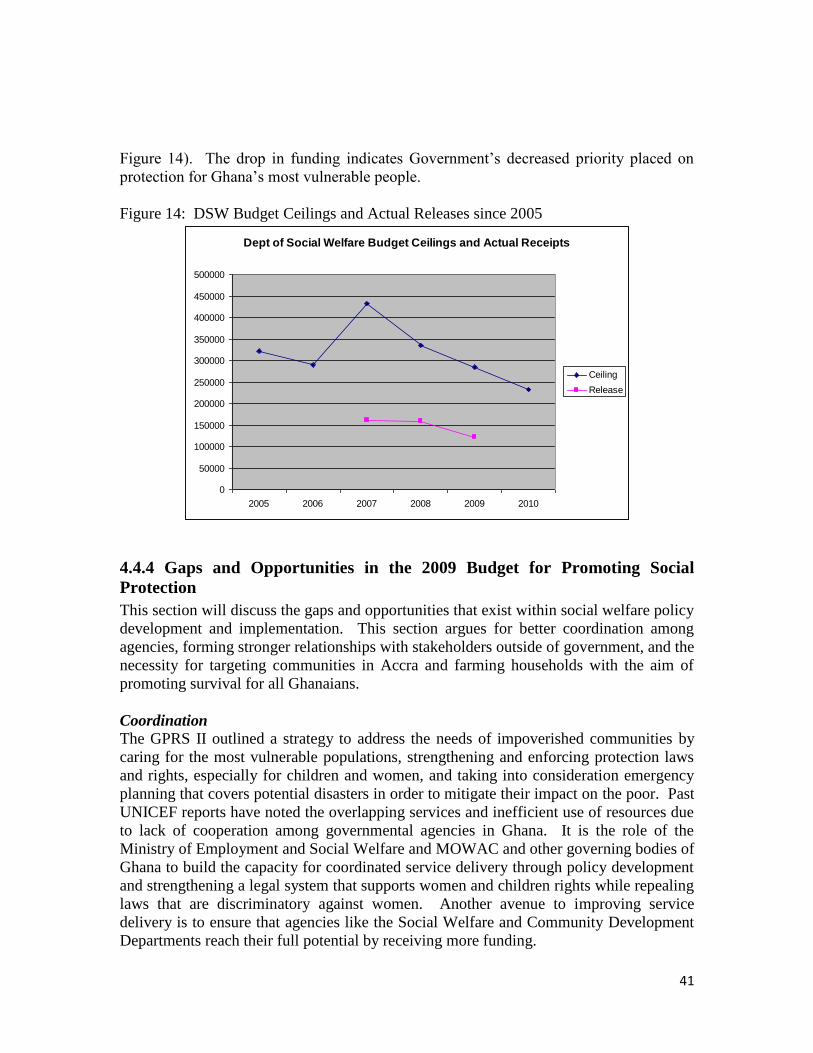
41
Figure 14). The drop in funding indicates Government‘s decreased priority placed on
protection for Ghana‘s most vulnerable people.
Figure 14: DSW Budget Ceilings and Actual Releases since 2005
Dept of Social Welfare Budget Ceilings and Actual Receipts
0
50000
100000
150000
200000
250000
300000
350000
400000
450000
500000
2005 2006 2007 2008 2009 2010
Ceiling
Release
4.4.4 Gaps and Opportunities in the 2009 Budget for Promoting Social
Protection
This section will discuss the gaps and opportunities that exist within social welfare policy
development and implementation. This section argues for better coordination among
agencies, forming stronger relationships with stakeholders outside of government, and the
necessity for targeting communities in Accra and farming households with the aim of
promoting survival for all Ghanaians.
Coordination
The GPRS II outlined a strategy to address the needs of impoverished communities by
caring for the most vulnerable populations, strengthening and enforcing protection laws
and rights, especially for children and women, and taking into consideration emergency
planning that covers potential disasters in order to mitigate their impact on the poor. Past
UNICEF reports have noted the overlapping services and inefficient use of resources due
to lack of cooperation among governmental agencies in Ghana. It is the role of the
Ministry of Employment and Social Welfare and MOWAC and other governing bodies of
Ghana to build the capacity for coordinated service delivery through policy development
and strengthening a legal system that supports women and children rights while repealing
laws that are discriminatory against women. Another avenue to improving service
delivery is to ensure that agencies like the Social Welfare and Community Development
Departments reach their full potential by receiving more funding.
42
Linkages
Political involvement must encompass relationships with civil society and Traditional
Authority. Mechanisms should be in place to work with the Traditional Authority to
facilitate a permanent and institutionalized dialogue between government and the
Chieftaincy. Another important partnership is with other NGOs like the ILO Global
Social Trust which is currently working on a project to eradicate the worst forms of child
labour through providing care to address the needs of not only the children, but also their
families, teachers and communities. Little discussion is currently taking place to develop
a comprehensive plan for relationship building with other stakeholders outside of the
government.
Targeting
Social protection programmes such as LEAP, school feeding, National Health Insurance,
etc. are most cost-effective when a large proportion of their benefits reach the poorest
people. At present, Ghana has different targeting mechanisms for each of these
programmes. Cost savings could be accrued if MDAs used a single method of
identifying the poorest people. This should take into account the increasing poverty in
Greater Accra due to urbanization, as well as the increasing disparities between the
northern and southern parts of the country, as seen in the GLSS 5 (2005/06).
43
CHAPTER FIVE:
CONCLUSION AND RECOMMENDATIONS
5.1 Conclusion
Generally programmes in the 2009 budget, with respect to sectors critical for
promoting women and children rights, fall in line with the policy framework of the
GPRS II, even though there is more focus on selected macroeconomic targets including
GDP growth, inflation rate, and gross international reserves. However, some indicators
with welfare implications on the economy, like employment, have been neglected. The
real GDP growth has been consistent and speculated to be affected by external shocks.
Inflation targets have also been missed over the years and budget deficits has been rising.
The 2009 budget outlines some measures for addressing the effects of the current global
crises but gains from the outlined measures are not likely to be immediate.
Regarding social sector budgets, there are some very positive priorities such as
maternal health care, free school uniforms, and LEAP. However, it is deeply
concerning that the actual releases for poverty reduction expenditure in the health,
education, and water sectors decreased in 2008. In particular, the repeated reductions
in both ceilings and actual releases to the Department of Social Welfare are troubling.
This means that the current budget deficits were effectively financed by cuts to
programmes for women and children, the most vulnerable members of society.
In addition, other important areas to the welfare of children have not been captured
in the budget. An example is protection for children with disability who are not provided
with adequate protection and welfare from the State. As these issues are not considered as
priority to government agencies responsible for women and children, budgetary
allocations to address them are non existent.
Most ministries, especially Education and Health, have extremely high Item 1
budgets for personnel emoluments. Civil servants certainly need a living wage, but the
price of these high wages is lack of money for service delivery. Nurses find themselves
in clinics with no equipment and social workers pay for transport to monitor programmes
out of their own pockets.
Little attention has been paid to the potential impact of the food, fuel, and financial
crises on households’ wellbeing, though macro-economic impacts have been
analyzed. It is possible that households will be unable to cope with reduced remittances
or reduced income from export industries, especially on top of already high food prices
since late 2007. Government should explain how its budget priorities reflect its plans to
assist households to withstand these shocks.
44
For the budget to be relevant to women and children, it is important that there is
coordination among the various government bodies. What is often lacking is
monitoring and evaluation of programmes and projects not only in the budgets but also in
national plans to assess progress in improving the welfare of women and children.
Though sectors like education and health produce reports that are relevant when it comes
to women and children, there is no comprehensive report (that is multi sector report) that
assesses the overall performance in securing the welfare and protection of women and
children.
Finally, MOFEP and other MDAs should make available to the public information
on the actual amounts released from MOFEP to each MDA. This is a basic piece of
information that the public has a right to know, and the authors were disappointed to find
that it was extraordinarily difficult to obtain this information. Our experience is also
reflected in Ghana‘s poor score on this aspect in the Open Budget Index.
5.2 Recommendations for Future Budgets
The section documents a number of recommendations based on findings from this study.
It also provides a number of inputs to be considered in formulating the 2010 budget.
Macroeconomic Framework
Attention should be directed to sectors that are envisaged to decline in growth to facilitate
their recovery during the current financial, food, and fuel crisis. Traditional measures
aimed at addressing inflation need a re-think, especially moving towards supply side
interventions. This includes improving the available infrastructure to increase growth in
the economy. With respect to expenditure increases, government should ensure
composition of expenditure reflects the development needs of Ghana and the usage of
expenditures monitored to ensure it promotes economic growth and social development.
The input into the 2010 budget with respect to the Macroeconomic framework is the
following:
Attempts at reducing inflation and budget deficits should not interfere with
government‘s efforts to provide basic services like education, health, and water.
Government expenditure should aim at stimulating local producers (especially in
areas that improve women livelihoods) in this period of economic crisis.
Though it is important to increase external reserves, this should not affect
investments in sectors that provide basic services like education, health and water.
The Ministry of Finance and Economic Planning and the Ministry of Employment
and Social Welfare should have an unemployment rate target for the year 2010.
The target should be disaggregated by male and female to help provide a human
face to our development progress.
Setting the 2010 macroeconomic framework should be linked with objectives such
as shared pro-poor growth and increased spending to the provision of essential
social services.
45
Increase attention and allocation to stabilization fund for fiscal flexibility during
economic downturns.
Social Protection
The current global economic crisis calls for increased allocation to social protection
programmes and essential services to cushion Ghanaians from adverse effects.
Considerations into the 2010 budget should include the following:
The Ministry of Employment and Social Welfare should reprioritize its expenditure
to ensure an increase in resources for its Social Protection agencies especially the
Department of Social Welfare
The Child Labor intervention in cocoa farms should be extended to all economic
sectors of the country.
Government should also ensure that adequate number of properly trained staff are
available to help scale-up or expand social protection programmes.
Government is also called upon to engage in data collection and analysis
(particularly related to poverty and vulnerability, and gender analysis) in order to
develop and carry out more rigorous monitoring and impact evaluations of
programme results on different target populations. There should also be an
improvement in the information and communications technology (ICT) to aid in
effective information management and linkages among programmes.
Government should improve targeting of social protection programme to reach the
very poor, i.e. food crop farmers and urban poor and consider addressing urban
poor as poverty increased in Accra.
Education
The input into the 2010 budget for the Education sector should include the following:
More investment must be channeled to capital expenditure, especially in deprived
districts.
Ensure the policy on 20% additional salary as incentives for teachers in deprived
areas is continued and institutionalized
The selection of schools for School Feeding should be assessed to ensure areas
most in need are captured.
Attention should be given to provision of special education facilities in Northern
parts of Ghana to benefit Children with disabilities in those areas. A study should
be commissioned to identify cause for limited attainment of higher education for
children with disabilities.
Prioritize the distribution of education and health resources to deprived regions and
districts. Special attention should be given to the three Northern regions in this
regard.
Increase the resources available to the Girl-Child unit to enable them to fully
embark on their mandate.
46
.
Increase proportion of education expenditure to Services and Investment.
Health
Following from the analysis the following inputs should be considered in the 2010
budget:
Ensure more efficiency in health service budget expenditure by increasing
allocation to actual programmes, including maternal and child health, and
reduction in percentage of operational cost to ensure improved health outcomes
Free maternal delivery initiative should target areas in Ghana with the worst
statistics towards ensuring that the required infrastructure and personnel are
available for successful implementation.
Funds should be allocated to continue free maternal health care and to de-link
children from their parents‘ NHIS registration. There should be mechanism for
monitoring progress toward the achievement of this policy.
Internally generated funds are playing a key role in the health sector and the central
government needs to monitor how well these resources are used at the facility
level
The Ministry of Health operational cost is very high and an assessment should be
made to streamline areas that may not be relevant
Administrative and service expenditures must not be cut unduly to cause
inefficiency in the health sector
Efforts should be made to prevent delays in re-imbursements by the NHIS to health
facilities
Health delivery should go hand in hand with improving nutrition, water and
sanitation services. Health should not be dealt with in isolation.
Ensure the policy on 20% additional salary as incentives for health personnel in
deprived areas is continued and institutionalized
In the area of expenditure reprioritization, the ministry must ensure actual
programmes allocations are prioritized rather than the operational cost of the
programmes. The government should look into the current structure of health
expenditure distribution to ensure spatial equity as the current structure favours
the less deprived areas and urban centers.
Water
The following consideration should be given in the 2010 budget with respect to the water
sector:
Increase resources for provision of infrastructure for urban and rural water supply
to ensure increased coverage. The future of Ghana‘s urban water should be
publicly debated and stated in 2010 budget and the investment in urban water
should reflect the increasing urbanization rate in the country.
47
.There should be increased inter-sectoral collaboration in ensuring the provision of
water for all.
Revenue Mobilization
The inputs into the 2010 budget for revenue mobilization with respect to this study are
the following:
Review tax incentives, especially for the location specific activities including
extractive industries and some free zone companies, to generate additional
revenues. Commitment to widen tax net should be clearly spelt out in the 2010
budget. This should include efforts to tap into the huge potential for property
rates. Steps towards reducing revenue leakages are also expected to be covered.
The Ministry of Finance and Economic Planning and the Value Added Tax service
should consider graduating the VAT rate based on the socio economic
characteristics of the country for a more progressive system.
Increase allocation to revenue bodies to increase monitoring. These include
undertaking audits of self employed business, identifying others out of the tax
brackets, increased monitoring of borders for import duties etc.
Proposal for the Computerization of tax system should be implemented. Increase
attention and allocation to stabilization fund for fiscal flexibility during economic
downturns.
48
Bibliography
1. Centre for Budget Advocacy/ISODEC (2007), Review of Trends in Public
Spending for Education and Health in Ghana (2002 – 2006) (draft), The
Brookings Institution Transparency and Accountability Project.
2. Colatei and Round (2000). ‗Poverty and Policy: Experiments with a SAM based
CGE Model for Ghana’ Paper presented at the XIII International Conference on
Input-Output Techniques, 21-25 August. Macerato, Italy
3. Fan S, Saurkar A and Shields G (2007) How to Mobilize Resources Support
Poverty Reduction
4. Gupta F and Tareq S (2008) Mobilizing Revenue. Financing and Development
Magazine, Vol 45, No 3
5. IMF (2009) Ghana: 2009 Article IV Consultation and Request for a Three-Year
Arrangement Under the Poverty Reduction and Growth Facility—Staff Report;
Staff Supplement; Staff Statement; Public Information Notice and Press Release
on the Executive Board Discussion; and Statement by the Executive Director for
Ghana
6. IMF (2009). The Implications of the Global Financial Crisis for Low-Income
Countries Washington, DC
7. M. Busse and H. Großmann (2004) ‗The Impact of ACP/EU Economic
Partnership Agreements on ECOWAS Countries: An Empirical Analysis of the
Trade and Budget Effects‘, Hamburg Institute of
8. Martens Jens (2006) Financing for Development. Global Policy Forum
9. Ministry of Health (2008), Independent Review, Health Sector Programme of
Work 2007(draft), Ministry of Health (Ghana)
10. National Development Planning Commission (2008), Implementation of the
Growth and Poverty Reduction Strategy 2006 – 2009, 2007 Annual Progress
Report, Republic of Ghana, Accra.
11. Osei R and Quartey P (2005) Tax Reforms in Ghana. UNU-WIDER research
paper No. 2005/66
49
12. Republic of Ghana (2004) The Budget Statement and Economic Policy of the
Government of Ghana for the 2004 Financial Year
13. Republic of Ghana (2005) The Budget Statement and Economic Policy of the
Government of Ghana for the 2005 Financial Year
14. Republic of Ghana. (2006) The Budget Statement and Economic Policy of the
Government of Ghana for the 2006 Financial Year
15. Republic of Ghana. (2006) The Budget Statement and Economic Policy of the
Government of Ghana for the 2007 Financial Year
16. Republic of Ghana (2007) The Budget Statement and Economic Policy of the
Government of Ghana for the 2008 Financial Year
17. Republic of Ghana (2009) The Budget Statement and Economic Policy of the
Government of Ghana for the 2009 Financial Year
18. United Nations (2002) Improving Financial Resource Mobilization in Developing
Countries and Economies in Transition
19. Vitus Azeem and Nicholas Adamtey (2006), Budget Ceilings and Health in
Ghana, Centre for Budget Advocacy of the Integrated Social Development Centre
(Ghana)
20. World Bank, (2008) Assessing the Potential Impact on Poverty of Rising Cereal
Proces: The Case of Ghana. WPS 4740
21. World Bank (2008) IDA Program Document for a Proposed Credit. No. 41842-
GH
22. World Food Programme (2009) Assessing the Impacts of the Global and
Financial Crisis on Vulnerable Households in Ghana
23. Younger (1993) Estimating Tax Incidence in Ghana: An Exercise Using
Household Data
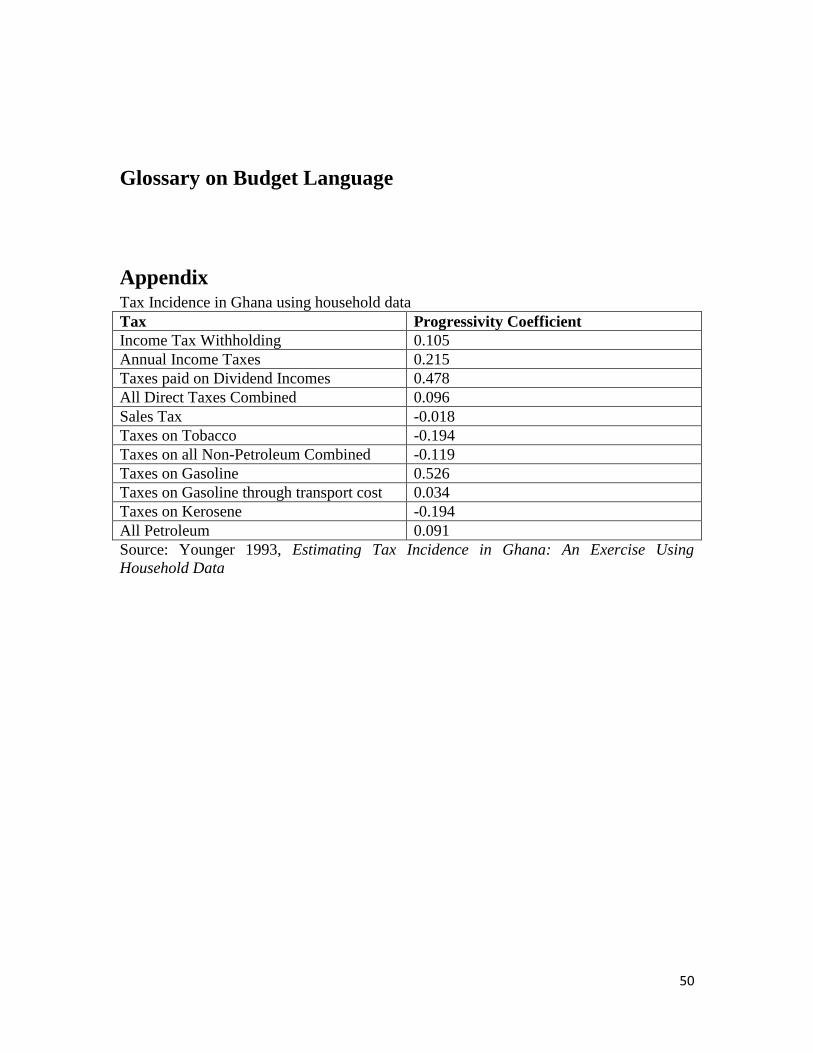
50
Glossary on Budget Language
Appendix Tax Incidence in Ghana using household data
Tax Progressivity Coefficient
Income Tax Withholding 0.105
Annual Income Taxes 0.215
Taxes paid on Dividend Incomes 0.478
All Direct Taxes Combined 0.096
Sales Tax -0.018
Taxes on Tobacco -0.194
Taxes on all Non-Petroleum Combined -0.119
Taxes on Gasoline 0.526
Taxes on Gasoline through transport cost 0.034
Taxes on Kerosene -0.194
All Petroleum 0.091
Source: Younger 1993, Estimating Tax Incidence in Ghana: An Exercise Using
Household Data