Embed Size (px)
Citation preview
111th Congress, 1st Session – – – – – – – – – – – – – – House Document 111-41
THE 2009 ANNUAL REPORT OF THE BOARD OF TRUSTEES OF THE FEDERAL OLD-AGE AND SURVIVORS
INSURANCE AND FEDERAL DISABILITY INSURANCE TRUST FUNDS
COMMUNICATION
FROM
THE BOARD OF TRUSTEES, FEDERAL OLD-AGE AND SURVIVORS INSURANCE AND FEDERAL DISABILITY
INSURANCE TRUST FUNDS
TRANSMITTING
THE 2009 ANNUAL REPORT OF THE BOARD OF TRUSTEES OF THEFEDERAL OLD-AGE AND SURVIVORS INSURANCE AND FEDERALDISABILITY INSURANCE TRUST FUNDS
May 12, 2009.—Referred to the Committee on Ways and Means and ordered to be printed
U.S. GOVERNMENT PRINTING OFFICE
49-654 WASHINGTON: 2009

.


.

CONTENTS
(V)
I. INTRODUCTION . . . . . . . . . . . . . . . . . . . . . . . . . . . . . . . . . . . 1
II. OVERVIEW . . . . . . . . . . . . . . . . . . . . . . . . . . . . . . . . . . . . . . . 2A. HIGHLIGHTS . . . . . . . . . . . . . . . . . . . . . . . . . . . . . . . . . . . . 2B. TRUST FUND FINANCIAL OPERATIONS IN 2008 . . . . . . . 5C. ASSUMPTIONS ABOUT THE FUTURE . . . . . . . . . . . . . . . . 7D. PROJECTIONS OF FUTURE FINANCIAL STATUS . . . . . . . 8E. CONCLUSION. . . . . . . . . . . . . . . . . . . . . . . . . . . . . . . . . . . . 19
III. FINANCIAL OPERATIONS OF THE TRUST FUNDS ANDLEGISLATIVE CHANGES IN THE LAST YEAR . . . . . . . . . . 21A. OPERATIONS OF THE OLD-AGE AND SURVIVORS
INSURANCE (OASI) AND DISABILITY INSURANCE (DI)TRUST FUNDS, IN CALENDAR YEAR 2008 . . . . . . . . . . . . 211. OASI Trust Fund . . . . . . . . . . . . . . . . . . . . . . . . . . . . . . . . . 212. DI Trust Fund . . . . . . . . . . . . . . . . . . . . . . . . . . . . . . . . . . . 253. OASI and DI Trust Funds, Combined . . . . . . . . . . . . . . . . . . 28
B. SOCIAL SECURITY AMENDMENTS SINCE THE2008 REPORT . . . . . . . . . . . . . . . . . . . . . . . . . . . . . . . . . . . . 32
IV. ACTUARIAL ESTIMATES. . . . . . . . . . . . . . . . . . . . . . . . . . . . 33A. SHORT-RANGE ESTIMATES . . . . . . . . . . . . . . . . . . . . . . . . 33
1. Operations of the OASI Trust Fund. . . . . . . . . . . . . . . . . . . . 342. Operations of the DI Trust Fund . . . . . . . . . . . . . . . . . . . . . . 373. Operations of the Combined OASI and DI Trust Funds . . . . . 404. Factors Underlying Changes in 10-Year Trust Fund Ratio
Estimates From the 2008 Report . . . . . . . . . . . . . . . . . . . . . . 42B. LONG-RANGE ESTIMATES . . . . . . . . . . . . . . . . . . . . . . . . . 44
1. Annual Income Rates, Cost Rates, and Balances . . . . . . . . . . 452. Comparison of Workers to Beneficiaries . . . . . . . . . . . . . . . . 503. Trust Fund Ratios . . . . . . . . . . . . . . . . . . . . . . . . . . . . . . . . 534. Summarized Income Rates, Cost Rates, and Balances . . . . . . 575. Additional Measures of OASDI Unfunded Obligations . . . . . 616. Test of Long-Range Close Actuarial Balance . . . . . . . . . . . . 647. Reasons for Change in Actuarial Balance From Last Report . . 68

(VI)
V. ASSUMPTIONS AND METHODS UNDERLYINGACTUARIAL ESTIMATES. . . . . . . . . . . . . . . . . . . . . . . . . . . . 74A. DEMOGRAPHIC ASSUMPTIONS AND METHODS . . . . . . . 75
1. Fertility Assumptions. . . . . . . . . . . . . . . . . . . . . . . . . . . . . . 762. Mortality Assumptions. . . . . . . . . . . . . . . . . . . . . . . . . . . . . 763. Immigration Assumptions . . . . . . . . . . . . . . . . . . . . . . . . . . 794. Total Population Estimates . . . . . . . . . . . . . . . . . . . . . . . . . . 845. Life Expectancy Estimates . . . . . . . . . . . . . . . . . . . . . . . . . . 86
B. ECONOMIC ASSUMPTIONS AND METHODS . . . . . . . . . . . 901. Productivity Assumptions . . . . . . . . . . . . . . . . . . . . . . . . . . 912. Price Inflation Assumptions . . . . . . . . . . . . . . . . . . . . . . . . . 923. Average Earnings Assumptions . . . . . . . . . . . . . . . . . . . . . . 944. Assumed Real-Wage Differentials . . . . . . . . . . . . . . . . . . . . 955. Labor Force and Unemployment Projections . . . . . . . . . . . . . 986. Gross Domestic Product Projections . . . . . . . . . . . . . . . . . . . 1007. Interest Rates . . . . . . . . . . . . . . . . . . . . . . . . . . . . . . . . . . . 101
C. PROGRAM-SPECIFIC ASSUMPTIONS AND METHODS . . . 1051. Automatically Adjusted Program Parameters. . . . . . . . . . . . . 1052. Covered Employment . . . . . . . . . . . . . . . . . . . . . . . . . . . . . 1123. Taxable Payroll and Payroll Tax Revenue . . . . . . . . . . . . . . . 1134. Insured Population. . . . . . . . . . . . . . . . . . . . . . . . . . . . . . . . 1145. Old-Age and Survivors Insurance Beneficiaries . . . . . . . . . . . 1166. Disability Insurance Beneficiaries. . . . . . . . . . . . . . . . . . . . . 1227. Average Benefits . . . . . . . . . . . . . . . . . . . . . . . . . . . . . . . . . 1338. Benefit Payments. . . . . . . . . . . . . . . . . . . . . . . . . . . . . . . . . 1339. Administrative Expenses . . . . . . . . . . . . . . . . . . . . . . . . . . . 133
10. Railroad Retirement Financial Interchange . . . . . . . . . . . . . . 13411. Military Service Transfers . . . . . . . . . . . . . . . . . . . . . . . . . . 13412. Income From Taxation of Benefits . . . . . . . . . . . . . . . . . . . . 134
(VII)
VI. APPENDICES . . . . . . . . . . . . . . . . . . . . . . . . . . . . . . . . . . . . . . 136A. HISTORY OF OASI AND DI TRUST FUND OPERATIONS. . 136B. HISTORY OF ACTUARIAL BALANCE ESTIMATES . . . . . . 149C. FISCAL YEAR HISTORICAL DATA AND
PROJECTIONS THROUGH 2018 . . . . . . . . . . . . . . . . . . . . . . 154D. LONG-RANGE SENSITIVITY ANALYSIS . . . . . . . . . . . . . . 160
1. Total Fertility Rate . . . . . . . . . . . . . . . . . . . . . . . . . . . . . . . 1602. Death Rates. . . . . . . . . . . . . . . . . . . . . . . . . . . . . . . . . . . . . 1623. Net Immigration . . . . . . . . . . . . . . . . . . . . . . . . . . . . . . . . . 1634. Real-Wage Differential . . . . . . . . . . . . . . . . . . . . . . . . . . . . 1645. Consumer Price Index . . . . . . . . . . . . . . . . . . . . . . . . . . . . . 1666. Real Interest Rate . . . . . . . . . . . . . . . . . . . . . . . . . . . . . . . . 1677. Disability Incidence Rates . . . . . . . . . . . . . . . . . . . . . . . . . . 1688. Disability Termination Rates . . . . . . . . . . . . . . . . . . . . . . . . 169
E. STOCHASTIC PROJECTIONS. . . . . . . . . . . . . . . . . . . . . . . . 1711. Background. . . . . . . . . . . . . . . . . . . . . . . . . . . . . . . . . . . . . 1712. Methodology. . . . . . . . . . . . . . . . . . . . . . . . . . . . . . . . . . . . 1713. Results . . . . . . . . . . . . . . . . . . . . . . . . . . . . . . . . . . . . . . . . 173
F. ESTIMATES FOR OASDI AND HI, SEPARATE AND COMBINED. . . . . . . . . . . . . . . . . . . . . . . . . . . . . . . . . . . . . . 1771. Estimates as a Percentage of Taxable Payroll. . . . . . . . . . . . . 1772. Estimates as a Percentage of Gross Domestic Product . . . . . . 1823. Estimates in Dollars . . . . . . . . . . . . . . . . . . . . . . . . . . . . . . . 187
G. ANALYSIS OF BENEFIT DISBURSEMENTS FROM THEOASI TRUST FUND WITH RESPECT TO DISABLED BENEFICIARIES . . . . . . . . . . . . . . . . . . . . . . . . . . . . . . . . . . 200
H. GLOSSARY . . . . . . . . . . . . . . . . . . . . . . . . . . . . . . . . . . . . . . 204
LIST OF TABLES . . . . . . . . . . . . . . . . . . . . . . . . . . . . . . . . . . . . 221
LIST OF FIGURES . . . . . . . . . . . . . . . . . . . . . . . . . . . . . . . . . . . 225
INDEX. . . . . . . . . . . . . . . . . . . . . . . . . . . . . . . . . . . . . . . . . . . . . . 227
STATEMENT OF ACTUARIAL OPINION. . . . . . . . . . . . . . . 232

.

THE 2009 ANNUAL REPORT OF THE BOARD OFTRUSTEES OF THE FEDERAL OLD-AGE AND
SURVIVORS INSURANCE AND FEDERAL DISABILITYINSURANCE TRUST FUNDS
I. INTRODUCTION
The Old-Age, Survivors, and Disability Insurance (OASDI) program in theUnited States makes available a basic level of monthly income upon theattainment of retirement eligibility age, death, or disability by insured work-ers. The OASDI program consists of two separate parts that pay benefits toworkers and their families—Old-Age and Survivors Insurance (OASI) andDisability Insurance (DI). Under OASI, monthly benefits are paid to retiredworkers and their families and to survivors of deceased workers. Under DI,monthly benefits are paid to disabled workers and their families.
The Board of Trustees was established under the Social Security Act to over-see the financial operations of the OASI and DI Trust Funds. The Board iscomposed of six members. Four members serve by virtue of their positionsin the Federal Government: the Secretary of the Treasury, who is the Manag-ing Trustee; the Secretary of Labor; the Secretary of Health and Human Ser-vices; and the Commissioner of Social Security. The other two positions,which are currently vacant, are for members of the public, to be appointed bythe President, subject to confirmation by the Senate. The Deputy Commis-sioner of the Social Security Administration (SSA) is designated as Secretaryof the Board.
The Social Security Act requires that the Board, among other duties, reportannually to the Congress on the actuarial (financial) status of the OASI andDI Trust Funds. This annual report, for 2009, is the 69th such report.

Overview
2
II. OVERVIEW
A. HIGHLIGHTS
The report’s major findings are summarized below.
In 2008
At the end of 2008, almost 51 million people were receiving benefits:35 million retired workers and dependents of retired workers, 6 million sur-vivors of deceased workers, and 9 million disabled workers and dependentsof disabled workers. During the year, an estimated 162 million people hadearnings covered by Social Security and paid payroll taxes. Total benefitspaid in 2008 were $615 billion. Total income was $805 billion, and assetsheld in special issue U.S. Treasury securities grew to $2.4 trillion.
Short-Range Results
The OASI Trust Fund and the combined OASI and DI Trust Funds are ade-quately financed over the next 10 years under the intermediate assumptions.The DI Trust Fund is expected to remain solvent over the next 10 years, butdoes not satisfy the short-range test of financial adequacy because assets areestimated to fall below 100 percent of annual expenditures by the beginningof 2014. The combined assets of the OASI and DI Trust Funds are projectedto increase from $2,419 billion at the beginning of 2009, or 354 percent ofannual expenditures, to $3,874 billion at the beginning of 2018, or 338 per-cent of annual expenditures in that year. Combined assets were projected forlast year’s report to rise to 369 percent of annual expenditures at the begin-ning of 2009, and 378 percent at the beginning of 2018.
Long-Range Results
Under the intermediate assumptions, OASDI cost will increase more rapidlythan tax income between about 2012 and 2030 because the retirement of thebaby-boom generation will cause the number of beneficiaries to rise muchfaster than the labor force. After 2030, increases in life expectancy and thecontinued relatively low fertility rates experienced since the baby boom willgenerally cause Social Security system costs to increase relative to taxincome, but more slowly. Annual cost will exceed tax income starting in2016, at which time the annual gap will be covered with cash from redemp-tions of special obligations of the Treasury that make up the trust fund assetsuntil these assets are exhausted in 2037. Individually, the DI fund is pro-jected to be exhausted in 2020 and the OASI fund in 2039. For the 75-yearprojection period, the actuarial deficit is 2.00 percent of taxable payroll, 0.30percentage point larger than in last year’s report. The open group unfunded

3
Highlights
obligation for OASDI over the 75-year period is $5.3 trillion in presentvalue, and is $0.9 trillion more than the measured level of a year ago. In theabsence of any changes in assumptions, methods, and starting values, theunfunded obligation would have risen to about $4.6 trillion due to the changein the valuation date.
The OASDI annual cost rate is projected to increase from 12.35 percent oftaxable payroll in 2009, to 16.76 percent in 2030, and to 17.68 percent in2083, a level that is 4.34 percent of taxable payroll more than the projectedincome rate for 2083. For last year’s report, the OASDI cost for 2083 wasestimated at 17.54 percent, or 4.25 percent of payroll more than the annualincome rate for that year. Expressed in relation to the projected gross domes-tic product (GDP), OASDI cost is estimated to rise from the current level of4.8 percent of GDP to 6.1 percent in 2030, and then to peak at almost6.2 percent in 2034. Thereafter, OASDI cost as a percent of GDP is projectedto decline, reaching a level around 5.8 percent for the period 2050 through2083.
The worsening of the long-range actuarial status of the OASDI program indi-cated in this report is principally the result of projected lower levels of eco-nomic activity that reflect the recent economic downturn and updated data,and faster reductions in mortality assumed in the longer term. Changes in theeconomic assumptions and the mortality assumptions contribute to about thesame degree to the reduction in the program’s actuarial balance.
Conclusion
Under the long-range intermediate assumptions, annual cost will begin toexceed tax income in 2016 for the combined OASDI Trust Funds. The com-bined funds are then projected to become exhausted and thus unable to payscheduled benefits in full on a timely basis in 2037. The separate DI TrustFund, however, is projected to become exhausted in 2020.
For the combined OASDI Trust Funds to remain solvent throughout the 75-year projection period, the combined payroll tax rate could be increased dur-ing the period in a manner equivalent to an immediate and permanentincrease of 2.01 percentage points, benefits could be reduced during theperiod in a manner equivalent to an immediate and permanent reduction of13.3 percent, general revenue transfers equivalent to $5.3 trillion in presentvalue could be made during the period, or some combination of approachescould be adopted. Significantly larger changes would be required to maintainsolvency beyond 75 years.

Overview
4
For this year’s intermediate projections, real GDP starts at a lower level thanwas assumed last year for 2008, declines through the second quarter of 2009,levels off in the third quarter, and then begins to grow, reaching the projectedstable, sustainable path by the end of 2015. These revised economic assump-tions account for about half of the estimated reduction in the program’s actu-arial balance relative to last year’s report. The effect of the recession on theactuarial balance would be smaller than projected in this report if the recov-ery were such that economic output substantially overshoots the projectedsustainable path, a phenomenon observed in some past business cycles.
The projected trust fund deficits should be addressed in a timely way so thatnecessary changes can be phased in gradually and workers can be given timeto plan for them. Implementing changes sooner will allow their effects to bespread over more generations. Social Security plays a critical role in the livesof 52 million beneficiaries and 160 million covered workers and their fami-lies in 2009. With informed discussion, creative thinking, and timely legisla-tive action, present and future Congresses and Presidents can ensure thatSocial Security continues to protect future generations.

5
Calendar Year 2008 Operations
B. TRUST FUND FINANCIAL OPERATIONS IN 2008
The table below shows the income, expenditures, and assets for the OASI,the DI and the combined OASDI Trust Funds in calendar year 2008.
Note: Totals do not necessarily equal the sums of rounded components.
In 2008, net contributions accounted for 83 percent of total trust fundincome. Net contributions consist of taxes paid by employees, employers andthe self-employed on earnings covered by Social Security. These taxes werepaid on covered earnings up to a specified maximum annual amount, whichwas $102,000 in 2008 and is increased each year automatically (to $106,800in 2009) as the average wage increases. The tax rates scheduled under cur-rent law for 2008 and later are shown in table II.B2.
Two percent of OASDI Trust Fund income came from subjecting up to50 percent of Social Security benefits above specified levels to Federal per-sonal income taxation, and 14 percent of OASDI income came from interestearned on investment of OASDI Trust Fund reserves. Social Security’s assetsare invested in interest-bearing securities of the U.S. Government. In 2008,the combined trust fund assets earned interest at an effective annual rate of5.1 percent. More than 98 percent of expenditures from the combined
Table II.B1.—Summary of 2008 Trust Fund Financial Operations(In billions)
OASI DI OASDI
Assets at the end of 2007 . . . . . . . . . . . . . . . . . . . . . . $2,023.6 $214.9 $2,238.5
Total income in 2008 . . . . . . . . . . . . . . . . . . . . . . . . . 695.5 109.8 805.3Net contributions . . . . . . . . . . . . . . . . . . . . . . . . . . 574.6 97.6 672.1Taxation of benefits . . . . . . . . . . . . . . . . . . . . . . . . 15.6 1.3 16.9Interest . . . . . . . . . . . . . . . . . . . . . . . . . . . . . . . . . . 105.3 11.0 116.3
Total expenditures in 2008. . . . . . . . . . . . . . . . . . . . . 516.2 109.0 625.1
Benefit payments . . . . . . . . . . . . . . . . . . . . . . . . . . 509.3 106.0 615.3Railroad Retirement financial interchange . . . . . . 3.6 .4 4.0Administrative expenses . . . . . . . . . . . . . . . . . . . . 3.2 2.5 5.7
Net increase in assets in 2008 . . . . . . . . . . . . . . . . . . 179.3 .9 180.2
Assets at the end of 2008 . . . . . . . . . . . . . . . . . . . . . . 2,202.9 215.8 2,418.7
Table II.B2.—Tax Rates for 2008 and LaterOASI DI OASDI
Tax rate for employees and employers, each (in percent) . . . . . . . 5.30 0.90 6.20
Tax rate for self-employed persons (in percent) . . . . . . . . . . . . . . 10.60 1.80 12.40

Overview
6
OASDI Trust Funds in 2008 went to pay retirement, survivor, and disabilitybenefits totaling $615.3 billion. The financial interchange with the RailroadRetirement program resulted in a payment of $4.0 billion from the combinedOASDI Trust Funds, or about 0.6 percent of total expenditures. The adminis-trative expenses of the Social Security program were $5.7 billion, or about0.9 percent of total expenditures.
Assets of the trust funds provide a reserve to pay benefits whenever total pro-gram cost exceeds income. Trust fund assets increased by $180.2 billion in2008 because income to each fund exceeded expenditures. At the end of2008, the combined assets of the OASI and the DI Trust Funds were354 percent of estimated expenditures for 2009, down from an actual level of358 percent at the end of 2007.
7
Future Assumptions
C. ASSUMPTIONS ABOUT THE FUTURE
Future income and expenditures of the OASI and DI Trust Funds will dependon many factors, including the size and characteristics of the populationreceiving benefits, the level of monthly benefit amounts, the size of theworkforce, and the level of workers’ earnings. These factors will depend inturn on future birth rates, death rates, immigration, marriage and divorcerates, retirement-age patterns, disability incidence and termination rates,employment rates, productivity gains, wage increases, inflation, and manyother demographic, economic, and program-specific factors.
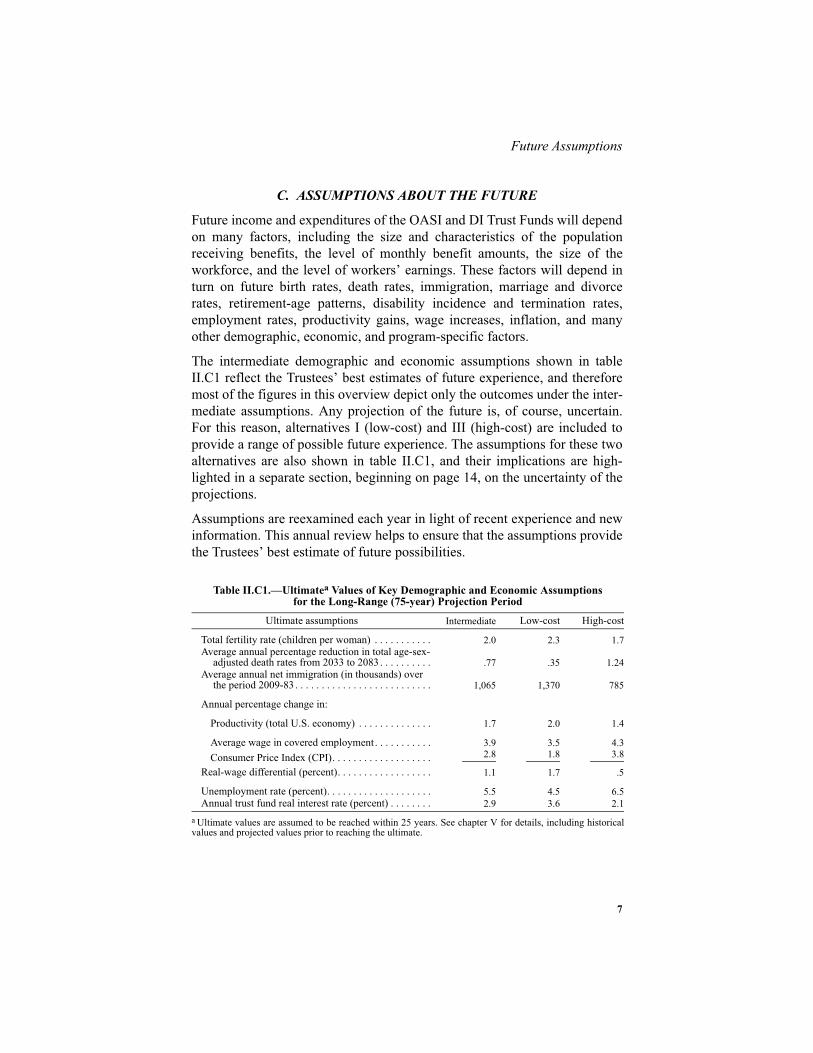
The intermediate demographic and economic assumptions shown in tableII.C1 reflect the Trustees’ best estimates of future experience, and thereforemost of the figures in this overview depict only the outcomes under the inter-mediate assumptions. Any projection of the future is, of course, uncertain.For this reason, alternatives I (low-cost) and III (high-cost) are included toprovide a range of possible future experience. The assumptions for these twoalternatives are also shown in table II.C1, and their implications are high-lighted in a separate section, beginning on page 14, on the uncertainty of theprojections.
Assumptions are reexamined each year in light of recent experience and newinformation. This annual review helps to ensure that the assumptions providethe Trustees’ best estimate of future possibilities.
Table II.C1.—Ultimatea Values of Key Demographic and Economic Assumptionsfor the Long-Range (75-year) Projection Period
a Ultimate values are assumed to be reached within 25 years. See chapter V for details, including historicalvalues and projected values prior to reaching the ultimate.
Ultimate assumptions Intermediate Low-cost High-cost
Total fertility rate (children per woman) . . . . . . . . . . . 2.0 2.3 1.7Average annual percentage reduction in total age-sex-
adjusted death rates from 2033 to 2083 . . . . . . . . . . .77 .35 1.24Average annual net immigration (in thousands) over
the period 2009-83 . . . . . . . . . . . . . . . . . . . . . . . . . . 1,065 1,370 785
Annual percentage change in:
Productivity (total U.S. economy) . . . . . . . . . . . . . . 1.7 2.0 1.4
Average wage in covered employment . . . . . . . . . . . 3.9 3.5 4.3Consumer Price Index (CPI). . . . . . . . . . . . . . . . . . . 2.8 1.8 3.8
Real-wage differential (percent). . . . . . . . . . . . . . . . . . 1.1 1.7 .5
Unemployment rate (percent). . . . . . . . . . . . . . . . . . . . 5.5 4.5 6.5Annual trust fund real interest rate (percent) . . . . . . . . 2.9 3.6 2.1

Overview
8
D. PROJECTIONS OF FUTURE FINANCIAL STATUS
Short-Range Actuarial Estimates
For the short range (2009-2018), the Trustees measure financial adequacy bycomparing projected assets at the beginning of each year to projected pro-gram cost for that year under the intermediate set of assumptions. Having atrust fund ratio of 100 percent or more—that is, assets at the beginning ofeach year at least equal to projected cost for the year—is considered a goodindication of a trust fund’s ability to cover most short-term contingencies.The projected trust fund ratios for OASI alone, and for OASI and DI com-bined, under the intermediate assumptions exceed 100 percent throughoutthe short-range period and therefore OASI and OASDI satisfy the Trustees’short-term test of financial adequacy. Considering the DI program alone,however, its trust fund ratio is projected to fall below the 100 percent levelby the beginning of 2014. Thus, DI fails to satisfy the Trustees’ short-termtest of financial adequacy. Figure II.D1 below shows that the trust fund ratiosfor the combined OASI and DI Trust Funds reach a peak level in 2012 andbegin declining thereafter.
Figure II.D1.—Short-Range OASDI Trust Fund Ratios[Assets as a percentage of annual expenditures]
0%
50%
100%
150%
200%
250%
300%
350%
400%
450%
500%
1998 2000 2002 2004 2006 2008 2010 2012 2014 2016 2018Calendar year
Historical Estimated
"Minimum" level for short-term financial adequacy

9
Future Financial Status
Long-Range Actuarial Estimates
The actuarial status of the program over the next 75 years is measured interms of annual cost and income as a percentage of taxable payroll, trust fundratios, the actuarial balance (also as a percentage of taxable payroll), and theopen group unfunded obligation (expressed in present-value dollars and aspercentages of taxable payroll and gross domestic product (GDP)). Consider-ing Social Security’s annual cost and income as a percentage of the total U.S.economic output or GDP provides an additional important perspective.
The year-by-year relationship between income and cost rates shown in figureII.D2 illustrates the expected pattern of cash flows for the OASDI programover the full 75-year period. Under the intermediate assumptions, the OASDIcost rate is projected to increase rapidly and first exceed the income rate in2016, producing cash-flow deficits thereafter. Redemption of trust fundassets will allow continuation of full benefit payments on a timely basis until2037, when the trust funds are projected to become exhausted. This redemp-tion process will require a flow of cash from the General Fund of the Trea-sury. Pressures on the Federal Budget will thus emerge well before 2037.Even if a trust fund’s assets are exhausted, however, tax income will continueto flow into the fund. Present tax rates are projected to be sufficient to pay76 percent of scheduled benefits after trust fund exhaustion in 2037 and74 percent of scheduled benefits in 2083.
Figure II.D2.—OASDI Income and Cost Rates Under Intermediate Assumptions[As a percentage of taxable payroll]
0%
5%
10%
15%
20%
25%
2005 2015 2025 2035 2045 2055 2065 2075 2085
Calendar year
Cost: Scheduled and payable benefits
Income
Payable benefits as percentof scheduled benefits:2009-36: 100%2037: 76%2083: 74%
Cost: Scheduled but not fully payable benefits
Expenditures: Income = payable benefits starting in the year the trust funds are exhausted (2037)

Overview
10
Social Security’s cost rate is projected to rise rapidly from about 2012through 2030 because the retirement of the baby-boom generation will causethe number of beneficiaries to rise much faster than the labor force. Thereaf-ter, the cost rate is estimated to rise at a slower rate for about 5 years andthen to remain fairly stable for the next 25 years. Continued reductions indeath rates and maintaining birth rates at levels well below those from thebaby-boom era and before will cause a continued increase in the average ageof the population and will raise the cost rate from 16.7 percent of taxablepayroll in 2060 to 17.7 percent by 2083 under the intermediate assumptions.After 2083, the increase in the average age of the population is likely to con-tinue and to increase the gap between OASDI cost and income rates.
The estimated number of workers per beneficiary is shown in figure II.D3.There were about 3.2 workers for every OASDI beneficiary in 2008. Thisratio has been extremely stable, remaining between 3.2 and 3.4 since 1974.However, the baby-boom generation will have largely retired by 2030, andthe ratio of workers to beneficiaries is projected to be only 2.2 at that time.Thereafter, the number of workers per beneficiary will slowly decline, andthe OASDI cost rate will continue to increase, largely due to projected reduc-tions in mortality.
Figure II.D3.—Number of Covered Workers Per OASDI Beneficiary
0
1
2
3
4
1980 1990 2000 2010 2020 2030 2040 2050 2060 2070 2080Calendar year
EstimatedHistorical

11
Future Financial Status
The maximum projected trust fund ratios for the OASI, DI, and combinedfunds appear in table II.D1. The year in which the maximum projected trustfund ratio is attained and the year in which the assets are projected to beexhausted are shown as well.
The actuarial balance is a measure of the program’s financial status for the75-year valuation period as a whole. It is essentially the difference betweenincome and cost of the program expressed as a percentage of taxable payrollover the valuation period. This single number summarizes the adequacy ofprogram financing for the period. When the actuarial balance is negative, theactuarial deficit can be interpreted as the percentage that could be added tothe current-law income rate for each of the next 75 years, or subtracted fromthe cost rate for each year, to bring the funds into actuarial balance. Becausethe effects of future changes are unlikely to follow this pattern, this measureshould be viewed only as providing a rough indication of the amount ofchange that is needed over the 75-year period as a whole. In this report, theactuarial balance under the intermediate assumptions is a deficit of2.00 percent of taxable payroll for the combined OASI and DI Trust Funds.The actuarial deficit was 1.70 percent in the 2008 report and has been in therange of 1.70 percent to 2.07 percent for the last 10 reports. The actuarialdeficit increases relative to the level estimated in last year’s report primarilybecause of revised economic data through 2008, the significant near-termeffects of the current economic recession, and the longer-term effects oflower ultimate mortality rates.
Another way to illustrate the financial shortfall of the OASDI system is toexamine the cumulative value of income less cost, in present value. FigureII.D4 shows the present value of cumulative OASDI income less costthrough the next 75 years. The balance of the combined trust funds peaks at$2.6 trillion in 2016 (in present value) and then turns downward. This cumu-lative amount continues to be positive, indicating trust fund assets, orreserves, through 2036. However, after 2036 this cumulative amountbecomes negative, indicating a net unfunded obligation. Through the end of2083, the combined funds have a present-value unfunded obligation of$5.3 trillion. This unfunded obligation represents 1.9 percent of future tax-able payroll and 0.7 percent of future GDP through the end of the 75-year
Table II.D1.—Projected Maximum Trust Fund Ratios Attained andTrust Fund Exhaustion Dates Under the Intermediate Assumptions
OASI DI OASDI
Maximum trust fund ratio (percent). . . . . . . . . . . . . . 422 179 369Year attained. . . . . . . . . . . . . . . . . . . . . . . . . . . . . . 2012 2009 2012
Year of trust fund exhaustion . . . . . . . . . . . . . . . . . . . 2039 2020 2037

Overview
12
projection period. The 0.1 percentage point difference between the unfundedobligation as a share of taxable payroll (1.9 percent) and the actuarial bal-ance (2.0 percent) reflects the additional requirement of an ending trust fundbalance equal to 1 year’s cost for the actuarial balance calculation.
Still another important way to look at Social Security’s future is to view itsannual cost and tax income as a share of U.S. economic output. Figure II.D5shows that Social Security’s cost as a percentage of GDP is projected to growfrom 4.8 percent in 2009 to 6.1 percent in 2030, and then to peak at almost6.2 percent in 2034. Thereafter, OASDI cost as a percent of GDP is projectedto decline reaching a level around 5.8 percent for the period 2050 through2083. However, Social Security’s scheduled tax revenue is projected todecline from its current level of about 5.0 percent of GDP, reaching about4.4 percent by 2083. Income from payroll taxes declines generally in relationto GDP in the future because an increasing share of employee compensationis assumed to be provided in fringe benefits, making wages a shrinking shareof GDP.
Figure II.D4.—Cumulative OASDI Income Less Cost, Based on Present Law Tax Rates and Scheduled Benefits
[Present value as of January 1, 2009, in trillions]
-$6
-$5
-$4
-$3
-$2
-$1
$0
$1
$2
$3
2008 2023 2038 2053 2068 2083
Ending year of valuation period
Unfunded obligation(negative)
Trust fund assets(positive)
2037

13
Future Financial Status
Figures II.D2, II.D4, and II.D5 show that the program’s financial condition isworsening at the end of the period. Overemphasis on summary measures fora 75-year period can lead to incorrect perceptions and to policy prescriptionsthat do not achieve sustainable solvency. Thus, careful consideration of thetrends in annual deficits and unfunded obligations toward the end of the 75-year period is important. In addition, summary measures for a time periodthat extends to the infinite horizon are included in this report. These mea-sures provide an additional indication of Social Security’s very long-runfinancial condition, but are subject to much greater uncertainty. These calcu-lations show that extending the horizon beyond 75 years increases theunfunded obligation. Over the infinite horizon, the shortfall (unfunded obli-gation) is $15.1 trillion in present value, or 3.4 percent of future taxable pay-roll and 1.2 percent of future GDP. These calculations of the shortfallindicate that much larger changes may be required to achieve solvencybeyond the 75-year period as compared to changes needed to balance 75-year period summary measures. The measured unfunded obligation over theinfinite horizon is increased from $13.6 trillion in last year’s report. In theabsence of any changes in assumptions, methods, and starting values, theunfunded obligation over the infinite horizon would have risen to$14.3 trillion due to the change in the valuation date. The additional increasein the unfunded obligation over the infinite horizon is largely the result of thechanges in near-term economic and ultimate mortality assumptions.
Figure II.D5.—OASDI Cost and Scheduled Tax Revenue as a Percentage of GDP
0%
2%
4%
6%
8%
10%
1990 2000 2010 2020 2030 2040 2050 2060 2070 2080Calendar year
Historical Estimated
Cost
Scheduled Tax Revenue

Overview
14
Expressed as percentages of taxable payroll and of GDP, the measuredunfunded obligation over the infinite horizon increased from 3.2 percent and1.1 percent, respectively, in last year’s report.
Uncertainty of the Projections
Significant uncertainty surrounds the intermediate assumptions. The Trusteesutilize several methods to help illustrate that uncertainty. One approach is theuse of low-cost (alternative I) and high-cost (alternative III) assumptions.Figure II.D6 shows the projected trust fund ratios for the combined OASIand DI Trust Funds under the intermediate, low-cost, and high-cost assump-tions. The low-cost alternative reflects a set of assumptions that improves theprojected financial status of the trust funds relative to the financial statusunder the intermediate set of assumptions. The low-cost alternative includesa higher ultimate total fertility rate, slower improvement in mortality, ahigher real-wage differential, and lower unemployment. The high-cost alter-native, in contrast, includes a lower ultimate total fertility rate, more rapidimprovement in mortality, a lower real-wage differential, and higher unem-ployment. These alternatives are not intended to suggest that all parameterswould be likely to differ from the intermediate values in the same direction,but are intended to illustrate the effect of scenarios that are, on balance, veryfavorable or unfavorable for the program’s financial status. The actual out-come for future costs is unlikely to be as extreme as either of the outcomesportrayed by the low- and high-cost projections. The method for constructingthese low- and high-cost projections does not provide an estimate of theprobability that actual experience will lie within or outside the range theydefine.

15
Future Financial Status
This report also provides long-range sensitivity analysis for the OASDI pro-gram, varying one parameter at a time, in Appendix D. These estimates pro-vide further illustrations of the uncertainty surrounding projections into thefuture, but do not provide any measure of the probability that future out-comes will fall within or outside the ranges shown.
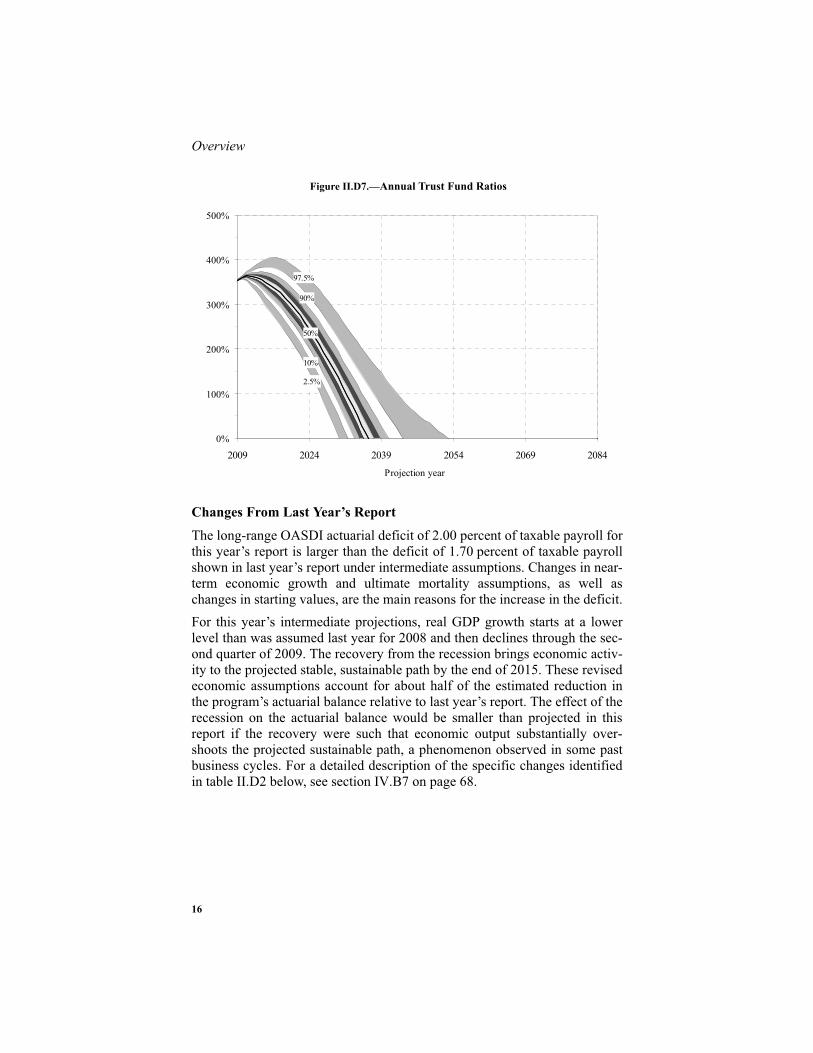
A third approach that measures uncertainty uses stochastic simulations todevelop a range of projections and does provide estimates of the probabilitythat future outcomes will fall within or outside a given range. The results ofthe stochastic simulations, discussed in more detail in Appendix E, suggestthat trust fund exhaustion is highly probable sometime during the 75-yearperiod (see figure II.D7). Further, the stochastic results suggest that out-comes as good as the low-cost alternative or as bad as the high-cost alterna-tive are unlikely. However, the relationship between the stochastic resultsand the low- and high-cost alternatives may change as the methodology forthe stochastic simulations is further developed. As noted in Appendix E,future improvements and refinements are expected to be more likely toexpand rather than reduce the indicated range of uncertainty.
Figure II.D6.—Long-Range OASDI Trust Fund Ratios Under Alternative Assumptions[Assets as a percentage of annual cost]
0%
100%
200%
300%
400%
500%
600%
1990 2000 2010 2020 2030 2040 2050 2060 2070 2080Calendar year
Historical Estimated
III
II
I
Overview
16
Changes From Last Year’s Report
The long-range OASDI actuarial deficit of 2.00 percent of taxable payroll forthis year’s report is larger than the deficit of 1.70 percent of taxable payrollshown in last year’s report under intermediate assumptions. Changes in near-term economic growth and ultimate mortality assumptions, as well aschanges in starting values, are the main reasons for the increase in the deficit.For this year’s intermediate projections, real GDP growth starts at a lowerlevel than was assumed last year for 2008 and then declines through the sec-ond quarter of 2009. The recovery from the recession brings economic activ-ity to the projected stable, sustainable path by the end of 2015. These revisedeconomic assumptions account for about half of the estimated reduction inthe program’s actuarial balance relative to last year’s report. The effect of therecession on the actuarial balance would be smaller than projected in thisreport if the recovery were such that economic output substantially over-shoots the projected sustainable path, a phenomenon observed in some pastbusiness cycles. For a detailed description of the specific changes identifiedin table II.D2 below, see section IV.B7 on page 68.
Figure II.D7.—Annual Trust Fund Ratios
0%
100%
200%
300%
400%
500%
2009 2024 2039 2054 2069 2084
Projection year
50%
97.5%
2.5%
90%
10%

17
Future Financial Status
Note: Totals do not necessarily equal the sums of rounded components.
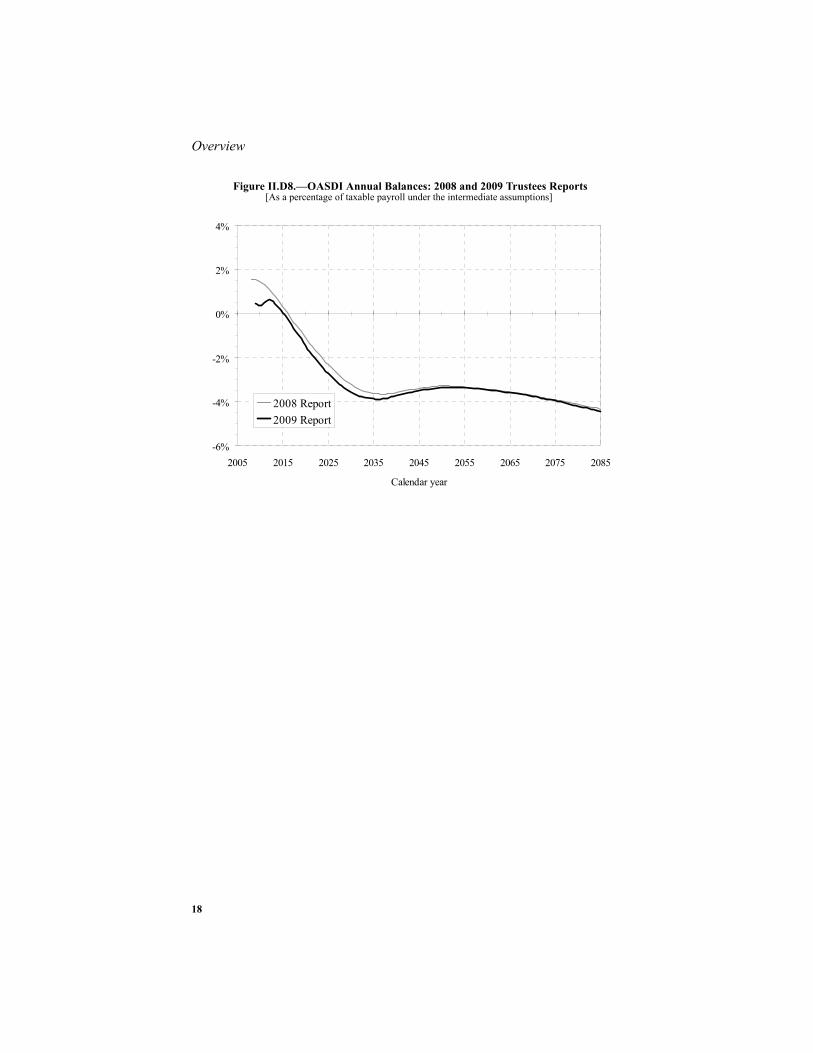
The open group unfunded obligation over the 75-year projection period hasincreased from $4.3 trillion (present discounted value as of January 1, 2008)to $5.3 trillion (present discounted value as of January 1, 2009). The mea-sured unfunded obligation would be expected to increase by about$0.3 trillion due to advancing the valuation date by 1 year and including theadditional year 2083. Changes in methods, revisions in assumptions, andupdated data further increased the measured unfunded obligation by about$0.7 trillion.Figure II.D8 shows that this year’s projections of annual balances (noninter-est income minus cost) are lower than those in last year’s report throughoutthe 75-year projection period.
Table II.D2.—Reasons for Change in the 75-Year Actuarial BalanceUnder Intermediate Assumptions
[As a percentage of taxable payroll]
Item OASI DI OASDI
Shown in last year's report:Income rate. . . . . . . . . . . . . . . . . . . . . . . . . . . . . . . . . . . 12.01 1.93 13.94Cost rate . . . . . . . . . . . . . . . . . . . . . . . . . . . . . . . . . . . . . 13.46 2.17 15.63Actuarial balance . . . . . . . . . . . . . . . . . . . . . . . . . . . . . . -1.46 -.24 -1.70
Changes in actuarial balance due to changes in:Legislation / Regulation . . . . . . . . . . . . . . . . . . . . . . . .00 .00 .00Valuation perioda . . . . . . . . . . . . . . . . . . . . . . . . . . . .
a In changing from the valuation period of last year’s report, which was 2008-82, to the valuation period ofthis report, 2009-83, the relatively large negative annual balance for 2083 is included. This change in thevaluation period results in a larger long-range actuarial deficit. The fund balance at the end of 2008, i.e., atthe beginning of the projection period, is included in the 75-year actuarial balance.
-.04 -.01 -.05Demographic data and assumptions . . . . . . . . . . . . . . -.11 .00 -.11Economic data and assumptions. . . . . . . . . . . . . . . . . -.13 -.02 -.15Disability assumptions . . . . . . . . . . . . . . . . . . . . . . . . -.01 -.01 -.01Methods and programmatic data . . . . . . . . . . . . . . . . +.07 -.04 +.03
Total change in actuarial balance . . . . . . . . . . . . . . . . . . -.22 -.08 -.30
Shown in this report:Actuarial balance . . . . . . . . . . . . . . . . . . . . . . . . . . . . . . -1.68 -.32 -2.00Income rate. . . . . . . . . . . . . . . . . . . . . . . . . . . . . . . . . . . 12.08 1.93 14.02Cost rate . . . . . . . . . . . . . . . . . . . . . . . . . . . . . . . . . . . . . 13.76 2.25 16.02
Overview
18
Figure II.D8.—OASDI Annual Balances: 2008 and 2009 Trustees Reports[As a percentage of taxable payroll under the intermediate assumptions]
-6%
-4%
-2%
0%
2%
4%
2005 2015 2025 2035 2045 2055 2065 2075 2085
Calendar year
2008 Report2009 Report

19
Conclusion
E. CONCLUSION
Under current law, the cost of Social Security will soon begin to increasefaster than the program’s income because of the aging of the baby-boom gen-eration, expected continuing low fertility (compared to the baby-boomperiod), and increasing life expectancy. Based on the Trustees’ best estimate,program cost will exceed tax revenues starting in 2016 and throughout theremainder of the 75-year projection period. Social Security’s combined trustfunds are projected to allow full payment of scheduled benefits until theybecome exhausted in 2037. At that time, annual tax income to the trust fundsis projected to equal about 76 percent of program costs. By 2083, annual taxincome is projected to be about 74 percent as large as the annual cost of theOASDI program.
Separately, the OASI and DI funds are projected to have sufficient funds topay full benefits on time until 2039 and 2020, respectively. The fact that theDI fund is projected to become exhausted in 2020 means that some actionwill likely need to be taken in the next 10 years. At a minimum, a realloca-tion of the payroll tax rate between OASI and DI would be necessary, as wasdone in 1994.
Over the full 75-year projection period, the actuarial deficit estimated for thecombined trust funds is 2.00 percent of taxable payroll—0.30 percentagepoint greater than the 1.70 percent deficit projected in last year’s report. Thisdeficit indicates that solvency of the combined OASDI Trust Funds for thenext 75 years could be restored under the intermediate assumptions ifincreases were made equivalent to immediately and permanently increasingthe Social Security payroll tax from its current level of 12.40 percent (foremployees and employers combined) to 14.41 percent. Alternatively,changes could be made that are equivalent to reducing all current and futurebenefits by about 13.3 percent. Other ways of reducing the deficit includemaking transfers from general revenues or adopting some combination ofapproaches.
If no substantial action is taken until the combined trust funds becomeexhausted in 2037, then changes necessary to make Social Security solventover the next 75 years will be concentrated on fewer years and fewer cohorts:
• For example, payroll taxes could be raised to finance scheduled benefitsfully in every year starting in 2037. In this case, the payroll tax wouldbe increased to about 16.26 percent at the point of trust fund exhaustionin 2037 and continue rising to about 16.74 percent in 2083.
Overview
20
• Similarly, benefits could be reduced to the level that is payable withscheduled tax rates in each year beginning in 2037. Under this scenario,benefits would be reduced 24 percent at the point of trust fund exhaus-tion in 2037, with reductions reaching 26 percent in 2083.
Either of these examples would eliminate the shortfall for the 75-year periodas a whole by specifically eliminating annual deficits after trust fund exhaus-tion. Because of the increasing average age of the population (due toexpected improvement in life expectancy and continued low birth rates),Social Security’s annual cost will very likely continue to grow faster thanscheduled tax revenues after 2083. As a result, ensuring solvency of the sys-tem beyond 2083 would likely require further changes beyond thoseexpected to be needed for 2083.
The projected trust fund deficits should be addressed in a timely way toallow for a gradual phasing in of the necessary changes and to provideadvance notice to workers. Making adjustments sooner will allow them to bespread over more generations. In 2009, Social Security plays a critical role inthe lives of 52 million beneficiaries and 160 million covered workers andtheir families. With informed discussion, creative thinking, and timely legis-lative action, present and future Congresses and Presidents can ensure thatSocial Security continues to protect future generations.
For further information related to the contents of this report, see the follow-ing websites.
• www.socialsecurity.gov/OACT/TR/TR09/index.html
• www.cms.hhs.gov/ReportsTrustFunds/
• www.treas.gov/offices/economic-policy/social_security.html

21
Calendar Year 2008 Operations
III. FINANCIAL OPERATIONS OF THE TRUST FUNDS ANDLEGISLATIVE CHANGES IN THE LAST YEAR
A. OPERATIONS OF THE OLD-AGE AND SURVIVORS INSURANCE(OASI) AND DISABILITY INSURANCE (DI) TRUST FUNDS, IN
CALENDAR YEAR 2008
Detailed information on the operations of the OASI and DI Trust Funds1 dur-ing calendar year 2008 is presented in this section. Appendix F provides pro-jections for calendar years 2009 through 2085.
1. OASI Trust Fund
A statement of the income and disbursements of the Federal Old-Age andSurvivors Insurance Trust Fund in calendar year 2008, and of the assets ofthe fund at the beginning and end of the calendar year, is presented in tableIII.A1. As shown in the table, total trust fund receipts in 2008 amounted to$695.5 billion, while disbursements totaled $516.2 billion, resulting in anincrease in trust fund assets during 2008 of $179.3 billion. Details of the var-ious components of trust fund income and disbursements are discussed in thefollowing paragraphs.
Included in total receipts during calendar year 2008 were $576.7 billion inemployment tax contributions. These contributions were partially offset bytransfers totaling $2.1 billion to the general fund for the estimated amount ofrefunds to employees who worked for more than one employer during a yearand paid contributions on total earnings in excess of the contribution andbenefit base.
Net contributions thus amounted to $574.6 billion in 2008, an increase of 2.4percent over the corresponding amount in 2007. This increase in OASI taxcontributions is due to increased earnings and the increase in the contributionand benefit base. (Table VI.A1 shows the tax rates and contribution and ben-efit bases in effect for past years.)
Income based on taxation of benefits amounted to $15.6 billion in 2008.About 99 percent of this income represents amounts credited to the trustfunds, on an estimated basis, generally in advance of the actual receipt oftaxes by the Treasury. The remaining 1 percent of the total income from taxa-tion of benefits represents amounts withheld from the benefits paid to non-resident aliens.
1 Data on trust fund operations are available on the Social Security website atwww.socialsecurity.gov/OACT/ProgData/fundsQuery.html.

Financial Operations & Legislative Changes
22
Note: Totals do not necessarily equal the sums of rounded components.
Special payments are made to uninsured persons who meet certain require-ments. The costs associated with providing such payments are largely reim-bursed from the General Fund of the Treasury. Accordingly, a transfer ofabout $6 thousand was made in 2008, reflecting costs incurred in fiscal year2007.
The OASI Trust Fund was credited with interest netting $105.3 billion,which consisted of: (1) interest earned on the investments of the trust fund;
Table III.A1.—Operations of the OASI Trust Fund, Calendar Year 2008[In millions]
Total assets, December 31, 2007 . . . . . . . . . . . . . . . . . . . . . . . . . . . . . . . . . . . . . . . . . . . $2,023,616Receipts:
Contributions:Employment taxes . . . . . . . . . . . . . . . . . . . . . . . . . . . . . . . . . . . . . . . . . . . . . . . . . . $576,659Payments from the General Fund of the Treasury for contributions subject to
refund. . . . . . . . . . . . . . . . . . . . . . . . . . . . . . . . . . . . . . . . . . . . . . . . . . . . . . . . . . -2,104Net contributions . . . . . . . . . . . . . . . . . . . . . . . . . . . . . . . . . . . . . . . . . . . . . . . . . 574,555
Income based on taxation of benefit payments:Withheld from benefit payments to nonresident aliens . . . . . . . . . . . . . . . . . . . . . . 146All other, not subject to withholding . . . . . . . . . . . . . . . . . . . . . . . . . . . . . . . . . . . . 15,420
Total income from taxation of benefits. . . . . . . . . . . . . . . . . . . . . . . . . . . . . . . . . 15,566Reimbursement from the general fund for costs of payments
to uninsured persons who attained age 72 before 1968. . . . . . . . . . . . . . . . . . . . . .a
a Between -$0.5 and $0.5 million.
Investment income and interest adjustments:Interest on investments. . . . . . . . . . . . . . . . . . . . . . . . . . . . . . . . . . . . . . . . . . . . . . . 105,333Interest adjustmentsb . . . . . . . . . . . . . . . . . . . . . . . . . . . . . . . . . . . . . . . . . . . . . . . .
b Includes (1) interest on transfers between the trust fund and the general fund account for the SupplementalSecurity Income program due to adjustments in the allocation of administrative expenses, (2) interest arisingfrom the revised allocation of administrative expenses among the trust funds, and (3) interest on certain reim-bursements to the trust fund.
7Total investment income and interest adjustments . . . . . . . . . . . . . . . . . . . . . . . . 105,340
Gifts . . . . . . . . . . . . . . . . . . . . . . . . . . . . . . . . . . . . . . . . . . . . . . . . . . . . . . . . . . . . . . . a
Total receipts . . . . . . . . . . . . . . . . . . . . . . . . . . . . . . . . . . . . . . . . . . . . . . . . . . . . . . . . . . 695,462
Disbursements:Benefit payments:
Monthly benefits and lump-sum death benefits . . . . . . . . . . . . . . . . . . . . . . . . . . . . 509,056Transfer to the DI Trust Fund to correct a trust fund allocation error made on pay-
ments to certain dually entitled disabled beneficiaries . . . . . . . . . . . . . . . . . . . . 339Reimbursement from the general fund for unnegotiated checks . . . . . . . . . . . . . . . -62Payment for costs of vocational rehabilitation services for disabled beneficiaries . 4
Net benefit payments . . . . . . . . . . . . . . . . . . . . . . . . . . . . . . . . . . . . . . . . . . . . . . 509,337Transfer to the Railroad Retirement “Social Security Equivalent Benefit Account” . 3,632Administrative expenses:
Costs incurred by:Social Security Administration. . . . . . . . . . . . . . . . . . . . . . . . . . . . . . . . . . . . . . . 2,543Department of the Treasury . . . . . . . . . . . . . . . . . . . . . . . . . . . . . . . . . . . . . . . . . 716
Offsetting receipts from sales of supplies, materials, etc. . . . . . . . . . . . . . . . . . . . . -1Miscellaneous reimbursements from the general fund c . . . . . . . . . . . . . . . . . . . . .
c Reimbursements for costs incurred in performing certain legislatively mandated activities not directlyrelated to administering the OASI program.
-35Net administrative expenses . . . . . . . . . . . . . . . . . . . . . . . . . . . . . . . . . . . . . . . . . 3,223
Total disbursements . . . . . . . . . . . . . . . . . . . . . . . . . . . . . . . . . . . . . . . . . . . . . . . . . . . . . 516,192Net increase in assets . . . . . . . . . . . . . . . . . . . . . . . . . . . . . . . . . . . . . . . . . . . . . . . . . . . . 179,270Total assets, December 31, 2008 . . . . . . . . . . . . . . . . . . . . . . . . . . . . . . . . . . . . . . . . . . . 2,202,886
23
Calendar Year 2008 Operations
(2) interest on transfers between the trust fund and the general fund accountfor the Supplemental Security Income program due to adjustments in theallocation of administrative expenses; (3) interest arising from the revisedallocation of administrative expenses among the trust funds; and (4) intereston certain reimbursements to the trust fund. The remaining $370 thousand ofreceipts consisted of gifts received under the provisions authorizing thedeposit of money gifts or bequests in the trust funds.
Of the $516.2 billion in total OASI disbursements, $509.3 billion was for netbenefit payments, including the reimbursable costs of vocational rehabilita-tion services.1 As described in last year’s report, in 2007 there was a transferof $5.6 billion from the OASI Trust Fund to the DI Trust Fund to correct along-standing, but small, error in the allocation between the trust funds of thecost for certain benefit payments. The error related to payments to certaindually-entitled disabled adult children that had been made entirely from theDI Trust Fund, even though a portion should have been paid from the OASITrust Fund. In 2008, a relatively small ($0.3 billion) transfer was made tocorrect the estimated effect of this error in fiscal year 2008. Excluding the$0.3 billion interfund transfer due to the trust fund allocation error, net bene-fit payments would have been $509.0 billion. This adjusted amount repre-sents an increase of 4.8 percent over the corresponding adjusted amount($485.8 billion) in calendar year 2007. This increase is due primarily to: (1)an increase in the total number of beneficiaries and (2) an increase in theaverage benefit amount. The increase in the average benefit amount in 2008was due in large part to the automatic cost-of-living benefit increase of 2.3percent, which became effective for December 2007 under the automatic-adjustment provisions in section 215(i) of the Social Security Act.
Provisions of the Railroad Retirement Act require an annual financial inter-change between the Railroad Retirement and OASDI programs. The purposeof such provisions is to put the OASI and DI Trust Funds in the same finan-cial position they would have been had railroad employment always beencovered by Social Security. Under those provisions, the Railroad RetirementBoard and the Commissioner of Social Security determined that a transfer of$3.6 billion to the Social Security Equivalent Benefit Account from theOASI Trust Fund was required in June 2008.
The remaining $3.2 billion of disbursements from the OASI Trust Fund rep-resented net administrative expenses. The expenses of administering theOASDI and Medicare programs are allocated and charged directly to each of
1 Vocational rehabilitation services are furnished to disabled widow(er) beneficiaries and to those childrenof retired or deceased workers who were receiving benefits on the basis of disabilities that began before age22. Reimbursement from the trust funds for the costs of vocational rehabilitation services is made only inthose cases where the services contributed to the successful rehabilitation of the beneficiary.

Financial Operations & Legislative Changes
24
the various trust funds through which those programs are financed, on thebasis of provisional estimates. Similarly, the expenses allocated for adminis-tering the Supplemental Security Income program are charged directly to theGeneral Fund of the Treasury on a provisional basis. Periodically, as actualexperience develops and is analyzed, adjustments to the allocations ofadministrative expenses for prior periods are effected by interfund transfersand transfers between the OASI Trust Fund and the general fund account forthe Supplemental Security Income program, with appropriate interest adjust-ments. As described earlier, the interest adjustments arising from the reallo-cation of administrative expenses are recorded in the trust fund accountingunder investment income.
In 2008, 79 percent of OASI net administrative expenses represented the costof administering the program. Such costs are charged to the trust fund by theSocial Security Administration ($2.5 billion in 2008). In addition, theDepartment of the Treasury charges directly to the trust fund certainexpenses ($0.7 billion in 2008) that it incurs in helping to administer theOASI program. In addition a relatively small adjustment ($586 thousand in2008) to administrative expenses is an offset representing income from thesale of excess supplies and equipment.
Finally, certain net reimbursements are made from the General Fund of theTreasury for administrative costs incurred by the Social Security Administra-tion in performing certain legislatively mandated activities that are notdirectly related to the OASI program. These reimbursements include thecosts associated with union activities related to administering the OASI pro-gram and providing information to participants in certain pension plans.Such reimbursements totaled $35 million in 2008.
The assets of the OASI Trust Fund at the end of calendar year 2008 totaled$2,202.9 billion, consisting of $2,203.4 billion in U.S. Government obliga-tions and, as an offset, an extension of credit amounting to $0.5 billionagainst securities to be redeemed within the following few days. The effec-tive annual rate of interest earned by the assets of the OASI Trust Fund dur-ing calendar year 2008 was 5.1 percent, as compared to 5.2 percent earnedduring calendar year 2007. Table VI.A5, presented in appendix A, shows adetailed listing of OASI Trust Fund holdings by type of security, interest rate,and year of maturity at the end of each year 2007 and 2008.
All securities held by the trust funds are backed by the full faith and credit ofthe United States Government, as required by law. Those currently held bythe OASI Trust Fund are special issues (i.e., securities sold only to the trustfunds). These are of two types: short-term certificates of indebtedness andlong-term bonds. The certificates of indebtedness are issued on a daily basisfor the investment of receipts not required to meet current expenditures, and

25
Calendar Year 2008 Operations
they mature on the next June 30 following the date of issue. Special-issuebonds, on the other hand, are normally acquired only when special issues ofeither type mature on June 30. The amount of bonds acquired on June 30 isequal to the amount of special issues maturing, plus accrued interest, lessamounts required to meet expenditures on that day.
Section 201(d) of the Social Security Act provides that the obligations issuedfor purchase by the OASI and DI Trust Funds shall have maturities fixedwith due regard for the needs of the funds. The usual practice has been tospread the holdings of special issues, as of each June 30, so that the amountsmaturing in each of the next 15 years are approximately equal. Accordingly,the amounts and maturity dates of the OASI special-issue bonds purchasedon June 30, 2008, with an interest rate of 4 percent, were selected so that thematurity dates of the total portfolio of special issues were spread evenly overthe 15-year period 2009-23. The amount of bonds purchased on June 30,2008, is shown in table III.A7.
2. DI Trust Fund
A statement of the income and disbursements of the Federal Disability Insur-ance Trust Fund in calendar year 2008, and of the assets of the fund at thebeginning and end of the calendar year, is presented in table III.A2.

Financial Operations & Legislative Changes
26
Note: Totals do not necessarily equal the sums of rounded components.
Line entries in the DI statement are similar to those in the OASI statementand the explanations of the OASI entries generally apply to DI as well.
Net contributions amounted to $97.6 billion, an increase of 2.4 percent fromthe amount in the preceding calendar year. This increase is attributable to thesame factors, insofar as they apply to the DI program, which accounted forthe change in contributions to the OASI Trust Fund.
Of the $109.0 billion in total disbursements, $106.0 billion was for net bene-fit payments. Excluding the $0.3 billion interfund transfer due to the trustfund allocation error, net benefit payments would have been $106.3 billion.This adjusted amount represents an increase of 7.3 percent over the corre-
Table III.A2.—Operations of the DI Trust Fund, Calendar Year 2008[In millions]
Total assets, December 31, 2007 . . . . . . . . . . . . . . . . . . . . . . . . . . . . . . . . . . . . . . . . . . . $214,884Receipts:
Contributions:Employment taxes . . . . . . . . . . . . . . . . . . . . . . . . . . . . . . . . . . . . . . . . . . . . . . . . . . $97,924Payments from the General Fund of the Treasury for contributions subject to
refund. . . . . . . . . . . . . . . . . . . . . . . . . . . . . . . . . . . . . . . . . . . . . . . . . . . . . . . . . . -357Net contributions . . . . . . . . . . . . . . . . . . . . . . . . . . . . . . . . . . . . . . . . . . . . . . . . . 97,566
Income based on taxation of benefit payments:Withheld from benefit payments to nonresident aliens . . . . . . . . . . . . . . . . . . . . . . 4All other, not subject to withholding . . . . . . . . . . . . . . . . . . . . . . . . . . . . . . . . . . . . 1,309
Total income from taxation of benefits. . . . . . . . . . . . . . . . . . . . . . . . . . . . . . . . . 1,313Investment income and interest adjustments:
Interest on investments. . . . . . . . . . . . . . . . . . . . . . . . . . . . . . . . . . . . . . . . . . . . . . . 10,957Interest adjustmentsa . . . . . . . . . . . . . . . . . . . . . . . . . . . . . . . . . . . . . . . . . . . . . . . . 4
Total investment income and interest adjustments . . . . . . . . . . . . . . . . . . . . . . . . 10,961Total receipts . . . . . . . . . . . . . . . . . . . . . . . . . . . . . . . . . . . . . . . . . . . . . . . . . . . . . . . . . . 109,840
Disbursements:Benefit payments:
Monthly benefits. . . . . . . . . . . . . . . . . . . . . . . . . . . . . . . . . . . . . . . . . . . . . . . . . . . . 106,301Transfer from the OASI Trust Fund to correct a trust fund allocation error made
on payments to certain dually entitled disabled beneficiaries . . . . . . . . . . . . . . . -339Reimbursement from the general fund for unnegotiated checks . . . . . . . . . . . . . . . -30Payment for costs of vocational rehabilitation services for disabled beneficiaries . 75
Net benefit payments . . . . . . . . . . . . . . . . . . . . . . . . . . . . . . . . . . . . . . . . . . . . . . 106,007Transfer to the Railroad Retirement “Social Security Equivalent Benefit Account” . 418Administrative expenses:
Costs incurred by:Social Security Administration. . . . . . . . . . . . . . . . . . . . . . . . . . . . . . . . . . . . . . . 2,368Department of the Treasury . . . . . . . . . . . . . . . . . . . . . . . . . . . . . . . . . . . . . . . . . 133
Miscellaneous reimbursements from the general fundb. . . . . . . . . . . . . . . . . . . . . . 26Total administrative expenses. . . . . . . . . . . . . . . . . . . . . . . . . . . . . . . . . . . . . . . . 2,526
Total disbursements . . . . . . . . . . . . . . . . . . . . . . . . . . . . . . . . . . . . . . . . . . . . . . . . . . . . . 108,951Net increase in assets . . . . . . . . . . . . . . . . . . . . . . . . . . . . . . . . . . . . . . . . . . . . . . . . . . . . 889Total assets, December 31, 2008 . . . . . . . . . . . . . . . . . . . . . . . . . . . . . . . . . . . . . . . . . . . 215,773a Includes (1) interest on transfers between the trust fund and the general fund account for the SupplementalSecurity Income program due to adjustments in the allocation of administrative expenses, (2) interest arisingfrom the revised allocation of administrative expenses among the trust funds, and (3) interest on certainreimbursements to the trust fund.b Reimbursements for costs incurred in performing certain legislatively mandated activities not directlyrelated to administering the DI program.

27
Calendar Year 2008 Operations
sponding amount in calendar year 2007. This increase in DI benefit pay-ments was due to the same factors that resulted in the net increase in benefitpayments from the OASI Trust Fund. However, the number of personsreceiving benefits from the DI Trust Fund increased more rapidly in 2008than the number receiving benefits from the OASI Trust Fund largely due toa) the current ages of the baby-boom generation, b) the recent increase in thenormal retirement age (NRA), and c) the special administrative action,undertaken by SSA beginning in 2001, to identify and award benefits fromthe DI Trust Fund to a substantial number of current and former recipients ofSSI benefits whose disability-insured status under the DI program was notpreviously recognized. Total DI disbursements, which started to exceed non-interest income in 2005, continue to exceed such income in 2008. However,as in 2005 through 2007, total DI income (including interest) in 2008exceeds total disbursements.
The assets of the DI Trust Fund at the end of calendar year 2008 totaled$215.8 billion, consisting of $215.8 billion in U.S. Government obligationsand, as an offset, an extension of credit amounting to $37 million againstsecurities to be redeemed within the following few days. The effectiveannual rate of interest earned by the assets of the DI Trust Fund during calen-dar year 2008 was 5.2 percent, as compared to 5.3 percent earned during cal-endar year 2007. Table VI.A6, presented in appendix A, shows a detailedlisting of DI Trust Fund holdings by type of security, interest rate, and yearof maturity at the end of each year 2007 and 2008.

Financial Operations & Legislative Changes
28
3. OASI and DI Trust Funds, Combined
A statement of the operations of the income and disbursements of the OASIand DI Trust Funds, on a combined basis, is presented in table III.A3. Theentries in this table represent the sums of the corresponding values fromtables III.A1 and III.A2. For a discussion of the nature of these income andexpenditure transactions, reference should be made to the two preceding sub-sections covering OASI and DI separately.
Note: Totals do not necessarily equal the sums of rounded components.
To provide a context for estimates of future trust fund income and expendi-tures provided later in this report, table III.A4 compares past estimates of
Table III.A3.—Operations of the Combined OASI and DI Trust Funds, Calendar Year 2008
[In millions]Total assets, December 31, 2007 . . . . . . . . . . . . . . . . . . . . . . . . . . . . . . . . . . . . . . . . . . . $2,238,500Receipts:
Contributions:Employment taxes . . . . . . . . . . . . . . . . . . . . . . . . . . . . . . . . . . . . . . . . . . . . . . . . . . $674,583Payments from the General Fund of the Treasury for contributions subject to
refund. . . . . . . . . . . . . . . . . . . . . . . . . . . . . . . . . . . . . . . . . . . . . . . . . . . . . . . . . . -2,461Net contributions . . . . . . . . . . . . . . . . . . . . . . . . . . . . . . . . . . . . . . . . . . . . . . . . . 672,122
Income based on taxation of benefit payments:Withheld from benefit payments to nonresident aliens . . . . . . . . . . . . . . . . . . . . . . 150All other, not subject to withholding . . . . . . . . . . . . . . . . . . . . . . . . . . . . . . . . . . . . 16,729
Total income from taxation of benefits. . . . . . . . . . . . . . . . . . . . . . . . . . . . . . . . . 16,879Reimbursement from the general fund for costs of payments
to uninsured persons who attained age 72 before 1968. . . . . . . . . . . . . . . . . . . . . .a
a Between -$0.5 and $0.5 million.
Investment income and interest adjustments:Interest on investments. . . . . . . . . . . . . . . . . . . . . . . . . . . . . . . . . . . . . . . . . . . . . . . 116,290Interest adjustmentsb . . . . . . . . . . . . . . . . . . . . . . . . . . . . . . . . . . . . . . . . . . . . . . . .
b Includes (1) interest on transfers between the trust funds and the general fund account for the SupplementalSecurity Income program due to adjustments in the allocation of administrative expenses, (2) interest arisingfrom the revised allocation of administrative expenses among the trust funds, and (3) interest on certainreimbursements to the trust funds.
11Total investment income and interest adjustments . . . . . . . . . . . . . . . . . . . . . . . . 116,301
Gifts . . . . . . . . . . . . . . . . . . . . . . . . . . . . . . . . . . . . . . . . . . . . . . . . . . . . . . . . . . . . . . . a
Total receipts . . . . . . . . . . . . . . . . . . . . . . . . . . . . . . . . . . . . . . . . . . . . . . . . . . . . . . . . . . 805,302
Disbursements:Benefit payments:
Monthly benefits and lump-sum death payments. . . . . . . . . . . . . . . . . . . . . . . . . . . 615,357Reimbursement from the general fund for unnegotiated checks . . . . . . . . . . . . . . . -92Payment for costs of vocational rehabilitation services for disabled beneficiaries . 79
Net benefit payments . . . . . . . . . . . . . . . . . . . . . . . . . . . . . . . . . . . . . . . . . . . . . . 615,344Transfer to the Railroad Retirement “Social Security Equivalent Benefit Account” . 4,050Administrative expenses:
Costs incurred by:Social Security Administration. . . . . . . . . . . . . . . . . . . . . . . . . . . . . . . . . . . . . . . 4,910Department of the Treasury . . . . . . . . . . . . . . . . . . . . . . . . . . . . . . . . . . . . . . . . . 849
Offsetting receipts from sales of supplies, materials, etc. . . . . . . . . . . . . . . . . . . . . -1Miscellaneous reimbursements from the general fundc. . . . . . . . . . . . . . . . . . . . . .
c Reimbursements for costs incurred in performing certain legislatively mandated activities not directlyrelated to administering the OASI and DI programs.
-10Net administrative expenses . . . . . . . . . . . . . . . . . . . . . . . . . . . . . . . . . . . . . . . . . 5,749
Total disbursements . . . . . . . . . . . . . . . . . . . . . . . . . . . . . . . . . . . . . . . . . . . . . . . . . . . . . 625,143Net increase in assets . . . . . . . . . . . . . . . . . . . . . . . . . . . . . . . . . . . . . . . . . . . . . . . . . . . . 180,159Total assets, December 31, 2008 . . . . . . . . . . . . . . . . . . . . . . . . . . . . . . . . . . . . . . . . . . . 2,418,658

29
Calendar Year 2008 Operations
contributions and benefit payments for calendar year 2008, as shown in the2004-08 Annual Reports, with the corresponding actual amounts in 2008.1l
A number of factors can contribute to differences between estimates and sub-sequent actual amounts, including actual values for key demographic, eco-nomic, and other variables that differ from assumed levels. In addition, newlegislation or other administrative initiatives that were unanticipated at thetime the earlier estimates were completed can contribute to such differences.
At the end of calendar year 2008, about 50.9 million persons were receivingmonthly benefits under the OASDI program. Of these persons, about41.6 million and 9.3 million were receiving monthly benefits from the OASITrust Fund and the DI Trust Fund, respectively. The number of persons
1 Estimated amounts used to calculate percentage differences are before rounding to amounts shown in theannual reports.
Table III.A4.—Comparison of Actual Calendar Year 2008 Trust Fund OperationsWith Estimates Made in Prior Reportsa
[Amounts in billions]
a The estimates shown are based on the intermediate assumptions.
Net contributions b
b “Actual” contributions for 2008 reflect adjustments for prior calendar years (see Appendix A on page 138for description of these adjustments). “Estimated” contributions also include such adjustments, but on anestimated basis.
Net benefit payments
Amount
Differencefrom actual
(percent) Amount
Differencefrom actual
(percent)OASI Trust Fund:
Estimate in 2004 report . . . . . . . . . . . . . . $581.8 1.3 $486.2 -4.5Estimate in 2005 report . . . . . . . . . . . . . . 582.6 1.4 494.8 -2.8Estimate in 2006 report . . . . . . . . . . . . . . 590.4 2.8 506.3 -.5Estimate in 2007 report . . . . . . . . . . . . . . 589.1 2.5 504.5 -.9Estimate in 2008 report . . . . . . . . . . . . . . 583.1 1.5 508.8 c
c Between -0.05 and 0.05 percent.
Actual amount . . . . . . . . . . . . . . . . . . . . . 574.6 — d 509.0
d Excludes interfund transfer to correct a trust fund allocation error made on payments to certain disabledbeneficiaries. The transfer amounted to $0.3 billion from OASI to DI.
—
DI Trust Fund:Estimate in 2004 report . . . . . . . . . . . . . . 98.8 1.3 98.8 -7.1Estimate in 2005 report . . . . . . . . . . . . . . 98.9 1.4 101.3 -4.8Estimate in 2006 report . . . . . . . . . . . . . . 100.3 2.8 104.5 -1.8Estimate in 2007 report . . . . . . . . . . . . . . 100.0 2.5 103.4 -2.8Estimate in 2008 report . . . . . . . . . . . . . . 99.0 1.5 104.9 -1.3
Actual amount . . . . . . . . . . . . . . . . . . . . . 97.6 — d 106.3 —
OASI and DI Trust Funds, combined:Estimate in 2004 report . . . . . . . . . . . . . . 680.6 1.3 585.0 -4.9Estimate in 2005 report . . . . . . . . . . . . . . 681.5 1.4 596.1 -3.1Estimate in 2006 report . . . . . . . . . . . . . . 690.6 2.8 610.7 -.7Estimate in 2007 report . . . . . . . . . . . . . . 689.2 2.5 607.9 -1.2Estimate in 2008 report . . . . . . . . . . . . . . 682.1 1.5 613.7 -.3
Actual amount . . . . . . . . . . . . . . . . . . . . . 672.1 — 615.3 —

Financial Operations & Legislative Changes
30
receiving benefits from the OASI and DI Trust Funds grew by 1.7 percentand 4.0 percent, respectively, during the calendar year. The estimated distri-butions of benefit payments in calendar years 2007 and 2008, by type of ben-eficiary, are shown in table III.A5 for each trust fund separately.
Note: Benefits are monthly benefits and lump-sum death payments. Totals do not necessarily equal the sumsof rounded components.
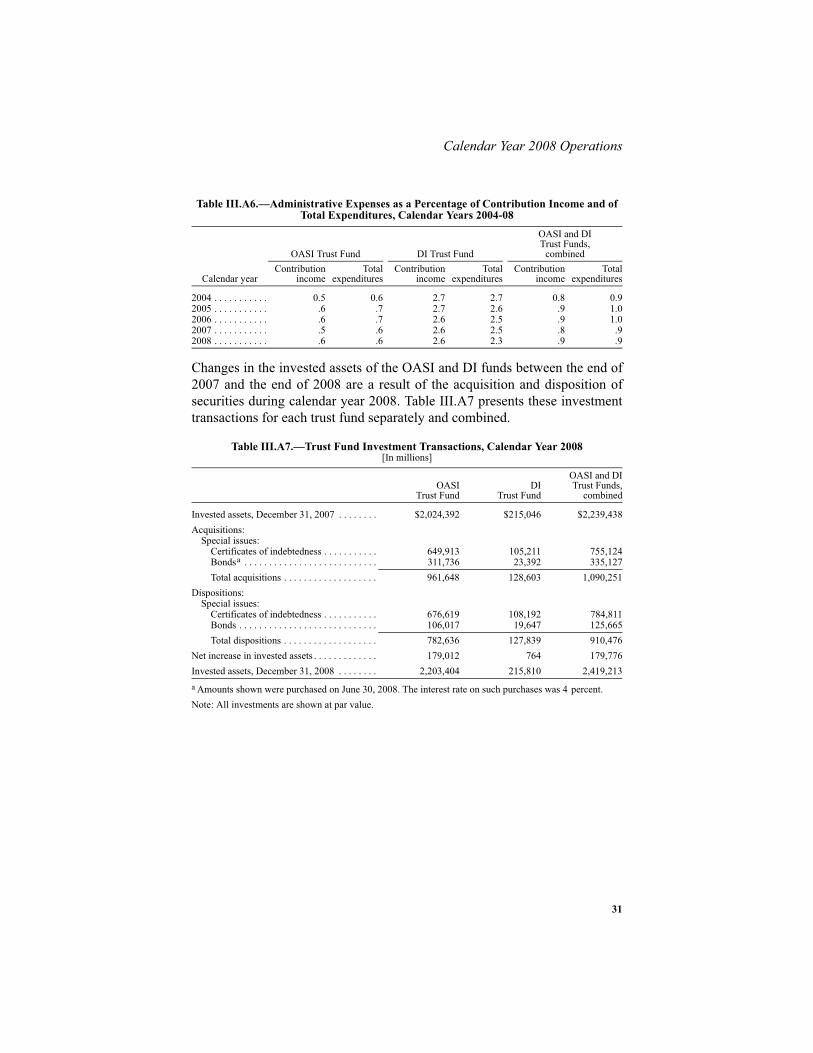
Net administrative expenses charged to the OASI and DI Trust Funds in cal-endar year 2008 totaled $5.7 billion. This amount represented 0.9 percent ofcontribution income and 0.9 percent of expenditures. Corresponding percent-ages for each trust fund separately and for the OASDI program as a wholeare shown in table III.A6 for each of the last 5 years.
Table III.A5.—Distribution of Benefit Payments by Type of Beneficiary or Payment, Calendar Years 2007 and 2008
[Amounts in millions]
Calendar year 2007 Calendar year 2008
AmountPercentage
of total AmountPercentage
of total
Total OASDI benefit payments . . . . . . . . . . $584,966 100.0 $615,357 100.0OASI benefit payments . . . . . . . . . . . . . . 485,881 83.1 509,056 82.7DI benefit payments . . . . . . . . . . . . . . . . . 99,086 16.9 106,301 17.3
OASI benefit payments, total. . . . . . . . . . . . 485,881 100.0 509,056 100.0Monthly benefits:
Retired workers and auxiliaries . . . . . . 389,124 80.1 409,503 80.4Retired workers . . . . . . . . . . . . . . . . 364,278 75.0 383,999 75.4Spouses . . . . . . . . . . . . . . . . . . . . . . . 21,571 4.4 22,022 4.3Children . . . . . . . . . . . . . . . . . . . . . . 3,274 .7 3,482 .7
Survivors of deceased workers. . . . . . . 96,554 19.9 99,348 19.5Aged widows and widowers. . . . . . . 76,619 15.8 78,747 15.5Disabled widows and widowers . . . . 1,853 .4 1,945 .4Parents . . . . . . . . . . . . . . . . . . . . . . . 24 a
a Less than 0.05 percent.
23 a
Children . . . . . . . . . . . . . . . . . . . . . . 16,486 3.4 17,041 3.3Widowed mothers and fathers
caring for child beneficiaries . . . . 1,573 .3 1,592 .3Uninsured persons generally aged 72
before 1968 . . . . . . . . . . . . . . . . . . . b
b Less than $0.5 million.
a b a
Lump-sum death payments . . . . . . . . . . . 203 a 205 a
DI benefit payments, total . . . . . . . . . . . . . . 99,086 100.0 106,301 100.0Disabled workers . . . . . . . . . . . . . . . . . 91,314 92.2 98,104 92.3Spouses. . . . . . . . . . . . . . . . . . . . . . . . . 520 .5 534 .5Children . . . . . . . . . . . . . . . . . . . . . . . . 7,251 7.3 7,664 7.2
31
Calendar Year 2008 Operations
Changes in the invested assets of the OASI and DI funds between the end of2007 and the end of 2008 are a result of the acquisition and disposition ofsecurities during calendar year 2008. Table III.A7 presents these investmenttransactions for each trust fund separately and combined.
Note: All investments are shown at par value.
Table III.A6.—Administrative Expenses as a Percentage of Contribution Income and of Total Expenditures, Calendar Years 2004-08
Calendar year
OASI Trust Fund DI Trust Fund
OASI and DITrust Funds,
combinedContribution
incomeTotal
expendituresContribution
incomeTotal
expendituresContribution
incomeTotal
expenditures
2004 . . . . . . . . . . . 0.5 0.6 2.7 2.7 0.8 0.92005 . . . . . . . . . . . .6 .7 2.7 2.6 .9 1.02006 . . . . . . . . . . . .6 .7 2.6 2.5 .9 1.02007 . . . . . . . . . . . .5 .6 2.6 2.5 .8 .92008 . . . . . . . . . . . .6 .6 2.6 2.3 .9 .9
Table III.A7.—Trust Fund Investment Transactions, Calendar Year 2008[In millions]
OASITrust Fund
DITrust Fund
OASI and DITrust Funds,
combined
Invested assets, December 31, 2007 . . . . . . . . $2,024,392 $215,046 $2,239,438Acquisitions:
Special issues:Certificates of indebtedness . . . . . . . . . . . 649,913 105,211 755,124Bondsa . . . . . . . . . . . . . . . . . . . . . . . . . . .
a Amounts shown were purchased on June 30, 2008. The interest rate on such purchases was 4 percent.
311,736 23,392 335,127Total acquisitions . . . . . . . . . . . . . . . . . . . 961,648 128,603 1,090,251
Dispositions:Special issues:
Certificates of indebtedness . . . . . . . . . . . 676,619 108,192 784,811Bonds . . . . . . . . . . . . . . . . . . . . . . . . . . . . 106,017 19,647 125,665Total dispositions . . . . . . . . . . . . . . . . . . . 782,636 127,839 910,476
Net increase in invested assets . . . . . . . . . . . . . 179,012 764 179,776Invested assets, December 31, 2008 . . . . . . . . 2,203,404 215,810 2,419,213

Financial Operations & Legislative Changes
32
B. SOCIAL SECURITY AMENDMENTS SINCE THE 2008 REPORT
Since the 2008 Annual Report was transmitted to Congress on March 25,2008, one law was enacted that had a direct financial effect on the OASDIprogram. The Food, Conservation, and Energy Act of 2008, Public Law 110-246, was enacted on June 18, 2008. It included provisions to exclude conser-vation reserve program payments from self-employment income for pur-poses of the Self-Employment Contributions Act (SECA) for individualswho are receiving Social Security retirement or disability benefits and totransfer funds from the General Fund of the Treasury to the OASI and DITrust Funds for fiscal years 2009 through 2017 to ensure that the assets ofthe trust funds are not reduced as a result of enactment of this Act. Anotherprovision increases the amount of net earnings from self-employment thatcan be declared for SECA tax purposes and thus credited to individuals whofile under the optional method of reporting self-employment earnings. Theseprovisions are estimated to have negligible financial effects on the OASDIprogram.
The Congress has also enacted legislation to stabilize the banking system andto stimulate the economy. The Emergency Economic Stabilization Act of2008 (Public Law 110-343, enacted on October 3, 2008) allows the govern-ment to purchase troubled assets and stocks to strengthen financial institu-tions. The American Recovery and Reinvestment Act of 2009 (Public Law111-5, enacted on February 17, 2009) includes some reductions in personalincome taxes and increases in government expenditures. These policies areexpected to affect the speed and timing of the economic recovery from thecurrent recession.

33
Short-Range Estimates
IV. ACTUARIAL ESTIMATES
This chapter presents actuarial estimates of the future financial condition ofthe Social Security program. These estimates include projected income andcost of the OASI and DI Trust Funds, in dollars over the next 10 years and asa percentage of taxable payroll or in present-value dollars over the full75-year period, along with a discussion of a variety of measures of the ade-quacy of current program financing. In this report we carefully distinguishbetween (1) the cost (or obligations) of the program, which includes, for thefuture, all benefits scheduled under current law, and (2) expenditures (dis-bursements or outgo), which include actual payments for the past and onlythe portion of the cost of the program that is projected to be payable with thefinancing provisions in current law.
As described in the Overview section of this report, these estimates dependupon a broad set of demographic, economic, and programmatic factors.Since assumptions related to these factors are subject to uncertainty, the esti-mates presented in this section are prepared under three sets of assumptions,to show a range of possible outcomes. The intermediate set of assumptions,designated as alternative II, reflects the Trustees’ best estimate of futureexperience; the low-cost alternative I is more optimistic and the high-costalternative III more pessimistic for the trust funds’ future financial outlook.The intermediate estimates are shown first in the tables in this report, fol-lowed by the low-cost and high-cost estimates. These sets of assumptions,along with actuarial methods used to produce the estimates, are described inchapter V. In this chapter, the estimates and measures of trust fund financialadequacy for the short range (2009-18) are presented first, followed by esti-mates and measures of actuarial status for the long range (2009-83) and forthe infinite future. As an additional illustration of uncertainty, estimatedprobability distributions of certain measures are presented in Appendix E.
A. SHORT-RANGE ESTIMATES
Financial adequacy, or solvency, of the trust funds reflects the ability to payscheduled benefits in full on a timely basis and is generally assessed usingthe “trust fund ratio,” which is defined as the assets at the beginning of a yearexpressed as a percentage of the projected cost for the year. Thus, the trustfund ratio represents the proportion of a year’s cost that can be paid with thefunds available at the beginning of the year. A trust fund ratio of 100 percentof annual program cost is generally assumed to provide a reasonable “contin-gency reserve.” During periods when trust fund income exceeds disburse-ments, the excess is held in the trust funds. To the extent that trust fund assetsexceed 100 percent of annual cost, the excess is dedicated to advance fund aportion of the Social Security program’s future financial obligations. Duringperiods when trust fund disbursements exceed income, as might happen dur-ing an economic recession, trust fund assets are used to meet the shortfall. Inthe event of recurring shortfalls for an extended period, the trust funds can

Actuarial Estimates
34
allow time for the development, enactment, and implementation of legisla-tion to restore financial stability to the program.
The short-range test of financial adequacy is applicable to the OASI and DITrust Funds individually and on a combined basis. The requirements of thistest are as follows: If the estimated trust fund ratio is at least 100 percent atthe beginning of the projection period, then it must be projected to remain ator above 100 percent throughout the 10-year projection period. Alternatively,if the ratio is initially less than 100 percent, then it must be projected to reacha level of at least 100 percent within 5 years (and not be depleted at any timeduring this period) and to remain at or above 100 percent throughout theremainder of the 10-year period. In addition, the fund’s estimated assets atthe beginning of each month of the 10-year period must be sufficient to coverthat month’s disbursements. This test is applied on the basis of the intermedi-ate estimates. Failure to meet this test by either trust fund is an indication thatsolvency of the program over the next 10 years is in question and that legis-lative action is needed to improve the short-range financial adequacy of theprogram.
1. Operations of the OASI Trust Fund
This subsection presents estimates of the operations and financial status ofthe OASI Trust Fund for the period 2009-18, based on the assumptionsdescribed in chapter V. No changes are assumed to occur in the present statu-tory provisions and regulations under which the OASDI program operates.1
These estimates are shown in table IV.A1 and indicate that the assets of theOASI Trust Fund would continue to increase rapidly throughout the next 10years under all three sets of assumptions. Also, based on the intermediateassumptions, the assets of the OASI Trust Fund would continue to exceed100 percent of annual expenditures by a large amount through the end of2018. Consequently, the OASI Trust Fund satisfies the test of short-rangefinancial adequacy by a wide margin. The estimates in table IV.A1 also indi-cate that the short-range test would be satisfied even under the high-costassumptions (see figure IV.A1 for graphical illustration of these results).
The increases in estimated income shown in table IV.A1 under each set ofassumptions reflect increases in estimated OASDI taxable earnings andgrowth in interest earnings on the invested assets of the trust fund. For eachalternative, employment is assumed to decrease in 2009 and, for alternativeIII only, in 2010. Thereafter, employment is assumed to increase in everyyear through 2018 for each alternative. The number of persons with taxable
1 The estimates shown in this subsection reflect 12 months of benefit payments in each year of the short-range projection period. In practice, the actual payment dates have at times been shifted over calendar yearboundaries as a result of the statutory requirement that benefit checks be delivered early when the normalcheck delivery date is a Saturday, Sunday, or legal public holiday. The annual benefit figures are shown as ifthose benefit checks were delivered on the usual date.

35
Short-Range Estimates
earnings would increase on the basis of alternatives I, II, and III from162 million during calendar year 2008 to about 177 million, 174 million, and171 million, respectively, in 2018. The total annual amount of taxable earn-ings is projected to increase in every year through 2018 for each alternative.Total earnings increase from $5,511 billion in 2008 to $8,319 billion,$8,329 billion, and $8,710 billion, in 2018, on the basis of alternatives I, II,and III, respectively.1 These increases in taxable earnings are due primarilyto (1) projected increases in employment levels as the working age popula-tion increases, (2) increases in average earnings in covered employment(reflecting both real growth and price inflation), and (3) increases in the con-tribution and benefit base during the period 2009-18 under the automatic-adjustment provisions.
Growth in interest earnings represents a significant component of the overallincrease in trust fund income during this period. Although interest rates pay-able on trust fund investments are assumed to temporarily decline from cur-rent levels, the continuing rapid increase in OASI assets will result in acorresponding net increase in interest income. By 2018, interest income tothe OASI Trust Fund is projected to be about 18 percent of total trust fundincome on the basis of the intermediate assumptions, as compared to15 percent in 2008.
1 Note that the pattern, by alternative, of these nominal amounts of total taxable earnings is not what mightbe expected, but the reverse, because of the varying inflation assumptions embedded in the respective esti-mates.
Figure IV.A1.—Short-Range OASI and DI Trust Fund Ratios[Assets as a percentage of annual cost]
0%
50%
100%
150%
200%
250%
300%
350%
400%
450%
500%
1998 2000 2002 2004 2006 2008 2010 2012 2014 2016 2018Calendar year
OASIDI
Historical Estimated
"Minimum" level for short-term financial adequacy
I
II
III
I
II
III

Actuarial Estimates
36
Note: Totals do not necessarily equal the sums of rounded components.
Table IV.A1.—Operations of the OASI Trust Fund, Calendar Years 2004-18a[Dollar amounts in billions]
a A detailed description of the components of income and cost, along with complete historical values, is pre-sented in Appendix A.
Calendaryear
Income Cost Assets
Totalb
b “Total Income” column includes transfers made between the OASI Trust Fund and the General Fund of theTreasury that are not included in the separate components of income shown. These transfers consist of pay-ments for (1) the cost of noncontributory wage credits for military service before 1957, and (2) the cost ofbenefits to certain uninsured persons who attained age 72 before 1968. In December 2005, $350 million wastransferred from the OASI Trust Fund to the General Fund of the Treasury for the cost of pre-1957 militaryservice wage credits. After 2008 such transfers are estimated to be less than $500,000 in each year.
Netcontri-
butions
Taxa-tion of
benefitsNet
interest Total
Benefitpay-
ments
Admin-istra-
tivecosts
RRBinter-
change
Netincrease
duringyear
Amountat end
of year
Trustfund
ratioc
c The “Trust fund ratio” column represents assets at the beginning of a year (which are identical to assets atthe end of the prior year shown in the “Amount at end of year” column) as a percentage of cost for the year.
Historical data:2004 . . $566.3 $472.8 $14.6 $79.0 $421.0 $415.0 $2.4 $3.6 $145.3 $1,500.6 3222005 . . 604.3 506.9 13.8 84.0 441.9 435.4 3.0 3.6 162.4 1,663.0 3402006 . . 642.2 534.8 15.6 91.8 461.0 454.5 3.0 3.5 181.3 1,844.3 3612007 . . 675.0 560.9 17.2 97.0 495.7 489.1 3.1 3.6 179.3 2,023.6 3722008 . . 695.5 574.6 15.6 105.3 516.2 509.3 3.2 3.6 179.3 2,202.9 392
Intermediate:2009 . . 708.5 579.0 21.7 107.8 561.8 554.7 3.6 3.6 146.7 2,349.6 3922010 . . 733.9 599.4 23.9 110.6 581.2 573.8 3.5 3.8 152.7 2,502.2 4042011 . . 771.8 628.9 25.2 117.7 602.0 594.5 3.6 3.8 169.8 2,672.1 4162012 . . 822.4 667.4 26.8 128.3 633.9 626.3 3.7 3.9 188.6 2,860.6 4222013 . . 874.2 702.8 30.1 141.3 678.8 671.2 3.7 3.9 195.3 3,056.0 421
2014 . . 924.7 737.2 32.6 154.8 729.6 721.8 3.8 4.1 195.0 3,251.0 4192015 . . 975.4 772.8 35.7 166.9 783.4 775.3 3.9 4.3 192.0 3,443.0 4152016 . . 1,024.0 806.6 38.8 178.6 839.8 831.5 3.9 4.4 184.1 3,627.2 4102017 . . 1,074.6 841.9 42.1 190.6 900.6 891.8 4.0 4.8 174.0 3,801.1 4032018 . . 1,126.0 878.2 44.9 202.9 965.5 956.3 4.1 5.0 160.5 3,961.6 394
Low-cost:2009 . . 712.3 582.1 21.7 108.4 561.6 554.5 3.6 3.6 150.7 2,353.6 3922010 . . 745.4 609.7 23.8 111.8 580.8 573.4 3.5 3.8 164.6 2,518.2 4052011 . . 781.3 638.1 25.2 118.0 601.2 593.7 3.6 3.8 180.1 2,698.3 4192012 . . 823.0 669.4 26.4 127.3 624.0 616.5 3.6 3.9 199.0 2,897.3 4322013 . . 880.4 711.8 29.2 139.4 659.6 652.1 3.7 3.8 220.9 3,118.2 439
2014 . . 927.1 743.9 31.4 151.8 701.9 694.3 3.7 3.9 225.3 3,343.4 4442015 . . 973.6 776.3 34.0 163.2 746.4 738.5 3.8 4.1 227.2 3,570.6 4482016 . . 1,020.7 808.6 36.6 175.5 792.6 784.7 3.8 4.1 228.1 3,798.7 4502017 . . 1,070.8 842.1 39.4 189.3 842.4 834.0 3.9 4.4 228.5 4,027.2 4512018 . . 1,122.8 877.3 41.7 203.9 895.0 886.5 4.0 4.6 227.8 4,254.9 450
High-cost:2009 . . 707.9 578.0 21.8 108.2 562.1 555.0 3.6 3.6 145.8 2,348.7 3922010 . . 730.4 594.8 23.9 111.7 581.9 574.5 3.5 3.8 148.5 2,497.2 4042011 . . 772.1 628.0 25.3 118.8 604.5 597.0 3.6 3.8 167.6 2,664.8 4132012 . . 809.7 653.9 27.2 128.5 644.8 637.2 3.6 3.9 165.0 2,829.8 4132013 . . 863.5 688.9 31.2 143.5 702.8 695.0 3.8 4.0 160.7 2,990.4 403
2014 . . 937.5 736.8 34.8 165.9 778.7 770.5 3.9 4.3 158.7 3,149.2 3842015 . . 1,006.9 786.1 39.1 181.7 858.2 849.4 4.1 4.7 148.8 3,297.9 3672016 . . 1,068.8 832.6 43.2 193.0 935.9 926.7 4.2 5.0 132.9 3,430.8 3522017 . . 1,127.1 876.9 47.4 202.7 1,013.9 1,004.1 4.3 5.5 113.1 3,544.0 3382018 . . 1,179.8 918.0 51.0 210.8 1,096.5 1,086.2 4.4 5.9 83.3 3,627.3 323
37
Short-Range Estimates
Rising expenditures during 2009-18 reflect automatic benefit increases aswell as the upward trend in the number of beneficiaries and in the averagemonthly earnings underlying benefits payable by the program. The growth inthe number of beneficiaries in the past and the expected growth in the futureresult both from the increase in the aged population and from the increase inthe proportion of the population that is eligible for benefits.
The estimates under all three sets of assumptions shown in table IV.A1 indi-cate that income to the OASI Trust Fund would substantially exceed expen-ditures in every year of the short-range projection period, and assets aretherefore estimated to increase substantially.
The portion of the OASI Trust Fund that is not needed to meet day-to-dayexpenditures is used to purchase financial securities, generally special pub-lic-debt obligations of the U.S. Government. The cash used to make thesepurchases flows to the General Fund of the Treasury and is used to meet var-ious Federal outlays or to reduce the amount of publicly-held Federal debt.Interest on these securities is credited to the trust fund and, when the securi-ties mature, they are reinvested in new securities if not immediately neededto pay program costs. When securities are redeemed prior to maturity inorder to pay program costs, general fund revenues flow to the trust fund.Thus, the investment operations of the trust fund result in various credits andcash flows between the trust fund and the General Fund of the Treasury.
2. Operations of the DI Trust Fund
The estimated operations and financial status of the DI Trust Fund duringcalendar years 2009-18 under the three sets of assumptions are shown intable IV.A2, together with values for actual experience during 2004-08.Income is generally projected to increase steadily under each alternative,reflecting most of the same factors described previously in connection withthe OASI Trust Fund. DI Trust Fund assets are projected to begin to decreasein 2009 under each alternative. Under the low-cost assumptions, assetswould begin to increase again after reaching a low point in 2012. Under theintermediate assumptions, assets would continue to decline through 2018.Under the high-cost assumptions, DI assets would decline steadily untilexhaustion in 2016.
Cost is estimated to increase in part due to increases in average benefit levelsresulting from (1) automatic benefit increases and (2) projected increases inthe amounts of average monthly earnings on which benefits are based. Inaddition, under all three sets of assumptions, the number of DI beneficiariesin current-payment status is projected to continue increasing throughout theshort-range projection period. Over the period 2008-18, the projected annualaverage growth rate in the number of DI worker beneficiaries is roughly 0.9,2.3, and 3.5 percent under alternatives I, II, and III, respectively. Growth is
Actuarial Estimates
38
largely attributable to the gradual progression of the baby-boom generationthrough ages 50 to normal retirement age, at which ages higher rates of dis-ability incidence are experienced. The estimates under all three sets ofassumptions anticipate additional growth in the numbers of DI worker bene-ficiaries due to a projected sharp, but temporary, increase in incidence ratesto levels comparable to some of the highest ever experienced under the DIprogram. These increases are projected to result from the current economicrecession. The projected higher levels of disability incidence are expected tosubside as the economy recovers, and to return to levels comparable to thoseprojected in last year’s report.1
The proportion of DI beneficiaries whose benefits terminate in a given yearhas also fluctuated in the past. Over the last 20 years, the rates of benefit ter-mination due to death or conversion to retirement benefits (at attainment ofnormal retirement age) have declined very gradually. This trend is attribut-able, in part, to the lower average age of new beneficiaries. Declines in mor-tality for the general population have also led to improved mortalityexperience among the DI disabled-worker beneficiaries. In addition, conver-sions to old-age benefits were at a temporarily reduced level for years 2003through 2008 due to the gradual increase in the normal retirement age. Thetermination rate due to recovery has been much more volatile. Currently, theproportion of disabled beneficiaries whose benefits cease because of theirrecovery from disability is very low in comparison to levels experiencedthroughout the 1970s and early 1980s. Projected rates of recovery termina-tions in this year’s report are temporarily elevated in years 2011-14 due toincreased funding for the purpose of reducing the backlog of continuing dis-ability reviews (CDRs) conducted by SSA. Following this temporaryincrease in CDRs, recovery termination rates are projected to return to levelsconsistent with (1) projected levels of work terminations and (2) the assump-tion that terminations for medical improvement will be consistent with con-tinued timely completion of CDRs after 2014. The overall proportion ofdisabled workers leaving the DI rolls (reflecting all causes) is projected toreturn to higher levels in 2009 when the gradual increase in the normal retire-ment age temporarily ceases.
1 Historical and projected patterns of disability incidence rates are described in greater detail in sectionV.C.6.

39
Short-Range Estimates
Note: Totals do not necessarily equal the sums of rounded components.
Table IV.A2.—Operations of the DI Trust Fund, Calendar Years 2004-18a[Dollar amounts in billions]
a A detailed description of the components of income and cost, along with complete historical values, is pre-sented in Appendix A.
Calendaryear
Income Cost Assets
Totalb
b “Total Income” column includes transfers made between the DI Trust Fund and the General Fund of theTreasury that are not included in the separate components of income shown. These transfers consist of pay-ments for the cost of noncontributory wage credits for military service before 1957. In particular, a transferwas made in December 2007 in the amount of $7.7 million from the General Fund of the Treasury to the DITrust Fund. After 2008 such transfers are estimated to be less than $500,000 in each year.
Netcontri-
butions
Taxa-tion of
benefitsNet
interest Total
Benefitpay-
ments
Admin-istra-
tivecosts
RRBinter-
change
Netincrease
duringyear
Amountat end
of year
Trustfund
ratioc
c The “Trust fund ratio” column represents assets at the beginning of a year (which are identical to assets atthe end of the prior year shown in the “Amount at end of year” column) as a percentage of cost for the year.
Historical data:2004 . . $91.4 $80.3 $1.1 $10.0 $80.6 $78.2 $2.2 $0.2 $10.8 $186.2 2182005 . . 97.4 86.1 1.1 10.3 88.0 85.4 2.3 .3 9.4 195.6 2122006 . . 102.6 90.8 1.2 10.6 94.5 91.7 2.3 .4 8.2 203.8 2072007 . . 109.9 95.2 1.4 13.2 98.8 95.9 2.5 .4 11.1 214.9 2062008 . . 109.8 97.6 1.3 11.0 109.0 106.0 2.5 .4 .9 215.8 197
Intermediate:2009 . . 110.9 98.3 2.2 10.4 120.7 117.7 2.5 .4 -9.8 206.0 1792010 . . 113.9 101.8 2.6 9.5 128.1 125.0 2.6 .5 -14.3 191.7 1612011 . . 118.2 106.8 2.7 8.7 133.1 129.8 2.7 .6 -15.0 176.7 1442012 . . 124.1 113.3 2.9 7.9 138.6 135.1 2.9 .5 -14.5 162.2 1282013 . . 129.7 119.3 3.3 7.1 143.9 140.2 3.1 .5 -14.2 148.1 113
2014 . . 135.0 125.2 3.5 6.3 150.6 146.8 3.3 .5 -15.6 132.5 982015 . . 140.5 131.2 3.8 5.4 157.8 153.8 3.5 .5 -17.4 115.1 842016 . . 145.6 137.0 4.1 4.6 165.5 161.3 3.7 .5 -19.9 95.2 702017 . . 151.1 143.0 4.4 3.7 173.6 169.2 3.9 .5 -22.5 72.7 552018 . . 156.5 149.1 4.7 2.6 182.0 177.4 4.1 .5 -25.5 47.2 40
Low-cost:2009 . . 111.5 98.8 2.2 10.4 118.5 115.5 2.5 .4 -7.0 208.8 1822010 . . 115.8 103.5 2.5 9.8 123.6 120.5 2.6 .5 -7.8 201.0 1692011 . . 120.3 108.4 2.6 9.4 126.4 123.1 2.7 .6 -6.2 194.8 1592012 . . 125.4 113.7 2.7 9.1 128.0 124.5 2.9 .5 -2.6 192.2 1522013 . . 132.9 120.9 2.9 9.1 129.5 125.9 3.1 .5 3.4 195.7 148
2014 . . 138.8 126.3 3.1 9.3 132.7 128.9 3.3 .5 6.1 201.7 1472015 . . 144.7 131.8 3.3 9.6 136.6 132.7 3.5 .5 8.1 209.8 1482016 . . 150.9 137.3 3.5 10.1 141.0 136.9 3.6 .5 9.9 219.7 1492017 . . 157.5 143.0 3.7 10.8 145.4 141.2 3.8 .4 12.1 231.8 1512018 . . 164.6 149.0 3.9 11.7 149.9 145.5 4.0 .4 14.6 246.4 155
High-cost:2009 . . 110.7 98.1 2.2 10.3 122.9 119.9 2.5 .4 -12.2 203.6 1762010 . . 113.0 101.0 2.7 9.3 132.5 129.4 2.6 .5 -19.5 184.1 1542011 . . 117.6 106.6 2.8 8.2 139.6 136.3 2.7 .6 -21.9 162.2 1322012 . . 121.1 111.0 3.1 6.9 149.0 145.5 2.9 .5 -27.9 134.3 1092013 . . 125.8 117.0 3.7 5.2 160.4 156.7 3.2 .5 -34.6 99.7 84
2014 . . 132.7 125.1 4.1 3.5 175.3 171.3 3.5 .6 -42.6 57.1 572015 . . 139.4 133.5 4.6 1.4 189.9 185.6 3.7 .6 -50.4 6.7 302016 . . d
d Under the high-cost assumptions, the DI Trust Fund is projected to be exhausted in 2016. Therefore, certaintrust fund operation values for 2016 to 2018 are not meaningful under present law and are not shown in thistable.
141.4 5.0 d 202.6 198.0 4.0 .6 d d 32017 . . d 148.9 5.5 d 214.5 209.7 4.2 .6 d d d
2018 . . d 155.9 5.9 d 227.3 222.3 4.4 .6 d d d
Actuarial Estimates
40
At the beginning of calendar year 2008, the assets of the DI Trust Fund rep-resented 197 percent of annual expenditures. During 2008, DI expenditurescontinued to exceed noninterest income. Although total DI income exceededDI expenditures by $0.9 billion, the trust fund ratio for the beginning of 2009still decreased, to about 179 percent. Under the intermediate set of assump-tions, expenditures are estimated to exceed total income from 2009 through2018. The projected expenditures in excess of income result in a decline inthe projected trust fund ratio to 40 percent by the beginning of 2018.
Under the low-cost assumptions, the trust fund ratio would decrease to a lowof 147 percent at the beginning of 2014, before increasing to 155 percent atthe beginning of 2018. Under the high-cost assumptions, the assets of the DITrust Fund would decline steadily, dipping below the level of 1 year’s expen-ditures during 2012, and becoming completely depleted in 2016.
Assets of the DI Trust Fund were greater than 1 year’s expenditures at thebeginning of 2009. By the beginning of 2014, however, the trust fund ratio isprojected to decline to 98 percent. Accordingly, the DI Trust Fund does notsatisfy the Trustees’ short-range test of financial adequacy under both theintermediate and high-cost assumptions. However, under the low-costassumptions the DI Trust Fund does meet the short-range test of financialadequacy, because assets remain above 1 year’s expenditures through the endof the short-range period, as described above (see also figure IV.A1).
3. Operations of the Combined OASI and DI Trust Funds
The estimated operations and status of the OASI and DI Trust Funds, com-bined, during calendar years 2009-18 on the basis of the three alternatives,are shown in table IV.A3, together with figures on actual experience in2004-08. Because income and cost for the OASI Trust Fund represent over80 percent of the corresponding amounts for the combined OASI and DITrust Funds, the operations of the OASI Trust Fund tend to dominate thecombined operations of the two funds. Consequently, based on the strengthof the OASI Trust Fund over the next 10 years, the combined OASI and DITrust Funds meet the requirements of the short-range test of financial ade-quacy under all three alternative sets of assumptions.
While combining the operations of the OASI and DI Trust Funds permits anassessment of the short-range test for the two programs on a combined basis,in practice assets from one trust fund cannot be shared with another trustfund without legislative changes to the Social Security Act. For example,under the high-cost scenario, table IV.A2 shows that the DI Trust Fundbecomes exhausted in 2016. The value of the combined OASI and DI TrustFunds in that year shown in table IV.A3 shows that OASI assets could bemade available to pay DI benefits through 2018, but only with legislation topermit this action.
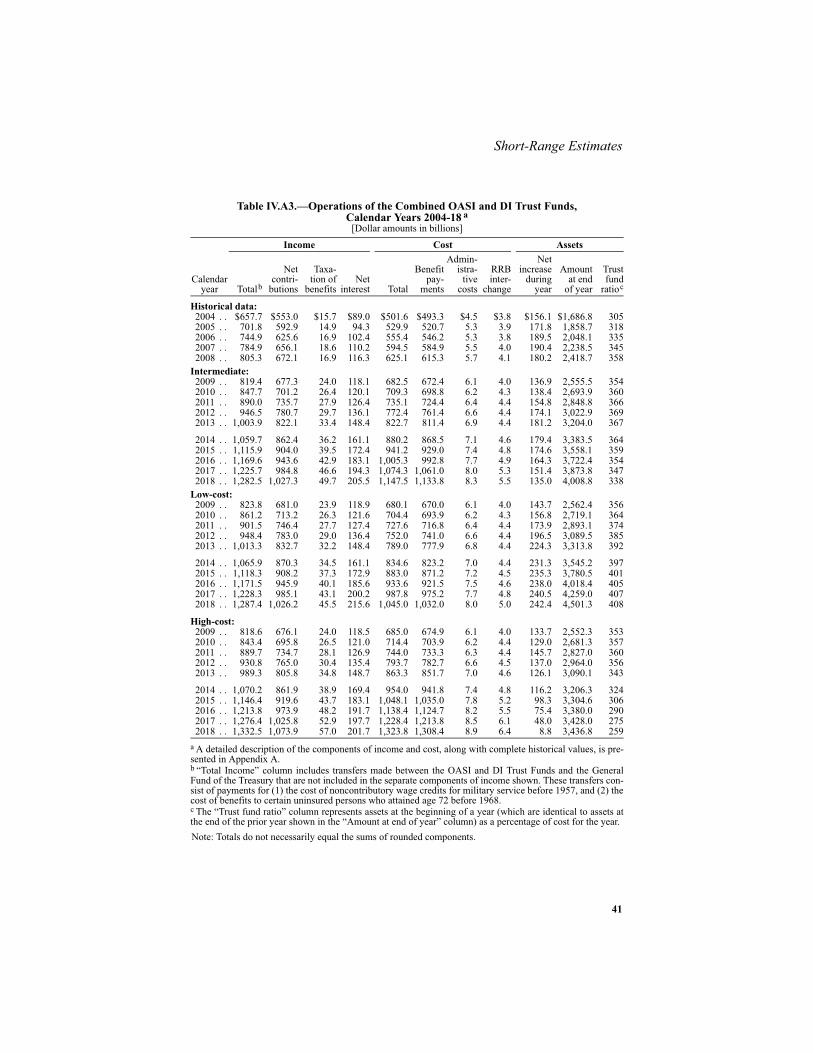
41
Short-Range Estimates
Note: Totals do not necessarily equal the sums of rounded components.
Table IV.A3.—Operations of the Combined OASI and DI Trust Funds,Calendar Years 2004-18 a
[Dollar amounts in billions]
a A detailed description of the components of income and cost, along with complete historical values, is pre-sented in Appendix A.
Calendaryear
Income Cost Assets
Totalb
b “Total Income” column includes transfers made between the OASI and DI Trust Funds and the GeneralFund of the Treasury that are not included in the separate components of income shown. These transfers con-sist of payments for (1) the cost of noncontributory wage credits for military service before 1957, and (2) thecost of benefits to certain uninsured persons who attained age 72 before 1968.
Netcontri-
butions
Taxa-tion of
benefitsNet
interest Total
Benefitpay-
ments
Admin-istra-
tivecosts
RRBinter-
change
Netincrease
duringyear
Amountat end
of year
Trustfund
ratioc
c The “Trust fund ratio” column represents assets at the beginning of a year (which are identical to assets atthe end of the prior year shown in the “Amount at end of year” column) as a percentage of cost for the year.
Historical data:2004 . . $657.7 $553.0 $15.7 $89.0 $501.6 $493.3 $4.5 $3.8 $156.1 $1,686.8 3052005 . . 701.8 592.9 14.9 94.3 529.9 520.7 5.3 3.9 171.8 1,858.7 3182006 . . 744.9 625.6 16.9 102.4 555.4 546.2 5.3 3.8 189.5 2,048.1 3352007 . . 784.9 656.1 18.6 110.2 594.5 584.9 5.5 4.0 190.4 2,238.5 3452008 . . 805.3 672.1 16.9 116.3 625.1 615.3 5.7 4.1 180.2 2,418.7 358
Intermediate:2009 . . 819.4 677.3 24.0 118.1 682.5 672.4 6.1 4.0 136.9 2,555.5 3542010 . . 847.7 701.2 26.4 120.1 709.3 698.8 6.2 4.3 138.4 2,693.9 3602011 . . 890.0 735.7 27.9 126.4 735.1 724.4 6.4 4.4 154.8 2,848.8 3662012 . . 946.5 780.7 29.7 136.1 772.4 761.4 6.6 4.4 174.1 3,022.9 3692013 . . 1,003.9 822.1 33.4 148.4 822.7 811.4 6.9 4.4 181.2 3,204.0 367
2014 . . 1,059.7 862.4 36.2 161.1 880.2 868.5 7.1 4.6 179.4 3,383.5 3642015 . . 1,115.9 904.0 39.5 172.4 941.2 929.0 7.4 4.8 174.6 3,558.1 3592016 . . 1,169.6 943.6 42.9 183.1 1,005.3 992.8 7.7 4.9 164.3 3,722.4 3542017 . . 1,225.7 984.8 46.6 194.3 1,074.3 1,061.0 8.0 5.3 151.4 3,873.8 3472018 . . 1,282.5 1,027.3 49.7 205.5 1,147.5 1,133.8 8.3 5.5 135.0 4,008.8 338
Low-cost:2009 . . 823.8 681.0 23.9 118.9 680.1 670.0 6.1 4.0 143.7 2,562.4 3562010 . . 861.2 713.2 26.3 121.6 704.4 693.9 6.2 4.3 156.8 2,719.1 3642011 . . 901.5 746.4 27.7 127.4 727.6 716.8 6.4 4.4 173.9 2,893.1 3742012 . . 948.4 783.0 29.0 136.4 752.0 741.0 6.6 4.4 196.5 3,089.5 3852013 . . 1,013.3 832.7 32.2 148.4 789.0 777.9 6.8 4.4 224.3 3,313.8 392
2014 . . 1,065.9 870.3 34.5 161.1 834.6 823.2 7.0 4.4 231.3 3,545.2 3972015 . . 1,118.3 908.2 37.3 172.9 883.0 871.2 7.2 4.5 235.3 3,780.5 4012016 . . 1,171.5 945.9 40.1 185.6 933.6 921.5 7.5 4.6 238.0 4,018.4 4052017 . . 1,228.3 985.1 43.1 200.2 987.8 975.2 7.7 4.8 240.5 4,259.0 4072018 . . 1,287.4 1,026.2 45.5 215.6 1,045.0 1,032.0 8.0 5.0 242.4 4,501.3 408
High-cost:2009 . . 818.6 676.1 24.0 118.5 685.0 674.9 6.1 4.0 133.7 2,552.3 3532010 . . 843.4 695.8 26.5 121.0 714.4 703.9 6.2 4.4 129.0 2,681.3 3572011 . . 889.7 734.7 28.1 126.9 744.0 733.3 6.3 4.4 145.7 2,827.0 3602012 . . 930.8 765.0 30.4 135.4 793.7 782.7 6.6 4.5 137.0 2,964.0 3562013 . . 989.3 805.8 34.8 148.7 863.3 851.7 7.0 4.6 126.1 3,090.1 343
2014 . . 1,070.2 861.9 38.9 169.4 954.0 941.8 7.4 4.8 116.2 3,206.3 3242015 . . 1,146.4 919.6 43.7 183.1 1,048.1 1,035.0 7.8 5.2 98.3 3,304.6 3062016 . . 1,213.8 973.9 48.2 191.7 1,138.4 1,124.7 8.2 5.5 75.4 3,380.0 2902017 . . 1,276.4 1,025.8 52.9 197.7 1,228.4 1,213.8 8.5 6.1 48.0 3,428.0 2752018 . . 1,332.5 1,073.9 57.0 201.7 1,323.8 1,308.4 8.9 6.4 8.8 3,436.8 259

Actuarial Estimates
42
4. Factors Underlying Changes in 10-Year Trust Fund Ratio EstimatesFrom the 2008 Report
The factors underlying the changes in the intermediate estimates for theOASI, DI and the combined funds from last year’s annual report to thisreport are analyzed in table IV.A4. In the 2008 Annual Report, the trust fundratio for OASI was estimated to reach 438 percent at the beginning of2017—the tenth projection year from that report. If there had been nochanges to the projections, the estimated ratio at the beginning of 2018would be 7 percentage points lower than at the beginning of 2017, or431 percent. There were changes, however, to reflect the latest actual data, aswell as adjustments to the assumptions for future years and the projectionmethods. The resulting ratio shown in this report for the tenth projection year(2018) is 394 percent. The net effect of changes in demographic assumptionsover the short-range period resulted in a reduction in the tenth-year trust fundratio of 2 percentage points. The cumulative net effects of changes in eco-nomic data and assumptions resulted in a reduction in the trust fund ratio of26 percentage points by the beginning of 2018. The change due to economicassumptions reflects the effects of the economic recession that started inDecember 2007 on revenue and benefit levels. There were several relativelyminor changes in the short-range projection methodology since the 2008report. The changes included improvements in the methods for estimatingthe numbers of beneficiaries and average benefit amounts at the end of eachquarter, given numbers and average amounts at the end of each calendar year.The combined effect of the various methodological improvements was toincrease the ending trust fund ratio by about 2 percentage points. Finally, adecrease in the 2018 trust fund ratio of 12 percentage points resulted fromthe combined effects of incorporating recent programmatic data includingthe further correction of the trust fund allocation error described in sectionIII.A.
Corresponding estimates of the factors underlying the changes in the finan-cial projections for the DI Trust Fund, and for the OASI and DI Trust Fundscombined, are also shown in table IV.A4. The largest effects on the DI trustfund ratio at the beginning of 2018 are due to the revised economic assump-tions and updates for programmatic data and assumptions. In particular, tem-porary increases in disability incidence rates related to the current recessionmake up about 20 percentage points of the 31 percentage point reductionattributable to programmatic assumptions. The change in the valuationperiod accounts for the remainder of the total change in the DI trust fundratio.
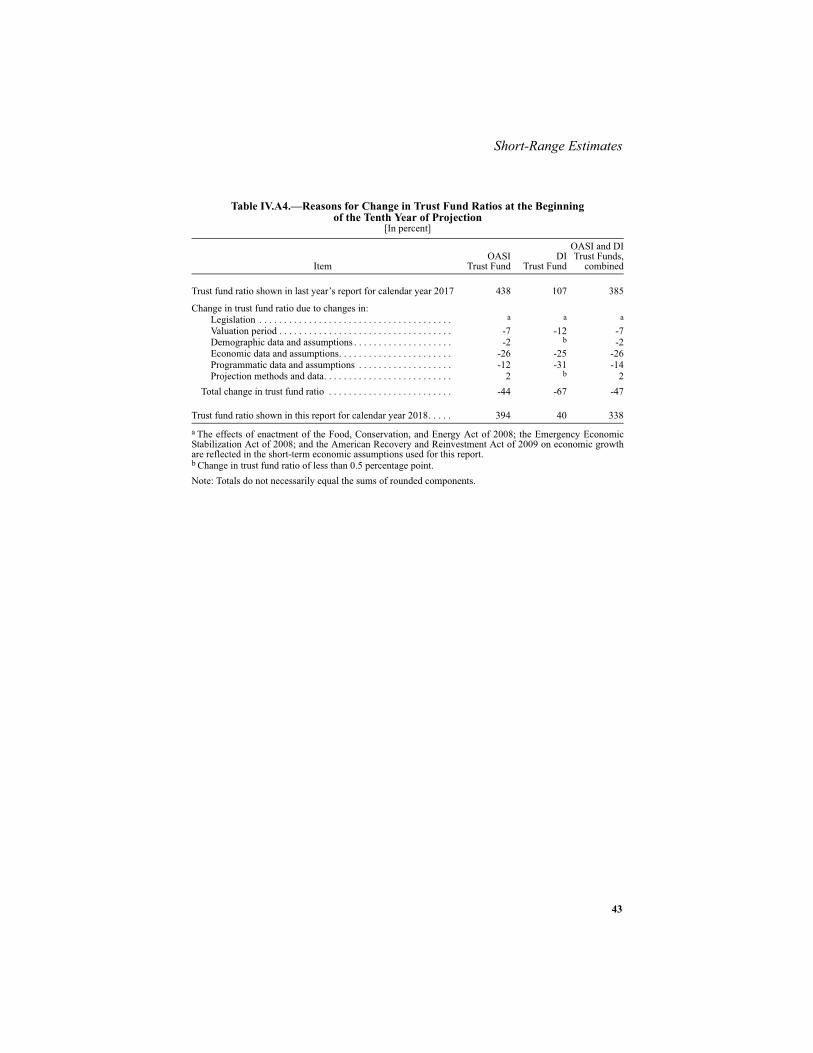
43
Short-Range Estimates
Note: Totals do not necessarily equal the sums of rounded components.
Table IV.A4.—Reasons for Change in Trust Fund Ratios at the Beginning of the Tenth Year of Projection
[In percent]
ItemOASI
Trust FundDI
Trust Fund
OASI and DITrust Funds,
combined
Trust fund ratio shown in last year’s report for calendar year 2017 438 107 385
Change in trust fund ratio due to changes in: Legislation . . . . . . . . . . . . . . . . . . . . . . . . . . . . . . . . . . . . . . . a
a The effects of enactment of the Food, Conservation, and Energy Act of 2008; the Emergency EconomicStabilization Act of 2008; and the American Recovery and Reinvestment Act of 2009 on economic growthare reflected in the short-term economic assumptions used for this report.
a a
Valuation period . . . . . . . . . . . . . . . . . . . . . . . . . . . . . . . . . . . -7 -12 -7Demographic data and assumptions . . . . . . . . . . . . . . . . . . . . -2 b
b Change in trust fund ratio of less than 0.5 percentage point.
-2Economic data and assumptions. . . . . . . . . . . . . . . . . . . . . . . -26 -25 -26Programmatic data and assumptions . . . . . . . . . . . . . . . . . . . -12 -31 -14Projection methods and data. . . . . . . . . . . . . . . . . . . . . . . . . . 2 b 2
Total change in trust fund ratio . . . . . . . . . . . . . . . . . . . . . . . . . -44 -67 -47
Trust fund ratio shown in this report for calendar year 2018. . . . . 394 40 338

Actuarial Estimates
44
B. LONG-RANGE ESTIMATES
Three types of financial measures are useful in assessing the actuarial statusof the Social Security trust funds under the financing approach specified incurrent law: (1) annual cash-flow measures, including income and cost rates,and balances; (2) trust fund ratios; and (3) summary measures like actuarialbalances and unfunded obligations. The first long-range estimates presentedare the series of projected annual balances (or net cash flow), which are thedifferences between the projected annual income rates and annual cost rates(expressed as percentages of the taxable payroll). In assessing the financialcondition of the program, particular attention should be paid to the level ofthe annual balances at the end of the long-range period and the time at whichthe annual balances may change from positive to negative values.
The next measure discussed is the pattern of projected trust fund ratios. Thetrust fund ratio represents the proportion of a year’s projected cost that couldbe paid with the funds available at the beginning of the year. Particular atten-tion should be paid to the level and year of maximum trust fund ratio, to theyear of exhaustion of the funds, and to the stability of the trust fund ratio incases where the ratio remains positive at the end of the long-range period.When a program has positive trust fund ratios throughout the 75-year projec-tion period and these ratios are stable or rising at the end of the period, theprogram financing is said to achieve sustainable solvency.
The final measures discussed in this section summarize the total income andcost over valuation periods that extend through 75 years, and to the infinitehorizon. These measures indicate whether projected income will be adequatefor the period as a whole. The first such measure, actuarial balance, indicatesthe size of any surplus or shortfall as a percentage of the taxable payroll overthe period. The second, open group unfunded obligation, indicates the size ofany shortfall in present-value dollars. This section also includes a compari-son of covered workers to beneficiaries, a generational decomposition of theinfinite future unfunded obligation, the test of long-range close actuarial bal-ance, and the reasons for change in the actuarial balance from the last report.
If the 75-year actuarial balance is zero (or positive), then the trust fund ratioat the end of the period will be at 100 percent (or greater), and financing forthe program is considered to be adequate for the 75-year period as a whole.Financial adequacy, or solvency, for each year is determined by whether thetrust fund asset level is positive throughout the year. Whether or not financialadequacy is stable in the sense that it is likely to continue for subsequent 75-year periods in succeeding reports is also important when considering theactuarial status of the program. One indication of this stability, or sustainablesolvency, is the behavior of the trust fund ratio at the end of the projection
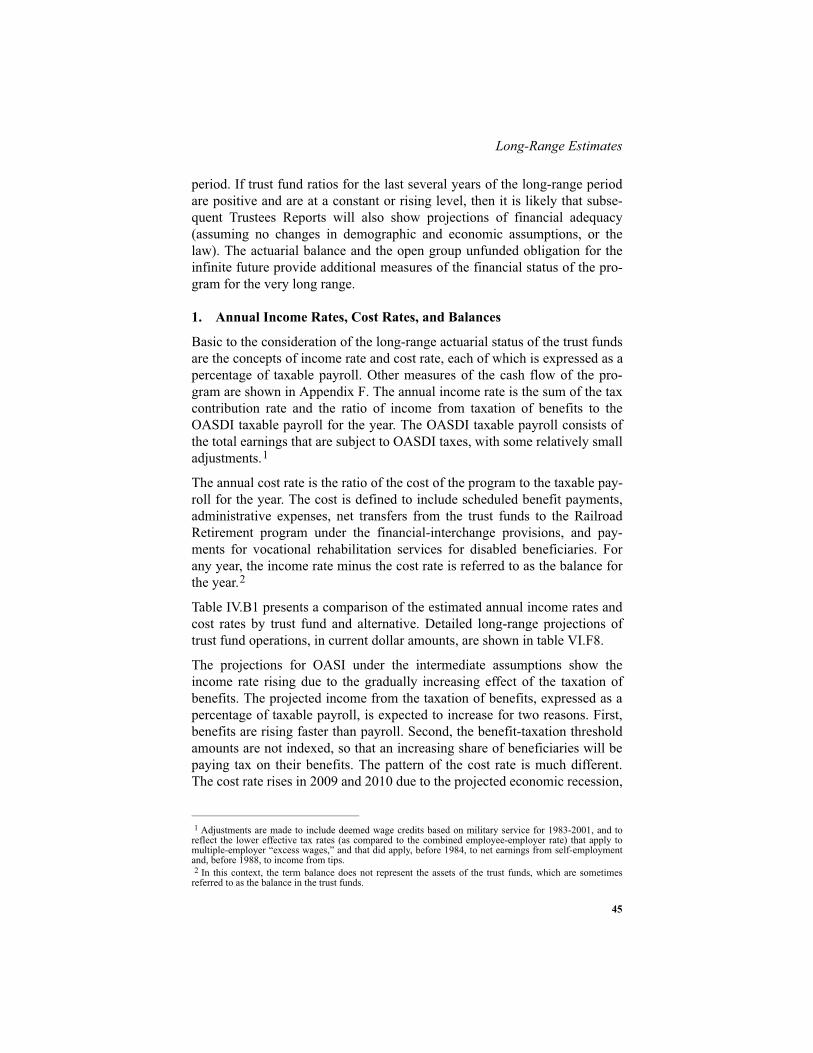
45
Long-Range Estimates
period. If trust fund ratios for the last several years of the long-range periodare positive and are at a constant or rising level, then it is likely that subse-quent Trustees Reports will also show projections of financial adequacy(assuming no changes in demographic and economic assumptions, or thelaw). The actuarial balance and the open group unfunded obligation for theinfinite future provide additional measures of the financial status of the pro-gram for the very long range.
1. Annual Income Rates, Cost Rates, and Balances
Basic to the consideration of the long-range actuarial status of the trust fundsare the concepts of income rate and cost rate, each of which is expressed as apercentage of taxable payroll. Other measures of the cash flow of the pro-gram are shown in Appendix F. The annual income rate is the sum of the taxcontribution rate and the ratio of income from taxation of benefits to theOASDI taxable payroll for the year. The OASDI taxable payroll consists ofthe total earnings that are subject to OASDI taxes, with some relatively smalladjustments.1
The annual cost rate is the ratio of the cost of the program to the taxable pay-roll for the year. The cost is defined to include scheduled benefit payments,administrative expenses, net transfers from the trust funds to the RailroadRetirement program under the financial-interchange provisions, and pay-ments for vocational rehabilitation services for disabled beneficiaries. Forany year, the income rate minus the cost rate is referred to as the balance forthe year.2
Table IV.B1 presents a comparison of the estimated annual income rates andcost rates by trust fund and alternative. Detailed long-range projections oftrust fund operations, in current dollar amounts, are shown in table VI.F8.
The projections for OASI under the intermediate assumptions show theincome rate rising due to the gradually increasing effect of the taxation ofbenefits. The projected income from the taxation of benefits, expressed as apercentage of taxable payroll, is expected to increase for two reasons. First,benefits are rising faster than payroll. Second, the benefit-taxation thresholdamounts are not indexed, so that an increasing share of beneficiaries will bepaying tax on their benefits. The pattern of the cost rate is much different.The cost rate rises in 2009 and 2010 due to the projected economic recession,
1 Adjustments are made to include deemed wage credits based on military service for 1983-2001, and toreflect the lower effective tax rates (as compared to the combined employee-employer rate) that apply tomultiple-employer “excess wages,” and that did apply, before 1984, to net earnings from self-employmentand, before 1988, to income from tips. 2 In this context, the term balance does not represent the assets of the trust funds, which are sometimesreferred to as the balance in the trust funds.

Actuarial Estimates
46
and then comes back down through 2012 due to the recovery. From about2012 to 2030, the cost rate rises rapidly because the retirement of the baby-boom generation will cause the number of beneficiaries to rise much fasterthan the labor force. After 2030, the cost rate remains fairly stable for about30 years because the number of workers and beneficiaries are projected torise at the same rate. Thereafter, the cost rate rises slowly, reflecting pro-jected reductions in death rates and continued relatively low birth rates. Thecost rate reaches 15.35 percent of taxable payroll for 2083. By comparison,the income rate reaches 11.48 percent of taxable payroll for 2083.
Projected income rates under the low-cost and high-cost sets of assumptionsare very similar to those projected for the intermediate assumptions becausethey are largely a reflection of the tax rates specified in the law. OASI costrates for the low-cost and high-cost assumptions differ significantly fromthose projected for the intermediate assumptions. For the low-cost assump-tions, the cost rate decreases from 2010 through 2013, then rises, until itpeaks in 2033 at a level of 13.01 percent of payroll. The cost rate then gener-ally declines gradually, reaching a level of 10.92 percent of payroll for 2083(at which point the income rate reaches 11.22 percent). For the high-costassumptions, the cost rate rises from 2011 through the end of the 75-yearperiod. It rises at a relatively fast pace between 2011 and 2030 because of theaging of the baby-boom generation. Subsequently, the projected cost ratecontinues rising and reaches 22.41 percent of payroll for 2083 (at whichpoint the income rate reaches 11.88 percent).
The pattern of the projected OASI annual balance is important in the analysisof the financial condition of the program. Under the intermediate assump-tions, the annual balance is positive for 8 years (through 2016) and is nega-tive thereafter. This annual deficit rises rapidly, reaching 2 percent of taxablepayroll by 2024, and continues rising generally thereafter, to a level of3.87 percent of taxable payroll for 2083.
Under the low-cost assumptions, the projected OASI annual balance is posi-tive for 11 years (through 2019) and then becomes negative, with the annualdeficit peaking at 1.74 percent of taxable payroll for 2033. Then, the annualdeficit declines until 2065, when the OASI annual balance becomes positive,reaching a surplus of 0.30 percent of payroll in 2083. Under the high-costassumptions, in contrast, the OASI balance is projected to be positive foronly 5 years (through 2013) and to be negative thereafter, with a deficit of2.19 percent for 2020, 6.30 percent for 2050, and 10.53 percent of payroll for2083.
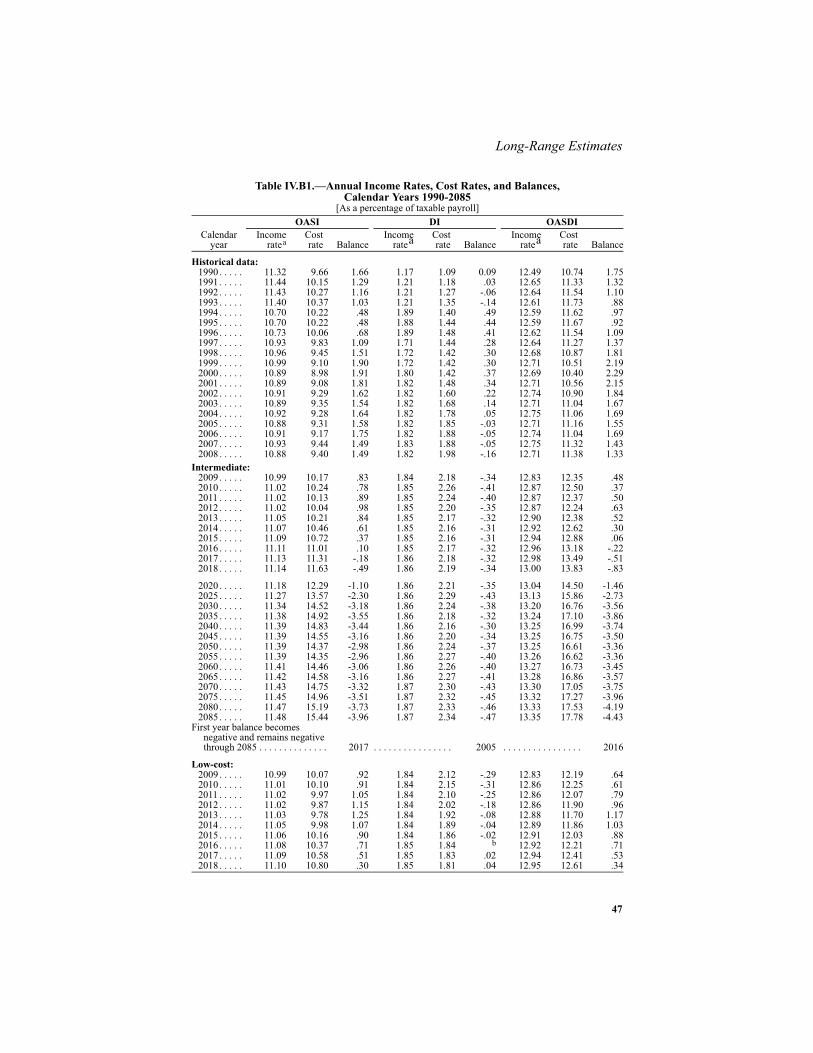
47
Long-Range Estimates
Table IV.B1.—Annual Income Rates, Cost Rates, and Balances,Calendar Years 1990-2085
[As a percentage of taxable payroll]
Calendar year
OASI DI OASDIIncome
rateaCostrate Balance
Incomeratea Cost
rate BalanceIncome
ratea Costrate Balance
Historical data:1990 . . . . . 11.32 9.66 1.66 1.17 1.09 0.09 12.49 10.74 1.751991 . . . . . 11.44 10.15 1.29 1.21 1.18 .03 12.65 11.33 1.321992 . . . . . 11.43 10.27 1.16 1.21 1.27 -.06 12.64 11.54 1.101993 . . . . . 11.40 10.37 1.03 1.21 1.35 -.14 12.61 11.73 .881994 . . . . . 10.70 10.22 .48 1.89 1.40 .49 12.59 11.62 .971995 . . . . . 10.70 10.22 .48 1.88 1.44 .44 12.59 11.67 .921996 . . . . . 10.73 10.06 .68 1.89 1.48 .41 12.62 11.54 1.091997 . . . . . 10.93 9.83 1.09 1.71 1.44 .28 12.64 11.27 1.371998 . . . . . 10.96 9.45 1.51 1.72 1.42 .30 12.68 10.87 1.811999 . . . . . 10.99 9.10 1.90 1.72 1.42 .30 12.71 10.51 2.192000 . . . . . 10.89 8.98 1.91 1.80 1.42 .37 12.69 10.40 2.292001 . . . . . 10.89 9.08 1.81 1.82 1.48 .34 12.71 10.56 2.152002 . . . . . 10.91 9.29 1.62 1.82 1.60 .22 12.74 10.90 1.842003 . . . . . 10.89 9.35 1.54 1.82 1.68 .14 12.71 11.04 1.672004 . . . . . 10.92 9.28 1.64 1.82 1.78 .05 12.75 11.06 1.692005 . . . . . 10.88 9.31 1.58 1.82 1.85 -.03 12.71 11.16 1.552006 . . . . . 10.91 9.17 1.75 1.82 1.88 -.05 12.74 11.04 1.692007 . . . . . 10.93 9.44 1.49 1.83 1.88 -.05 12.75 11.32 1.432008 . . . . . 10.88 9.40 1.49 1.82 1.98 -.16 12.71 11.38 1.33
Intermediate:2009 . . . . . 10.99 10.17 .83 1.84 2.18 -.34 12.83 12.35 .482010 . . . . . 11.02 10.24 .78 1.85 2.26 -.41 12.87 12.50 .372011 . . . . . 11.02 10.13 .89 1.85 2.24 -.40 12.87 12.37 .502012 . . . . . 11.02 10.04 .98 1.85 2.20 -.35 12.87 12.24 .632013 . . . . . 11.05 10.21 .84 1.85 2.17 -.32 12.90 12.38 .522014 . . . . . 11.07 10.46 .61 1.85 2.16 -.31 12.92 12.62 .302015 . . . . . 11.09 10.72 .37 1.85 2.16 -.31 12.94 12.88 .062016 . . . . . 11.11 11.01 .10 1.85 2.17 -.32 12.96 13.18 -.222017 . . . . . 11.13 11.31 -.18 1.86 2.18 -.32 12.98 13.49 -.512018 . . . . . 11.14 11.63 -.49 1.86 2.19 -.34 13.00 13.83 -.83
2020 . . . . . 11.18 12.29 -1.10 1.86 2.21 -.35 13.04 14.50 -1.462025 . . . . . 11.27 13.57 -2.30 1.86 2.29 -.43 13.13 15.86 -2.732030 . . . . . 11.34 14.52 -3.18 1.86 2.24 -.38 13.20 16.76 -3.562035 . . . . . 11.38 14.92 -3.55 1.86 2.18 -.32 13.24 17.10 -3.862040 . . . . . 11.39 14.83 -3.44 1.86 2.16 -.30 13.25 16.99 -3.742045 . . . . . 11.39 14.55 -3.16 1.86 2.20 -.34 13.25 16.75 -3.502050 . . . . . 11.39 14.37 -2.98 1.86 2.24 -.37 13.25 16.61 -3.362055 . . . . . 11.39 14.35 -2.96 1.86 2.27 -.40 13.26 16.62 -3.362060 . . . . . 11.41 14.46 -3.06 1.86 2.26 -.40 13.27 16.73 -3.452065 . . . . . 11.42 14.58 -3.16 1.86 2.27 -.41 13.28 16.86 -3.572070 . . . . . 11.43 14.75 -3.32 1.87 2.30 -.43 13.30 17.05 -3.752075 . . . . . 11.45 14.96 -3.51 1.87 2.32 -.45 13.32 17.27 -3.962080 . . . . . 11.47 15.19 -3.73 1.87 2.33 -.46 13.33 17.53 -4.192085 . . . . . 11.48 15.44 -3.96 1.87 2.34 -.47 13.35 17.78 -4.43
First year balance becomesnegative and remains negativethrough 2085 . . . . . . . . . . . . . . 2017 . . . . . . . . . . . . . . . . 2005 . . . . . . . . . . . . . . . . 2016
Low-cost:2009 . . . . . 10.99 10.07 .92 1.84 2.12 -.29 12.83 12.19 .642010 . . . . . 11.01 10.10 .91 1.84 2.15 -.31 12.86 12.25 .612011 . . . . . 11.02 9.97 1.05 1.84 2.10 -.25 12.86 12.07 .792012 . . . . . 11.02 9.87 1.15 1.84 2.02 -.18 12.86 11.90 .962013 . . . . . 11.03 9.78 1.25 1.84 1.92 -.08 12.88 11.70 1.172014 . . . . . 11.05 9.98 1.07 1.84 1.89 -.04 12.89 11.86 1.032015 . . . . . 11.06 10.16 .90 1.84 1.86 -.02 12.91 12.03 .882016 . . . . . 11.08 10.37 .71 1.85 1.84 b 12.92 12.21 .712017 . . . . . 11.09 10.58 .51 1.85 1.83 .02 12.94 12.41 .532018 . . . . . 11.10 10.80 .30 1.85 1.81 .04 12.95 12.61 .34

Actuarial Estimates
48
Notes:1. The income rate excludes interest income and certain transfers from the General Fund of the Treasury.2. Some historical values are subject to change due to revisions of taxable payroll.3. Totals do not necessarily equal the sums of rounded components.
Low-cost (cont.):2020 . . . . . 11.14 11.30 -0.16 1.85 1.79 0.06 12.98 13.09 -0.112025 . . . . . 11.20 12.25 -1.04 1.85 1.80 .05 13.05 14.04 -1.002030 . . . . . 11.25 12.88 -1.63 1.85 1.71 .14 13.10 14.59 -1.492035 . . . . . 11.27 12.98 -1.71 1.84 1.61 .23 13.12 14.60 -1.482040 . . . . . 11.27 12.64 -1.37 1.84 1.57 .28 13.11 14.20 -1.092045 . . . . . 11.25 12.15 -.90 1.84 1.57 .28 13.09 13.71 -.622050 . . . . . 11.24 11.77 -.53 1.84 1.56 .28 13.08 13.34 -.252055 . . . . . 11.23 11.54 -.30 1.84 1.56 .29 13.08 13.10 -.022060 . . . . . 11.23 11.40 -.17 1.84 1.54 .31 13.08 12.93 .142065 . . . . . 11.23 11.23 b 1.84 1.53 .31 13.07 12.76 .322070 . . . . . 11.22 11.06 .16 1.84 1.53 .31 13.07 12.60 .472075 . . . . . 11.22 10.94 .28 1.84 1.55 .30 13.06 12.49 .582080 . . . . . 11.22 10.90 .32 1.84 1.56 .28 13.06 12.46 .602085 . . . . . 11.22 10.94 .28 1.84 1.57 .27 13.07 12.51 .55
First year balance becomesnegative and remains negativethrough 2085 . . . . . . . . . . . . . . c . . . . . . . . . . . . . . . . c . . . . . . . . . . . . . . . . c
High-cost:2009 . . . . . 10.99 10.20 .79 1.84 2.23 -.39 12.84 12.43 .412010 . . . . . 11.02 10.32 .70 1.85 2.35 -.50 12.87 12.67 .202011 . . . . . 11.03 10.18 .85 1.85 2.35 -.50 12.87 12.53 .342012 . . . . . 11.04 10.44 .60 1.85 2.41 -.56 12.89 12.85 .042013 . . . . . 11.08 10.78 .30 1.86 2.46 -.60 12.93 13.24 -.302014 . . . . . 11.10 11.17 -.07 1.86 2.51 -.66 12.96 13.68 -.722015 . . . . . 11.13 11.53 -.41 1.86 2.55 -.69 12.99 14.09 -1.102016 . . . . . 11.15 11.88 -.73 1.86 2.57 -.71 13.01 14.45 -1.442017 . . . . . 11.17 12.22 -1.05 1.87 2.59 -.72 13.04 14.81 -1.772018 . . . . . 11.19 12.64 -1.45 1.87 2.62 -.75 13.06 15.25 -2.20
2020 . . . . . 11.24 13.43 -2.19 1.87 2.68 -.81 13.11 16.10 -2.992025 . . . . . 11.35 15.07 -3.73 1.88 2.83 -.96 13.22 17.91 -4.682030 . . . . . 11.44 16.41 -4.97 1.88 2.81 -.94 13.32 19.23 -5.912035 . . . . . 11.51 17.26 -5.75 1.88 2.80 -.92 13.38 20.06 -6.672040 . . . . . 11.54 17.60 -6.05 1.88 2.82 -.94 13.42 20.42 -7.002045 . . . . . 11.56 17.69 -6.13 1.88 2.93 -1.05 13.45 20.62 -7.172050 . . . . . 11.59 17.89 -6.30 1.89 3.03 -1.14 13.47 20.91 -7.442055 . . . . . 11.62 18.25 -6.63 1.89 3.12 -1.23 13.50 21.37 -7.862060 . . . . . 11.66 18.81 -7.16 1.89 3.16 -1.27 13.55 21.97 -8.432065 . . . . . 11.70 19.45 -7.75 1.89 3.21 -1.32 13.59 22.66 -9.072070 . . . . . 11.75 20.22 -8.47 1.89 3.27 -1.37 13.64 23.49 -9.852075 . . . . . 11.80 21.09 -9.29 1.89 3.29 -1.39 13.70 24.38 -10.692080 . . . . . 11.85 21.94 -10.09 1.89 3.29 -1.40 13.75 25.23 -11.492085 . . . . . 11.90 22.69 -10.79 1.89 3.28 -1.39 13.79 25.97 -12.17
First year balance becomesnegative and remains negativethrough 2085 . . . . . . . . . . . . . . 2014 . . . . . . . . . . . . . . . . 2005 . . . . . . . . . . . . . . . . 2013
a Historical income rates are modified to include adjustments to the lump-sum payments received in 1983from the General Fund of the Treasury for the cost of noncontributory wage credits for military service in1940-56.b Between -0.005 and 0.005 percent of taxable payroll.c The annual balance is projected to be negative for a temporary period, returning to positive levels beforethe end of the projection period.
Table IV.B1.—Annual Income Rates, Cost Rates, and Balances,Calendar Years 1990-2085 (Cont.)
[As a percentage of taxable payroll]
Calendar year
OASI DI OASDIIncome
rateaCostrate Balance
Incomeratea Cost
rate BalanceIncome
ratea Costrate Balance

49
Long-Range Estimates
Under the intermediate assumptions, the cost rate for DI fluctuates between2.15 and 2.30 percent of taxable payroll from 2009 to 2034, generallyincreasing thereafter to 2.34 percent for 2083. The income rate increasesonly very slightly from 1.84 percent of taxable payroll for 2009 to1.87 percent for 2083. The annual deficit is about 0.34 percent in 2009 andreaches 0.47 percent for 2083.
Under the low-cost assumptions, the DI cost rate peaks at 2.15 percent ofpayroll for 2010, then generally declines slowly thereafter, reaching1.57 percent for 2083. The annual balance is negative for the first 7 years andis positive throughout the remainder of the long-range period. For the high-cost assumptions, DI cost rises much more, reaching 3.29 percent for 2083.The annual deficit is about 0.39 percent in 2009 and reaches 1.39 percent for2083.
Figure IV.B1 shows in graphical form the patterns of the OASI and DIannual income rates and cost rates. The income rates shown here are only foralternative II in order to simplify the graphical presentation because, asshown in table IV.B1, the variation in the income rates by alternative is verysmall. Income rates increase generally, but at a slow rate for each of the alter-natives over the long-range period. Both increases in the income rate andvariation among the alternatives result from the relatively small componentof income from taxation of benefits. Increases in income from taxation ofbenefits reflect increases in the total amount of benefits paid and the fact thatan increasing share of individual benefits will be subject to taxation becausebenefit taxation threshold amounts are not indexed.
The patterns of the annual balances for OASI and DI can be inferred fromfigure IV.B1. For each alternative, the magnitude of each of the positive bal-ances, as a percentage of taxable payroll, is represented by the distancebetween the appropriate cost-rate curve and the income-rate curve above it.The magnitude of each of the deficits is represented by the distance betweenthe appropriate cost-rate curve and the income-rate curve below it.
In the future, the cost of OASI, DI and the combined OASDI programs as apercentage of taxable payroll will not necessarily be within the range encom-passed by alternatives I and III. Nonetheless, because alternatives I and IIIdefine a reasonably wide range of demographic and economic conditions, theresulting estimates delineate a reasonable range for consideration of potentialfuture program costs.

Actuarial Estimates
50
Thus far in this section, the cost and income of the OASDI program havebeen discussed with reference to their size relative to taxable payroll, whichis the base from which most of the income is derived for the OASDI pro-gram. Also of interest are estimates of income and cost expressed as sharesof gross domestic product (GDP), the value of goods and services producedduring the year in the United States. Under alternative II, OASDI cost gener-ally rises from about 4.8 percent of GDP currently to 6.1 percent in 2030,and then peaks at almost 6.2 percent in 2034. Thereafter, OASDI cost as apercent of GDP is projected to decline, reaching a level around 5.8 percentfor the period 2050 through 2083. Full estimates of income and cost are pre-sented on this basis in Appendix VI.F.2 beginning on page 182.
2. Comparison of Workers to Beneficiaries
The estimated OASDI cost rate is expected to rise rapidly between 2012 and2030 primarily because the number of beneficiaries is expected to rise sub-stantially more rapidly than the number of covered workers as the baby-boom generation retires. This occurs largely because of the swings in fertilityrates over time. Because the baby-boom generation had low fertility rates rel-ative to their parents, and those low fertility rates are expected to persist, theratio of beneficiaries to workers is expected to rise rapidly, reaching a perma-nently higher level after the baby-boom generation retires. After 2030, the
Figure IV.B1.—Long-Range OASI and DI Annual Income Rates and Cost Rates[As a percentage of taxable payroll]
0%
5%
10%
15%
20%
25%
1990 2000 2010 2020 2030 2040 2050 2060 2070 2080Calendar year
Alternative II Income ratesOASI cost ratesDI cost rates
Historical Estimated
OASI
DI IIIIII
III
II
I
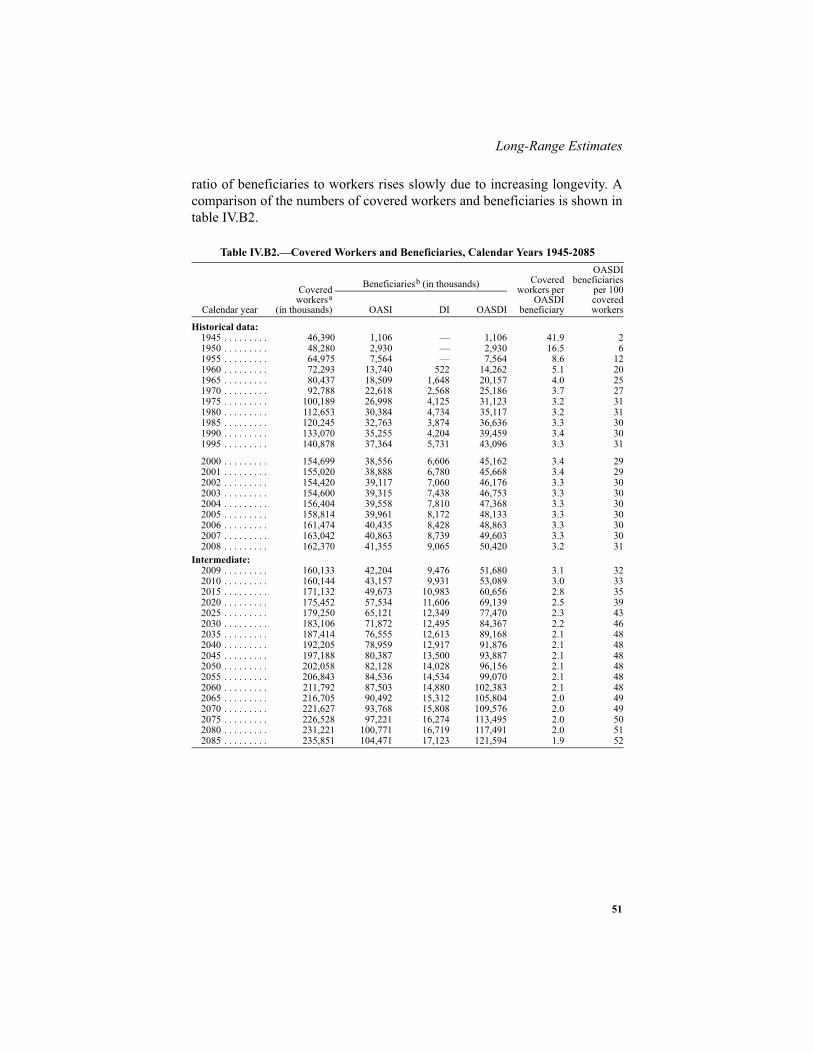
51
Long-Range Estimates
ratio of beneficiaries to workers rises slowly due to increasing longevity. Acomparison of the numbers of covered workers and beneficiaries is shown intable IV.B2.
Table IV.B2.—Covered Workers and Beneficiaries, Calendar Years 1945-2085
Calendar year
Coveredworkersa
(in thousands)
Beneficiariesb (in thousands) Coveredworkers per
OASDIbeneficiary
OASDIbeneficiaries
per 100coveredworkersOASI DI OASDI
Historical data:1945 . . . . . . . . . 46,390 1,106 — 1,106 41.9 21950 . . . . . . . . . 48,280 2,930 — 2,930 16.5 61955 . . . . . . . . . 64,975 7,564 — 7,564 8.6 121960 . . . . . . . . . 72,293 13,740 522 14,262 5.1 201965 . . . . . . . . . 80,437 18,509 1,648 20,157 4.0 251970 . . . . . . . . . 92,788 22,618 2,568 25,186 3.7 271975 . . . . . . . . . 100,189 26,998 4,125 31,123 3.2 311980 . . . . . . . . . 112,653 30,384 4,734 35,117 3.2 311985 . . . . . . . . . 120,245 32,763 3,874 36,636 3.3 301990 . . . . . . . . . 133,070 35,255 4,204 39,459 3.4 301995 . . . . . . . . . 140,878 37,364 5,731 43,096 3.3 31
2000 . . . . . . . . . 154,699 38,556 6,606 45,162 3.4 292001 . . . . . . . . . 155,020 38,888 6,780 45,668 3.4 292002 . . . . . . . . . 154,420 39,117 7,060 46,176 3.3 302003 . . . . . . . . . 154,600 39,315 7,438 46,753 3.3 302004 . . . . . . . . . 156,404 39,558 7,810 47,368 3.3 302005 . . . . . . . . . 158,814 39,961 8,172 48,133 3.3 302006 . . . . . . . . . 161,474 40,435 8,428 48,863 3.3 302007 . . . . . . . . . 163,042 40,863 8,739 49,603 3.3 302008 . . . . . . . . . 162,370 41,355 9,065 50,420 3.2 31
Intermediate:2009 . . . . . . . . . 160,133 42,204 9,476 51,680 3.1 322010 . . . . . . . . . 160,144 43,157 9,931 53,089 3.0 332015 . . . . . . . . . 171,132 49,673 10,983 60,656 2.8 352020 . . . . . . . . . 175,452 57,534 11,606 69,139 2.5 392025 . . . . . . . . . 179,250 65,121 12,349 77,470 2.3 432030 . . . . . . . . . 183,106 71,872 12,495 84,367 2.2 462035 . . . . . . . . . 187,414 76,555 12,613 89,168 2.1 482040 . . . . . . . . . 192,205 78,959 12,917 91,876 2.1 482045 . . . . . . . . . 197,188 80,387 13,500 93,887 2.1 482050 . . . . . . . . . 202,058 82,128 14,028 96,156 2.1 482055 . . . . . . . . . 206,843 84,536 14,534 99,070 2.1 482060 . . . . . . . . . 211,792 87,503 14,880 102,383 2.1 482065 . . . . . . . . . 216,705 90,492 15,312 105,804 2.0 492070 . . . . . . . . . 221,627 93,768 15,808 109,576 2.0 492075 . . . . . . . . . 226,528 97,221 16,274 113,495 2.0 502080 . . . . . . . . . 231,221 100,771 16,719 117,491 2.0 512085 . . . . . . . . . 235,851 104,471 17,123 121,594 1.9 52

Actuarial Estimates
52
Notes: 1. The number of beneficiaries does not include uninsured individuals who receive benefits under Section228 of the Social Security Act. Costs are reimbursed from the General Fund of the Treasury for most ofthese individuals.2. Historical covered worker data are subject to revision.3. Totals do not necessarily equal the sums of rounded components.
The impact of the demographic shifts under the three alternatives on theOASDI cost rates is readily seen by considering the projected number ofOASDI beneficiaries per 100 covered workers. As compared to the 2008level of 31 beneficiaries per 100 covered workers, this ratio is estimated torise to 46 by 2030 and 48 by 2035 under intermediate assumptions, as thegrowth in beneficiaries greatly exceeds the growth in workers. By 2085, thisratio rises significantly under all three alternatives, reaching 39 under thelow-cost assumptions, 52 under the intermediate assumptions, and 69 under
Low-cost:2009 . . . . . . . . . 160,945 42,204 9,411 51,615 3.1 322010 . . . . . . . . . 161,586 43,157 9,716 52,873 3.1 332015 . . . . . . . . . 174,038 49,582 9,959 59,541 2.9 342020 . . . . . . . . . 179,300 57,109 10,583 67,692 2.6 382025 . . . . . . . . . 183,802 64,213 10,713 74,926 2.5 412030 . . . . . . . . . 188,439 70,265 10,423 80,688 2.3 432035 . . . . . . . . . 194,188 74,169 10,268 84,437 2.3 432040 . . . . . . . . . 201,230 75,788 10,384 86,172 2.3 432045 . . . . . . . . . 209,187 76,567 10,787 87,354 2.4 422050 . . . . . . . . . 217,717 77,811 11,197 89,008 2.4 412055 . . . . . . . . . 226,755 79,859 11,633 91,492 2.5 402060 . . . . . . . . . 236,321 82,455 12,016 94,471 2.5 402065 . . . . . . . . . 246,625 84,999 12,526 97,526 2.5 402070 . . . . . . . . . 257,666 87,698 13,150 100,847 2.6 392075 . . . . . . . . . 269,257 90,640 13,840 104,480 2.6 392080 . . . . . . . . . 281,162 94,175 14,574 108,749 2.6 392085 . . . . . . . . . 293,286 98,492 15,289 113,781 2.6 39
High-cost:2009 . . . . . . . . . 159,518 42,206 9,540 51,745 3.1 322010 . . . . . . . . . 159,048 43,165 10,135 53,300 3.0 342015 . . . . . . . . . 166,774 49,799 12,150 61,949 2.7 372020 . . . . . . . . . 171,957 58,085 12,595 70,680 2.4 412025 . . . . . . . . . 175,143 66,295 13,936 80,231 2.2 462030 . . . . . . . . . 178,320 73,824 14,500 88,324 2.0 502035 . . . . . . . . . 181,265 79,470 14,858 94,329 1.9 522040 . . . . . . . . . 183,937 82,872 15,302 98,174 1.9 532045 . . . . . . . . . 186,134 85,136 16,010 101,146 1.8 542050 . . . . . . . . . 187,554 87,493 16,599 104,092 1.8 562055 . . . . . . . . . 188,540 90,319 17,114 107,433 1.8 572060 . . . . . . . . . 189,241 93,680 17,334 111,014 1.7 592065 . . . . . . . . . 189,515 97,060 17,563 114,623 1.7 602070 . . . . . . . . . 189,286 100,813 17,776 118,589 1.6 632075 . . . . . . . . . 188,701 104,720 17,807 122,528 1.5 652080 . . . . . . . . . 187,722 108,250 17,727 125,977 1.5 672085 . . . . . . . . . 186,603 111,196 17,602 128,798 1.4 69
a Workers who are paid at some time during the year for employment on which OASDI taxes are due.b Beneficiaries with monthly benefits in current-payment status as of June 30.
Table IV.B2.—Covered Workers and Beneficiaries, Calendar Years 1945-2085 (Cont.)
Calendar year
Coveredworkersa
(in thousands)
Beneficiariesb (in thousands) Coveredworkers per
OASDIbeneficiary
OASDIbeneficiaries
per 100coveredworkersOASI DI OASDI
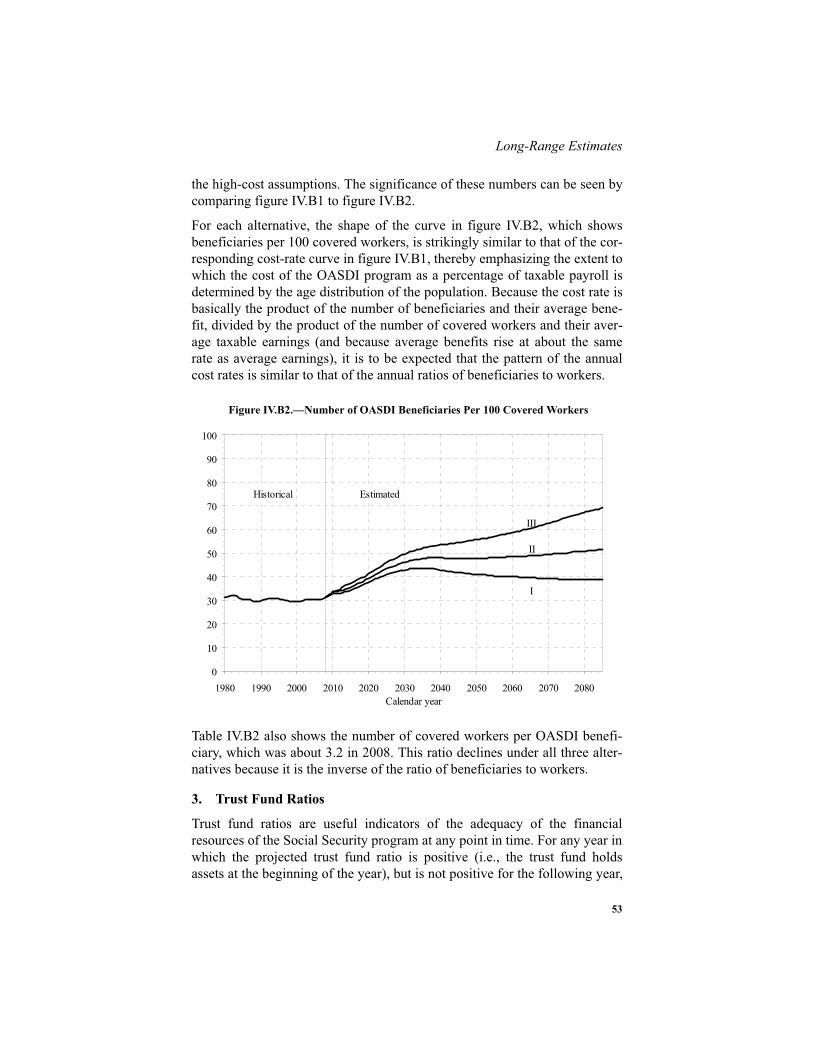
53
Long-Range Estimates
the high-cost assumptions. The significance of these numbers can be seen bycomparing figure IV.B1 to figure IV.B2.
For each alternative, the shape of the curve in figure IV.B2, which showsbeneficiaries per 100 covered workers, is strikingly similar to that of the cor-responding cost-rate curve in figure IV.B1, thereby emphasizing the extent towhich the cost of the OASDI program as a percentage of taxable payroll isdetermined by the age distribution of the population. Because the cost rate isbasically the product of the number of beneficiaries and their average bene-fit, divided by the product of the number of covered workers and their aver-age taxable earnings (and because average benefits rise at about the samerate as average earnings), it is to be expected that the pattern of the annualcost rates is similar to that of the annual ratios of beneficiaries to workers.
Table IV.B2 also shows the number of covered workers per OASDI benefi-ciary, which was about 3.2 in 2008. This ratio declines under all three alter-natives because it is the inverse of the ratio of beneficiaries to workers.
3. Trust Fund Ratios
Trust fund ratios are useful indicators of the adequacy of the financialresources of the Social Security program at any point in time. For any year inwhich the projected trust fund ratio is positive (i.e., the trust fund holdsassets at the beginning of the year), but is not positive for the following year,
Figure IV.B2.—Number of OASDI Beneficiaries Per 100 Covered Workers
0
10
20
30
40
50
60
70
80
90
100
1980 1990 2000 2010 2020 2030 2040 2050 2060 2070 2080Calendar year
Historical Estimated
III
II
I

Actuarial Estimates
54
the trust fund is projected to become exhausted during the year. Underpresent law, the OASI and DI Trust Funds do not have the authority to bor-row. Therefore, exhaustion of the assets in either fund during a year wouldmean there are no longer sufficient assets in the fund to cover the full amountof benefits scheduled for the year under present law.
The trust fund ratio also serves an additional important purpose in assessingthe actuarial status of the program. When the financing is adequate for thetimely payment of full benefits throughout the long-range period, the stabil-ity of the trust fund ratio toward the end of the period indicates the likelihoodthat this projected adequacy will continue for subsequent Trustees Reports. Ifthe trust fund ratio toward the end of the period is level (or increasing), thenprojected adequacy for the long-range period is likely to continue for subse-quent reports. Under these conditions, the program financing is said toachieve sustainable solvency.
Table IV.B3 shows, by alternative, the estimated trust fund ratios (withoutregard to advance tax transfers that would be effected after the end of the10-year, short-range period) for the separate and combined OASI and DITrust Funds. Also shown in this table is the year in which a fund is estimatedto become exhausted, reflecting the effect of the provision for advance taxtransfers.
Based on the intermediate assumptions, the OASI trust fund ratio rises from392 percent at the beginning of 2009, reaching a peak of 422 percent at thebeginning of 2012. This increase in the OASI trust fund ratio results from thefact that the annual income rate exceeds the annual cost rate for several years(see table IV.B1). Thereafter, the OASI trust fund ratio declines steadily, withthe OASI Trust Fund becoming exhausted in 2039. The DI trust fund ratiohas been declining steadily since 2003, and is estimated to continue todecline from 179 percent at the beginning of 2009 until the trust fundbecomes exhausted in 2020.
The trust fund ratio for the combined OASI and DI Trust Funds under theintermediate assumptions rises from 354 percent for 2009 to a peak of369 percent at the beginning of 2012. Thereafter, the ratio declines, with thecombined funds becoming exhausted in 2037. In last year’s report, the peaktrust fund ratio for the combined funds was estimated to be 395 percent for2014 and the year of exhaustion was estimated to be 2041.
The trust fund ratio for the OASDI program under the intermediate assump-tions first declines in 2013. This occurs because the increase in trust fundassets during 2012, which reflects interest income and a small excess of non-interest income over cost, occurs at a slower rate than does the increase in theannual cost of the program between 2012 and 2013. After 2012, the dollar

55
Long-Range Estimates
amount of assets is projected to continue to rise through the beginning of2024 because interest income more than offsets the shortfall in noninterestincome.
Beginning in 2016, the OASDI program under the intermediate assumptionsis projected to experience increasingly large cash-flow shortfalls that willrequire the trust funds to redeem special public-debt obligations of the Gen-eral Fund of the Treasury. This will differ from the experience of recent yearswhen the trust funds have been net lenders to the General Fund of the Trea-sury. The change in the cash flow between the trust funds and the generalfund is expected to have important public policy and economic implicationsthat go well beyond the operation of the OASDI program itself.
Based on the low-cost assumptions, the trust fund ratio for the DI programincreases from 2014 through the end of the long-range projection period,reaching the extremely high level of 1,683 percent for 2084. At the end ofthe long-range period, the DI trust fund ratio is rising by 33 percentagepoints per year. For the OASI program, the trust fund ratio rises to a peak of451 percent for 2017, drops to a low of 261 percent for 2052, and rises there-after to a level of 389 percent for 2084. At the end of the period, the OASItrust fund ratio is rising by 6 percentage points per year. For the OASDI pro-gram, the trust fund ratio peaks at 408 percent for 2018, falls to 301 percentfor 2044, and increases thereafter, reaching 552 percent for 2084. Becausethe trust fund ratios are large and increasing at the end of the long-rangeperiod, subsequent Trustees Reports are likely to contain projections of ade-quate long-range financing of the OASI, the DI, and the combined OASI andDI programs under the low-cost assumptions. Thus, under the low-costassumptions, each program would achieve sustainable solvency.
In contrast, under the high-cost assumptions, the OASI trust fund ratio isestimated to peak at 413 percent for 2012, thereafter declining to fundexhaustion by the end of 2031. The DI trust fund ratio is estimated to declinefrom 176 percent for 2009 to fund exhaustion by the end of 2016. The com-bined OASDI trust fund ratio is estimated to rise to a peak of 360 percent for2011, declining thereafter to fund exhaustion by the end of 2029.
Thus, because large ultimate cost rates are projected under all but the low-cost assumptions, it is likely that income will eventually need to beincreased, and/or program costs will need to be reduced in order to preventthe trust funds from becoming exhausted.
Even under the high-cost assumptions, however, the combined OASI and DIfunds on hand plus their estimated future income would be able to cover theircombined cost for 20 years into the future (until 2029). Under the intermedi-ate assumptions the combined starting funds plus estimated future income

Actuarial Estimates
56
would be able to cover cost for about 28 years into the future (until 2037).The program would be able to cover cost for the foreseeable future under themore optimistic low-cost assumptions. In the 2008 report, the combined trustfunds were projected to become exhausted in 2031 under the high-costassumptions and in 2041 under the intermediate assumptions..
Note: See definition of trust fund ratio on page 219. The combined ratios shown for years after the DI fund isestimated to be exhausted are theoretical and are shown for informational purposes only.
An illustration of the trust fund ratios for the separate OASI and DI TrustFunds is shown in figure IV.B3 for each of the alternative sets of assump-tions. A graphical illustration of the trust fund ratios for the combined trustfunds is shown in figure II.D6 on page 15.
Table IV.B3.—Trust Fund Ratios, Calendar Years 2009-85[In percent]
Calendaryear
Intermediate Low-cost High-cost
OASI DI OASDI OASI DI OASDI OASI DI OASDI
2009 . . . . . . . . . . . . . 392 179 354 392 182 356 392 176 3532010 . . . . . . . . . . . . . 404 161 360 405 169 364 404 154 3572011 . . . . . . . . . . . . . 416 144 366 419 159 374 413 132 3602012 . . . . . . . . . . . . . 422 128 369 432 152 385 413 109 3562013 . . . . . . . . . . . . . 421 113 367 439 148 392 403 84 3432014 . . . . . . . . . . . . . 419 98 364 444 147 397 384 57 3242015 . . . . . . . . . . . . . 415 84 359 448 148 401 367 30 3062016 . . . . . . . . . . . . . 410 70 354 450 149 405 352 3 2902017 . . . . . . . . . . . . . 403 55 347 451 151 407 338 a 2752018 . . . . . . . . . . . . . 394 40 338 450 155 408 323 a 259
2020 . . . . . . . . . . . . . 370 9 315 442 164 404 288 a 2222025 . . . . . . . . . . . . . 298 a 244 413 189 385 179 a 1082030 . . . . . . . . . . . . . 204 a
a The trust fund is estimated to be exhausted by the beginning of this year. The last line of the table shows thespecific year of trust fund exhaustion.
153 370 234 354 44 a a
2035 . . . . . . . . . . . . . 98 a 50 325 321 325 a a a
2040 . . . . . . . . . . . . . a a a 290 432 306 a a a
2045 . . . . . . . . . . . . . a a a 270 545 301 a a a
2050 . . . . . . . . . . . . . a a a 262 665 309 a a a
2055 . . . . . . . . . . . . . a a a 263 794 326 a a a
2060 . . . . . . . . . . . . . a a a 269 943 349 a a a
2065 . . . . . . . . . . . . . a a a 282 1,099 380 a a a
2070 . . . . . . . . . . . . . a a a 303 1,252 419 a a a
2075 . . . . . . . . . . . . . a a a 332 1,404 464 a a a
2080 . . . . . . . . . . . . . a a a 364 1,556 513 a a a
2085 . . . . . . . . . . . . . a a a 395 1,716 561 a a a
Trust fund is esti-mated to becomeexhausted in. . . . . 2039 2020 2037 b
b The trust fund is not estimated to be exhausted within the projection period.
b b 2031 2016 2029
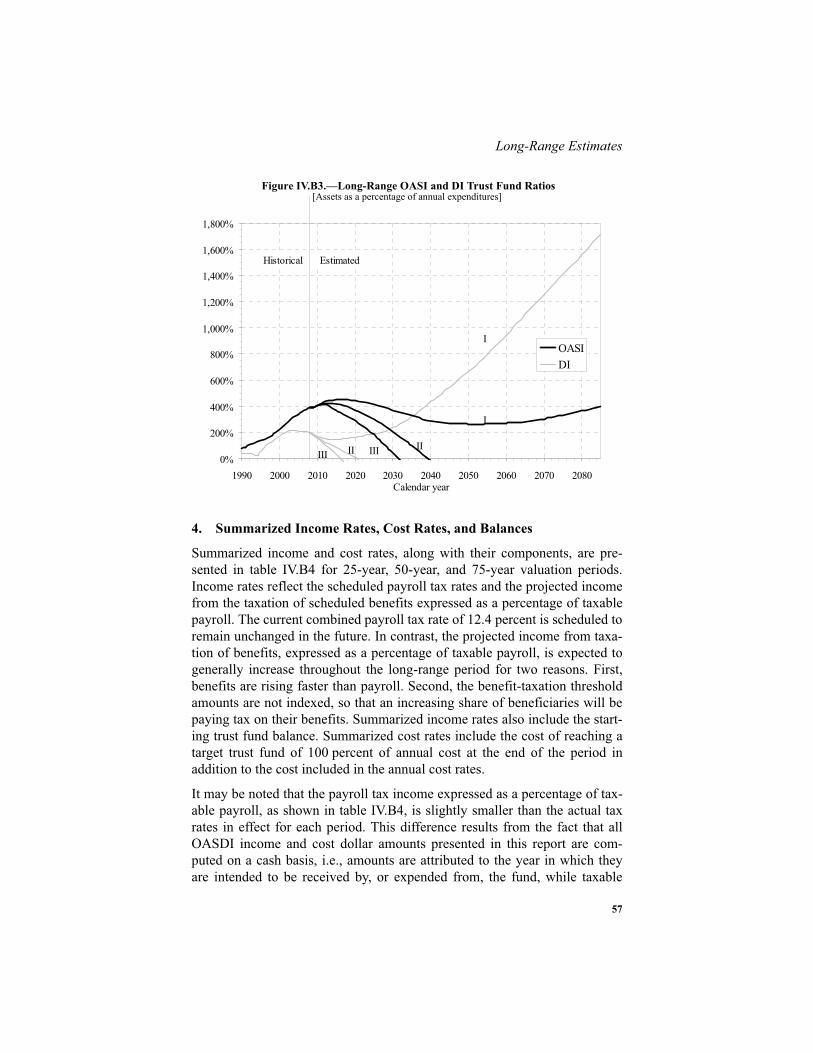
57
Long-Range Estimates
4. Summarized Income Rates, Cost Rates, and Balances
Summarized income and cost rates, along with their components, are pre-sented in table IV.B4 for 25-year, 50-year, and 75-year valuation periods.Income rates reflect the scheduled payroll tax rates and the projected incomefrom the taxation of scheduled benefits expressed as a percentage of taxablepayroll. The current combined payroll tax rate of 12.4 percent is scheduled toremain unchanged in the future. In contrast, the projected income from taxa-tion of benefits, expressed as a percentage of taxable payroll, is expected togenerally increase throughout the long-range period for two reasons. First,benefits are rising faster than payroll. Second, the benefit-taxation thresholdamounts are not indexed, so that an increasing share of beneficiaries will bepaying tax on their benefits. Summarized income rates also include the start-ing trust fund balance. Summarized cost rates include the cost of reaching atarget trust fund of 100 percent of annual cost at the end of the period inaddition to the cost included in the annual cost rates.
It may be noted that the payroll tax income expressed as a percentage of tax-able payroll, as shown in table IV.B4, is slightly smaller than the actual taxrates in effect for each period. This difference results from the fact that allOASDI income and cost dollar amounts presented in this report are com-puted on a cash basis, i.e., amounts are attributed to the year in which theyare intended to be received by, or expended from, the fund, while taxable
Figure IV.B3.—Long-Range OASI and DI Trust Fund Ratios[Assets as a percentage of annual expenditures]
0%
200%
400%
600%
800%
1,000%
1,200%
1,400%
1,600%
1,800%
1990 2000 2010 2020 2030 2040 2050 2060 2070 2080Calendar year
OASIDI
Historical Estimated
III II
I
I
IIIII

Actuarial Estimates
58
payroll is attributed to the year in which earnings are paid. Because earningsare paid to workers before the corresponding payroll taxes are credited to thefunds, payroll tax income for a particular year reflects a combination of thetaxable payrolls from that year and from prior years, when payroll wassmaller. Dividing payroll tax income by taxable payroll for a particular year,or period of years, will thus generally result in an income rate that is slightlyless than the applicable tax rate for the period.
Summarized values for the full 75-year period are useful in analyzing thelong-range adequacy of financing for the program over the period as a wholeunder present law and under proposed modifications to the law.
Table IV.B4 shows summarized rates for valuation periods of the first 25, thefirst 50, and the entire 75 years of the long-range projection period, includingthe funds on hand at the start of the period and the cost of accumulating a tar-get trust fund balance equal to 100 percent of the following year’s annualcost by the end of the period. The actuarial balance for each of these threevaluation periods is equal to the difference between the summarized incomerate and the summarized cost rate for the corresponding period. An actuarialbalance of zero for any period would indicate that estimated cost for theperiod could be met, on average, with a remaining trust fund balance at theend of the period equal to 100 percent of the following year’s cost. A nega-tive actuarial balance indicates that, over the period, the present value ofincome to the program plus the existing trust fund falls short of the presentvalue of the cost of the program plus the cost of reaching a target trust fundbalance of 1 year’s cost by the end of the period. This negative balance, com-bined with a falling trust fund ratio, signals the likelihood of continuingcash-flow deficits, implying that the current-law level of financing is not sus-tainable.
The values in table IV.B4 show that the combined OASDI program isexpected to operate with a positive actuarial balance over the 25-year valua-tion period under only the low-cost assumptions. For the 25-year valuationperiod the summarized values indicate actuarial balances of 1.18 percent oftaxable payroll under the low-cost assumptions, -0.17 percent under theintermediate assumptions, and -1.81 percent under the high-cost assump-tions. Thus, the program is more than adequately financed for the 25-yearvaluation period under only the low-cost projections. For the 50-year valua-tion period the OASDI program would have a positive actuarial balance of0.48 percent under the low-cost assumptions, but would have deficits of1.51 percent under the intermediate assumptions and 4.05 percent under thehigh-cost assumptions. Thus, the program is more than adequately financedfor the 50-year valuation period under only the low-cost set of assumptions.
59
Long-Range Estimates
For the entire 75-year valuation period, the combined OASDI programwould once again have actuarial deficits except under the low-cost set ofassumptions. The actuarial balance for this long-range valuation period isprojected to be 0.50 percent of taxable payroll under the low-cost assump-tions, -2.00 percent under the intermediate assumptions, and -5.32 percentunder the high-cost assumptions.
Assuming the Trustees’ intermediate assumptions are realized, the deficit of2.00 percent of payroll indicates that financial adequacy of the program forthe next 75 years could be restored if the Social Security payroll tax ratewere increased for current and future earnings from 12.40 percent (combinedemployee-employer shares) to 14.41 percent. Alternatively, all current andfuture benefits could be reduced by 13.3 percent (or there could be somecombination of tax increases and benefit reductions). Changes of this magni-tude would be sufficient to maintain trust fund solvency over the 75-yearprojection period under the intermediate assumptions.
However, large annual deficits projected under current law for the end of thelong-range period, which exceed 4 percent of payroll under the intermediateassumptions (see table IV.B1), indicate that the annual cost will very likelycontinue to exceed tax revenues after 2083. As a result, ensuring continuedadequate financing would eventually require larger changes than thoseneeded to maintain solvency for the 75-year period. For the infinite future,the actuarial deficit is estimated to be 3.4 percent of taxable payroll under theintermediate assumptions. This means that the projected infinite horizonshortfall could be eliminated with an immediate increase in the combinedpayroll tax rate from 12.4 percent to about 15.8 percent. This shortfall couldalso be eliminated if all current and future benefits were immediatelyreduced by 21.1 percent.
As may be concluded from table IV.B4, the financial condition of the DI pro-gram is substantially weaker than that of the OASI program for the first25 years. Summarized over the full 75-year period, however, long-range def-icits for the OASI and DI programs under intermediate assumptions are moresimilar when measured relative to the level of program costs.
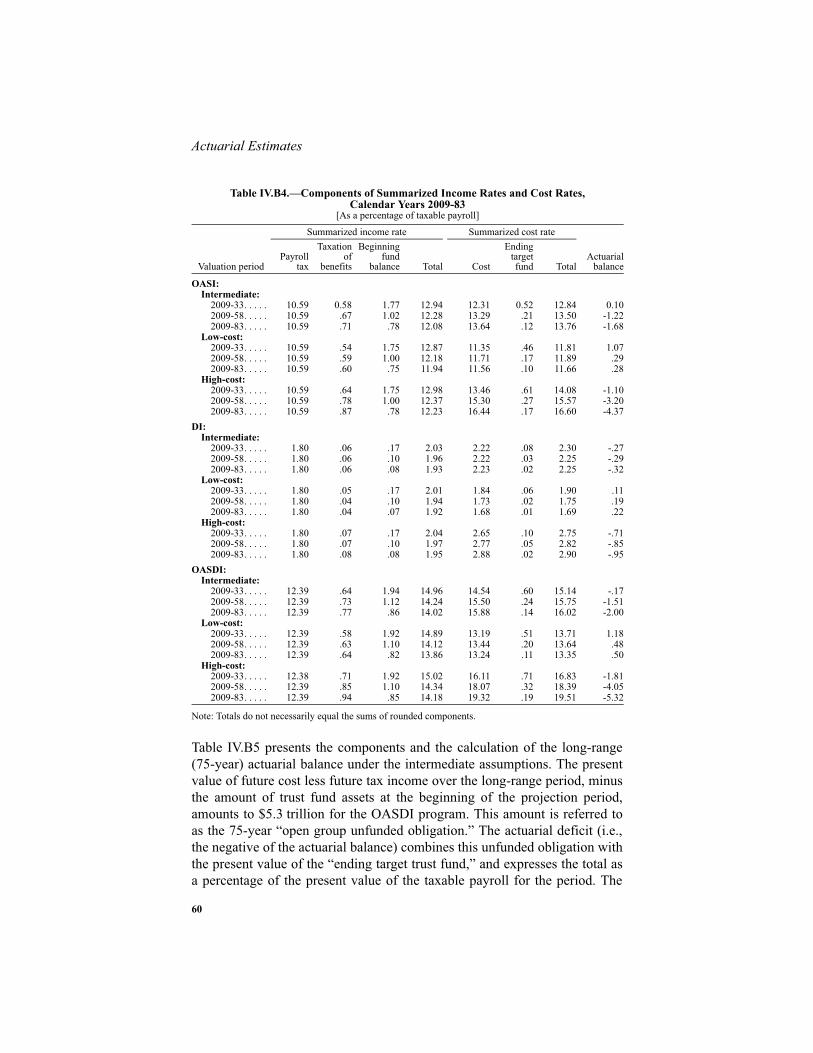
Actuarial Estimates
60
.
Note: Totals do not necessarily equal the sums of rounded components.
Table IV.B5 presents the components and the calculation of the long-range(75-year) actuarial balance under the intermediate assumptions. The presentvalue of future cost less future tax income over the long-range period, minusthe amount of trust fund assets at the beginning of the projection period,amounts to $5.3 trillion for the OASDI program. This amount is referred toas the 75-year “open group unfunded obligation.” The actuarial deficit (i.e.,the negative of the actuarial balance) combines this unfunded obligation withthe present value of the “ending target trust fund,” and expresses the total asa percentage of the present value of the taxable payroll for the period. The
Table IV.B4.—Components of Summarized Income Rates and Cost Rates, Calendar Years 2009-83
[As a percentage of taxable payroll]
Valuation period
Summarized income rate Summarized cost rate
Actuarialbalance
Payrolltax
Taxationof
benefits
Beginningfund
balance Total Cost
Endingtargetfund Total
OASI:Intermediate:
2009-33. . . . . 10.59 0.58 1.77 12.94 12.31 0.52 12.84 0.102009-58. . . . . 10.59 .67 1.02 12.28 13.29 .21 13.50 -1.222009-83. . . . . 10.59 .71 .78 12.08 13.64 .12 13.76 -1.68
Low-cost:2009-33. . . . . 10.59 .54 1.75 12.87 11.35 .46 11.81 1.072009-58. . . . . 10.59 .59 1.00 12.18 11.71 .17 11.89 .292009-83. . . . . 10.59 .60 .75 11.94 11.56 .10 11.66 .28
High-cost:2009-33. . . . . 10.59 .64 1.75 12.98 13.46 .61 14.08 -1.102009-58. . . . . 10.59 .78 1.00 12.37 15.30 .27 15.57 -3.202009-83. . . . . 10.59 .87 .78 12.23 16.44 .17 16.60 -4.37
DI:Intermediate:
2009-33. . . . . 1.80 .06 .17 2.03 2.22 .08 2.30 -.272009-58. . . . . 1.80 .06 .10 1.96 2.22 .03 2.25 -.292009-83. . . . . 1.80 .06 .08 1.93 2.23 .02 2.25 -.32
Low-cost:2009-33. . . . . 1.80 .05 .17 2.01 1.84 .06 1.90 .112009-58. . . . . 1.80 .04 .10 1.94 1.73 .02 1.75 .192009-83. . . . . 1.80 .04 .07 1.92 1.68 .01 1.69 .22
High-cost:2009-33. . . . . 1.80 .07 .17 2.04 2.65 .10 2.75 -.712009-58. . . . . 1.80 .07 .10 1.97 2.77 .05 2.82 -.852009-83. . . . . 1.80 .08 .08 1.95 2.88 .02 2.90 -.95
OASDI:Intermediate:
2009-33. . . . . 12.39 .64 1.94 14.96 14.54 .60 15.14 -.172009-58. . . . . 12.39 .73 1.12 14.24 15.50 .24 15.75 -1.512009-83. . . . . 12.39 .77 .86 14.02 15.88 .14 16.02 -2.00
Low-cost:2009-33. . . . . 12.39 .58 1.92 14.89 13.19 .51 13.71 1.182009-58. . . . . 12.39 .63 1.10 14.12 13.44 .20 13.64 .482009-83. . . . . 12.39 .64 .82 13.86 13.24 .11 13.35 .50
High-cost:2009-33. . . . . 12.38 .71 1.92 15.02 16.11 .71 16.83 -1.812009-58. . . . . 12.39 .85 1.10 14.34 18.07 .32 18.39 -4.052009-83. . . . . 12.39 .94 .85 14.18 19.32 .19 19.51 -5.32
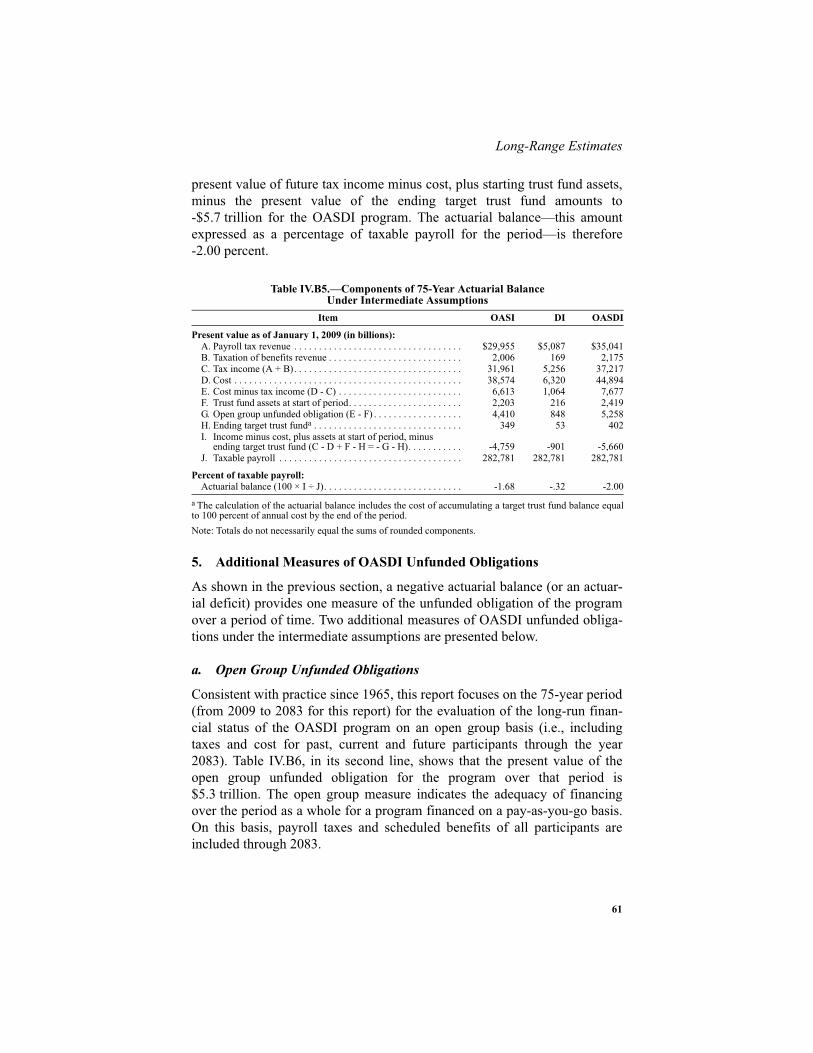
61
Long-Range Estimates
present value of future tax income minus cost, plus starting trust fund assets,minus the present value of the ending target trust fund amounts to-$5.7 trillion for the OASDI program. The actuarial balance—this amountexpressed as a percentage of taxable payroll for the period—is therefore-2.00 percent.
Note: Totals do not necessarily equal the sums of rounded components.
5. Additional Measures of OASDI Unfunded Obligations
As shown in the previous section, a negative actuarial balance (or an actuar-ial deficit) provides one measure of the unfunded obligation of the programover a period of time. Two additional measures of OASDI unfunded obliga-tions under the intermediate assumptions are presented below.
a. Open Group Unfunded Obligations
Consistent with practice since 1965, this report focuses on the 75-year period(from 2009 to 2083 for this report) for the evaluation of the long-run finan-cial status of the OASDI program on an open group basis (i.e., includingtaxes and cost for past, current and future participants through the year2083). Table IV.B6, in its second line, shows that the present value of theopen group unfunded obligation for the program over that period is$5.3 trillion. The open group measure indicates the adequacy of financingover the period as a whole for a program financed on a pay-as-you-go basis.On this basis, payroll taxes and scheduled benefits of all participants areincluded through 2083.
Table IV.B5.—Components of 75-Year Actuarial BalanceUnder Intermediate Assumptions
Item OASI DI OASDI
Present value as of January 1, 2009 (in billions):A. Payroll tax revenue . . . . . . . . . . . . . . . . . . . . . . . . . . . . . . . . . . $29,955 $5,087 $35,041B. Taxation of benefits revenue . . . . . . . . . . . . . . . . . . . . . . . . . . . 2,006 169 2,175C. Tax income (A + B). . . . . . . . . . . . . . . . . . . . . . . . . . . . . . . . . . 31,961 5,256 37,217D. Cost . . . . . . . . . . . . . . . . . . . . . . . . . . . . . . . . . . . . . . . . . . . . . . 38,574 6,320 44,894E. Cost minus tax income (D - C) . . . . . . . . . . . . . . . . . . . . . . . . . 6,613 1,064 7,677F. Trust fund assets at start of period. . . . . . . . . . . . . . . . . . . . . . . 2,203 216 2,419G. Open group unfunded obligation (E - F) . . . . . . . . . . . . . . . . . . 4,410 848 5,258H. Ending target trust funda . . . . . . . . . . . . . . . . . . . . . . . . . . . . . .
a The calculation of the actuarial balance includes the cost of accumulating a target trust fund balance equalto 100 percent of annual cost by the end of the period.
349 53 402I. Income minus cost, plus assets at start of period, minus
ending target trust fund (C - D + F - H = - G - H). . . . . . . . . . . -4,759 -901 -5,660J. Taxable payroll . . . . . . . . . . . . . . . . . . . . . . . . . . . . . . . . . . . . . 282,781 282,781 282,781
Percent of taxable payroll:Actuarial balance (100 × I ÷ J). . . . . . . . . . . . . . . . . . . . . . . . . . . . -1.68 -.32 -2.00
Actuarial Estimates
62
Table IV.B6 also presents the 75-year unfunded obligation as percentages offuture OASDI taxable payroll and gross domestic product (GDP) through2083. The 75-year unfunded obligation as a percentage of taxable payroll isless than the actuarial deficit, because it excludes the ending target trust fundvalue (see table IV.B5).
However, there are limitations on what can be conveyed using summarizedmeasures alone. For example, overemphasis on summary measures (such asthe actuarial balance and open group unfunded obligation) for the 75-yearperiod can lead to incorrect perceptions and policies that fail to addressfinancial sustainability for the more distant future. This can be addressed byconsidering the trend in trust fund ratios toward the end of the period (see“sustainable solvency” at the beginning of section IV.B).
Another limitation of the 75-year summary measure is that continued, andpossibly increasing, annual shortfalls after 75 years are not taken intoaccount. In order to address this limitation, this section presents estimates ofunfunded obligations that extend to the infinite horizon. The extensionassumes that the current-law OASDI program and the demographic and mosteconomic trends used for the 75-year projection continue indefinitely. Theone exception is that the ultimate assumed real-wage differential for thelong-range period of 1.1 percent is increased to 1.2 percent, phased in overthe 10-year period 2084 to 2093. This change essentially maintains consis-tency with the assumed reduction in the growth of health care expendituresafter 2083. (See the Medicare Trustees Report.) The values in table IV.B6indicate that extending the calculations beyond 2083 adds $9.9 ($15.1 - $5.3)trillion in present value to the amount of the unfunded obligation estimatedthrough 2083. That is, over the infinite horizon, the OASDI open groupunfunded obligation is projected to be $15.1 trillion. The $9.9 trillion incre-ment reflects a significant financing gap projected for OASDI for years after2083. Of course, the degree of uncertainty associated with estimates beyond2083 is substantial.
In last year’s report the unfunded obligation over the infinite horizon wasreported as $13.6 trillion in present value as of January 1, 2008. The changeto the later valuation date (January 1, 2009), taken alone, would increase themeasured deficit by about $0.7 trillion. In addition, the net effects of changesin data, methods, and other assumptions increased the infinite horizonunfunded obligation by approximately $0.8 trillion. The main changes affect-ing the infinite horizon unfunded obligation for this report are near-term eco-nomic and disability assumptions reflecting the current economic recession,updated starting economic values, and lower ultimate mortality rates for ages65-84. See section IV.B.7 for details regarding changes in data, methods, andassumptions.

63
Long-Range Estimates
As noted in the previous section, the $15.1 trillion infinite future open groupunfunded obligation may also be expressed as a percentage of the taxablepayroll over that period. This actuarial deficit for the infinite future is3.4 percent of taxable payroll under the intermediate assumptions, about0.2 percentage point higher than in last year’s report. This unfunded obliga-tion can also be expressed as a percentage of GDP over the infinite futureand is 1.2 percent on that basis, about 0.1 percentage point higher than in lastyear’s report. These relative measures of the unfunded obligation over theinfinite future express its magnitude in relation to the resources that arepotentially available to finance the shortfall.
Notes:1. The present values of future taxable payroll for 2009-83 and for 2009 through the infinite horizon are$282.8 trillion and $442.3 trillion, respectively.2. The present values of GDP for 2009-83 and for 2009 through the infinite horizon are $788.4 trillion and$1,309.0 trillion, respectively. Present values of GDP shown in the Medicare Trustees Report differ slightlydue to the use of interest discount rates that are specific to each program’s trust fund holdings.
b. Unfunded Obligations for Past, Current, and Future Participants
The future unfunded obligation of the OASDI program may also be viewedfrom a generational perspective. This perspective is generally associatedwith assessment of the financial condition of a program that is intended orrequired to be financed on a fully-advance-funded basis. However, analysisfrom this perspective can also provide insights into the implications of pay-as-you-go financing, the basis that has been used for the OASDI program.
The first line of table IV.B7 shows that the present value of future cost lessfuture taxes over the next 100 years for all current participants equals$18.7 trillion. For this purpose, current participants are defined as individualswho attain age 15 or older in 2009. Subtracting the current value of the trustfund (the accumulated value of past OASDI taxes less cost) gives a closedgroup (excluding all future participants) unfunded obligation of$16.3 trillion. This value represents the shortfall of lifetime contributions forall past and current participants relative to the lifetime costs associated with
Table IV.B6.—Unfunded OASDI Obligations for 1935 (Program Inception)Through the Infinite Horizon
[Present values as of January 1, 2009; dollar amounts in trillions]
Presentvalue
Expressed as a percentageof future payroll and GDP
Taxablepayroll GDP
Unfunded obligation for 1935 through the infinite horizona . . . . .
a Present value of future cost less future taxes, reduced by the amount of trust fund assets at the beginning of2009. Expressed as percentage of payroll and GDP for the period 2009 through the infinite horizon.
$15.1 3.4 1.2Unfunded obligation for 1935 through 2083b . . . . . . . . . . . . . . . .
b Present value of future cost less future taxes through 2083, reduced by the amount of trust fund assets at thebeginning of 2009. Expressed as percentage of payroll and GDP for the period 2009 through 2083.
5.3 1.9 .7
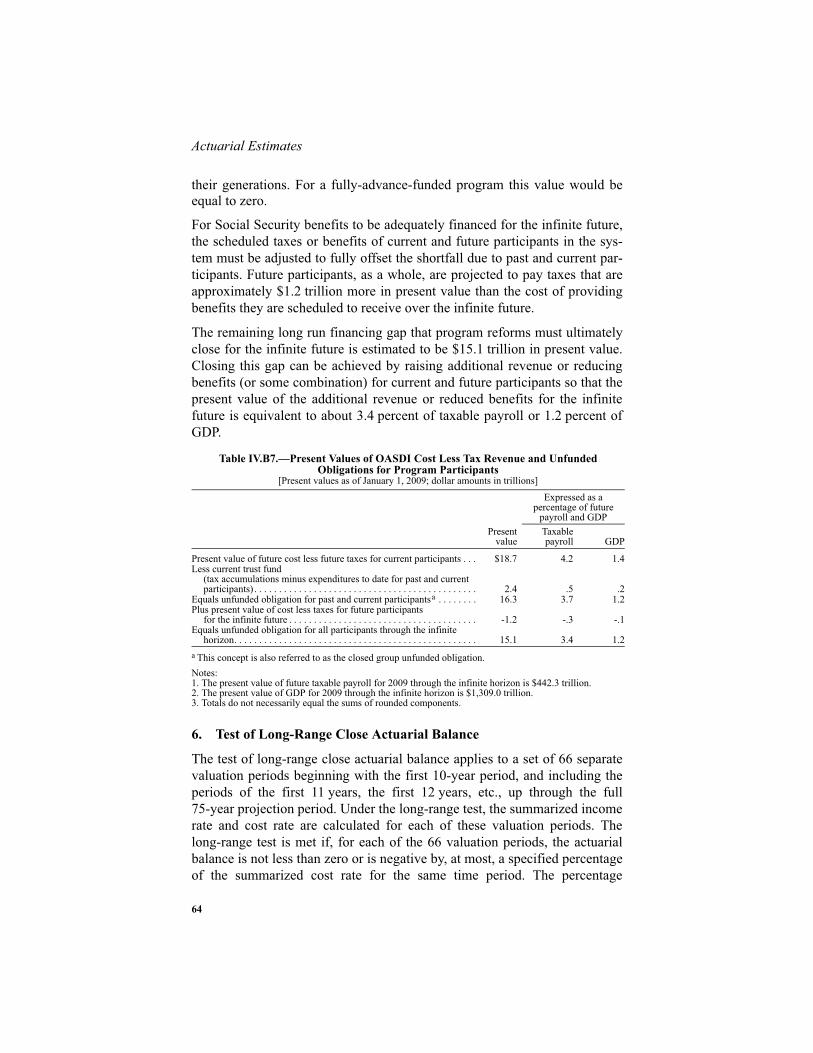
Actuarial Estimates
64
their generations. For a fully-advance-funded program this value would beequal to zero.
For Social Security benefits to be adequately financed for the infinite future,the scheduled taxes or benefits of current and future participants in the sys-tem must be adjusted to fully offset the shortfall due to past and current par-ticipants. Future participants, as a whole, are projected to pay taxes that areapproximately $1.2 trillion more in present value than the cost of providingbenefits they are scheduled to receive over the infinite future.
The remaining long run financing gap that program reforms must ultimatelyclose for the infinite future is estimated to be $15.1 trillion in present value.Closing this gap can be achieved by raising additional revenue or reducingbenefits (or some combination) for current and future participants so that thepresent value of the additional revenue or reduced benefits for the infinitefuture is equivalent to about 3.4 percent of taxable payroll or 1.2 percent ofGDP.
Notes:1. The present value of future taxable payroll for 2009 through the infinite horizon is $442.3 trillion.2. The present value of GDP for 2009 through the infinite horizon is $1,309.0 trillion.3. Totals do not necessarily equal the sums of rounded components.
6. Test of Long-Range Close Actuarial Balance
The test of long-range close actuarial balance applies to a set of 66 separatevaluation periods beginning with the first 10-year period, and including theperiods of the first 11 years, the first 12 years, etc., up through the full75-year projection period. Under the long-range test, the summarized incomerate and cost rate are calculated for each of these valuation periods. Thelong-range test is met if, for each of the 66 valuation periods, the actuarialbalance is not less than zero or is negative by, at most, a specified percentageof the summarized cost rate for the same time period. The percentage
Table IV.B7.—Present Values of OASDI Cost Less Tax Revenue and Unfunded Obligations for Program Participants
[Present values as of January 1, 2009; dollar amounts in trillions]
Presentvalue
Expressed as a percentage of future
payroll and GDPTaxablepayroll GDP
Present value of future cost less future taxes for current participants . . . $18.7 4.2 1.4Less current trust fund
(tax accumulations minus expenditures to date for past and current participants) . . . . . . . . . . . . . . . . . . . . . . . . . . . . . . . . . . . . . . . . . . . . . 2.4 .5 .2
Equals unfunded obligation for past and current participantsa . . . . . . . .
a This concept is also referred to as the closed group unfunded obligation.
16.3 3.7 1.2Plus present value of cost less taxes for future participants
for the infinite future . . . . . . . . . . . . . . . . . . . . . . . . . . . . . . . . . . . . . . -1.2 -.3 -.1Equals unfunded obligation for all participants through the infinite
horizon. . . . . . . . . . . . . . . . . . . . . . . . . . . . . . . . . . . . . . . . . . . . . . . . . 15.1 3.4 1.2

65
Long-Range Estimates
allowed for a negative actuarial balance is 5 percent for the full 75-yearperiod. For shorter periods, the allowable percentage begins with zero for thefirst 10 years and increases uniformly for longer periods, until it reaches themaximum percentage of 5 percent allowed for the 75-year period. The crite-rion for meeting the test is less stringent for the longer periods in recognitionof the greater uncertainty associated with estimates for more distant years.
When a negative actuarial balance in excess of the allowable percentage ofthe summarized cost rate is projected for one or more of the 66 separate valu-ation periods, the program fails the test of long-range close actuarial balance.Being out of close actuarial balance indicates that the program is expected toexperience financial problems in the future and that ways of improving thefinancial status of the program should be considered. The sooner the actuar-ial balance is less than the minimum allowable balance, expressed as a per-centage of the summarized cost rate, the more urgent is the need forcorrective action. Necessary changes in program financing or benefit provi-sions should not be put off until the last possible moment if future beneficia-ries and workers are to effectively plan for their retirement.
Table IV.B8 presents a comparison of the estimated actuarial balances withthe minimum allowable balance (or maximum allowable deficit) under thelong-range test, each expressed as a percentage of the summarized cost rate,based on the intermediate estimates. Values are shown for only 14 of the val-uation periods: those of length 10 years, 15 years, and continuing in 5-yearincrements through 75 years. However, each of the 66 periods—those oflength 10 years, 11 years, and continuing in 1-year increments through75 years—is considered for the test. These minimum allowable balances arecalculated to show the limit for each valuation period resulting from thegraduated tolerance scale. The patterns in the estimated balances as a per-centage of the summarized cost rates, as well as that for the minimum allow-able balance, are presented graphically in figure IV.B4 for the OASI, DI andcombined OASDI programs. Values shown for the 25-year, 50-year, and75-year valuation periods correspond to those presented in table IV.B4.
For the OASI program, the estimated actuarial balance as a percentage of thesummarized cost rate exceeds the minimum allowable for valuation periodsof length 10 through 27 years under the intermediate estimates. For valuationperiods of length greater than 27 years, the estimated actuarial balance is lessthan the minimum allowable. For the full 75-year long-range period the esti-mated actuarial balance reaches -12.23 percent of the summarized cost rate,for a shortfall of 7.23 percent from the minimum allowable balance of-5.0 percent of the summarized cost rate. Thus, although the OASI programsatisfies the test of short-range financial adequacy (as discussed earlier onpage 34), it is not in long-range close actuarial balance.

Actuarial Estimates
66
For the DI program, under the intermediate assumptions, the estimated actu-arial balance as a percentage of the summarized cost rate is less than the min-imum allowable balance for all 66 valuation periods. For the full 75-yearlong-range period the estimated actuarial balance reaches -14.14 percent ofthe summarized cost rate, for a shortfall of 9.14 percent from the minimumallowable balance of -5.0 percent of the summarized cost rate. Thus, the DIprogram fails to meet the short-range test of financial adequacy (as discussedon page 40), and is also not in long-range close actuarial balance.
Financing for the DI program is much less adequate than for the OASI pro-gram in satisfying the test for long-range actuarial balance even though long-range actuarial deficits are more comparable over the entire 75-year period.This difference occurs because much more of the increase in the long-rangecost due to the aging of the baby-boom generation occurs earlier for the DIprogram than for the OASI program. As a result, tax rates that are relativelymore adequate for the OASI program during the first 25 years become rela-tively less adequate later in the long-range period.
For the OASDI program, the estimated actuarial balance as a percentage ofthe summarized cost rate exceeds the minimum allowable balance for valua-tion periods of length 10 through 25 years under the intermediate estimates.For valuation periods of length greater than 25 years, the estimated actuarialbalance is below the minimum allowable balance. The size of the shortfallfrom the minimum allowable balance rises gradually, reaching 7.50 percentof the summarized cost rate for the full 75-year long-range valuation period.Thus, although the OASDI program satisfies the short-range test of financialadequacy, it is out of long-range close actuarial balance.
The OASI and DI programs, both separate and combined, were also found tobe out of close actuarial balance in last year’s report. The estimated deficitsfor the OASI, DI, and combined OASDI programs in this report are worsewhen compared to those shown in last year’s report for the longer valuationperiods.

67
Long-Range Estimates
Note: Totals do not necessarily equal the sums of rounded components.
Table IV.B8.—Comparison of Long-Range Actuarial Balances With the Minimum Allowable in the Test for Close Actuarial Balance,
Based on Intermediate Assumptions
Valuation period
Rates(percentage of taxable payroll)
Values expressed as apercentage of cost rate
Summarizedincome rate
Summarizedcost rate
Actuarialbalance
Actuarialbalance
Minimumallowableactuarialbalance
OASI:10-year: 2009-18 . . . . . . . 15.16 11.79 3.37 28.62 0.0015-year: 2009-23 . . . . . . . 13.89 12.07 1.81 15.00 -.3820-year: 2009-28 . . . . . . . 13.28 12.47 .81 6.53 -.7725-year: 2009-33 . . . . . . . 12.94 12.84 .10 .80 -1.1530-year: 2009-38 . . . . . . . 12.72 13.11 -.39 -2.98 -1.5435-year: 2009-43 . . . . . . . 12.56 13.27 -.72 -5.40 -1.9240-year: 2009-48 . . . . . . . 12.44 13.38 -.93 -6.99 -2.3145-year: 2009-53 . . . . . . . 12.35 13.44 -1.09 -8.12 -2.6950-year: 2009-58 . . . . . . . 12.28 13.50 -1.22 -9.03 -3.0855-year: 2009-63 . . . . . . . 12.22 13.55 -1.33 -9.80 -3.4660-year: 2009-68 . . . . . . . 12.18 13.60 -1.43 -10.48 -3.8565-year: 2009-73 . . . . . . . 12.14 13.65 -1.52 -11.10 -4.2370-year: 2009-78 . . . . . . . 12.11 13.71 -1.60 -11.68 -4.6275-year: 2009-83 . . . . . . . 12.08 13.76 -1.68 -12.23 -5.00
DI:10-year: 2009-18 . . . . . . . 2.25 2.41 -.16 -6.73 .0015-year: 2009-23 . . . . . . . 2.12 2.35 -.23 -9.59 -.3820-year: 2009-28 . . . . . . . 2.06 2.33 -.26 -11.35 -.7725-year: 2009-33 . . . . . . . 2.03 2.30 -.27 -11.90 -1.1530-year: 2009-38 . . . . . . . 2.00 2.28 -.27 -12.03 -1.5435-year: 2009-43 . . . . . . . 1.99 2.26 -.28 -12.17 -1.9240-year: 2009-48 . . . . . . . 1.97 2.25 -.28 -12.43 -2.3145-year: 2009-53 . . . . . . . 1.96 2.25 -.29 -12.74 -2.6950-year: 2009-58 . . . . . . . 1.96 2.25 -.29 -13.02 -3.0855-year: 2009-63 . . . . . . . 1.95 2.25 -.30 -13.26 -3.4660-year: 2009-68 . . . . . . . 1.95 2.25 -.30 -13.48 -3.8565-year: 2009-73 . . . . . . . 1.94 2.25 -.31 -13.71 -4.2370-year: 2009-78 . . . . . . . 1.94 2.25 -.31 -13.94 -4.6275-year: 2009-83 . . . . . . . 1.93 2.25 -.32 -14.14 -5.00
OASDI:10-year: 2009-18 . . . . . . . 17.41 14.20 3.21 22.62 .0015-year: 2009-23 . . . . . . . 16.01 14.42 1.59 11.00 -.3820-year: 2009-28 . . . . . . . 15.35 14.80 .55 3.72 -.7725-year: 2009-33 . . . . . . . 14.96 15.14 -.17 -1.13 -1.1530-year: 2009-38 . . . . . . . 14.72 15.38 -.66 -4.32 -1.5435-year: 2009-43 . . . . . . . 14.54 15.54 -.99 -6.38 -1.9240-year: 2009-48 . . . . . . . 14.41 15.63 -1.21 -7.77 -2.3145-year: 2009-53 . . . . . . . 14.31 15.69 -1.38 -8.78 -2.6950-year: 2009-58 . . . . . . . 14.24 15.75 -1.51 -9.60 -3.0855-year: 2009-63 . . . . . . . 14.17 15.80 -1.63 -10.30 -3.4660-year: 2009-68 . . . . . . . 14.12 15.85 -1.73 -10.91 -3.8565-year: 2009-73 . . . . . . . 14.08 15.90 -1.82 -11.47 -4.2370-year: 2009-78 . . . . . . . 14.05 15.96 -1.91 -12.00 -4.6275-year: 2009-83 . . . . . . . 14.02 16.02 -2.00 -12.50 -5.00

Actuarial Estimates
68
7. Reasons for Change in Actuarial Balance From Last Report
The estimated effects of various changes from last year’s report to this reporton the long-range actuarial balance under the intermediate assumptions arelisted (by category) in table IV.B9.
Figure IV.B4.—Test of Long-Range Close Actuarial Balance[Comparison of long-range actuarial balances with the minimum allowable
for close actuarial balance under intermediate assumptions]
-20%
-15%
-10%
-5%
0%
5%
10%
15%
20%
25%
30%
35%
40%
2018 2023 2028 2033 2038 2043 2048 2053 2058 2063 2068 2073 2078 2083Ending year of valuation period
Actuarial balance as percentage of summarized cost rate
Minimum allowable actuarial balance
OASI
OASDI
DI
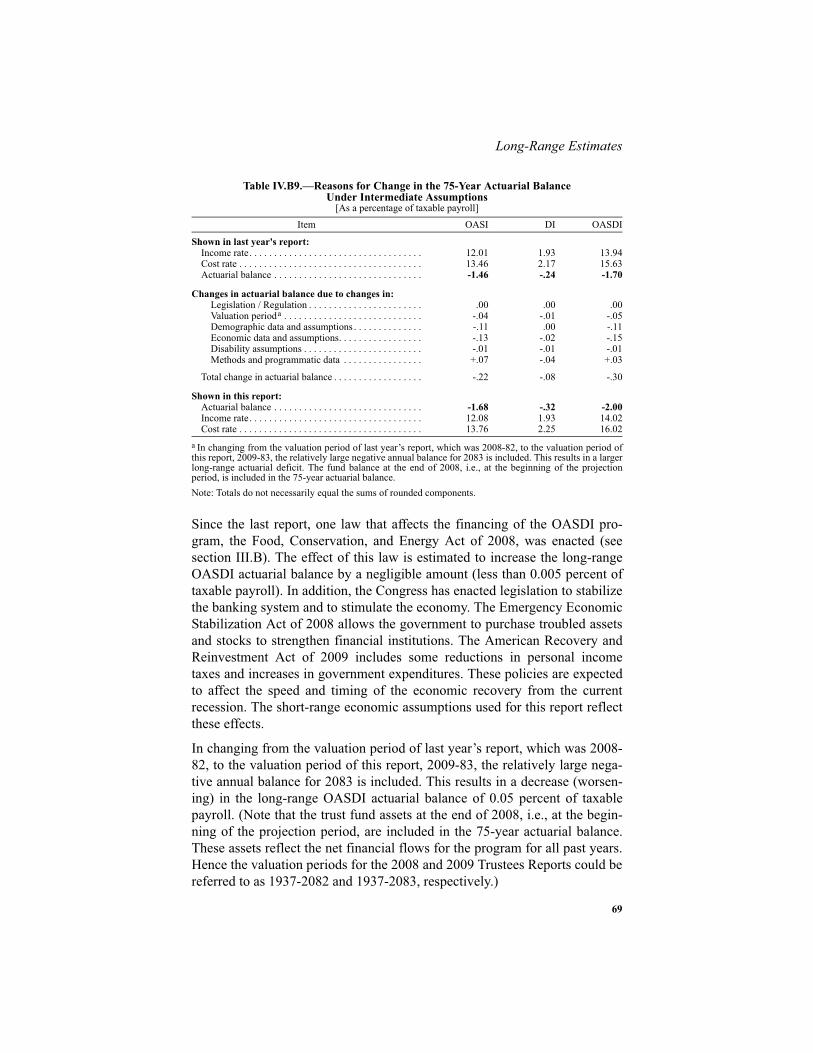
69
Long-Range Estimates
Note: Totals do not necessarily equal the sums of rounded components.
Since the last report, one law that affects the financing of the OASDI pro-gram, the Food, Conservation, and Energy Act of 2008, was enacted (seesection III.B). The effect of this law is estimated to increase the long-rangeOASDI actuarial balance by a negligible amount (less than 0.005 percent oftaxable payroll). In addition, the Congress has enacted legislation to stabilizethe banking system and to stimulate the economy. The Emergency EconomicStabilization Act of 2008 allows the government to purchase troubled assetsand stocks to strengthen financial institutions. The American Recovery andReinvestment Act of 2009 includes some reductions in personal incometaxes and increases in government expenditures. These policies are expectedto affect the speed and timing of the economic recovery from the currentrecession. The short-range economic assumptions used for this report reflectthese effects.
In changing from the valuation period of last year’s report, which was 2008-82, to the valuation period of this report, 2009-83, the relatively large nega-tive annual balance for 2083 is included. This results in a decrease (worsen-ing) in the long-range OASDI actuarial balance of 0.05 percent of taxablepayroll. (Note that the trust fund assets at the end of 2008, i.e., at the begin-ning of the projection period, are included in the 75-year actuarial balance.These assets reflect the net financial flows for the program for all past years.Hence the valuation periods for the 2008 and 2009 Trustees Reports could bereferred to as 1937-2082 and 1937-2083, respectively.)
Table IV.B9.—Reasons for Change in the 75-Year Actuarial BalanceUnder Intermediate Assumptions
[As a percentage of taxable payroll]
Item OASI DI OASDI
Shown in last year's report:Income rate. . . . . . . . . . . . . . . . . . . . . . . . . . . . . . . . . . . 12.01 1.93 13.94Cost rate . . . . . . . . . . . . . . . . . . . . . . . . . . . . . . . . . . . . . 13.46 2.17 15.63Actuarial balance . . . . . . . . . . . . . . . . . . . . . . . . . . . . . . -1.46 -.24 -1.70
Changes in actuarial balance due to changes in:Legislation / Regulation . . . . . . . . . . . . . . . . . . . . . . . .00 .00 .00Valuation perioda . . . . . . . . . . . . . . . . . . . . . . . . . . . .
a In changing from the valuation period of last year’s report, which was 2008-82, to the valuation period ofthis report, 2009-83, the relatively large negative annual balance for 2083 is included. This results in a largerlong-range actuarial deficit. The fund balance at the end of 2008, i.e., at the beginning of the projectionperiod, is included in the 75-year actuarial balance.
-.04 -.01 -.05Demographic data and assumptions . . . . . . . . . . . . . . -.11 .00 -.11Economic data and assumptions. . . . . . . . . . . . . . . . . -.13 -.02 -.15Disability assumptions . . . . . . . . . . . . . . . . . . . . . . . . -.01 -.01 -.01Methods and programmatic data . . . . . . . . . . . . . . . . +.07 -.04 +.03
Total change in actuarial balance . . . . . . . . . . . . . . . . . . -.22 -.08 -.30
Shown in this report:Actuarial balance . . . . . . . . . . . . . . . . . . . . . . . . . . . . . . -1.68 -.32 -2.00Income rate. . . . . . . . . . . . . . . . . . . . . . . . . . . . . . . . . . . 12.08 1.93 14.02Cost rate . . . . . . . . . . . . . . . . . . . . . . . . . . . . . . . . . . . . . 13.76 2.25 16.02
Actuarial Estimates
70
Changes in the demographic starting values and assumptions reduce thelong-range OASDI actuarial balance by 0.11 percent of taxable payroll. First,the source of change contributing most to this reduction is the revision ofultimate rates of decline in mortality. The most significant of these revisionsare faster ultimate rates of decline in death rates for heart disease and cancerfor ages 65-84. In addition, final mortality data for 2005 result in slightlylower starting death rates and faster near-term declines in death rates than inlast year’s report. All of the mortality changes result in a decrease in thelong-range OASDI actuarial balance of about 0.12 percent of taxable payroll.Second, immigration levels for the first several years of the projection periodare assumed to be slightly lower than the levels in last year’s report, reflect-ing both a lower starting level of immigration and the weaker economy dur-ing the recession and recovery period. These lower levels result in a decreasein the long-range OASDI actuarial balance of about 0.01 percent of taxablepayroll. Third, partially offsetting the effect of the mortality and immigrationchanges are higher assumed birth rates during the first 24 years of the projec-tion period. This revision stems from preliminary birth data for 2006 thatindicate higher than expected numbers of births, and results in an increase inthe long-range OASDI actuarial balance of about 0.02 percent of taxablepayroll.
Ultimate economic assumptions are unchanged from those in last year’sreport. However, changes in starting values and in the near-term economicgrowth assumptions significantly reduce the long-range OASDI actuarialbalance by about 0.15 percent of taxable payroll. The projections begin withan economic recession where negative real GDP growth that started in thethird calendar quarter of 2008 is assumed to continue though the secondquarter of 2009. The recovery from the recession is projected to extendthrough 2015. During the period of negative real GDP growth and the periodof recovery, unemployment rates are higher than the assumed ultimate leveland higher than projected in last year’s report. Reduced employment duringthese periods leads to significantly less payroll taxes, resulting in smallertrust fund accumulations. For 2017 and later, real GDP is projected to beabout 1.4 percent lower than in the 2008 report, based on recent data and theeffects of the recession. Reduced average benefit levels resulting from therecession only partly offset the effects on revenue. Based on recent experi-ence, interest rates for new special-issue Treasury bonds are assumed to belower through 2012 than in last year’s report.
Several changes in disability assumptions and data are included in this reportand combine to decrease the long-range OASDI actuarial balance by 0.01percent of taxable payroll. First, disability incidence rates are substantiallyhigher in the first few years of the projection period as more individuals areassumed to apply for disability benefits due to the economic recession. These
71
Long-Range Estimates
increased incidence rates reduce the long-range OASDI actuarial balance by0.02 percent of taxable payroll. Second, the disability incidence rate assump-tions are slightly increased to reflect the agency’s decision that certain poli-cies currently applying only in the Boston region (in particular, the policy toclose a disability claimant’s record to new evidence after a determination foran initial appeal to an administrative law judge) would not be extended toother regions. This decision reduces the long-range OASDI actuarial balanceby 0.01 percent of taxable payroll. Third, the ultimate disability incidencerates and the disability-insured population are updated to reflect more recenthistorical data and trends (other than the recession), resulting in an improve-ment in the actuarial balance of 0.02 percent of taxable payroll.
Several methodological improvements and updates of program-specific dataare included in this report. These changes to programmatic data and methodshave largely offsetting effects and combine to increase the long-rangeOASDI actuarial balance by 0.03 percent of taxable payroll.
Three significant changes were made in the methods for determining averagebenefit amounts for retired-worker and disabled-worker beneficiaries forprojection years 11 through 75. First, the factors used to project growth inbenefit levels after initial entitlement in excess of the COLA (due to addi-tional earnings and lower mortality for higher earners) were updated, reflect-ing recent data. Second, post-entitlement factors were newly developed andapplied for the following additional beneficiary categories: (1) retired-worker beneficiaries after conversion from disabled-worker status at normalretirement age; (2) retired-worker beneficiaries over age 95; and (3) dis-abled-worker beneficiaries. Third, the transitioning of projected average ben-efit levels, from the end of the 10-year short-range period to the remainder ofthe long-range period, was improved. These three changes combined toincrease the projected average benefit level for disabled-worker beneficiariesand decrease the projected average benefit level for retired-worker beneficia-ries over the long-range projection period. As a result, the long-range OASIactuarial balance decreased by 0.05 percent of taxable payroll, and the long-range DI actuarial balance increased by a similar amount. In total, the com-bined effects increased the long-range OASDI actuarial balance by 0.01 per-cent of taxable payroll.
Three additional significant changes were made in the area of methodologi-cal improvements and updates of program-specific data. First, the ultimateprojected relationship between benefits and personal income taxes onOASDI benefits was updated based on new estimates provided by the Officeof Tax Analysis at the Department of the Treasury. The revisions in the esti-mates of tax revenue increase the long-range OASDI actuarial balance by0.02 percent of taxable payroll. Second, the methodology for projecting the

Actuarial Estimates
72
financial interchange between the Social Security Administration and theRailroad Retirement Board (RRB) was improved by using data and projec-tions provided directly from the RRB. The improvement in the methodologyof RRB estimates decreases the long-range OASDI actuarial balance by 0.01percent of taxable payroll. Third, starting level data and estimates wererevised for retroactive payments to beneficiaries for periods of benefit enti-tlement prior to award; plus estimates of the effect of the windfall elimina-tion provision for individuals with pensions based on non-OASDI-coveredemployment were revised. These final updates, and other improvementsbased on more recent historical information, result in an increase in the long-range OASDI actuarial balance of about 0.01 percent of taxable payroll.
If no changes in assumptions or methods were made for this report and actualexperience had met expectations since the last report, the OASDI long-rangeactuarial deficit would have increased by 0.05 percent of taxable payroll dueto the change in the valuation period. However, the combined changes madein data, assumptions, and methods for this report increase the actuarial deficitby an additional 0.25 percent of taxable payroll. Thus the actuarial deficitincreases from 1.70 percent in last year’s report to 2.00 percent of taxablepayroll in this report.
The effects of changes made in this report can also be illustrated by compar-ing the annual (cash-flow) balances for this and the prior year’s report. Fig-ure IV.B5 provides this comparison for the combined OASDI program overthe long-range (75-year) projection period.

73
Long-Range Estimates
During the first 10 years of the projection period, the annual balances in thisreport are lower than those in last year’s report by about 0.52 percent of tax-able payroll, on average. This is mainly due to (1) a lower starting level ofreal GDP than was assumed last year for 2008, and (2) the economic reces-sion which is projected to cause a decline in income from payroll taxes andan increase in the number of disabled-worker beneficiaries. After 2018, thedifference in projected annual balances between the two reports increasesthrough about 2025 due to the improved method for transitioning projectedaverage benefit levels from the short-range period to the long-range period.The effect of generally lower post-entitlement factors then causes the differ-ence to decline, reaching similar annual balances around 2063. Thereafter,the projected annual balances in this year’s report gradually become lowerthan in last year’s report due primarily to the increase in assumed rates ofdecline in mortality. By the end of last year’s 75-year projection period(2082), the difference in the annual balances is 0.09 percent of payroll. Theannual deficit for 2082 is 4.29 percent of taxable payroll in this report com-pared to 4.20 percent for 2082 in last year’s report.
Figure IV.B5.—OASDI Annual Balances: 2008 and 2009 Trustees Reports[As a percentage of taxable payroll under the intermediate assumptions]
-6%
-4%
-2%
0%
2%
4%
2005 2015 2025 2035 2045 2055 2065 2075 2085
Calendar year
2008 Report2009 Report
Assumptions & Methods
74
V. ASSUMPTIONS AND METHODS UNDERLYINGACTUARIAL ESTIMATES
The future income and cost of the OASDI program will depend on manydemographic, economic, and program-specific factors. Trust fund incomewill depend on how these factors affect the size and composition of theworking population and the level and distribution of earnings. Similarly, pro-gram cost will depend on how these factors affect the size and compositionof the beneficiary population and the general level of benefits.
Basic assumptions are developed for several of these factors based on analy-sis of historical trends and conditions, and on expected future conditions.These factors include fertility, mortality, immigration, marriage, divorce,productivity, inflation, average earnings, unemployment, retirement, and dis-ability incidence and termination. Other factors are projected using methodsthat reflect historical and expected future relationships to the basic assump-tions. These include total population, life expectancy, labor force, grossdomestic product, interest rates, and many program-specific factors. Itshould be noted that all factors included in any consistent set of assumptionsare interrelated directly or indirectly. It is also important to note that theseinterrelationships can and do change over time.
The assumptions and methods used in this report are reexamined each year inlight of recent experience and new information about future conditions, andare revised if warranted.
Because projections of these factors and their interrelationships are inher-ently uncertain, a range of estimates is shown in this report on the basis ofthree sets of assumptions, designated as intermediate (alternative II), low-cost (alternative I), and high-cost (alternative III). The intermediate set repre-sents the Board’s best estimate of the future course of the population and theeconomy. In terms of the net effect on the status of the OASDI program, thelow-cost is more optimistic, and the high-cost is more pessimistic. The low-and high-cost sets of assumptions reflect significant potential changes in theinterrelationship among factors, as well as changes in the values for individ-ual factors. The probability is very low that all the factors and interactionswould differ in the same direction from those expected for long periods oftime. Outcomes with overall long-range cost as low as (or lower than) thelow-cost scenario or as high as (or higher than) the high-cost scenario alsohave a very low probability. This report also includes a stochastic projectionthat provides a probability distribution of possible future outcomes that iscentered around the intermediate assumptions. These are discussed inAppendix E.

75
Demographic Assumptions and Methods
Although these three sets of demographic and economic assumptions havebeen developed to provide a broad range of possible outcomes, the resultingestimates should be interpreted with care. The estimates are not intended tobe specific predictions of the future financial status of the OASDI program,but rather, they are intended to be indicators of the expected trend and a rea-sonable range of future income and cost, under a variety of plausible demo-graphic and economic conditions.
The values for each of the demographic, economic, and program-specificfactors are assumed to move from recently experienced levels or trends,toward long-range ultimate values, generally over the next 25 years. Ulti-mate values or trends reached by the end of the 75-year long-range period aregenerally maintained at these levels or trends for extrapolations beyond 75years. One exception is for real-wage growth, as described in section IV.B.5.
The assumed ultimate values, which are reached within the first 25 years(and apply thereafter through the end of the 75-year long-range period) forboth the demographic and the economic factors, are intended to representaverage annual experience or growth rates. Actual future values will exhibitfluctuations or cyclical patterns, as in the past.
The following sections discuss, in abbreviated form, the various assumptionsand methods required to make the estimates of trust fund financial status,which are the heart of this report.1 There are, of course, many interrelation-ships among these factors that make a sequential presentation potentiallymisleading. Nevertheless, the following sections roughly follow the orderused in building the trust fund estimates presented in chapter IV.
A. DEMOGRAPHIC ASSUMPTIONS AND METHODS
The principal demographic assumptions relating to fertility, mortality, andnet immigration for the three alternatives are shown in table V.A1. Therationales for selecting these assumptions are discussed in the followingthree sections.
1 Further details about the assumptions, methods, and actuarial estimates are contained in Actuarial Studiespublished by the Office of the Chief Actuary, Social Security Administration. A complete list of availablestudies may be found on the Social Security website at:www.socialsecurity.gov/OACT/NOTES/actstud.html. To obtain copies of such studies, or of this report, sub-mit a request via our Internet request form at www.socialsecurity.gov/OACT/request.html; or write to:Office of the Chief Actuary, 700 Altmeyer Building, 6401 Security Boulevard, Baltimore, MD 21235; orcall 410-965-3000. This entire report, along with supplemental year-by-year tables, may also be found atwww.socialsecurity.gov/OACT/TR/TR09/index.html.
Assumptions & Methods
76
1. Fertility Assumptions
Fertility assumptions are developed for women in the form of birth rates bysingle year of age, from 14 to 49. They are applied to the total number ofwomen in the population at each age, for all marital statuses.
Historically, birth rates in the United States have fluctuated widely. The totalfertility rate1 decreased from 3.31 children per woman at the end of WorldWar I (1918) to 2.15 during the Great Depression (1936). After 1936, thetotal fertility rate rose to 3.68 in 1957 and then fell to 1.74 by 1976. After1976, the total fertility rate began to rise again, reaching a level of 2.07 for1990. In the 1990s, the total fertility rate remained fairly stable, around 2.00children per woman. Since 2000, the total fertility rate has been consistentlyabove 2.00, and was 2.06 in 2005.
These variations in the total fertility rate resulted from changes in many fac-tors, including social attitudes, economic conditions, and the use of birth-control methods. Future total fertility rates may be expected to remain closeto recent levels. Certain population characteristics, such as the higher per-centages of women who have never married, of women who are divorced,and of young women who are in the labor force, are consistent with contin-ued lower total fertility rates than experienced during the baby-boom era(1946-65). Based on consideration of these factors, ultimate total fertilityrates of 2.30, 2.00 and 1.70 children per woman are assumed for the low-cost, intermediate, and high-cost assumptions, respectively. These assump-tions are unchanged from those used in last year’s report.
Based on preliminary data for 2006 and 2007, the total fertility rate isassumed to reach a level of 2.10 children per woman for both 2006 and 2007and 2.08 for 2008. These levels are slightly higher than those estimated inlast year’s report for the intermediate assumptions. For all three alternatives,the total fertility rate is then assumed to follow a gradual trend toward theselected ultimate level, which is reached in 2033.
2. Mortality Assumptions
For the projections in this year’s report, assumed average percentage reduc-tions in future mortality rates were developed by age-group, sex, and causeof death. These assumptions were then used to estimate future central death
1 Defined to be the average number of children that would be born to a woman in her lifetime if she were toexperience the birth rates by age observed in, or assumed for, the selected year, and if she were to survive theentire childbearing period. A rate of 2.1 would ultimately result in a nearly constant population if net immi-gration were zero and if death rates were constant.
77
Demographic Assumptions and Methods
rates by age-group, sex, and cause of death. From these estimated centraldeath rates, resulting probabilities of death by single year of age and sexwere calculated.
Historical death rates (for years 1900-2005) used in developing estimates forthis report were calculated for ages below 65 (and for all ages for years priorto 1968) using data from the National Center for Health Statistics (NCHS).1For ages 65 and over, final Medicare data on deaths and enrollments wereused for years 1968 through 2005. Death rates by cause of death at all ages,for years 1979-2005, were produced by the NCHS.
The total age-sex-adjusted death rate2 declined at an average rate3 of1.07 percent per year between 1900 and 2005. Between 1979 and 2005, theperiod for which death rates were analyzed by cause, the total age-sex-adjusted death rate (for all causes combined) declined at an average rate of0.82 percent per year.
Death rates have declined substantially in the U.S. since 1900, with rapiddeclines over some periods and slow or no improvement over the other peri-ods. Historical death rates generally declined more slowly for older ages thanfor the rest of the population. The age-sex-adjusted death rate for ages 65 andover declined at an average rate of 0.75 percent per year between 1900 and2005. Between 1982 and 2005 the age-sex-adjusted death rate for these agesdeclined at an average annual rate of 0.57 percent.
Reductions in death rates resulted from many factors, including increasedmedical knowledge and availability of health-care services, and improve-ments in sanitation and nutrition. Based on consideration of the expected rateof future progress in these and other areas, three alternative sets of ultimateannual percentage reductions in central death rates by age group, sex, andcause of death are assumed for 2033 and later. The intermediate set, which isused for alternative II, is considered to be the most likely to occur. The aver-age annual percentage reductions used for alternative I are generally smallerthan those for alternative II, while those used for alternative III are generallylarger. These three sets of ultimate annual percentage reductions differslightly from those used in last year’s report. Overall, age-sex-adjusted deathrates are projected to decline slightly faster than in last year’s report. The dif-
1 These rates reflect NCHS data on deaths and Census estimates of population. 2 Calculated here as the crude rate that would occur in the enumerated total population, as of April 1, 2000,if that population were to experience the death rates by age and sex for the selected year. 3 Average rate of decline is calculated as the annual geometric rate of reduction between the first and lastyears of the period.
Assumptions & Methods
78
ferences reflect an assessment of long-term trends based on mortality datafrom 1900 through 2005. The most significant changes in the ultimate ratesof reduction in death rates are increases in these rates for heart disease andcancer between ages 65-84. For these ages and these causes of death,declines in death rates have consistently exceeded expectations in recentyears.
After 2005, the reductions in central death rates for alternative II areassumed to change rapidly from the average annual reductions by age group,sex, and cause of death observed between 1985 and 2005, to the ultimateannual percentage reductions by age group, sex, and cause of death assumedfor 2033 and later. The reductions in death rates under alternatives I and IIIare also assumed to change rapidly to their ultimate levels, but start from lev-els which are, respectively, 50 or 150 percent of the average annual reduc-tions observed between 1985 and 2005.
Projections of age-sex-adjusted death rates are presented in table V.A1 forthe total population (all ages), for under age 65, and for ages 65 and over.Under the intermediate assumptions, projected age-sex-adjusted death ratesfor the total population are lower than the death rates in last year’s report.However, for the age group under age 65, projected age-sex-adjusted deathrates are slightly higher than in last year’s report. This change primarilyresults from updating starting levels of mortality to reflect the most recentdata. For the age group 65 and over, projected age-sex-adjusted death ratesare lower than in last year’s report. This is primarily due to the increased ulti-mate rates of decline in mortality that are assumed for ages 65 through 84.
After adjustment for changes in the age-sex distribution of the population,the resulting total death rates are projected to decline at ultimate averageannual rates of about 0.35 percent, 0.77 percent, and 1.24 percent between2033 and 2083 for alternatives I, II, and III, respectively. In keeping with thepatterns observed in the historical data, future rates of decline are assumed tobe greater for younger ages than for older ages, but to a substantially lesserdegree than in the past. Accordingly, age-sex-adjusted death rates for ages 65and over are projected to decline at average annual rates of about0.32 percent, 0.71 percent, and 1.18 percent between 2033 and 2083 foralternatives I, II, and III, respectively.
Experts express a wide range of views on the likely rate of future decline indeath rates. For example, the 2007 Technical Panel on Assumptions andMethods appointed by the Social Security Advisory Board believed that ulti-mate rates of decline in mortality will be higher than the rates of declineassumed for the intermediate projections in this report. Others believe that

79
Demographic Assumptions and Methods
biological and social factors may slow future rates of decline in mortality.Evolving mortality trends and developments in health care and lifestyle willbe closely monitored to determine what further modifications to the assumedultimate rates of decline in mortality may be warranted for future reports.
3. Immigration Assumptions
In order to develop projections of the total Social Security area population,assumptions are made for annual legal immigration, legal emigration, otherimmigration, and other emigration. Legal immigration consists of personswho are granted legal permanent resident (LPR) status. Legal emigrationconsists of those legal immigrants and native-born citizens who leave theSocial Security area population. Net legal immigration is then calculated asthe difference between legal immigration and legal emigration. Other immi-gration consists of immigrants who enter the Social Security area in a givenyear and stay to the end of that year without having LPR status, such asundocumented immigrants and temporary foreign workers and students.Other emigration consists of other immigrants who leave the Social Securityarea population or who adjust their status to LPR. Net other immigration isthen calculated as the difference between other immigration and other emi-gration. Net immigration refers to the sum of net legal immigration and netother immigration.
Separate assumptions are developed for the low-cost, intermediate, and high-cost scenarios. The low-cost scenario includes higher annual net immigrationand the high-cost scenario includes lower annual net immigration.
Legal immigration increased after World War II to around 300,000 personsper year and remained around that level until shortly after 1960. With theImmigration Act of 1965 and other related changes, annual legal immigra-tion increased to about 400,000 and remained fairly stable until 1977.Between 1977 and 1990, legal immigration once again increased, averagingabout 580,0001 per year. The Immigration Act of 1990, which took effect infiscal year 1992, restructured the immigration categories and increased sig-nificantly the number of immigrants who may legally enter the United States.
Legal immigration averaged about 790,0001 persons per year during theperiod 1992 through 2000. Legal immigration increased to about 900,000 in2000 and about 1,000,000 in 2001 reflecting primarily an increase in thenumber of persons granted LPR status as immediate relatives of U.S. citi-
1 Excludes those persons who attained legal permanent resident status under the special, one-time provi-sions of the Immigration Reform and Control Act of 1986.

Assumptions & Methods
80
zens, the only category of legal immigration that is not numerically limited.However, legal immigration declined to less than 800,000 by 2003 as thenumber of pending applications increased. From 2003 to 2006, legal immi-gration increased, reaching about 1,200,000 for 2005 and 2006. For 2007,legal immigration decreased to about 1,100,000. Legal immigration in excessof 1,000,000 reflects the concerted effort in recent years to reduce the back-log of pending applications for LPR status.
For the intermediate alternative, the remaining backlog of pending applica-tions is assumed to be reduced by the end of 2009, and thereafter legal immi-gration is assumed to average approximately 1,000,000 persons per year. Foralternatives I and III, annual legal immigration is ultimately assumed to be1,200,000 persons and 800,000 persons, respectively. These are the sameassumptions used in the 2008 report.
The ratios of annual legal emigration to legal immigration are assumed to be20, 25, and 30 percent for alternatives I, II, and III, respectively. This rangeis consistent with the limited historical data for legal emigration from theSocial Security area. These are the same ratios used in the 2008 TrusteesReport. Combining the annual legal immigration and emigration assump-tions results in ultimate net legal immigration of 750,000 persons per yearunder the intermediate alternative. For the low-cost and high-cost scenarios,ultimate annual net legal immigration is 960,000 persons and 560,000 per-sons, respectively.
The number of other immigrants residing in the Social Security area popula-tion is estimated to have been about 9.7 million persons as of January 1,2000, increasing to about 12.8 million persons as of January 1, 2006. Thisother-immigrant population is highly mobile and far more likely to leave theSocial Security area than is the native-born or legal-immigrant population.The average number of persons entering the other-immigrant population inthe period 2000 through 2006 is estimated to have been about 1.5 million peryear. During the same period, the number of other immigrants who left theSocial Security area or adjusted status to become LPRs is estimated to haveaveraged about 960,000 per year. Thus, annual net other immigration duringthis time period is estimated to have averaged approximately 540,000 per-sons.
For the intermediate assumptions, annual other immigration is assumed tocontinue at the level of 1.5 million persons throughout the projection period.For the low- and high-cost scenarios, future annual other immigration isassumed to average 1.8 million persons and 1.2 million persons, respectively.

81
Demographic Assumptions and Methods
Emigration from the other-immigrant population includes those who leavethe Social Security area and those who adjust status to become LPRs. Theannual number of other immigrants who leave the Social Security area isestimated based on modeled departures, disaggregated into two groups, forthe period 2000-06. The first departing group is set at fixed annual numbersof departures, by age and sex, which remain constant throughout the projec-tion period. This first group is directly related to the number of other immi-grants that are assumed to have recently entered the Social Security area. Thesecond departing group is calculated by applying a set of annual departurerates, by age and sex, to the other-immigrant population in the Social Secu-rity area. In addition, the annual number of other immigrants who adjust sta-tus to become LPRs is assumed to ultimately be 500,000 for the intermediateassumptions. This level is one third of the annual number of other immi-grants assumed to enter the Social Security area. For the low- and high-costscenarios, ultimate annual numbers adjusting status to LPR are assumed toaverage 600,000 persons and 400,000 persons, respectively.
Under the assumptions and methods described above, the size of the other-immigrant population is projected to grow substantially. This growth reflectsthe excess of annual other immigration over the combined annual numbers ofemigrants and deaths that occur within the other-immigrant population.
Net other immigration decreased from a level averaging over 590,000 peryear in the period 2000 through 2003, to about 465,000 in 2006, reflecting anincrease in the number of other immigrants adjusting to LPR status as aresult of the effort to reduce the backlog of applications for LPR status. By2010, when the backlog of applications is expected to be eliminated, netother immigration is projected to be about 440,000 persons per year. After2010, net other immigration is projected to decline steadily to about 275,000in 2063 and to remain fairly stable thereafter. The decline in net other immi-gration is attributable to the increasing number of other immigrants residingin the Social Security area. This results in an increase in the numbers whoemigrate out of the area based on the rates of departure described above. Allother components of other immigration and emigration are set at fixed levelsafter 2010, and thus do not contribute toward any change in net other immi-gration. The average annual level of net other immigration over the 75-yearprojection period is about 315,000 persons. Net other immigration is esti-mated to average about 410,000 persons per year under the low-cost assump-tions and 220,000 persons per year under the high-cost assumptions.
The total level of net immigration (legal and other combined) is estimated toaverage 1,065,000 persons per year during the 75-year projection periodunder the intermediate assumptions. For the low-cost assumptions, total net
Assumptions & Methods
82
immigration is estimated to average 1,370,000 persons per year. Under thehigh-cost assumptions, total net immigration is estimated to average 785,000persons per year.
Demographers express a wide range of views about the future course ofimmigration for the United States. Some, like the 2007 Technical Panel men-tioned in the previous section, believe that immigration will increase sub-stantially in the future. Others believe that potential immigrants may beattracted to other countries or that the U.S. borders could be tightened in thefuture.

83
Demographic Assumptions and Methods
Table V.A1.—Principal Demographic Assumptions, Calendar Years 1940-2085
Calendar year
Totalfertility
ratea
Age-sex-adjusted death rateb per 100,000, by age Net immigrationc
Total Under 65 65 and over Legald Othere
Historical data:1940 . . . . . . . . . 2.23 1,779.1 673.0 9,569.0 45,0001945 . . . . . . . . . 2.42 1,586.6 601.8 8,522.4 55,0001950 . . . . . . . . . 3.03 1,435.6 499.4 8,028.3 170,0001955 . . . . . . . . . 3.50 1,334.2 442.8 7,612.2 210,0001960 . . . . . . . . . 3.61 1,330.9 436.9 7,626.7 200,0001965 . . . . . . . . . 2.88 1,304.6 430.0 7,464.0 230,0001970 . . . . . . . . . 2.43 1,224.3 422.6 6,870.7 280,0001975 . . . . . . . . . 1.77 1,099.0 369.5 6,236.4 295,0001980 . . . . . . . . . 1.82 1,035.9 331.9 5,993.6 410,000 375,0001985 . . . . . . . . . 1.83 984.2 303.6 5,777.6 435,000 375,0001990 . . . . . . . . . 2.07 931.2 289.4 5,451.1 500,000 550,000
1995 . . . . . . . . . 1.98 913.9 277.3 5,397.5 575,000 550,0001996 . . . . . . . . . 1.98 900.4 266.1 5,367.2 665,000 550,0001997 . . . . . . . . . 1.97 885.1 253.6 5,332.5 570,000 550,0001998 . . . . . . . . . 2.00 878.3 246.9 5,325.2 490,000 550,0001999 . . . . . . . . . 2.01 884.3 245.0 5,386.6 520,000 550,0002000 . . . . . . . . . 2.05 875.7 243.4 5,328.3 670,000 625,0002001 . . . . . . . . . 2.03 867.4 243.6 5,260.7 795,000 495,0002002 . . . . . . . . . 2.02 863.7 242.7 5,236.6 730,000 550,0002003 . . . . . . . . . 2.05 851.5 241.4 5,148.2 575,000 685,0002004 . . . . . . . . . 2.06 820.1 235.0 4,940.6 750,000 505,0002005 . . . . . . . . . 2.06 822.2 236.2 4,949.3 870,000 440,0002006f . . . . . . . . 2.10 825.4 230.5 5,015.2 910,000 465,0002007f . . . . . . . . 2.10 820.5 227.6 4,995.5 790,000 480,0002008f. . . . . . . . . 2.08 815.8 224.9 4,977.4 825,000 410,000
Intermediate: 2010 . . . . . . . . . 2.08 806.4 219.6 4,939.2 750,000 440,0002015 . . . . . . . . . 2.06 776.4 207.2 4,785.2 750,000 405,0002020 . . . . . . . . . 2.04 743.2 195.7 4,599.7 750,000 380,0002025 . . . . . . . . . 2.03 710.6 184.9 4,412.5 750,000 355,0002030 . . . . . . . . . 2.01 679.5 174.8 4,233.4 750,000 335,0002035 . . . . . . . . . 2.00 650.3 165.5 4,064.4 750,000 315,0002040 . . . . . . . . . 2.00 622.9 156.7 3,906.3 750,000 300,0002045 . . . . . . . . . 2.00 597.4 148.6 3,758.5 750,000 290,0002050 . . . . . . . . . 2.00 573.5 140.9 3,620.1 750,000 285,0002055 . . . . . . . . . 2.00 551.2 133.8 3,490.5 750,000 280,0002060 . . . . . . . . . 2.00 530.2 127.1 3,368.8 750,000 280,0002065 . . . . . . . . . 2.00 510.5 120.9 3,254.5 750,000 275,0002070 . . . . . . . . . 2.00 492.0 115.0 3,147.0 750,000 275,0002075 . . . . . . . . . 2.00 474.6 109.5 3,045.6 750,000 275,0002080 . . . . . . . . . 2.00 458.2 104.3 2,950.1 750,000 275,0002085 . . . . . . . . . 2.00 442.7 99.5 2,859.8 750,000 275,000
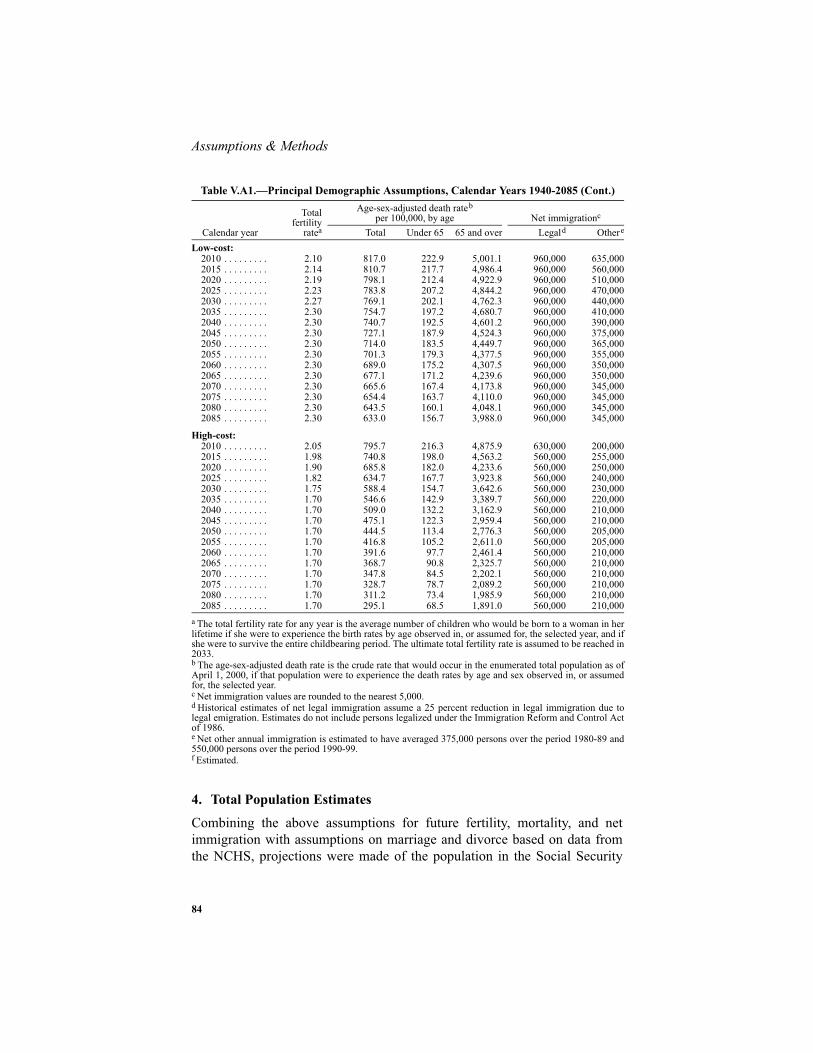
Assumptions & Methods
84
4. Total Population Estimates
Combining the above assumptions for future fertility, mortality, and netimmigration with assumptions on marriage and divorce based on data fromthe NCHS, projections were made of the population in the Social Security
Low-cost: 2010 . . . . . . . . . 2.10 817.0 222.9 5,001.1 960,000 635,0002015 . . . . . . . . . 2.14 810.7 217.7 4,986.4 960,000 560,0002020 . . . . . . . . . 2.19 798.1 212.4 4,922.9 960,000 510,0002025 . . . . . . . . . 2.23 783.8 207.2 4,844.2 960,000 470,0002030 . . . . . . . . . 2.27 769.1 202.1 4,762.3 960,000 440,0002035 . . . . . . . . . 2.30 754.7 197.2 4,680.7 960,000 410,0002040 . . . . . . . . . 2.30 740.7 192.5 4,601.2 960,000 390,0002045 . . . . . . . . . 2.30 727.1 187.9 4,524.3 960,000 375,0002050 . . . . . . . . . 2.30 714.0 183.5 4,449.7 960,000 365,0002055 . . . . . . . . . 2.30 701.3 179.3 4,377.5 960,000 355,0002060 . . . . . . . . . 2.30 689.0 175.2 4,307.5 960,000 350,0002065 . . . . . . . . . 2.30 677.1 171.2 4,239.6 960,000 350,0002070 . . . . . . . . . 2.30 665.6 167.4 4,173.8 960,000 345,0002075 . . . . . . . . . 2.30 654.4 163.7 4,110.0 960,000 345,0002080 . . . . . . . . . 2.30 643.5 160.1 4,048.1 960,000 345,0002085 . . . . . . . . . 2.30 633.0 156.7 3,988.0 960,000 345,000
High-cost:2010 . . . . . . . . . 2.05 795.7 216.3 4,875.9 630,000 200,0002015 . . . . . . . . . 1.98 740.8 198.0 4,563.2 560,000 255,0002020 . . . . . . . . . 1.90 685.8 182.0 4,233.6 560,000 250,0002025 . . . . . . . . . 1.82 634.7 167.7 3,923.8 560,000 240,0002030 . . . . . . . . . 1.75 588.4 154.7 3,642.6 560,000 230,0002035 . . . . . . . . . 1.70 546.6 142.9 3,389.7 560,000 220,0002040 . . . . . . . . . 1.70 509.0 132.2 3,162.9 560,000 210,0002045 . . . . . . . . . 1.70 475.1 122.3 2,959.4 560,000 210,0002050 . . . . . . . . . 1.70 444.5 113.4 2,776.3 560,000 205,0002055 . . . . . . . . . 1.70 416.8 105.2 2,611.0 560,000 205,0002060 . . . . . . . . . 1.70 391.6 97.7 2,461.4 560,000 210,0002065 . . . . . . . . . 1.70 368.7 90.8 2,325.7 560,000 210,0002070 . . . . . . . . . 1.70 347.8 84.5 2,202.1 560,000 210,0002075 . . . . . . . . . 1.70 328.7 78.7 2,089.2 560,000 210,0002080 . . . . . . . . . 1.70 311.2 73.4 1,985.9 560,000 210,0002085 . . . . . . . . . 1.70 295.1 68.5 1,891.0 560,000 210,000
a The total fertility rate for any year is the average number of children who would be born to a woman in herlifetime if she were to experience the birth rates by age observed in, or assumed for, the selected year, and ifshe were to survive the entire childbearing period. The ultimate total fertility rate is assumed to be reached in2033.b The age-sex-adjusted death rate is the crude rate that would occur in the enumerated total population as ofApril 1, 2000, if that population were to experience the death rates by age and sex observed in, or assumedfor, the selected year.c Net immigration values are rounded to the nearest 5,000.d Historical estimates of net legal immigration assume a 25 percent reduction in legal immigration due tolegal emigration. Estimates do not include persons legalized under the Immigration Reform and Control Actof 1986.e Net other annual immigration is estimated to have averaged 375,000 persons over the period 1980-89 and550,000 persons over the period 1990-99.f Estimated.
Table V.A1.—Principal Demographic Assumptions, Calendar Years 1940-2085 (Cont.)
Calendar year
Totalfertility
ratea
Age-sex-adjusted death rateb per 100,000, by age Net immigrationc
Total Under 65 65 and over Legald Othere

85
Demographic Assumptions and Methods
area by age, sex, and marital status as of January 1 of each year 2008 through2085. The starting Social Security area population for January 1, 2007, isbased on the Census Bureau’s estimate of the residents of the 50 States andD.C., and U.S. Armed Forces overseas. The base estimate is adjusted for netcensus undercount and increased for other U.S. citizens living abroad(including residents of U.S. territories) and for non-citizens living abroadwho are insured for Social Security benefits. This starting population wasthen projected using assumed rates of birth, death, marriage and divorce, andassumed levels of net immigration.
Table V.A2 shows the historical and projected population as of July 1 bybroad age group, for the three alternatives. Also shown are aged and totaldependency ratios (see table footnotes for definitions).
Table V.A2.—Social Security Area Population as of July 1 and Dependency Ratios,Calendar Years 1950-2085
Calendar year
Population (in thousands) Dependency ratio
Under 20 20-6465 and
over Total Ageda Totalb
Historical data:1950 . . . . . . . . . . . . . . 54,466 92,841 12,811 160,118 0.138 0.7251960 . . . . . . . . . . . . . . 73,076 99,818 17,278 190,172 .173 .9051965 . . . . . . . . . . . . . . 80,052 104,805 19,070 203,927 .182 .9461970 . . . . . . . . . . . . . . 80,864 112,996 20,899 214,759 .185 .9011975 . . . . . . . . . . . . . . 78,776 122,579 23,254 224,609 .190 .8321980 . . . . . . . . . . . . . . 74,929 134,110 26,196 235,236 .195 .7541985 . . . . . . . . . . . . . . 73,401 144,851 29,122 247,374 .201 .7081990 . . . . . . . . . . . . . . 75,154 153,316 31,981 260,452 .209 .6991995 . . . . . . . . . . . . . . 79,542 160,871 34,336 274,749 .213 .7082000 . . . . . . . . . . . . . . 82,662 170,076 35,489 288,227 .209 .6952005 . . . . . . . . . . . . . . 84,383 180,384 37,415 302,182 .207 .6752008c . . . . . . . . . . . . . 85,612 186,221 39,179 311,012 .210 .670
Intermediate:2010 . . . . . . . . . . . . . . 86,141 189,953 40,503 316,597 .213 .6672015 . . . . . . . . . . . . . . 87,799 196,299 46,550 330,648 .237 .6842020 . . . . . . . . . . . . . . 90,483 199,981 54,266 344,729 .271 .7242025 . . . . . . . . . . . . . . 93,174 202,064 63,107 358,344 .312 .7732030 . . . . . . . . . . . . . . 95,338 204,743 70,832 370,913 .346 .8122035 . . . . . . . . . . . . . . 97,112 209,532 75,515 382,159 .360 .8242040 . . . . . . . . . . . . . . 98,759 215,603 78,026 392,388 .362 .8202045 . . . . . . . . . . . . . . 100,561 221,923 79,526 402,010 .358 .8112050 . . . . . . . . . . . . . . 102,635 227,201 81,603 411,440 .359 .8112055 . . . . . . . . . . . . . . 104,878 231,724 84,472 421,074 .365 .8172060 . . . . . . . . . . . . . . 106,963 235,988 88,190 431,141 .374 .8272065 . . . . . . . . . . . . . . 108,848 241,118 91,673 441,639 .380 .8322070 . . . . . . . . . . . . . . 110,673 246,309 95,355 452,337 .387 .8362075 . . . . . . . . . . . . . . 112,575 251,166 99,258 462,999 .395 .8432080 . . . . . . . . . . . . . . 114,582 255,759 103,145 473,486 .403 .8512085 . . . . . . . . . . . . . . 116,625 260,107 107,119 483,851 .412 .860

Assumptions & Methods
86
Notes:1. Historical data are subject to revision.2. Totals do not necessarily equal the sums of rounded components.
5. Life Expectancy Estimates
Life expectancy, or average remaining number of years expected prior todeath, is a useful analytical concept. Life expectancy is calculated in two dif-ferent forms, for two separate purposes.
Low-cost:2010 . . . . . . . . . . . . . . 86,377 190,351 40,497 317,225 0.213 0.6672015 . . . . . . . . . . . . . . 89,243 198,006 46,379 333,628 .234 .6852020 . . . . . . . . . . . . . . 93,876 202,922 53,724 350,522 .265 .7272025 . . . . . . . . . . . . . . 99,305 206,196 61,975 367,475 .301 .7822030 . . . . . . . . . . . . . . 104,975 210,075 68,888 383,939 .328 .8282035 . . . . . . . . . . . . . . 110,505 216,639 72,629 399,773 .335 .8452040 . . . . . . . . . . . . . . 115,667 225,230 74,195 415,093 .329 .8432045 . . . . . . . . . . . . . . 120,878 234,751 74,908 430,537 .319 .8342050 . . . . . . . . . . . . . . 126,451 243,911 76,416 446,779 .313 .8322055 . . . . . . . . . . . . . . 132,284 253,106 78,867 464,256 .312 .8342060 . . . . . . . . . . . . . . 138,322 262,595 82,158 483,075 .313 .8402065 . . . . . . . . . . . . . . 144,371 273,613 85,097 503,081 .311 .8392070 . . . . . . . . . . . . . . 150,389 285,567 88,068 524,025 .308 .8352075 . . . . . . . . . . . . . . 156,485 298,092 91,175 545,752 .306 .8312080 . . . . . . . . . . . . . . 162,792 310,673 94,804 568,268 .305 .8292085 . . . . . . . . . . . . . . 169,325 323,128 99,209 591,662 .307 .831
High-cost:2010 . . . . . . . . . . . . . . 85,925 189,590 40,514 316,029 .214 .6672015 . . . . . . . . . . . . . . 86,425 194,702 46,757 327,884 .240 .6842020 . . . . . . . . . . . . . . 87,241 197,202 54,920 339,363 .278 .7212025 . . . . . . . . . . . . . . 87,333 198,138 64,471 349,941 .325 .7662030 . . . . . . . . . . . . . . 86,195 199,665 73,158 359,018 .366 .7982035 . . . . . . . . . . . . . . 84,511 202,731 78,955 366,197 .389 .8062040 . . . . . . . . . . . . . . 83,041 206,360 82,576 371,977 .400 .8032045 . . . . . . . . . . . . . . 81,981 209,586 85,000 376,567 .406 .7972050 . . . . . . . . . . . . . . 81,310 211,145 87,718 380,173 .415 .8012055 . . . . . . . . . . . . . . 80,918 211,257 90,998 383,173 .431 .8142060 . . . . . . . . . . . . . . 80,193 210,683 95,057 385,933 .451 .8322065 . . . . . . . . . . . . . . 79,197 210,487 98,942 388,627 .470 .8462070 . . . . . . . . . . . . . . 78,225 209,710 103,173 391,108 .492 .8652075 . . . . . . . . . . . . . . 77,459 207,960 107,714 393,133 .518 .8902080 . . . . . . . . . . . . . . 76,866 205,919 111,691 394,476 .542 .9162085 . . . . . . . . . . . . . . 76,318 203,812 115,005 395,136 .564 .939
a Ratio of the population at ages 65 and over to the population at ages 20-64.b Ratio of the population at ages 65 and over and the population under age 20 to the population at ages20-64.c Estimated.
Table V.A2.—Social Security Area Population as of July 1 and Dependency Ratios,Calendar Years 1950-2085 (Cont.)
Calendar year
Population (in thousands) Dependency ratio
Under 20 20-6465 and
over Total Ageda Totalb
87
Demographic Assumptions and Methods
Period life expectancy is calculated for a given year using the actual orexpected death rates at each age for that year. It is a useful summary statisticfor illustrating the overall level of the death rates experienced in a singleyear. It is thus closely related to the age-sex-adjusted death rate that is dis-cussed in section V.A.2. Period life expectancy for a particular year may beviewed as the expected remaining life at a selected age only if it is assumedthat there is no change in death rates after that year.
Cohort life expectancy truly answers the question “What is the expectedaverage remaining lifetime for an individual at a selected age in a givenyear?” Cohort life expectancy is calculated using death rates not from a sin-gle year, but from the series of years in which the individual will actuallyreach each succeeding age if he or she survives. Cohort life expectancy isshown in table V.A4 for those born on January 1 of each calendar year, andfor those attaining age 65 on January 1 of each calendar year.
Tables V.A3 and V.A4 present historical and projected life expectancy calcu-lated on both period and cohort bases. Cohort life expectancy is somewhatgreater than period life expectancy for the same year. This is because deathrates for any given age tend to decline as time passes and the cohort growsolder.

Assumptions & Methods
88
Table V.A3.—Period Life Expectancya
a The period life expectancy at a given age for a given year represents the average number of years of liferemaining if a group of persons at that age were to experience the mortality rates for that year over the courseof their remaining lives.
Calendaryear
Low-cost Intermediate High-costAt birth At age 65 At birth At age 65 At birth At age 65
Male Female Male Female Male Female Male Female Male Female Male Female
Historical data:1940 . . . . 61.4 65.7 11.9 13.41945 . . . . 62.9 68.4 12.6 14.41950 . . . . 65.6 71.1 12.8 15.11955 . . . . 66.7 72.8 13.1 15.61960 . . . . 66.7 73.2 12.9 15.91965 . . . . 66.8 73.8 12.9 16.31970 . . . . 67.2 74.9 13.1 17.11975 . . . . 68.7 76.6 13.7 18.01980 . . . . 69.9 77.5 14.0 18.41985 . . . . 71.1 78.2 14.4 18.61990 . . . . 71.8 78.9 15.1 19.1
1995 . . . . 72.5 79.1 15.4 19.11996 . . . . 73.0 79.2 15.5 19.11997 . . . . 73.4 79.4 15.6 19.11998 . . . . 73.7 79.4 15.7 19.11999 . . . . 73.8 79.3 15.7 19.02000 . . . . 74.0 79.4 15.9 19.02001 . . . . 74.1 79.5 16.1 19.12002 . . . . 74.2 79.5 16.2 19.12003 . . . . 74.4 79.6 16.3 19.22004 . . . . 74.8 80.0 16.7 19.52005 . . . . 74.8 80.0 16.7 19.52006b . . . 75.1 79.9 16.7 19.32007b . . . 75.2 79.9 16.8 19.32008b . . .
b Estimated.
75.4 80.0 16.9 19.3Projected:
2010 . . . . 75.5 79.9 16.9 19.3 75.7 80.1 17.0 19.4 75.9 80.2 17.1 19.52015 . . . . 75.8 80.0 17.1 19.3 76.4 80.5 17.4 19.6 76.9 81.0 17.8 20.02020 . . . . 76.1 80.2 17.2 19.4 77.0 81.0 17.8 19.9 77.9 81.8 18.4 20.52025 . . . . 76.3 80.4 17.4 19.5 77.6 81.4 18.1 20.2 78.9 82.6 19.0 21.12030 . . . . 76.6 80.6 17.5 19.6 78.1 81.9 18.4 20.5 79.8 83.4 19.6 21.72035 . . . . 76.8 80.8 17.6 19.7 78.6 82.4 18.7 20.8 80.6 84.2 20.2 22.32040 . . . . 77.1 81.0 17.8 19.9 79.2 82.9 19.0 21.1 81.4 84.9 20.7 22.82045 . . . . 77.3 81.2 17.9 20.0 79.7 83.3 19.3 21.4 82.2 85.5 21.2 23.32050 . . . . 77.6 81.4 18.0 20.1 80.1 83.7 19.6 21.7 82.9 86.2 21.7 23.82055 . . . . 77.8 81.6 18.1 20.2 80.6 84.1 19.9 22.0 83.6 86.8 22.2 24.22060 . . . . 78.0 81.8 18.3 20.3 81.1 84.5 20.2 22.3 84.3 87.4 22.7 24.72065 . . . . 78.3 82.0 18.4 20.5 81.5 84.9 20.5 22.5 84.9 87.9 23.1 25.12070 . . . . 78.5 82.2 18.5 20.6 81.9 85.3 20.7 22.8 85.5 88.4 23.5 25.52075 . . . . 78.7 82.4 18.6 20.7 82.3 85.6 21.0 23.0 86.1 89.0 23.9 25.92080 . . . . 78.9 82.5 18.7 20.8 82.7 86.0 21.2 23.3 86.7 89.4 24.3 26.22085 . . . . 79.1 82.7 18.9 20.9 83.1 86.3 21.5 23.5 87.2 89.9 24.7 26.6

89
Demographic Assumptions and Methods
Table V.A4.—Cohort Life Expectancya
a The cohort life expectancy at a given age for a given year represents the average number of years of liferemaining if a group of persons at that age were to experience the mortality rates for the series of years inwhich they reach each succeeding age.
Calendaryear
Low-cost Intermediate High-costAt birthb
b Cohort life expectancy at birth for those born on January 1 of the calendar year is based on a combinationof actual and estimated death rates for birth years 1940 through 2005. For birth years after 2005, these valuesare based solely on estimated death rates.
At age 65 c
c Age 65 cohort life expectancy for those attaining age 65 on January 1 of the calendar years before 1975 isbased on actual data. For 1975 through 2005, these values are based on a combination of actual and esti-mated death rates. After 2005, these values are based solely on estimated death rates.
At birthb At age 65c At birthb At age 65 c
Male Female Male Female Male Female Male Female Male Female Male Female
1940 . . . . 69.6 75.5 12.7 14.7 69.9 75.9 12.7 14.7 70.3 76.3 12.7 14.71945 . . . . 71.2 76.9 13.0 15.4 71.7 77.4 13.0 15.4 72.3 78.1 13.0 15.41950 . . . . 72.2 77.9 13.1 16.2 72.9 78.7 13.1 16.2 73.8 79.7 13.1 16.21955 . . . . 72.7 78.3 13.1 16.7 73.6 79.3 13.1 16.7 74.8 80.6 13.1 16.71960 . . . . 73.2 78.6 13.2 17.4 74.4 79.8 13.2 17.4 75.8 81.4 13.2 17.41965 . . . . 73.9 78.9 13.5 18.0 75.3 80.4 13.5 18.0 77.0 82.2 13.5 18.01970 . . . . 74.8 79.5 13.8 18.5 76.5 81.2 13.8 18.5 78.5 83.3 13.8 18.51975 . . . . 75.4 80.0 14.2 18.7 77.4 82.0 14.2 18.7 79.7 84.3 14.2 18.71980 . . . . 76.1 80.5 14.7 18.7 78.3 82.7 14.7 18.7 81.0 85.3 14.7 18.71985 . . . . 76.6 80.8 15.3 18.8 79.1 83.3 15.3 18.9 82.0 86.1 15.3 18.91990 . . . . 77.0 81.2 15.8 19.0 79.7 83.8 15.8 19.1 82.9 86.9 15.9 19.1
1995 . . . . 77.4 81.5 16.3 19.1 80.4 84.4 16.4 19.2 83.9 87.6 16.5 19.41996 . . . . 77.5 81.5 16.4 19.1 80.5 84.5 16.5 19.3 84.0 87.8 16.6 19.51997 . . . . 77.5 81.6 16.5 19.1 80.6 84.6 16.6 19.3 84.2 87.9 16.8 19.61998 . . . . 77.6 81.6 16.6 19.2 80.7 84.6 16.8 19.4 84.3 88.0 16.9 19.71999 . . . . 77.7 81.7 16.7 19.2 80.8 84.7 16.9 19.4 84.5 88.2 17.1 19.72000 . . . . 77.7 81.7 16.8 19.2 80.9 84.8 17.0 19.5 84.6 88.3 17.2 19.82001 . . . . 77.8 81.8 16.8 19.3 81.0 84.9 17.1 19.6 84.8 88.4 17.4 19.92002 . . . . 77.8 81.8 16.9 19.3 81.1 85.0 17.2 19.6 84.9 88.5 17.5 20.12003 . . . . 77.8 81.8 17.0 19.3 81.2 85.1 17.3 19.7 85.1 88.6 17.7 20.22004 . . . . 77.9 81.9 17.0 19.3 81.3 85.1 17.4 19.8 85.2 88.8 17.8 20.32005 . . . . 77.9 81.9 17.1 19.4 81.4 85.2 17.5 19.8 85.3 88.9 17.9 20.42006 . . . . 78.0 82.0 17.1 19.4 81.5 85.3 17.5 19.9 85.5 89.0 18.1 20.52007 . . . . 78.1 82.0 17.2 19.4 81.6 85.4 17.6 19.9 85.6 89.1 18.2 20.62008 . . . . 78.1 82.1 17.2 19.4 81.7 85.5 17.7 20.0 85.8 89.2 18.4 20.7
2010 . . . . 78.2 82.1 17.3 19.5 81.9 85.6 17.9 20.1 86.1 89.5 18.6 21.02015 . . . . 78.5 82.3 17.4 19.6 82.4 86.0 18.2 20.4 86.8 90.1 19.3 21.62020 . . . . 78.7 82.5 17.5 19.7 82.8 86.4 18.6 20.8 87.4 90.6 19.9 22.22025 . . . . 78.9 82.7 17.7 19.8 83.2 86.8 18.9 21.1 88.0 91.1 20.5 22.82030 . . . . 79.2 82.9 17.8 20.0 83.6 87.1 19.2 21.4 88.6 91.6 21.1 23.32035 . . . . 79.4 83.1 17.9 20.1 84.0 87.4 19.5 21.7 89.1 92.1 21.7 23.92040 . . . . 79.6 83.3 18.1 20.2 84.4 87.8 19.8 22.0 89.7 92.5 22.2 24.42045 . . . . 79.8 83.4 18.2 20.3 84.7 88.1 20.1 22.3 90.2 93.0 22.7 24.92050 . . . . 80.0 83.6 18.3 20.5 85.1 88.4 20.4 22.6 90.7 93.4 23.2 25.32055 . . . . 80.2 83.8 18.5 20.6 85.4 88.7 20.7 22.8 91.2 93.8 23.7 25.82060 . . . . 80.4 83.9 18.6 20.7 85.7 88.9 20.9 23.1 91.6 94.2 24.1 26.22065 . . . . 80.6 84.1 18.7 20.8 86.1 89.2 21.2 23.4 92.1 94.6 24.5 26.62070 . . . . 80.8 84.3 18.8 20.9 86.4 89.5 21.5 23.6 92.5 95.0 25.0 27.02075 . . . . 81.0 84.4 18.9 21.0 86.7 89.7 21.7 23.8 93.0 95.4 25.4 27.42080 . . . . 81.1 84.6 19.0 21.1 87.0 90.0 21.9 24.1 93.4 95.8 25.8 27.72085 . . . . 81.3 84.7 19.2 21.3 87.2 90.2 22.2 24.3 93.8 96.1 26.1 28.1

Assumptions & Methods
90
B. ECONOMIC ASSUMPTIONS AND METHODS
The basic economic assumptions are embodied in three alternatives that aredesigned to provide a reasonable range of effects on Social Security’s finan-cial status. The intermediate assumptions reflect the Trustees’ consensusexpectation of an underlying general trend toward moderate economicgrowth throughout the projection period and the expected levels of variouseconomic parameters. The low-cost assumptions represent a more optimisticoutlook and assume relatively strong economic growth and relatively opti-mistic levels for other parameters. The high-cost assumptions represent a rel-atively pessimistic scenario, with weak economic growth, two recessions inthe short-range period and relatively pessimistic levels for other parameters.For this report, all three sets of assumptions include an extension into theprojection period of the recession that started in December 2007 with lowerproductivity in 2009 and unemployment peaking in 2010.
Actual economic data was available through the third quarter of 2008 at thetime the assumptions for this report were set. The data indicated that eco-nomic activity peaked in December 20071 with the level of output (GDP)above the long-term sustainable trend level. Economic growth subsequentlyweakened with the level of output reaching the sustainable trend level by themiddle of 2008. The actual growth rate in real GDP was slightly negative forthe third quarter of 2008 and was projected to be significantly negative forthe fourth quarter in all three alternatives. For the intermediate and low-costalternatives, the current recession was projected to be followed by a recoveryperiod with economic growth sufficient to return output to the sustainablelevel, but not beyond that level. For the high-cost alternative, the economy isassumed to experience a second recession before returning only to the sus-tainable level of output. Under all three sets of assumptions the economy isassumed to reach and maintain a sustainable, potential trend level of outputby the end of the short-range period. Economic cycles are not included in theassumptions beyond the first 10 years of the projection period because com-plete cycles have little effect on the long-range estimates of financial status.
For this year’s intermediate projections, real GDP growth is assumed todecline through the second quarter of 2009. The recovery from the recessionbrings economic activity to the projected stable, sustainable path by the endof 2015. For 2017 and later, real GDP is projected to be about 1.4 percentlower than in the 2008 report, based on recent data and the effects of the
1 Determination of the December 2007 Peak in Economic Activity, Business Cycle Dating Committee,National Bureau of Economic Research (NBER). Access date March 3, 2009.http://www.nber.org/cycles/dec2008.html
91
Economic Assumptions and Methods
recession. These revised economic assumptions account for about half of theestimated reduction in the program’s actuarial balance relative to last year’sreport. The effect of the recession on the actuarial balance would be smallerthan projected in this report if the recovery were such that economic outputsubstantially overshoots the projected sustainable path, a phenomenonobserved in some past business cycles.
The following sections 1 through 4 present the principal economic assump-tions for the three alternatives that are summarized in table V.B1. The subse-quent sections 5 through 7 present additional economic factors, summarizedin table V.B2, that are critical to the projections of the future financial statusof the combined OASI and DI Trust Funds.
1. Productivity Assumptions
Total U.S. economy productivity is defined as the ratio of real gross domesticproduct (GDP) to hours worked by all workers.1 The rate of change in total-economy productivity is a major determinant in the growth of average earn-ings. For the 40 years from 1967 to 2007, annual increases in total productiv-ity averaged 1.7 percent, the result of average annual increases of 2.0, 1.3,1.3, and 2.1 percent for the 10-year periods 1967-77, 1977-87, 1987-97, and1997-2007, respectively. However, it should be noted that this growth rate of1.7 percent reflects a shift of employment from low (farm) to high (nonfarm)productivity sectors that is not expected to continue in the future.
Because productivity growth can vary substantially within economic cycles,it is most useful to consider historical average growth rates for complete eco-nomic cycles. The annual increase in total productivity averaged 1.6 percentover the last five complete economic cycles (measured from peak to peak),covering the 41-year period from 1966 to 2007. The annual increase in totalproductivity averaged 2.2, 1.2, 1.2, 1.6, and 2.0 percent over the economiccycles 1966-73, 1973-78, 1978-89, 1989-2000, and 2000-07, respectively.
The ultimate annual increases in productivity are assumed to be 2.0, 1.7, and1.4 percent for the low-cost, intermediate, and high-cost assumptions,respectively, and are consistent with ultimate annual increases in non-farmproductivity of 2.4, 2.0, and 1.7 percent. These rates of increase are the sameas those used in the 2008 report, and reflect the belief that recent stronggrowth in non-farm business productivity, after the relatively poor perfor-
1 Historical levels of real GDP are from the Bureau of Economic Analysis’ (BEA) National Income andProduct Accounts (NIPA). Historical total hours worked is an unpublished series provided by the Bureau ofLabor Statistics (BLS), and is for all U.S. Armed Forces and civilian employment.

Assumptions & Methods
92
mance from 1973 to 1995, is consistent with future long-term growth thatmirrors the long-term trends of the past.
In the near term for the intermediate assumptions, the negative growth in realGDP is assumed to continue through the first half of 2009. The quarterlychange in real GDP (on an annual basis) is assumed to be -0.5, -6.0, -4.0, and-1.5 percent for 2008Q3 (i.e., the third calendar quarter of 2008), 2008Q4,2009Q1, and 2009Q2, respectively. The total decline in real GDP from2008Q2 to 2009Q2 is assumed to be 3.0 percent, giving this recession thelargest consecutive quarterly decline in real output since the 1957-58 reces-sion. The economy is assumed to begin recovering in 2010 and reach its full-employment or sustainable trend level of output in 2015. The annual changein real GDP is assumed to be 1.1 percent for 2008, -2.2 percent for 2009,2.4 percent for 2010, and to average about 3.6 percent over the 5-year recov-ery period from 2010 to 2015. Following this pattern, the annual change intotal-economy productivity is assumed to be 1.8 percent for 2008, 0.3 per-cent for 2009, 2.8 percent for 2010, and to average about 1.9 percent over the5-year recovery period from 2010 to 2015. The annual change in total-econ-omy productivity then falls to its assumed ultimate annual rate of 1.7 percentin 2018 and later.
For the low-cost assumptions, the economy is assumed to experience amilder recession and a faster recovery. The annual change in total-economyproductivity is assumed to be 1.8, 0.6, 2.9, 2.5, and 2.2 percent for 2008,2009, 2010, 2011, and 2012, respectively, and to average the assumed ulti-mate annual rate of 2.0 percent thereafter. For the high-cost assumptions, theannual change in productivity decreases from 1.7 percent for 2008 to0.0 percent for 2009. Thereafter, the annual change in productivity varieswith economic cycles until reaching its ultimate growth rate of 1.4 percentfor 2020.
2. Price Inflation Assumptions
Future changes in the Consumer Price Index for Urban Wage Earners andClerical Workers (CPI) will directly affect the OASDI program through theautomatic cost-of-living benefit increases. Future changes in the GDP priceindex (GDP deflator) affect the nominal levels of GDP, wages, self-employ-ment income, average earnings, and taxable payroll.
Historically, the CPI increased at an average annual rate of 4.6 percent forthe 40 years from 1967 to 2007, the result of average annual increases of 6.1,6.3, 3.4, and 2.6 percent for the 10-year periods 1967-77, 1977-87, 1987-97,and 1997-2007, respectively. The GDP deflator increased at an averageannual rate of 4.1 percent from 1967 to 2007, the result of average annual
93
Economic Assumptions and Methods
increases of 6.0, 5.5, 2.7, and 2.3 percent for the same respective 10-yearperiods.
The ultimate annual increases in the CPI are assumed to be 1.8, 2.8, and3.8 percent for the low-cost, intermediate, and high-cost assumptions,respectively. These rates of increase are the same as those used in the 2008report, and reflect a belief that future inflationary shocks will likely be offsetby succeeding periods of relatively slow inflation due to persistent interna-tional competition, and that future monetary policy will be similar to that ofthe last 20 years, with its strong emphasis on holding the growth rate inprices to relatively low levels.
For each alternative in the 2008 report, the ultimate annual increase in theGDP deflator was assumed to be equal to the annual increases in the CPIminus a 0.4 percentage point price differential. The price differential is basedprimarily on methodological differences in the construction of the two indi-ces. For the 2009 report, the ultimate annual increase in the GDP deflator isassumed to be equal to the annual increases in the CPI minus a 0.3, 0.4, and0.5 percentage point price differential for the low-cost, intermediate, andhigh-cost alternatives, respectively. Varying the ultimate projected price dif-ferential across alternatives better recognizes the historical variation in thisconcept. Hence, for the 2009 report, the ultimate annual increase in the GDPdeflator is assumed to be 1.5 (1.8 less 0.3), 2.4 (2.8 less 0.4), and 3.3 (3.8 less0.5) percent for the low-cost, intermediate, and high-cost alternatives,respectively.
For the intermediate assumptions, the annual change in the CPI is assumed todecrease from 4.3 percent for 2008 to -1.0 and 1.7 percent for 2009 and2010, respectively, due to the effects of the recession and a decline in theprice of a barrel of oil in late 2008. The annual change in the CPI is assumedto gradually increase to 3.1 percent for 2013 as the economy recovers and thedemand for oil increases. The annual change in the CPI is assumed to recedeto its assumed ultimate annual increase of 2.8 percent for 2015 and later.Because the level of the CPI in 2009Q3 and 2010Q3 is not assumed to beabove the level of the CPI in 2008Q3, the automatic cost-of-living benefitincrease for 2009 and 2010 is projected to be 0.0 percent. The price differen-tial, defined as the percent change in the CPI less the percent change in theGDP deflator, is estimated to be 2.1 percentage points for 2008 and projectedto be -2.1 percentage points for 2009. This swing in the price differential isdue to the dramatic rise of oil prices for 2008 and the subsequent fall tolower average prices for 2009. The rise and fall in oil prices affected CPImuch more than the GDP deflator because oil is a much larger share of whatwe consume than of what we produce in the U.S. As the economy recovers,
Assumptions & Methods
94
the relative price of oil rises and the price differential is assumed to averageabout 0.8 percentage point over the 4-year period from 2010 to 2013. Afterthe economy returns to full employment, the relative price of oil stabilizesand the price differential is assumed to fall to its ultimate assumed value of0.4 percentage point for 2015 and later.
For the low-cost assumptions, the annual change in the CPI is assumed todecrease from 4.3 percent for 2008 to -1.2 and 1.3 percent for 2009 and2010, respectively. Thereafter, the annual change in the CPI is assumed togradually increase to 2.1 percent for 2013 and then decrease to its assumedultimate annual change of 1.8 percent for 2015. For the high-cost assump-tions, the annual change in the CPI is assumed to decrease from 4.3 percentfor 2008 to -0.4 and 2.2 percent for 2009 and 2010, respectively. Thereafter,the annual change in the CPI is assumed to gradually increase to 6.0 percentfor 2013 and then decrease to its assumed ultimate annual change of 3.8 per-cent for 2015.
3. Average Earnings Assumptions
The average level of nominal earnings in OASDI covered employment foreach year has a direct effect on the size of the taxable payroll and on thefuture level of average benefits. In addition, under the automatic-adjustmentprovisions in the law, growth in the average wage in the U.S. economydirectly affects certain parameters used in the OASDI benefit formulas andadditional parameters used for the computation of the contribution and bene-fit base, the exempt amounts under the retirement earnings test, the amountof earnings required for a quarter of coverage, and under certain circum-stances, the automatic cost-of-living benefit increases.
Average U.S. earnings is defined as the ratio of the sum of total U.S. wageand salary disbursements and proprietor income to the sum of total U.S. mili-tary and total civilian household employment. The growth rate in averageU.S. earnings for any period is equal to the combined growth rates for totalU.S. economy productivity, average hours worked, the ratio of earnings tocompensation (which includes fringe benefits), the ratio of compensation toGDP, and the GDP deflator. Assumed future growth rates in productivity andthe GDP deflator are discussed in the previous two sections.
The average annual change in average hours worked was -0.2 percent overthe last 40 years, and -0.7, -0.1, 0.3, and -0.4 percent for the 10-year periods1967-77, 1977-87, 1987-97, and 1997-2007, respectively. The averageannual change in average hours worked was -0.3 percent over the last fivecomplete economic cycles covering the period from 1966 to 2007. Theannual change in average hours worked averaged -0.7, -0.6, 0.0, 0.1, and

95
Economic Assumptions and Methods
-0.6 percent over the economic cycles 1966-73, 1973-78, 1978-89, 1989-2000, and 2000-07, respectively.
For the 2009 report, the ultimate annual rates of change for average hoursworked are assumed to be 0.1, 0.0, and -0.1 percent for the low-cost, inter-mediate, and high-cost assumptions, respectively. These ultimate annualrates of change for average hours worked are the same as those assumed forthe 2008 report.
The average annual change in the ratio of earnings to compensation was-0.2 percent from 1967 to 2007. For wage workers, the assumed ultimateannual rates of change in the ratio of earnings to compensation are -0.1, -0.2,and -0.3 percent for the low-cost, intermediate, and high-cost assumptions,respectively. Under the intermediate assumptions, the ratio of wages toemployee compensation is projected to decline from 0.813 for 2008 to 0.695for 2083. The ratio of compensation to GDP is assumed to be stable.
Thus, the ultimate projected annual growth rate in average U.S. earnings isabout 3.9 percent for the intermediate assumptions. This growth rate reflectsassumed ultimate annual growth rates of about 1.7, -0.2, 0.0, and 2.4 percentfor productivity, the ratio of earnings to compensation, average hoursworked, and the GDP deflator, respectively. Similarly, the ultimate projectedannual growth rate in average nominal U.S. earnings is 3.5 percent for thelow-cost assumptions and 4.3 percent for the high-cost assumptions.
Over long periods of time the average annual growth rates in average U.S.earnings and average earnings in OASDI covered employment are expectedto be very close to the average annual growth rates in the average wage inOASDI covered employment (henceforth the “average covered wage”).Thus, the assumed ultimate annual growth rates in the average covered wageare 3.5, 3.9, and 4.3 percent for the low-cost, intermediate, and high-costassumptions, respectively. For the intermediate assumptions, the annual rateof change in the average covered wage is assumed to decrease from 3.3 per-cent for 2008 to 0.7 percent for 2009, following the recession to its lowpoint. As the economy recovers, the annual rate of change in the averagecovered wage is assumed to increase to 3.4 percent in 2010 and to averageabout 4.1 percent over the 5-year period from 2011 to 2015. Thereafter, theannual rate of change in the average covered wage decreases and reaches itsassumed ultimate rate of change of 3.9 percent for 2018.
4. Assumed Real-Wage Differentials
For simplicity, real increases in the average OASDI covered wage have tradi-tionally been expressed in the form of real-wage differentials—i.e., the per-
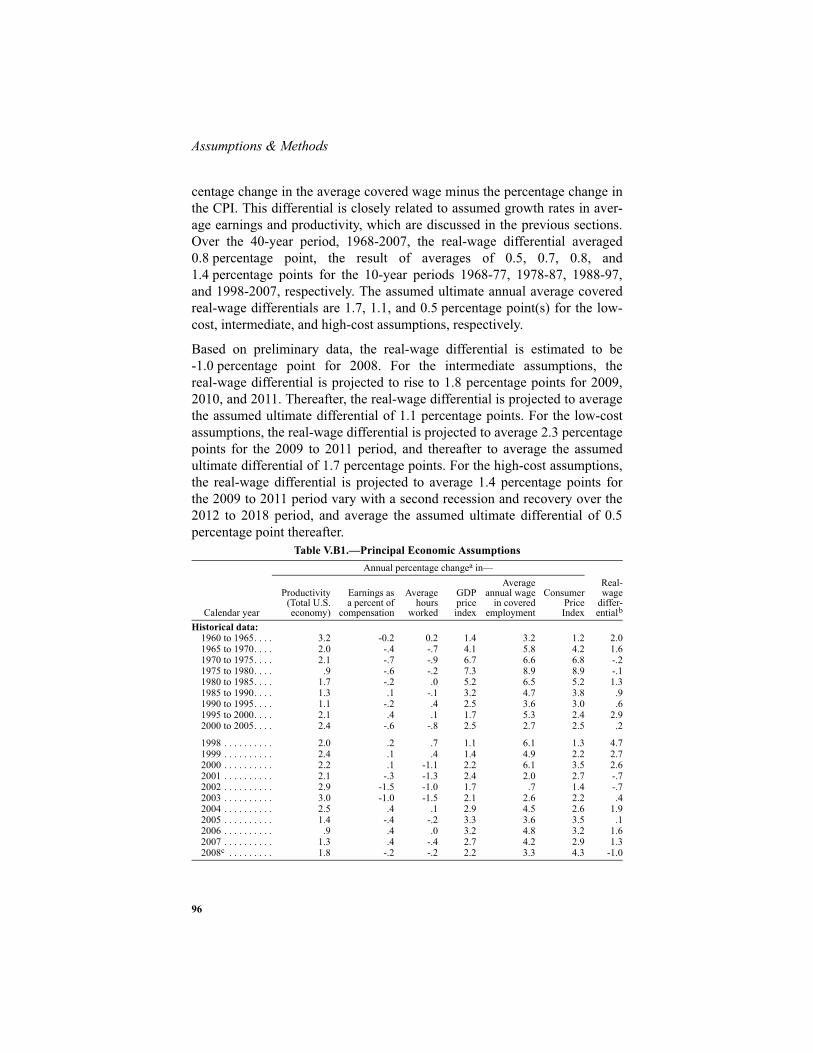
Assumptions & Methods
96
centage change in the average covered wage minus the percentage change inthe CPI. This differential is closely related to assumed growth rates in aver-age earnings and productivity, which are discussed in the previous sections.Over the 40-year period, 1968-2007, the real-wage differential averaged0.8 percentage point, the result of averages of 0.5, 0.7, 0.8, and1.4 percentage points for the 10-year periods 1968-77, 1978-87, 1988-97,and 1998-2007, respectively. The assumed ultimate annual average coveredreal-wage differentials are 1.7, 1.1, and 0.5 percentage point(s) for the low-cost, intermediate, and high-cost assumptions, respectively.
Based on preliminary data, the real-wage differential is estimated to be-1.0 percentage point for 2008. For the intermediate assumptions, thereal-wage differential is projected to rise to 1.8 percentage points for 2009,2010, and 2011. Thereafter, the real-wage differential is projected to averagethe assumed ultimate differential of 1.1 percentage points. For the low-costassumptions, the real-wage differential is projected to average 2.3 percentagepoints for the 2009 to 2011 period, and thereafter to average the assumedultimate differential of 1.7 percentage points. For the high-cost assumptions,the real-wage differential is projected to average 1.4 percentage points forthe 2009 to 2011 period vary with a second recession and recovery over the2012 to 2018 period, and average the assumed ultimate differential of 0.5percentage point thereafter.
Table V.B1.—Principal Economic Assumptions
Calendar year
Annual percentage changea in—Real-wage
differ-entialb
Productivity(Total U.S.economy)
Earnings asa percent of
compensation
Averagehours
worked
GDPpriceindex
Averageannual wage
in coveredemployment
ConsumerPriceIndex
Historical data:1960 to 1965. . . . 3.2 -0.2 0.2 1.4 3.2 1.2 2.01965 to 1970. . . . 2.0 -.4 -.7 4.1 5.8 4.2 1.61970 to 1975. . . . 2.1 -.7 -.9 6.7 6.6 6.8 -.21975 to 1980. . . . .9 -.6 -.2 7.3 8.9 8.9 -.11980 to 1985. . . . 1.7 -.2 .0 5.2 6.5 5.2 1.31985 to 1990. . . . 1.3 .1 -.1 3.2 4.7 3.8 .91990 to 1995. . . . 1.1 -.2 .4 2.5 3.6 3.0 .61995 to 2000. . . . 2.1 .4 .1 1.7 5.3 2.4 2.92000 to 2005. . . . 2.4 -.6 -.8 2.5 2.7 2.5 .2
1998 . . . . . . . . . . 2.0 .2 .7 1.1 6.1 1.3 4.71999 . . . . . . . . . . 2.4 .1 .4 1.4 4.9 2.2 2.72000 . . . . . . . . . . 2.2 .1 -1.1 2.2 6.1 3.5 2.62001 . . . . . . . . . . 2.1 -.3 -1.3 2.4 2.0 2.7 -.72002 . . . . . . . . . . 2.9 -1.5 -1.0 1.7 .7 1.4 -.72003 . . . . . . . . . . 3.0 -1.0 -1.5 2.1 2.6 2.2 .42004 . . . . . . . . . . 2.5 .4 .1 2.9 4.5 2.6 1.92005 . . . . . . . . . . 1.4 -.4 -.2 3.3 3.6 3.5 .12006 . . . . . . . . . . .9 .4 .0 3.2 4.8 3.2 1.62007 . . . . . . . . . . 1.3 .4 -.4 2.7 4.2 2.9 1.32008c . . . . . . . . . 1.8 -.2 -.2 2.2 3.3 4.3 -1.0
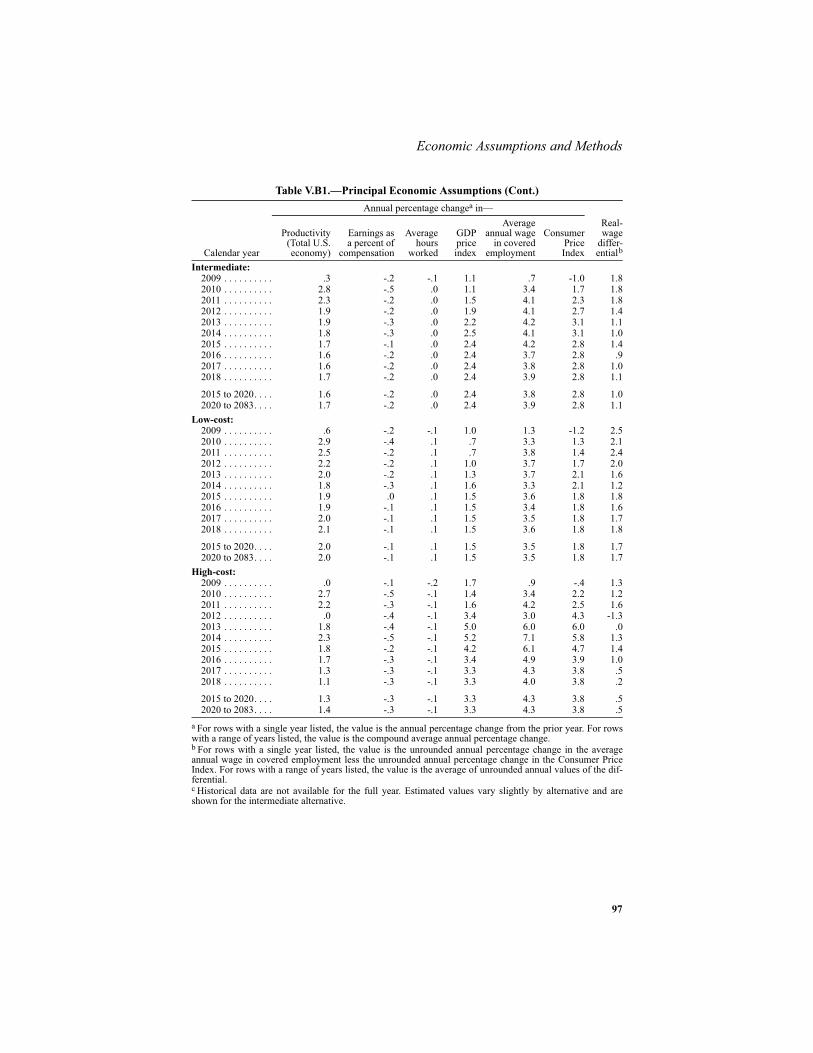
97
Economic Assumptions and Methods
Intermediate: 2009 . . . . . . . . . . .3 -.2 -.1 1.1 .7 -1.0 1.82010 . . . . . . . . . . 2.8 -.5 .0 1.1 3.4 1.7 1.82011 . . . . . . . . . . 2.3 -.2 .0 1.5 4.1 2.3 1.82012 . . . . . . . . . . 1.9 -.2 .0 1.9 4.1 2.7 1.42013 . . . . . . . . . . 1.9 -.3 .0 2.2 4.2 3.1 1.12014 . . . . . . . . . . 1.8 -.3 .0 2.5 4.1 3.1 1.02015 . . . . . . . . . . 1.7 -.1 .0 2.4 4.2 2.8 1.42016 . . . . . . . . . . 1.6 -.2 .0 2.4 3.7 2.8 .92017 . . . . . . . . . . 1.6 -.2 .0 2.4 3.8 2.8 1.02018 . . . . . . . . . . 1.7 -.2 .0 2.4 3.9 2.8 1.1
2015 to 2020. . . . 1.6 -.2 .0 2.4 3.8 2.8 1.02020 to 2083. . . . 1.7 -.2 .0 2.4 3.9 2.8 1.1
Low-cost: 2009 . . . . . . . . . . .6 -.2 -.1 1.0 1.3 -1.2 2.52010 . . . . . . . . . . 2.9 -.4 .1 .7 3.3 1.3 2.12011 . . . . . . . . . . 2.5 -.2 .1 .7 3.8 1.4 2.42012 . . . . . . . . . . 2.2 -.2 .1 1.0 3.7 1.7 2.02013 . . . . . . . . . . 2.0 -.2 .1 1.3 3.7 2.1 1.62014 . . . . . . . . . . 1.8 -.3 .1 1.6 3.3 2.1 1.22015 . . . . . . . . . . 1.9 .0 .1 1.5 3.6 1.8 1.82016 . . . . . . . . . . 1.9 -.1 .1 1.5 3.4 1.8 1.62017 . . . . . . . . . . 2.0 -.1 .1 1.5 3.5 1.8 1.72018 . . . . . . . . . . 2.1 -.1 .1 1.5 3.6 1.8 1.8
2015 to 2020. . . . 2.0 -.1 .1 1.5 3.5 1.8 1.72020 to 2083. . . . 2.0 -.1 .1 1.5 3.5 1.8 1.7
High-cost: 2009 . . . . . . . . . . .0 -.1 -.2 1.7 .9 -.4 1.32010 . . . . . . . . . . 2.7 -.5 -.1 1.4 3.4 2.2 1.22011 . . . . . . . . . . 2.2 -.3 -.1 1.6 4.2 2.5 1.62012 . . . . . . . . . . .0 -.4 -.1 3.4 3.0 4.3 -1.32013 . . . . . . . . . . 1.8 -.4 -.1 5.0 6.0 6.0 .02014 . . . . . . . . . . 2.3 -.5 -.1 5.2 7.1 5.8 1.32015 . . . . . . . . . . 1.8 -.2 -.1 4.2 6.1 4.7 1.42016 . . . . . . . . . . 1.7 -.3 -.1 3.4 4.9 3.9 1.02017 . . . . . . . . . . 1.3 -.3 -.1 3.3 4.3 3.8 .52018 . . . . . . . . . . 1.1 -.3 -.1 3.3 4.0 3.8 .2
2015 to 2020. . . . 1.3 -.3 -.1 3.3 4.3 3.8 .52020 to 2083. . . . 1.4 -.3 -.1 3.3 4.3 3.8 .5
a For rows with a single year listed, the value is the annual percentage change from the prior year. For rowswith a range of years listed, the value is the compound average annual percentage change.b For rows with a single year listed, the value is the unrounded annual percentage change in the averageannual wage in covered employment less the unrounded annual percentage change in the Consumer PriceIndex. For rows with a range of years listed, the value is the average of unrounded annual values of the dif-ferential.c Historical data are not available for the full year. Estimated values vary slightly by alternative and areshown for the intermediate alternative.
Table V.B1.—Principal Economic Assumptions (Cont.)
Calendar year
Annual percentage changea in—Real-wage
differ-entialb
Productivity(Total U.S.economy)
Earnings asa percent of
compensation
Averagehours
worked
GDPpriceindex
Averageannual wage
in coveredemployment
ConsumerPriceIndex

Assumptions & Methods
98
5. Labor Force and Unemployment Projections
The civilian labor force is projected by age, sex, marital status, and presenceof children. Projections of the labor force participation rates for each sub-group take into account the percentages of the population that are disabled orin the military, the levels of Social Security retirement benefits, the state ofthe economy, and changes in life expectancy. The projections also include a“cohort effect” that applies differences in participation rates for a cohort at aspecific age (relative to earlier cohorts at the same age) to participation ratesfor that cohort at older ages.
The annual rate of growth in the size of the labor force decreased from anaverage of about 2.1 percent during the 1970s and 1980s to about 1.1 percentfrom 1990 to 2008. Further slowing of labor force growth is projected due toa substantial slowing of growth in the working age population in the future—a natural consequence of the baby-boom generation approaching retirementand the succeeding lower-birth-rate cohorts reaching working age. Under theintermediate assumptions, the labor force is projected to increase by about0.7 percent per year, on average, through 2018. Thereafter, the labor force isprojected to increase much more slowly, averaging 0.5 percent over the 2018to 2050 period, and 0.4 percent over the remainder of the 75-year projectionperiod.
The ultimate projected labor force participation rates are not basic assump-tions. They are derived from a historically-based structural relationship usingdemographic and economic assumptions specific to each alternative. How-ever, the participation rates are not highly sensitive to most of the demo-graphic and economic assumptions. Thus, the projected labor forceparticipation rates vary modestly into the future and across alternatives.
Historically, labor force participation rates have been influenced substan-tially by trends in demographics and pensions. Between the mid-1960s andthe mid-1980s, labor force participation rates at ages 50 and over declinedfor males and were fairly stable for females. These overall declines werefacilitated by the large numbers of workers entering the labor force from thebaby-boom generation, and from the female population in general, duringthis period. This increasing supply of labor allowed employers to offer early-retirement options that were attractive. Between the mid-1980s and about1995, participation rates roughly stabilized for males and increased forfemales. Since 1995, however, participation rates for both sexes at ages 50and over have generally risen significantly, reflecting a decrease in early-outoptions and relatively strong economic growth.
For the future, changes in available benefit levels from Social Security,increases in the normal retirement age, and the effects of modifying the earn-

99
Economic Assumptions and Methods
ings test are expected to encourage work at older ages. Some of these factorsare modeled directly. However, other factors, like the trend away from pri-vate defined-benefit pension plans (that often provided incentives to retire)toward defined-contribution plans, are expected to provide additionalupward pressure on labor force participation rates. In addition to this shift inprivate pensions, the aging of the population is expected to both increase thedemand for workers and, through improved health associated with greaterlife expectancy, improve the ability of the older population to work. Longerlife expectancy will also increase the amount of assets that will be needed tolive comfortably through retirement years, thus encouraging workers to stayemployed longer. In order to account for these effects, which are directly orindirectly related to increases in life expectancy, projected participation ratesfor prime age and older males and females are adjusted upward in relation toassumed increases in life expectancy. For the intermediate projections, thisadjustment for changes related to life expectancy adds about 1.4 percent tothe total labor force by 2083.
For men age 16 and over, the projected age-adjusted labor force participationrates for 2083 are 72.6, 73.0, and 73.6 percent for the low-cost, intermediate,and high-cost assumptions, respectively, compared to the 2007 level of73.2 percent. (Age-adjusted labor force participation rates are adjusted to the2007 age distribution of the civilian noninstitutional U.S. population.) Theserates reflect the net effect of increases due to assumed improvements in lifeexpectancy, and decreases due to higher assumed disability prevalence ratesand an increasing proportion of males who are never married. For womenage 16 and over, the projected age-adjusted labor force participation rates for2083 are 60.3, 60.4, and 60.3 percent, for the low-cost, intermediate, andhigh-cost assumptions, respectively, compared to the 2007 level of59.3 percent. These projections reflect the combination of decreases due tohigher assumed disability prevalence rates, increases due to assumedimprovements in life expectancy, and increases due to assumed changes inthe proportion of females who are separated, widowed, divorced, or nevermarried.
The unemployment rate presented in table V.B2 is in the most commonlycited form, the civilian rate. For years through 2018, total rates are presentedwithout adjustment for the changing age-sex distribution of the population.For years after 2018, unemployment rates are presented as total age-sex-adjusted rates (using the age-sex distribution of the 2007 civilian laborforce). Age-sex-adjusted rates allow for more meaningful comparisonsacross longer time periods.

Assumptions & Methods
100
The total unemployment rate reflects the projected levels of unemploymentfor various age-sex subgroups of the population. The unemployment rate foreach subgroup is projected based on a specification (consistent with Okun’sLaw) relating changes in the unemployment rate to the changes in the eco-nomic cycle, as measured by the ratio of the actual to potential GDP. Foreach alternative, the total unemployment rate is projected to move toward theultimate assumed rate as the economy moves toward the long-range sustain-able growth path.
The ultimate age-sex-adjusted unemployment rate for each alternative isassumed to be reached by 2018. The ultimate assumed unemployment ratesare 4.5, 5.5, and 6.5 percent for the low-cost, intermediate, and high-costassumptions, respectively. These are the same values assumed for the 2008report.
6. Gross Domestic Product Projections
The real growth rate in gross domestic product (GDP) equals the combinedgrowth rates for total employment, productivity, and average hours worked.Total employment is the sum of the U.S. Armed Forces and total civilianemployment, which is based on the projected total civilian labor force andunemployment rates. For the 40-year period from 1967 to 2007, the averagegrowth rate in real GDP was 3.0 percent, combining the approximate growthrates of 1.6, 1.7, and -0.2 percent for its components—total employment,productivity, and average hours worked, respectively.
For the intermediate assumptions, the average annual growth in real GDP isprojected to be 2.4 percent from 2008 to 2018, a slower rate than the3.0 percent average observed over the historical 40-year period from 1967 to2007. This slowdown is primarily due to slower projected growth in totalemployment. For the low-cost assumptions, annual growth in real GDP isprojected to average 3.1 percent over the decade ending in 2018. The rela-tively faster growth is due mostly to higher assumed rates of growth foremployment and worker productivity. For the high-cost assumptions, realGDP is assumed to fall in the third and fourth quarters of 2008 and in thefirst three quarters of 2009, resulting in a total decline in real GDP for thesefive quarters of 4.0 percent. After 10 quarters of recovery, a second reces-sion, with a total decline in real GDP of 2.1 percent, is assumed to begin inthe second quarter of 2012 and last two quarters. After the second recession,a moderate economic recovery is assumed through 2015, with continuedmodest economic growth thereafter. For the high-cost assumptions, annualgrowth in real GDP is projected to average 1.8 percent for the decade endingin 2018.

101
Economic Assumptions and Methods
After 2018, no economic cycles are assumed for the three alternatives.Accordingly, projected rates of growth in real GDP are determined by theprojected full-employment rate of growth for total employment, and theassumed full-employment rates of growth for total U.S. economy productiv-ity and average hours worked. For the intermediate assumptions, the pro-jected rate of growth for real GDP falls toward the assumed productivitygrowth rate because of the projected decline in labor force growth over theperiod. At the end of the 75-year projection period, the annual growth in realGDP is 2.1 percent, due to the assumed ultimate percent changes of about0.4, 1.7, and 0.0 for total employment, productivity, and average hoursworked, respectively.
7. Interest Rates
The average annual nominal and real interest rates are presented in tableV.B2. The nominal rate is the average of the nominal interest rates for specialU.S. Government obligations issuable to the trust funds in each of the12 months of the year. Interest for these securities is generally compoundedsemiannually. The real interest rate (ex post) is defined to be the annual com-pound yield rate for investments in these securities divided by the annual rateof growth in the CPI for the first year after issuance. The real rate shown foreach year reflects the actual realized (historical) or expected (future) annualreal yield on securities issuable in the prior year.
In developing a reasonable range of assumed ultimate future real interestrates for the three alternatives, historical experience was examined for the 40years, 1968-2007, and for each of the 10-year subperiods, 1968-77, 1978-87,1988-97, and 1998-2007. For the 40-year period, the real interest rate aver-aged 2.8 percent per year. For the four 10-year subperiods, the real interestrates averaged 0.4, 4.1, 4.2, and 2.6 percent, respectively. The assumed ulti-mate real interest rates are 3.6 percent, 2.9 percent, and 2.1 percent for thelow-cost, intermediate, and high-cost assumptions, respectively, and areunchanged from the 2008 report. These ultimate real interest rates, whencombined with the ultimate CPI assumptions of 1.8, 2.8, and 3.8 percent,yield ultimate nominal interest rates of about 5.4 percent for the low-costassumptions, about 5.7 percent for the intermediate assumptions, and about5.9 percent for the high-cost assumptions. These ultimate nominal rates areassumed to be reached by the end of the short-range period.
The actual average annual nominal interest rate is 4.7 percent for 2007. Theannual rate of change in the CPI is assumed to be 4.3 percent for 2008.Hence, the annual real interest rate is 0.4 percent for 2008. For the next 10-year short-range projection period, nominal interest rates are projected based

Assumptions & Methods
102
on changes in the business cycle and in the CPI. Under the intermediateassumptions, the nominal interest rate is projected to decline from an actualvalue of 3.6 percent for 2008 to 3.0 percent for 2009, reflecting a weak econ-omy along with a negative rate of inflation. Thereafter, the nominal interestrate rises to the ultimate assumed level of 5.7 percent for 2018. For the low-cost assumptions, the average annual nominal interest rate is assumed toreach an ultimate level of about 5.4 percent for 2017. For the high-costassumptions, it is assumed to peak at 8.6 percent for 2014, and then declineto an ultimate rate of about 5.9 percent by 2018.

103
Economic Assumptions and Methods
Table V.B2.—Additional Economic Factors
Calendar year
Average annualunemployment
ratea
Annual percentage changeb in—Average annual interest
rateLaborforcec
Totalemploymentd
RealGDPe Nominalf Realg
Historical data:1960 to 1965. . . . . . 5.5 1.3 1.6 5.0 4.0 2.51965 to 1970. . . . . . 3.9 2.2 2.1 3.4 5.9 1.01970 to 1975. . . . . . 6.1 2.5 1.5 2.7 6.7 .01975 to 1980. . . . . . 6.8 2.7 2.9 3.7 8.5 -.91980 to 1985. . . . . . 8.3 1.5 1.5 3.2 12.1 6.91985 to 1990. . . . . . 5.9 1.7 2.0 3.3 8.5 5.11990 to 1995. . . . . . 6.6 1.0 .9 2.5 7.0 4.31995 to 2000. . . . . . 4.6 1.5 1.8 4.1 6.2 3.92000 to 2005. . . . . . 5.4 .9 .7 2.3 4.6 2.41998 . . . . . . . . . . . . 4.5 1.0 1.4 4.2 5.6 5.31999 . . . . . . . . . . . . 4.2 1.2 1.5 4.4 5.9 3.42000 . . . . . . . . . . . . 4.0 2.3 2.5 3.7 6.2 2.42001 . . . . . . . . . . . . 4.7 .8 .0 .8 5.2 3.52002 . . . . . . . . . . . . 5.8 .8 -.3 1.6 4.9 3.92003 . . . . . . . . . . . . 6.0 1.1 1.0 2.5 4.1 2.62004 . . . . . . . . . . . . 5.5 .6 1.1 3.6 4.3 1.52005 . . . . . . . . . . . . 5.1 1.3 1.7 2.9 4.3 .82006 . . . . . . . . . . . . 4.6 1.4 1.8 2.8 4.8 1.12007 . . . . . . . . . . . . 4.6 1.1 1.1 2.0 4.7 1.92008h . . . . . . . . . . . 5.7 .8 -.4 1.1 3.6 .4
Intermediate: 2009 . . . . . . . . . . . . 8.2 .3 -2.3 -2.2 3.0 4.72010 . . . . . . . . . . . . 8.8 .3 -.4 2.4 4.0 1.32011 . . . . . . . . . . . . 7.9 1.0 2.0 4.3 5.0 1.62012 . . . . . . . . . . . . 6.8 1.1 2.2 4.2 5.7 2.32013 . . . . . . . . . . . . 6.2 1.0 1.7 3.6 6.0 2.62014 . . . . . . . . . . . . 5.8 .9 1.2 3.0 6.0 3.02015 . . . . . . . . . . . . 5.6 .7 .9 2.7 5.7 3.22016 . . . . . . . . . . . . 5.5 .6 .6 2.2 5.6 2.92017 . . . . . . . . . . . . 5.5 .6 .6 2.2 5.6 2.82018 . . . . . . . . . . . . 5.5 .5 .5 2.2 5.7 2.82020 . . . . . . . . . . . . 5.5 .4 .5 2.1 5.7 2.92025 . . . . . . . . . . . . 5.5 .5 .5 2.1 5.7 2.92030 . . . . . . . . . . . . 5.5 .5 .5 2.2 5.7 2.92035 . . . . . . . . . . . . 5.5 .5 .5 2.2 5.7 2.92040 . . . . . . . . . . . . 5.5 .5 .5 2.2 5.7 2.92045 . . . . . . . . . . . . 5.5 .5 .5 2.2 5.7 2.92050 . . . . . . . . . . . . 5.5 .5 .5 2.1 5.7 2.92055 . . . . . . . . . . . . 5.5 .4 .4 2.1 5.7 2.92060 . . . . . . . . . . . . 5.5 .4 .4 2.1 5.7 2.92065 . . . . . . . . . . . . 5.5 .4 .4 2.1 5.7 2.92070 . . . . . . . . . . . . 5.5 .4 .4 2.1 5.7 2.92075 . . . . . . . . . . . . 5.5 .4 .4 2.1 5.7 2.92080 . . . . . . . . . . . . 5.5 .4 .4 2.1 5.7 2.92085 . . . . . . . . . . . . 5.5 .4 .4 2.1 5.7 2.9
Low-cost: 2009 . . . . . . . . . . . . 7.8 .5 -1.7 -1.2 3.3 4.92010 . . . . . . . . . . . . 8.2 .5 .1 3.1 3.8 2.02011 . . . . . . . . . . . . 7.1 1.2 2.4 5.1 4.6 2.42012 . . . . . . . . . . . . 5.8 1.3 2.6 5.0 5.2 2.92013 . . . . . . . . . . . . 5.0 1.2 2.0 4.2 5.5 3.12014 . . . . . . . . . . . . 4.8 1.0 1.2 3.1 5.3 3.42015 . . . . . . . . . . . . 4.7 .8 .9 3.0 5.1 3.52016 . . . . . . . . . . . . 4.6 .7 .8 2.9 5.3 3.32017 . . . . . . . . . . . . 4.5 .7 .7 2.8 5.4 3.52018 . . . . . . . . . . . . 4.5 .6 .6 2.8 5.4 3.6
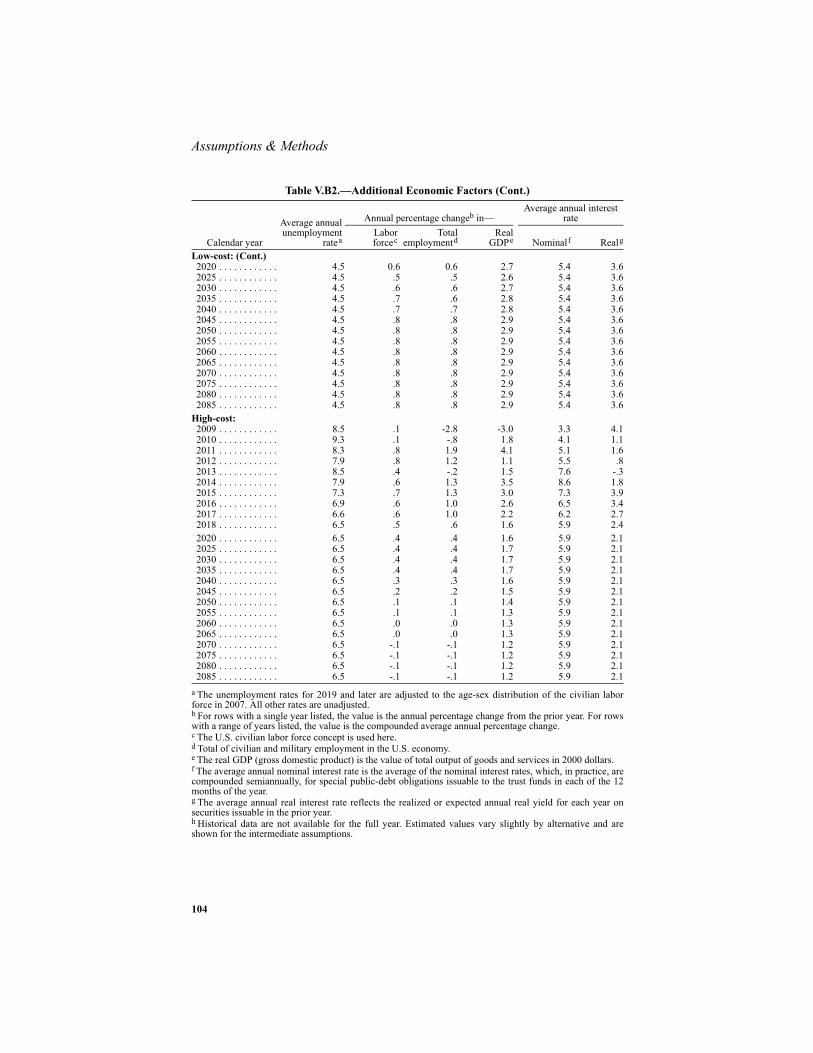
Assumptions & Methods
104
Low-cost: (Cont.)2020 . . . . . . . . . . . . 4.5 0.6 0.6 2.7 5.4 3.62025 . . . . . . . . . . . . 4.5 .5 .5 2.6 5.4 3.62030 . . . . . . . . . . . . 4.5 .6 .6 2.7 5.4 3.62035 . . . . . . . . . . . . 4.5 .7 .6 2.8 5.4 3.62040 . . . . . . . . . . . . 4.5 .7 .7 2.8 5.4 3.62045 . . . . . . . . . . . . 4.5 .8 .8 2.9 5.4 3.62050 . . . . . . . . . . . . 4.5 .8 .8 2.9 5.4 3.62055 . . . . . . . . . . . . 4.5 .8 .8 2.9 5.4 3.62060 . . . . . . . . . . . . 4.5 .8 .8 2.9 5.4 3.62065 . . . . . . . . . . . . 4.5 .8 .8 2.9 5.4 3.62070 . . . . . . . . . . . . 4.5 .8 .8 2.9 5.4 3.62075 . . . . . . . . . . . . 4.5 .8 .8 2.9 5.4 3.62080 . . . . . . . . . . . . 4.5 .8 .8 2.9 5.4 3.62085 . . . . . . . . . . . . 4.5 .8 .8 2.9 5.4 3.6
High-cost: 2009 . . . . . . . . . . . . 8.5 .1 -2.8 -3.0 3.3 4.12010 . . . . . . . . . . . . 9.3 .1 -.8 1.8 4.1 1.12011 . . . . . . . . . . . . 8.3 .8 1.9 4.1 5.1 1.62012 . . . . . . . . . . . . 7.9 .8 1.2 1.1 5.5 .82013 . . . . . . . . . . . . 8.5 .4 -.2 1.5 7.6 -.32014 . . . . . . . . . . . . 7.9 .6 1.3 3.5 8.6 1.82015 . . . . . . . . . . . . 7.3 .7 1.3 3.0 7.3 3.92016 . . . . . . . . . . . . 6.9 .6 1.0 2.6 6.5 3.42017 . . . . . . . . . . . . 6.6 .6 1.0 2.2 6.2 2.72018 . . . . . . . . . . . . 6.5 .5 .6 1.6 5.9 2.42020 . . . . . . . . . . . . 6.5 .4 .4 1.6 5.9 2.12025 . . . . . . . . . . . . 6.5 .4 .4 1.7 5.9 2.12030 . . . . . . . . . . . . 6.5 .4 .4 1.7 5.9 2.12035 . . . . . . . . . . . . 6.5 .4 .4 1.7 5.9 2.12040 . . . . . . . . . . . . 6.5 .3 .3 1.6 5.9 2.12045 . . . . . . . . . . . . 6.5 .2 .2 1.5 5.9 2.12050 . . . . . . . . . . . . 6.5 .1 .1 1.4 5.9 2.12055 . . . . . . . . . . . . 6.5 .1 .1 1.3 5.9 2.12060 . . . . . . . . . . . . 6.5 .0 .0 1.3 5.9 2.12065 . . . . . . . . . . . . 6.5 .0 .0 1.3 5.9 2.12070 . . . . . . . . . . . . 6.5 -.1 -.1 1.2 5.9 2.12075 . . . . . . . . . . . . 6.5 -.1 -.1 1.2 5.9 2.12080 . . . . . . . . . . . . 6.5 -.1 -.1 1.2 5.9 2.12085 . . . . . . . . . . . . 6.5 -.1 -.1 1.2 5.9 2.1
a The unemployment rates for 2019 and later are adjusted to the age-sex distribution of the civilian laborforce in 2007. All other rates are unadjusted.b For rows with a single year listed, the value is the annual percentage change from the prior year. For rowswith a range of years listed, the value is the compounded average annual percentage change.c The U.S. civilian labor force concept is used here.d Total of civilian and military employment in the U.S. economy.e The real GDP (gross domestic product) is the value of total output of goods and services in 2000 dollars.f The average annual nominal interest rate is the average of the nominal interest rates, which, in practice, arecompounded semiannually, for special public-debt obligations issuable to the trust funds in each of the 12months of the year.g The average annual real interest rate reflects the realized or expected annual real yield for each year onsecurities issuable in the prior year.h Historical data are not available for the full year. Estimated values vary slightly by alternative and areshown for the intermediate assumptions.
Table V.B2.—Additional Economic Factors (Cont.)
Calendar year
Average annualunemployment
ratea
Annual percentage changeb in—Average annual interest
rateLaborforcec
Totalemploymentd
RealGDPe Nominalf Realg

105
Program Assumptions and Methods
\
C. PROGRAM-SPECIFIC ASSUMPTIONS AND METHODS
The demographic and economic assumptions and methods described in theprevious sections are used in a set of models to project future income andcost under the OASDI program. In some cases, the economic assumptionsresult in the direct calculation of program parameters as described in the fol-lowing subsection. These parameters affect the level of payroll taxes col-lected and the level of benefits paid and are calculated using formulasdescribed explicitly in the Social Security Act. In other cases, the combina-tion of demographic and economic assumptions are used indirectly to drivemore complicated models that project the numbers of future workers coveredunder OASDI and the levels of their covered earnings, and the numbers offuture beneficiaries and the expected levels of their benefits. The followingsubsections provide brief descriptions of the derivations of these program-specific factors.
1. Automatically Adjusted Program Parameters
The Social Security Act specifies that certain program parameters affectingthe determination of OASDI benefits and taxes are to be adjusted annually ina manner that reflects changes in particular economic measures. The law pre-scribes specific formulas that, when applied to reported statistics, produceautomatic revisions in these program parameters and hence in the benefit andtax computations. These automatic adjustments are based on measuredchanges in the national average wage index (AWI) and the CPI.1 In this sec-tion, values are shown for program parameters that are subject to automaticadjustment, from the time that such adjustments became effective through2018. Projected values for future years are based on the economic assump-tions described in the preceding section of this report.
The following two tables present the historical and projected values of theCPI-based benefit increases, as well as the AWI series and the values ofmany of the wage-indexed program parameters. In each table, the projectionsare shown under the three alternative sets of economic assumptionsdescribed in the previous section. Table V.C1 includes:
• The annual percentage increases that have been applied to OASDI ben-efits under automatic cost-of-living adjustment provisions in the SocialSecurity Act, based on increases in the CPI. Under all three sets of eco-
1 Details of these indexation procedures are published annually in the Federal Register, and are also avail-able on the Social Security website at www.socialsecurity.gov/OACT/COLA/index.html.

Assumptions & Methods
106
nomic assumptions, no cost-of-living adjustment becomes effective forDecember of 2009 (and in some later years under the intermediate andlow-cost assumptions).
• The annual levels of and percentage increases in the AWI. Under sec-tion 215(b)(3) of the Social Security Act, the AWI for each year after1950 is used to index the taxable earnings of most workers first becom-ing eligible for benefits in 1979 or later. This procedure converts aworker’s past earnings to approximately benefit equivalent values nearthe time of the worker’s benefit eligibility, and these indexed values areused to calculate the worker’s benefit amount. The AWI is also used toadjust most of the other program parameters that are subject to the auto-matic-adjustment provisions.
• The wage-indexed contribution and benefit base—the maximumamount of earnings for the specified year that are subject to the OASDIpayroll tax and creditable toward benefit computation. The Social Secu-rity Act prohibits an increase in this base if there is no cost-of-livingadjustment effective for December of the preceding year.
• The wage-indexed retirement earnings test exempt amounts—theannual amount of earnings below which beneficiaries are not subject tobenefit withholding. A lower exempt amount applies in years before abeneficiary attains normal retirement age (NRA). A higher amountapplies for the year in which the beneficiary attains normal retirementage. The retirement test does not apply beginning with the attainment ofnormal retirement age. The Social Security Act prohibits an increase inthese exempt amounts if there is no cost-of-living adjustment effectivefor December of the preceding year.

107
Program Assumptions and Methods
Table V.C1.—Cost-of-Living Benefit Increases, Average Wage Index, Contribution and Benefit Bases, and Retirement Earnings Test Exempt Amounts, 1975-2018
Calendar year
Cost-of-livingbenefit
increasea(percent)
Averagewage index (AWI) b Contribution
and benefitbase c
Retirement earningstest exempt amount
AmountIncrease
(percent)UnderNRAd At NRAe
Historical data:1975 . . . . . . . . . . . 8.0 $8,630.92 7.5 $14,100 $2,520 $2,5201976 . . . . . . . . . . . 6.4 9,226.48 6.9 15,300 2,760 2,7601977 . . . . . . . . . . . 5.9 9,779.44 6.0 16,500 3,000 3,0001978 . . . . . . . . . . . 6.5 10,556.03 7.9 17,700 3,240 4,0001979 . . . . . . . . . . . 9.9 11,479.46 8.7 22,900 3,480 4,5001980 . . . . . . . . . . . 14.3 12,513.46 9.0 25,900 3,720 5,0001981 . . . . . . . . . . . 11.2 13,773.10 10.1 29,700 4,080 5,5001982 . . . . . . . . . . . 7.4 14,531.34 5.5 32,400 4,440 6,0001983 . . . . . . . . . . . 3.5 15,239.24 4.9 35,700 4,920 6,6001984 . . . . . . . . . . . 3.5 16,135.07 5.9 37,800 5,160 6,9601985 . . . . . . . . . . . 3.1 16,822.51 4.3 39,600 5,400 7,3201986 . . . . . . . . . . . 1.3 17,321.82 3.0 42,000 5,760 7,8001987 . . . . . . . . . . . 4.2 18,426.51 6.4 43,800 6,000 8,1601988 . . . . . . . . . . . 4.0 19,334.04 4.9 45,000 6,120 8,4001989 . . . . . . . . . . . 4.7 20,099.55 4.0 48,000 6,480 8,8801990 . . . . . . . . . . . 5.4 21,027.98 4.6 51,300 6,840 9,3601991 . . . . . . . . . . . 3.7 21,811.60 3.7 53,400 7,080 9,7201992 . . . . . . . . . . . 3.0 22,935.42 5.2 55,500 7,440 10,2001993 . . . . . . . . . . . 2.6 23,132.67 .9 57,600 7,680 10,5601994 . . . . . . . . . . . 2.8 23,753.53 2.7 60,600 8,040 11,1601995 . . . . . . . . . . . 2.6 24,705.66 4.0 61,200 8,160 11,2801996 . . . . . . . . . . . 2.9 25,913.90 4.9 62,700 8,280 12,5001997 . . . . . . . . . . . 2.1 27,426.00 5.8 65,400 8,640 13,5001998 . . . . . . . . . . . 1.3 28,861.44 5.2 68,400 9,120 14,5001999 . . . . . . . . . . . f2.5 30,469.84 5.6 72,600 9,600 15,5002000 . . . . . . . . . . . 3.5 32,154.82 5.5 76,200 10,080 17,0002001 . . . . . . . . . . . 2.6 32,921.92 2.4 80,400 10,680 25,0002002 . . . . . . . . . . . 1.4 33,252.09 1.0 84,900 11,280 30,0002003 . . . . . . . . . . . 2.1 34,064.95 2.4 87,000 11,520 30,7202004 . . . . . . . . . . . 2.7 35,648.55 4.6 87,900 11,640 31,0802005 . . . . . . . . . . . 4.1 36,952.94 3.7 90,000 12,000 31,8002006 . . . . . . . . . . . 3.3 38,651.41 4.6 94,200 12,480 33,2402007 . . . . . . . . . . . 2.3 40,405.48 4.5 97,500 12,960 34,440
Intermediate:2008 . . . . . . . . . . . g5.8 41,679.58 3.2 g102,000 g13,560 g36,1202009 . . . . . . . . . . . .0 42,041.84 .9 g106,800 g14,160 g37,6802010 . . . . . . . . . . . .0 43,451.28 3.4 106,800 14,160 37,6802011 . . . . . . . . . . . 1.4 45,194.92 4.0 106,800 14,160 37,6802012 . . . . . . . . . . . 2.8 47,013.95 4.0 114,900 15,240 40,5602013 . . . . . . . . . . . 3.1 48,969.10 4.2 119,400 15,840 42,1202014 . . . . . . . . . . . 3.0 50,962.45 4.1 124,200 16,440 43,9202015 . . . . . . . . . . . 2.8 53,085.22 4.2 129,300 17,160 45,7202016 . . . . . . . . . . . 2.8 55,070.22 3.7 134,700 17,880 47,5202017 . . . . . . . . . . . 2.8 57,165.32 3.8 140,400 18,600 49,5602018 . . . . . . . . . . . 2.8 59,362.72 3.8 145,500 19,320 51,360
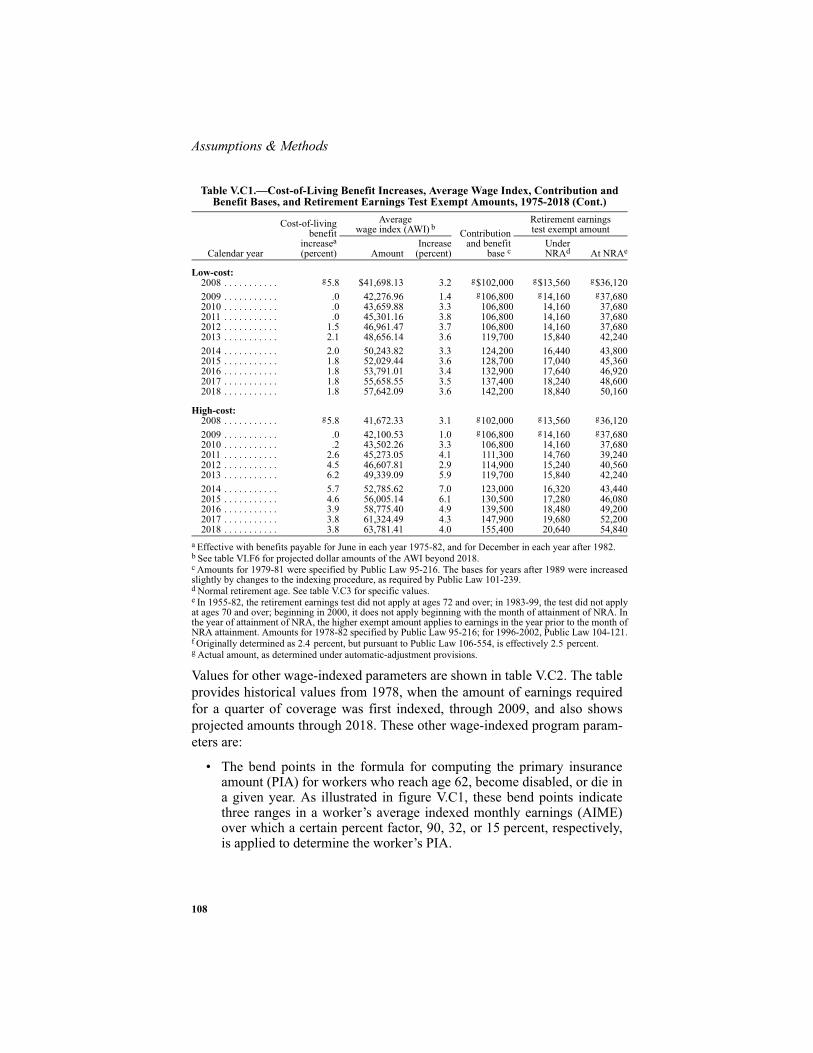
Assumptions & Methods
108
Values for other wage-indexed parameters are shown in table V.C2. The tableprovides historical values from 1978, when the amount of earnings requiredfor a quarter of coverage was first indexed, through 2009, and also showsprojected amounts through 2018. These other wage-indexed program param-eters are:
• The bend points in the formula for computing the primary insuranceamount (PIA) for workers who reach age 62, become disabled, or die ina given year. As illustrated in figure V.C1, these bend points indicatethree ranges in a worker’s average indexed monthly earnings (AIME)over which a certain percent factor, 90, 32, or 15 percent, respectively,is applied to determine the worker’s PIA.
Low-cost:2008 . . . . . . . . . . . g5.8 $41,698.13 3.2 g$102,000 g$13,560 g$36,1202009 . . . . . . . . . . . .0 42,276.96 1.4 g106,800 g14,160 g37,6802010 . . . . . . . . . . . .0 43,659.88 3.3 106,800 14,160 37,6802011 . . . . . . . . . . . .0 45,301.16 3.8 106,800 14,160 37,6802012 . . . . . . . . . . . 1.5 46,961.47 3.7 106,800 14,160 37,6802013 . . . . . . . . . . . 2.1 48,656.14 3.6 119,700 15,840 42,2402014 . . . . . . . . . . . 2.0 50,243.82 3.3 124,200 16,440 43,8002015 . . . . . . . . . . . 1.8 52,029.44 3.6 128,700 17,040 45,3602016 . . . . . . . . . . . 1.8 53,791.01 3.4 132,900 17,640 46,9202017 . . . . . . . . . . . 1.8 55,658.55 3.5 137,400 18,240 48,6002018 . . . . . . . . . . . 1.8 57,642.09 3.6 142,200 18,840 50,160
High-cost:2008 . . . . . . . . . . . g5.8 41,672.33 3.1 g102,000 g13,560 g36,1202009 . . . . . . . . . . . .0 42,100.53 1.0 g106,800 g14,160 g37,6802010 . . . . . . . . . . . .2 43,502.26 3.3 106,800 14,160 37,6802011 . . . . . . . . . . . 2.6 45,273.05 4.1 111,300 14,760 39,2402012 . . . . . . . . . . . 4.5 46,607.81 2.9 114,900 15,240 40,5602013 . . . . . . . . . . . 6.2 49,339.09 5.9 119,700 15,840 42,2402014 . . . . . . . . . . . 5.7 52,785.62 7.0 123,000 16,320 43,4402015 . . . . . . . . . . . 4.6 56,005.14 6.1 130,500 17,280 46,0802016 . . . . . . . . . . . 3.9 58,775.40 4.9 139,500 18,480 49,2002017 . . . . . . . . . . . 3.8 61,324.49 4.3 147,900 19,680 52,2002018 . . . . . . . . . . . 3.8 63,781.41 4.0 155,400 20,640 54,840
a Effective with benefits payable for June in each year 1975-82, and for December in each year after 1982.b See table VI.F6 for projected dollar amounts of the AWI beyond 2018.c Amounts for 1979-81 were specified by Public Law 95-216. The bases for years after 1989 were increasedslightly by changes to the indexing procedure, as required by Public Law 101-239. d Normal retirement age. See table V.C3 for specific values.e In 1955-82, the retirement earnings test did not apply at ages 72 and over; in 1983-99, the test did not applyat ages 70 and over; beginning in 2000, it does not apply beginning with the month of attainment of NRA. Inthe year of attainment of NRA, the higher exempt amount applies to earnings in the year prior to the month ofNRA attainment. Amounts for 1978-82 specified by Public Law 95-216; for 1996-2002, Public Law 104-121.f Originally determined as 2.4 percent, but pursuant to Public Law 106-554, is effectively 2.5 percent.g Actual amount, as determined under automatic-adjustment provisions.
Table V.C1.—Cost-of-Living Benefit Increases, Average Wage Index, Contribution and Benefit Bases, and Retirement Earnings Test Exempt Amounts, 1975-2018 (Cont.)
Calendar year
Cost-of-livingbenefit
increasea(percent)
Averagewage index (AWI) b Contribution
and benefitbase c
Retirement earningstest exempt amount
AmountIncrease
(percent)UnderNRAd At NRAe

109
Program Assumptions and Methods
• Bend points in the formula used to compute the maximum total amountof monthly benefits payable on the basis of the earnings of a retired ordeceased worker. This formula is a function of the worker’s PIA, and, asshown in figure V.C2, relies on four intervals and percentages.
Figure V.C1.—Primary-Insurance-Amount Formula for Those Newly Eligible in 2009
Figure V.C2.—Maximum-Family-Benefit Formula for Those Newly Eligible in 2009
32%
15%
90%
$0
$500
$1,000
$1,500
$2,000
$2,500
$0 $1,000 $2,000 $3,000 $4,000 $5,000 $6,000
Average Indexed Monthly Earnings
Prim
ary
Insu
ranc
e A
mou
nt
.
Firstben d p oint
($7 44)
Secondbend p oint($ 4,483)
134% 175%
150%
272%
$0
$500
$1,000
$1,500
$2,000
$2,500
$3,000
$3,500
$4,000
$4,500
$0 $500 $1,000 $1,500 $2,000 $2,500
Primary Insurance Amount
Max
imum
fam
ily b
enef
it
.
Thirdbend point($1,789)
Secondbend point
($1,372)
Firstbend point
($950)

Assumptions & Methods
110
• The amount of earnings required in a year to be credited with a quarterof coverage (QC). The number and timing of QCs earned is used todetermine an individual’s insured status—the basic requirement forbenefit eligibility under OASDI.
• The old-law contribution and benefit base—the contribution and benefitbase that would have been in effect in each year after 1977 under theautomatic-adjustment provisions as in effect before the enactment of the1977 amendments. This old-law base is used in determining special-minimum benefits for certain workers who have many years of lowearnings in covered employment. Beginning in 1986, the old-law baseis also used in the calculation of OASDI benefits for certain workerswho are eligible to receive pensions based on noncovered employment.In addition, it is used for certain purposes under the Railroad Retirementprogram and the Employee Retirement Income Security Act of 1974.
Table V.C2.—Values for Selected Wage-Indexed Program Parameters, Calendar Years 1978-2018
Calendar year
AIME bendpoints in PIA
formulaa
PIA bend pointsin maximum-
family-benefit formulabEarnings
required fora quarter of
coverage
Old-lawcontributionand benefit
basecFirst Second First Second Third
Historical data:1978 . . . . . . . . . d d d d d e $250 e $17,7001979 . . . . . . . . . e $180 e $1,085 e $230 e $332 e $433 260 18,900
1980 . . . . . . . . . 194 1,171 248 358 467 290 20,4001981 . . . . . . . . . 211 1,274 270 390 508 310 22,2001982 . . . . . . . . . 230 1,388 294 425 554 340 24,3001983 . . . . . . . . . 254 1,528 324 468 610 370 26,7001984 . . . . . . . . . 267 1,612 342 493 643 390 28,200
1985 . . . . . . . . . 280 1,691 358 517 675 410 29,7001986 . . . . . . . . . 297 1,790 379 548 714 440 31,5001987 . . . . . . . . . 310 1,866 396 571 745 460 32,7001988 . . . . . . . . . 319 1,922 407 588 767 470 33,6001989 . . . . . . . . . 339 2,044 433 626 816 500 35,700
1990 . . . . . . . . . 356 2,145 455 656 856 520 38,1001991 . . . . . . . . . 370 2,230 473 682 890 540 39,6001992 . . . . . . . . . 387 2,333 495 714 931 570 41,4001993 . . . . . . . . . 401 2,420 513 740 966 590 42,9001994 . . . . . . . . . 422 2,545 539 779 1,016 620 45,000
1995 . . . . . . . . . 426 2,567 544 785 1,024 630 45,3001996 . . . . . . . . . 437 2,635 559 806 1,052 640 46,5001997 . . . . . . . . . 455 2,741 581 839 1,094 670 48,6001998 . . . . . . . . . 477 2,875 609 880 1,147 700 50,7001999 . . . . . . . . . 505 3,043 645 931 1,214 740 53,700
2000 . . . . . . . . . 531 3,202 679 980 1,278 780 56,7002001 . . . . . . . . . 561 3,381 717 1,034 1,349 830 59,7002002 . . . . . . . . . 592 3,567 756 1,092 1,424 870 63,0002003 . . . . . . . . . 606 3,653 774 1,118 1,458 890 64,5002004 . . . . . . . . . 612 3,689 782 1,129 1,472 900 65,100
2005 . . . . . . . . . 627 3,779 801 1,156 1,508 920 66,9002006 . . . . . . . . . 656 3,955 838 1,210 1,578 970 69,9002007 . . . . . . . . . 680 4,100 869 1,255 1,636 1,000 72,6002008 . . . . . . . . . 711 4,288 909 1,312 1,711 1,050 75,9002009 . . . . . . . . . 744 4,483 950 1,372 1,789 1,090 79,200
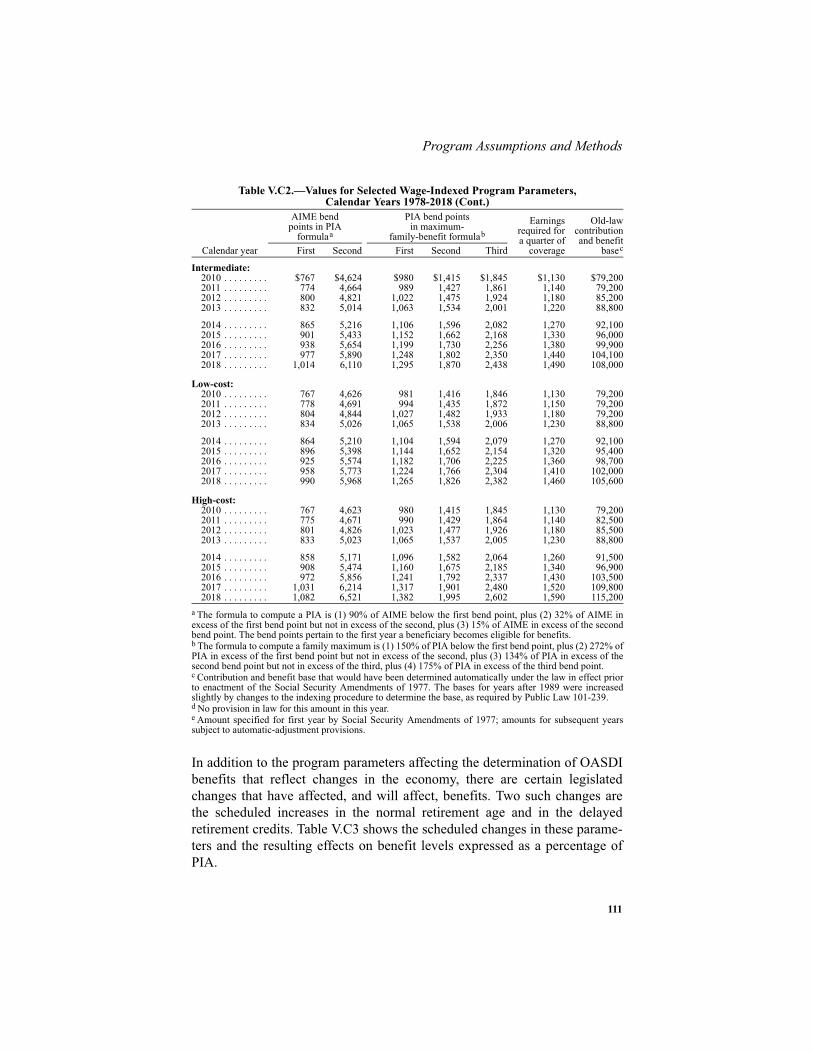
111
Program Assumptions and Methods
In addition to the program parameters affecting the determination of OASDIbenefits that reflect changes in the economy, there are certain legislatedchanges that have affected, and will affect, benefits. Two such changes arethe scheduled increases in the normal retirement age and in the delayedretirement credits. Table V.C3 shows the scheduled changes in these parame-ters and the resulting effects on benefit levels expressed as a percentage ofPIA.
Intermediate:2010 . . . . . . . . . $767 $4,624 $980 $1,415 $1,845 $1,130 $79,2002011 . . . . . . . . . 774 4,664 989 1,427 1,861 1,140 79,2002012 . . . . . . . . . 800 4,821 1,022 1,475 1,924 1,180 85,2002013 . . . . . . . . . 832 5,014 1,063 1,534 2,001 1,220 88,800
2014 . . . . . . . . . 865 5,216 1,106 1,596 2,082 1,270 92,1002015 . . . . . . . . . 901 5,433 1,152 1,662 2,168 1,330 96,0002016 . . . . . . . . . 938 5,654 1,199 1,730 2,256 1,380 99,9002017 . . . . . . . . . 977 5,890 1,248 1,802 2,350 1,440 104,1002018 . . . . . . . . . 1,014 6,110 1,295 1,870 2,438 1,490 108,000
Low-cost:2010 . . . . . . . . . 767 4,626 981 1,416 1,846 1,130 79,2002011 . . . . . . . . . 778 4,691 994 1,435 1,872 1,150 79,2002012 . . . . . . . . . 804 4,844 1,027 1,482 1,933 1,180 79,2002013 . . . . . . . . . 834 5,026 1,065 1,538 2,006 1,230 88,800
2014 . . . . . . . . . 864 5,210 1,104 1,594 2,079 1,270 92,1002015 . . . . . . . . . 896 5,398 1,144 1,652 2,154 1,320 95,4002016 . . . . . . . . . 925 5,574 1,182 1,706 2,225 1,360 98,7002017 . . . . . . . . . 958 5,773 1,224 1,766 2,304 1,410 102,0002018 . . . . . . . . . 990 5,968 1,265 1,826 2,382 1,460 105,600
High-cost:2010 . . . . . . . . . 767 4,623 980 1,415 1,845 1,130 79,2002011 . . . . . . . . . 775 4,671 990 1,429 1,864 1,140 82,5002012 . . . . . . . . . 801 4,826 1,023 1,477 1,926 1,180 85,5002013 . . . . . . . . . 833 5,023 1,065 1,537 2,005 1,230 88,800
2014 . . . . . . . . . 858 5,171 1,096 1,582 2,064 1,260 91,5002015 . . . . . . . . . 908 5,474 1,160 1,675 2,185 1,340 96,9002016 . . . . . . . . . 972 5,856 1,241 1,792 2,337 1,430 103,5002017 . . . . . . . . . 1,031 6,214 1,317 1,901 2,480 1,520 109,8002018 . . . . . . . . . 1,082 6,521 1,382 1,995 2,602 1,590 115,200
a The formula to compute a PIA is (1) 90% of AIME below the first bend point, plus (2) 32% of AIME inexcess of the first bend point but not in excess of the second, plus (3) 15% of AIME in excess of the secondbend point. The bend points pertain to the first year a beneficiary becomes eligible for benefits.b The formula to compute a family maximum is (1) 150% of PIA below the first bend point, plus (2) 272% ofPIA in excess of the first bend point but not in excess of the second, plus (3) 134% of PIA in excess of thesecond bend point but not in excess of the third, plus (4) 175% of PIA in excess of the third bend point.c Contribution and benefit base that would have been determined automatically under the law in effect priorto enactment of the Social Security Amendments of 1977. The bases for years after 1989 were increasedslightly by changes to the indexing procedure to determine the base, as required by Public Law 101-239.d No provision in law for this amount in this year.e Amount specified for first year by Social Security Amendments of 1977; amounts for subsequent yearssubject to automatic-adjustment provisions.
Table V.C2.—Values for Selected Wage-Indexed Program Parameters, Calendar Years 1978-2018 (Cont.)
Calendar year
AIME bendpoints in PIA
formulaa
PIA bend pointsin maximum-
family-benefit formulabEarnings
required fora quarter of
coverage
Old-lawcontributionand benefit
basecFirst Second First Second Third
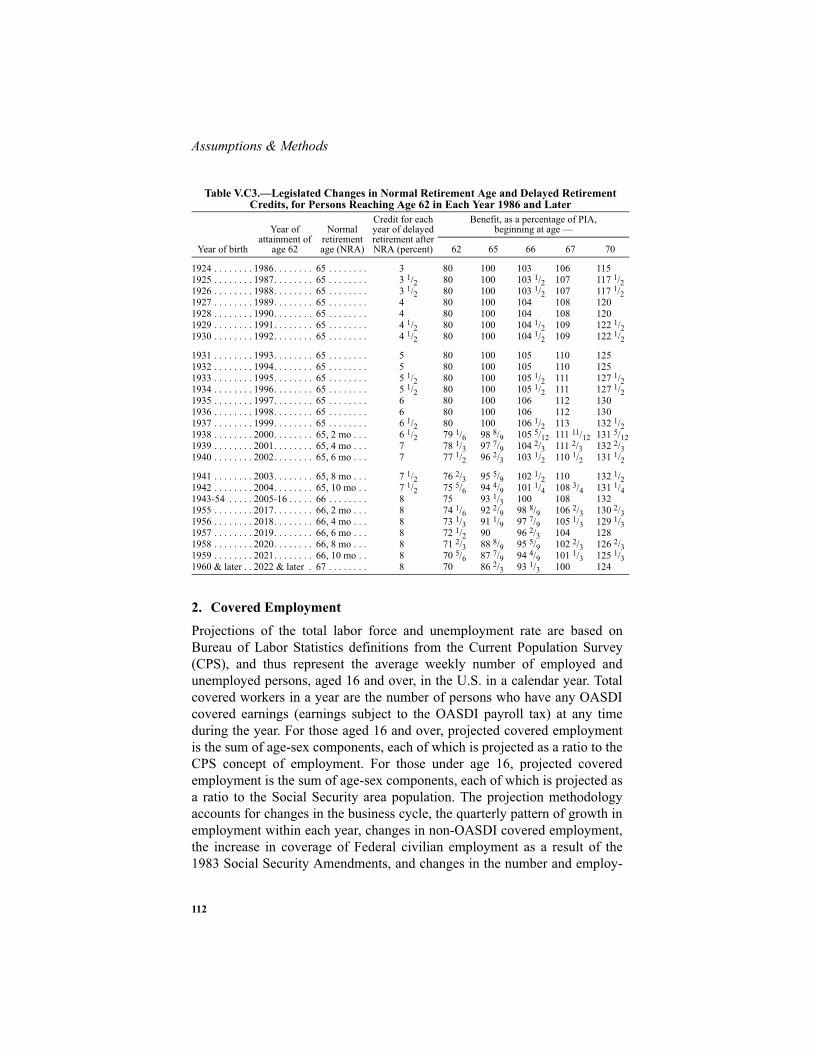
Assumptions & Methods
112
2. Covered Employment
Projections of the total labor force and unemployment rate are based onBureau of Labor Statistics definitions from the Current Population Survey(CPS), and thus represent the average weekly number of employed andunemployed persons, aged 16 and over, in the U.S. in a calendar year. Totalcovered workers in a year are the number of persons who have any OASDIcovered earnings (earnings subject to the OASDI payroll tax) at any timeduring the year. For those aged 16 and over, projected covered employmentis the sum of age-sex components, each of which is projected as a ratio to theCPS concept of employment. For those under age 16, projected coveredemployment is the sum of age-sex components, each of which is projected asa ratio to the Social Security area population. The projection methodologyaccounts for changes in the business cycle, the quarterly pattern of growth inemployment within each year, changes in non-OASDI covered employment,the increase in coverage of Federal civilian employment as a result of the1983 Social Security Amendments, and changes in the number and employ-
Table V.C3.—Legislated Changes in Normal Retirement Age and Delayed RetirementCredits, for Persons Reaching Age 62 in Each Year 1986 and Later
Year of birth
Year ofattainment of
age 62
Normalretirementage (NRA)
Credit for each year of delayed retirement afterNRA (percent)
Benefit, as a percentage of PIA, beginning at age —
62 65 66 67 70
1924 . . . . . . . . 1986. . . . . . . . 65 . . . . . . . . 3 80 100 103 106 1151925 . . . . . . . . 1987. . . . . . . . 65 . . . . . . . . 3 1/2 80 100 103 1/2 107 117 1/21926 . . . . . . . . 1988. . . . . . . . 65 . . . . . . . . 3 1/2 80 100 103 1/2 107 117 1/21927 . . . . . . . . 1989. . . . . . . . 65 . . . . . . . . 4 80 100 104 108 1201928 . . . . . . . . 1990. . . . . . . . 65 . . . . . . . . 4 80 100 104 108 1201929 . . . . . . . . 1991. . . . . . . . 65 . . . . . . . . 4 1/2 80 100 104 1/2 109 122 1/21930 . . . . . . . . 1992. . . . . . . . 65 . . . . . . . . 4 1/2 80 100 104 1/2 109 122 1/2
1931 . . . . . . . . 1993. . . . . . . . 65 . . . . . . . . 5 80 100 105 110 1251932 . . . . . . . . 1994. . . . . . . . 65 . . . . . . . . 5 80 100 105 110 1251933 . . . . . . . . 1995. . . . . . . . 65 . . . . . . . . 5 1/2 80 100 105 1/2 111 127 1/21934 . . . . . . . . 1996. . . . . . . . 65 . . . . . . . . 5 1/2 80 100 105 1/2 111 127 1/21935 . . . . . . . . 1997. . . . . . . . 65 . . . . . . . . 6 80 100 106 112 1301936 . . . . . . . . 1998. . . . . . . . 65 . . . . . . . . 6 80 100 106 112 1301937 . . . . . . . . 1999. . . . . . . . 65 . . . . . . . . 6 1/2 80 100 106 1/2 113 132 1/21938 . . . . . . . . 2000. . . . . . . . 65, 2 mo . . . 6 1/2 79 1/6 98 8/9 105 5/12 111 11/12 131 5/121939 . . . . . . . . 2001. . . . . . . . 65, 4 mo . . . 7 78 1/3 97 7/9 104 2/3 111 2/3 132 2/31940 . . . . . . . . 2002. . . . . . . . 65, 6 mo . . . 7 77 1/2 96 2/3 103 1/2 110 1/2 131 1/2
1941 . . . . . . . . 2003. . . . . . . . 65, 8 mo . . . 7 1/2 76 2/3 95 5/9 102 1/2 110 132 1/21942 . . . . . . . . 2004. . . . . . . . 65, 10 mo . . 7 1/2 75 5/6 94 4/9 101 1/4 108 3/4 131 1/41943-54 . . . . . 2005-16 . . . . . 66 . . . . . . . . 8 75 93 1/3 100 108 1321955 . . . . . . . . 2017. . . . . . . . 66, 2 mo . . . 8 74 1/6 92 2/9 98 8/9 106 2/3 130 2/31956 . . . . . . . . 2018. . . . . . . . 66, 4 mo . . . 8 73 1/3 91 1/9 97 7/9 105 1/3 129 1/31957 . . . . . . . . 2019. . . . . . . . 66, 6 mo . . . 8 72 1/2 90 96 2/3 104 1281958 . . . . . . . . 2020. . . . . . . . 66, 8 mo . . . 8 71 2/3 88 8/9 95 5/9 102 2/3 126 2/31959 . . . . . . . . 2021. . . . . . . . 66, 10 mo . . 8 70 5/6 87 7/9 94 4/9 101 1/3 125 1/31960 & later . . 2022 & later . 67 . . . . . . . . 8 70 86 2/3 93 1/3 100 124
113
Program Assumptions and Methods
ment-status of other immigrants estimated to be residing within the SocialSecurity coverage area.
Covered-worker rates are defined as the ratio of OASDI covered workers tothe Social Security area population. The age-adjusted coverage rate for malesage 16 and over is projected to be 70.7, 70.1, and 69.7 percent for 2083 forthe low-cost, intermediate, and high-cost assumptions, respectively, com-pared to the 2007 level of about 71.7 percent. (Age-adjusted covered workerrates are adjusted to the 2007 age distribution of the Social Security areapopulation.) For females, the projected age-adjusted coverage rate changesfrom its 2007 level of 63.3 percent to 63.8, 63.1, and 62.4 percent for 2083for the low-cost, intermediate, and high-cost assumptions, respectively.
3. Taxable Payroll and Payroll Tax Revenue
The OASDI taxable payroll is the amount of earnings in a year that, whenmultiplied by the combined employee-employer tax rate, yields the totalamount of taxes due from wages and self-employed income in the year. Tax-able payroll is used in estimating OASDI income and in determining incomeand cost rates and actuarial balances. (See section IV.B.1, Annual IncomeRates, Cost Rates, and Balances, for definitions of these terms.) Taxable pay-roll is computed from taxable earnings, defined as the sum of wages and self-employment earnings subject to the Social Security tax. In computing tax-able payroll, wages are adjusted to take into account the “excess wages”earned by workers with multiple jobs whose combined wages exceed thecontribution and benefit base. Also, from 1983 through 2001, taxable payrollincludes deemed wage credits for military service. Prior to 1984, the self-employed tax rate was less than the combined employee-employer rate, thustaxable self-employed earnings were weighted to reflect this. Also, prior to1988, employers were exempt from paying Social Security tax on part oftheir employees’ tips; taxable payroll was thus reduced by half of the amountof tips to take this into account.
The computation of taxable earnings for employees, employers, and the self-employed is based on total earnings in covered employment. Covered earn-ings are summed from component sectors of the economy, including private,State and local, Federal civilian, and military. Covered earnings for each sec-tor are based on the projected growth of U.S. earnings and a factor thatreflects any projected change in coverage (e.g., the increase in coverage inthe Federal civilian sector due to mandatory coverage of newly hiredemployees). The level of taxable earnings reflects only the portion of cov-ered earnings that is at or below the contribution and benefit base. The por-tion of covered earnings that is taxable (i.e., at or below the base) was about

Assumptions & Methods
114
89.5, 86.9, and 82.8 percent for 1983, 1994, and 2000, respectively. Thisratio of taxable earnings to covered earnings rose to about 85.8 for 2002,then fell to 82.7 for 2007. The average annual rate of change in the ratio wasabout -0.3 percent between 1983 and 2007. Most of this decline was due to arelative increase in wages for high earners.
The ratio is assumed to increase to about 85.2 percent for 2009 for the inter-mediate assumptions due, in part, to a recession-induced reduction in the rel-ative amount of wages of high earners. The projected taxable earnings ratiosin 2018 are 83.7, 82.9, and 82.1 percent for the low-cost, intermediate, andhigh-cost assumptions, respectively. After 2018, the taxable-to-covered earn-ings ratio is approximately constant.
Payroll tax revenue is computed by applying the scheduled tax rates to tax-able wages and self-employment income, taking into account the lagbetween the time the tax liability is incurred and taxes are collected. In thecase of wages, employers are required to deposit withholding taxes with theTreasury on a schedule determined by the amount of tax liability incurred.(Generally, the higher the amount of liability, the sooner the taxes must bepaid—ranging from the middle of the following month for employers withfew employees to the next banking day after wages are paid for companieswith very large payrolls.) Self-employed workers are required to make esti-mated tax payments on their earnings four times during the year, as well asmaking up any under-estimate on their individual income tax return. The pat-tern of actual receipts by the Treasury is taken into account when estimatingself-employed tax collections.
4. Insured Population
Eligibility for benefits under the OASDI program requires some minimallevel of work in covered employment. This requirement is established by aworker’s accumulation of quarters of coverage (QCs). Prior to 1978, one QCwas credited for each calendar quarter in which at least $50 was earned. In1978, when quarterly reporting of earnings was replaced by annual reporting,the amount required to earn a QC (up to a maximum of four per year) was setat $250. Since then, this amount has been adjusted each year according tochanges in the AWI. Its value in 2009 is $1,090.
There are three types of insured status that can be acquired by a workerunder the OASDI program. Each of these statuses is determined by the num-ber and recency of QCs earned. Fully insured status is acquired by anyworker whose total number of QCs is greater than or equal to the number ofyears elapsed after the year of attainment of age 21 (but not less than six).

115
Program Assumptions and Methods
Once a worker has accumulated 40 QCs, he or she remains permanently fullyinsured. Disability insured status is acquired by any fully insured workerover age 30 who has accumulated 20 QCs during the 40-quarter period end-ing with the current quarter; any fully insured worker aged 24-30 who hasaccumulated QCs during one-half of the quarters elapsed after the quarter ofattainment of age 21 and up to and including the current quarter; and anyfully insured worker under age 24 who has accumulated six QCs during the12-quarter period ending with the current quarter. Currently insured status isacquired by any worker who has accumulated six QCs during the 13-quarterperiod ending with the current quarter. Periods of disability are excludedfrom the above described QC requirements for insured status (but do notreduce the minimum of six QCs).
There are many types of benefits payable to workers and their family mem-bers under the OASDI program. A worker must be fully insured to be eligi-ble for a primary retirement benefit, and for his or her spouse or children tobe eligible for auxiliary benefits. A deceased worker must have been eithercurrently insured or fully insured at the time of death for his or her children(and their mother or father) to be eligible for benefits. If there are no eligiblesurviving children, the deceased worker must have been fully insured at thetime of death for his or her surviving spouse to be eligible. A worker must bedisability insured to be eligible for a primary disability benefit, and for his orher spouse or children to be eligible for auxiliary benefits.
Historical estimates of the fully insured population, as a percentage of theSocial Security area population, are made by age and sex for each birthcohort beginning with 1900. These percentages are based on 30,000 simu-lated work histories for each sex and birth cohort, which are constructedfrom past coverage rates, median earnings, and amounts required for credit-ing QCs. These work histories are developed by a model that assumes thatpersons who have recently been out of covered employment are likely toremain out of covered employment. This model is aligned such that the sim-ulated fully insured percentages reproduce fairly closely the fully insuredpercentages estimated from the Continuous Work History Sample from 1970to date. The fully insured population for future years is projected using thismodel, reflecting estimated future coverage rates, median earnings, andamounts required for crediting QCs.
Historical estimates of the disability insured population, as a percentage ofthe fully insured population, are made by age and sex for each birth cohortbeginning with 1900. These percentages are based on the same simulatedwork histories used to project the fully insured percentages. Additionaladjustments are made to bring the simulated disability insured percentages
Assumptions & Methods
116
into close agreement with those estimated from the Continuous Work HistorySample. The principal adjustment is for periods of disability (which are notexplicitly taken into account in the model). These periods (which reduce thenormally applicable QC requirements) have a negligible effect on fullyinsured status at retirement age, but a substantial effect on disability insuredstatus. The disability insured population for future years is projected usingthis model, reflecting projections of the fully insured population.
For the 2009 Trustees Report, projections of the disability insured populationreflect improvements in estimating the historical disability insured popula-tion. For historical years, disability insured status is estimated using adminis-trative records of all workers with earnings reported to the Social SecurityAdministration. The improvements in this process generally resulted in low-ering the estimated number of people in the post-1980 Social Security areapopulation with disability insured status.
Projections of the currently insured population are not made. This is becausethe number of beneficiaries who are entitled to benefits based solely on cur-rently insured status has been very small, and is expected to remain small inthe future.
Under this procedure, the percentage of the Social Security area populationaged 62 and over that is fully insured is projected to increase from its esti-mated level of 81.3 for December 31, 2006, to 90.0, 90.2, and 90.7 forDecember 31, 2085, under alternatives I, II, and III, respectively. The per-centage for females is projected to increase significantly, while that for malesis projected to decline somewhat. Under alternative II, for example, the per-centage for males is projected to decrease slightly during this period from92.7 to 90.8, while that for females is projected to increase from 72.5 to 89.6.
5. Old-Age and Survivors Insurance Beneficiaries
The number of OASI beneficiaries is projected for each type of benefit sepa-rately, by the sex of the worker on whose earnings the benefits are based, andby the age of the beneficiary. For selected types of benefits, the number ofbeneficiaries is also projected by marital status.
For the short-range period, the number of retired-worker beneficiaries isdeveloped by applying award rates to the aged fully insured population lessthose insured persons entitled to retired-worker, disabled-worker, aged-widow(er)’s, or aged-spouse’s benefits, and by applying termination rates tothe number of persons already receiving retired-worker benefits.

117
Program Assumptions and Methods
For the long-range period, the number of retired-worker beneficiaries notpreviously converted from disabled-worker beneficiary status is projected asa percentage of the exposed population, i.e., the aged fully insured popula-tion less persons entitled to or converted from disabled-worker benefits andfully insured persons entitled only to widow(er)’s benefits. For age 62, a lin-ear regression is developed based on the historical relationship between thispercentage and the labor force participation rate. The regression coefficientsare then used to project this percentage based on the projected labor forceparticipation rate for age 62. The percentage for ages 70 and over is assumedto be nearly 100, because delayed retirement credits cannot be earned afterage 70. The percentage for each age 63 through 69 is projected based on his-torical experience with an adjustment for changes in the portion of the pri-mary insurance amount that is payable at each age of entitlement. As the nor-mal retirement age increases, the number of retired-worker beneficiaries notautomatically converted from disabled-worker beneficiary status as a per-centage of the exposed population, is gradually adjusted downward.
For the long-range period also, the number of retired-worker beneficiariespreviously converted from disabled-worker beneficiaries is calculated sepa-rately in a manner consistent with the calculation of disabled-worker benefi-ciaries.
The number of aged-spouse beneficiaries (excluding those who are alsoreceiving a retired-worker benefit) is estimated from the population projectedby age and sex. The benefits of aged-spouse beneficiaries are based on theearnings records of their husbands or wives, who are referred to as “earners.”In the short-range period, insured aged-spouse beneficiaries are projected inconjunction with the retired-worker beneficiaries. Uninsured aged-spousebeneficiaries are projected by applying award rates to the aged uninsuredmale or female population, and by applying termination rates to the popula-tion already receiving such benefits.
In the long-range period, aged-spouse beneficiaries are estimated separatelyfor those married and divorced. The number of married aged-spouse benefi-ciaries is projected by applying a series of factors to the number of spousesaged 62 and over in the population. These factors represent the probabilitiesthat the spouse and the earner meet all of the conditions of eligibility—i.e.,the probabilities that: (1) the earner is 62 or over; (2) the earner is insured;(3) the earner is receiving benefits; (4) the spouse is not receiving a benefitfor the care of an entitled child; (5) the spouse is not insured; and (6) thespouse is not eligible to receive a significant government pension based onearnings in noncovered employment. To the resulting number of spouses a
Assumptions & Methods
118
projected prevalence rate is applied to calculate the estimated number ofaged-spouse beneficiaries.
The number of divorced aged-spouse beneficiaries is estimated by applyingthe same factors to the number of divorced persons aged 62 and over in thepopulation, with three differences. First, an additional factor is required toreflect the probability that the person’s former earner spouse is still alive(otherwise, the person may be entitled to a divorced widow(er)’s benefit).Second, a factor is required to reflect the probability that the marriage to theearner spouse was at least 10 years in duration. Third, factor (3) above is notapplied because, effective as of January 1985, a divorced person generallyneed not wait to receive benefits until the former earner spouse is receivingbenefits.
The projected numbers of children under age 18, and students aged 18 and19, who are eligible for benefits as children of retired-worker beneficiaries,are based on the projected number of children in the population. In the short-range period, the number of entitled children is developed by applying awardrates to the number of children in the population where both parents arealive, and by applying termination rates to the number of children alreadyreceiving benefits.
In the long-range period, the number of entitled children is projected sepa-rately by sex of the earner parent. The number of entitled children is pro-jected for each age under 18 from the latest beneficiary data by reflectingchanges in the following: the number of children in the population and theratio of retired workers aged 62 to 71 to the population aged 20 to 71. Forstudent beneficiaries, factors are applied to the number of children aged 18and 19 in the population, representing the probabilities that the parent isalive, aged 62 or over, insured, and receiving a retired-worker benefit.Another factor is applied representing the probability that the child is attend-ing a secondary school.
The number of disabled children, aged 18 and over, of retired-worker benefi-ciaries is projected from the adult population. In the short-range period,award rates are applied to the population, and termination rates are applied tothe number of disabled children already receiving benefits. In the long-rangeperiod, disabled children are projected in a manner similar to that for studentchildren with the inclusion of a factor reflecting the probability of being dis-abled before age 22.
In the short-range period, the number of young-spouses, entitled becausethey have a child in their care, is developed by applying award rates to thenumber of awards to children of retired workers, where the children are

119
Program Assumptions and Methods
either under age 16 or disabled, and by applying termination rates to thenumber of young spouses with a child in care who are already receiving ben-efits. In the long-range period, young-spouse beneficiaries with a child intheir care who are projected as a proportion of the projected number of childbeneficiaries of retired workers, taking into account projected changes inaverage family size.
The number of aged-widow(er) beneficiaries (excluding those who are alsoreceiving a retired-worker benefit) is projected from the population by ageand sex. In the short-range period, fully insured aged-widow(er) beneficia-ries are projected in conjunction with the retired-worker beneficiaries. Unin-sured aged-widow(er) beneficiaries are projected by applying award rates tothe aged uninsured male or female population, and by applying terminationrates to the population already receiving such benefits. In the long-rangeperiod, aged-widow(er) beneficiaries are projected by marital status. Fourfactors are applied to the number of widow(er)s in the population aged 60and over. These factors represent the probabilities that: (1) the deceasedearner is fully insured at death; (2) the widow(er) is not receiving a benefitfor the care of an entitled child; (3) the widow(er) is not fully insured; and(4) the widow(er)’s benefits are not withheld because of receipt of a signifi-cant government pension based on earnings in noncovered employment. Inaddition, some insured widow(er)s who had not applied for their retired-worker benefits are assumed to receive widow(er)’s benefits. Also, the samefactors are applied to the number of divorced persons aged 60 and over in thepopulation, with additional factors representing the probability that the per-son’s former earner spouse is deceased and that the marriage was at least 10years in duration.
In the short-range period, the number of disabled-widow(er) beneficiaries isdeveloped by applying award rates to the uninsured male or female popula-tion, and by applying termination rates to the population already receiving adisabled-widow(er) benefit. In the long-range period, the number is projectedfor each age 50 up to NRA as percentages of the widowed and divorced pop-ulations, adjusted for the insured status of the deceased spouse, the preva-lence of disability, and the probability that the disabled spouse is notreceiving another type of benefit.
The projected numbers of children under age 18, and students aged 18 and19, who are entitled for benefits as survivors of deceased workers, are basedon the projected number of children in the population whose mothers orfathers are deceased. In the short-range period, the number of entitled chil-dren is developed by applying award rates to the number of orphaned chil-
Assumptions & Methods
120
dren, and by applying termination rates to the number of children alreadyreceiving benefits.
In the long-range period, the number of child-survivor beneficiaries is pro-jected in a manner analogous to that for student beneficiaries of retired work-ers, with the factor representing the probability that the parent is aged 62 orover replaced by a factor that represents the probability that the parent isdeceased.
In the short-range period, the numbers of entitled mother-survivor and father-survivor beneficiaries are developed by applying award rates to the numberof awards to child-survivor beneficiaries, where the children are either underage 16 or disabled, and by applying termination rates to the number ofmother-survivors and father-survivors already receiving benefits. In the long-range period, mother-survivor and father-survivor beneficiaries, assumingthey are not remarried, are estimated from the number of child-survivor ben-eficiaries, taking into account projected changes in average family size.
The number of parent-survivor beneficiaries is projected based on the histor-ical pattern of the number of such beneficiaries.
Table V.C4 shows the projected number of beneficiaries under the OASI pro-gram by type of benefit. Included among the beneficiaries who receiveretired-worker benefits are persons who also receive a residual benefit con-sisting of the excess of an auxiliary benefit over their retired-worker benefit.Estimates of the number and amount of such residual payments are madeseparately for spouses and widow(er)s.

121
Program Assumptions and Methods
Table V.C4.—OASI Beneficiaries With Benefits in Current-Payment Status at the End of Calendar Years 1945-2085
[In thousands]
Calendar year
Retired workers and auxiliaries Survivors
TotalWorkera Spouse ChildWidow-
widowerMother-
father Child Parent
Historical data:1945 . . . . . . . . . . 518 159 13 94 121 377 6 1,2881950 . . . . . . . . . . 1,771 508 46 314 169 653 15 3,4771955 . . . . . . . . . . 4,474 1,192 122 701 292 1,154 25 7,9611960 . . . . . . . . . . 8,061 2,269 268 1,544 401 1,577 36 14,1571965 . . . . . . . . . . 11,101 2,614 461 2,371 472 2,074 35 19,1281970 . . . . . . . . . . 13,349 2,668 546 3,227 523 2,688 29 23,0301975 . . . . . . . . . . 16,589 2,867 643 3,888 582 2,919 21 27,5091980 . . . . . . . . . . 19,564 3,018 639 4,415 563 2,610 15 30,8231985 . . . . . . . . . . 22,435 3,069 456 4,862 372 1,918 10 33,1221986 . . . . . . . . . . 22,985 3,086 450 4,927 350 1,878 9 33,6851987 . . . . . . . . . . 23,444 3,090 439 4,983 329 1,837 8 34,1291988 . . . . . . . . . . 23,862 3,088 432 5,013 318 1,809 7 34,5291989 . . . . . . . . . . 24,331 3,095 422 5,057 312 1,782 6 35,0041990 . . . . . . . . . . 24,841 3,104 421 5,098 304 1,777 6 35,5511991 . . . . . . . . . . 25,293 3,106 425 5,142 301 1,792 5 36,0641992 . . . . . . . . . . 25,762 3,115 431 5,187 294 1,808 5 36,6031993 . . . . . . . . . . 26,109 3,098 436 5,207 289 1,837 5 36,9811994 . . . . . . . . . . 26,412 3,069 440 5,218 283 1,865 4 37,2921995 . . . . . . . . . . 26,679 3,027 441 5,213 275 1,884 4 37,5221996 . . . . . . . . . . 26,905 2,971 442 5,199 242 1,898 4 37,6611997 . . . . . . . . . . 27,282 2,926 441 5,043 230 1,893 3 37,8171998 . . . . . . . . . . 27,518 2,866 439 4,981 221 1,884 3 37,9111999 . . . . . . . . . . 27,784 2,811 442 4,936 212 1,885 3 38,0732000 . . . . . . . . . . 28,505 2,798 459 4,901 203 1,878 3 38,7472001 . . . . . . . . . . 28,843 2,742 467 4,828 197 1,890 3 38,9692002 . . . . . . . . . . 29,195 2,681 477 4,771 194 1,908 2 39,2272003 . . . . . . . . . . 29,537 2,622 480 4,707 190 1,910 2 39,4482004 . . . . . . . . . . 29,952 2,569 482 4,643 184 1,901 2 39,7332005 . . . . . . . . . . 30,461 2,524 488 4,569 178 1,903 2 40,1262006 . . . . . . . . . . 30,976 2,476 490 4,494 171 1,899 2 40,5082007 . . . . . . . . . . 31,528 2,431 494 4,436 165 1,892 2 40,9472008 . . . . . . . . . . 32,274 2,370 525 4,380 160 1,915 2 41,625
Intermediate:2010 . . . . . . . . . . 34,205 2,373 554 4,308 152 1,919 2 43,5132015 . . . . . . . . . . 40,935 2,351 643 4,203 142 1,949 1 50,2252020 . . . . . . . . . . 49,127 2,283 714 4,140 136 1,979 2 58,3802025 . . . . . . . . . . 56,535 2,308 776 4,142 129 1,942 2 65,8332030 . . . . . . . . . . 63,013 2,391 819 4,183 125 1,935 2 72,4682035 . . . . . . . . . . 67,486 2,317 834 4,198 124 1,933 2 76,8942040 . . . . . . . . . . 69,848 2,209 841 4,163 121 1,920 2 79,1042045 . . . . . . . . . . 71,450 2,133 850 4,093 118 1,895 2 80,5412050 . . . . . . . . . . 73,351 2,110 879 3,993 115 1,871 2 82,3212055 . . . . . . . . . . 75,833 2,216 903 3,901 113 1,854 2 84,8192060 . . . . . . . . . . 78,757 2,327 926 3,836 111 1,837 2 87,7962065 . . . . . . . . . . 81,654 2,455 937 3,832 108 1,816 2 90,8042070 . . . . . . . . . . 84,790 2,571 957 3,889 105 1,793 2 94,1072075 . . . . . . . . . . 88,099 2,653 980 3,963 103 1,768 2 97,5682080 . . . . . . . . . . 91,512 2,735 1,004 4,030 100 1,751 2 101,1342085 . . . . . . . . . . 95,065 2,823 1,031 4,089 98 1,735 2 104,842

Assumptions & Methods
122
Notes: 1. The number of beneficiaries does not include uninsured individuals who receive benefits under Section228 of the Social Security Act. Costs are reimbursed from the General Fund of the Treasury for most ofthese individuals.2. Totals do not necessarily equal the sums of rounded components.
6. Disability Insurance Beneficiaries
Benefits are paid from the DI Trust Fund to disabled workers who satisfy thedisability insured requirements, who are unable to engage in substantial gain-ful activity due to medically determinable physical or mental impairmentsevere enough to satisfy the requirements of the program, and who have notyet attained normal retirement age. Spouses and children of such disabled
Low-cost:2010 . . . . . . . . . . 34,201 2,374 554 4,308 153 1,921 2 43,5122015 . . . . . . . . . . 40,804 2,357 648 4,194 145 1,973 1 50,1222020 . . . . . . . . . . 48,559 2,260 720 4,164 135 2,072 2 57,9122025 . . . . . . . . . . 55,370 2,275 790 4,195 127 2,106 2 64,8652030 . . . . . . . . . . 61,016 2,336 848 4,270 122 2,191 2 70,7842035 . . . . . . . . . . 64,599 2,235 876 4,314 119 2,284 2 74,4292040 . . . . . . . . . . 66,104 2,093 896 4,285 117 2,363 2 75,8612045 . . . . . . . . . . 67,008 1,991 919 4,207 117 2,422 2 76,6652050 . . . . . . . . . . 68,369 1,947 963 4,092 117 2,472 2 77,9622055 . . . . . . . . . . 70,464 2,015 1,000 3,983 119 2,524 2 80,1072060 . . . . . . . . . . 72,969 2,088 1,041 3,902 122 2,588 2 82,7112065 . . . . . . . . . . 75,376 2,158 1,069 3,878 125 2,652 2 85,2602070 . . . . . . . . . . 77,915 2,203 1,106 3,905 128 2,717 2 87,9762075 . . . . . . . . . . 80,725 2,221 1,150 3,948 131 2,778 2 90,9542080 . . . . . . . . . . 84,124 2,262 1,204 4,000 134 2,845 2 94,5692085 . . . . . . . . . . 88,235 2,339 1,266 4,068 137 2,914 2 98,960
High-cost:2010 . . . . . . . . . . 34,216 2,373 554 4,309 152 1,917 2 43,5232015 . . . . . . . . . . 41,099 2,347 639 4,214 140 1,925 1 50,3652020 . . . . . . . . . . 49,813 2,319 710 4,114 138 1,892 2 58,9882025 . . . . . . . . . . 57,941 2,358 763 4,087 131 1,791 2 67,0722030 . . . . . . . . . . 65,318 2,478 789 4,093 125 1,705 2 74,5092035 . . . . . . . . . . 70,854 2,436 792 4,076 120 1,630 2 79,9102040 . . . . . . . . . . 74,274 2,352 787 4,032 113 1,554 2 83,1142045 . . . . . . . . . . 76,736 2,287 781 3,972 106 1,478 2 85,3622050 . . . . . . . . . . 79,263 2,276 793 3,889 99 1,415 2 87,7352055 . . . . . . . . . . 82,168 2,399 802 3,812 92 1,365 2 90,6402060 . . . . . . . . . . 85,504 2,539 808 3,759 86 1,315 2 94,0122065 . . . . . . . . . . 88,791 2,721 801 3,759 79 1,260 2 97,4132070 . . . . . . . . . . 92,394 2,907 802 3,821 73 1,206 2 101,2062075 . . . . . . . . . . 96,126 3,039 805 3,902 67 1,155 2 105,0962080 . . . . . . . . . . 99,476 3,145 804 3,975 62 1,111 2 108,5752085 . . . . . . . . . . 102,264 3,240 802 4,023 58 1,071 2 111,459
a Included among the beneficiaries who receive retired-worker benefits are persons who also receive a resid-ual benefit consisting of the excess of an auxiliary benefit over their retired-worker benefit.
Table V.C4.—OASI Beneficiaries With Benefits in Current-Payment Status at the End of Calendar Years 1945-2085 (Cont.)
[In thousands]
Calendar year
Retired workers and auxiliaries Survivors
TotalWorkera Spouse ChildWidow-
widowerMother-
father Child Parent

123
Program Assumptions and Methods
workers may also receive DI benefits provided they satisfy certain criteria,primarily age requirements.
The number of disabled workers receiving benefits in a given year (i.e., incurrent-payment status) is projected using standard actuarial methods thatreflect future new benefit awards, terminations due to death and recovery,and conversions from disabled-worker to retired-worker beneficiary statusafter which benefits are paid from the OASI Trust Fund.
The prevalence of disability results from the likelihood of becoming disabled(incidence) as well as the likelihood that disability ceases (termination). Dis-ability prevalence is captured by the ratio of the number of disabled-workerbeneficiaries in current-payment status to the disability insured population.This ratio is referred to as the disability prevalence rate. The balance of thissection describes the methods and assumptions used for projecting the num-ber of disabled-worker beneficiaries. Incidence rates and termination ratesare the key factors in these projections. This section illustrates these rates aswell as the projected beneficiary population and prevalence rates.
a. Disability Incidence
The number of new benefit awards each year divided by the number of indi-viduals who meet insured requirements but are not yet receiving benefits (thedisability exposed population) is referred to as the disability incidence rate.New awards are projected for each year by applying assumed age-sex-spe-cific disability incidence rates to the projected disability exposed populationby age and sex. Projections of the disability insured population are describedin section V.C.4 of this report.
For the first 10 years of the projection period (through 2018) incidence ratesreflect several factors including: (1) aspects of program administration (suchas efforts to reduce the disability backlog and recent changes to how claimsare adjudicated); (2) assumed future unemployment rates; and (3) underlyingtrends in incidence. Notably for this year’s report, all three sets of underlyingeconomic assumptions include a continuation of the current economic reces-sion, although of varying durations and severity. During the recession, theprojected disability incidence rates are estimated to experience sharp tempo-rary increases above the general trend level. The elevated incidence rates areassumed to subside as the economy recovers, and to briefly drop below thegeneral trend level on the assumption that some of the earlier additionalawards will be cases that would have applied in a later year. After 2018, age-sex-specific incidence rates are assumed to trend toward the ultimate ratesassumed for the long-range projections and to reach these ultimate rates in2028. These ultimate age-sex-specific disability incidence rates were

Assumptions & Methods
124
selected based on careful analysis of historical levels and patterns andexpected future conditions, including the impact of scheduled increases inthe normal retirement age.1 The ultimate incidence rates are assumed to rep-resent the likely average rates of incidence for the future.
For the intermediate alternative, the ultimate age-sex-adjusted incidence rate(adjusted to the disability exposed population for the year 2000) for agesthrough 64 is assumed to be 5.3 awards per thousand exposed population.This level is about 2 percent higher than the average rate for the historicalperiod 1970 through 2008. The ultimate age-sex-adjusted incidence rates forthe low-cost and high-cost alternatives are assumed to be 4.2 and 6.3 awardsper thousand exposed, or about 19 percent lower and 21 percent higher thanthe average for the historical period, respectively. For the 2009 report, theultimate assumed age-sex-adjusted incidence rates are essentially the same asin last year’s report.
Historical incidence rates and assumed incidence rates under the three alter-natives are illustrated in figure V.C3. Incidence rates have varied within awide range over the past 35 years. This variation is attributed to a variety ofdemographic and economic factors, along with the effects of changes due tolegislation and program administration.2 The solid lines in figure V.C3 illus-trate values of the incidence rate, age-sex adjusted to the distribution of thedisability exposed population for 2000. Such adjustment facilitates meaning-ful comparisons over long periods of time by focusing on the likelihood ofbecoming disabled, and excluding the effects of a changing distribution ofthe population toward ages where disability is inherently more or less likely.
Gross (unadjusted) incidence rates are also shown in figure V.C3 in dashedlines. Unadjusted rates are influenced by the changing age-sex distribution ofthe exposed population over time. The gross incidence rate fell substantiallybelow the age-sex-adjusted rate between 1975 and 1995 as the baby-boomgeneration swelled the size of the younger working-age population, wheredisability incidence is low. After 1995, the gross rate rose relative to theage-sex-adjusted rate, reflecting the aging of the baby-boom generation intohigher ages, where disability incidence increases substantially. After 2023,the gross incidence rate declines relative to the age-sex-adjusted rate as thebaby-boom generation moves above the normal retirement age (NRA), and is
1 Incidence rates are adjusted upward to account for additional workers who are expected to file for disabil-ity benefits (rather than retirement benefits) in response to greater reductions in retirement benefits as theNRA rises. 2 A more detailed discussion of the recent history of the DI program is presented in Actuarial Study 118,“Social Security Disability Insurance Program Worker Experience,” June 2005. This study can be found atwww.socialsecurity.gov/OACT/NOTES/s2000s.html.

125
Program Assumptions and Methods
replaced at prime disability ages (50 to NRA) by the smaller cohorts born inthe 1970s. As these smaller cohorts age past NRA, by about 2050, the grossincidence rate returns to a higher relative level under the intermediateassumptions. Thereafter, the gross rate remains higher, reflecting the persis-tently higher average age of the working-age population, which is largelydue to lower birth rates since 1965.
b. Disability Termination
Disability benefits may be terminated if a beneficiary dies or recovers fromthe disabling condition (as indicated by either medical improvement orreturn to work). The termination rate is the ratio of the number of termina-tions to the average number of disabled-worker beneficiaries during the year.
Termination rates are projected by age, sex, and reason for termination. Inaddition, in the long-range period (post-2018) termination rates are alsoassumed to vary by duration of entitlement to disabled-worker benefits.
Figure V.C3.—DI Disability Incidence Rates, 1970-2085[Awards per thousand disability exposed]
0
1
2
3
4
5
6
7
8
9
1970 1980 1990 2000 2010 2020 2030 2040 2050 2060 2070 2080
Calendar year
Gross incidence rates
Age-sex-adjustedincidence rates
I
II
III
Historical Estimated
Assumptions & Methods
126
In the short-range period (through 2018), the age-sex-adjusted death rate(adjusted to the 2000 disabled-worker population) under the intermediateassumptions is projected to gradually decline from 27.7 deaths per thousandbeneficiaries in 2008 to about 23.6 per thousand by 2018.1 The age-sex-adjusted recovery rate under the intermediate assumptions is assumed to risefrom a relatively low level of 10.5 per thousand beneficiaries in 2008(reflecting temporarily lower levels of continuing disability reviews) to 11.5per thousand beneficiaries by 2018. Under low-cost (high-cost) assumptions,total age-sex-adjusted termination rates due to death and recovery areassumed to increase (decrease) to levels roughly 10-16 percent higher(lower) than those under the intermediate assumptions.
For the long-range period (post-2018), death and recovery rates are projectedrelative to rates by age, sex, and duration of entitlement over the base period1996-2000.2 The ultimate age-sex-adjusted recovery rate for disabled work-ers is assumed to be about 10.8 per thousand beneficiaries. Ultimate age-sex-adjusted recovery rates for low-cost and high-cost alternatives are assumedto reach about 13.1 and 8.6 recoveries per thousand beneficiaries, respec-tively. For all three sets of assumptions, the ultimate recovery rates arereached in the twentieth year of the projection period (2028). In contrast,death rates by age and sex are assumed to change throughout the long-rangeperiod at the same rate as for death rates in the general population. From theage-sex- adjusted death rate of 27.7 per thousand beneficiaries in 2008, ratesof 20.3, 11.4, and 7.3 per thousand disabled-worker beneficiaries are pro-jected for 2085 under the low-cost, intermediate, and high-cost assumptions,respectively.
Figure V.C4 illustrates gross and age-sex-adjusted total termination rates fordisabled-worker beneficiaries for the historical period since 1970, and for theprojection period through 2085. In the near term, between 2011 and 2014,recovery terminations are projected to be elevated as SSA works down thecurrent pending backlog of continuing disability reviews. As with incidencerates, the age-sex-adjusted termination rate provides an illustration of the realchange in the tendency to terminate benefits. The gross rate is influenced bychanges in the age-sex distribution of the beneficiary population. A shift in
1 Projections are developed separately for the short range (through 2018) and for the long range (after 2018).While short-range assumptions vary within the 10-year short-range period, the full phase in to the ultimateassumptions is not achieved until 2028. Death rates differ in this regard as explained in the text. 2 The termination rate analysis was based on work presented in Actuarial Study 118, “Social Security Dis-ability Insurance Program Worker Experience,” June 2005. This study can be found on the Social Securitywebsite at www.socialsecurity.gov/OACT/NOTES/s2000s.html.

127
Program Assumptions and Methods
the beneficiary population to older ages, as when the baby-boom generationmoves into pre-retirement ages, results in an increase in the gross death ter-mination rate as long as death rates by age and sex are constant or declining.
c. Comparison of Incidence, Termination, and Conversion
Incidence and termination rates are the foundation for development of theprojected levels of disabled-worker beneficiaries in current-payment statusup to the normal retirement age (NRA) at which time beneficiaries are con-verted to retired-worker status and thereby leave the DI rolls. For all dis-abled-worker beneficiaries reaching the NRA in a given year, the disability“conversion” rate is, by definition 100 percent. For beneficiaries at all otherages this rate is zero. Conversions are simply a transfer of beneficiaries atNRA from the DI Trust Fund account to the OASI Trust Fund account. Afterconversion, recovery from the disabling condition is no longer considered.Conversions do represent a form of exit from the DI rolls and therefore mustbe accounted for in disabled-worker beneficiary totals.
Figure V.C5 compares the historical and projected (intermediate) levels ofincidence, termination, and conversion on both gross and age-sex-adjustedbases. The rates for incidence and termination (death and recovery) aredescribed above. The conversion ratio is the number of conversions in a
Figure V.C4.—DI Disability Termination Rates, 1970-2085[Terminations per thousand disabled-worker beneficiaries]
0
20
40
60
80
100
120
140
1970 1980 1990 2000 2010 2020 2030 2040 2050 2060 2070 2080Calendar year
Gross termination rates
Age-sex-adjustedtermination rates
II
III
I
Historical Estimated
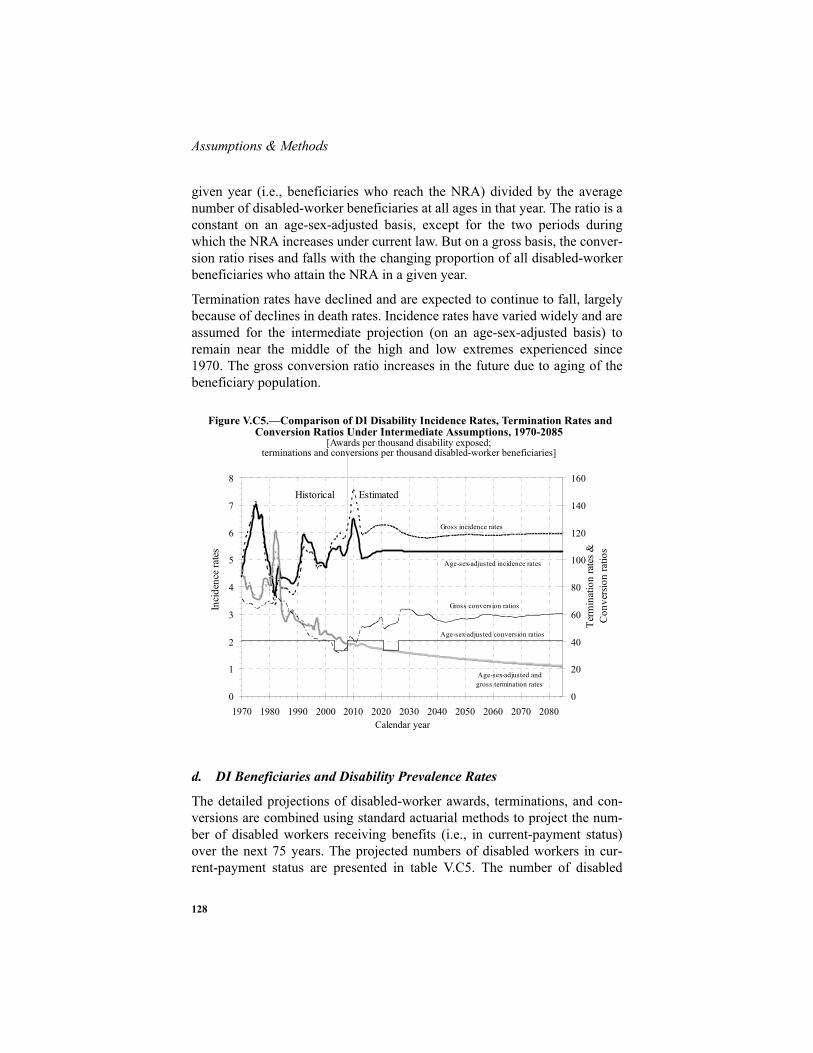
Assumptions & Methods
128
given year (i.e., beneficiaries who reach the NRA) divided by the averagenumber of disabled-worker beneficiaries at all ages in that year. The ratio is aconstant on an age-sex-adjusted basis, except for the two periods duringwhich the NRA increases under current law. But on a gross basis, the conver-sion ratio rises and falls with the changing proportion of all disabled-workerbeneficiaries who attain the NRA in a given year.
Termination rates have declined and are expected to continue to fall, largelybecause of declines in death rates. Incidence rates have varied widely and areassumed for the intermediate projection (on an age-sex-adjusted basis) toremain near the middle of the high and low extremes experienced since1970. The gross conversion ratio increases in the future due to aging of thebeneficiary population.
d. DI Beneficiaries and Disability Prevalence Rates
The detailed projections of disabled-worker awards, terminations, and con-versions are combined using standard actuarial methods to project the num-ber of disabled workers receiving benefits (i.e., in current-payment status)over the next 75 years. The projected numbers of disabled workers in cur-rent-payment status are presented in table V.C5. The number of disabled
Figure V.C5.—Comparison of DI Disability Incidence Rates, Termination Rates and Conversion Ratios Under Intermediate Assumptions, 1970-2085
[Awards per thousand disability exposed;terminations and conversions per thousand disabled-worker beneficiaries]
0
1
2
3
4
5
6
7
8
1970 1980 1990 2000 2010 2020 2030 2040 2050 2060 2070 2080Calendar year
Inci
denc
e ra
tes
0
20
40
60
80
100
120
140
160
Term
inat
ion
rate
s &C
onve
rsio
n ra
tios
Gross incidence rates
Age-sex-adjusted incidence rates
Gross conversion ratios
Age-sex-adjusted conversion ratios
Age-sex-adjusted and gross termination rates
Historical Estimated

129
Program Assumptions and Methods
workers in current-payment status is projected to grow from 7.4 million atthe end of 2008, to 12.0 million, 13.9 million, and 14.7 million at the end of2085, under the low-cost, intermediate, and high-cost assumptions, respec-tively. Of course, much of this growth is a direct result of the growth andaging of the population described earlier in this chapter. Also shown in tableV.C5 are disability prevalence rates on both gross and age-sex-adjustedbases. Discussion of auxiliary beneficiary projections appears below.
Table V.C5.—DI Beneficiaries With Benefits in Current-Payment Status at the End of Calendar Years 1960-2085
[Beneficiaries in thousands; prevalence rates per thousand disability insured]
Calendar year
Disabled-worker
beneficiaries
Auxiliary beneficiariesTotal
beneficiaries
Disabilityprevalence rates
Spouse Child GrossAge-sex-adjusted
Historical data:1960. . . . . . . . . . . . 455 77 155 6871965. . . . . . . . . . . . 988 193 558 1,7391970. . . . . . . . . . . . 1,493 283 889 2,665 20 181975. . . . . . . . . . . . 2,488 453 1,411 4,351 29 291980. . . . . . . . . . . . 2,856 462 1,359 4,677 28 311985. . . . . . . . . . . . 2,653 306 945 3,904 24 261986. . . . . . . . . . . . 2,725 301 965 3,991 25 271987. . . . . . . . . . . . 2,782 291 968 4,041 25 271988. . . . . . . . . . . . 2,826 281 963 4,070 25 271989. . . . . . . . . . . . 2,891 271 962 4,124 25 271990. . . . . . . . . . . . 3,007 266 989 4,261 25 281991. . . . . . . . . . . . 3,191 266 1,052 4,509 26 291992. . . . . . . . . . . . 3,464 271 1,151 4,886 28 311993. . . . . . . . . . . . 3,721 273 1,255 5,249 30 331994. . . . . . . . . . . . 3,958 271 1,350 5,579 32 341995. . . . . . . . . . . . 4,179 264 1,409 5,852 33 351996. . . . . . . . . . . . 4,378 224 1,463 6,065 34 361997. . . . . . . . . . . . 4,501 207 1,438 6,146 34 361998. . . . . . . . . . . . 4,691 190 1,446 6,327 35 361999. . . . . . . . . . . . 4,870 176 1,468 6,514 36 362000. . . . . . . . . . . . 5,036 165 1,466 6,667 37 372001. . . . . . . . . . . . 5,268 157 1,482 6,907 38 372002. . . . . . . . . . . . 5,539 152 1,526 7,217 39 382003. . . . . . . . . . . . 5,869 151 1,571 7,590 41 392004. . . . . . . . . . . . 6,198 153 1,599 7,950 43 392005. . . . . . . . . . . . 6,519 157 1,633 8,309 45 402006. . . . . . . . . . . . 6,807 156 1,652 8,615 46 402007. . . . . . . . . . . . 7,099 154 1,665 8,918 48 412008. . . . . . . . . . . . 7,427 155 1,692 9,273 49 41
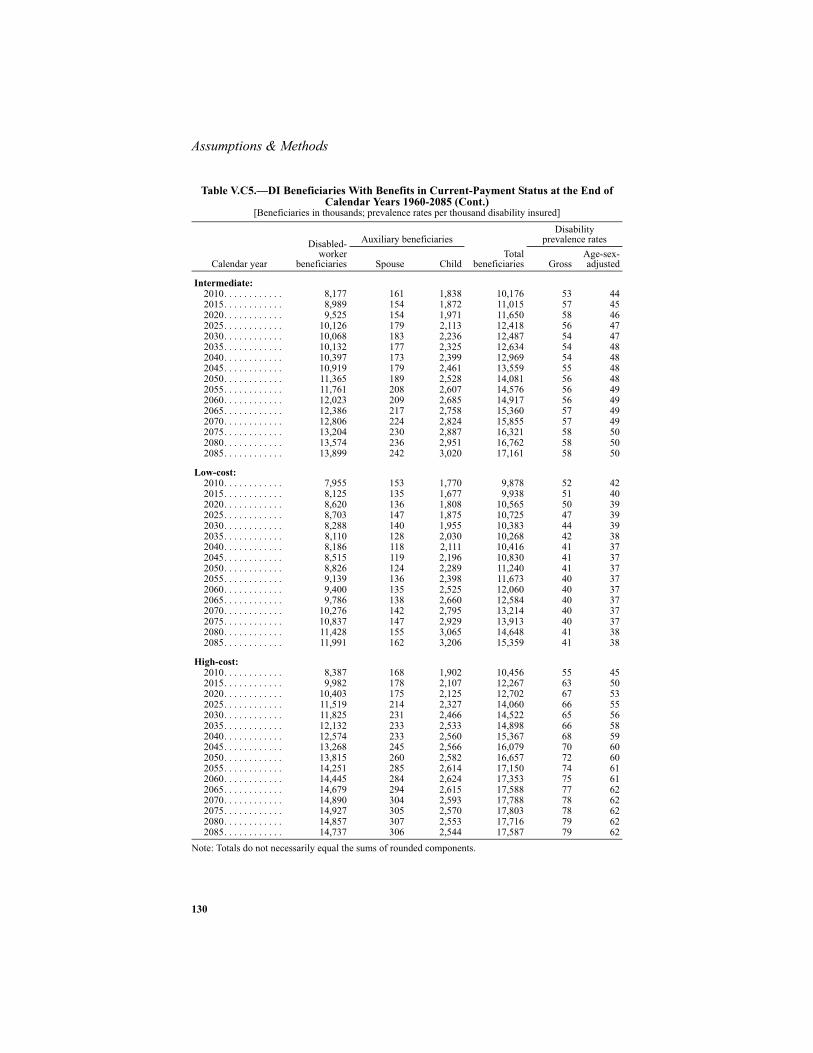
Assumptions & Methods
130
Note: Totals do not necessarily equal the sums of rounded components.
Intermediate:2010. . . . . . . . . . . . 8,177 161 1,838 10,176 53 442015. . . . . . . . . . . . 8,989 154 1,872 11,015 57 452020. . . . . . . . . . . . 9,525 154 1,971 11,650 58 462025. . . . . . . . . . . . 10,126 179 2,113 12,418 56 472030. . . . . . . . . . . . 10,068 183 2,236 12,487 54 472035. . . . . . . . . . . . 10,132 177 2,325 12,634 54 482040. . . . . . . . . . . . 10,397 173 2,399 12,969 54 482045. . . . . . . . . . . . 10,919 179 2,461 13,559 55 482050. . . . . . . . . . . . 11,365 189 2,528 14,081 56 482055. . . . . . . . . . . . 11,761 208 2,607 14,576 56 492060. . . . . . . . . . . . 12,023 209 2,685 14,917 56 492065. . . . . . . . . . . . 12,386 217 2,758 15,360 57 492070. . . . . . . . . . . . 12,806 224 2,824 15,855 57 492075. . . . . . . . . . . . 13,204 230 2,887 16,321 58 502080. . . . . . . . . . . . 13,574 236 2,951 16,762 58 502085. . . . . . . . . . . . 13,899 242 3,020 17,161 58 50
Low-cost:2010. . . . . . . . . . . . 7,955 153 1,770 9,878 52 422015. . . . . . . . . . . . 8,125 135 1,677 9,938 51 402020. . . . . . . . . . . . 8,620 136 1,808 10,565 50 392025. . . . . . . . . . . . 8,703 147 1,875 10,725 47 392030. . . . . . . . . . . . 8,288 140 1,955 10,383 44 392035. . . . . . . . . . . . 8,110 128 2,030 10,268 42 382040. . . . . . . . . . . . 8,186 118 2,111 10,416 41 372045. . . . . . . . . . . . 8,515 119 2,196 10,830 41 372050. . . . . . . . . . . . 8,826 124 2,289 11,240 41 372055. . . . . . . . . . . . 9,139 136 2,398 11,673 40 372060. . . . . . . . . . . . 9,400 135 2,525 12,060 40 372065. . . . . . . . . . . . 9,786 138 2,660 12,584 40 372070. . . . . . . . . . . . 10,276 142 2,795 13,214 40 372075. . . . . . . . . . . . 10,837 147 2,929 13,913 40 372080. . . . . . . . . . . . 11,428 155 3,065 14,648 41 382085. . . . . . . . . . . . 11,991 162 3,206 15,359 41 38
High-cost:2010. . . . . . . . . . . . 8,387 168 1,902 10,456 55 452015. . . . . . . . . . . . 9,982 178 2,107 12,267 63 502020. . . . . . . . . . . . 10,403 175 2,125 12,702 67 532025. . . . . . . . . . . . 11,519 214 2,327 14,060 66 552030. . . . . . . . . . . . 11,825 231 2,466 14,522 65 562035. . . . . . . . . . . . 12,132 233 2,533 14,898 66 582040. . . . . . . . . . . . 12,574 233 2,560 15,367 68 592045. . . . . . . . . . . . 13,268 245 2,566 16,079 70 602050. . . . . . . . . . . . 13,815 260 2,582 16,657 72 602055. . . . . . . . . . . . 14,251 285 2,614 17,150 74 612060. . . . . . . . . . . . 14,445 284 2,624 17,353 75 612065. . . . . . . . . . . . 14,679 294 2,615 17,588 77 622070. . . . . . . . . . . . 14,890 304 2,593 17,788 78 622075. . . . . . . . . . . . 14,927 305 2,570 17,803 78 622080. . . . . . . . . . . . 14,857 307 2,553 17,716 79 622085. . . . . . . . . . . . 14,737 306 2,544 17,587 79 62
Table V.C5.—DI Beneficiaries With Benefits in Current-Payment Status at the End of Calendar Years 1960-2085 (Cont.)
[Beneficiaries in thousands; prevalence rates per thousand disability insured]
Calendar year
Disabled-worker
beneficiaries
Auxiliary beneficiariesTotal
beneficiaries
Disabilityprevalence rates
Spouse Child GrossAge-sex-adjusted

131
Program Assumptions and Methods
Figure V.C6 illustrates the historical and projected disability prevalence rateson both a gross basis and on an age-sex-adjusted basis (adjusted to the age-sex distribution of the insured population for the year 2000).
Changes in prevalence rates are a direct result of changes in incidence ratesand termination rates. The patterns depicted for these rates in figure V.C5 arehelpful for understanding the trend in prevalence rates. (Annual rates are notdirectly comparable and cannot be simply combined because their denomina-tors differ.)
Prevalence rates have increased primarily because: (1) termination rates havedeclined; and (2) incidence rates at younger ages have increased relative torates at higher ages. Gross prevalence rates have increased more than age-sex-adjusted prevalence rates since the baby-boom generation began to moveinto the ages 50 through NRA, where incidence rates are relatively high.With this upward shift in the age distribution of the disabled population,gross conversions to retired worker status at NRA have naturally increasedas well. In the future, prevalence rates are projected to grow at a slower pacereflecting assumed stabilization in three factors: the age distribution of thegeneral population, the age distribution of the disability insured population,and relative rates of incidence by age. With these factors gradually stabiliz-
Figure V.C6.—DI Disability Prevalence Rates, 1970-2085[Rate per thousand disability insured]
0
10
20
30
40
50
60
70
80
1970 1980 1990 2000 2010 2020 2030 2040 2050 2060 2070 2080
Calendar year
Gross prevalence rates
Age-sex-adjustedprevalence rates
III
III
II
III
I
Historical Estimated
Assumptions & Methods
132
ing, the remaining force influencing prevalence rates is the declining deathtermination rate, which is projected to continue to have a small influencetoward higher disability prevalence rates in the future.
As mentioned above in the discussion of incidence and termination rates, theage-sex-adjusted prevalence rate isolates the changing trend in the true likeli-hood of receiving benefits for the insured population, free from the effects ofan aging population. For disability prevalence rates, like incidence rates, theentrance of the baby-boom generation into working ages caused the grossrate of disability to decline relative to the age-sex-adjusted rate between1975 and 1995, due to lower disability prevalence rates at younger ages.Conversely, the gross rate of disability prevalence increases relative to theage-sex-adjusted rate after 1995 due to the aging of the baby-boom genera-tion into ages with higher disability prevalence rates.
The age-sex-adjusted disability prevalence rate for ages through 64 is pro-jected to grow from 41.3 per thousand disability insured at the end of 2008,to 50.0 per thousand at the end of 2085 under the intermediate assumptions.As mentioned above, the growth in prevalence is expected to slow relative tothe historical period.
Under the low-cost and high-cost assumptions, the age-sex-adjusted disabil-ity prevalence rate is projected to decrease to 37.7 per thousand and increaseto 62.5 per thousand insured workers at the end of 2085, respectively.
Table V.C5 presents projections of the numbers of auxiliary beneficiariespaid from the DI Trust Fund. As indicated at the beginning of this subsec-tion, such auxiliary beneficiaries consist of qualifying spouses and childrenof disabled workers. In the case of children, the child must be either (1)under age 18, (2) age 18 or 19 and still a student in high school, or (3) overage 18 and disabled prior to age 22. In the case of spouses, the spouse musteither be at least age 62, or have, in his or her care, an eligible child benefi-ciary who is either under age 16 or disabled prior to age 22.
In general, the number of such auxiliary beneficiaries is projected in a man-ner that is related to the projected number of disabled-worker beneficiaries.In the short-range period (2009-18), this is accomplished for family membersof disabled-worker beneficiaries by projecting incidence and terminationrates for each category of auxiliary beneficiary. After 2018, the child benefi-ciaries at ages 18 and under are projected in relation to the projected numberof children in the population, by applying factors representing the probabilitythat either of their parents is a disabled-worker beneficiary. The remainingcategories of children and spouses are projected in a similar manner.

133
Program Assumptions and Methods
7. Average Benefits
Average benefits are projected by type of benefit based on recent historicalaverages, projected average primary insurance amounts (PIAs), and pro-jected ratios of average benefits to average PIAs. Average PIAs are calcu-lated from projected distributions of beneficiaries by duration from year ofinitial entitlement, average PIAs at initial entitlement, and increases in PIAssince the year of initial entitlement, reflecting automatic benefit increases,recomputations to reflect additional covered earnings, and other factors.Future average PIAs at initial entitlement are calculated from projected earn-ings histories, which are developed using a combination of the actual earn-ings histories associated with a sample of 2004 initial entitlements, and morerecent actual earnings levels by age and sex for covered workers.
For several types of benefits—retired-worker, aged-spouse, and aged-widow(er) benefits—the percentage of the PIA that is payable depends onthe age at initial entitlement to benefits. Projected ratios of average benefitsto average PIAs for these types of benefits are based on projections of agedistributions at initial entitlement.
8. Benefit Payments
For each type of benefit, benefit payments are calculated as the product of anumber of beneficiaries and a corresponding average monthly benefit. In theshort-range period, benefit payments are calculated on a quarterly basis. Inthe long-range period, all benefit payments are calculated on an annual basis,using the number of beneficiaries on December 31. These amounts areadjusted to include retroactive payments to newly awarded beneficiaries, andother amounts not reflected in the regular monthly benefit payments.
Lump-sum death payments are calculated as the product of (1) the number ofsuch payments, which is projected on the basis of the assumed death rates,the projected fully insured population, and the estimated percentage of thefully insured population that would qualify for benefits, and (2) the amountof the lump-sum death payment, which is $255 (not indexed in future years).
9. Administrative Expenses
The projection of administrative expenses through 2018 is based on histori-cal experience and the expected growth in average wages. Additionally, esti-mates for the first several years of the projection are provided by the Officeof Budget of the Social Security Administration. For years after 2018,administrative expenses are assumed to increase because of increases in the

Assumptions & Methods
134
number of beneficiaries and increases in the average wage, which will morethan offset assumed improvements in administrative productivity.
10.Railroad Retirement Financial Interchange
Railroad workers are covered under a separate multi-tiered plan, the first tierbeing very similar to OASDI coverage. An annual financial interchangebetween the Railroad Retirement fund and the OASI and DI funds is madereflecting the difference between: (1) the amount of OASDI benefits thatwould be paid to railroad workers and their families if railroad employmenthad been covered under the OASDI program and administrative expensesassociated with these benefits; and (2) the amount of OASDI payroll tax andincome tax that would be received with allowances for interest from railroadworkers.
The effect of the financial interchange with the Railroad Retirement programis evaluated on the basis of trends similar to those used in estimating the costof OASDI benefits. The resulting effect is annual short-range costs of about$4-5 billion and a long-range summarized cost of 0.04 percent of taxablepayroll to the OASDI program.
11. Military Service Transfers
Beginning in 1966, the OASI and DI Trust Funds were reimbursed annuallyfor the cost (including administrative expenses) of providing additional bene-fit payments resulting from noncontributory wage credits for military serviceperformed prior to 1957. The 1983 amendments modified the reimbursementmechanism and the timing of the reimbursements, and required a transfer in1983 to include all future costs attributable to the wage credits. The amend-ments also require adjustments to that 1983 transfer every fifth year, begin-ning with 1985, to account for actual data.
12. Income From Taxation of Benefits
Under present law, the OASI and DI Trust Funds are credited with the addi-tional income taxes attributable to the taxation of up to the first 50 percent ofOASI and DI benefit payments. (The remainder of the income taxes attribut-able to the taxation of up to 85 percent of OASI and DI benefit payments iscredited to the HI Trust Fund.)
For the short-range period, income to the trust funds from such taxation isestimated by applying the following two factors to total OASI and DI benefitpayments: (1) the percentage of benefit payments (limited to 50 percent) thatis taxable; and (2) the average marginal tax rate applicable to those benefits.

135
Program Assumptions and Methods
For the long-range period, income to the trust funds from such taxation isestimated by applying projected ratios of taxation of OASI and DI benefits tototal OASI and DI benefit payments. Because the income thresholds used forbenefit taxation are, by law, constant in the future, their values in relation tofuture income and benefit levels will decline. Thus, ratios of income fromtaxation of benefits to the amount of benefits are projected to increase gradu-ally. Ultimate tax ratios for OASI and DI benefits used in the projection arebased on information from the Office of Tax Analysis (OTA) in the Depart-ment of the Treasury, by eliminating the current threshold amounts com-pletely for taxation of Social Security benefits in its tax model. Subsequently,based on recent Current Population Survey data, the Office of the ChiefActuary makes a downward adjustment to OTA’s ultimate ratios for relativechanges in the projected 75th year OASDI beneficiary population in the mostrecent Trustees Report.
Appendices
136
VI. APPENDICES
A. HISTORY OF OASI AND DI TRUST FUND OPERATIONS
The Federal Old-Age and Survivors Insurance (OASI) Trust Fund was estab-lished on January 1, 1940 as a separate account in the United States Treasury.The Federal Disability Insurance (DI) Trust Fund, another separate accountin the United States Treasury, was established on August 1, 1956. All thefinancial operations of the OASI and DI programs are handled through theserespective funds. The Board of Trustees is responsible for overseeing thefinancial operations of these funds. The following paragraphs describe thevarious components of trust fund income and outgo. Following this descrip-tion, tables VI.A2 and VI.A3 present the historical operations of the separatetrust funds since their inception, and table VI.A4 presents the operations ofthe combined trust funds during the period when they have co-existed.
The primary receipts of these two funds are amounts appropriated to each ofthem under permanent authority on the basis of contributions payable byworkers, their employers, and individuals with self-employment income, inwork covered by the OASDI program. All employees, and their employers,in covered employment are required to pay contributions with respect to theirwages. Employees, and their employers, are also required to pay contribu-tions with respect to cash tips, if the individual’s monthly cash tips amount toat least $20. All self-employed persons are required to pay contributions withrespect to their covered net earnings from self-employment. In addition topaying the required employer contributions on the wages of covered Federalemployees, the Federal Government also pays amounts equivalent to thecombined employer and employee contributions that would be paid ondeemed wage credits attributable to military service performed between 1957and 2001 if such wage credits were covered wages.
In general, an individual’s contributions, or taxes, are computed on wages ornet earnings from self-employment, or both wages and net self-employmentearnings combined, up to a specified maximum annual amount. The contri-butions are determined first on the wages and then on any net self-employ-ment earnings, such that the total does not exceed the annual maximumamount. An employee who pays contributions on wages in excess of theannual maximum amount (because of employment with two or moreemployers) is eligible for a refund of the excess employee contributions.
The monthly benefit amount to which an individual (or his or her spouse andchildren) may become entitled under the OASDI program is based on theindividual’s taxable earnings during his or her lifetime. For almost all per-
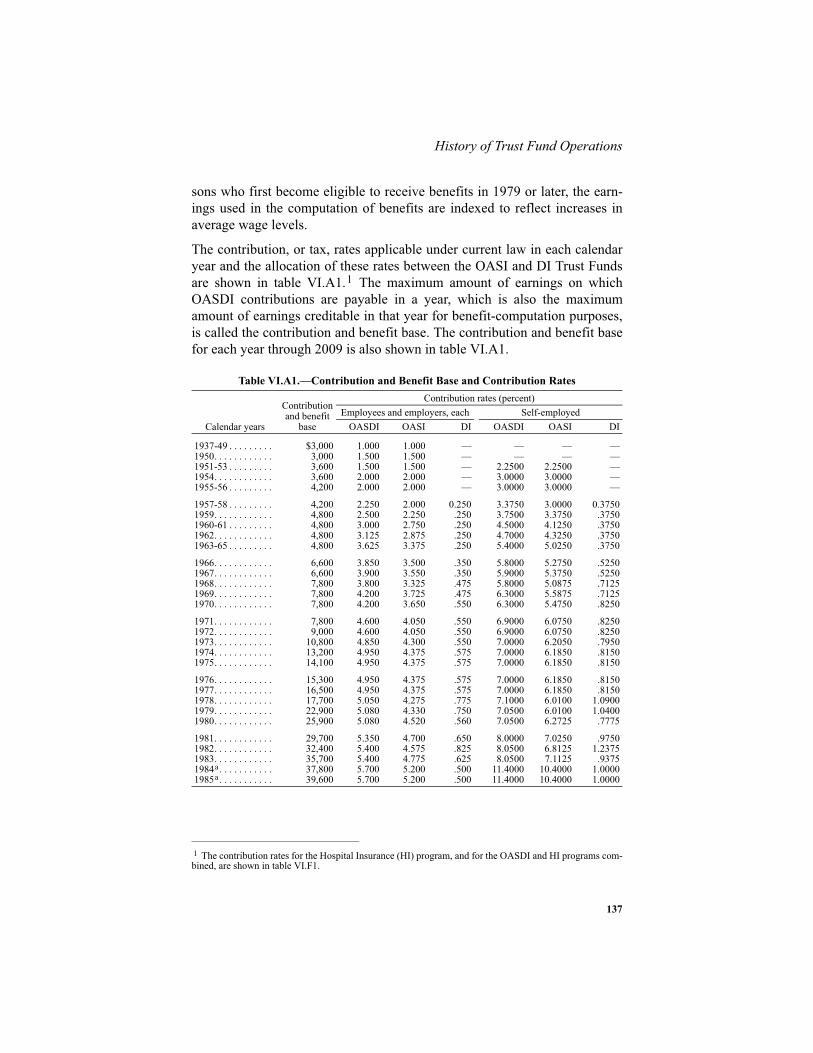
137
History of Trust Fund Operations
sons who first become eligible to receive benefits in 1979 or later, the earn-ings used in the computation of benefits are indexed to reflect increases inaverage wage levels.
The contribution, or tax, rates applicable under current law in each calendaryear and the allocation of these rates between the OASI and DI Trust Fundsare shown in table VI.A1.1 The maximum amount of earnings on whichOASDI contributions are payable in a year, which is also the maximumamount of earnings creditable in that year for benefit-computation purposes,is called the contribution and benefit base. The contribution and benefit basefor each year through 2009 is also shown in table VI.A1.
1 The contribution rates for the Hospital Insurance (HI) program, and for the OASDI and HI programs com-bined, are shown in table VI.F1.
Table VI.A1.—Contribution and Benefit Base and Contribution Rates
Calendar years
Contributionand benefit
base
Contribution rates (percent)Employees and employers, each Self-employed
OASDI OASI DI OASDI OASI DI
1937-49 . . . . . . . . . $3,000 1.000 1.000 — — — —1950. . . . . . . . . . . . 3,000 1.500 1.500 — — — —1951-53 . . . . . . . . . 3,600 1.500 1.500 — 2.2500 2.2500 —1954. . . . . . . . . . . . 3,600 2.000 2.000 — 3.0000 3.0000 —1955-56 . . . . . . . . . 4,200 2.000 2.000 — 3.0000 3.0000 —
1957-58 . . . . . . . . . 4,200 2.250 2.000 0.250 3.3750 3.0000 0.37501959. . . . . . . . . . . . 4,800 2.500 2.250 .250 3.7500 3.3750 .37501960-61 . . . . . . . . . 4,800 3.000 2.750 .250 4.5000 4.1250 .37501962. . . . . . . . . . . . 4,800 3.125 2.875 .250 4.7000 4.3250 .37501963-65 . . . . . . . . . 4,800 3.625 3.375 .250 5.4000 5.0250 .3750
1966. . . . . . . . . . . . 6,600 3.850 3.500 .350 5.8000 5.2750 .52501967. . . . . . . . . . . . 6,600 3.900 3.550 .350 5.9000 5.3750 .52501968. . . . . . . . . . . . 7,800 3.800 3.325 .475 5.8000 5.0875 .71251969. . . . . . . . . . . . 7,800 4.200 3.725 .475 6.3000 5.5875 .71251970. . . . . . . . . . . . 7,800 4.200 3.650 .550 6.3000 5.4750 .8250
1971. . . . . . . . . . . . 7,800 4.600 4.050 .550 6.9000 6.0750 .82501972. . . . . . . . . . . . 9,000 4.600 4.050 .550 6.9000 6.0750 .82501973. . . . . . . . . . . . 10,800 4.850 4.300 .550 7.0000 6.2050 .79501974. . . . . . . . . . . . 13,200 4.950 4.375 .575 7.0000 6.1850 .81501975. . . . . . . . . . . . 14,100 4.950 4.375 .575 7.0000 6.1850 .8150
1976. . . . . . . . . . . . 15,300 4.950 4.375 .575 7.0000 6.1850 .81501977. . . . . . . . . . . . 16,500 4.950 4.375 .575 7.0000 6.1850 .81501978. . . . . . . . . . . . 17,700 5.050 4.275 .775 7.1000 6.0100 1.09001979. . . . . . . . . . . . 22,900 5.080 4.330 .750 7.0500 6.0100 1.04001980. . . . . . . . . . . . 25,900 5.080 4.520 .560 7.0500 6.2725 .7775
1981. . . . . . . . . . . . 29,700 5.350 4.700 .650 8.0000 7.0250 .97501982. . . . . . . . . . . . 32,400 5.400 4.575 .825 8.0500 6.8125 1.23751983. . . . . . . . . . . . 35,700 5.400 4.775 .625 8.0500 7.1125 .93751984a. . . . . . . . . . . 37,800 5.700 5.200 .500 11.4000 10.4000 1.00001985a. . . . . . . . . . . 39,600 5.700 5.200 .500 11.4000 10.4000 1.0000
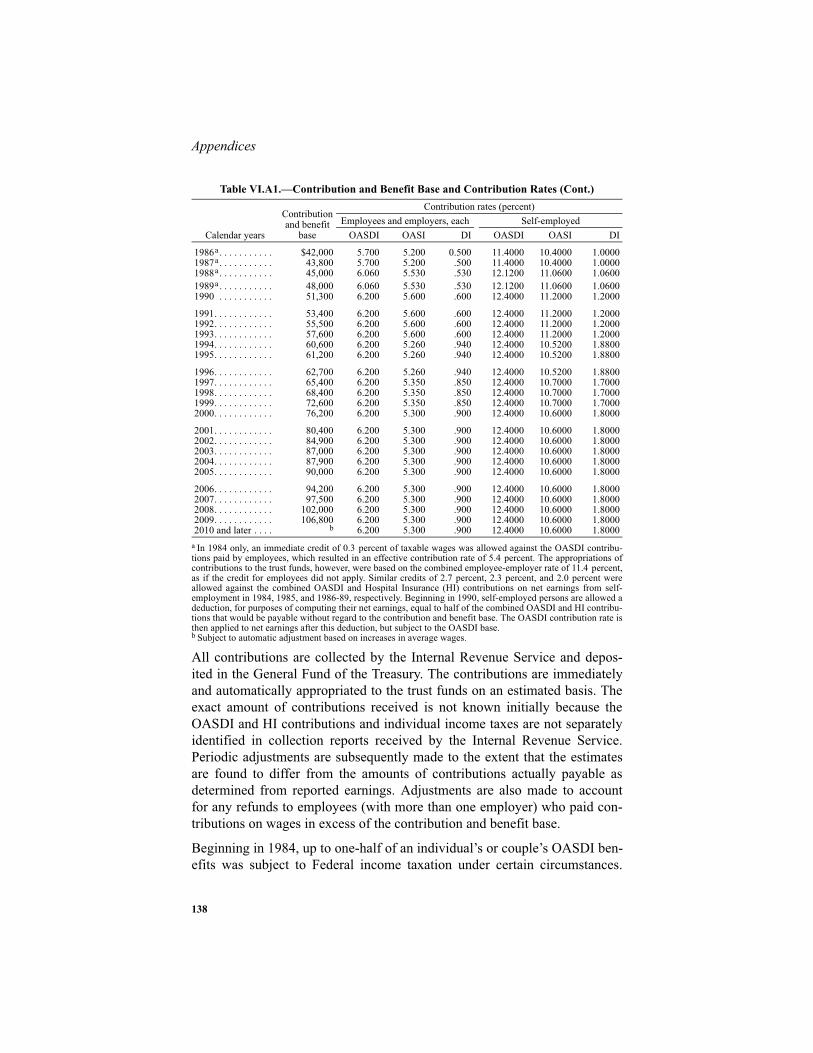
Appendices
138
All contributions are collected by the Internal Revenue Service and depos-ited in the General Fund of the Treasury. The contributions are immediatelyand automatically appropriated to the trust funds on an estimated basis. Theexact amount of contributions received is not known initially because theOASDI and HI contributions and individual income taxes are not separatelyidentified in collection reports received by the Internal Revenue Service.Periodic adjustments are subsequently made to the extent that the estimatesare found to differ from the amounts of contributions actually payable asdetermined from reported earnings. Adjustments are also made to accountfor any refunds to employees (with more than one employer) who paid con-tributions on wages in excess of the contribution and benefit base.
Beginning in 1984, up to one-half of an individual’s or couple’s OASDI ben-efits was subject to Federal income taxation under certain circumstances.
1986a. . . . . . . . . . . $42,000 5.700 5.200 0.500 11.4000 10.4000 1.00001987a. . . . . . . . . . . 43,800 5.700 5.200 .500 11.4000 10.4000 1.00001988a. . . . . . . . . . . 45,000 6.060 5.530 .530 12.1200 11.0600 1.06001989a. . . . . . . . . . . 48,000 6.060 5.530 .530 12.1200 11.0600 1.06001990 . . . . . . . . . . . 51,300 6.200 5.600 .600 12.4000 11.2000 1.2000
1991. . . . . . . . . . . . 53,400 6.200 5.600 .600 12.4000 11.2000 1.20001992. . . . . . . . . . . . 55,500 6.200 5.600 .600 12.4000 11.2000 1.20001993. . . . . . . . . . . . 57,600 6.200 5.600 .600 12.4000 11.2000 1.20001994. . . . . . . . . . . . 60,600 6.200 5.260 .940 12.4000 10.5200 1.88001995. . . . . . . . . . . . 61,200 6.200 5.260 .940 12.4000 10.5200 1.8800
1996. . . . . . . . . . . . 62,700 6.200 5.260 .940 12.4000 10.5200 1.88001997. . . . . . . . . . . . 65,400 6.200 5.350 .850 12.4000 10.7000 1.70001998. . . . . . . . . . . . 68,400 6.200 5.350 .850 12.4000 10.7000 1.70001999. . . . . . . . . . . . 72,600 6.200 5.350 .850 12.4000 10.7000 1.70002000. . . . . . . . . . . . 76,200 6.200 5.300 .900 12.4000 10.6000 1.8000
2001. . . . . . . . . . . . 80,400 6.200 5.300 .900 12.4000 10.6000 1.80002002. . . . . . . . . . . . 84,900 6.200 5.300 .900 12.4000 10.6000 1.80002003. . . . . . . . . . . . 87,000 6.200 5.300 .900 12.4000 10.6000 1.80002004. . . . . . . . . . . . 87,900 6.200 5.300 .900 12.4000 10.6000 1.80002005. . . . . . . . . . . . 90,000 6.200 5.300 .900 12.4000 10.6000 1.8000
2006. . . . . . . . . . . . 94,200 6.200 5.300 .900 12.4000 10.6000 1.80002007. . . . . . . . . . . . 97,500 6.200 5.300 .900 12.4000 10.6000 1.80002008. . . . . . . . . . . . 102,000 6.200 5.300 .900 12.4000 10.6000 1.80002009. . . . . . . . . . . . 106,800 6.200 5.300 .900 12.4000 10.6000 1.80002010 and later . . . . b 6.200 5.300 .900 12.4000 10.6000 1.8000
a In 1984 only, an immediate credit of 0.3 percent of taxable wages was allowed against the OASDI contribu-tions paid by employees, which resulted in an effective contribution rate of 5.4 percent. The appropriations ofcontributions to the trust funds, however, were based on the combined employee-employer rate of 11.4 percent,as if the credit for employees did not apply. Similar credits of 2.7 percent, 2.3 percent, and 2.0 percent wereallowed against the combined OASDI and Hospital Insurance (HI) contributions on net earnings from self-employment in 1984, 1985, and 1986-89, respectively. Beginning in 1990, self-employed persons are allowed adeduction, for purposes of computing their net earnings, equal to half of the combined OASDI and HI contribu-tions that would be payable without regard to the contribution and benefit base. The OASDI contribution rate isthen applied to net earnings after this deduction, but subject to the OASDI base.b Subject to automatic adjustment based on increases in average wages.
Table VI.A1.—Contribution and Benefit Base and Contribution Rates (Cont.)
Calendar years
Contributionand benefit
base
Contribution rates (percent)Employees and employers, each Self-employed
OASDI OASI DI OASDI OASI DI

139
History of Trust Fund Operations
Effective for taxable years beginning after 1993, the maximum percentage ofbenefits subject to taxation was increased from 50 percent to 85 percent. Theproceeds from taxation of up to 50 percent of benefits are credited to theOASI and DI Trust Funds in advance, on an estimated basis, at the beginningof each calendar quarter, with no reimbursement to the general fund for inter-est costs attributable to the advance transfers.1 Subsequent adjustments aremade based on the actual amounts as shown on annual income tax records.The amounts appropriated from the General Fund of the Treasury are allo-cated to the OASI and DI Trust Funds on the basis of the income taxes paidon the benefits from each fund.2
Another source of income to the trust funds is interest received on invest-ments held by the trust funds. That portion of each trust fund that is notrequired to meet the current cost of benefits and administration is invested,on a daily basis, primarily in interest-bearing obligations of the U.S. Govern-ment (including special public-debt obligations described below). Invest-ments may also be made in obligations guaranteed as to both principal andinterest by the United States, including certain Federally sponsored agencyobligations that are designated in the laws authorizing their issuance as law-ful investments for fiduciary and trust funds under the control and authorityof the United States or any officer of the United States. These obligationsmay be acquired on original issue at the issue price or by purchase of out-standing obligations at their market price.
The Social Security Act authorizes the issuance of special public-debt obli-gations for purchase exclusively by the trust funds. The Act provides that theinterest rate on new special obligations will be the average market yield, asof the last business day of a month, on all of the outstanding marketable U.S.obligations that are due or callable more than 4 years in the future. The rateso calculated is rounded to the nearest one-eighth of one percent and appliesto new issues in the following month. Beginning January 1999, in calculatingthe average market yield rate for this purpose, the Treasury incorporates theyield to the call date when a callable bond’s market price is above par.
Although the special issues cannot be bought or sold in the open market, theyare nonetheless redeemable at any time at par value and thus bear no risk offluctuations in principal value due to changes in market yield rates. Just as inthe case of marketable Treasury securities held by the public, all of the
1 The additional tax revenues resulting from the increase to 85 percent are transferred to the HI Trust Fund. 2 A special provision applies to benefits paid to nonresident aliens. Under Public Law 103-465, effective fortaxable years beginning after 1994, a flat-rate tax, usually 25.5 percent, is withheld from the benefits beforethey are paid and, therefore, remains in the trust funds. From 1984 to 1994 the flat-rate tax that was withheldwas usually 15 percent.

Appendices
140
investments held by the trust funds are backed by the full faith and credit ofthe U.S. Government.
Income is also affected by provisions of the Social Security Act for: (1)transfers between the General Fund of the Treasury and the OASI and DITrust Funds for any adjustments to prior payments for the cost arising fromthe granting of noncontributory wage credits for military service prior to1957, according to periodic determinations; and (2) the receipt of uncondi-tional money gifts or bequests made for the benefit of the trust funds or anyactivity financed through the funds.
The primary expenditures of the OASI and DI Trust Funds are for: (1)OASDI benefit payments, net of any reimbursements from the General Fundof the Treasury for unnegotiated benefit checks; and (2) expenses incurred bythe Social Security Administration and the Department of the Treasury inadministering the OASDI program and the provisions of the Internal Reve-nue Code relating to the collection of contributions. Such administrativeexpenses include expenditures for construction, rental and lease, or purchaseof office buildings and related facilities for the Social Security Administra-tion. The Social Security Act does not permit expenditures from the OASIand DI Trust Funds for any purpose not related to the payment of benefits oradministrative costs for the OASDI program.
The expenditures of the trust funds also include (1) the costs of vocationalrehabilitation services furnished as an additional benefit to disabled personsreceiving cash benefits because of their disabilities where such services con-tributed to their successful rehabilitation, and (2) net costs resulting from theprovisions of the Railroad Retirement Act which provide for a system ofcoordination and financial interchange between the Railroad Retirement pro-gram and the Social Security program. Under the latter provisions, transfersbetween the Railroad Retirement program’s Social Security Equivalent Ben-efit Account and the trust funds are made on an annual basis in order to placeeach trust fund in the same position in which it would have been if railroademployment had always been covered under Social Security.
The net worth of facilities and other fixed capital assets is not carried in thestatements of the operations of the trust funds presented in this report. This isbecause the value of fixed capital assets is not available in the form of afinancial asset redeemable for the payment of benefits or administrativeexpenditures, and therefore is not considered in assessing the actuarial statusof the trust funds.

141
History of Trust Fund Operations
Table VI.A2.— Operations of the OASI Trust Fund, Calendar Years 1937-2008
[Dollar amounts in billions]
Calendaryear
Income Expenditures Assets
Totala
Netcontri-
butionsb
Taxa-tion of
benefitsNet
interestc Total
Benefitpay-
mentsd
Admin-istra-
tivecosts
RRBinter-
change
Netincrease
duringyear
Amountat end
of year
Trustfund
ratioe
1937 . . $0.8 $0.8 — f f f — — $0.8 $0.8 —1938 . . .4 .4 — f f f — — .4 1.1 7,6601939 . . .6 .6 — f f f — — .6 1.7 8,0861940 . . .4 .3 — f $0.1 f f — .3 2.0 2,7811941 . . .8 .8 — $0.1 .1 $0.1 f — .7 2.8 1,7821942 . . 1.1 1.0 — .1 .2 .1 f — .9 3.7 1,7371943 . . 1.3 1.2 — .1 .2 .2 f — 1.1 4.8 1,8911944 . . 1.4 1.3 — .1 .2 .2 f — 1.2 6.0 2,0251945 . . 1.4 1.3 — .1 .3 .3 f — 1.1 7.1 1,9751946 . . 1.4 1.3 — .2 .4 .4 f — 1.0 8.2 1,7041947 . . 1.7 1.6 — .2 .5 .5 f — 1.2 9.4 1,5921948 . . 2.0 1.7 — .3 .6 .6 $0.1 — 1.4 10.7 1,5421949 . . 1.8 1.7 — .1 .7 .7 .1 — 1.1 11.8 1,4871950 . . 2.9 2.7 — .3 1.0 1.0 .1 — 1.9 13.7 1,1561951 . . 3.8 3.4 — .4 2.0 1.9 .1 — 1.8 15.5 6981952 . . 4.2 3.8 — .4 2.3 2.2 .1 — 1.9 17.4 6811953 . . 4.4 3.9 — .4 3.1 3.0 .1 — 1.3 18.7 5641954 . . 5.6 5.2 — .4 3.7 3.7 .1 f 1.9 20.6 5001955 . . 6.2 5.7 — .5 5.1 5.0 .1 f 1.1 21.7 4051956 . . 6.7 6.2 — .5 5.8 5.7 .1 f .9 22.5 3711957 . . 7.4 6.8 — .6 7.5 7.3 .2 f -.1 22.4 3001958 . . 8.1 7.6 — .6 8.6 8.3 .2 $0.1 -.5 21.9 2591959 . . 8.6 8.1 — .5 10.3 9.8 .2 .3 -1.7 20.1 2121960 . . 11.4 10.9 — .5 11.2 10.7 .2 .3 .2 20.3 1801961 . . 11.8 11.3 — .5 12.4 11.9 .2 .3 -.6 19.7 1631962 . . 12.6 12.1 — .5 14.0 13.4 .3 .4 -1.4 18.3 1411963 . . 15.1 14.5 — .5 14.9 14.2 .3 .4 .1 18.5 1231964 . . 16.3 15.7 — .6 15.6 14.9 .3 .4 .6 19.1 1181965 . . 16.6 16.0 — .6 17.5 16.7 .3 .4 -.9 18.2 1091966 . . 21.3 20.6 — .6 19.0 18.3 .3 .4 2.3 20.6 961967 . . 24.0 23.1 — .8 20.4 19.5 .4 .5 3.7 24.2 1011968 . . 25.0 23.7 — .9 23.6 22.6 .5 .4 1.5 25.7 1031969 . . 29.6 27.9 — 1.2 25.2 24.2 .5 .5 4.4 30.1 1021970 . . 32.2 30.3 — 1.5 29.8 28.8 .5 .6 2.4 32.5 1011971 . . 35.9 33.7 — 1.7 34.5 33.4 .5 .6 1.3 33.8 941972 . . 40.1 37.8 — 1.8 38.5 37.1 .7 .7 1.5 35.3 881973 . . 48.3 46.0 — 1.9 47.2 45.7 .6 .8 1.2 36.5 751974 . . 54.7 52.1 — 2.2 53.4 51.6 .9 .9 1.3 37.8 681975 . . 59.6 56.8 — 2.4 60.4 58.5 .9 1.0 -.8 37.0 631976 . . 66.3 63.4 — 2.3 67.9 65.7 1.0 1.2 -1.6 35.4 541977 . . 72.4 69.6 — 2.2 75.3 73.1 1.0 1.2 -2.9 32.5 471978 . . 78.1 75.5 — 2.0 83.1 80.4 1.1 1.6 -5.0 27.5 391979 . . 90.3 87.9 — 1.8 93.1 90.6 1.1 1.4 -2.9 24.7 30
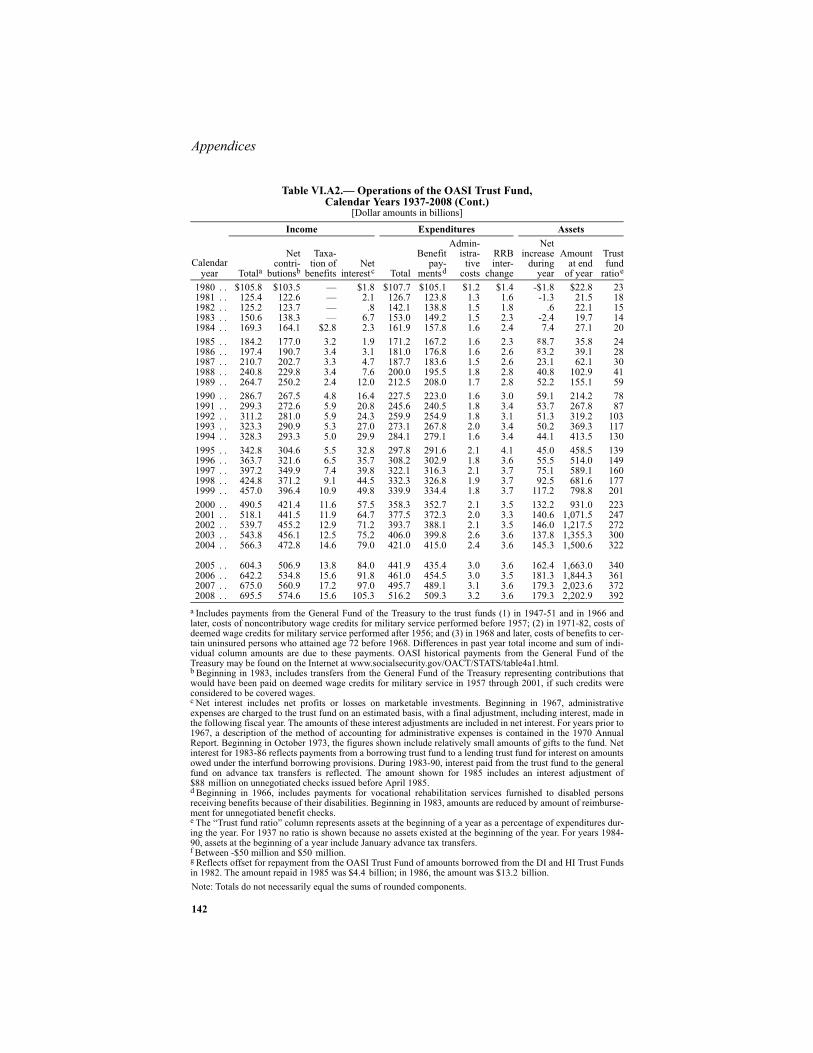
Appendices
142
Note: Totals do not necessarily equal the sums of rounded components.
1980 . . $105.8 $103.5 — $1.8 $107.7 $105.1 $1.2 $1.4 -$1.8 $22.8 231981 . . 125.4 122.6 — 2.1 126.7 123.8 1.3 1.6 -1.3 21.5 181982 . . 125.2 123.7 — .8 142.1 138.8 1.5 1.8 .6 22.1 151983 . . 150.6 138.3 — 6.7 153.0 149.2 1.5 2.3 -2.4 19.7 141984 . . 169.3 164.1 $2.8 2.3 161.9 157.8 1.6 2.4 7.4 27.1 201985 . . 184.2 177.0 3.2 1.9 171.2 167.2 1.6 2.3 g8.7 35.8 241986 . . 197.4 190.7 3.4 3.1 181.0 176.8 1.6 2.6 g3.2 39.1 281987 . . 210.7 202.7 3.3 4.7 187.7 183.6 1.5 2.6 23.1 62.1 301988 . . 240.8 229.8 3.4 7.6 200.0 195.5 1.8 2.8 40.8 102.9 411989 . . 264.7 250.2 2.4 12.0 212.5 208.0 1.7 2.8 52.2 155.1 591990 . . 286.7 267.5 4.8 16.4 227.5 223.0 1.6 3.0 59.1 214.2 781991 . . 299.3 272.6 5.9 20.8 245.6 240.5 1.8 3.4 53.7 267.8 871992 . . 311.2 281.0 5.9 24.3 259.9 254.9 1.8 3.1 51.3 319.2 1031993 . . 323.3 290.9 5.3 27.0 273.1 267.8 2.0 3.4 50.2 369.3 1171994 . . 328.3 293.3 5.0 29.9 284.1 279.1 1.6 3.4 44.1 413.5 1301995 . . 342.8 304.6 5.5 32.8 297.8 291.6 2.1 4.1 45.0 458.5 1391996 . . 363.7 321.6 6.5 35.7 308.2 302.9 1.8 3.6 55.5 514.0 1491997 . . 397.2 349.9 7.4 39.8 322.1 316.3 2.1 3.7 75.1 589.1 1601998 . . 424.8 371.2 9.1 44.5 332.3 326.8 1.9 3.7 92.5 681.6 1771999 . . 457.0 396.4 10.9 49.8 339.9 334.4 1.8 3.7 117.2 798.8 2012000 . . 490.5 421.4 11.6 57.5 358.3 352.7 2.1 3.5 132.2 931.0 2232001 . . 518.1 441.5 11.9 64.7 377.5 372.3 2.0 3.3 140.6 1,071.5 2472002 . . 539.7 455.2 12.9 71.2 393.7 388.1 2.1 3.5 146.0 1,217.5 2722003 . . 543.8 456.1 12.5 75.2 406.0 399.8 2.6 3.6 137.8 1,355.3 3002004 . . 566.3 472.8 14.6 79.0 421.0 415.0 2.4 3.6 145.3 1,500.6 322
2005 . . 604.3 506.9 13.8 84.0 441.9 435.4 3.0 3.6 162.4 1,663.0 3402006 . . 642.2 534.8 15.6 91.8 461.0 454.5 3.0 3.5 181.3 1,844.3 3612007 . . 675.0 560.9 17.2 97.0 495.7 489.1 3.1 3.6 179.3 2,023.6 3722008 . . 695.5 574.6 15.6 105.3 516.2 509.3 3.2 3.6 179.3 2,202.9 392
a Includes payments from the General Fund of the Treasury to the trust funds (1) in 1947-51 and in 1966 andlater, costs of noncontributory wage credits for military service performed before 1957; (2) in 1971-82, costs ofdeemed wage credits for military service performed after 1956; and (3) in 1968 and later, costs of benefits to cer-tain uninsured persons who attained age 72 before 1968. Differences in past year total income and sum of indi-vidual column amounts are due to these payments. OASI historical payments from the General Fund of theTreasury may be found on the Internet at www.socialsecurity.gov/OACT/STATS/table4a1.html.b Beginning in 1983, includes transfers from the General Fund of the Treasury representing contributions thatwould have been paid on deemed wage credits for military service in 1957 through 2001, if such credits wereconsidered to be covered wages.c Net interest includes net profits or losses on marketable investments. Beginning in 1967, administrativeexpenses are charged to the trust fund on an estimated basis, with a final adjustment, including interest, made inthe following fiscal year. The amounts of these interest adjustments are included in net interest. For years prior to1967, a description of the method of accounting for administrative expenses is contained in the 1970 AnnualReport. Beginning in October 1973, the figures shown include relatively small amounts of gifts to the fund. Netinterest for 1983-86 reflects payments from a borrowing trust fund to a lending trust fund for interest on amountsowed under the interfund borrowing provisions. During 1983-90, interest paid from the trust fund to the generalfund on advance tax transfers is reflected. The amount shown for 1985 includes an interest adjustment of$88 million on unnegotiated checks issued before April 1985.d Beginning in 1966, includes payments for vocational rehabilitation services furnished to disabled personsreceiving benefits because of their disabilities. Beginning in 1983, amounts are reduced by amount of reimburse-ment for unnegotiated benefit checks.e The “Trust fund ratio” column represents assets at the beginning of a year as a percentage of expenditures dur-ing the year. For 1937 no ratio is shown because no assets existed at the beginning of the year. For years 1984-90, assets at the beginning of a year include January advance tax transfers. f Between -$50 million and $50 million.g Reflects offset for repayment from the OASI Trust Fund of amounts borrowed from the DI and HI Trust Fundsin 1982. The amount repaid in 1985 was $4.4 billion; in 1986, the amount was $13.2 billion.
Table VI.A2.— Operations of the OASI Trust Fund, Calendar Years 1937-2008 (Cont.)
[Dollar amounts in billions]
Calendaryear
Income Expenditures Assets
Totala
Netcontri-
butionsb
Taxa-tion of
benefitsNet
interestc Total
Benefitpay-
mentsd
Admin-istra-
tivecosts
RRBinter-
change
Netincrease
duringyear
Amountat end
of year
Trustfund
ratioe

143
History of Trust Fund Operations
Table VI.A3.— Operations of the DI Trust Fund, Calendar Years 1957-2008
[Dollar amounts in billions]
Calendaryear
Income Expenditures Assets
Total a
Netcontri-
butionsb
Taxa-tion of
benefitsNet
interestc Total
Benefitpay-
mentsd
Admin-istra-
tivecosts
RRBinter-
change
Netincrease
duringyear
Amountat end
of year
Trustfund
ratioe
1957 . . $0.7 $0.7 — f $0.1 $0.1 f — $0.6 $0.6 —1958 . . 1.0 1.0 — f .3 .2 f — .7 1.4 2491959 . . .9 .9 — f .5 .5 $0.1 f .4 1.8 284
1960 . . 1.1 1.0 — $0.1 .6 .6 f f .5 2.3 3041961 . . 1.1 1.0 — .1 1.0 .9 .1 f .1 2.4 2391962 . . 1.1 1.0 — .1 1.2 1.1 .1 f -.1 2.4 2061963 . . 1.2 1.1 — .1 1.3 1.2 .1 f -.1 2.2 1831964 . . 1.2 1.2 — .1 1.4 1.3 .1 f -.2 2.0 159
1965 . . 1.2 1.2 — .1 1.7 1.6 .1 f -.4 1.6 1211966 . . 2.1 2.0 — .1 1.9 1.8 .1 f .1 1.7 821967 . . 2.4 2.3 — .1 2.1 2.0 .1 f .3 2.0 831968 . . 3.5 3.3 — .1 2.5 2.3 .1 f 1.0 3.0 831969 . . 3.8 3.6 — .2 2.7 2.6 .1 f 1.1 4.1 111
1970 . . 4.8 4.5 — .3 3.3 3.1 .2 f 1.5 5.6 1261971 . . 5.0 4.6 — .4 4.0 3.8 .2 f 1.0 6.6 1401972 . . 5.6 5.1 — .4 4.8 4.5 .2 f .8 7.5 1401973 . . 6.4 5.9 — .5 6.0 5.8 .2 f .5 7.9 1251974 . . 7.4 6.8 — .5 7.2 7.0 .2 f .2 8.1 110
1975 . . 8.0 7.4 — .5 8.8 8.5 .3 f -.8 7.4 921976 . . 8.8 8.2 — .4 10.4 10.1 .3 f -1.6 5.7 711977 . . 9.6 9.1 — .3 11.9 11.5 .4 f -2.4 3.4 481978 . . 13.8 13.4 — .3 13.0 12.6 .3 f .9 4.2 261979 . . 15.6 15.1 — .4 14.2 13.8 .4 f 1.4 5.6 30
1980 . . 13.9 13.3 — .5 15.9 15.5 .4 f -2.0 3.6 351981 . . 17.1 16.7 — .2 17.7 17.2 .4 f -.6 3.0 211982 . . 22.7 22.0 — .5 18.0 17.4 .6 f -.4 2.7 171983 . . 20.7 18.0 — 1.6 18.2 17.5 .6 f 2.5 5.2 151984 . . 17.3 15.9 $0.2 1.2 18.5 17.9 .6 f -1.2 4.0 35
1985 . . 19.3 17.2 .2 .9 19.5 18.8 .6 f g2.4 6.3 271986 . . 19.4 18.4 .2 .8 20.5 19.9 .6 $0.1 g1.5 7.8 381987 . . 20.3 19.7 f .6 21.4 20.5 .8 .1 -1.1 6.7 441988 . . 22.7 22.0 .1 .6 22.5 21.7 .7 .1 .2 6.9 381989 . . 24.8 24.0 .1 .7 23.8 22.9 .8 .1 1.0 7.9 38
1990 . . 28.8 28.5 .1 .9 25.6 24.8 .7 .1 3.2 11.1 401991 . . 30.4 29.1 .2 1.1 28.6 27.7 .8 .1 1.8 12.9 391992 . . 31.4 30.1 .2 1.1 32.0 31.1 .8 .1 -.6 12.3 401993 . . 32.3 31.2 .3 .8 35.7 34.6 1.0 .1 -3.4 9.0 351994 . . 52.8 51.4 .3 1.2 38.9 37.7 1.0 .1 14.0 22.9 23
1995 . . 56.7 54.4 .3 2.2 42.1 40.9 1.1 .1 14.6 37.6 551996 . . 60.7 57.3 .4 3.0 45.4 44.2 1.2 f 15.4 52.9 831997 . . 60.5 56.0 .5 4.0 47.0 45.7 1.3 .1 13.5 66.4 1131998 . . 64.4 59.0 .6 4.8 49.9 48.2 1.6 .2 14.4 80.8 1331999 . . 69.5 63.2 .7 5.7 53.0 51.4 1.5 .1 16.5 97.3 152
2000 . . 77.9 71.1 .7 6.9 56.8 55.0 1.6 .2 21.1 118.5 1712001 . . 83.9 74.9 .8 8.2 61.4 59.6 1.7 f 22.5 141.0 1932002 . . 87.4 77.3 .9 9.2 67.9 65.7 2.0 .2 19.5 160.5 2082003 . . 88.1 77.4 .9 9.7 73.1 70.9 2.0 .2 15.0 175.4 2192004 . . 91.4 80.3 1.1 10.0 80.6 78.2 2.2 .2 10.8 186.2 218

Appendices
144
Note: Totals do not necessarily equal the sums of rounded components.
2005 . . $97.4 $86.1 $1.1 $10.3 $88.0 $85.4 $2.3 $0.3 $9.4 $195.6 2122006 . . 102.6 90.8 1.2 10.6 94.5 91.7 2.3 .4 8.2 203.8 2072007 . . 109.9 95.2 1.4 13.2 98.8 95.9 2.5 .4 11.1 214.9 2062008 . . 109.8 97.6 1.3 11.0 109.0 106.0 2.5 .4 .9 215.8 197
a Includes payments from the General Fund of the Treasury to the trust funds (1) beginning in 1966 and later,costs of noncontributory wage credits for military service performed before 1957 and (2) in 1971-82, costs ofdeemed wage credits for military service performed after 1956. Differences in past year total income and sum ofindividual column amounts are due to these payments. DI historical payments from the General Fund of theTreasury may be found on the Internet at www.socialsecurity.gov/OACT/STATS/table4a2.html.b Beginning in 1983, includes transfers from the General Fund of the Treasury representing contributions thatwould have been paid on deemed wage credits for military service in 1957 through 2001, if such credits wereconsidered to be covered wages.c Net interest includes net profits or losses on marketable investments. Beginning in 1967, administrativeexpenses are charged to the trust fund on an estimated basis, with a final adjustment, including interest, made inthe following fiscal year. The amounts of these interest adjustments are included in net interest. For years prior to1967, a description of the method of accounting for administrative expenses is contained in the 1970 AnnualReport. Beginning in July 1974, the figures shown include relatively small amounts of gifts to the fund. Netinterest for 1983-86 reflects payments from a borrowing trust fund to a lending trust fund for interest on amountsowed under the interfund borrowing provisions. During 1983-90, interest paid from the trust fund to the generalfund on advance tax transfers is reflected. The amount shown for 1985 includes an interest adjustment of$14.8 million on unnegotiated checks issued before April 1985.d Beginning in 1966, includes payments for vocational rehabilitation services furnished to disabled personsreceiving benefits because of their disabilities. Beginning in 1983, amounts are reduced by amount of reimburse-ment for unnegotiated benefit checks.e The “Trust fund ratio” column represents assets at the beginning of a year as a percentage of expenditures dur-ing the year. For 1957 no ratio is shown because no assets existed at the beginning of the year. For years 1984-90, assets at the beginning of a year include January advance tax transfers.f Between -$50 million and $50 million.g Reflects offset for repayment from the OASI Trust Fund of amounts borrowed from the DI Trust Fund in 1982.An amount of $2.5 billion was repaid in each year 1985 and 1986.
Table VI.A3.— Operations of the DI Trust Fund, Calendar Years 1957-2008 (Cont.)
[Dollar amounts in billions]
Calendaryear
Income Expenditures Assets
Total a
Netcontri-
butionsb
Taxa-tion of
benefitsNet
interestc Total
Benefitpay-
mentsd
Admin-istra-
tivecosts
RRBinter-
change
Netincrease
duringyear
Amountat end
of year
Trustfund
ratioe
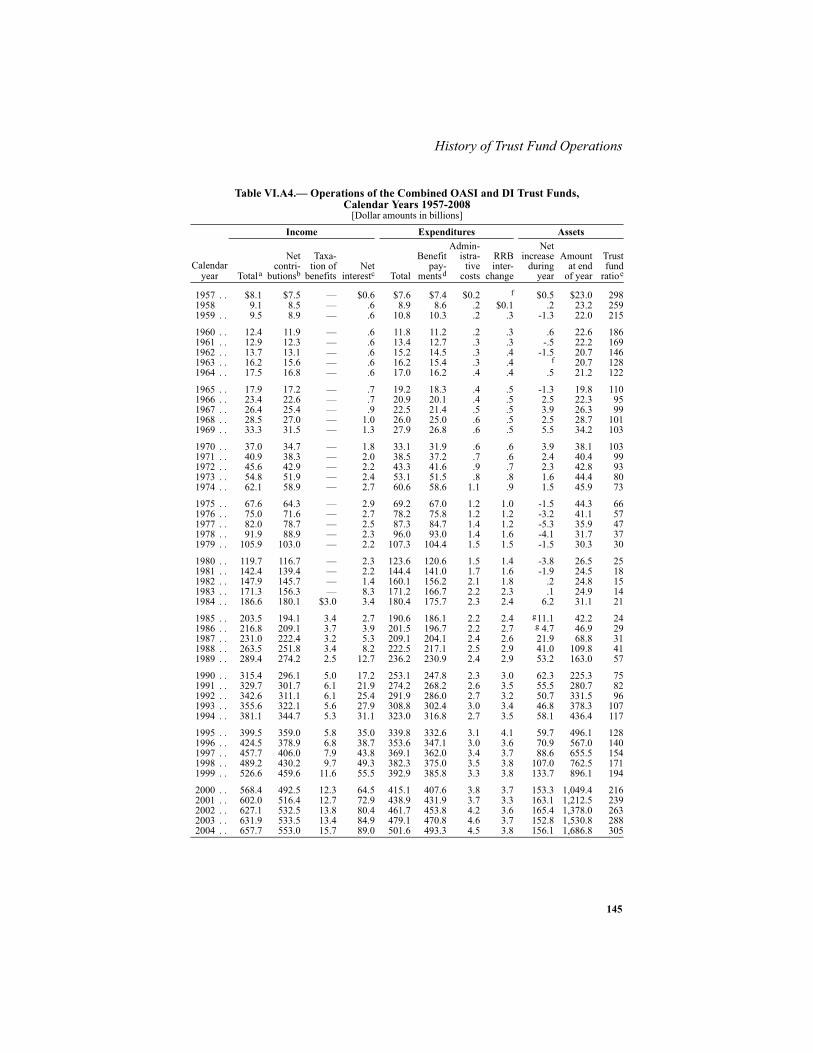
145
History of Trust Fund Operations
Table VI.A4.— Operations of the Combined OASI and DI Trust Funds,Calendar Years 1957-2008
[Dollar amounts in billions]
Calendaryear
Income Expenditures Assets
Totala
Netcontri-
butionsb
Taxa-tion of
benefitsNet
interestc Total
Benefitpay-
mentsd
Admin-istra-
tivecosts
RRBinter-
change
Netincrease
duringyear
Amountat end
of year
Trustfund
ratioe
1957 . . $8.1 $7.5 — $0.6 $7.6 $7.4 $0.2 f $0.5 $23.0 2981958 9.1 8.5 — .6 8.9 8.6 .2 $0.1 .2 23.2 2591959 . . 9.5 8.9 — .6 10.8 10.3 .2 .3 -1.3 22.0 215
1960 . . 12.4 11.9 — .6 11.8 11.2 .2 .3 .6 22.6 1861961 . . 12.9 12.3 — .6 13.4 12.7 .3 .3 -.5 22.2 1691962 . . 13.7 13.1 — .6 15.2 14.5 .3 .4 -1.5 20.7 1461963 . . 16.2 15.6 — .6 16.2 15.4 .3 .4 f 20.7 1281964 . . 17.5 16.8 — .6 17.0 16.2 .4 .4 .5 21.2 122
1965 . . 17.9 17.2 — .7 19.2 18.3 .4 .5 -1.3 19.8 1101966 . . 23.4 22.6 — .7 20.9 20.1 .4 .5 2.5 22.3 951967 . . 26.4 25.4 — .9 22.5 21.4 .5 .5 3.9 26.3 991968 . . 28.5 27.0 — 1.0 26.0 25.0 .6 .5 2.5 28.7 1011969 . . 33.3 31.5 — 1.3 27.9 26.8 .6 .5 5.5 34.2 103
1970 . . 37.0 34.7 — 1.8 33.1 31.9 .6 .6 3.9 38.1 1031971 . . 40.9 38.3 — 2.0 38.5 37.2 .7 .6 2.4 40.4 991972 . . 45.6 42.9 — 2.2 43.3 41.6 .9 .7 2.3 42.8 931973 . . 54.8 51.9 — 2.4 53.1 51.5 .8 .8 1.6 44.4 801974 . . 62.1 58.9 — 2.7 60.6 58.6 1.1 .9 1.5 45.9 73
1975 . . 67.6 64.3 — 2.9 69.2 67.0 1.2 1.0 -1.5 44.3 661976 . . 75.0 71.6 — 2.7 78.2 75.8 1.2 1.2 -3.2 41.1 571977 . . 82.0 78.7 — 2.5 87.3 84.7 1.4 1.2 -5.3 35.9 471978 . . 91.9 88.9 — 2.3 96.0 93.0 1.4 1.6 -4.1 31.7 371979 . . 105.9 103.0 — 2.2 107.3 104.4 1.5 1.5 -1.5 30.3 30
1980 . . 119.7 116.7 — 2.3 123.6 120.6 1.5 1.4 -3.8 26.5 251981 . . 142.4 139.4 — 2.2 144.4 141.0 1.7 1.6 -1.9 24.5 181982 . . 147.9 145.7 — 1.4 160.1 156.2 2.1 1.8 .2 24.8 151983 . . 171.3 156.3 — 8.3 171.2 166.7 2.2 2.3 .1 24.9 141984 . . 186.6 180.1 $3.0 3.4 180.4 175.7 2.3 2.4 6.2 31.1 21
1985 . . 203.5 194.1 3.4 2.7 190.6 186.1 2.2 2.4 g11.1 42.2 241986 . . 216.8 209.1 3.7 3.9 201.5 196.7 2.2 2.7 g 4.7 46.9 291987 . . 231.0 222.4 3.2 5.3 209.1 204.1 2.4 2.6 21.9 68.8 311988 . . 263.5 251.8 3.4 8.2 222.5 217.1 2.5 2.9 41.0 109.8 411989 . . 289.4 274.2 2.5 12.7 236.2 230.9 2.4 2.9 53.2 163.0 57
1990 . . 315.4 296.1 5.0 17.2 253.1 247.8 2.3 3.0 62.3 225.3 751991 . . 329.7 301.7 6.1 21.9 274.2 268.2 2.6 3.5 55.5 280.7 821992 . . 342.6 311.1 6.1 25.4 291.9 286.0 2.7 3.2 50.7 331.5 961993 . . 355.6 322.1 5.6 27.9 308.8 302.4 3.0 3.4 46.8 378.3 1071994 . . 381.1 344.7 5.3 31.1 323.0 316.8 2.7 3.5 58.1 436.4 117
1995 . . 399.5 359.0 5.8 35.0 339.8 332.6 3.1 4.1 59.7 496.1 1281996 . . 424.5 378.9 6.8 38.7 353.6 347.1 3.0 3.6 70.9 567.0 1401997 . . 457.7 406.0 7.9 43.8 369.1 362.0 3.4 3.7 88.6 655.5 1541998 . . 489.2 430.2 9.7 49.3 382.3 375.0 3.5 3.8 107.0 762.5 1711999 . . 526.6 459.6 11.6 55.5 392.9 385.8 3.3 3.8 133.7 896.1 194
2000 . . 568.4 492.5 12.3 64.5 415.1 407.6 3.8 3.7 153.3 1,049.4 2162001 . . 602.0 516.4 12.7 72.9 438.9 431.9 3.7 3.3 163.1 1,212.5 2392002 . . 627.1 532.5 13.8 80.4 461.7 453.8 4.2 3.6 165.4 1,378.0 2632003 . . 631.9 533.5 13.4 84.9 479.1 470.8 4.6 3.7 152.8 1,530.8 2882004 . . 657.7 553.0 15.7 89.0 501.6 493.3 4.5 3.8 156.1 1,686.8 305
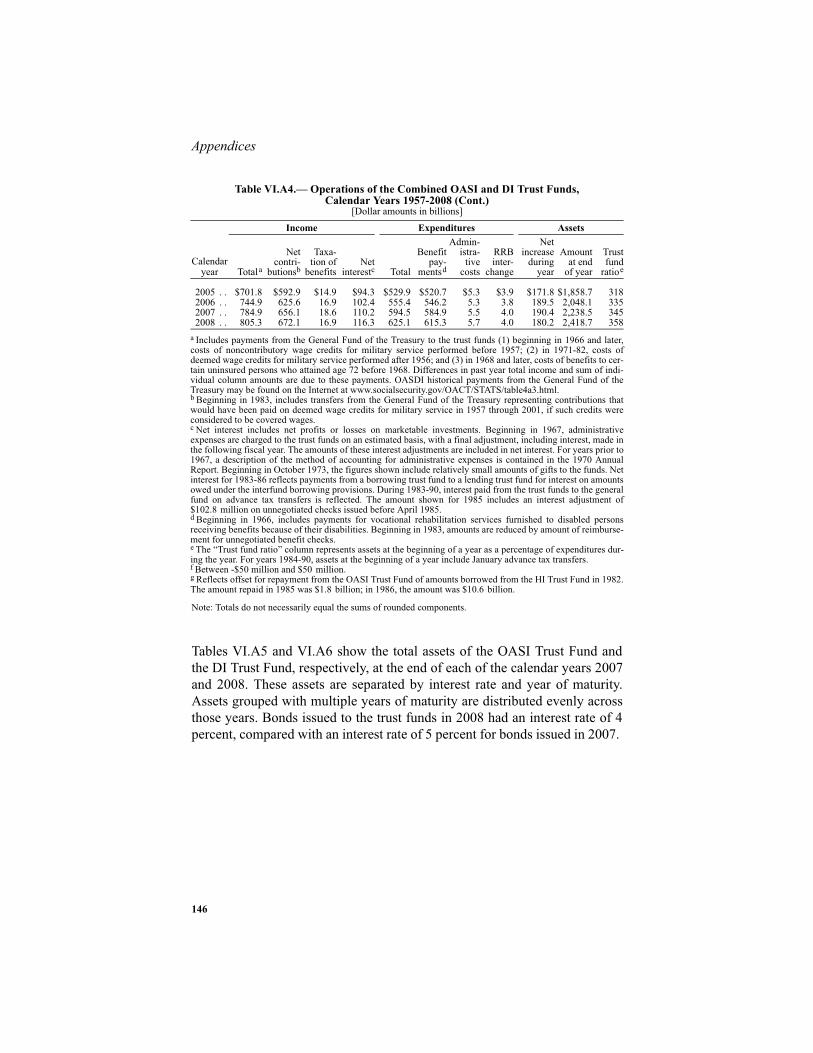
Appendices
146
Note: Totals do not necessarily equal the sums of rounded components.
Tables VI.A5 and VI.A6 show the total assets of the OASI Trust Fund andthe DI Trust Fund, respectively, at the end of each of the calendar years 2007and 2008. These assets are separated by interest rate and year of maturity.Assets grouped with multiple years of maturity are distributed evenly acrossthose years. Bonds issued to the trust funds in 2008 had an interest rate of 4percent, compared with an interest rate of 5 percent for bonds issued in 2007.
2005 . . $701.8 $592.9 $14.9 $94.3 $529.9 $520.7 $5.3 $3.9 $171.8 $1,858.7 3182006 . . 744.9 625.6 16.9 102.4 555.4 546.2 5.3 3.8 189.5 2,048.1 3352007 . . 784.9 656.1 18.6 110.2 594.5 584.9 5.5 4.0 190.4 2,238.5 3452008 . . 805.3 672.1 16.9 116.3 625.1 615.3 5.7 4.0 180.2 2,418.7 358
a Includes payments from the General Fund of the Treasury to the trust funds (1) beginning in 1966 and later,costs of noncontributory wage credits for military service performed before 1957; (2) in 1971-82, costs ofdeemed wage credits for military service performed after 1956; and (3) in 1968 and later, costs of benefits to cer-tain uninsured persons who attained age 72 before 1968. Differences in past year total income and sum of indi-vidual column amounts are due to these payments. OASDI historical payments from the General Fund of theTreasury may be found on the Internet at www.socialsecurity.gov/OACT/STATS/table4a3.html.b Beginning in 1983, includes transfers from the General Fund of the Treasury representing contributions thatwould have been paid on deemed wage credits for military service in 1957 through 2001, if such credits wereconsidered to be covered wages.c Net interest includes net profits or losses on marketable investments. Beginning in 1967, administrativeexpenses are charged to the trust funds on an estimated basis, with a final adjustment, including interest, made inthe following fiscal year. The amounts of these interest adjustments are included in net interest. For years prior to1967, a description of the method of accounting for administrative expenses is contained in the 1970 AnnualReport. Beginning in October 1973, the figures shown include relatively small amounts of gifts to the funds. Netinterest for 1983-86 reflects payments from a borrowing trust fund to a lending trust fund for interest on amountsowed under the interfund borrowing provisions. During 1983-90, interest paid from the trust funds to the generalfund on advance tax transfers is reflected. The amount shown for 1985 includes an interest adjustment of$102.8 million on unnegotiated checks issued before April 1985.d Beginning in 1966, includes payments for vocational rehabilitation services furnished to disabled personsreceiving benefits because of their disabilities. Beginning in 1983, amounts are reduced by amount of reimburse-ment for unnegotiated benefit checks.e The “Trust fund ratio” column represents assets at the beginning of a year as a percentage of expenditures dur-ing the year. For years 1984-90, assets at the beginning of a year include January advance tax transfers.f Between -$50 million and $50 million.g Reflects offset for repayment from the OASI Trust Fund of amounts borrowed from the HI Trust Fund in 1982.The amount repaid in 1985 was $1.8 billion; in 1986, the amount was $10.6 billion.
Table VI.A4.— Operations of the Combined OASI and DI Trust Funds,Calendar Years 1957-2008 (Cont.)
[Dollar amounts in billions]
Calendaryear
Income Expenditures Assets
Totala
Netcontri-
butionsb
Taxa-tion of
benefitsNet
interestc Total
Benefitpay-
mentsd
Admin-istra-
tivecosts
RRBinter-
change
Netincrease
duringyear
Amountat end
of year
Trustfund
ratioe

147
History of Trust Fund Operations
Note: Amounts of special issues are shown at par value. Special issues are always purchased and redeemedat par value. Where equal amounts mature in two or more years at a given interest rate, they are grouped. Anundisbursed balance, if negative, represents an extension of credit against securities to be redeemed withinthe following few days.
Table VI.A5.—Assets of the OASI Trust Fund, End of Calendar Years 2007 and 2008[In thousands]
December 31, 2007 December 31, 2008Obligations sold only to the trust funds (special issues):
Certificates of indebtedness:2.750 percent, 2009. . . . . . . . . . . . . . . . . . . . . . . . . . . . . . — $68,361,7743.750 percent, 2009. . . . . . . . . . . . . . . . . . . . . . . . . . . . . . — 7,420,6483.875 percent, 2009. . . . . . . . . . . . . . . . . . . . . . . . . . . . . . — 4,440,1344.000 percent, 2008. . . . . . . . . . . . . . . . . . . . . . . . . . . . . . $73,768,095 —4.500 percent, 2008. . . . . . . . . . . . . . . . . . . . . . . . . . . . . . 11,114,654 —5.000 percent, 2008. . . . . . . . . . . . . . . . . . . . . . . . . . . . . . 22,046,087 —
Bonds:3.500 percent, 2009. . . . . . . . . . . . . . . . . . . . . . . . . . . . . . 9,513,751 —3.500 percent, 2010-15 . . . . . . . . . . . . . . . . . . . . . . . . . . . 57,082,506 57,082,5063.500 percent, 2016-17 . . . . . . . . . . . . . . . . . . . . . . . . . . . 19,027,504 19,027,5043.500 percent, 2018. . . . . . . . . . . . . . . . . . . . . . . . . . . . . . 86,900,994 86,900,9944.000 percent, 2009. . . . . . . . . . . . . . . . . . . . . . . . . . . . . . — 4,526,6274.000 percent, 2010-11 . . . . . . . . . . . . . . . . . . . . . . . . . . . — 24,150,3844.000 percent, 2012. . . . . . . . . . . . . . . . . . . . . . . . . . . . . . — 12,075,1934.000 percent, 2013-22 . . . . . . . . . . . . . . . . . . . . . . . . . . . — 120,751,9204.000 percent, 2023. . . . . . . . . . . . . . . . . . . . . . . . . . . . . . — 142,682,8934.125 percent, 2009-19 . . . . . . . . . . . . . . . . . . . . . . . . . . . 115,686,406 115,686,4064.125 percent, 2020. . . . . . . . . . . . . . . . . . . . . . . . . . . . . . 106,585,700 106,585,7004.625 percent, 2009-15 . . . . . . . . . . . . . . . . . . . . . . . . . . . 64,173,648 64,173,6484.625 percent, 2016-18 . . . . . . . . . . . . . . . . . . . . . . . . . . . 27,502,989 27,502,9894.625 percent, 2019. . . . . . . . . . . . . . . . . . . . . . . . . . . . . . 96,068,657 96,068,6575.000 percent, 2009. . . . . . . . . . . . . . . . . . . . . . . . . . . . . . 12,454,234 12,454,2345.000 percent, 2010-11 . . . . . . . . . . . . . . . . . . . . . . . . . . . 24,908,466 24,908,4665.000 percent, 2012-21 . . . . . . . . . . . . . . . . . . . . . . . . . . . 124,542,320 124,542,3205.000 percent, 2022. . . . . . . . . . . . . . . . . . . . . . . . . . . . . . 130,607,701 130,607,7015.125 percent, 2008. . . . . . . . . . . . . . . . . . . . . . . . . . . . . . 11,567,865 —5.125 percent, 2009. . . . . . . . . . . . . . . . . . . . . . . . . . . . . . 11,567,865 11,567,8655.125 percent, 2010-19 . . . . . . . . . . . . . . . . . . . . . . . . . . . 115,678,660 115,678,6605.125 percent, 2020. . . . . . . . . . . . . . . . . . . . . . . . . . . . . . 11,567,769 11,567,7695.125 percent, 2021. . . . . . . . . . . . . . . . . . . . . . . . . . . . . . 118,153,469 118,153,4695.250 percent, 2008. . . . . . . . . . . . . . . . . . . . . . . . . . . . . . 9,235,912 —5.250 percent, 2009-15 . . . . . . . . . . . . . . . . . . . . . . . . . . . 64,651,384 64,651,3845.250 percent, 2016. . . . . . . . . . . . . . . . . . . . . . . . . . . . . . 9,235,911 9,235,9115.250 percent, 2017. . . . . . . . . . . . . . . . . . . . . . . . . . . . . . 77,387,242 77,387,2425.625 percent, 2008. . . . . . . . . . . . . . . . . . . . . . . . . . . . . . 9,621,438 —5.625 percent, 2009-11 . . . . . . . . . . . . . . . . . . . . . . . . . . . 28,864,314 28,864,3145.625 percent, 2012-15 . . . . . . . . . . . . . . . . . . . . . . . . . . . 38,485,748 38,485,7485.625 percent, 2016. . . . . . . . . . . . . . . . . . . . . . . . . . . . . . 68,151,331 68,151,3315.875 percent, 2008. . . . . . . . . . . . . . . . . . . . . . . . . . . . . . 6,169,273 —5.875 percent, 2009-12 . . . . . . . . . . . . . . . . . . . . . . . . . . . 24,677,092 24,677,0925.875 percent, 2013. . . . . . . . . . . . . . . . . . . . . . . . . . . . . . 43,258,869 43,258,8696.000 percent, 2008. . . . . . . . . . . . . . . . . . . . . . . . . . . . . . 6,693,627 —6.000 percent, 2009-11 . . . . . . . . . . . . . . . . . . . . . . . . . . . 20,080,881 20,080,8816.000 percent, 2012-13 . . . . . . . . . . . . . . . . . . . . . . . . . . . 13,387,256 13,387,2566.000 percent, 2014. . . . . . . . . . . . . . . . . . . . . . . . . . . . . . 49,952,497 49,952,4976.250 percent, 2008. . . . . . . . . . . . . . . . . . . . . . . . . . . . . . 23,350,034 —6.500 percent, 2008. . . . . . . . . . . . . . . . . . . . . . . . . . . . . . 11,008,650 —6.500 percent, 2009. . . . . . . . . . . . . . . . . . . . . . . . . . . . . . 11,008,650 11,008,6506.500 percent, 2010. . . . . . . . . . . . . . . . . . . . . . . . . . . . . . 38,320,240 38,320,2406.500 percent, 2011-14 . . . . . . . . . . . . . . . . . . . . . . . . . . . 34,309,584 34,309,5846.500 percent, 2015. . . . . . . . . . . . . . . . . . . . . . . . . . . . . . 58,529,893 58,529,8936.875 percent, 2008. . . . . . . . . . . . . . . . . . . . . . . . . . . . . . 3,975,271 —6.875 percent, 2009. . . . . . . . . . . . . . . . . . . . . . . . . . . . . . 3,975,271 3,975,2716.875 percent, 2010-11 . . . . . . . . . . . . . . . . . . . . . . . . . . . 7,950,544 7,950,5446.875 percent, 2012. . . . . . . . . . . . . . . . . . . . . . . . . . . . . . 37,089,596 37,089,5967.000 percent, 2008. . . . . . . . . . . . . . . . . . . . . . . . . . . . . . 3,371,480 —7.000 percent, 2009-10 . . . . . . . . . . . . . . . . . . . . . . . . . . . 6,742,960 6,742,9607.000 percent, 2011. . . . . . . . . . . . . . . . . . . . . . . . . . . . . . 33,114,324 33,114,3247.250 percent, 2008. . . . . . . . . . . . . . . . . . . . . . . . . . . . . . 3,961,557 —7.250 percent, 2009. . . . . . . . . . . . . . . . . . . . . . . . . . . . . . 27,311,591 27,311,591
Total investments . . . . . . . . . . . . . . . . . . . . . . . . . . . . . . . . . . . 2,024,391,760 2,203,403,639Undisbursed balances . . . . . . . . . . . . . . . . . . . . . . . . . . . . . . . . -776,165 -518,033
Total assets . . . . . . . . . . . . . . . . . . . . . . . . . . . . . . . . . . . . 2,023,615,595 2,202,885,606

Appendices
148
Note: Amounts of special issues are shown at par value. Special issues are always purchased and redeemedat par value. Where equal amounts mature in two or more years at a given interest rate, they are grouped. Anundisbursed balance, if negative, represents an extension of credit against securities to be redeemed withinthe following few days.
Table VI.A6.—Assets of the DI Trust Fund, End of Calendar Years 2007 and 2008[In thousands]
December 31, 2007 December 31, 2008Obligations sold only to the trust funds (special issues):
Certificates of indebtedness: 2.750 percent, 2009 . . . . . . . . . . . . . . . . . . . . . . . . . . . — $7,743,4194.000 percent, 2008 . . . . . . . . . . . . . . . . . . . . . . . . . . . $8,467,836 —4.500 percent, 2008 . . . . . . . . . . . . . . . . . . . . . . . . . . . 2,256,068 —
Bonds:3.500 percent, 2009 . . . . . . . . . . . . . . . . . . . . . . . . . . . 1,115,128 —3.500 percent, 2010-11 . . . . . . . . . . . . . . . . . . . . . . . . . 2,230,256 2,230,2563.500 percent, 2012-15 . . . . . . . . . . . . . . . . . . . . . . . . . 4,460,508 4,460,5083.500 percent, 2016-17 . . . . . . . . . . . . . . . . . . . . . . . . . 2,230,256 2,230,2563.500 percent, 2018 . . . . . . . . . . . . . . . . . . . . . . . . . . . 11,378,384 11,378,3844.000 percent, 2010-16 . . . . . . . . . . . . . . . . . . . . . . . . . — 4,358,0044.000 percent, 2017-19 . . . . . . . . . . . . . . . . . . . . . . . . . — 1,867,7134.000 percent, 2020-22 . . . . . . . . . . . . . . . . . . . . . . . . . — 1,867,7164.000 percent, 2023 . . . . . . . . . . . . . . . . . . . . . . . . . . . — 14,675,5544.125 percent, 2009 . . . . . . . . . . . . . . . . . . . . . . . . . . . 677,386 —4.125 percent, 2010-11 . . . . . . . . . . . . . . . . . . . . . . . . . 1,354,772 1,354,7724.125 percent, 2012-17 . . . . . . . . . . . . . . . . . . . . . . . . . 4,064,310 4,064,3104.125 percent, 2018-19 . . . . . . . . . . . . . . . . . . . . . . . . . 1,354,772 1,354,7724.125 percent, 2020 . . . . . . . . . . . . . . . . . . . . . . . . . . . 12,911,283 12,911,2834.625 percent, 2009 . . . . . . . . . . . . . . . . . . . . . . . . . . . 855,497 —4.625 percent, 2010-11 . . . . . . . . . . . . . . . . . . . . . . . . . 1,710,994 1,710,9944.625 percent, 2012-15 . . . . . . . . . . . . . . . . . . . . . . . . . 3,421,992 3,421,9924.625 percent, 2016-18 . . . . . . . . . . . . . . . . . . . . . . . . . 2,566,491 2,566,4914.625 percent, 2019 . . . . . . . . . . . . . . . . . . . . . . . . . . . 12,233,881 12,233,8815.000 percent, 2009 . . . . . . . . . . . . . . . . . . . . . . . . . . . 476,586 —5.000 percent, 2010-19 . . . . . . . . . . . . . . . . . . . . . . . . . 4,765,860 4,765,8605.000 percent, 2020-21 . . . . . . . . . . . . . . . . . . . . . . . . . 953,168 953,1685.000 percent, 2022 . . . . . . . . . . . . . . . . . . . . . . . . . . . 14,052,982 14,052,9825.125 percent, 2009 . . . . . . . . . . . . . . . . . . . . . . . . . . . 665,131 —5.125 percent, 2010-17 . . . . . . . . . . . . . . . . . . . . . . . . . 5,321,048 5,321,0485.125 percent, 2018-19 . . . . . . . . . . . . . . . . . . . . . . . . . 1,330,260 1,330,2605.125 percent, 2020 . . . . . . . . . . . . . . . . . . . . . . . . . . . 665,115 665,1155.125 percent, 2021 . . . . . . . . . . . . . . . . . . . . . . . . . . . 13,576,398 13,576,3985.250 percent, 2009 . . . . . . . . . . . . . . . . . . . . . . . . . . . 1,363,407 —5.250 percent, 2010-11 . . . . . . . . . . . . . . . . . . . . . . . . . 2,726,814 2,726,8145.250 percent, 2012-16 . . . . . . . . . . . . . . . . . . . . . . . . . 6,817,040 6,817,0405.250 percent, 2017 . . . . . . . . . . . . . . . . . . . . . . . . . . . 10,263,256 10,263,2565.625 percent, 2008 . . . . . . . . . . . . . . . . . . . . . . . . . . . 205,332 —5.625 percent, 2009 . . . . . . . . . . . . . . . . . . . . . . . . . . . 1,524,968 —5.625 percent, 2010-13 . . . . . . . . . . . . . . . . . . . . . . . . . 6,099,872 6,099,8725.625 percent, 2014-15 . . . . . . . . . . . . . . . . . . . . . . . . . 3,049,934 3,049,9345.625 percent, 2016 . . . . . . . . . . . . . . . . . . . . . . . . . . . 8,899,848 8,899,8485.875 percent, 2008 . . . . . . . . . . . . . . . . . . . . . . . . . . . 916,286 —5.875 percent, 2009 . . . . . . . . . . . . . . . . . . . . . . . . . . . 916,286 —5.875 percent, 2010-12 . . . . . . . . . . . . . . . . . . . . . . . . . 2,748,858 2,748,8585.875 percent, 2013 . . . . . . . . . . . . . . . . . . . . . . . . . . . 5,361,805 5,361,8056.000 percent, 2008 . . . . . . . . . . . . . . . . . . . . . . . . . . . 695,966 —6.000 percent, 2009 . . . . . . . . . . . . . . . . . . . . . . . . . . . 695,966 —6.000 percent, 2010-12 . . . . . . . . . . . . . . . . . . . . . . . . . 2,087,898 2,087,8986.000 percent, 2013 . . . . . . . . . . . . . . . . . . . . . . . . . . . 695,967 695,9676.000 percent, 2014 . . . . . . . . . . . . . . . . . . . . . . . . . . . 6,057,772 6,057,7726.500 percent, 2008 . . . . . . . . . . . . . . . . . . . . . . . . . . . 4,381,228 —6.500 percent, 2009 . . . . . . . . . . . . . . . . . . . . . . . . . . . 1,317,108 —6.500 percent, 2010-13 . . . . . . . . . . . . . . . . . . . . . . . . . 5,268,432 5,268,4326.500 percent, 2014 . . . . . . . . . . . . . . . . . . . . . . . . . . . 1,317,109 1,317,1096.500 percent, 2015 . . . . . . . . . . . . . . . . . . . . . . . . . . . 7,374,881 7,374,8816.875 percent, 2008 . . . . . . . . . . . . . . . . . . . . . . . . . . . 265,249 —6.875 percent, 2009 . . . . . . . . . . . . . . . . . . . . . . . . . . . 265,249 —6.875 percent, 2010-12 . . . . . . . . . . . . . . . . . . . . . . . . . 13,336,560 13,336,5607.000 percent, 2008 . . . . . . . . . . . . . . . . . . . . . . . . . . . 1,116,151 —7.000 percent, 2009 . . . . . . . . . . . . . . . . . . . . . . . . . . . 4,180,271 2,608,382
Total investments . . . . . . . . . . . . . . . . . . . . . . . . . . . . . . . . . 215,045,875 215,809,564Undisbursed balances . . . . . . . . . . . . . . . . . . . . . . . . . . . . . . -161,723 -36,763
Total assets . . . . . . . . . . . . . . . . . . . . . . . . . . . . . . . . . . 214,884,152 215,772,801

149
History of Actuarial Balances
B. HISTORY OF ACTUARIAL BALANCE ESTIMATES
This appendix chronicles the history of the principal summary measure oflong-range actuarial status, namely the actuarial balance, since 1983. The1983 report was the last report for which the actuarial balance was positive.Actuarial balance is defined in detail in section IV.B.4 Summarized IncomeRates, Cost Rates, and Balances. Conceptually, the two basic components ofactuarial balance are the summarized income rate and the summarized costrate. Both rates are expressed as percentages of taxable payroll. For anygiven period, the actuarial balance is the difference between the presentvalue of tax income for the period, and the present value of the cost for theperiod, each divided by the present value of taxable payroll for all years inthe period. Also included in the calculation of the actuarial balance are:
• The amount of the trust fund balances on hand at the beginning of thevaluation period, as shown in the reports for 1988 and later, and
• The present value of a target trust fund balance equal to 100 percent ofthe amount of annual cost to be reached and maintained by the end ofthe valuation period, as shown in the reports for 1991 and later.
It should be noted that the current method of calculating the actuarial balancebased on present values, though used prior to the 1973 Annual Report, wasnot used for the annual reports of 1973-87. Instead, a simpler method thatapproximates the results of the present-value approach, called the average-cost method, was used during that period. Under the average-cost method,the sum of the annual cost rates (which are expressed as percentages of tax-able payroll) over the 75-year projection period was divided by the totalnumber of years, 75, to obtain the average cost rate per year. The averageincome rate was similarly calculated, and the difference between the averageincome rate and the average cost rate was called the actuarial balance.
In 1973, when the average-cost method was first used, the long-range financ-ing of the program was more nearly on a pay-as-you-go basis. Also, based onthe long-range demographic and economic assumptions then being used, theannual rate of growth in taxable payroll was about the same as the annualrate at which the trust funds earned interest. In either situation (i.e., pay-as-you-go financing, where the annual income rate is the same as the annualcost rate, or an annual rate of growth in taxable payroll equal to the annualinterest rate), the average-cost method produces the same result as thepresent-value method. However, by 1988, neither of these situations stillexisted.
Appendices
150
As a result of legislation enacted in 1977 and in 1983, substantial increasesin the trust funds were estimated to occur well into the 21st century, so thatthe program was partially advance funded, rather than being funded on apay-as-you-go basis. Also, because of reductions in long-range fertility ratesand average real-wage growth that were assumed in the annual reports overthe period 1973-87, the annual rate of growth in taxable earnings assumedfor the long range became significantly lower than the assumed interest rate.Therefore, during the period 1973-87, the results of the average-cost methodand the present-value method began to diverge, and by 1988 they were quitedifferent. While the average-cost method still accounted for most of theeffects of the assumed interest rate, it no longer accounted for all of the inter-est effects. The present-value method, of course, does account for the fulleffect of the assumed interest rates. So, in 1988, the present-value method ofcalculating the actuarial balance was reintroduced.
A positive actuarial balance indicates that estimated income is more than suf-ficient to meet estimated trust fund obligations for the period as a whole. Anegative actuarial balance indicates that estimated income is insufficient tomeet estimated trust fund obligations for the entire period. An actuarial bal-ance of zero indicates that the estimated income exactly matches estimatedtrust fund obligations for the period.
Table VI.B1 shows the estimated OASDI actuarial balances, as well as thesummarized income and cost rates, for the annual reports 1982-2008, alongwith the estimates for the current report. The values shown are based on thealternative II assumptions, or alternative II-B for years prior to 1991.
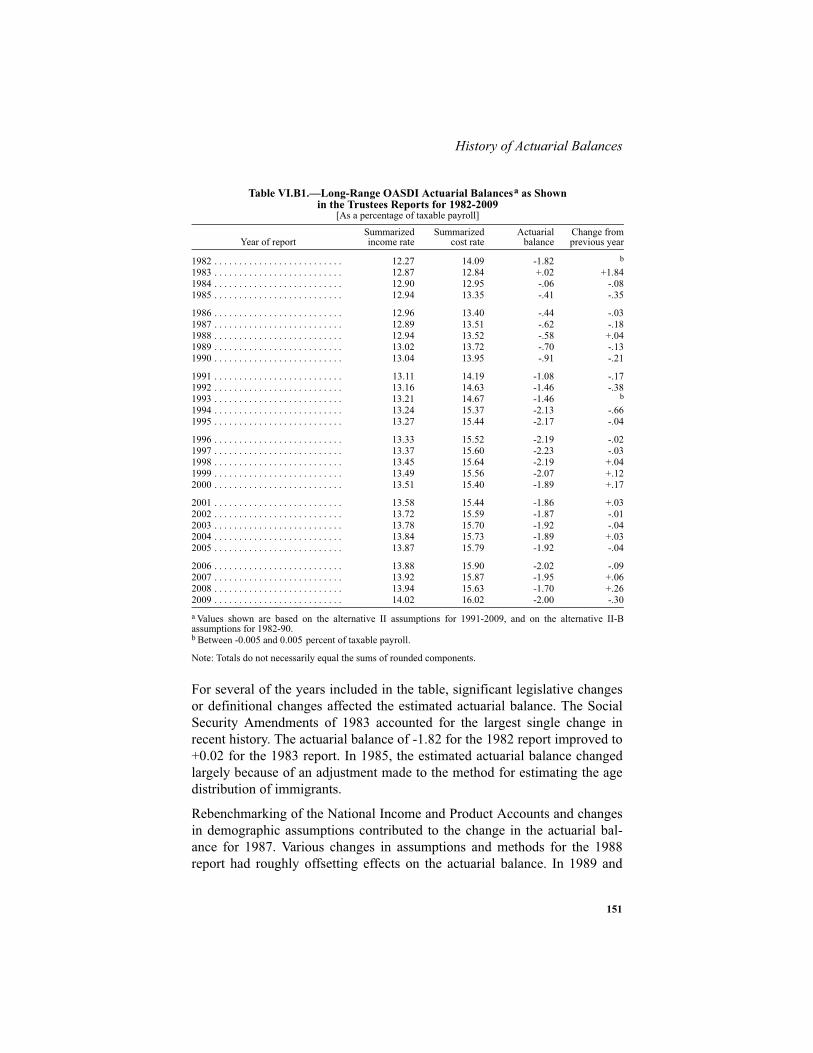
151
History of Actuarial Balances
Note: Totals do not necessarily equal the sums of rounded components.
For several of the years included in the table, significant legislative changesor definitional changes affected the estimated actuarial balance. The SocialSecurity Amendments of 1983 accounted for the largest single change inrecent history. The actuarial balance of -1.82 for the 1982 report improved to+0.02 for the 1983 report. In 1985, the estimated actuarial balance changedlargely because of an adjustment made to the method for estimating the agedistribution of immigrants.
Rebenchmarking of the National Income and Product Accounts and changesin demographic assumptions contributed to the change in the actuarial bal-ance for 1987. Various changes in assumptions and methods for the 1988report had roughly offsetting effects on the actuarial balance. In 1989 and
Table VI.B1.—Long-Range OASDI Actuarial Balancesa as Shownin the Trustees Reports for 1982-2009
[As a percentage of taxable payroll]
a Values shown are based on the alternative II assumptions for 1991-2009, and on the alternative II-Bassumptions for 1982-90.
Year of reportSummarizedincome rate
Summarizedcost rate
Actuarialbalance
Change fromprevious year
1982 . . . . . . . . . . . . . . . . . . . . . . . . . . 12.27 14.09 -1.82 b
1983 . . . . . . . . . . . . . . . . . . . . . . . . . . 12.87 12.84 +.02 +1.841984 . . . . . . . . . . . . . . . . . . . . . . . . . . 12.90 12.95 -.06 -.081985 . . . . . . . . . . . . . . . . . . . . . . . . . . 12.94 13.35 -.41 -.35
1986 . . . . . . . . . . . . . . . . . . . . . . . . . . 12.96 13.40 -.44 -.031987 . . . . . . . . . . . . . . . . . . . . . . . . . . 12.89 13.51 -.62 -.181988 . . . . . . . . . . . . . . . . . . . . . . . . . . 12.94 13.52 -.58 +.041989 . . . . . . . . . . . . . . . . . . . . . . . . . . 13.02 13.72 -.70 -.131990 . . . . . . . . . . . . . . . . . . . . . . . . . . 13.04 13.95 -.91 -.21
1991 . . . . . . . . . . . . . . . . . . . . . . . . . . 13.11 14.19 -1.08 -.171992 . . . . . . . . . . . . . . . . . . . . . . . . . . 13.16 14.63 -1.46 -.381993 . . . . . . . . . . . . . . . . . . . . . . . . . . 13.21 14.67 -1.46 b
b Between -0.005 and 0.005 percent of taxable payroll.
1994 . . . . . . . . . . . . . . . . . . . . . . . . . . 13.24 15.37 -2.13 -.661995 . . . . . . . . . . . . . . . . . . . . . . . . . . 13.27 15.44 -2.17 -.04
1996 . . . . . . . . . . . . . . . . . . . . . . . . . . 13.33 15.52 -2.19 -.021997 . . . . . . . . . . . . . . . . . . . . . . . . . . 13.37 15.60 -2.23 -.031998 . . . . . . . . . . . . . . . . . . . . . . . . . . 13.45 15.64 -2.19 +.041999 . . . . . . . . . . . . . . . . . . . . . . . . . . 13.49 15.56 -2.07 +.122000 . . . . . . . . . . . . . . . . . . . . . . . . . . 13.51 15.40 -1.89 +.17
2001 . . . . . . . . . . . . . . . . . . . . . . . . . . 13.58 15.44 -1.86 +.032002 . . . . . . . . . . . . . . . . . . . . . . . . . . 13.72 15.59 -1.87 -.012003 . . . . . . . . . . . . . . . . . . . . . . . . . . 13.78 15.70 -1.92 -.042004 . . . . . . . . . . . . . . . . . . . . . . . . . . 13.84 15.73 -1.89 +.032005 . . . . . . . . . . . . . . . . . . . . . . . . . . 13.87 15.79 -1.92 -.04
2006 . . . . . . . . . . . . . . . . . . . . . . . . . . 13.88 15.90 -2.02 -.092007 . . . . . . . . . . . . . . . . . . . . . . . . . . 13.92 15.87 -1.95 +.062008 . . . . . . . . . . . . . . . . . . . . . . . . . . 13.94 15.63 -1.70 +.262009 . . . . . . . . . . . . . . . . . . . . . . . . . . 14.02 16.02 -2.00 -.30

Appendices
152
1990, changes in economic assumptions accounted for most of the changesin the estimated actuarial balance.
In 1991, the effect of legislation, changes in economic assumptions, and theintroduction of the cost of reaching and maintaining an ending trust fund tar-get combined to produce the change in the actuarial balance. In 1992,changes in disability assumptions and the method for projecting average ben-efit levels accounted for most of the change in the actuarial balance. In 1993,numerous small changes in assumptions and methods had offsetting effectson the actuarial balance. In 1994, changes in the real-wage assumptions, dis-ability rates, and the earnings sample used for projecting average benefit lev-els accounted for most of the change in the actuarial balance. In 1995,numerous small changes had largely offsetting effects on the actuarial bal-ance, including a substantial reallocation of the payroll tax rate, whichreduced the OASI actuarial balance, but increased the DI actuarial balance.
In 1996, a change in the method of projecting dually-entitled beneficiariesproduced a large increase in the actuarial balance, which almost totally offsetdecreases produced by changes in the valuation period and in the demo-graphic and economic assumptions. Various changes in assumptions andmethods for the 1997 report had roughly offsetting effects on the actuarialbalance. In 1998, increases caused by changes in the economic assumptions,although partially offset by decreases produced by changes in the valuationperiod and in the demographic assumptions, accounted for most of thechanges in the estimated actuarial balance. In 1999, increases caused bychanges in the economic assumptions (related to improvements in the CPI bythe Bureau of Labor Statistics) accounted for most of the changes in the esti-mated actuarial balance. For the 2000 report, changes in the actuarial balanceresulted from changes in economic assumptions and methodology; however,these increases in the balance were partially offset by reductions caused bythe change in valuation period and changes in demographic assumptions.
For the 2001 report, increases caused by changes in the demographic startingvalues, although partially offset by a decrease produced by the change in thevaluation period, accounted for most of the changes in the estimated actuarialbalance. For the 2002 report, the changes in the valuation period and thedemographic assumptions—both decreases in the actuarial balance—wereoffset by changes in the economic assumptions, while the increase due to dis-ability assumptions was slightly more than offset by the decrease due tochanges in the projection methods and data. For the 2003 report, the increasedue to the change in program assumptions was more than offset by decreasesdue to the change in valuation period and changes in demographic assump-tions. For the 2004 report, increases due to changing the method of project-
153
History of Actuarial Balances
ing benefit levels for higher earners more than offset decreases in theactuarial balance arising from the change in the valuation period and the neteffect of other changes in programmatic data and methods. For the 2005report, the increase due to changing the method of projecting future averagebenefit levels was more than offset by decreases due to changes in the valua-tion period, updated starting values for the economic assumptions, and othermethodological changes.
In 2006, decreases in the actuarial balance due to the change in the valuationperiod, a reduction in the ultimate annual real interest rate, and improve-ments in calculating mortality for disabled workers, were greater in aggre-gate than increases in the actuarial balance due to changes in demographicstarting values and the ultimate total fertility rate, as well as other program-matic data and method changes. For the 2007 report, increases in the actuar-ial balance arising from revised disability incidence rate assumptions,improvements in average benefit level projections, and changes in near-termeconomic projections, more than offset decreases in the balance due to thevaluation period change and updated historical mortality data. For the 2008report, the large increase in the actuarial balance was primarily due tochanges in immigration methods and assumptions. These changes more thanoffset the decreases in the actuarial balance due to the change in the valua-tion period and the lower starting and ultimate mortality rates.
Changes affecting the actuarial balance shown for the 2009 report aredescribed in section IV.B.7 Reasons for Change in Actuarial Balance FromLast Report.
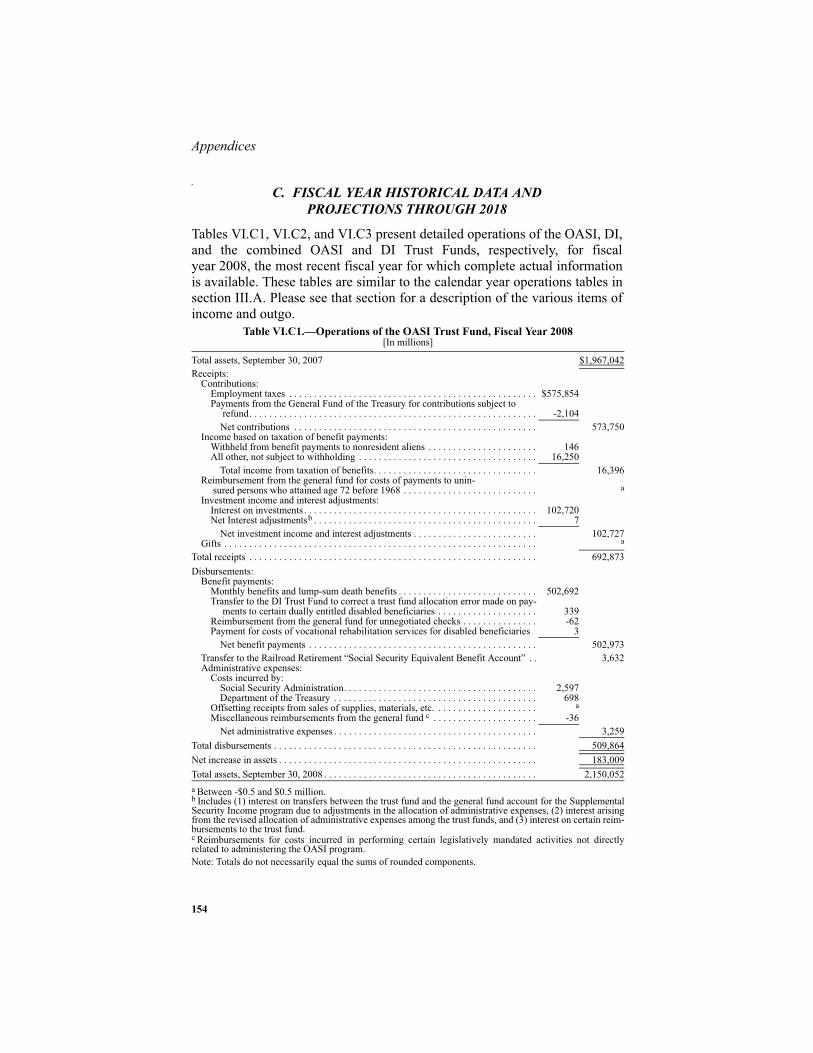
Appendices
154
0
C. FISCAL YEAR HISTORICAL DATA ANDPROJECTIONS THROUGH 2018
Tables VI.C1, VI.C2, and VI.C3 present detailed operations of the OASI, DI,and the combined OASI and DI Trust Funds, respectively, for fiscalyear 2008, the most recent fiscal year for which complete actual informationis available. These tables are similar to the calendar year operations tables insection III.A. Please see that section for a description of the various items ofincome and outgo.
Note: Totals do not necessarily equal the sums of rounded components.
Table VI.C1.—Operations of the OASI Trust Fund, Fiscal Year 2008[In millions]
Total assets, September 30, 2007 $1,967,042Receipts:
Contributions:Employment taxes . . . . . . . . . . . . . . . . . . . . . . . . . . . . . . . . . . . . . . . . . . . . . . . . . . $575,854Payments from the General Fund of the Treasury for contributions subject to
refund. . . . . . . . . . . . . . . . . . . . . . . . . . . . . . . . . . . . . . . . . . . . . . . . . . . . . . . . . . -2,104Net contributions . . . . . . . . . . . . . . . . . . . . . . . . . . . . . . . . . . . . . . . . . . . . . . . . . 573,750
Income based on taxation of benefit payments:Withheld from benefit payments to nonresident aliens . . . . . . . . . . . . . . . . . . . . . . 146All other, not subject to withholding . . . . . . . . . . . . . . . . . . . . . . . . . . . . . . . . . . . . 16,250
Total income from taxation of benefits. . . . . . . . . . . . . . . . . . . . . . . . . . . . . . . . . 16,396Reimbursement from the general fund for costs of payments to unin-
sured persons who attained age 72 before 1968 . . . . . . . . . . . . . . . . . . . . . . . . . . . a
a Between -$0.5 and $0.5 million.
Investment income and interest adjustments:Interest on investments . . . . . . . . . . . . . . . . . . . . . . . . . . . . . . . . . . . . . . . . . . . . . . . 102,720Net Interest adjustmentsb . . . . . . . . . . . . . . . . . . . . . . . . . . . . . . . . . . . . . . . . . . . . .
b Includes (1) interest on transfers between the trust fund and the general fund account for the SupplementalSecurity Income program due to adjustments in the allocation of administrative expenses, (2) interest arisingfrom the revised allocation of administrative expenses among the trust funds, and (3) interest on certain reim-bursements to the trust fund.
7Net investment income and interest adjustments . . . . . . . . . . . . . . . . . . . . . . . . . 102,727
Gifts . . . . . . . . . . . . . . . . . . . . . . . . . . . . . . . . . . . . . . . . . . . . . . . . . . . . . . . . . . . . . . . a
Total receipts . . . . . . . . . . . . . . . . . . . . . . . . . . . . . . . . . . . . . . . . . . . . . . . . . . . . . . . . . . 692,873Disbursements:
Benefit payments:Monthly benefits and lump-sum death benefits . . . . . . . . . . . . . . . . . . . . . . . . . . . . 502,692Transfer to the DI Trust Fund to correct a trust fund allocation error made on pay-
ments to certain dually entitled disabled beneficiaries . . . . . . . . . . . . . . . . . . . . 339Reimbursement from the general fund for unnegotiated checks . . . . . . . . . . . . . . . -62Payment for costs of vocational rehabilitation services for disabled beneficiaries 3
Net benefit payments . . . . . . . . . . . . . . . . . . . . . . . . . . . . . . . . . . . . . . . . . . . . . . 502,973Transfer to the Railroad Retirement “Social Security Equivalent Benefit Account” . . 3,632Administrative expenses:
Costs incurred by:Social Security Administration. . . . . . . . . . . . . . . . . . . . . . . . . . . . . . . . . . . . . . . 2,597Department of the Treasury . . . . . . . . . . . . . . . . . . . . . . . . . . . . . . . . . . . . . . . . . 698
Offsetting receipts from sales of supplies, materials, etc. . . . . . . . . . . . . . . . . . . . . aMiscellaneous reimbursements from the general fund c . . . . . . . . . . . . . . . . . . . . .
c Reimbursements for costs incurred in performing certain legislatively mandated activities not directlyrelated to administering the OASI program.
-36Net administrative expenses . . . . . . . . . . . . . . . . . . . . . . . . . . . . . . . . . . . . . . . . . 3,259
Total disbursements . . . . . . . . . . . . . . . . . . . . . . . . . . . . . . . . . . . . . . . . . . . . . . . . . . . . . 509,864Net increase in assets . . . . . . . . . . . . . . . . . . . . . . . . . . . . . . . . . . . . . . . . . . . . . . . . . . . . 183,009Total assets, September 30, 2008 . . . . . . . . . . . . . . . . . . . . . . . . . . . . . . . . . . . . . . . . . . . 2,150,052

155
Fiscal Year Operations and Projections
Note: Totals do not necessarily equal the sums of rounded components.
Table VI.C2.—Operations of the DI Trust Fund, Fiscal Year 2008[In millions]
Total assets, September 30, 2007 . . . . . . . . . . . . . . . . . . . . . . . . . . . . . . . . . . . . . . . . . . . $213,577Receipts:
Contributions:Employment taxes . . . . . . . . . . . . . . . . . . . . . . . . . . . . . . . . . . . . . . . . . . . . . . . . . . $97,790Payments from the General Fund of the Treasury for contributions subject to
refund. . . . . . . . . . . . . . . . . . . . . . . . . . . . . . . . . . . . . . . . . . . . . . . . . . . . . . . . . . -357Net contributions . . . . . . . . . . . . . . . . . . . . . . . . . . . . . . . . . . . . . . . . . . . . . . . . . 97,432
Income based on taxation of benefit payments:Withheld from benefit payments to nonresident aliens . . . . . . . . . . . . . . . . . . . . . . 4All other, not subject to withholding . . . . . . . . . . . . . . . . . . . . . . . . . . . . . . . . . . . . 1,369
Total income from taxation of benefits . . . . . . . . . . . . . . . . . . . . . . . . . . . . . . . . 1,373Reimbursement from the general fund for costs of noncontributory wage credits
for military service before 1957 . . . . . . . . . . . . . . . . . . . . . . . . . . . . . . . . . . . . . . . 8Investment income and interest adjustments:
Interest on investments. . . . . . . . . . . . . . . . . . . . . . . . . . . . . . . . . . . . . . . . . . . . . . . 10,998Interest adjustmentsa . . . . . . . . . . . . . . . . . . . . . . . . . . . . . . . . . . . . . . . . . . . . . . . .
a Includes (1) interest on transfers between the trust fund and the general fund account for the SupplementalSecurity Income program due to adjustments in the allocation of administrative expenses, (2) interest arisingfrom the revised allocation of administrative expenses among the trust funds, and (3) interest on certainreimbursements to the trust fund.
4Total investment income and interest adjustments . . . . . . . . . . . . . . . . . . . . . . . . 11,003
Total receipts . . . . . . . . . . . . . . . . . . . . . . . . . . . . . . . . . . . . . . . . . . . . . . . . . . . . . . . . . . 109,816
Disbursements:Benefit payments:
Monthly benefits. . . . . . . . . . . . . . . . . . . . . . . . . . . . . . . . . . . . . . . . . . . . . . . . . . . . 104,517Transfer from the OASI Trust Fund to correct a trust fund allocation error made on
payments to certain dually entitled disabled beneficiaries . . . . . . . . . . . . . . . . . -339Reimbursement from the general fund for unnegotiated checks . . . . . . . . . . . . . . . -30Payment for costs of vocational rehabilitation services for disabled beneficiaries . 74
Net benefit payments . . . . . . . . . . . . . . . . . . . . . . . . . . . . . . . . . . . . . . . . . . . . . . 104,222Transfer to the Railroad Retirement “Social Security Equivalent Benefit Account” . . 418Administrative expenses:
Costs incurred by:Social Security Administration. . . . . . . . . . . . . . . . . . . . . . . . . . . . . . . . . . . . . . . 2,364Department of the Treasury . . . . . . . . . . . . . . . . . . . . . . . . . . . . . . . . . . . . . . . . . 130
Miscellaneous reimbursements from the general fundb. . . . . . . . . . . . . . . . . . . . . .
b Reimbursements for costs incurred in performing certain legislatively mandated activities not directlyrelated to administering the DI program.
19Total administrative expenses. . . . . . . . . . . . . . . . . . . . . . . . . . . . . . . . . . . . . . . . 2,513
Total disbursements . . . . . . . . . . . . . . . . . . . . . . . . . . . . . . . . . . . . . . . . . . . . . . . . . . . . . 107,153Net increase in assets . . . . . . . . . . . . . . . . . . . . . . . . . . . . . . . . . . . . . . . . . . . . . . . . . . . . 2,663Total assets, September 30, 2008 . . . . . . . . . . . . . . . . . . . . . . . . . . . . . . . . . . . . . . . . . . . 216,239

Appendices
156
Note: Totals do not necessarily equal the sums of rounded components.
Estimates of the operations and status of the OASI, DI and the combinedOASI and DI Trust Funds during fiscal years (12 months ending onSeptember 30) 2004-18 are presented in tables VI.C4, VI.C5 and VI.C6,respectively.
Table VI.C3.—Operations of the Combined OASI and DI Trust Funds, Fiscal Year 2008[In millions]
Total assets, September 30, 2007 . . . . . . . . . . . . . . . . . . . . . . . . . . . . . . . . . . . . . . . . . . . $2,180,619Receipts:
Contributions:Employment taxes . . . . . . . . . . . . . . . . . . . . . . . . . . . . . . . . . . . . . . . . . . . . . . . . . . $673,644Payments from the General Fund of the Treasury for contributions subject to
refund. . . . . . . . . . . . . . . . . . . . . . . . . . . . . . . . . . . . . . . . . . . . . . . . . . . . . . . . . . -2,461Net contributions . . . . . . . . . . . . . . . . . . . . . . . . . . . . . . . . . . . . . . . . . . . . . . . . . 671,182
Income based on taxation of benefit payments:Withheld from benefit payments to nonresident aliens . . . . . . . . . . . . . . . . . . . . . . 150All other, not subject to withholding . . . . . . . . . . . . . . . . . . . . . . . . . . . . . . . . . . . . 17,619
Total income from taxation of benefits. . . . . . . . . . . . . . . . . . . . . . . . . . . . . . . . . 17,769Reimbursement from the general fund for costs of noncontributory wage credits
for military service before 1957 . . . . . . . . . . . . . . . . . . . . . . . . . . . . . . . . . . . . . . . 8Reimbursement from the general fund for costs of payments to unin-
sured persons who attained age 72 before 1968 . . . . . . . . . . . . . . . . . . . . . . . . . . . a
a Between -$0.5 and $0.5 million.
Investment income and interest adjustments:Interest on investments. . . . . . . . . . . . . . . . . . . . . . . . . . . . . . . . . . . . . . . . . . . . . . . 113,719Net Interest adjustmentsb . . . . . . . . . . . . . . . . . . . . . . . . . . . . . . . . . . . . . . . . . . . . .
b Includes (1) interest on transfers between the trust funds and the general fund account for the SupplementalSecurity Income program due to adjustments in the allocation of administrative expenses, (2) interest arisingfrom the revised allocation of administrative expenses among the trust funds, and (3) interest on certain reim-bursements to the trust fund.
11Net investment income and interest adjustments . . . . . . . . . . . . . . . . . . . . . . . . . 113,730
Gifts . . . . . . . . . . . . . . . . . . . . . . . . . . . . . . . . . . . . . . . . . . . . . . . . . . . . . . . . . . . . . . . a
Total receipts . . . . . . . . . . . . . . . . . . . . . . . . . . . . . . . . . . . . . . . . . . . . . . . . . . . . . . . . . . 802,689
Disbursements:Benefit payments:
Monthly benefits and lump-sum death benefits . . . . . . . . . . . . . . . . . . . . . . . . . . . . 607,210Reimbursement from the general fund for unnegotiated checks . . . . . . . . . . . . . . . -92Payment for costs of vocational rehabilitation services for disabled beneficiaries . 77
Net benefit payments . . . . . . . . . . . . . . . . . . . . . . . . . . . . . . . . . . . . . . . . . . . . . . 607,195Transfer to the Railroad Retirement “Social Security Equivalent Benefit Account” . . 4,050Administrative expenses:
Costs incurred by:Social Security Administration. . . . . . . . . . . . . . . . . . . . . . . . . . . . . . . . . . . . . . . 4,961Department of the Treasury . . . . . . . . . . . . . . . . . . . . . . . . . . . . . . . . . . . . . . . . . 828
Offsetting receipts from sales of supplies, materials, etc. . . . . . . . . . . . . . . . . . . . . a
Miscellaneous reimbursements from the general fundc . . . . . . . . . . . . . . . . . . . . . .
c Reimbursements for costs incurred in performing certain legislatively mandated activities not directlyrelated to administering the OASI and DI programs.
-17Net administrative expenses . . . . . . . . . . . . . . . . . . . . . . . . . . . . . . . . . . . . . . . . . 5,772
Total disbursements . . . . . . . . . . . . . . . . . . . . . . . . . . . . . . . . . . . . . . . . . . . . . . . . . . . . . 617,017Net increase in assets . . . . . . . . . . . . . . . . . . . . . . . . . . . . . . . . . . . . . . . . . . . . . . . . . . . . 185,672Total assets, September 30, 2008 . . . . . . . . . . . . . . . . . . . . . . . . . . . . . . . . . . . . . . . . . . . 2,366,291
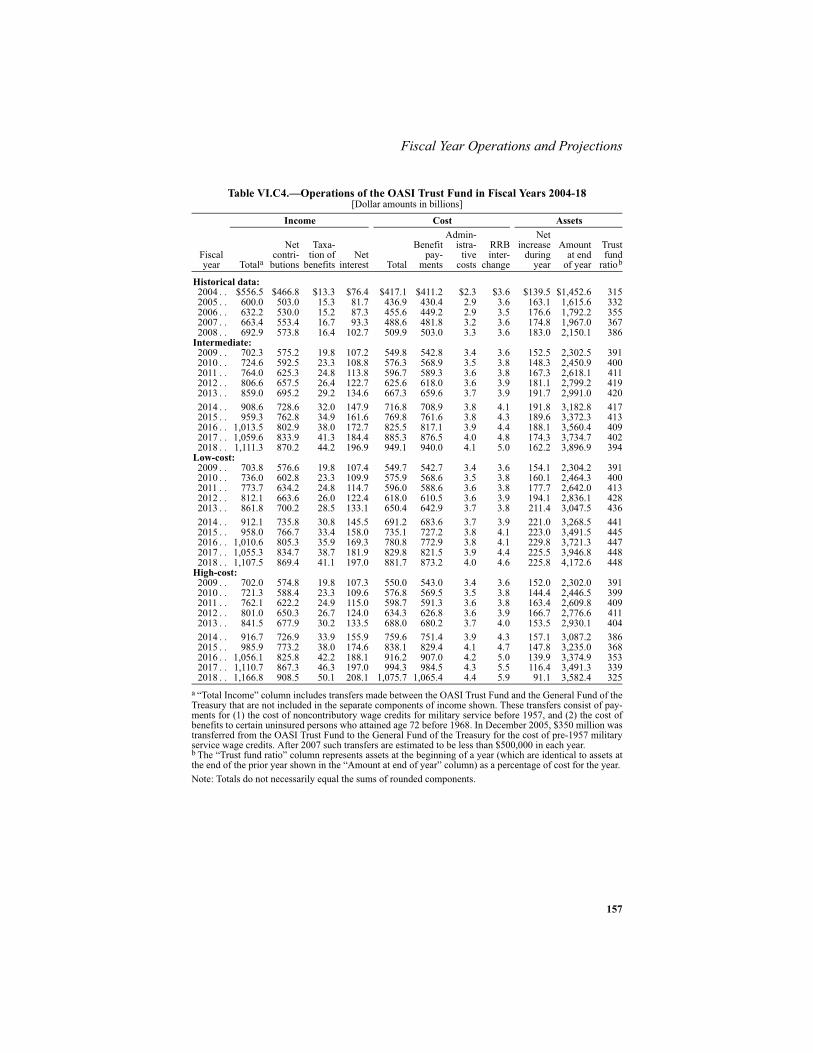
157
Fiscal Year Operations and Projections
Note: Totals do not necessarily equal the sums of rounded components.
Table VI.C4.—Operations of the OASI Trust Fund in Fiscal Years 2004-18[Dollar amounts in billions]
Fiscal year
Income Cost Assets
Totala
a “Total Income” column includes transfers made between the OASI Trust Fund and the General Fund of theTreasury that are not included in the separate components of income shown. These transfers consist of pay-ments for (1) the cost of noncontributory wage credits for military service before 1957, and (2) the cost ofbenefits to certain uninsured persons who attained age 72 before 1968. In December 2005, $350 million wastransferred from the OASI Trust Fund to the General Fund of the Treasury for the cost of pre-1957 militaryservice wage credits. After 2007 such transfers are estimated to be less than $500,000 in each year.
Netcontri-
butions
Taxa-tion of
benefitsNet
interest Total
Benefitpay-
ments
Admin-istra-
tivecosts
RRBinter-
change
Netincrease
duringyear
Amountat end
of year
Trustfund
ratiob
b The “Trust fund ratio” column represents assets at the beginning of a year (which are identical to assets atthe end of the prior year shown in the “Amount at end of year” column) as a percentage of cost for the year.
Historical data:2004 . . $556.5 $466.8 $13.3 $76.4 $417.1 $411.2 $2.3 $3.6 $139.5 $1,452.6 3152005 . . 600.0 503.0 15.3 81.7 436.9 430.4 2.9 3.6 163.1 1,615.6 3322006 . . 632.2 530.0 15.2 87.3 455.6 449.2 2.9 3.5 176.6 1,792.2 3552007 . . 663.4 553.4 16.7 93.3 488.6 481.8 3.2 3.6 174.8 1,967.0 3672008 . . 692.9 573.8 16.4 102.7 509.9 503.0 3.3 3.6 183.0 2,150.1 386
Intermediate:2009 . . 702.3 575.2 19.8 107.2 549.8 542.8 3.4 3.6 152.5 2,302.5 3912010 . . 724.6 592.5 23.3 108.8 576.3 568.9 3.5 3.8 148.3 2,450.9 4002011 . . 764.0 625.3 24.8 113.8 596.7 589.3 3.6 3.8 167.3 2,618.1 4112012 . . 806.6 657.5 26.4 122.7 625.6 618.0 3.6 3.9 181.1 2,799.2 4192013 . . 859.0 695.2 29.2 134.6 667.3 659.6 3.7 3.9 191.7 2,991.0 4202014 . . 908.6 728.6 32.0 147.9 716.8 708.9 3.8 4.1 191.8 3,182.8 4172015 . . 959.3 762.8 34.9 161.6 769.8 761.6 3.8 4.3 189.6 3,372.3 4132016 . . 1,013.5 802.9 38.0 172.7 825.5 817.1 3.9 4.4 188.1 3,560.4 4092017 . . 1,059.6 833.9 41.3 184.4 885.3 876.5 4.0 4.8 174.3 3,734.7 4022018 . . 1,111.3 870.2 44.2 196.9 949.1 940.0 4.1 5.0 162.2 3,896.9 394
Low-cost:2009 . . 703.8 576.6 19.8 107.4 549.7 542.7 3.4 3.6 154.1 2,304.2 3912010 . . 736.0 602.8 23.3 109.9 575.9 568.6 3.5 3.8 160.1 2,464.3 4002011 . . 773.7 634.2 24.8 114.7 596.0 588.6 3.6 3.8 177.7 2,642.0 4132012 . . 812.1 663.6 26.0 122.4 618.0 610.5 3.6 3.9 194.1 2,836.1 4282013 . . 861.8 700.2 28.5 133.1 650.4 642.9 3.7 3.8 211.4 3,047.5 4362014 . . 912.1 735.8 30.8 145.5 691.2 683.6 3.7 3.9 221.0 3,268.5 4412015 . . 958.0 766.7 33.4 158.0 735.1 727.2 3.8 4.1 223.0 3,491.5 4452016 . . 1,010.6 805.3 35.9 169.3 780.8 772.9 3.8 4.1 229.8 3,721.3 4472017 . . 1,055.3 834.7 38.7 181.9 829.8 821.5 3.9 4.4 225.5 3,946.8 4482018 . . 1,107.5 869.4 41.1 197.0 881.7 873.2 4.0 4.6 225.8 4,172.6 448
High-cost:2009 . . 702.0 574.8 19.8 107.3 550.0 543.0 3.4 3.6 152.0 2,302.0 3912010 . . 721.3 588.4 23.3 109.6 576.8 569.5 3.5 3.8 144.4 2,446.5 3992011 . . 762.1 622.2 24.9 115.0 598.7 591.3 3.6 3.8 163.4 2,609.8 4092012 . . 801.0 650.3 26.7 124.0 634.3 626.8 3.6 3.9 166.7 2,776.6 4112013 . . 841.5 677.9 30.2 133.5 688.0 680.2 3.7 4.0 153.5 2,930.1 4042014 . . 916.7 726.9 33.9 155.9 759.6 751.4 3.9 4.3 157.1 3,087.2 3862015 . . 985.9 773.2 38.0 174.6 838.1 829.4 4.1 4.7 147.8 3,235.0 3682016 . . 1,056.1 825.8 42.2 188.1 916.2 907.0 4.2 5.0 139.9 3,374.9 3532017 . . 1,110.7 867.3 46.3 197.0 994.3 984.5 4.3 5.5 116.4 3,491.3 3392018 . . 1,166.8 908.5 50.1 208.1 1,075.7 1,065.4 4.4 5.9 91.1 3,582.4 325
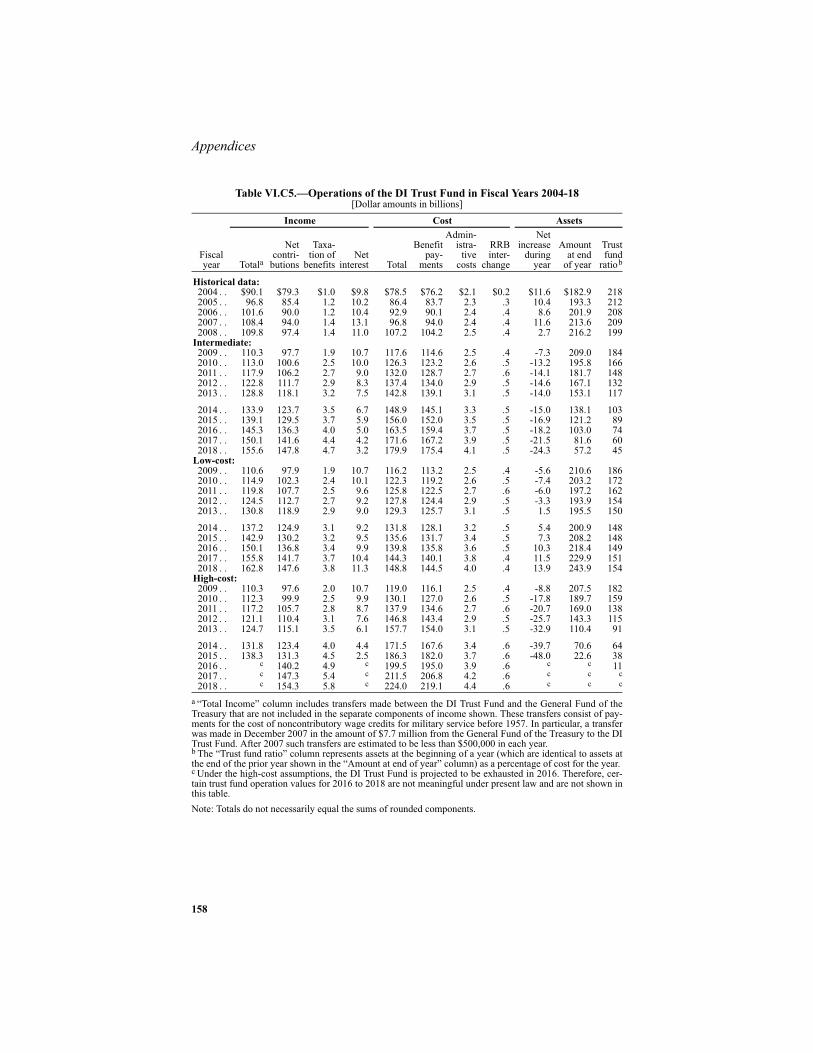
Appendices
158
Note: Totals do not necessarily equal the sums of rounded components.
Table VI.C5.—Operations of the DI Trust Fund in Fiscal Years 2004-18[Dollar amounts in billions]
Fiscal year
Income Cost Assets
Totala
a “Total Income” column includes transfers made between the DI Trust Fund and the General Fund of theTreasury that are not included in the separate components of income shown. These transfers consist of pay-ments for the cost of noncontributory wage credits for military service before 1957. In particular, a transferwas made in December 2007 in the amount of $7.7 million from the General Fund of the Treasury to the DITrust Fund. After 2007 such transfers are estimated to be less than $500,000 in each year.
Netcontri-
butions
Taxa-tion of
benefitsNet
interest Total
Benefitpay-
ments
Admin-istra-
tivecosts
RRBinter-
change
Netincrease
duringyear
Amountat end
of year
Trustfund
ratiob
b The “Trust fund ratio” column represents assets at the beginning of a year (which are identical to assets atthe end of the prior year shown in the “Amount at end of year” column) as a percentage of cost for the year.
Historical data:2004 . . $90.1 $79.3 $1.0 $9.8 $78.5 $76.2 $2.1 $0.2 $11.6 $182.9 2182005 . . 96.8 85.4 1.2 10.2 86.4 83.7 2.3 .3 10.4 193.3 2122006 . . 101.6 90.0 1.2 10.4 92.9 90.1 2.4 .4 8.6 201.9 2082007 . . 108.4 94.0 1.4 13.1 96.8 94.0 2.4 .4 11.6 213.6 2092008 . . 109.8 97.4 1.4 11.0 107.2 104.2 2.5 .4 2.7 216.2 199
Intermediate:2009 . . 110.3 97.7 1.9 10.7 117.6 114.6 2.5 .4 -7.3 209.0 1842010 . . 113.0 100.6 2.5 10.0 126.3 123.2 2.6 .5 -13.2 195.8 1662011 . . 117.9 106.2 2.7 9.0 132.0 128.7 2.7 .6 -14.1 181.7 1482012 . . 122.8 111.7 2.9 8.3 137.4 134.0 2.9 .5 -14.6 167.1 1322013 . . 128.8 118.1 3.2 7.5 142.8 139.1 3.1 .5 -14.0 153.1 117
2014 . . 133.9 123.7 3.5 6.7 148.9 145.1 3.3 .5 -15.0 138.1 1032015 . . 139.1 129.5 3.7 5.9 156.0 152.0 3.5 .5 -16.9 121.2 892016 . . 145.3 136.3 4.0 5.0 163.5 159.4 3.7 .5 -18.2 103.0 742017 . . 150.1 141.6 4.4 4.2 171.6 167.2 3.9 .5 -21.5 81.6 602018 . . 155.6 147.8 4.7 3.2 179.9 175.4 4.1 .5 -24.3 57.2 45
Low-cost:2009 . . 110.6 97.9 1.9 10.7 116.2 113.2 2.5 .4 -5.6 210.6 1862010 . . 114.9 102.3 2.4 10.1 122.3 119.2 2.6 .5 -7.4 203.2 1722011 . . 119.8 107.7 2.5 9.6 125.8 122.5 2.7 .6 -6.0 197.2 1622012 . . 124.5 112.7 2.7 9.2 127.8 124.4 2.9 .5 -3.3 193.9 1542013 . . 130.8 118.9 2.9 9.0 129.3 125.7 3.1 .5 1.5 195.5 150
2014 . . 137.2 124.9 3.1 9.2 131.8 128.1 3.2 .5 5.4 200.9 1482015 . . 142.9 130.2 3.2 9.5 135.6 131.7 3.4 .5 7.3 208.2 1482016 . . 150.1 136.8 3.4 9.9 139.8 135.8 3.6 .5 10.3 218.4 1492017 . . 155.8 141.7 3.7 10.4 144.3 140.1 3.8 .4 11.5 229.9 1512018 . . 162.8 147.6 3.8 11.3 148.8 144.5 4.0 .4 13.9 243.9 154
High-cost:2009 . . 110.3 97.6 2.0 10.7 119.0 116.1 2.5 .4 -8.8 207.5 1822010 . . 112.3 99.9 2.5 9.9 130.1 127.0 2.6 .5 -17.8 189.7 1592011 . . 117.2 105.7 2.8 8.7 137.9 134.6 2.7 .6 -20.7 169.0 1382012 . . 121.1 110.4 3.1 7.6 146.8 143.4 2.9 .5 -25.7 143.3 1152013 . . 124.7 115.1 3.5 6.1 157.7 154.0 3.1 .5 -32.9 110.4 91
2014 . . 131.8 123.4 4.0 4.4 171.5 167.6 3.4 .6 -39.7 70.6 642015 . . 138.3 131.3 4.5 2.5 186.3 182.0 3.7 .6 -48.0 22.6 382016 . . c
c Under the high-cost assumptions, the DI Trust Fund is projected to be exhausted in 2016. Therefore, cer-tain trust fund operation values for 2016 to 2018 are not meaningful under present law and are not shown inthis table.
140.2 4.9 c 199.5 195.0 3.9 .6 c c 112017 . . c 147.3 5.4 c 211.5 206.8 4.2 .6 c c c2018 . . c 154.3 5.8 c 224.0 219.1 4.4 .6 c c c
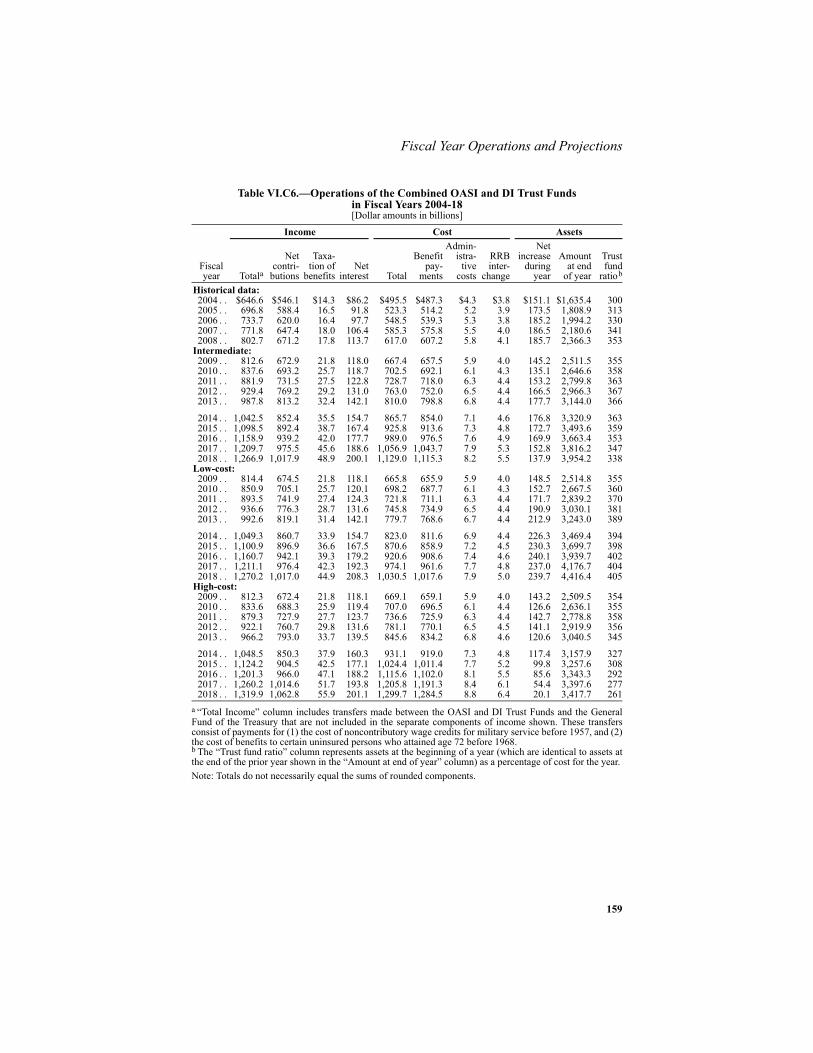
159
Fiscal Year Operations and Projections
Note: Totals do not necessarily equal the sums of rounded components.
Table VI.C6.—Operations of the Combined OASI and DI Trust Fundsin Fiscal Years 2004-18[Dollar amounts in billions]
Fiscalyear
Income Cost Assets
Totala
a “Total Income” column includes transfers made between the OASI and DI Trust Funds and the GeneralFund of the Treasury that are not included in the separate components of income shown. These transfersconsist of payments for (1) the cost of noncontributory wage credits for military service before 1957, and (2)the cost of benefits to certain uninsured persons who attained age 72 before 1968.
Netcontri-
butions
Taxa-tion of
benefitsNet
interest Total
Benefitpay-
ments
Admin-istra-
tivecosts
RRBinter-
change
Netincrease
duringyear
Amountat end
of year
Trustfund
ratiob
b The “Trust fund ratio” column represents assets at the beginning of a year (which are identical to assets atthe end of the prior year shown in the “Amount at end of year” column) as a percentage of cost for the year.
Historical data:2004 . . $646.6 $546.1 $14.3 $86.2 $495.5 $487.3 $4.3 $3.8 $151.1 $1,635.4 3002005 . . 696.8 588.4 16.5 91.8 523.3 514.2 5.2 3.9 173.5 1,808.9 3132006 . . 733.7 620.0 16.4 97.7 548.5 539.3 5.3 3.8 185.2 1,994.2 3302007 . . 771.8 647.4 18.0 106.4 585.3 575.8 5.5 4.0 186.5 2,180.6 3412008 . . 802.7 671.2 17.8 113.7 617.0 607.2 5.8 4.1 185.7 2,366.3 353
Intermediate:2009 . . 812.6 672.9 21.8 118.0 667.4 657.5 5.9 4.0 145.2 2,511.5 3552010 . . 837.6 693.2 25.7 118.7 702.5 692.1 6.1 4.3 135.1 2,646.6 3582011 . . 881.9 731.5 27.5 122.8 728.7 718.0 6.3 4.4 153.2 2,799.8 3632012 . . 929.4 769.2 29.2 131.0 763.0 752.0 6.5 4.4 166.5 2,966.3 3672013 . . 987.8 813.2 32.4 142.1 810.0 798.8 6.8 4.4 177.7 3,144.0 366
2014 . . 1,042.5 852.4 35.5 154.7 865.7 854.0 7.1 4.6 176.8 3,320.9 3632015 . . 1,098.5 892.4 38.7 167.4 925.8 913.6 7.3 4.8 172.7 3,493.6 3592016 . . 1,158.9 939.2 42.0 177.7 989.0 976.5 7.6 4.9 169.9 3,663.4 3532017 . . 1,209.7 975.5 45.6 188.6 1,056.9 1,043.7 7.9 5.3 152.8 3,816.2 3472018 . . 1,266.9 1,017.9 48.9 200.1 1,129.0 1,115.3 8.2 5.5 137.9 3,954.2 338
Low-cost:2009 . . 814.4 674.5 21.8 118.1 665.8 655.9 5.9 4.0 148.5 2,514.8 3552010 . . 850.9 705.1 25.7 120.1 698.2 687.7 6.1 4.3 152.7 2,667.5 3602011 . . 893.5 741.9 27.4 124.3 721.8 711.1 6.3 4.4 171.7 2,839.2 3702012 . . 936.6 776.3 28.7 131.6 745.8 734.9 6.5 4.4 190.9 3,030.1 3812013 . . 992.6 819.1 31.4 142.1 779.7 768.6 6.7 4.4 212.9 3,243.0 389
2014 . . 1,049.3 860.7 33.9 154.7 823.0 811.6 6.9 4.4 226.3 3,469.4 3942015 . . 1,100.9 896.9 36.6 167.5 870.6 858.9 7.2 4.5 230.3 3,699.7 3982016 . . 1,160.7 942.1 39.3 179.2 920.6 908.6 7.4 4.6 240.1 3,939.7 4022017 . . 1,211.1 976.4 42.3 192.3 974.1 961.6 7.7 4.8 237.0 4,176.7 4042018 . . 1,270.2 1,017.0 44.9 208.3 1,030.5 1,017.6 7.9 5.0 239.7 4,416.4 405
High-cost:2009 . . 812.3 672.4 21.8 118.1 669.1 659.1 5.9 4.0 143.2 2,509.5 3542010 . . 833.6 688.3 25.9 119.4 707.0 696.5 6.1 4.4 126.6 2,636.1 3552011 . . 879.3 727.9 27.7 123.7 736.6 725.9 6.3 4.4 142.7 2,778.8 3582012 . . 922.1 760.7 29.8 131.6 781.1 770.1 6.5 4.5 141.1 2,919.9 3562013 . . 966.2 793.0 33.7 139.5 845.6 834.2 6.8 4.6 120.6 3,040.5 345
2014 . . 1,048.5 850.3 37.9 160.3 931.1 919.0 7.3 4.8 117.4 3,157.9 3272015 . . 1,124.2 904.5 42.5 177.1 1,024.4 1,011.4 7.7 5.2 99.8 3,257.6 3082016 . . 1,201.3 966.0 47.1 188.2 1,115.6 1,102.0 8.1 5.5 85.6 3,343.3 2922017 . . 1,260.2 1,014.6 51.7 193.8 1,205.8 1,191.3 8.4 6.1 54.4 3,397.6 2772018 . . 1,319.9 1,062.8 55.9 201.1 1,299.7 1,284.5 8.8 6.4 20.1 3,417.7 261

Appendices
160
D. LONG-RANGE SENSITIVITY ANALYSIS
This appendix presents estimates that illustrate the sensitivity of the long-range actuarial status of the OASDI program to changes in selected individ-ual assumptions. The estimates, based on the three alternative sets ofassumptions (see sections IV.B, V.A, V.B, and V.C), illustrate the effects ofvarying all of the principal assumptions simultaneously in order to portray agenerally more optimistic or pessimistic future, in terms of the financial sta-tus of the OASDI program. In the sensitivity analysis presented in thisappendix, the intermediate alternative II projection is used as the referencepoint, and one assumption at a time is varied within that alternative. Thevariation used for each individual assumption reflects the levels used for thatassumption in the low-cost alternative I and high-cost alternative III projec-tions.
Each table in this section shows the effects of changing a particular assump-tion on the OASDI summarized income rates, summarized cost rates, andactuarial balances for 25-year, 50-year, and 75-year valuation periods.Because the annual payroll tax rate is constant for the entire 75-year valua-tion period, the income rate varies only slightly with changes in assumptionsand, therefore, is not considered in the discussion of the tables. The changein each of the actuarial balances is approximately equal to the change in thecorresponding cost rate, but in the opposite direction.
1. Total Fertility Rate
Table VI.D1 shows the estimated OASDI income rates, cost rates, and actu-arial balances, on the basis of alternative II with various assumptions aboutthe ultimate total fertility rate. These assumptions are that the ultimate totalfertility rate will be 1.7, 2.0, and 2.3 children per woman as assumed foralternatives III, II, and I, respectively. The rate is assumed to change gradu-ally from its current level and to reach the various ultimate values in 2033.
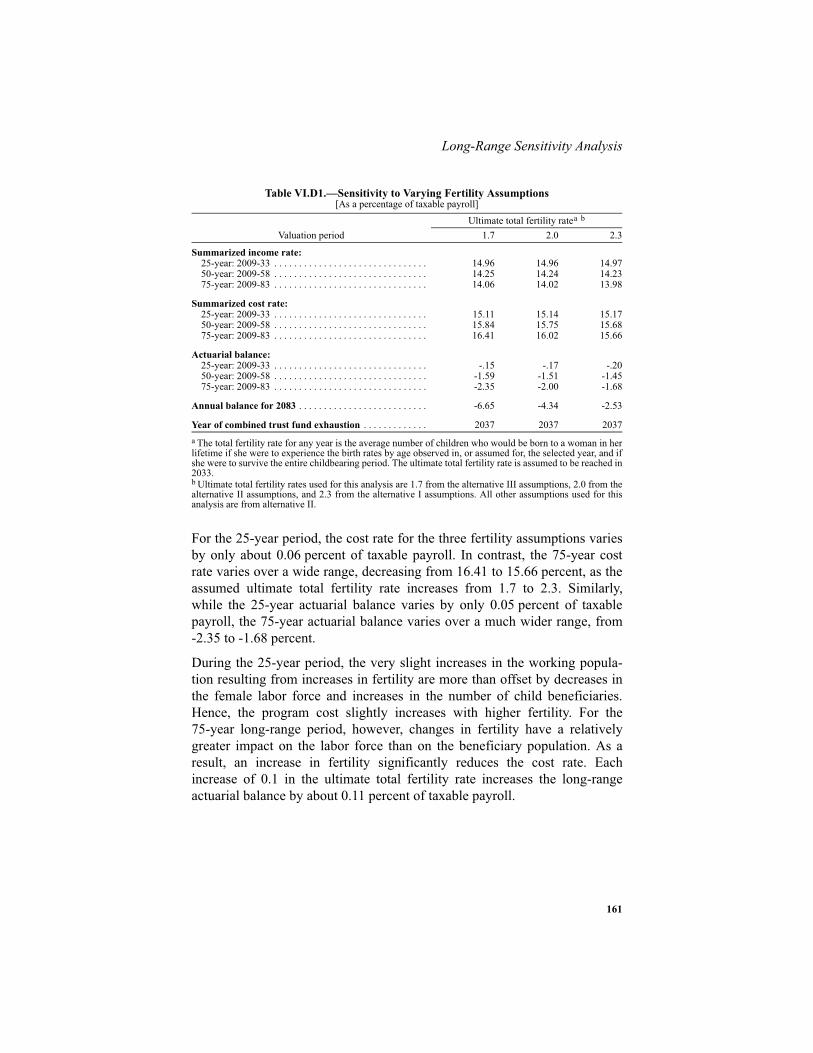
161
Long-Range Sensitivity Analysis
For the 25-year period, the cost rate for the three fertility assumptions variesby only about 0.06 percent of taxable payroll. In contrast, the 75-year costrate varies over a wide range, decreasing from 16.41 to 15.66 percent, as theassumed ultimate total fertility rate increases from 1.7 to 2.3. Similarly,while the 25-year actuarial balance varies by only 0.05 percent of taxablepayroll, the 75-year actuarial balance varies over a much wider range, from-2.35 to -1.68 percent.
During the 25-year period, the very slight increases in the working popula-tion resulting from increases in fertility are more than offset by decreases inthe female labor force and increases in the number of child beneficiaries.Hence, the program cost slightly increases with higher fertility. For the75-year long-range period, however, changes in fertility have a relativelygreater impact on the labor force than on the beneficiary population. As aresult, an increase in fertility significantly reduces the cost rate. Eachincrease of 0.1 in the ultimate total fertility rate increases the long-rangeactuarial balance by about 0.11 percent of taxable payroll.
Table VI.D1.—Sensitivity to Varying Fertility Assumptions[As a percentage of taxable payroll]
Valuation periodUltimate total fertility ratea b
a The total fertility rate for any year is the average number of children who would be born to a woman in herlifetime if she were to experience the birth rates by age observed in, or assumed for, the selected year, and ifshe were to survive the entire childbearing period. The ultimate total fertility rate is assumed to be reached in2033.b Ultimate total fertility rates used for this analysis are 1.7 from the alternative III assumptions, 2.0 from thealternative II assumptions, and 2.3 from the alternative I assumptions. All other assumptions used for thisanalysis are from alternative II.
1.7 2.0 2.3
Summarized income rate:25-year: 2009-33 . . . . . . . . . . . . . . . . . . . . . . . . . . . . . . . 14.96 14.96 14.9750-year: 2009-58 . . . . . . . . . . . . . . . . . . . . . . . . . . . . . . . 14.25 14.24 14.2375-year: 2009-83 . . . . . . . . . . . . . . . . . . . . . . . . . . . . . . . 14.06 14.02 13.98
Summarized cost rate:25-year: 2009-33 . . . . . . . . . . . . . . . . . . . . . . . . . . . . . . . 15.11 15.14 15.1750-year: 2009-58 . . . . . . . . . . . . . . . . . . . . . . . . . . . . . . . 15.84 15.75 15.6875-year: 2009-83 . . . . . . . . . . . . . . . . . . . . . . . . . . . . . . . 16.41 16.02 15.66
Actuarial balance:25-year: 2009-33 . . . . . . . . . . . . . . . . . . . . . . . . . . . . . . . -.15 -.17 -.2050-year: 2009-58 . . . . . . . . . . . . . . . . . . . . . . . . . . . . . . . -1.59 -1.51 -1.4575-year: 2009-83 . . . . . . . . . . . . . . . . . . . . . . . . . . . . . . . -2.35 -2.00 -1.68
Annual balance for 2083 . . . . . . . . . . . . . . . . . . . . . . . . . . -6.65 -4.34 -2.53
Year of combined trust fund exhaustion . . . . . . . . . . . . . 2037 2037 2037
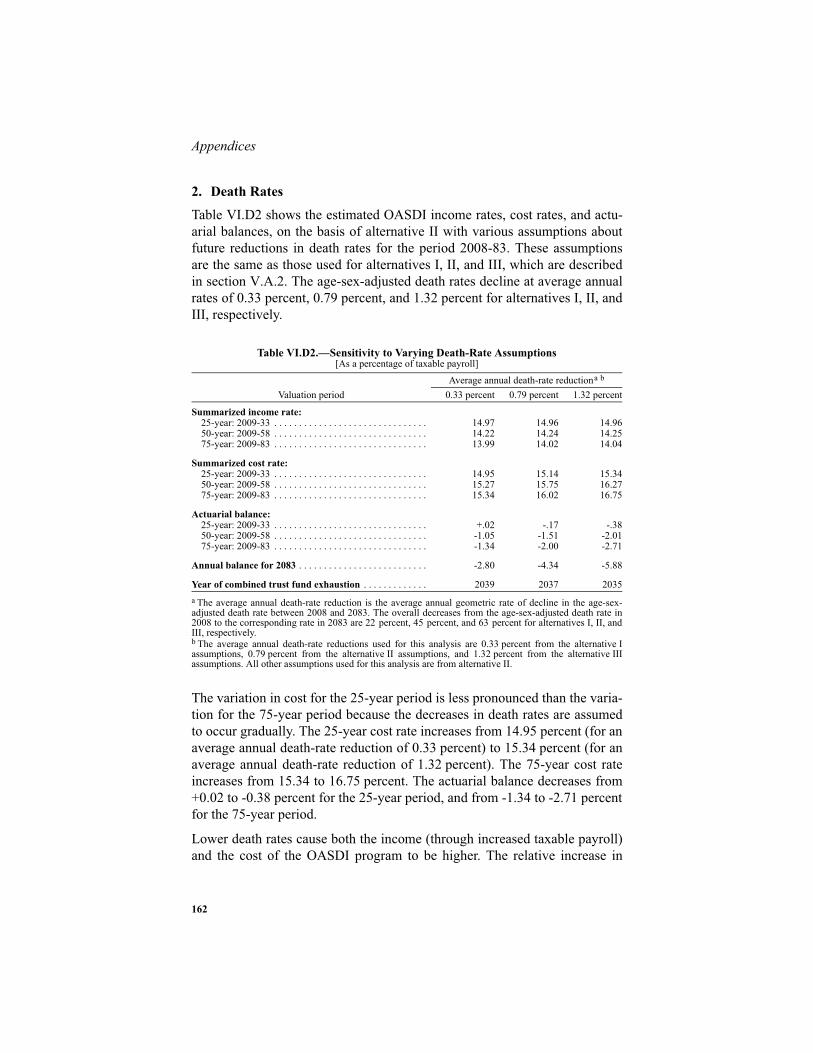
Appendices
162
2. Death Rates
Table VI.D2 shows the estimated OASDI income rates, cost rates, and actu-arial balances, on the basis of alternative II with various assumptions aboutfuture reductions in death rates for the period 2008-83. These assumptionsare the same as those used for alternatives I, II, and III, which are describedin section V.A.2. The age-sex-adjusted death rates decline at average annualrates of 0.33 percent, 0.79 percent, and 1.32 percent for alternatives I, II, andIII, respectively.
The variation in cost for the 25-year period is less pronounced than the varia-tion for the 75-year period because the decreases in death rates are assumedto occur gradually. The 25-year cost rate increases from 14.95 percent (for anaverage annual death-rate reduction of 0.33 percent) to 15.34 percent (for anaverage annual death-rate reduction of 1.32 percent). The 75-year cost rateincreases from 15.34 to 16.75 percent. The actuarial balance decreases from+0.02 to -0.38 percent for the 25-year period, and from -1.34 to -2.71 percentfor the 75-year period.
Lower death rates cause both the income (through increased taxable payroll)and the cost of the OASDI program to be higher. The relative increase in
Table VI.D2.—Sensitivity to Varying Death-Rate Assumptions[As a percentage of taxable payroll]
Valuation periodAverage annual death-rate reductiona b
a The average annual death-rate reduction is the average annual geometric rate of decline in the age-sex-adjusted death rate between 2008 and 2083. The overall decreases from the age-sex-adjusted death rate in2008 to the corresponding rate in 2083 are 22 percent, 45 percent, and 63 percent for alternatives I, II, andIII, respectively.b The average annual death-rate reductions used for this analysis are 0.33 percent from the alternative Iassumptions, 0.79 percent from the alternative II assumptions, and 1.32 percent from the alternative IIIassumptions. All other assumptions used for this analysis are from alternative II.
0.33 percent 0.79 percent 1.32 percent
Summarized income rate:25-year: 2009-33 . . . . . . . . . . . . . . . . . . . . . . . . . . . . . . . 14.97 14.96 14.9650-year: 2009-58 . . . . . . . . . . . . . . . . . . . . . . . . . . . . . . . 14.22 14.24 14.2575-year: 2009-83 . . . . . . . . . . . . . . . . . . . . . . . . . . . . . . . 13.99 14.02 14.04
Summarized cost rate:25-year: 2009-33 . . . . . . . . . . . . . . . . . . . . . . . . . . . . . . . 14.95 15.14 15.3450-year: 2009-58 . . . . . . . . . . . . . . . . . . . . . . . . . . . . . . . 15.27 15.75 16.2775-year: 2009-83 . . . . . . . . . . . . . . . . . . . . . . . . . . . . . . . 15.34 16.02 16.75
Actuarial balance: 25-year: 2009-33 . . . . . . . . . . . . . . . . . . . . . . . . . . . . . . . +.02 -.17 -.3850-year: 2009-58 . . . . . . . . . . . . . . . . . . . . . . . . . . . . . . . -1.05 -1.51 -2.0175-year: 2009-83 . . . . . . . . . . . . . . . . . . . . . . . . . . . . . . . -1.34 -2.00 -2.71
Annual balance for 2083 . . . . . . . . . . . . . . . . . . . . . . . . . . -2.80 -4.34 -5.88
Year of combined trust fund exhaustion . . . . . . . . . . . . . 2039 2037 2035

163
Long-Range Sensitivity Analysis
cost, however, exceeds the relative increase in taxable payroll. For any givenyear, reductions in the death rates for people who are age 62 and over (agesat which death rates are the highest) increase the number of retired-workerbeneficiaries (and, therefore, the amount of retirement benefits paid) withoutadding significantly to the number of covered workers (and, therefore, to thetaxable payroll). Although reductions for people at ages 50 to retirement eli-gibility age do result in significant increases to the taxable payroll, thoseincreases are not large enough to offset the sum of the additional retirementbenefits mentioned above and the disability benefits paid to additional bene-ficiaries at these pre-retirement ages, which are ages of high disability inci-dence. At ages under 50, death rates are so low that even substantialreductions would not result in significant increases in the numbers of cov-ered workers or beneficiaries. Consequently, if death rates for all ages arelowered by about the same relative amount, cost increases at a rate greaterthan the rate of growth in payroll, thereby resulting in higher cost rates and,therefore, lower actuarial balances. Each additional 0.1-percentage-pointincrease in the average annual rate of decline in the death rate decreases thelong-range actuarial balance by about 0.14 percent of taxable payroll.
3. Net Immigration
Table VI.D3 shows the estimated OASDI income rates, cost rates, and actu-arial balances, under alternative II with various assumptions about the mag-nitude of net immigration. These assumptions are that the annual netimmigration will average, over the long-range period, 785,000 persons,1,065,000 persons, and 1,370,000 persons as assumed for alternatives III, II,and I, respectively.

Appendices
164
For all three periods, the cost rate decreases with increasing rates of netimmigration. For the 25-year period, the cost rate decreases from15.22 percent of taxable payroll (for average annual net immigration of785,000 persons) to 15.04 percent (for average annual net immigration of1,370,000 persons). For the 50-year period, it decreases from 15.91 percentto 15.57 percent, and for the 75-year period, it decreases from 16.25 percentto 15.79 percent. The actuarial balance increases from -0.22 to -0.12 percentfor the 25-year period, from -1.64 to -1.38 percent for the 50-year period,and from -2.19 to -1.81 percent for the 75-year period.
The cost rate decreases with an increase in net immigration because immi-gration occurs at relatively young ages, thereby increasing the numbers ofcovered workers earlier than the numbers of beneficiaries. Increasing aver-age annual net immigration by 100,000 persons improves the long-rangeactuarial balance by about 0.07 percent of taxable payroll.
4. Real-Wage Differential
Table VI.D4 shows the estimated OASDI income rates, cost rates, and actu-arial balances, on the basis of alternative II with various assumptions aboutthe real-wage differential. These assumptions are that the ultimate real-wagedifferential will be 0.5 percentage point, 1.1 percentage points, and 1.7 per-centage points as assumed for alternatives III, II, and I, respectively. In each
Table VI.D3.—Sensitivity to Varying Net-Immigration Assumptions[As a percentage of taxable payroll]
Valuation periodAverage annual net immigrationa b
a Net immigration per year is the assumed annual net immigration to the Social Security area, including bothlegal and other immigration, averaged over the 75-year projection period.b The average annual net immigration assumptions used for this analysis are 785,000 from the alternative IIIassumptions, 1,065,000 from the alternative II assumptions, and 1,370,000 from the alternative I assump-tions. All other assumptions used for this analysis are from alternative II.
785,000 1,065,000 1,370,000
Summarized income rate:25-year: 2009-33 . . . . . . . . . . . . . . . . . . . . . . . . . . . . . . . 15.00 14.96 14.9350-year: 2009-58 . . . . . . . . . . . . . . . . . . . . . . . . . . . . . . . 14.27 14.24 14.2075-year: 2009-83 . . . . . . . . . . . . . . . . . . . . . . . . . . . . . . . 14.06 14.02 13.98
Summarized cost rate:25-year: 2009-33 . . . . . . . . . . . . . . . . . . . . . . . . . . . . . . . 15.22 15.14 15.0450-year: 2009-58 . . . . . . . . . . . . . . . . . . . . . . . . . . . . . . . 15.91 15.75 15.5775-year: 2009-83 . . . . . . . . . . . . . . . . . . . . . . . . . . . . . . . 16.25 16.02 15.79
Actuarial balance: 25-year: 2009-33 . . . . . . . . . . . . . . . . . . . . . . . . . . . . . . . -.22 -.17 -.1250-year: 2009-58 . . . . . . . . . . . . . . . . . . . . . . . . . . . . . . . -1.64 -1.51 -1.3875-year: 2009-83 . . . . . . . . . . . . . . . . . . . . . . . . . . . . . . . -2.19 -2.00 -1.81
Annual balance for 2083 . . . . . . . . . . . . . . . . . . . . . . . . . . -4.91 -4.34 -3.81
Year of combined trust fund exhaustion . . . . . . . . . . . . . 2036 2037 2037
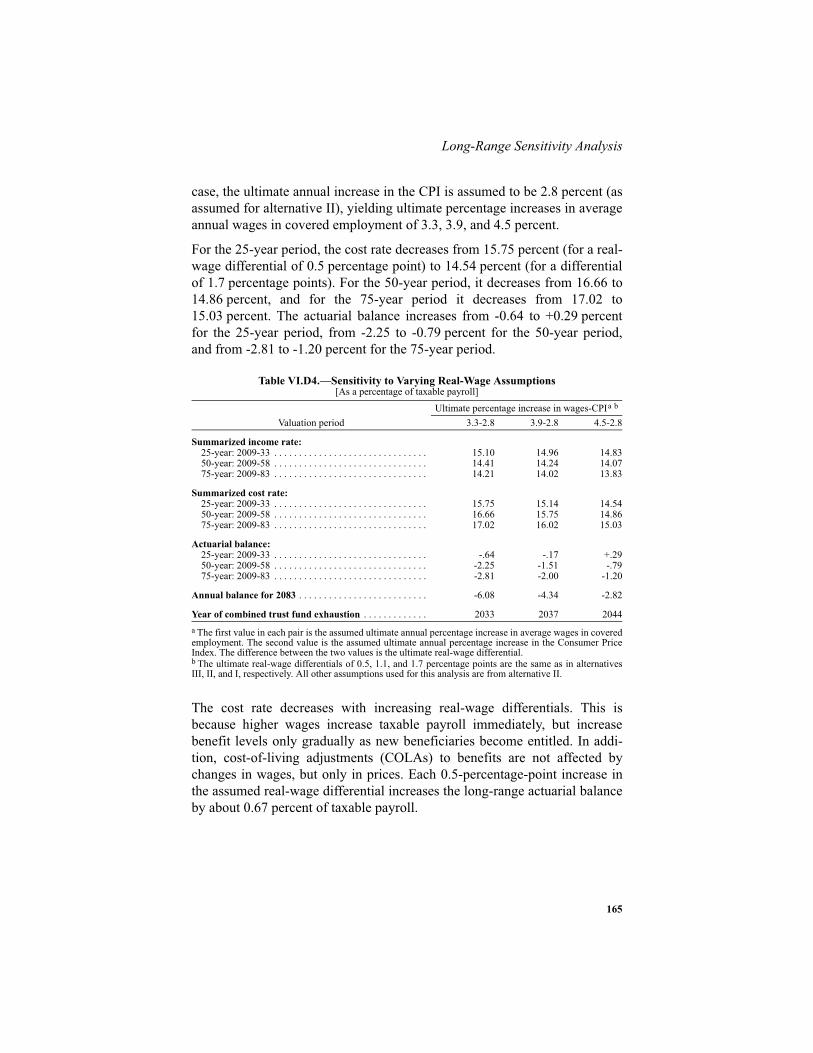
165
Long-Range Sensitivity Analysis
case, the ultimate annual increase in the CPI is assumed to be 2.8 percent (asassumed for alternative II), yielding ultimate percentage increases in averageannual wages in covered employment of 3.3, 3.9, and 4.5 percent.
For the 25-year period, the cost rate decreases from 15.75 percent (for a real-wage differential of 0.5 percentage point) to 14.54 percent (for a differentialof 1.7 percentage points). For the 50-year period, it decreases from 16.66 to14.86 percent, and for the 75-year period it decreases from 17.02 to15.03 percent. The actuarial balance increases from -0.64 to +0.29 percentfor the 25-year period, from -2.25 to -0.79 percent for the 50-year period,and from -2.81 to -1.20 percent for the 75-year period.
The cost rate decreases with increasing real-wage differentials. This isbecause higher wages increase taxable payroll immediately, but increasebenefit levels only gradually as new beneficiaries become entitled. In addi-tion, cost-of-living adjustments (COLAs) to benefits are not affected bychanges in wages, but only in prices. Each 0.5-percentage-point increase inthe assumed real-wage differential increases the long-range actuarial balanceby about 0.67 percent of taxable payroll.
Table VI.D4.—Sensitivity to Varying Real-Wage Assumptions[As a percentage of taxable payroll]
Valuation periodUltimate percentage increase in wages-CPIa b
a The first value in each pair is the assumed ultimate annual percentage increase in average wages in coveredemployment. The second value is the assumed ultimate annual percentage increase in the Consumer PriceIndex. The difference between the two values is the ultimate real-wage differential.b The ultimate real-wage differentials of 0.5, 1.1, and 1.7 percentage points are the same as in alternativesIII, II, and I, respectively. All other assumptions used for this analysis are from alternative II.
3.3-2.8 3.9-2.8 4.5-2.8
Summarized income rate:25-year: 2009-33 . . . . . . . . . . . . . . . . . . . . . . . . . . . . . . . 15.10 14.96 14.8350-year: 2009-58 . . . . . . . . . . . . . . . . . . . . . . . . . . . . . . . 14.41 14.24 14.0775-year: 2009-83 . . . . . . . . . . . . . . . . . . . . . . . . . . . . . . . 14.21 14.02 13.83
Summarized cost rate:25-year: 2009-33 . . . . . . . . . . . . . . . . . . . . . . . . . . . . . . . 15.75 15.14 14.5450-year: 2009-58 . . . . . . . . . . . . . . . . . . . . . . . . . . . . . . . 16.66 15.75 14.8675-year: 2009-83 . . . . . . . . . . . . . . . . . . . . . . . . . . . . . . . 17.02 16.02 15.03
Actuarial balance: 25-year: 2009-33 . . . . . . . . . . . . . . . . . . . . . . . . . . . . . . . -.64 -.17 +.2950-year: 2009-58 . . . . . . . . . . . . . . . . . . . . . . . . . . . . . . . -2.25 -1.51 -.7975-year: 2009-83 . . . . . . . . . . . . . . . . . . . . . . . . . . . . . . . -2.81 -2.00 -1.20
Annual balance for 2083 . . . . . . . . . . . . . . . . . . . . . . . . . . -6.08 -4.34 -2.82
Year of combined trust fund exhaustion . . . . . . . . . . . . . 2033 2037 2044

Appendices
166
5. Consumer Price Index
Table VI.D5 shows the estimated OASDI income rates, cost rates, and actu-arial balances, on the basis of alternative II with various assumptions aboutthe rate of increase for the Consumer Price Index (CPI). These assumptionsare that the ultimate annual increase in the CPI will be 1.8 percent,2.8 percent, and 3.8 percent as assumed for alternatives I, II, and III, respec-tively. In each case, the ultimate real-wage differential is assumed to be1.1 percentage points (as assumed for alternative II), yielding ultimate per-centage increases in average annual wages in covered employment of 2.9,3.9, and 4.9 percent.
For all three periods, the cost rate decreases with greater assumed rates ofincrease in the CPI. For the 25-year period, the cost rate decreases from15.31 (for CPI increases of 1.8 percent) to 14.97 percent (for CPI increasesof 3.8 percent). For the 50-year period, it decreases from 15.97 to15.53 percent, and for the 75-year period, it decreases from 16.26 to15.78 percent. The actuarial balance increases from -0.30 to -0.05 percent forthe 25-year period, from -1.70 to -1.33 percent for the 50-year period, andfrom -2.21 to -1.80 percent for the 75-year period.
Table VI.D5.—Sensitivity to Varying CPI-Increase Assumptions[As a percentage of taxable payroll]
Valuation periodUltimate percentage increase in wages-CPIa b
a The first value in each pair is the assumed ultimate annual percentage increase in average wages in coveredemployment. The second value is the assumed ultimate annual percentage increase in the Consumer PriceIndex. The difference between the two values is the ultimate real-wage differential.b The ultimate CPI increases of 1.8, 2.8, and 3.8 percent are the same as in alternatives I, II, and III, respec-tively. The ultimate real-wage differential of 1.1 percentage points is the same as in alternative II. All otherassumptions used for this analysis are also from alternative II.
2.9-1.8 3.9-2.8 4.9-3.8
Summarized income rate:25-year: 2009-33 . . . . . . . . . . . . . . . . . . . . . . . . . . . . . . . 15.01 14.96 14.9250-year: 2009-58 . . . . . . . . . . . . . . . . . . . . . . . . . . . . . . . 14.27 14.24 14.2075-year: 2009-83 . . . . . . . . . . . . . . . . . . . . . . . . . . . . . . . 14.05 14.02 13.99
Summarized cost rate:25-year: 2009-33 . . . . . . . . . . . . . . . . . . . . . . . . . . . . . . . 15.31 15.14 14.9750-year: 2009-58 . . . . . . . . . . . . . . . . . . . . . . . . . . . . . . . 15.97 15.75 15.5375-year: 2009-83 . . . . . . . . . . . . . . . . . . . . . . . . . . . . . . . 16.26 16.02 15.78
Actuarial balance: 25-year: 2009-33 . . . . . . . . . . . . . . . . . . . . . . . . . . . . . . . -.30 -.17 -.0550-year: 2009-58 . . . . . . . . . . . . . . . . . . . . . . . . . . . . . . . -1.70 -1.51 -1.3375-year: 2009-83 . . . . . . . . . . . . . . . . . . . . . . . . . . . . . . . -2.21 -2.00 -1.80
Annual balance for 2083 . . . . . . . . . . . . . . . . . . . . . . . . . . -4.64 -4.34 -4.05
Year of combined trust fund exhaustion . . . . . . . . . . . . . 2036 2037 2038

167
Long-Range Sensitivity Analysis
The patterns described above result primarily from the time lag between theeffects of the CPI changes on taxable payroll and on benefit payments. Whenassuming a greater rate of increase in the CPI (in combination with a con-stant real-wage differential), the effect on taxable payroll due to a greater rateof increase in average wages is experienced immediately, while the effect onbenefits due to a larger COLA is experienced with a lag of about 1 year.Thus, the higher taxable payrolls have a stronger effect than the higher bene-fits, thereby resulting in lower cost rates. The effect of each 1.0-percentage-point increase in the rate of change assumed for the CPI is an increase in thelong-range actuarial balance of about 0.21 percent of taxable payroll.
6. Real Interest Rate
Table VI.D6 shows the estimated OASDI income rates, cost rates, and actu-arial balances, on the basis of alternative II with various assumptions aboutthe annual real interest rate for special public-debt obligations issuable to thetrust funds, which are compounded semiannually. These assumptions are thatthe ultimate annual real interest rate will be 2.1 percent, 2.9 percent, and3.6 percent as assumed for alternatives III, II, and I, respectively. In eachcase, the ultimate annual increase in the CPI is assumed to be 2.8 percent (asassumed for alternative II), resulting in ultimate annual yields of 5.0, 5.8, and6.5 percent.
Table VI.D6.—Sensitivity to Varying Real-Interest Assumptions[As a percentage of taxable payroll]
Valuation periodUltimate annual real interest ratea b
a The ultimate real interest rate is defined to be the effective annual yield on assets held by the trust fundsdivided by the annual rate of growth in the CPI.b The ultimate annual real interest rates used for this analysis are 2.1 percent from the alternative III assump-tions, 2.9 percent from the alternative II assumptions, and 3.6 percent from the alternative I assumptions. Allother assumptions used for this analysis are from alternative II.
2.1 percent 2.9 percent 3.6 percent
Summarized income rate:25-year: 2009-33 . . . . . . . . . . . . . . . . . . . . . . . . . . . . . . . 14.85 14.96 15.0650-year: 2009-58 . . . . . . . . . . . . . . . . . . . . . . . . . . . . . . . 14.10 14.24 14.3675-year: 2009-83 . . . . . . . . . . . . . . . . . . . . . . . . . . . . . . . 13.86 14.02 14.16
Summarized cost rate:25-year: 2009-33 . . . . . . . . . . . . . . . . . . . . . . . . . . . . . . . 15.28 15.14 15.0250-year: 2009-58 . . . . . . . . . . . . . . . . . . . . . . . . . . . . . . . 15.95 15.75 15.5875-year: 2009-83 . . . . . . . . . . . . . . . . . . . . . . . . . . . . . . . 16.27 16.02 15.80
Actuarial balance: 25-year: 2009-33 . . . . . . . . . . . . . . . . . . . . . . . . . . . . . . . -.42 -.17 +.0550-year: 2009-58 . . . . . . . . . . . . . . . . . . . . . . . . . . . . . . . -1.85 -1.51 -1.2175-year: 2009-83 . . . . . . . . . . . . . . . . . . . . . . . . . . . . . . . -2.41 -2.00 -1.64
Annual balance for 2083 . . . . . . . . . . . . . . . . . . . . . . . . . . -4.34 -4.34 -4.34
Year of combined trust fund exhaustion . . . . . . . . . . . . . 2035 2037 2039

Appendices
168
For the 25-year period, the cost rate decreases with increasing real interestrates, from 15.28 percent (for an ultimate real interest rate of 2.1 percent) to15.02 percent (for an ultimate real interest rate of 3.6 percent). For the 50-year period, it decreases from 15.95 to 15.58 percent, and for the 75-yearperiod, it decreases from 16.27 to 15.80 percent. The actuarial balanceincreases from -0.42 to +0.05 percent for the 25-year period, from -1.85 to-1.21 percent for the 50-year period, and from -2.41 to -1.64 percent for the75-year period. Each 0.5-percentage-point increase in the assumed real inter-est rate increases the long-range actuarial balance by about 0.26 percent oftaxable payroll.
7. Disability Incidence Rates
Table VI.D7 shows the estimated OASDI income rates, cost rates, and actu-arial balances, on the basis of alternative II with various assumptions con-cerning future disability incidence rates. For all three alternatives, incidencerates by age and sex are assumed to vary during the early years of the projec-tion period before attaining ultimate levels in 2028. In comparison to the his-torical period 1970 through 2008, the ultimate age-sex-adjusted incidencerate is 2 percent higher for alternative II, 19 percent lower for alternative I,and 21 percent higher for alternative III.
Table VI.D7.—Sensitivity to Varying Disability Incidence Assumptions[As a percentage of taxable payroll]
Valuation period
Disability incidence ratesbased on alternative—
I II III
Summarized income rate:25-year: 2009-33 . . . . . . . . . . . . . . . . . . . . . . . . . . . . . . . 14.96 14.96 14.9750-year: 2009-58 . . . . . . . . . . . . . . . . . . . . . . . . . . . . . . . 14.23 14.24 14.2475-year: 2009-83 . . . . . . . . . . . . . . . . . . . . . . . . . . . . . . . 14.01 14.02 14.02
Summarized cost rate:25-year: 2009-33 . . . . . . . . . . . . . . . . . . . . . . . . . . . . . . . 14.96 15.14 15.3150-year: 2009-58 . . . . . . . . . . . . . . . . . . . . . . . . . . . . . . . 15.50 15.75 15.9975-year: 2009-83 . . . . . . . . . . . . . . . . . . . . . . . . . . . . . . . 15.74 16.02 16.29
Actuarial balance: 25-year: 2009-33 . . . . . . . . . . . . . . . . . . . . . . . . . . . . . . . a
a Between -0.005 and 0.005 percent of taxable payroll.
-.17 -.3450-year: 2009-58 . . . . . . . . . . . . . . . . . . . . . . . . . . . . . . . -1.27 -1.51 -1.7575-year: 2009-83 . . . . . . . . . . . . . . . . . . . . . . . . . . . . . . . -1.73 -2.00 -2.26
Annual balance for 2083 . . . . . . . . . . . . . . . . . . . . . . . . . . -3.98 -4.34 -4.68
Year of combined trust fund exhaustion . . . . . . . . . . . . . 2038 2037 2035

169
Long-Range Sensitivity Analysis
For the 25-year period, the cost rate increases with increasing disability inci-dence rates, from 14.96 percent (for the relatively low rates assumed foralternative I) to 15.31 percent (for the relatively high rates assumed foralternative III). For the 50-year period, it increases from 15.50 to 15.99 per-cent, and for the 75-year period, it increases from 15.74 to 16.29 percent.The actuarial balance decreases from 0.00 to -0.34 percent for the 25-yearperiod, from -1.27 to -1.75 percent for the 50-year period, and from -1.73 to-2.26 percent for the 75-year period.
8. Disability Termination Rates
Table VI.D8 shows the estimated OASDI income rates, cost rates, and actu-arial balances, on the basis of alternative II with various assumptions aboutfuture disability termination rates. For all three alternatives, death rates areassumed to decline throughout the long-range period. For alternative II, theage-sex-adjusted1 death rate is assumed to decline to a level in 2085 that isabout 59 percent lower than the level in 2008. For alternative I, the age-sex-adjusted death rate is assumed to decline to a level in 2085 that is about 27percent lower than the level in 2008. For alternative III, the age-sex-adjusteddeath rate is assumed to decline to a level in 2085 that is about 74 percentlower than the level in 2008.
For all three alternatives, ultimate recovery-termination rates by age, sex,and duration are assumed to be attained in the twentieth year of the projec-tion period. For alternative II, the age-sex-adjusted1 recovery rate in 2028 isabout 11 recoveries per thousand disabled-worker beneficiaries. For alterna-tive I, the age-sex-adjusted recovery rate in 2028 is about 13 recoveries perthousand disabled-worker beneficiaries. For alternative III, the age-sex-adjusted recovery rate in 2028 is about 9 recoveries per thousand disabled-worker beneficiaries.
1 Age adjusted to the total disabled workers in current-payment status as of the year 2000.
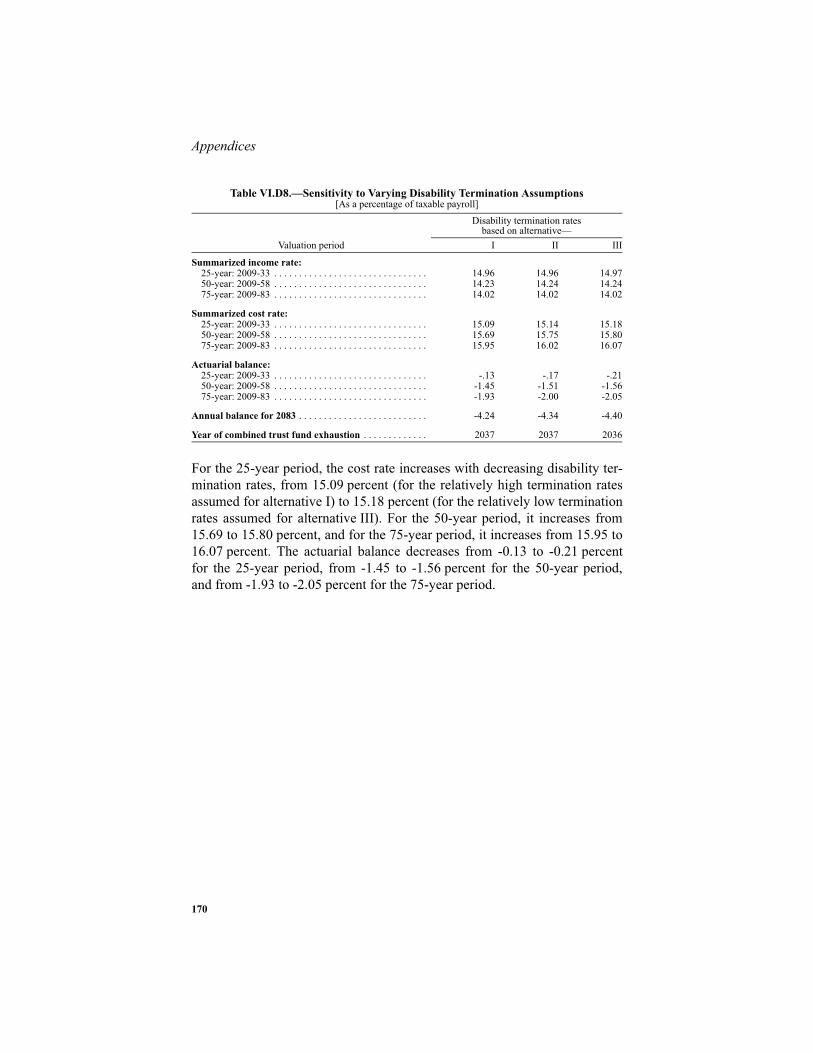
Appendices
170
For the 25-year period, the cost rate increases with decreasing disability ter-mination rates, from 15.09 percent (for the relatively high termination ratesassumed for alternative I) to 15.18 percent (for the relatively low terminationrates assumed for alternative III). For the 50-year period, it increases from15.69 to 15.80 percent, and for the 75-year period, it increases from 15.95 to16.07 percent. The actuarial balance decreases from -0.13 to -0.21 percentfor the 25-year period, from -1.45 to -1.56 percent for the 50-year period,and from -1.93 to -2.05 percent for the 75-year period.
Table VI.D8.—Sensitivity to Varying Disability Termination Assumptions[As a percentage of taxable payroll]
Valuation period
Disability termination ratesbased on alternative—
I II III
Summarized income rate:25-year: 2009-33 . . . . . . . . . . . . . . . . . . . . . . . . . . . . . . . 14.96 14.96 14.9750-year: 2009-58 . . . . . . . . . . . . . . . . . . . . . . . . . . . . . . . 14.23 14.24 14.2475-year: 2009-83 . . . . . . . . . . . . . . . . . . . . . . . . . . . . . . . 14.02 14.02 14.02
Summarized cost rate:25-year: 2009-33 . . . . . . . . . . . . . . . . . . . . . . . . . . . . . . . 15.09 15.14 15.1850-year: 2009-58 . . . . . . . . . . . . . . . . . . . . . . . . . . . . . . . 15.69 15.75 15.8075-year: 2009-83 . . . . . . . . . . . . . . . . . . . . . . . . . . . . . . . 15.95 16.02 16.07
Actuarial balance:25-year: 2009-33 . . . . . . . . . . . . . . . . . . . . . . . . . . . . . . . -.13 -.17 -.2150-year: 2009-58 . . . . . . . . . . . . . . . . . . . . . . . . . . . . . . . -1.45 -1.51 -1.5675-year: 2009-83 . . . . . . . . . . . . . . . . . . . . . . . . . . . . . . . -1.93 -2.00 -2.05
Annual balance for 2083 . . . . . . . . . . . . . . . . . . . . . . . . . . -4.24 -4.34 -4.40
Year of combined trust fund exhaustion . . . . . . . . . . . . . 2037 2037 2036

171
Stochastic Projections
E. STOCHASTIC PROJECTIONS
Significant uncertainty surrounds the estimates under the intermediateassumptions, especially for a period as long as 75 years. This appendix pre-sents a way to illustrate the uncertainty of these estimates. It is intended tosupplement the traditional methods of examining such uncertainty and toillustrate the potential value of new techniques.
1. Background
The Trustees Report has traditionally shown additional estimates using thelow-cost and high-cost sets of specified assumptions to reflect the presenceof uncertainty. These additional estimates provide a range of possible out-comes for the projections. However, they provide no indication of the proba-bility that actual future experience will be inside or outside the range of theseestimates. This appendix presents the results of a model, based on stochasticmodeling techniques, that estimates a probability distribution of future out-comes of the financial status of the combined OASI and DI Trust Funds.
It should be noted that this model is subject to further development. Futureimprovements and refinements are expected to be more likely to expand,rather than reduce, the indicated range of uncertainty.
2. Methodology
Other sections of this report provide estimates of the financial status of thecombined OASI and DI Trust Funds using a “deterministic” model. For thedeterministic model, certain assumptions are made regarding levels of fertil-ity, changes in mortality, legal and other immigration levels, legal and otheremigration levels, changes in the Consumer Price Index, changes in averagereal wages, unemployment rates, trust fund real yield rates, and disabilityincidence and recovery rates. In general, each of these variables is assumedto reach an ultimate value at a specific point during the long-range periodand to maintain that value throughout the remainder of the period. As men-tioned above, three deterministic scenarios are developed assuming separate,specified values for each of these variables. More details about each of theseassumptions can be found in section V.
In contrast, the results of 5,000 independent stochastic simulations are pre-sented in this appendix. Each of the 5,000 simulations is determined byallowing the above variables to vary throughout the long-range period. Thefluctuation in each variable is projected by using standard time-series model-ing, a method designed to help make inferences based on historical data.Generally, each variable is modeled by an equation that captures a relation-ship between current and prior years’ values of the variable and introduces

Appendices
172
year-by-year random variation, as reflected in the historical period. For somevariables, the equations additionally reflect relationships with other vari-ables. Parameters for the equations are estimated using historical data forperiods between 20 years and 110 years depending on the nature and qualityof data available. Each time-series equation is designed such that, in theabsence of random variation, the value of the variable would equal the valueassumed under the intermediate set of assumptions. More detail on thismodel, and stochastic modeling in general, is available on the Social Securitywebsite.1
For each simulation of the model, values for most of the variables listedabove are determined by using Monte Carlo techniques to randomly assignthe year-by-year variations. The one exception is that net other immigrationis modeled rather than individually modeling other immigration and otheremigration. Each simulation produces an estimate of the financial status ofthe combined OASI and DI Trust Funds. Results shown in this appendixreflect the distribution of results from 5,000 model simulations.
The results from this model should be interpreted with caution and with a fullunderstanding of the inherent limitations. Results are very sensitive to equa-tion specifications, degrees of interdependence among variables, and the his-torical periods used for the estimates. For some variables, using thevariations exhibited in a relatively recent historical period may not provide arealistic representation of the potential variation for the future. In addition,results would differ if random variations had been applied to additional vari-ables other than those mentioned above (such as labor force participationrates, retirement rates, marriage rates, and divorce rates). Furthermore, addi-tional variability could result from incorporating statistical approaches thatwould more fully model change in the long-range central tendencies of thevariables. The historical period available for most variables is relativelyhomogeneous and does not reflect many substantial shifts. The time-seriesmodeling reflects what occurred in the historical period. As a result, the vari-ation indicated in this appendix should be viewed as the minimum plausiblevariation for the future. Substantial shifts, as predicted by many experts andas seen in prior centuries, are not fully reflected in the current model.
1 www.socialsecurity.gov/OACT/stochastic/index.html

173
Stochastic Projections
3. Results
Simulated probability distributions of the annual trust fund ratios for thecombined OASI and DI Trust Funds are shown in figure VI.E1. The twoextreme lines in this figure illustrate the range within which future annualtrust fund ratios are estimated to occur 95 percent of the time (i.e., a 95-per-cent confidence interval). In other words, actual future trust fund ratios in agiven year would be expected to exceed the upper bound only 2.5 percent ofthe time or to fall below the lower bound 2.5 percent of the time. Other linesin the figure display additional confidence intervals (80-percent, 60-percent,40-percent, and 20-percent) around future annual trust fund ratios. Themedian estimate for each year indicates the trust fund ratio that is projectedby this model to fall exactly in the middle of possible outcomes for that year.It is important to note that these lines do not represent the results of individ-ual stochastic simulations. Instead, for each given year, they represent thepercentile distribution of trust fund ratios based on all stochastic simulationsfor that year.
The median estimate for each year indicates that the assets of the combinedOASI and DI Trust Funds would be exhausted by the end of 2036 with aprobability of 50 percent. This exhaustion date is 1 year earlier than the yearof exhaustion projected under the intermediate assumptions. Figure VI.E1shows that the 95-percent confidence interval for the trust fund ratio in 2025ranges from 345 to 127 percent of annual cost. In comparison, the 2025 trustfund ratios for the low-cost and high-cost alternatives are each outside thisrange, at 385 and 108 percent, respectively. By 2083, the range representedby the low-cost and high-cost projections increases substantially beyond theboundaries of the 95-percent stochastic confidence interval, as seen from thevalues for the open group unfunded obligation in table VI.E1. This increasedvariation of the alternatives relative to the stochastic confidence interval isalso seen in the positive trust fund ratio for the low-cost scenario for 2083.
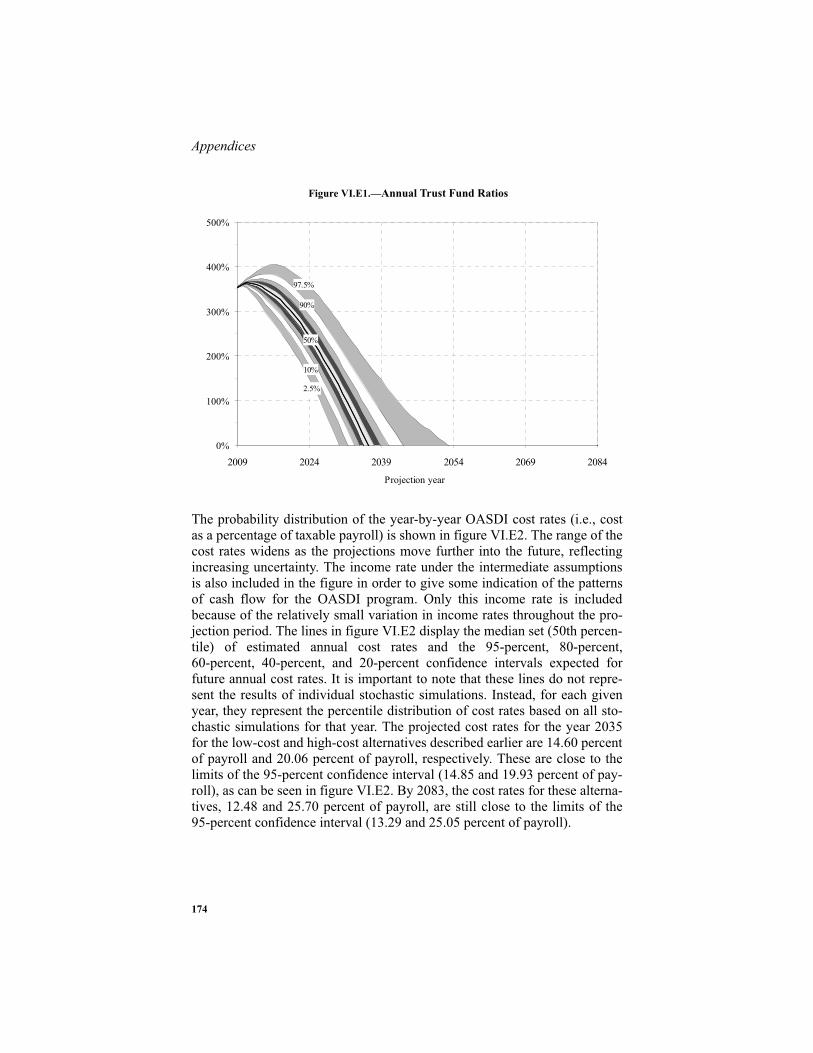
Appendices
174
The probability distribution of the year-by-year OASDI cost rates (i.e., costas a percentage of taxable payroll) is shown in figure VI.E2. The range of thecost rates widens as the projections move further into the future, reflectingincreasing uncertainty. The income rate under the intermediate assumptionsis also included in the figure in order to give some indication of the patternsof cash flow for the OASDI program. Only this income rate is includedbecause of the relatively small variation in income rates throughout the pro-jection period. The lines in figure VI.E2 display the median set (50th percen-tile) of estimated annual cost rates and the 95-percent, 80-percent,60-percent, 40-percent, and 20-percent confidence intervals expected forfuture annual cost rates. It is important to note that these lines do not repre-sent the results of individual stochastic simulations. Instead, for each givenyear, they represent the percentile distribution of cost rates based on all sto-chastic simulations for that year. The projected cost rates for the year 2035for the low-cost and high-cost alternatives described earlier are 14.60 percentof payroll and 20.06 percent of payroll, respectively. These are close to thelimits of the 95-percent confidence interval (14.85 and 19.93 percent of pay-roll), as can be seen in figure VI.E2. By 2083, the cost rates for these alterna-tives, 12.48 and 25.70 percent of payroll, are still close to the limits of the95-percent confidence interval (13.29 and 25.05 percent of payroll).
Figure VI.E1.—Annual Trust Fund Ratios
0%
100%
200%
300%
400%
500%
2009 2024 2039 2054 2069 2084
Projection year
50%
97.5%
2.5%
90%
10%

175
Stochastic Projections
Table VI.E1 displays long-range actuarial estimates that illustrate uncertaintyfor the combined OASDI program using both the deterministic and stochas-tic approaches. Actuarial estimates included in the table are for the long-range period, 2009-83. Stochastic estimates are shown for the median (50thpercentile) and for the 95-percent and 80-percent confidence intervals. Forcomparison, deterministic estimates are shown for the intermediate, low-cost, and high-cost assumptions. Each individual stochastic estimate dis-played in the table represents the level at that percentile from the distributionof the 5,000 simulations. However, for each given percentile, the stochasticestimates shown for the different long-range actuarial measures are generallynot from the same stochastic simulation.
Median stochastic estimates for the actuarial measures displayed in tableVI.E1 are slightly more pessimistic for the combined OASI and DI TrustFunds than the deterministic estimates projected under the intermediateassumptions. The median estimate of the long-range actuarial balance is-2.16 percent of taxable payroll, about 0.16 percentage point lower than pro-jected under the intermediate assumptions. The median estimate for the firstyear cost exceeds tax income is 2014. This is 2 years earlier than projectedunder the intermediate assumptions. The median estimate for the year assetsfirst become exhausted is 2036. This is 1 year earlier than the year projectedunder the intermediate assumptions. The median estimate for the annual costin the 75th year of the projection period is 17.93 as a percentage of taxable
Figure VI.E2.—Annual Cost Rates
5%
10%
15%
20%
25%
30%
2009 2024 2039 2054 2069 2084
Projection year
50%
97.5%
2.5%
90%
10%
Income Rate

Appendices
176
payroll and 5.90 as a percentage of GDP. The comparable estimates using theintermediate assumptions are 17.68 percent of payroll and 5.86 percent ofGDP.
The 95-percent confidence interval determined by the stochastic modelingprojections can be compared to the range of variation defined by the tradi-tional low-cost and high-cost alternatives. For four of the measures in tableVI.E1 (the actuarial balance, the open group unfunded obligation, the firstyear assets become exhausted, and the annual cost in the 75th year of theprojection period expressed as a percentage of payroll), the 95-percent sto-chastic projection range is narrower than the range defined by the low-costand high-cost alternatives. That is, for these measures, the estimates underthe low-cost and high-cost alternatives fall outside the 95-percent confidenceinterval determined by the stochastic modeling projections. In contrast, forone of the measures in the table (the annual cost in the 75th year of the pro-jection period expressed as a percentage of GDP), the 95-percent stochasticprojection range includes the estimates under the low-cost and high-costalternatives. For the remaining measure in the table (the first year costexceeds tax income), the 95-percent stochastic projection range includes theestimate under the high-cost alternative, but does not include the low-costestimate.
Table VI.E1.—Long-Range Estimates Relating to the Actuarial Status of the Combined OASDI Program
[Comparison of deterministic and stochastic results]
Traditionaldeterministic model Stochastic model
Interme-diate
Low-Cost
High-Cost
Median50th
percentile
80-percentconfidence interval
95-percentconfidence interval
10thpercentile
90thpercentile
2.5thpercentile
97.5thpercentile
Actuarial balance . . . . . . -2.00 0.50 -5.32 -2.16 -3.32 -1.07 -3.98 -0.53Open group unfunded
obligation (in trillions) $5.3 -$1.8 $14.5 $5.7 $9.3 $2.7 $11.5 $1.2First year cost exceeds tax
income. . . . . . . . . . . . . 2016 2020 2013 2014 2010 2017 2009 2019First year assets become
exhausteda . . . . . . . . . .
a For some stochastic simulations, the first year in which trust fund assets become exhausted does not indi-cate a permanent exhaustion of assets.
2037 b
b The fund is not estimated to be exhausted within the projection period.
2029 2036 2032 2043 2030 2052Annual cost in 75th year
(percent of taxablepayroll) . . . . . . . . . . . . 17.68 12.48 25.70 17.93 14.64 22.30 13.29 25.05
Annual cost in 75th year (percent of GDP). . . . . 5.86 4.48 7.84 5.90 4.71 7.46 4.19 8.42

177
OASDI & HI: Percent of Payroll
F. ESTIMATES FOR OASDI AND HI, SEPARATE AND COMBINED
In this appendix, long-range actuarial estimates for the OASDI and HospitalInsurance (HI) programs are presented separately and on a combined basis.These estimates facilitate analysis of the adequacy of the income and assetsof these programs relative to their cost under current law. Estimates for theSupplementary Medical Insurance (SMI) program are not included in thisappendix because adequate financing is guaranteed in the law, and becausethe SMI program is not financed through a payroll tax.
The emphasis in this appendix on combined operations, while significant,should not obscure the analysis of the financial status of the individual trustfunds, which are legally separate and cannot be commingled. In addition, thefactors which determine the costs of the OASI, DI, and HI programs differsubstantially.
1. Estimates as a Percentage of Taxable Payroll
Comparing and combining cost and income rates for the OASDI and HI pro-grams as percentages of taxable payroll require a note of caution. The tax-able payrolls for the HI program are larger than those estimated for theOASDI program because (1) a larger maximum taxable amount was estab-lished for the HI program in 1991, with the maximum being eliminated alto-gether for the HI program in 1994, (2) a larger proportion of Federal, State,and local government employees have their wages covered under the HI pro-gram, and (3) the earnings of railroad workers are included directly in the HItaxable payroll but not in the OASDI taxable payroll (railroad contributionsfor the equivalent of OASDI benefits are accounted for in a net interchangethat occurs annually between the OASDI and Railroad Retirement pro-grams). As a result, the HI taxable payroll is about 25 percent larger than theOASDI taxable payroll throughout the long-range period. Nonetheless, com-bined OASDI and HI rates shown in this section are computed by adding theseparately derived rates for the programs. The resulting combined rates maybe interpreted as those applicable to the taxable payroll in the amount of theOASDI payroll, with the separate HI rates being additionally applicable tothe excess of the HI payroll over the OASDI payroll.
As with the OASI and DI Trust Funds, income to the HI Trust Fund comesprimarily from contributions paid by employees, employers, and self-employed persons. The combined OASDI and HI contribution rate foremployees and their employers is often referred to as the FICA tax, becauseit is authorized by the Federal Insurance Contributions Act. Contributionrates for the OASDI and HI programs are shown in table VI.F1.
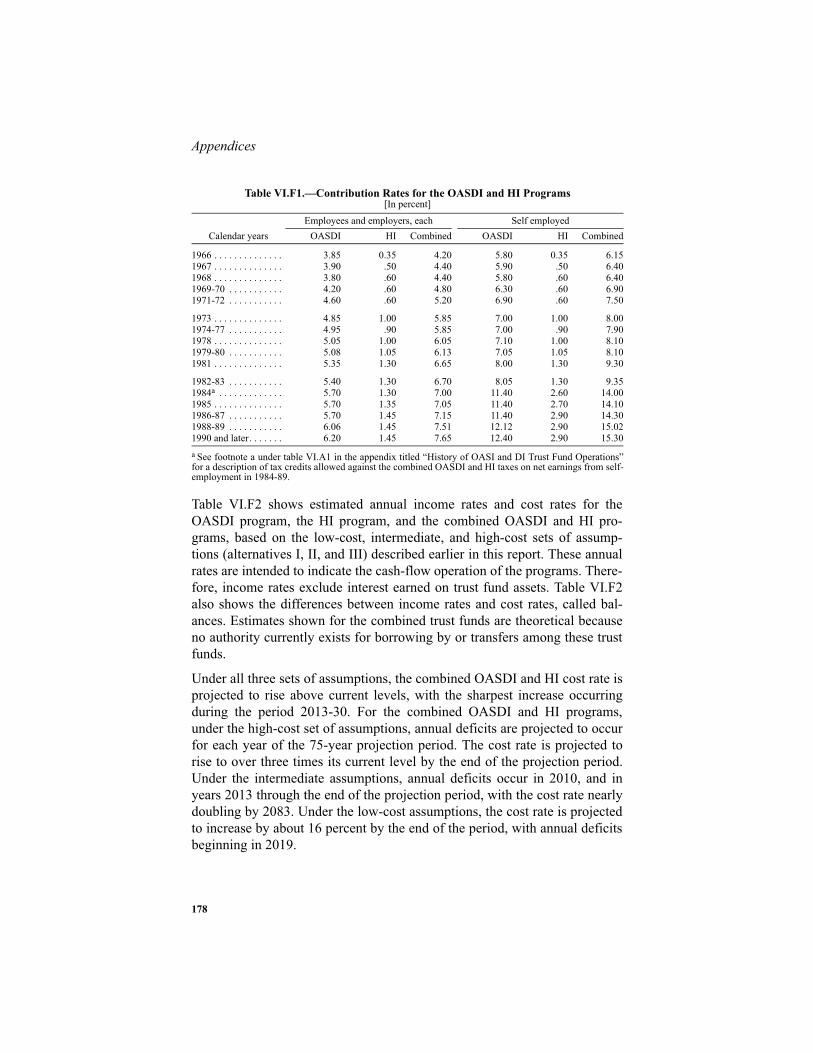
Appendices
178
Table VI.F2 shows estimated annual income rates and cost rates for theOASDI program, the HI program, and the combined OASDI and HI pro-grams, based on the low-cost, intermediate, and high-cost sets of assump-tions (alternatives I, II, and III) described earlier in this report. These annualrates are intended to indicate the cash-flow operation of the programs. There-fore, income rates exclude interest earned on trust fund assets. Table VI.F2also shows the differences between income rates and cost rates, called bal-ances. Estimates shown for the combined trust funds are theoretical becauseno authority currently exists for borrowing by or transfers among these trustfunds.
Under all three sets of assumptions, the combined OASDI and HI cost rate isprojected to rise above current levels, with the sharpest increase occurringduring the period 2013-30. For the combined OASDI and HI programs,under the high-cost set of assumptions, annual deficits are projected to occurfor each year of the 75-year projection period. The cost rate is projected torise to over three times its current level by the end of the projection period.Under the intermediate assumptions, annual deficits occur in 2010, and inyears 2013 through the end of the projection period, with the cost rate nearlydoubling by 2083. Under the low-cost assumptions, the cost rate is projectedto increase by about 16 percent by the end of the period, with annual deficitsbeginning in 2019.
Table VI.F1.—Contribution Rates for the OASDI and HI Programs[In percent]
Calendar yearsEmployees and employers, each Self employed
OASDI HI Combined OASDI HI Combined
1966 . . . . . . . . . . . . . . 3.85 0.35 4.20 5.80 0.35 6.151967 . . . . . . . . . . . . . . 3.90 .50 4.40 5.90 .50 6.401968 . . . . . . . . . . . . . . 3.80 .60 4.40 5.80 .60 6.401969-70 . . . . . . . . . . . 4.20 .60 4.80 6.30 .60 6.901971-72 . . . . . . . . . . . 4.60 .60 5.20 6.90 .60 7.50
1973 . . . . . . . . . . . . . . 4.85 1.00 5.85 7.00 1.00 8.001974-77 . . . . . . . . . . . 4.95 .90 5.85 7.00 .90 7.901978 . . . . . . . . . . . . . . 5.05 1.00 6.05 7.10 1.00 8.101979-80 . . . . . . . . . . . 5.08 1.05 6.13 7.05 1.05 8.101981 . . . . . . . . . . . . . . 5.35 1.30 6.65 8.00 1.30 9.30
1982-83 . . . . . . . . . . . 5.40 1.30 6.70 8.05 1.30 9.351984a . . . . . . . . . . . . .
a See footnote a under table VI.A1 in the appendix titled “History of OASI and DI Trust Fund Operations”for a description of tax credits allowed against the combined OASDI and HI taxes on net earnings from self-employment in 1984-89.
5.70 1.30 7.00 11.40 2.60 14.001985 . . . . . . . . . . . . . . 5.70 1.35 7.05 11.40 2.70 14.101986-87 . . . . . . . . . . . 5.70 1.45 7.15 11.40 2.90 14.301988-89 . . . . . . . . . . . 6.06 1.45 7.51 12.12 2.90 15.021990 and later. . . . . . . 6.20 1.45 7.65 12.40 2.90 15.30

179
OASDI & HI: Percent of Payroll
Table VI.F2.—OASDI and HI Annual Income Rates, Cost Rates, and Balances,Calendar Years 2009-85
[As a percentage of taxable payrolla]
Calendar year
OASDI HI CombinedIncome
rateCostrate Balance
Incomerate
Costrate Balance
Incomerate
Costrate Balance
Intermediate:2009 . . . . . . 12.83 12.35 0.48 3.13 3.57 -0.44 15.97 15.93 0.042010 . . . . . . 12.87 12.50 .37 3.16 3.57 -.41 16.03 16.07 -.042011 . . . . . . 12.87 12.37 .50 3.15 3.59 -.45 16.02 15.97 .052012 . . . . . . 12.87 12.24 .63 3.15 3.65 -.50 16.02 15.88 .142013 . . . . . . 12.90 12.38 .52 3.17 3.74 -.57 16.07 16.12 -.052014 . . . . . . 12.92 12.62 .30 3.18 3.88 -.70 16.10 16.50 -.412015 . . . . . . 12.94 12.88 .06 3.19 3.81 -.62 16.13 16.69 -.562016 . . . . . . 12.96 13.18 -.22 3.21 3.90 -.69 16.17 17.08 -.912017 . . . . . . 12.98 13.49 -.51 3.22 4.00 -.78 16.21 17.50 -1.292018 . . . . . . 13.00 13.83 -.83 3.23 4.12 -.88 16.23 17.95 -1.71
2020 . . . . . . 13.04 14.50 -1.46 3.26 4.37 -1.10 16.31 18.87 -2.562025 . . . . . . 13.13 15.86 -2.73 3.33 5.13 -1.80 16.46 20.99 -4.532030 . . . . . . 13.20 16.76 -3.56 3.38 6.00 -2.62 16.58 22.76 -6.182035 . . . . . . 13.24 17.10 -3.86 3.42 6.87 -3.46 16.65 23.97 -7.322040 . . . . . . 13.25 16.99 -3.74 3.43 7.64 -4.21 16.68 24.63 -7.952045 . . . . . . 13.25 16.75 -3.50 3.44 8.24 -4.81 16.68 24.99 -8.312050 . . . . . . 13.25 16.61 -3.36 3.44 8.74 -5.30 16.69 25.34 -8.652055 . . . . . . 13.26 16.62 -3.36 3.45 9.20 -5.75 16.71 25.81 -9.102060 . . . . . . 13.27 16.73 -3.45 3.46 9.71 -6.24 16.73 26.43 -9.702065 . . . . . . 13.28 16.86 -3.57 3.47 10.25 -6.78 16.76 27.11 -10.352070 . . . . . . 13.30 17.05 -3.75 3.49 10.81 -7.32 16.78 27.86 -11.072075 . . . . . . 13.32 17.27 -3.96 3.50 11.34 -7.84 16.81 28.62 -11.802080 . . . . . . 13.33 17.53 -4.19 3.51 11.81 -8.30 16.84 29.34 -12.492085 . . . . . . 13.35 17.78 -4.43 3.52 12.24 -8.72 16.87 30.02 -13.15
Low-cost:2009 . . . . . . 12.83 12.19 .64 3.13 3.44 -.31 15.96 15.63 .332010 . . . . . . 12.86 12.25 .61 3.16 3.37 -.22 16.02 15.62 .392011 . . . . . . 12.86 12.07 .79 3.14 3.33 -.19 16.00 15.40 .602012 . . . . . . 12.86 11.90 .96 3.14 3.32 -.17 16.00 15.21 .792013 . . . . . . 12.88 11.70 1.17 3.16 3.34 -.18 16.03 15.04 .992014 . . . . . . 12.89 11.86 1.03 3.17 3.42 -.25 16.06 15.28 .782015 . . . . . . 12.91 12.03 .88 3.18 3.28 -.10 16.09 15.31 .782016 . . . . . . 12.92 12.21 .71 3.19 3.29 -.10 16.11 15.50 .622017 . . . . . . 12.94 12.41 .53 3.20 3.31 -.11 16.14 15.71 .432018 . . . . . . 12.95 12.61 .34 3.21 3.34 -.13 16.16 15.94 .22
2020 . . . . . . 12.98 13.09 -.11 3.24 3.41 -.17 16.22 16.50 -.282025 . . . . . . 13.05 14.04 -1.00 3.29 3.65 -.36 16.34 17.69 -1.352030 . . . . . . 13.10 14.59 -1.49 3.33 3.88 -.55 16.42 18.46 -2.042035 . . . . . . 13.12 14.60 -1.48 3.34 4.02 -.68 16.46 18.62 -2.162040 . . . . . . 13.11 14.20 -1.09 3.35 4.11 -.76 16.46 18.31 -1.852045 . . . . . . 13.09 13.71 -.62 3.34 4.16 -.82 16.44 17.87 -1.432050 . . . . . . 13.08 13.34 -.25 3.34 4.23 -.89 16.42 17.56 -1.142055 . . . . . . 13.08 13.10 -.02 3.34 4.36 -1.02 16.42 17.45 -1.032060 . . . . . . 13.08 12.93 .14 3.34 4.58 -1.24 16.42 17.52 -1.102065 . . . . . . 13.07 12.76 .32 3.34 4.84 -1.50 16.41 17.60 -1.182070 . . . . . . 13.07 12.60 .47 3.34 5.11 -1.77 16.41 17.70 -1.302075 . . . . . . 13.06 12.49 .58 3.34 5.36 -2.02 16.40 17.84 -1.442080 . . . . . . 13.06 12.46 .60 3.34 5.58 -2.24 16.40 18.04 -1.632085 . . . . . . 13.07 12.51 .55 3.35 5.78 -2.43 16.41 18.30 -1.88
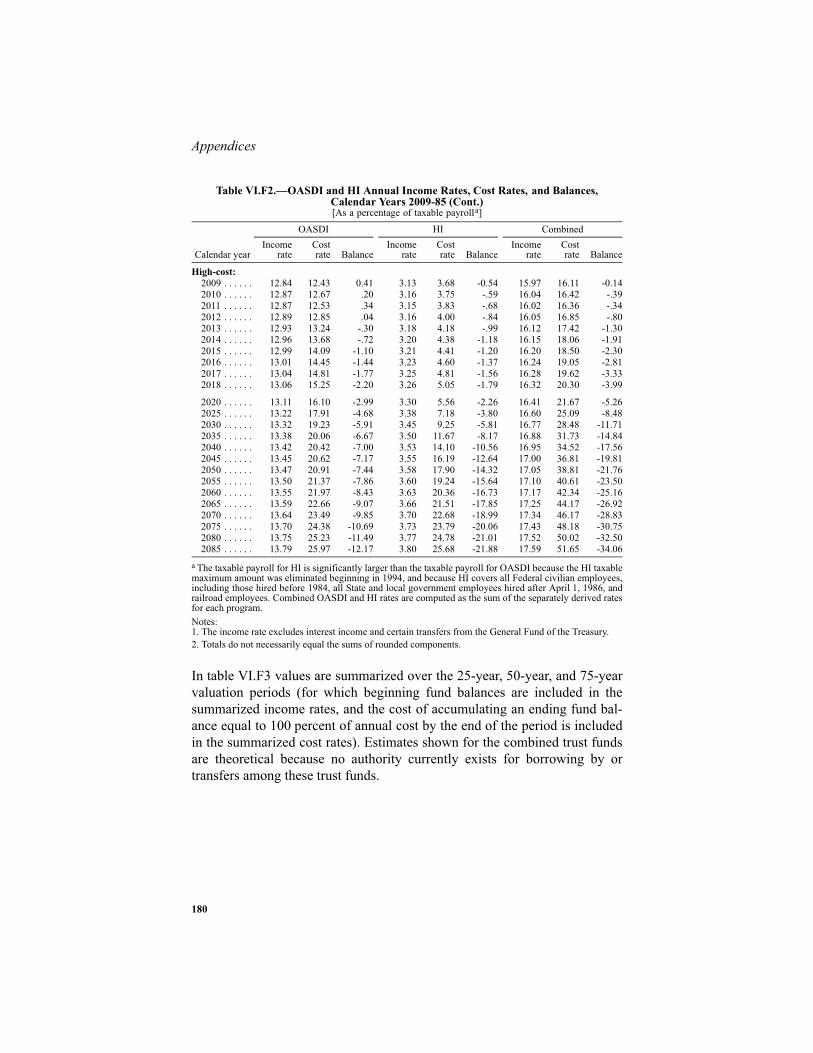
Appendices
180
Notes:1. The income rate excludes interest income and certain transfers from the General Fund of the Treasury.2. Totals do not necessarily equal the sums of rounded components.
In table VI.F3 values are summarized over the 25-year, 50-year, and 75-yearvaluation periods (for which beginning fund balances are included in thesummarized income rates, and the cost of accumulating an ending fund bal-ance equal to 100 percent of annual cost by the end of the period is includedin the summarized cost rates). Estimates shown for the combined trust fundsare theoretical because no authority currently exists for borrowing by ortransfers among these trust funds.
High-cost:2009 . . . . . . 12.84 12.43 0.41 3.13 3.68 -0.54 15.97 16.11 -0.142010 . . . . . . 12.87 12.67 .20 3.16 3.75 -.59 16.04 16.42 -.392011 . . . . . . 12.87 12.53 .34 3.15 3.83 -.68 16.02 16.36 -.342012 . . . . . . 12.89 12.85 .04 3.16 4.00 -.84 16.05 16.85 -.802013 . . . . . . 12.93 13.24 -.30 3.18 4.18 -.99 16.12 17.42 -1.302014 . . . . . . 12.96 13.68 -.72 3.20 4.38 -1.18 16.15 18.06 -1.912015 . . . . . . 12.99 14.09 -1.10 3.21 4.41 -1.20 16.20 18.50 -2.302016 . . . . . . 13.01 14.45 -1.44 3.23 4.60 -1.37 16.24 19.05 -2.812017 . . . . . . 13.04 14.81 -1.77 3.25 4.81 -1.56 16.28 19.62 -3.332018 . . . . . . 13.06 15.25 -2.20 3.26 5.05 -1.79 16.32 20.30 -3.99
2020 . . . . . . 13.11 16.10 -2.99 3.30 5.56 -2.26 16.41 21.67 -5.262025 . . . . . . 13.22 17.91 -4.68 3.38 7.18 -3.80 16.60 25.09 -8.482030 . . . . . . 13.32 19.23 -5.91 3.45 9.25 -5.81 16.77 28.48 -11.712035 . . . . . . 13.38 20.06 -6.67 3.50 11.67 -8.17 16.88 31.73 -14.842040 . . . . . . 13.42 20.42 -7.00 3.53 14.10 -10.56 16.95 34.52 -17.562045 . . . . . . 13.45 20.62 -7.17 3.55 16.19 -12.64 17.00 36.81 -19.812050 . . . . . . 13.47 20.91 -7.44 3.58 17.90 -14.32 17.05 38.81 -21.762055 . . . . . . 13.50 21.37 -7.86 3.60 19.24 -15.64 17.10 40.61 -23.502060 . . . . . . 13.55 21.97 -8.43 3.63 20.36 -16.73 17.17 42.34 -25.162065 . . . . . . 13.59 22.66 -9.07 3.66 21.51 -17.85 17.25 44.17 -26.922070 . . . . . . 13.64 23.49 -9.85 3.70 22.68 -18.99 17.34 46.17 -28.832075 . . . . . . 13.70 24.38 -10.69 3.73 23.79 -20.06 17.43 48.18 -30.752080 . . . . . . 13.75 25.23 -11.49 3.77 24.78 -21.01 17.52 50.02 -32.502085 . . . . . . 13.79 25.97 -12.17 3.80 25.68 -21.88 17.59 51.65 -34.06
a The taxable payroll for HI is significantly larger than the taxable payroll for OASDI because the HI taxablemaximum amount was eliminated beginning in 1994, and because HI covers all Federal civilian employees,including those hired before 1984, all State and local government employees hired after April 1, 1986, andrailroad employees. Combined OASDI and HI rates are computed as the sum of the separately derived ratesfor each program.
Table VI.F2.—OASDI and HI Annual Income Rates, Cost Rates, and Balances,Calendar Years 2009-85 (Cont.)[As a percentage of taxable payrolla]
Calendar year
OASDI HI CombinedIncome
rateCostrate Balance
Incomerate
Costrate Balance
Incomerate
Costrate Balance

181
OASDI & HI: Percent of Payroll
Note: Totals do not necessarily equal the sums of rounded components.
Under the high-cost assumptions, the combined OASDI and HI system isprojected to experience large actuarial deficits for the 25-year, 50-year, and75-year valuation periods. Under the intermediate assumptions, actuarial def-icits smaller than those for the high-cost assumptions are projected for allthree valuation periods. Under the low-cost assumptions, the combinedOASDI and HI system is projected to have a positive actuarial balance forthe 25-year valuation period, a negligible balance (between -0.005 and 0.005percent of taxable payroll) for the 50-year valuation period, and a negativeactuarial balance for the 75-year valuation period.
Table VI.F3.—Summarized OASDI and HI Income Rates and Cost Rates for Valuation Periods,a Calendar Years 2009-83
[As a percentage of taxable payrollb]
a Income rates include beginning trust fund balances and cost rates include the cost of reaching an endingfund target equal to 100 percent of annual cost by the end of the period.b The taxable payroll for HI is significantly larger than the taxable payroll for OASDI because the HI taxablemaximum amount was eliminated beginning 1994, and because HI covers all Federal civilian employees,including those hired before 1984, all State and local government employees hired after April 1, 1986, andrailroad employees. Combined OASDI and HI rates are computed as the sum of the separately derived ratesfor each program.
Valuationperiod
OASDI HI CombinedIncome
rate Cost
rateActuarial
balanceIncome
rate Cost
rateActuarial
balanceIncome
rate Cost
rateActuarial
balance
Intermediate:25-years:
2009-33 . . . . . . 14.96 15.14 -0.17 3.47 4.88 -1.40 18.43 20.02 -1.5850-years:
2009-58 . . . . . . 14.24 15.75 -1.51 3.46 6.29 -2.83 17.70 22.04 -4.3475-years:
2009-83 . . . . . . 14.02 16.02 -2.00 3.46 7.34 -3.88 17.48 23.36 -5.88
Low-cost:25-years:
2009-33 . . . . . . 14.89 13.71 1.18 3.44 3.67 -.23 18.33 17.38 .9550-years:
2009-58 . . . . . . 14.12 13.64 .48 3.40 3.88 -.48 17.52 17.52 c
c Between -0.005 and 0.005 percent of taxable payroll.
75-years:2009-83 . . . . . . 13.86 13.35 .50 3.38 4.19 -.81 17.24 17.54 -.31
High-cost:25-years:
2009-33 . . . . . . 15.02 16.83 -1.81 3.51 6.58 -3.07 18.53 23.41 -4.8850-years:
2009-58 . . . . . . 14.34 18.39 -4.05 3.53 10.62 -7.09 17.87 29.01 -11.1475-years:
2009-83 . . . . . . 14.18 19.51 -5.32 3.57 13.31 -9.74 17.75 32.82 -15.06
Appendices
182
2. Estimates as a Percentage of Gross Domestic Product
This section presents long-range projections of the operations of the com-bined Old-Age and Survivors Insurance and Disability Insurance (OASI andDI) Trust Funds and of the Hospital Insurance (HI) Trust Fund expressed as apercentage of gross domestic product (GDP). While expressing these fundoperations as a percentage of taxable payroll is the most useful approach forassessing the financial status of the programs (see table IV.B1 and sectionIV.B.1), analyzing them as a percentage of GDP provides an additional per-spective on these fund operations in relation to the total value of goods andservices produced in the United States.
Table VI.F4 shows estimated income excluding interest, total cost, and theresulting balance of the combined OASI and DI Trust Funds, of the HI TrustFund, and of the combined OASI, DI, and HI Trust Funds, expressed as per-centages of GDP on the basis of each of the three alternative sets of assump-tions. The estimated GDP on which these percentages are based is alsoshown in table VI.F4. For OASDI, income excluding interest consists of pay-roll-tax contributions, proceeds from taxation of benefits, and various reim-bursements from the General Fund of the Treasury. Total cost consists ofbenefit payments, administrative expenses, net transfers from the trust fundsto the Railroad Retirement program, and payments for vocational rehabilita-tion services for disabled beneficiaries. For HI, income excluding interestconsists of payroll-tax contributions (including contributions from railroademployment) and proceeds from taxation of OASDI benefits. Total cost con-sists of outlays (benefits and administrative expenses) for insured beneficia-ries. Both the HI income and cost are on an incurred basis.
The OASDI annual balance (income excluding interest, less cost) as a per-centage of GDP is projected to be positive on the basis of the low-costassumptions until 2020. After 2019, deficits increase to a peak in 2032 anddecrease thereafter. By 2057, the OASDI balance becomes positive, reaching0.20 percent of GDP in 2083. The OASDI balance is projected to be positivethrough 2015 on the basis of the intermediate assumptions and negativethereafter. Annual deficits increase from 2016 through 2035, decrease from2036 through 2053, and then increase thereafter. On the basis of the high-cost assumptions, the OASDI balance is projected to be positive through2012, after which time balances become permanently negative, with increas-ing deficits thereafter. The HI balance is projected to be negative in the firstprojection year under all three sets of assumptions, with deficits generallyincreasing steadily thereafter, though to different degrees, under each set ofassumptions.

183
OASDI & HI: Percent of GDP
The combined OASDI and HI balance as a percentage of GDP is projected tobe positive through 2018 under the low-cost assumptions, but negativethroughout the projection period under the intermediate and high-costassumptions. Between 2013 and about 2035, under all three sets of assump-tions, the combined OASDI and HI balance as a percentage of GDP is gener-ally projected to decline (or deficits increase) substantially because the baby-boom generation reaches retirement eligibility age during these years. After2035, annual deficits increase fairly steadily under the intermediate and high-cost assumptions, but decrease through 2054 and increase thereafter underthe low-cost assumptions.
By 2083, the combined OASDI and HI balances as percentages of GDP areprojected to range from a deficit of 0.85 percent for the low-cost assumptionsto a deficit of 12.03 percent for the high-cost assumptions. Projected bal-ances differ by a much smaller amount for the tenth year, 2018, ranging froma positive balance of 0.06 percent for the low-cost assumptions to a deficit of1.66 percent for the high-cost assumptions.
The summarized long-range (75-year) balance as a percentage of GDP forthe combined OASDI and HI programs varies among the three alternatives,by a relatively large amount (from a deficit of 0.18 percent, based on thelow-cost assumptions, to a deficit of 6.11 percent, based on the high-costassumptions). The 25-year summarized balance varies by a smaller amount(from a positive balance of 0.34 percent to a deficit of 2.08 percent). Summa-rized rates are calculated on the present-value basis including the trust fundbalances on January 1, 2009, and the cost of reaching a target trust fund levelequal to 100 percent of the following year’s annual cost at the end of theperiod. (See section IV.B.4 for further explanation.)
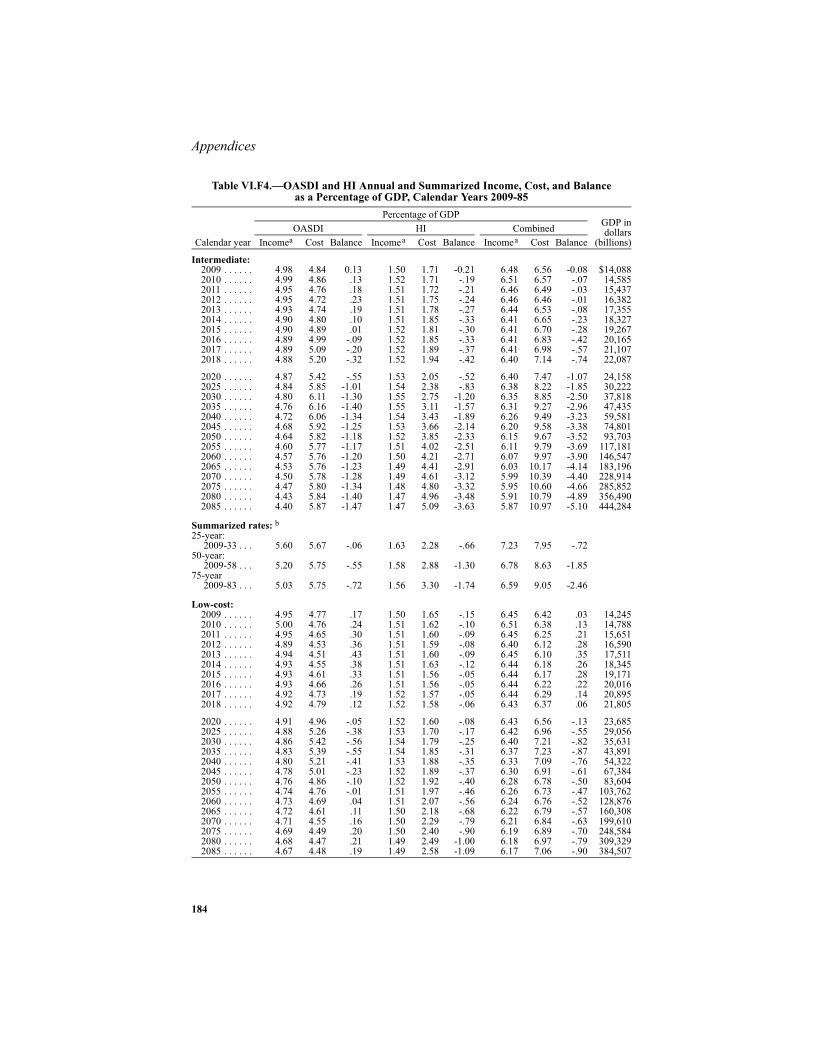
Appendices
184
Table VI.F4.—OASDI and HI Annual and Summarized Income, Cost, and Balanceas a Percentage of GDP, Calendar Years 2009-85
Calendar year
Percentage of GDPGDP indollars
(billions)OASDI HI Combined
Incomea Cost Balance Incomea Cost Balance Incomea Cost Balance
Intermediate:2009 . . . . . . 4.98 4.84 0.13 1.50 1.71 -0.21 6.48 6.56 -0.08 $14,0882010 . . . . . . 4.99 4.86 .13 1.52 1.71 -.19 6.51 6.57 -.07 14,5852011 . . . . . . 4.95 4.76 .18 1.51 1.72 -.21 6.46 6.49 -.03 15,4372012 . . . . . . 4.95 4.72 .23 1.51 1.75 -.24 6.46 6.46 -.01 16,3822013 . . . . . . 4.93 4.74 .19 1.51 1.78 -.27 6.44 6.53 -.08 17,3552014 . . . . . . 4.90 4.80 .10 1.51 1.85 -.33 6.41 6.65 -.23 18,3272015 . . . . . . 4.90 4.89 .01 1.52 1.81 -.30 6.41 6.70 -.28 19,2672016 . . . . . . 4.89 4.99 -.09 1.52 1.85 -.33 6.41 6.83 -.42 20,1652017 . . . . . . 4.89 5.09 -.20 1.52 1.89 -.37 6.41 6.98 -.57 21,1072018 . . . . . . 4.88 5.20 -.32 1.52 1.94 -.42 6.40 7.14 -.74 22,087
2020 . . . . . . 4.87 5.42 -.55 1.53 2.05 -.52 6.40 7.47 -1.07 24,1582025 . . . . . . 4.84 5.85 -1.01 1.54 2.38 -.83 6.38 8.22 -1.85 30,2222030 . . . . . . 4.80 6.11 -1.30 1.55 2.75 -1.20 6.35 8.85 -2.50 37,8182035 . . . . . . 4.76 6.16 -1.40 1.55 3.11 -1.57 6.31 9.27 -2.96 47,4352040 . . . . . . 4.72 6.06 -1.34 1.54 3.43 -1.89 6.26 9.49 -3.23 59,5812045 . . . . . . 4.68 5.92 -1.25 1.53 3.66 -2.14 6.20 9.58 -3.38 74,8012050 . . . . . . 4.64 5.82 -1.18 1.52 3.85 -2.33 6.15 9.67 -3.52 93,7032055 . . . . . . 4.60 5.77 -1.17 1.51 4.02 -2.51 6.11 9.79 -3.69 117,1812060 . . . . . . 4.57 5.76 -1.20 1.50 4.21 -2.71 6.07 9.97 -3.90 146,5472065 . . . . . . 4.53 5.76 -1.23 1.49 4.41 -2.91 6.03 10.17 -4.14 183,1962070 . . . . . . 4.50 5.78 -1.28 1.49 4.61 -3.12 5.99 10.39 -4.40 228,9142075 . . . . . . 4.47 5.80 -1.34 1.48 4.80 -3.32 5.95 10.60 -4.66 285,8522080 . . . . . . 4.43 5.84 -1.40 1.47 4.96 -3.48 5.91 10.79 -4.89 356,4902085 . . . . . . 4.40 5.87 -1.47 1.47 5.09 -3.63 5.87 10.97 -5.10 444,284
Summarized rates: b25-year:
2009-33 . . . 5.60 5.67 -.06 1.63 2.28 -.66 7.23 7.95 -.7250-year:
2009-58 . . . 5.20 5.75 -.55 1.58 2.88 -1.30 6.78 8.63 -1.8575-year
2009-83 . . . 5.03 5.75 -.72 1.56 3.30 -1.74 6.59 9.05 -2.46
Low-cost:2009 . . . . . . 4.95 4.77 .17 1.50 1.65 -.15 6.45 6.42 .03 14,2452010 . . . . . . 5.00 4.76 .24 1.51 1.62 -.10 6.51 6.38 .13 14,7882011 . . . . . . 4.95 4.65 .30 1.51 1.60 -.09 6.45 6.25 .21 15,6512012 . . . . . . 4.89 4.53 .36 1.51 1.59 -.08 6.40 6.12 .28 16,5902013 . . . . . . 4.94 4.51 .43 1.51 1.60 -.09 6.45 6.10 .35 17,5112014 . . . . . . 4.93 4.55 .38 1.51 1.63 -.12 6.44 6.18 .26 18,3452015 . . . . . . 4.93 4.61 .33 1.51 1.56 -.05 6.44 6.17 .28 19,1712016 . . . . . . 4.93 4.66 .26 1.51 1.56 -.05 6.44 6.22 .22 20,0162017 . . . . . . 4.92 4.73 .19 1.52 1.57 -.05 6.44 6.29 .14 20,8952018 . . . . . . 4.92 4.79 .12 1.52 1.58 -.06 6.43 6.37 .06 21,805
2020 . . . . . . 4.91 4.96 -.05 1.52 1.60 -.08 6.43 6.56 -.13 23,6852025 . . . . . . 4.88 5.26 -.38 1.53 1.70 -.17 6.42 6.96 -.55 29,0562030 . . . . . . 4.86 5.42 -.56 1.54 1.79 -.25 6.40 7.21 -.82 35,6312035 . . . . . . 4.83 5.39 -.55 1.54 1.85 -.31 6.37 7.23 -.87 43,8912040 . . . . . . 4.80 5.21 -.41 1.53 1.88 -.35 6.33 7.09 -.76 54,3222045 . . . . . . 4.78 5.01 -.23 1.52 1.89 -.37 6.30 6.91 -.61 67,3842050 . . . . . . 4.76 4.86 -.10 1.52 1.92 -.40 6.28 6.78 -.50 83,6042055 . . . . . . 4.74 4.76 -.01 1.51 1.97 -.46 6.26 6.73 -.47 103,7622060 . . . . . . 4.73 4.69 .04 1.51 2.07 -.56 6.24 6.76 -.52 128,8762065 . . . . . . 4.72 4.61 .11 1.50 2.18 -.68 6.22 6.79 -.57 160,3082070 . . . . . . 4.71 4.55 .16 1.50 2.29 -.79 6.21 6.84 -.63 199,6102075 . . . . . . 4.69 4.49 .20 1.50 2.40 -.90 6.19 6.89 -.70 248,5842080 . . . . . . 4.68 4.47 .21 1.49 2.49 -1.00 6.18 6.97 -.79 309,3292085 . . . . . . 4.67 4.48 .19 1.49 2.58 -1.09 6.17 7.06 -.90 384,507

185
OASDI & HI: Percent of GDP
Note: Totals do not necessarily equal the sums of rounded components.
The difference between trust fund operations expressed as percentages oftaxable payroll and those expressed as percentages of GDP can be under-stood by analyzing the estimated ratios of OASDI taxable payroll to GDP,which are presented in table VI.F5. HI taxable payroll is about 25 percentlarger than the OASDI taxable payroll throughout the long-range period (seeAppendix VI.F.1 for a detailed description of the difference). The cost as a
Low-cost (cont.):
Summarized rates: b25-year:
2009-33 . . . 5.64 5.19 0.45 1.62 1.73 -0.11 7.26 6.92 0.3450-year:
2009-58 . . . 5.27 5.09 .18 1.58 1.80 -.22 6.85 6.89 -.0475-year
2009-83 . . . 5.13 4.94 .19 1.56 1.93 -.37 6.69 6.87 -.18
High-cost:2009 . . . . . . 4.98 4.87 .11 1.50 1.77 -.26 6.49 6.64 -.15 $14,0522010 . . . . . . 4.98 4.93 .05 1.52 1.80 -.28 6.50 6.72 -.23 14,5052011 . . . . . . 4.97 4.85 .12 1.51 1.84 -.33 6.48 6.69 -.21 15,3452012 . . . . . . 4.96 4.95 .01 1.51 1.91 -.40 6.47 6.86 -.39 16,0262013 . . . . . . 4.92 5.05 -.13 1.51 1.99 -.47 6.43 7.03 -.60 17,0972014 . . . . . . 4.84 5.12 -.29 1.51 2.07 -.56 6.35 7.19 -.84 18,6162015 . . . . . . 4.82 5.25 -.42 1.52 2.08 -.57 6.34 7.33 -.99 19,9772016 . . . . . . 4.82 5.37 -.55 1.52 2.17 -.65 6.34 7.54 -1.19 21,2042017 . . . . . . 4.82 5.49 -.67 1.52 2.26 -.73 6.34 7.75 -1.40 22,3812018 . . . . . . 4.81 5.64 -.82 1.53 2.36 -.84 6.34 8.00 -1.66 23,490
2020 . . . . . . 4.80 5.91 -1.11 1.53 2.59 -1.05 6.34 8.50 -2.16 25,8762025 . . . . . . 4.77 6.47 -1.70 1.55 3.29 -1.74 6.31 9.75 -3.44 33,0262030 . . . . . . 4.72 6.83 -2.11 1.55 4.17 -2.62 6.28 11.01 -4.73 42,1882035 . . . . . . 4.68 7.02 -2.35 1.56 5.19 -3.63 6.23 12.21 -5.98 53,8782040 . . . . . . 4.62 7.05 -2.42 1.55 6.18 -4.63 6.17 13.23 -7.05 68,6662045 . . . . . . 4.57 7.02 -2.45 1.54 7.00 -5.46 6.11 14.02 -7.91 87,2032050 . . . . . . 4.51 7.02 -2.51 1.53 7.63 -6.11 6.04 14.66 -8.62 110,1682055 . . . . . . 4.46 7.07 -2.61 1.52 8.10 -6.58 5.98 15.17 -9.19 138,6762060 . . . . . . 4.41 7.17 -2.76 1.51 8.45 -6.95 5.92 15.62 -9.71 174,2182065 . . . . . . 4.36 7.29 -2.93 1.50 8.81 -7.31 5.86 16.09 -10.23 218,4162070 . . . . . . 4.32 7.45 -3.13 1.49 9.16 -7.67 5.81 16.60 -10.80 273,1932075 . . . . . . 4.27 7.62 -3.35 1.49 9.48 -7.99 5.76 17.09 -11.33 341,0652080 . . . . . . 4.22 7.77 -3.54 1.48 9.73 -8.25 5.70 17.50 -11.79 425,0142085 . . . . . . 4.18 7.88 -3.70 1.47 9.94 -8.47 5.65 17.82 -12.17 529,364
Summarized rates: b25-year:
2009-33 . . . 5.53 6.19 -.67 1.63 3.05 -1.42 7.16 9.24 -2.0850-year:
2009-58 . . . 5.10 6.54 -1.44 1.59 4.78 -3.19 6.69 11.32 -4.6375-year
2009-83 . . . 4.91 6.75 -1.84 1.57 5.84 -4.27 6.48 12.59 -6.11a Income for individual years excludes interest on the trust funds. Interest is implicitly reflected in all summa-rized values.b Summarized rates are calculated on the present-value basis including the value of the trust funds onJanuary 1, 2009, and the cost of reaching a target trust fund level equal to 100 percent of annual cost at the endof the period.
Table VI.F4.—OASDI and HI Annual and Summarized Income, Cost, and Balanceas a Percentage of GDP, Calendar Years 2009-85 (Cont.)
Calendar year
Percentage of GDPGDP indollars
(billions)OASDI HI Combined
Incomea Cost Balance Incomea Cost Balance Incomea Cost Balance

Appendices
186
percentage of GDP is equal to the cost as a percentage of taxable payrollmultiplied by the ratio of taxable payroll to GDP.
Projections of GDP are based on the projected increases in U.S. employment,labor productivity, average hours worked, and the GDP implicit price defla-tor. Projections of taxable payroll reflect the projected growth in GDP, alongwith assumed changes in the ratio of worker compensation to GDP, the ratioof earnings to worker compensation, the ratio of OASDI covered earnings tototal earnings, and the ratio of taxable to total covered earnings.
Over the long-range period, projected growth in taxable payroll differs fromprojected growth in GDP primarily due to the assumed trend in the ratio ofwages to total employee compensation—i.e., wages plus fringe benefits. Theratio of earnings to total worker compensation declined at an average annualrate of 0.23 percent for the 40 years from 1967 to 2007. For the 10-year peri-ods 1967-77, 1977-87, 1987-97, and 1997-2007, the average annual rates ofchange were -0.63, -0.19, 0.09 and -0.16 percent, respectively. Ultimatefuture annual rates of decline in the ratio of wages to employee compensa-tion are assumed to be 0.1, 0.2, and 0.3 percent for the low-cost, intermedi-ate, and high-cost assumptions, respectively. An additional factor that hasmade the overall ratio of taxable payroll to GDP decline in recent years is thedecline in the ratio of taxable wages to covered wages, as a result of the rela-tively greater increases in wages for persons earning above the contributionand benefit base. This decline in the taxable ratio is assumed to continue at aslower pace through 2018, with no further decline thereafter.
Table VI.F5.—Ratio of OASDI Taxable Payroll to GDP, Calendar Years 2009-85 Calendar year Intermediate Low-cost High-cost
2009 . . . . . . . . . . . . . . . . . . . . . . . . . 0.392 0.392 0.3922010 . . . . . . . . . . . . . . . . . . . . . . . . . .389 .389 .3892011 . . . . . . . . . . . . . . . . . . . . . . . . . .385 .385 .3872012 . . . . . . . . . . . . . . . . . . . . . . . . . .385 .381 .3852013 . . . . . . . . . . . . . . . . . . . . . . . . . .383 .385 .3812014 . . . . . . . . . . . . . . . . . . . . . . . . . .381 .384 .3752015 . . . . . . . . . . . . . . . . . . . . . . . . . .379 .383 .3722016 . . . . . . . . . . . . . . . . . . . . . . . . . .378 .382 .3722017 . . . . . . . . . . . . . . . . . . . . . . . . . .377 .381 .3712018 . . . . . . . . . . . . . . . . . . . . . . . . . .376 .380 .369
2020 . . . . . . . . . . . . . . . . . . . . . . . . . .374 .379 .3672025 . . . . . . . . . . . . . . . . . . . . . . . . . .369 .375 .3612030 . . . . . . . . . . . . . . . . . . . . . . . . . .364 .372 .3552035 . . . . . . . . . . . . . . . . . . . . . . . . . .360 .369 .3502040 . . . . . . . . . . . . . . . . . . . . . . . . . .357 .367 .3452045 . . . . . . . . . . . . . . . . . . . . . . . . . .354 .366 .3402050 . . . . . . . . . . . . . . . . . . . . . . . . . .350 .364 .3362055 . . . . . . . . . . . . . . . . . . . . . . . . . .347 .363 .3312060 . . . . . . . . . . . . . . . . . . . . . . . . . .345 .362 .3262065 . . . . . . . . . . . . . . . . . . . . . . . . . .342 .362 .3222070 . . . . . . . . . . . . . . . . . . . . . . . . . .339 .361 .3172075 . . . . . . . . . . . . . . . . . . . . . . . . . .336 .360 .3122080 . . . . . . . . . . . . . . . . . . . . . . . . . .333 .359 .3082085 . . . . . . . . . . . . . . . . . . . . . . . . . .330 .358 .303

187
OASDI & HI: Estimates in Dollars
3. Estimates in Dollars
This section presents long-range projections in dollars of the operations ofthe combined OASI and DI Trust Funds and in some cases the HI TrustFund. Meaningful comparison of current dollar values over long periods oftime can be difficult because of the effect of inflation. Some means ofremoving inflation is thus generally desirable. Several economic series orindices are provided to allow current dollars to be adjusted for changes inprices, wages, and certain other aspects of economic growth during the pro-jection period.
The selection of a particular index for adjustment of current dollars dependsupon the analyst’s decision as to which index provides the most useful stan-dard for adjusting dollar amounts, over time, to create values that are appro-priately comparable. Table VI.F6 presents five such indices for adjustment.Adjustment of any series of values is accomplished by dividing the value foreach year by the corresponding index values for the year. This adjustmentremoves the inflation in the index from the series of values.
One of the most common forms of standardization is based on some measureof change in the prices of consumer goods. One such price index is the Con-sumer Price Index for Urban Wage Earners and Clerical Workers (CPI-W,hereafter referred to as CPI), which is published by the Bureau of Labor Sta-tistics, Department of Labor. This is the index used to determine annualincreases in OASDI monthly benefits payable after the year of initial eligibil-ity. The CPI is assumed to increase ultimately at annual rates of 1.8, 2.8, and3.8 percent for the low-cost, intermediate, and high-cost sets of assumptions,respectively. Constant-dollar values (those calculated by dividing by theadjusted CPI in table VI.F6) indicate the relative purchasing power of thevalues over time. Constant-dollar values are provided in table VI.F7.
Another type of standardization combines the effects of price inflation andreal-wage growth. The wage index presented here is the national averagewage index, as defined in section 215(i)(1)(G) of the Social Security Act.This index is used to make annual adjustments to many earnings-relatedquantities embodied in the Social Security Act, such as the contribution andbenefit base. The average annual wage is assumed to increase ultimately by3.5, 3.9, and 4.3 percent under the low-cost, intermediate, and high-costassumptions, respectively. Wage-indexed values indicate the level of a seriesrelative to the standard-of-living of workers over time.
The taxable payroll index adjusts for the effects of changes in the number ofworkers and changes in the proportion of earnings that are taxable, as well as
Appendices
188
for the effects of price inflation and real-wage growth. The OASDI taxablepayroll consists of all earnings subject to OASDI taxation, adjusted for thelower effective tax rate on multiple-employer excess wages. Values adjustedby dividing by the taxable payroll indicate the percentage of payroll that eachvalue represents, and thus the extent to which the series of values increasesor decreases as a percent of payroll over time.
The GDP index adjusts for the growth in the aggregate amount of goods andservices produced in the United States. Values adjusted by GDP (see Appen-dix VI.F.2) indicate their relative share of the total output of the economy.No explicit assumptions are made about growth in taxable payroll or GDP.These series are computed reflecting the other more basic demographic andeconomic assumptions, as discussed in sections V.A and V.B, respectively.
Discounting at the rate of interest is another way of adjusting current dollars.The series of interest-rate factors included here is based on the average of theassumed annual interest rates for special public-debt obligations issuable tothe trust funds for each year. This series is slightly different from the interestrates used to create summarized values elsewhere in this report, where theactual yield on currently-held trust fund assets is used for each year. Ultimatenominal interest rates, which, in practice, are compounded semiannually, areassumed to be approximately 5.4, 5.7, and 5.9 percent for the low-cost, inter-mediate, and high-cost assumptions, respectively.

189
OASDI & HI: Estimates in Dollars
Table VI.F6.—Selected Economic Variables, Calendar Years 2008-85[GDP and taxable payroll in billions]
Calendar yearAdjusted
CPIa Average
wage indexbTaxablepayrollc
Grossdomestic
product
Compoundinterest-rate
factord
Intermediate:2008 . . . . . . . . . . . . . 101.03 $41,679.58 $5,493 $14,260 0.97092009 . . . . . . . . . . . . . 100.00 42,041.84 5,525 14,088 1.00002010 . . . . . . . . . . . . . 101.65 43,451.28 5,676 14,585 1.04032011 . . . . . . . . . . . . . 104.04 45,194.92 5,942 15,437 1.09332012 . . . . . . . . . . . . . 106.85 47,013.95 6,312 16,382 1.15612013 . . . . . . . . . . . . . 110.13 48,969.10 6,647 17,355 1.22682014 . . . . . . . . . . . . . 113.51 50,962.45 6,974 18,327 1.30102015 . . . . . . . . . . . . . 116.70 53,085.22 7,310 19,267 1.37602016 . . . . . . . . . . . . . 119.97 55,070.22 7,629 20,165 1.45432017 . . . . . . . . . . . . . 123.32 57,165.32 7,961 21,107 1.53732018 . . . . . . . . . . . . . 126.78 59,362.72 8,298 22,087 1.62632020 . . . . . . . . . . . . . 133.98 64,015.44 9,028 24,158 1.81982025 . . . . . . . . . . . . . 153.81 77,313.68 11,146 30,222 2.41032030 . . . . . . . . . . . . . 176.59 93,515.03 13,779 37,818 3.19232035 . . . . . . . . . . . . . 202.73 113,303.44 17,093 47,435 4.22812040 . . . . . . . . . . . . . 232.75 137,360.95 21,258 59,581 5.60002045 . . . . . . . . . . . . . 267.21 166,519.95 26,445 74,801 7.41712050 . . . . . . . . . . . . . 306.78 201,741.66 32,839 93,703 9.82372055 . . . . . . . . . . . . . 352.20 244,272.24 40,718 117,181 13.01122060 . . . . . . . . . . . . . 404.35 295,727.43 50,492 146,547 17.23302065 . . . . . . . . . . . . . 464.22 358,142.06 62,590 183,196 22.82462070 . . . . . . . . . . . . . 532.95 433,747.20 77,552 228,914 30.23052075 . . . . . . . . . . . . . 611.86 525,251.00 96,025 285,852 40.03952080 . . . . . . . . . . . . . 702.45 636,051.02 118,735 356,490 53.03112085 . . . . . . . . . . . . . 806.46 770,353.35 146,739 444,284 70.2381
Low-cost:2008 . . . . . . . . . . . . . 101.21 41,698.13 5,496 14,274 .96812009 . . . . . . . . . . . . . 100.00 42,276.96 5,577 14,245 1.00002010 . . . . . . . . . . . . . 101.26 43,659.88 5,750 14,788 1.03872011 . . . . . . . . . . . . . 102.70 45,301.16 6,029 15,651 1.08702012 . . . . . . . . . . . . . 104.45 46,961.47 6,321 16,590 1.14382013 . . . . . . . . . . . . . 106.62 48,656.14 6,742 17,511 1.20712014 . . . . . . . . . . . . . 108.82 50,243.82 7,036 18,345 1.27132015 . . . . . . . . . . . . . 110.79 52,029.44 7,343 19,171 1.33752016 . . . . . . . . . . . . . 112.78 53,791.01 7,646 20,016 1.40862017 . . . . . . . . . . . . . 114.81 55,658.55 7,962 20,895 1.48532018 . . . . . . . . . . . . . 116.88 57,642.09 8,289 21,805 1.56622020 . . . . . . . . . . . . . 121.13 61,700.55 8,967 23,685 1.74212025 . . . . . . . . . . . . . 132.43 73,074.23 10,892 29,056 2.27312030 . . . . . . . . . . . . . 144.78 86,621.69 13,242 35,631 2.96592035 . . . . . . . . . . . . . 158.29 102,798.62 16,198 43,891 3.86982040 . . . . . . . . . . . . . 173.06 122,108.41 19,941 54,322 5.04922045 . . . . . . . . . . . . . 189.20 145,111.83 24,635 67,384 6.58822050 . . . . . . . . . . . . . 206.86 172,415.87 30,466 83,604 8.59612055 . . . . . . . . . . . . . 226.16 204,880.30 37,708 103,762 11.21602060 . . . . . . . . . . . . . 247.26 243,538.16 46,717 128,876 14.63452065 . . . . . . . . . . . . . 270.32 289,575.63 57,974 160,308 19.09482070 . . . . . . . . . . . . . 295.55 344,303.73 72,021 199,610 24.91452075 . . . . . . . . . . . . . 323.12 409,331.60 89,482 248,584 32.50802080 . . . . . . . . . . . . . 353.27 486,548.41 111,075 309,329 42.41582085 . . . . . . . . . . . . . 386.23 578,362.07 137,741 384,507 55.3433

Appendices
190
Table VI.F7 shows estimated operations of the combined OASI and DI TrustFunds in constant 2009 dollars (i.e., adjusted by the CPI indexing series asdiscussed above). Items included in the table are: income excluding interest,interest income, total income, total cost, and assets at the end of the year.Income excluding interest consists of payroll-tax contributions, income fromtaxation of benefits, and miscellaneous reimbursements from the GeneralFund of the Treasury. Cost consists of benefit payments, administrativeexpenses, net transfers from the OASI and DI Trust Funds to the RailroadRetirement program under the financial-interchange provisions, and pay-ments for vocational rehabilitation services for disabled beneficiaries. Theseestimates are based on the low-cost, intermediate, and high-cost sets ofassumptions.
High-cost:2008 . . . . . . . . . . . . . 100.38 $41,672.33 $5,490 $14,252 0.96772009 . . . . . . . . . . . . . 100.00 42,100.53 5,511 14,052 1.00002010 . . . . . . . . . . . . . 102.21 43,502.26 5,638 14,505 1.04162011 . . . . . . . . . . . . . 104.79 45,273.05 5,938 15,345 1.09522012 . . . . . . . . . . . . . 109.29 46,607.81 6,176 16,026 1.15672013 . . . . . . . . . . . . . 115.82 49,339.09 6,521 17,097 1.24662014 . . . . . . . . . . . . . 122.56 52,785.62 6,972 18,616 1.35642015 . . . . . . . . . . . . . 128.31 56,005.14 7,441 19,977 1.45792016 . . . . . . . . . . . . . 133.37 58,775.40 7,880 21,204 1.55392017 . . . . . . . . . . . . . 138.43 61,324.49 8,297 22,381 1.65102018 . . . . . . . . . . . . . 143.70 63,781.41 8,678 23,490 1.74942020 . . . . . . . . . . . . . 154.82 69,266.04 9,496 25,876 1.96492025 . . . . . . . . . . . . . 186.56 85,325.34 11,925 33,026 2.62702030 . . . . . . . . . . . . . 224.81 105,333.13 14,997 42,188 3.51212035 . . . . . . . . . . . . . 270.89 130,312.17 18,869 53,878 4.69562040 . . . . . . . . . . . . . 326.43 161,272.36 23,706 68,666 6.27772045 . . . . . . . . . . . . . 393.34 199,485.10 29,687 87,203 8.39302050 . . . . . . . . . . . . . 473.98 246,504.19 36,984 110,168 11.22112055 . . . . . . . . . . . . . 571.14 304,157.52 45,902 138,676 15.00202060 . . . . . . . . . . . . . 688.23 375,060.42 56,850 174,218 20.05702065 . . . . . . . . . . . . . 829.31 462,499.14 70,253 218,416 26.81522070 . . . . . . . . . . . . . 999.32 570,425.72 86,602 273,193 35.85062075 . . . . . . . . . . . . . 1,204.18 703,463.63 106,544 341,065 47.93052080 . . . . . . . . . . . . . 1,451.04 867,652.91 130,823 425,014 64.08072085 . . . . . . . . . . . . . 1,748.50 1,070,658.02 160,580 529,364 85.6727
a The adjusted CPI is the CPI-W indexed to calendar year 2009.b The average wage index is used to automatically adjust the contribution and benefit base and other wage-indexed program amounts. (See “Average wage index” in the glossary.)c Taxable payroll consists of total earnings subject to OASDI contribution rates, adjusted to reflect the lowereffective contribution rates (compared to the combined employee-employer rate) that apply to multiple-employer “excess wages.”d The compound interest-rate factor is based on the average of the assumed annual interest rates for specialpublic-debt obligations issuable to the trust funds in the 12 months of the year, under each alternative.
Table VI.F6.—Selected Economic Variables, Calendar Years 2008-85 (Cont.)[GDP and taxable payroll in billions]
Calendar yearAdjusted
CPIa Average
wage indexbTaxablepayrollc
Grossdomestic
product
Compoundinterest-rate
factord

191
OASDI & HI: Estimates in Dollars
Note: Totals do not necessarily equal the sums of rounded components.
Table VI.F7.—Operations of the Combined OASI and DI Trust Funds,in Constant 2009 Dollars,a Calendar Years 2009-85
[In billions]
a The adjustment from current to constant dollars is by the adjusted CPI indexing series shown in tableVI.F6.
Calendar year
Incomeexcluding
interestInterestincome
Totalincome Cost
Assets atend of year
Intermediate:2009 . . . . . . . . . . . . . $701.3 $118.1 $819.4 $682.5 $2,555.52010 . . . . . . . . . . . . . 715.8 118.1 833.9 697.8 2,650.12011 . . . . . . . . . . . . . 733.9 121.5 855.4 706.6 2,738.22012 . . . . . . . . . . . . . 758.5 127.4 885.9 722.9 2,829.12013 . . . . . . . . . . . . . 776.8 134.7 911.5 747.0 2,909.22014 . . . . . . . . . . . . . 791.6 141.9 933.5 775.5 2,980.72015 . . . . . . . . . . . . . 808.5 147.7 956.2 806.6 3,049.02016 . . . . . . . . . . . . . 822.3 152.7 974.9 838.0 3,102.92017 . . . . . . . . . . . . . 836.3 157.5 993.9 871.1 3,141.22018 . . . . . . . . . . . . . 849.5 162.1 1,011.6 905.1 3,162.12020 . . . . . . . . . . . . . 877.4 168.0 1,045.4 976.9 3,146.42025 . . . . . . . . . . . . . 950.1 157.3 1,107.4 1,149.4 2,757.92030 . . . . . . . . . . . . . 1,028.3 109.1 1,137.4 1,307.8 1,833.22035b . . . . . . . . . . . .
b Estimates for later years are not shown because the combined OASI and DI Trust Funds are estimated tobecome exhausted in 2037 under the intermediate assumptions and in 2029 under the high-cost assumptions.
1,114.4 33.8 1,148.2 1,441.8 429.4Low-cost:
2009 . . . . . . . . . . . . . 704.9 118.9 823.8 680.1 2,562.42010 . . . . . . . . . . . . . 730.3 120.1 850.5 695.6 2,685.32011 . . . . . . . . . . . . . 753.7 124.0 877.8 708.4 2,816.92012 . . . . . . . . . . . . . 777.5 130.6 908.0 719.9 2,957.92013 . . . . . . . . . . . . . 811.2 139.2 950.4 740.1 3,108.12014 . . . . . . . . . . . . . 831.4 148.1 979.5 766.9 3,257.72015 . . . . . . . . . . . . . 853.4 156.0 1,009.4 797.0 3,412.32016 . . . . . . . . . . . . . 874.2 164.6 1,038.8 827.8 3,563.02017 . . . . . . . . . . . . . 895.5 174.3 1,069.9 860.4 3,709.52018 . . . . . . . . . . . . . 917.0 184.5 1,101.4 894.1 3,851.32020 . . . . . . . . . . . . . 959.7 204.3 1,164.0 969.0 4,109.32025 . . . . . . . . . . . . . 1,071.7 241.9 1,313.6 1,155.2 4,602.52030 . . . . . . . . . . . . . 1,196.1 256.2 1,452.3 1,334.1 4,847.52035 . . . . . . . . . . . . . 1,340.1 262.7 1,602.9 1,493.8 4,962.42040 . . . . . . . . . . . . . 1,508.2 271.8 1,780.0 1,636.8 5,145.72045 . . . . . . . . . . . . . 1,702.3 293.9 1,996.2 1,785.7 5,589.32050 . . . . . . . . . . . . . 1,923.9 332.9 2,256.8 1,964.2 6,360.02055 . . . . . . . . . . . . . 2,177.0 391.3 2,568.3 2,183.5 7,498.02060 . . . . . . . . . . . . . 2,466.4 469.7 2,936.2 2,443.8 9,018.82065 . . . . . . . . . . . . . 2,798.5 573.5 3,372.0 2,735.5 11,033.12070 . . . . . . . . . . . . . 3,178.7 710.0 3,888.7 3,069.9 13,682.32075 . . . . . . . . . . . . . 3,611.4 886.6 4,498.0 3,457.7 17,101.22080 . . . . . . . . . . . . . 4,100.6 1,108.7 5,209.3 3,917.2 21,391.72085 . . . . . . . . . . . . . 4,653.0 1,379.3 6,032.2 4,463.1 26,603.1
High-cost:2009 . . . . . . . . . . . . . 700.1 118.5 818.6 685.0 2,552.32010 . . . . . . . . . . . . . 706.8 118.4 825.2 699.0 2,623.42011 . . . . . . . . . . . . . 727.9 121.1 849.0 710.0 2,697.72012 . . . . . . . . . . . . . 727.8 123.9 851.7 726.3 2,712.12013 . . . . . . . . . . . . . 725.8 128.4 854.2 745.3 2,668.02014 . . . . . . . . . . . . . 735.0 138.2 873.2 778.4 2,616.02015 . . . . . . . . . . . . . 750.7 142.7 893.4 816.8 2,575.42016 . . . . . . . . . . . . . 766.4 143.7 910.2 853.6 2,534.42017 . . . . . . . . . . . . . 779.3 142.8 922.0 887.4 2,476.32018 . . . . . . . . . . . . . 787.0 140.4 927.3 921.2 2,391.72020 . . . . . . . . . . . . . 802.5 127.0 929.5 987.7 2,137.42025b . . . . . . . . . . . . 843.6 66.3 909.9 1,144.5 1,006.2

Appendices
192
Figure VI.F1 provides a comparison of annual cost with total annual income(including interest) and annual income excluding interest, for the OASDIprogram under intermediate assumptions. All values are expressed in con-stant dollars, as shown in table VI.F7. The difference between the incomevalues for each year is equal to the trust fund interest earnings. Thus the fig-ure illustrates the fact that, under intermediate assumptions, combinedOASDI cost will be payable from (1) current tax income alone through 2015,(2) current tax income plus amounts from the trust funds that are less thanannual interest income for years 2016 through 2023, and (3) current taxincome plus amounts from the trust funds that are greater than annual interestincome for years 2024 through 2036, i.e., through the year preceding the yearof trust fund exhaustion.
Table VI.F8 shows estimated operations of the combined OASI and DI TrustFunds in current dollars—that is in dollars unadjusted for price inflation.Items included in the table are: income excluding interest, interest income,total income, total cost, and assets at the end of the year. These estimates,based on the low-cost, intermediate, and high-cost sets of demographic andeconomic assumptions, are presented to facilitate independent analysis.
Figure VI.F1.—Estimated OASDI Income and Cost in Constant Dollars,Based on Intermediate Assumptions
[In billions]
$0
$200
$400
$600
$800
$1,000
$1,200
$1,400
$1,600
2005 2010 2015 2020 2025 2030 2035 2040Calendar year
Cost
Total income
Income excluding interest

193
OASDI & HI: Estimates in Dollars
Note: Totals do not necessarily equal the sums of rounded components.
Table VI.F8.—Operations of the Combined OASI and DI Trust Funds, in Current Dollars, Calendar Years 2009-85
[In billions]
Calendar year
Incomeexcluding
interestInterestincome
Totalincome Cost
Assets atend of year
Intermediate:2009 . . . . . . . . . . . . . $701.3 $118.1 $819.4 $682.5 $2,555.52010 . . . . . . . . . . . . . 727.6 120.1 847.7 709.3 2,693.92011 . . . . . . . . . . . . . 763.6 126.4 890.0 735.1 2,848.82012 . . . . . . . . . . . . . 810.4 136.1 946.5 772.4 3,022.92013 . . . . . . . . . . . . . 855.5 148.4 1,003.9 822.7 3,204.02014 . . . . . . . . . . . . . 898.6 161.1 1,059.7 880.2 3,383.52015 . . . . . . . . . . . . . 943.5 172.4 1,115.9 941.2 3,558.12016 . . . . . . . . . . . . . 986.4 183.1 1,169.6 1,005.3 3,722.42017 . . . . . . . . . . . . . 1,031.4 194.3 1,225.7 1,074.3 3,873.82018 . . . . . . . . . . . . . 1,077.0 205.5 1,282.5 1,147.5 4,008.82020 . . . . . . . . . . . . . 1,175.5 225.1 1,400.6 1,308.8 4,215.42025 . . . . . . . . . . . . . 1,461.3 242.0 1,703.3 1,767.9 4,242.02030 . . . . . . . . . . . . . 1,815.9 192.7 2,008.6 2,309.3 3,237.22035a . . . . . . . . . . . .
a Estimates for later years are not shown because the combined OASI and DI Trust Funds are estimated tobecome exhausted in 2037 under the intermediate assumptions and in 2029 under the high-cost assumptions.
2,259.2 68.6 2,327.8 2,922.9 870.5Low-cost:
2009 . . . . . . . . . . . . . 704.9 118.9 823.8 680.1 2,562.42010 . . . . . . . . . . . . . 739.5 121.6 861.2 704.4 2,719.12011 . . . . . . . . . . . . . 774.1 127.4 901.5 727.6 2,893.12012 . . . . . . . . . . . . . 812.1 136.4 948.4 752.0 3,089.52013 . . . . . . . . . . . . . 864.9 148.4 1,013.3 789.0 3,313.82014 . . . . . . . . . . . . . 904.8 161.1 1,065.9 834.6 3,545.22015 . . . . . . . . . . . . . 945.5 172.9 1,118.3 883.0 3,780.52016 . . . . . . . . . . . . . 985.9 185.6 1,171.5 933.6 4,018.42017 . . . . . . . . . . . . . 1,028.2 200.2 1,228.3 987.8 4,259.02018 . . . . . . . . . . . . . 1,071.8 215.6 1,287.4 1,045.0 4,501.32020 . . . . . . . . . . . . . 1,162.4 247.4 1,409.9 1,173.7 4,977.42025 . . . . . . . . . . . . . 1,419.3 320.3 1,739.6 1,529.8 6,094.92030 . . . . . . . . . . . . . 1,731.7 370.9 2,102.7 1,931.6 7,018.32035 . . . . . . . . . . . . . 2,121.3 415.9 2,537.2 2,364.5 7,855.02040 . . . . . . . . . . . . . 2,610.1 470.4 3,080.5 2,832.5 8,905.02045 . . . . . . . . . . . . . 3,220.9 556.0 3,776.9 3,378.6 10,575.22050 . . . . . . . . . . . . . 3,979.6 688.7 4,668.3 4,063.1 13,156.02055 . . . . . . . . . . . . . 4,923.3 885.0 5,808.4 4,938.0 16,957.12060 . . . . . . . . . . . . . 6,098.4 1,161.5 7,259.9 6,042.5 22,299.42065 . . . . . . . . . . . . . 7,565.0 1,550.3 9,115.3 7,394.7 29,825.22070 . . . . . . . . . . . . . 9,394.5 2,098.5 11,493.0 9,072.9 40,437.42075 . . . . . . . . . . . . . 11,669.2 2,864.7 14,533.9 11,172.5 55,257.22080 . . . . . . . . . . . . . 14,486.1 3,916.7 18,402.8 13,838.0 75,569.62085 . . . . . . . . . . . . . 17,970.9 5,327.1 23,298.0 17,237.6 102,748.0
High-cost:2009 . . . . . . . . . . . . . 700.1 118.5 818.6 685.0 2,552.32010 . . . . . . . . . . . . . 722.4 121.0 843.4 714.4 2,681.32011 . . . . . . . . . . . . . 762.8 126.9 889.7 744.0 2,827.02012 . . . . . . . . . . . . . 795.4 135.4 930.8 793.7 2,964.02013 . . . . . . . . . . . . . 840.7 148.7 989.3 863.3 3,090.12014 . . . . . . . . . . . . . 900.8 169.4 1,070.2 954.0 3,206.32015 . . . . . . . . . . . . . 963.3 183.1 1,146.4 1,048.1 3,304.62016 . . . . . . . . . . . . . 1,022.2 191.7 1,213.8 1,138.4 3,380.02017 . . . . . . . . . . . . . 1,078.8 197.7 1,276.4 1,228.4 3,428.02018 . . . . . . . . . . . . . 1,130.8 201.7 1,332.5 1,323.8 3,436.82020 . . . . . . . . . . . . . 1,242.5 196.7 1,439.2 1,529.2 3,309.22025a . . . . . . . . . . . . 1,573.8 123.7 1,697.5 2,135.2 1,877.3
Appendices
194
Table VI.F9 shows, in current dollars, estimated income (excluding interest)and estimated total cost (excluding the cost of accumulating target trust fundbalances) of the combined OASI and DI Trust Funds, of the HI Trust Fund,and of the combined OASI, DI, and HI Trust Funds, based on the low-cost,intermediate, and high-cost sets of assumptions described earlier in thisreport. For OASDI, income excluding interest consists of payroll-tax contri-butions, proceeds from taxation of OASDI benefits, and miscellaneous trans-fers from the General Fund of the Treasury. Cost consists of benefitpayments, administrative expenses, net transfers from the trust funds to theRailroad Retirement program, and payments for vocational rehabilitationservices for disabled beneficiaries. For HI, income excluding interest con-sists of payroll-tax contributions (including contributions from railroademployment) and proceeds from the taxation of OASDI benefits. Total costconsists of outlays (scheduled benefits and administrative expenses) forinsured beneficiaries. Income and cost estimates are shown on a cash basisfor the OASDI program and on an incurred basis for the HI program.
Table VI.F9 also shows the difference between income excluding interestand cost, which is called the balance. The balance indicates the size of thedifference between tax income and cost.
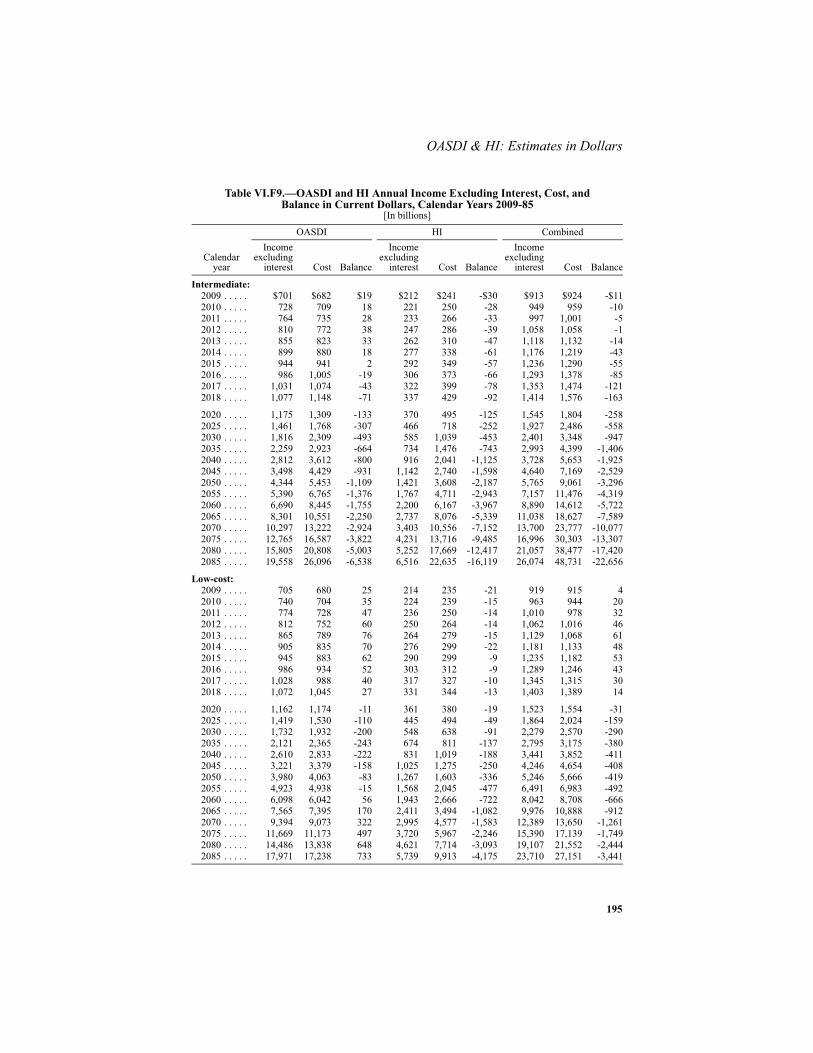
195
OASDI & HI: Estimates in Dollars
Table VI.F9.—OASDI and HI Annual Income Excluding Interest, Cost, andBalance in Current Dollars, Calendar Years 2009-85
[In billions]
Calendaryear
OASDI HI CombinedIncome
excludinginterest Cost Balance
Incomeexcluding
interest Cost Balance
Incomeexcluding
interest Cost Balance
Intermediate:2009 . . . . . $701 $682 $19 $212 $241 -$30 $913 $924 -$112010 . . . . . 728 709 18 221 250 -28 949 959 -102011 . . . . . 764 735 28 233 266 -33 997 1,001 -52012 . . . . . 810 772 38 247 286 -39 1,058 1,058 -12013 . . . . . 855 823 33 262 310 -47 1,118 1,132 -142014 . . . . . 899 880 18 277 338 -61 1,176 1,219 -432015 . . . . . 944 941 2 292 349 -57 1,236 1,290 -552016 . . . . . 986 1,005 -19 306 373 -66 1,293 1,378 -852017 . . . . . 1,031 1,074 -43 322 399 -78 1,353 1,474 -1212018 . . . . . 1,077 1,148 -71 337 429 -92 1,414 1,576 -163
2020 . . . . . 1,175 1,309 -133 370 495 -125 1,545 1,804 -2582025 . . . . . 1,461 1,768 -307 466 718 -252 1,927 2,486 -5582030 . . . . . 1,816 2,309 -493 585 1,039 -453 2,401 3,348 -9472035 . . . . . 2,259 2,923 -664 734 1,476 -743 2,993 4,399 -1,4062040 . . . . . 2,812 3,612 -800 916 2,041 -1,125 3,728 5,653 -1,9252045 . . . . . 3,498 4,429 -931 1,142 2,740 -1,598 4,640 7,169 -2,5292050 . . . . . 4,344 5,453 -1,109 1,421 3,608 -2,187 5,765 9,061 -3,2962055 . . . . . 5,390 6,765 -1,376 1,767 4,711 -2,943 7,157 11,476 -4,3192060 . . . . . 6,690 8,445 -1,755 2,200 6,167 -3,967 8,890 14,612 -5,7222065 . . . . . 8,301 10,551 -2,250 2,737 8,076 -5,339 11,038 18,627 -7,5892070 . . . . . 10,297 13,222 -2,924 3,403 10,556 -7,152 13,700 23,777 -10,0772075 . . . . . 12,765 16,587 -3,822 4,231 13,716 -9,485 16,996 30,303 -13,3072080 . . . . . 15,805 20,808 -5,003 5,252 17,669 -12,417 21,057 38,477 -17,4202085 . . . . . 19,558 26,096 -6,538 6,516 22,635 -16,119 26,074 48,731 -22,656
Low-cost:2009 . . . . . 705 680 25 214 235 -21 919 915 42010 . . . . . 740 704 35 224 239 -15 963 944 202011 . . . . . 774 728 47 236 250 -14 1,010 978 322012 . . . . . 812 752 60 250 264 -14 1,062 1,016 462013 . . . . . 865 789 76 264 279 -15 1,129 1,068 612014 . . . . . 905 835 70 276 299 -22 1,181 1,133 482015 . . . . . 945 883 62 290 299 -9 1,235 1,182 532016 . . . . . 986 934 52 303 312 -9 1,289 1,246 432017 . . . . . 1,028 988 40 317 327 -10 1,345 1,315 302018 . . . . . 1,072 1,045 27 331 344 -13 1,403 1,389 14
2020 . . . . . 1,162 1,174 -11 361 380 -19 1,523 1,554 -312025 . . . . . 1,419 1,530 -110 445 494 -49 1,864 2,024 -1592030 . . . . . 1,732 1,932 -200 548 638 -91 2,279 2,570 -2902035 . . . . . 2,121 2,365 -243 674 811 -137 2,795 3,175 -3802040 . . . . . 2,610 2,833 -222 831 1,019 -188 3,441 3,852 -4112045 . . . . . 3,221 3,379 -158 1,025 1,275 -250 4,246 4,654 -4082050 . . . . . 3,980 4,063 -83 1,267 1,603 -336 5,246 5,666 -4192055 . . . . . 4,923 4,938 -15 1,568 2,045 -477 6,491 6,983 -4922060 . . . . . 6,098 6,042 56 1,943 2,666 -722 8,042 8,708 -6662065 . . . . . 7,565 7,395 170 2,411 3,494 -1,082 9,976 10,888 -9122070 . . . . . 9,394 9,073 322 2,995 4,577 -1,583 12,389 13,650 -1,2612075 . . . . . 11,669 11,173 497 3,720 5,967 -2,246 15,390 17,139 -1,7492080 . . . . . 14,486 13,838 648 4,621 7,714 -3,093 19,107 21,552 -2,4442085 . . . . . 17,971 17,238 733 5,739 9,913 -4,175 23,710 27,151 -3,441
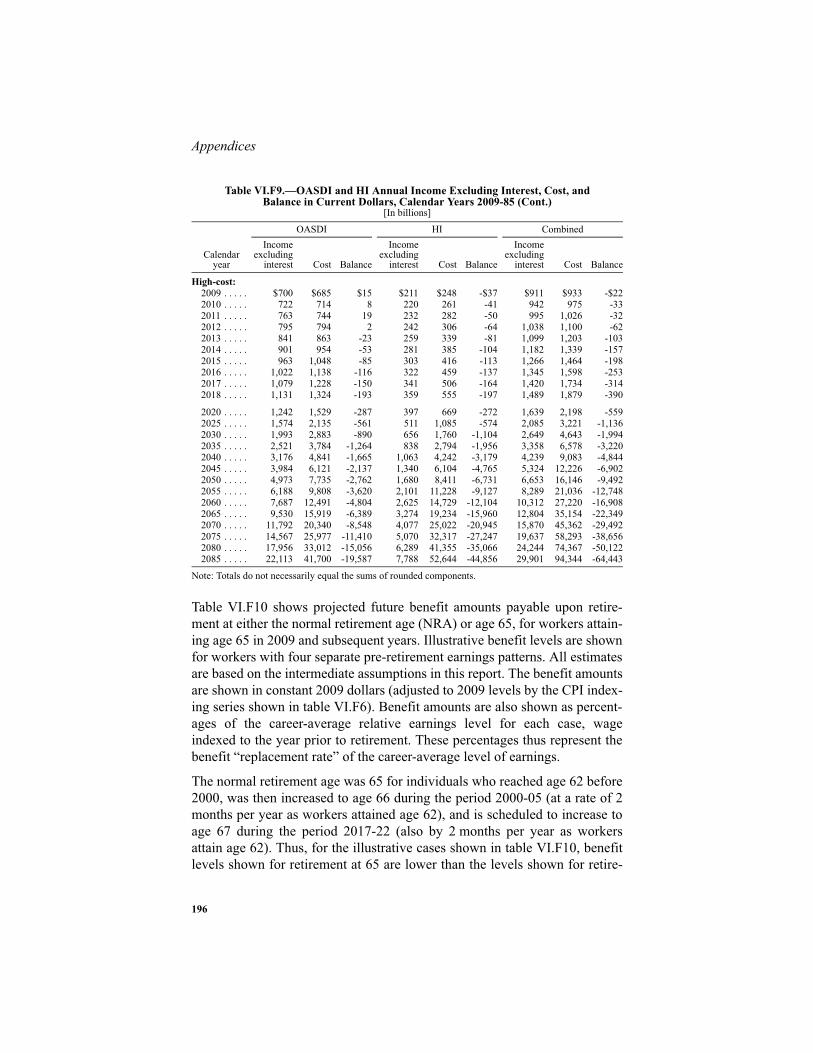
Appendices
196
Note: Totals do not necessarily equal the sums of rounded components.
Table VI.F10 shows projected future benefit amounts payable upon retire-ment at either the normal retirement age (NRA) or age 65, for workers attain-ing age 65 in 2009 and subsequent years. Illustrative benefit levels are shownfor workers with four separate pre-retirement earnings patterns. All estimatesare based on the intermediate assumptions in this report. The benefit amountsare shown in constant 2009 dollars (adjusted to 2009 levels by the CPI index-ing series shown in table VI.F6). Benefit amounts are also shown as percent-ages of the career-average relative earnings level for each case, wageindexed to the year prior to retirement. These percentages thus represent thebenefit “replacement rate” of the career-average level of earnings.
The normal retirement age was 65 for individuals who reached age 62 before2000, was then increased to age 66 during the period 2000-05 (at a rate of 2months per year as workers attained age 62), and is scheduled to increase toage 67 during the period 2017-22 (also by 2 months per year as workersattain age 62). Thus, for the illustrative cases shown in table VI.F10, benefitlevels shown for retirement at 65 are lower than the levels shown for retire-
High-cost:2009 . . . . . $700 $685 $15 $211 $248 -$37 $911 $933 -$222010 . . . . . 722 714 8 220 261 -41 942 975 -332011 . . . . . 763 744 19 232 282 -50 995 1,026 -322012 . . . . . 795 794 2 242 306 -64 1,038 1,100 -622013 . . . . . 841 863 -23 259 339 -81 1,099 1,203 -1032014 . . . . . 901 954 -53 281 385 -104 1,182 1,339 -1572015 . . . . . 963 1,048 -85 303 416 -113 1,266 1,464 -1982016 . . . . . 1,022 1,138 -116 322 459 -137 1,345 1,598 -2532017 . . . . . 1,079 1,228 -150 341 506 -164 1,420 1,734 -3142018 . . . . . 1,131 1,324 -193 359 555 -197 1,489 1,879 -390
2020 . . . . . 1,242 1,529 -287 397 669 -272 1,639 2,198 -5592025 . . . . . 1,574 2,135 -561 511 1,085 -574 2,085 3,221 -1,1362030 . . . . . 1,993 2,883 -890 656 1,760 -1,104 2,649 4,643 -1,9942035 . . . . . 2,521 3,784 -1,264 838 2,794 -1,956 3,358 6,578 -3,2202040 . . . . . 3,176 4,841 -1,665 1,063 4,242 -3,179 4,239 9,083 -4,8442045 . . . . . 3,984 6,121 -2,137 1,340 6,104 -4,765 5,324 12,226 -6,9022050 . . . . . 4,973 7,735 -2,762 1,680 8,411 -6,731 6,653 16,146 -9,4922055 . . . . . 6,188 9,808 -3,620 2,101 11,228 -9,127 8,289 21,036 -12,7482060 . . . . . 7,687 12,491 -4,804 2,625 14,729 -12,104 10,312 27,220 -16,9082065 . . . . . 9,530 15,919 -6,389 3,274 19,234 -15,960 12,804 35,154 -22,3492070 . . . . . 11,792 20,340 -8,548 4,077 25,022 -20,945 15,870 45,362 -29,4922075 . . . . . 14,567 25,977 -11,410 5,070 32,317 -27,247 19,637 58,293 -38,6562080 . . . . . 17,956 33,012 -15,056 6,289 41,355 -35,066 24,244 74,367 -50,1222085 . . . . . 22,113 41,700 -19,587 7,788 52,644 -44,856 29,901 94,344 -64,443
Table VI.F9.—OASDI and HI Annual Income Excluding Interest, Cost, andBalance in Current Dollars, Calendar Years 2009-85 (Cont.)
[In billions]
Calendaryear
OASDI HI CombinedIncome
excludinginterest Cost Balance
Incomeexcluding
interest Cost Balance
Incomeexcluding
interest Cost Balance

197
OASDI & HI: Estimates in Dollars
ment at NRA, primarily because of the actuarial reduction for “early” (pre-NRA) retirement.
Four different pre-retirement earnings patterns are represented in tableVI.F10. Three of these cases are for workers with scaled-earnings patterns,1reflecting low, medium, and high career-average levels of pre-retirementearnings starting at age 21. The fourth case is the steady maximum earner.The three scaled-earnings cases have earnings patterns that reflect differ-ences by age in the probability of work and in average earnings levels experi-enced by insured workers during the period 1991-2005. The general, career-average level of earnings for the scaled cases is set relative to the nationalaverage wage index (AWI) so that benefit levels are consistent with levelsfor “steady-earnings” cases that were shown in the 2000 and earlier TrusteesReports. For the scaled medium earner, the general, career-average earningslevel is about equal to the AWI. For the scaled low and high earners, the gen-eral, career-average earnings level is set at about 45 percent and 160 percentof the AWI, respectively. The steady maximum earner is assumed to haveearnings at (or above) the contribution and benefit base for each year prior toretirement starting at age 22.
As noted above, the scaled-earnings cases were constructed so that theircareer-average earnings levels are consistent with those of the correspondingsteady low, average, and high earners that were illustrated in the 2000 andearlier Trustees Reports. As a result, values in this table for benefits underthe present-law Social Security benefit formula are essentially comparable tothose in earlier reports. Scaled-earnings cases are now being used instead ofsteady-earnings cases because they more accurately illustrate the differencesin benefit levels under the wide variety of reform proposals considered inrecent years.
1 More details are provided on scaled-earnings patterns in the Social Security Administration Actuarial NoteNumber 2008.3, located at the following internet address:www.socialsecurity.gov/OACT/NOTES/ran3/an2008-3.html.

Appendices
198
Table VI.F10.—Annual Scheduled Benefit Amountsa for Retired WorkersWith Various Pre-Retirement Earnings Patterns
Based on Intermediate Assumptions, Calendar Years 2009-85
Year attain age 65b
Retirement at normal retirement age Retirement at age 65
Age atretirement
Constant2009
dollars cPercent of
earningsAge at
retirement
Constant2009
dollarscPercent of
earnings
Scaled low earnings:d
2009 . . . . . . . . . . . 66:0 $10,683 57.4 65:0 $10,128 54.02010 . . . . . . . . . . . 66:0 10,485 55.8 65:0 9,999 53.72015 . . . . . . . . . . . 66:0 11,099 55.7 65:0 10,358 52.72020 . . . . . . . . . . . 66:2 11,747 56.1 65:0 10,835 52.32025 . . . . . . . . . . . 67:0 12,343 55.5 65:0 10,697 49.12030 . . . . . . . . . . . 67:0 12,987 55.4 65:0 11,252 49.12035 . . . . . . . . . . . 67:0 13,681 55.3 65:0 11,859 49.02040 . . . . . . . . . . . 67:0 14,441 55.3 65:0 12,511 49.02045 . . . . . . . . . . . 67:0 15,249 55.3 65:0 13,216 49.02050 . . . . . . . . . . . 67:0 16,105 55.4 65:0 13,954 49.02055 . . . . . . . . . . . 67:0 16,995 55.4 65:0 14,726 49.02060 . . . . . . . . . . . 67:0 17,922 55.4 65:0 15,534 49.02065 . . . . . . . . . . . 67:0 18,901 55.4 65:0 16,381 49.02070 . . . . . . . . . . . 67:0 19,938 55.4 65:0 17,281 49.02075 . . . . . . . . . . . 67:0 21,035 55.4 65:0 18,229 49.02080 . . . . . . . . . . . 67:0 22,186 55.4 65:0 19,229 49.02085 . . . . . . . . . . . 67:0 23,402 55.4 65:0 20,282 49.0
Scaled medium earnings:e2009 . . . . . . . . . . . 66:0 17,601 42.6 65:0 16,692 40.02010 . . . . . . . . . . . 66:0 17,275 41.4 65:0 16,480 39.82015 . . . . . . . . . . . 66:0 18,288 41.3 65:0 17,069 39.12020 . . . . . . . . . . . 66:2 19,362 41.6 65:0 17,857 38.82025 . . . . . . . . . . . 67:0 20,342 41.2 65:0 17,626 36.42030 . . . . . . . . . . . 67:0 21,399 41.1 65:0 18,547 36.42035 . . . . . . . . . . . 67:0 22,546 41.0 65:0 19,537 36.32040 . . . . . . . . . . . 67:0 23,795 41.0 65:0 20,624 36.32045 . . . . . . . . . . . 67:0 25,130 41.0 65:0 21,777 36.32050 . . . . . . . . . . . 67:0 26,534 41.0 65:0 22,996 36.32055 . . . . . . . . . . . 67:0 28,002 41.1 65:0 24,268 36.42060 . . . . . . . . . . . 67:0 29,533 41.1 65:0 25,594 36.42065 . . . . . . . . . . . 67:0 31,143 41.1 65:0 26,991 36.42070 . . . . . . . . . . . 67:0 32,854 41.1 65:0 28,473 36.42075 . . . . . . . . . . . 67:0 34,659 41.1 65:0 30,038 36.42080 . . . . . . . . . . . 67:0 36,557 41.1 65:0 31,682 36.42085 . . . . . . . . . . . 67:0 38,560 41.1 65:0 33,418 36.4
Scaled high earnings:f
2009 . . . . . . . . . . . 66:0 23,326 35.3 65:0 22,128 33.22010 . . . . . . . . . . . 66:0 22,899 34.3 65:0 21,851 33.02015 . . . . . . . . . . . 66:0 24,244 34.2 65:0 22,624 32.42020 . . . . . . . . . . . 66:2 25,667 34.5 65:0 23,674 32.22025 . . . . . . . . . . . 67:0 26,957 34.1 65:0 23,366 30.22030 . . . . . . . . . . . 67:0 28,366 34.1 65:0 24,582 30.12035 . . . . . . . . . . . 67:0 29,884 34.0 65:0 25,903 30.12040 . . . . . . . . . . . 67:0 31,541 34.0 65:0 27,337 30.12045 . . . . . . . . . . . 67:0 33,309 34.0 65:0 28,866 30.12050 . . . . . . . . . . . 67:0 35,172 34.0 65:0 30,480 30.12055 . . . . . . . . . . . 67:0 37,115 34.0 65:0 32,167 30.12060 . . . . . . . . . . . 67:0 39,143 34.0 65:0 33,926 30.12065 . . . . . . . . . . . 67:0 41,279 34.0 65:0 35,775 30.12070 . . . . . . . . . . . 67:0 43,545 34.0 65:0 37,739 30.12075 . . . . . . . . . . . 67:0 45,937 34.0 65:0 39,812 30.12080 . . . . . . . . . . . 67:0 48,453 34.0 65:0 41,992 30.12085 . . . . . . . . . . . 67:0 51,108 34.0 65:0 44,293 30.1

199
OASDI & HI: Estimates in Dollars
Steady maximum earnings:g
2009 . . . . . . . . . . . 66:0 $27,694 29.0 65:0 $26,064 27.42010 . . . . . . . . . . . 66:0 27,322 28.1 65:0 25,864 27.12015 . . . . . . . . . . . 66:0 29,477 27.6 65:0 27,355 26.02020 . . . . . . . . . . . 66:2 31,352 27.6 65:0 28,809 25.72025 . . . . . . . . . . . 67:0 33,150 27.3 65:0 28,511 24.02030 . . . . . . . . . . . 67:0 34,921 27.3 65:0 30,052 24.02035 . . . . . . . . . . . 67:0 36,806 27.2 65:0 31,681 23.92040 . . . . . . . . . . . 67:0 38,812 27.2 65:0 33,404 23.92045 . . . . . . . . . . . 67:0 40,989 27.2 65:0 35,285 23.92050 . . . . . . . . . . . 67:0 43,223 27.3 65:0 37,208 24.02055 . . . . . . . . . . . 67:0 45,585 27.3 65:0 39,240 24.02060 . . . . . . . . . . . 67:0 48,077 27.3 65:0 41,386 24.02065 . . . . . . . . . . . 67:0 50,694 27.3 65:0 43,638 24.02070 . . . . . . . . . . . 67:0 53,471 27.3 65:0 46,029 24.02075 . . . . . . . . . . . 67:0 56,406 27.3 65:0 48,556 24.02080 . . . . . . . . . . . 67:0 59,497 27.3 65:0 51,216 24.02085 . . . . . . . . . . . 67:0 62,756 27.3 65:0 54,022 24.0
a Annual scheduled benefit amounts are the total for the 12-month period starting with the month ofretirement.b Assumed to attain age 65 in January of the year.c The adjustment for constant dollars is made using the adjusted CPI indexing series shown in table VI.F6.d Career-average earnings at about 45 percent of the national average wage index (AWI).e Career-average earnings at about 100 percent of the AWI.f Career-average earnings at about 160 percent of the AWI.g Earnings for each year equal to the contribution and benefit base.
Table VI.F10.—Annual Scheduled Benefit Amountsa for Retired WorkersWith Various Pre-Retirement Earnings Patterns
Based on Intermediate Assumptions, Calendar Years 2009-85 (Cont.)
Year attain age 65b
Retirement at normal retirement age Retirement at age 65
Age atretirement
Constant2009
dollars cPercent of
earningsAge at
retirement
Constant2009
dollarscPercent of
earnings
Appendices
200
G. ANALYSIS OF BENEFIT DISBURSEMENTS FROM THE OASI TRUST FUND WITH RESPECT TO DISABLED BENEFICIARIES
(Required by section 201(c) of the Social Security Act)
Effective January 1957, monthly benefits have been payable from the OASITrust Fund to disabled children aged 18 and over of retired and deceasedworkers in those cases for which the disability began before age 18. The agebefore which disability is required to have begun was subsequently changedto age 22. Effective February 1968, reduced monthly benefits have been pay-able from this trust fund to disabled widows and widowers at ages 50 andover. Effective January 1991, the requirements for the disability of thewidow or widower were made less restrictive.
On December 31, 2008, about 922,000 persons were receiving monthly ben-efits from the OASI Trust Fund because of their disabilities or the disabilitiesof children. This total includes 26,000 mothers and fathers (wives or hus-bands under age 65 of retired-worker beneficiaries and widows or widowersof deceased insured workers) who met all other qualifying requirements andwere receiving unreduced benefits solely because they had disabled-childbeneficiaries (or disabled children aged 16 or 17) in their care. Benefits paidfrom this trust fund to the persons described above totaled $7,796 million incalendar year 2008. Table VI.G1 shows these and similar figures for selectedcalendar years during 1960-2008, and estimated experience for 2009-18based on the intermediate set of assumptions.

201
OASI Expenditures for Disabled
Note: Totals do not necessarily equal the sums of rounded components.
Table VI.G1.—Benefit Disbursements From the OASI Trust FundWith Respect to Disabled Beneficiaries
[Beneficiaries in thousands; benefit payments in millions]
Calendar year
Disabled beneficiaries, end of year Amount of benefit paymentsa
a Beginning in 1966, includes payments for vocational rehabilitation services.
Total Children b
b Also includes certain mothers and fathers (see text).
Widows-widowers c
c In 1984 and later years, only disabled widows and widowers aged 50-59 are included because disabledwidows and widowers aged 60-64 would be eligible for the same benefit as a nondisabled aged widow orwidower; therefore, they are not receiving benefits solely because of a disability.
Total ChildrenbWidows-
widowers d
d In 1983 and prior years, reflects the offsetting effect of lower benefits payable to disabled widows and wid-owers who continued to receive benefits after attaining age 60 (62, for disabled widowers, prior to 1973) ascompared to the higher nondisabled widow's and widower's benefits that would otherwise be payable. In1984 and later years, only benefit payments to disabled widows and widowers aged 50-59 are included (seefootnote c).
Historical data:1960 . . . . . . . . . 117 117 — $59 $59 —1965 . . . . . . . . . 214 214 — 134 134 —1970 . . . . . . . . . 316 281 36 301 260 $411975 . . . . . . . . . 435 376 58 664 560 1041980 . . . . . . . . . 519 460 59 1,223 1,097 1261985 . . . . . . . . . 594 547 47 2,072 1,885 1871986 . . . . . . . . . 614 565 49 2,219 2,022 1971987 . . . . . . . . . 629 580 49 2,331 2,128 2031988 . . . . . . . . . 640 591 48 2,518 2,307 2111989 . . . . . . . . . 651 602 49 2,680 2,459 2211990 . . . . . . . . . 662 613 49 2,882 2,649 2331991 . . . . . . . . . 687 627 61 3,179 2,875 3041992 . . . . . . . . . 715 643 72 3,459 3,079 3801993 . . . . . . . . . 740 659 81 3,752 3,296 4561994 . . . . . . . . . 758 671 86 3,973 3,481 4921995 . . . . . . . . . 772 681 91 4,202 3,672 5311996 . . . . . . . . . 782 687 94 4,410 3,846 5651997 . . . . . . . . . 789 693 96 4,646 4,050 5961998 . . . . . . . . . 797 698 99 4,838 4,210 6271999 . . . . . . . . . 805 702 102 4,991 4,336 6552000 . . . . . . . . . 811 707 104 5,203 4,523 6802001 . . . . . . . . . 817 712 105 5,520 4,802 7182002 . . . . . . . . . 823 717 106 5,773 5,024 7492003 . . . . . . . . . 827 722 105 5,747 4,980 7642004 . . . . . . . . . 828 723 105 5,947 5,164 7812005 . . . . . . . . . 836 728 108 6,291 5,389 8432006 . . . . . . . . . 840 732 108 6,741 5,852 8852007 . . . . . . . . . 851 744 107 7,298 6,418 8782008 . . . . . . . . . 922 813 109 7,796 6,878 915
Estimates under the intermediate assumptions:2009 . . . . . . . . . 955 846 110 8,439 7,478 9572010 . . . . . . . . . 971 861 110 8,676 7,707 9642011 . . . . . . . . . 986 876 110 8,907 7,929 9692012 . . . . . . . . . 1,000 891 109 9,253 8,256 9852013 . . . . . . . . . 1,014 906 108 9,732 8,703 1,013
2014 . . . . . . . . . 1,026 920 106 10,241 9,189 1,0322015 . . . . . . . . . 1,037 933 104 10,759 9,686 1,0502016 . . . . . . . . . 1,047 945 101 11,267 10,184 1,0582017 . . . . . . . . . 1,056 957 98 11,790 10,697 1,0682018 . . . . . . . . . 1,064 969 96 12,335 11,230 1,079

Appendices
202
Total benefit payments from the OASI Trust Fund with respect to disabledbeneficiaries are estimated to increase from $8,439 million in calendar year2009 to $12,335 million in calendar year 2018, based on the intermediateassumptions.
In calendar year 2008, benefit payments (including expenditures for voca-tional rehabilitation services) with respect to disabled persons from the OASITrust Fund and from the DI Trust Fund (including payments from the latterfund to all children and spouses of disabled-worker beneficiaries) totaled$114,173 million. Of this amount, $7,796 million or 6.8 percent representedpayments from the OASI Trust Fund. These and similar figures for selectedcalendar years during 1960-2008 and estimates for calendar years 2009-18are presented in table VI.G2.
Table VI.G2.—Benefit Disbursements Under the OASDI ProgramWith Respect to Disabled Beneficiaries
[Amounts in millions]
Calendar year Totala DI Trust Fund bOASI Trust Fund
Amount c Percentage of totalHistorical data:
1960 . . . . . . . . . $627 $568 $59 9.41965 . . . . . . . . . 1,707 1,573 134 7.91970 . . . . . . . . . 3,386 3,085 301 8.91975 . . . . . . . . . 9,169 8,505 664 7.21980 . . . . . . . . . 16,738 15,515 1,223 7.31985 . . . . . . . . . 20,908 18,836 2,072 9.91990 . . . . . . . . . 27,717 24,835 2,882 10.41991 . . . . . . . . . 30,877 27,698 3,179 10.31992 . . . . . . . . . 34,583 31,124 3,459 10.01993 . . . . . . . . . 38,378 34,626 3,752 9.81994 . . . . . . . . . 41,730 37,757 3,973 9.51995 . . . . . . . . . 45,140 40,937 4,202 9.31996 . . . . . . . . . 48,615 44,205 4,410 9.11997 . . . . . . . . . 50,358 45,712 4,646 9.21998 . . . . . . . . . 53,062 48,224 4,838 9.11999 . . . . . . . . . 56,390 51,399 4,991 8.92000 . . . . . . . . . 60,204 55,001 5,203 8.62001 . . . . . . . . . 65,157 59,637 5,520 8.52002 . . . . . . . . . 71,493 65,721 5,773 8.12003 . . . . . . . . . 76,699 70,952 5,747 7.52004 . . . . . . . . . 84,199 78,251 5,947 7.12005 . . . . . . . . . 91,677 85,386 6,291 6.92006 . . . . . . . . . 99,186 d 92,446 6,741 6.82007 . . . . . . . . . 106,444 e 99,147 7,298 6.92008 . . . . . . . . . 114,173 e106,376 7,796 6.8

203
OASI Expenditures for Disabled
Note: Totals do not necessarily equal the sums of rounded components.
Estimates under the intermediate assumptions:2009 . . . . . . . . . $126,183 $117,744 $8,439 6.72010 . . . . . . . . . 133,718 125,042 8,676 6.52011 . . . . . . . . . 138,777 129,871 8,907 6.42012 . . . . . . . . . 144,384 135,131 9,253 6.42013 . . . . . . . . . 149,991 140,260 9,732 6.52014 . . . . . . . . . 157,037 146,796 10,241 6.52015 . . . . . . . . . 164,559 153,800 10,759 6.52016 . . . . . . . . . 172,582 161,315 11,267 6.52017 . . . . . . . . . 181,027 169,237 11,790 6.52018 . . . . . . . . . 189,786 177,451 12,335 6.5
a Beginning in 1966, includes payments for vocational rehabilitation services.b Benefit payments to disabled workers and their children and spouses.c Benefit payments to disabled children aged 18 and over, to certain mothers and fathers (see text), and todisabled widows and widowers (see footnote d, table VI.G1).d Excludes reimbursement of $0.7 billion for excess amounts of voluntary income tax withholding in 1999-2005.e Excludes interfund transfers to correct a trust fund allocation error made on payments to certain disabledbeneficiaries. These transfers amounted to $3.3 billion in 2007 and $0.3 billion in 2008 from OASI to DI.
Table VI.G2.—Benefit Disbursements Under the OASDI ProgramWith Respect to Disabled Beneficiaries (Cont.)
[Amounts in millions]
Calendar year Totala DI Trust Fund bOASI Trust Fund
Amount c Percentage of total
Appendices
204
H. GLOSSARY
Actuarial balance. The difference between the summarized income rate andthe summarized cost rate over a given valuation period.Actuarial deficit. A negative actuarial balance.Administrative expenses. Expenses incurred by the Social Security Admin-istration and the Department of the Treasury in administering the OASDIprogram and the provisions of the Internal Revenue Code relating to the col-lection of contributions. Such administrative expenses are paid from theOASI and DI Trust Funds.Advance tax transfers. Amounts representing the estimated total OASDItax contributions for a given month. From May 1983 through November1990, such amounts were credited to the OASI and DI Trust Funds at thebeginning of each month. Reimbursements were made from the trust funds tothe General Fund of the Treasury for the associated loss of interest. Advancetax transfers are no longer made unless needed in order to pay benefits.Alternatives I, II, or III. See “Assumptions.”Annual balance. The difference between the income rate and the cost rate ina given year.Assets. Treasury notes and bonds, other securities guaranteed by the FederalGovernment, certain Federally sponsored agency obligations, and cash, heldby the trust funds for investment purposes.Assumptions. Values relating to future trends in certain key factors thataffect the balance in the trust funds. Demographic assumptions include fertil-ity, mortality, net immigration, marriage, and divorce. Economic assump-tions include unemployment rates, average earnings, inflation, interest rates,and productivity. Program-specific assumptions include retirement patterns,and disability incidence and termination rates. Three sets of demographic,economic, and program-specific assumptions are presented in this report— • Alternative II is the intermediate set of assumptions, and represents the
Trustees’ best estimates of likely future demographic, economic, andprogram-specific conditions.
• Alternative I is characterized as a low-cost set—it assumes relativelyrapid economic growth, low inflation, and favorable (from the stand-point of program financing) demographic and program-specific condi-tions.
• Alternative III is characterized as a high-cost set—it assumes relativelyslow economic growth, high inflation, and unfavorable (from the stand-point of program financing) demographic and program-specific condi-tions.
See tables V.A1, V.B1, and V.B2.
205
Glossary
Automatic cost-of-living benefit increase. The annual increase in benefits,effective for December, reflecting the increase in the cost of living. The ben-efit increase equals the percentage increase in the Consumer Price Index forUrban Wage Earners and Clerical Workers (CPI-W) measured from the aver-age over July, August, and September of the preceding year to the averagefor the same 3 months in the current year. If the increase is less than one-tenth of 1 percent, when rounded, there is no automatic increase for the cur-rent year; the increase for the next year would reflect the net increase in theCPI over a 2-year period. See table V.C1.Auxiliary benefits. Monthly benefits payable to a spouse or child of aretired or disabled worker, or to a survivor of a deceased worker.Average indexed monthly earnings—AIME. The amount of earnings usedin determining the primary insurance amount (PIA) for most workers whoattain age 62, become disabled, or die after 1978. A worker’s actual pastearnings are adjusted by changes in the average wage index, in order to bringthem up to their approximately equivalent value at the time of retirement orother eligibility for benefits.Average wage index—AWI. The average amount of total wages for eachyear after 1950, including wages in noncovered employment and wages incovered employment in excess of the OASDI contribution and benefit base.(See Title 20, Chapter III, section 404.211(c) of the Code of Federal Regula-tions for a more precise definition.) These average wage amounts are used toindex the taxable earnings of most workers first becoming eligible for bene-fits in 1979 or later, and for automatic adjustments in the contribution andbenefit base, bend points, earnings test exempt amounts, and other wage-indexed amounts. See table V.C1.Award. An administrative determination that an individual is entitled toreceive a specified type of OASDI benefit. Awards can represent not onlynew entrants to the benefit rolls but also persons already on the rolls whobecome entitled to a different type of benefit. Awards usually result in theimmediate payment of benefits, although payments may be deferred or with-held depending on the individual’s particular circumstances.Baby boom. The period from the end of World War II through the mid-1960s marked by unusually high birth rates.Bend points. The dollar amounts defining the AIME or PIA brackets in thebenefit formulas. For the bend points for years 1979 and later, see table V.C2.Beneficiary. A person who has been awarded benefits on the basis of his orher own or another’s earnings record. The benefits may be either in current-payment status or withheld.Benefit award. See “Award.”

Appendices
206
Benefit payments. The amounts disbursed for OASI and DI benefits by theDepartment of the Treasury in specified periods.Benefit termination. See “Termination.”Best estimate assumptions. See “Assumptions.”Board of Trustees. A Board established by the Social Security Act to over-see the financial operations of the Federal Old-Age and Survivors InsuranceTrust Fund and the Federal Disability Insurance Trust Fund. The Board iscomposed of six members, four of whom serve automatically by virtue oftheir positions in the Federal Government: the Secretary of the Treasury, whois the Managing Trustee, the Secretary of Labor, the Secretary of Health andHuman Services, and the Commissioner of Social Security. The other twomembers are appointed by the President to serve as public representatives.Cash flow. The cash flow for the OASI and DI Trust Funds is defined gener-ally as actual or projected revenue and costs reflecting the levels of tax ratesand benefits scheduled in the law. Net cash flow is the difference between taxrevenue and cost on this basis.Closed group unfunded obligation. This measure is computed like theopen group unfunded obligation except that individuals under the age of 15(or not yet born) are excluded. In other words, only persons who attain age15 or older during the first year of the projection period are included in thecalculations.Constant dollars. Amounts adjusted by the CPI to the value of the dollar ina particular year.Consumer Price Index—CPI. An official measure of inflation in consumerprices. In this report, all references to the CPI relate to the Consumer PriceIndex for Urban Wage Earners and Clerical Workers (CPI-W). Historical val-ues for the CPI-W are published by the Bureau of Labor Statistics, Depart-ment of Labor.Contribution and benefit base. Annual dollar amount above which earn-ings in employment covered under the OASDI program are neither taxablenor creditable for benefit-computation purposes. (Also referred to as maxi-mum contribution and benefit base, annual creditable maximum, taxablemaximum, and maximum taxable.) See tables V.C1 and VI.A1. See “HI con-tribution base.”Contributions. The amount based on a percent of earnings, up to an annualmaximum, that must be paid by— • employers and employees on wages from employment under the Fed-
eral Insurance Contributions Act, • the self-employed on net earnings from self-employment under the
Self-Employment Contributions Act, and

207
Glossary
• States on the wages of State and local government employees coveredunder the Social Security Act through voluntary agreements under sec-tion 218 of the Act.
Generally, employers withhold contributions from wages, add an equalamount of contributions, and pay both on a current basis. Also referred to astaxes.Cost. The cost for a year is defined to include scheduled benefit payments,administrative expenses, net transfers from the trust funds to the RailroadRetirement program under the financial-interchange provisions, and pay-ments for vocational rehabilitation services for disabled beneficiaries; itexcludes transfers under the interfund borrowing provisions.Cost-of-living adjustment. See “Automatic cost-of-living benefit increase.”Cost rate. The cost rate for a year is the ratio of the cost of the program tothe taxable payroll for the year.Covered earnings. Earnings in employment covered by the OASDI pro-gram.Covered employment. All employment for which earnings are creditablefor Social Security purposes. Almost all employment is covered under theprogram. Some exceptions are: • State and local government employees whose employer has not elected
to be covered under Social Security and who are participating in anemployer-provided pension plan.
• Current Federal civilian workers hired before 1984 who have notelected to be covered.
• Self-employed workers earning less than $400 in a calendar year.Covered worker. A person who has earnings creditable for Social Securitypurposes on the basis of services for wages in covered employment and/or onthe basis of income from covered self-employment.Creditable earnings. Wage or self-employment earnings posted to aworker’s earnings record, upon which eligibility for and amount of benefitson that worker’s record is based. The maximum amount of creditable earn-ings for each worker in a calendar year is determined by the contribution andbenefit base.Current-cost financing. See “Pay-as-you-go financing.”Current dollars. Amounts expressed in nominal dollars with no adjustmentfor inflationary changes in the value of the dollar over time.Current-payment status. Status of a beneficiary to whom a benefit is beingpaid for a given month (with or without deductions, provided the deductionsadd to less than a full month’s benefit).Deemed wage credit. See “Military service wage credits.”
Appendices
208
Delayed retirement credits. Increases the benefit amount for certain indi-viduals who did not receive benefits for months after attainment of the nor-mal retirement age but before age 70. Delayed retirement credits areapplicable for January benefits of the year following the year they are earnedor for the month of attainment of age 70, whichever comes first. See tableV.C3.Demographic assumptions. See “Assumptions.”Deterministic model. A model with specified assumptions for and relation-ships among variables. Under such a model, any specified set of assumptionsdetermines a single outcome directly reflecting the specifications.Disability. For Social Security purposes, the inability to engage in substan-tial gainful activity (see “Substantial gainful activity—SGA”) by reason ofany medically determinable physical or mental impairment that can beexpected to result in death or to last for a continuous period of not less than12 months. Special rules apply for workers at ages 55 and over whose dis-ability is based on blindness.The law generally requires that a person be disabled continuously for 5months before he or she can qualify for a disabled-worker benefit.Disability conversion ratio. For a given year, the ratio of the number of dis-ability conversions to the average number of disabled-worker beneficiariesduring the year.Disability conversion. Upon attainment of normal retirement age, a dis-abled-worker beneficiary is automatically converted to retired-worker status.Disability incidence rate. The proportion of workers in a given year,insured for but not receiving disability benefits, who apply for and areawarded disability benefits.Disability Insurance (DI) Trust Fund. See “Trust fund.”Disability prevalence rate. The proportion of persons insured for disabilitybenefits who are disabled-worker beneficiaries in current-payment status.Disability termination rate. The proportion of disabled-worker beneficia-ries in a given year whose disability benefits terminate as a result of the indi-vidual’s recovery or death.Disabled-worker benefit. A monthly benefit payable to a disabled workerunder normal retirement age and insured for disability. Before November1960, disability benefits were limited to disabled workers aged 50-64.Disbursements. Actual expenditures (outgo) made or expected to be madeunder current law, including benefits paid or payable, administrativeexpenses, net transfers from the trust funds to the Railroad Retirement pro-gram under the financial-interchange provisions, and payments for voca-tional rehabilitation services for disabled beneficiaries; it excludes transfersunder the interfund borrowing provisions.

209
Glossary
Earnings. Unless otherwise qualified, all wages from employment and netearnings from self-employment, whether or not taxable or covered.Earnings test. The provision requiring the withholding of benefits if benefi-ciaries under normal retirement age have earnings in excess of certainexempt amounts. See table V.C1.Economic assumptions. See “Assumptions.”Effective interest rate. See “Interest rate.”Excess wages. Wages in excess of the contribution and benefit base onwhich a worker initially pays taxes (usually as a result of working for morethan one employer during a year). Employee taxes on excess wages arerefundable to affected employees, while the employer taxes are not refund-able.Expenditures. See “Disbursements.”Federal Insurance Contributions Act—FICA. Provision authorizing taxeson the wages of employed persons to provide for Retirement, Survivors, andDisability Insurance, and for Hospital Insurance. The tax is paid in equalamounts by workers and their employers.Financial interchange. Provisions of the Railroad Retirement Act providingfor transfers between the trust funds and the Social Security Equivalent Ben-efit Account of the Railroad Retirement program in order to place each trustfund in the same position it would have been in if railroad employment hadalways been covered under Social Security.Fiscal year. The accounting year of the United States Government. Since1976, a fiscal year is the 12-month period ending September 30. For exam-ple, fiscal year 2009 began October 1, 2008, and will end September 30,2009.Full advance funding. A financing scheme where taxes or contributions areestablished to match the full cost of future benefits as these costs are incurredthrough current service. Such financing methods also provide for amortiza-tion over a fixed period of any financial liability that is incurred at the begin-ning of the program (or subsequent modification) as a result of grantingcredit for past service.General Fund of the Treasury. Funds held by the Treasury of the UnitedStates, other than receipts collected for a specific purpose (such as SocialSecurity) and maintained in a separate account for that purpose.General fund reimbursements. Transfers from the General Fund of theTreasury to the trust funds for specific purposes defined in the law, such as: • Payments corresponding to the employee-employer taxes on deemed
wage credits for military personnel.
Appendices
210
• Interest on checks which are not negotiated 6 months after the month ofissue. (For checks issued before October, 1989, the principal wasreturned to the trust funds as a general fund reimbursement; since thattime, the principal amount is automatically returned to the issuing fundwhen the check is uncashed after a year.)
• Administrative expenses incurred as a result of furnishing informationon deferred vested benefits to pension plan participants, as required bythe Employee Retirement Income Security Act of 1974 (Public Law 93-406).
Gross domestic product—GDP. The total dollar value of all goods and ser-vices produced by labor and property located in the United States, regardlessof who supplies the labor or property.HI contribution base. Annual dollar amount above which earnings inemployment covered under the HI program are not taxable. (Also referred toas maximum contribution base, taxable maximum, and maximum taxable.)Beginning in 1994, the HI contribution base was eliminated.High-cost assumptions. See “Assumptions.”Hospital Insurance (HI) Trust Fund. See “Trust fund.”Immigration. See “Legal immigration” and “Other immigration.”Income. Income for a given year is the sum of tax revenues on a liabilitybasis (payroll-tax contributions and income from the taxation of scheduledbenefits) and interest credited to the trust funds.Income rate. Ratio of income from tax revenues on a liability basis (payroll-tax contributions and income from the taxation of scheduled benefits) to theOASDI taxable payroll for the year.Inflation. An increase in the volume of money and credit relative to avail-able goods, resulting in an increase in the general price level.Insured status. The state or condition of having sufficient quarters of cover-age to meet the eligibility requirements for retired-worker or disabled-workerbenefits, or to permit the worker’s spouse and children or survivors to estab-lish eligibility for benefits in the event of his or her disability, retirement, ordeath. See “Quarters of coverage.”Interest. A payment in exchange for the use of money during a specifiedperiod.Interest rate. Interest rates on new public-debt obligations issuable to Fed-eral trust funds (see “Special public-debt obligation”) are determinedmonthly. Such rates are set equal to the average market yield on all outstand-ing marketable U.S. securities not due or callable until after 4 years from thedate the rate is determined. See table V.B2 for historical and assumed futureinterest rates on new special-issue securities. The effective interest rate for atrust fund is the ratio of the interest earned by the fund over a given period of

211
Glossary
time to the average level of assets held by the fund during the period. Theeffective rate of interest thus represents a measure of the overall averageinterest earnings on the fund’s portfolio of assets.Interfund borrowing. The borrowing of assets by a trust fund (OASI, DI, orHI) from another of the trust funds when the first fund is in danger ofexhaustion. Interfund borrowing was permitted by the Social Security Actonly during 1982 through 1987; all amounts borrowed were to be repaidprior to the end of 1989. The only exercise of this authority occurred in 1982,when the OASI Trust Fund borrowed assets from the DI and HI Trust Funds.The final repayment of borrowed amounts occurred in 1986.Intermediate assumptions. See “Assumptions.”Legal emigration. Legal emigration for a given year consists of those legalpermanent residents and native-born citizens who leave the Social Securityarea during the year.Legal immigration. Consistent with the definition used by the Departmentof Homeland Security, legal immigration for a given year consists of foreign-born individuals who are granted legal permanent residence status during theyear.Life expectancy. Average remaining number of years expected prior todeath. Period life expectancy is calculated for a given year using the actual orexpected death rates at each age for that year. Cohort life expectancy, some-times referred to as generational life expectancy, is calculated for individualsat a specific age in a given year using actual or expected death rates from theyears in which the individuals would actually reach each succeeding age ifhe or she survives.Long range. The next 75 years. Long-range actuarial estimates are made forthis period because it is approximately the maximum remaining lifetime ofcurrent Social Security participants.Low-cost assumptions. See “Assumptions.”Lump-sum death benefit. A lump sum, generally $255, payable on thedeath of a fully or currently insured worker. The lump sum is payable to thesurviving spouse of the worker, under most circumstances, or to the worker’schildren.Maximum family benefit. The maximum monthly amount that can be paidon a worker’s earnings record. Whenever the total of the individual monthlybenefits payable to all the beneficiaries entitled on one earnings recordexceeds the maximum, each dependent’s or survivor’s benefit is proportion-ately reduced to bring the total within the maximum. Benefits payable todivorced spouses or surviving divorced spouses are not reduced under thefamily maximum provision.

Appendices
212
Medicare. A nationwide, Federally administered health insurance programauthorized in 1965 to cover the cost of hospitalization, medical care, andsome related services for most people age 65 and over. In 1972, coveragewas extended to people receiving Social Security Disability Insurance pay-ments for 2 years, and people with End-Stage Renal Disease. In 2006, pre-scription drug coverage was also added. Medicare consists of two separatebut coordinated programs—Hospital Insurance (HI, Part A) and Supplemen-tary Medical Insurance (SMI). The SMI program is composed of three sepa-rate accounts—the Part B Account, the Part D Account, and the TransitionalAssistance Account. Almost all persons who are aged 65 and over or dis-abled and who are entitled to HI are eligible to enroll in Part B and Part D ona voluntary basis by paying monthly premiums. Health insurance protectionis available to Medicare beneficiaries without regard to income.Military service wage credits. Credits recognizing that military personnelreceive wages in kind (such as food and shelter) in addition to their basic payand other cash payments. Noncontributory wage credits of $160 were pro-vided for each month of active military service from September 16, 1940,through December 31, 1956. For years after 1956, the basic pay of militarypersonnel is covered under the Social Security program on a contributorybasis. In addition to the contributory credits for basic pay, noncontributorywage credits of $300 were granted for each calendar quarter, from January1957 through December 1977, in which a person received pay for militaryservice. Noncontributory wage credits of $100 were granted for each $300 ofmilitary wages, up to a maximum credit of $1,200 per calendar year, fromJanuary 1978 through December 2001.National average wage index—AWI. See “Average wage index—AWI.”Normal retirement age. The age at which a person may first become enti-tled to retirement benefits without reduction based on age. For persons reach-ing age 62 before 2000, the normal retirement age is 65. It will increasegradually to 67 for persons reaching that age in 2027 or later, beginning withan increase to 65 years and 2 months for persons reaching age 65 in 2003.See table V.C3.Old-Age and Survivors Insurance (OASI) Trust Fund. See “Trust fund.”Old-law base. Amount the contribution and benefit base would have been ifthe discretionary increases in the base under the 1977 amendments had notbeen enacted. The Social Security Amendments of 1972 provided for auto-matic annual indexing of the contribution and benefit base. The Social Secu-rity Amendments of 1977 provided ad hoc increases to the bases for1979-81, with subsequent bases updated in accordance with the normalindexing procedure. See table V.C2.Open group unfunded obligation. This measure is computed as the excessof the present value of the projected cost of the program over a specified

213
Glossary
time period (for example the next 75 years or the infinite future) over thesum of (1) the value of trust fund assets at the beginning of the period and (2)the present value of the projected tax income of the program, assumingscheduled tax rates and benefit levels.Other emigration. Other emigration for a given year consists of individualsfrom the other-immigrant population who leave the Social Security area dur-ing the year or who adjust status to become legal permanent residents duringthe year.Other immigration. Other immigration for a given year consists of individ-uals who enter the Social Security area and stay 6 months or more but with-out legal permanent residence status, such as undocumented immigrants andtemporary workers and students.Outgo. See “Disbursements.”Par value. The value printed on the face of a bond. For both public and spe-cial issues held by the trust funds, par value is also the redemption value atmaturity.Partial advance funding. A financing scheme where taxes are scheduled toprovide a substantial accumulation of trust fund assets, thereby generatingadditional interest income to the trust funds and reducing the need for payrolltax increases in periods when costs are relatively high. (Higher general taxesor additional borrowing may be required, however, to support the payment ofsuch interest.) While substantial, the trust fund buildup under partial advancefunding is much smaller than it would be with full advance funding.Pay-as-you-go financing. A financing scheme where taxes are scheduled toproduce just as much income as required to pay current benefits, with trustfund assets built up only to the extent needed to prevent exhaustion of thefund by random economic fluctuations.Payment cycling. Beneficiaries on the rolls before May 1, 1997, are paid onthe third of the month. Persons applying for OASDI benefits after April1997, however, generally are paid on the second, third, or fourth Wednesdayof the month following the month for which payment is due. The particularWednesday payment date is based on the earner’s date of birth. For thoseborn on the first through tenth, the benefit payment day is the secondWednesday of the month; for those born on the eleventh through the twenti-eth, the benefit payment day is the third Wednesday of the month; and forthose born after the twentieth of the month, the payment day is the fourthWednesday of the month.Payroll taxes. A tax levied on the gross wages of workers. See tables VI.A1and VI.F1.Population in the Social Security area. See “Social Security area popula-tion.”

Appendices
214
Present value. The equivalent value, at the present time, of a future streamof payments (either income or cost). The present value of a future stream ofpayments may be thought of as the lump-sum amount that, if invested today,together with interest earnings would be just enough to meet each of the pay-ments as they fell due. Present values are widely used in calculations involv-ing financial transactions over long periods of time to account for the timevalue of money (interest). For the purpose of present-value calculations forthis report, values are discounted by the effective yield on trust fund assets.Primary insurance amount—PIA. The monthly amount payable to aretired worker who begins to receive benefits at normal retirement age or(generally) to a disabled worker. This amount, which is related to theworker’s average monthly wage or average indexed monthly earnings, is alsothe amount used as a base for computing all types of benefits payable on thebasis of one individual’s earnings record.Primary-insurance-amount formula. The mathematical formula relatingthe PIA to the AIME for workers who attain age 62, become disabled, or dieafter 1978. The PIA is equal to the sum of 90 percent of AIME up to the firstbend point, plus 32 percent of AIME above the first bend point up to the sec-ond bend point, plus 15 percent of AIME in excess of the second bend point.Automatic benefit increases are applied beginning with the year of eligibility.See table V.C2 for historical and assumed future bend points and table V.C1for historical and assumed future benefit increases.Quarters of coverage. Basic unit of measurement for determining insuredstatus. In 2009, a worker receives one quarter of coverage (up to a total offour) for each $1,090 of annual covered earnings. The amount of earningsrequired for a quarter of coverage is subject to annual automatic increases inproportion to increases in average wages. For amounts applicable for yearsafter 1978, see table V.C2. Railroad retirement. A Federal insurance program, somewhat similar toSocial Security, designed for workers in the railroad industry. The provisionsof the Railroad Retirement Act provide for a system of coordination andfinancial interchange between the Railroad Retirement program and theSocial Security program.Reallocation of tax rates. An increase in the tax rate payable to either theOASI or DI Trust Fund, with a corresponding reduction in the rate for theother fund, so that the total OASDI tax rate is not changed. Real-wage differential. The difference between the percentage increases in(1) the average annual wage in covered employment and (2) the averageannual Consumer Price Index. See table V.B1.Recession. A period of adverse economic conditions; in particular, two ormore successive calendar quarters of negative growth in gross domesticproduct.

215
Glossary
Retired-worker benefit. A monthly benefit payable to a fully insured retiredworker aged 62 or older or to a person entitled under the transitionallyinsured status provision in the law.Retirement earnings test. See “Earnings test.”Retirement eligibility age. The age (62) at which a fully insured individualfirst becomes eligible to receive retired-worker benefits.Retirement test. See “Earnings test.”Self-employment. Operation of a trade or business by an individual or by apartnership in which an individual is a member.Self-Employment Contributions Act–SECA. Provision authorizing SocialSecurity taxes on the net earnings of most self-employed persons.Short range. The next 10 years. Short-range actuarial estimates are preparedfor this period because of the short-range test of financial adequacy. TheSocial Security Act requires estimates for 5 years; estimates are prepared foran additional 5 years to help clarify trends which are only starting to developin the mandated first 5-year period. Social Security Act. Provisions of the law governing most operations of theSocial Security program. Original Social Security Act is Public Law 74-271,enacted August 14, 1935. With subsequent amendments, the Social SecurityAct consists of 20 titles, of which four have been repealed. The Old-Age,Survivors, and Disability Insurance program is authorized by title II of theSocial Security Act.Social Security area population. The population comprised of (i) residentsof the 50 States and the District of Columbia (adjusted for net census under-count); (ii) civilian residents of Puerto Rico, the Virgin Islands, Guam,American Samoa and the Northern Mariana Islands; (iii) Federal civilianemployees and persons in the U.S. Armed Forces abroad and their depen-dents; (iv) crew members of merchant vessels; and (v) all other U.S. citizensabroad.Solvency. A program is solvent at a point in time if it is able to pay sched-uled benefits when due with scheduled financing. For example, the OASDIprogram is considered solvent over any period for which the trust fundsmaintain a positive balance throughout the period.Special public-debt obligation. Securities of the United States Governmentissued exclusively to the OASI, DI, HI, and SMI Trust Funds and other Fed-eral trust funds. Section 201(d) of the Social Security Act provides that thepublic-debt obligations issued for purchase by the OASI and DI Trust Fundsshall have maturities fixed with due regard for the needs of the funds. Theusual practice has been to spread the holdings of special issues, as of eachJune 30, so that the amounts maturing in each of the next 15 years areapproximately equal. Special public-debt obligations are redeemable at par
Appendices
216
value at any time and carry interest rates determined by law (see “Interestrate”). See tables VI.A5 and VI.A6 for a listing of the obligations held by theOASI and DI Trust Funds, respectively.Statutory blindness. Central visual acuity of 20/200 or less in the better eyewith the use of a correcting lens or tunnel vision of 20o or less.Stochastic model. A model used for projecting a probability distribution ofpotential outcomes. Such models allow for random variation in one or morevariables through time. The random variation is generally based on fluctua-tions observed in historical data for a selected period. Distributions of poten-tial outcomes are derived from a large number of simulations, each of whichreflects random variation in the variable(s).Substantial gainful activity—SGA. The level of work activity used toestablish disability. A finding of disability requires that a person be unable toengage in substantial gainful activity. A person who is earning more than acertain monthly amount (net of impairment-related work expenses) is ordi-narily considered to be engaging in SGA. The amount of monthly earningsconsidered as SGA depends on the nature of a person’s disability. The SocialSecurity Act specifies a higher SGA amount for statutorily blind individuals;Federal regulations specify a lower SGA amount for non-blind individuals.Both SGA amounts increase with increases in the national average wageindex.Summarized balance. The difference between the summarized cost rate andthe summarized income rate, expressed as a percentage of taxable payroll.Summarized cost rate. The ratio of the present value of cost to the presentvalue of the taxable payroll for the years in a given period, expressed as apercentage. This percentage can be used as a measure of the relative level ofcost during the period in question. For purposes of evaluating the financialadequacy of the program, the summarized cost rate is adjusted to include thecost of reaching and maintaining a target trust fund level. Because a trustfund level of about 1 year’s cost is considered to be an adequate reserve forunforeseen contingencies, the targeted trust fund ratio used in determiningsummarized cost rates is 100 percent of annual cost. Accordingly, theadjusted summarized cost rate is equal to the ratio of (a) the sum of thepresent value of the cost during the period plus the present value of the tar-geted ending trust fund level, to (b) the present value of the taxable payrollduring the projection period.Summarized income rate. The ratio of the present value of scheduled taxincome to the present value of taxable payroll for the years in a given period,expressed as a percentage. This percentage can be used as a measure of therelative level of income during the period in question. For purposes of evalu-ating the financial adequacy of the program, the summarized income rate isadjusted to include assets on hand at the beginning of the period. Accord-
217
Glossary
ingly, the adjusted summarized income rate equals the ratio of (a) the sum ofthe trust fund balance at the beginning of the period plus the present value ofthe total income from taxes during the period, to (b) the present value of thetaxable payroll for the years in the period.Supplemental Security Income—SSI. A Federally administered program(often with State supplementation) of cash assistance for needy aged, blind,or disabled persons. SSI is funded through the General Fund of the Treasuryand administered by the Social Security Administration.Supplementary Medical Insurance (SMI) Trust Fund. See “Trust fund.”Survivor benefit. Benefit payable to a survivor of a deceased worker.Sustainable solvency. Sustainable solvency for the financing of the programis achieved when the program has positive trust fund ratios throughout the75-year projection period and these ratios are stable or rising at the end of theperiod.Taxable earnings. Wages and/or self-employment income, in employmentcovered by the OASDI and/or HI programs, that is under the applicableannual maximum taxable limit. For 1994 and later, no maximum taxablelimit applies to the HI program.Taxable payroll. A weighted average of taxable wages and taxable self-employment income. When multiplied by the combined employee-employertax rate, it yields the total amount of taxes incurred by employees, employ-ers, and the self-employed for work during the period.Taxable self-employment income. The maximum amount of net earningsfrom self-employment by an earner which, when added to any taxablewages, does not exceed the contribution and benefit base. For HI beginningin 1994, all of net earnings from self-employment.Taxable wages. See “Taxable earnings.”Taxation of benefits. During 1984-93, up to one-half of an individual’s or acouple’s OASDI benefits was potentially subject to Federal income taxationunder certain circumstances. The revenue derived from this provision wasallocated to the OASI and DI Trust Funds on the basis of the income taxespaid on the benefits from each fund. Beginning in 1994, the maximum por-tion of OASDI benefits potentially subject to taxation was increased to85 percent. The additional revenue derived from taxation of benefits inexcess of one-half, up to 85 percent, is allocated to the HI Trust Fund.Taxes. See “Contributions.”Termination. Cessation of payment of a specific type of benefit because thebeneficiary is no longer entitled to receive it. For example, benefits mightterminate as a result of the death of the beneficiary, the recovery of a dis-abled beneficiary, or the attainment of age 18 by a child beneficiary. In somecases, the individual may become immediately entitled to another type of
Appendices
218
benefit (such as the conversion of a disabled-worker beneficiary at normalretirement age to a retired-worker beneficiary).Test of long-range close actuarial balance. Summarized income rates andcost rates are calculated for each of 66 valuation periods within the full 75-year long-range projection period. The first of these periods consists of thenext 10 years. Each succeeding period becomes longer by 1 year, culminat-ing with the period consisting of the next 75 years. The long-range test is metif, for each of the 66 valuation periods, the actuarial balance is not less thanzero or is negative by, at most, a specified percentage of the summarized costrate for the same time period. The percentage allowed for a negative actuar-ial balance is 0 percent for the 10-year period, grading uniformly to 5 percentfor the full 75-year period. The criterion for meeting the test is less stringentfor the longer periods in recognition of the greater uncertainty associatedwith estimates for more distant years. The test is applied to OASI and DIseparately, as well as combined, based on the intermediate set of assump-tions.Test of short-range financial adequacy. The conditions required to meetthis test are as follows: • If the trust fund ratio for a fund exceeds 100 percent at the beginning of
the projection period, then it must be projected to remain at or above100 percent throughout the 10-year projection period;
• Alternatively, if the fund ratio is initially less than 100 percent, it mustbe projected to reach a level of at least 100 percent within 5 years (andnot be depleted at any time during this period) and then remain at orabove 100 percent throughout the remainder of the 10-year period. Inaddition, the fund’s estimated assets at the beginning of each month ofthe 10-year period must be sufficient to cover that month’s disburse-ments.
These conditions apply to each trust fund separately, as well as to the com-bined funds, and are evaluated based on the intermediate set of assumptions.Total fertility rate. The average number of children that would be born to awoman in her lifetime if she were to experience the birth rates by ageobserved in, or assumed for, a specified year, and if she were to survive theentire childbearing period.Trust fund. Separate accounts in the United States Treasury in which aredeposited the taxes received under the Federal Insurance Contributions Actand the Self-Employment Contributions Act, as well as taxes resulting fromcoverage of State and local government employees; any sums received underthe financial interchange with the railroad retirement account; voluntary hos-pital and medical insurance premiums; and transfers of Federal general reve-nues. Funds not withdrawn for current monthly or service benefits, the
219
Glossary
financial interchange, and administrative expenses are invested in interest-bearing Federal securities, as required by law; the interest earned is alsodeposited in the trust funds. • Old-Age and Survivors Insurance (OASI). The trust fund used for
paying monthly benefits to retired-worker (old-age) beneficiaries andtheir spouses and children and to survivors of deceased insured workers.
• Disability Insurance (DI). The trust fund used for paying monthly ben-efits to disabled-worker beneficiaries and their spouses and children andfor providing rehabilitation services to the disabled.
• Hospital Insurance (HI). The trust fund used for paying part of thecosts of inpatient hospital services and related care for aged and dis-abled individuals who meet the eligibility requirements. Also known asMedicare Part A.
• Supplementary Medical Insurance (SMI). The Medicare trust fundcomposed of the Part B Account, the Part D Account, and the Transi-tional Assistance Account. The Part B Account pays for a portion of thecosts of physicians’ services, outpatient hospital services, and otherrelated medical and health services for voluntarily enrolled aged anddisabled individuals. The Part D Account pays private plans to provideprescription drug coverage, beginning in 2006. The Transitional Assis-tance Account paid for transitional assistance under the prescriptiondrug card program in 2004 and 2005.
Trust fund ratio. A measure of the adequacy of the trust fund level. Definedas the assets at the beginning of a year, including advance tax transfers (ifany), expressed as a percentage of the cost during the year. The trust fundratio represents the proportion of a year’s cost which could be paid with thefunds available at the beginning of a year.Unfunded obligation. See “Open group unfunded obligation” and “Closedgroup unfunded obligation”.Unnegotiated check. A check which has not been cashed 6 months after theend of the month in which the check was issued. When a check has been out-standing for a year (i) the check is administratively cancelled by the Depart-ment of the Treasury and (ii) the issuing trust fund is reimbursed separatelyfor the amount of the check and interest for the period the check was out-standing. The appropriate trust fund also receives an interest adjustment forthe time the check was outstanding if it is cashed 6-12 months after themonth of issue. If a check is presented for payment after it is administrativelycancelled, a replacement check is issued.Valuation period. A period of years which is considered as a unit for pur-poses of calculating the financial status of a trust fund.
Appendices
220
Vocational rehabilitation. Services provided to disabled persons to helpenable them to return to gainful employment. Reimbursement from the trustfunds for the costs of such services is made only in those cases where the ser-vices contributed to the successful rehabilitation of the beneficiaries.Year of exhaustion. The year in which a trust fund would become unable topay benefits when due because the assets of the fund were exhausted.

List of Tables
221
II. OVERVIEWII.B1 Summary of 2008 Trust Fund Financial Operations . . . . . . . . 5II.B2 Tax Rates for 2008 and Later . . . . . . . . . . . . . . . . . . . . . . . . 5II.C1 Ultimate Values of Key Demographic and Economic
Assumptions for the Long-Range (75-year) ProjectionPeriod . . . . . . . . . . . . . . . . . . . . . . . . . . . . . . . . . . . . . . . . . 7
II.D1 Projected Maximum Trust Fund Ratios Attained andTrust Fund Exhaustion Dates Under the IntermediateAssumptions . . . . . . . . . . . . . . . . . . . . . . . . . . . . . . . . . . . . 11
II.D2 Reasons for Change in the 75-Year Actuarial BalanceUnder Intermediate Assumptions . . . . . . . . . . . . . . . . . . . . . 17
III. FINANCIAL OPERATIONS OF THE TRUST FUNDS ANDLEGISLATIVE CHANGES IN THE LAST YEAR
III.A1 Operations of the OASI Trust Fund, Calendar Year 2008 . . . . 22III.A2 Operations of the DI Trust Fund, Calendar Year 2008 . . . . . . . 26III.A3 Operations of the Combined OASI and DI Trust Funds,
Calendar Year 2008 . . . . . . . . . . . . . . . . . . . . . . . . . . . . . . . 28III.A4 Comparison of Actual Calendar Year 2008 Trust Fund
Operations With Estimates Made in Prior Reports . . . . . . . . . 29III.A5 Distribution of Benefit Payments by Type of Beneficiary or
Payment, Calendar Years 2007 and 2008 . . . . . . . . . . . . . . . . 30III.A6 Administrative Expenses as a Percentage of Contribution
Income and of Total Expenditures,Calendar Years 2004-08 . . . . . . . . . . . . . . . . . . . . . . . . . . . . 31
III.A7 Trust Fund Investment Transactions, Calendar Year 2008 . . . . 31
IV. ACTUARIAL ESTIMATESIV.A1 Operations of the OASI Trust Fund, Calendar Years 2004-18 . 36IV.A2 Operations of the DI Trust Fund, Calendar Years 2004-18 . . . 39IV.A3 Operations of the Combined OASI and DI Trust Funds,
Calendar Years 2004-18 . . . . . . . . . . . . . . . . . . . . . . . . . . . . 41IV.A4 Reasons for Change in Trust Fund Ratios at the Beginning
of the Tenth Year of Projection . . . . . . . . . . . . . . . . . . . . . . . 43IV.B1 Annual Income Rates, Cost Rates, and Balances,
Calendar Years 1990-2085 . . . . . . . . . . . . . . . . . . . . . . . . . . 47IV.B2 Covered Workers and Beneficiaries, Calendar Years 1945-2085 51
List of Tables
222
IV.B3 Trust Fund Ratios, Calendar Years 2009-85 . . . . . . . . . . . . . . 56IV.B4 Components of Summarized Income Rates and Cost Rates,
Calendar Years 2009-83 . . . . . . . . . . . . . . . . . . . . . . . . . . . . 60IV.B5 Components of 75-Year Actuarial Balance
Under Intermediate Assumptions . . . . . . . . . . . . . . . . . . . . . 61IV.B6 Unfunded OASDI Obligations for 1935 (Program Inception)
Through the Infinite Horizon . . . . . . . . . . . . . . . . . . . . . . . . 63IV.B7 Present Values of OASDI Cost Less Tax Revenue and
Unfunded Obligations for Program Participants . . . . . . . . . . . 64IV.B8 Comparison of Long-Range Actuarial Balances With the
Minimum Allowable in the Test for Close Actuarial Balance,Based on Intermediate Assumptions . . . . . . . . . . . . . . . . . . . 67
IV.B9 Reasons for Change in the 75-Year Actuarial BalanceUnder Intermediate Assumptions . . . . . . . . . . . . . . . . . . . . . 69
V. ASSUMPTIONS AND METHODS UNDERLYINGACTUARIAL ESTIMATES
V.A1 Principal Demographic Assumptions,Calendar Years 1940-2085 . . . . . . . . . . . . . . . . . . . . . . . . . . 83
V.A2 Social Security Area Population as of July 1 andDependency Ratios, Calendar Years 1950-2085 . . . . . . . . . . . 85
V.A3 Period Life Expectancy . . . . . . . . . . . . . . . . . . . . . . . . . . . . 88V.A4 Cohort Life Expectancy . . . . . . . . . . . . . . . . . . . . . . . . . . . . 89V.B1 Principal Economic Assumptions . . . . . . . . . . . . . . . . . . . . . 96V.B2 Additional Economic Factors . . . . . . . . . . . . . . . . . . . . . . . . 103V.C1 Cost-of-Living Benefit Increases, Average Wage Index,
Contribution and Benefit Bases, and Retirement EarningsTest Exempt Amounts, 1975-2018 . . . . . . . . . . . . . . . . . . . . 107
V.C2 Values for Selected Wage-Indexed Program Parameters, Calendar Years 1978-2018 . . . . . . . . . . . . . . . . . . . . . . . . . . 110
V.C3 Legislated Changes in Normal Retirement Age and Delayed Retirement Credits, for Persons Reaching Age 62 inEach Year 1986 and Later . . . . . . . . . . . . . . . . . . . . . . . . . . . 112
V.C4 OASI Beneficiaries With Benefits in Current-Payment Statusat the End of Calendar Years 1945-2085 . . . . . . . . . . . . . . . . 121
V.C5 DI Beneficiaries With Benefits in Current-Payment Statusat the End of Calendar Years 1960-2085 . . . . . . . . . . . . . . . . 129

List of Tables
223
VI. APPENDICES
A. HISTORY OF OASI AND DI TRUST FUND OPERATIONSVI.A1 Contribution and Benefit Base and Contribution Rates . . . . . . 137VI.A2 Operations of the OASI Trust Fund,
Calendar Years 1937-2008 . . . . . . . . . . . . . . . . . . . . . . . . . . 141VI.A3 Operations of the DI Trust Fund,
Calendar Years 1957-2008 . . . . . . . . . . . . . . . . . . . . . . . . . . 143VI.A4 Operations of the Combined OASI and DI Trust Funds,
Calendar Years 1957-2008 . . . . . . . . . . . . . . . . . . . . . . . . . . 145VI.A5 Assets of the OASI Trust Fund, End of Calendar Years
2007 and 2008 . . . . . . . . . . . . . . . . . . . . . . . . . . . . . . . . . . . 147VI.A6 Assets of the DI Trust Fund, End of Calendar Years
2007 and 2008 . . . . . . . . . . . . . . . . . . . . . . . . . . . . . . . . . . . 148
B. HISTORY OF ACTUARIAL BALANCE ESTIMATESVI.B1 Long-Range OASDI Actuarial Balances as Shown
in the Trustees Reports for 1982-2009 . . . . . . . . . . . . . . . . . . 151
C. FISCAL YEAR HISTORICAL DATA ANDPROJECTIONS THROUGH 2018
VI.C1 Operations of the OASI Trust Fund, Fiscal Year 2008. . . . . . . 154VI.C2 Operations of the DI Trust Fund, Fiscal Year 2008 . . . . . . . . . 155VI.C3 Operations of the Combined OASI and DI Trust Funds,
Fiscal Year 2008 . . . . . . . . . . . . . . . . . . . . . . . . . . . . . . . . . 156VI.C4 Operations of the OASI Trust Fund in Fiscal Years 2004-18 . . 157VI.C5 Operations of the DI Trust Fund in Fiscal Years 2004-18 . . . . 158VI.C6 Operations of the Combined OASI and DI Trust Funds in
Fiscal Years 2004-18 . . . . . . . . . . . . . . . . . . . . . . . . . . . . . . 159
D. LONG-RANGE SENSITIVITY ANALYSISVI.D1 Sensitivity to Varying Fertility Assumptions . . . . . . . . . . . . . 161VI.D2 Sensitivity to Varying Death-Rate Assumptions . . . . . . . . . . . 162VI.D3 Sensitivity to Varying Net-Immigration Assumptions . . . . . . . 164VI.D4 Sensitivity to Varying Real-Wage Assumptions . . . . . . . . . . . 165VI.D5 Sensitivity to Varying CPI-Increase Assumptions . . . . . . . . . . 166VI.D6 Sensitivity to Varying Real-Interest Assumptions . . . . . . . . . . 167VI.D7 Sensitivity to Varying Disability Incidence Assumptions. . . . . 168VI.D8 Sensitivity to Varying Disability Termination Assumptions . . . 170

List of Tables
224
E. STOCHASTIC PROJECTIONSVI.E1 Long-Range Estimates Relating to the Actuarial Status of the
Combined OASDI Program . . . . . . . . . . . . . . . . . . . . . . . . . 176
F. ESTIMATES FOR OASDI AND HI,SEPARATE AND COMBINED
VI.F1 Contribution Rates for the OASDI and HI Programs. . . . . . . . 178VI.F2 OASDI and HI Annual Income Rates, Cost Rates,
and Balances, Calendar Years 2009-85 . . . . . . . . . . . . . . . . . 179VI.F3 Summarized OASDI and HI Income Rates and Cost Rates for
Valuation Periods, Calendar Years 2009-83 . . . . . . . . . . . . . . 181VI.F4 OASDI and HI Annual and Summarized Income, Cost, and
Balance as a Percentage of GDP, Calendar Years 2009-85 . . . 184VI.F5 Ratio of OASDI Taxable Payroll to GDP,
Calendar Years 2009-85 . . . . . . . . . . . . . . . . . . . . . . . . . . . . 186VI.F6 Selected Economic Variables, Calendar Years 2008-85 . . . . . . 189VI.F7 Operations of the Combined OASI and DI Trust Funds,
in Constant 2009 Dollars, Calendar Years 2009-85 . . . . . . . . . 191VI.F8 Operations of the Combined OASI and DI Trust Funds,
in Current Dollars, Calendar Years 2009-85 . . . . . . . . . . . . . . 193VI.F9 OASDI and HI Annual Income Excluding Interest, Cost, and
Balance in Current Dollars, Calendar Years 2009-85 . . . . . . . 195VI.F10 Annual Scheduled Benefit Amounts for Retired Workers
With Various Pre-Retirement Earnings PatternsBased on Intermediate Assumptions,Calendar Years 2009-85 . . . . . . . . . . . . . . . . . . . . . . . . . . . . 198
G. ANALYSIS OF BENEFIT DISBURSEMENTSFROM THE OASI TRUST FUND WITH
RESPECT TO DISABLED BENEFICIARIESVI.G1 Benefit Disbursements From the OASI Trust Fund
With Respect to Disabled Beneficiaries . . . . . . . . . . . . . . . . . 201VI.G2 Benefit Disbursements Under the OASDI Program
With Respect to Disabled Beneficiaries . . . . . . . . . . . . . . . . . 202

List of Figures
225
II. OVERVIEWII.D1 Short-Range OASDI Trust Fund Ratios . . . . . . . . . . . . . . . . . 8II.D2 OASDI Income and Cost Rates Under Intermediate
Assumptions . . . . . . . . . . . . . . . . . . . . . . . . . . . . . . . . . . . . 9II.D3 Number of Covered Workers Per OASDI Beneficiary. . . . . . . 10II.D4 Cumulative OASDI Income Less Cost, Based on
Present Law Tax Rates and Scheduled Benefits . . . . . . . . . . . 12II.D5 OASDI Cost and Scheduled Tax Revenue as a
Percentage of GDP. . . . . . . . . . . . . . . . . . . . . . . . . . . . . . . . 13II.D6 Long-Range OASDI Trust Fund Ratios Under
Alternative Assumptions . . . . . . . . . . . . . . . . . . . . . . . . . . . 15II.D7 Annual Trust Fund Ratios . . . . . . . . . . . . . . . . . . . . . . . . . . . 16II.D8 OASDI Annual Balances: 2008 and 2009 Trustees Reports . . . 18
IV. ACTUARIAL ESTIMATESIV.A1 Short-Range OASI and DI Trust Fund Ratios . . . . . . . . . . . . . 35IV.B1 Long-Range OASI and DI Annual Income Rates and
Cost Rates . . . . . . . . . . . . . . . . . . . . . . . . . . . . . . . . . . . . . . 50IV.B2 Number of OASDI Beneficiaries Per 100 Covered Workers . . 53IV.B3 Long-Range OASI and DI Trust Fund Ratios . . . . . . . . . . . . . 57IV.B4 Test of Long-Range Close Actuarial Balance . . . . . . . . . . . . . 68IV.B5 OASDI Annual Balances: 2008 and 2009 Trustees Reports . . . 73
V. ASSUMPTIONS AND METHODS UNDERLYINGACTUARIAL ESTIMATES
V.C1 Primary-Insurance-Amount Formula for ThoseNewly Eligible in 2009. . . . . . . . . . . . . . . . . . . . . . . . . . . . . 109
V.C2 Maximum-Family-Benefit Formula for ThoseNewly Eligible in 2009. . . . . . . . . . . . . . . . . . . . . . . . . . . . . 109
V.C3 DI Disability Incidence Rates, 1970-2085 . . . . . . . . . . . . . . . 125V.C4 DI Disability Termination Rates, 1970-2085 . . . . . . . . . . . . . 127V.C5 Comparison of DI Disability Incidence Rates,
Termination Rates and Conversion Ratios UnderIntermediate Assumptions, 1970-2085. . . . . . . . . . . . . . . . . . 128
V.C6 DI Disability Prevalence Rates, 1970-2085 . . . . . . . . . . . . . . 131
List of Figures
226
VI. APPENDICESVI.E1 Annual Trust Fund Ratios . . . . . . . . . . . . . . . . . . . . . . . . . . . 174VI.E2 Annual Cost Rates . . . . . . . . . . . . . . . . . . . . . . . . . . . . . . . . 175VI.F1 Estimated OASDI Income and Cost in Constant Dollars,
Based on Intermediate Assumptions . . . . . . . . . . . . . . . . . . . 192

227
Index
AActuarial balance 9, 11, 44, 113, 149, 160Actuarial balance, long-range test 67Actuarial deficit 2, 11, 19, 59, 181Actuarial estimates, LR 44Actuarial estimates, SR 33Adjusted program amounts 105Administrative expenses 5, 30, 45, 133, 140, 154, 182, 190Advance tax transfers 54, 142Amendments 32Annual balance 17, 44, 69Assets 2, 5, 8, 24, 33, 45, 140, 154, 167, 177, 188Assumptions 2, 8, 45, 74, 90, 105, 149, 160, 178, 182, 187, 200Automatic cost-of-living benefit increase 5, 37, 92, 105Auxiliary benefits 115Average benefits 133Average earnings assumptions 94Average indexed monthly earnings (AIME) 108Average wage index 105, 187Award 116
BBaby-boom generation 2, 19, 38, 46, 50, 98, 124, 132, 183Bend points 108Beneficiaries, DI 122Beneficiary 10, 37, 50, 74, 106, 152, 161, 182, 190, 200Beneficiary, OASI 116Benefit payments 5, 9, 34, 45, 133, 140, 154, 167, 182, 190, 202Benefit termination 7, 38Best estimate 7, 19, 33, 74Board of Trustees 33, 90, 136
CClose actuarial balance 44, 64Closed group unfunded obligation 63, 64, 206Constant dollars 192Consumer Price Index 92, 166, 187, 205Contribution and benefit base 35, 94, 106, 137, 187, 205Contributions 5, 136, 154, 177, 182, 190, 204Cost rate 3, 9, 45, 113, 177Cost-of-living adjustment 105Covered earnings 5, 105, 186Covered employment 7, 35, 94, 112, 136, 165Covered worker 52, 112, 163
Index
228
Creditable earnings 207Current dollars 187Current-payment status 37, 123, 127, 128, 129, 205
DDeemed wage credit 45, 113Delayed retirement credit 111Demographic assumptions 7, 17, 33, 45, 75, 98, 105, 149, 188, 204Deterministic model 171, 176, 208DI beneficiaries 122Disability 136, 163, 200Disability conversion ratio 127Disability incidence rate 74, 123, 125, 163, 168, 204Disability Insurance Trust Fund 206Disability prevalence rate 123, 129, 131, 132Disability termination rate 169Disabled-worker benefit 125, 208Disbursements 21, 22, 23, 26, 28, 33, 154, 155, 156, 201, 202
EEarnings 2, 5, 34, 45, 94, 106, 136, 150, 177, 186, 187, 204Earnings test 94, 106, 205Economic assumptions 7, 17, 33, 42, 45, 90, 98, 105, 149, 188, 204Excess wages 45, 113, 188Expenditures 2, 5, 7, 25, 31, 33, 37, 40, 140, 141, 143, 145, 208
FFederal Insurance Contributions Act 177, 206Fertility assumptions 76Financial interchange 5, 134, 140Fiscal year 79, 142, 154Full advance funding 209
GGeneral Fund of the Treasury 36, 37, 138, 182, 190, 204General fund reimbursement 209Gross domestic product 3, 50, 74, 91, 182Gross domestic product projections 100
HHigh-cost assumptions 7, 14, 34, 46, 74, 90, 126, 160, 178, 182, 187, 204Hospital Insurance program 137, 177, 212Hospital Insurance Trust Fund 182

229
Index
IImmigration 7, 74, 75, 79, 83, 163, 171, 204, 210Immigration assumptions 79Income rate 3, 9, 45, 177Inflation 7, 74, 92, 187, 204Inflation assumptions 92Insured population 7, 114Insured status 110Interest 34, 101, 139, 149, 154, 178, 182, 188, 204Interest rate 35, 74, 149, 167, 188, 204Interest rate projections 101Interfund borrowing 142, 207Intermediate assumptions 33, 35, 37, 46, 74, 126, 160, 178, 182, 187, 191,192, 193, 200, 204
LLabor force projections 98Legal immigration 79, 84, 211Life expectancy 2, 19, 74, 87, 98, 211Life expectancy estimates 86Long range 9, 44, 75, 90, 117, 149, 177, 182, 187Low-cost assumptions 7, 14, 46, 74, 126, 160, 178, 187, 204Lump-sum death payment 133
MMedicare 77, 212Military service 36, 45, 94, 113, 134, 136, 209
NNational average wage index 105, 187Normal retirement age 106, 122, 196, 208
OOASI beneficiaries 116Old-Age and Survivors Insurance Trust Fund 136, 206Old-law base 110Open group unfunded obligation 2, 9, 17, 44, 60, 61, 176, 206, 212Other immigration 79, 164, 213

Index
230
PPar value 139Partial advance funding 213Pay-as-you-go financing 149Payroll taxes 2, 19, 58, 59, 105, 113, 152, 160, 177, 190Population estimates 84Population in the Social Security area 35, 53, 84, 98, 112, 164Present value 149Primary insurance amount (PIA) 108Productivity assumptions 91
QQuarters of coverage 114
RRailroad Retirement 45, 110, 134, 140, 154, 177, 182, 190, 207Reallocation of tax rates 214Real-wage differential 95, 164Recession 33, 90Retired-worker benefit 116, 163, 200Retirement age 38, 106, 196, 208Retirement earnings test 94, 106Retirement eligibility age 1, 163, 183
SSelf-employment 45, 92, 113, 136, 178, 206Self-Employment Contributions Act 32, 206, 215Sensitivity analysis 160Short range 8, 33, 54, 90, 116Social Security Act 105, 139, 187, 200, 206Social Security amendments 32Solvency 13, 34, 44, 215Special public-debt obligation 37, 104, 139, 167, 188Stochastic projections 171Substantial gainful activity 122, 208Summarized balance 183Summarized income and cost rates 58, 149, 160, 180, 204Supplemental Security Income 154Supplementary Medical Insurance program 177, 212Survivor benefit 2, 6, 120, 205

231
Index
TTaxable earnings 34, 53, 106, 136, 150, 186, 205Taxable payroll 2, 9, 19, 45, 92, 113, 149, 161, 177, 182, 187, 207Taxable self-employment income 136, 217Taxable wages 114, 138, 217Taxation of benefits 5, 45, 134, 182, 190, 210Taxes 5, 105, 136, 178, 207Termination 38, 74Termination rate 7, 38, 116, 169, 204Test of short-range financial adequacy 34, 65, 215Total fertility rate 76, 160Trust fund financial operations 5, 21, 34, 136Trust fund ratio 8, 33, 44, 53, 142, 157, 219
UUnemployment projections 98Unfunded obligation 2, 9, 11, 13, 17, 44, 60, 61, 64, 176, 206, 212, 219Unnegotiated check 142, 154
VValuation period 11, 44, 149, 160, 180, 204Vocational rehabilitation 45, 140, 155, 182, 190, 202, 207
YYear of exhaustion 9, 11, 19, 44, 56

232
STATEMENT OF ACTUARIAL OPINION
It is my opinion that (1) the techniques and methodology used herein to eval-uate the financial and actuarial status of the Federal Old-Age and SurvivorsInsurance and Disability Insurance Trust Funds are based upon sound princi-ples of actuarial practice and are generally accepted within the actuarial pro-fession; and (2) the assumptions used and the resulting actuarial estimatesare, individually and in the aggregate, reasonable for the purpose of evaluat-ing the financial and actuarial status of the trust funds, taking into consider-ation the past experience and future expectations for the population, theeconomy, and the program.
Stephen C. Goss,
Associate of the Society of Actuaries,Member of the American Academy of Actuaries,Chief Actuary, Social Security Administration