Embed Size (px)
Citation preview

The 2008 HMDA Data: The Mortgage Market during a Turbulent Year
Robert B. Avery, Neil Bhutta, Kenneth P. Brevoort, Glenn B. Canner, and Christa N.
Gibbs, of the Division of Research and Statistics, prepared this article. Cheryl R. Cooper and
Christine Coyer provided research assistance.
[Note: This article is forthcoming in the Federal Reserve Bulletin.]
The Home Mortgage Disclosure Act of 1975 (HMDA) requires most mortgage lending
institutions with offices in metropolitan areas to publicly disclose information about their home-
lending activity. The information includes the disposition of applications for mortgage credit,
the characteristics of the home mortgages that lenders originate or purchase during a calendar
year, the location of the properties related to those loans, and personal demographic and other
information about the borrowers.1 The disclosures are intended not only to help the public
determine whether institutions are adequately serving their communities’ housing finance needs,
but also to facilitate enforcement of the nation’s fair lending laws and to inform investment in
both the public and private sectors.
The Federal Reserve Board implements the provisions of HMDA through regulation.2
The Federal Financial Institutions Examination Council (FFIEC) is responsible for collecting the
HMDA data and facilitating public access to the information.3 Each September, the FFIEC
releases summary tables pertaining to lending activity from the previous calendar year for each
reporting lender and aggregations of home-lending activity for each metropolitan statistical area
1 A description of the items reported under HMDA is provided in appendix A. 2 HMDA is implemented by Regulation C (12 C.F.R. pt. 203) of the Federal Reserve Board. Information
about the regulation is available at www.federalreserve.gov. 3 The FFIEC (www.ffiec.gov) was established by federal law in 1979 as an interagency body to prescribe
uniform examination procedures and to promote uniform supervision among the federal agencies responsible for the examination and supervision of financial institutions. The member agencies are the Board of Governors of the Federal Reserve System, the Federal Deposit Insurance Corporation, the National Credit Union Administration, the Office of the Comptroller of the Currency, the Office of Thrift Supervision, and representatives from state bank supervisory agencies.

2008 HMDA Data
2
(MSA) and for the nation as a whole.4 The FFIEC also makes available a consolidated data file
containing virtually all the reported information for each lending institution.5
The 2008 HMDA data consist of information reported by about 8,400 home lenders,
including all of the nation’s largest mortgage originators. The loans reported are estimated to
represent the majority of home lending nationwide. Thus, they likely provide a broadly
representative picture of home lending in the United States.
This article presents a number of findings from our initial review of the 2008 HMDA
data. Three of those findings are noted here. First, the 2008 HMDA data reflect the ongoing
difficulties in the housing and mortgage markets. Reported loan application and origination
volumes fell sharply from 2007 to 2008 after already falling considerably from 2006 to 2007.
The reduction in lending occurred among all groups of borrowers regardless of race, ethnicity, or
income, although lending for some groups declined more sharply than for others.
Second, the Federal Housing Administration’s (FHA) role in the mortgage market
expanded considerably during 2008. The increasing use of FHA-insured loans in 2008 appears
to be related to a number of factors, including difficulties faced by private mortgage insurers and
their pullback from the marketplace.
Third, atypical changes in the interest rate environment, related primarily to widening
spreads between the yields on Treasury securities and the interest rates on prime mortgage loans,
resulted in a large number of loans being reported as higher priced in 2008 that would not have
been so reported a year earlier. As a result, the decline in the incidence of reported higher-priced
lending between 2007 and 2008 actually understates the true extent of the decline in higher-
priced lending. Because the FHA insured substantially more loans in the second half of the year,
when the distortions in the reporting of higher-priced loans were the largest, the effect of these
distortions on the reported incidence of FHA higher-priced lending was particularly significant.
4 For the 2008 data, the FFIEC prepared and made available to the public more than 51,100 MSA-specific
HMDA reports on behalf of reporting institutions. The FFIEC also makes available to the public reports about private mortgage insurance (PMI) activity. Details about the PMI data are provided in appendix B of this article. All the HMDA and PMI reports are available on the FFIEC’s reports website at www.ffiec.gov/reports.htm.
5 The only reported items not included in the data made available to the public are the loan application number, the date of application, and the date on which action was taken on the application. Those items are withheld to help ensure that the individuals involved in the application cannot be identified.

2008 HMDA Data
3
2008: A TURBULENT YEAR
The 2008 HMDA data reflect a sharp deterioration in economic conditions during the year. The
housing market’s continued decline was reflected in the Federal Housing Finance Agency’s
(FHFA) nationwide home price index, which posted a year-over-year decline of more than
8 percent by November 2008, compared with less than 3 percent in January. At the same time,
mortgage-related losses continued to weigh on the confidence of investors and the health of
financial institutions. A number of major financial institutions either failed, merged under
distress, or received government assistance. The government-sponsored enterprises (GSEs)
Fannie Mae and Freddie Mac were placed into conservatorship by the FHFA in September.6
Difficulties in the housing and financial markets advanced into a broad-based economic
recession.7 By December 2008, the unemployment rate had risen to 7.2 percent from 4.9 percent
a year earlier, and the number of employed individuals fell by nearly 3 million during the year.8
The deterioration in household income and wealth as well as fears about buying into a falling
market may have weakened demand for housing and mortgages.
On the supply side, strained lending institutions, facing the risks posed by falling home
prices and a weakening economy, were apprehensive or unable to offer loans that did not have
some form of government backing. Potential borrowers, especially those with blemished credit
histories and those seeking “jumbo” mortgages, likely found it more difficult than in previous
years to obtain a mortgage.9 Those with adequate credit histories but little money for a down
payment also faced a more challenging situation since private mortgage insurance (PMI)
companies, which suffered large losses in 2007 and 2008, tightened their standards and raised
prices.10 Lenders also sharply curtailed the issuance of second-lien loans used heavily in
6 To maintain the GSEs’ ability to purchase home mortgages, the Treasury announced plans to establish a
backstop lending facility for the GSEs, to purchase up to $100 billion of preferred stock in each of the two firms, and to initiate a program to purchase agency mortgage-backed securities. See Board of Governors of the Federal Reserve System (2009), Monetary Policy Report to the Congress (Washington: Board of Governors, February), www.federalreserve.gov/monetarypolicy/mpr_20090224_part1.htm.
7 The National Bureau of Economic Research declared the start of the recession as December 2007. 8 Employment statistics from the Bureau of Labor Statistics; based on individuals 16 years or older. 9 Industry sources indicate that the dollar amount of originations of subprime loans fell 88 percent from
2007 to 2008, to a level of $23 billion. Jumbo loans are loans that exceed the size limits set for loans that Fannie Mae and Freddie Mac are permitted to purchase (commonly referred to as conforming loans). Available data indicate that the dollar amount of originations of jumbo loans fell 72 percent from 2007 to 2008, to a level of $97 billion. See Inside Mortgage Finance (2009), The 2009 Mortgage Market Statistical Annual, Vol. 1: The Primary Market (Bethesda, Md.: Inside Mortgage Finance Publications).
10 See Mortgage Insurance Companies of America (2009), 2009–2010 Fact Book & Member Directory (Washington: MICA), www.privatemi.com/news/factsheets/2009-2010.pdf.

2008 HMDA Data
4
previous years to help finance home purchases. Partly in response to difficulties in the private
market, the government raised the size limits on loans eligible to be purchased by Fannie Mae or
Freddie Mac and insured by the FHA as well as the guarantee limit for loans backed by the
Department of Veterans Affairs (VA) as part of the Economic Stimulus Act of 2008.
MORTGAGE MARKET TRENDS FROM THE HMDA DATA
For 2008, 8,388 institutions reported under HMDA: 3,942 commercial banks, 913 savings
institutions (savings and loans and savings banks), 2,026 credit unions, and 1,507 mortgage
companies (table 1). 11 The number of reporting institutions fell nearly 3 percent from 2007,
primarily because of a relatively large decline in the number of independent mortgage
companies—that is, mortgage companies that were neither subsidiaries of depository institutions
nor affiliates of bank or savings institution holding companies that reported data.
Fifteen institutions that reported data in 2007 ceased operations during 2008 or early 2009 and
did not report data on their 2008 lending activity.
Reporting lenders submitted information on 14.2 million applications for home loans of
all types in 2008, down 34 percent from 2007 and almost 50 percent from 2006 (table 2).
Lenders also reported information on 2.9 million loans that they had purchased from other
institutions and on 276,000 requests for preapprovals of home-purchase loans that did not result
in an application for a loan (preapproval data not shown in table).
The top panel of figure 1, which shows the monthly counts of loans, indicates a
downward trend in home-purchase lending from 2006 to 2008.12 For instance, the 2006 peak
month for home-purchase lending (in June) was more than 400,000 loans, compared with less
11 Not all mortgage lenders have to provide HMDA data. Depositories must have had an office in a
metropolitan area and had assets of more than $37,000,000 at the end of 2007 to report data for 2008. For filing year 2008, 55.7 percent of the commercial banks in existence on December 31, 2008, filed HMDA data. However, the filers had 93.0 percent of the total mortgage dollars outstanding on commercial bank portfolios at that time. For savings institutions, 70.9 percent of existing institutions holding 94.1 percent of the mortgage dollars filed. For credit unions, only 25.4 percent of the institutions filed; however, these institutions held 92.5 percent of the mortgage dollars outstanding on credit union balance sheets.
Independent mortgage banks needed to meet other criteria related to their dollar volume of mortgage lending, the share of mortgage lending of their total lending, and their lending in metropolitan areas to be eligible for reporting. There is no comprehensive list of independent mortgage lenders, so it is difficult to know the full scope of HMDA data coverage of such lenders.
12 Lenders report the date on which action on an application is taken. For originations, the “action taken” date is the closing date or date of loan origination for the loan. This date is the one we use to compile data at the monthly level. To help ensure the anonymity of the data, these dates are not released in the publically available HMDA data.

2008 HMDA Data
5
than 300,000 loans at the peak month (June) in 2008. The bottom panel of figure 1 indicates that
refinance lending jumped at the beginning of 2008 to a level in February exceeding any month in
2006 or 2007. Refinance lending then fell sharply during the remainder of 2008. Figure 1 also
shows that the annual percentage rate (APR) for a 30-year fixed-rate prime mortgage fell sharply
at the end of 2007 to levels not seen in several years; it continued to fall in early 2008 and dipped
below 6 percent in January 2008, which may have triggered the jump in refinance lending.13
The Potential Effect of Nonreporters on Lending Volume in the 2008 HMDA Data
As part of the HMDA data collection effort, the Federal Reserve Board tracks each financial
institution that is expected to report (including all lenders that reported data for the previous
calendar year) and then contacts those that did not submit a report.14 In some cases, nonreporting
is due to a cessation of business; in others, it is the result of a merger, acquisition, or
consolidation. When a merger, acquisition, or consolidation occurs, all lending by the
institutions covered by HMDA in that year is reported by the surviving entity; only when an
institution goes out of business is the volume of reported loans possibly affected.
The Federal Reserve’s respondent tracking report records what happened to each
institution that failed to report. For institutions that ceased operations, the tracking report also
records, to the extent possible, the month that operations were discontinued. The tracking report
indicates that 15 institutions that reported HMDA data for 2007 ceased operations during 2008 or
at the beginning of 2009 and did not report lending activity for 2008.15 Of the 15 nonreporting
institutions, 3 were banking institutions and 12 were independent mortgage companies.
Although it is not possible to know how many loans these 15 institutions originated in
2008 before discontinuing operations, one can gauge their potential importance by measuring
their lending activity in 2007. In the aggregate, these 15 nonreporting companies accounted for
about 5 percent of all conventional first-lien loans for site-built properties in the 2007 HMDA
13 The APRs for prime loans are based on data from Freddie Mac’s Primary Mortgage Market Survey and
reflect interest rates and points offered to consumers during the first three days of each week. For more details, see note 29. Loan counts in figure 1 are aggregated to the monthly level using the date of loan origination, as opposed to an earlier date when the interest rate for the loan was locked. If the HMDA data were aggregated using the “lock” date, the spike in refinancings would likely occur closer to the January dip in the APR.
14 Sometimes contacting a nonreporting lender is impossible because the firm has ceased operations. 15 The list of lenders that ceased operations and did not report is as comprehensive as possible at this time.
If additional information becomes available, the list will be updated on the Federal Reserve Board’s website. For a list of the institutions that ceased operations and did not report, see appendix table A.1, which has been posted separately as an Excel file.

2008 HMDA Data
6
data (data not shown in tables).16 The tracking reports indicate that the 15 nonreporting
institutions had exited the marketplace by the middle of 2008, so their effects on the
completeness of the HMDA data are confined to the first half of the year.
Government-Backed Lending
Government-backed loans—those insured by the FHA and those backed by guarantees from the
VA, the Farm Service Agency, or the Rural Housing Service—rose in 2008 relative to 2007.
The rise in FHA-insured lending was particularly large. The number of reported FHA-insured
loans was almost three times greater in 2008 than in 2007, and the FHA-insured share of home-
purchase and refinance loans rose to more than 21 percent in 2008 from less than 6 percent in
2007 (table 3).17 Moreover, by December of 2008, the FHA’s share of home-purchase and
refinance lending was about 30 percent (data not shown in tables).
Lenders typically require borrowers to purchase mortgage insurance (through the FHA or
PMI companies) or a credit guarantee (through the VA, for example) when the borrower
provides a small down payment.18 Such credit enhancements protect lenders against loss if the
borrower defaults.
The VA guarantees a percentage of the loan amount up to a certain limit (but with no cap
on the loan size), while the FHA cannot insure mortgages that are larger than legislated limits.
Historically, these limits have been set at levels that were sufficiently low that many homebuyers
in areas with high home prices have not been able to use these programs. Under the Economic
Stimulus Act of 2008, the limits were raised in high-cost areas. In a later section, “The Surge in
FHA and VA Lending,” we will analyze more closely the contribution of increased limits to the
increase in FHA and VA-backed lending. We will also examine whether difficulties facing PMI
companies contributed to the shift to government-backed lending.
16 Market shares reported in this article are based on the number of loans and not the dollar amounts. 17 Loans are for owner-occupied, one- to four-family properties. Junior-lien loans and loans for
manufactured homes are included because the HMDA data prior to 2004 do not separately identify these loans. The FHA share of home-purchase and refinance lending in 2008, excluding junior-lien and manufactured-home loans, was 22.5 percent.
18 For more details about PMI, see appendix B, “Private Mortgage Insurance Data.”

2008 HMDA Data
7
Loan Sales
The HMDA data document the importance of the secondary market for home loans. Just over
73 percent of the first-lien home loans reported in 2008 were sold during the same year (table
4).19 Notably, the rise in government-backed lending between 2007 and 2008 described earlier
has resulted in a sharp increase in the proportion of loans sold into pools guaranteed by the
Government National Mortgage Association (Ginnie Mae).
More prominent in the secondary market are the GSEs. For the most part, the purchases
made by Fannie Mae and Freddie Mac consist of conventional loans originated to purchase
homes or to refinance existing loans. Fannie Mae and Freddie Mac are restricted by law to
purchase mortgages with origination balances below a specific amount, known as the
conforming loan limit. As with the FHA loan limits mentioned earlier, the Economic Stimulus
Act of 2008 increased the conforming loan limits.20
In 2008, sales to Fannie Mae and Freddie Mac accounted for about 42 percent of the
loans reported as sold, compared with about 28 percent in 2006. At least in part, this increase in
market share reflects the reduction during this period in the higher-priced share of loans, which
the GSEs typically do not purchase directly. Higher-priced loans were often sold through the
private securitization process; indeed, loans sold through this process diminished considerably,
from about 10 percent of sold loans in 2006 to less than 1 percent in 2008.
Credit Unions
A credit union is a cooperative financial institution formed by a group of people with a common
bond, such as employees of a firm or members of a religious organization, university, or
governmental entity.21 Members of a credit union pool their funds to extend credit to their
fellow members. In 2008, about 7,700 credit unions across the country served upward of
90 million members. The vast majority of credit unions are small measured by asset size, and
many do little home lending. As such, only about 2,000 credit unions report under HMDA each
year (table 1).
Unlike other types of lenders, credit unions have not experienced a significant reduction 19 Loans that are sold in a different calendar year than the year of origination are recorded as being held in
the lender’s portfolio in the HMDA data. 20 For more on the conforming loan limit, see www.fhfa.gov/Default.aspx?Page=185. 21 The notion of a common bond has been expanded some in recent years, for example, to include
individuals from broad geographic areas.

2008 HMDA Data
8
in home-lending activity over the past couple of years (table 5). As a consequence, their share of
one- to four-family site-built HMDA loans has risen, particularly for junior liens (28.3 percent in
2008). Their high market share of junior liens can be explained, in part, by the collapse of the
piggyback market, discussed later in the section “Piggyback Lending.” Piggyback junior-lien
home-purchase loans are issued as part of a purchase package. Less than 5 percent of credit
union junior liens have been for home purchases, so they were not particularly affected by this
collapse.
The credit union data afford a unique opportunity to benchmark the HMDA data. Unlike
other depositories, all credit unions are required to report their aggregate first- and junior-lien
mortgage originations each year as part of their regulatory filings. These data allow a
determination of the HMDA-filer coverage relative to all credit union mortgage lending. These
data show that for 2008, about 88 percent of all credit union mortgage originations were made by
lenders who reported under HMDA. For first liens, the numbers reported in regulatory filings by
these lenders corresponded relatively closely to the number reported in HMDA (95 percent of
first-lien loan originations are reported in HMDA, data derived from table 5). However, for
closed-end junior liens, only about 50 percent appear to be reported, which suggests that many of
these loans are new junior liens not reportable under HMDA rules.
Lending for Manufactured Homes
Since 2004, the HMDA data have distinguished between loans secured by site-built properties
and those related to manufactured homes.22 Manufactured-home lending differs from lending for
site-built properties along a number of dimensions, including typical loan amounts, borrower
incomes, and the share of such loans that are higher priced.
The reported number of manufactured-home loans fell by about the same proportion as
for site-built homes from 2007 through 2008 (table 6). However, when measured from 2005 (a
year when mortgage markets were quite robust), the decline in loan activity was much steeper for
site-built homes than for manufactured homes. Over this longer period, the number of loans to
buy site-built homes fell 48 percent, and the number to buy manufactured homes fell 25 percent.
22 For more information about the reporting details, see Robert B. Avery, Glenn B. Canner, and Robert E.
Cook (2005), “New Information Reported under HMDA and Its Application in Fair Lending Enforcement,” Federal Reserve Bulletin, vol. 91 (Summer), pp. 344–94.

2008 HMDA Data
9
The mean loan amount used to purchase manufactured homes in 2008 was $75,000,
which was much smaller than the mean loan amount of $217,000 for site-built homes. Similarly,
the mean income of borrowers purchasing manufactured homes in 2008 was $48,400, which was
much smaller than the mean income of $93,300 for purchasers of site-built homes for the same
period.
Non-Owner-Occupant Lending
One factor contributing to the strong performance of housing markets over the first half of this
decade was the growth in sales of homes to investors or individuals purchasing second or
vacation homes, which are collectively referred to here as non-owner-occupied units.23 From
1996 through 2005, the share of non-owner-occupant lending used to purchase one- to four-
family site-built homes rose each year, increasing from 6.4 percent to 17.3 percent over the
period (table 7). This share has since fallen to 13.5 percent in 2008.
Currently, loans for non-owner occupants are not eligible for the FHA or VA programs.
However, the GSEs can purchase non-owner-occupied loans that otherwise meet their
requirements, but they typically demand interest rates that are about 3/8 of a percentage point
higher than the interest rates on loans for similar owner-occupied properties. Perhaps reflecting
less of an appetite for such loans on the part of private lenders, the GSE market share of both
home-purchase and refinance non-owner-occupied lending grew about 10 percentage points from
2007 to 2008 (33.8 percent to 43.1 percent for home-purchase lending and 28.4 percent to
39.2 percent for refinance lending). Nevertheless, non-owner-occupied lending remained a
comparatively small part of overall GSE lending in 2008 (17.9 percent of home-purchase lending
and 11.3 percent of refinance lending; data not shown in tables).
Piggyback Lending
In recent years, piggyback loans emerged as an important segment of the conventional mortgage
market, particularly regarding loans to purchase homes. In piggyback lending, borrowers
simultaneously receive a first-lien mortgage and a junior-lien (piggyback) loan. The piggyback
23 An investment property is a non-owner-occupied dwelling that is intended to be rented or resold for a
profit. Some non-owner-occupied units—vacation homes and second homes—are for the primary use of the owners and thus would not be considered investment properties. The HMDA data do not, however, distinguish between these two types of non-owner-occupied dwellings.

2008 HMDA Data
10
loan finances the portion of the purchase price not being financed by the first mortgage and
sometimes any cash payment that might have been made; the junior-lien loan may amount to as
much as 20 percent of the purchase price. In many cases, borrowers used piggyback loans to
avoid the need to obtain PMI.24 Sometimes, piggyback loans were used to keep the size of the
first-lien loan within the Fannie Mae and Freddie Mac conforming loan limits so the borrower
could take advantage of the lower interest rates available on conforming loans.
The HMDA data help document the extent of piggyback lending over time. However,
because not all lenders submit HMDA data, some of the junior-lien loans that are reported may
not have the corresponding first-lien loan reported, and some of the first-lien loans that are
reported may not have the associated junior-lien loan reported. Also, some piggyback loans may
be open-end loans which do not need to be reported under HMDA.
The HMDA data for 2005 and 2006 show that lenders extended about 1.3 million junior-
lien loans to help individuals purchase homes (for both owner-occupant and non-owner-occupant
purposes) in each of these years (data not shown in tables). The number of reported junior-lien
loans contracted sharply in 2007 to about 600,000 such loans. This contraction continued as the
number of junior-lien loans declined by 84 percent from the 2007 level to only about 98,000
loans in 2008.
A loan-matching process can be undertaken to determine which reported junior-lien loans
in the HMDA data appear to be associated with the appropriate reported first-lien loans.25 Our
matching algorithm indicates that in 2008, 2.7 percent of the nearly 1.6 million first-lien
conventional loans to purchase one- to four-family site-built owner-occupied homes involved a
piggyback loan reported by the same lender, a proportion that was down 77 percent from 2007
(table 8).
24 One advantage of piggyback loans over those backed by PMI insurance was that PMI payments made by
the borrower did not qualify as deductible interest under Internal Revenue Service (IRS) guidelines, whereas interest payments on many piggyback loans did. The Congress allowed the deductibility of PMI premiums of some borrowers starting in 2007, which reduced the relative attractiveness of piggybacks.
25 For the analysis here, a junior-lien loan was identified as a piggyback loan to a reported first-lien loan if both loans (1) were conventional loans involving property in the same census tract; (2) were originated by the same lender with approximately the same dates of loan application and closing; and (3) had the same owner-occupancy status and identical borrower income, race or ethnicity, and sex.

2008 HMDA Data
11
THE DISPOSITION OF APPLICATIONS BY LOAN CHARACTERISTICS IN 2008
Thus far, our analysis of the 2008 HMDA data has focused primarily on how the mortgage
market has evolved over the past few years. In this section, we examine the information
provided by HMDA about what home lending looked like in 2008.
Tables 9 and 10 categorize every loan application reported in 2008 into 25 distinct
product categories characterized by loan and property type, purpose of the loan, and lien and
owner-occupancy status. Each product category contains information on the number of total and
preapproval applications, application denials, originated loans, loans with prices above the
reporting thresholds established by HMDA reporting rules for identifying higher-priced loans,
loans covered by the Home Ownership and Equity Protection Act (HOEPA), and the mean and
median APR spreads for loans reported as higher priced.26 The 2008 HMDA data include information on 14 million loan applications, about
12 million of which were acted upon by the lender (table 9). The vast majority of these
applications were for first-lien loans on one- to four-family site-built homes. Among these
applications, about two-thirds of home-purchase applications and four-fifths of refinance
applications were for conventional loans. These shares of applications for conventional loans are
considerably lower than were observed in earlier years (data not shown in tables).
Patterns in the denial rates are consistent with what has been observed in earlier years.
Denial rates on applications for home-purchase loans are generally lower than those observed for
either refinance or home-improvement loans. Denial rates on applications backed by
manufactured housing are generally higher than those backed by site-built homes. Furthermore,
requests for a first-lien, conventional, home-purchase loan backed by a manufactured home is the
only one of the 25 product categories for which the majority of applications are denied.
In addition to the application data provided under HMDA, about 734,000 requests for
preapprovals that were acted on by the lender were reported under HMDA (table 10). Almost
one-quarter of these requests for preapproval were denied by the lender. Of the applications 26 The type of information provided in tables 9 and 10 is identical to that provided in analyses of earlier
years of HMDA data. Comparisons of the numbers in these two tables with earlier years can be made by consulting the following articles: Robert B. Avery, Kenneth P. Brevoort, and Glenn B. Canner (2008), “The 2007 HMDA Data,” Federal Reserve Bulletin, vol. 94, pp. A107–A146; Robert B. Avery, Kenneth P. Brevoort, and Glenn B. Canner (2007), “The 2006 HMDA Data,” Federal Reserve Bulletin, vol. 93, pp. A73–A109; Robert B. Avery, Kenneth P. Brevoort, and Glenn B. Canner (2006), “Higher-Priced Home Lending and the 2005 HMDA Data,” Federal Reserve Bulletin, vol. 92, pp. A123–A166; and Avery, Canner, and Cook, “New Information Reported under HMDA.”

2008 HMDA Data
12
acted on by the lender and preceded by requests for preapproval, more than 88 percent were
approved (data derived from table 10).
The HMDA data also indicate which loans were covered by HOEPA. Under HOEPA,
certain types of mortgage loans that have rates or fees above specified levels require additional
disclosures to consumers and are subject to various restrictions on loan terms.27 For 2008, 2,281
lenders reported extending about 7,750 loans covered by HOEPA (data regarding lenders not
shown in tables). In comparison, lenders reported on about 11,500 loans covered by HOEPA in
2007. In the aggregate, HOEPA-related lending made up less than 0.2 percent of all the
originations of home-secured refinance mortgages and home-improvement loans reported for
2008 (data derived from table 9).28
Relative to previous years, a smaller proportion of loans were reported as higher priced in
2008, and a larger proportion of reported higher-priced loans had an APR less than 1 percentage
point above the reporting threshold. Furthermore, a substantial fraction of loans in 2008 were
reported as higher priced because of atypical changes in the interest rate environment, rather than
because the loans represented relatively high credit risk. We discuss this issue in detail in the
next section and formulate an adjusted measure of higher-priced loans that is more consistent
over time.
THE 2008 HMDA DATA ON LOAN PRICING
When analyzing the loan pricing information in the HMDA data, one may be tempted to assume
that changes in the incidence of reported higher-priced lending reflect changes in subprime
lending activity. This interpretation, however, ignores a number of factors that can alter the
incidence of reported higher-priced lending without any corresponding changes in subprime
lending activity. In 2008, we identify two such factors that were related to the overall interest
rate environment and may have led to variation over time in whether a loan was reported as
higher priced in HMDA. Understanding how these changes in the interest rate environment
27 The requirement to report HOEPA loans in HMDA relates to whether the loan is subject to the original
protections of HOEPA, as determined by the coverage test in the Federal Reserve Board’s Regulation Z, 12 C.F.R. pt. 226.32(a). The required reporting is not triggered by the more recently adopted protections for “higher-priced mortgage loans” under Regulation Z, notwithstanding that those protections were adopted under authority given to the Board by HOEPA. See 73 Fed. Reg. 44522 (July 30, 2008). The more recent HOEPA regulations do not take effect until October 1, 2009.
28 HOEPA does not apply to home-purchase loans.

2008 HMDA Data
13
affected the reported incidence of higher-priced lending is important when attempting to draw
inferences about how lending to high-risk borrowers has changed.
In the following sections, we discuss how changes in the interest rate situation during
2007 and 2008 may have affected the reported incidence of higher-priced lending. We then
present the methodology we use to adjust for changes in the interest rate environment in a
manner that provides a clearer picture of how home lending to high-credit-risk borrowers has
changed. We then discuss what the 2008 HMDA data indicate about lending to high-risk
borrowers.
How the Interest Rate Situation Affected the Reporting of Higher-Priced Loans
The reporting rules governing HMDA require lenders to use the yield on a Treasury security
with a comparable term to maturity in determining whether a loan was required to be reported as
higher priced under HMDA. Because most mortgages prepay well before the stated term of the
loan, lenders typically use relatively shorter-term interest rates when setting the price of
mortgage loans. For example, lenders often price 30-year fixed-rate mortgages based on the
yields on securities with maturities of fewer than 10 years, and they typically set interest rates on
adjustable-rate mortgages (ARMs) on the basis of securities with much shorter terms. Thus, a
change in the relationship between shorter-term and longer-term yields can affect the reported
incidence of higher-priced lending. For example, if short-term interest rates fall relative to long-
term rates, then the number and proportion of loans reported as higher priced will fall even if
other factors, such as lenders’ underwriting practices or borrowers’ characteristics, are
unchanged. For ARMs, this effect is further exacerbated by the manner in which APRs are
calculated. The interest rates on most ARM loans, after the initial interest rate reset date, are
typically set based on interest rates for one-year securities. As a result, the APRs for ARMs—
which take into account the expected interest rates on a loan, assuming that the loan does not
prepay and that the index rates used to establish interest rates after the reset do not change—will
be particularly sensitive to changes in one-year interest rates. Consequently, higher-priced
lending reported for ARMs will fall when one-year interest rates decline relative to other rates
even if the relationship between long-term and intermediate-term rates is constant.
The relationship between shorter- and longer-term interest rates can be seen in the yield
curve for Treasury securities, which displays how the yields on these securities vary with the

2008 HMDA Data
14
term to maturity. Through the first seven months of 2007, the yield curve was relatively flat and
then began to steepen, so that the differences between the yield on a 30-year Treasury security
and the yields on the five-year and one-year Treasury securities increased (figure 2). Overall,
this steepening continued in 2008; while spreads did narrow during the spring and at the very end
of 2008, they remained consistently above the spreads observed in 2007. As discussed earlier,
this change would be expected to decrease the incidence of reported higher-priced lending,
particularly for ARMs, even in the absence of any changes in high-risk lending activity.
In addition to the steepening yield curve, a second change in the interest rate environment
affected the likelihood that a loan was reported as higher priced in HMDA in 2008. As a result
of the “flight to quality” and liquidity concerns caused by the financial crisis late in 2008, the
spreads between the yields on Treasury securities and other securities and loans, including
30-year fixed-rate loans, widened considerably. At the beginning of 2008, the HMDA reporting
threshold was 7.66 percent, and the APR on a 30-year fixed-rate prime loan, based on the rates
reported by Freddie Mac’s Primary Mortgage Market Survey (PMMS), was 6.12 percent (figure
3).29 This difference resulted in a gap between the HMDA reporting threshold and the APR on a
prime 30-year fixed-rate loan of 1.54 percentage points.
By the end of 2008, this gap had narrowed to approximately 0.77 percentage point, as the
falling yields on Treasury securities pulled the HMDA reporting threshold closer to the prime
mortgage rate. As a result, an increasing share of near-prime loans would have been reported as
higher priced toward the end of 2008 over what had been reported earlier in the year. Widening
spreads between the interest rates on Treasury securities and the rates on prime mortgage loans
would be expected to increase the overall incidence of higher-priced lending, even if the credit-
risk profile of borrowers remained unchanged.
These two changes in the interest rate environment in 2008, therefore, worked in opposite
directions. The expected net effect of these two competing forces can be discerned from
figure 3. The top line in that figure shows the HMDA reporting threshold in effect from 2006
through 2008. The middle three lines show the APRs calculated from the interest rates reported
in Freddie Mac’s PMMS for the three 30-year loan products reported in that survey: a fixed-rate 29 The weekly Freddie Mac Primary Mortgage Market Survey reports the average contract rates and points
for all loans and the margin for adjustable-rate loans for loans offered to prime borrowers (those with the lowest credit risk). The survey currently reports information for two fixed-rate mortgage products (30 year and 15 year) and two ARM products (one-year adjustable rate and a five-year adjustable rate). For more information, see www.freddiemac.com/dlink/html/PMMS/display/PMMSOutputYr.jsp.

2008 HMDA Data
15
loan, a 5-year ARM, and a 1-year ARM. As expected, the steepening of the yield curve had a
much larger effect on the APRs associated with ARMs than on fixed-rate loans, though rates on
all three products were generally lower in 2008 than they had been in earlier years.
The change during 2008 in the spreads between the APRs on these prime loans and the
HMDA reporting threshold (shown by the bottom three lines in figure 3) suggests that the net
effect of these changes depended upon whether the loan had either a fixed or adjustable rate. For
ARMs, the spreads appeared to have widened substantially in 2008, suggesting that the incidence
of reported higher-priced lending for these loans should have decreased in 2008 even without
changes in borrower characteristics. For fixed-rate loans, spreads appear to have narrowed
relative to earlier years. Consequently, the incidence of reported higher-priced lending for fixed-
rate loans should have increased.
The difference in the net effects of the changes in the interest rate environment between
fixed- and adjustable-rate loans complicates an analysis of the HMDA data, because one cannot
determine whether a loan in the HMDA data is a fixed- or adjustable-rate loan. Using industry
data, however, it is possible to estimate the monthly volume of both loan types.30 These data
show that at the beginning of 2007, ARMs accounted for about 17.8 percent of the market,
falling to a range of between 5 and 6 percent at the beginning of 2008 (table 11). During 2008,
ARM activity continued to fall (particularly in the latter portion of the year) to less than
2 percent. Given the small share of ARMs in the marketplace in 2008, any distortions in the
incidence of reported higher-priced lending caused by changes in the interest rate environment
can be attributed to fixed-rate lending.
Adjusting for Changes in the Interest Rate Environment, 2006-2008
The changes in the interest rate environment discussed in the previous section can result in loans
of a given level of credit risk being reported as higher priced in the HMDA data at some points
in time but not others. This variation makes drawing inferences about changes in high-credit-
risk lending based upon changes in the incidence of reported higher-priced lending much more
complicated. To better isolate the credit-risk component of pricing so that we have a definition
of a “higher-priced loan” that is more constant over time and, therefore, more fully reflective of
30 Source: Lender Processing Services, Inc. (LPS). LPS claims coverage of about 70 percent of the
mortgage market, including all loans of 9 of the top 10 mortgage servicers (see www.lpsvcs.com).
2008 HMDA Data
16
high-risk lending activity, we constructed an adjusted measure.
We defined the credit-risk component of a loan as the difference between the APR on
that loan and the APR available to the lowest-risk prime borrowers at that time. This credit risk
component is assumed to be constant over time.31 In other words, we assume that a nonprime
borrower who received a loan with an APR that was 0.25 percentage point above the APR
available to prime borrowers at that time would receive, if the nonprime borrower’s
characteristics remained constant, a loan that was 0.25 percentage point above the available rate
for prime borrowers at all other times, regardless of any changes in the interest rate environment.
We then examined the share of loans over time with credit-risk components above specific
thresholds. This approach should provide a more accurate depiction of how the extent of high-
risk lending has changed that is relatively free of the distortions introduced in the incidence of
reported higher-priced lending by changes in the interest rate environment.
In estimating the credit-risk component of loans in the HMDA data, we used, as the
measure of the rate available to prime borrowers, the APR derived from the information reported
in the Freddie Mac PMMS for a 30-year fixed-rate loan.32 As an approximation of the APR on
loans in HMDA, we added the reported spread (for higher-priced loans) to the appropriate
HMDA reporting threshold for a 30-year loan. We refer to the resulting estimate of the credit-
risk component as the PMMS spread.33
PMMS spreads can only be calculated for loans with reported spreads in HMDA. Loans
with PMMS spreads below 0.95 percentage point would not have been reported as higher priced
at any time between 2006 and 2008. We are therefore unable to identify these loans in the data.
Loans with PMMS spreads between 0.95 and 1.75 percentage points would have been reported
as higher priced at some points during the three years but not at others, so we can only identify 31 The credit-risk component that we are defining here may include other risk components besides credit
risk (for example, prepayment risk). 32 By using the APR for the 30-year fixed-rate mortgage, we are implicitly treating all loans in the HMDA
data as though they were 30-year fixed rate loans. Because of the small market share for ARMs and the prevalence of 30-year loans, we do not expect this methodological approach to have a substantive effect on our analysis. However, note that the share of loans that were ARMS in 2006 and early 2007 was much higher than in 2008. As such, one should exercise caution when comparing incidences of adjusted higher-priced lending across these periods.
33 Under new rules adopted by the Federal Reserve Board in 2008, the spread between a loan’s APR and the APR of comparable prime PMMS loan will be used to determine whether a loan is reported as higher priced in HMDA. The new rules take effect for all loans with application dates on or after October 1, 2009, and for loans regardless of application date if originated in 2010. APRs of first–lien loans with a PMMS-APR spread of 1.50 percentage points or more must be reported. For second-lien loans, the reporting threshold is a PMMS-APR spread of 3.50 percentage points.

2008 HMDA Data
17
these loans at some points in time. Only those loans with a PMMS spread of more than
1.75 percentage points have been consistently identified in the HMDA data as higher priced.
Therefore, we focused on loans with a PMMS spread greater than 1.75 percentage points in
examining how high-risk lending has changed over time, as this measure should be free of the
distortions introduced by changes in the interest rate environment and should more accurately
reflect changes in high-risk lending activity over time. We refer to loans with a PMMS spread in
excess of 1.75 percentage points as adjusted higher-priced loans.
Incidence of Higher-Priced Lending
As in earlier years, most loans reported in 2008 were not higher priced as defined under HMDA
reporting rules. Among all the HMDA-reported loans secured by one- to four-family properties,
11.6 percent were higher priced in 2008, down significantly from the historic high point of
28.7 percent in 2006 and from 18.3 percent in 2007 (data for 2008 shown in table 3; data for
2006 and 2007 are not shown in tables). The incidence of higher-priced lending fell from the
2007 levels for all conventional loan product categories, with the exception of those related to
manufactured homes.
Looking exclusively at changes in the annual rates of higher-priced lending can obscure
the information about how the mortgage market is developing over time. To better illustrate how
changes in higher-priced lending have played out in recent years, we examined monthly patterns
in higher-priced lending activity. The top line in the upper panel of figure 4 shows the incidence
of reported higher-priced, home-purchase lending. The monthly data show that the overall
annual decline in the incidence of higher-priced lending between 2007 and 2008 obscures a
substantial rebound in the incidence of reported higher-priced lending in the second half of 2008.
A similar rebound in the incidence of reported higher-priced lending is observed for the
refinance loans (shown in the bottom panel of figure 4).
This rebound in the incidence of reported higher-priced lending appears to reflect
changes in the interest rate environment and not changes in actual high-risk lending activity.
Using our methodology to correct for distortions caused by changes in the interest rate
environment, we see that the share of adjusted higher-priced loans (shown in figure 4 as “PMMS
+ 1.75”) continued to decline in 2008 and remained at historically low levels, even when the
incidence of reported higher-priced lending in HMDA began to increase. There does appear to

2008 HMDA Data
18
have been something of a rebound in the share of adjusted higher-priced home-purchase loans at
the very end of 2008, though, even after this increase, the incidence of adjusted higher-priced
lending remained below the levels observed throughout 2007.
The pattern for refinance lending appears somewhat different than that for home-
purchase lending. The incidence of adjusted higher-priced refinance lending fell at the beginning
of 2008 and then remained relatively flat throughout the rest of the year. The timing of this
decline, and the fact that a similar decline was not observed for home-purchase lending, suggests
that this may be the result of a changing mix of borrowers caused by the refinancing boom in
early 2008. This refinancing boom, which coincided with a sharp decline in the prime mortgage
rate, may have encouraged a large number of high-credit-quality borrowers to refinance their
prime mortgages in order to take advantage of relatively low mortgage rates. A tendency of
high-credit-quality borrowers to refinance when rates are low and to refrain when rates are high
may explain why the incidence of adjusted higher-priced refinancing lending exhibits more
variation than home-purchase lending. A comparison of the incidence of adjusted higher-priced
lending and volume of refinancing suggests that increases (decreases) in refinancing activity
often occur at the same time as decreases (increases) in the incidence of adjusted higher-priced
lending (figures 3 and 4).
Figure 4 also shows the share of home-purchase and refinance lending that was
composed of loans with PMMS spreads of more than 2.75 percentage points (shown in the figure
as “PMMS + 2.75”) and more than 3.75 percentage points (“PMMS + 3.75”). Most of the
adjusted higher-priced loans had PMMS spreads in excess of 2.75 percentage points for most of
2006. In 2007, this circumstance changed dramatically as the shares of both home-purchase and
refinance lending accounted for by these loans fell precipitously. While starting 2008 from
much lower levels than previous years, the share of loans made up of these loans that were very
higher priced continued to fall in 2008, though the decline seems to have slowed somewhat.
Nevertheless, loans with PMMS spreads in excess of 2.75 percentage points now account for a
negligible share of home-purchase lending and for a very small share of refinance lending. This
suggests that, as in 2007, the decline in the incidence of adjusted higher-priced lending has been
greater for the highest-risk borrowers.

2008 HMDA Data
19
Higher-Priced Lending by Lender Type
Higher-priced lending activity can also differ by type of lender. Three types of lender are
considered here: depository institutions, subsidiaries or affiliates of depository institutions, and
independent mortgage companies. In 2006, independent mortgage companies originated almost
one-half of all higher-priced loans and accounted for about 31.7 percent of all first-lien loans
(table 12). For that year, depository institutions accounted for a smaller share of higher-priced
lending (26.8 percent of adjusted higher-priced lending) than independent mortgage companies.
Since 2006, the share of higher-priced loans originated by independent mortgage
companies has fallen dramatically. Independent mortgage companies accounted for 18.5 percent
of reported higher-priced loans in HMDA in 2008, down from 45.7 percent of such loans in
2006. When using the adjusted higher-priced loan definition, the decline has been even steeper
(particularly between 2007 and 2008), with the share of higher-priced loans extended to
independent mortgage companies falling to 12 percent.
The share of adjusted higher-priced loans originated by depository institutions has
increased substantially from 26.8 percent in 2006 to 61.6 percent in 2008, though the incidence
of adjusted higher-priced lending has also fallen for depository institutions over this period from
14.7 percent to 5.6 percent. These numbers suggest that the increased share of adjusted higher-
priced lending of depository institutions reflects the sharp decline in high-risk lending by
independent mortgage companies and not an increased focus on high-risk lending by depository
institutions. Some of the increased share for the depository institutions may reflect acquisitions
of previously independent mortgage companies.
THE SURGE IN FHA AND VA LENDING
Figure 5 illustrates the changing structure of the mortgage market between 2006 and 2008. It
groups first-lien owner-occupied site-built mortgages for home purchase and refinance into six
distinct categories: (1) loans sold to an affiliate or held in the portfolio of the originating lender
(“Portfolio”), (2) loans sold into the private securitization market or to unaffiliated institutions
(“Private”), (3) loans sold to Fannie Mae or Freddie Mac (GSEs), (4) loans insured by the FHA,
(5) loans backed by the VA, and (6) loans insured by the Farm Service Agency or Rural Housing
Service. The data show that approximately 40 percent of loans in early 2006 were sold into the

2008 HMDA Data
20
private securitization market or to an unaffiliated institution.34 By the end of 2008, nearly one-
half of home-purchase loans and one-quarter of refinance loans were backed by either the FHA
or the VA, and fewer than 15 percent of originations were sold to unaffiliated institutions or into
the private securitization market (however, recall table 4, which indicates that almost no loans
were sold into the private securitization market in 2008). The two GSEs increased their market
share in 2007, but then relinquished much of these gains during 2008.
While the decline of the subprime-based private securitization market was well under
way by 2007, FHA and VA lending did not surge until 2008. At least two events in early 2008
may help explain the timing of this surge. First, as part of the Economic Stimulus Act passed in
February, the Congress authorized an increase in the loan-size limits applicable for the FHA and
VA programs and GSE purchases. Second, beginning in the early part of 2008, PMI companies
started limiting their issuance of PMI insurance and raising prices because of rising claims and
binding capital restrictions in certain states. As a consequence, Fannie Mae and Freddie Mac
substantially reduced their purchases of loans with loan-to-value ratios (LTV) above 80 percent,
which by statute require PMI (or other credit enhancement). Both GSEs also raised their credit
guarantee fees for such loans at this time as well. We examine the effects of these events in the
following two sections.
The Effect of Higher Loan-Size Limits
New standards released on March 6, 2008, raised the GSE and FHA loan-size limits up to
$729,750 in certain areas designated by the Department of Housing and Urban Development as
“high cost”.35 FHA loan limits were also raised above their 2007 levels in many other areas to
new levels. Prior to these changes, the GSEs could not purchase single-family home loans above
$417,000 in most states, while the FHA could not insure single-family home loans above
34 Classifying loans by their ultimate disposition is complicated by HMDA reporting rules. A loan is
classified as sold if the sale takes place within the HMDA reporting year. In other words, a loan originated in the December must be sold within the same month to be classified as sold. Since lenders often hold loans for several months before selling them, there is an “underreporting” in loan sales in HMDA for loans originated toward the end of the year. Analysis of the HMDA data indicates that most loans are sold within three months if they were sold. To adjust for the underreporting in October-December, we used an imputation formula based on the allocation of loans originated in September (and the following January for 2006 and 2007 data) to allocate conventional loans among the first three groups shown in figure 5. Data in all of the tables presented in this section are based on this imputation.
35 More than one-half of the 2008 loans in the high-cost areas were in California. One-third of the loans were in the mid-Atlantic states of New York, New Jersey, Maryland, and Virginia.

2008 HMDA Data
21
$271,050 in most areas of the country.36
VA loans do not have a size limit, but they do have a guarantee limit that is tied to GSE
loan limits.37 The VA guarantees the smaller of 25 percent of the loan amount or 25 percent of
the applicable GSE loan limit. As such, increases to the GSE loan limit raise the maximum VA
guarantee amount.
To understand the potential effect of the higher limits, we divided loans originated in
2008 into four categories based on the size of the loan and the location of the property securing
the loan: (1) loans smaller than the applicable 2007 FHA limit; (2) loans larger than the
applicable 2007 FHA loan limit, but less than $417,000 and the applicable 2008 FHA limit;
(3) loans larger than $417,000 but under the 2008 high-cost area limit common to the FHA, VA,
and GSEs; and (4) all other loans. Changes in the loan-size limits directly affected the options
available to borrowers for loans in categories 2 and 3 but did not affect those in categories 1
and 4.
Table 13 displays the share of loans in these four categories by month, loan purpose, and
loan product type (FHA, VA, GSE, and other).38 Among FHA loans, there is a noticeable rise in
the share of “newly FHA-eligible” loans (categories 2 and 3) in the first half of the year when the
limits were increased for both home-purchase and refinance loans. For 2008 overall, the share of
FHA-insured home-purchase loans in categories 2 and 3 was 9.7 percent, compared with
2.4 percent in 2007.39 This increase implies that the limit changes lifted FHA home-purchase
lending by 7.4 percent in 2008, assuming that the share of FHA lending in each of these
categories would have remained at its 2007 level in the absence of limit changes (derived from
table). This same assumption would imply that FHA refinance lending was 8.9 percent higher
36 The GSE loan limits were higher in Alaska and Hawaii; the maximum loan size for the FHA program
was as low as $201,160 in some low-cost areas. 37 VA loans larger than the GSE limits, however, cannot be sold into Ginnie Mae security pools. 38 The other category includes portfolio loans, private loans, and loans insured by the Farm Service Agency
or the Rural Housing Service (a very small part of the category). Loan growth during 2008 (particularly for the first half of the year), shown in table 13, is likely understated
because of the omission of data from the 15 lenders who failed to report HMDA data, as discussed earlier. In December 2007, these lenders accounted for 3.4 percent of home-purchase loans and 6.0 percent of refinance loans in HMDA; however, these loans were not proportionately distributed among the four loan types examined here. For the same period, these lenders represented less than 2 percent of FHA loans and 0.01 percent of VA loans. Their market share of GSE loans was 3.1 percent for home-purchase loans and 5.7 percent for refinance loans; for other loans, their share was 4.1 percent for home-purchase loans and 6.7 percent for refinance loans.
39 FHA-insured loans in the 2007 HMDA data for amounts that exceed the single-family loan limit can be attributed to recording errors in the data or to loans for two-, three-, or four-family structures, which have higher loan limits and are not identified separately in the HMDA data.

2008 HMDA Data
22
because of the limit changes.
In contrast to the patterns for FHA lending, the proportion of VA loans in the four
categories changed little over the course of the year, suggesting that the limit increases had little
effect on VA lending. GSE lending showed only a modest boost from the limit increases
(category 3). Under the same assumption used above, we estimate that GSE home purchase
lending would have been 1.9 percent lower and GSE refinance lending only 0.8 percent lower in
2008 had the GSE limits not been changed.
In sum, the effect of the limit increases on FHA, VA, and GSE lending appears to have
been modest because the vast majority of the growth in both FHA and VA lending was in the
categories in which there was no change in the eligibility standards.
Pullback by PMI Companies and its Implication for FHA and VA lending
With losses mounting in 2007 and 2008, PMI companies started raising prices and limiting
coverage in some areas in the spring of 2008. These changes likely reduced the ability of the
GSEs to purchase higher-LTV loans (loans with LTVs above 80 percent) because of the statutory
requirement that such loans carry PMI (or a comparable credit enhancement) in order to be
eligible for GSE purchase. The GSEs also raised their own underwriting fees for relatively high
LTV loans in March 2008 and further in June.40
Both the FHA and VA loan programs offer a form of credit insurance and, consequently,
compete with the PMI companies. The two government programs likely increased their market
share, at least to some extent, because the PMI and GSE price increases pushed the price of
conventional higher-LTV loans above that for the FHA and VA programs for some borrowers.41
40 PMI annual premiums for loans with LTVs above 80 percent range from 0.50 percentage point to greater
than 1.00 percentage point. On March 1, 2008, Fannie Mae and Freddie Mac raised their one-time delivery fees for 30-year loans with LTVs above 70 percent to a range of 0.75 to 2.00 percentage points, depending on the borrower’s credit score. On March 9, 2008, both GSEs added a 0.25 percentage point additional fee for “market conditions.” In June 2008, the GSEs raised their fees again, by an average of 0.50 percentage point. In the summer of 2008, many PMI companies announced further increases in their rates, particularly in markets they defined as “distressed.” In some areas, it became almost impossible to obtain PMI for loans with LTVs of greater than 90 percent.
41 For the first half of 2008, the FHA charged a flat delivery fee of 1.50 percentage points and an annual premium of 0.50 percentage point to insure 30-year mortgages. On July 14, 2008, the FHA implemented a risk-based insurance system with upfront fees for 30-year mortgages ranging from 1.25 to 2.25 percentage points and annual premiums from 0 to 0.55 percentage point, depending on the LTV and credit score of the borrower. The price changes were rolled back by the Congress, however, which passed legislation prohibiting the use of a risk-based pricing system after October 1, 2008. On that date, the FHA announced a new fee schedule with an upfront fee of 1.75 percentage points and an annual premium of 0.55 percentage point for 30-year loans with LTVs of 90 percent and higher and 0.50 percentage point for those with lower LTVs. During the period in which FHA
2008 HMDA Data
23
Consistent with this account, figure 5 indicates that the increase in FHA’s home-purchase and
refinance market shares accelerated just as GSE market share began falling in early 2008. VA
market shares, however, rose more steadily over time.
To further examine the potential link between PMI issuance and FHA and VA lending,
we took advantage of the HMDA data filed by the PMI industry (appendix B). These data reflect
the disposition of applications for mortgage insurance received by the eight large PMI companies
in 2008. These applications are arrayed by month, disposition, and loan type (table 14). For
context, we also provide monthly information on application disposition for conventional (GSE,
portfolio, and private) and nonconventional (FHA, VA, and Farm Service Agency or Rural
Housing Service) lending.
The data on PMI denial and withdrawal rates reveal only mild evidence of a change in
PMI companies’ underwriting practices. Nevertheless, the sharp reduction in PMI issuance
during 2008 (for instance, the ratio of PMI issuance to conventional home-purchase lending was
almost 0.60 in January and fell to 0.27 in December) is consistent with the view that much of the
high-LTV market shifted from the conventional market to the FHA and VA during 2008. In fact,
on a county-by-county basis, we find a strong correlation between declines in PMI issuance for
home purchases and increases in FHA home-purchase lending. However, such a relationship
does not hold for refinance lending, and overall, the total of FHA, VA and PMI lending as a
share of total home purchase lending remained relatively constant over 2008.42
Data collected by Lender Processing Services, Inc. (LPS), from several large mortgage
servicers provides more direct evidence that high-LTV borrowers shifted to government-backed
loans during 2008. These data show that the FHA share of first-lien, home-purchase loans with
charged risk-based rates (and during the post-March fixed-rate period), FHA fees were lower than those of the GSEs with PMI for all borrowers except those with high credit scores.
VA charged a 2.15 percentage point upfront fee and no annual premium for a veteran using the program for the first time with no down payment (the dominant choice); the fee was reduced to 1.50 percentage points with a 5 percent down payment and to 1.25 percentage points with a down payment of 10 percent or more. Fees were higher (at least 3.3 percentage points) for veterans using the program for a second or third time (there are also lifetime limits on coverage, which discourage or eliminate multiple usages). The VA has a streamlined refinance program that allows the refinancing of a VA loan into another VA loan with little documentation and a refinance fee of 0.50 percentage points (other refinance loans have the standard fees). VA statistics state that the average VA premium in 2008 was 2.13 percentage points.
42 Care must be exercised in comparing the PMI and loan data reported in HMDA. Only the largest PMI companies report HMDA data, but those that do report provide information on all their issuances, regardless of property location. HMDA loan reporting requirements favor urban areas, implying different underreporting patterns than the PMI data. Further, some PMI policies are written “after the fact” for loans that have already been originated, and as a result, the timing of the two data sources may not align perfectly. Nevertheless, the general relationship patterns between the two series should be informative.

2008 HMDA Data
24
LTVs in excess of 80 percent rose sharply in 2008 from just over 20 percent to about 70 percent
(figure 6). Similar to figure 5, the share of high-LTV loans sold to the GSEs began falling
sharply just as the FHA’s share began accelerating. The GSE share fell from more than
50 percent to 20 percent during 2008.
The FHA share of loans with LTVs of 80 percent or below in the LPS data also increased
yet remained at a low level, rising from 1 percent to almost 9 percent in 2008 (data not shown in
figure). At the same time, the share of loans with LTVs of 80 percent or below that were sold to
the GSEs held relatively constant throughout this period (after a brief increase early in 2007) at
levels just over 80 percent. These patterns observed for home-purchase loans are also generally
observed for refinance loans in the LPS data.
The VA share of high-LTV home-purchase loans grew modestly during most of 2007 and
2008, with a somewhat sharper increase at the end of 2008. By December 2008, this share
exceeded 11 percent. Somewhat differently, the VA share of high-LTV refinance loans peaked
during the refinancing boom in early 2008. This share declined somewhat after that, but
remained at higher levels than in 2007. For both home-purchase and refinance loans with LTVs
of 80 percent or less, the VA market share was higher in 2008 than in 2007, but was consistently
under 1 percent.
Evidence on the Quality of FHA and VA loans
The HMDA data contain only limited information indicative of the credit risk posed by
borrowers. First, a payment-to-income (PTI) ratio can be estimated using reported income and
loan size (if assumptions are made about interest rates on loans based on the date of loan
origination). Second, loan pricing information reported in the HMDA data might also be used to
infer risk.
We examine the monthly profiles of both of these risk measures by loan purpose and by
the four loan product types (table 15). For each loan purpose and type, we show the proportion
of loans that were reported in HMDA as higher priced, those with a PMMS spread (defined
earlier) of at least 1.75 percentage points, and those with a PMMS spread greater than
2.75 percentage points (likely subprime loans). We also show the proportion of loans with
estimated PTIs above 30 percent—the edge of an acceptable range in many loan underwriting
programs.

2008 HMDA Data
25
Table 15 shows a striking increase in the incidence of HMDA-reported higher-priced
FHA home-purchase and refinance lending. However, these increases seem to be driven largely
by the widening gap between Treasury and mortgage market interest rates during 2008. When
incidence was calculated using the PMMS-adjusted spreads, which better reflect the true credit
risk premium, higher-priced lending rose far less dramatically. While the incidence of HMDA
reported higher-priced FHA home-purchase loans more than doubled between 2007 and 2008
(4.3 percent versus 11.6 percent), the incidence of loans with a PMMS spread greater than
1.75 percentage points was small and nearly unchanged (2.1 percent versus 2.3 percent).
Virtually none of the FHA or VA loans had PMMS spreads above 2.75 percentage points.
Nevertheless, both FHA and VA show a significant percentage of their loans with APRs
in the range of prime plus 1.00 to 1.75 percentage points, which results in their being flagged as
“higher priced” in HMDA; these loans are clearly not priced as prime loans. Much of the pricing
can be attributed to FHA and VA insurance and guarantee fees. By our estimates, the average
FHA loan in October and November only had to be priced 0.25 percentage point above prime to
be reported as higher priced in HMDA after insurance fees were factored into the APR.43 VA
loans only had to be priced 0.55 percentage point above prime to be reported as higher priced
during this period.
Caution must be exercised in drawing too strong an inference about the quality of FHA
and VA loans on the basis of a low incidence of PMMS-spread, higher-priced loans. The FHA
(and to a lesser extent, the VA) cover most of the credit risk in a loan and, except for the brief
period in the summer of 2008, charged flat rates. Consequently, pricing on FHA loans may not
be particularly sensitive to the loan’s credit risk.44
Table 15 also shows an increase in the percentage of FHA borrowers with high PTI ratios
for both home-purchase and refinance lending during 2008 as well as relative to 2007, a potential
sign of an increased risk profile for the FHA program. We note that this increase stems primarily
from borrowers whose loans were newly eligible for FHA financing because of the limit
increases. The incidence of high PTI ratios for borrowers that would have been eligible for FHA
loans under 2007 limits rose only modestly (data not shown in tables). 43 FHA fees added about 0.65 percentage point to an APR at the beginning of 2008 and rose slightly during
the year. 44 Even though the FHA and VA cover most of the credit risk in a loan, they do not cover all of it. Lenders
face recourse risk in the case of fraud and servicing costs in the case of borrowers who do not make their payments. VA coverage may also be limited if the loan size is above the loan’s coverage cap.

2008 HMDA Data
26
LPS data provide more precise information on the credit quality of government-backed
loans. In addition to LTV, these data provide borrower FICO scores, a commonly used credit
score. Credit scores, such as FICO, provide a numeric ranking of the relative credit risk posed
by a borrower and are a widely used measure of the credit risk of a loan.45
In 2007, the median FICO score of an FHA home-purchase loan in the LPS data was
approximately 625, just above the range of credit scores often associated with subprime
borrowers and about 100 points below the median FICO score for conventional loans in the LPS
data (data not shown in tables). Similarly, the median LTV on 2007 FHA loans was
97.6 percent—more than 15 percentage points higher than the median for conventional loans in
2007.46
A comparison of the FICO scores of FHA borrowers in 2008 and 2007 suggests that the
growth of FHA loans has predominantly involved loans to borrowers with higher credit scores.
The share of FHA home-purchase loans to prime borrowers (those with scores greater than 660)
grew from 30 percent in 2007 to more than 50 percent in 2008. In addition, the LPS data suggest
that over 60 percent of the increase in FHA home-purchase activity between 2007 and 2008 was
to borrowers with prime-quality FICO scores.
The LPS data also indicate that FHA lending in 2008 continued to involve very low
levels of borrower equity in the home. While the share of FHA home-purchase loans with LTVs
exceeding 95 percent fell modestly from 72.3 percent in 2007 to 67.4 percent in 2008, the
median LTV on these loans remained above 97 percent. Nevertheless, there is evidence that the
credit scores of high-LTV borrowers improved as well. For example, while one-third of 2007
FHA home-purchase loans went to borrowers with LTVs in excess of 95 percent and FICO
scores below 620, this share declined to 15 percent in 2008. The numbers for FHA-insured
refinancing are somewhat different, but they show a very similar trend toward borrowers with
higher credit scores. Taken together, the FICO scores and LTVs reported in the LPS data for
45 FICO scores are one summary measure of the credit risk posed by an individual based solely on the
information contained in the credit reports maintained by the three national credit reporting agencies. FICO scores are produced using statistical models developed by Fair Isaac Corporation. A FICO score of 660 or more is often viewed as a score range associated with prime quality borrowers; a score under 620 is often associated with borrowers with subprime credit quality. For more information, see www.myfico.com/CreditEducation.
46 The LPS data tend to underrepresent the share of subprime loans; therefore, the median FICO score for conventional loans may be overstated. Also, LPS does not collect information on the combined LTV ratio of loans in its database. Because conventional loans may be more likely to involve junior liens, median LTVs for conventional loans will not accurately reflect the amount of borrower equity in the home.

2008 HMDA Data
27
2008 suggest that the growth of FHA loans has predominantly involved loans with lower-risk
characteristics than in 2007.
For VA loans, the LPS data indicate that 90 percent of VA first-lien, home-purchase
loans had LTVs in excess of 95 percent in 2007, compared with 86 percent in 2008. Like FHA
loans, while LTVs have remained high on VA loans, the credit scores of VA borrowers in the
LPS data increased in 2008. The median credit score for first-lien, home-purchase VA
borrowers was 672 in 2007 (within the range generally considered to be prime quality), and rose
to about 687 in 2008.
It is important to keep in mind when interpreting the LPS data on FICO scores and LTVs
that while these data suggest that the expansion of the FHA and VA programs has been primarily
to borrowers with higher credit scores, the performance of these loans depends upon many
factors, including the future path of house prices and economic activity. Predicting how FHA
and VA loans will perform is beyond the scope of this article.
CHANGES IN TOTAL LENDING BY BORROWER AND AREA CHARACTERISTICS
As highlighted in a previous article, the mortgage market experienced a severe contraction in
lending from the beginning of 2006 to the end of 2007 related primarily to the collapse of the
subprime mortgage market.47 As discussed above, 2008 was characterized by the increased role
of FHA and VA as the overall mortgage market continued to decline. This section examines
whether these changes had a differential effect across borrower groups. As before, particular
focus is paid to the effect of the surge in FHA and VA lending.
Overall Changes from 2006 through 2008
On the whole, lending for first-lien, site-built, owner-occupied home purchases reported in
HMDA fell 22.3 percent from 2006 through 2007 and dropped an additional 24.5 percent from
2007 through 2008. Refinance lending fell 18.3 percent from 2006 through 2007, and
20.9 percent from 2007 through 2008. 48 Although lending to all groups fell considerably during
47 See Avery, Brevoort, and Canner, “The 2007 HMDA Data.” 48 The decline in lending from 2006 to 2007 is likely to be overstated and the decline from 2007 to 2008
understated because of a serious reporting problem in the 2007 data. Federal Reserve tracking reports indicated that 169 lenders that reported HMDA data for 2006 and ceased operations sometime in 2007 or 2008 did not report HMDA data for 2007 (in an earlier section, we discuss the more limited problem of 15 nonreporting lenders in the 2008 HMDA data). Overall, these lenders accounted for about 8 percent of the site-built conventional first-lien loans in 2006. Since many of these lenders went out of business at or before the middle of 2007, there is reason to

2008 HMDA Data
28
these years, some groups experienced steeper declines than others. Market shares for both black
and Hispanic white borrowers fell from 2006 through 2007 and further declined in 2008,
implying that lending to these groups fell more quickly than average between 2006 and 2008
(column 1, labeled “market share” in tables 16.A and 16.B). In contrast, the share of lending to
Asians and non-Hispanic whites rose.
Overall patterns for lower-income lending (borrowers with incomes below 80 percent of
the median family income in their area or borrowers who live in census tracts with median
family incomes in the year 2000 that were less than 80 percent of the median family income of
their area) differ between home-purchase and refinance lending and between lower-income
borrowers and lower-income census tracts. The share of home-purchase lending made to lower-
income borrowers increased each year, while the percentage made to borrowers living in lower-
income census tracts consistently fell. The share of refinance lending made to each lower-
income group decreased each year with the exception of a slight uptick of lending to lower-
income borrowers in 2008. 49
Borrowers of different demographic groups showed large differences in their propensity
to use different types of lenders with significant changes from year to year (columns 2 to 5,
tables 16.A and 16.B). All groups showed significant increases in their reliance on loans from
banking institutions lending within their assessment areas.50 Higher-income, Hispanic-white and
Asian borrowers were more likely to use such lenders. The overall increased market share of
lending by banking institutions in their assessment areas appeared to come from a decline in
believe that loan activity in the first half of 2007 is understated in the HMDA data (by up to 8 percent), though lending activity reported in HMDA in the second half of the year is likely to be more accurate. Since these lenders specialized in higher-priced subprime loans and disproportionately served blacks and Hispanic whites, the undercounts in the 2007 HMDA data were likely larger for these groups. For additional information, see Avery, Brevoort, and Canner, “The 2007 HMDA Data.”
49 Monthly data suggest that the refinance boom in the beginning of 2008 may account for some of the overall decline in lower-income refinance lending for 2008. The overall incidence of lower-income refinance lending fell from 31.7 percent in January to 27.2 percent in February and increased to 28.7 percent in March, suggesting that the refinance boom disproportionately involved higher-income borrowers. The damping of the incidence of lower-income refinance lending during this period was sufficiently large to explain much of the difference in the 2007–08 overall changes between home-purchase and refinance lending.
50 The Community Reinvestment Act (CRA) requires commercial banks and savings institutions to identify the geographic areas that they designate as their assessment areas, which are areas in which the institution has special responsibilities under the CRA. Typically, assessment areas correspond to the counties or markets in which the institution has banking branches. Each year, larger banking institutions file a list of the census tracts that compose their assessment areas. We use this list to determine whether a loan originated by a banking institution (or an affiliate) and reported in HMDA is within the institution’s assessment area. For smaller institutions who do not supply a list, we approximate their assessment area by taking into account the counties in which they have banking offices.

2008 HMDA Data
29
lending by independent mortgage companies from 2006 through 2007. From 2007 through
2008, however, independent mortgage companies actually increased their share; meanwhile,
there was a significant shift in lending by banking institutions from outside their assessment
areas (where their past lending activity was more similar to that of independent mortgage
companies) to lending within assessment areas.
Borrowers of different demographic groups showed large differences in their propensity
to use different types of loans, with significant changes from year to year (columns 6 to 11,
tables 16.A and 16.B). All groups showed significant increases in their use of FHA and VA
programs from 2006 through 2008. Black and Hispanic-white borrowers, however, relied
particularly heavily on these government programs. In 2008, more than 60 percent of home-
purchase loans and almost 40 percent of refinance loans to blacks were from either the FHA or
VA. For Hispanic-white borrowers, nearly 50 percent of their 2008 home-purchase loans and
21 percent of their refinance loans were from the FHA or VA. In contrast, about one-half of
home-purchase and refinance loans to both blacks and Hispanic whites were sold in the
nongovernment secondary market in 2006. By 2007, this share dropped significantly, with a
shift to the GSEs and portfolio lenders by both groups. In 2008, the shift in black and Hispanic-
white home-purchase loans sold to the GSEs reversed (going to FHA and VA); however, the
share of refinance loans made to both groups that were sold to the GSEs rose from 2007 through
2008.
Patterns of loan-type incidence for lower-income borrowers and borrowers living in
lower-income tracts are similar to those of blacks and Hispanic whites, but are more muted.
Loans to these borrowers were less likely to be sold on the nongovernment secondary market in
2006, and the shift toward FHA and VA loans in 2008 was not as large (note that the share of
FHA loans made to lower-income borrowers or those in lower-income census tracts actually fell
from 2007 through 2008).51 The share of borrowers with income missing from their loan
51 The disproportionate increase in higher-income FHA loans is driven primarily by the expansion of FHA
loan limits. Only 8.6 percent of the FHA home-purchase loans and 9.1 percent of the FHA refinance loans originated in 2008 that would not have been eligible under 2007 rules were deemed lower-income under either the income or census-tract criteria. In contrast, 48.0 percent of the 2008 FHA home-purchase loans and 40.5 percent of the 2008 FHA refinance loans that would have been eligible in earlier years were deemed lower income, numbers largely unchanged from 2007 (47.5 percent and 41.5 percent, respectively).
The GSEs also show a decrease in lower-income lending. Some of the decrease in the incidence of lower-income lending by the GSEs stems from growth associated with changes in the GSE size limits, but a modest decline (about 0.8 percent for home-purchase lending and 3.0 percent for refinance lending) in the incidence of lower-income lending is evident in loans below the 2007 GSE limits as well.

2008 HMDA Data
30
applications fell from 2006 through 2008 (more than one-half of these loans were sold into the
private secondary market in 2006). The incidence of missing income for refinance loans actually
rose in 2008, with almost 60 percent of these loans in the FHA or VA programs. This
circumstance is likely the result of “streamlined” refinance programs in both agencies for which
income data are not used.
The incidence of higher-priced lending significantly declined for all groups from 2006
through 2008, although the rate of decline differs (columns 12 to 16, tables 16.A and 16.B).
Overall, the percentage of borrowers with a home-purchase loan priced 1.75 percentage points
over PMMS fell from 20.3 percent in 2006 to 10.2 percent in 2007 and further to 3.3 percent in
2008, reflecting the collapse of the subprime market. For black borrowers, the decline was much
steeper, from 43.4 percent to 23.7 percent and then to 5.7 percent. Hispanic-white borrowers and
borrowers living in lower-income census tracts showed a similar decline, though not quite as
steep.
The decline in very high-priced lending (2.75 percentage points or more above PMMS) is
striking. About one-fifth of refinance loans were priced this high in 2006, compared with less
than 4 percent in 2008. For black home-purchase borrowers, the percentage fell from
37.6 percent in 2006 to 1.5 percent in 2008.
Other indicators of subprime lending also show declines from 2006 through 2008. For
example, there was a reduction in the number of borrowers with PTIs above 30 percent and a
virtual elimination of piggyback loans (column 1, tables 16.A and 16.B). In 2006, more than
22 percent of home-purchase loans had piggyback loans. Two-thirds of these loans were sold
into the private secondary market, and more than 36 percent were very high priced (PMMS
spread of more than 2.75 percentage points). By 2008, virtually none of the piggyback loans that
remained were higher priced, and most were sold to the GSEs.
Borrower Incomes and Loan Sizes
More detailed information on borrower incomes and loan sizes by year and loan type is shown in
tables 17.A, 17.B, 18.A, and 18.B. The data show that the mean income for borrowers using
FHA, VA, and “other” loans (almost all of which are conventional loans) increased for both
home-purchase and refinance lending from 2007 through 2008. Though the income of FHA and
VA borrowers rose relative to borrowers using other loans, FHA and VA borrowers continued to

2008 HMDA Data
31
have substantially lower income levels. Meanwhile, the incomes of borrowers with higher-
priced loans, already lower than that of borrowers with lower-priced loans, fell relatively more in
2008.
Loan amounts also differed across loan types, with government-insured or guaranteed
loans generally being smaller than conventional loans. In 2008, though, the upward shift in the
distribution of loan amounts for both FHA-insured and VA-guaranteed loans contrasted with a
downward shift in the distribution for other loans. Overall, average loan amounts for all loans
fell for both home-purchase and refinance lending, but the drop was largest among higher-priced
loans.
DIFFERENCES IN LENDING OUTCOMES BY RACE, ETHNICITY, AND SEX OF THE
BORROWER
Analyses of HMDA data from earlier years revealed substantial differences in the incidence of
higher-priced lending and in denial rates across racial and ethnic lines; analyses further showed
that such differences could not be fully explained by factors included in the HMDA data.52
Studies also found that differences across groups in mean APR spreads paid by those with
higher-priced loans were generally small.53 Here we examine the 2008 HMDA data to determine
the extent to which these differences persist, comparing results for 2008 with those for 2007.
Although the HMDA data include a variety of detailed information about mortgage
transactions, many key factors that are considered by lenders in credit underwriting and pricing
are not included. Accordingly, it is not possible to determine from HMDA data alone whether
racial and ethnic pricing disparities reflect illegal discrimination. However, analysis using the
HMDA data can account for some factors that are likely related to the lending process. Given
that lenders offer a wide variety of loan products for which basic terms can differ substantially,
the analysis here can only be viewed as suggestive.
Comparisons of average outcomes for each racial, ethnic, or gender group are made both
52 See Avery, Brevoort, and Canner, “The 2006 HMDA Data”; Avery, Brevoort, and Canner, “Higher-
Priced Home Lending and the 2005 HMDA Data”; and Avery, Canner, and Cook, “New Information Reported under HMDA.”
53 See, for example, Andrew Haughwout, Christopher Mayer, and Joseph Tracy (2009), Subprime Mortgage Pricing: The Impact of Race, Ethnicity, and Gender on the Cost of Borrowing, Staff Report no. 368 (New York: Federal Reserve Bank of New York, April); and Marsha Courchane (2007), “The Pricing of Home Mortgage Loans to Minority Borrowers: How Much of the APR Differential Can We Explain?” Journal of Real Estate Research, vol. 29 (4), pp. 400–39.
2008 HMDA Data
32
before and after accounting for differences in the borrower-related factors contained in the
HMDA data (income, loan amount, location of the property or MSA, and presence of a co-
applicant) and for differences in borrower-related factors plus the specific lending institution
used by the borrower.54 Comparisons for lending outcomes across groups are of three types:
gross (or “unmodified”), modified to account for borrower-related factors (or “borrower
modified”), and modified to account for borrower-related factors plus lender (or “lender
modified”).
As described earlier, changes in the interest rate environment over the course of 2008
may have affected whether a loan’s APR exceeded the reporting threshold set by the rules
governing HMDA, making comparisons of unadjusted data on reported higher-priced lending
potentially misleading. To correct for the distortions introduced by these changes, we rely on the
PMMS spread, which was defined in an earlier section as the difference between the APR on a
loan and the interest rate available on loans to prime borrowers with the best credit quality,
assuming the loan is a 30-year fixed-rate loan. In the tables presented in this section, we report
disparities in the incidence and level of pricing using the reported HMDA pricing definition of
higher-priced lending, labeled “unadjusted,” and the PMMS-spread definition, labeled “PMMS-
spread adjusted.” A loan with a PMMS spread of greater than 1.75 percentage points is treated
as higher priced in the adjusted analysis.
Finally, in previous years, analyses were conducted only for conventional loans, because
the incidence of higher-priced lending for FHA and VA loans was so low that a meaningful
54 Excluded from the analysis are applicants residing outside the 50 states and the District of Columbia as
well as applications deemed to be business related. Borrower-related factors are controlled for as follows: Loans are placed in cells based on their size
(arrayed into buckets), the borrower’s income (also arrayed into buckets), the product type, MSA, number of applicants (one or two), whether the loan was originated through a preapproval program, and, for home-purchase loans, whether a piggyback junior lien was associated with it. The applicant’s (and co-applicant’s) gender was further used to define cells in the analyses of differences among racial and ethnic groups, and the applicant’s (and co-applicant’s) race was used in the analyses of gender differences.
Once loans are placed in cells, “within cell” differences in the incidence of higher-priced lending (or APR spreads or denial rates) are computed. These differences are averaged across cells to create a modified disparity controlling for borrower-related characteristics. For the second stage of the analyses, cells are further defined by the HMDA lender, and again, average within-cell disparities are computed. These disparities control for both borrower-related characteristics and lender.
For purposes of presentation, the average borrower- and lender-controlled within-cell disparities for each comparison group are added to the average gross incidence (or APR spread or denial rate) of the base comparison group (non-Hispanic whites in the case of comparison by race and ethnicity, and males in the case of comparison by sex). An interpretation of this number is that it is the best guess as to the incidence of higher-priced lending (or APR or denial rate) that the comparison group would have if it had the same average borrower characteristics (and lender) as the base comparison group.

2008 HMDA Data
33
statistical comparison across different groups was not possible. As discussed earlier, this was not
the case in 2008 where at least the unadjusted incidence levels for nonconventional lending were
at almost the same levels as conventional lending. Consequently, the analysis for 2008 (but not
2007) was conducted separately for both conventional and nonconventional lending.55
Incidence of Higher-Priced Lending by Race and Ethnicity
The frequency of reported higher-priced lending varies across racial and ethnic groups. The
2008 HMDA data, like those from earlier years, indicate that black and Hispanic white
borrowers are more likely, and Asian borrowers less likely, to obtain conventional loans with
prices above the HMDA price-reporting thresholds than are non-Hispanic white borrowers
(tables 21.A and 21.B). These relationships hold for both home-purchase and refinance lending
and persist whether the analysis focuses on unadjusted or PMMS-spread-adjusted data.
However, relative to 2007, incidences declined in 2008, and differences among groups appear to
be narrowing. For example, the gross PMMS-spread-adjusted home-purchase incidence was
29.7 percent for black borrowers in 2007, falling to 10.5 percent in 2008. The PMMS-spread-
adjusted incidence declined as well for non-Hispanic white borrowers but by a smaller amount,
from 8.4 percent to 3.7 percent.
The gross differences in the incidence of higher-priced lending between non-Hispanic
whites, on the one hand, and blacks or Hispanic whites, on the other, are relatively large; these
differences are reduced some, but not completely, after controlling for borrower-related factors
plus lender. For example, the gross 2008 PMMS-spread-adjusted difference for home purchase
lending between Hispanic whites and non-Hispanic whites falls 2.7 percentage points when other
factors are accounted for (8.5 percent minus 3.7 percent versus 5.8 percent minus 3.7 percent).
Differences in the incidences of higher-priced lending between Asians and non-Hispanic whites
are generally small and largely disappear after adjusting for borrower-related factors and lender.
As noted, changes in the interest rate environment had a particularly distortive effect on
the incidence of higher-priced lending reported for FHA and VA loans. These distortions are
apparent in comparisons across racial and ethnic groups (table 21.C). The unadjusted incidence
of higher-priced home-purchase lending is 12.0 percent for black borrowers, almost 4 percentage
55 Although results are reported for nonconventional lending as a whole, the analysis controls for the
specific type of government-backed loan program (FHA, VA, or Farm Service Agency/Rural Housing Service) used.

2008 HMDA Data
34
points higher than the incidence of 8.1 percent for non-Hispanic whites. However, the PMMS-
spread-adjusted incidences are only 2.6 percent and 1.5 percent for the two groups, respectively.
Like conventional lending, controlling for borrower characteristics and lender narrows the
differences among groups, but they do not entirely disappear. Overall, the results suggest that
racial and ethnic disparities in the incidence of higher-priced lending may be less of an issue for
FHA or VA lending than for conventional lending, particularly when corrections are made for
the distortions created by the interest rate environment.56
Rate Spreads by Race and Ethnicity
The 2008 data indicate that among borrowers with higher-priced loans, the gross mean prices
paid relative to prime (the PMMS-adjusted spread) are similar across groups for both home-
purchase and refinance lending (tables 22.A, 22.B, and 22.C). This circumstance holds for both
conventional and nonconventional lending. For example, for conventional home-purchase loans,
the gross mean PMMS-adjusted spread was 2.76 percentage points for both Hispanic white and
black borrowers, while the mean APR spread for non-Hispanic white borrowers was somewhat
higher at 2.89 percentage points. Accounting for borrower-related factors or the specific lender
used by the borrowers alters the relationships, but in unpredictable ways; blacks and Hispanic
whites now have higher modified spreads relative to non-Hispanic whites. Patterns are similar
when the analysis focuses on nonconventional loans.
Pricing Differences by Sex
The 2008 HMDA data, like those in previous years, reveal relatively little difference in pricing
outcomes (PMMS-spread adjusted or spread unadjusted) when borrowers are distinguished by
sex. This holds for both incidence and rate-spread comparisons (tables 21 and 22).
56 It is difficult to know how to interpret pricing disparities across groups in FHA and VA lending
programs. For the most part, neither program’s fees have been risk based, so it is tempting to attribute any differences in rates across groups to discrimination or other factors unrelated to credit risk. However, this is an unwarranted simplification. Even though the FHA and VA cover most of the credit risk in a loan, they do not cover all of it. Lenders face recourse risk in the case of fraud, and elevated servicing costs in the case of borrowers who do not make their payments. Thus, FHA and VA loan rates are still likely to vary with credit risk, albeit not as much as they would if the program fees were fully risk based. Beyond credit risk, other risk factors, such as prepayment risk, may influence FHA and VA loan pricing.

2008 HMDA Data
35
Denial Rates by Race, Ethnicity, and Sex
Analyses of the HMDA data from earlier years have consistently found that denial rates vary
across applicants grouped by race or ethnicity. In 2008, for both home-purchase and refinance
conventional lending, blacks and Hispanic whites had notably higher gross denial rates than non-
Hispanic whites. Generally, denial rates for blacks have been the highest, and denial rates for
Hispanic whites were between those for blacks and those for non-Hispanic whites (tables 23.A
and 23.B). The pattern for Asians was somewhat different, as the gross denial rate for this group
was higher for home-purchase loans than for non-Hispanic whites, but about the same for
refinancing.
Controlling for borrower-related factors in the HMDA data reduces the differences
among racial and ethnic groups. Accounting for the specific lender used by the applicant reduces
differences further, although unexplained differences remain between non-Hispanic whites and
other racial and ethnic groups. For home-purchase conventional lending, denial rates increased
only modestly for virtually all groups from 2007 through 2008 with differences between groups
also changing little. Patterns for conventional refinancing are less straightforward. Denial rates
for virtually all minority groups (with the exception of Asians) increased by about one-tenth over
the previous year while the denial rate fell for non-Hispanic whites. As a result, denial-rate
differences between minorities and non-Hispanic whites widened.
The rank ordering of denial rates across groups is similar for nonconventional lending in
2008 (table 23.C). However, differences among groups are narrower because denial rates are
uniformly lower for Blacks and Hispanic whites and higher for Asians and non-Hispanic whites
as compared with conventional lending. Group differences are reduced, but do not disappear,
when borrower characteristics and lender are controlled for. With regard to the sex of applicants,
there are no notable differences for either conventional or nonconventional lending.
Some Limitations of the Data in Assessing Fair Lending Compliance
Information in the HMDA data, including borrower and loan characteristics, property location,
loan origination date, and the lender identity, does not account fully for racial or ethnic
differences in the incidence of higher-priced conventional lending or in denial rates for all
lending types; significant differences remain unexplained. In contrast, only small differences
across groups were found in the mean APR spreads paid by those receiving higher-priced loans

2008 HMDA Data
36
and in the incidence of higher-priced lending for nonconventional lending. The latter finding is
reassuring given the apparent increase in higher-priced nonconventional lending in 2008.
However, removing the effects of the reporting distortions created by changes in the interest rate
environment eliminates much of the difference in incidence rates among groups in
nonconventional lending. Regarding the sex of borrowers, only very small differences were
found in lending outcomes.
Both previous research and experience gained in the fair lending enforcement process
show that unexplained differences in the incidence of higher-priced lending and in denial rates
among racial or ethnic groups often stem, at least in part, from credit-related factors not available
in the HMDA data, such as measures of credit history (including credit scores), loan-to-value and
debt-to-income ratios, and differences in choice of loan products. Differential costs of loan
origination and the competitive environment also may bear on the differences in pricing, as may
differences across populations in credit-shopping activities.
Differences in pricing and underwriting outcomes may also be due to discriminatory
treatment of minorities or other actions by lenders, including marketing practices. The HMDA
data are regularly used to facilitate the fair lending examination and enforcement processes.
When examiners for the federal banking agencies evaluate an institution’s fair lending risk, they
analyze HMDA price data in conjunction with other information and risk factors, as directed by
the Interagency Fair Lending Examination Procedures.57
57 The Interagency Fair Lending Examination Procedures are available at www.ffiec.gov/PDF/fairlend.pdf.

2008 HMDA Data
37
APPENDIX A: REQUIREMENTS OF REGULATION C
The Federal Reserve Board’s Regulation C requires lenders to report the following information
on home-purchase and home-improvement loans and on refinance loans:
For each application or loan
• application date and the date an action was taken on the application
• action taken on the application
— approved and originated
— approved but not accepted by the applicant
— denied (with the reasons for denial—voluntary for some lenders)
— withdrawn by the applicant
— file closed for incompleteness
• preapproval program status (for home-purchase loans only)
— preapproval request denied by financial institution
— preapproval request approved but not accepted by individual
• loan amount
• loan type
— conventional
— insured by the Federal Housing Administration
— guaranteed by the U.S. Department of Veterans Affairs
— backed by the Farm Service Agency or Rural Housing Service
• lien status
— first lien
— junior lien
— unsecured
• loan purpose
— home purchase
— refinance
— home improvement

2008 HMDA Data
38
• type of purchaser (if the lender subsequently sold the loan during the year)
— Fannie Mae
— Ginnie Mae
— Freddie Mac
— Farmer Mac
— Private securitization
— Commercial bank, savings bank, or savings association
— Life insurance company, credit union, mortgage bank, or finance company
— Affiliate institution
— Other type of purchaser
For each applicant or co-applicant
• race
• ethnicity
• sex
• income relied on in credit decision
For each property
• location, by state, county, metropolitan statistical area, and census tract
• type of structure
— one- to four-family dwelling
— manufactured home
— multifamily property (dwelling with five or more units)
• occupancy status (owner occupied, non-owner occupied, or not applicable)
For loans subject to price reporting
• spread above comparable Treasury security
For loans subject to the Home Ownership and Equity Protection Act
• indicator of whether loan is subject to the Home Ownership and Equity Protection Act

2008 HMDA Data
39
APPENDIX B: PRIVATE MORTGAGE INSURANCE DATA
Historically, mortgage lenders have required a prospective borrower to make a down payment of
at least 20 percent of a home’s value before they will extend a loan to buy a home or refinance an
existing loan. Such down payments are required because experience has shown that
homeowners with little equity are substantially more likely to default on their mortgages. Private
mortgage insurance (PMI) emerged as a response to creditors’ concerns about the elevated credit
risk of lending backed by little equity in a home as well as the difficulties that some consumers
encounter in accumulating sufficient savings to meet the required down payment and closing
costs.
PMI protects a lender if a borrower defaults on a loan; it reduces a lender’s credit risk by
insuring against losses associated with default up to a contractually established percentage of the
claim amount. The costs of the insurance are typically paid by the borrower through a somewhat
higher interest rate on the loan.
In 1993, the Mortgage Insurance Companies of America (MICA) asked the Federal
Financial Institutions Examination Council (FFIEC) to process data from PMI companies on
applications for mortgage insurance and to produce disclosure statements for the public based on
the data.58 The PMI data largely mirror the types of information submitted by lenders covered
by the Home Mortgage Disclosure Act of 1975 (HMDA). However, because the PMI companies
do not receive all the information about a prospective loan from the lenders seeking insurance
coverage, some HMDA items are not included in the PMI data. In particular, loan pricing
information, requests for preapproval, and an indicator of whether a loan is subject to the Home
Ownership and Equity Protection Act are unavailable in the PMI data.
The eight PMI companies that issued PMI during 2008 submitted data to the FFIEC
through MICA. In total, these companies acted on more than 1.55 million applications for
insurance, including 1.06 million applications to insure mortgages for purchasing homes and
490,000 applications to insure mortgages for refinancing existing mortgages. PMI companies
approved 87 percent of the applications they received. Approval rates for PMI companies are
notably higher than they are for mortgage lenders because lenders applying for PMI are familiar
58 Founded in 1973, MICA is the trade association for the PMI industry. The FFIEC prepares disclosure
statements for each of the PMI companies. The statements are available at the corporate headquarters of each company and at a central depository in each metropolitan statistical area in which HMDA data are held. The PMI data are available from the FFIEC at www.ffiec.gov/reports.htm.

2008 HMDA Data
40
with the underwriting standards used by the PMI companies and generally submit applications
for insurance coverage only if the applications are likely to be approved.

Number Percent Number Percent Number PercentDepository institutionCommerical bank 3,900 43.9 3,910 45.4 3,942 47.0Savings institution 946 10.6 929 10.8 913 10.9Credit union 2,036 22.9 2,019 23.4 2,026 24.2 All 6,882 77.4 6,858 79.7 6,881 82.0
Mortgage companyIndependent 1,328 14.9 1,124 13.1 968 11.5Affiliated1 676 7.6 628 7.3 539 6.4 All 2,004 22.6 1,752 20.3 1,507 18.0
All institutions 8,886 100 8,610 100 8,388 100 NOTE: Here and in all subsequent tables, components may not sum to totals because of rounding. 1. Subsidiary of a depository institution or an affiliate of a bank holding company. SOURCE: Here and in the subsequent tables and figures except as noted, Federal Financial Institutions Examination Council, data reported under the Home Mortgage Disclosure Act (www.ffiec.gov/hmda).
1. Distribution of reporters covered by the Home Mortgage Disclosure Act, by type of institution, 2006–08
Type 2007 20082006
41
2008 HMDA Data

2. Home loan and reporting activity of lending institutions covered under the Home Mortgage Disclosure Act, 1990–2008 Number
Home purchase Refinance Home improvement
1990 3.3 1.1 1.2 5.5 1.2 6.7 9,332 24,0411991 3.3 2.1 1.2 6.6 1.4 7.9 9,358 25,9341992 3.5 5.2 1.2 10.0 2.0 12.0 9,073 28,7821993 4.5 7.7 1.4 13.6 1.8 15.4 9,650 35,9761994 5.2 3.8 1.7 10.7 1.5 12.2 9,858 38,750
1995 5.5 2.7 1.8 10.0 1.3 11.2 9,539 36,6111996 6.3 4.5 2.1 13.0 1.8 14.8 9,328 42,9461997 6.8 5.4 2.2 14.3 2.1 16.4 7,925 47,4161998 8.0 11.4 2.0 21.4 3.2 24.7 7,836 57,2941999 8.4 9.4 2.1 19.9 3.0 22.9 7,832 56,966
2000 8.3 6.5 2.0 16.8 2.4 19.2 7,713 52,7762001 7.7 14.3 1.9 23.8 3.8 27.6 7,631 53,0662002 7.4 17.5 1.5 26.4 4.8 31.2 7,771 56,5062003 8.2 24.6 1.5 34.3 7.2 41.5 8,121 65,8082004 9.8 16.1 2.2 28.1 5.1 33.3 8,853 72,246
2005 11.7 15.9 2.5 30.2 5.9 36.0 8,848 78,1932006 10.9 14.0 2.5 27.5 6.2 33.7 8,886 78,6382007 7.6 11.5 2.2 21.4 4.8 26.2 8,610 63,0552008 5.0 7.7 1.4 14.2 2.9 17.1 8,388 51,109
1. Applications for multifamily homes are included only in the total columns; for 2008, these applications numbered 42,792. 2. A report covers the mortgage lending activity of a lender in a single metropolitan statistical area in which it had an office during the year.
Year ReportersDisclosure
reports2Loans purchased Total1
ApplicationsApplications received for home loans on 1–4
family properties, and home loans purchased from another institution (millions) Total1
NOTE: Except as noted, applications exclude requests for preapproval that were denied by the lender or were accepted by the lender but not acted upon by the borrower. In this article, applications are defined as being for a loan on a specific property; they are thus distinct from requests for preapproval, which are not related to a specific property.
42
2008 HMDA Data

3. Share of home loans, by type of loan, 1990–2008 Percent
Year Conventional FHA insuredVA
guaranteed1 All
1990 77.4 18.1 4.5 1001991 81.7 13.8 4.5 1001992 87.1 8.8 4.1 1001993 81.5 13.0 5.5 1001994 81.5 12.6 5.9 100
1995 81.9 12.7 5.5 1001996 82.5 12.7 4.8 1001997 82.7 12.9 4.4 1001998 85.7 10.0 4.3 1001999 84.8 11.8 3.4 100
2000 84.4 12.7 2.8 1002001 87.1 10.3 2.6 1002002 90.1 7.6 2.3 1002003 91.3 6.2 2.5 1002004 93.0 5.1 1.9 100
2005 95.3 3.4 1.3 1002006 95.2 3.5 1.3 1002007 92.5 5.6 1.9 1002008 74.3 21.5 4.2 100 NOTE: Includes home-purchase and refinance loans for 1–4 family owner-occupied properties. 1. Includes loans guaranteed by the Farm Service Agency or Rural Housing Service.
43
2008 HMDA Data

Percent
By number of loans
By amount of loans
By number of loans
By amount of loans
By number of loans
By amount of loans
Fannie Mae 17.2 14.3 23.4 21.2 25.8 27.1Ginnie Mae 2.2 1.4 3.5 2.4 11.4 9.5Freddie Mac 10.7 8.9 15.3 13.4 16.2 16.2Farmer Mac .0 .0 .0 .0 .0 .0Private securitization 9.0 11.0 3.6 5.0 .5 .6Commerical bank or savings institution 6.9 7.6 6.8 7.6 8.8 8.8Insurance company 15.7 15.5 10.5 10.3 9.7 9.4Affiliate of institution 14.5 16.2 21.4 23.4 12.3 13.5Other 23.8 25.0 15.6 16.7 15.4 14.8Total 100 100 100 100 100 100
MEMOShare of all originations sold 72.2 71.9 69.5 67.0 73.2 72.0 NOTE: Includes only first-lien loans.
4. Distribution of loans sold during year of origination, by type of purchaser, number of loans, and amount of loans, 2006–08
Type of purchaser2006 2007 2008
44
2008 HMDA Data
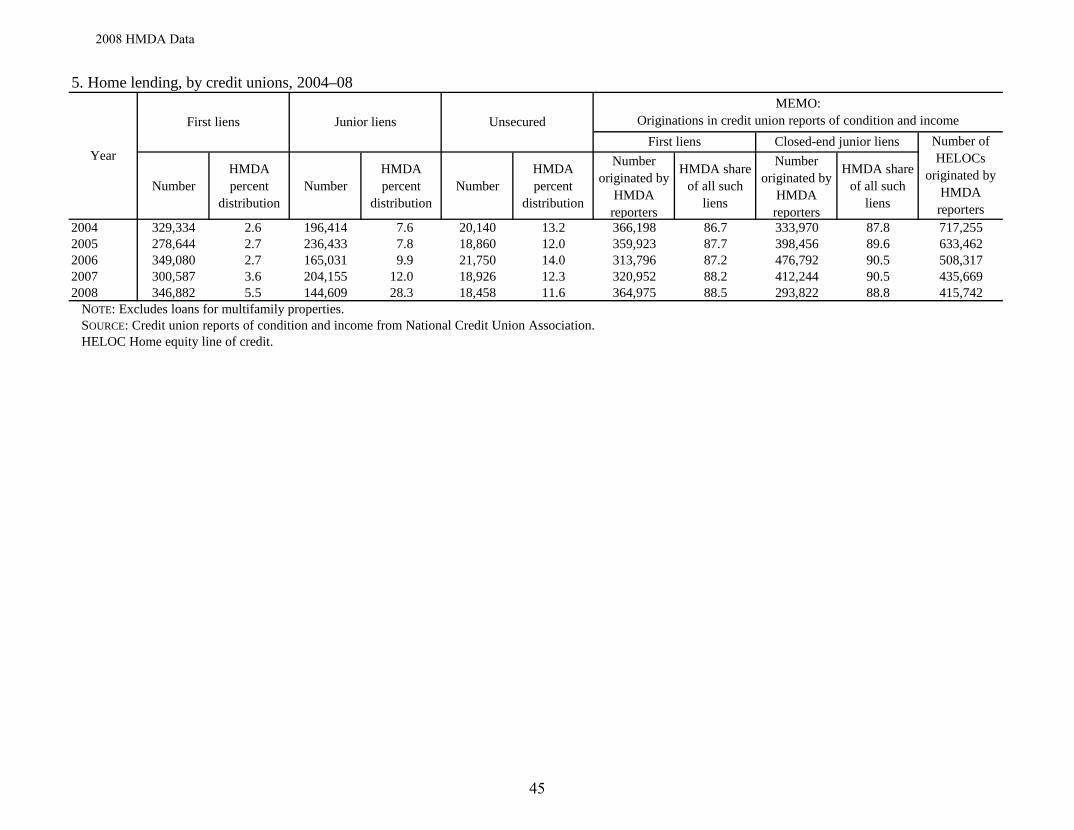
5. Home lending, by credit unions, 2004–08
NumberHMDA percent
distributionNumber
HMDA percent
distributionNumber
HMDA percent
distribution
Number originated by
HMDA reporters
HMDA share of all such
liens
Number originated by
HMDA reporters
HMDA share of all such
liens
2004 329,334 2.6 196,414 7.6 20,140 13.2 366,198 86.7 333,970 87.8 717,2552005 278,644 2.7 236,433 7.8 18,860 12.0 359,923 87.7 398,456 89.6 633,4622006 349,080 2.7 165,031 9.9 21,750 14.0 313,796 87.2 476,792 90.5 508,3172007 300,587 3.6 204,155 12.0 18,926 12.3 320,952 88.2 412,244 90.5 435,6692008 346,882 5.5 144,609 28.3 18,458 11.6 364,975 88.5 293,822 88.8 415,742 NOTE: Excludes loans for multifamily properties. SOURCE: Credit union reports of condition and income from National Credit Union Association. HELOC Home equity line of credit.
MEMO:Originations in credit union reports of condition and income
Year
First liens Junior liens UnsecuredNumber of HELOCs
originated by HMDA reporters
Closed-end junior liensFirst liens
45
2008 HMDA Data

6. Manufactured and site-built home lending, 2004–08
Number Percent distribution Number Percent
distribution2004 129,150 2.7 4,654,243 97.32005 127,336 2.6 4,830,594 97.42006 131,188 3.0 4,290,023 97.02007 122,834 3.6 3,325,082 96.42008 95,895 3.7 2,511,827 96.3
MEMO
Mean 48.4 . . . 93.3 . . .Median 42.0 . . . 69.0 . . .
Mean 74.6 . . . 216.9 . . .Median 62.0 . . . 176.0 . . .
1. For loans originated in 2008. . . . Not applicable.
Borrower income (thousands of dollars) 1
Loan amount (thousands of dollars) 1
NOTE: Includes only first-lien, owner-occupied home-purchase loans for 1–4 family homes.
YearManufactured homes Site-built homes
46
2008 HMDA Data

Percent
Number Dollar amount Number Dollar amount1990 6.6 5.9 9.0 8.41991 5.6 4.5 5.8 4.91992 5.2 4.0 4.7 4.01993 5.1 3.8 5.1 4.31994 5.7 4.3 8.0 6.6
1995 6.4 5.0 7.8 6.41996 6.4 5.1 6.7 5.81997 7.0 5.8 6.8 5.71998 7.1 6.0 5.2 4.41999 7.4 6.4 6.7 5.9
2000 8.0 7.2 7.4 7.02001 8.6 7.6 5.8 5.22002 10.5 9.2 6.1 5.32003 11.9 10.6 6.2 5.62004 14.9 13.1 8.3 7.2
2005 17.3 15.7 8.8 7.92006 16.5 14.8 10.7 9.92007 14.9 13.8 11.3 10.62008 13.5 12.3 10.0 9.5
7. Non-owner-occupied lending as a share of all first liens to purchase or refinance one- to four- family site-built homes, by number and dollar amount of loans, 1990–2008
Year Home purchase Refinance
47
2008 HMDA Data

8. Piggyback home-purchase lending, 2004–08
Higher-priced proportion of
piggyback loans
Piggyback proportion of higher-priced
loans2004 530,740 14.9 19.1 29.02005 950,965 21.5 53.2 46.72006 950,408 24.3 44.4 42.82007 356,959 12.2 16.0 13.92008 43,017 2.7 3.0 1.1 NOTE: Conventional first-lien mortgages for owner-occupied, 1–4 family, site-built properties.
Year Number Incidence
MEMO
48
2008 HMDA Data

9. Disposition of applications for home loans, and origination and pricing of loans, by type of home and type of loan, 2008
Number Number denied Percent denied 3-3.99 4-4.99 5-6.99 7-8.99 9 or more Mean Median
Owner occupiedSite-built
Home purchaseConventional
First lien 2,491,474 2,166,315 391,045 18.1 1,565,612 113,767 7.3 69.9 16.4 11.7 1.7 .4 3.9 3.5 . . .Junior lien 146,420 127,818 22,858 17.9 90,232 9,899 11.0 . . . . . . 93.1 6.2 .7 5.7 5.5 . . .
Government backedFirst lien 1,369,879 1,211,975 209,886 17.3 941,575 89,882 9.5 9.1 5.0 1.3 .6 .1 3.4 3.2 . . .Junior lien 1,301 1,161 95 8.2 1,043 4 .4 . . . . . . 100.0 .0 .0 5.9 5.7 . . .
RefinanceConventional
First lien 5,227,940 4,395,340 1,627,991 37.0 2,328,102 245,118 10.5 47.7 18.3 20.9 12.6 .6 4.7 4.1 2,686Junior lien 471,860 419,789 173,203 41.3 214,579 31,571 14.7 . . . . . . 55.2 23.0 21.9 7.2 6.6 873
Government backedFirst lien 1,189,774 944,697 387,460 41.0 498,271 65,784 13.2 92.7 6.1 .9 .2 .0 3.4 3.3 583Junior lien 937 752 262 34.8 372 4 1.1 . . . . . . 75.0 25.0 .0 6.2 5.8
Home improvementConventional
First lien 451,561 389,513 187,249 48.1 172,328 53,476 31.0 41.6 19.9 21.5 15.5 1.5 5.0 4.4 1,085Junior lien 421,964 373,086 165,662 44.4 179,313 22,670 12.6 . . . . . . 59.0 21.1 19.9 7.1 6.4 854
Government backedFirst lien 21,632 17,866 6,770 37.9 9,834 1,360 13.8 81.7 10.1 5.8 2.3 .2 3.7 3.3 8Junior lien 2,928 2,493 524 21.0 1,602 1,211 75.6 . . . . . . 33.2 40.7 26.1 7.8 7.7 27
Unsecured(conventional or government backed) 384,490 378,389 188,293 49.8 151,475 . . . . . . . . . . . . . . . . . . . . . . . . . . . . . .
ManufacturedConventional, first lien
Home purchase 296,213 287,601 156,475 54.4 68,147 51,354 75.4 19.6 21.6 31.2 17.3 10.3 6.0 5.5 . . .Refinance 114,728 103,996 51,076 49.1 42,098 26,791 63.6 22.2 19.7 33.5 20.9 3.7 5.7 5.5 1,650
Other 137,052 121,464 45,691 37.6 65,414 16,599 25.4 52.0 10.2 22.0 11.0 4.9 4.9 3.9 614
Non-owner occupied 4
Conventional, first lienHome purchase 592,174 521,870 104,761 20.1 368,595 57,323 15.6 74.0 15.4 7.5 1.9 1.2 3.9 3.5 . . .Refinance 593,296 507,391 167,245 33.0 293,490 34,433 11.7 68.1 16.0 12.1 3.1 .8 4.0 3.6 128
Other 118,535 106,634 44,147 41.4 55,145 8,259 15.0 35.3 17.1 36.6 8.2 2.9 5.1 4.8 76
Conventional, first lienHome purchase 49,316 47,546 2,091 4.4 44,217 2,317 5.2 39.9 29.4 19.3 5.7 5.7 4.9 4.3 . . .Refinance 46,847 44,599 3,095 6.9 39,935 1,865 4.7 43.2 33.6 18.6 4.2 .5 4.4 4.2 4
Other 20,828 17,529 2,522 14.4 14,374 972 6.8 47.4 8.1 38.2 4.7 1.5 4.6 4.2 3
Conventional, first lienHome purchase 13,921 12,625 1,913 15.2 10,065 474 4.7 56.8 24.9 16.7 1.3 .4 4.2 3.8 . . .Refinance 23,244 21,580 3,488 16.2 17,089 634 3.7 53.6 24.3 20.2 1.9 .0 4.2 3.9 0
Other 5,627 5,327 800 15.0 4,355 125 2.9 47.2 19.2 24.8 8.0 .8 4.6 4.1 2
Total 14,193,941 12,227,356 3,944,602 32.3 7,177,262 835,892 11.6 55.1 14.1 19.1 8.9 2.8 4.6 3.8 8,593
2. Loans covered by the Home Ownership and Equity Protection Act of 1994 (HOEPA), which does not apply to home-purchase loans.3. Business-related applications and loans are those for which the lender reported that the race, ethnicity, and sex of the applicant or co-applicant are "not applicable"; all other applications and loans are nonbusiness related.4. Includes applications and loans for which occupancy status was missing.5. Includes business-related and nonbusiness-related applications and loans for owner-occupied and non-owner-occupied properties.. . . Not applicable.
NONBUSINESS RELATED3
Loans with APR spread above the threshold1
1. Annual percentage rate (APR) spread is the difference between the APR on the loan and the yield on a comparable-maturity Treasury security. The threshold for first-lien loans is a spread of 3 percentage points; for junior-lien loans, it is a spread of 5 percentage points.
Number PercentDistribution, by percentage points of APR spread APR spread (percentage points) Number of HOEPA-
covered loans2
1–4 FAMILY
MULTIFAMILY5
BUSINESS RELATED3
Type of home and loan Acted upon by lenderNumber
Applications Loans originated
Number submitted
49
2008 HMDA Data

10. Home-purchase lending that began with a request for preapproval: Disposition and pricing, by type of home, 2008
3-3.99 4-4.99 5-6.99 7-8.99 9 or more Mean spread Median spread
Owner occupiedSite-built
ConventionalFirst lien 455,564 103,025 22.6 275,844 245,484 33,303 190,583 6,881 4 84.6 11.4 3.4 .4 .1 3.5 3.3Junior lien 24,846 5,767 23.2 15,112 14,394 1,820 10,987 1,279 12 . . . . . . 97.3 2.7 .1 5.6 5.4
Government backedFirst lien 172,217 54,004 31.4 107,065 97,422 12,461 80,369 7,844 10 94.4 4.9 .5 .1 .1 3.4 3.2Junior lien 81 30 37.0 47 38 11 27 1 4 . . . . . . 100.0 .0 .0 5.8 5.8
ManufacturedConventional, first lien 21,908 1,600 7.3 20,102 17,155 8,027 6,928 4,592 66 12.6 21.4 40.6 19.5 5.9 6.0 6.0Other 4,955 1,541 31.1 3,173 2,926 417 2,293 594 26 86.7 8.1 4.4 .8 .0 3.6 3.3
Non-owner occupied 4
Conventional, first lien 51,442 9,970 19.4 34,662 30,768 4,669 23,382 2,086 9 82.2 12.4 3.8 1.0 .6 3.7 3.4Other 2,003 530 26.5 1,328 1,009 284 646 33 5 24.2 .0 72.7 3.0 .0 5.0 5.2
Conventional, first lien 1,059 62 5.9 960 842 71 731 53 7 50.9 32.1 15.1 1.9 .0 4.2 3.9Other 268 9 3.4 255 203 24 172 15 9 86.7 13.3 .0 .0 .0 3.4 3.2
Conventional, first lien 117 6 5.1 105 91 9 71 1 1 .0 .0 100.0 .0 .0 6.0 6.0Other 17 0 .0 17 15 3 11 1 9 100.0 .0 .0 .0 .0 3.0 3.0
Total 734,477 176,544 24.0 458,670 410,347 61,099 316,200 23,380 7 68.8 10.6 15.1 4.2 1.3 4.1 3.5 1. These applications are included in the total reported in table 9. 2. See note 1, table 9. 3. See note 3, table 9. 4. See note 4, table 9. 5. See note 5, table 9. . . . Not applicable.
MULTIFAMILY 5
Loans with APR spread above the threshold2
Number Number denied Number Percent
Distribution, by percentage points of APR spread APR spread (percentage points)Type of home
Requests for preapproval
Number
1–4 FAMILY
Applications preceded by requests for preapproval1 Loan originations whose applications were preceded by requests for preapproval
Number acted upon by lender
BUSINESS RELATED3
Number denied
Percent denied
Number submitted
Acted upon by lender
NONBUSINESS RELATED3
50
2008 HMDA Data
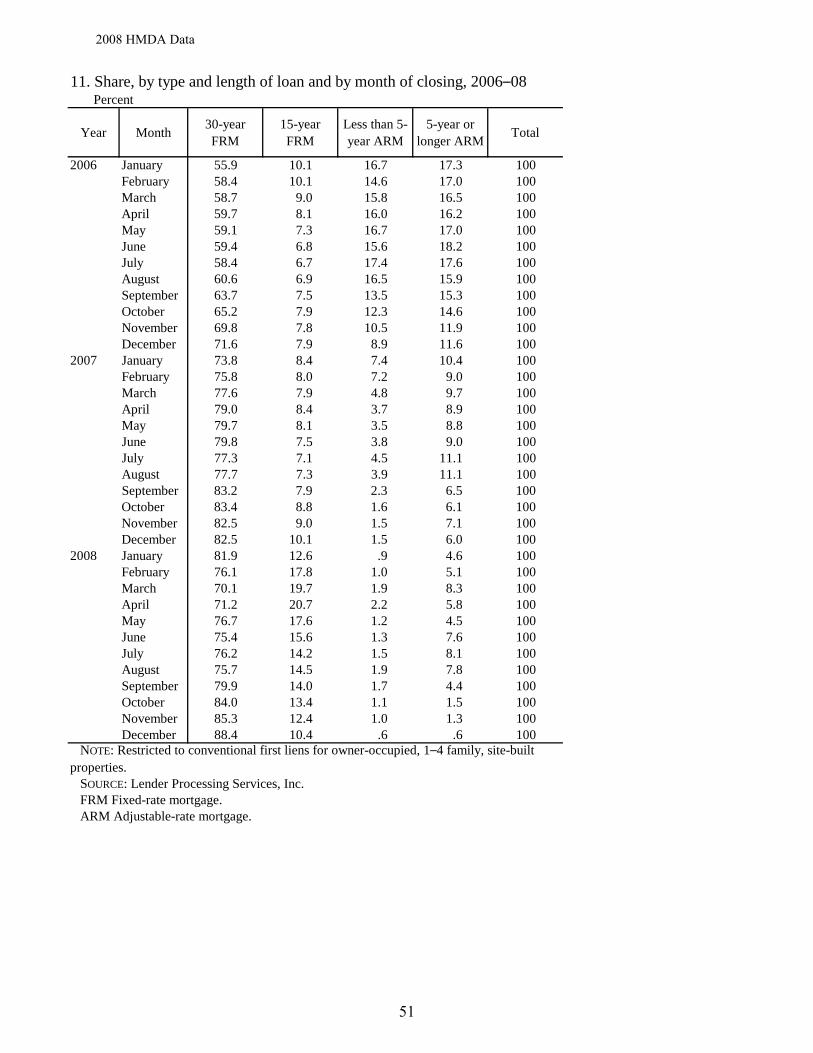
11. Share, by type and length of loan and by month of closing, 2006–08 Percent
Year Month 30-year FRM
15-year FRM
Less than 5-year ARM
5-year or longer ARM Total
2006 January 55.9 10.1 16.7 17.3 100February 58.4 10.1 14.6 17.0 100March 58.7 9.0 15.8 16.5 100April 59.7 8.1 16.0 16.2 100May 59.1 7.3 16.7 17.0 100June 59.4 6.8 15.6 18.2 100July 58.4 6.7 17.4 17.6 100August 60.6 6.9 16.5 15.9 100September 63.7 7.5 13.5 15.3 100October 65.2 7.9 12.3 14.6 100November 69.8 7.8 10.5 11.9 100December 71.6 7.9 8.9 11.6 100
2007 January 73.8 8.4 7.4 10.4 100February 75.8 8.0 7.2 9.0 100March 77.6 7.9 4.8 9.7 100April 79.0 8.4 3.7 8.9 100May 79.7 8.1 3.5 8.8 100June 79.8 7.5 3.8 9.0 100July 77.3 7.1 4.5 11.1 100August 77.7 7.3 3.9 11.1 100September 83.2 7.9 2.3 6.5 100October 83.4 8.8 1.6 6.1 100November 82.5 9.0 1.5 7.1 100December 82.5 10.1 1.5 6.0 100
2008 January 81.9 12.6 .9 4.6 100February 76.1 17.8 1.0 5.1 100March 70.1 19.7 1.9 8.3 100April 71.2 20.7 2.2 5.8 100May 76.7 17.6 1.2 4.5 100June 75.4 15.6 1.3 7.6 100July 76.2 14.2 1.5 8.1 100August 75.7 14.5 1.9 7.8 100September 79.9 14.0 1.7 4.4 100October 84.0 13.4 1.1 1.5 100November 85.3 12.4 1.0 1.3 100December 88.4 10.4 .6 .6 100
SOURCE: Lender Processing Services, Inc. FRM Fixed-rate mortgage. ARM Adjustable-rate mortgage.
NOTE: Restricted to conventional first liens for owner-occupied, 1–4 family, site-built properties.
51
2008 HMDA Data

12. Distribution of reported higher-priced lending, by type of lender, and incidence at each type of lender, 2006–08Percent except as noted
Number Distribution Incidence Number Distribution Incidence Number Distribution
Independent mortgage company 1,287,869 45.7 39.1 1,163,602 47.7 35.3 3,292,281 31.7Depository 802,125 28.5 18.0 653,985 26.8 14.7 4,455,331 42.9Affiliate or subsidiary of depository 725,953 25.8 27.6 624,179 25.6 23.7 2,633,237 25.4 Total 2,815,947 100.0 27.1 2,441,766 100.0 23.5 10,380,849 100.0
Independent mortgage company 306,675 21.1 18.2 264,893 21.7 15.7 1,685,948 20.5Depository 660,744 45.5 14.2 519,662 42.6 11.2 4,648,082 56.5Affiliate or subsidiary of depository 485,287 33.4 25.7 436,425 35.7 23.1 1,888,347 23.0 Total 1,452,706 100.0 17.7 1,220,980 100.0 14.8 8,222,377 100.0
Independent mortgage company 122,225 18.5 9.2 44,498 12.0 3.3 1,332,729 21.5Depository 401,590 60.8 9.9 228,248 61.6 5.6 4,044,886 65.3Affiliate or subsidiary of depository 137,084 20.7 16.8 97,625 26.4 12.0 813,798 13.1 Total 660,899 100.0 10.7 370,371 100.0 6.0 6,191,413 100.0 NOTE: First-lien mortgages for site-built properties; excludes business loans. For definition of higher-priced lending, see text.
2008
1. Adjusted higher-priced loans are those with annual percentage rates (APRs) 1.75 percentage points or more above the 30-year fixed-rate APR from the Freddie Mac Primary Mortgage Market Survey.
Type of lender Higher-priced loans Adjusted higher-priced loans1 MEMO: All loans
2006
2007
52
2008 HMDA Data

13. Percent of home-purchase and refinance loans, by category of FHA and GSE eligibility, by type of loan and month of origination Percent except as noted
FHA2008
January 21,857 100.0 14.1 96.0 3.1 .2 .7 25,634 100.0 9.9 93.9 5.0 .3 .9February 31,099 142.3 17.6 95.7 3.4 .2 .7 35,100 136.9 8.5 93.8 5.1 .3 .8March 43,193 197.6 20.9 94.1 4.8 .3 .7 38,896 151.7 10.1 92.2 6.5 .4 .9April 56,654 259.2 25.7 90.3 7.5 1.1 1.0 43,173 168.4 12.4 85.7 12.0 .9 1.4May 70,554 322.8 28.5 88.1 9.1 1.6 1.3 39,700 154.9 15.5 83.6 13.4 1.3 1.7June 75,493 345.4 29.1 87.0 9.5 1.8 1.6 37,073 144.6 17.4 83.4 13.1 1.4 2.2July 79,949 365.8 31.4 87.1 9.4 1.9 1.6 35,697 139.3 21.4 83.5 12.8 1.4 2.2August 80,968 370.4 33.7 87.3 9.0 1.9 1.8 34,773 135.7 24.7 83.7 12.6 1.6 2.1September 90,597 414.5 40.5 88.2 8.4 1.8 1.7 37,068 144.6 26.6 83.5 12.8 1.6 2.2October 72,304 330.8 35.3 87.3 8.6 2.1 2.0 46,682 182.1 25.5 82.6 13.3 1.3 2.9November 54,914 251.2 36.5 88.0 8.2 1.9 1.9 33,774 131.8 28.8 83.0 13.2 1.2 2.7December 64,245 293.9 38.2 87.3 8.5 2.1 2.2 51,327 200.2 24.9 80.8 14.5 1.2 3.5Total 741,827 . . . 29.6 88.7 8.1 1.6 1.6 458,897 . . . 16.2 85.4 11.5 1.1 2.0
2007Second half 149,428 . . . 9.4 96.3 2.7 .2 .8 108,094 . . . 7.0 94.5 4.3 .3 1.0Total 257,674 . . . 7.8 96.7 2.4 .2 .7 164,063 . . . 4.6 94.9 3.9 .3 1.0
VA2008
January 6,976 100.0 4.5 77.2 17.4 .6 4.8 2,625 100.0 1.0 74.7 17.9 .3 7.2February 8,747 125.4 5.0 76.7 17.4 .6 5.3 5,026 191.5 1.2 70.7 21.8 .2 7.2March 10,661 152.8 5.2 75.8 18.0 1.1 5.0 4,709 179.4 1.2 71.7 21.0 .4 6.9April 11,710 167.9 5.3 75.1 17.9 1.4 5.7 4,437 169.0 1.3 74.8 18.2 .4 6.7May 13,651 195.7 5.5 73.6 18.5 1.3 6.5 3,441 131.1 1.3 77.5 16.4 .6 5.5June 14,707 210.8 5.7 72.0 19.8 1.2 7.1 2,565 97.7 1.2 77.4 16.4 .4 5.8July 14,948 214.3 5.9 73.0 18.8 1.3 6.9 2,071 78.9 1.2 80.6 14.1 .6 4.7August 14,071 201.7 5.9 73.7 18.5 1.4 6.5 1,746 66.5 1.2 82.4 12.8 .5 4.4September 12,532 179.6 5.6 75.2 17.4 1.4 6.0 1,906 72.6 1.4 78.5 14.4 .7 6.4October 13,202 189.2 6.4 76.0 16.2 1.5 6.3 3,111 118.5 1.7 73.9 18.1 .9 7.2November 10,307 147.7 6.9 77.0 15.7 1.6 5.6 1,939 73.9 1.7 73.4 16.8 1.4 8.4December 12,131 173.9 7.2 76.2 15.4 1.8 6.7 4,953 188.7 2.4 67.5 21.6 .9 10.0Total 143,643 . . . 5.7 74.9 17.7 1.3 6.1 38,529 . . . 1.4 74.0 18.4 .6 7.0
2007Second half 56,002 . . . 3.5 75.8 18.8 .1 5.3 8,129 . . . .5 79.6 15.3 .2 4.8Total 106,710 . . . 3.2 76.2 18.7 .1 5.1 15,019 . . . .4 80.5 14.9 .2 4.4
GSE2
2008January 59,029 100.0 38.0 72.1 19.9 .6 7.4 105,505 100.0 40.9 74.3 18.6 .2 6.9February 63,165 107.0 35.8 71.9 20.1 .5 7.5 177,617 168.3 43.0 71.9 20.1 .2 7.8March 70,510 119.4 34.1 70.9 20.9 .4 7.8 157,348 149.1 40.9 74.9 18.0 .2 6.8April 68,462 116.0 31.1 70.6 20.8 .6 8.0 132,992 126.1 38.1 76.3 16.9 .2 6.5May 71,840 121.7 29.0 69.4 20.6 1.2 8.8 86,447 81.9 33.9 76.7 16.3 .5 6.6June 72,736 123.2 28.1 68.0 20.1 2.4 9.5 69,358 65.7 32.6 74.6 15.8 2.7 6.8July 67,790 114.8 26.6 68.3 19.2 3.3 9.2 47,377 44.9 28.4 76.9 14.3 2.5 6.4August 61,150 103.6 25.4 68.4 18.6 3.7 9.3 37,482 35.5 26.6 77.3 13.7 2.2 6.7September 50,053 84.8 22.4 70.4 17.3 3.8 8.4 38,002 36.0 27.3 76.0 14.5 2.4 7.1October 48,782 82.6 23.8 71.0 16.3 4.2 8.4 54,018 51.2 29.5 71.4 16.6 3.9 8.2November 34,849 59.0 23.2 71.2 16.7 3.9 8.3 31,474 29.8 26.8 75.1 14.8 2.6 7.5December 36,962 62.6 22.0 70.3 17.1 3.8 8.9 60,730 57.6 29.5 68.2 19.8 2.3 9.7Total 705,328 . . . 28.1 70.1 19.3 2.2 8.5 998,350 . . . 35.3 74.3 17.4 1.1 7.2
2007Second half 539,637 . . . 32.5 75.4 17.8 .3 6.4 449,999 . . . 25.2 78.3 16.1 .3 5.3Total 1,109,069 . . . 32.6 77.1 16.7 .3 6.0 995,889 . . . 26.2 79.4 15.1 .3 5.1
Other3
2008January 67,503 100.0 43.4 67.8 14.3 3.9 13.9 124,272 100.0 48.2 72.5 13.9 2.8 7.2February 73,628 109.1 41.7 68.4 14.7 3.3 13.7 195,520 157.3 47.3 71.0 15.7 2.1 10.7March 82,163 121.7 39.8 67.7 14.9 3.3 14.1 183,400 147.6 47.7 72.4 13.9 2.3 11.2April 83,434 123.6 37.9 68.2 14.5 3.4 13.9 168,781 135.8 48.3 74.1 13.2 2.0 11.4May 91,289 135.2 36.9 67.9 14.7 3.2 14.2 125,791 101.2 49.3 75.1 12.3 2.2 10.7June 96,353 142.7 37.2 66.4 15.2 3.3 15.2 103,786 83.5 48.8 75.3 11.6 2.7 10.4July 91,786 136.0 36.1 67.5 14.5 3.5 14.5 81,715 65.8 49.0 76.3 10.6 2.7 10.4August 84,186 124.7 35.0 68.1 13.9 3.6 14.3 66,685 53.7 47.4 78.1 9.8 2.6 10.4September 70,329 104.2 31.5 70.1 13.4 3.4 13.1 62,133 50.0 44.7 77.2 10.6 2.6 9.6October 70,623 104.6 34.5 70.8 13.3 3.2 12.7 79,514 64.0 43.4 74.0 13.2 2.9 9.6November 50,385 74.7 33.5 71.5 12.6 3.3 12.6 50,156 40.4 42.7 75.9 11.0 2.9 9.8December 54,709 81.1 32.6 71.0 12.8 3.2 13.0 88,828 71.5 43.2 70.3 15.4 2.8 10.2Total 916,388 . . . 36.6 68.5 14.2 3.4 13.9 1,330,581 . . . 47.1 73.8 13.1 2.4 11.5
2007Second half 838,703 . . . 54.6 67.6 14.3 5.1 13.1 983,519 . . . 67.3 74.4 12.0 4.6 9.1Total 1,847,598 . . . 56.4 67.5 13.2 6.3 13.0 2,396,004 . . . 68.7 72.1 11.4 6.5 9.9
Total Market2008
January 155,365 100.0 100.0 73.8 15.0 2.0 9.2 258,036 100.0 100.0 75.4 15.0 1.5 8.1February 176,639 113.7 100.0 74.9 14.8 1.6 8.8 413,263 160.2 100.0 73.3 16.7 1.1 8.8March 206,527 132.9 100.0 74.8 15.0 1.6 8.7 384,353 149.0 100.0 75.4 14.9 1.2 8.4April 220,260 141.8 100.0 75.0 14.9 1.8 8.3 349,383 135.4 100.0 76.4 14.5 1.2 7.9May 247,334 159.2 100.0 74.4 15.0 2.0 8.5 255,379 99.0 100.0 77.0 13.9 1.5 7.7June 259,289 166.9 100.0 73.2 15.1 2.5 9.2 212,782 82.5 100.0 76.5 13.3 2.4 7.8July 254,473 163.8 100.0 74.2 14.4 2.8 8.6 166,860 64.7 100.0 78.1 12.2 2.3 7.4August 240,375 154.7 100.0 75.0 13.7 2.9 8.4 140,686 54.5 100.0 79.3 11.6 2.2 6.9September 223,511 143.9 100.0 77.8 12.5 2.7 7.0 139,109 53.9 100.0 78.6 12.3 2.2 6.9October 204,911 131.9 100.0 77.0 12.5 3.0 7.5 183,325 71.0 100.0 75.4 14.3 2.8 7.5November 150,455 96.8 100.0 77.8 12.1 2.8 7.2 117,343 45.5 100.0 77.7 12.7 2.3 7.3December 168,047 108.2 100.0 77.4 12.3 2.8 7.5 205,838 79.8 100.0 72.3 16.6 2.2 8.9Total 2,507,186 . . . 100.0 75.3 14.0 2.4 8.3 2,826,357 . . . 100.0 75.8 14.5 1.7 8.0
2007Second half 1,583,770 . . . 100.0 73.1 14.5 2.9 9.5 1,549,741 . . . 100.0 76.8 12.5 3.2 7.6Total 3,321,051 . . . 100.0 73.2 13.7 3.6 9.5 3,570,975 . . . 100.0 75.1 12.0 4.6 8.3
1. Includes loans that were not FHA or GSE eligible or were always GSE eligible. 2. GSE loans include all originations categorized as conventional and sold to Fannie Mae, Freddie Mac, Ginnie Mae, or Farmer Mac by the end of the calendar year. 3. Other loans include loans originated with a Farm Service Agency or Rural Housing Service guarantee and conventional loans not sold to a government-related institution. . . . Not applicable.
Home purchase RefinanceType of loan by
month of origination
Number of loans Growth Market
share
FHA eligible, no
change
Newly FHA
eligible
Newly GSE and FHA eligible
Newly GSE and FHA eligible
NOTE: First-lien mortgages for owner-occupied, 1–4 family, site-built properties; excludes business loans. Government-sponsored entity (GSE) and other loans have been adjusted for the fourth quarter of 2008; for more details, see text.
Other eligibility or no change1
Number of loans Growth Market
share
FHA eligible, no
change
Newly FHA
eligible
Other eligibility or no change1
53
2008 HMDA Data

Number of applications
Number issued
Percent withdrawn
Percent denied
Number of applications
Number of loans
Percent withdrawn
Percent denied
Number of applications
Number of loans
Percent withdrawn
Percent denied
Home purchaseJanuary 102,859 73,644 3.2 3.0 217,027 124,433 14.2 21.2 48,005 31,019 12.4 21.0February 89,047 59,372 3.9 4.2 217,777 134,085 13.0 19.4 60,525 42,643 10.4 17.4March 95,190 61,160 4.7 7.1 238,353 149,236 11.9 18.6 82,971 57,397 11.1 18.1April 96,396 65,874 4.2 4.8 239,885 147,684 13.2 19.7 106,114 72,723 11.5 18.6May 86,310 56,563 4.9 5.7 241,888 158,238 12.3 16.5 124,497 89,270 10.3 16.2June 83,544 54,739 3.8 6.4 246,414 163,806 11.8 16.1 135,951 95,696 10.7 16.9July 82,427 53,663 3.7 6.7 238,464 154,109 12.9 16.4 145,238 100,593 11.3 17.1August 71,505 45,766 4.5 6.2 213,776 139,688 12.8 16.3 145,820 100,914 11.5 16.6September 59,115 36,044 7.1 7.3 183,792 115,074 13.5 18.0 156,340 108,708 11.4 16.2October 69,844 32,936 12.6 7.6 183,889 113,280 14.3 18.4 140,518 91,831 13.1 18.6November 47,634 26,140 7.9 7.3 133,188 80,344 14.3 19.2 106,654 70,271 12.8 18.2December 44,118 24,680 6.3 8.4 138,183 86,176 14.0 17.6 119,790 82,030 12.0 16.2
RefinanceJanuary 53,565 37,895 3.3 3.1 562,486 229,794 16.7 40.6 58,180 28,355 15.0 36.4February 56,450 39,379 5.6 3.9 721,408 373,119 15.4 30.3 72,641 40,302 15.3 29.1March 65,040 45,036 5.9 5.4 675,958 340,698 14.0 31.8 85,825 43,779 17.0 32.5April 56,452 36,362 6.5 5.6 632,885 301,741 14.6 34.2 104,206 47,801 18.8 37.2May 46,880 27,504 7.6 6.5 481,145 212,236 15.0 36.6 101,399 43,284 19.5 40.4June 35,281 17,956 5.6 6.7 401,895 173,151 14.9 37.5 100,743 39,739 20.8 43.0July 31,766 13,779 6.8 7.5 344,968 129,109 16.6 43.0 104,345 37,863 21.8 46.4August 25,533 8,976 7.2 6.9 281,635 104,170 16.8 44.6 101,003 36,617 22.5 46.2September 19,050 7,310 9.2 8.8 266,415 100,132 16.7 45.2 105,068 39,094 23.0 45.7October 30,028 8,841 17.7 7.1 311,590 133,495 15.9 41.0 126,943 49,935 22.2 43.5November 17,166 6,464 12.4 7.5 216,267 81,625 18.4 44.6 101,505 35,798 23.9 47.9December 16,166 7,187 11.8 15.9 332,578 149,506 21.2 34.6 130,673 56,460 22.8 38.9
NOTE: First-lien mortgages for owner-occupied, 1–4 family, site-built properties; excludes business loans.
14. Disposition of home-purchase and refinance applications for private mortgage insurance, conventional loans, and nonconventional loans, by month of action taken, 2008
Private mortgage insurance Conventional NonconventionalPurpose of loan and month of origination
54
2008 HMDA Data

Percent
Above HMDA
Above PMMS +
1.751
Above PMMS +
2.751
High debt-to-income
ratio
Above HMDA
Above PMMS +
1.751
Above PMMS +
2.751
High debt-to-income
ratioFHA
2008January 5.8 3.3 .2 7.9 8.9 5.0 .2 9.8February 4.6 3.0 .2 7.5 7.4 5.0 .2 8.2March 4.0 1.7 .2 9.0 7.1 3.5 .3 10.5April 4.4 1.7 .2 8.6 7.4 3.1 .2 10.1May 3.8 1.3 .2 9.4 7.2 2.6 .3 10.8June 4.1 1.2 .2 10.1 8.2 2.8 .2 12.0July 6.0 1.3 .3 11.2 11.7 3.0 .3 13.3August 15.7 1.3 .3 13.1 23.9 2.5 .2 16.0September 17.3 1.9 .3 13.2 22.7 3.0 .2 15.4October 20.7 2.8 .3 13.7 22.1 3.4 .2 15.6November 23.2 3.1 .3 13.8 25.9 3.9 .2 16.1December 19.1 6.7 1.0 11.6 17.1 6.3 .8 11.6Total 11.6 2.3 .3 11.3 14.3 3.7 .3 12.5
2007Second half 5.2 2.4 .3 9.7 8.8 4.0 .4 11.8Total 4.3 2.1 .3 9.4 7.2 3.4 .5 11.2
VA2008
January .4 .2 .0 15.9 .6 .3 .1 3.5February .3 .2 .0 14.2 .1 .1 .0 3.0March .2 .2 .1 16.2 .2 .1 .0 3.4April .4 .2 .2 14.9 .4 .2 .1 3.0May .3 .2 .2 14.9 .4 .1 .0 2.9June .3 .1 .1 16.3 .3 .1 .0 3.6July .5 .3 .2 17.2 .7 .1 .0 4.7August 1.0 .2 .1 17.8 1.2 .2 .1 5.3September 1.5 .3 .2 17.4 1.5 .1 .1 5.0October 2.6 .3 .2 16.4 1.0 .2 .1 4.0November 3.6 .2 .2 15.2 1.1 .1 .0 4.8December 4.1 1.5 .3 12.5 1.4 .4 .1 4.1Total 1.3 .3 .2 15.8 .7 .2 .1 3.7
2007Second half .2 .1 .0 18.9 .3 .1 .0 6.7Total .2 .1 .1 17.9 .3 .1 .1 6.6
GSE2
2008January 8.2 6.1 1.2 13.7 3.5 2.7 .5 13.8February 7.2 5.3 1.0 12.3 1.9 1.5 .3 10.5March 6.8 3.6 .5 13.3 2.4 1.4 .3 12.0April 5.2 2.4 .2 12.5 2.7 1.5 .3 11.7May 3.1 1.1 .1 12.8 3.1 1.5 .2 13.6June 2.3 .8 .0 13.8 3.0 1.5 .2 15.1July 2.3 .5 .0 14.7 2.8 .8 .1 16.6August 5.3 .4 .0 14.7 5.6 .5 .0 17.0September 5.1 .5 .0 14.4 5.7 .5 .0 15.8October 6.4 .7 .0 14.0 4.8 .6 .0 14.2November 5.8 .5 .0 13.6 5.4 .4 .0 14.6December 4.1 .8 .0 12.2 2.1 .3 .0 10.4Total 5.1 2.0 .3 13.5 3.0 1.4 .2 12.9
2007Second half 10.0 7.2 2.5 15.8 6.6 4.8 1.3 18.2Total 9.0 6.6 2.2 14.9 5.1 3.6 .9 17.1
Other3
2008January 12.0 9.6 3.7 15.6 19.7 17.8 11.3 16.1February 10.2 8.5 3.2 13.4 12.1 10.9 6.6 12.4March 9.5 6.9 3.1 14.7 13.3 10.8 6.7 13.9April 8.7 6.2 2.9 13.9 14.6 11.7 7.0 12.8May 7.1 4.9 2.3 13.8 15.5 11.8 7.3 13.2June 5.6 3.7 1.7 13.8 14.5 11.0 6.9 14.1July 5.9 3.5 1.6 14.4 16.8 12.1 7.9 14.8August 8.9 3.6 1.6 14.7 22.7 13.7 9.2 14.5September 9.2 4.2 2.0 14.5 24.5 16.5 10.8 14.6October 10.2 4.4 2.1 13.6 19.2 11.8 7.8 14.2November 10.7 4.6 2.5 13.6 22.2 14.2 9.7 14.5December 10.4 6.9 3.6 11.8 14.3 11.2 7.4 11.8Total 8.8 5.4 2.5 14.0 16.1 12.4 7.8 13.7
2007Second half 12.7 9.7 4.5 18.1 23.1 19.7 12.0 20.7Total 16.8 14.1 8.7 17.8 28.0 24.7 16.3 21.9
Total Market2008
January 9.1 7.0 2.1 13.8 11.8 10.2 5.7 14.4February 7.7 6.0 1.7 12.0 7.2 6.3 3.3 11.1March 7.0 4.3 1.5 13.1 8.0 6.1 3.3 12.6April 6.1 3.5 1.2 12.1 9.0 6.6 3.5 11.9May 4.6 2.5 .9 12.3 9.8 6.7 3.7 12.8June 3.9 2.0 .7 12.9 9.5 6.3 3.5 13.9July 4.7 1.8 .7 13.7 11.5 6.8 4.0 14.8August 9.8 1.8 .7 14.3 18.2 7.2 4.4 15.4September 11.1 2.2 .8 14.1 18.6 8.3 4.9 15.0October 12.5 2.7 .9 13.9 15.4 6.2 3.4 14.4November 13.6 2.8 1.0 13.8 18.4 7.3 4.2 14.8December 11.9 5.1 1.6 11.9 11.1 6.5 3.4 11.1Total 8.1 3.3 1.1 13.2 11.0 6.9 3.8 13.1
2007Second half 10.7 7.8 3.3 16.6 17.8 14.7 8.5 19.4Total 12.7 10.3 5.6 16.2 28.0 24.7 16.3 21.9
1. PMMS is the prime APR from the Freddie Mac Primary Mortgage Market Survey; see notes to figure 1. 2. See note 2, table 13. 3. See note 3, table 13.
NOTE: First-lien mortgages for owner-occupied, 1–4 family, site-built properties; excludes business loans. Government-sponsored entity (GSE) and other loans have been adjusted for the fourth quarter of 2008; for more details, see text. For explanation of Home Mortgage Disclosure Act price-reporting threshold, see text. The threshold and annual percentage rates (APRs) are for conventional first-lien 30-year prime mortgages.
15. Percent of home-purchase and refinance loans that are higher-priced, by threshold and by type of loan and month of origination, 2008
Type of loan by month of
origination
Home purchase Refinance
55
2008 HMDA Data

16. Market share of home-purchase and refinance loans, by type of originator, type of loan, and loan pricing and by characteristic of borrower, of census tract, and of loan, 2006–08 A. Home purchasePercent
Within CRA assessment area1
Outside CRA assessment area
Less than 1.75
1.75–2.74 2.75
Minority status 4
2006 8.7 20.8 33.3 1.3 44.4 9.1 4.2 .2 13.1 51.1 22.4 53.3 3.4 5.8 37.62007 7.6 32.4 36.4 2.0 29.1 15.0 6.0 .6 25.9 20.8 31.6 72.3 3.9 8.4 15.32008 6.3 40.8 21.2 2.7 35.3 51.4 10.8 2.1 15.0 7.9 12.9 85.6 8.8 4.2 1.52006 12.1 23.8 32.0 .9 43.2 5.6 1.4 .3 13.8 52.4 26.5 57.6 4.6 6.8 31.02007 9.5 38.0 34.0 1.6 26.5 9.7 2.2 .8 27.5 21.6 38.2 75.1 4.7 9.1 11.12008 8.5 47.0 16.2 2.2 34.6 44.7 4.5 2.3 22.9 9.1 16.5 84.8 9.3 4.2 1.62006 4.5 31.8 32.3 1.4 34.4 1.5 .5 .0 26.4 41.4 30.2 83.6 2.5 2.9 11.02007 4.5 41.7 32.4 2.1 23.7 1.9 .6 .1 33.9 23.3 40.3 92.4 1.8 3.0 2.82008 4.9 55.7 17.2 3.2 24.0 11.9 1.3 .2 46.2 17.4 23.0 96.0 2.6 1.0 .42006 1.0 24.5 33.6 1.7 40.0 6.4 2.5 .4 17.4 48.1 25.2 68.8 3.8 5.3 22.12007 .9 37.5 35.4 2.8 24.5 10.1 3.6 .8 27.9 22.2 35.4 83.4 3.3 6.0 7.32008 .9 46.3 21.2 3.7 28.8 39.1 7.3 2.1 25.3 11.2 14.9 90.5 5.8 2.3 1.42006 62.7 31.0 34.9 2.7 31.5 6.1 2.7 .6 28.5 35.1 26.9 83.9 2.4 3.3 10.42007 66.8 36.5 36.3 3.5 23.7 7.3 3.1 1.0 34.3 23.9 30.4 90.4 2.1 3.7 3.82008 69.1 44.6 24.8 4.4 26.2 27.4 5.5 2.6 28.2 16.3 20.1 92.8 4.2 1.9 1.12006 10.9 23.5 30.3 3.0 43.0 4.0 2.6 .1 21.8 42.3 29.2 74.4 2.5 3.6 19.62007 10.6 33.2 34.7 3.7 28.3 6.0 3.6 .3 31.5 23.4 35.1 87.6 2.2 4.1 6.12008 10.4 47.2 21.3 4.7 26.7 26.7 7.1 .9 31.5 13.6 20.2 93.6 4.2 1.7 .6
Borrower income 7
2006 23.5 31.6 32.7 2.8 33.0 11.4 2.4 1.0 25.7 34.1 25.4 74.5 2.9 4.3 18.32007 24.8 38.3 33.6 3.5 24.6 11.7 2.6 1.6 33.6 21.6 28.8 85.0 3.1 5.6 6.32008 28.1 44.3 22.9 3.9 28.9 37.6 4.3 4.2 23.4 14.0 16.5 89.0 6.8 3.0 1.22006 24.7 26.2 35.1 2.6 36.0 8.0 4.0 .6 26.4 38.4 22.6 75.6 2.4 3.5 18.62007 25.2 33.3 36.4 3.5 26.7 10.8 4.8 1.2 33.7 22.2 27.4 87.4 2.4 4.2 6.02008 27.1 42.5 23.5 4.1 30.0 35.6 7.7 2.8 25.6 13.5 14.7 92.1 5.0 2.0 .92006 46.8 28.9 34.6 2.1 34.4 2.6 2.2 .1 24.1 42.2 28.8 79.0 2.3 3.2 15.52007 47.0 37.2 36.6 2.9 23.3 4.4 2.9 .3 32.2 24.2 36.1 89.3 1.9 3.6 5.12008 43.1 48.4 23.0 4.2 24.3 20.6 5.5 .6 33.2 16.3 23.9 93.7 3.5 1.7 1.12006 5.0 19.6 24.2 1.1 54.7 1.1 .4 .2 11.6 50.9 35.8 74.4 8.9 11.4 5.32007 3.1 29.0 33.1 2.2 35.8 3.3 .9 .5 21.7 33.2 40.4 74.0 6.2 14.5 5.32008 1.7 33.2 19.2 4.4 43.2 30.4 3.8 3.0 17.2 16.5 29.1 91.7 3.7 2.2 2.5
Census-tract income 8
2006 15.7 25.6 33.0 1.7 39.6 7.6 1.7 .3 18.3 46.0 26.2 62.5 3.7 5.5 28.32007 14.4 37.7 34.8 2.6 24.9 10.8 2.3 .7 30.1 21.3 34.9 79.1 3.7 7.3 9.92008 13.1 46.8 20.6 3.4 29.2 39.2 4.5 1.9 24.4 11.8 18.2 87.0 7.9 3.7 1.42006 49.6 27.8 34.9 2.5 34.8 6.9 3.2 .7 24.9 38.7 25.7 75.8 3.0 4.2 17.12007 49.7 35.0 37.1 3.4 24.5 9.0 3.9 1.2 33.0 22.4 30.4 86.4 2.7 5.0 5.92008 49.9 44.1 24.3 4.2 27.3 32.8 6.6 3.3 25.8 13.6 17.9 91.0 5.4 2.4 1.22006 33.8 31.4 33.0 2.2 33.5 3.7 2.2 .2 27.0 38.5 28.5 84.7 2.1 2.8 10.32007 35.1 38.2 34.3 2.9 24.6 4.7 2.6 .3 33.4 25.2 33.8 91.7 1.7 3.1 3.52008 35.9 48.0 22.1 3.9 26.0 21.6 5.0 .8 33.1 17.6 21.8 94.8 3.1 1.3 .82006 1.0 2.1 15.2 9.6 72.3 3.8 2.2 1.2 11.2 43.5 38.1 90.2 2.2 3.4 4.22007 .8 2.5 23.9 14.5 59.2 10.2 3.3 2.3 19.0 32.5 32.8 93.1 1.7 3.5 1.72008 1.1 2.3 24.4 12.3 61.1 33.4 3.9 5.1 15.0 18.7 23.9 92.4 4.1 1.8 1.7
Subprime indicators2006 16.4 25.4 31.8 2.0 40.6 3.7 2.8 .3 17.7 47.3 28.1 63.2 1.6 2.6 32.62007 16.2 35.1 34.6 2.9 27.4 4.5 3.6 .6 30.0 25.9 35.5 82.4 2.4 4.7 10.62008 13.2 43.4 21.7 3.2 31.7 25.4 6.9 1.8 28.8 17.9 19.2 93.9 3.2 1.6 1.32006 22.2 15.9 34.0 .4 49.4 .0 .0 .0 13.4 66.1 20.4 55.3 3.4 4.8 36.52007 10.8 33.3 38.5 1.0 27.4 .0 .0 .0 33.0 33.6 33.4 84.0 2.0 2.9 11.02008 1.7 68.3 18.0 4.8 8.9 .0 .0 .0 56.7 18.6 24.7 97.0 1.5 1.1 .4
Total2006 100.0 28.4 33.8 2.3 35.5 5.9 2.6 .4 24.4 39.8 26.8 76.9 2.8 3.9 16.42007 100.0 36.2 35.7 3.2 24.9 7.8 3.2 .8 32.6 23.3 32.2 87.3 2.5 4.6 5.62008 100.0 45.4 23.0 4.1 27.5 29.6 5.7 2.2 28.1 14.9 19.4 91.9 4.9 2.2 1.1
NOTE: First-lien mortgages for owner-occupied, 1–4 family, site-built properties; excludes business loans. 1. Includes lending by nondepository affiliates in the assessment areas of depository institutions covered by the Community Reinvestment Act of 1977 (CRA). 2. Includes loans sold into a private security, to another commerical bank, savings bank or savings association, or a life insurance company. 3. Freddie Mac Primary Mortgage Market Survey annual percentage rate (PMMS APR) is for a 30-year fixed-rate mortgage; for more details, see text.
5. Other minority consists of American Indian or Alaskan Native, and Native Hawaiian or other Pacific Islander. 6. Information for the characteristic was missing on the application.
9. High payment-to-income ratio (PTI) is 30 percent or more.FSA Farm Service Agency.RHS Rural Housing Service.
8. The income category of a census tract is the median family income of the tract relative to that of the MSA or statewide non-MSA in which the tract is located. "Lower" is less than 80 percent of the median; "middle" is 20 to 119 percent; and "high" is 120 percent or more.
Middle
High
Missing6
High PTI9
Piggyback
7. Borrower income is the total income relied upon by the lender in the loan underwriting. Income is expressed relative to the median family income of the metropolitan statistical area (MSA) or statewide non-MSA in which the property being purchased is located. “Lower” is less than 80 percent of the median; “middle” is 80 to 119 percent; and “high” is 120 percent or more.
4. Categories for race and ethnicity reflect revised standards established in 1997 by the Office of Management and Budget. Applicants are placed under only one category for race and ethnicity, generally according to the race and ethnicity of the person listed first on the application. However, under race, the application is designated joint if one applicant reported the single designation of white and the other reported one or more minority races. If the application is not joint but more than one race is reported, the following desiginations are made: If at least two minority races are reported, the application is designated as two or more minority races; if the first person listed on the application reports as two races, and one is white, the application is categorized under the minority race. For loans with two or more applicants, lenders covered under the Home Mortgage Disclosure Act report data on only two.
Lower
Characteristic of borrower, of census
tract, and of loanYear Market
share
Lower
Missing6
Originating institutionDepository (excluding credit unions),
by property location
Middle
High
Missing6
Black or African American
Non-Hispanic white
Hispanic white
Asian
Other minority5
Credit union
Independent mortgage company
GSESold to a non-government
entity2
Held in portfolioRHS/FSAFHA VA
Type of loan Loan pricingHigher priced, by percentage points
above PMMS APR3Lower priced
56
2008 HMDA Data

16. Market share of home-purchase and refinance loans, by type of originator, type of loan, and loan pricing and by characteristic of borrower, of census tract, and of loan, 2006–08 B. RefinancePercent
Within CRA assessment area1
Outside CRA assessment area
Less than 1.75 1.75–2.74 2.75
Minority status 4
2006 9.5 20.9 37.3 2.1 39.5 3.7 .7 .0 12.5 48.9 34.3 49.4 4.2 9.5 37.02007 8.3 27.9 44.2 3.2 24.6 9.1 1.1 .0 19.7 23.1 47.0 62.1 3.7 9.9 24.32008 6.0 39.9 27.8 5.4 26.9 35.1 4.0 .0 22.4 8.5 29.9 77.1 7.4 5.6 9.92006 10.5 29.4 28.7 1.6 40.2 1.8 .1 .0 14.7 49.2 34.2 63.5 4.6 7.6 24.32007 9.2 40.4 34.6 2.7 22.3 3.8 .2 .0 24.7 23.9 47.3 74.1 4.2 8.5 13.32008 5.7 52.9 19.0 5.7 22.5 19.5 1.2 .0 36.3 11.8 31.2 85.3 5.5 4.4 4.92006 3.0 34.8 30.6 1.8 32.6 .5 .0 .0 20.2 41.5 37.8 80.5 3.2 4.8 11.42007 3.1 42.3 33.8 2.8 21.0 .9 .1 .0 26.8 22.8 49.5 87.6 2.4 5.4 4.62008 3.1 55.4 20.5 5.7 18.4 4.4 .3 .0 48.4 16.2 30.7 96.8 1.4 1.0 .72006 1.2 29.0 32.3 2.3 36.4 2.0 .2 .0 16.5 44.8 36.4 67.4 4.0 7.4 21.22007 1.0 37.4 38.5 3.4 20.7 3.7 .3 .0 23.8 23.3 48.9 75.6 3.4 7.7 13.32008 .7 47.9 25.2 6.6 20.2 16.0 1.5 .0 35.2 13.1 34.2 84.5 4.3 3.9 7.32006 61.3 29.5 35.2 3.7 31.8 2.3 .3 .0 22.4 38.2 36.8 75.0 3.2 6.1 15.72007 64.4 33.8 39.1 4.8 22.3 4.5 .4 .0 27.7 23.9 43.6 82.5 2.4 5.9 9.32008 72.5 44.7 27.1 7.4 20.7 14.7 1.2 .0 35.3 16.9 31.8 89.8 3.8 2.9 3.62006 14.5 21.4 32.7 3.0 42.6 1.6 .3 .0 17.4 49.4 31.3 63.2 3.6 7.7 25.62007 14.0 27.7 40.5 3.7 28.1 3.8 .5 .0 24.3 28.4 43.0 75.3 3.1 7.5 14.22008 12.0 45.2 25.2 7.1 22.6 17.5 1.7 .0 37.8 14.4 28.6 90.3 4.4 3.1 2.3
Borrower income 7
2006 24.6 27.1 34.9 3.8 34.2 2.8 .1 .0 20.5 40.7 35.9 62.4 3.6 7.9 26.12007 23.3 32.0 40.0 4.8 23.2 5.6 .2 .0 26.5 22.9 44.8 73.8 3.0 7.7 15.62008 23.5 44.0 26.7 7.3 22.1 17.9 .3 .1 32.7 15.2 33.9 82.9 5.9 4.7 6.52006 26.2 25.5 34.8 3.4 36.2 2.5 .2 .0 21.3 42.3 33.7 66.7 3.3 6.9 23.12007 25.6 30.7 40.2 4.6 24.6 6.0 .2 .0 27.7 24.0 42.2 77.3 2.8 6.6 13.32008 25.5 43.3 26.4 7.4 22.9 19.2 .4 .0 35.3 15.8 29.3 88.0 4.6 3.3 4.02006 43.8 29.5 33.3 2.9 34.4 1.0 .1 .0 18.7 43.3 37.0 74.2 3.3 6.0 16.62007 46.2 35.8 38.0 4.0 22.2 2.5 .1 .0 25.6 25.6 46.2 82.1 2.6 6.1 9.22008 44.9 48.3 25.5 7.5 18.7 10.2 .3 .0 38.4 17.6 33.5 91.8 3.1 2.4 2.72006 5.4 24.8 35.1 1.2 38.8 7.7 3.5 .0 17.9 40.1 30.7 81.2 5.8 8.0 4.92007 5.0 31.2 40.9 1.7 26.5 11.7 5.5 .0 23.1 23.2 36.5 84.7 3.7 7.7 3.92008 6.2 37.0 29.3 2.1 31.7 41.7 17.0 .0 23.3 5.0 13.0 95.7 2.1 1.1 1.1
Census-tract income 8
2006 17.9 24.9 33.1 2.4 39.3 2.6 .2 .0 15.2 47.2 34.7 57.7 4.3 8.6 29.52007 16.0 33.0 39.5 3.5 24.0 5.9 .3 .0 22.9 24.3 46.6 69.1 3.7 9.0 18.12008 11.9 44.8 25.6 6.4 23.3 23.4 1.2 .0 30.5 12.5 32.3 81.2 6.5 5.2 7.12006 52.0 26.9 35.2 3.3 34.6 2.5 .4 .0 20.6 41.1 35.5 68.6 3.6 7.2 20.62007 52.2 31.9 40.6 4.4 23.1 5.3 .5 .0 26.7 23.7 43.8 77.9 2.9 7.0 12.22008 52.0 43.7 27.6 7.3 21.4 18.6 1.6 .0 33.9 14.9 31.0 87.3 4.7 3.6 4.52006 29.5 31.1 33.2 3.0 32.8 1.4 .2 .0 21.4 40.8 36.2 78.7 2.9 5.0 13.52007 31.0 36.8 37.0 3.9 22.3 2.7 .3 .0 27.3 25.6 44.1 85.9 2.2 4.9 7.02008 35.1 49.2 24.5 6.5 19.8 10.2 1.1 .0 39.5 18.1 31.1 94.1 2.4 1.8 1.72006 .6 2.7 21.1 17.8 57.2 1.6 1.0 .1 10.3 57.7 29.4 85.0 3.0 5.3 6.72007 .7 2.4 24.6 19.1 54.1 8.2 .6 .0 19.1 29.1 43.1 90.3 1.8 4.6 3.32008 1.0 2.2 24.9 22.3 50.9 22.1 1.6 .1 20.5 19.7 36.0 91.8 3.0 2.4 2.8
Subprime indicators2006 24.0 20.3 32.9 1.6 44.8 .9 .1 .0 13.5 56.2 29.3 54.3 2.4 5.4 37.92007 20.1 28.2 40.5 2.5 28.6 2.6 .1 .0 22.3 31.6 43.4 70.6 2.3 6.3 20.72008 13.1 39.5 27.3 4.5 28.6 15.5 .4 .0 34.8 20.3 29.0 89.7 3.0 2.6 4.72006 . . . . . . . . . . . . . . . . . . . . . . . . . . . . . . . . . . . . . . . . . . . . .2007 . . . . . . . . . . . . . . . . . . . . . . . . . . . . . . . . . . . . . . . . . . . . .2008 . . . . . . . . . . . . . . . . . . . . . . . . . . . . . . . . . . . . . . . . . . . . .
Total 2006 100.0 27.6 34.2 3.1 35.1 2.2 .3 .0 19.8 42.2 35.5 69.7 3.5 6.8 20.02007 100.0 33.4 39.2 4.2 23.2 4.6 .4 .0 26.2 24.4 44.3 79.1 2.8 6.7 11.52008 100.0 45.3 26.2 7.1 21.3 16.3 1.4 .0 35.3 15.8 31.3 89.0 4.1 3.1 3.8
NOTE: See notes to table 16.A. 10. Piggyback data for refinance loans are omitted due to possibly significant underreporting of such loans.… Not applicable.
Lower
Piggyback10
Middle
High
Missing6
High PTI9
Middle
High
Missing6
Non-Hispanic white
VA
Missing6
Black or African American
Hispanic white
Asian
Other minority5
Lower
Loan pricingDepository (excluding credit unions),
by property location Credit union
Independent mortgage company
FHASold to a non-government
entity2RHS/FSA
Higher priced, by percentage points above PMMS APR3
Held in portfolio
Lower pricedGSE
Originating institution Type of loan
Characteristic of borrower, of census
tract, and of loanYear Market
share
57
2008 HMDA Data

17. Cumulative distribution of home loans, by borrower income and by purpose, type, and pricing of loan, 2007–08 A. Home purchase Percent
2007 2008 2007 2008 2007 2008 2007 2008 2007 2008 2007 200824 4.6 3.0 .8 .6 2.9 3.0 3.0 2.9 5.4 6.6 5.4 8.149 43.5 35.7 28.2 24.1 26.2 25.1 27.6 28.2 35.6 42.2 35.2 42.874 78.1 68.9 66.3 60.5 50.4 48.2 53.1 55.1 61.6 68.8 61.3 67.299 92.4 86.5 87.5 82.3 67.7 65.5 70.3 72.7 77.1 82.9 76.9 80.7124 96.9 93.9 95.7 92.5 78.7 76.9 80.7 82.9 85.7 89.7 85.6 87.7149 98.4 96.9 98.5 96.8 85.1 83.8 86.6 88.4 90.3 93.2 90.3 91.4199 99.3 99.0 99.8 99.3 92.0 91.2 92.9 94.0 95.0 96.3 95.1 95.1249 99.6 99.6 99.9 99.8 95.1 94.5 95.6 96.3 97.0 97.6 97.1 96.7299 99.7 99.8 100.0 99.9 96.6 96.2 96.9 97.5 97.8 98.2 97.9 97.6More than 299 100.0 100.0 100.0 100.0 100.0 100.0 100.0 100.0 100.0 100.0 100.0 100.0
MEMOBorrower income, by selected loan type (thousands of dollars)1
Mean 59.8 67.1 68.3 73.7 102.2 107.1 97.7 93.3 84.6 77.0 84.6 83.1Median 53.0 59.0 62.0 66.0 74.0 77.0 71.0 69.0 62.0 55.0 62.0 55.0
1. Income amounts are reported under HMDA to the nearest $1,000. 2. See note 3, table 13. 3. Higher-priced adjusted loans are those with annual percentage rates (APRs) 1.75 percentage points or more above the 30-year fixed-rate APR from the Freddie Mac Primary Mortgage Market Survey.
NOTE: Includes only first-lien originations for owner-occupied, 1–4-family, site-built properties; excludes business-related loans. For loans with two or more applicants, HMDA-covered lenders report data on only two. Income for two applicants is reported jointly. For definitions of lower- and higher-priced lending, see text.
FHA VA Other2 Total High price Adjusted high price3Upper bound of borrower income (thousands of
dollars)1
58
2008 HMDA Data

17. Cumulative distribution of home loans, by borrower income and by purpose, type, and pricing of loan, 2007–08 B. Refinance Percent
2007 2008 2007 2008 2007 2008 2007 2008 2007 2008 2007 200824 2.9 2.6 3.6 2.7 3.2 3.3 3.2 3.2 5.1 8.5 5.2 9.949 34.2 30.5 29.4 23.9 25.0 23.1 25.4 24.2 33.7 42.1 34.5 44.474 72.2 65.9 65.9 57.3 51.2 47.7 52.1 50.4 62.1 70.5 63.2 71.799 91.1 86.3 86.4 80.1 69.9 66.5 70.8 69.5 79.1 85.5 80.0 86.0124 97.4 94.8 95.5 91.6 81.2 78.8 81.9 81.2 87.9 82.3 88.6 92.5149 99.1 97.8 98.5 96.4 87.3 85.7 87.8 87.5 92.1 95.4 92.6 95.4199 96.7 99.5 99.6 99.2 93.5 92.8 93.7 93.8 96.1 97.7 96.4 97.7249 99.8 99.8 99.9 99.7 96.0 95.7 96.2 96.3 97.7 98.6 97.9 98.6299 99.8 99.9 99.9 99.8 97.2 97.1 97.3 97.5 98.4 99.0 98.5 99.0More than 299 100.0 100.0 100.0 100.0 100.0 100.0 100.0 100.0 100.0 100.0 100.0 100.0
MEMOBorrower income, by selected loan type (thousands of dollars)1
Mean 64.2 68.3 67.7 75.3 96.8 101.7 95.3 96.7 80.3 69.1 78.7 67.5Median 59.0 62.0 63.0 68.0 73.0 77.0 72.0 74.0 62.0 55.0 62.0 54.0 NOTE: See notes to table 17.A.
Adjusted high price3Upper bound of borrower income (thousands of
dollars)1
FHA VA Other2 Total High price
59
2008 HMDA Data

18. Cumulative distribution of home loans, by loan amount and by type, 2007–08 A. Home purchase Percent
2007 2008 2007 2008 2007 2008 2007 2008 2007 2008 2007 200824 .1 .1 .0 .0 .4 .5 .3 .3 1.0 2.0 1.1 3.949 2.2 1.5 .4 .3 2.3 2.8 2.3 2.3 5.6 10.0 5.8 15.074 11.4 7.9 2.5 2.2 7.8 8.4 7.9 7.9 15.9 23.6 16.3 29.699 26.6 18.9 8.8 7.3 15.5 16.0 16.1 16.3 27.1 37.8 27.6 42.5149 60.6 47.6 32.9 28.7 35.9 35.6 37.7 38.7 48.1 61.8 48.7 63.3199 85.1 71.4 60.6 55.4 53.4 52.4 56.1 58.2 63.1 76.4 63.5 75.8274 96.3 89.1 85.0 80.2 71.4 70.6 73.8 76.6 77.7 87.1 78.0 86.1417 99.8 98.2 98.9 97.0 88.6 89.0 89.8 92.2 91.2 95.3 91.4 94.4625 100.0 99.7 100.0 99.8 96.1 96.5 96.5 97.6 97.5 98.4 97.7 98.0729 100.0 99.9 100.0 100.0 97.4 97.6 97.7 98.4 98.5 98.9 98.7 98.6More than 799 100.0 100.0 100.0 100.0 100.0 100.0 100.0 100.0 100.0 100.0 100.0 100.0
MEMO
Loan amount (thousands of dollars)Mean 142.3 171.4 193.1 207.3 241.1 238.6 231.9 216.9 205.5 164.6 202.6 164.8Median1 134.0 154.0 179.0 188.0 188.0 190.0 180.0 176.0 155.0 124.0 152.0 116.0
1. Loan amounts are reported under the Home Mortgage Disclosure Act to the nearest $1,000. 2. See note 3, table 13. 3. See note 3, table 17.A.
NOTE: Includes only first-lien originations for owner-occupied, 1–4 family, site-built properties; excludes business-related loans. For definitions of lower- and higher-priced lending, see text.
FHA VA Other2 Total High price Adjusted high price3Upper bound of loan amount (thousands of
dollars)1
60
2008 HMDA Data

18. Cumulative distribution of home loans, by loan amount and by type, 2007–08 B. Refinance Percent
2007 2008 2007 2008 2007 2008 2007 2008 2007 2008 2007 200824 .1 .0 .1 .0 1.1 1.1 1.0 .9 2.2 5.3 2.3 7.149 1.0 .7 .9 .7 4.1 4.8 3.9 4.0 7.0 17.7 7.1 21.574 6.1 4.7 4.7 4.0 10.5 11.7 10.3 10.5 16.0 33.1 16.3 37.799 17.3 13.5 13.5 10.9 18.5 20.2 18.4 19.0 26.2 46.8 26.8 51.1149 50.2 41.3 40.1 32.6 37.2 39.7 37.8 39.8 47.2 68.7 48.4 71.6199 76.5 66.7 64.5 56.1 53.7 56.4 54.8 58.1 63.2 81.8 64.4 83.5274 93.4 88.1 87.5 81.1 71.4 74.2 72.5 76.5 78.2 91.1 79.3 91.8417 99.7 98.7 99.3 98.1 88.9 92.0 89.4 93.1 91.5 97.2 92.1 97.3625 100.0 99.8 100.0 99.9 96.4 97.7 96.6 98.1 97.7 99.1 97.9 99.1729 100.0 100.0 100.0 100.0 97.7 98.4 97.8 98.7 98.6 99.4 98.8 99.4More than 799 100.0 100.0 100.0 100.0 100.0 100.0 100.0 100.0 100.0 100.0 100.0 100.0
MEMO
Loan amount (thousands of dollars)Mean 160.3 179.8 181.7 200.2 235.0 217.4 231.4 211.0 202.3 138.1 197.0 130.7Median1 149.0 164.0 168.0 186.0 186.0 178.0 183.0 175.0 157.0 105.0 153.0 97.0 NOTE: See notes to table 18.A.
Adjusted high price3Upper bound of loan amount (thousands of
dollars)1
FHA VA Other2 Total High price
61
2008 HMDA Data

A. Conventional home purchase, adjusted and unadjusted for changes in interest rates, 2007–08 Percent except as noted
Borrower-related
Borrower- related plus
lender
Borrower-related
Borrower- related plus
lender
Race other than white onlyAmerican Indian or Alaska Native 13,678 19.9 17.9 15.8 13,678 16.4 15.0 13.0Asian 146,411 7.7 8.3 9.5 146,411 5.9 6.5 7.6Black or African American 196,967 34.1 29.7 22.5 196,967 29.7 25.9 18.6Native Hawiian or other Pacific Islander 11,757 17.7 17.0 14.2 11,757 14.1 14.0 11.4Two or more minority races 1,876 13.0 12.8 13.3 1,876 10.8 10.4 10.7Joint 36,550 8.9 13.4 12.0 36,550 7.3 11.1 9.6Missing 277,348 14.2 18.7 14.4 277,348 11.7 15.9 11.8
White, by ethnicityHispanic white 261,935 28.7 21.3 16.5 261,935 23.6 17.5 13.0Non-Hispanic white 1,950,566 10.6 10.6 10.6 1,950,566 8.4 8.4 8.4
SexOne male 906,127 18.6 18.6 18.6 906,127 15.2 15.2 15.2One female 664,102 17.1 16.4 17.2 664,102 13.9 13.4 14.1Two males 28,649 14.6 14.6 14.6 28,649 11.9 11.9 11.9Two females 24,439 15.3 13.3 14.0 24,439 12.9 11.0 12.0
Race other than white onlyAmerican Indian or Alaska Native 5,969 11.7 10.1 9.4 5,969 7.2 5.7 5.0Asian 105,156 3.3 5.9 6.4 105,156 1.4 3.2 3.6Black or African American 55,987 17.1 14.4 14.0 55,987 10.5 8.7 8.0Native Hawiian or other Pacific Islander 4,986 7.2 8.3 8.9 4,986 3.2 4.5 4.6Two or more minority races 1,132 5.0 5.4 8.6 1,132 2.0 3.0 4.1Joint 21,215 4.9 7.3 7.3 21,215 2.8 4.2 4.1Missing 146,339 4.9 7.2 7.5 146,339 2.4 3.9 4.3
White, by ethnicityHispanic white 91,804 15.4 11.9 11.1 91,804 8.5 6.8 5.8Non-Hispanic white 1,109,587 6.5 6.5 6.5 1,109,587 3.7 3.7 3.7
SexOne male 440,197 8.9 8.9 8.9 440,197 5.0 5.0 5.0One female 314,078 7.7 7.5 7.9 314,078 4.1 4.0 4.4Two males 17,547 9.6 9.6 9.6 17,547 5.6 5.6 5.6Two females 13,498 7.6 7.7 9.1 13,498 4.1 4.1 5.4
19. Incidence of higher-priced lending, unmodified and modified for borrower- and lender-related factors, for first liens on owner-occupied, one- to four-family, site-built homes, by race, ethnicity, and sex of borrower
Race, ethnicity, and sex Number of loans
Unmodified incidence
Modified incidence, by modification factor Number of
loansUnmodified incidence
Modified incidence, by modification factor
NOTE: Excludes transition-period loans (those for which the application was submitted before 2004). For definition of higher-priced lending and explanations of spread adjustment and modification factors, see text. Loans taken out jointly by a male and female are not tabulated here because they would not be directly comparable with loans taken out by one borrower or by two borrowers of the same sex.
2007Unadjusted spread Adjusted spread
2008Unadjusted spread Adjusted spread
62
2008 HMDA Data

B. Conventional refinance, adjusted and unadjusted for changes in interest rates, 2007–08 Percent except as noted
Borrower-related
Borrower- related plus
lender
Borrower-related
Borrower- related plus
lender
Race other than white onlyAmerican Indian or Alaska Native 19,508 26.4 29.2 20.3 19,508 23.1 26.1 17.6Asian 108,317 12.5 15.8 17.3 108,317 10.1 13.4 14.8Black or African American 266,661 41.4 38.8 25.1 266,661 37.8 35.3 22.0Native Hawiian or other Pacific Islander 15,801 23.0 26.9 21.9 15,801 19.5 23.9 19.0Two or more minority races 2,556 17.5 19.3 20.6 2,556 15.3 17.5 17.8Joint 34,305 18.6 23.3 19.0 34,305 16.4 20.7 16.6Missing 438,423 25.9 31.4 22.7 438,423 22.8 28.2 19.8
White, by ethnicityHispanic white 302,012 27.0 25.3 21.4 302,012 22.8 21.9 18.5Non-Hispanic white 2,174,308 18.2 18.2 18.2 2,174,308 15.8 15.8 15.8
SexOne male 927,344 23.8 23.8 23.8 927,344 20.6 20.6 20.6One female 778,477 24.9 23.8 23.6 778,477 21.6 20.5 20.4Two males 23,147 19.4 19.4 19.4 23,147 17.0 17.0 17.0Two females 25,363 26.6 22.2 20.7 25,363 23.8 19.6 18.3
Race other than white onlyAmerican Indian or Alaska Native 9,693 19.7 18.8 12.6 9,693 15.7 15.4 9.3Asian 83,697 2.9 8.0 9.3 83,697 1.7 5.6 6.8Black or African American 102,119 27.9 24.8 15.2 102,119 22.7 20.4 11.0Native Hawiian or other Pacific Islander 6,924 10.7 14.9 11.0 6,924 7.9 11.2 7.7Two or more minority races 2,050 6.2 10.4 10.6 2,050 4.3 7.4 7.1Joint 26,145 8.1 11.6 10.4 26,145 6.1 8.6 7.7Missing 244,501 7.8 10.9 10.9 244,501 5.4 7.6 8.0
White, by ethnicityHispanic white 118,457 14.4 13.2 11.4 118,457 10.2 9.5 8.1Non-Hispanic white 1,708,479 9.9 9.9 9.9 1,708,479 7.1 7.1 7.1
SexOne male 542,449 11.2 11.2 11.2 542,449 8.0 8.0 8.0One female 441,113 12.6 10.9 10.8 441,113 9.2 7.9 7.8Two males 16,661 10.3 10.3 10.3 16,661 7.3 7.3 7.3Two females 17,633 14.4 11.9 11.1 17,633 10.9 8.9 7.7 NOTE: See notes to table 19.A.
19. Incidence of higher-priced lending, unmodified and modified for borrower- and lender-related factors, for first liens on owner-occupied, one- to four-family, site-built homes, by race, ethnicity, and sex of borrower
Race, ethnicity, and sex Number of loans
Unmodified incidence
Modified incidence, by modification factor
Number of loans
Unmodified incidence
Modified incidence, by modification factor
Unadjusted spread Adjusted spread
2007Unadjusted spread Adjusted spread
2008
63
2008 HMDA Data

19. Incidence of higher-priced lending, unmodified and modified for borrower- and lender-related factors, for first liens on owner-occupied, one- to four-family, site-built homes, by race, ethnicity, and sex of borrower C. Nonconventional home purchase and refinance, 2008 Percent except as noted
Race, ethnicity, and sex Number of loans
Unmodified incidence
Modified incidence, by modification factor
Number of loans
Unmodified incidence
Modified incidence, by modification factor
Borrower-related
Borrower-related plus
lender
Borrower-related
Borrower-related plus
lender
Unadjusted spreadHome purchase Refinance
Race other than white onlyAmerican Indian or Alaska Native
7,546 8.1 9.8 10.5 2,270 10.8 13.3 12.8Asian 19,360 7.9 9.1 9.2 4,758 8.2 9.3 10.4Black or African American 111,375 12.0 11.9 11.2 73,007 13.8 16.1 14.7Native Hawiian or other Pacific Islander 4,782 8.8 10.4 9.9 1,566 12.0 16.5 15.1Two or more minority races 802 11.3 12.4 10.6 305 15.7 20.5 13.1Joint 20,081 7.0 9.8 9.7 7,692 8.8 11.2 11.3Missing 87,225 8.4 10.7 9.6 63,069 15.4 16.8 12.9
White, by ethnicityHispanic white 107,031 12.4 9.6 9.7 32,361 10.3 12.0 12.3Non-Hispanic white 719,687 8.1 8.1 8.1 368,192 11.7 11.7 11.7
SexOne male 328,082 9.6 9.6 9.6 148,319 12.5 12.5 12.5One female 213,682 10.6 8.8 8.9 107,427 13.4 11.9 12.2Two males 21,843 12.1 12.1 12.1 5,988 12.5 12.5 12.5Two females 17,412 12.3 11.8 6.8 7,148 13.8 12.0 10.8
Adjusted spreadHome Purchase Refinance
R h h hi lRace other than white onlyAmerican Indian or Alaska Native
7,546 1.4 1.7 2.3 2,270 2.6 3.2 2.8Asian 19,360 1.1 1.2 1.5 4,758 1.4 1.7 2.0Black or African American 111,375 2.6 2.4 2.2 73,007 3.9 4.6 3.7Native Hawiian or other Pacific Islander 4,782 1.5 1.8 1.8 1,566 3.6 3.5 2.7Two or more minority races 802 3.1 4.9 2.3 305 6.2 9.7 3.3Joint 20,081 1.4 2.0 1.9 7,692 2.4 3.4 3.7Missing 87,225 1.6 2.5 2.0 63,069 4.3 4.1 3.3
White, by ethnicityHispanic white 107,031 2.3 1.7 1.7 32,361 2.3 2.9 2.9Non-Hispanic white 719,687 1.5 1.5 1.5 368,192 2.7 2.7 2.7
SexOne male 328,082 1.8 1.8 1.8 148,319 3.1 3.1 3.1One female 213,682 2.1 2.1 1.6 107,427 3.4 2.9 3.0Two males 21,843 2.3 2.3 2.3 5,988 2.7 2.7 2.7Two females 17,412 2.3 2.2 2.0 7,148 3.3 2.9 2.9 NOTE: Excludes transition-period loans (those for which the application was submitted before 2004). For definition of higher-priced lending and explanation of modification factors, see text. Loans taken out jointly by a male and female are not tabulated here because they would not be directly comparable with loans taken out by one borrower or by two borrowers of the same sex.
64
2008 HMDA Data

A. Coventional home purchase, adjusted and unadjusted for changes in interest rates, 2007–08 Percent except as noted
Borrower-related
Borrower-related plus
lender
Borrower-related
Borrower- related plus
lender
Race other than white onlyAmerican Indian or Alaska Native 2,727 4.46 4.48 4.49 2,244 3.27 3.26 3.34Asian 11,263 4.29 4.33 4.39 8,627 3.18 3.22 3.27Black or African American 67,231 4.94 4.92 4.67 58,491 3.73 3.71 3.49Native Hawiian or other Pacific Islander 2,086 4.52 4.59 4.53 1,654 3.42 3.42 3.40Two or more minority races 243 4.78 4.83 4.75 203 3.62 3.64 3.67Joint 3,264 4.65 4.64 4.52 2,667 3.52 3.47 3.38Missing 39,267 4.68 4.80 4.60 32,511 3.52 3.63 3.43
White, by ethnicityHispanic white 75,103 4.52 4.49 4.45 61,754 3.35 3.31 3.30Non-Hispanic white 206,469 4.42 4.42 4.42 164,132 3.28 3.28 3.28
SexOne male 168,684 4.55 4.55 4.55 138,085 3.39 3.39 3.39One female 113,427 4.54 4.54 4.55 92,374 3.39 3.40 3.40Two males 4,189 4.54 4.54 4.54 3,397 3.40 3.40 3.40Two females 3,743 4.81 4.63 4.59 3,153 3.65 3.46 3.41
Race other than white onlyAmerican Indian or Alaska Native 700 4.16 4.17 4.23 427 3.12 3.19 3.34Asian 3,465 3.65 3.85 3.86 1,460 2.63 2.69 2.63Black or African American 9,601 3.88 4.02 4.10 5,855 2.76 2.90 2.99Native Hawiian or other Pacific Islander 357 3.70 3.87 4.01 159 2.73 2.80 3.24Two or more minority races 57 3.73 4.39 4.35 23 2.85 3.59 3.74Joint 1,045 4.05 3.93 4.06 596 3.02 2.88 2.93Missing 7,241 3.69 3.79 4.01 3,540 2.64 2.72 2.92
White, by ethnicityHispanic white 14,130 3.83 3.96 4.05 7,776 2.76 2.84 2.98Non-Hispanic white 72,549 3.97 3.97 3.97 41,588 2.89 2.89 2.89
SexOne male 39,093 3.87 3.87 3.87 21,852 2.79 2.79 2.79One female 24,189 3.80 3.81 3.83 12,907 2.72 2.75 2.76Two males 1,683 3.99 3.99 3.99 985 2.87 2.87 2.87Two females 1,023 3.88 3.86 4.05 547 2.83 2.82 2.86
2007
20. Mean APR spreads, unmodified and modified for borrower- and lender-related factors, for higher-priced loans on one- to four-family homes, by type of loan and by race, ethnicity, and sex of borrower
Race, ethnicity, and sexNumber of
higher-priced loans
Unmodified mean spread
Modified mean spread, by modification factor Number of
higher-priced loans
Unmodified mean spread
Modified mean spread, by modification factor
NOTE: Spread-unadjusted annual percentage rate (APR) is the difference between the APR on the loan and the yield on a comparable-maturity Treasury security. Spread-adjusted APR is the difference between the APR on the loan and the estimated APR reported by Freddie Mac for a 30-year fixed-rate loan in its Primary Mortgage Market Survey. Excludes transition-period loans (those for which the application was submitted before 2004). For definition of higher-priced lending and explanation of modification factors, see text. Loans taken out jointly by a male and female are not tabulated here because they would not be directly comparable with loans taken out by one borrower or by two borrowers of the same sex.
Unadjusted spread Adjusted spread
2008Unadjusted spread Adjusted spread
65
2008 HMDA Data

B. Conventional refinance, adjusted and unadjusted for changes in interest rates, 2007–08 Percent except as noted
Borrower-related
Borrower- related plus
lender
Borrower-related
Borrower- related plus
lender
Race other than white onlyAmerican Indian or Alaska Native 5,145 4.77 4.77 4.79 4,515 3.52 3.50 3.54Asian 13,581 4.29 4.62 4.69 10,950 3.11 3.41 3.47Black or African American 110,464 5.06 5.04 4.86 100,695 3.77 3.75 3.61Native Hawiian or other Pacific Islander 3,639 4.63 4.82 4.81 3,075 3.44 3.55 3.56Two or more minority races 447 4.83 4.84 4.75 392 3.59 3.58 3.51Joint 6,365 4.79 4.90 4.82 5,631 3.53 3.63 3.58Missing 113,472 4.88 4.97 4.75 100,081 3.64 3.71 3.51
White, by ethnicityHispanic white 81,628 4.68 4.77 4.80 68,909 3.50 3.54 3.57Non-Hispanic white 396,194 4.71 4.71 4.71 344,009 3.47 3.47 3.47
SexOne male 221,043 4.77 4.77 4.77 191,322 3.55 3.55 3.55One female 193,694 4.78 4.75 4.76 167,975 3.56 3.53 3.53Two males 4,502 4.77 4.77 4.77 3,937 3.52 3.52 3.52Two females 6,750 4.91 4.82 4.79 6,046 3.64 3.57 3.52
Race other than white onlyAmerican Indian or Alaska Native 1,914 5.12 5.00 4.68 1,525 3.93 3.79 3.58Asian 2,429 4.08 4.47 4.59 1,450 3.08 3.43 3.47Black or African American 28,476 5.28 5.38 4.89 23,191 4.11 4.17 3.75Native Hawiian or other Pacific Islander 743 4.71 4.91 4.70 549 3.62 3.74 3.66Two or more minority races 128 4.76 5.12 4.83 88 3.89 4.28 3.99Joint 2,115 4.72 4.78 4.73 1,584 3.58 3.64 3.58Missing 19,179 4.46 4.58 4.67 13,155 3.42 3.54 3.52
White, by ethnicityHispanic white 17,025 4.63 4.69 4.71 12,080 3.58 3.57 3.63Non-Hispanic white 168,484 4.66 4.66 4.66 122,082 3.54 3.54 3.54
SexOne male 60,584 4.63 4.63 4.63 43,232 3.56 3.56 3.56One female 55,666 4.77 4.72 4.63 40,779 3.69 3.64 3.54Two males 1,710 4.50 4.50 4.50 1,221 3.36 3.36 3.36Two females 2,540 4.84 4.68 4.39 1,921 3.72 3.45 3.28 NOTE: See notes to table 20.A.
20. Mean APR spreads, unmodified and modified for borrower- and lender-related factors, for higher-priced loans on one- to four-family homes, by type of loan and by race, ethnicity, and sex of borrower
2007Unadjusted spread Adjusted spread
Race, ethnicity, and sexNumber of
higher-priced loans
Unmodified mean spread
Modified mean spread, by modification factor Number of
higher-priced loans
Unadjusted spread Adjusted spread
Unmodified mean spread
Modified mean spread, by modification factor
2008
66
2008 HMDA Data

Borrower-related
Borrower-related plus
lender
Borrower-related
Borrower-related plus
lender
Race other than white onlyAmerican Indian or Alaska Native
610 3.34 3.34 3.38 245 3.38 3.43 3.45Asian 1,527 3.32 3.31 3.37 392 3.31 3.31 3.49Black or African American 13,388 3.39 3.40 3.41 10,103 3.40 3.39 3.41Native Hawiian or other Pacific Islander 422 3.36 3.39 3.38 188 3.62 3.32 3.35Two or more minority races 91 3.38 3.37 3.31 48 3.37 3.51 3.30Joint 1,399 3.49 3.39 3.39 674 3.38 3.39 3.45Missing 7,335 3.34 3.39 3.40 9,712 3.38 3.35 3.41
White, by ethnicityHispanic white 13,267 3.40 3.38 3.37 3,334 3.44 3.82 3.37Non-Hispanic white 58,517 3.37 3.37 3.37 42,901 3.37 3.37 3.37
SexOne male 31,483 3.37 3.37 3.37 18,522 3.38 3.38 3.38One female 22,722 3.39 3.40 3.37 14,403 3.40 3.50 3.36Two males 2,650 3.37 3.37 3.37 751 3.36 3.36 3.36Two females 2,138 3.36 3.35 3.35 985 3.37 3.39 3.44
Race other than white onlyAmerican Indian or Alaska Native
109 2.26 2.14 2.36 58 2.07 2.30 2.32Asian 211 2.30 2.08 2.27 67 2.11 1.62 2.45Black or African American 2,906 2.26 2.38 2.45 2,831 2.19 2.13 2.25Native Hawiian or other Pacific Islander 71 2.41 2.16 2.27 56 2.88 2.02 2.35Two or more minority races 25 2.17 1.74 2.21 19 2.03 2.34 2.34Joint 277 2.91 2.31 2.29 181 2.20 2.16 2.42Missing 1,401 2.19 2.37 2.40 2,713 2.09 2.02 2.32
White, by ethnicityHispanic white 2,411 2.47 2.35 2.27 731 2.61 3.42 2.23Non-Hispanic white 10,553 2.36 2.36 2.36 10,057 2.24 2.24 2.24
SexOne male 5,992 2.30 2.30 2.30 4,600 2.20 2.20 2.20One female 4,386 2.36 2.50 2.28 3,634 2.27 2.27 2.11Two males 498 2.30 2.30 2.30 162 2.21 2.21 2.21Two females 392 2.26 2.28 2.37 238 2.13 1.71 2.72
Refinance
NOTE: Spread annual percentage rate (APR) is the difference between the APR on the loan and the yield on a comparable-maturity Treasury security. Excludes transition-period loans (those for which the application was submitted before 2004). For definition of higher-priced lending and explanation of modification factors, see text. Loans taken out jointly by a male and female are not tabulated here because they would not be directly comparable with loans taken out by one borrower or by two borrowers of the same sex.
20. Mean APR spreads, unmodified and modified for borrower- and lender-related factors, for higher-priced first liens on owner-occupied, one- to four-family, site-built homes, by race, ethnicity, and sex of borrower C. Nonconventional home purchase and refinance, 2008 Percentage points except as noted
Race, ethnicity, and sexNumber of
higher-priced loans
Unmodified mean spread
Home purchase Refinance
Modified mean spread, by modification factor
Adjusted spread
Unadjusted spreadHome purchase
Modified mean spread, by modification factor Number of
higher-priced loans
Unmodified mean spread
67
2008 HMDA Data

A. Conventional home purchase, 2007–08 Percent except as noted
Borrower-related
Borrower- related plus
lender
Borrower-related
Borrower- related plus
lender
Race other than white onlyAmerican Indian or Alaska Native 22,627 27.9 24.8 20.7 9,939 29.7 24.6 21.0Asian 210,828 17.4 15.0 15.1 152,213 18.7 16.6 16.8Black or African American 364,887 35.3 30.4 23.5 105,001 36.1 29.7 25.4Native Hawiian or other Pacific Islander 19,436 27.5 21.9 20.2 8,016 26.9 22.7 21.0Two or more minority races 2,824 23.5 21.7 21.4 1,669 23.6 21.9 23.8Joint 48,325 14.5 18.2 15.5 28,195 14.8 17.6 15.3Missing 441,246 24.5 23.2 17.8 220,395 21.5 19.9 17.0
White, by ethnicityHispanic white 448,973 29.9 22.1 19.5 160,823 31.1 22.7 22.0Non-Hispanic white 2,495,779 13.2 13.2 13.2 1,425,869 13.6 13.6 13.6
SexOne male 1,349,211 22.7 22.7 22.7 640,030 21.3 21.3 21.3One female 967,818 21.6 21.3 21.7 443,753 19.8 19.4 19.9Two males 41,128 21.0 21.0 21.0 25,195 21.1 21.1 21.1Two females 35,184 21.1 19.3 19.5 19,148 20.4 19.3 19.6
Modified denial rate, by modification factor
2007 2008
NOTE: Includes transition-period applications (those submitted before 2004). For explanation of modification factors, see text. Applications made jointly by a male and female are not tabulated here because they would not be directly comparable with applications made by one applicant or by two applicants of the same sex.
21. Denial rates on applications, unmodified and modified for borrower- and lender-related factors, for first liens on owner- occupied, one- to four-family, site-built homes, by race, ethnicity, and sex of applicant
Race, ethnicity, and sex
Number of applications
acted upon by lender
Unmodified denial rate
Modified denial rate, by modification factor Number of
applications acted upon by
lender
Unmodified denial rate
68
2008 HMDA Data

B. Conventional refinance, 2007–08 Percent except as noted
Borrower-related
Borrower- related plus
lender
Borrower-related
Borrower- related plus
lender
Race other than white onlyAmerican Indian or Alaska Native 59,774 57.0 53.7 42.5 36,265 65.4 56.7 43.0Asian 202,414 32.6 37.2 38.0 150,970 31.6 35.4 36.1Black or African American 737,786 53.3 53.5 43.6 343,389 61.2 59.9 44.9Native Hawiian or other Pacific Islander 38,851 46.3 48.5 43.0 19,275 51.8 52.2 43.4Two or more minority races 6,204 51.0 51.2 44.6 4,682 50.5 49.7 42.0Joint 70,982 41.4 46.5 38.5 53,200 41.8 46.0 36.8
1,147,462 49.4 49.8 40.4 532,425 41.5 42.5 37.8
White, by ethnicityHispanic white 695,537 43.4 44.0 41.6 320,845 50.6 45.3 41.3Non-Hispanic white 3,917,492 34.0 34.0 34.0 2,894,154 31.7 31.7 31.7
SexOne male 2,016,750 42.2 42.2 42.2 1,125,624 41.5 41.5 41.5One female 1,606,563 40.6 39.5 40.6 889,334 40.7 39.0 39.6Two males 48,099 41.5 41.5 41.5 32,014 38.2 38.2 38.2Two females 55,312 44.7 42.2 40.9 35,706 41.7 38.5 36.9 NOTE: See notes to table 21.A.
2007 2008
21. Denial rates on applications, unmodified and modified for borrower- and lender-related factors, for first liens on owner- occupied, one- to four-family, site-built homes, by race, ethnicity, and sex of applicant
Race, ethnicity, and sex
Number of applications
acted upon by lender
Unmodified denial rate
Modified denial rate, by modification factor Number of
applications acted upon by
lender
Unmodified denial rate
Modified denial rate, by modification factor
69
2008 HMDA Data

Borrower-related
Borrower-related plus
lender
Borrower-related
Borrower-related plus
lender
Race other than white only
American Indian or Alaska Native 10,154 19.7 20.6 18.6 5,229 49.7 49.6 43.6Asian 26,711 21.3 19.2 18.6 11,836 51.5 49.0 45.1Black or African American 161,187 25.0 24.0 22.6 155,665 45.0 47.2 46.1Native Hawaiian or other Pacific Islander 6,581 21.7 18.9 18.3 3,643 49.7 47.7 47.2Two or more minority races
1,141 23.8 23.3 17.3 873 58.2 59.7 53.1Joint 25,123 14.7 16.2 16.3 14,154 38.7 44.1 42.2Missing 121,400 21.9 20.8 19.8 165,776 54.6 47.7 43.9
White, by ethnicityHispanic white 152,228 24.0 19.8 20.0 73,118 47.6 44.1 44.3Non-Hispanic white 890,659 14.1 14.1 14.1 662,593 37.5 37.5 37.5
SexOne male 433,829 19.0 19.0 19.0 300,070 42.8 42.8 42.8One female 283,404 19.2 17.7 17.8 219,503 44.0 41.2 41.3Two males 29,772 20.9 20.9 20.9 11,826 41.8 41.8 41.8Two females 23,519 20.5 18.7 18.5 13,808 41.2 40.3 40.3 NOTE: See notes to table 21.A.
Unmodified denial rate
Modified denial rate, by modification factor
Home purchase Refinance
21. Denial rates on applications, unmodified and modified for borrower- and lender-related factors, for first liens on owner-occupied, one- to four-family, site-built homes, by race, ethnicity, and sex of applicant C. Nonconventional home purchase and refinance, 2008 Percent except as noted
Race, ethnicity, and sex
Number of applications
acted upon by lender
Unmodified denial rate
Modified denial rate, by modification factor Number of
applications acted upon by
lender
70
2008 HMDA Data

71

72

73
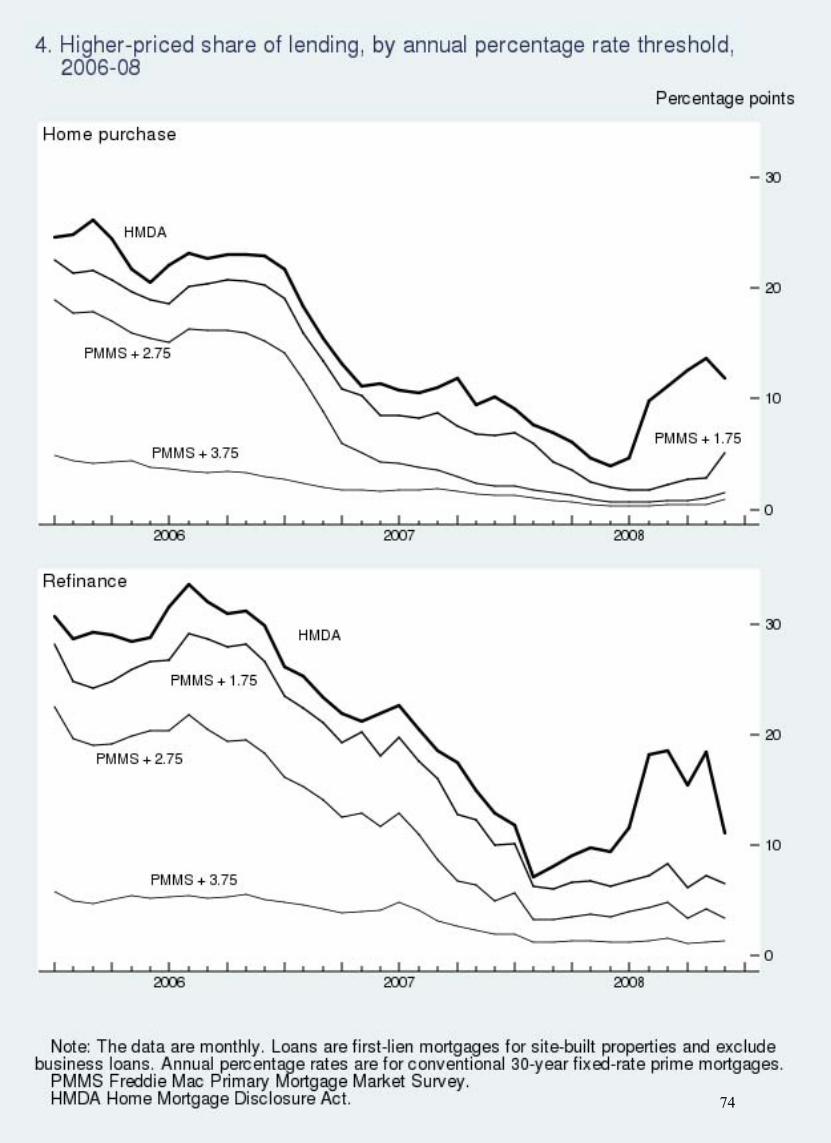
74

75

76

TotalHigher priced3
OTS 0000008551 Washington Mutual - Wholesale and Agency A 643,765 233,566 49,499OTS 0000003970 IndyMac Bancorp 337,026 117,708 39,608HUD 1534900004 First NLC Financial Services 149,564 11,340 0HUD 7289300004 Realty Mortgage Corp. 15,835 5,701 597FDIC 0000026870 Franklin Bank, SSB 6,048 1,842 461HUD 0955809996 Sunshine & Madison Mortgage Corp 4,818 2,127 46HUD 7624400009 Homebridge Mortgage Bankers - Refinance.com 4,171 1,555 234HUD 1368600004 Residential Loan Centers of America 4,017 1,106 166HUD 7862800001 Pacific Community Mortgage, Inc. - Gold Reverse, Inc. 3,067 291 29HUD 65-0396839 Liberty Home Lending 2,473 652 181HUD 52-2288421 USA Home Loans - Wholesale 2,427 147 0HUD 06-1497302 Fairfield Financial Mortgage Group 2,296 550 133HUD 52-1815063 Fidelity Home Mortgage Corp. 1,819 78 0HUD 84-1569877 Vanguard Mortgage & Title, Inc. 1,397 883 1HUD 7823600001 1st Republic Mortgage Bankers 1,247 443 55
TOTAL LOAN COUNTS 1,179,970 377,989 91,0101. Conventional first-lien mortgages for site-built properties; excludes business and home improvement loans.2. Loan/application register count is total applications and loans reported by the institution.3. For definition of higher-priced lending, see text.HMDA Home Mortgage Disclosure Act of 1975.HUD U.S. Department of Housing and Urban Development.OTS Office of Thrift Supervision.FDIC Federal Deposit Insurance Corporation.
A.1 Identifying information and loan counts for lenders that reported data for 2007 under HMDA but that subsequently ceased operations and did not report 2008 HMDA data
2007
Loans1Regulatory Agency
Identification number of
HMDA reporterHMDA reporter
Loan/ application
register count2
77 (LAST PAGE)