Embed Size (px)
Citation preview
1
Report of Survey of Neuroscience Graduate, Postdoctoral, & Undergraduate Programs (Academic Year 2010-2011) Alan F. Sved, PhD, University of Pittsburgh
INTRODUCTION In the mid-1980s the Association of Neuroscience Departments and Programs (ANDP) initiated a survey of neuroscience programs to help monitor the development of programs. Goals of this survey included providing data to allow programs, and the field in general, to better understand the development of the discipline, allow them to benchmark relative to other developing programs, and to empower the departments to more fully represent themselves to colleagues, deans, students, and to the federal agencies that support predoctoral and postdoctoral training programs. This survey was conducted periodically by the ANDP, and following the consolidation of the ANDP and the Society for Neuroscience (SfN) in 2009, the survey was taken over by SfN’s Committee on Neuroscience Departments and Programs (CNDP). This current survey is based on data collected during 2011-2012 from surveys sent to all of the Institutional Program (IP) members of SfN and is based on reported data from the 2010-2011 academic year. As in the past, data have been considered in the context of previous surveys. (Details of the previous surveys, as well as additional historical perspective on the survey, can be found here and the survey questionnaire is available here.) For this survey, responses were obtained from 97 of 125 graduate training programs that were, at the time, SfN IP members, which represents a 78% rate of participation. Similarly, responses were obtained from 50 of the 53 undergraduate programs that were IP members (94%). As with the previous surveys, an important value of these responses is in the numbers they provide in comparison to the results of earlier surveys. In this regard, 82% of the graduate programs that participated in the current survey also participated in the 2009 survey; for undergraduate programs, there were almost twice as many schools that responded to the current survey, but nearly all that responded to previous survey responded to the current survey as well. A complete list of the graduate programs and undergraduate programs that participated in the current survey can be found in the attached appendix. A broad cross-section of graduate neuroscience departments and programs is represented. Similarly, undergraduate programs that provided data are diverse in size, institutional affiliation, and administrative structure, and are located throughout the U.S. (A few programs from Canada also responded to the survey, and their data are included except for the questions regarding U.S. citizenship and racial and ethnic minority groups.) The results have been organized for presentation in seven main categories, as in previous years. The first six report sections summarize the results regarding graduate and postdoctoral training. Whenever possible, the results of the current survey were compared with the previous surveys conducted in 1986, 1991, 1998, 2000/2001, 2003, 2005, 2007, and 2009. The seventh category summarizes the responses regarding undergraduate training.
1. Graduate Program Characteristics 5. Diversity 2. Graduate Program Faculty 6. Financial Support for Trainees 3. Graduate Education 7. Undergraduate Education 4. Postdoctoral Training
The report also includes a summary of the major findings of the current survey and the conclusions drawn.

2
1. Graduate Program Characteristics The information presented below is based on the information provided by 97 of the 125 graduate programs in the U.S. and Canada that were IP members of SfN at the time of the survey. In considering comparisons with previous surveys, 82% of these programs were included in the 114 that responded to the 2009 survey, which also had a high degree of overlap with the 2007 survey. 1a - School Affiliation
The locus of graduate education in neuroscience evolved considerably in the past two decades but has appeared to stabilize. In the 1991 survey, graduate programs located in schools of medicine were most numerous, representing nearly 40% of all programs. In contrast, less than 20% of the programs involved multiple schools at the university. Over the years, the percentage of the programs located solely in a school of medicine has declined to roughly 30%, while programs spanning more than a single school at a university has stabilized at ~50%.
1b - Administrative Structure and Degree Granted
The administrative structure of graduate programs in neuroscience is quite varied. Only 18% of current programs are administered exclusively in a department of neuroscience or neurobiology (or in departments that had those words in their name, such as “behavioral neuroscience” or “anatomy and neurobiology”). In contrast, 68% of the programs link neuroscientists in multiple departments (or in a “center,” “division,” or “institute” of neuroscience) in a unified, degree-granting program, and only 14% are in departments that do not have neuroscience or neurobiology in their names. These numbers have been quite stable over the past decade.
0
10
20
30
40
50
60
1991 1998 2000/2001 2003 2005 2007 2009 2011
Neuroscience Graduate Programs School Affliation
School of Medicine
Arts and Sciences
Multiple Schools
Other
3
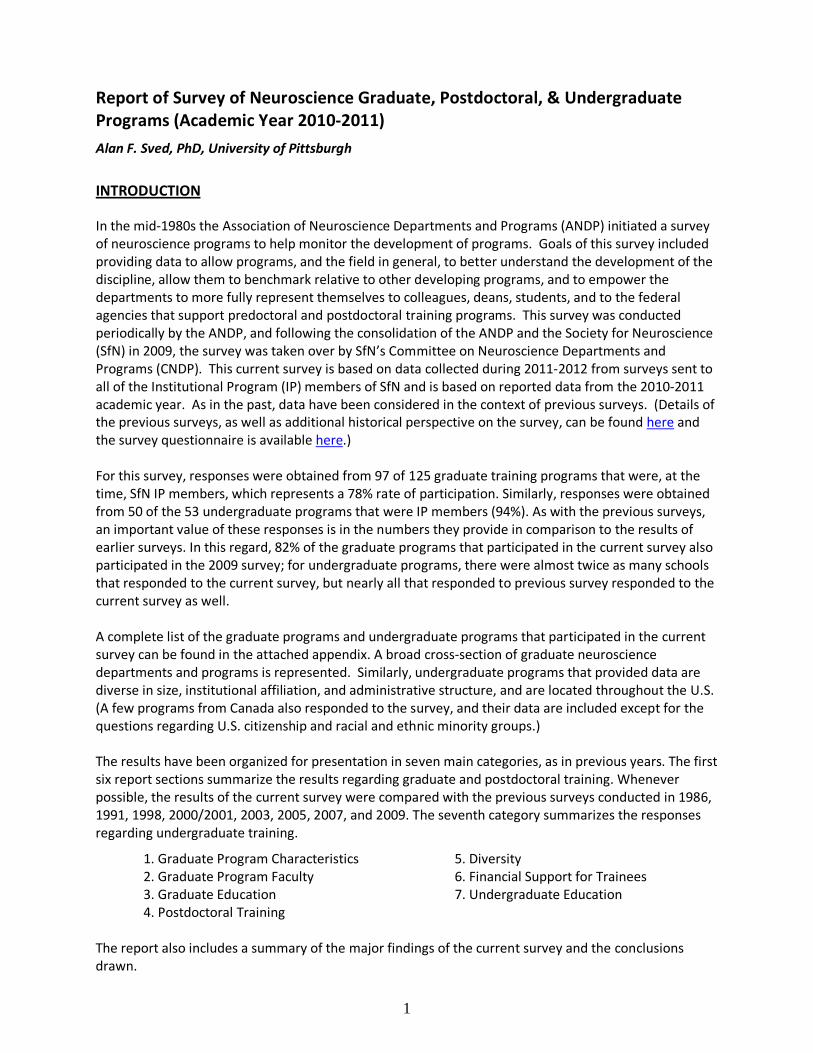
In ~80% of the programs, the degree awarded to graduate students trained in neuroscience is a PhD in neuroscience or in neurobiology (or in a discipline that had those words in their name). This situation represents a striking reversal from that which occurred 25 years ago, when the majority of such degrees were awarded in other disciplines. This change occurred during the 1990s, and for the past decade more than 2/3 of the PhDs awarded have had neuroscience or neurobiology in the title. Biomedical sciences, psychology, and pharmacology make up the majority of the ~15% of PhDs awarded to students trained in neuroscience that to not specifically state neuroscience or neurobiology in the degree. (Note that the “other” category in the table represents the few graduate training programs in neuroscience that do not offer a PhD degree.)
Only 46% of graduate training programs in neuroscience hire their own faculty; likely a reflection of the predominantly multi-departmental structure of neuroscience programs. Note that this number has changed little in recent years (44-52% over the past 5 surveys).
1c - Undergraduate Activities of Graduate Program Faculty
Although only 21% of the graduate programs additionally administer an undergraduate program in neuroscience, a number that has been rather stable over the previous few surveys, the faculty of these programs are involved in undergraduate neuroscience education. Most graduate programs have faculty members who teach undergraduate courses (68%) and virtually all provide opportunities for undergraduate students to be involved in research projects (98%).
0%
10%
20%
30%
40%
50%
60%
70%
80%
90%
100%
1986 1991 1998 2000/2001 2003 2005 2007 2009 2011
PhDs Awarded to Graduate Students in Neuroscience vs. Other Disciplines
PhD in neuroscience
PhD in another discipline
Other

4
2. Graduate Program Faculty
Eighty-eight programs responded to questions in the survey that examined the faculty make-up in AY2010-2011 and the data that follow are based on that subset of programs responding to the survey.
2a - Number of Faculty per Program
The number of faculty members per graduate program varies widely, from less than 10 to more than 90 per program, with the median number of 32 faculty members (which is similar to that in recent surveys). There was, on average, 42 faculty members per program; the comparable numbers in the 2009, 2007, and 2005 surveys were 50, 51, and 51, respectively. The distribution of faculty size across programs, which has been similar across recent surveys, shows that roughly half the programs have less than 30 faculty members, whereas almost 15% have more than 90 faculty members.
0%
10%
20%
30%
40%
50%
60%
70%
80%
90%
100%
1986 1991 1998 2000/2001 2003 2005 2007 2009 2011
Undergraduate Activities of Graduate Program Faculty
Formal Program
Teaching
Research
0123456789
101112131415
5 10 15 20 25 30 35 40 45 50 55 60 65 70 75 80 85 90 95 100
Num
ber o
f Pro
gram
s
Faculty Size
Distribution of Faculty Size
5
On average, 86% of faculty members are in the tenure stream, with an average of 5.8 faculty per program outside the tenure-stream. However, ~30% of the programs rely entirely on tenure-stream faculty. The percent of faculty in and out of the tenure stream are similar in the past several surveys. There is considerable stability in the training faculty. In AY2010-2011, ~5% of the tenure-stream faculty left their positions (average of 2 per program) while almost twice than many were newly hired (3.8 faculty per program, ranging from 0-8). A similarly low turnover was observed in the three previous surveys. The number of faculty outside the tenure stream that left programs or were added to programs was quite small (in contrast to past years where the turnover of this pool was higher than for tenure-stream faculty).
2b - Distribution of Faculty in Graduate Programs by Academic Rank
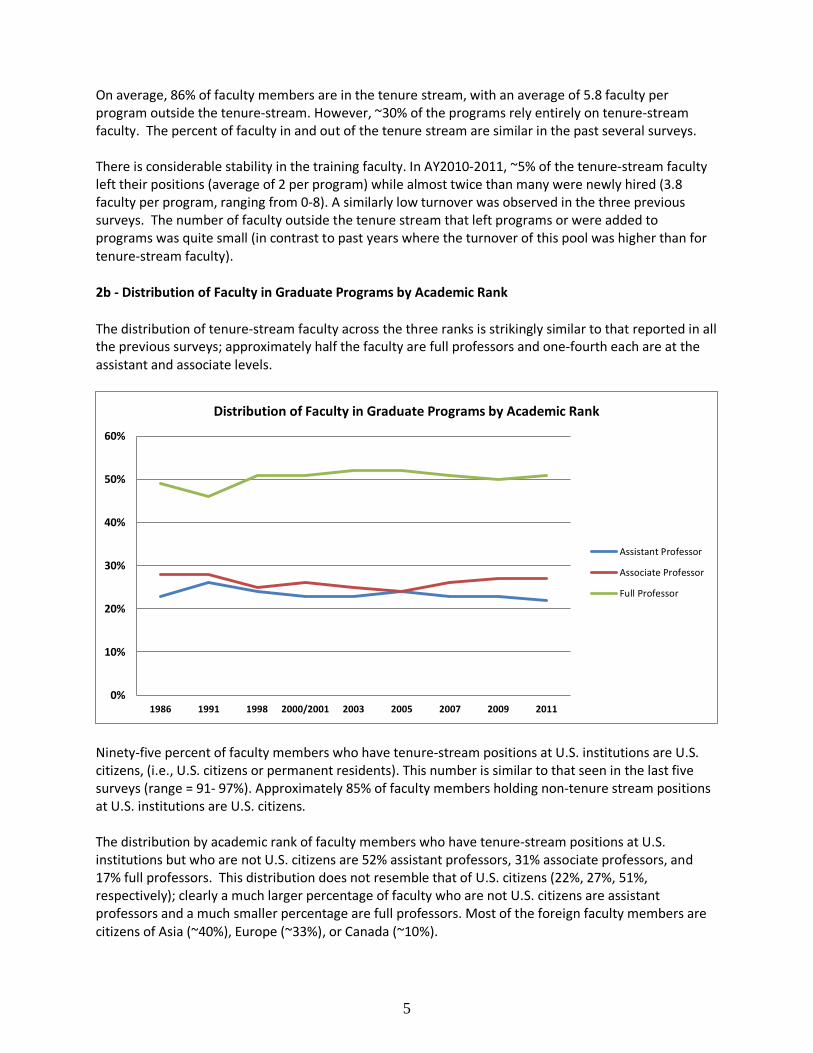
The distribution of tenure-stream faculty across the three ranks is strikingly similar to that reported in all the previous surveys; approximately half the faculty are full professors and one-fourth each are at the assistant and associate levels.
Ninety-five percent of faculty members who have tenure-stream positions at U.S. institutions are U.S. citizens, (i.e., U.S. citizens or permanent residents). This number is similar to that seen in the last five surveys (range = 91- 97%). Approximately 85% of faculty members holding non-tenure stream positions at U.S. institutions are U.S. citizens. The distribution by academic rank of faculty members who have tenure-stream positions at U.S. institutions but who are not U.S. citizens are 52% assistant professors, 31% associate professors, and 17% full professors. This distribution does not resemble that of U.S. citizens (22%, 27%, 51%, respectively); clearly a much larger percentage of faculty who are not U.S. citizens are assistant professors and a much smaller percentage are full professors. Most of the foreign faculty members are citizens of Asia (~40%), Europe (~33%), or Canada (~10%).
0%
10%
20%
30%
40%
50%
60%
1986 1991 1998 2000/2001 2003 2005 2007 2009 2011
Distribution of Faculty in Graduate Programs by Academic Rank
Assistant Professor
Associate Professor
Full Professor
6
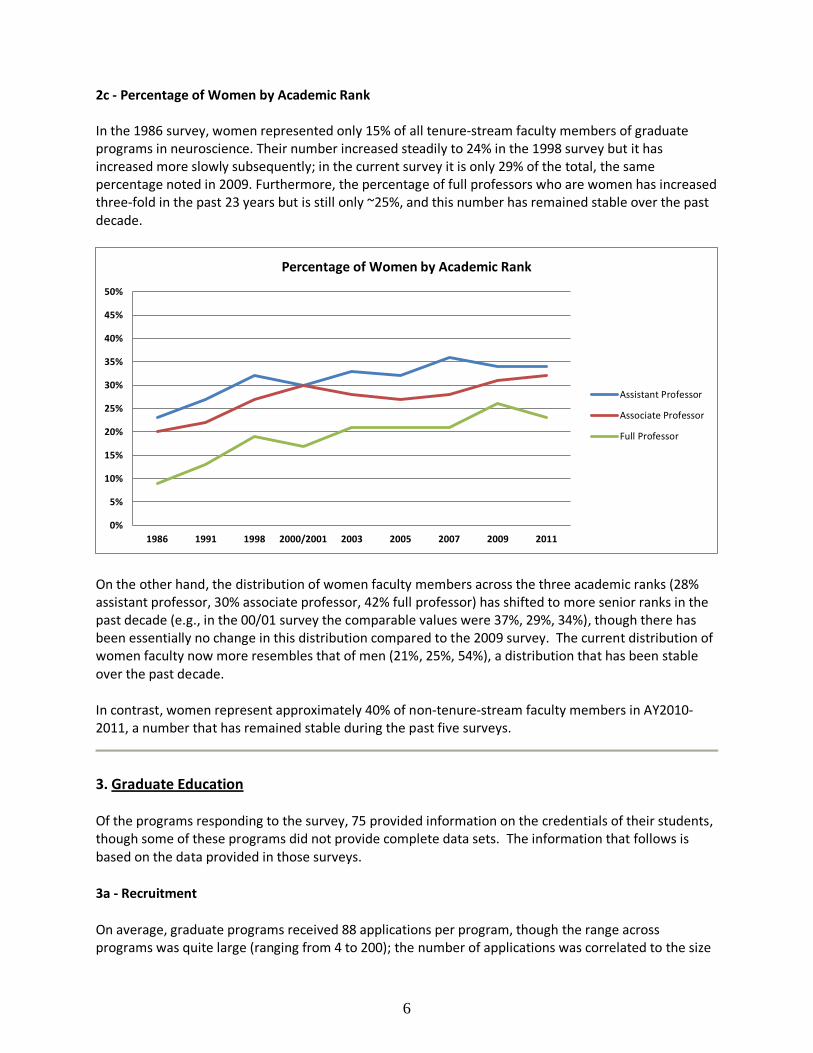
2c - Percentage of Women by Academic Rank In the 1986 survey, women represented only 15% of all tenure-stream faculty members of graduate programs in neuroscience. Their number increased steadily to 24% in the 1998 survey but it has increased more slowly subsequently; in the current survey it is only 29% of the total, the same percentage noted in 2009. Furthermore, the percentage of full professors who are women has increased three-fold in the past 23 years but is still only ~25%, and this number has remained stable over the past decade.
On the other hand, the distribution of women faculty members across the three academic ranks (28% assistant professor, 30% associate professor, 42% full professor) has shifted to more senior ranks in the past decade (e.g., in the 00/01 survey the comparable values were 37%, 29%, 34%), though there has been essentially no change in this distribution compared to the 2009 survey. The current distribution of women faculty now more resembles that of men (21%, 25%, 54%), a distribution that has been stable over the past decade.
In contrast, women represent approximately 40% of non-tenure-stream faculty members in AY2010-2011, a number that has remained stable during the past five surveys.
3. Graduate Education
Of the programs responding to the survey, 75 provided information on the credentials of their students, though some of these programs did not provide complete data sets. The information that follows is based on the data provided in those surveys.
3a - Recruitment
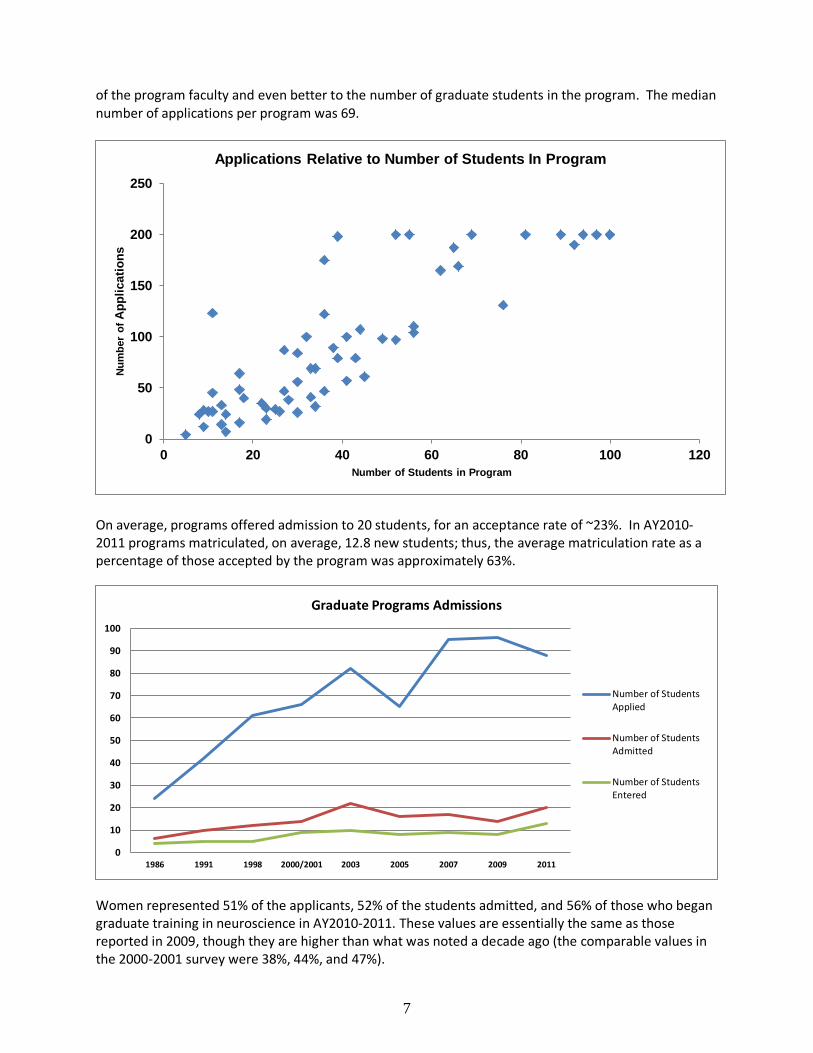
On average, graduate programs received 88 applications per program, though the range across programs was quite large (ranging from 4 to 200); the number of applications was correlated to the size
0%
5%
10%
15%
20%
25%
30%
35%
40%
45%
50%
1986 1991 1998 2000/2001 2003 2005 2007 2009 2011
Percentage of Women by Academic Rank
Assistant Professor
Associate Professor
Full Professor
7
of the program faculty and even better to the number of graduate students in the program. The median number of applications per program was 69.
On average, programs offered admission to 20 students, for an acceptance rate of ~23%. In AY2010-2011 programs matriculated, on average, 12.8 new students; thus, the average matriculation rate as a percentage of those accepted by the program was approximately 63%.
Women represented 51% of the applicants, 52% of the students admitted, and 56% of those who began graduate training in neuroscience in AY2010-2011. These values are essentially the same as those reported in 2009, though they are higher than what was noted a decade ago (the comparable values in the 2000-2001 survey were 38%, 44%, and 47%).
0
50
100
150
200
250
0 20 40 60 80 100 120
Num
ber
of A
pplic
atio
ns
Number of Students in Program
Applications Relative to Number of Students In Program
0
10
20
30
40
50
60
70
80
90
100
1986 1991 1998 2000/2001 2003 2005 2007 2009 2011
Graduate Programs Admissions
Number of StudentsApplied
Number of StudentsAdmitted
Number of StudentsEntered
8
Non-U.S. citizens represented 31% of the applicants (down from 39% in the previous survey) but only 16% of the students admitted and 12% of those who began graduate training. Students identified as members of U.S. racial and ethnic minorities represented only 12% of the applicants (compared to 10% in the 2009 survey), 17% of the students admitted (compared to 13% in the 2009 survey), and 12% of those who began graduate training (compared to 14% in the 2009 survey). Thus, although the percentage of applicants and accepted applicants identified as members of U.S. racial and ethnic minorities may be increasing, this is not translating into an increase in matriculation. Whereas the acceptance rate of these applicants is higher than that for the whole pool of applicants (30% compared to 23%), their rate of matriculation in programs is less (44% of those accepted compared to 63%). For applicants who are not U.S. citizens, the acceptance rate is lower than for the whole pool of applicants (11% compared to 23%) and the matriculation rate of those accepted is also lower (52% compared to 63%).
3b - Academic Credentials of Entering Graduate Students
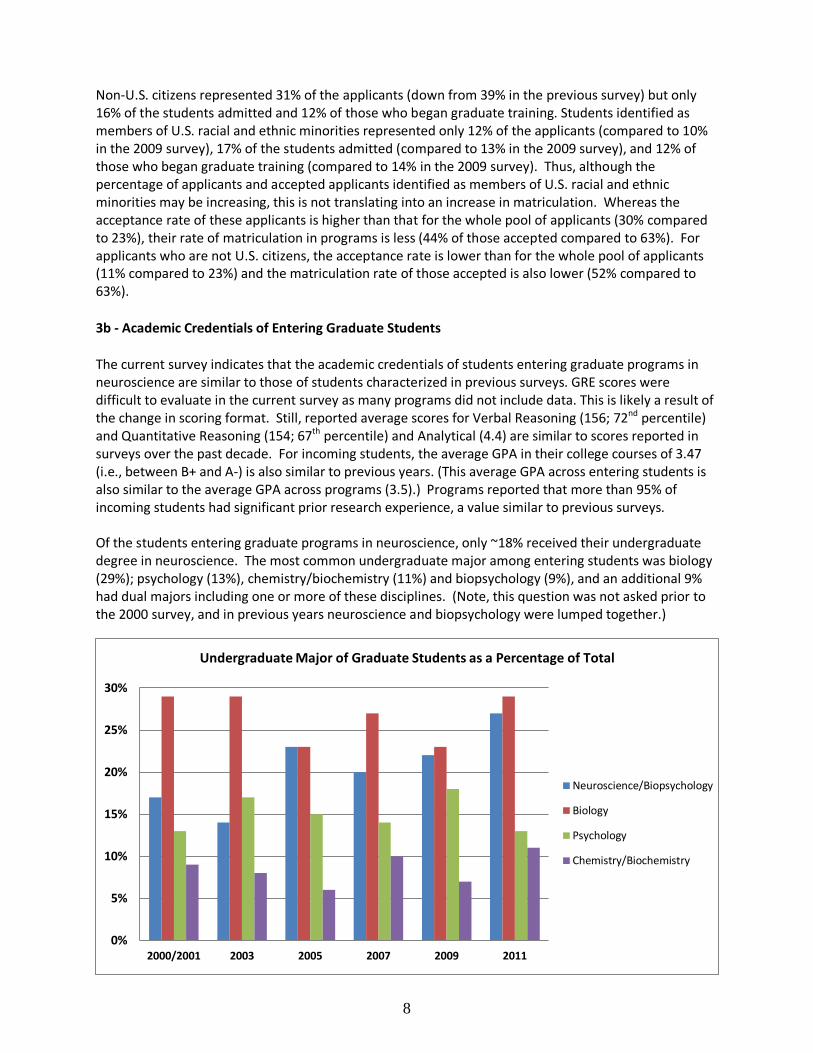
The current survey indicates that the academic credentials of students entering graduate programs in neuroscience are similar to those of students characterized in previous surveys. GRE scores were difficult to evaluate in the current survey as many programs did not include data. This is likely a result of the change in scoring format. Still, reported average scores for Verbal Reasoning (156; 72nd percentile) and Quantitative Reasoning (154; 67th percentile) and Analytical (4.4) are similar to scores reported in surveys over the past decade. For incoming students, the average GPA in their college courses of 3.47 (i.e., between B+ and A-) is also similar to previous years. (This average GPA across entering students is also similar to the average GPA across programs (3.5).) Programs reported that more than 95% of incoming students had significant prior research experience, a value similar to previous surveys. Of the students entering graduate programs in neuroscience, only ~18% received their undergraduate degree in neuroscience. The most common undergraduate major among entering students was biology (29%); psychology (13%), chemistry/biochemistry (11%) and biopsychology (9%), and an additional 9% had dual majors including one or more of these disciplines. (Note, this question was not asked prior to the 2000 survey, and in previous years neuroscience and biopsychology were lumped together.)
0%
5%
10%
15%
20%
25%
30%
2000/2001 2003 2005 2007 2009 2011
Undergraduate Major of Graduate Students as a Percentage of Total
Neuroscience/Biopsychology
Biology
Psychology
Chemistry/Biochemistry
9
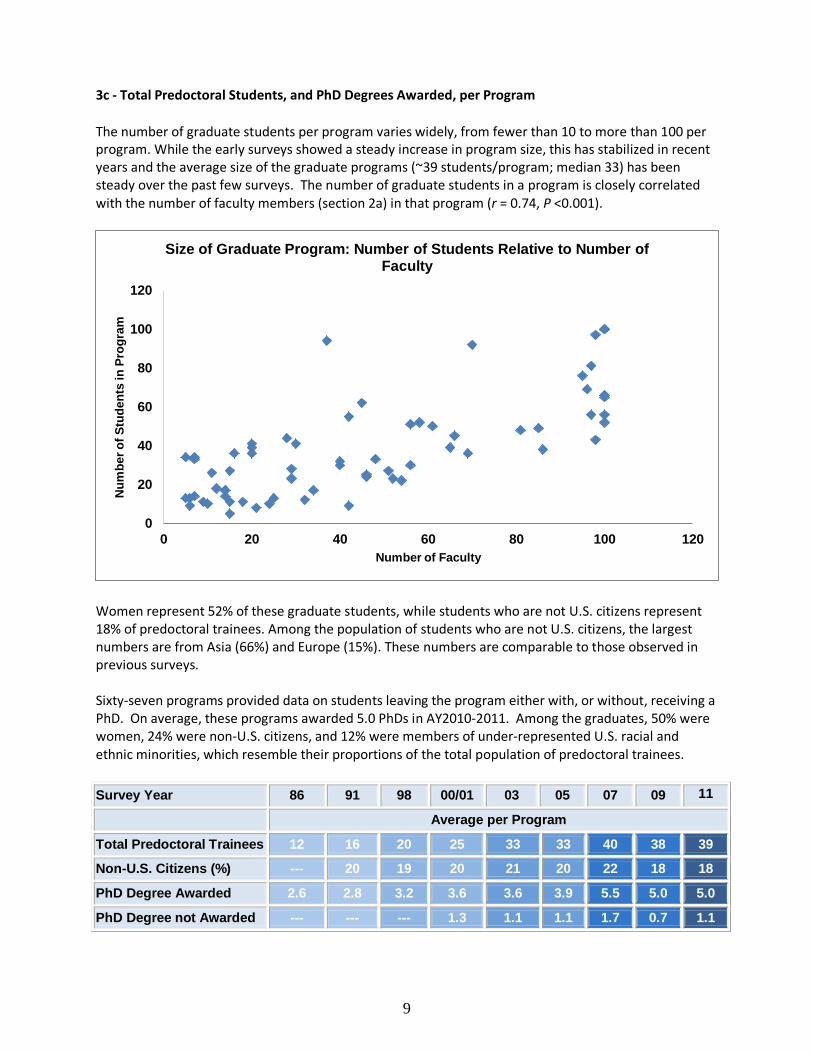
3c - Total Predoctoral Students, and PhD Degrees Awarded, per Program
The number of graduate students per program varies widely, from fewer than 10 to more than 100 per program. While the early surveys showed a steady increase in program size, this has stabilized in recent years and the average size of the graduate programs (~39 students/program; median 33) has been steady over the past few surveys. The number of graduate students in a program is closely correlated with the number of faculty members (section 2a) in that program (r = 0.74, P <0.001).
Women represent 52% of these graduate students, while students who are not U.S. citizens represent 18% of predoctoral trainees. Among the population of students who are not U.S. citizens, the largest numbers are from Asia (66%) and Europe (15%). These numbers are comparable to those observed in previous surveys. Sixty-seven programs provided data on students leaving the program either with, or without, receiving a PhD. On average, these programs awarded 5.0 PhDs in AY2010-2011. Among the graduates, 50% were women, 24% were non-U.S. citizens, and 12% were members of under-represented U.S. racial and ethnic minorities, which resemble their proportions of the total population of predoctoral trainees.
Survey Year 86 91 98 00/01 03 05 07 09 11
Average per Program
Total Predoctoral Trainees 12 16 20 25 33 33 40 38 39
Non-U.S. Citizens (%) --- 20 19 20 21 20 22 18 18
PhD Degree Awarded 2.6 2.8 3.2 3.6 3.6 3.9 5.5 5.0 5.0
PhD Degree not Awarded --- --- --- 1.3 1.1 1.1 1.7 0.7 1.1
0
20
40
60
80
100
120
0 20 40 60 80 100 120
Num
ber o
f Stu
dent
s in
Pro
gram
Number of Faculty
Size of Graduate Program: Number of Students Relative to Number of Faculty
10
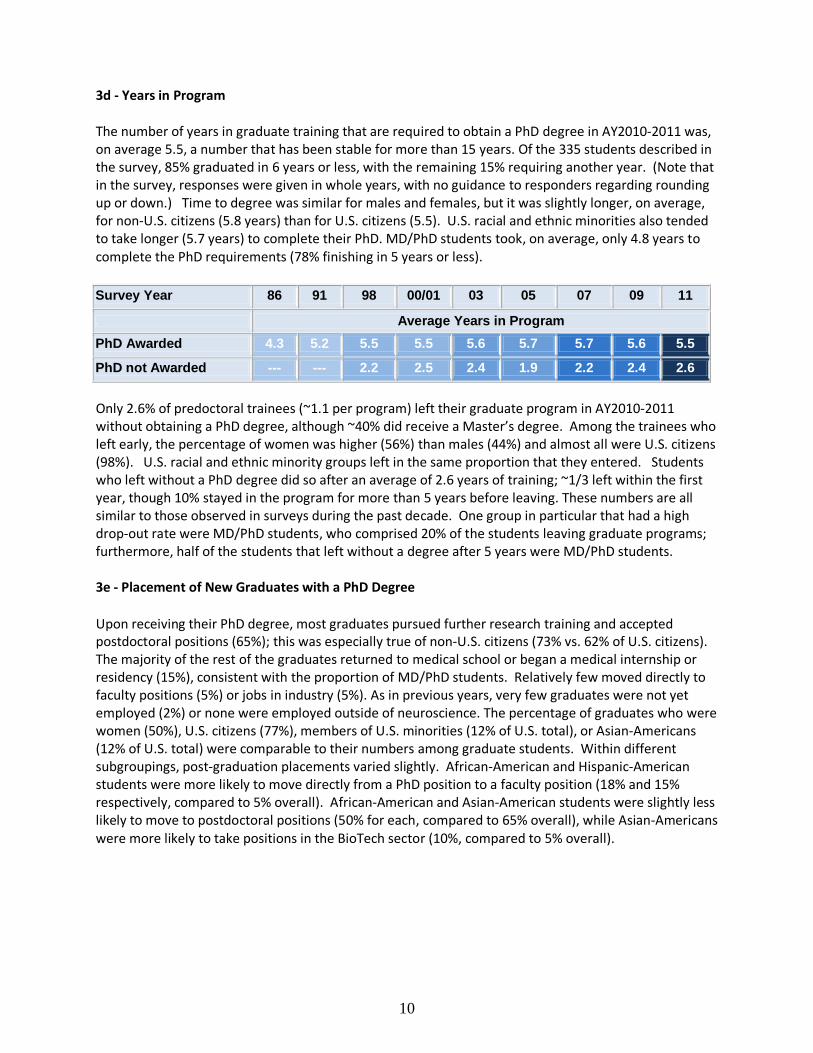
3d - Years in Program
The number of years in graduate training that are required to obtain a PhD degree in AY2010-2011 was, on average 5.5, a number that has been stable for more than 15 years. Of the 335 students described in the survey, 85% graduated in 6 years or less, with the remaining 15% requiring another year. (Note that in the survey, responses were given in whole years, with no guidance to responders regarding rounding up or down.) Time to degree was similar for males and females, but it was slightly longer, on average, for non-U.S. citizens (5.8 years) than for U.S. citizens (5.5). U.S. racial and ethnic minorities also tended to take longer (5.7 years) to complete their PhD. MD/PhD students took, on average, only 4.8 years to complete the PhD requirements (78% finishing in 5 years or less).
Survey Year 86 91 98 00/01 03 05 07 09 11
. Average Years in Program PhD Awarded 4.3 5.2 5.5 5.5 5.6 5.7 5.7 5.6 5.5
PhD not Awarded --- --- 2.2 2.5 2.4 1.9 2.2 2.4 2.6
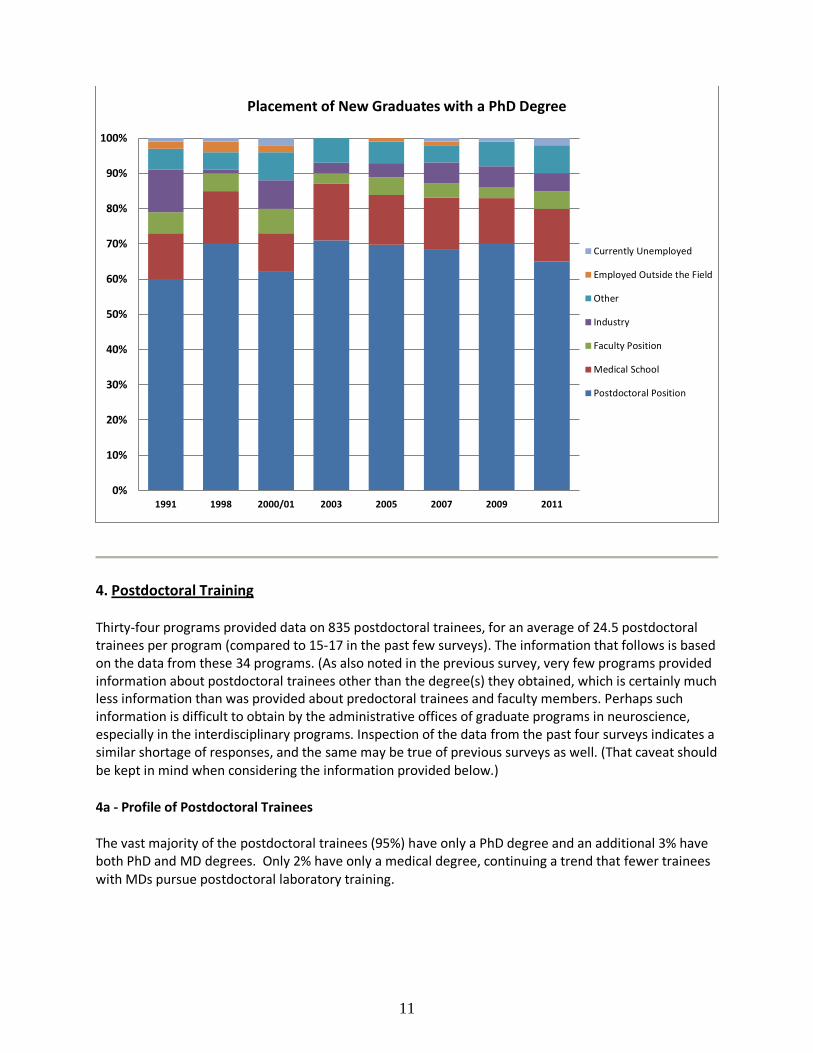
Only 2.6% of predoctoral trainees (~1.1 per program) left their graduate program in AY2010-2011 without obtaining a PhD degree, although ~40% did receive a Master’s degree. Among the trainees who left early, the percentage of women was higher (56%) than males (44%) and almost all were U.S. citizens (98%). U.S. racial and ethnic minority groups left in the same proportion that they entered. Students who left without a PhD degree did so after an average of 2.6 years of training; ~1/3 left within the first year, though 10% stayed in the program for more than 5 years before leaving. These numbers are all similar to those observed in surveys during the past decade. One group in particular that had a high drop-out rate were MD/PhD students, who comprised 20% of the students leaving graduate programs; furthermore, half of the students that left without a degree after 5 years were MD/PhD students. 3e - Placement of New Graduates with a PhD Degree
Upon receiving their PhD degree, most graduates pursued further research training and accepted postdoctoral positions (65%); this was especially true of non-U.S. citizens (73% vs. 62% of U.S. citizens). The majority of the rest of the graduates returned to medical school or began a medical internship or residency (15%), consistent with the proportion of MD/PhD students. Relatively few moved directly to faculty positions (5%) or jobs in industry (5%). As in previous years, very few graduates were not yet employed (2%) or none were employed outside of neuroscience. The percentage of graduates who were women (50%), U.S. citizens (77%), members of U.S. minorities (12% of U.S. total), or Asian-Americans (12% of U.S. total) were comparable to their numbers among graduate students. Within different subgroupings, post-graduation placements varied slightly. African-American and Hispanic-American students were more likely to move directly from a PhD position to a faculty position (18% and 15% respectively, compared to 5% overall). African-American and Asian-American students were slightly less likely to move to postdoctoral positions (50% for each, compared to 65% overall), while Asian-Americans were more likely to take positions in the BioTech sector (10%, compared to 5% overall).
11
4. Postdoctoral Training
Thirty-four programs provided data on 835 postdoctoral trainees, for an average of 24.5 postdoctoral trainees per program (compared to 15-17 in the past few surveys). The information that follows is based on the data from these 34 programs. (As also noted in the previous survey, very few programs provided information about postdoctoral trainees other than the degree(s) they obtained, which is certainly much less information than was provided about predoctoral trainees and faculty members. Perhaps such information is difficult to obtain by the administrative offices of graduate programs in neuroscience, especially in the interdisciplinary programs. Inspection of the data from the past four surveys indicates a similar shortage of responses, and the same may be true of previous surveys as well. (That caveat should be kept in mind when considering the information provided below.)
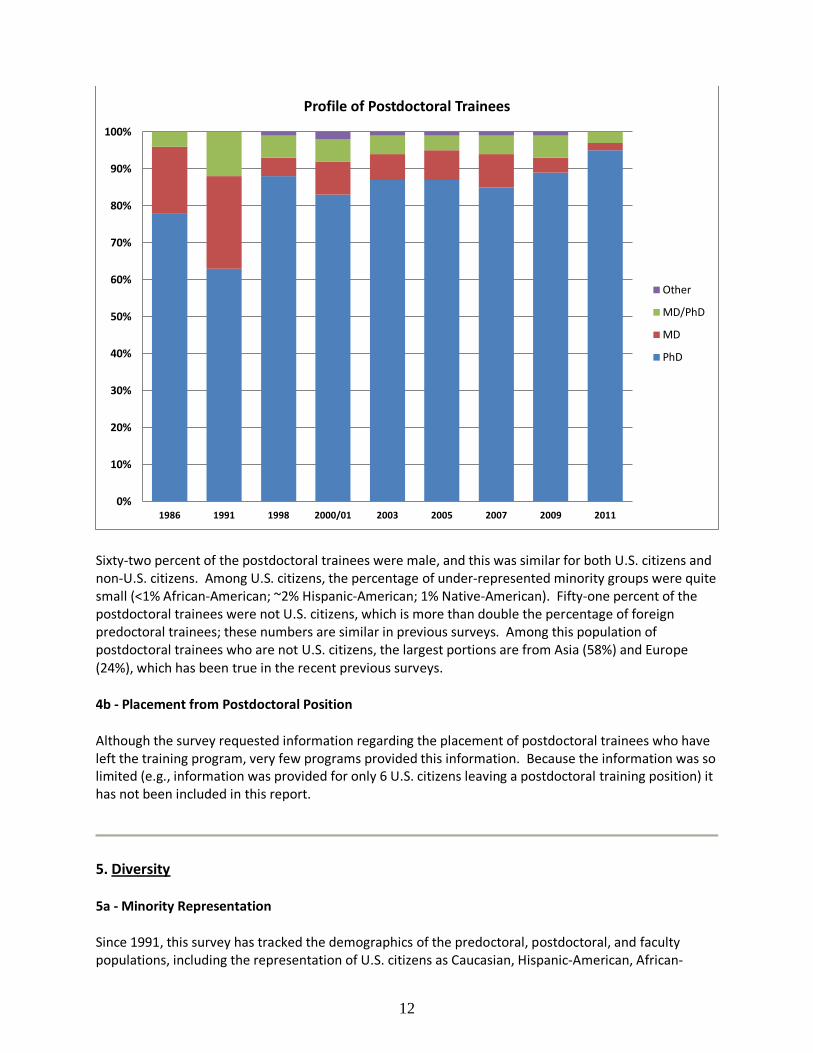
4a - Profile of Postdoctoral Trainees
The vast majority of the postdoctoral trainees (95%) have only a PhD degree and an additional 3% have both PhD and MD degrees. Only 2% have only a medical degree, continuing a trend that fewer trainees with MDs pursue postdoctoral laboratory training.
0%
10%
20%
30%
40%
50%
60%
70%
80%
90%
100%
1991 1998 2000/01 2003 2005 2007 2009 2011
Placement of New Graduates with a PhD Degree
Currently Unemployed
Employed Outside the Field
Other
Industry
Faculty Position
Medical School
Postdoctoral Position
12
Sixty-two percent of the postdoctoral trainees were male, and this was similar for both U.S. citizens and non-U.S. citizens. Among U.S. citizens, the percentage of under-represented minority groups were quite small (<1% African-American; ~2% Hispanic-American; 1% Native-American). Fifty-one percent of the postdoctoral trainees were not U.S. citizens, which is more than double the percentage of foreign predoctoral trainees; these numbers are similar in previous surveys. Among this population of postdoctoral trainees who are not U.S. citizens, the largest portions are from Asia (58%) and Europe (24%), which has been true in the recent previous surveys.
4b - Placement from Postdoctoral Position
Although the survey requested information regarding the placement of postdoctoral trainees who have left the training program, very few programs provided this information. Because the information was so limited (e.g., information was provided for only 6 U.S. citizens leaving a postdoctoral training position) it has not been included in this report.
5. Diversity
5a - Minority Representation
Since 1991, this survey has tracked the demographics of the predoctoral, postdoctoral, and faculty populations, including the representation of U.S. citizens as Caucasian, Hispanic-American, African-
0%
10%
20%
30%
40%
50%
60%
70%
80%
90%
100%
1986 1991 1998 2000/01 2003 2005 2007 2009 2011
Profile of Postdoctoral Trainees
Other
MD/PhD
MD
PhD
13
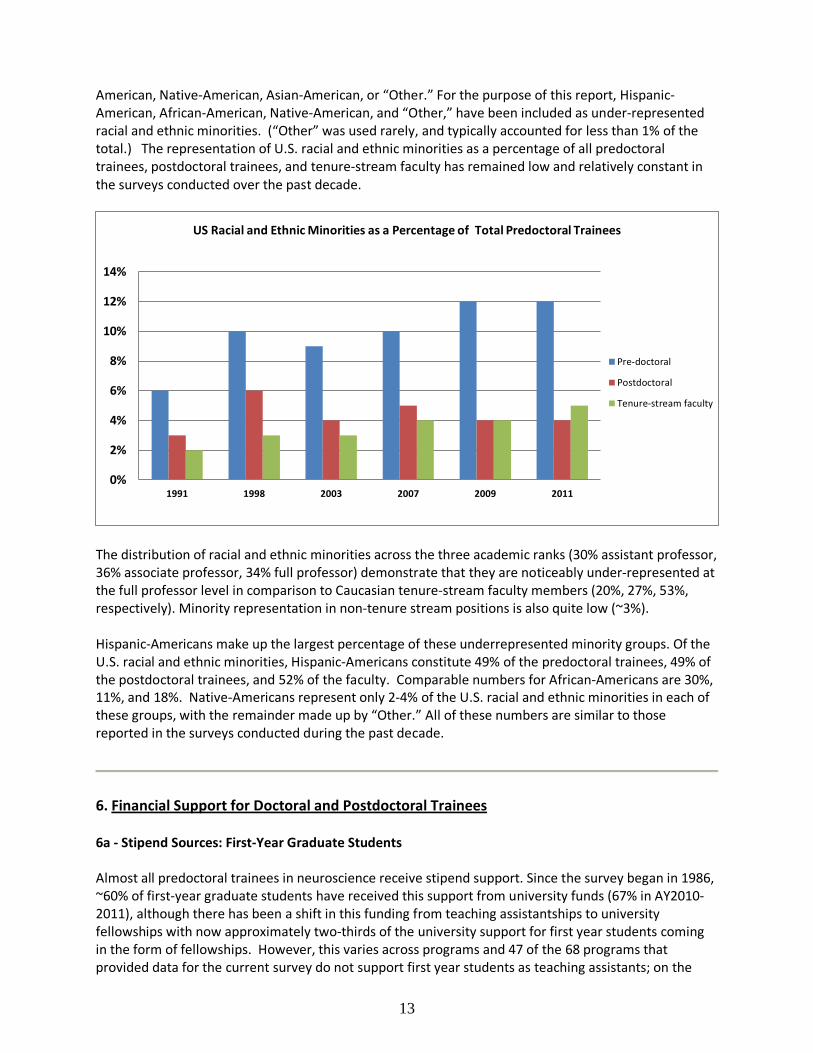
American, Native-American, Asian-American, or “Other.” For the purpose of this report, Hispanic-American, African-American, Native-American, and “Other,” have been included as under-represented racial and ethnic minorities. (“Other” was used rarely, and typically accounted for less than 1% of the total.) The representation of U.S. racial and ethnic minorities as a percentage of all predoctoral trainees, postdoctoral trainees, and tenure-stream faculty has remained low and relatively constant in the surveys conducted over the past decade.
The distribution of racial and ethnic minorities across the three academic ranks (30% assistant professor, 36% associate professor, 34% full professor) demonstrate that they are noticeably under-represented at the full professor level in comparison to Caucasian tenure-stream faculty members (20%, 27%, 53%, respectively). Minority representation in non-tenure stream positions is also quite low (~3%). Hispanic-Americans make up the largest percentage of these underrepresented minority groups. Of the U.S. racial and ethnic minorities, Hispanic-Americans constitute 49% of the predoctoral trainees, 49% of the postdoctoral trainees, and 52% of the faculty. Comparable numbers for African-Americans are 30%, 11%, and 18%. Native-Americans represent only 2-4% of the U.S. racial and ethnic minorities in each of these groups, with the remainder made up by “Other.” All of these numbers are similar to those reported in the surveys conducted during the past decade.
6. Financial Support for Doctoral and Postdoctoral Trainees
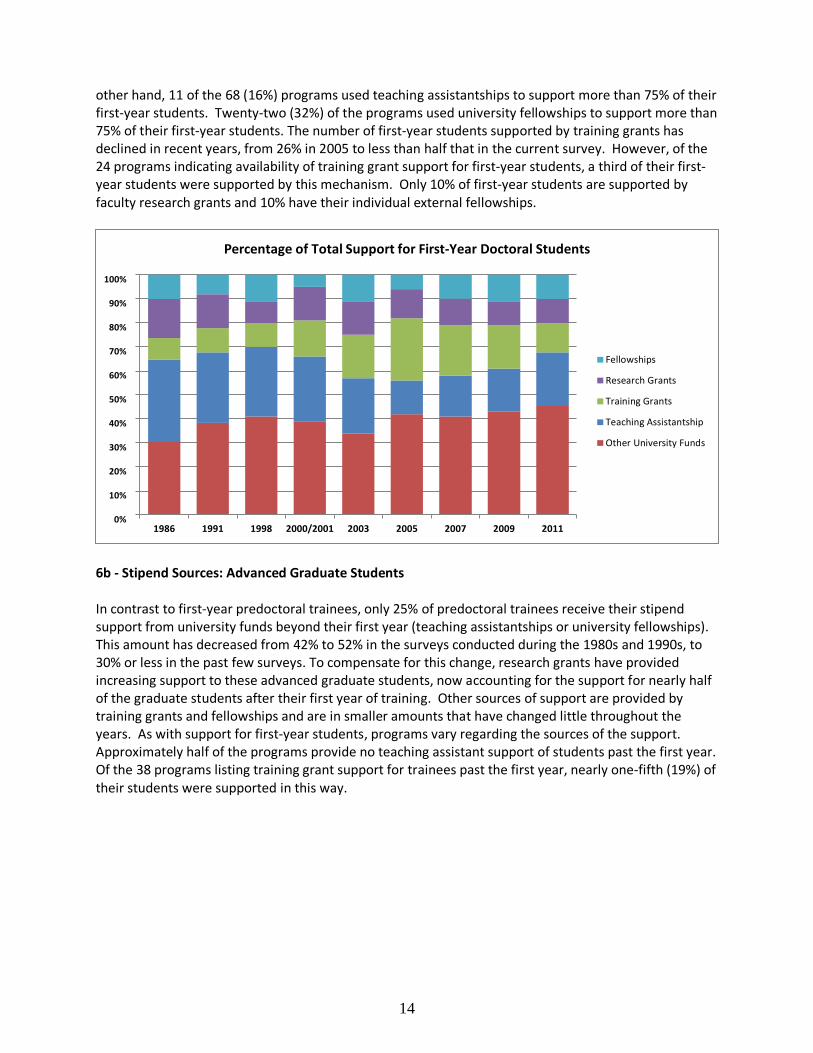
6a - Stipend Sources: First-Year Graduate Students Almost all predoctoral trainees in neuroscience receive stipend support. Since the survey began in 1986, ~60% of first-year graduate students have received this support from university funds (67% in AY2010-2011), although there has been a shift in this funding from teaching assistantships to university fellowships with now approximately two-thirds of the university support for first year students coming in the form of fellowships. However, this varies across programs and 47 of the 68 programs that provided data for the current survey do not support first year students as teaching assistants; on the
0%
2%
4%
6%
8%
10%
12%
14%
1991 1998 2003 2007 2009 2011
US Racial and Ethnic Minorities as a Percentage of Total Predoctoral Trainees
Pre-doctoral
Postdoctoral
Tenure-stream faculty
14
other hand, 11 of the 68 (16%) programs used teaching assistantships to support more than 75% of their first-year students. Twenty-two (32%) of the programs used university fellowships to support more than 75% of their first-year students. The number of first-year students supported by training grants has declined in recent years, from 26% in 2005 to less than half that in the current survey. However, of the 24 programs indicating availability of training grant support for first-year students, a third of their first-year students were supported by this mechanism. Only 10% of first-year students are supported by faculty research grants and 10% have their individual external fellowships.
6b - Stipend Sources: Advanced Graduate Students
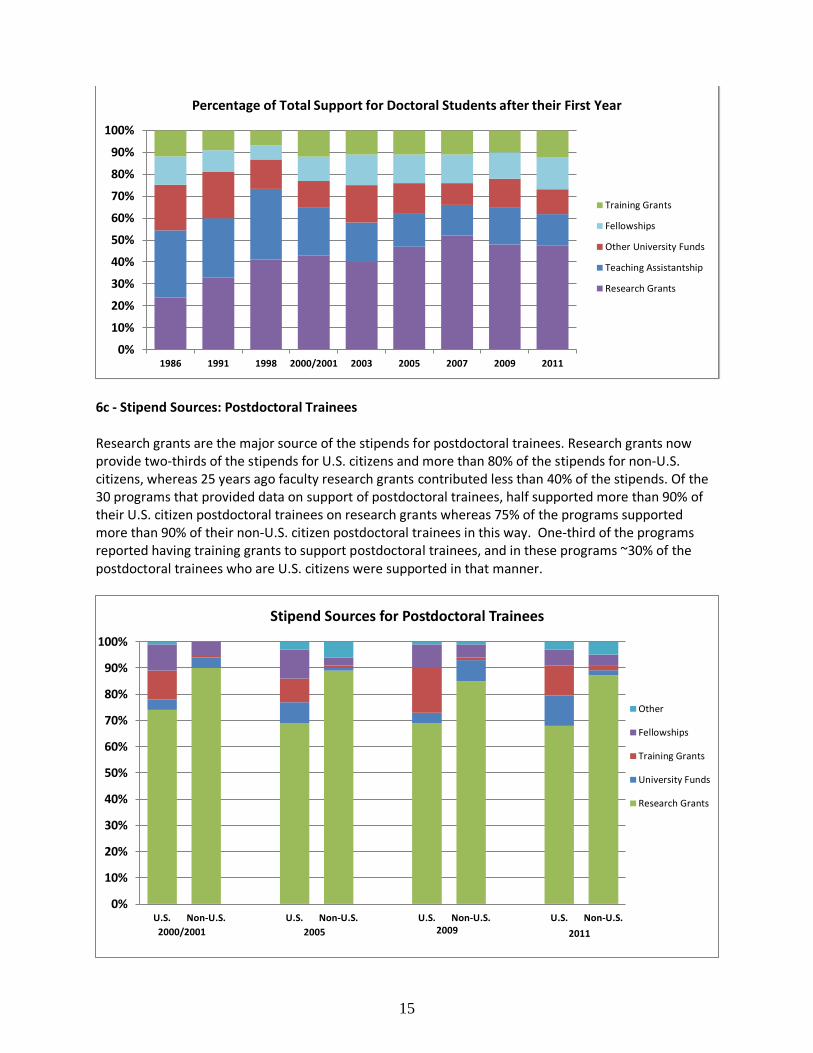
In contrast to first-year predoctoral trainees, only 25% of predoctoral trainees receive their stipend support from university funds beyond their first year (teaching assistantships or university fellowships). This amount has decreased from 42% to 52% in the surveys conducted during the 1980s and 1990s, to 30% or less in the past few surveys. To compensate for this change, research grants have provided increasing support to these advanced graduate students, now accounting for the support for nearly half of the graduate students after their first year of training. Other sources of support are provided by training grants and fellowships and are in smaller amounts that have changed little throughout the years. As with support for first-year students, programs vary regarding the sources of the support. Approximately half of the programs provide no teaching assistant support of students past the first year. Of the 38 programs listing training grant support for trainees past the first year, nearly one-fifth (19%) of their students were supported in this way.
0%
10%
20%
30%
40%
50%
60%
70%
80%
90%
100%
1986 1991 1998 2000/2001 2003 2005 2007 2009 2011
Percentage of Total Support for First-Year Doctoral Students
Fellowships
Research Grants
Training Grants
Teaching Assistantship
Other University Funds
15
6c - Stipend Sources: Postdoctoral Trainees
Research grants are the major source of the stipends for postdoctoral trainees. Research grants now provide two-thirds of the stipends for U.S. citizens and more than 80% of the stipends for non-U.S. citizens, whereas 25 years ago faculty research grants contributed less than 40% of the stipends. Of the 30 programs that provided data on support of postdoctoral trainees, half supported more than 90% of their U.S. citizen postdoctoral trainees on research grants whereas 75% of the programs supported more than 90% of their non-U.S. citizen postdoctoral trainees in this way. One-third of the programs reported having training grants to support postdoctoral trainees, and in these programs ~30% of the postdoctoral trainees who are U.S. citizens were supported in that manner.
0%
10%
20%
30%
40%
50%
60%
70%
80%
90%
100%
1986 1991 1998 2000/2001 2003 2005 2007 2009 2011
Percentage of Total Support for Doctoral Students after their First Year
Training Grants
Fellowships
Other University Funds
Teaching Assistantship
Research Grants
0%
10%
20%
30%
40%
50%
60%
70%
80%
90%
100%
U.S. Non-U.S. U.S. Non-U.S. U.S. Non-U.S. U.S. Non-U.S.
Stipend Sources for Postdoctoral Trainees
Other
Fellowships
Training Grants
University Funds
Research Grants
2000/2001 2005
2009
2011
16
7. Undergraduate Programs
Data were provided by 50 undergraduate programs, nearly twice as many as in the other recent surveys.
a. Institutional Affiliation. Of the 50 undergraduate programs that provided information, 17 were at institutions that did not have graduate programs. Of the remaining 33 programs, 17 were at institutions that had a doctoral training program in neuroscience, whereas 16 did not.
b. Administrative Structure. Thirty-five of the programs (70%) are interdisciplinary in nature and offer a BS or BA degree in neuroscience. Five programs offer a BS or BA degree in psychology or biology with a specialization in neuroscience. Only five programs (10%) are located in departments of neuroscience or behavioral neuroscience.
c. Faculty Hiring. Approximately two-thirds of the programs hire faculty into their program. (This contrasts with the situation in graduate programs, where only 46% of the programs hired faculty into their program.)
d. Faculty Appointments. The average number of faculty members with tenure-stream positions in AY2010-11 was ~10 per program (median = 8 per program). The turnover of these positions is quite low, with programs hiring, on average, less than 0.5 faculty/program and losing less than 0.1 faculty/program.
e. Faculty. In AY2010-11, the distribution of faculty members with tenure-stream positions is 23% assistant professors, 29% associate professors, and 78% full professors, which represents a shift toward the more senior ranks compared to the previous survey. Women occupy 47%, 40%, and 32% of these positions, respectively, for a total of 37% of all tenure-stream positions. These values are approximately 25% higher than those reported in the previous survey and are also higher than those provided for graduate programs. They also hold 44% of the non-tenure-stream faculty positions. Among faculty with tenure-stream positions in U.S. institutions, 93% are U.S. citizens and of those 5% are members of U.S. racial and ethnic minorities. Among faculty with non-tenure-stream positions, 90% are U.S. citizens and 5% are members of U.S. racial and ethnic minorities.
f. Undergraduate Students. There was not sufficient information collected from the survey data regarding undergraduate students therefore these data are not available in the survey this year.
SUMMARY
This periodic survey of neuroscience training programs that began in the mid-1980s initially tracked rapid and marked changes as the field as training programs developed. In contrast, the biennial surveys conducted during the past decade highlight more stability in programs and their training activities. Indeed, overall, the results of the current survey, based on data collected for AY2010-2011, are remarkably similar to the 2009 and 2007 surveys.
Graduate training programs are largely interdepartmental, and roughly half of the programs span multiple schools within a university. The administrative structure of these programs varies markedly, and less than 20% are found exclusively in a department of neuroscience or neurobiology (or some such name). Although the administrative structure of graduate programs in neuroscience is quite varied, most training now is conducted in interdisciplinary programs rather than in departments offering
17
degrees in neuroscience or in other disciplines. Graduate students trained in neuroscience are much more likely to be awarded a PhD degree in neuroscience or neurobiology than in another discipline. These programs, approximately two- thirds of which span multiple departments, range in size with some programs having approximately 100 faculty while others are in the range of 20-40. Not surprisingly, the size of the faculty correlates highly to the number of students in the program.
On average, there are ~50 faculty members per program, and the vast majority of these faculty (~90%) have tenure-stream positions. Of these, approximately half are at the rank of full professor, with the rest being divided equally between assistant professor and associate professor ranks. Women make up 34% of assistant professors, 32% of associate professors, and 23% of full professors, numbers that have remained stable over the past decade. Faculty members of under-represented ethnic and minority groups remain under-represented, with little change over the past decade. The number of applications to graduate programs, ~90 applicants/program, appears to have stabilized over the past several years. On average, ~13 students/program entered graduate training in AY2010-11, more than the 8-10 reported in surveys during the past decade. The academic credentials of the incoming students were comparably high to previous years (GPA ~3.5, GRE scores ~70th percentile) and essentially all of these students had significant laboratory experience. Only ~20% of the entering students were undergraduate neuroscience majors; the most common major was biology (~30%).
The mean number of graduate students per program, 39 in this survey, is similar to the past two surveys. Thus, although the size of programs has more than tripled since the initial survey in 1986, this now appears to have stabilized. The mean number of PhD degrees in neuroscience awarded annually per program was 5.0 in AY2010-11, while the mean time to degree was 5.6 years, numbers that have been stable over the past few surveys. Only ~2% of predoctoral trainees (1.1 per program) left training in AY2010-11 without obtaining a PhD degree, which is similar to the past few surveys. Most new graduates pursue further research training in postdoctoral positions (70%), with the majority of the rest attending medical school (13%), consistent with the proportion of MD/PhD students.
Ninety-five percent of postdoctoral trainees in neuroscience have a PhD degree. Postdoctoral trainees usually leave their position either to accept a faculty position or to pursue further training; very few are not employed at all and none who are employed outside the field.
Predoctoral students who are women, U.S. racial and ethnic minorities, or non-U.S. citizens are equally likely to obtain their PhD degree, and in generally the same time frame, as one another and as the American Caucasian male majority.
Women represent 52% of predoctoral trainees, 38% of postdoctoral trainees, and 40% of non-tenure-stream faculty members. In contrast, in faculty of the graduate training programs women represent only 29% of tenure-stream faculty members and 23% of full professors. These numbers have been similar over the past decade.
Among U.S. citizens in U.S. institutions, members of U.S. racial and ethnic minorities (African-American, Hispanic-American, Native American, “Other”) represent 12% of predoctoral trainees and 4% of postdoctoral trainees but only 5% of tenure-stream faculty members and 3% of non-tenure-stream faculty members. Predoctoral trainees who are not U.S. citizens represent 18% of predoctoral trainees, a number that has changed little during the past 20 years. They come predominantly from Asia and Europe.

18
Approximately half of postdoctoral trainees are not U.S. citizens, which has been consistent during the past decade. In contrast, ~10% of all tenure-stream graduate faculty positions in neuroscience are not U.S. citizens. Almost all predoctoral students receive stipend support, primarily from university funds (first-year students) and from research grants (more advanced students). Research grants are the major source of support for postdoctoral trainees, especially those who are not U.S. citizens. Funding sources for pre and postdoctoral trainees has been relatively constant (in terms of how they are supported) during the past decade. Undergraduate programs exist in many administrative structures and organizations. Approximately two-thirds are interdisciplinary in nature and offer a BS or BA degree in neuroscience. Only 10% of the programs are located in departments of neuroscience or behavioral neuroscience. Others offer a BS or BA degree in psychology (10%) or biology (10%) with a specialization in neuroscience.
CONCLUSIONS
• During the past decade, most aspects of the survey have been stable, suggesting that, unlike 25 years ago when the survey started, there is now stability in neuroscience training programs.
• One number that did jump out as different from past surveys is the number of undergraduate programs responding. This likely reflects both an increase in the number of undergraduate programs over all and increased involvement of undergraduate programs as IP members of SfN.
• Graduate training programs succeed in a variety of sizes and formats. Whereas most programs have fewer than 50 faculty members, some have twice that many. Similarly, there is a large range in the size of the student body. Most programs are inter-departmental and span more than one school at a university, though some programs are departmental.
• The number of students applying for, and enrolling in, graduate training in neuroscience is stable; the numbers haven’t changed much in the past decade. The credentials of entering students are quite strong, and have seemingly reached a plateau. However, they come from quite varied academic backgrounds.
• Graduate training takes, on average, 5.5 years; this has been constant for the past decade.
• Women and minorities continue to be under-represented, particularly among the faculty, and this has not changed much over the past decade.
• Nearly all doctoral students move on to postdoctoral training positions, and then onto other positions; virtually all remain employed in the field. (Still, this needs to be considered in the context of the job market and how many of these students move into their first choice of position.)
• The survey, initially developed more than 20 years ago, shows that the discipline has evolved and matured. The parameters examined in the survey have become stable during the past decade. However, these parameters are likely not the key issues that will need to be addressed by the discipline in coming years. Thus, it is likely a good time to address the future of this survey.
19
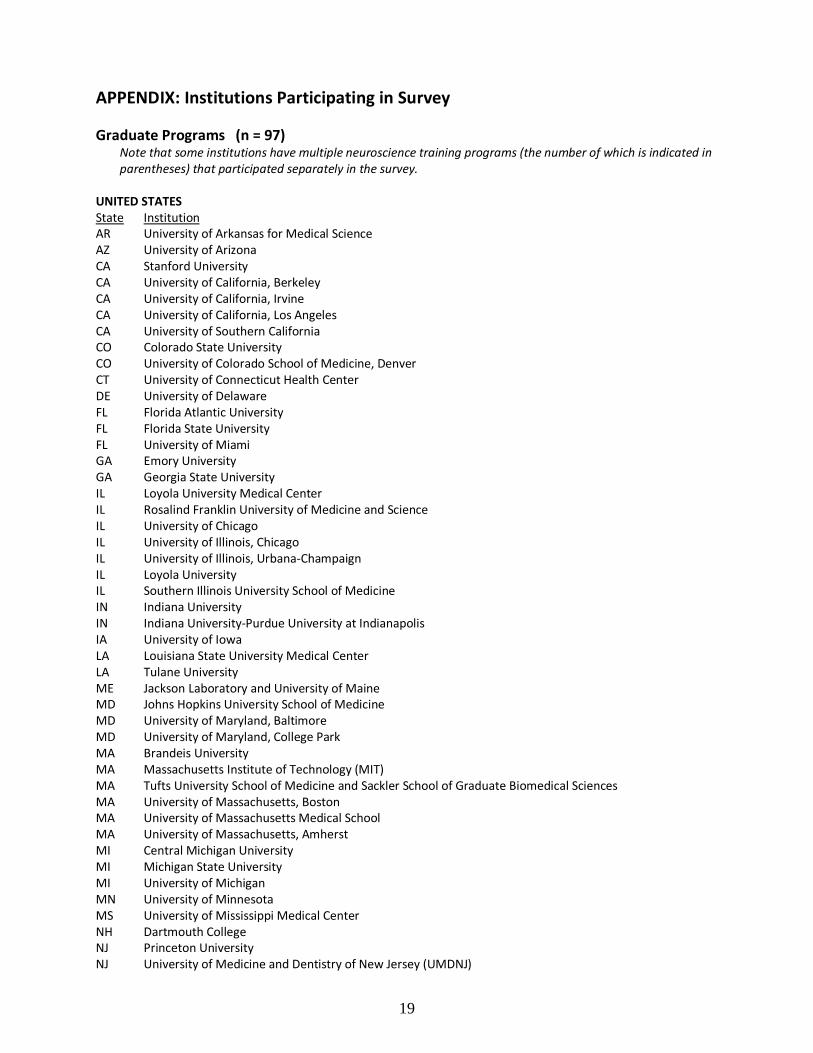
APPENDIX: Institutions Participating in Survey Graduate Programs (n = 97)
Note that some institutions have multiple neuroscience training programs (the number of which is indicated in parentheses) that participated separately in the survey.
UNITED STATES State Institution AR University of Arkansas for Medical Science AZ University of Arizona CA Stanford University CA University of California, Berkeley CA University of California, Irvine CA University of California, Los Angeles CA University of Southern California CO Colorado State University CO University of Colorado School of Medicine, Denver CT University of Connecticut Health Center DE University of Delaware FL Florida Atlantic University FL Florida State University FL University of Miami GA Emory University GA Georgia State University IL Loyola University Medical Center IL Rosalind Franklin University of Medicine and Science IL University of Chicago IL University of Illinois, Chicago IL University of Illinois, Urbana-Champaign IL Loyola University IL Southern Illinois University School of Medicine IN Indiana University IN Indiana University-Purdue University at Indianapolis IA University of Iowa LA Louisiana State University Medical Center LA Tulane University ME Jackson Laboratory and University of Maine MD Johns Hopkins University School of Medicine MD University of Maryland, Baltimore MD University of Maryland, College Park MA Brandeis University MA Massachusetts Institute of Technology (MIT) MA Tufts University School of Medicine and Sackler School of Graduate Biomedical Sciences MA University of Massachusetts, Boston MA University of Massachusetts Medical School MA University of Massachusetts, Amherst MI Central Michigan University MI Michigan State University MI University of Michigan MN University of Minnesota MS University of Mississippi Medical Center NH Dartmouth College NJ Princeton University NJ University of Medicine and Dentistry of New Jersey (UMDNJ)

20
NM University of New Mexico School of Medicine NY Albert Einstein College of Medicine NY Cornell University NY Mount Sinai School of Medicine of New York University NY New York University (2) NY State University of New York, Binghamton NY State University of New York, Buffalo NY State University of New York, Stony Brook NY University of Rochester School of Medicine and Dentistry NC Duke University Medical Center NC University of North Carolina, Chapel Hill NC Wake Forest University School of Medicine (2) OH Ohio State University (2) OH University of Toledo College of Medicine OH Wright State University OK University of Oklahoma OR Oregon Health and Science University (2) PA Drexel University College of Medicine PA Temple University School of Medicine PA Thomas Jefferson University PA University of Pittsburgh PR University of Puerto Rico RI Brown University SC University of South Carolina TN Meharry Medical College TN University of Tennessee Health Science Center TN Vanderbilt University TX Baylor College of Medicine TX Baylor University TX Texas A&M System Health Science Center/College of Medicine TX University of Texas, Austin TX University of Texas, San Antonio TX University of Texas Health Science Center, Houston TX University of Texas Health Science Center, San Antonio TX University of Texas Medical Branch, Galveston UT University of Utah VT University of Vermont VA George Mason University VA Virginia Commonwealth University WA University of Washington WA Washington State University WV West Virginia University School of Medicine WI University of Wisconsin, Madison WY University of Wyoming CANADA Prov. Institution ON Queen's University ON University of Toronto QU McGill University
21
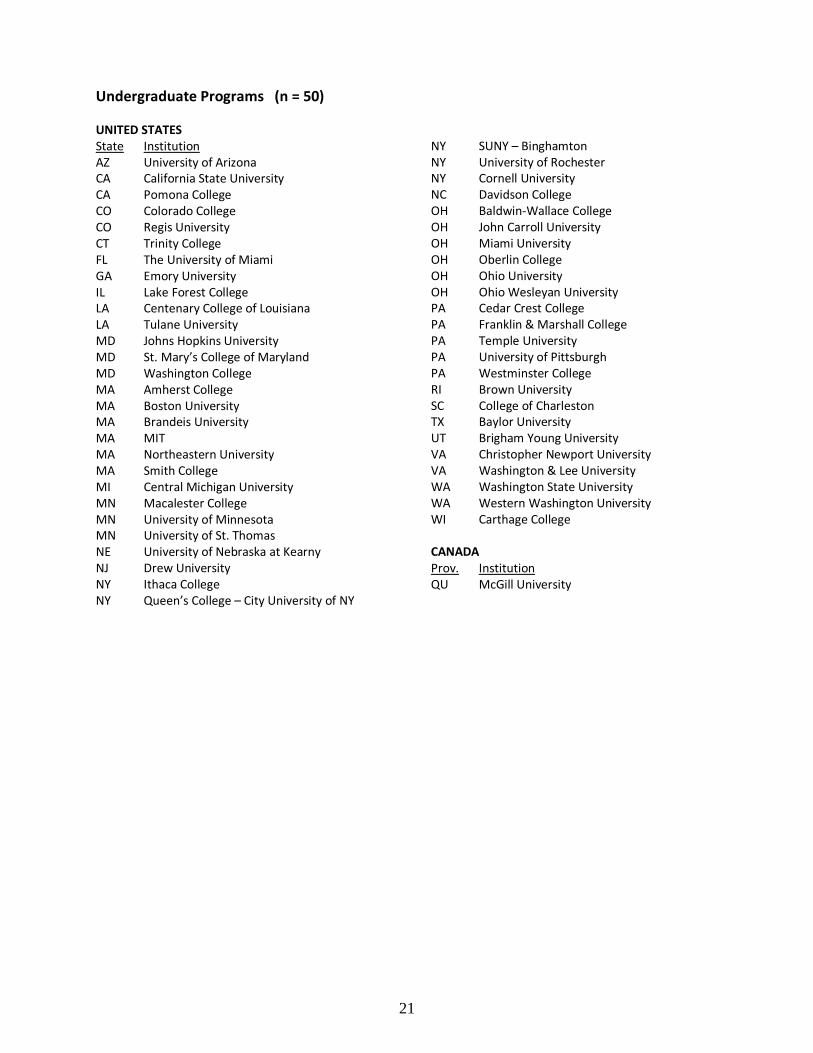
Undergraduate Programs (n = 50) UNITED STATES State Institution AZ University of Arizona CA California State University CA Pomona College CO Colorado College CO Regis University CT Trinity College FL The University of Miami GA Emory University IL Lake Forest College LA Centenary College of Louisiana LA Tulane University MD Johns Hopkins University MD St. Mary’s College of Maryland MD Washington College MA Amherst College MA Boston University MA Brandeis University MA MIT MA Northeastern University MA Smith College MI Central Michigan University MN Macalester College MN University of Minnesota MN University of St. Thomas NE University of Nebraska at Kearny NJ Drew University NY Ithaca College NY Queen’s College – City University of NY
NY SUNY – Binghamton NY University of Rochester NY Cornell University NC Davidson College OH Baldwin-Wallace College OH John Carroll University OH Miami University OH Oberlin College OH Ohio University OH Ohio Wesleyan University PA Cedar Crest College PA Franklin & Marshall College PA Temple University PA University of Pittsburgh PA Westminster College RI Brown University SC College of Charleston TX Baylor University UT Brigham Young University VA Christopher Newport University VA Washington & Lee University WA Washington State University WA Western Washington University WI Carthage College CANADA Prov. Institution QU McGill University

![Neuroscience Student Handbook 2016[1] - UT Health San …uthscsa.edu/neuroscience/docs/neurosciencestudenthandbook2016.… · graduate studies in neuroscience graduate school of biomedical](https://img.pdfslide.us/doc/110x75/5b398ced7f8b9a310e8e8028/neuroscience-student-handbook-20161-ut-health-san-graduate-studies-in-neuroscience.jpg)