Embed Size (px)
Citation preview

The 2007-2009 Financial Crisis, Global Imbalances and Capital Flows: Implications for Reform
Turalay Kenc
Central Bank of the Republic of Turkey
&
Sel Dibooglu♦ University of Missouri St Louis
October 2009 Abstract: The paper discusses the currents that led to the 2007-2009 financial crisis. We discuss the
crisis in a historical context and present evidence regarding the incidence and unit price
of risk. Our results show that the unit price of risk prior to the subprime crisis is
comparable to the price of risk prior to the great depression and similar to the price of risk
at onset of the technology bubble. We then discuss global imbalances, the associated risks
with regards to international optimal allocation of capital, and arrangements to minimize
problems of global imbalances.
Keywords: financial crisis, international capital flows. JEL: G28, F32, F42
♦ Corresponding author: University of Missouri St Louis, Department of Economics, One University Blvd., St Louis, MO 63121, Email: [email protected], Phone: 314 516 5530; Fax: 314 516 5352. Opinions expressed herein are those of the authors and should not be taken to represent the views of the Central Bank of the Republic of Turkey. We thank two anonymous referees for helpful comments without implicating them for any remaining errors.

1
The 2007-2009 Financial Crisis, Global Imbalances and Capital Flows: Implications for Reform 1. Introduction
The financial crisis that started in 2007 is the most serious setback the world
economy has experienced since the great depression. What started as a credit crunch in
July 2007 in the U.S. spread to other countries and brought the financial system to a halt.
As hundreds of billions of dollars worth mortgage related investments went sour,
investment banks totally disappeared and the U.S. Federal Reserve and other central
banks took unprecedented steps to contain the crisis. The FED steps included large cuts
in the target federal funds target rate which brought it to near zero, currency swaps with
foreign central banks, and additional lending mechanisms (term auction facility, term
securities lending facility, the primary dealer credit facility, term asset backed securities
loan facility, commercial paper lending facility, and purchase of long term US Treasury
securities, among other steps). In addition, the US Treasury launched its Troubled Asset
Relief Plan (TARP) where it committed $700 billion to purchase risky securities in order
to remove them from the banks’ balance sheets. The freefall of home values coupled with
the collapse of stock markets around the world and the associated wealth reduction made
households cutback on spending sending major economies into a deep recession.
As the crisis unfolds, the U.S and other major countries designed “fiscal stimulus”
packages that are aimed at reviving the real sector to a limited success. In contrast to
previous downturns, the current crisis impacted all major economies at once making
recovery the more difficult. There is evidence that economic crises associated with credit
crunches and busts are worse than others as they tend to be longer on average and have
much larger output losses than others. (Claessens, Kose, Terrones, 2008; Reinhart and
Rogoff, 2008a). Moreover, problems in the financial sector are having a negative effect
on international trade1 exacerbating the problems of an already constricted aggregate
demand.
The onslaught of the financial crisis of 2007-2009 and the economic downturn
that followed came after the so called “great moderation,” a term coined to describe a
large fall in the cyclical volatility of real economic activity in general, and output

2
volatility in particular starting in 19842. What is also surprising is that the crisis, at least
in its scope and magnitude, caught policymakers and all but few academic economists by
surprise3.
The principle objective of this paper is to discuss the current crisis in historical
context with a focus on the incidence of risk and the evolution of the unit price of risk in
a historical context. To that end, we estimate simple models of conditional volatility and
measure the unit price of risk using an ARCH-M model. Since one of the major
explanations of the current crisis is an increase in risk taking, we evaluate this hypothesis
by comparing the incidence and price of risk in the current crisis to other major episodes
including the great depression. To preview our results, we show that the unit price of risk
prior to the subprime crisis is comparable to the price of risk prior to the great depression
and similar to the price of risk at onset of the technology bubble. The second objective of
this paper is to discuss global imbalances as a major contributor to the current crisis and
arrangements that can be designed to minimize their negative effects. In Section 2, we
discuss the origins of the crises. Section 3 presents the evaluation of the crisis from a
historical perspective, the evolution of the incidence and unit price of risk, and other
measures such as the composite treasury-Baa spread. We then focus on global imbalances
that are at the root of the current crisis, how they manifested themselves and the
environment that amplified their effects in Section 4. Finally, we discuss problems
associated with global imbalances and arrangements to minimize these problems before
we offer some concluding remarks.
2. Origins of the Crisis
The crisis started in July 2007 with the collapse of two Bear Stearns hedge funds,
the Bear Stearns High-Grade Structured Credit Fund, and the Bear Stearns High-Grade
Structured Credit Enhanced Leveraged Fund. With this collapse, the so-called subprime
mortgage crisis became apparent with a substantial increase in mortgage delinquencies
and foreclosures in the United States. As credit markets froze, the Treasury bill-
Eurodollar spread known as the TED spread (difference between the three-month US
Treasury bill yield and LIBOR) started to increase dramatically; see Figure 1. The spread
is an indicator of perceived credit risk in the wholesale credit market as investors flee to

3
the safety of the short term US Treasury bills. The TED spread also reflects liquidity risk
as banks may prefer keeping any extra cash in Treasuries rather than lending them 3
months unsecured. It reached a record high of 463 basis points on October 10, 2008 and
fell thereafter with massive injection of liquidity into the financial system by central
banks. As of early July 2009, the spread stands at 35 basis points, which is slightly above
historical norms.
There are numerous factors that have contributed to the financial crisis. Of
particular importance are global macroeconomic imbalances, poor risk management
practices, and weak financial regulations and supervision. Perhaps due to the integration
of the world economy (financial globalization), the asymmetric distribution of investment
opportunities, and due to the desire to accumulate official exchange reserves for
precautionary purposes, the world economy has witnessed major macroeconomic
imbalances since the mid 1990s. The United States, Great Britain, Mediterranean
countries, including Portugal, Spain, Italy, Greece, Turkey, Central and East European
countries run large current account deficits on one hand and Germany and oil exporting
countries and various Asian countries including China, Japan, South Korea, Taiwan, and
Malaysia run surpluses on the other (IMF 2009). These imbalances and the accompanying
capital flows caused unusually low interest rates in the United States and European banks,
intensifying the search for higher yields and increased leverage and risk taking by relying
on complex and opaque financial instruments. In the absence of proper regulation and
supervision, the rally went on so long as the arrangement was self sustaining.
How did the global imbalances become self sustaining? The US run external
deficits and capital flows from surplus countries financed these deficits. The trade surplus
countries kept their exchange rates low relative to the dollar which helped sustain the
deficit/surplus configurations. The capital inflows kept long term US interest rates low
and made for a robust GDP growth boosting investment, consumption, and imports.
Foreign funds aided in the asset price boom. The rise in asset prices led to an increase in
consumer wealth, which further stimulated U.S. consumption spending and imports, and
thereby helped sustain the trade deficit.

4
The US economy and other major economies experienced impressive growth rates
with the advent of the information technology in the 1990s with major stock market
wealth build up. After the collapse of the so called dot com bubble, the US economy
slowed down in 2000 and entered a recession in 2001. To combat the recession, the US
FED reduced interest rates sharply in 2000-2001. Figure 2 presents US short term interest
rates (effective federal funds rate) adjusted for inflation. The figure indicates that real
short term interest rates were in the negative range in 2002-2005. Lower target interest
rates made by the FED contributed to the global flow of funds in making mortgages more
affordable and home prices rose sharply as the demand for homes exploded. With wealth
build up, there was a consumption boom and the United States and saving rate declined
sharply.
The trade surplus countries expanded their production base, exports and foreign
exchange reserves. They also experienced major increases in their saving rates that were
not matched by investment rates, a result most evident after 2002. For example, emerging
and developing economies saving investment balance went from a deficit of 0.8 percent
of GDP in 1994-2001 to a surplus of 1.2 % in 2002 rising steadily thereafter and reaching
a peak of 4.8 % of GDP in 2006 (IMF 2008, Table A16). The most dramatic rise in
external lending occurred in the Middle East with a saving investment surplus of 21 % of
GDP in 2006. The dramatic rise in the saving rates –the so called “saving glut” (Bernanke
(2005) - was not confined to the developing world or the Middle East as Germany, Japan,
China, and Commonwealth of Independent States all had external surpluses and were net
lenders to the rest of the world. The recipient of these savings was primarily the US,
even though the UK, Italy, Spain, Australia, and to some extent, France also were net
borrowers in the 2002-2007 period (Bernanke 2005, IMF 2008).
While investment rates have fallen in Japan and Europe in response to their weak
economic growth, US investment opportunities remained healthy. The US saving rate on
the other hand, fell to an all time low. The personal saving rate in the US steadily
declined after 1980 reaching an all time low of -2.7 percent in August 2005 and remained
near zero percent until April 20084. This was due to high levels of household borrowing
which kept current consumption levels high. Even though the fall in the trade weighted

5
value of the US dollar between March 2002- July 2008 could curb some of the current
account deficits and the incipient capital flows into the US, some emerging markets
(notably China, Hong Kong, Malaysia, and oil exporting Persian Gulf countries) fixed or
managed their currencies against the US dollar at exchange rates that were conducive to
substantial current account surpluses in these countries. The rise in international reserves
in the same countries financed large current account deficits in the US and to some extent
in some European countries and Australia.
The fast growth and global integration of high-saving economies created a
shortage of adequately safe assets. The result was massive financial flows into the US
which has contributed to low long term interest rates. Combined with the effects of loose
monetary policy which contributed to low short term interest rates, the latter has been
dubbed a “conundrum”. Caballero, Farhi and Gourinchas (2008) explain this conundrum
in terms of comparative advantage of the US financial intermediation. With foreign
demand for safe assets soaring, the US financial industry scrambled to find ways to
satisfy the appetite for “credit enhanced” securities. However, international capital flow
statistics show that emerging and developing economies have continued to attract private
capital inflows every year between 1997 and 2008. For example, net private capital
inflows into emerging and developing economies amounted to $73.5 billion in 2001
increasing to $617.5 billion in 2007. The current account surplus in emerging and
developing economies rose from $93.3 billion in 2001 to $741.5 billion in 2007 (IMF
2009, Table A13). The substantial current account surpluses along with private capital
inflows added to the massive accumulation of official foreign exchange reserves in these
countries. Central banks in these surplus countries mostly invested in US government and
agency securities, which raised the prices of safe assets in the US, bringing their yield to
historical lows. In this low yield environment, the financial industry made extra strides to
increase returns on investments by intensifying risk taking. Given the role of the central
banks in surplus countries in channeling the flows into the U.S., global imbalances played
a key role in the current crisis.
With low interest rates, mortgage lenders followed lax standards in approving
mortgages and optimism fueled speculation in the housing market. As a result, the

6
nonprime mortgage market consisting of near prime, subprime (loans that do not meet
prime underwriting guidelines such as full documentation, certain income, and credit
score thresholds) and Alt-A loans (alternative documentation loans that holds borrowers
with good credit to different approval standards than traditional loans) experienced
explosive growth in the 2001-2006; see Figure 3. This explosive growth was aided by
mortgage market innovations (“originate to distribute”) and specifically, the creation of
private label mortgage backed securities that do not carry any guarantees by Government
Sponsored Enterprises (GSE). The pressure to attain high returns increased the appetite
for mortgage backed securities which caused a sharp increase in the nonprime share of
the mortgage market. While fewer than 10 percent of outstanding mortgages were
nonprime in 2001, this category accounted for 34 percent of all mortgage originations
during 2006, which is the peak of the housing market (Emmons 2008). Moreover
securitization in the subprime market increased from 54 percent in 2001 to 75 percent in
2006 (Demyanyk and Van Hemert 2009). After adjusting for borrower characteristics,
loan characteristics, and macroeconomic conditions Demyanyk and Van Hemert (2009)
show that loan quality in the subprime market as measured by loan performance
deteriorated dramatically for six years prior to the crisis.
Mortgage securitization entails pooling of mortgages and issuing assets backed by
the cash flows of the mortgages. Mortgage backed securities (MBS) are created when
holders of mortgages form a pool of mortgages and sell shares in that pool. Then, cash
flows from the pool are passed through to the ultimate investor. With credit
enhancements and standardization, an MBS can be expected to be more liquid than an
individual mortgages since pooling reduces risk. Mortgage backed securities originating
in the U.S. were sold to investors around the world. Many investors assumed these
securities were backed by the full faith of the US government as GSEs, the Federal
National Mortgage Association (Fannie Mae) and Federal Home Loan Mortgage
Corporation (and Freddie Mac) were chartered by Congress (Eisenbeis, Franme and Wall
2007). This allowed Fannie Mae and Freddie Mac to be highly leveraged and borrow
massive amounts of funds against the mortgages they held as collateral. On the other
hand, high leverage was not confined to Fannie Mae and Freddie Mac as individuals and

7
financial institutions increased their debt levels to unprecedented levels. Figure 3 shows
that the debt income ratio of households exceeded 1 by 2006. Dynan and Kohn (2007)
show that the increase in household debt in the United States is partially attributable to
the effects of financial innovations which relaxed constraints on the ability of households
to borrow and reach desired consumption levels.
With widespread declines in underwriting standards, low interest rates and little
lending oversight by investors, the demand for housing soared in the US and a boom in
house construction followed. House prices increased dramatically relative to GDP as can
be seen in Figure 4. The figure shows that U.S. house prices peaked in mid 2006 and
began to fall thereafter as housing inventory exceeded demand precipitating decline in
house values. Figure 5 shows that the house price increase was too much to be justified
by the house price/rent ratio, the equivalent to the Price-earning (P/E) ratio in the
financial literature. Borrowers with adjustable rate mortgages faced problems as they
could not refinance their mortgages. In the meantime, delinquencies and foreclosures
increased particularly in the nonprime market as falling home prices left borrowers owing
more on mortgages than their properties were worth. Figure 6 shows that the greatest
increase in foreclosures occurred in the subprime adjustable rate mortgages. Slowing U.S.
personal income growth and rise in mortgage rates exacerbated the problem causing
mortgage-backed securities to decline in value and resulting in large financial losses for
U.S. and international investors holding mortgage-backed securities. These losses
sparked widespread uncertainty and loss of confidence and investors became vary of
bearing risks. Before long, mortgage backed securities became so unreliable that they
were not being bought or sold and turned into so called “toxic assets.” Because of their
complexity, the value of these assets could not be assessed: trading in these assets ceased
to exist and investors retreated to the safety of U.S. Treasury securities. This made it
difficult for lenders to assess their own exposure and that of potential borrowers to bad
debt. As Bordo (2008) emphasized, the problem compounding the pricing of these assets
is that securities based on a pool of assets are difficult to assess because the quality of
individual components of the pool varies greatly. Unless each component constituting the
pool is individually assessed, no clear-cut price of the securities can be established.

8
The “originate to distribute” lending model entailed well known principal/agent
problems as loan originators sought to maximize short term gains and did not bear the
brunt of the risks. Investors relied on ratings agencies instead of exercising due diligence.
Rating agencies used backward valuation methods, grossly underestimating risks. As
financial losses continued to increase, investor fear and uncertainty intensified during
2008. Finally the crisis reached a boiling point in September 2008 when the U.S. Federal
Housing Finance Agency (FHFA) decided to put two GSEs, Fannie Mae and Freddie
Mac, into government conservatorship. Then US Federal Reserve provided a two-year
$85 billion emergency loan to an insurer of mortgage backed securities, the American
International Group (AIG), when the investment bank Lehman Brothers filed for
bankruptcy. After the collapse of Lehman Brothers, lending among banks and other
financial firms fell sharply and the risk premium as measured by the TED spread shot up
to unprecedented levels.
Since financial institutions had difficulty borrowing from the secondary markets,
they had to sell assets to raise funds and improve their balance sheets. This led to ‘fire
sale externalities’ (Kashyap, Rajan, and Stein, 2008) with substantial discounts in bonds
and a collapse of stock markets. All the problems were compounded by excessive
leverage and financial globalization. Given the exposure of foreign financial institutions’
balance sheets to US toxic assets, particularly in advanced economies, the financial crisis
quickly spread throughout the world.
The crisis had far reaching consequences. Flight to quality increased demand for
Treasury securities at the expense of municipal bonds and corporate bonds. Institutional
investors (hedge funds & property and casualty insurance companies) deserted municipal
and corporate bonds to raise capital which raised borrowing costs for individuals,
businesses and local governments. The crisis reduced the credit rating of municipal bond
insurers because they also insured mortgage backed securities. As bond insurers suffered
losses and experienced reduced credit ratings, the bonds they insured were downgraded
raising their interest rates and hence borrowing costs. This put additional strains to an
already constrained credit market.

9
3. The Current Crisis in a Historical Perspective
To put the current crisis into proper historical perspective, we compare to
previous crises of modern times and try to gain insights into the scope, duration and
severity of the crisis. Since the crisis is ongoing, any assessment of duration, by nature, is
preliminary. Figure 7 updates Bordo (2008)’s spread between the Baa corporate bond rate
and the Ten year Treasury Composite bond rate from January 1925 through September
2009. As Bordo (2008) emphasizes, the spread represents, among other things, an
indicator of credit risk in the general economy and financial instability reflecting
asymmetric information (Mishkin 1991); as such, elevated readings in the indicator point
to an increased level of perceived risk in the market, as investors move to the safety of
US Treasury securities. Moreover, the peaks of the spread roughly correspond to the
troughs of the business cycle as the spread measures credit cycles.
Judging from the corporate bond Treasury yield spread, it is evident that the
current cycle is comparable only to those recorded in the aftermath of the great
depression. Particularly in the most recent credit cycle, the spread started to inch up
precisely at the onset of the subprime crisis in July 2007 moving from 1.65 percent in the
same month to a peak of 6.1 percent in December 2008. While it started to move down
gradually, it is still at 2.9 percent as of September 2009. In a comprehensive study of
business cycle characteristics, Claessens, Kose and Terrones (2008) find that recessions
associated with credit crunch and an equity price busts are more severe: they last longer
on average, have larger output losses, and tend to have an international dimension.
Moreover, the authors find that recessions accompanied with acute credit crunches or
house price collapse last only a quarter longer on average but entail three times greater
output losses than recessions without a financial stress. Reinhart and Rogoff (2008a) also
find that recessions associated with a stress to the financial system are overly costly in
terms of output losses. In the worst case episodes involving crises in Finland, Japan,

10
Norway, Spain and Sweden, Reinhart and Rogoff (2008a) find that the drop in annual
output growth is over 5 percent with a growth slowdown below trend that lasts more than
three years.
Another recent study that links financial market troubles to severe economic
conditions is Barro and Ursua (2009). Using long-term data for 25 countries up to 2006,
Barro and Ursua (2006) show that stock market crashes (multi-year real returns of -25
percent or less) figure prominently in depressions (multi-year macroeconomic declines of
10 percent or more). Following a stock-market crash, the probability of a minor
depression (macroeconomic decline of at least 10 percent) is 30 percent and of a major
depression (at least 25 percent) is 11 percent.
3.1. Trade-offs between growth rates prior the crisis and the depth of the crisis
An interesting question is whether there has been a tradeoff between growth rates
in advanced economies prior the crisis and the depth of the crisis. Table 1 gives the
growth rates of advanced economies between 1996-2008 and the International Monetary
Fund’s projected growth rates for 2009 and 2010. It is evident that many advanced
economies recorded notable growth rates prior to the crisis: particularly in the 5 years
prior to the crisis (2002-2006), the average growth rate has been about 3 percent per year.
The countries that recorded above average growth are the US, Spain, Finland, Greece,
Ireland, Luxembourg, Canada, Korea, Australia, Taiwan, Hong Kong, Israel, Singapore,
New Zealand, Cyprus, and Iceland. The slow growth countries were Germany, France,
Italy, Netherlands, Belgium, Austria, Portugal, Japan, UK, Sweden, Switzerland,
Denmark, and Norway. Did the countries with the most dynamic financial sectors
experience robust growth prior to the crisis and is there a correlation between growth
prior to the crisis and the depth of the crisis? In order to address whether there has been a
tradeoff between growth rates in advanced economies prior the crisis and the depth of the
crisis, we regress cross country average growth rates during the crisis on average growth
rates in the 5 year period prior to the crisis in advanced economies:
Gy08-10 = -0.56 – 0.166 Gy02-06 + error; R2 = 2.85 %, (0.59) (0.187)
11
where Gy08-10 is the average growth rate in advanced economies in 2008-2010 based on
IMF’s projections for 2009 and 2010; Gy02-06 is the average growth in the 2002-2006
period and the standard error is in parenthesis. While preliminary, these results show that
there is a weak relationship between growth prior to the crisis and the depth of the crisis
as indicated by the negative coefficient on the average growth prior to the crisis.
However, the relationship is weak at best and is not statistically significant.
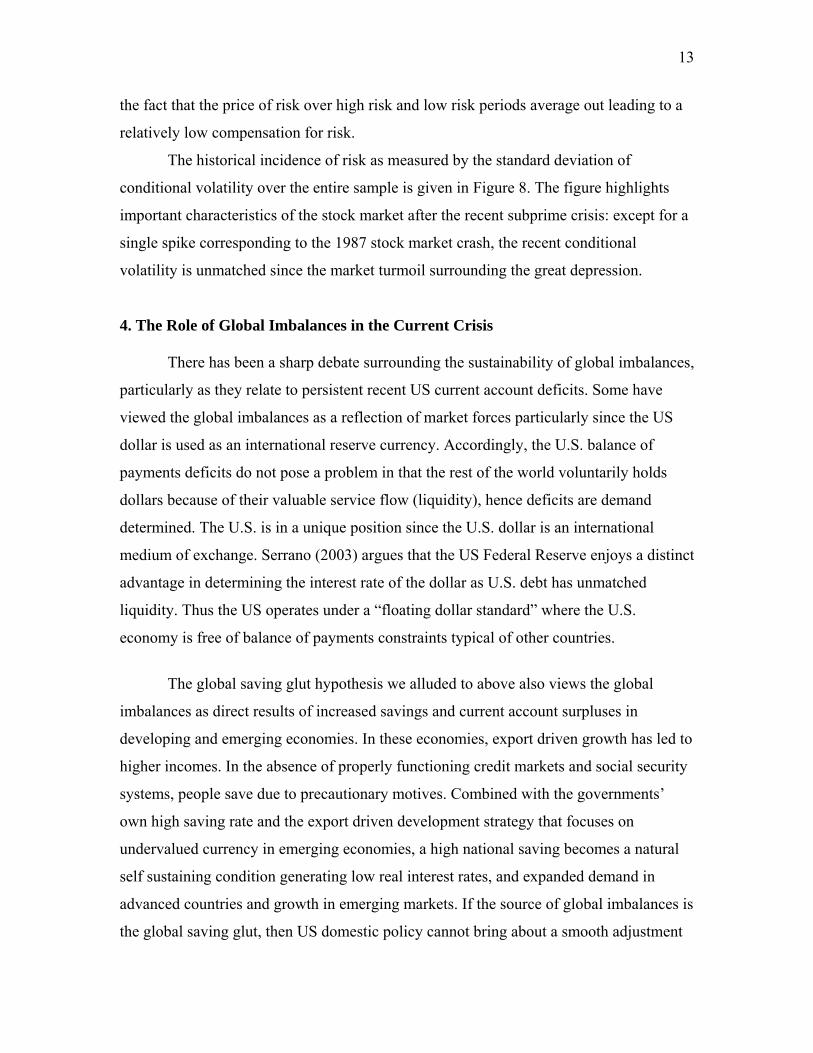
3.2. The Incidence of Risk and the Evolution of the Unit Price of Risk
What makes the current crisis unique is the increase in stock market volatility
unmatched since the great depression. In order to document the conditional volatility as a
measure of the incidence of risk, we consider long term daily data on the Dow Jones
Industrial Average from January 4, 1915 through April 28, 20095. Following usual
identification procedures, we find that a Lagrange Multiplier test confirm the presence of
ARCH errors. Based on the autocorrelation function of the stock market return series and
the squared residuals, the best candidate for a univariate model of the daily6 percentage
change in stock returns is an MA(1) process, with ARCH(1) errors:
rt = b0 + b1 εt-1 + εt (mean equation) (1)
and
ht = a0 + a1(εt-i ) 2 (conditional variance) (2)
where εt = hv tt and E(vt) = 0 and Var(vt) = 1; rt = ln(DJt - DJt-1) and DJ is the daily
closing value of the Dow Jones Industrial Average. As an alternative, we consider an
ARCH-M specification of Engle, Lilien, and Robins (1987) such that the mean return
equation is modified as follows:
rt = b0 + b1 εt-1 + δ.ht + εt (1’)
This specification allows the mean return process to depend on its conditional variance
where the coefficient δ has the interpretation of being the unit price of risk. A higher
conditional variance of returns can be expected to increase the compensation necessary to

12
induce investors to hold a risky asset, such as common stock. We estimate the two
models in (1) –(2) and (1’)-(2) over the entire sample. To evaluate the goodness of fit, we
compute modified versions of Akaike Information criterion (AIC) and Schwarz Bayesian
Criterion (SBC) as AIC = -ln L + 2n and SBC = -ln L + n ln(T) where n is the total
number of parameters in each model and T is the number of observations. Both AIC and
SBC pick the ARCH-M model in (1’) – (2) over the conventional ARCH model in (1)-
(2). Table 2 presents parameters of the model estimated over the full sample and over the
onset of major recessions. We define the onset of a major recession from the trough of an
NBER business cycle to the peak of the following cycle. When two or more cycles follow
each other within less than six years, we extend the sample to include the previous
business cycle(s). Accordingly, we focus on the onset of the following major episodes of
the business cycle in the U.S.: the onset of the Great Depression, 07.01.1921-08.01.1929;
the oil crises of the 1970s, 11.01.1970-01.01.1980; onset of the technology bubble,
03.01.1991-03.01.2001; and onset of the subprime crisis, 11.01.2001-12.01.2007. This
allows for the evaluation of the changes in the compensation for risk prior to major crises.
Table 1 indicates that with few exceptions the coefficients of the mean equation
are statistically significant and are of the expected sign. Particularly the estimates of the
unit price of risk, δ, as a measure of the compensation for risk are positive and
significant except for the oil crises of the 1970s. Specifically, investors demand a higher
compensation for risk taking and the higher the risk, the greater the compensation. Note
that in comparison to the onset of the great depression and the technology bubble of the
1990s, there is no major difference in the unit price of risk in the onset to the recent
subprime crisis. The point estimate for unit price of risk prior to the subprime crisis is
27.01, which is comparable to the price of risk prior to the great depression (25.83), and
the price at the onset of the technology bubble (24.14). The evidence regarding this
measure of risk taking does not implicate the decrease in the compensation for risk as a
major culprit in the onset of the subprime crisis. Of course, this is just a measure of risk
in the stock market and does not account for default risks, illiquidity risks, interest rate
risks, hidden tail risks, or rare event risks; alternative measures may very well indicate a
role for the decline in the compensation for risk in the run up to the recent subprime
crisis. Finally, the unit price of risk over the full sample period is only 1.45, pointing to
13
the fact that the price of risk over high risk and low risk periods average out leading to a
relatively low compensation for risk.
The historical incidence of risk as measured by the standard deviation of
conditional volatility over the entire sample is given in Figure 8. The figure highlights
important characteristics of the stock market after the recent subprime crisis: except for a
single spike corresponding to the 1987 stock market crash, the recent conditional
volatility is unmatched since the market turmoil surrounding the great depression.
4. The Role of Global Imbalances in the Current Crisis
There has been a sharp debate surrounding the sustainability of global imbalances,
particularly as they relate to persistent recent US current account deficits. Some have
viewed the global imbalances as a reflection of market forces particularly since the US
dollar is used as an international reserve currency. Accordingly, the U.S. balance of
payments deficits do not pose a problem in that the rest of the world voluntarily holds
dollars because of their valuable service flow (liquidity), hence deficits are demand
determined. The U.S. is in a unique position since the U.S. dollar is an international
medium of exchange. Serrano (2003) argues that the US Federal Reserve enjoys a distinct
advantage in determining the interest rate of the dollar as U.S. debt has unmatched
liquidity. Thus the US operates under a “floating dollar standard” where the U.S.
economy is free of balance of payments constraints typical of other countries.
The global saving glut hypothesis we alluded to above also views the global
imbalances as direct results of increased savings and current account surpluses in
developing and emerging economies. In these economies, export driven growth has led to
higher incomes. In the absence of properly functioning credit markets and social security
systems, people save due to precautionary motives. Combined with the governments’
own high saving rate and the export driven development strategy that focuses on
undervalued currency in emerging economies, a high national saving becomes a natural
self sustaining condition generating low real interest rates, and expanded demand in
advanced countries and growth in emerging markets. If the source of global imbalances is
the global saving glut, then US domestic policy cannot bring about a smooth adjustment

14
to the problem since all this is taking place at a time of unusually low interest rates in the
US (the interest rate conundrum). If instead, the root cause of the imbalances were low
US saving rates, then one would observe high interest rates in the US; Clarida (2005).
Reflecting a widely held view, Clarida concludes that because i) the US dollar is an
international reserve currency, ii) the comparative advantage of U.S. financial markets,
iii) the credibility of U.S. monetary policy, the United States is destined to run structural
international capital inflows, and thus a structural current account deficit. According to
this view, the US current account deficit should narrow over time in an orderly fashion.
Another major argument discounting the imminent threats posed by global
imbalances focuses on the tendency of US investments abroad to earn a higher rate of
return than US foreign liabilities; Gourinchas and Rey (2007). Accordingly, US net
foreign liabilities rise less quickly than US current account deficits and viewed in this
fashion, the resulting debt is small and is inexpensive to service. Despite the relatively
lower rates of returns in the United States, Forbes (2007) summarizes the possible factors
why foreign investors might prefer investing in the United States: more sophisticated,
liquid and efficient U.S. financial markets; corporate governance, accounting standards
and transparency in the United States; low information costs relative to other economies;
the reserve status of the U.S. dollar; the diversification benefits; and/or location
advantages.
Finally there are those who view the current account adjustment within the
context of the resurgence of an implicit Bretton Woods System. The large current
account surplus in many emerging markets, matched by current account deficits chiefly in
the US but also in a number of advanced economies has been dubbed Bretton Woods II
(also called global co-dependency theory) in a series of papers by Dooley, Folkerts-
Landau, and Garber (2003, 2004, 2008), henceforth DFG. According to this view, China
and other Asian emerging markets are willing to finance US current account deficits
regardless of whether it is sustainable or not. The reason is that these countries are
emulating the Japanese export led growth, driven by artificially low exchange rates where
the export sector is the locus of learning and productivity spillovers. This strategy makes
the country more appealing for foreign direct investment and private capital flows. Indeed

15
many Asian and emerging economies have followed an export driven development
strategy and managed their exchange rates so as to promote and/or maintain export
competitiveness. As such, these surplus countries particularly Japan and China have been
accumulating massive amount of dollar-denominated assets mainly in the form of U.S.
Treasury securities. Even if there is a risk that a fall in the value of the US dollar will
make these countries incur a capital loss, DFG point out that by holding a large sum of
US Treasury securities, these countries are providing a collateral against the risk of
confiscation of US multinational investments in among other places, China; see, Dooley,
Folkerts-Landau (2004).
The global co-dependency view is consistent with couple of observed facts. First,
as we stated above, foreign central banks and not private investors have been providing
the funds to finance US current account deficits. Second, emerging market economies
themselves have been receiving foreign direct investment and net private capital flows.
As Eichengreen (2008) points out, this view also capable of explaining the bond market
“conundrum” since foreign central banks are the marginal purchasers of U.S. Treasury
securities and U.S. current account deficits coexist with low long term US interest rates.
Portes (2009) and Lane (2009) disagree with DFG on the reasons for official
reserve accumulation by emerging markets. They argue that surpluses are intended to
build up precautionary reserves. Particularly after the Asian crisis, many emerging Asian
economies purposefully pursued policies that were conducive to the accumulation of
foreign exchange reserves in order to deal with ‘sudden stops’ in capital inflows and
perhaps outflow of capital by domestic savers. Moreover, policy-makers in the developed
countries and international agencies encouraged this policy. This has far reaching
implications: if emerging markets are accumulating reserves that pay abnormally low
yields so as to thwart sudden capital flight, and are effectively subsidizing advanced
economies, then the resulting global allocation of capital is indeed suboptimal.
Others have argued that global imbalances may lead to a sudden stop in the flow
of funds to deficit countries, particularly the United States, and spark a sharp decline in
the value of the U.S. dollar. Roubini and Setser (2005) questioned the sustainability of

16
global imbalances and the efforts to limit dollar appreciation against some Asian
currencies notably the Chinese renminbi, arguing that the scale of the financing required
is increasing faster than the willingness of the world's central banks to build up their
dollar reserves. They argued that Bretton Woods II international monetary system was
unstable and predicted that there was a meaningful risk the system would collapse before
the end of 2006. Essentially surplus countries, by financing US current account deficits
and purchasing dollar assets are subsidizing low interest rates in the US which facilitates
the expansion of US consumption and employment in interest-sensitive sectors at the
expense of investment in the production of tradables. The adjustments ultimately required
to bring the US trade deficit down will be more painful. Moreover, Roubini and Setser
(2005) contend that the classical specie-flow mechanism will be at work: the enormous
reserve growth required to sustain the Bretton Woods II system will be hard to fully
sterilize, particularly in China, which will increase the money supply and domestic
inflation, in addition to fueling a lending boom and asset bubble that will weaken
financial markets further. Finally, surplus countries that accumulate dollar reserves run
the risk of substantial capital losses as the dollar starts to depreciate. Obstfeld and Rogoff
(2007) also questioned the sustainability of U.S. current account imbalances and
suggested that a large depreciation of the dollar was indeed very likely.
Cline (2005) argued the current account deficit in the US was no longer benign as
it had been in the 1990s when it was financing high investment instead of high
consumption and large government budget deficits. Cline calls for a new Plaza
agreement similar to the 1985 Plaza Agreement that ended an overvalued US dollar or a
Smithsonian type agreement like that of 1971 under the auspices of the G-20 group of
industrial and emerging-market economies. The United States would commit to
eliminate fiscal deficits in few years. The objective would be the real appreciation of
currencies (especially those of East Asian currencies including the Japanese yen) and a
commitment to refrain from accumulating dollar reserves until a target depreciation of the
dollar (for example 20 percent) is achieved. All that is needed is for surplus countries to
refrain from intervening in the foreign exchange markets. If this is not possible, as a
second best alternative, Cline suggests that the United States should seriously consider

17
imposing countervailing duties against countries that subsidize their exports by keeping
their currencies artificially undervalued.
In fact many authors who expected an imminent economic crisis stemming from
global imbalances did so based on the usual scenario: a sudden stop of capital flows into
the US precipitating a currency crisis followed up by exorbitant interest rate hikes that
would choke off economic activity, possibly defaults and a debt crisis. The fact that a
hard landing with a foreign exchange crisis did not occur7 does not mean global
imbalances are likely to disappear from the radar screen. In fact a program called
“Multilateral Consultation on Global Imbalances” was initiated in 2006 under the
auspices of the IMF to deal with global imbalances. The program brought policymakers
from major governments of countries/regions involved in the imbalances. It was agreed
that major policy changes are needed to redistribute spending patterns so as to mitigate
risks to the international system. The program basically called for deficit countries to take
steps to increase national savings and for surplus countries to boost domestic aggregate
demand and allow exchange rate appreciation; the program began on June 5, 2006 (See
IMF 2007 for details). Before any measure could bear fruit, the crisis came and spread
worldwide.
There is an emerging consensus that global macroeconomic imbalances have
contributed to this crisis at least indirectly. As we emphasised above, with these
imbalances the US was flooded with large foreign capital and a period of low interest
rates followed. As a result, long term interest rates showed a secular decline as did
mortgage rates. Figure 9 shows the 30-year conventional fixed mortgage rate, the 10-year
US Treasury constant maturity yield and US current account deficits. The figure clearly
shows the general trend of large current account deficits (foreign accumulation of claims
against the US) and the general decline of the long term yield and the mortgage rate.
Faruqee and Lee (2009) show that not only the size of global imbalances has
increased but also their dispersion. These pervasive imbalances played a significant role
in the so called great moderation: By increasing global liquidity they contributed to low
volatilities, lower and more stable inflation and low interest rates [Portes (2009)]. As a

18
result, this environment fostered a build up of leverage that fed the real estate bubble in
the United States and other advanced economies [IMF (2009)]. Indeed the US house
price index tracks a global imbalances indicator very well (the ratio of absolute value of
global current account balances to global GDP)8 Moreover, Aizenman and Jinjarak
(2008) confirm that global imbalances are associated with a sizable real appreciation of
real estate prices in general and the relationship is robust to the presence of other
conditioning variables such as the real interest rate, GDP growth, and inflation. While
ideally such imbalances lead to efficient allocation of global resources, in a more realistic
second best environment Aizenman and Jinjarak argue that capital inflows may amplify
the costs of distortions. This should not mean a country has to turn its back to capital
flows but rather greater financial globalization calls for being vigilant against moral
hazard and other pre-existing domestic frictions.
Figure 10 is suggestive in that the period of easy money mentioned above in
Figure 2 combined with global capital flows made a very dangerous mix: low interest
rates intensified the “search for yield” that led to the creation of complex asset backed
securities. Pension funds and insurance companies were willing to buy these securities so
long as the rating agencies gave them certifications that passed these institutions’ rating
thresholds. The system was self sustaining so long as securities could be pledged as
collateral to raise more funds. However, with delinquencies and foreclosures, the
complex securities became highly illiquid. Illiquidity in the housing market created
information risk, which coupled with complexity risk, destroyed liquidity for asset
backed securities in financial markets [Kashyap, Rajan, and Steen (2008)].
The competition for yield also gave way to poor risk management practices that
did not price risk properly and the financial system was interconnected in ways that
amplified systemic risk. The propagation of the crisis took place via holdings of US
assets in highly leveraged Swiss, German, French, and British financial institutions; these
tended to hold mortgage backed securities that carried no implicit US government
guarantees, whereas official holdings of emerging market institutions consisted mainly of
GSE securities [IMF (2009)].

19
The financial crisis has to some extent helped in reducing global current account
imbalances due to increased savings and improvements in the terms of trade in deficit
countries, even though there are still substantial imbalances remaining. Whether these
imbalances should be addressed is open to debate. Even though the word "imbalances"
itself implies a degree of undesirability; there is no theoretical or historical case against
running deficits or surpluses. Indeed as Hunt (2008) emphasizes, economic history is
replete with periods where global savings have flowed from one region to another,
resulting in sizable current account imbalances. Examples of such periods include the
classical Gold Standard period where the core industrial economies of Britain, France and
Germany bankrolled the development of resource rich countries such as Australia,
Argentina, Canada, New Zealand and even the United States. What is peculiar about
these examples is that capital flew from regions where the marginal productivity of
capital was low to countries or regions where such productivity is presumably higher.
Such capital flows are clearly optimal in that they lead to a more efficient allocation of
global capital. Moreover, the unraveling of the underlying imbalances was not disruptive.
By contrast, it is useful to recount a brief narrative of other notable global
episodes of imbalances that were followed by painful periods of adjustment. After the oil
shocks of the 1970s financial institutions of advanced countries were flush with funds
notably those that were recycled from oil exporting countries. These funds were lent to
developing countries, particularly in Latin America, at adjustable interest rates. After a
global recession in early 1980s that reduced exports, many developing countries’ export
earnings fell. Combined with a strong dollar that increased the value of debt in domestic
currencies (the so-called “original sin” problem), higher interest rates, capital flight, and
depleted foreign exchange reserves, many Latin American countries including Mexico,
Brazil, Venezuela, Argentina, and Chile declared they were not able to repay their debt.
Reinhart and Rogoff (2008b) confirm what many suspect with regards to debt
crises such as the Latin American debt crisis: global economic factors, including
commodity prices and centre country interest rates, play a major role in precipitating
these types of sovereign debt crises. Moreover, countries that are the loci of large capital
inflows are at high risk of having a debt crisis. Historically defaults on debt, currency

20
crashes, inflation, and banking crises are associated with large capital movements.
However, Kose et al. (2009) provide a more nuanced view of global capital movements:
In a comprehensive study of capital flows, they conclude that there are thresholds below
which a complete opening of the capital account can impair the realization of any benefits
which would make a country more vulnerable to sudden stops of capital flows. These
economic environment thresholds refer to stable macroeconomic policies, sufficiently
strong financial and other institutions, regulation and governance.
The Latin American debt crisis was followed by another notable episode where
global capital movements led to speculative attacks on a number of emerging market
currencies in Asia. Until the Asian financial crisis, many Asian countries recorded
impressive economic growth with low inflation, macroeconomic stability, openness,
strong fiscal position, high saving rate, and a thriving export sector. At the core of this
crisis were the large-scale foreign capital inflows into financial systems that became
vulnerable to panic, reflecting sudden reversals of market confidence. Moreover, because
most of the economic activity in those countries supported by the capital inflows was
highly productive, the loss of economic activity resulting from the sudden reversal in
capital flows was enormous, which, in turn, forced the economies into sharp downturns.
This crisis also hit the most rapidly growing economies in the world, and prompted the
largest financial bailouts in history. It was the most severe financial crisis to hit the
developing world since the 1982 debt crisis and one of the least anticipated financial
crises (Chancheroenchai, Dibooglu, Mathur 2005). After the Asian crisis, many emerging
economies particularly those in Asia, built war chests of foreign exchange reserves in
order to insure themselves against the sudden stop of capital flight. These countries
emerged from the crisis building their export sector that generated surpluses on the
current account balance that fed the following cycle of boom and bust. These current
account balances then contributed to the most recent economic crisis and any reform or
regulatory solution with regards to capital requirements, risk management, leverage,
transparency, disclosures, credit ratings, or insurance will be inadequate by itself. Thus,
any global moves to reform the financial sector should be complemented by reforms to
remedy problems posed by global imbalances.

21
Some authors have suggested various steps to deal with global imbalances to
complement financial reforms as such [e.g., Portes (2009); Lane (2009)], and in light of
the foregoing discussion, it worthwhile to enumerate some sensible measures here:
• Focus on financial development in emerging markets so that domestic savings can
support a sizable domestic investment without too much reliance on short term foreign
capital;
• Expand international institutional financing including that of the IMF so that
countries do not have to accumulate excessive foreign exchange reserves for
precautionary purposes;
• Improve international risk sharing: eliminate or reduce the problem of the original
sin; allow emerging markets to borrow in their own currencies;
• Allow for state contingent instruments such as GDP-indexed bonds or global
commodity price indexed bonds;
• Develop domestic social insurance, health, disability, and unemployment
insurance so that people do not have to over save for precautionary purposes.
• Undertake long term reforms with respect to property rights, transparency,
governance and improve macroeconomic stability so that the thresholds for productive
international capital flows are met;
• For surplus countries, promote domestic demand policies that are appropriate for
the domestic productive capacity of the economy in question;
• Promote regional integration and currency unions to eliminate some exchange
rates and currency speculation all together;
• Limit leverage for systemically important financial institutions and/or require
them to pay premiums to the fiscal authority; make sure that their size is not too big for
the fiscal authority to deal with in case of insolvency.
6. Concluding Remarks
A stable financial system –one that is not prone to systemic risk- is the backbone
of a robust economy. The recent 2007-2009 crisis has proved that the financial system
was not able to withstand the stresses that came about with an increase in the size and

22
dispersion of global imbalances and the associated capital flows. After the Asian crisis,
some emerging economies along with oil exporters amassed substantial official foreign
exchange reserves. Central banks and sovereign wealth funds in these surplus countries
channeled these funds to advanced economies but particularly to the US buying US
government and agency securities, which raised the prices of safe assets in the US,
bringing their yield to historical lows. In this low yield environment, the financial
industry made extra strides to increase returns on investments by taking on various
financial innovations (securitization, “originate to distribute”) to expose many financial
institutions to systemic risk. The environment was also conducive to well documented
principal-agent problems, moral hazard, and various incentive compatibility issues.
Combined with leverage, these problems acted to amplify risk taking particularly in real
estate related investments. The system was self sustaining so long as financial institutions
were able to raise funds. However when slowing personal income growth and increase in
interest rates increased delinquencies and foreclosures in the real estate market in the US,
the complex securities became highly illiquid. Illiquidity in the housing market created
information risk, which coupled with complexity risk, destroyed liquidity for asset
backed securities in financial markets. Because of the interconnectedness in the global
financial system, the crisis spread quickly and is producing the largest global downturns
in recent memory.
In this paper we give a brief description of the origin of the crisis followed by an
evaluation of the crisis within a historical context. We estimate the historical incidence of
risk and present some evidence regarding the evolution of the unit price of risk in the
stock market. Our results show that at least in the stock market, the unit price of risk is
comparable to the onset of other notable recessions in the last century including the great
depression. We then discuss global imbalances and how they may have been at the heart
of the current crisis. Any sensible approach at financial reform must be complemented
with addressing issues related to global imbalances and include remedies for allocating
global financial resources such that they are used where they are most productive. As it is
global financial resources are flowing the “wrong way”; providing environments where

23
they can flow the right way must be a priority for international institutions and
policymakers.

24
Figure 1. TED Spread, May 2004-July 2009
0.00
0.50
1.00
1.50
2.00
2.50
3.00
3.50
4.00
4.50
5.005/
4/20
04
8/4/
2004
11/4
/200
4
2/4/
2005
5/4/
2005
8/4/
2005
11/4
/200
5
2/4/
2006
5/4/
2006
8/4/
2006
11/4
/200
6
2/4/
2007
5/4/
2007
8/4/
2007
11/4
/200
7
2/4/
2008
5/4/
2008
8/4/
2008
11/4
/200
8
2/4/
2009
5/4/
2009
Per
cent
Source: 3 Month US Dollar LIBOR is from Moneycafe.com and the 3 month T-Bill rate
is from the Federal Reserve Bank of St Louis, FRED Database.

25
Figure 2. Effective US Federal Funds Rate Adjusted for Year to Year CPI Inflation
-4.00
-3.00
-2.00
-1.00
0.00
1.00
2.00
3.00
4.00
5.00Ja
n-00
Jul-0
0
Jan-
01
Jul-0
1
Jan-
02
Jul-0
2
Jan-
03
Jul-0
3
Jan-
04
Jul-0
4
Jan-
05
Jul-0
5
Jan-
06
Jul-0
6
Jan-
07
Jul-0
7
Jan-
08
Jul-0
8
Jan-
09
Source: Federal Reserve bank of St Louis, FRED Database

26
Figure 3. Non Prime Mortgages and Debt-Income Ratio in the U.S.
Source: David Wheelock (2008). "Dealing With Financial Turmoil: The Fed's Response",
Federal Reserve Bank of St Louis.
http://research.stlouisfed.org/conferences/prof/2008/Wheelock_Professors_Conf_11_6_2
008v2.ppt
0
100
200
300
400
500
600
700
1995 1996 1997 1998 1999 2000 2001 2002 2003 2004 2005 2006
Mortgages, $ Billions
0.4
0.5
0.6
0.7
0.8
0.9
1
1.1(Debt/ Income)
---Debt/Income (right scale)
Subprime
Alt- A

27
Figure 4. U.S. House Price Index and GDP Growth, 2001-2008
2001 2002 2003 2004 2005 2006 2007 200890
100
110
120
130
140
150
160
170
18020
01=1
00
House Price Index Nominal GDP
Source: Standard and Poors Case-Shiller House Price Index (McGrawHill) GDP (St
Louis FED)

28
Figure 5. U.S. Median House Price to Rent Ratio in the U.S.
1988
1989
1990
1991
1992
1993
1994
1995
1996
1997
1998
1999
2000
2001
2002
2003
2004
2005
2006
2007
2008
10
15
20
25
30
Median Rent/Price Ratio
Note: Median house price divided by annual rent.
Source: Current Population Survey/Housing Vacancy Survey, Bureau of the Census,
Washington, DC 20233

29
Figure 6. U.S. Foreclosure Rates by Loan Type
Source: David Wheelock (2008). "Dealing With Financial Turmoil: The Fed's Response",
Federal Reserve Bank of St Louis.
http://research.stlouisfed.org/conferences/prof/2008/Wheelock_Professors_Conf_11_6_2
008v2.ppt
0.0
1.0
2.0
3.0
4.0
5.0
6.0
7.0
8.0
2005 2006 2007 2008
Rat
e of
new
fore
clos
ures
, %
All Mortgages Subprime ARMs Subprime FRMs
Prime ARMs Prime FRMs

30
Figure 7. The Spread between Baa Grade Corporate Bonds and Treasury Composite
Yield over 10 Years, January 1925-September 2009
0.00
1.00
2.00
3.00
4.00
5.00
6.00
7.00
8.00Ja
n-25
Jan-
29
Jan-
33
Jan-
37
Jan-
41
Jan-
45
Jan-
49
Jan-
53
Jan-
57
Jan-
61
Jan-
65
Jan-
69
Jan-
73
Jan-
77
Jan-
81
Jan-
85
Jan-
89
Jan-
93
Jan-
97
Jan-
01
Jan-
05
Jan-
09
Perc
ent
Source: Federal Reserve Board, St Louis FED FFRED Database.
Note: Treasury discontinued the Composite Yield over 10 Years on June 30 2000. The 10 year constant-yield Treasury bond yield is substituted thereafter.

31
Figure 8. Conditional Volatility of the Stock Market in a Historical Perspective
1920 1930 1940 1950 1960 1970 1980 1990 20000.000
0.025
0.050
0.075
0.100
0.125
0.150
0.175

32
Figure 9. US Current account deficit (external borrowing), the Yield on the 10-year Treasury Note and the 30-year Conventional Fixed Mortgage Rate
BOND_YIELD MORTGAGE_RATE CA_DEFICIT
per
cen
t
CA
deficit in
$billio
n
1990 1992 1994 1996 1998 2000 2002 2004 2006 20083
4
5
6
7
8
9
10
11
-250
-200
-150
-100
-50
0
50
Source: Federal Reserve Bank of St Louis, FRED Database.

33
Figure 10. US House Price Index and Global Imbalances
HOUSE_PRICES GLOBAL_IMBALANCE
US
ho
use
pri
ce in
dex
,198
0=10
0
glo
bal im
balan
ces
1990 1992 1994 1996 1998 2000 2002 2004 2006 2008150
200
250
300
350
400
0.015
0.020
0.025
0.030
0.035
0.040
0.045
0.050
0.055
0.060
Source: US House Price Index, Federal Housing Finance Agency; Global Imbalances (absolute value of current account balances as a percent of world GDP) are from IMF (2008). The 2008 figure is from IMF (2009).

Table 1. Annual GDP Growth Rates in Advanced Economies
1986–1995 1996 1997 1999 2000 2001 2002 2003 2004 2005 2006 2007 2008 2009a 2010a
2002-2006
2008-2010
United States 2.9 3.7 4.5 4.2 4.4 3.7 0.8 1.9 3 3.9 3.2 2.8 2 1.1 -2.8 0.0 3.0 -0.6 Germany 2.7 0.8 1.4 2 2 2.9 0.8 0.1 –0.1 1.2 0.9 3 2.5 1.3 -5.6 -1.0 1.3 -1.8 France 2.1 1 1.9 3.6 3.2 4.2 2.1 1.1 0.5 2 1.2 2.2 2.1 0.7 -3 0.4 1.4 -0.6 Italy 2.1 1.1 2 1.8 1.7 3 1.8 0.4 0.3 1.1 1.9 1.8 1.6 –1.0 -4.4 -0.4 1.1 -2.4 Spain 3 2.4 4 4.3 4.2 4.4 2.8 2.2 2.5 3.1 3.4 3.9 3.7 1.2 -3 -0.7 3.0 -0.8 Netherlands 2.7 3 3.8 4.3 4 3.5 1.4 0.6 –0.9 2 1.5 3.4 3.5 2 -4.8 -0.7 1.9 -1.2 Belgium 2.3 0.9 3.7 2.1 3.2 3.7 0.7 0.7 1.1 2.4 1.5 2.9 2.6 1.1 -3.8 0.3 1.7 -0.8 Austria 2.5 2 1.6 3.9 2.7 3.4 0.8 1.4 0.7 2.4 2 3.4 3.1 1.8 -3 0.2 2.0 -0.3 Finland 1.1 3.9 6.3 5 3.4 5.1 1.1 2.3 2 3.5 2.9 4.9 4.2 0.9 -5.2 -1.2 3.1 -1.8 Greece 1.2 2.4 3.6 3.4 3.4 4.4 4 3.9 4.3 4.7 3.7 4.2 4 2.9 -0.2 -0.6 4.2 0.7 Portugal 4 3.5 4 4.6 3.8 3.4 1.6 0.4 –1.2 1.2 0.4 1.4 1.9 0 -4.1 -0.5 0.9 -1.5 Ireland 4.4 8.1 10.8 8.9 11.1 9.9 6 6.1 3.7 4.3 5.5 5.7 6 –2.3 -8 -3.0 5.1 -5.5 Luxembourg 6.2 3.3 8.3 6.9 7.8 9 1.3 1.7 2.1 4.2 4 6.1 5.2 0.7 -4.8 -0.2 3.6 -1.4 Japan 3.1 3.5 1.8 –1.2 0.2 2.8 0.4 –0.3 2.5 2.3 2.6 2.4 2.4 –0.6 -6.2 0.5 2.5 -2.9 United Kingdom 2.5 2.8 3.3 3.1 2.9 3.9 2.3 1.8 2.2 3.3 1.9 2.8 3 0.7 -4.1 -0.4 2.4 -1.3 Canada 2.3 1.6 4.2 4.1 5.5 5.2 1.8 3.4 2 3.3 2.9 3.1 2.7 0.5 -2.5 1.2 2.9 -0.3 Korea 8.5 7 4.7 –6.9 9.5 8.5 3.8 7 3.1 4.7 4 5.1 5.1 2.2 -4 1.5 4.8 -0.1 Australia 3.1 4.3 3.9 5.2 4.3 3.2 2.5 3.8 3 3.5 2.5 2.7 4 2.1 -1.4 0.6 3.1 0.4 Taiwan 8.1 6.1 6.7 4.6 5.4 5.9 –2.2 3.6 3.3 6.1 4.1 4.9 5.7 0.1 -7.5 0.0 4.4 -2.5 Sweden 1.6 1.3 2.4 3.6 4.6 4.3 0.9 2.1 1.6 3.7 2.7 4.1 2.6 –0.2 -4.3 0.2 2.8 -2.1 Switzerland 1.4 0.5 1.9 2.8 1.3 3.7 1 0.2 –0.5 2.1 1.9 3.4 3.3 1.6 -3 -0.3 1.9 -0.6 Hong Kong 6.6 4.3 5.1 –5.0 3.4 10.2 0.5 1.9 3.2 8.6 7.3 7 6.4 2.5 -4.5 0.5 5.6 -0.5 Denmark 1.6 2.5 3 2.5 2.6 2.8 1.6 1 0.5 1.9 3.2 3.9 1.6 –1.1 -4 0.4 2.1 -1.8 Norway 2.8 5.3 5.2 2.6 2.1 2.8 2.7 1.4 0.4 3.1 2.3 2.5 3.1 2 -1.7 0.3 1.9 0.2 Israel 5.4 4.6 3.5 3.7 2.5 8 –0.9 –0.7 1.3 4.8 5.2 5.2 5.4 3.9 -1.7 0.3 4.1 0.8 Singapore 8.8 8.1 8.6 –0.9 6.9 9.7 –1.9 2.2 1.1 8.7 6.4 8.2 7.8 1.1 -10 -0.1 5.3 -3.0 New Zealand 2.5 4 2 –0.1 4 3.8 2.6 4.3 3.4 4.4 2.3 1.9 3.2 0.3 -2 0.5 3.3 -0.4 Cyprus 5.7 1.9 2.3 4.8 4.7 5 4 2 2 3.9 3.7 4 4.4 3.7 0.3 2.1 3.1 2.0 Iceland 1.7 5.2 4.7 5.6 4.2 5.6 2.7 –0.5 4 8.2 5.5 4.4 5.5 0.3 -11 -0.2 5.5 -3.5
Notes: a Based on IMF projections. Source: International Monetary Fund, World Economic Outlook, various issue

Table2. Estimates of ARCH-M coefficients and the Evolution of the Unit Price of Risk
Full Sample
Onset of Great Depression
Oil Crises of 1970s
Onset of the Tech Bubble
Onset of the Subprime Crisis
b0
0.00023*** (3.16)
-0.00163 (-1.46)
-0.00056 (-0.60)
-0.0011** (-2.32)
-0.00211** (-2.16)
b1
0.0725*** (8.95)
-0.053** (-1.96)
0.224*** (9.00)
0.052** (2.15)
-0.082*** (-2.49)
δ.
1.45*** (7.83)
25.83** (2.32)
10.09 (0.83)
24.14*** (4.28)
27.01*** (2.47)
a0
0.000081*** (74.72)
0.000086***(23.70)
0.000065*** (24.80)
0.000064*** (26.27)
0.000075*** (22.34)
a1
0.462*** (29.41)
0.167*** (4.81)
0.196*** (6.17)
0.254*** (7.59)
0.217*** (6.25)
Notes: Data periods are as follows: Full sample, 1.04.1915-04.28.2009; Onset of Great Depression, 07.01.1921-08.01.1929; Oil Crises of 1970s, 11.01.1970-01.01.1980; Onset of the Technology Bubble, 03.01.1991-03.01.2001; Onset of the Subprime Crisis, 11.01.2001-12.01.2007. T-statistics are in parentheses. (**) indicates significance at 5 percent; (***) significance at 1 percent.

1
REFERENCES
Aizenman, Joshua and Yothin Jinjarak (2008). “Current account patterns and national real estate markets,” mimeo, University of California Santa Cruz, September 2008.
Barro, Robert J. and José F. Ursúa (2009). “Stock Market Crashes and Depressions,” NBER Working Paper No. 14760, February 2009.
Blanchard, Olivier, and John Simon (2001). "The Long and Large Decline in U.S. Output Volatility," Brookings Papers on Economic Activity, 1, pp. 135-64.
Bordo, Michael (2008). “An Historical Perspective on the Crisis of 2007-2008.” NBER Working Paper No. 14569, December 2008.
Caballero, Ricardo, Emmanuel Farhi, and Pierre-Olivier Gourinchas (2008). “An Equilibrium Model of ‘Global Imbalances’ and Low Interest Rates,” American Economic Review, Vol. 98, No. 1 (March), pp. 358–93.
Chancheroenchai, Kanokwan, Sel Dibooglu, Ike Mathur (2005). Stock Returns and the Macroeconomic Environment prior to the Asian Crisis in Selected Southeast Asian Countries” (with K. Chancharoenchai and I. Mathur), Emerging Markets Finance and Trade, 41(4), July-August 2005, 38-56.
Claessens, Stijn, M. Ayhan Kose, and Marco Terrones (2008). “What Happens During Recessions, Crunches and Busts?” IMF Working Paper No. 08/274.
Clarida, Richard H. (2005), “Japan, China, and the U.S. Current Account Deficit,” CATO Journal 25, pp.111-114.
Cline, William R. (2005). The United States as a Debtor Nation: Risks and Policy Reform, Washington, DC: Institute of International Economics and Center for Global Development.
Demyanyk, Yuliya and Otto Van Hemert (2009). “Understanding the Subprime Mortgage Crisis,” forthcoming, Review of Financial Studies.
Dooley, M, D Folkerts-Landau and P Garber (2003) 'An essay on the revived Bretton Woods system' NBER Working Paper 9971, September 2003.
Dooley, M, D Folkerts-Landau and P Garber (2004) 'The US Current Account Deficit and Economic Development: Collateral for a Total Return Swap', NBER Working Paper No. 10727, August 2004.
Dooley, M, D Folkerts-Landau and P Garber (2008) 'Will Subprime be a Twin Crisis for the US?' NBER Working Paper No. 13978, April. 2008.

2
Dynan Karen E. and Donald L. Kohn (2007). “The Rise in U.S. Household Indebtedness: Causes and Consequences,” Board of Governors of the Federal Reserve System, Finance and Economics Discussion Series, No. 2007-37. Engle, Robert F., D. Lilien and R. Robins. (1987). “Estimating Time Varying Risk Premia in the Term Structure: The ARCH-M Model.” Econometrica, 1987, 55, pp. 391-407. Eisenbeis, Robert A., W. Scott Frame, and Larry D. Wall (2007). “An Analysis of the Systemic Risks Posed by Fannie Mae and Freddie Mac and an Evaluation of the Policy Options for Reducing those Risks,” Journal of Financial Services Research, 31(2), June 2007, pp. 75-99.
Emmons, William R. (2008). “The Mortgage Crisis: Let Markets Work, But Compensate the Truly Needy” The Regional Economist, Federal Reserve Bank of St Louis, July 2008, vol. 16, pp. 10-16
Faruqee, Hamid and Jaewoo Lee (2009) “Global Dispersion of Current Accounts: Is the Universe Expanding" IMF Staff Papers, 56(3), pp. 574-595, August. Forbes, Kristen J. (2007). “Global Imbalances: A Source of Strength or Weakness?” Cato Journal, Vol. 27, No. 2 (Spring/Summer 2007), pp. 193-202.
Gourinchas, Pierre-Olivier and Helene Rey (2007). “From World Banker to World Venture Capitalist: The US External Adjustment and the Exorbitant Privilege,” in G7 Current Account Imbalances: Sustainability and Adjustment, Richard Clarida, editor, The University of Chicago Press, 2007, pp.11-55.
International Chamber of Commerce (2008). Trade Finance in the Current Financial Crisis: Preliminary Assessment of Key Issues, Paris: International Chamber Of Commerce. Hunt, Chris (2008). "Financial turmoil and global imbalances: the end of Bretton Woods II?" Reserve Bank of New Zealand: Bulletin, 71(3), September 2008, pp. 44-55.
International Monetary Fund (IMF), (2007). Press Release 07/72 on the Conclusion of Multilateral Consultations (Washington, D.C.)
International Monetary Fund (IMF), (2008). World Economic Outlook: Financial Stress, Downturns, and Recoveries, October 2008. (Washington, D.C.) International Monetary Fund (IMF), (2009). World Economic Outlook: Crisis and Recovery, April 2009. (Washington, D.C.)

3
Kashyap, Anil, Raghuram Rajan and Jeremy Stein (2008). “The Global Roots of the Current Financial Crisis and its Implications for Regulation.” Paper presented at the Bank of Finland, Helsinki, 5 December 2008.
Kose, M. Ayhan, Eswar Prasad, Kenneth Rogoff, and Shang-Jin Wei (2009). “Financial Globalization: A Reappraisal,” IMF Staff Papers, 56(1), April 2009, pp. 8-62.
Lane, Philip R. (2009). “Global Imbalances and Global Governance,” mimeo, Trinity College Dublin, February 2009.
Mishkin, Frederic ( 1991) "Asymmetric Information and Financial Crises: A Historical Perspective." NBER Working Paper No. 3400. In Financial Markets and Financial Crises, edited by R. Glenn Hubbard, pp. 69- 108. Chicago: The University of Chicago Press, 1991.
Obstfeld, Maurice and Kenneth Rogoff (2007) "The Unsustainable U.S. Current Account Position Revisited," in G7 Current Account Imbalances: Sustainability and Adjustment, Richard Clarida, editor, The University of Chicago Press, 2007, pp.339-376.
Portes, Richard (2008). “Rating Agency Reform,” pp. 145-149 in The First Global Financial Crisis of the 21st Century, ed. by Andrew Felton and Carmen Reinhart, a publication of VoxEU.org. Available at http://www.voxeu.org/index.php?q=node/1352. Portes, Richard (2009). “Global Imbalances,” mimeo, London Business School. Reinhart, Carmen M. and Kenneth S. Rogoff (2008a). “Is the 2007 US Sub-Prime Financial Crisis So Different? An International Historical Comparison,” American Economic Review 98(2), May 2008, pp. 339-344. Reinhart, Carmen M. and Kenneth S. Rogoff (2008b). “Banking Crises: An Equal Opportunity Menace,” NBER Working Paper No. 14587, December 2008.
Roubini, Nouriel and Brad Setser (2005). “Will the Bretton Woods 2 Regime Unravel Soon? The Risk of a Hard Landing in 2005-2006” Federal Reserve Bank of San Francisco Proceedings, February 2005.
Serrano, Franklin L. P. (2003). “From 'Static' Gold to the Floating Dollar.” Contributions to Political Economy, Vol. 22, pp. 87-102, 2003.
Stock, James H., and Mark W. Watson (2002). “Has the Business Cycle Changed and Why?” NBER Working Paper No. 9127, August 2002.

4

5
ENDNOTES 1 See, International Chamber of Commerce (2008). 2 See, Stock and Watson (2002) and Blanchard and Simon (2001). Some argue that the decline in volatility is in no small measure due to the backward valuation methods and risk assessments that increased lending to hedge funds and made banks complacent about their own risk profiles. See Gillian Tett “Volatility returns with a vengeance,” Financial Times, FT.com, October 27, 2008. 3 As late as July 19, 2007 appearing before the Senate Banking Committee, FED Chairman Ben Bernanke predicted that the cost of sub-prime crisis would be in the order of $100 billion. See, Times Online, July 19, 2007, http://business.timesonline.co.uk. 4 See the FRED database of the Federal Reserve Bank of St Louis, series PSAVERT, available at http://research.stlouisfed.org/fred2/series/PSAVERT?cid=112 5 Data from January 4, 1915 through October 1, 1928 is from Ohio State University Fisher College of Business web site while the rest of the data is from http://finance.yahoo.com. 6 Since the stock market is closed on weekends and holidays and some other occasions when trading is halted, this is necessarily an approximation. We assume trading takes place continuously and substitute the previous closing price when data are missing. 7 To the contrary, demand for US government securities surged after September 2008 due to a flight to safety, yields have dropped dramatically and the US dollar appreciated as a result. 8 A simple regression of the percentage change in the house price index in the US on the change in absolute current account balances to global GDP ratio as a measure of global imbalances confirms a significant relationship (t-statistics in parentheses). Δhouse price = 0.36 + 5.26 (0.006) (1.59) ΔGlobal imbalances + error; R2 = 39%.