Embed Size (px)
Citation preview
A
fClC
•••••
c©
1
heiijpcct
E
0d
Nuclear Engineering and Design 237 (2007) 1909–1922
The 2006 CHF look-up table
D.C. Groeneveld a,b,∗, J.Q. Shan c, A.Z. Vasic b, L.K.H. Leung b,A. Durmayaz d, J. Yang a,b, S.C. Cheng a, A. Tanase a
a University of Ottawa, Department of Mechanical Engineering, Ottawa, Ont., Canadab Chalk River Laboratories, Atomic Energy of Canada Ltd., Chalk River, Ont., Canada K0J 1J0
c Department of Nuclear Engineering, Xi’an Jiaotong University, P.R. Chinad Istanbul Technical University, Institute of Energy, Istanbul, Turkey
Received 2 May 2006; received in revised form 26 February 2007; accepted 26 February 2007
bstract
CHF look-up tables are used widely for the prediction of the critical heat flux (CHF). The CHF look-up table is basically a normalized data bankor a vertical 8 mm water-cooled tube. The 2006 CHF look-up table is based on a database containing more than 30,000 data points and providesHF values at 24 pressures, 20 mass fluxes, and 23 qualities, covering the full range of conditions of practical interest. In addition, the 2006 CHF
ook-up table addresses several concerns with respect to previous CHF look-up tables raised in the literature. The major improvements of the 2006HF look-up table are:
An enhanced quality of the database (improved screening procedures, removal of clearly identified outliers and duplicate data).An increased number of data in the database (an addition of 33 recent data sets).A significantly improved prediction of CHF in the subcooled region and the limiting quality region.
An increased number of pressure and mass flux intervals (thus increasing the CHF entries by 20% compared to the 1995 CHF look-up table).An improved smoothness of the look-up table (the smoothness was quantified by a smoothness index).A discussion of the impact of these changes on the prediction accuracy and table smoothness is presented. The 2006 CHF look-up table iss.
tsC
tsup
haracterized by a significant improvement in accuracy and smoothnes2007 Elsevier B.V. All rights reserved.
. Introduction
The critical heat flux (CHF) normally limits the amount ofeat transferred, both in nuclear fuel bundles and in steam gen-rators. Failure of the heated surface may occur once the CHFs exceeded. The number of empirical CHF correlations hasncreased over the past 50 years and has reached well over 1000,ust for tubes cooled by water. The present proliferation of CHFrediction methods clearly indicates that the CHF mechanism is
omplex; no single theory or equation can be applied to all CHFonditions of interest. The complexity involved in predictinghe CHF increases significantly when additional factors such as∗ Corresponding author at: University of Ottawa, Department of Mechanicalngineering, Ottawa, Ont., Canada. Tel.: +1 6135843142.
E-mail address: [email protected] (D.C. Groeneveld).
oiaat
ai
029-5493/$ – see front matter © 2007 Elsevier B.V. All rights reserved.oi:10.1016/j.nucengdes.2007.02.014
ransients, non-uniform flux distributions, and asymmetric crossections are introduced. This has led to the development of theHF look-up table.
The CHF look-up table is basically a normalized data bank,hat predicts the CHF as a function of the coolant pres-ure (P), mass flux (G) and thermodynamic quality (X). Anpdated version of the CHF look-up table is appended to thisaper.
The CHF look-up table method has many advantages overther CHF prediction methods, e.g., (i) simple to use, (ii) noteration required, (iii) wide range of application, (iv) based on
very large database, and (vi) eliminates the need to choosemong many CHF prediction methods currently available for
ubes cooled by water.Although the CHF look-up table has been quite successfulnd has been adopted widely, several concerns have been raised,ncluding
1910 D.C. Groeneveld et al. / Nuclear Engineerin
Nomenclature
AECL Atomic Energy of Canada LimitedCHF critical heat flux (kW m−2)D inside diameter (m)G mass flux (kg m−2 s−1)H enthalpy (kJ kg−1)Hfg latent heat (kJ kg−1)�Hin inlet subcooling = (H − Hin)/Hfg (kJ kg−1)ID inside diameterL, Lh heated length (m)LQR limiting quality regionLUT look-up tablep pressure at CHF (kPa)qcr critical heat flux (kW m−2)T fluid temperature (◦C)X thermodynamic quality
Greek letterΩ smoothness index
SubscriptsCHF pertaining to the CHFexp experimentalin inlet conditions
•
•
•
•
uus8qpseheptc((
mita
2
aaals
(
(i
(
(
rcd
3
t
lim limiting quality as explained in Appendix A
Fluctuations in the value of the CHF with pressure, massflux and quality. This can cause difficulties when using look-up tables inside safety analysis codes in which iteration isrequired.Large variations in CHF between the adjacent table entries,especially in the region of the so-called limiting quality (thisregion is discussed in Appendix A).Prediction of CHF at unattainable conditions (e.g., criticalflow, CHF at qualities greater than 1.0).Lack or scarcity of data at certain conditions (e.g., high sub-coolings and high flow, near zero flows).
An initial attempt to construct a standard table of CHF val-es for a given geometry was made by Doroshchuk et al. (1975),sing a limited database of 5000 data points. This table, and allubsequent tables, contains normalized CHF values for a vertical-mm water-cooled tube at various pressures, mass fluxes andualities. Since then, CHF table development work has been inrogress at various institutions (e.g., CENG-Grenoble, Univer-ity of Ottawa, IPPE-Obninsk, and AECL-Chalk River) using anver-increasing database. The most recent CHF look-up table,ereafter referred to as the 1995 CHF look-up table (Groeneveldt al., 1996) employed a database containing about 24,000 CHFoints and provides CHF values for an 8-mm ID, water-cooled
ube at 21 pressures, 20 mass fluxes, and 23 critical qualities,overing, respectively, ranges of 0.1–20 MPa, 0–8 Mg m−2 s−1zero flow refers to pool-boiling conditions) and −50 to 100%negative qualities refer to subcooled conditions).
vsot
g and Design 237 (2007) 1909–1922
During the past 10 years, further enhancements have beenade to the CHF look-up table and its database, culminat-
ng in the 2006 CHF look-up table. This paper summarizeshe enhancements and presents the improvements in predictionccuracy of the 2006 CHF look-up table.
. Database
Following the development of the 1995 CHF look-up table,total of 33 new data sets containing 7545 data were acquired
nd included in the University of Ottawa’s CHF data bank. Notll of these data were used in the derivation of the new CHFook-up table. The database was first subjected to the followingcreening criteria (summarized in Table 1):
(i) Acceptable values for diameter (D), ratio L/D, pressure (P),mass flux (G) and quality (X).
ii) Ensuring that the data satisfied the heat balance (reportedpower should be approximately equal to [flow] × [enthalpyrise]).
ii) Identification of outliers using the slice method (Durmayazet al., 2004): the “slice” method was introduced toexamine all the data behind each table entry in thelook-up table. For each nominal look-up table pres-sure Pi and nominal mass flux Gj, a CHF versuscritical quality plot was created showing all the exper-imental CHF values falling within the pressure andmass flux ranges of (Pi−1 + Pi)/2 < Pexp < (Pi+1 + Pi)/2 and(Gj−1 + Gj)/2 < Gexp < (Gj+1 + Gj)/2 after normalization toPi and Gj and D = 8 mm. Data that did not obviously agreewith the bulk of the data and the previous CHF look-up tablewere labelled “outliers” and were excluded in the CHF look-up table derivation process. Fig. 1 shows an example of aslice. The same slice approach was used for the CHF versuspressure (P) and CHF versus mass flux (G) plots.
iv) Identification of duplicate data using the “slice” method (thesame data sets may have been reported by more than oneauthor).
v) Removal of data sets which display a significant scatter andgenerally disagree with the bulk of the data. These “bad”data sets may be due to “soft” inlet conditions, which cangive rise to flow instabilities or a poorly performed experi-ment (e.g., large uncertainties in instrumentation).
As can be seen from Table 1, a total of 8394 data points, rep-esenting 25% of the total number of CHF data available, wereonsidered unsuitable for use in the 2006 CHF look-up tableerivation and were removed through the screening process.
. Skeleton table
The derivation of the CHF look-up table requires a skeletonable to provide the initial estimate of the CHF look-up table
alues. The skeleton CHF values are used for evaluating thelopes of CHF versus P, G or X. The slopes are used for extrap-lating selected CHF measurement to the surrounding look-upable values of P, G and X as was described by Groeneveld et al.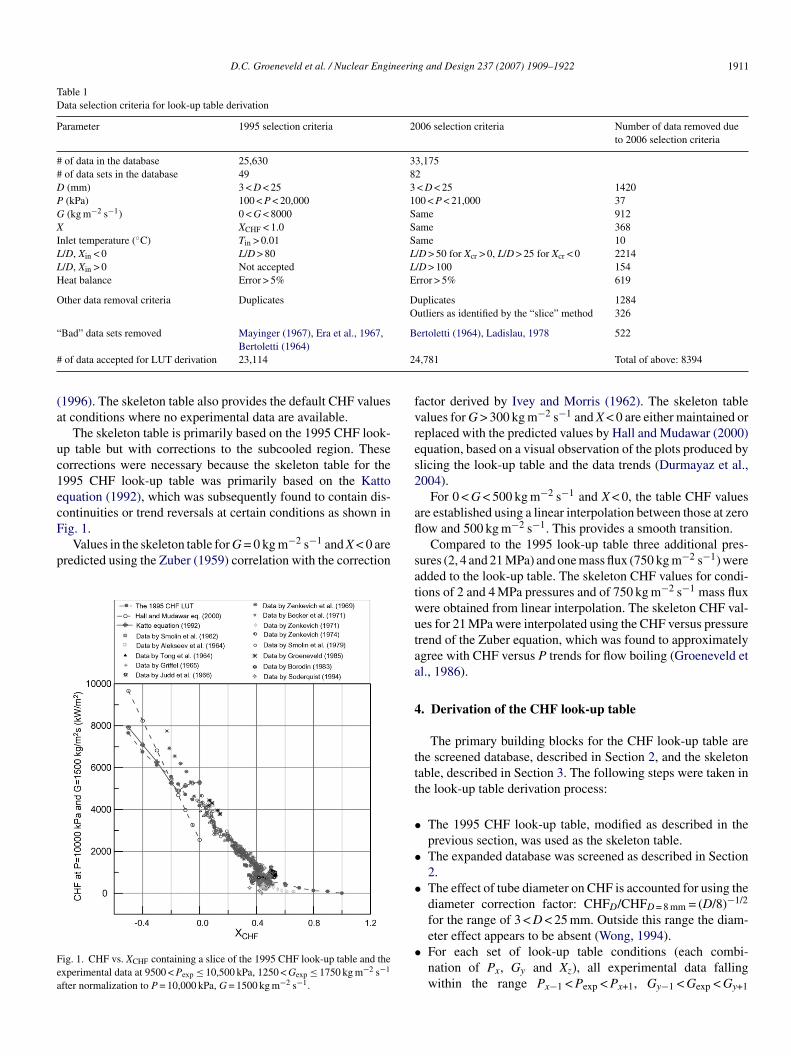
D.C. Groeneveld et al. / Nuclear Engineering and Design 237 (2007) 1909–1922 1911
Table 1Data selection criteria for look-up table derivation
Parameter 1995 selection criteria 2006 selection criteria Number of data removed dueto 2006 selection criteria
# of data in the database 25,630 33,175# of data sets in the database 49 82D (mm) 3 < D < 25 3 < D < 25 1420P (kPa) 100 < P < 20,000 100 < P < 21,000 37G (kg m−2 s−1) 0 < G < 8000 Same 912X XCHF < 1.0 Same 368Inlet temperature (◦C) Tin > 0.01 Same 10L/D, Xin < 0 L/D > 80 L/D > 50 for Xcr > 0, L/D > 25 for Xcr < 0 2214L/D, Xin > 0 Not accepted L/D > 100 154Heat balance Error > 5% Error > 5% 619
Other data removal criteria Duplicates Duplicates 1284Outliers as identified by the “slice” method 326
“ B
# 2
(a
uc1ecF
p
Fea
fvres2
a
Bad” data sets removed Mayinger (1967), Era et al., 1967,Bertoletti (1964)
of data accepted for LUT derivation 23,114
1996). The skeleton table also provides the default CHF valuest conditions where no experimental data are available.
The skeleton table is primarily based on the 1995 CHF look-p table but with corrections to the subcooled region. Theseorrections were necessary because the skeleton table for the995 CHF look-up table was primarily based on the Kattoquation (1992), which was subsequently found to contain dis-ontinuities or trend reversals at certain conditions as shown in
ig. 1.Values in the skeleton table for G = 0 kg m−2 s−1 and X < 0 areredicted using the Zuber (1959) correlation with the correction
ig. 1. CHF vs. XCHF containing a slice of the 1995 CHF look-up table and thexperimental data at 9500 < Pexp ≤ 10,500 kPa, 1250 < Gexp ≤ 1750 kg m−2 s−1
fter normalization to P = 10,000 kPa, G = 1500 kg m−2 s−1.
fl
satwutaa
4
ttt
•
•
•
•
ertoletti (1964), Ladislau, 1978 522
4,781 Total of above: 8394
actor derived by Ivey and Morris (1962). The skeleton tablealues for G > 300 kg m−2 s−1 and X < 0 are either maintained oreplaced with the predicted values by Hall and Mudawar (2000)quation, based on a visual observation of the plots produced bylicing the look-up table and the data trends (Durmayaz et al.,004).
For 0 < G < 500 kg m−2 s−1 and X < 0, the table CHF valuesre established using a linear interpolation between those at zeroow and 500 kg m−2 s−1. This provides a smooth transition.
Compared to the 1995 look-up table three additional pres-ures (2, 4 and 21 MPa) and one mass flux (750 kg m−2 s−1) weredded to the look-up table. The skeleton CHF values for condi-ions of 2 and 4 MPa pressures and of 750 kg m−2 s−1 mass fluxere obtained from linear interpolation. The skeleton CHF val-es for 21 MPa were interpolated using the CHF versus pressurerend of the Zuber equation, which was found to approximatelygree with CHF versus P trends for flow boiling (Groeneveld etl., 1986).
. Derivation of the CHF look-up table
The primary building blocks for the CHF look-up table arehe screened database, described in Section 2, and the skeletonable, described in Section 3. The following steps were taken inhe look-up table derivation process:
The 1995 CHF look-up table, modified as described in theprevious section, was used as the skeleton table.The expanded database was screened as described in Section2.The effect of tube diameter on CHF is accounted for using thediameter correction factor: CHFD/CHFD = 8 mm = (D/8)−1/2
for the range of 3 < D < 25 mm. Outside this range the diam-
eter effect appears to be absent (Wong, 1994).For each set of look-up table conditions (each combi-nation of Px, Gy and Xz), all experimental data fallingwithin the range Px−1 < Pexp < Px+1, Gy−1 < Gexp < Gy+1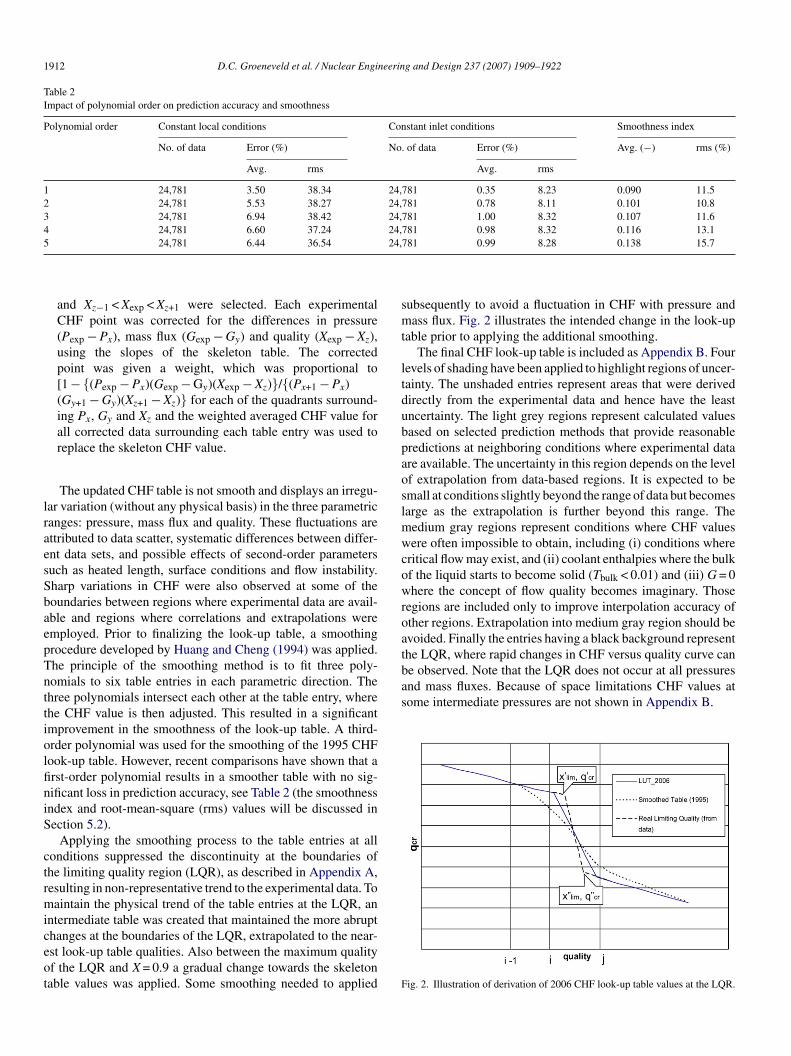
1912 D.C. Groeneveld et al. / Nuclear Engineering and Design 237 (2007) 1909–1922
Table 2Impact of polynomial order on prediction accuracy and smoothness
Polynomial order Constant local conditions Constant inlet conditions Smoothness index
No. of data Error (%) No. of data Error (%) Avg. (−) rms (%)
Avg. rms Avg. rms
1 24,781 3.50 38.34 24,781 0.35 8.23 0.090 11.52 24,781 5.53 38.27 24,781 0.78 8.11 0.101 10.83 24,781 6.94 38.42 24,781 1.00 8.32 0.107 11.64 24,781 6.60 37.24 24,781 0.98 8.32 0.116 13.15 24,
lraesSbaepTnttiolfiniS
ctrmiceot
smt
ltdubpaoslmwcowroatbe observed. Note that the LQR does not occur at all pressuresand mass fluxes. Because of space limitations CHF values atsome intermediate pressures are not shown in Appendix B.
24,781 6.44 36.54
and Xz−1 < Xexp < Xz+1 were selected. Each experimentalCHF point was corrected for the differences in pressure(Pexp − Px), mass flux (Gexp − Gy) and quality (Xexp − Xz),using the slopes of the skeleton table. The correctedpoint was given a weight, which was proportional to[1 − {(Pexp − Px)(Gexp − Gy)(Xexp − Xz)}/{(Px+1 − Px)(Gy+1 − Gy)(Xz+1 − Xz)} for each of the quadrants surround-ing Px, Gy and Xz and the weighted averaged CHF value forall corrected data surrounding each table entry was used toreplace the skeleton CHF value.
The updated CHF table is not smooth and displays an irregu-ar variation (without any physical basis) in the three parametricanges: pressure, mass flux and quality. These fluctuations arettributed to data scatter, systematic differences between differ-nt data sets, and possible effects of second-order parametersuch as heated length, surface conditions and flow instability.harp variations in CHF were also observed at some of theoundaries between regions where experimental data are avail-ble and regions where correlations and extrapolations weremployed. Prior to finalizing the look-up table, a smoothingrocedure developed by Huang and Cheng (1994) was applied.he principle of the smoothing method is to fit three poly-omials to six table entries in each parametric direction. Thehree polynomials intersect each other at the table entry, wherehe CHF value is then adjusted. This resulted in a significantmprovement in the smoothness of the look-up table. A third-rder polynomial was used for the smoothing of the 1995 CHFook-up table. However, recent comparisons have shown that arst-order polynomial results in a smoother table with no sig-ificant loss in prediction accuracy, see Table 2 (the smoothnessndex and root-mean-square (rms) values will be discussed inection 5.2).
Applying the smoothing process to the table entries at allonditions suppressed the discontinuity at the boundaries ofhe limiting quality region (LQR), as described in Appendix A,esulting in non-representative trend to the experimental data. Toaintain the physical trend of the table entries at the LQR, an
ntermediate table was created that maintained the more abrupt
hanges at the boundaries of the LQR, extrapolated to the near-st look-up table qualities. Also between the maximum qualityf the LQR and X = 0.9 a gradual change towards the skeletonable values was applied. Some smoothing needed to applied F781 0.99 8.28 0.138 15.7
ubsequently to avoid a fluctuation in CHF with pressure andass flux. Fig. 2 illustrates the intended change in the look-up
able prior to applying the additional smoothing.The final CHF look-up table is included as Appendix B. Four
evels of shading have been applied to highlight regions of uncer-ainty. The unshaded entries represent areas that were derivedirectly from the experimental data and hence have the leastncertainty. The light grey regions represent calculated valuesased on selected prediction methods that provide reasonableredictions at neighboring conditions where experimental datare available. The uncertainty in this region depends on the levelf extrapolation from data-based regions. It is expected to bemall at conditions slightly beyond the range of data but becomesarge as the extrapolation is further beyond this range. The
edium gray regions represent conditions where CHF valuesere often impossible to obtain, including (i) conditions where
ritical flow may exist, and (ii) coolant enthalpies where the bulkf the liquid starts to become solid (Tbulk < 0.01) and (iii) G = 0here the concept of flow quality becomes imaginary. Those
egions are included only to improve interpolation accuracy ofther regions. Extrapolation into medium gray region should bevoided. Finally the entries having a black background representhe LQR, where rapid changes in CHF versus quality curve can
ig. 2. Illustration of derivation of 2006 CHF look-up table values at the LQR.
neering and Design 237 (2007) 1909–1922 1913
5
5
o(cMmb
spCdGf
of
•
•
•
•
•
•
teo
Fd−
etDtat
frs1diTtss
db20
“ttd
tpshilTl
D.C. Groeneveld et al. / Nuclear Engi
. Look-up table prediction accuracy and smoothness
.1. Prediction accuracy
There are two methods for assessing the prediction accuracyf the CHF look-up table: (i) based on constant local conditionsi.e., constant critical quality), and (ii) based on constant inletonditions (i.e., constant inlet temperature or inlet enthalpy).ethod (i) is sometimes referred to as the direct substitutionethod (DSM), while method (ii) is also referred to as the heat
alance method (HBM).The CHF prediction based on constant local conditions is the
implest to apply. The predicted CHF for each experimental dataoint in question (Dexp, Pexp, Gexp, Xexp) is first found using theHF look-up table at local flow conditions for a tube of 8-mmiameter using direct interpolation between matrix values of P,, and X. Next, the CHF is corrected for the diameter effect as
ollows:
CHF(Dexp, Pexp, Gexp, Xexp)
= CHF(D = 8, Pexp, Gexp, Xexp)
(Dexp
8
)−1/2
(5.1)
The CHF prediction based on constant inlet conditions isbtained via iteration with the heat-balance equation using theollowing steps:
Estimate the heat flux (if unsure how to make an estimate,assume CHF = 500 kW m−2)Calculate the quality based on the estimated heat flux, massflux and inlet subcooling:
X = H − Hf(Pexp)
Hfg(Pexp)
= 4qest
GexpHfg(Pexp)
Lh,exp
Dexp− �Hin,exp(Tin,exp)
Hfg(Pexp)(5.2)
Note that the quality as defined above is the thermodynamicquality, which will be negative for subcooled conditions.The first estimate of CHF is calculated from the CHF look-up table at local flow conditions (D = 8 mm, Pexp, Gexp, X)corrected for diameter
qpred(Dexp, Pexp, Gexp, X)
= CHF(8, Pexp, Gexp, X)
(Dexp
8
)−1/2
(5.3)
Re-evaluate the quality using the average of the predictedvalue and the previous heat flux value, and again find theCHF.Continue this iteration process until the heat flux value startsconverging to a single value.
The prediction errors are calculated for each data point fromhe database. The mean (arithmetic average) and rms errors arevaluated for data subsets and for the complete database basedn either constant local quality and constant inlet condition. The
sfd5
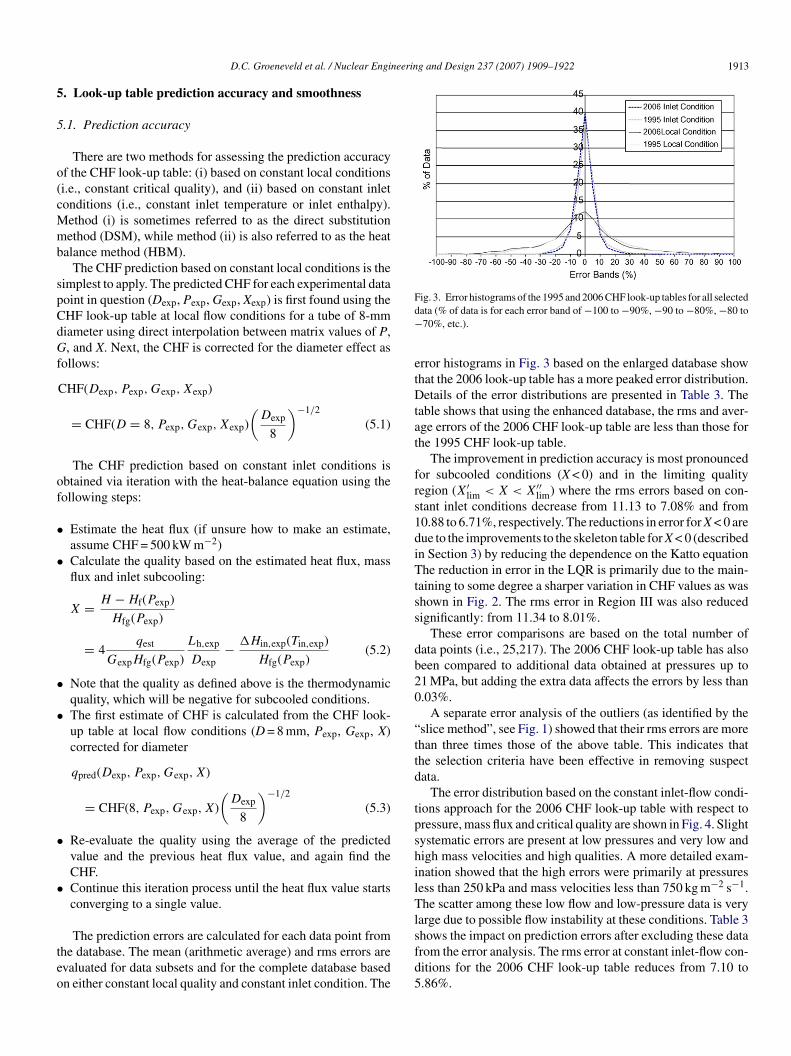
ig. 3. Error histograms of the 1995 and 2006 CHF look-up tables for all selectedata (% of data is for each error band of −100 to −90%, −90 to −80%, −80 to70%, etc.).
rror histograms in Fig. 3 based on the enlarged database showhat the 2006 look-up table has a more peaked error distribution.etails of the error distributions are presented in Table 3. The
able shows that using the enhanced database, the rms and aver-ge errors of the 2006 CHF look-up table are less than those forhe 1995 CHF look-up table.
The improvement in prediction accuracy is most pronouncedor subcooled conditions (X < 0) and in the limiting qualityegion (X′
lim < X < X′′lim) where the rms errors based on con-
tant inlet conditions decrease from 11.13 to 7.08% and from0.88 to 6.71%, respectively. The reductions in error for X < 0 areue to the improvements to the skeleton table for X < 0 (describedn Section 3) by reducing the dependence on the Katto equationhe reduction in error in the LQR is primarily due to the main-
aining to some degree a sharper variation in CHF values as washown in Fig. 2. The rms error in Region III was also reducedignificantly: from 11.34 to 8.01%.
These error comparisons are based on the total number ofata points (i.e., 25,217). The 2006 CHF look-up table has alsoeen compared to additional data obtained at pressures up to1 MPa, but adding the extra data affects the errors by less than.03%.
A separate error analysis of the outliers (as identified by theslice method”, see Fig. 1) showed that their rms errors are morehan three times those of the above table. This indicates thathe selection criteria have been effective in removing suspectata.
The error distribution based on the constant inlet-flow condi-ions approach for the 2006 CHF look-up table with respect toressure, mass flux and critical quality are shown in Fig. 4. Slightystematic errors are present at low pressures and very low andigh mass velocities and high qualities. A more detailed exam-nation showed that the high errors were primarily at pressuresess than 250 kPa and mass velocities less than 750 kg m−2 s−1.he scatter among these low flow and low-pressure data is very
arge due to possible flow instability at these conditions. Table 3
hows the impact on prediction errors after excluding these datarom the error analysis. The rms error at constant inlet-flow con-itions for the 2006 CHF look-up table reduces from 7.10 to.86%.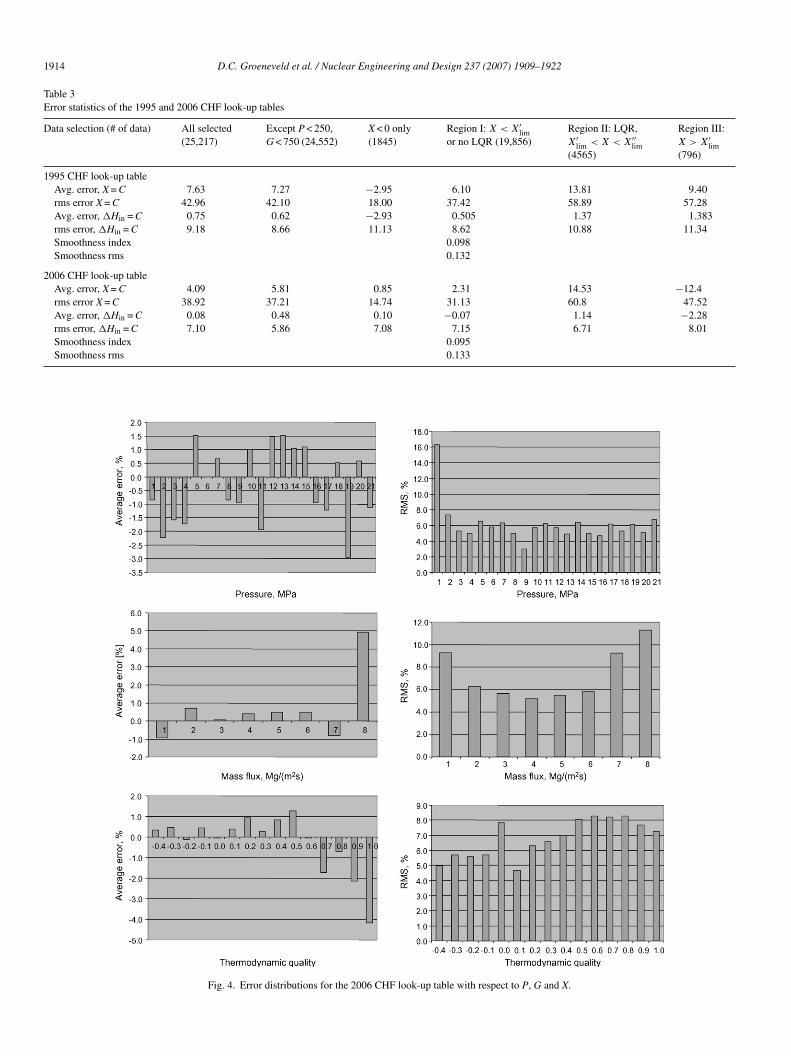
1914 D.C. Groeneveld et al. / Nuclear Engineering and Design 237 (2007) 1909–1922
Table 3Error statistics of the 1995 and 2006 CHF look-up tables
Data selection (# of data) All selected(25,217)
Except P < 250,G < 750 (24,552)
X < 0 only(1845)
Region I: X < X′lim
or no LQR (19,856)Region II: LQR,X′
lim < X < X′′lim
(4565)
Region III:X > X′
lim(796)
1995 CHF look-up tableAvg. error, X = C 7.63 7.27 −2.95 6.10 13.81 9.40rms error X = C 42.96 42.10 18.00 37.42 58.89 57.28Avg. error, �Hin = C 0.75 0.62 −2.93 0.505 1.37 1.383rms error, �Hin = C 9.18 8.66 11.13 8.62 10.88 11.34Smoothness index 0.098Smoothness rms 0.132
2006 CHF look-up tableAvg. error, X = C 4.09 5.81 0.85 2.31 14.53 −12.4rms error X = C 38.92 37.21 14.74 31.13 60.8 47.52Avg. error, �Hin = C 0.08 0.48 0.10 −0.07 1.14 −2.28rms error, �Hin = C 7.10 5.86 7.08 7.15 6.71 8.01Smoothness index 0.095Smoothness rms 0.133
Fig. 4. Error distributions for the 2006 CHF look-up table with respect to P, G and X.
D.C. Groeneveld et al. / Nuclear Engineering and Design 237 (2007) 1909–1922 1915
nd th
5
Cs2odjta
Gith.
top
wbaes
Ω
r
smoothness for the 2006 CHF look-up table are improved com-pared to the corresponding values for the 1995 CHF look-uptable.
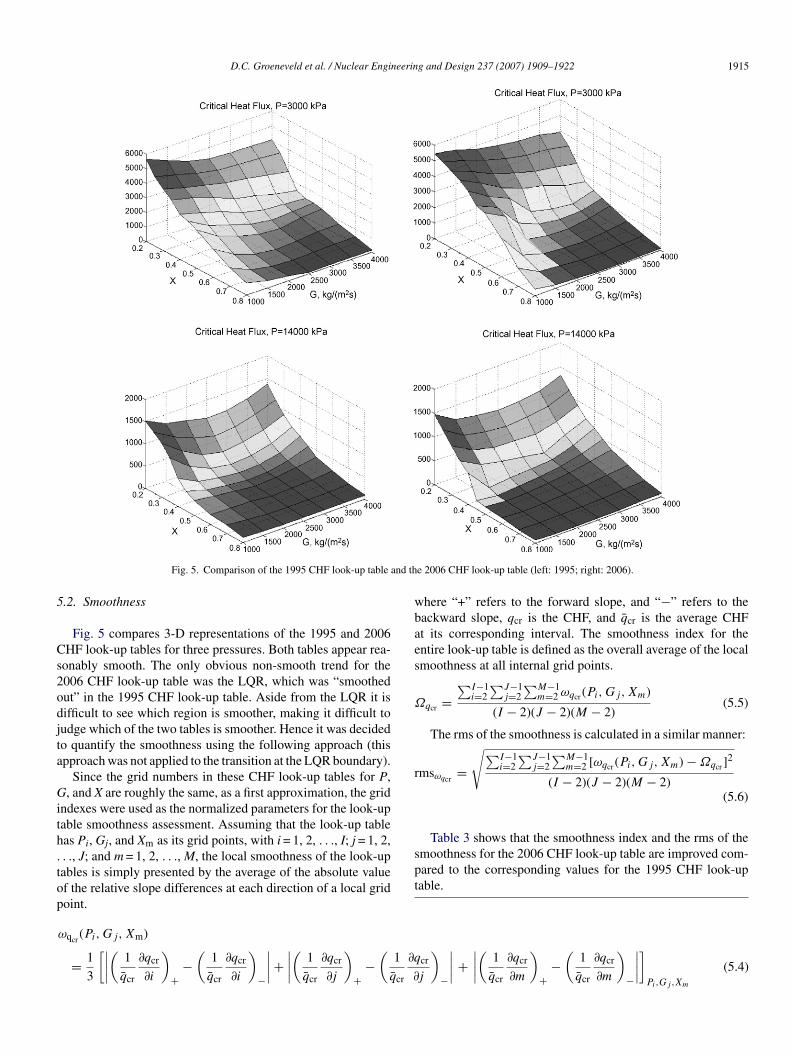
Fig. 5. Comparison of the 1995 CHF look-up table a
.2. Smoothness
Fig. 5 compares 3-D representations of the 1995 and 2006HF look-up tables for three pressures. Both tables appear rea-
onably smooth. The only obvious non-smooth trend for the006 CHF look-up table was the LQR, which was “smoothedut” in the 1995 CHF look-up table. Aside from the LQR it isifficult to see which region is smoother, making it difficult toudge which of the two tables is smoother. Hence it was decidedo quantify the smoothness using the following approach (thispproach was not applied to the transition at the LQR boundary).
Since the grid numbers in these CHF look-up tables for P,, and X are roughly the same, as a first approximation, the grid
ndexes were used as the normalized parameters for the look-upable smoothness assessment. Assuming that the look-up tableas Pi, Gj, and Xm as its grid points, with i = 1, 2, . . ., I; j = 1, 2,. ., J; and m = 1, 2, . . ., M, the local smoothness of the look-upables is simply presented by the average of the absolute valuef the relative slope differences at each direction of a local gridoint.
ωqcr(Pi, Gj, Xm)
= 1
3
[∣∣∣∣(
1
qcr
∂qcr
∂i
)+
−(
1
qcr
∂qcr
∂i
)−
∣∣∣∣ +∣∣∣∣(
1
qcr
∂qcr
∂j
)+
−(
1
qcr
∂q
∂
e 2006 CHF look-up table (left: 1995; right: 2006).
here “+” refers to the forward slope, and “−” refers to theackward slope, qcr is the CHF, and qcr is the average CHFt its corresponding interval. The smoothness index for thentire look-up table is defined as the overall average of the localmoothness at all internal grid points.
qcr =∑I−1
i=2∑J−1
j=2∑M−1
m=2 ωqcr (Pi, Gj, Xm)
(I − 2)(J − 2)(M − 2)(5.5)
The rms of the smoothness is calculated in a similar manner:
msωqcr=
√∑I−1i=2
∑J−1j=2
∑M−1m=2 [ωqcr (Pi, Gj, Xm) − Ωqcr ]
2
(I − 2)(J − 2)(M − 2)(5.6)
Table 3 shows that the smoothness index and the rms of the
cr
j
)−
∣∣∣∣ +∣∣∣∣(
1
qcr
∂qcr
∂m
)+
−(
1
qcr
∂qcr
∂m
)−
∣∣∣∣]
Pi,Gj,Xm
(5.4)
1 neering and Design 237 (2007) 1909–1922
6
tc
se
oaltaiTr
dilr
A
CoA
A
aLTavT
tmmiflbfrteiC
LbUmpw
916 D.C. Groeneveld et al. / Nuclear Engi
. Conclusions and final remarks
The tube CHF database has been expanded since the deriva-ion of the 1995 CHF look-up table with 33 additional data setsontaining 7545 new data points.
The screening process of the CHF data has been enhancedignificantly resulting in a larger fraction (∼25%) of data beingxcluded from the table development.
The 2006 CHF look-up table is a significant improvementver the 1995 CHF look-up table; the rms errors were reducednd the smoothness of the look-up table was improved. Theargest improvements in prediction accuracy was obtained inhe subcooled CHF region where local subcooling trend nowgrees better with the Hall–Mudawar equation, and in the lim-ting quality region where the smoothing has been removed.he rms errors decreased by approximately 4% in these
egions.Despite the large number of CHF studies performed in
irectly heated tubes during the past 50 years, significant gapsn the data remain, where CHF predictions are based on extrapo-ation and models predictions. Additional CHF experiments areequired to fill these gaps.
cknowledgements
The financial assistance for the development of the new 2006HF look-up table was provided by NSERC. The developmentf previous versions of the CHF look-up table was supported byECL, ANSL, EPRI, CEA and the IAEA.
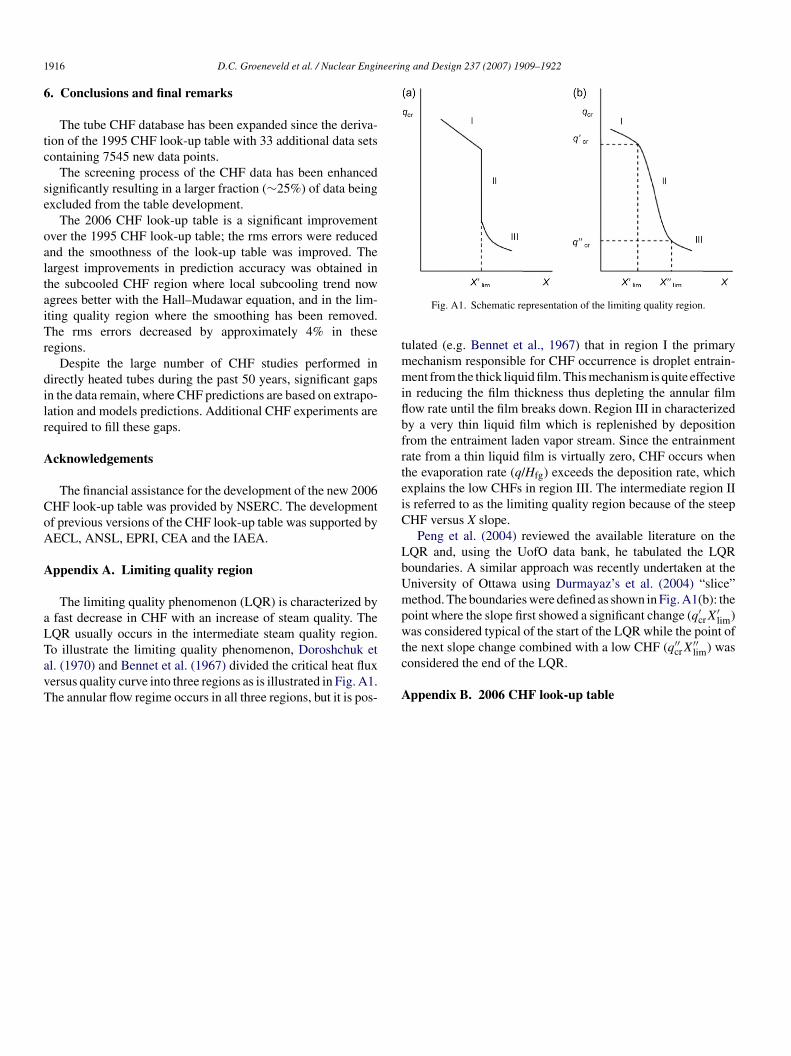
ppendix A. Limiting quality region
The limiting quality phenomenon (LQR) is characterized byfast decrease in CHF with an increase of steam quality. TheQR usually occurs in the intermediate steam quality region.
o illustrate the limiting quality phenomenon, Doroshchuk etl. (1970) and Bennet et al. (1967) divided the critical heat fluxersus quality curve into three regions as is illustrated in Fig. A1.he annular flow regime occurs in all three regions, but it is pos-tc
A
Fig. A1. Schematic representation of the limiting quality region.
ulated (e.g. Bennet et al., 1967) that in region I the primaryechanism responsible for CHF occurrence is droplet entrain-ent from the thick liquid film. This mechanism is quite effective
n reducing the film thickness thus depleting the annular filmow rate until the film breaks down. Region III in characterizedy a very thin liquid film which is replenished by depositionrom the entraiment laden vapor stream. Since the entrainmentate from a thin liquid film is virtually zero, CHF occurs whenhe evaporation rate (q/Hfg) exceeds the deposition rate, whichxplains the low CHFs in region III. The intermediate region IIs referred to as the limiting quality region because of the steepHF versus X slope.
Peng et al. (2004) reviewed the available literature on theQR and, using the UofO data bank, he tabulated the LQRoundaries. A similar approach was recently undertaken at theniversity of Ottawa using Durmayaz’s et al. (2004) “slice”ethod. The boundaries were defined as shown in Fig. A1(b): the
oint where the slope first showed a significant change (q′crX
′lim)
as considered typical of the start of the LQR while the point ofhe next slope change combined with a low CHF (q′′
crX′′lim) was
onsidered the end of the LQR.
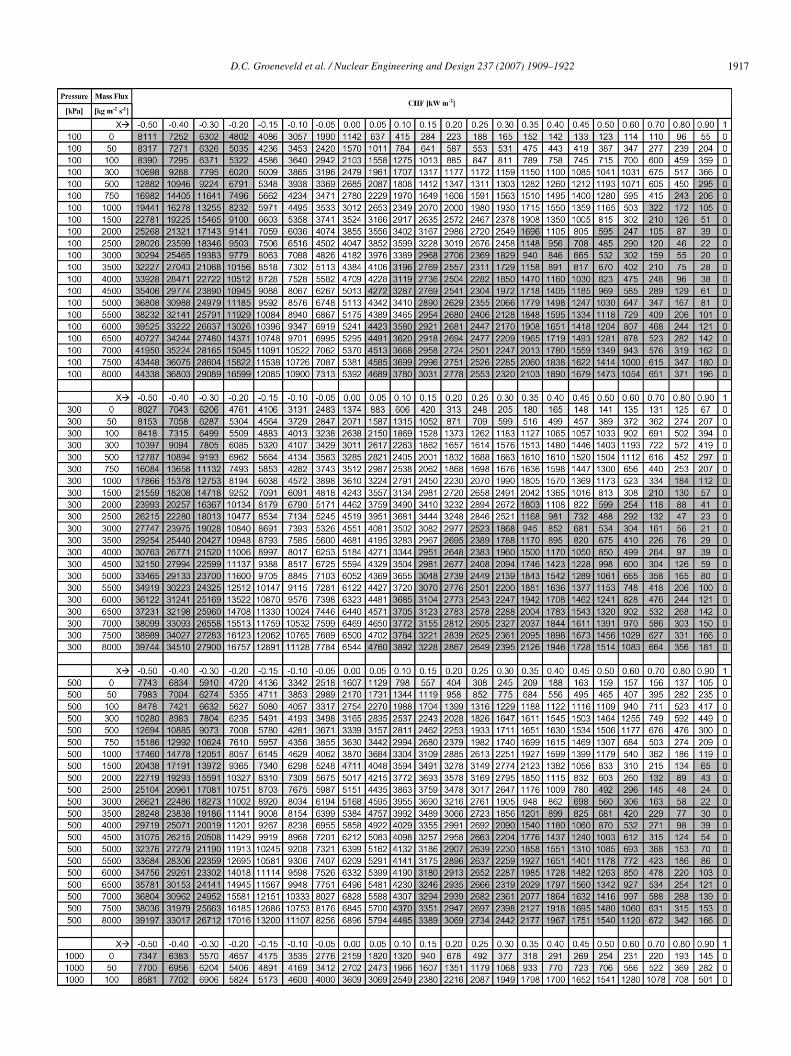
ppendix B. 2006 CHF look-up table
neering and Design 237 (2007) 1909–1922 1917
D.C. Groeneveld et al. / Nuclear Engi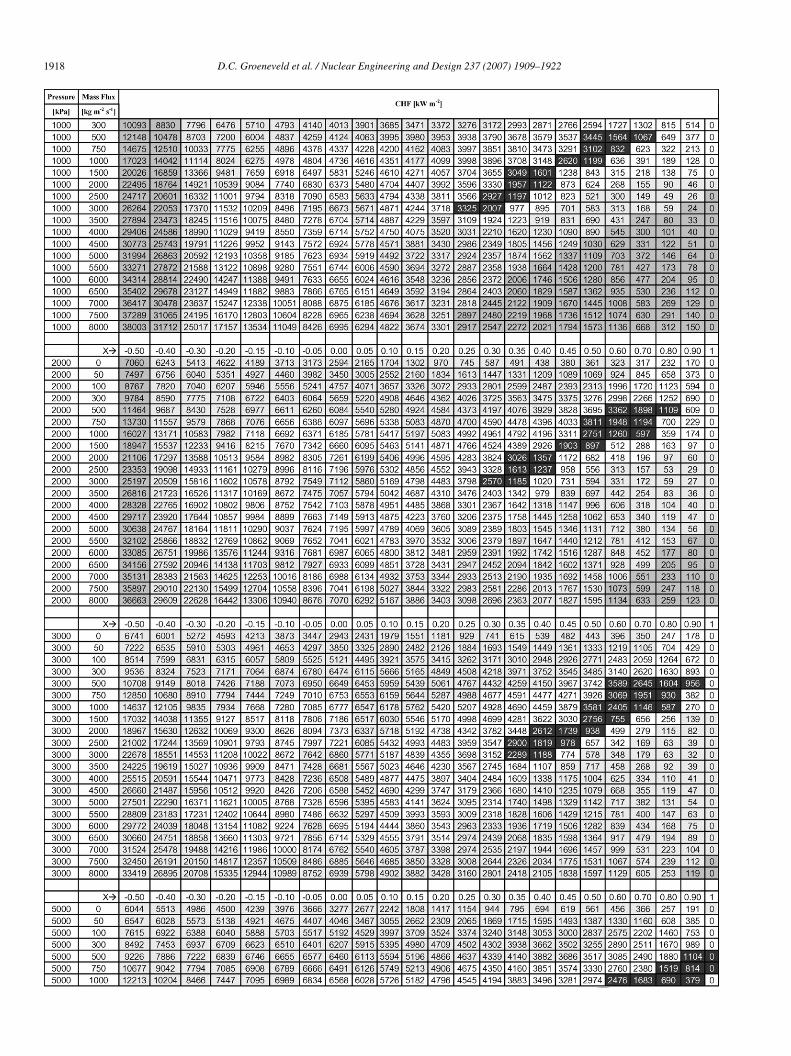
1 neering and Design 237 (2007) 1909–1922
918 D.C. Groeneveld et al. / Nuclear Engi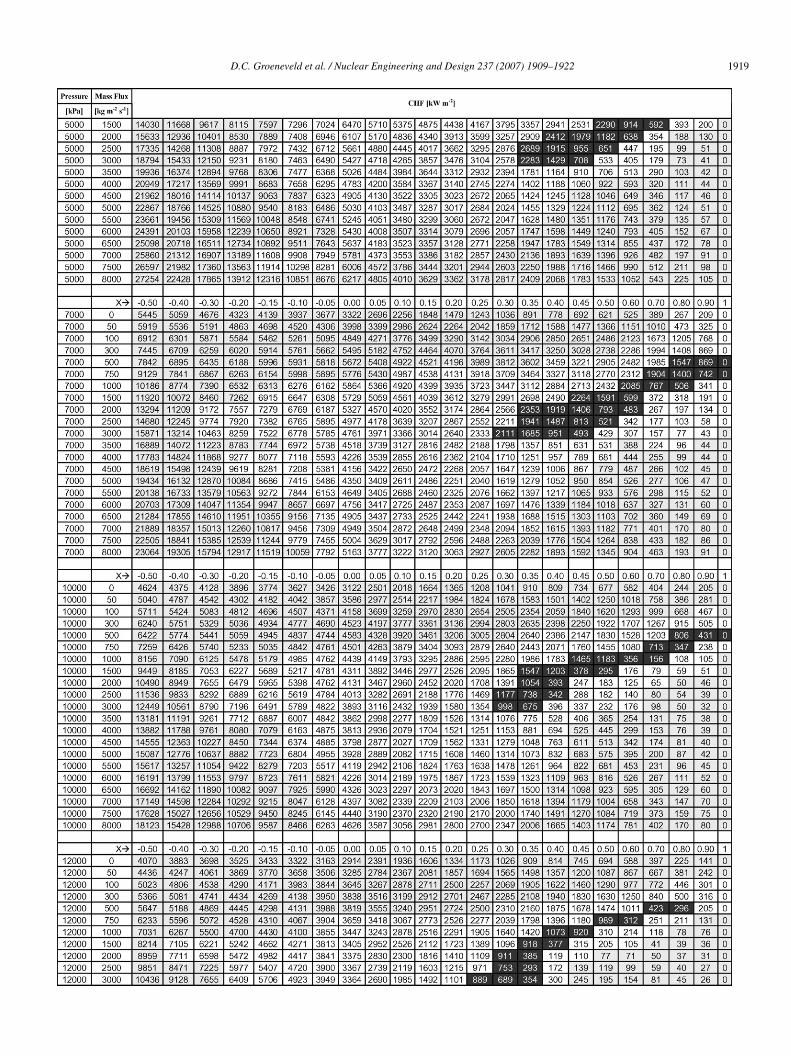
neering and Design 237 (2007) 1909–1922 1919
D.C. Groeneveld et al. / Nuclear Engi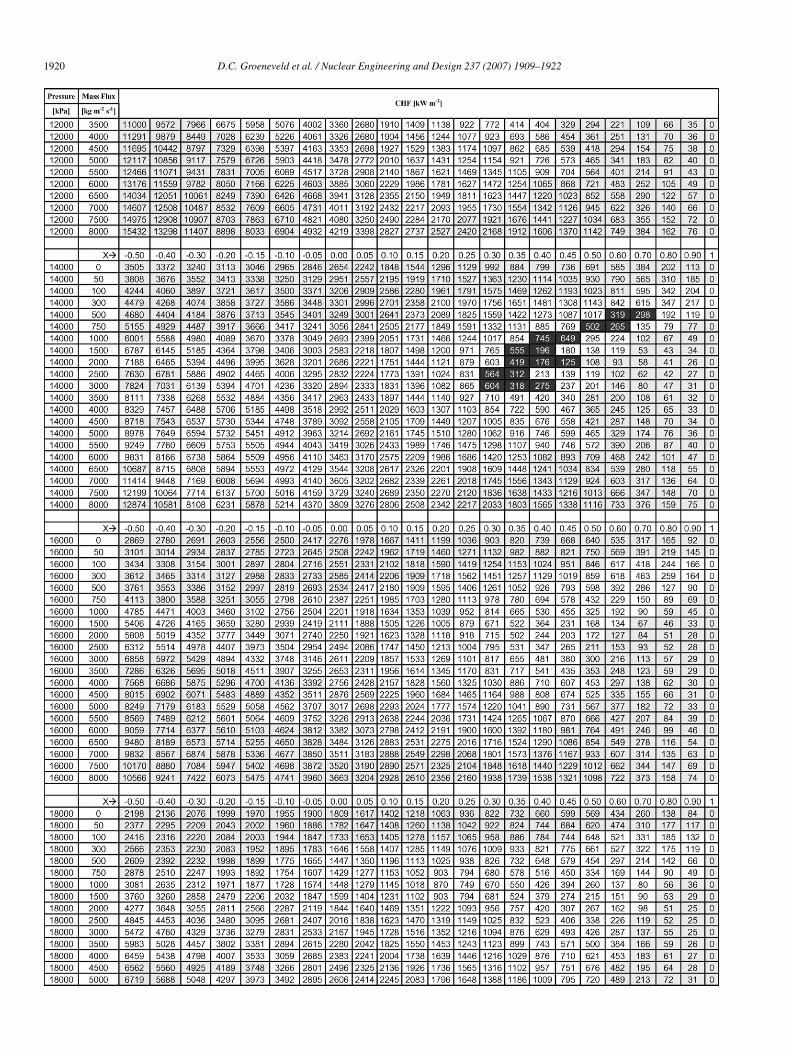
1 neering and Design 237 (2007) 1909–1922
920 D.C. Groeneveld et al. / Nuclear Engi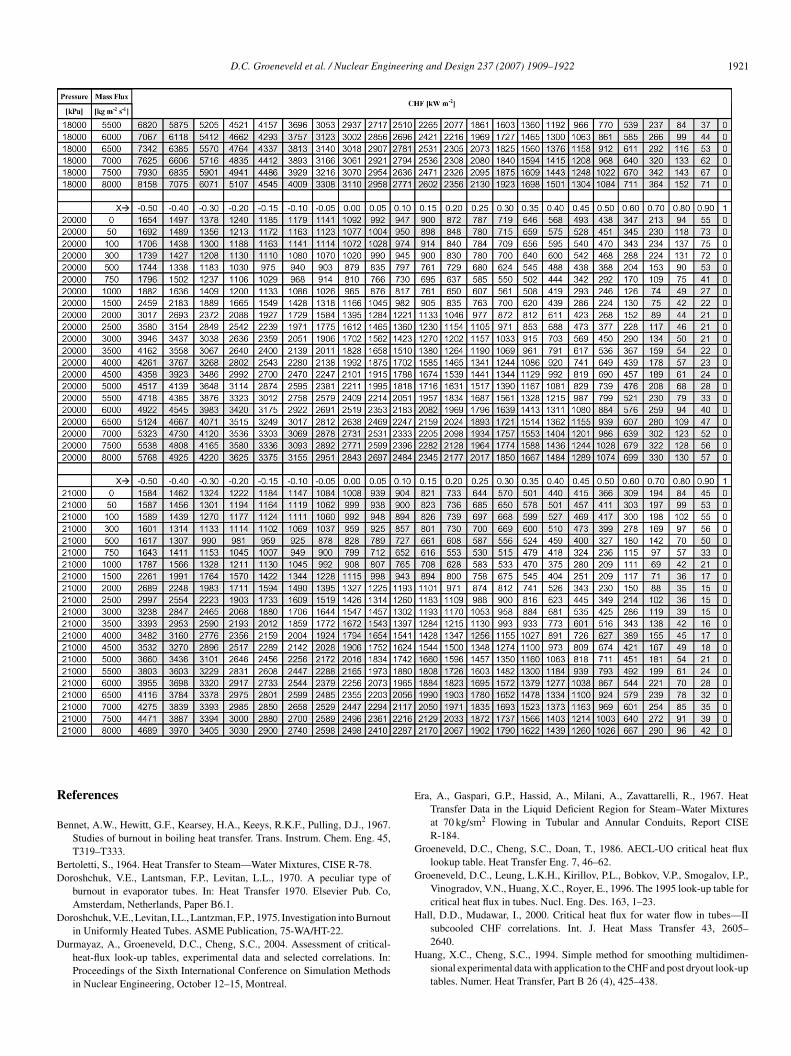
neerin
R
B
BD
D
D
E
G
G
H
D.C. Groeneveld et al. / Nuclear Engi
eferences
ennet, A.W., Hewitt, G.F., Kearsey, H.A., Keeys, R.K.F., Pulling, D.J., 1967.Studies of burnout in boiling heat transfer. Trans. Instrum. Chem. Eng. 45,T319–T333.
ertoletti, S., 1964. Heat Transfer to Steam—Water Mixtures, CISE R-78.oroshchuk, V.E., Lantsman, F.P., Levitan, L.L., 1970. A peculiar type of
burnout in evaporator tubes. In: Heat Transfer 1970. Elsevier Pub. Co,Amsterdam, Netherlands, Paper B6.1.
oroshchuk, V.E., Levitan, I.L., Lantzman, F.P., 1975. Investigation into Burnout
in Uniformly Heated Tubes. ASME Publication, 75-WA/HT-22.urmayaz, A., Groeneveld, D.C., Cheng, S.C., 2004. Assessment of critical-heat-flux look-up tables, experimental data and selected correlations. In:Proceedings of the Sixth International Conference on Simulation Methodsin Nuclear Engineering, October 12–15, Montreal.
H
g and Design 237 (2007) 1909–1922 1921
ra, A., Gaspari, G.P., Hassid, A., Milani, A., Zavattarelli, R., 1967. HeatTransfer Data in the Liquid Deficient Region for Steam–Water Mixturesat 70 kg/sm2 Flowing in Tubular and Annular Conduits, Report CISER-184.
roeneveld, D.C., Cheng, S.C., Doan, T., 1986. AECL-UO critical heat fluxlookup table. Heat Transfer Eng. 7, 46–62.
roeneveld, D.C., Leung, L.K.H., Kirillov, P.L., Bobkov, V.P., Smogalov, I.P.,Vinogradov, V.N., Huang, X.C., Royer, E., 1996. The 1995 look-up table forcritical heat flux in tubes. Nucl. Eng. Des. 163, 1–23.
all, D.D., Mudawar, I., 2000. Critical heat flux for water flow in tubes—IIsubcooled CHF correlations. Int. J. Heat Mass Transfer 43, 2605–
2640.uang, X.C., Cheng, S.C., 1994. Simple method for smoothing multidimen-sional experimental data with application to the CHF and post dryout look-uptables. Numer. Heat Transfer, Part B 26 (4), 425–438.

1 neerin
I
K
L
M
P
922 D.C. Groeneveld et al. / Nuclear Engi
vey, H.J., Morris, D.J., 1962. On the Relevance of the Vapour–Liquid–ExchangeMechanism for Subcooled Boiling Heat Transfer at High Pressures, AEEW-R-137.
atto, Y., 1992. A prediction model of subcooled water flow boiling CHFfor pressure in the range 0.1–20 MPa. Int. J. Heat Mass Transfer 35 (5),
1115–1123.adislau, L., 1978. The influence of pressure on critical heat flux at mediumdiameter (4 mm). In: Teplofizicheskie Issledovanija dlja ObespechenijaNadyozhnosti I Bezopasnosti Jadernyikh Reaktorov Vodo-Vodyanogo Tipa.Institute of Power Nuclear Reactors, Bucharest, Romania.
W
Z
g and Design 237 (2007) 1909–1922
ayinger F., 1967. Investigations into the Critical Heat Flux in Boiling Water,EUR-3347.
eng, S.W., Groeneveld, D.C., Liu, W., Cheng, S.C., 2004. Flow boiling CHF andlimiting quality phenomenon in tubes. In: Proceedings of 2004 Annual Con-ference of Multiphase Flow, Chinese Society of Engineering Thermophysics,
October 23–26, Shanghai, PR China, pp. 35–40.ong, W., 1994. Effect of diameter on the critical heat flux. M.A. Sc. thesis.Department of Mechanical Engineering, University of Ottawa.
uber, N., 1959. Hydrodynamic Aspects of Boiling Heat Transfer, AtomicEnergy Commission Report AECU-4439.