Embed Size (px)
Citation preview
Dear Educator:
The 2006 Census Teacher’s Kit has been developed for use in elementary, intermediate, and secondary classes across the country. All activities are classroom-ready and have been tested to meet curriculum requirements.
The eight activities are appropriate for many subjects including Language Arts, Economics, Mathematics, Art, Social Studies, Geography, History, Family Studies, Theatre Arts, Science and ESL.
A census colouring book and a game placemat are included for young students. You may order extra copies for your students. A separate ABE/Literacy Kit is also available.
If you have any questions or comments about the Teacher’s Kit, please contact:
Census Communications Statistics Canada Ground Floor C-7 Jean Talon Building Ottawa, Ontario K1A 0T6 Fax: (613) 951-0930 E-mail: [email protected]
The 2006 Census Teacher’s Kit is also available on the 2006 Census Web site at www.census2006.ca.
Thank you for your help in spreading the census message to your students.
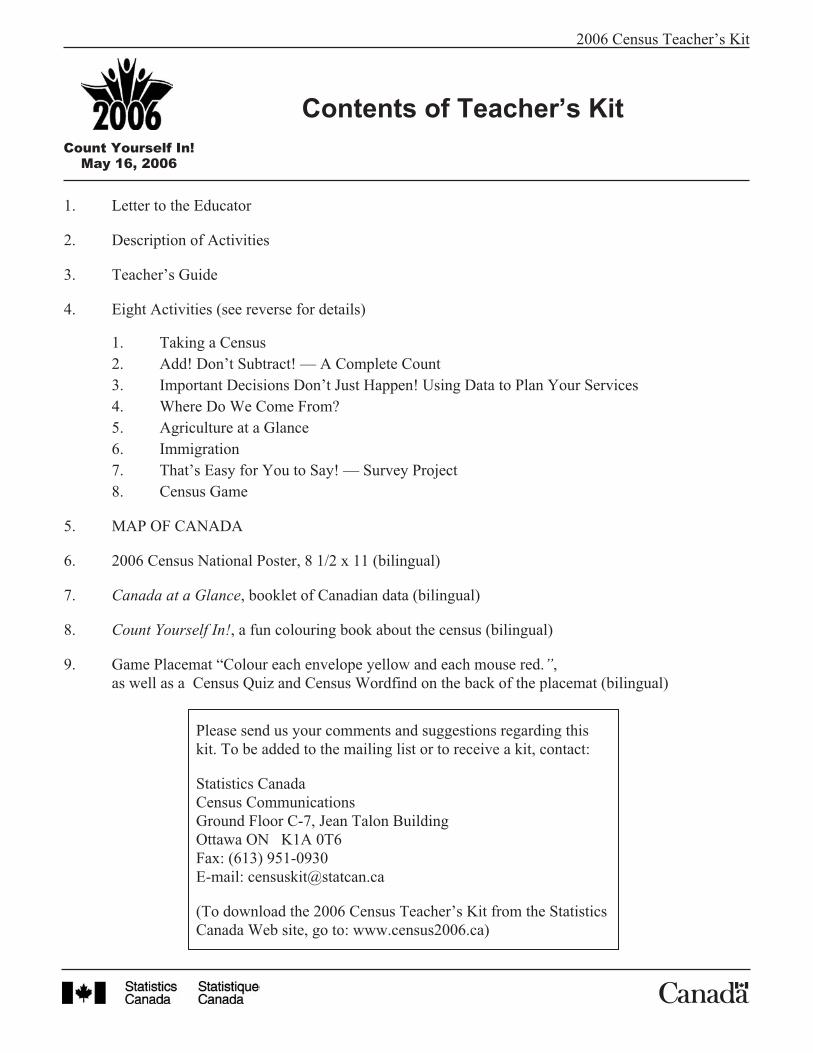
Contents of Teacher’s Kit
1. Letter to the Educator
2. Description of Activities
3. Teacher’s Guide
4. Eight Activities (see reverse for details)
1. Taking a Census
2. Add! Don’t Subtract! — A Complete Count
3. Important Decisions Don’t Just Happen! Using Data to Plan Your Services
4. Where Do We Come From?
5. Agriculture at a Glance
6. Immigration
7. That’s Easy for You to Say! — Survey Project
8. Census Game
5. MAP OF CANADA
6. 2006 Census National Poster, 8 1/2 x 11 (bilingual)
7. Canada at a Glance, booklet of Canadian data (bilingual)
8. Count Yourself In!, a fun colouring book about the census (bilingual)
9. Game Placemat “Colour each envelope yellow and each mouse red.”,
as well as a Census Quiz and Census Wordfind on the back of the placemat (bilingual)
2006 Census Teacher’s Kit
Please send us your comments and suggestions regarding this
kit. To be added to the mailing list or to receive a kit, contact:
Statistics Canada
Census Communications
Ground Floor C-7, Jean Talon Building
Ottawa ON K1A 0T6
Fax: (613) 951-0930
E-mail: [email protected]
(To download the 2006 Census Teacher’s Kit from the Statistics
Canada Web site, go to: www.census2006.ca)
Count Yourself In!May 16, 2006
2 Description of Activities
ACTIVITY SUGGESTED
GRADE, # OF
CLASSES
SUGGESTED
SUBJECTS
DESCRIPTION
1. Taking a Census Elementary1 class
Art, Mathematics,Social Studies,Language Arts
Students learn what the census is and conducta census of their own by counting the peoplein their homes and class.
2. Add! Don’t Subtract!– A Complete Count
Elementary2 classes
Geography,Social StudiesMathematics
Students learn the concepts of complete countand undercount, interpret a map, summarizedata, and make decisions.
3. Important DecisionsDon’t Just Happen!Using Data to PlanYour Services
Intermediate1-2 classes
Social Studies,Mathematics,Geography
Students gain hands-on experience usingcensus-like data as a basis for decisions aboutcommunity services and businesses.
4. Where Do We ComeFrom?
Intermediate,
Intermediate ESL1-2 classes
ESL, Geography,Social Studies,Language Arts
Students learn about the places of birth ofimmigrants to Canada, and how thisinformation is gathered through a census.Students gain an understanding of themulticultural nature of Canadian society byexamining the cultural diversity presentwithin their classroom.
5. Agriculture at aGlance
Elementary
(5A, C),Intermediate
(5A, B, C),Secondary
(5A, B)1/4- 2 classes
Theatre Arts,Mathematics,Language Arts,Geography,Science, History,Economics,Family Studies
Students learn about agriculture, Canada’smost important primary industry and examinethe trends identified by the Census ofAgriculture, and work on 1 or all of theactivities: 5A: students create a play in whichthey assume the roles of a farm in transition;5B: students measure and compare the size oftheir classroom or school to the size of theaverage Canadian farm; 5C: students makethe link between Canadian grains and ethnichomemade breads in a short matching game.
6. Immigration Intermediate,
Intermediate ESL1-2 classes
Mathematics,Geography,History,Family Studies,Language Arts,Social Studies
Students develop an awareness andappreciation of the multicultural nature ofCanadian society. Students complete a seriesof graphs showing Canada’s immigrationpatterns over time. They carry out a smallsurvey by making up a class profile, andreview the language questions from the2006 Census questionnaire.
7. That’s Easy for Youto Say! — SurveyProject
SecondaryLong project:8-10 classesShort project:2-3 classes
Social Studies,Mathematics,Data Management
Students study the process of designing,conducting and reporting a survey. They havethe option of carrying out a survey Project.
8. Census Game Secondary1 class
Geography,Economics,Social Studies,History
Students participate in a game designed tohelp them understand the range ofdemographic, social and economicinformation provided by the census.
Description of Activities 2006 Census Teacher’s Kit
2006 CENSUS TEACHER’S KIT
Teacher’s Guide

Teacher’s Guide
Introduction
This guide contains useful information for both
teachers and students. Pages three and four are
specific to the teacher, while the following pages
contain background information on the Census of
Population, the Census of Agriculture, and Census
Vocabulary (pp. 9-12), that will be helpful to both
students and teachers. There is also a set of Quick
Census Facts (pp. 13-14).
Teacher-ready activities have been divided into
three suggested grade levels: elementary,
intermediate, and secondary. Some activities have
classroom extensions to enrich students’
comprehension.
Objectives
1. Create awareness and understanding about the
importance of the census and the information it
will provide.
2. Increase awareness among teachers and
students about census information as a
valuable tool for student and teacher research
projects.
Enrichment
In addition to the enrichment exercises in each
activity, here are some additional ideas:
1. Send the message home.
The 2006 Census logo with its slogan “Count
Yourself In!” appears on the back of this
guide. The logo is a drawing of three people
with the year of the census in front of them —
2006. This image reflects how important
people are to the census. Quick Census Facts
and the Census logo can be reproduced and
sent home with students to help spread the
census message.
2. Get students involved.
Motivate students to actively participate in the
census by having them generate community
awareness projects. Ask them for their ideas on
what they can do to make area residents aware
of the upcoming census.
A variety of school communications vehicles
could be used to generate awareness among the
student body: announcements on the public
address system, posters in gymnasiums and
school buses, messages on the school’s cable
TV or radio station, displays on classroom
bulletin boards, census stories in the school
newspaper, and announcements on the
school’s Web site.
3. Take a look at the 1911 Census of Canada
(Elementary level)
Students can examine a few pages from the
1911 Census of Canada. (Print pages from
www.collectionscanada.ca/archivianet/1911.)
Students could be led in a class discussion
about the types of information that are found
and what that information may tell them about
the people who are listed. For example,
students can take a look at the size of families,
the age of parents when they had their first
child, what occupations people had and who
they worked for, how old the children were
who worked, how many children went to
school, how many people could read and write,
etc.
4. Research the changes in population in your
community (Intermediate/Secondary levels)
Students can research a street in their
community using the 1911 Census of Canada
Teacher’s Guide 3
2006 Census Teacher’s Kit
Count Yourself In!May 16, 2006
and compare it with what they would find on
the same street today. If the community did not
exist in 1911, students can select a near-by
community that is listed in the 1911 Census.
(Students can print the relevant pages from
www.collectionscanada.ca/archivianet/1911.)
By examining the data contained in the census
pages, students can create a snapshot of the
way life was in 1911. What were the people
like who lived in the students’ chosen area?
How are the people listed similar to the people
who live there today? How do they differ?
(Students can compare a wide range of
interesting factors, such as the number of
households, the number and ages of the people
who live there, their occupations and
employer, where they were born, the language
they spoke, etc.)
5. Research family history (Secondary level)
Working in groups, students can research
various ancestors of members of the class.
Only ancestors who were living in Canada in
1911 should be chosen. Each group should
select several names to search, as some names
may not be found in the census records. Those
without ancestors living in Canada in 1911 can
“adopt” a classmate’s ancestor to research. To
search the 1911 Census of Canada online at
www.collectionscanada.ca/archivianet/1911,
students will need to know where in Canada
(town, city, etc.) an ancestor was living in
1911. Once students have located an ancestor,
they will be able to check the census record to
find such interesting information as: other
family members and their ages, occupations,
employers, religion, place of birth, whether
they could read and write, etc. Each group
could compile this information in a brief report
for a family history. Students may wish to find
additional information by checking other
genealogical sources such as passenger lists,
military records, immigration records, etc. A
good place to continue the search is the
Canadian Genealogy Centre
(www.lac-bac.ca/genealogy) under
“Databases”.
When Should I Use the Teacher’sKit?
Allow yourself time to prepare for the project you
undertake. The best time to conduct these
activities is in early May 2006. This will coincide
with Statistics Canada’s national, provincial and
local census awareness campaigns, and with the
delivery of the census questionnaire to every
household in Canada. (However, after Census
Day, May 16, 2006, people still have time to
respond to the census.) Send the message: It’s not
too late.
The Census of Canada
The Census of Population
Every five years Statistics Canada takes a Census
of Population. The last Census Day was on May
15, 2001; the next one will be May 16, 2006. The
census provides a comprehensive collection of
data about people in Canada. For example, people
are asked questions about their age, sex, marital
status, education, employment, income, ethnic
origin, language, and other subjects. The need for
this kind of information increases as our society
becomes more complex.
Census History
Census taking is not a new idea. During the third
and fourth centuries B.C., the Babylonians,
Chinese, and Egyptians were enumerating their
populations to collect taxes and to fight foreign
wars. The Romans were avid census takers and
regularly held censuses to inform themselves
about areas in their far-reaching empire.
In contrast to early censuses, later censuses
became more than just a way to levy taxes or to
muster men for fighting. They were seen as an
inquiry into the social and economic state of the
nation.
4 Teacher’s Guide
The first modern census: Intendant Jean Talon is
generally regarded to have been the first in the
world to put a modern census into practice. Sent
by Louis XIV to administer the colony of New
France, Talon recognized the importance of having
reliable information on which to organize the
colony and further its development. This first
census in 1666 enumerated 3,215 inhabitants and
collected information on age, sex, marital status,
locality, and occupation. A supplementary inquiry
in 1667 covered area of land under cultivation and
the numbers of cattle and sheep.
No fewer than 36 censuses were conducted during
the French regime. Each one brought a few new
questions including the production of various
crops, the number of public buildings, churches,
grist mills and sawmills, and the number of
firearms and swords.
The first census under the British regime was
taken in 1765 and contained much the same
information as the censuses in the latter part of the
French regime. As time progressed, new topics
appeared such as race, ethnicity, religion, and
place of birth.
During the 1800s separate censuses of different
complexities were held at various times in the
Atlantic colonies, Upper and Lower Canada, and
in Manitoba. Eventually, with 1867 and
Confederation, the British North America Act
called for a Census of Canada to provide an
official count of the population to determine the
number of members in the House of Commons.
The first national census was to be taken in 1871
with additional ones to be taken every 10 years
thereafter.
A census every five years: In 1956, the Dominion
Bureau of Statistics began taking censuses once
every five years to provide up-to-date information
on the nation’s rapidly changing population. This
mid-decade census was made mandatory in the
Statistics Act of 1971.
How Is the Census Taken?
During the 2006 Census, every household in
Canada will receive a census questionnaire. Over
12.7 million households are expected to be
counted in Canada.
Mail-out, mail-back: In 2006, Statistics Canada
will be mailing out the census forms to 70% of the
country. Census Enumerators will deliver to the
remaining 30% of households. Delivery of census
forms will start on May 2, 2006. All census forms
will be either mailed back or returned online to the
Data Processing Centre (DPC). This new method
will enhance the security and confidentiality of the
census. The forms are to be completed and
returned online or by mail by May 16, 2006.
Internet: For the first time, every person living in
a private household can complete the census form
online. This will allow the census data to be
processed more quickly.
Sampling: While most households receive a short
questionnaire, one household in five will receive a
longer questionnaire. The short questionnaire asks
basic questions such as age, sex, and marital
status. The longer version asks these questions
plus more detailed ones such as education, income,
and employment. Sampling produces statistics that
are accurate for the entire population. Some of the
advantages of sampling include reduced response
burden as well as reduced collection and
processing costs.
Drop-off: In rural and less populated parts of the
country, households will still receive their forms
from enumerators.
Personal interview: Because of the smaller
number of people living in northern and remote
areas, or on Indian reserves, the one-in-five
sampling ratio would not accurately reflect all
people within the group. In these areas everyone is
interviewed by an enumerator using the long form.
Teacher’s Guide 5
Data Processing Centre (DPC): When all the
forms are returned to the DPC, the responses are
edited and scanned into a computer. The wealth of
data produced can then be sorted and
cross-referenced. We can find out, for example,
the number of school-aged children in Edmonton
or the number of people employed in the forest
industry in New Brunswick.
The Census of Agriculture
The Census of Agriculture is taken at the same
time as the Census of Population to find out about
the country’s farming and food production
population.
Agriculture is an important part of our economy.
Jean Talon’s census of 1667 tells us that the
colony had 11,448 arpents of land (3,915 hectares)
under cultivation; 3,107 cattle; and 85 sheep.
As mentioned in Census History, the British
North America Act of 1867 called for a Census of
Canada to be taken in 1871 and every 10 years
thereafter. However, the expansion of western
Canada at the turn of the 19th century created a
demand for agricultural information at more
regular intervals. A mid-decade agricultural census
was first held in Manitoba in 1896 and then
extended in 1906 to Alberta and Saskatchewan. In
1956, Canada began taking a Census of Population
and Census of Agriculture every five years.
By May 16, 2006 everyone who runs an
agricultural operation will receive a Census of
Agriculture questionnaire. The Census of
Agriculture gives us facts about the country’s
farming and food production. The farm industry,
as a whole, benefits from census data in many
ways: agricultural producer groups are guided by
census data both when informing their
membership about industry trends and
developments and when putting operators’
viewpoints before legislators and the Canadian
public. Governments and private groups use
agricultural statistics to develop or evaluate
agricultural policies and programs. Analysing
information on the quantity of produce and
livestock grown helps forecast shortages or
surpluses and can, for example, aid in making
production or marketing decisions. Information
about farm energy usage helps energy companies
prepare for fuel and electricity requirements.
(Activity 5 includes an overview of the Census of
Agriculture with specific vocabulary.)
Who Uses Census Data?
Census data are used by governments, businesses
and industries, social organizations and countless
other agencies. For instance:
Census data are essential for producing the
population estimates used to allocate transfer
payments from the federal government to the
provinces and territories, and from the provinces
to the municipalities.
Governments of all levels use census data to
develop policies on economic and social programs.
In fact, census data are used by programs which
administer a variety of federal transfer payments,
Old Age Security, Official Languages, and War
Veterans’ Allowances. At the local level,
municipalities use census data to assess the need
for community programs and services, such as
transportation, police, or youth services.
Businesses and industries use census data to
analyse markets for their goods and services, plan
their need for employees, or select new retail or
manufacturing sites.
The health-care industry uses census data to
forecast health care needs and costs, and select
sites for hospitals, seniors’ homes, and clinics.
The labour sector uses census data to measure the
number, location and skills of Canadian workers
and provide information on their age, education,
income, sex, marital status and ethnic origin.
Much use can be made of this information
including helping planners decide what
employment or training programs to develop.
6 Teacher’s Guide
Social service agencies use census data to assess
many social needs such as day care or subsidized
housing.
The education sector uses census data on the
level of schooling achieved to plan postsecondary
and adult education programs. School boards use
population figures by age group and ethnic origin
to project school enrolments or to plan special
programs.
The agricultural sector uses census data to
determine the agricultural programs operated by
government and private industry.
The media use census data on economic activity,
income, housing, education, language,
immigration, ethnic origin, and family
composition as background for articles.
More Than a Civic Responsibility?
It is vital that decision makers have accurate
statistics when making policies that will shape our
country’s future. For this reason, answering census
questions is more than a civic responsibility — it
is required by law. The Statistics Act states this
requirement and details the penalties for not filling
in a census form. By the same law, Statistics
Canada must protect the confidentiality of the
personal information provided by respondents.
Privacy and Confidentiality
Under the Statistics Act, all personal census
information must be kept confidential. Only
Statistics Canada employees who have a need to
examine individual forms have access to the
completed questionnaires. Penalties for employees
who release personal census information are laid
down in the Statistics Act. No one outside of
Statistics Canada can have access to personal
census information.
Although names and addresses are required on the
census form, this is only to ensure that no
household is missed or counted twice. Names and
adresses are not entered into the census database.
This database combines information from all the
census questionnaires and produces data in the
form of statistics.
What Questions Are Asked?
Great care is also taken when deciding on
questions. The information collected must be
clearly in the public interest and unable to be
obtained from other sources. When deciding
questions for the 2006 Census, Statistics Canada
consulted with many organizations across the
country including federal and provincial
governments, businesses, universities, social
action groups, town planners, and individuals, who
offered some 1,931 comments. The questions then
had to be approved by Cabinet and published in
the Canada Gazette in April 2005. The questions
for the 2006 Census were being developed even
before the results of the 2001 Census were
complete. Likewise, planning for the 2011 Census
is already well underway.
Many of the questions remain the same from
census to census. In this way, trends can be
tracked over the years, such as the growth or
decline in the population in various areas of the
country. However, as appropriate, new questions
are asked and some are deleted. For example, in
2001 a new two-part question on language spoken
at home was introduced.
For 2006 a new question asking whether the
respondent would permit Statistics Canada to
make their information public in 92 years was also
added. A new question granting Statistics Canada
permission to use data from income tax records
has been introduced.
For the census of Agriculture a new question on
day-to-day management decisions made by farm
operators has been added.
Teacher’s Guide 7

Resources for Census Material
Census information can be obtained free of charge
in many libraries located across Canada. Academic
and large city libraries have received a full range
of Statistics Canada products in a variety of media
while others carry a selection of publications. You
can also get census information from bookstores
selling Government of Canada publications.
On the Statistics Canada Web site
(www.statcan.ca) you will find information such
as Canadian Statistics, Statistical Profile of
Canadian Communities, Population and Dwelling
Counts Tables, and a section about the Census.
You can download a Game Placemat, a Word Find
Puzzle, a 2006 Census Quiz, and the 2006 Census
Teacher’s Kit from the 2006 Census page on the
Census Web site at: www.census2006.ca. The
Teacher’s Kit includes a Teacher’s Guide and
eight Activities.
Additional educational material is available free of
charge on the Statistics Canada Web site at:
www.statcan.ca, under Learning Resources.
The Census Help Line (CHL) will be available to
help with completing the census questionnaire.
The CHL operates starting May 1st, from 8 a.m. to
9 p.m., at this toll-free number: 1 877 594-2006.
TTY/TDD users call: 1 888 243-0730.
8 Teacher’s Guide
Census Vocabulary
agriculture see Census of Agriculture
block canvass a new operation for the 2006 Census. Enumerators systematically canvasevery block in selected areas to locate every housing unit and verifyaddresses for future mailing of census questionnaires.
census The word census comes from the Latin censere — to appraise. Bycollecting information from every person in Canada, the census can tell usabout a wide variety of social and economic topics important to thecountry. These include age, sex, marital status, education, ethnic origin,language, labour force activities, agricultural activities, immigration,migration, and others. A Census of Population and a Census ofAgriculture are held concurrently once every five years. The next Censusof Canada takes place on May 16, 2006.
census agglomeration
(CA)
like a census metropolitan area (CMA), a CA is an urban area withadjacent urban and rural areas that are socially and economicallyintegrated, but on a smaller scale. The population of its urban core is atleast 10,000. Charlottetown in Prince Edward Island, is a CA.
census data information produced from the census.
census division
(CD)
a geographic area established by provincial law. CD often corresponds tocounties, regional districts and regional municipalities, among others. CDsare smaller than a province, but larger than a census subdivision. (seeCSD)
census metropolitan area
(CMA)
a very large urban area (known as the urban core) together with adjacenturban and rural areas that have a high degree of social and economicintegration with the urban core. A CMA has an urban core of at least100,000, based on the previous census. The census has identified 27CMAs across Canada. Winnipeg in Manitoba is a CMA.
Census of Agriculture an enumeration of every farm, ranch or other agricultural operation withsales of agricultural products during the year prior to the census. Heldevery five years in conjunction with the Census of Population, the Censusof Agriculture asks questions about land use, crops, livestock, agriculturallabour, farm income, and land management practices.
Census of Population an enumeration of every household and person in the country once everyfive years on a particular day. A short form, which is distributed to 80% ofthe population, asks basic questions such as date of birth, sex, familyrelationship, marital and common-law status, and mother tongue. A longerform, which is distributed to 20% of the population, asks more detailedquestions on language, citizenship and immigration, ethnic origin,education, labour market activities, income, unpaid work, and dwellings.The 20% sample obtains information that is statistically accurate for thecountry as a whole while lowering the cost of the census and the burdenon respondents.
Teacher’s Guide 9
Census Vocabulary (cont’d)
census subdivison
(CSD)
corresponds to a city, town, village, or Indian reserve within a censusdivision (CD), among others. In Newfoundland, Nova Scotia and BritishColumbia, a CSD also describes geographic areas created jointly byStatistics Canada with the provinces. (see CD).
collection unit
(CU)
the small geographic area used to delineate manageable areas forcollection. In remote areas it is the unit for which an enumerator isresponsible.
complete count the census goal — to obtain information from everyone who is a residentof Canada, as well as Canadians working overseas for the federal andprovincial governments, Canadian embassies, Canadian Armed Forces,and their families.
confidentiality The Statistics Act requires that all personal census information be keptconfidential. Data are released only after responses have been combined ina database to produce statistics.
data facts from which conclusions can be drawn.
data processing centre
(DPC)
a key innovation for the 2006 Census — a centralized centre where allquestionnaires are forwarded for scanning and data capture, enhancing thesecurity and confidentiality of the census collection process.
diversity as in cultural diversity, multicultural, different cultures in Canada.
dwelling a set of living quarters in which a person or a group of persons reside orcould reside.
enumeration In the census, 70% of Canadians are enumerated by self-enumeration.Canada Post delivers a questionnaire to each dwelling. Respondents thencomplete the questionnaire in the privacy of their own homes, on paper oronline. In remote areas census enumerators enumerate householders bycanvasser enumeration or personal interview.
farm operator person(s) responsible for the day-to-day decisions made in the farmingoperation.
farm population includes all members of a farm operator’s household living on a farm in arural or urban area.
grid a system of survey lines running parallel to lines of latitude and longitude,used for the division of an area into counties, sections, lots, etc.
household a family or a group of unrelated persons living in a dwelling.
House of Commons the elected House of Parliament. Each member of the House of Commonsis elected from one of Canada’s federal electoral districts (FEDs orridings). The most recent changes, which were determined by informationfrom the 2001 Census of Population, called for the creation of anadditional 6 federal electoral districts, increasing the number of Canada’selected officials in the House of Commons from 301 to 307.
10 Teacher’s Guide
Census Vocabulary (cont’d)
immigrant population people who are, or have been at one time, landed immigrants in Canada. Alanded immigrant is a person who has been granted the right to live inCanada permanently by immigration authorities. Some are recent arrivals,while others have resided in Canada for a number of years. Recentimmigrants are people who immigrated to Canada during the five yearsbefore the last census. Asian-born refers to people born in the MiddleEast as well as other parts of Asia. Canadian-born refers to people whoare Canadian citizens by birth. Most were born in Canada, but a smallnumber were born outside Canada to Canadian parents. (seenon-permanent residents)
immigration the act of entering a foreign country as a permanent resident.
immigration source areas Immigrants to Canada were born in many countries all over the world.Statistics Canada has arranged these countries by six source areas: 1)North America (excluding Canada), 2) Central and South America and theCaribbean, 3) Europe, 4) Africa, 5) Asia and the Middle East, and 6)Oceania.
Internet In 2006, census questionnaires can be completed and returned online.
labour force refers to all persons aged 15 years and over, excluding institutionalresidents, who were employed during the week prior to Census Day. Alsoincluded are unemployed persons who looked for work in the four weekspreceding the census, those who were to start a new job within four weeksof the census or who were temporarily laid off.
mother tongue the first language learned at home in childhood and still understood by theindividual at the time of the census.
multicultural having a number of distinct cultures existing side by side in the samecountry.
net farm income as reported on the Census of Population questionnaire: gross farm receiptsminus operating expenses such as wages, rents and depreciation.
non-farm work (formerly called off-farm work) the number of days farm operatorsworked away from the farming operation at paid agricultural andnon-agricultural work.
non-permanent residents refers to people from another country who live in Canada and have work,student or Minister’s permits, or are persons claiming refugee status inCanada at the time of the census. They are not included in the immigrantpopulation and are less than 1% of the total population.
overcount (a noun) those people who were counted more than once (e.g., people away fromhome who were counted at a hotel/motel as well as at their regularresidence).
place of birth the country in which a person was born, according to present boundaries.
Teacher’s Guide 11
Census Vocabulary (cont’d)
population the total number of people living in a given area. Population density refersto the number of persons per square kilometre.
privacy refers to disclosing personal information on the census form. Providingpersonal information to anyone does involve some loss of privacy.However, in virtually any country in the world, it is recognized that thepublic benefits of accurate census data far outweigh this minimal loss ofprivacy; especially when the personal information is kept strictlyconfidential and is used only to produce statistics.
questionnaire a document containing a series of questions. It is used to ensure thatinformation is collected in a standardized manner and is usually designedso that the answers can be tabulated quickly.
rural all territory outside urban areas, therefore with a maximum populationconcentration of less than 1,000 and a population density of less than 400per square kilometre.
sample part of something that can be used to represent the whole. For the census,a sample of one in five households in populated areas is asked additionalquestions. The combined characteristics of these households arerepresentative of the entire population.
snapshot of the population the census is sometimes described this way, or as a portrait of Canada.
stacked column a column in a bar graph. The column is broken into proportional segmentsto total 100%.
statistics numerical facts about people, the weather, business conditions, etc.; thescience of collecting and classifying such facts in order to show theirsignificance.
survey a study made by gathering information in the form of statistics. Althoughthe census is often referred to as Canada’s largest survey, the terms censusand survey really mean different things. In a census, a wide variety ofinformation is gathered from the entire population. In a survey,information on a narrower topic is gathered from a smaller sample withinthe population.
undercount (noun) the estimated number of persons who were not counted in the census.
urban urban areas have minimum population concentrations of 1,000 and apopulation density of at least 400 people per square kilometre, based onthe previous census population counts (2001). All territory outside urbanareas is considered rural. Taken together, urban and rural areas cover all ofCanada.
12 Teacher’s Guide
Quick Census Facts
What is the census?
The census collects information on a wide variety of topics including age, sex, language, education,
labour activities and others. The information is collected from every man, woman and child in Canada
once every five years. The census encompasses an area of more than 9.2 million square kilometres,
collecting information from over 12.7 million households and every farm operation in Canada. It is
estimated that 32.5 million people will count themselves in.
When will the next Census be held?
May 16, 2006 is Census Day.
Why take a census?
The census tells us about the social and economic situation of the country — a kind of statistical portrait
of Canada and its people. The information is used to make important decisions in areas such as health
care, housing, employment, education, public transit, and much more.
Who will be included in the census?
Every household in Canada is included, as well as Canadians working overseas for the federal and
provincial governments, Canadian embassies, Canadian Armed Forces, and their families.
How is the information collected?
Canada Post delivers 70% of the questionnaires during the first two weeks of May. The remaining 30%
of questionnaires are delivered by census enumerators. One in five households receive the long
questionnaire (2B), while the rest of the households receive the short questionnaire (2A). One person
completes the form for everyone in the household and returns it online at www.census2006.ca or by
mail by Census Day.
Cost
The total estimated cost of the 2006 Census in 2005 dollars is $567 million or $44.80 per household.
Teacher’s Guide 13
Questionnaires
The 2006 short form (2A) contains eight questions on age, sex, marital status and mother tongue. The
long questionnaire (2B) contains 61 questions. 16,135,000 short questionnaires and five million long
questionnaires in English have been printed. In French, 13,365,000 short questionnaires and 2,200,000
long questionnaires have also been printed. New for 2006 are questions on permission to use data from
income tax records, a question asking whether the respondent would permit Statistics Canada to make
their information public in 92 years and a question on where individuals received their highest level of
education.
Legal Requirements and Confidentiality
According to the Statistics Act:
• A census must be conducted every five years.
• Every Canadian household must participate in
the census.
• Every Statistics Canada employee must take
an oath of secrecy not to reveal any
information that could be traced to an
individual.
Users of Census Data
All levels of government as well as business, labour, education, health care, agricultural, and social
service sectors use census data to make informed decisions that affect the lives of everyone in Canada.
This could include anything from calculating transfer payments to the provinces to determining the
number of police in your community.
14 Teacher’s Guide
Please send us your comments and suggestions regarding this kit.
To be added to the mailing list or to receive a kit, please contact:
Statistics Canada
Census Communications
Ground Floor C-7, Jean Talon Building
Ottawa, Ontario K1A 0T6
Fax: (613) 951-0930
E-mail: [email protected]
(To download the 2006 Census Teacher’s Kit
from the Census Web site, go to: www.census2006.ca)
Census Day: May 16, 2006
Count Yourself In!
Activity 1:
Taking a Census
Suggested Level: Elementary
Subjects: Art, Social Studies, Mathematics, Language Arts
Overview
This activity introduces students to the concept of
a census. Students relate the census to counting of
households, in order to help them understand how
and why a census is taken in Canada every five
years. (1 class period)
Note: See the Teacher’s Guide for general
background on the census and census vocabulary.
Learning Objectives
• Explain the term census and name some of the
information gathered by the census.
• Use counting techniques to take a census of
their household and classroom.
• Collect information and organize data.
Vocabulary
Census, household, population
Materials
• Teacher’s Guide
• Handout 1: The Census Logo
• Handout 2: Taking a Census
• Coloured pencils, markers, crayons (not
included)
Getting Started
Explain to students that a census collects
information on every man, woman and child in
Canada every five years, on a particular day. We
take a census every five years because the number
of people in Canada is always changing. The next
census takes place on May 16, 2006.
The numbers that the census provides are used to
make important decisions. For example,
playgrounds will be built close to where a lot of
children live.
Census Activity
1. Distribute Handout 1: The Census Logo.
Explain that the census logo shows a group of
people. These people represent everyone who
will be counted in the census on May 16, 2006.
Have the students colour the census logo in the
official census colours (yellow, red and green).
2. Tell the students that they are now going to
take a census, and distribute copies of Handout
2: Taking a Census. Read the introduction with
them and then have them answer the questions.
3. Ask the students to take the handouts home to
remind their families of Census Day on
May 16, 2006.
2006 Census Teacher’s Kit
Count Yourself In!May 16, 2006
Extension/Enrichment
1. Have the students count the members of the
class. They could then organize the data by
sex, age, or other characteristics they are
interested in. This could be done by having the
students form groups for the characteristic in
question (e.g., girls on one side, boys on the
other). Have them re-group for each
characteristic.
The class should choose items of interest to the
students. These could range from favourite
colours to method of getting to school. The
aim here is to have students recognize that
almost anything can be counted and that the
results influence decisions. For example,
favourite colours could determine the colours
for a new school crest; method of getting to
school could determine the number of bike
racks needed in the schoolyard.
2. Expand this activity by designating a few
students as “census takers.” Each census taker
could be responsible for one particular item,
e.g., favourite TV shows, types of pets, etc.
The results could be listed on the chalkboard,
followed by a discussion of the class profile.
If desired, students could graph the results.
Have the students create a bulletin board
display of what they have done in class. Add
pictures and drawings.
2 Activity 1

Handout 1: The Census Logo
Activity 1 3

Handout 2: Taking a Census
The census collects information on every man, woman and child in Canada, every five years, on a
particular day.
The census tells us many things. It tells us how many people are old and how many are young. It tells us
what languages people speak.
The answers we get from the census help us make important decisions. For example: How many children
are there in your neighbourhood? Are there enough playgrounds for all these children? Do we need to
build another playground?
On May 16, 2006 every household in Canada will be counted in the census. Can you take a census of your
household? Be sure to count every person.
1. How many adults live in your household? _______________________________________________
2. How many boys live in your household? ________________________________________________
3. How many girls live in your household? ________________________________________________
4. How many people in total live in your household? ________________________________________
4 Activity 1
Activity 2:
Add! Don’t Subtract! —
A Complete Count
Suggested Level: Elementary
Subjects: Mathematics, Social Studies, Geography
Overview
This activity shows students how the answers to
the census are useful in decision making when
they are totalled and associated with geographic
areas.
Students will engage in activities which use a
neighbourhood map, summarize data about
persons in households, and make decisions based
on the results of their calculations. (2 class
periods)
Note: See the Teacher’s Guide for general
background on the census and census vocabulary.
Learning Objectives
• Define the term census.
• Summarize and verify a set of data.
• Use a simple model to make a decision.
• See how important decisions are affected when
census information is not complete.
• Describe how people depend upon each other by
seeing how the individual behaviour of some
can affect everyone.
Vocabulary
Census, dwelling, population
Materials
• Teacher’s Guide
• Handout 1: Map of Centreville Neighbourhood
• Handout 2: Counting a Centreville
Neighbourhood
• Red pencils/markers (not included)
Getting Started
1. Introduce this activity by having a discussion
of the vocabulary. Tell the students that they
are going to be learning some important words.
Begin with the word census. Ask the students
if they know the meaning of this word.
2. Tell the students that a census takes place
every five years in Canada. Ask them if they
know when the next census will take place. As
a follow-up question, ask why a census is
taken every five years in Canada. (ANSWERS:
May 16, 2006; to provide accurate and
up-to-date information.)
2006 Census Teacher’s Kit
Count Yourself In!May 16, 2006
3. Explain the words population and dwelling.
Ask the students why these are important
words to know. Tell them that these words
describe what is counted in a census. The
census also collects information about people
(such as age and sex).
4. Tell the students that they will see how census
totals are used in making decisions.
Census Activity
1. Distribute Handout 1: Map of Centreville
Neighbourhood. Go over the map with the
students so that there is no confusion about the
different shapes and their meanings.
2. Present the following story to the class:
The mayor of Centreville wants to build a new
park in the vacant block in the centre of your
map. The park would be used by people in the
surrounding neighbourhood. The mayor has
posed this question: Is at least one-half of the
population of the neighbourhood children and
seniors? If yes, she would propose building the
park. If no, she would agree to build a
shopping mall for adults.
You are the town planner. The mayor has
given you a table that shows results from the
census describing the ages of people in the
neighbourhood. She has asked you to help her
decide whether or not to build the park.
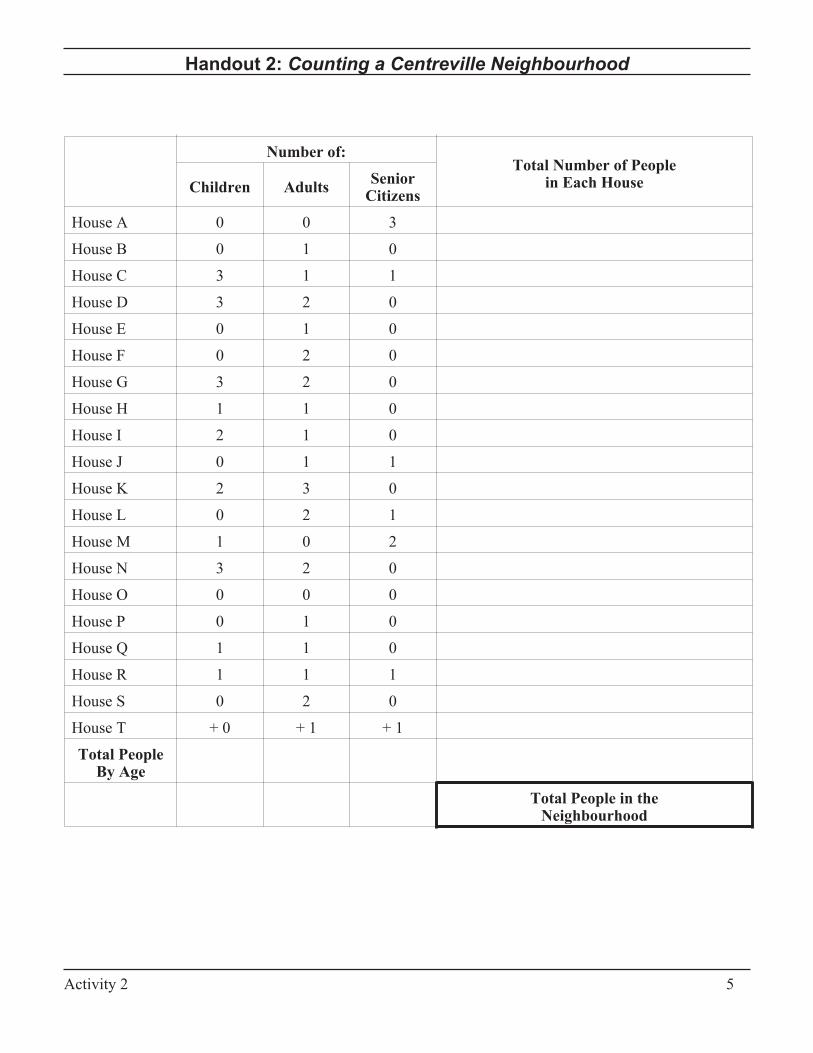
3. Distribute Handout 2: Counting a Centreville
Neighbourhood. Tell the students that they will
be totalling the numbers of children, adults and
senior citizens living in Houses A to T.
4. Familiarize the students with the table.
Emphasize that in order for the mayor to make
her decision, the information must be totalled.
A decision cannot be made just by looking at
the information about the people in the
neighbourhood.
5. Have the students calculate the total number of
people in each house by adding across each
row. Next, ask them to determine the total
population of the neighbourhood by adding
down the column titled Total Number of
People in Each House (Answer: 55).
Have students calculate the totals for each of
the columns marked Children, Adults, Senior
Citizens (Answers: 20, 25, 10). Have them
write in their answers at the bottom of each
column.
Have the students cross-check their
calculations by adding the total of the three
columns together. The sum should equal the
figure for the total number of people in the
neighbourhood.
6. Ask the students which of their totals will
answer the mayor’s question. Ask them how
they will arrive at their answer.
The students only need to use the figures in the
columns Children (20), Senior Citizens (10)
and Total Number of People in the
Neighbourhood (55). The question they must
answer is: Are the number of children plus the
number of senior citizens greater than or equal
to one-half the total number of people in the
neighbourhood, or is 20 + 10 equal to or
greater than 55 divided by 2? The answer is
yes. The park can be built on the centre block
of the map.
2 Activity 2
Now Take Away Some of the Data
7. Explain to the students that they are now going
to learn what happens when some people are
not counted. They will repeat the process in
steps 5 and 6, except this time, the census
information they have to work with will not be
complete.
8. Using the red pencils/markers, have the
students put an X over Houses A, D, E, I and
M on the map and cross out all the information
from these houses on the table of information
presented in Handout 1.
Ask the students to imagine that in the census
some people did not fill in their census
questionnaires. The people in Houses A and E
did not think they had to fill in their forms. The
people in Houses D and I did not care about
the census and the people in House M refused
to return their form.
Because people were left out of the census, the
numbers describing the neighbourhood have
changed. Ask the students to find out how
much the information has changed. Ask them
if the changes in information will change the
mayor’s decision.
9. Have the students repeat the calculations they
did for the complete count. The new figures
are: children (14), adults (21), senior citizens
(5) and total number of people in the
neighbourhood (40).
Now the question is: Is 19 greater than or equal
to 20? The answer is no. Because some people
were not counted in the census, the mayor will
build a shopping mall instead of a park, when
in fact the park was needed.
Discuss with the students how the decisions of
a few people who left themselves out of the
census affected the whole neighbourhood. See
if they can apply the concept to their own
community.
Activity 2 3

Handout 1: Map of Centreville Neighbourhood
4 Activity 2
?
Handout 2: Counting a Centreville Neighbourhood
Activity 2 5
Number of:Total Number of People
in Each HouseChildren AdultsSenior
Citizens
House A 0 0 3
House B 0 1 0
House C 3 1 1
House D 3 2 0
House E 0 1 0
House F 0 2 0
House G 3 2 0
House H 1 1 0
House I 2 1 0
House J 0 1 1
House K 2 3 0
House L 0 2 1
House M 1 0 2
House N 3 2 0
House O 0 0 0
House P 0 1 0
House Q 1 1 0
House R 1 1 1
House S 0 2 0
House T + 0 + 1 + 1
Total PeopleBy Age
Total People in theNeighbourhood
Activity 3:
Important Decisions Don’t Just Happen!
Using Data to Plan Your Services
Suggested Level: Intermediate
Subjects: Social Studies, Mathematics, Geography
Overview
This activity gives students hands-on experience
with census data, introduces them to data for small
geographic areas, refines decision-making skills
and demonstrates some of the actual uses of
census data.
Accordingly, students will examine sets of
imaginary data associated with several community
services, decide which neighbourhoods would
benefit most from each service, and illustrate their
findings on a grid map. (1-2 class periods)
Note: See the Teacher’s Guide for general
background on the census and census vocabulary.
Learning Objectives
• Interpret a statistical table and a grid map.
• Sort and rank numeric values.
• Graphically display information on a grid map.
• Name at least one piece of information collected
in a census.
Vocabulary
Census, census data, grid
Materials
• Teacher’s Guide
• Handout 1: Important Decisions Don’t Just
Happen!
• Transparency of Handout 1 and coloured
markers (not included)
Getting Started
1. Ask your students to imagine that they are the
advisors to the town council in a community
where three-quarters of the families have
children younger than six years. What do they
think would be the special concerns of
residents in this community?
Ask your students what special services they
would advise the town council to include in its
plans. The answers will vary but will probably
include schools, day-care centres, playgrounds,
libraries and health centres.
Have students explain their recommendations.
Point out that their decisions were influenced
by the number of families with young children.
2. Explain to the students that real-life decisions
also require this type of statistical data. The
Census of Canada is an important source of
such data. The census is conducted by
Statistics Canada every five years and the next
census will take place on May 16, 2006.
2006 Census Teacher’s Kit
Count Yourself In!May 16, 2006

Spend time discussing the upcoming census
with the class, especially how census data are
used in the everyday life of the community.
Census data are used at the local, provincial
and federal government levels as well as by
community organizations, businesses and
individuals. (See Teacher’s Guide, pp. 6-7)
3. Tell the students that they are going to have a
chance to make some decisions for another
imaginary community using the type of data
that is produced in a census.
Census Activity
1. Distribute the handout and have a student read
aloud for the class the three paragraphs under
the first question: How many school-aged
children are there in your community?
2. Explain to the students that they are going to
be researchers at Data-R-Us. Their task will be
to select the best neighbourhood in the town of
Petunia for some new community services.
3. The length of this activity may warrant
conducting part of it aloud. You may also want
to take the students through the tables.
It helps to copy Table 2 and the map with its
legend on the chalkboard or on overhead
transparencies.
Students could link the patterns in the legend
with the numbers selected from Table 2 by
using different coloured markers.
4. This exercise lends itself to group work.
Divide the class into groups of three to five
students and have them determine where to
locate the services on the map.
Note: The selection of the medical centre area is
both the hardest and the easiest for the students to
locate. They must look for high numbers in two
table categories (People - 15 years and under and
People - 65 years and over) at the same time. By
solving the playground and seniors’ centre
sections of the exercise and overlapping the
patterns where appropriate, the medical centre area
magically appears.
5. Once your students have correctly identified
the best group of neighbourhoods for each
service, ask them to pinpoint (within that
group) where the service should be located
(using the letters A to D and a solid line for the
bus route).
The location should be the spot that makes the
service most accessible to all the people in the
selected group of neighbourhoods. These
locations have been identified for you on the
answer sheet’s map (p. 3).
Extension/Enrichment
1. Have your students discuss other census data
that would be important in researching the best
location for these services. Of course not all
other important data are necessarily
census-related. Availability of land, land prices
in the community, existing street patterns and
the present locations of similar services will be
considered in the selection of a site.
2. Ask your students to visit the Statistics Canada
Web site (www.statcan.ca) and research census
data on the age distribution of their own
community and province under the
“Community Profiles” button. Then, have the
students report on any new services that have
become established. Why are these new
services located where they are? Municipal
offices, chambers of commerce and provincial
development agencies are good sources of
current information. Local businesses that have
moved away or that have not succeeded could
also be investigated.
2 Activity 3

ANSWERS to Activity 3: Data-R-Us
TABLE 2: CENSUS DATA
* highest number of people in each category
Activity 3 3
(Playground) (Seniors’ Centre) (Bus Routes)
Neighbourhood People - 15 People - 65 Total Population
years and under years and over
1 175* 79 334
2 170* 190* 450
3 5 250* 312
4 95 145 520*
5 171* 94 470
6 150* 201* 440
7 65 220* 335
8 84 98 522*
9 20 100 207
10 27 5 171
11 90 78 568*
12 75 43 608*
13 17 76 192
14 15 22 169
15 120 11 632*
16 20 1 163
Handout 1: Important Decisions Don’t Just Happen!
How many school-aged children arethere in your community?
Your community is growing and more young
families are moving in. Are there enough schools
to look after the extra children, or should your
school board think about building more?
This kind of decision is made every day using
census data. Decisions can be made by guessing;
sometimes the guess would be right but more often
it would be wrong.
In today’s world, millions of dollars can be lost on
a guess. That’s why people need facts to make
decisions. For example, retail businesses use data,
to help choose new locations or add new products.
More and more often they turn to data that have
been gathered by the census.
What if you wanted to find a locationfor a sailboard store?
Your choices are: Vancouver, British Columbia;
Montreal, Quebec; or Toronto, Ontario. How
would you choose? You would want to find out
which city has the most days that are sunny, the
best winds, and available waterfront. And once
you have chosen the city, what spot would you
pick for your store? Who buys sailboards anyway?
The following exercise asks you tomake some choices.
In your job at Data-R-Us, you help clients make
decisions using census data. Your boss comes into
your office with requests from two clients who
want to find the best location in Petunia for some
new services. You have the job of researching the
best areas in the city for each service.
The first request is from the town council, which
has been given money to build a new playground
and a new seniors’ centre. As well, the council has
the money to buy a new bus and start a new bus
route.
The second request comes from the Get Well
Medical Clinic. This company wants to expand
into Petunia and is looking for a location close to
large numbers of children and seniors.
Imagine that you have looked at the census report
on Petunia and have picked the data that best
describe the people who will use the services.
Table 1 is the result of this effort. Take a moment
to study the table.
You have census data for different parts of
Petunia. The city is divided into 16 parts or
neighbourhoods. They are numbered 1 through 16.
You also have a census map of the city showing
you where the 16 neighbourhoods are located.
Imagine that you have now made a second table
from the census report on Petunia.
On this table you have listed census data for each
of Petunia’s 16 neighbourhoods. For each
neighbourhood you have listed ONLY the census
4 Activity 3
TABLE 1
ServiceWho needs
the serviceCensus Data
playground children people - 15 yearsand under
seniors’ centre seniors people - 65 yearsand over
new bus route workers total population
medical centre children andseniors
people - 15 yearsand underpeople - 65 yearsand over
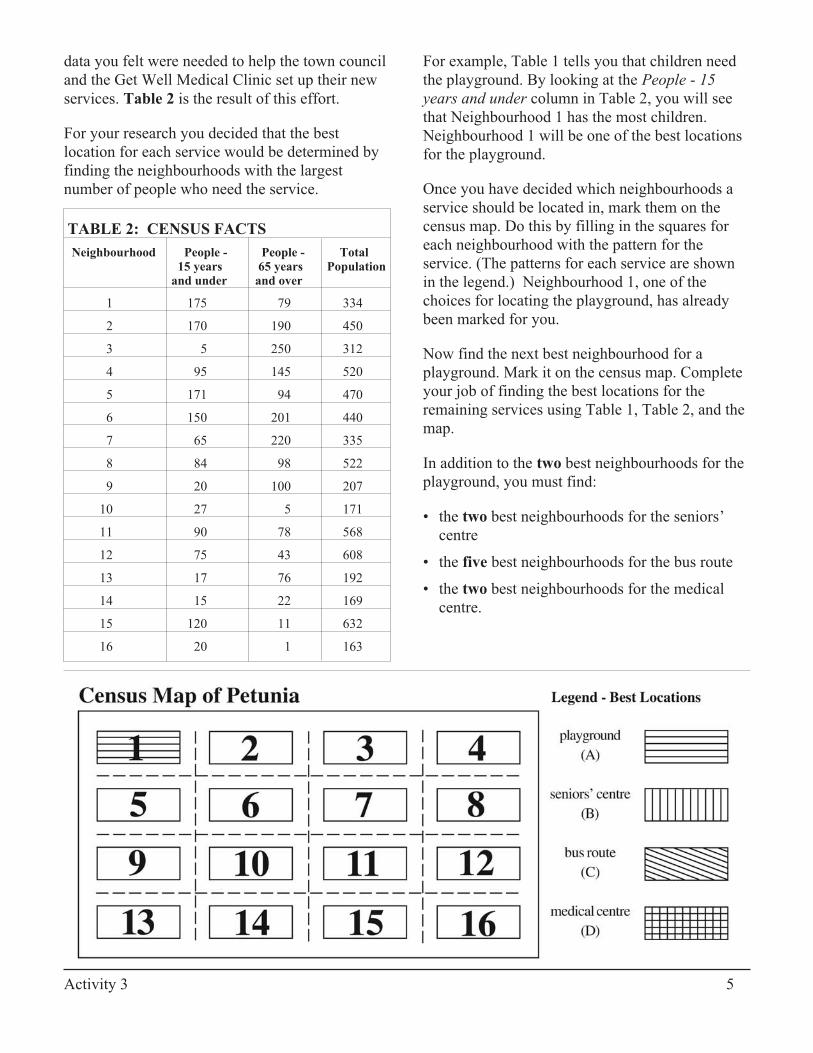
data you felt were needed to help the town council
and the Get Well Medical Clinic set up their new
services. Table 2 is the result of this effort.
For your research you decided that the best
location for each service would be determined by
finding the neighbourhoods with the largest
number of people who need the service.
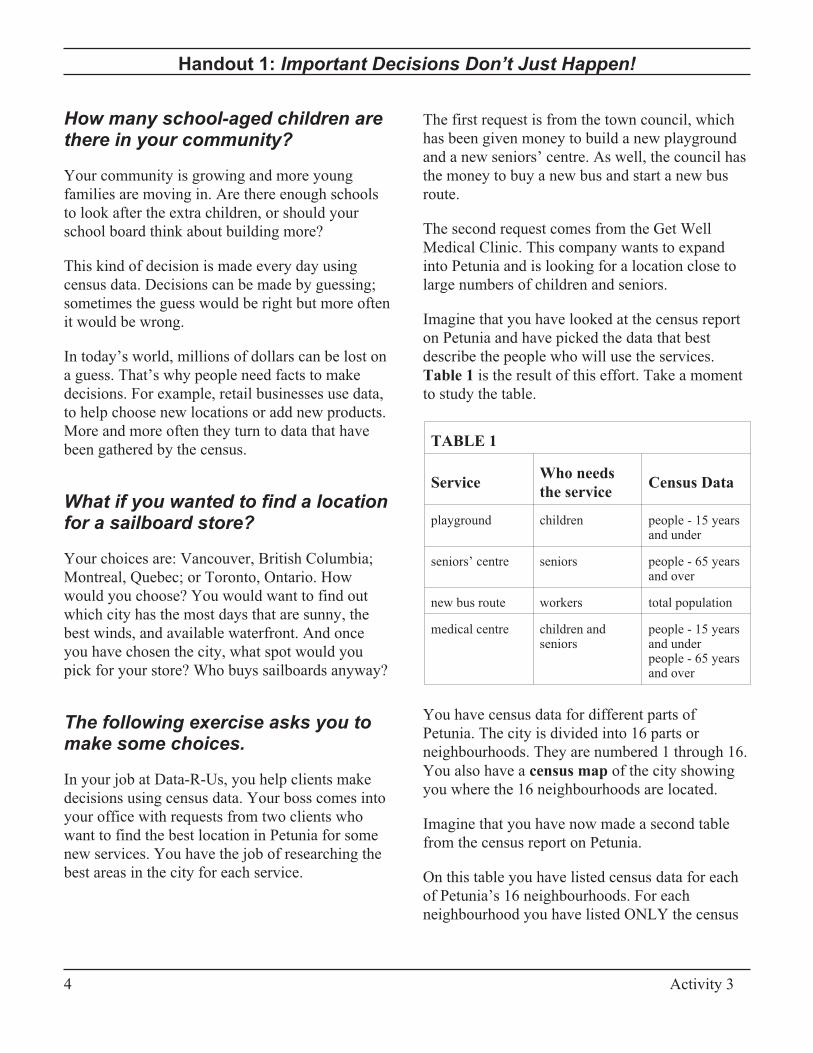
For example, Table 1 tells you that children need
the playground. By looking at the People - 15
years and under column in Table 2, you will see
that Neighbourhood 1 has the most children.
Neighbourhood 1 will be one of the best locations
for the playground.
Once you have decided which neighbourhoods a
service should be located in, mark them on the
census map. Do this by filling in the squares for
each neighbourhood with the pattern for the
service. (The patterns for each service are shown
in the legend.) Neighbourhood 1, one of the
choices for locating the playground, has already
been marked for you.
Now find the next best neighbourhood for a
playground. Mark it on the census map. Complete
your job of finding the best locations for the
remaining services using Table 1, Table 2, and the
map.
In addition to the two best neighbourhoods for the
playground, you must find:
• the two best neighbourhoods for the seniors’
centre
• the five best neighbourhoods for the bus route
• the two best neighbourhoods for the medical
centre.
Activity 3 5
TABLE 2: CENSUS FACTS
Neighbourhood People - People - Total
15 years 65 years Population
and under and over
1 175 79 334
2 170 190 450
3 5 250 312
4 95 145 520
5 171 94 470
6 150 201 440
7 65 220 335
8 84 98 522
9 20 100 207
10 27 5 171
11 90 78 568
12 75 43 608
13 17 76 192
14 15 22 169
15 120 11 632
16 20 1 163

Census Day: May 16, 2006
Count Yourself In!

Activity 4:
Where Do We Come From?
Suggested Level: Intermediate, Intermediate ESL
Subjects: ESL, Geography, Social Studies, Language Arts
Overview
This activity makes students aware of the places of
birth of people who immigrate to Canada. Students
will gain an understanding of the multicultural
nature of Canadian society by examining the
cultural diversity present within their classroom.
As an Extension/Enrichment exercise, they can
look at how immigrants contribute to our society.
(1-2 class periods for main activity)
Note: See the Teacher’s Guide for general
background on the census and census vocabulary.
Learning Objectives
• Develop an awareness of the places of birth of
people who immigrate to Canada.
• Understand how this information is gathered
through a census.
• In a group, locate their place of birth on a world
map.
• Express/understand personal experiences of
immigration to Canada through pictures or
stories.
• Recognise the contributions that immigrants
have made and continue to make to Canadian
society.
Vocabulary
Census, diversity, emigrate, immigrate,
immigration source areas, multicultural, place of
birth
Materials
• Teacher’s Guide
• Handout 1: Where Do We Come From?
• Handout 2: How Immigrants Contribute to
Canada
Getting Started
1. Using the background information provided
in the Teacher’s Guide, tell students about
the census and explain that the next one
takes place on May 16, 2006. Mention the
importance of immigration information that
the census gathers. The data are used to
provide services to immigrants.
2. Explain to your students that one of the
questions asked in the census is: Where
were you born? In this way, we know where
people come from and how many come
from each place.
2006 Census Teacher’s Kit
Count Yourself In!May 16, 2006
Census Activity
1. Ask your students to name the country in
which they were born and find its
approximate location on the world map in
Handout 1: Where Do We Come From?
Tell them to write in the name of their
country near its location.
Ask students to draw an arrow connecting
their place of birth to where they live now
in Canada. (Maps can be displayed so that
students can see the various places of birth
of their classmates.)
2. Ask your students to colour the stacked
columns in the graph and the map according
to the colour key.
3. Do a mini-census of the classroom counting
the total number of students from each
country. Display the results on the
blackboard or a chart.
4. (a) In a class that includes students who have
immigrated to Canada: invite students to
share their experiences of immigrating to
Canada with the class (see the questions
suggested in 4 (b).
(b) For a class of students who were all born in
Canada:
Invite a person who immigrated to Canada
to visit your class. Students with parents,
grandparents, or neighbours who are
immigrants, could ask them about their
experience, and report back to the class with
the stories they have gathered.
Here are a few QUESTIONS you can use as
examples (the census asks similar questions
about language and where you were born):
Where were you born? How long ago did
you come to Canada? Why did you come?
When you immigrated to Canada, were
there others who came here at the same
time?
Did you already speak English or French
when you came to Canada? What
language(s) did you learn as a young child?
Do you still speak it (them) now?
Did you play the same or different games?
Tell us about your culture’s art and music.
What was the most important thing you
brought with you when you came here?
What did you find hardest to learn or adjust
to in Canada? What do you like best about
living here?
5. Have each student write and/or draw a story
about immigrating to Canada.
Extension/Enrichment
1. Ask your students to put these stories
together in a book format. Each student’s
story can be a chapter in the book.
Using Handout 2: How Immigrants
Contribute to Canada, prepare your
students to research a source area and
country of their choice. The work could be
done individually or in groups.
2. Ask your students to visit the Statistics
Canada Web site (www.statcan.ca) and
research the immigration characteristics of
their community and their province under
the “Community Profile” button. Ask them
to draw a chart using the census data.
2 Activity 4
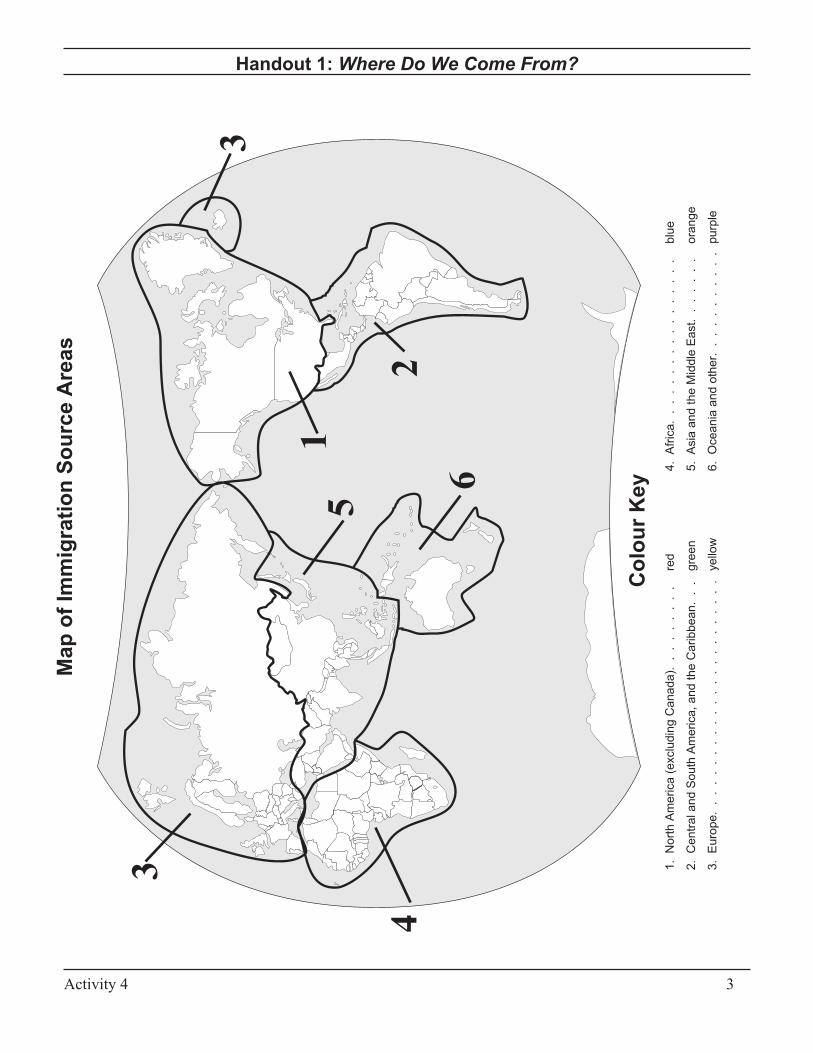
Handout 1: Where Do We Come From?
Activity 4 3
4
1
2
3
6
5
3
Map
of
Imm
igrati
on
So
urce
Areas
Co
lou
rK
ey
1.
Nort
hA
merica
(exclu
din
gC
anada).
..
..
..
..
red
2.
Centr
aland
South
Am
erica,
and
the
Caribbean.
..
gre
en
3.
Euro
pe.
..
..
..
..
..
..
..
..
..
..
..
.yello
w
4.
Afr
ica.
..
..
..
..
..
..
..
..
blu
e
5.
Asia
and
the
Mid
dle
East.
..
..
..
ora
nge
6.
Oceania
and
oth
er.
..
..
..
..
..
purp
le
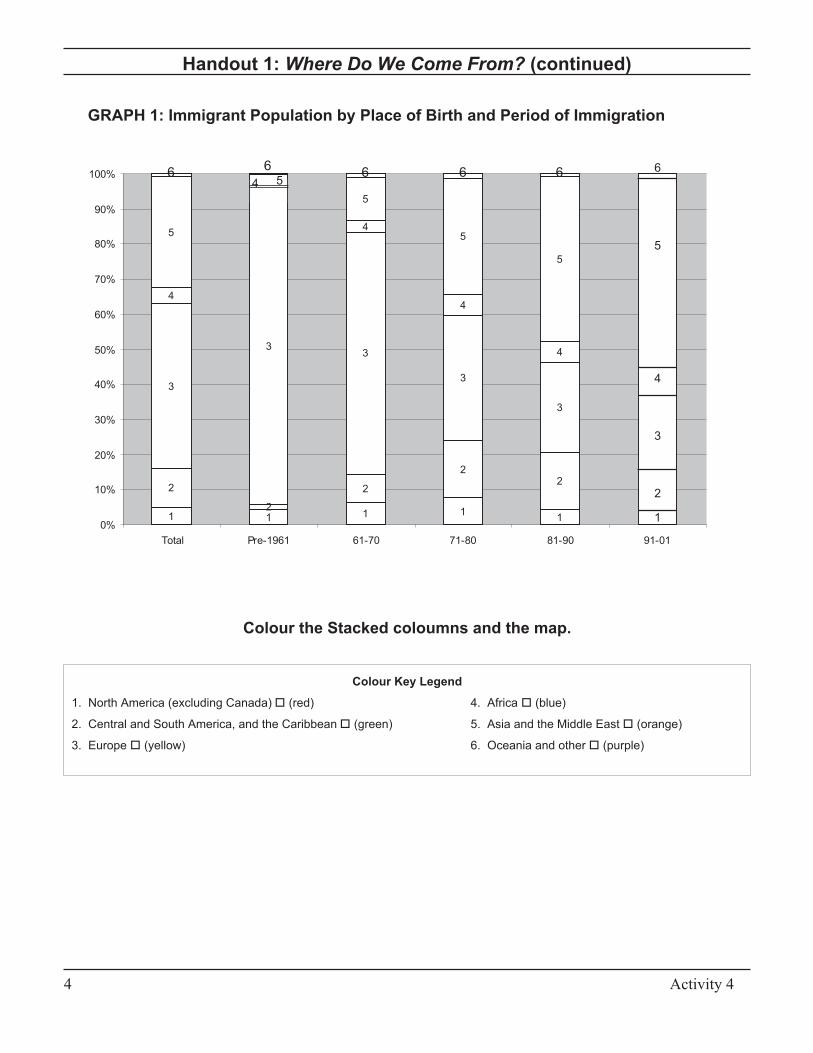
Handout 1: Where Do We Come From? (continued)
GRAPH 1: Immigrant Population by Place of Birth and Period of Immigration
4 Activity 4
Colour Key Legend
1. North America (excluding Canada)� (red)
2. Central and South America, and the Caribbean� (green)
3. Europe � (yellow)
4. Africa � (blue)
5. Asia and the Middle East� (orange)
6. Oceania and other� (purple)
Colour the Stacked coloumns and the map.
1 1 1 11
2
2
2
22
3
33
3
3
4
4
4
4
5
5
5
5
4
5
66 6 66
0%
10%
20%
30%
40%
50%
60%
70%
80%
90%
100%
Total Pre-1961 61-70 71-80 81-90 91-01
6
5
4
3
2
1
54
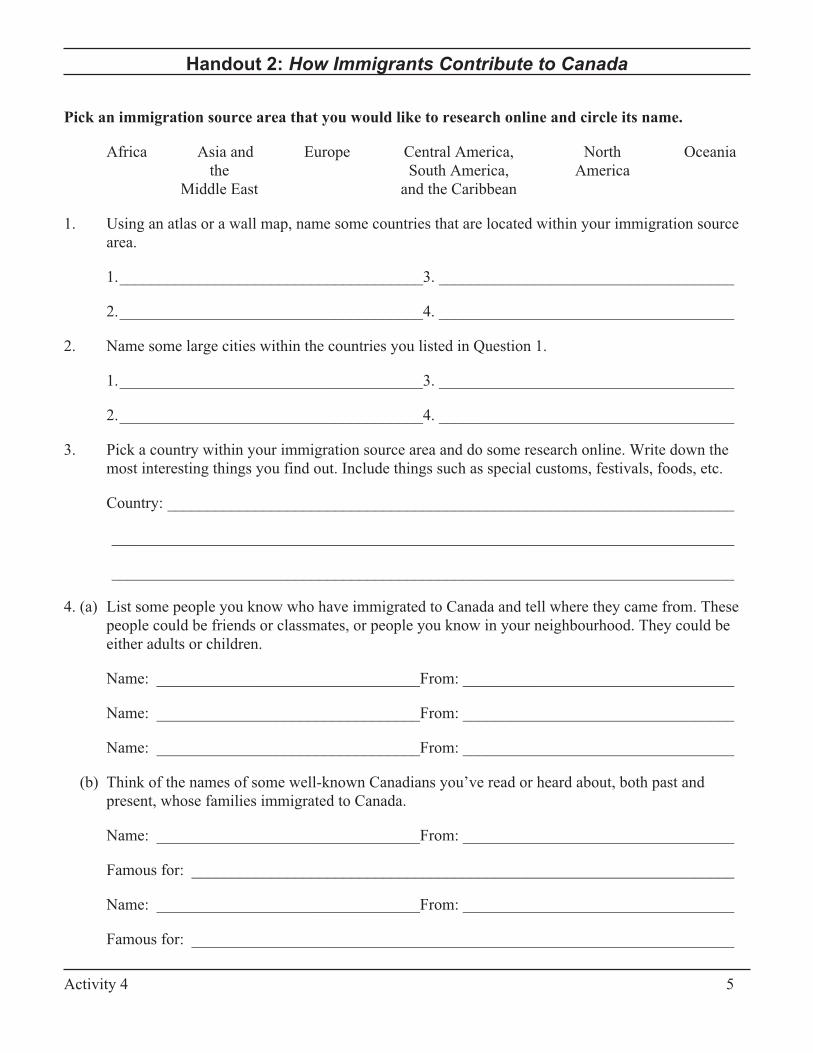
Handout 2: How Immigrants Contribute to Canada
Pick an immigration source area that you would like to research online and circle its name.
Africa Asia and Europe Central America, North Oceania
the South America, America
Middle East and the Caribbean
1. Using an atlas or a wall map, name some countries that are located within your immigration source
area.
1.______________________________________3. _____________________________________
2.______________________________________4. _____________________________________
2. Name some large cities within the countries you listed in Question 1.
1.______________________________________3. _____________________________________
2.______________________________________4. _____________________________________
3. Pick a country within your immigration source area and do some research online. Write down the
most interesting things you find out. Include things such as special customs, festivals, foods, etc.
Country: _______________________________________________________________________
______________________________________________________________________________
______________________________________________________________________________
4. (a) List some people you know who have immigrated to Canada and tell where they came from. These
people could be friends or classmates, or people you know in your neighbourhood. They could be
either adults or children.
Name: _________________________________From: __________________________________
Name: _________________________________From: __________________________________
Name: _________________________________From: __________________________________
(b) Think of the names of some well-known Canadians you’ve read or heard about, both past and
present, whose families immigrated to Canada.
Name: _________________________________From: __________________________________
Famous for: ____________________________________________________________________
Name: _________________________________From: __________________________________
Famous for: ____________________________________________________________________
Activity 4 5

Census Day: May 16, 2006
Count Yourself In!
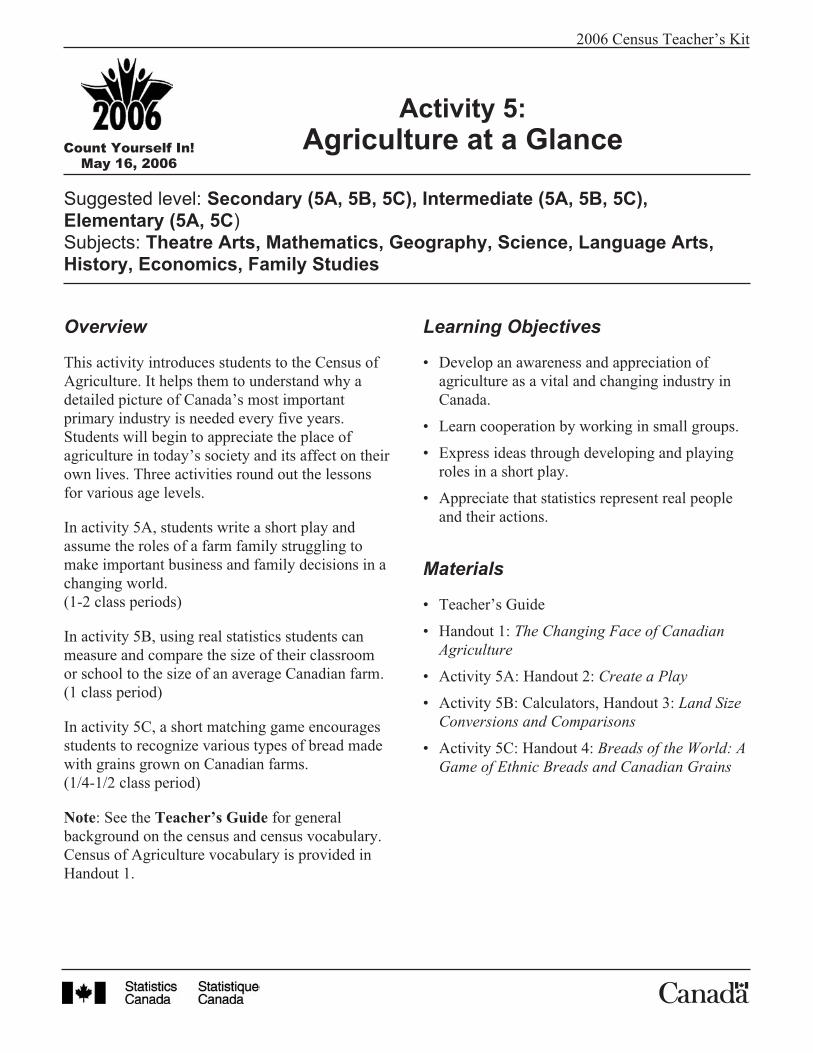
Activity 5:
Agriculture at a Glance
Suggested level: Secondary (5A, 5B, 5C), Intermediate (5A, 5B, 5C),
Elementary (5A, 5C)Subjects: Theatre Arts, Mathematics, Geography, Science, Language Arts,
History, Economics, Family Studies
Overview
This activity introduces students to the Census of
Agriculture. It helps them to understand why a
detailed picture of Canada’s most important
primary industry is needed every five years.
Students will begin to appreciate the place of
agriculture in today’s society and its affect on their
own lives. Three activities round out the lessons
for various age levels.
In activity 5A, students write a short play and
assume the roles of a farm family struggling to
make important business and family decisions in a
changing world.
(1-2 class periods)
In activity 5B, using real statistics students can
measure and compare the size of their classroom
or school to the size of an average Canadian farm.
(1 class period)
In activity 5C, a short matching game encourages
students to recognize various types of bread made
with grains grown on Canadian farms.
(1/4-1/2 class period)
Note: See the Teacher’s Guide for general
background on the census and census vocabulary.
Census of Agriculture vocabulary is provided in
Handout 1.
Learning Objectives
• Develop an awareness and appreciation of
agriculture as a vital and changing industry in
Canada.
• Learn cooperation by working in small groups.
• Express ideas through developing and playing
roles in a short play.
• Appreciate that statistics represent real people
and their actions.
Materials
• Teacher’s Guide
• Handout 1: The Changing Face of Canadian
Agriculture
• Activity 5A: Handout 2: Create a Play
• Activity 5B: Calculators, Handout 3: Land Size
Conversions and Comparisons
• Activity 5C: Handout 4: Breads of the World: A
Game of Ethnic Breads and Canadian Grains
2006 Census Teacher’s Kit
Count Yourself In!May 16, 2006
Getting Started
Explain to your students that the next census takes
place on May 16, 2006. Begin with a general
discussion of the census — what it is and how it is
carried out. (See Teacher’s Guide.) Distribute
Handout 1: The Changing Face of Canadian
Agriculture to your students.
Besides saving money, conducting the Census of
Population and the Census of Agriculture at the
same time every five years allows us to combine
the data so we can compare the farm operator to
the general population. By looking at current
trends, we can predict what is likely to happen in
the future.
Explain how the charts indicate trends. Take turns
reading aloud in class. Discuss the trends in
farming that were identified through the reading.
These include:
• the decreasing number of farms
• the move to larger, more specialized farms
• the increase in the use of technology and
computers
• management of farms by men and women
• the education and aging trend
• new data on farm-related injuries
• farm income and motivation for non-farm work
• why more farm women work off the farm
Choose an activity from 5A, 5B, and 5C.
Census Activity 5A(1-2 classroom periods)
Divide the class into small groups. (The preferred
group size is four, but the exercise can be
conducted by a group of three.)
Distribute Handout 2: Create a Play and read
through the scenarios with the class.
Census Activity 5B(1 classroom period)
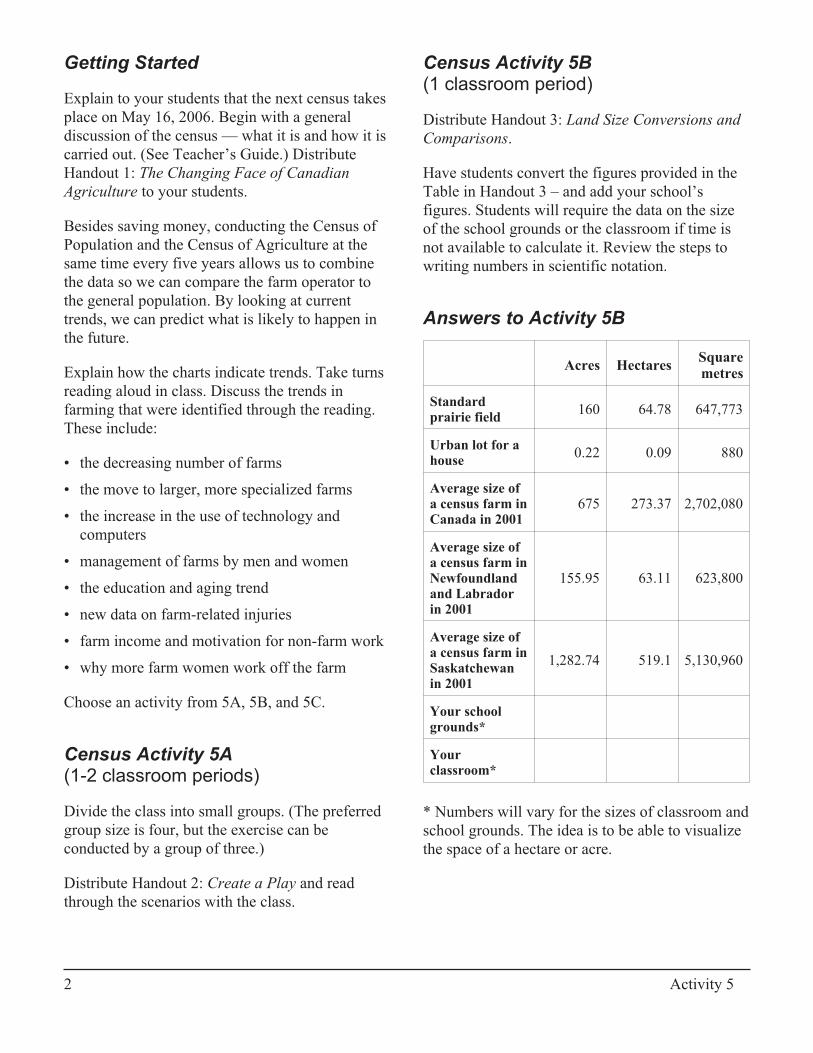
Distribute Handout 3: Land Size Conversions and
Comparisons.
Have students convert the figures provided in the
Table in Handout 3 – and add your school’s
figures. Students will require the data on the size
of the school grounds or the classroom if time is
not available to calculate it. Review the steps to
writing numbers in scientific notation.
Answers to Activity 5B
Acres HectaresSquaremetres
Standardprairie field
160 64.78 647,773
Urban lot for ahouse
0.22 0.09 880
Average size ofa census farm inCanada in 2001
675 273.37 2,702,080
Average size ofa census farm inNewfoundlandand Labradorin 2001
155.95 63.11 623,800
Average size ofa census farm inSaskatchewanin 2001
1,282.74 519.1 5,130,960
Your schoolgrounds*
Yourclassroom*
* Numbers will vary for the sizes of classroom and
school grounds. The idea is to be able to visualize
the space of a hectare or acre.
2 Activity 5
1. The formulas are: 1 acre [a.] = 0.405 hectare; 1
hectare [ha] = 2.47 acres; and 1 hectare =
10,000 square metres [m2].
2. The size of the classroom should be measured
in square metres.
Census Activity 5C (a short game)
Using Handout 4: Breads of the World: A Game of
Ethnic Breads and Canadian Grains, match the
bread name to its grain and description.
Answers: K, J, I, H, G, F, E, D, C, B, A (A-K
backwards)
Extension/Enrichment
Organize a field trip to a nearby farm to study the
farm operation and interview the farm operators.
Invite a guest speaker to class to talk about
farming from his or her perspective. Ask a retired
farmer, a student from an agricultural college, an
agricultural scientist, a representative from
provincial agricultural offices or laboratories, a
real-estate agent, a farm auctioneer or a practising
farmer to come in.
To expand on Activity 5C, ask the students to
bring in samples of the grain products in the main
activity. Bake some bread!
Thirty-eight lessons were designed to compliment
the 2001 edition of Canadian Agriculture at aGlance. Each lesson corresponds with one article
(also provided in PDF format) and focuses on
secondary school curricula in the following subject
areas: Family Studies/Home Economics;
Geography; History; and Science. When online,
access the lesson plans at
www.statcan.ca/english/kits/agric04/lesson.htm
Census of Agriculture data are available at
www.statcan.ca/english/agcensus2001/index.htm.
Activity 5 3
Handout 1: The Changing Face of Canadian Agriculture
1. APPRECIATING AGRICULTURE
Words You’ll Need to Know
biotechnology: a science that relates biology to
technology
diversification: giving variety to, expanding into
different fields
subsistence: a livelihood, a means of staying alive
BSE: Bovine Spongiform Encephalopathy, or
“mad cow disease”
If you’re not living on a farm, studying agriculture
or working in the food industry, what has
Canadian agriculture got to do with you? Plenty!
Canadian farms are where most of your food
comes from, as well as many essential non-edible
products you use daily. Our farms are also part of
one of Canada’s major industries: from the
farmer’s field to your grocery checkout, the
agri-food industry employs hundreds of thousands
of people and contributes billions of dollars to the
economy. Every five years the Census of
Agriculture gives us an updated snapshot of
Canadian farms and the lives of the people who
live and work on them. A census farm is defined
as an agricultural operation producing at least one
agricultural product for sale.
Gross farm receipts is the total revenue from all
farming activities before deducting any expenses.
This is an important concept that can be used to
distinguish farmers whose operation is a business
and their livelihood from those who farm as a
sideline or lifestyle choice.
4 Activity 5
Source: Statistics Canada, Canadian Agriculture at a Glance, 2004Catalogue no. 96-325-XPB
2001 agricultural ecumene Non-agricultural area Census division boundary
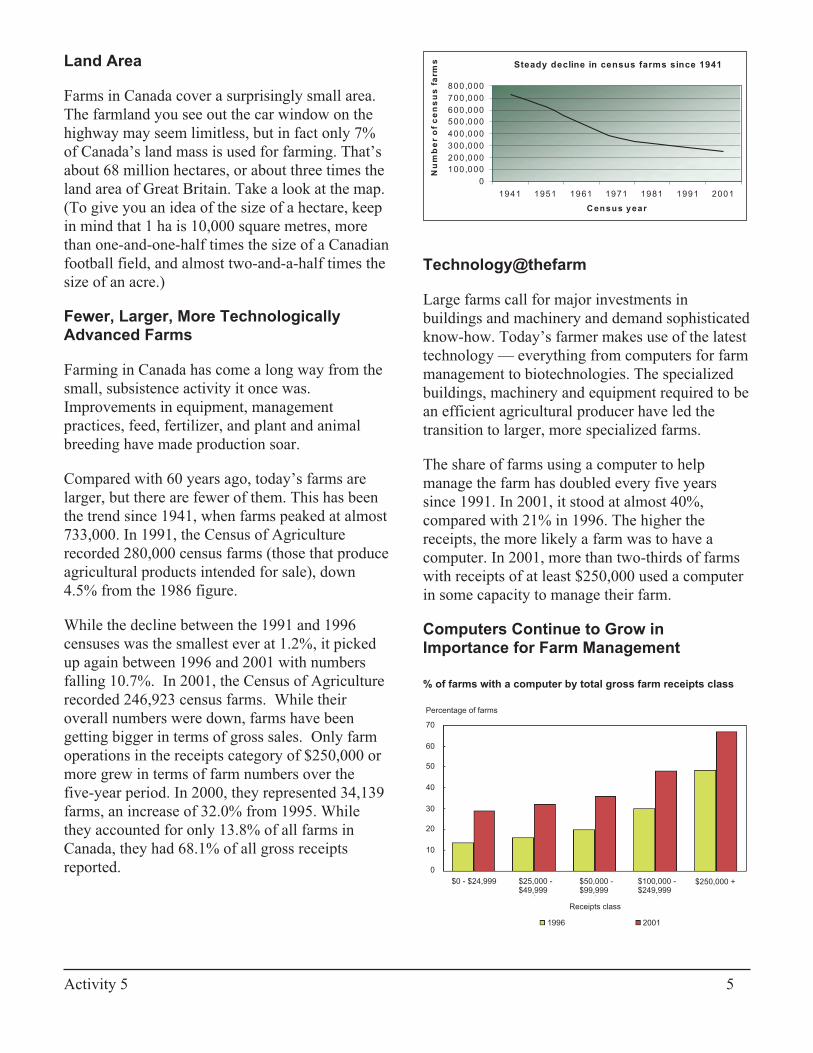
Land Area
Farms in Canada cover a surprisingly small area.
The farmland you see out the car window on the
highway may seem limitless, but in fact only 7%
of Canada’s land mass is used for farming. That’s
about 68 million hectares, or about three times the
land area of Great Britain. Take a look at the map.
(To give you an idea of the size of a hectare, keep
in mind that 1 ha is 10,000 square metres, more
than one-and-one-half times the size of a Canadian
football field, and almost two-and-a-half times the
size of an acre.)
Fewer, Larger, More Technologically
Advanced Farms
Farming in Canada has come a long way from the
small, subsistence activity it once was.
Improvements in equipment, management
practices, feed, fertilizer, and plant and animal
breeding have made production soar.
Compared with 60 years ago, today’s farms are
larger, but there are fewer of them. This has been
the trend since 1941, when farms peaked at almost
733,000. In 1991, the Census of Agriculture
recorded 280,000 census farms (those that produce
agricultural products intended for sale), down
4.5% from the 1986 figure.
While the decline between the 1991 and 1996
censuses was the smallest ever at 1.2%, it picked
up again between 1996 and 2001 with numbers
falling 10.7%. In 2001, the Census of Agriculture
recorded 246,923 census farms. While their
overall numbers were down, farms have been
getting bigger in terms of gross sales. Only farm
operations in the receipts category of $250,000 or
more grew in terms of farm numbers over the
five-year period. In 2000, they represented 34,139
farms, an increase of 32.0% from 1995. While
they accounted for only 13.8% of all farms in
Canada, they had 68.1% of all gross receipts
reported.
Technology@thefarm
Large farms call for major investments in
buildings and machinery and demand sophisticated
know-how. Today’s farmer makes use of the latest
technology — everything from computers for farm
management to biotechnologies. The specialized
buildings, machinery and equipment required to be
an efficient agricultural producer have led the
transition to larger, more specialized farms.
The share of farms using a computer to help
manage the farm has doubled every five years
since 1991. In 2001, it stood at almost 40%,
compared with 21% in 1996. The higher the
receipts, the more likely a farm was to have a
computer. In 2001, more than two-thirds of farms
with receipts of at least $250,000 used a computer
in some capacity to manage their farm.
Computers Continue to Grow in
Importance for Farm Management
% of farms with a computer by total gross farm receipts class
Activity 5 5
Steady decline in census farms since 1941
0
100,000
200,000
300,000
400,000
500,000
600,000
700,000
800,000
1941 1951 1961 1971 1981 1991 2001
Census year
Nu
mb
er
of
ce
ns
us
fa
rm
s
Percentage of farms
$25,000 -$49,999
$50,000 -$99,999
$100,000 -$249,999
$250,000 +$0 - $24,999
1996 2001
Receipts class
70
60
50
40
30
20
10
0
Types of Farming
A wide variety of farming takes place in Canada.
Livestock products include hogs, poultry, dairy
cattle and beef cattle. Although wheat is still
popular, more and more Canadian farmers are
growing a variety of other crops. These include
oats, dry field peas, mustard seed, canary seed and
dry coloured beans. Farmers are also growing
other grain and oilseed products such as canola,
barley, rye, corn, soybeans, and flax. Other crops
include vegetables, fruits, root crops, tobacco, and
forest products.
Specific types of farming are associated with
certain provinces — potatoes in Prince Edward
Island, corn in Ontario, wheat in Saskatchewan,
beef in Alberta — but such generalizations create
inaccurate pictures of farming in Canada. Table –
Agriculture Profile of Canada, on page 9, gives a
clearer picture of agricultural practices in each
province. In fact, if you look at where different
types of farming are located in Canada, it is clear
that diversification, or producing a variety of
products, is common within each province.
Production and Consumption Trends
The types and quantity of farm goods Canadians
produce depend very much on consumer demand,
both at home and abroad. Grains and oilseeds
continue to be key products, particularly for the
export market.
Production of canola, Canada’s major oilseed, rose
significantly in the 1980s and 1990s. The global
market for this high-quality edible oil will likely
continue to expand.
Farmers reported record levels of both cattle and
hogs as of May 15, 2001. The number of cattle on
Canadian farms rose 4.4% between 1996 and
2001, to a record 15.6 million head. The number of
hogs also reached record highs, at 13.9 million —
a 26.4% jump.
Shortly after the 2001 Census was completed BSE
was discovered in a Canadian cattle herd. The
subsequent loss of markets has caused a great deal
of hardship for many in the agricultural sector.
The 2006 Census of Agriculture will help to
establish just how farmers have been affected and
how they are reacting.
2. WHO’S DOWN ON THE FARM?
In 1941, just under 3.2 million people lived on
farms, more than 25% of Canada’s overall
population. Since the Second World War, the
proportion of people living on farms has dropped
drastically. At the time of the 2001 Census of
Agriculture, Canada’s farm population was
727,125, about 2.4% of the overall population.
Between 1991 and 1996 the farm population
declined 1.7%, while between 1996 and 2001, it
declined 14.6%. Farm families are getting
smaller, which is one reason for the decline in the
farm population. At the same time, there are
proportionately more seniors operating farms.
The 2001 Census counted 32,995 farm operators
who were immigrants, about one-tenth of the total
number of farmers. Between a third and one-half
of immigrant farmers from the Netherlands, the
United Kingdom and Germany, the three most
frequent countries of birth for immigrant farmers,
came to Canada before 1961.
Farm Operators — Men and Women
Between 1996 and 2001, the number of farm
operators in Canada declined 10% to 346,200,
which mirrored a 10.7% decrease in the number of
farms. A farm operator is defined as a person
responsible for the day-to-day management
decisions in the operation of a census farm or
agricultural operation.
Women represented just over one-quarter of all
farm operators, virtually the same proportion as in
1996.
British Columbia reported the highest share of
female farm operators (36%).
6 Activity 5
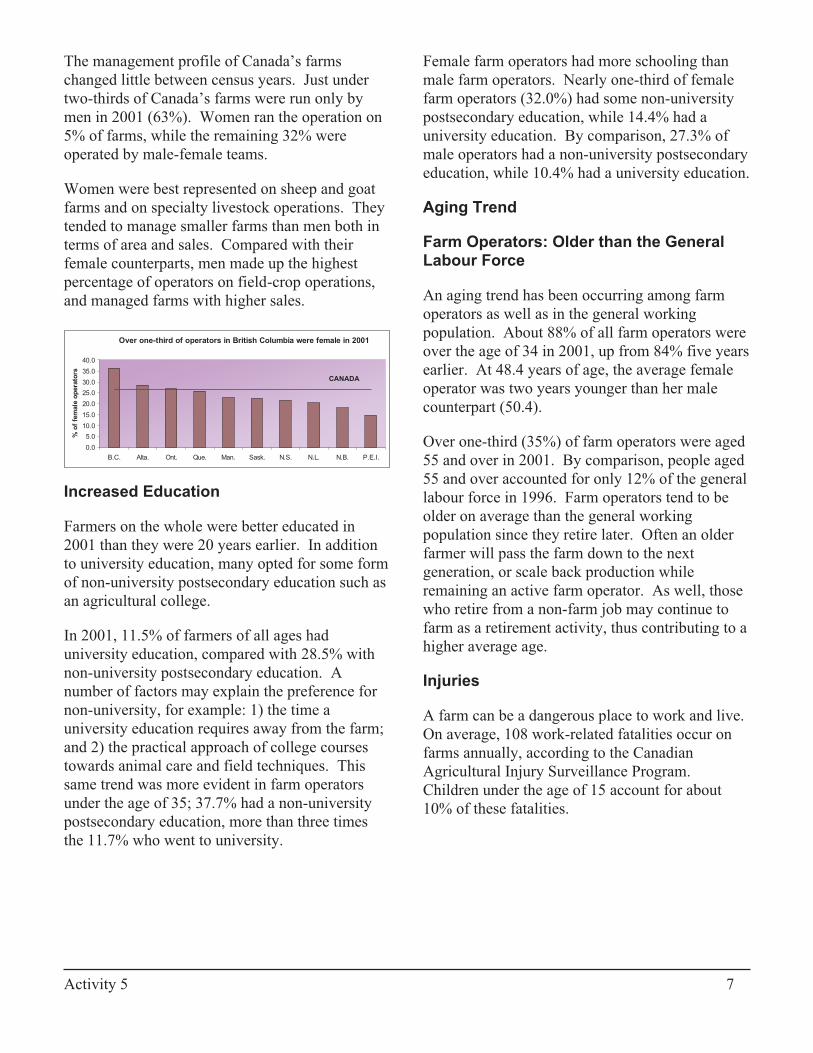
The management profile of Canada’s farms
changed little between census years. Just under
two-thirds of Canada’s farms were run only by
men in 2001 (63%). Women ran the operation on
5% of farms, while the remaining 32% were
operated by male-female teams.
Women were best represented on sheep and goat
farms and on specialty livestock operations. They
tended to manage smaller farms than men both in
terms of area and sales. Compared with their
female counterparts, men made up the highest
percentage of operators on field-crop operations,
and managed farms with higher sales.
Increased Education
Farmers on the whole were better educated in
2001 than they were 20 years earlier. In addition
to university education, many opted for some form
of non-university postsecondary education such as
an agricultural college.
In 2001, 11.5% of farmers of all ages had
university education, compared with 28.5% with
non-university postsecondary education. A
number of factors may explain the preference for
non-university, for example: 1) the time a
university education requires away from the farm;
and 2) the practical approach of college courses
towards animal care and field techniques. This
same trend was more evident in farm operators
under the age of 35; 37.7% had a non-university
postsecondary education, more than three times
the 11.7% who went to university.
Female farm operators had more schooling than
male farm operators. Nearly one-third of female
farm operators (32.0%) had some non-university
postsecondary education, while 14.4% had a
university education. By comparison, 27.3% of
male operators had a non-university postsecondary
education, while 10.4% had a university education.
Aging Trend
Farm Operators: Older than the General
Labour Force
An aging trend has been occurring among farm
operators as well as in the general working
population. About 88% of all farm operators were
over the age of 34 in 2001, up from 84% five years
earlier. At 48.4 years of age, the average female
operator was two years younger than her male
counterpart (50.4).
Over one-third (35%) of farm operators were aged
55 and over in 2001. By comparison, people aged
55 and over accounted for only 12% of the general
labour force in 1996. Farm operators tend to be
older on average than the general working
population since they retire later. Often an older
farmer will pass the farm down to the next
generation, or scale back production while
remaining an active farm operator. As well, those
who retire from a non-farm job may continue to
farm as a retirement activity, thus contributing to a
higher average age.
Injuries
A farm can be a dangerous place to work and live.
On average, 108 work-related fatalities occur on
farms annually, according to the Canadian
Agricultural Injury Surveillance Program.
Children under the age of 15 account for about
10% of these fatalities.
Activity 5 7
Over one-third of operators in British Columbia were female in 2001
0.0
5.0
10.0
15.0
20.0
25.0
30.0
35.0
40.0
B.C. Alta. Ont. Que. Man. Sask. N.S. N.L. N.B. P.E.I.
%o
ffe
male
op
erato
rs
CANADA
In 2001, the Census of Agriculture collected data
about farm-related injuries sustained by farmers.
The census found that more than 11,000 operators
or 3.2% of the total were injured on the farm in
2000, the last full year prior to the census. Farmers
on livestock farms had higher injury rates than
those on other types of farms. Male operators
were nearly twice as likely to be injured as their
female counterparts. The injury rate for men was
3.7% compared to 1.9% for women.
Majority of Operators Work Only on the
Farm
The majority (55.5%) of farm operators worked
only on the farm in 2000, up slightly from 1995.
Only marginally more female farm operators
reported working off the farm than their male
colleagues in 2000. Those with non-farm work
included two groups of operators, those who
worked off the farm or operated another business
to help make ends meet, as well as those who had
non-farm work and farmed as a sideline or hobby.
Families on Unincorporated Farms
Wages and salaries remained the biggest source of
income for farm families on unincorporated farms.
In 2000, wages and salaries accounted for 57 cents
of every dollar in total farm income. Net farm
income was the second highest contributor to total
family income at 18 cents of every dollar.
One reason that wages and salaries have grown in
importance is the volatility of agricultural prices.
Over time, farm families have diversified their
income sources by seeking work off the farm as
one way to stabilize their total income. For other
families, farming could be considered a secondary
occupation or even a hobby, and is not expected to
provide the family with significant disposable
income.
Those families who earned at least half their
income in agriculture were more likely to be
involved in dairy, hogs, poultry and egg, wheat, or
grain and oilseed farming.
More Farm Women Work Off the Farm
Women have always played an essential role on
Canadian farms. Now they are playing more of a
role in their surrounding communities, as more
farm women are working off the farm. In 1971
approximately 45% of all Canadian women
(between the ages of 15 and 64) were in the labour
force. Of all farm women, 43% were in the labour
force. By 2001, 70% of all women (between the
ages of 15 and 64) were in the labour force. For
farm women the proportion had jumped to 83%.
Is it only a paycheque that has lured women off
the farm? That’s important, but other reasons
factor in too. Agriculture is changing, and with it
the traditional role of “farm wife.” Small
family-run operations such as dairy farms are
giving way to larger operations. Mechanization
and hired labour — both essential on large crop or
livestock operations — have changed the
traditional roles of women and other farm family
members.
Today proportionately more farm women hold
diplomas and degrees. Having a postsecondary
education affords more options in terms of
off-farm work. The numbers back this up. In
2001, 29% of farm women between 15 and 64
with a non-agricultural job had completed
postsecondary education, compared with 24% of
women working on the farm.
8 Activity 5
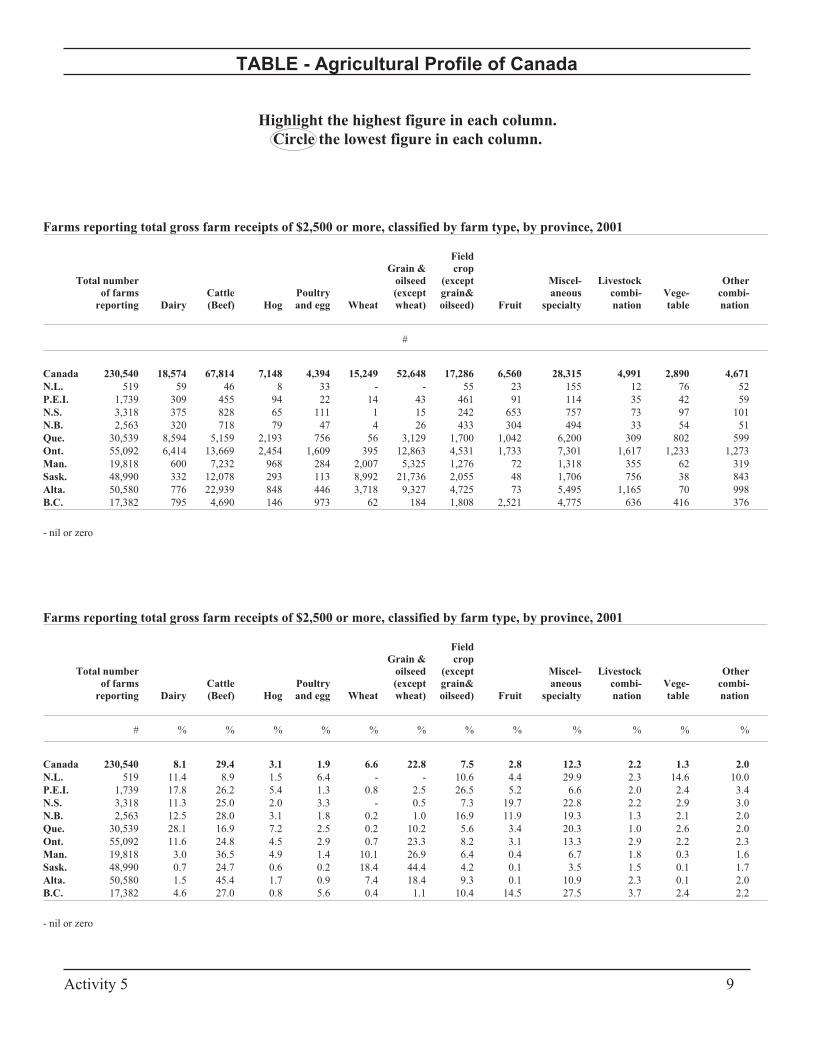
TABLE - Agricultural Profile of Canada
Activity 5 9
Highlight the highest figure in each column.
Circle the lowest figure in each column.
Farms reporting total gross farm receipts of $2,500 or more, classified by farm type, by province, 2001
Field
Grain & crop
Total number oilseed (except Miscel- Livestock Other
of farms Cattle Poultry (except grain& aneous combi- Vege- combi-
reporting Dairy (Beef) Hog and egg Wheat wheat) oilseed) Fruit specialty nation table nation
#
Canada 230,540 18,574 67,814 7,148 4,394 15,249 52,648 17,286 6,560 28,315 4,991 2,890 4,671
N.L. 519 59 46 8 33 - - 55 23 155 12 76 52
P.E.I. 1,739 309 455 94 22 14 43 461 91 114 35 42 59
N.S. 3,318 375 828 65 111 1 15 242 653 757 73 97 101
N.B. 2,563 320 718 79 47 4 26 433 304 494 33 54 51
Que. 30,539 8,594 5,159 2,193 756 56 3,129 1,700 1,042 6,200 309 802 599
Ont. 55,092 6,414 13,669 2,454 1,609 395 12,863 4,531 1,733 7,301 1,617 1,233 1,273
Man. 19,818 600 7,232 968 284 2,007 5,325 1,276 72 1,318 355 62 319
Sask. 48,990 332 12,078 293 113 8,992 21,736 2,055 48 1,706 756 38 843
Alta. 50,580 776 22,939 848 446 3,718 9,327 4,725 73 5,495 1,165 70 998
B.C. 17,382 795 4,690 146 973 62 184 1,808 2,521 4,775 636 416 376
- nil or zero
Farms reporting total gross farm receipts of $2,500 or more, classified by farm type, by province, 2001
Field
Grain & crop
Total number oilseed (except Miscel- Livestock Other
of farms Cattle Poultry (except grain& aneous combi- Vege- combi-
reporting Dairy (Beef) Hog and egg Wheat wheat) oilseed) Fruit specialty nation table nation
# % % % % % % % % % % % %
Canada 230,540 8.1 29.4 3.1 1.9 6.6 22.8 7.5 2.8 12.3 2.2 1.3 2.0
N.L. 519 11.4 8.9 1.5 6.4 - - 10.6 4.4 29.9 2.3 14.6 10.0
P.E.I. 1,739 17.8 26.2 5.4 1.3 0.8 2.5 26.5 5.2 6.6 2.0 2.4 3.4
N.S. 3,318 11.3 25.0 2.0 3.3 - 0.5 7.3 19.7 22.8 2.2 2.9 3.0
N.B. 2,563 12.5 28.0 3.1 1.8 0.2 1.0 16.9 11.9 19.3 1.3 2.1 2.0
Que. 30,539 28.1 16.9 7.2 2.5 0.2 10.2 5.6 3.4 20.3 1.0 2.6 2.0
Ont. 55,092 11.6 24.8 4.5 2.9 0.7 23.3 8.2 3.1 13.3 2.9 2.2 2.3
Man. 19,818 3.0 36.5 4.9 1.4 10.1 26.9 6.4 0.4 6.7 1.8 0.3 1.6
Sask. 48,990 0.7 24.7 0.6 0.2 18.4 44.4 4.2 0.1 3.5 1.5 0.1 1.7
Alta. 50,580 1.5 45.4 1.7 0.9 7.4 18.4 9.3 0.1 10.9 2.3 0.1 2.0
B.C. 17,382 4.6 27.0 0.8 5.6 0.4 1.1 10.4 14.5 27.5 3.7 2.4 2.2
- nil or zero
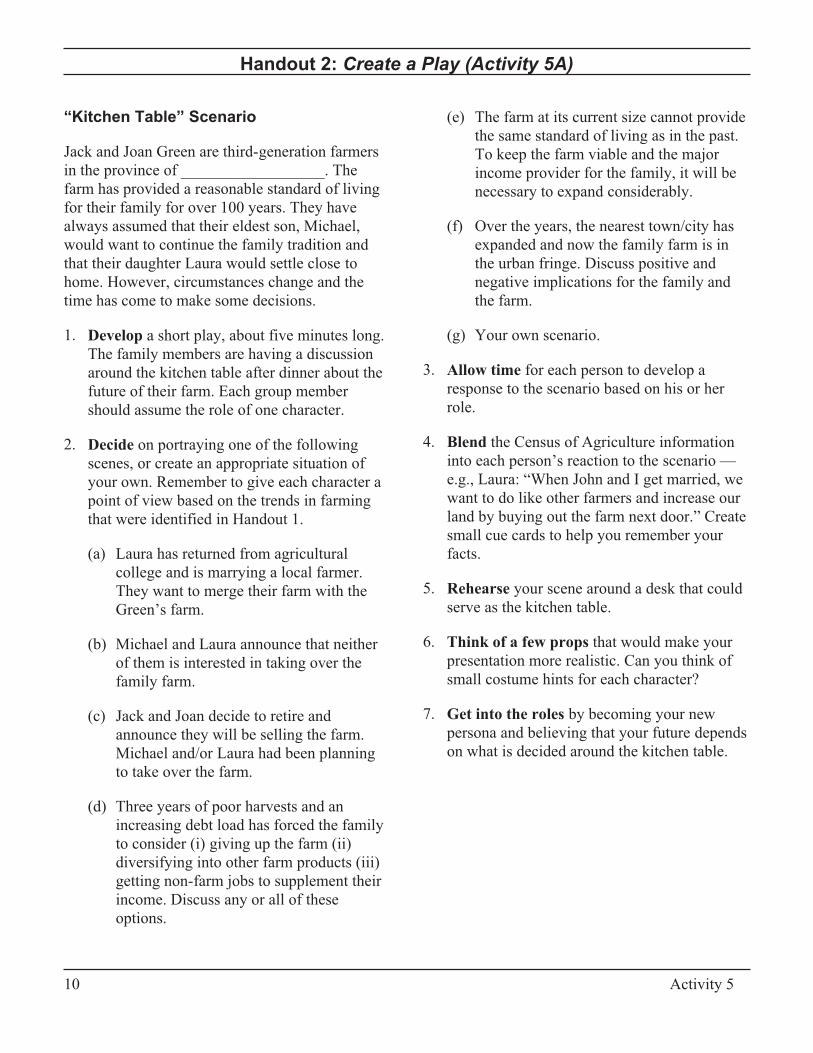
Handout 2: Create a Play (Activity 5A)
“Kitchen Table” Scenario
Jack and Joan Green are third-generation farmers
in the province of __________________. The
farm has provided a reasonable standard of living
for their family for over 100 years. They have
always assumed that their eldest son, Michael,
would want to continue the family tradition and
that their daughter Laura would settle close to
home. However, circumstances change and the
time has come to make some decisions.
1. Develop a short play, about five minutes long.
The family members are having a discussion
around the kitchen table after dinner about the
future of their farm. Each group member
should assume the role of one character.
2. Decide on portraying one of the following
scenes, or create an appropriate situation of
your own. Remember to give each character a
point of view based on the trends in farming
that were identified in Handout 1.
(a) Laura has returned from agricultural
college and is marrying a local farmer.
They want to merge their farm with the
Green’s farm.
(b) Michael and Laura announce that neither
of them is interested in taking over the
family farm.
(c) Jack and Joan decide to retire and
announce they will be selling the farm.
Michael and/or Laura had been planning
to take over the farm.
(d) Three years of poor harvests and an
increasing debt load has forced the family
to consider (i) giving up the farm (ii)
diversifying into other farm products (iii)
getting non-farm jobs to supplement their
income. Discuss any or all of these
options.
(e) The farm at its current size cannot provide
the same standard of living as in the past.
To keep the farm viable and the major
income provider for the family, it will be
necessary to expand considerably.
(f) Over the years, the nearest town/city has
expanded and now the family farm is in
the urban fringe. Discuss positive and
negative implications for the family and
the farm.
(g) Your own scenario.
3. Allow time for each person to develop a
response to the scenario based on his or her
role.
4. Blend the Census of Agriculture information
into each person’s reaction to the scenario —
e.g., Laura: “When John and I get married, we
want to do like other farmers and increase our
land by buying out the farm next door.” Create
small cue cards to help you remember your
facts.
5. Rehearse your scene around a desk that could
serve as the kitchen table.
6. Think of a few props that would make your
presentation more realistic. Can you think of
small costume hints for each character?
7. Get into the roles by becoming your new
persona and believing that your future depends
on what is decided around the kitchen table.
10 Activity 5
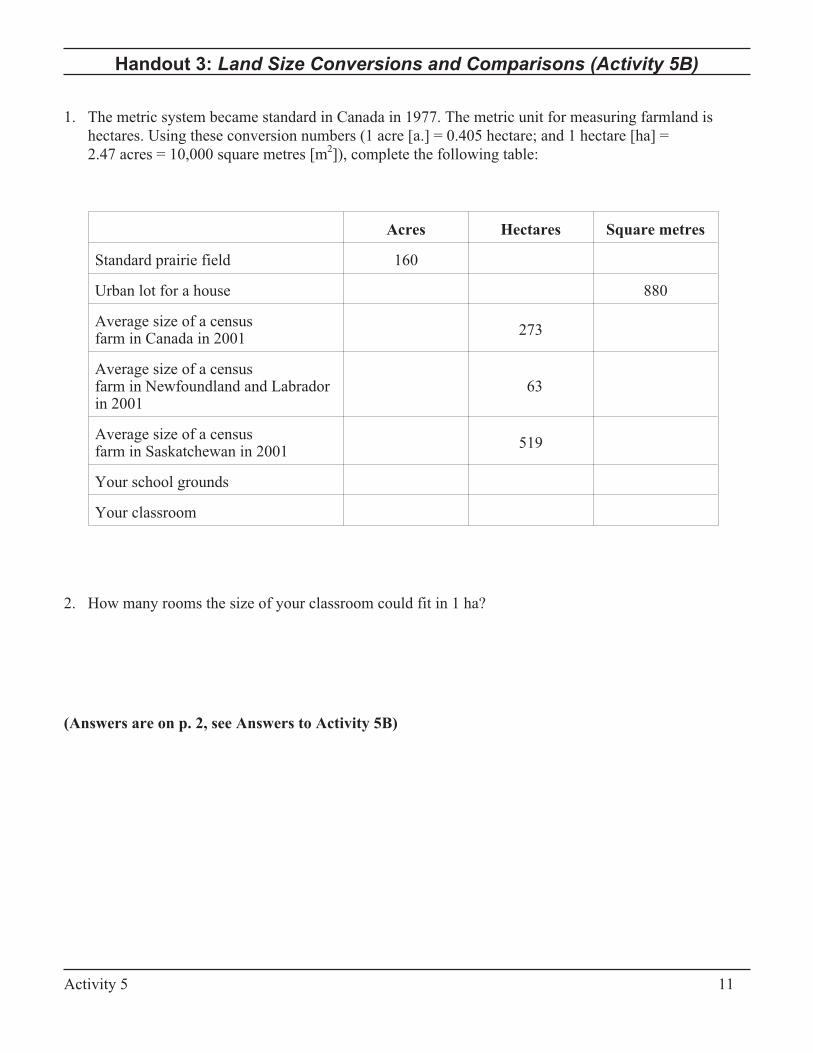
Handout 3: Land Size Conversions and Comparisons (Activity 5B)
1. The metric system became standard in Canada in 1977. The metric unit for measuring farmland is
hectares. Using these conversion numbers (1 acre [a.] = 0.405 hectare; and 1 hectare [ha] =
2.47 acres = 10,000 square metres [m2]), complete the following table:
2. How many rooms the size of your classroom could fit in 1 ha?
(Answers are on p. 2, see Answers to Activity 5B)
Activity 5 11
Acres Hectares Square metres
Standard prairie field 160
Urban lot for a house 880
Average size of a censusfarm in Canada in 2001
273
Average size of a censusfarm in Newfoundland and Labradorin 2001
63
Average size of a censusfarm in Saskatchewan in 2001
519
Your school grounds
Your classroom
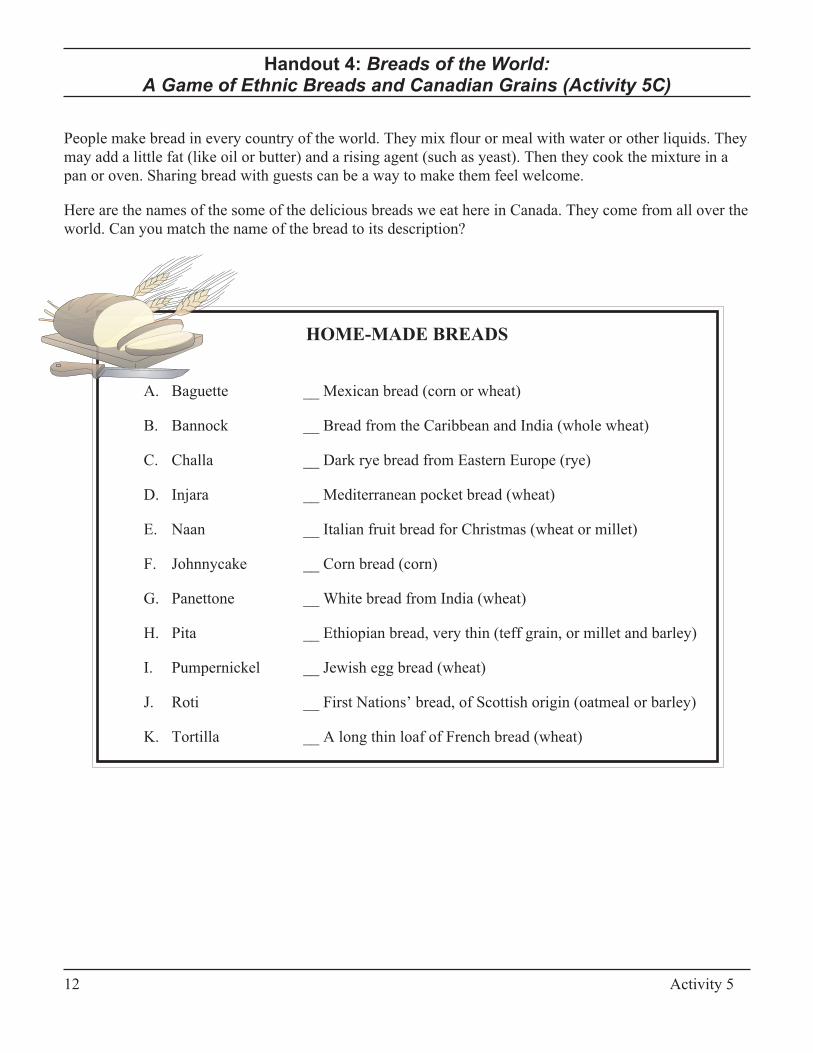
Handout 4: Breads of the World:A Game of Ethnic Breads and Canadian Grains (Activity 5C)
People make bread in every country of the world. They mix flour or meal with water or other liquids. They
may add a little fat (like oil or butter) and a rising agent (such as yeast). Then they cook the mixture in a
pan or oven. Sharing bread with guests can be a way to make them feel welcome.
Here are the names of the some of the delicious breads we eat here in Canada. They come from all over the
world. Can you match the name of the bread to its description?
HOME-MADE BREADS
A. Baguette __ Mexican bread (corn or wheat)
B. Bannock __ Bread from the Caribbean and India (whole wheat)
C. Challa __ Dark rye bread from Eastern Europe (rye)
D. Injara __ Mediterranean pocket bread (wheat)
E. Naan __ Italian fruit bread for Christmas (wheat or millet)
F. Johnnycake __ Corn bread (corn)
G. Panettone __ White bread from India (wheat)
H. Pita __ Ethiopian bread, very thin (teff grain, or millet and barley)
I. Pumpernickel __ Jewish egg bread (wheat)
J. Roti __ First Nations’ bread, of Scottish origin (oatmeal or barley)
K. Tortilla __ A long thin loaf of French bread (wheat)
12 Activity 5
Activity 6:
Immigration
Suggested Level: Intermediate, Intermediate ESL
Subjects: Mathematics, Geography, History, Family Studies, Language Arts,
Social Studies
Overview
This activity provides students with an
understanding of the multicultural nature of
Canadian society. Students complete a series of
graphs showing Canada’s immigration patterns
over time. They examine Canadian immigration,
including place of birth, language, and the
changing proportion of immigrants. They learn
how this information is gathered through a census,
and carry out a small survey. (1-2 class periods)
Note: See the Teacher’s Guide for general
background on the census and census vocabulary.
Learning Objectives
• Develop an awareness and appreciation of
Canada’s cultural diversity.
• Use graphing techniques to illustrate
immigration data.
• Identify changes in data over time.
• Understand language questions from the 2006
Census questionnaire.
• Compile data to make up a class profile.
• Analyse data and write a report.
Vocabulary
Census, census metropolitan area, immigration,
multicultural, place of birth, population, stacked
column, statistics
Materials
• Teacher’s Guide
• Classroom map of the world (not included)
• Handout 1: Graphing Immigration
• Handout 2: Map of Immigration Source Areas
• Handout 3: 2006 Census Questions on
Language
Getting Started
1. Tell the students the next census takes place on
May 16, 2006. Begin with a general discussion
of the census — what it is and how it is carried
out. Mention that immigrants to Canada come
from many different countries and speak many
different languages. (See the Teacher’s Guide.)
2006 Census Teacher’s Kit
Count Yourself In!May 16, 2006
2. Review Handout 1: Graphing Immigration and
Handout 2: Map of Immigration Source Areas
focusing on the categories used for place of
birth, and help students locate these on the
world map. The students will be learning about
immigration to Canada and the changes that
have occurred over 40 years.
3. Make sure everyone understands the
instructions for graphing. Examine the results
of the graphing together as a class.
Census Activity
1. Look at the bar graph in Handout 1, and
identify trends in immigration.
During the period 1961-1970, where did most
of Canada’s immigrants come from? How does
this compare with 1981-1991 and 1991-2001?
Discuss the trends of the other immigrant
populations mentioned in the graph.
2. Steer discussion from immigration to how it
affects the variety of languages spoken in
Canada. Note that the census not only requests
information on the place of birth, but also
language(s). Mention that all responses to
census questions are kept strictly confidential.
Distribute copies of Handout 3: 2006 Census
Questions on Language to the class and have
students fill in their answers.
Write the names of the languages reported in
Handout 3 on the blackboard and record the
number of students who speak each one.
Discuss briefly the findings of this small
classroom survey.
Extension/Enrichment
1. Students could write a brief report describing
trends in immigration to Canada between 1961
and 2001.
2. Students could write a brief summary (five to
eight sentences) about the class survey on
language.
3. Working in small groups of two to three,
students could prepare a bar graph showing
languages spoken at home by members of the
class.
4. Ask students to visit Statistics Canada’s 2006
Census Web site (www.census2006.ca).
Choose the “Multimedia presentations of
census data” link to view “The one hundred
years of immigration to Canada (1901-2001)”
presentation.
2 Activity 6
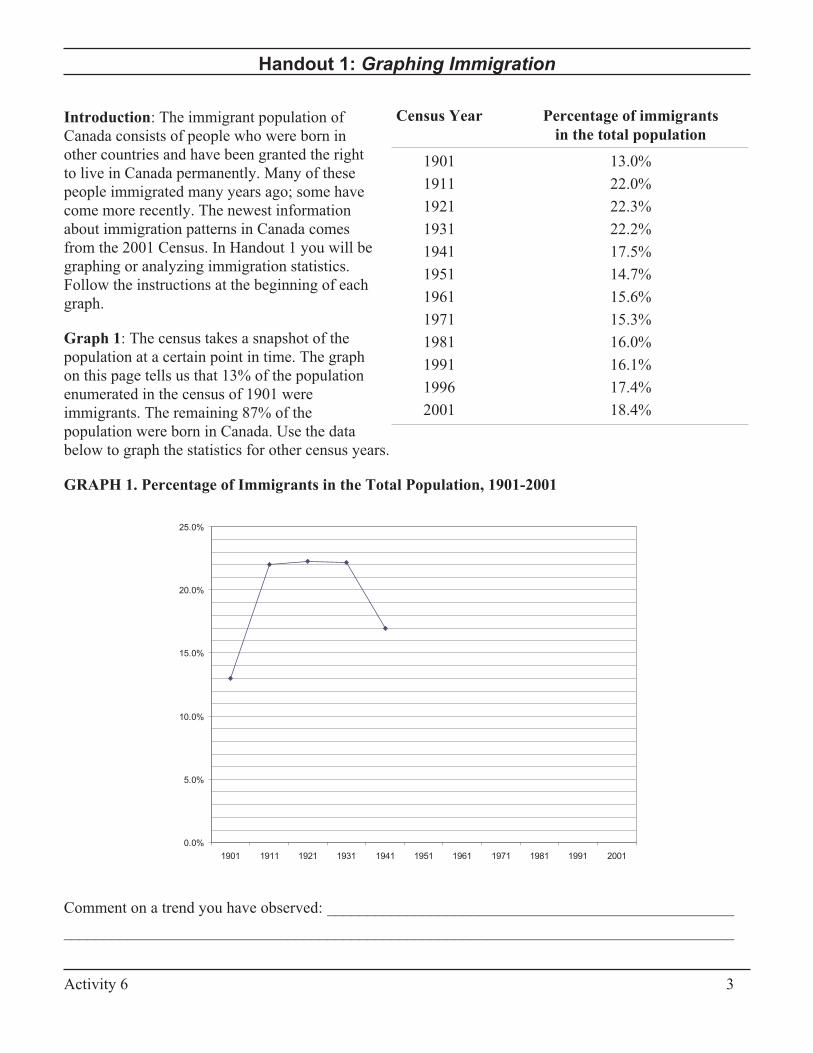
Handout 1: Graphing Immigration
Introduction: The immigrant population of
Canada consists of people who were born in
other countries and have been granted the right
to live in Canada permanently. Many of these
people immigrated many years ago; some have
come more recently. The newest information
about immigration patterns in Canada comes
from the 2001 Census. In Handout 1 you will be
graphing or analyzing immigration statistics.
Follow the instructions at the beginning of each
graph.
Graph 1: The census takes a snapshot of the
population at a certain point in time. The graph
on this page tells us that 13% of the population
enumerated in the census of 1901 were
immigrants. The remaining 87% of the
population were born in Canada. Use the data
below to graph the statistics for other census years.
GRAPH 1. Percentage of Immigrants in the Total Population, 1901-2001
Comment on a trend you have observed: ___________________________________________________
____________________________________________________________________________________
Activity 6 3
Census Year Percentage of immigrants
in the total population
1901 13.0%
1911 22.0%
1921 22.3%
1931 22.2%
1941 17.5%
1951 14.7%
1961 15.6%
1971 15.3%
1981 16.0%
1991 16.1%
1996 17.4%
2001 18.4%
0.0%
5.0%
10.0%
15.0%
20.0%
25.0%
1901 1911 1921 1931 1941 1951 1961 1971 1981 1991 2001
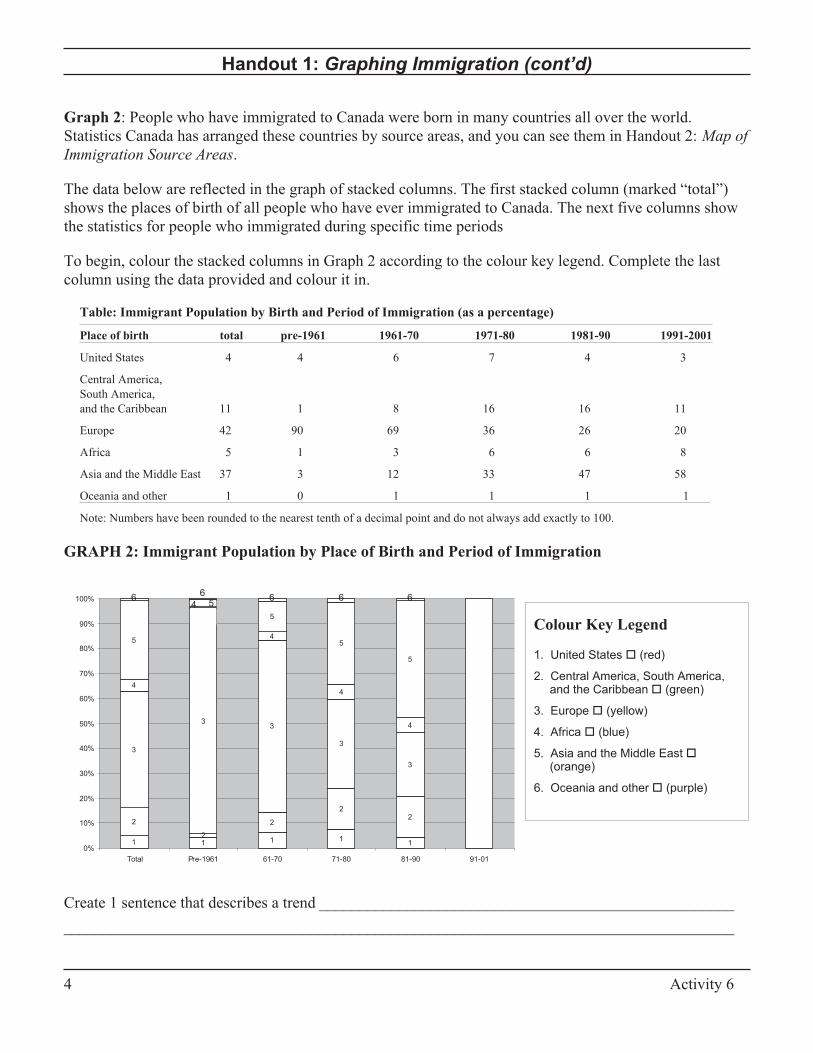
Handout 1: Graphing Immigration (cont’d)
Graph 2: People who have immigrated to Canada were born in many countries all over the world.
Statistics Canada has arranged these countries by source areas, and you can see them in Handout 2: Map of
Immigration Source Areas.
The data below are reflected in the graph of stacked columns. The first stacked column (marked “total”)
shows the places of birth of all people who have ever immigrated to Canada. The next five columns show
the statistics for people who immigrated during specific time periods
To begin, colour the stacked columns in Graph 2 according to the colour key legend. Complete the last
column using the data provided and colour it in.
Table: Immigrant Population by Birth and Period of Immigration (as a percentage)
Place of birth total pre-1961 1961-70 1971-80 1981-90 1991-2001
United States 4 4 6 7 4 3
Central America,
South America,
and the Caribbean 11 1 8 16 16 11
Europe 42 90 69 36 26 20
Africa 5 1 3 6 6 8
Asia and the Middle East 37 3 12 33 47 58
Oceania and other 1 0 1 1 1 1
Note: Numbers have been rounded to the nearest tenth of a decimal point and do not always add exactly to 100.
GRAPH 2: Immigrant Population by Place of Birth and Period of Immigration
Create 1 sentence that describes a trend ____________________________________________________
____________________________________________________________________________________
4 Activity 6
1 1 1 11
2
2
2
22
3
33
3
3
4
4
4
4
5
5
5
5
4
5
66 6 66
0%
10%
20%
30%
40%
50%
60%
70%
80%
90%
100%
Total Pre-1961 61-70 71-80 81-90 91-01
Colour Key Legend
1. United States � (red)
2. Central America, South America,and the Caribbean� (green)
3. Europe � (yellow)
4. Africa � (blue)
5. Asia and the Middle East�(orange)
6. Oceania and other� (purple)
54
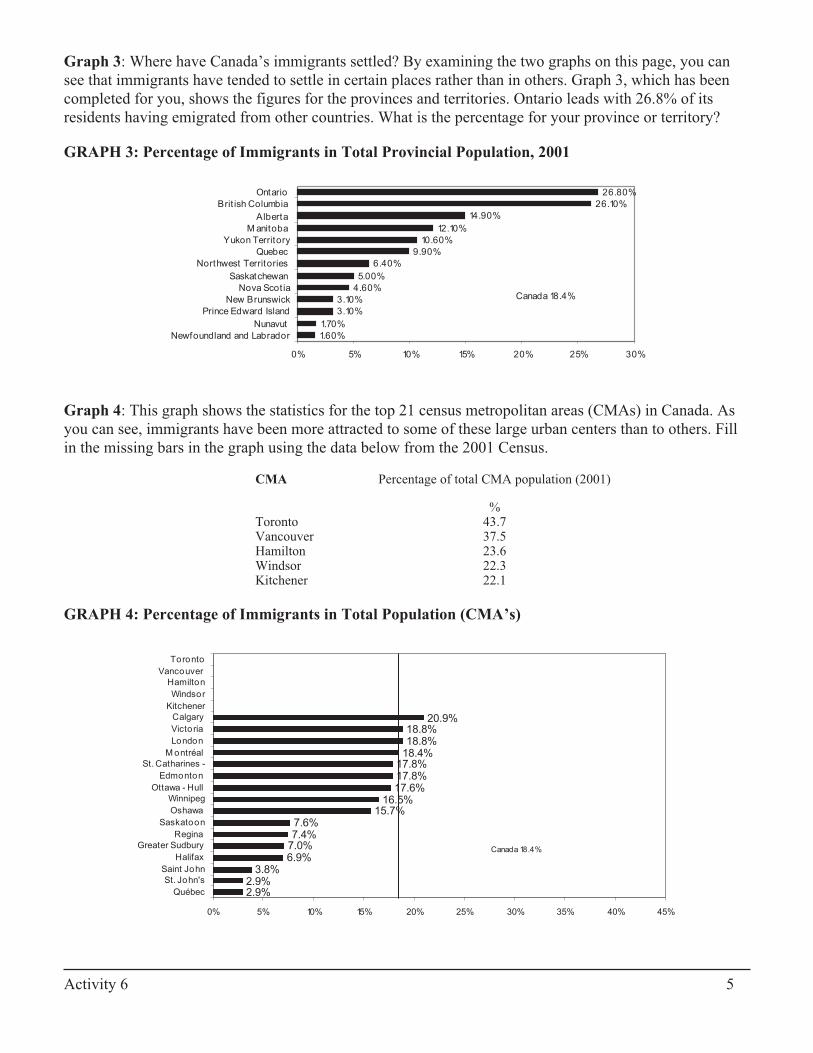
Graph 3: Where have Canada’s immigrants settled? By examining the two graphs on this page, you can
see that immigrants have tended to settle in certain places rather than in others. Graph 3, which has been
completed for you, shows the figures for the provinces and territories. Ontario leads with 26.8% of its
residents having emigrated from other countries. What is the percentage for your province or territory?
GRAPH 3: Percentage of Immigrants in Total Provincial Population, 2001
Graph 4: This graph shows the statistics for the top 21 census metropolitan areas (CMAs) in Canada. As
you can see, immigrants have been more attracted to some of these large urban centers than to others. Fill
in the missing bars in the graph using the data below from the 2001 Census.
CMA Percentage of total CMA population (2001)
%Toronto 43.7Vancouver 37.5Hamilton 23.6Windsor 22.3Kitchener 22.1
GRAPH 4: Percentage of Immigrants in Total Population (CMA’s)
Activity 6 5
1.60%
1.70%
3.10%
3.10%
4.60%
5.00%
6.40%
9.90%
10.60%
12.10%
14.90%
26.10%
26.80%
0% 5% 10% 15% 20% 25% 30%
Newfoundland and Labrador
Nunavut
Prince Edward Island
New Brunswick
Nova Scot ia
Saskatchewan
Northwest Territories
Quebec
Yukon Territory
M anitoba
Alberta
Brit ish Columbia
Ontario
Canada 18.4%
2.9%2.9%
3.8%6.9%7.0%7.4%7.6%
15.7%16.5%
17.6%17.8%17.8%18.4%18.8%18.8%
20.9%
0% 5% 10% 15% 20% 25% 30% 35% 40% 45%
Québec
St. John's
Saint John
Halifax
Greater Sudbury
Regina
Saskatoon
Oshawa
Winnipeg
Ottawa - Hull
Edmonton
St. Catharines -
M ontréal
London
Victoria
Calgary
Kitchener
Windsor
Hamilton
Vancouver
Toronto
Canada 18.4%
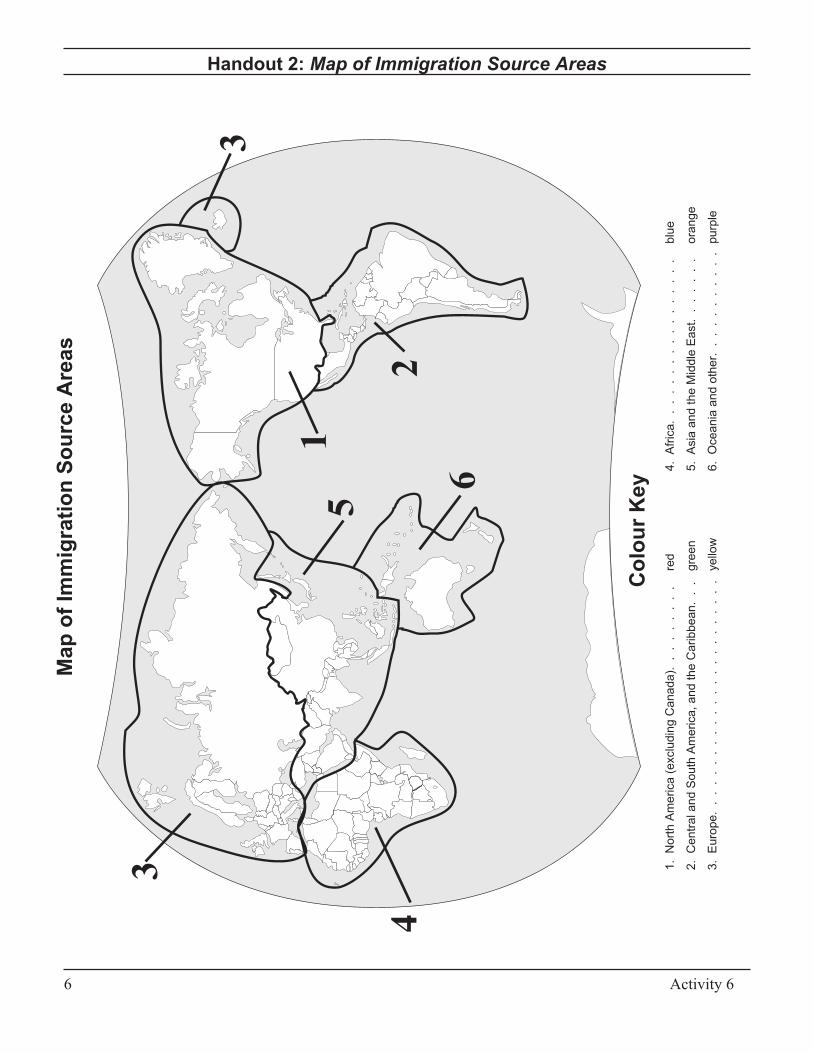
Handout 2: Map of Immigration Source Areas
6 Activity 6
3
2
1
6
5
4
3
Map
of
Imm
igrati
on
So
urce
Areas
Co
lou
rK
ey
1.
Nort
hA
merica
(exclu
din
gC
anada).
..
..
..
..
red
2.
Centr
aland
South
Am
erica,
and
the
Caribbean.
..
gre
en
3.
Euro
pe.
..
..
..
..
..
..
..
..
..
..
..
.yello
w
4.
Afr
ica.
..
..
..
..
..
..
..
..
blu
e
5.
Asia
and
the
Mid
dle
East.
..
..
..
ora
nge
6.
Oceania
and
oth
er.
..
..
..
..
..
purp
le
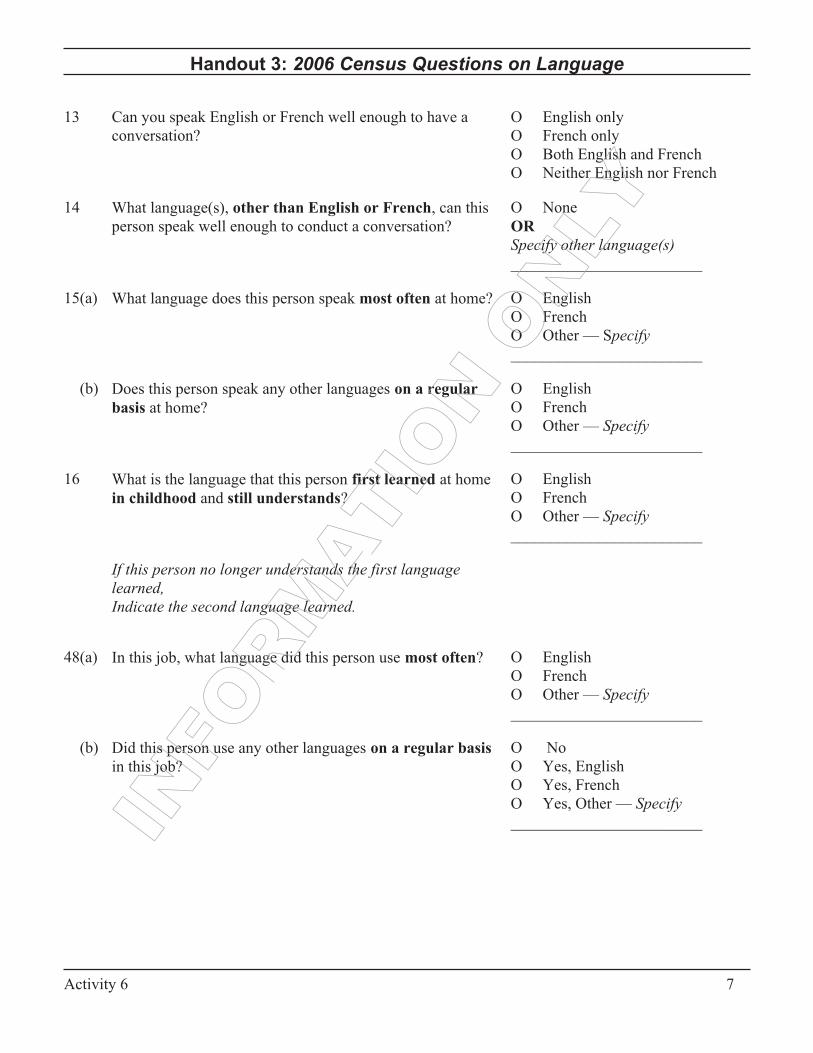
Handout 3: 2006 Census Questions on Language
13 Can you speak English or French well enough to have a
conversation?
O English only
O French only
O Both English and French
O Neither English nor French
14 What language(s), other than English or French, can this
person speak well enough to conduct a conversation?
O None
OR
Specify other language(s)
________________________
15(a) What language does this person speak most often at home? O English
O French
O Other — Specify
________________________
(b) Does this person speak any other languages on a regular
basis at home?
O English
O French
O Other — Specify
________________________
16 What is the language that this person first learned at home
in childhood and still understands?
O English
O French
O Other — Specify
________________________
If this person no longer understands the first language
learned,
Indicate the second language learned.
48(a) In this job, what language did this person use most often? O English
O French
O Other — Specify
________________________
(b) Did this person use any other languages on a regular basis
in this job?
O No
O Yes, English
O Yes, French
O Yes, Other — Specify
________________________
Activity 6 7
INFORM
ATIO
NONLY
Census Day: May 16, 2006
Count Yourself In!
Activity 7:
That’s Easy for You to Say! —
Survey Project
Suggested Level: Secondary
Subjects: Mathematics, Social Studies, Data Management
Overview
This activity demonstrates to students through
hands-on experience many aspects of planning,
conducting and reporting a survey.
Students will learn what goes into the production
of statistical information, how individual
responses on a questionnaire are merged to create
summary data, and how the summarized
information is used.
This activity could take the form of a full count of
the student body. If this is too ambitious, a small
survey or an opinion poll of a sample of the
student population or specific class may be more
appropriate. Use topics of interest to students and
teachers.
Since Census Day is May 16, 2006, schedule the
completion of this activity or parts of it (data
collection) to closely coincide with this date, if
possible. If you intend to have the students
conduct a survey or census, remember to allow
yourself enough lead time. (For number of class
periods, see next column.)
Note: See the Teacher’s Guide for general
background on the census and census vocabulary.
Class Time Required
Four class periods before conducting the survey;
one or two periods collecting the data; three or
four periods after collecting the data. (Times will
vary with the complexity of the questionnaire and
the size of the group surveyed.)
or
Two or three class periods if the activity is
restricted to using the prepared questionnaire
(Handout 2) in one or two classes.
Learning Objectives
• Understand the stages of designing, conducting
and processing a survey.
• Design, conduct, process and report on a survey
of their own.
• Write a report analysing the results of a survey.
• Work as a team to reach mutually agreed
decisions and to resolve issues.
2006 Census Teacher’s Kit
Count Yourself In!May 16, 2006

Vocabulary
Census, complete count, confidentiality, data,
enumeration, privacy, questionnaire, sample,
survey, undercount
Materials
• Teacher’s Guide
• Handout 1: That’s Easy for You to Say!
• Handout 2: Student Survey on Future Plans
Getting Started
1. Ask your students to write down what they
think the population of Canada was in
2001. Give them a moment to do so and
then write the figure on the chalkboard.
(Answer: In 2001, the population of
Canada was 30,007,094.)
2. Ask several of the students to comment on
how their estimates compared to the actual
figure.
3. Ask students how they think the 2001
population figure for Canada was
determined. (Answer: Every five years
Statistics Canada conducts a census — a
complete count of the country’s
population.)
4. Ask the class to concentrate again on the
2001 population figure. Ask them to
estimate the time it took to produce this
figure. Now distribute Handout 1: That’s
Easy for You to Say! for all to read.
Note: The 2001 Census took place on May 15,
2001. The first results — population counts
— were made publicly available in March
2002. The remaining information dealing
mostly with socio-economic topics was
released in stages from July 2002 to May
2003.
Census Activity
1. Discuss the stages of the survey process listed
on the handout. You may wish to show a flow
chart such as the one below, listing the
questions in the handout below each stage.
Define� Design� Collect� Process� Report
2. This is the point at which the class should
decide whether they want to plan and conduct
their own survey or use the one in Handout 2.
If the class decides not to create their own
survey, continue with the rest of item 2 and
end the lesson. If the class does want to create
their own survey, skip to item 3.
(a) Distribute Handout 2: Student Survey on
Future Plans
(b) Before students answer the prepared
questionnaire, have them discuss how they
will process their answers (electronically
or by hand) and what they will want to
report. Ask them to consider what
summary information they would like to
analyse and what their tables will look like.
Ask students to identify interesting
questions that summary data could answer.
For example: “Do male and female
students in the class have the same career
goals?” To answer this question they must
be able to cross-tabulate question 2 with
question 7. This can be a tedious job if the
processing is done by hand. Manual
tallying may limit them to looking at the
simple frequencies for single questions,
such as “Do you plan to get married?”
Access to a computer and statistical
software will provide greater flexibility.
(c) Have the students answer the prepared
questionnaire. Ask the class to follow
through on their processing and reporting
strategies for Handout 2.
2 Activity 7
(d) The class may wish to conduct the same
survey with a larger group to learn how the
data compare with the whole grade or the
whole school. How students process the
data, what they report, and how much time
they have will dictate the response here.
3. (a) For students conducting their own survey,
have them re-examine the full range of
questions in Handout 1. Some key
questions to consider are:
• How big is the project going to be?
• Who will be surveyed about what?
• How much time will the class invest in
conducting, processing and analysing the
survey?
• Will the results be shared?
(b) Distribute Handout 2: Student Survey on
Future Plans
(c) Ask students to consider the merits of the
prepared questionnaire by taking note of its
concise questions, multiple-choice format,
and lack of open-ended questions. The
prepared questionnaire may be used as a
model for the survey form the class will
design.
Teacher Hints
If the students design their own survey, limit the
number of questions to about 10.
Avoid fill-in-the-answer (open-ended) type
questions in favour of questions where answers
may be checked or circled.
Include several “demographic background” items
so that students can correlate data and make
statements such as “Female students are most
likely to say . . . .”
Try to centre the survey on student and school
concerns.
Take time to test the questionnaire through
role-playing or small sample surveys to ensure that
the questions make sense and provide useful
answers.
Try to make the survey part of some larger event
such as a display, special assembly or open house
so students can see that other people are interested
in the survey results.
Note: Be sure that the survey has been
approved/registered in advance by your school’s
administration.
Activity 7 3
Handout 1: That’s Easy for You to Say!
The population of Canada in 2001 was 30,007,094. That was easy to say wasn’t it? In a few breaths you
have just stated what took years to produce. Have you ever tried to count 30,007,094 people? It’s a big
job!
It is difficult to describe how big a job it really is to take a census in Canada. For a few months in 2001,
34,000 temporary employees were added to the Statistics Canada payroll. These people were trained,
equipped and supervised so that the portrait of Canada from the 2001 Census would be as accurate as
possible.
Once all the census forms were collected, information from the questionnaires had to be scanned and the
long task of analysing, interpreting and publishing the data could begin.
A good way to understand the many aspects of planning, conducting and reporting a census is to take one
yourself. If you want to conduct a census or a survey in your school, take a look at the checklist of
questions that must be answered before you can get it off the ground. Once you’ve answered these
questions, it will be easy to walk up to someone and say, “Hi! I have a few questions to ask you.”
Defining the Task
• Do you have permission to conduct a survey? _____________________________________________
• How much time do you have for the whole project? (days, class periods) _______________________
• Will this be a class project or something larger? ___________________________________________
• Will this be a census covering the entire school or a survey of a portion of the school population?
__________________________________________________________________________________
• Will you collect data or is this an opinion poll? ____________________________________________
• When and how will you collect the data? _________________________________________________
• What are the major topics to be researched and why?
(for example, youth issues, school issues) ________________________________________________
Designing the Questionnaire
• What type of questions will be used?
(for example, multiple choice, fill-in-the-blank) ___________________________________________
• How many topics do you want to include?________________________________________________
• How many questions? (If two topics, how many questions per topic?) _________________________
• How many possible answers will there be for each question? _________________________________
• Are the questions concise and easy to understand? _________________________________________
4 Activity 7
• Do you want to include background questions like name, age, sex, grade, where the person lives?
__________________________________________________________________________________
• Will the questions provide the data you are seeking?________________________________________
• How are the questions arranged on your form? ____________________________________________
• How will your forms be printed?
(Could the school newspaper/office print them?)___________________________________________
Collecting the Data
• Who will answer the questions? ________________________________________________________
• Is this a personal interview or is it a self-completed survey? __________________________________
• How will you deal with the privacy of the respondents if you ask for their names? ________________
__________________________________________________________________________________
• How will you get everyone to respond? __________________________________________________
• Do you need publicity? _______________________________________________________________
• What will you do if someone is away or does not answer? ___________________________________
• How will you make sure that everyone is counted only once?_________________________________
• How will you know that all the forms were returned? _______________________________________
Processing the Data
• How will you check the returned questionnaires for completeness? ____________________________
__________________________________________________________________________________
• How will you summarize the data? (For example, will you use tables, graphs, charts?)_____________
__________________________________________________________________________________
• Is the questionnaire designed to make this easy? ___________________________________________
• Are you using a computer or manually tallying? ___________________________________________
Activity 7 5
Handout 1: That’s Easy for You to Say! (cont’d)
• How does the use of one or the other affect the amount of time you need or how much you can ask?
__________________________________________________________________________________
• How will you check to make sure there are no errors in the processing? ________________________
__________________________________________________________________________________
• If processing is done on a computer, how will you construct the database? ______________________
__________________________________________________________________________________
• If it is done by hand, how will you record the data (on a form, on the chalkboard, something else)?
__________________________________________________________________________________
Reporting the Data
• How will you report the data?__________________________________________________________
• What tables do you want to make? ______________________________________________________
• Do you want to include graphics, like a bar or pie chart? ____________________________________
• Would percentages help communicate the data better? ______________________________________
• Do you want to write a report about the findings? __________________________________________
6 Activity 7
Handout 1: That’s Easy for You to Say! (cont’d)
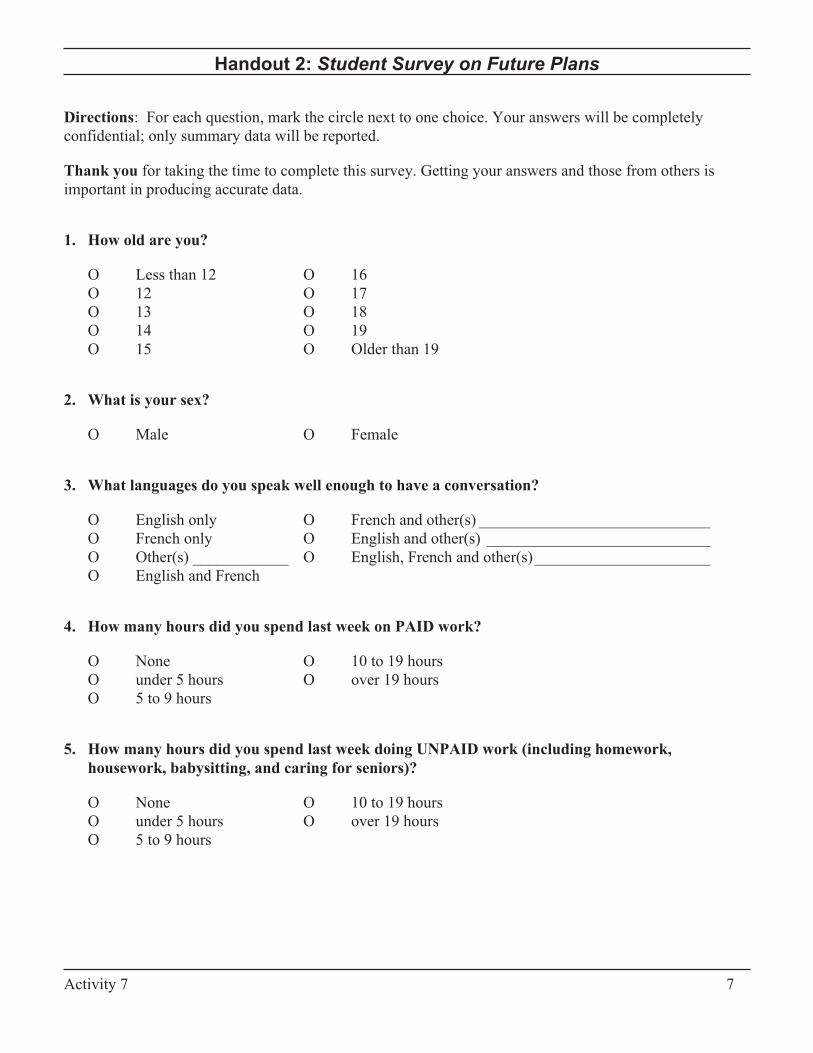
Handout 2: Student Survey on Future Plans
Directions: For each question, mark the circle next to one choice. Your answers will be completely
confidential; only summary data will be reported.
Thank you for taking the time to complete this survey. Getting your answers and those from others is
important in producing accurate data.
1. How old are you?
O Less than 12 O 16
O 12 O 17
O 13 O 18
O 14 O 19
O 15 O Older than 19
2. What is your sex?
O Male O Female
3. What languages do you speak well enough to have a conversation?
O English only O French and other(s) _____________________________
O French only O English and other(s) ____________________________
O Other(s) ____________ O English, French and other(s)______________________
O English and French
4. How many hours did you spend last week on PAID work?
O None O 10 to 19 hours
O under 5 hours O over 19 hours
O 5 to 9 hours
5. How many hours did you spend last week doing UNPAID work (including homework,
housework, babysitting, and caring for seniors)?
O None O 10 to 19 hours
O under 5 hours O over 19 hours
O 5 to 9 hours
Activity 7 7
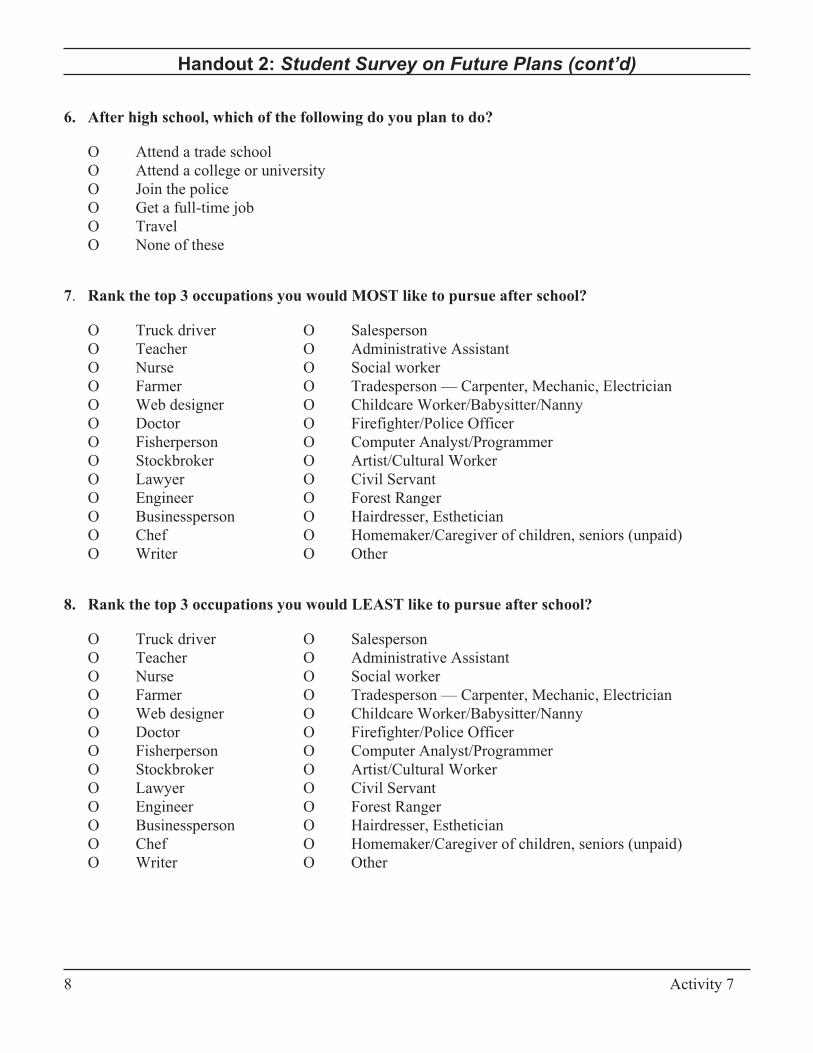
Handout 2: Student Survey on Future Plans (cont’d)
6. After high school, which of the following do you plan to do?
O Attend a trade school
O Attend a college or university
O Join the police
O Get a full-time job
O Travel
O None of these
7. Rank the top 3 occupations you would MOST like to pursue after school?
O Truck driver O Salesperson
O Teacher O Administrative Assistant
O Nurse O Social worker
O Farmer O Tradesperson — Carpenter, Mechanic, Electrician
O Web designer O Childcare Worker/Babysitter/Nanny
O Doctor O Firefighter/Police Officer
O Fisherperson O Computer Analyst/Programmer
O Stockbroker O Artist/Cultural Worker
O Lawyer O Civil Servant
O Engineer O Forest Ranger
O Businessperson O Hairdresser, Esthetician
O Chef O Homemaker/Caregiver of children, seniors (unpaid)
O Writer O Other
8. Rank the top 3 occupations you would LEAST like to pursue after school?
O Truck driver O Salesperson
O Teacher O Administrative Assistant
O Nurse O Social worker
O Farmer O Tradesperson — Carpenter, Mechanic, Electrician
O Web designer O Childcare Worker/Babysitter/Nanny
O Doctor O Firefighter/Police Officer
O Fisherperson O Computer Analyst/Programmer
O Stockbroker O Artist/Cultural Worker
O Lawyer O Civil Servant
O Engineer O Forest Ranger
O Businessperson O Hairdresser, Esthetician
O Chef O Homemaker/Caregiver of children, seniors (unpaid)
O Writer O Other
8 Activity 7

Census Day: May 16, 2006
Count Yourself In!
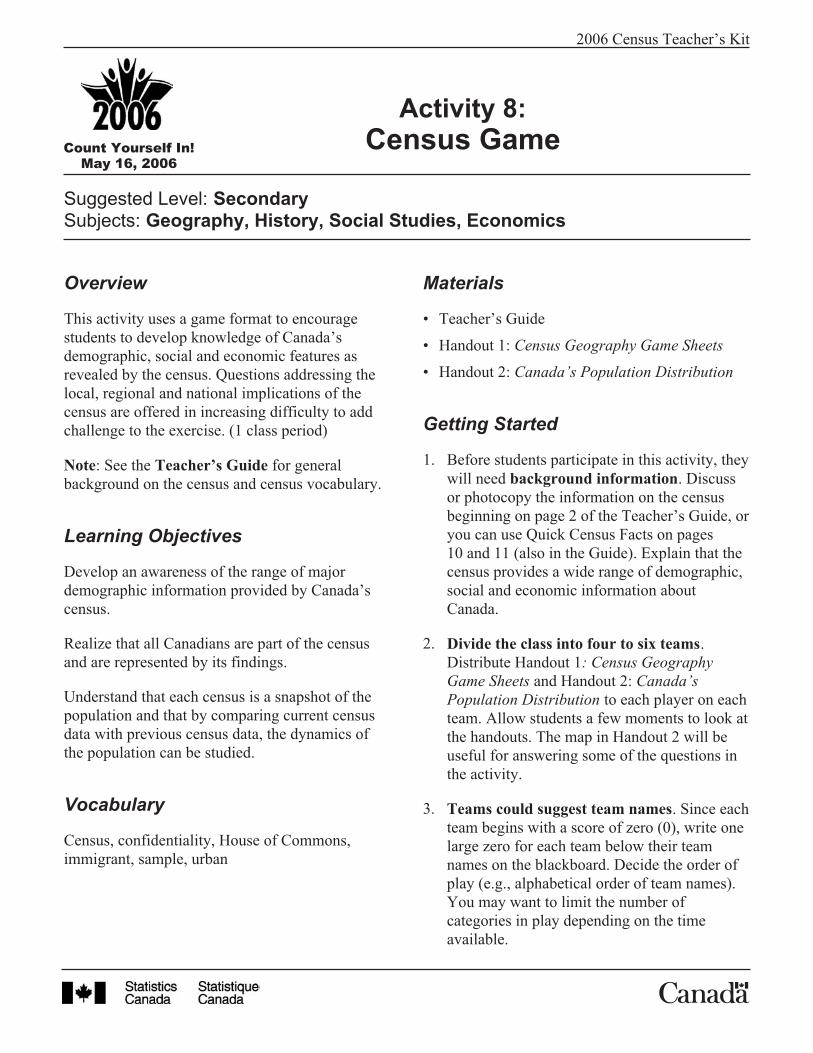
Activity 8:
Census Game
Suggested Level: Secondary
Subjects: Geography, History, Social Studies, Economics
Overview
This activity uses a game format to encourage
students to develop knowledge of Canada’s
demographic, social and economic features as
revealed by the census. Questions addressing the
local, regional and national implications of the
census are offered in increasing difficulty to add
challenge to the exercise. (1 class period)
Note: See the Teacher’s Guide for general
background on the census and census vocabulary.
Learning Objectives
Develop an awareness of the range of major
demographic information provided by Canada’s
census.
Realize that all Canadians are part of the census
and are represented by its findings.
Understand that each census is a snapshot of the
population and that by comparing current census
data with previous census data, the dynamics of
the population can be studied.
Vocabulary
Census, confidentiality, House of Commons,
immigrant, sample, urban
Materials
• Teacher’s Guide
• Handout 1: Census Geography Game Sheets
• Handout 2: Canada’s Population Distribution
Getting Started
1. Before students participate in this activity, they
will need background information. Discuss
or photocopy the information on the census
beginning on page 2 of the Teacher’s Guide, or
you can use Quick Census Facts on pages
10 and 11 (also in the Guide). Explain that the
census provides a wide range of demographic,
social and economic information about
Canada.
2. Divide the class into four to six teams.
Distribute Handout 1: Census Geography
Game Sheets and Handout 2: Canada’s
Population Distribution to each player on each
team. Allow students a few moments to look at
the handouts. The map in Handout 2 will be
useful for answering some of the questions in
the activity.
3. Teams could suggest team names. Since each
team begins with a score of zero (0), write one
large zero for each team below their team
names on the blackboard. Decide the order of
play (e.g., alphabetical order of team names).
You may want to limit the number of
categories in play depending on the time
available.
2006 Census Teacher’s Kit
Count Yourself In!May 16, 2006
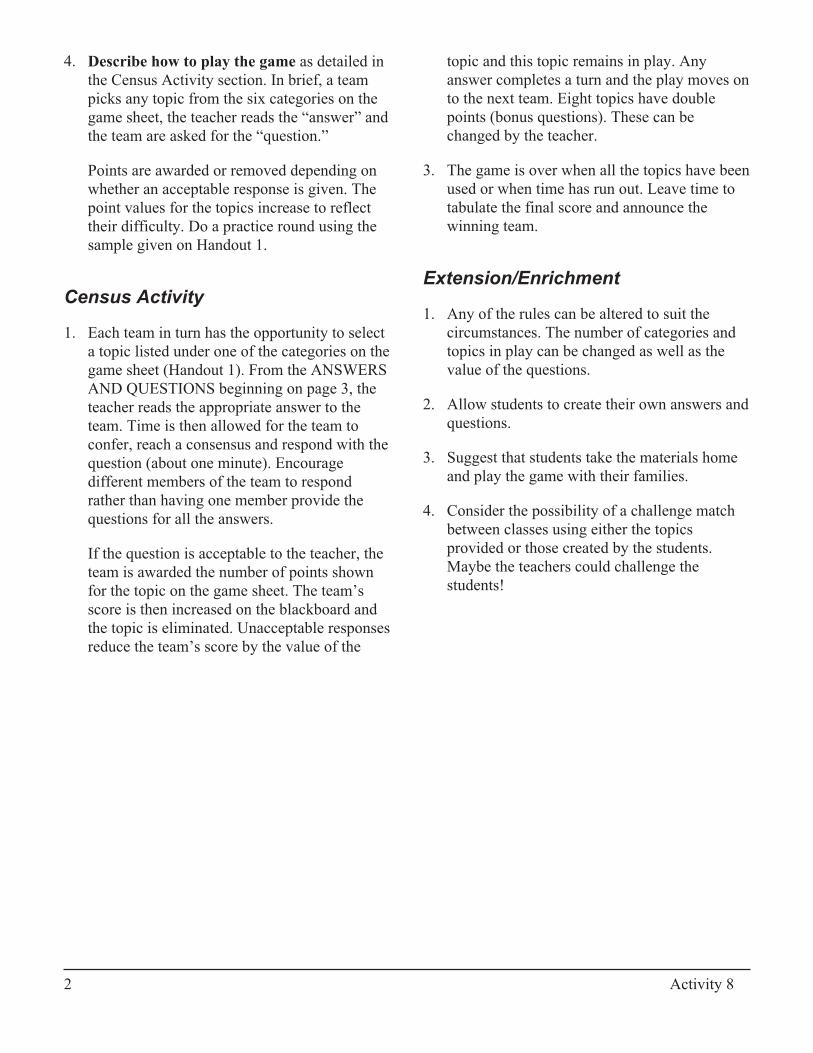
4. Describe how to play the game as detailed in
the Census Activity section. In brief, a team
picks any topic from the six categories on the
game sheet, the teacher reads the “answer” and
the team are asked for the “question.”
Points are awarded or removed depending on
whether an acceptable response is given. The
point values for the topics increase to reflect
their difficulty. Do a practice round using the
sample given on Handout 1.
Census Activity
1. Each team in turn has the opportunity to select
a topic listed under one of the categories on the
game sheet (Handout 1). From the ANSWERS
AND QUESTIONS beginning on page 3, the
teacher reads the appropriate answer to the
team. Time is then allowed for the team to
confer, reach a consensus and respond with the
question (about one minute). Encourage
different members of the team to respond
rather than having one member provide the
questions for all the answers.
If the question is acceptable to the teacher, the
team is awarded the number of points shown
for the topic on the game sheet. The team’s
score is then increased on the blackboard and
the topic is eliminated. Unacceptable responses
reduce the team’s score by the value of the
topic and this topic remains in play. Any
answer completes a turn and the play moves on
to the next team. Eight topics have double
points (bonus questions). These can be
changed by the teacher.
3. The game is over when all the topics have been
used or when time has run out. Leave time to
tabulate the final score and announce the
winning team.
Extension/Enrichment
1. Any of the rules can be altered to suit the
circumstances. The number of categories and
topics in play can be changed as well as the
value of the questions.
2. Allow students to create their own answers and
questions.
3. Suggest that students take the materials home
and play the game with their families.
4. Consider the possibility of a challenge match
between classes using either the topics
provided or those created by the students.
Maybe the teachers could challenge the
students!
2 Activity 8
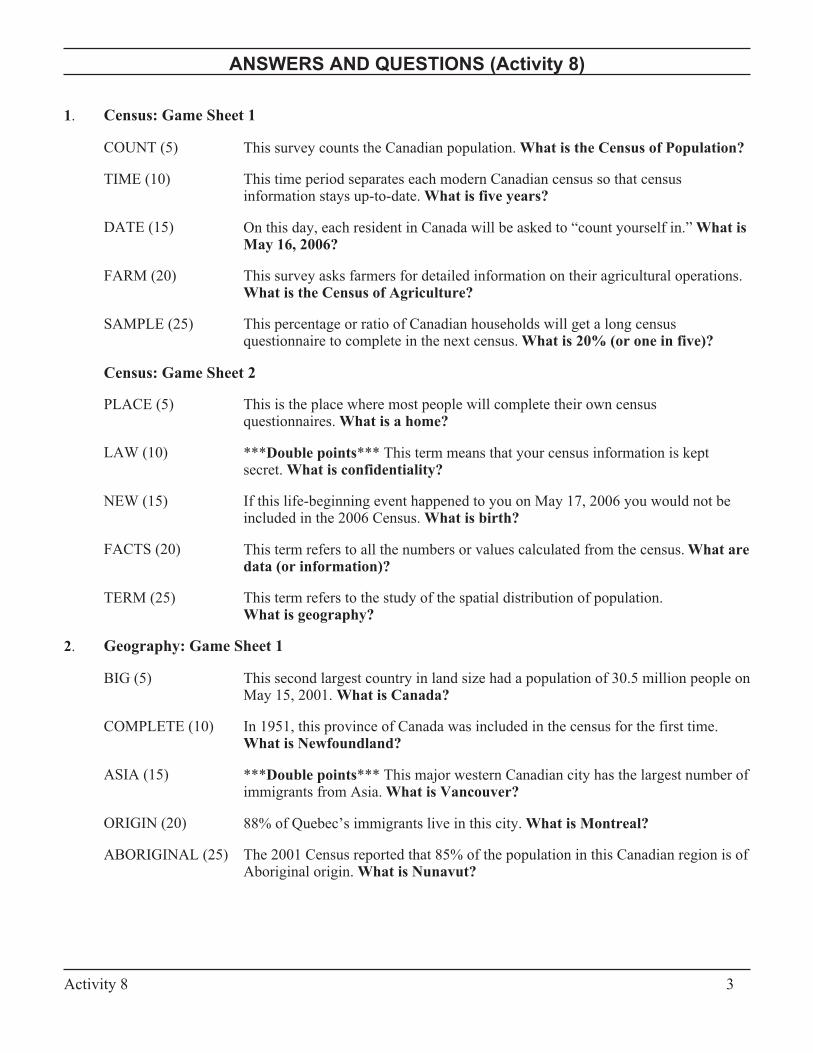
ANSWERS AND QUESTIONS (Activity 8)
1. Census: Game Sheet 1
COUNT (5) This survey counts the Canadian population. What is the Census of Population?
TIME (10) This time period separates each modern Canadian census so that censusinformation stays up-to-date. What is five years?
DATE (15) On this day, each resident in Canada will be asked to “count yourself in.” What isMay 16, 2006?
FARM (20) This survey asks farmers for detailed information on their agricultural operations.What is the Census of Agriculture?
SAMPLE (25) This percentage or ratio of Canadian households will get a long censusquestionnaire to complete in the next census. What is 20% (or one in five)?
Census: Game Sheet 2
PLACE (5) This is the place where most people will complete their own censusquestionnaires. What is a home?
LAW (10) ***Double points*** This term means that your census information is keptsecret. What is confidentiality?
NEW (15) If this life-beginning event happened to you on May 17, 2006 you would not beincluded in the 2006 Census. What is birth?
FACTS (20) This term refers to all the numbers or values calculated from the census. What aredata (or information)?
TERM (25) This term refers to the study of the spatial distribution of population.What is geography?
2. Geography: Game Sheet 1
BIG (5) This second largest country in land size had a population of 30.5 million people onMay 15, 2001. What is Canada?
COMPLETE (10) In 1951, this province of Canada was included in the census for the first time.What is Newfoundland?
ASIA (15) ***Double points*** This major western Canadian city has the largest number ofimmigrants from Asia. What is Vancouver?
ORIGIN (20) 88% of Quebec’s immigrants live in this city. What is Montreal?
ABORIGINAL (25) The 2001 Census reported that 85% of the population in this Canadian region is ofAboriginal origin. What is Nunavut?
Activity 8 3
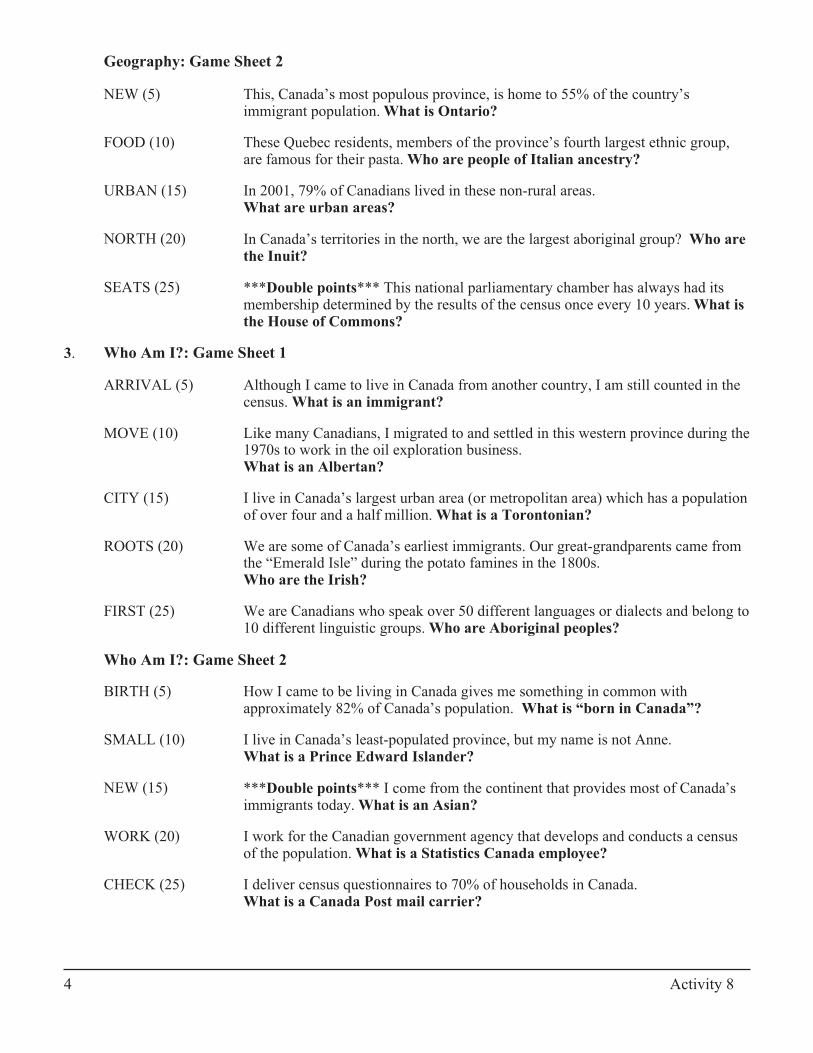
Geography: Game Sheet 2
NEW (5) This, Canada’s most populous province, is home to 55% of the country’simmigrant population. What is Ontario?
FOOD (10) These Quebec residents, members of the province’s fourth largest ethnic group,are famous for their pasta. Who are people of Italian ancestry?
URBAN (15) In 2001, 79% of Canadians lived in these non-rural areas.What are urban areas?
NORTH (20) In Canada’s territories in the north, we are the largest aboriginal group? Who arethe Inuit?
SEATS (25) ***Double points*** This national parliamentary chamber has always had itsmembership determined by the results of the census once every 10 years. What isthe House of Commons?
3. Who Am I?: Game Sheet 1
ARRIVAL (5) Although I came to live in Canada from another country, I am still counted in thecensus. What is an immigrant?
MOVE (10) Like many Canadians, I migrated to and settled in this western province during the1970s to work in the oil exploration business.What is an Albertan?
CITY (15) I live in Canada’s largest urban area (or metropolitan area) which has a populationof over four and a half million. What is a Torontonian?
ROOTS (20) We are some of Canada’s earliest immigrants. Our great-grandparents came fromthe “Emerald Isle” during the potato famines in the 1800s.Who are the Irish?
FIRST (25) We are Canadians who speak over 50 different languages or dialects and belong to10 different linguistic groups. Who are Aboriginal peoples?
Who Am I?: Game Sheet 2
BIRTH (5) How I came to be living in Canada gives me something in common withapproximately 82% of Canada’s population. What is “born in Canada”?
SMALL (10) I live in Canada’s least-populated province, but my name is not Anne.What is a Prince Edward Islander?
NEW (15) ***Double points*** I come from the continent that provides most of Canada’simmigrants today. What is an Asian?
WORK (20) I work for the Canadian government agency that develops and conducts a censusof the population. What is a Statistics Canada employee?
CHECK (25) I deliver census questionnaires to 70% of households in Canada.What is a Canada Post mail carrier?
4 Activity 8

4. Settlement: Game Sheet 1
AREA (5) They are political divisions shown on the map of population distribution. Whatare the provinces and territories?
DOT (10) This is the number of people with whom I share a dot on Canada’s 2001population distribution map. What are 999 people?
CLUSTER (15) *** Double points*** This area in Ontario is home to 22% of the population ofCanada. What is the extended Golden Horseshoe?
DONUT (20) This eastern province’s population distribution map has its population clusteredaround its exterior. What is New Brunswick?
GATEWAY (25) This western capital city’s population appears on the population distribution mapas a cluster of dots and is the gateway to Canada’s western Arctic. What isEdmonton?
Settlement: Game Sheet 2
FEW (5) This non-provincial region of Canada consists of 0.1% of Canada’s population in2001 and has few dots due to the scattered settlement pattern. What is the YukonTerritory?
CLUSTERS (10) This broad and fairly flat region of Canada features a settlement pattern ofscattered clusters of dots. What are the Prairies?
ISLAND (15) This west coast island features a population pattern that is concentrated along itseastern side. What is Vancouver Island?
WATER (20) The largest province in Canada features settlement that is highly concentratedalong this major river. What is the St. Lawrence River?
COASTAL (25) These three provinces in Atlantic Canada feature settlement along their coastalborders. What are Nova Scotia, New Brunswick and Newfoundland?
5. Results: Game Sheet 1
WATER (5) The most striking concentration of population in Canada shown on the distributionmap lies along the northern shores of these large bodies of water. What are theGreat Lakes?
METALS (10) The clusters of settlement north of the major population centres in Quebec andOntario are communities built around this rock-based economic activity. What ismining?
NARROWS (15) This provincial capital city is the centre of a large concentration of populationlocated between two large lakes and an international border. What is Winnipeg?
DOUBLE V (20) ***Double points*** These two west coast cities form their province’s majorpopulation concentration and begin with the same letter.What are Vancouver and Victoria?
LANDFALL (25) This provincial capital appears as the major cluster on the island and faces Europe.What is St. John’s?
Activity 8 5
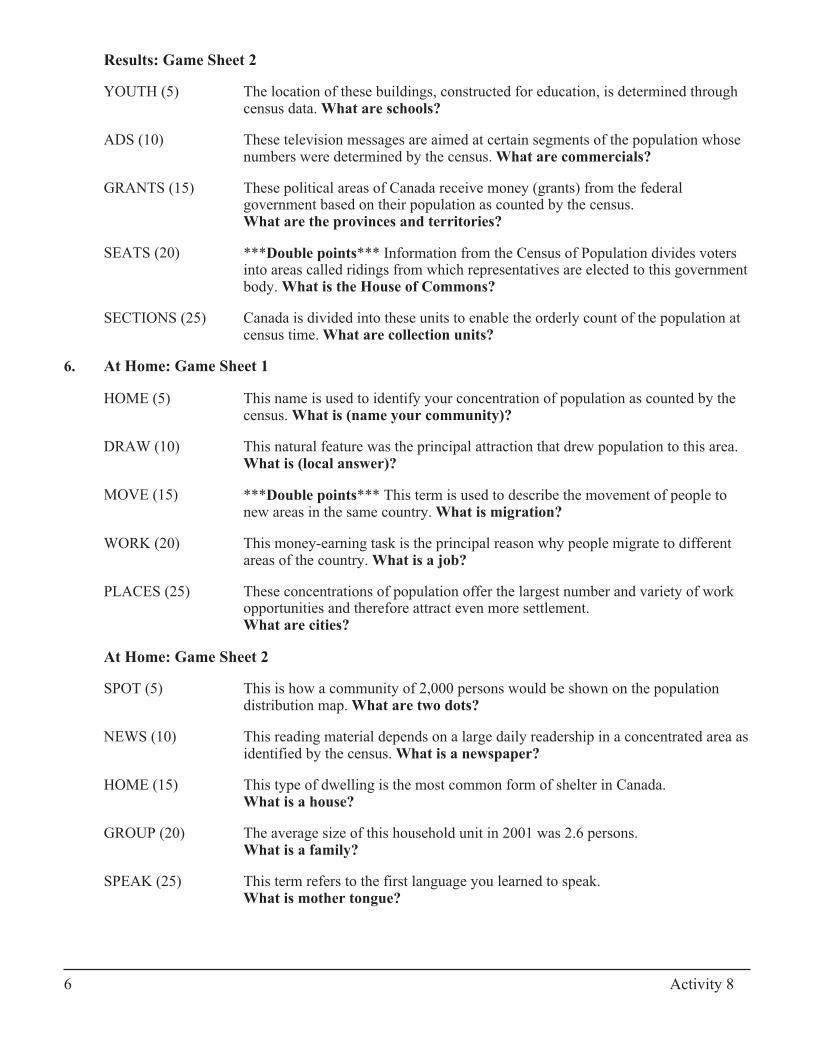
Results: Game Sheet 2
YOUTH (5) The location of these buildings, constructed for education, is determined throughcensus data. What are schools?
ADS (10) These television messages are aimed at certain segments of the population whosenumbers were determined by the census. What are commercials?
GRANTS (15) These political areas of Canada receive money (grants) from the federalgovernment based on their population as counted by the census.What are the provinces and territories?
SEATS (20) ***Double points*** Information from the Census of Population divides votersinto areas called ridings from which representatives are elected to this governmentbody. What is the House of Commons?
SECTIONS (25) Canada is divided into these units to enable the orderly count of the population atcensus time. What are collection units?
6. At Home: Game Sheet 1
HOME (5) This name is used to identify your concentration of population as counted by thecensus. What is (name your community)?
DRAW (10) This natural feature was the principal attraction that drew population to this area.What is (local answer)?
MOVE (15) ***Double points*** This term is used to describe the movement of people tonew areas in the same country. What is migration?
WORK (20) This money-earning task is the principal reason why people migrate to differentareas of the country. What is a job?
PLACES (25) These concentrations of population offer the largest number and variety of workopportunities and therefore attract even more settlement.What are cities?
At Home: Game Sheet 2
SPOT (5) This is how a community of 2,000 persons would be shown on the populationdistribution map. What are two dots?
NEWS (10) This reading material depends on a large daily readership in a concentrated area asidentified by the census. What is a newspaper?
HOME (15) This type of dwelling is the most common form of shelter in Canada.What is a house?
GROUP (20) The average size of this household unit in 2001 was 2.6 persons.What is a family?
SPEAK (25) This term refers to the first language you learned to speak.What is mother tongue?
6 Activity 8
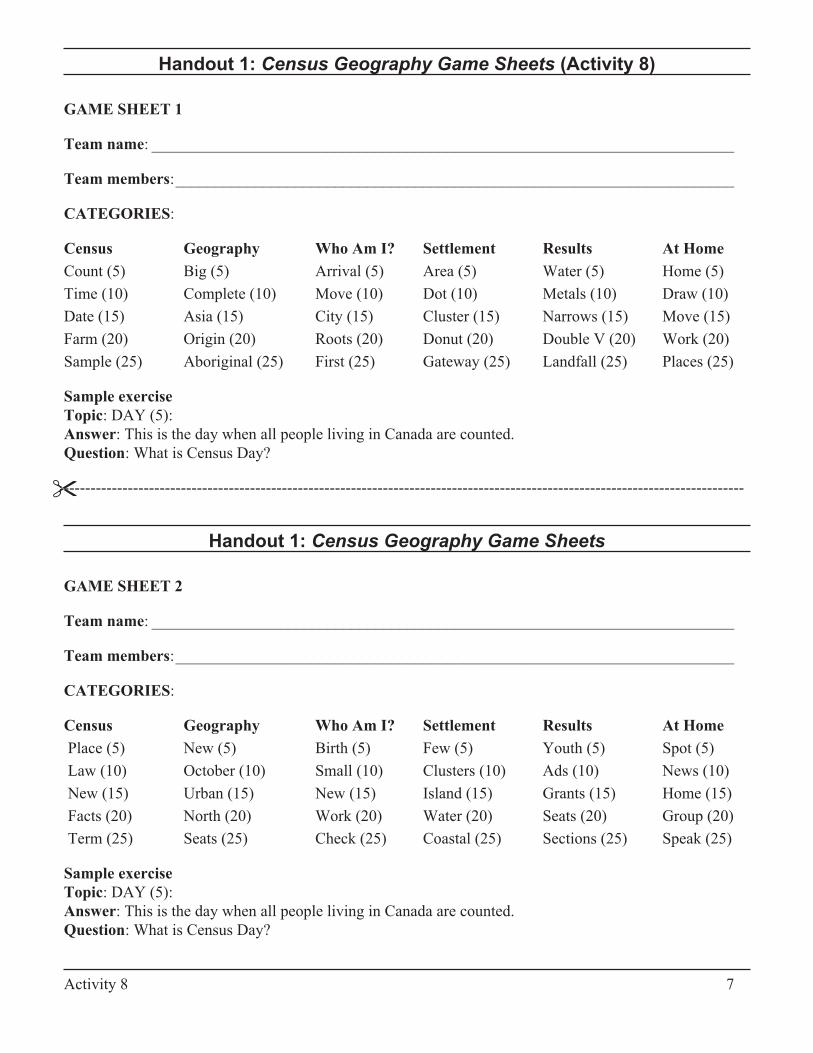
Handout 1: Census Geography Game Sheets (Activity 8)
GAME SHEET 1
Team name: _________________________________________________________________________
Team members:______________________________________________________________________
CATEGORIES:
Census Geography Who Am I? Settlement Results At Home
Count (5) Big (5) Arrival (5) Area (5) Water (5) Home (5)
Time (10) Complete (10) Move (10) Dot (10) Metals (10) Draw (10)
Date (15) Asia (15) City (15) Cluster (15) Narrows (15) Move (15)
Farm (20) Origin (20) Roots (20) Donut (20) Double V (20) Work (20)
Sample (25) Aboriginal (25) First (25) Gateway (25) Landfall (25) Places (25)
Sample exercise
Topic: DAY (5):
Answer: This is the day when all people living in Canada are counted.
Question: What is Census Day?
--------------------------------------------------------------------------------------------------------------------------------
Handout 1: Census Geography Game Sheets
GAME SHEET 2
Team name: _________________________________________________________________________
Team members:______________________________________________________________________
CATEGORIES:
Census Geography Who Am I? Settlement Results At Home
Place (5) New (5) Birth (5) Few (5) Youth (5) Spot (5)
Law (10) October (10) Small (10) Clusters (10) Ads (10) News (10)
New (15) Urban (15) New (15) Island (15) Grants (15) Home (15)
Facts (20) North (20) Work (20) Water (20) Seats (20) Group (20)
Term (25) Seats (25) Check (25) Coastal (25) Sections (25) Speak (25)
Sample exercise
Topic: DAY (5):
Answer: This is the day when all people living in Canada are counted.
Question: What is Census Day?
Activity 8 7
�
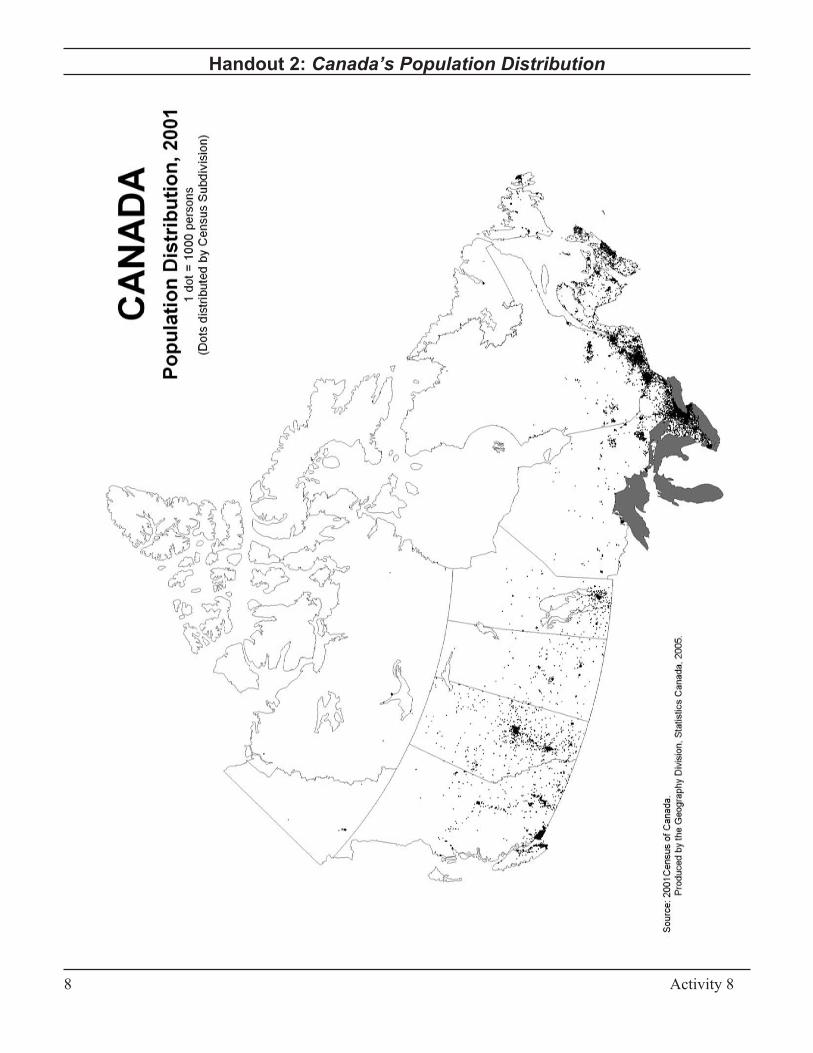
Handout 2: Canada’s Population Distribution
8 Activity 8