Embed Size (px)
Citation preview
2009 vol. 33 no. 3 AUSTRALIAN AND NEW ZEALAND JOURNAL OF PUBLIC HEALTH 289© 2009 The Authors. Journal Compilation © 2009 Public Health Association of Australia
The 2005 Wellington influenza outbreak: syndromic
surveillance of Wellington Hospital Emergency
Department activity may have provided early warning
Abstract
Objectives: To assess whether the
Wellington Emergency Department (ED)
Respiratory Syndromic Surveillance
System may have provided early warning
of the influenza outbreak in Wellington
schools during 2005, and as a result might
have provided the opportunity for an earlier
or more effective public health response.
Methods: All events of respiratory
syndrome, as defined by selected ICD 10
codes, were extracted from Wellington
Hospital ED for the dates 1 January 2004
to 31 December 2006, and analysed
using the Centers for Disease Control and
Prevention (CDC) surveillance program,
Early Aberration Reporting System
(EARS). Daily events were analysed for
total counts and by lifecycle age group.
Seven day moving averages of the
numbers of events were also calculated.
Results: This study indicated that the
surveillance system may have provided
early warning of a potential respiratory
outbreak. Regular exceedance flags were
generated nine days prior to the initial
notification received by Regional Public
Health (RPH). The surveillance system
also provided information on the type of
illness (respiratory), the groups affected
(5-14 year olds), and the progression of the
outbreak (peak, end).
Conclusions: The surveillance system
might have worked by providing early
notification of the outbreak. This may have
prompted RPH to earlier investigate the
potential outbreak and may have led to an
earlier response.
Implications: Surveillance of Emergency
Department activity may be useful for early
public health response.
Key words: surveillance, influenza,
outbreaks, New Zealand.
Aust N Z Public Health. 2009; 33:289-94
doi: 10.1111/j.1753-6405.2009.00391.xSubmitted: July 2008 Revision requested: November 2008 Accepted: January 2009Correspondence to: Kylie Mason, Senior Advisor (Epidemiology), Health and Disability Intelligence, Health & Disability Systems Strategy Directorate, Ministry of Health, P O Box 5013, Wellington, New Zealand. Fax (64 4) 816 2340; e-mail: [email protected]
Melissa McLeod Regional Public Health, Lower Hutt, New Zealand
Kylie Mason, Paul White Ministry of Health, New Zealand
Deborah ReadRegional Public Health, Lower Hutt, New Zealand
Syndromic surveillanceSyndromic surveil lance refers to
surveillance of a broad group of symptoms,
used to monitor particular illnesses that
might be recorded in different ways by health
professionals.1 Syndromic surveillance
systems are useful in public health to allow
early detection of outbreaks, to follow the
size, spread and tempo of an outbreak, and
to monitor disease trends. They are also used
during high profile events for reassurance
that no outbreak has occurred.2,3 The Centers
for Disease Control and Prevention (CDC)
framework for surveillance considers that
there are nine key elements of a good
syndromic surveillance system: timeliness,
sensitivity, stability, simplicity, flexibility,
data quality, acceptability, representativeness
and predictive value positive.4
Syndromic surveillance can utilise records
from health care providers, such as hospital
admissions, Emergency Department visit
outcomes, General Practitioner consultations
and telephone healthlines, as well as other
sources of data, such as pharmacy sales and
school absenteeism.2 Emergency Departments
are a useful source of population health
surveillance data. Surveillance activities
through Emergency Departments offer the
advantages of large volumes of patients,
a varied patient case mix, and improving
medical record technology.5,6 Wellington
Hospital provides Emergency Department
services to a catchment of approximately
280,000 people. Annual attendances are
approximately 45,000.
In New Zealand, public health responses
to events such as influenza outbreaks are
generally managed by Public Health Units.
Regional Public Health (RPH) covers the
Greater Wellington region (population
approximately 450,000) which includes the
catchment area of Wellington Hospital.
The 2005 influenza outbreakAn epidemic of influenza B occurred
in New Zealand in May and June 2005.
The epidemic mainly affected school
children, causing a high level of morbidity.
In the Wellington region, 30% of schools
reported absenteeism of 10-20% during the
epidemic, while a further 18% of schools
reported absenteeism over 20%. One school
voluntarily closed for two days due to the
high level of illness.7 During the epidemic,
there were two deaths from complications
of influenza infection in young people
(aged <25years) in the Greater Wellington
region.
Article Viruses and infections
290 AUSTRALIAN AND NEW ZEALAND JOURNAL OF PUBLIC HEALTH 2009 vol. 33 no. 3© 2009 The Authors. Journal Compilation © 2009 Public Health Association of Australia
In the Greater Wellington region, RPH was responsible for
the public health monitoring of the influenza outbreak and any
interventions. RPH was first notified of an increase in absenteeism
in a local school on 19 May 2005. On 23 May, RPH began a
survey of all schools to determine general absenteeism levels.7
Concurrently, information was provided to all schools on ‘winter
viruses’ and nasopharyngeal swabs were taken from some
affected students. Students suffered from both respiratory and
gastrointestinal symptoms, suggesting that the most likely cause
of the outbreak was either norovirus or influenza. Virological
testing of symptomatic schoolchildren subsequently confirmed
influenza B (B/Hong Kong/330/2001-like, with a few cases of
B/Shanghai/361/2002).8,9
RPH received further notifications of high absenteeism from
local schools in late May. In early June, a school child died from
complications of influenza B.10 Subsequently an information
leaflet ‘Advice for parents looking after children with respiratory
illnesses’ was sent to all schools and all General Practitioners were
informed of the outbreak by fax.
Pilot studyIn March 2008, RPH began a two-year pilot study of a
Respiratory Syndromic Surveillance System, using primary
discharge ICD 10 codes from Wellington Hospital Emergency
Department (ED). This pilot study is a joint project between RPH,
who manage the project and interpret the findings, Wellington
Hospital ED, who provide the data, and the Ministry of Health
(MoH), who analyse the data.
The Wellington ED Respiratory Syndromic Surveillance pilot
study aims to identify, at the earliest opportunity, any increase in
symptoms, diagnoses or sequelae of disease caused by common
or emerging respiratory infections, and any increase in respiratory
illness caused by the deliberate or accidental release of biological
or chemical agents.
The purpose of this surveillance system is to allow the early
detection of respiratory illness, and a timely public health response.
Wellington ED data is automatically downloaded on a weekly
basis, and sent to the MoH, who analyse the data, identify flags, and
send the findings to RPH on the same day. RPH uses a decision tree
developed specifically for this project, to firstly review the weekly
statistical analysis from MoH, secondly review the raw data from
Wellington ED, and thirdly consider other available surveillance,
notification and clinical information, in order to decide upon
an appropriate public health response to aberrant events. The
surveillance system is therefore designed to complement other
sources of information, such as General Practice Influenza Sentinel
Surveillance, telephone healthline data and activities of the public
health unit (e.g. school health, communicable diseases, and health
protection).
Before fully implementing this pilot surveillance system,
Wellington ED data were retrospectively analysed for the time
period 1 January 2004 to 31 December 2006. In this study, the
efficacy of the Wellington ED Surveillance System to detect
aberrant events was assessed by retrospective analysis of the
2005 influenza outbreak. The aim of this study was to investigate
whether the Wellington ED Respiratory Syndromic Surveillance
System might have provided an early warning of the influenza
outbreak in Wellington schools during 2005, and as a result
provided the opportunity for an earlier or more effective public
health response.
MethodsOverview of project
To test the Wellington ED Syndromic Surveillance system
before implementation, retrospective analysis was carried out
on respiratory syndrome data for the dates 1 January 2004 to 31
December 2006. This analysis employed similar methods to those
that will be implemented in the pilot surveillance in 2008/9.
DataThe discharge records for all events of respiratory syndrome
were extracted from the computer database system at Wellington
Hospital ED, for the dates 1 January 2004 to 31 December 2006.
The discharge records contained information on the time and date
of discharge, the age of the patient, the primary diagnosis, the
triage code, and the disposition.
Respiratory syndrome was defined as having a primary diagnosis
of one of 68 ICD 10 codes selected for the purposes of this pilot
study (Appendix 1). The ICD 10 code selections were validated
through comparisons with existing syndrome definitions and
codes,11,12 existing surveillance data (General Practice Influenza
Sentinel Surveillance), and local and national hospitalisation
data. The diagnosis code is a required field in the Wellington ED
database, which must be completed by medical staff before the
patient can be discharged.
AnalysisDaily events of respiratory syndrome were retrospectively
analysed for 1 January 2004 to 31 December 2006, for total counts
and by lifecycle age group (0-4, 5-14, 15-44, 45-64, 65+ years).
The data were analysed using the Early Aberration Reporting
System (EARS), developed by the CDC. In EARS, flags (or
exceedances) are triggered when the number of events exceeds a
threshold that is calculated using cumulative summation (CUSUM)
methods, specifically a positive one-sided cumulative sum.13,14
Epidemiologists have used CUSUM methods for surveillance
purposes for many years, for example for respiratory diseases
mortality.15 EARS has been used in the US for early warning
surveillance, including for detecting the start of the influenza
season and outbreaks of West Nile disease.13,16,17
In EARS, data aberrations are reported with three different
types of flags: C1–MILD, C2–MEDIUM and C3–ULTRA.14 C1
flags are based on baseline data from the previous seven days,
while C2 and C3 flags are based on a seven-day baseline with a
three-day offset. 14 For C1 and C2 flags, the CUSUM threshold is
McLeod et al. Article
2009 vol. 33 no. 3 AUSTRALIAN AND NEW ZEALAND JOURNAL OF PUBLIC HEALTH 291© 2009 The Authors. Journal Compilation © 2009 Public Health Association of Australia
equivalent to the mean plus three standard deviations.13 C1 flags
are less sensitive than C2 and C3 flags.14 C2 flags can be useful
for identifying when an outbreak has peaked, while C3 flags can
be used to identify aberrations that slowly increase over a short
time period, such as for influenza.16
For this study, seven-day baselines were used to account for
fluctuations in the number of events due to the day of the week.
This short baseline method allows the identification of increased
numbers of cases, compared to recent activity. While historical
baselines can be used in analysis (incorporating three or more
years of data), a study using simulated data showed that the EARS
short baseline methods had similar sensitivity and specificity for
the C1, C2 and C3 flags, compared to the historical methods,
demonstrating that short baseline methods are as effective as
historical baseline methods.13
For these analyses, primary outputs produced by EARS (using
SAS v9.1) included the total population and age-specific number
of events by day, with associated flags. Using the data and these
results, graphs were prepared, presenting the total number of
daily counts of respiratory syndrome, with associated flags and
the seven-day moving average of the numbers of events. Similar
outputs were produced by age group. In this study, flags were
interpreted in the context of the magnitude of numbers, and
occurrences of flags on consecutive days or closely grouped in
time. It is important to note that not all statistical aberrations
represent an outbreak, or are of public health significance18 and
therefore the interpretation of the flags in a wider context plays
an important role.
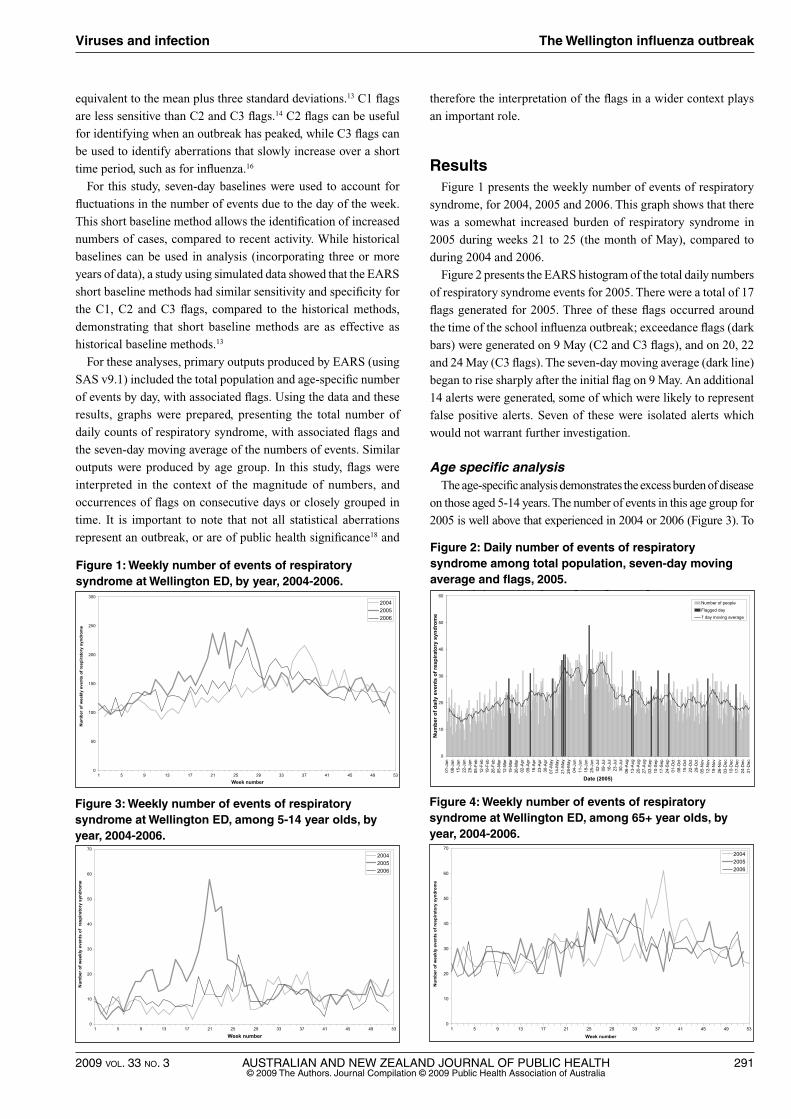
ResultsFigure 1 presents the weekly number of events of respiratory
syndrome, for 2004, 2005 and 2006. This graph shows that there
was a somewhat increased burden of respiratory syndrome in
2005 during weeks 21 to 25 (the month of May), compared to
during 2004 and 2006.
Figure 2 presents the EARS histogram of the total daily numbers
of respiratory syndrome events for 2005. There were a total of 17
flags generated for 2005. Three of these flags occurred around
the time of the school influenza outbreak; exceedance flags (dark
bars) were generated on 9 May (C2 and C3 flags), and on 20, 22
and 24 May (C3 flags). The seven-day moving average (dark line)
began to rise sharply after the initial flag on 9 May. An additional
14 alerts were generated, some of which were likely to represent
false positive alerts. Seven of these were isolated alerts which
would not warrant further investigation.
Age specific analysisThe age-specific analysis demonstrates the excess burden of disease
on those aged 5-14 years. The number of events in this age group for
2005 is well above that experienced in 2004 or 2006 (Figure 3). To
Figure 1: Weekly number of events of respiratory syndrome at Wellington ED, by year, 2004-2006.Figure 1 Weekly number of events of respiratory syndrome at Wellington ED,
by year, 2004–2006
0
50
100
150
200
250
300
1 5 9 13 17 21 25 29 33 37 41 45 49 53
Week number
Num
ber o
f wee
kly
even
ts o
f res
pira
tory
syn
drom
e
200420052006
Figure 2 Daily number of events of respiratory syndrome among total population, 7-day moving average and flags, 2005
0
10
20
30
40
50
60
01-J
an08
-Jan
15-J
an22
-Jan
29-J
an05
-Feb
12-F
eb19
-Feb
26-F
eb05
-Mar
12-M
ar19
-Mar
26-M
ar02
-Apr
09-A
pr16
-Apr
23-A
pr30
-Apr
07-M
ay14
-May
21-M
ay28
-May
04-J
un11
-Jun
18-J
un25
-Jun
02-J
ul09
-Jul
16-J
ul23
-Jul
30-J
ul06
-Aug
13-A
ug20
-Aug
27-A
ug03
-Sep
10-S
ep17
-Sep
24-S
ep01
-Oct
08-O
ct15
-Oct
22-O
ct29
-Oct
05-N
ov12
-Nov
19-N
ov26
-Nov
03-D
ec10
-Dec
17-D
ec24
-Dec
31-D
ec
Date (2005)
Num
ber o
f dai
ly e
vent
s of
resp
irato
ry s
yndr
ome
Number of people
Flagged day7 day moving average
Figure 2: Daily number of events of respiratory syndrome among total population, seven-day moving average and flags, 2005.
Figure 1 Weekly number of events of respiratory syndrome at Wellington ED, by year, 2004–2006
0
50
100
150
200
250
300
1 5 9 13 17 21 25 29 33 37 41 45 49 53
Week number
Num
ber o
f wee
kly
even
ts o
f res
pira
tory
syn
drom
e
200420052006
Figure 2 Daily number of events of respiratory syndrome among total population, 7-day moving average and flags, 2005
0
10
20
30
40
50
60
01-J
an08
-Jan
15-J
an22
-Jan
29-J
an05
-Feb
12-F
eb19
-Feb
26-F
eb05
-Mar
12-M
ar19
-Mar
26-M
ar02
-Apr
09-A
pr16
-Apr
23-A
pr30
-Apr
07-M
ay14
-May
21-M
ay28
-May
04-J
un11
-Jun
18-J
un25
-Jun
02-J
ul09
-Jul
16-J
ul23
-Jul
30-J
ul06
-Aug
13-A
ug20
-Aug
27-A
ug03
-Sep
10-S
ep17
-Sep
24-S
ep01
-Oct
08-O
ct15
-Oct
22-O
ct29
-Oct
05-N
ov12
-Nov
19-N
ov26
-Nov
03-D
ec10
-Dec
17-D
ec24
-Dec
31-D
ec
Date (2005)
Num
ber o
f dai
ly e
vent
s of
resp
irato
ry s
yndr
ome
Number of people
Flagged day7 day moving average
Figure 3: Weekly number of events of respiratory syndrome at Wellington ED, among 5-14 year olds, by year, 2004-2006.Figure 3: Weekly number of events of respiratory syndrome at Wellington ED,
among 5–14 year olds, by year, 2004–2006
0
10
20
30
40
50
60
70
1 5 9 13 17 21 25 29 33 37 41 45 49 53
Week number
Num
ber o
f wee
kly
even
ts o
f re
spira
tory
syn
drom
e
200420052006
Figure 4: Weekly number of events of respiratory syndrome at Wellington ED, among 65+ year olds, by year, 2004–2006
0
10
20
30
40
50
60
70
1 5 9 13 17 21 25 29 33 37
Week number
Num
ber o
f wee
kly
even
ts o
f res
pira
tory
syn
drom
e
41 45 49 53
200420052006
Figure 4: Weekly number of events of respiratory syndrome at Wellington ED, among 65+ year olds, by year, 2004-2006.
Figure 3: Weekly number of events of respiratory syndrome at Wellington ED, among 5–14 year olds, by year, 2004–2006
0
10
20
30
40
50
60
70
1 5 9 13 17 21 25 29 33 37 41 45 49 53
Week number
Num
ber o
f wee
kly
even
ts o
f re
spira
tory
syn
drom
e
200420052006
Figure 4: Weekly number of events of respiratory syndrome at Wellington ED, among 65+ year olds, by year, 2004–2006
0
10
20
30
40
50
60
70
1 5 9 13 17 21 25 29 33 37
Week number
Num
ber o
f wee
kly
even
ts o
f res
pira
tory
syn
drom
e
41 45 49 53
200420052006
Viruses and infection The Wellington influenza outbreak
292 AUSTRALIAN AND NEW ZEALAND JOURNAL OF PUBLIC HEALTH 2009 vol. 33 no. 3© 2009 The Authors. Journal Compilation © 2009 Public Health Association of Australia
a lesser degree, the 0-4 year olds also displayed an excess number
of events in 2005 (graph not shown). In comparison, the burden of
respiratory syndrome on other age groups, including those aged over
65 years, was similar over the same three-year period (Figure 4).
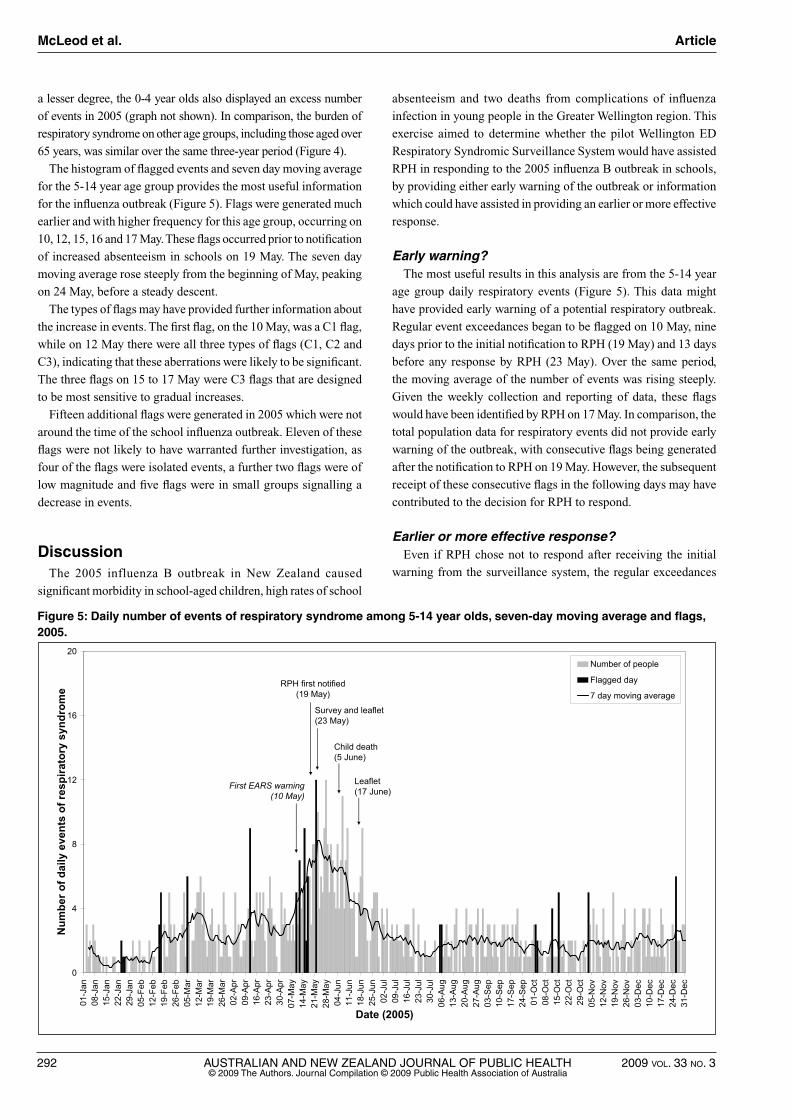
The histogram of flagged events and seven day moving average
for the 5-14 year age group provides the most useful information
for the influenza outbreak (Figure 5). Flags were generated much
earlier and with higher frequency for this age group, occurring on
10, 12, 15, 16 and 17 May. These flags occurred prior to notification
of increased absenteeism in schools on 19 May. The seven day
moving average rose steeply from the beginning of May, peaking
on 24 May, before a steady descent.
The types of flags may have provided further information about
the increase in events. The first flag, on the 10 May, was a C1 flag,
while on 12 May there were all three types of flags (C1, C2 and
C3), indicating that these aberrations were likely to be significant.
The three flags on 15 to 17 May were C3 flags that are designed
to be most sensitive to gradual increases.
Fifteen additional flags were generated in 2005 which were not
around the time of the school influenza outbreak. Eleven of these
flags were not likely to have warranted further investigation, as
four of the flags were isolated events, a further two flags were of
low magnitude and five flags were in small groups signalling a
decrease in events.
DiscussionThe 2005 influenza B outbreak in New Zealand caused
significant morbidity in school-aged children, high rates of school
absenteeism and two deaths from complications of influenza
infection in young people in the Greater Wellington region. This
exercise aimed to determine whether the pilot Wellington ED
Respiratory Syndromic Surveillance System would have assisted
RPH in responding to the 2005 influenza B outbreak in schools,
by providing either early warning of the outbreak or information
which could have assisted in providing an earlier or more effective
response.
Early warning?The most useful results in this analysis are from the 5-14 year
age group daily respiratory events (Figure 5). This data might
have provided early warning of a potential respiratory outbreak.
Regular event exceedances began to be flagged on 10 May, nine
days prior to the initial notification to RPH (19 May) and 13 days
before any response by RPH (23 May). Over the same period,
the moving average of the number of events was rising steeply.
Given the weekly collection and reporting of data, these flags
would have been identified by RPH on 17 May. In comparison, the
total population data for respiratory events did not provide early
warning of the outbreak, with consecutive flags being generated
after the notification to RPH on 19 May. However, the subsequent
receipt of these consecutive flags in the following days may have
contributed to the decision for RPH to respond.
Earlier or more effective response?Even if RPH chose not to respond after receiving the initial
warning from the surveillance system, the regular exceedances
Figure 5: Daily number of events of respiratory syndrome among 5-14 year olds, seven-day moving average and flags, 2005.
0
4
8
12
16
20
01-J
an08
-Jan
15-J
an22
-Jan
29-J
an05
-Feb
12-F
eb19
-Feb
26-F
eb05
-Mar
12-M
ar19
-Mar
26-M
ar02
-Apr
09-A
pr16
-Apr
23-A
pr30
-Apr
07-M
ay14
-May
21-M
ay28
-May
04-J
un11
-Jun
18-J
un25
-Jun
02-J
ul09
-Jul
16-J
ul23
-Jul
30-J
ul06
-Aug
13-A
ug20
-Aug
27-A
ug03
-Sep
10-S
ep17
-Sep
24-S
ep01
-Oct
08-O
ct15
-Oct
22-O
ct29
-Oct
05-N
ov12
-Nov
19-N
ov26
-Nov
03-D
ec10
-Dec
17-D
ec24
-Dec
31-D
ec
Date (2005)
Num
ber o
f dai
ly e
vent
s of
resp
irato
ry s
yndr
ome
Number of people
Flagged day
7 day moving average
Survey and leaflet(23 May)
RPH first notified (19 May)
Child death(5 June)
Leaflet(17 June)
First EARS warning(10 May)
Figure 5: Daily number of events of respiratory syndrome among 5-14 year olds, 7-day moving average and flags, 2005
McLeod et al. Article
2009 vol. 33 no. 3 AUSTRALIAN AND NEW ZEALAND JOURNAL OF PUBLIC HEALTH 293© 2009 The Authors. Journal Compilation © 2009 Public Health Association of Australia
and rising average would raise suspicion of a respiratory outbreak
in school-aged children. At a minimum, the surveillance system
would have provided another source of information to assess the
situation.
This study indicated that a range of information would have been
provided to RPH that may have assisted in their response to the
outbreak. The surveillance system (raw data and analysis outputs)
may have been used to identify the type of illness (respiratory),
the groups affected (5-14 year olds), and the progression of
the outbreak (peak, end). This information in conjunction with
that from existing activities of the public health unit and other
established surveillance systems may have prompted earlier
active investigation of the potential outbreak by RPH and led to
an earlier response.
Limitations, assumptions and strengthsThere are distinct limitations in retrospectively testing a system
intended for use prospectively. The events of the 2005 influenza
B outbreak were well-documented, guiding where we believed
exceedances should appear, and when they would have been useful.
Nevertheless, aberrations detected by EARS were based only on
the data, independent of any prior knowledge of the influenza
outbreak. Also, further evaluation is required to ensure that the
system is sensitive enough for less extreme events and across
different demographic groups.
The purpose of this study was to test the Wellington ED
Respiratory Syndromic Surveillance System, rather than to
critically analyse the actions of RPH in the 2005 school influenza
B outbreak. While it is possible to identify the information that
would have been delivered to RPH, it is not possible to know with
any certainty what the subsequent response would have been, and
if this would have had any impact on the morbidity or mortality
that resulted. In this exercise, the assumption was made that the
surveillance system would have functioned in 2005 in the way that
it has been set up for 2008. In practice, this system would not have
been possible in 2005, with significant recent advancement in the
IT capacity at Wellington ED and experience gained over the past
few years at the MoH in EARS analysis and reporting.
This surveillance system was developed in accordance with the
key elements of the CDC framework for evaluation of surveillance
programs. The strengths of this system include being designed
and managed by the public health unit, who provide any required
response to the alerts generated. This arrangement allowed the
provision of weekly outputs determined by the public health unit to
be relevant to public health practice. Other strengths of this system
are skills capture from a range of organisations, the timeliness of
ICD 10 coding, and the stability and acceptability of automated
data collection and delivery. In particular, this surveillance system
has credibility, through the joint collaboration and buy-in from the
key stakeholders of Wellington Hospital, RPH and the MoH.
Thorough evaluation of the pilot study will occur at the end of
the pilot period, which will include the prospective evaluation of
the system over its two-year lifespan.
Conclusions The Wellington ED Respiratory Syndromic Surveillance System
may have assisted RPH in responding to the 2005 influenza B
outbreak in schools. Retrospectively, the system provided an extra
source of information, which might have given an early warning
of the outbreak and information on the group affected, the type
of illness and the progression of the outbreak. It is hoped that
this system will assist RPH to respond to future outbreaks of
respiratory illness.
AcknowledgementsWellington Hospital ED staff: Sandra Allmark and Dr Vicki
Vertongen. Dr Amanda D’Souza for the feasibility study on ED
respiratory syndromic surveillance.
References1. Lawson AB, Kleinman K. Introduction: Spatial and syndromic surveillance
for public health. In: Lawson AB, Kleinman K, editors. Spatial and Syndromic Surveillance for Public Health. Chichester (UK): John Wiley & Sons; 2005.
2. Henning KJ. What is syndromic surveillance? MMWR Morb Mortal Wkly Rep. 2004;53 Suppl:5-11.
3. Muscatello D, Churches T, Kaldor J, Zheng W, Chiu C, Correll P, et al. Emergency Department surveillance for the 2003 Rugby World Cup - New South Wales, Australia. MMWR Morb Mortal Wkly Rep. 2005;54 Suppl;196.
4. Centers for Disease Control and Prevention. Updated guidelines for evaluating public health surveillance systems: recommendations from the Guidelines Working Group. MMWR Recomm Rep. 2001;50:1-35.
5. Hirshon J. The rationale for developing public health surveillance systems based on Emergency Department data. Acad Emerg Med. 2000;7:1428-32.
6. Muscatello D, Churches T, Kaldor J, Zheng W, Chiu C, Correll P, et al. An automated, broad-based, near real-time public health surveillance system using presentations to hospital Emergency Departments in New South Wales, Australia. BMC Public Health. 2005;5:141.
7. Shaw C. Influenza-like-Illness in Schools: A Case Study, Wellington 2005. Lower Hutt (NZ): Regional Public Health; 2006.
8. Lopez L. Influenza Weekly Update 25 June –01 July 2005. Wellington (NZ): Institute of Environmental Science and Research; 2005.
9. Lopez L. Influenza Surveillance Summary June 2005. Wellington (NZ): Institute of Environmental Science and Research; 2005.
10. Coroner Says Vaccine Not to Blame for Boy’s Death. Wairarapa Times Age. 2005: Sept 15.
11. Newell M, Black J. Syndromic surveillance for influenza: how well do emergency department diagnoses correlate with notified cases. Victorian Infectious Diseases Bulletin. 2006;9:2-4.
12. Centers for Disease Control and Prevention. Syndrome definitions for disease associated with critical bioterrorism-associated agents. CDC Surveillance. 2003;21:1-29.
13. Hutwagner L, Browne T, Seeman GM, Fleischauer AT. Comparing Aberration Detection Methods with Simulated Data. Emerg Infect Dis. 2005;11(2):314-6.
14. Centers for Disease Control and Prevention. Early Aberration Reporting System (EARS) v4.5 User Guide; Altanta (GA): CDC; 2006.
15. Le Strat Y. Overview of temporal surveillance. In: Lawson AB, Kleinman K, editors. Spatial and Syndromic Surveillance for Public Health. Chichester (UK): John Wiley & Sons; 2005.
16. Hutwagner L, Seeman GM, Thompson WW, Treadwell TH. A simulation model for assessing aberration detection methods used in public health surveillance for systems with limited baselines. Stat Med. 2005;24:543-50.
17. Lawson B, Fitzhugh E, Hall P, Franklin C, Hutwagner L, Seeman G, et al. Multifaceted syndromic surveillance in a public health department using the early aberration reporting system. J Public Health Manag Pract. 2005;11:274-81.
18. Hutwagner L, Thompson W, Seeman GM, Treadwell T. The Bioterrorism Preparedness and Response Early Aberration Reporting System (EARS). J Urban Health. 2003;80(2 Suppl 1):89-95.
Viruses and infection The Wellington influenza outbreak
294 AUSTRALIAN AND NEW ZEALAND JOURNAL OF PUBLIC HEALTH 2009 vol. 33 no. 3© 2009 The Authors. Journal Compilation © 2009 Public Health Association of Australia
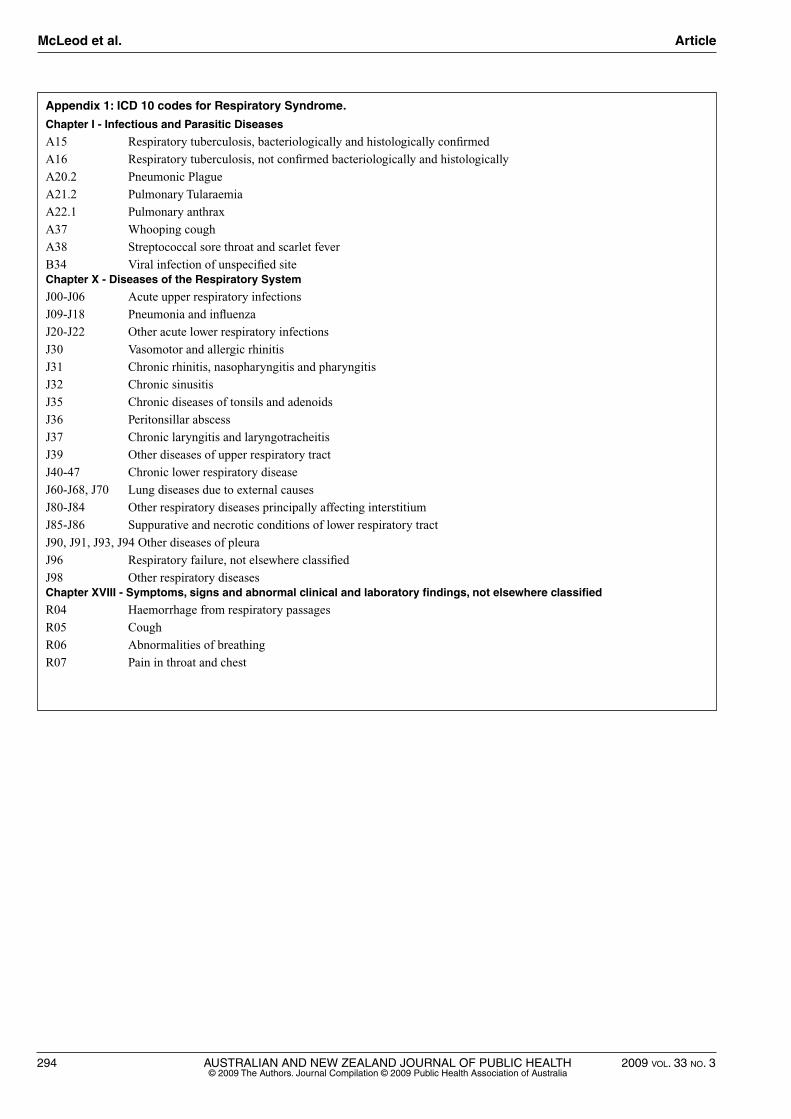
Appendix 1: ICD 10 codes for Respiratory Syndrome.
Chapter I - Infectious and Parasitic Diseases
A15 Respiratory tuberculosis, bacteriologically and histologically confirmed
A16 Respiratory tuberculosis, not confirmed bacteriologically and histologically
A20.2 Pneumonic Plague
A21.2 Pulmonary Tularaemia
A22.1 Pulmonary anthrax
A37 Whooping cough
A38 Streptococcal sore throat and scarlet fever
B34 Viral infection of unspecified siteChapter X - Diseases of the Respiratory System
J00-J06 Acute upper respiratory infections
J09-J18 Pneumonia and influenza
J20-J22 Other acute lower respiratory infections
J30 Vasomotor and allergic rhinitis
J31 Chronic rhinitis, nasopharyngitis and pharyngitis
J32 Chronic sinusitis
J35 Chronic diseases of tonsils and adenoids
J36 Peritonsillar abscess
J37 Chronic laryngitis and laryngotracheitis
J39 Other diseases of upper respiratory tract
J40-47 Chronic lower respiratory disease
J60-J68, J70 Lung diseases due to external causes
J80-J84 Other respiratory diseases principally affecting interstitium
J85-J86 Suppurative and necrotic conditions of lower respiratory tract
J90, J91, J93, J94 Other diseases of pleura
J96 Respiratory failure, not elsewhere classified
J98 Other respiratory diseases Chapter XVIII - Symptoms, signs and abnormal clinical and laboratory findings, not elsewhere classified
R04 Haemorrhage from respiratory passages
R05 Cough
R06 Abnormalities of breathing
R07 Pain in throat and chest
McLeod et al. Article