Embed Size (px)
Citation preview
The 2004 London ElectionsIncludes results from the 2005 Parliamentary General Election in London
and from the 2006 London Borough Council General Elections
Previous publications on local government elections
General Election of Greater London Councillors - 9 April 1964
London Borough Council Elections - 7 May 1964
General Election of Greater London Councillors - 13 April 1967
London Borough Council Elections - 9 May 1968
Greater London Council Elections - 9 April 1970
London Borough Council Elections - 13 May 1971
Greater London Council Elections - 12 April 1973
London Borough Council Elections - 2 May 1974
Greater London Council Elections - 5 May 1977
London Borough Council Elections - 4 May 1978
Greater London Council Elections - 7 May 1981
London Borough Council Elections - 6 May 1982
London Borough Council Elections - 8 May 1986
Inner London Education Authority Direct Elections - 8 May 1986
London Borough Council Elections - 3 May 1990
London Borough Council By-elections - May 1990 to May 1994
London Borough Council Elections - 5 May 1994
London Borough Council Elections - 7 May 1998
London Borough Council Elections - 2 May 2002
Published 1964 to 1982 by the Greater London Council, 1986 by the London Residuary Body, 1990 to 1998 by the London Research Centre, and 2002 by the Greater
London Authority.
The London Elections10 June 2004
The Parliamentary General Election5 May 2005
The London Borough Council General Elections4 May 2006
Michael Minors
Dennis Grenham
Copyright:Greater London AuthorityOctober 2006
Published by:Greater London AuthorityCity HallThe Queen’s WalkMore LondonLondon SE1 2AA
www.london.gov.ukenquiries 020 7983 4100minicom 020 7983 4458
ISBN 10: 1 85261 916 3ISBN 13: 978 1 85261 916 9
Acknowledgements:
This publication has grown over two years and the authors recognise the considerable contribution made by the kind help, advice and support given by many people at the GLA. Principal among those have been Anthony Mayer, John Bennett, Rob Lewis, Kelly Rump and Alison Vydulinska.
All maps in this publication are based on Ordnance Survey material with permission of Ordnance Survey on behalf of the Controller of Her Majesty’s Stationery Offi ce and are © Crown Copyright. Unauthorised reproduction infringes Crown Copyright and may lead to prosecution or civil proceedings. (Greater London Authority) (LA 100032379) (2006).
Data from the 2000 and 2004 elections for the Mayor of London and the London Assembly, and from the 2004 election for the European Parliament were provided by the London Elects Team at City Hall. Electronic counting at the elections was undertaken by Data and Research Services plc, on behalf of the Greater London Returning Offi cer. Further information on GLA elections can be found on the London Elects web site: www.londonelects.org.uk.Statistics from the 1999 European Parliamentary election were taken from European Parliamentary Election Expenses, Home Offi ce Statistical Bulletin 16/00, Home Offi ce 2000. Figures on rejected ballot papers at that election were provided separately by the Home Offi ce.Data from the 2001 Parliamentary general election were from The Parliamentary General Election, 2001, DMAG Briefi ng 2004/7, GLA 2004. The 2005 Parliamentary general election data were taken from the Electoral Commission’s web site and modifi ed using Guide to the House of Commons 2005, The Times 2005, and London borough web sites.Data from the 2006 London borough general elections were collected, principally, from the borough elections offi cers, by the GLA Data Management and Analysis Group (DMAG).
The authors would also like to acknowledge the following sources of the photographs used in this publication: City Hall ceiling - the cover: Adam Hinton; the Assembly Chamber - page 5: Hayley Madden; the European Parliament, Strasbourg - page 23: Atelier Architecture; City Hall - pages 63 and 221: Sarah Dyson; the Assembly Chamber - pages 147, 157 and 163: Hayley Madden.
GLA Data Management and Analysis Group The 2004 London Elections Page i
Contents
page
Foreword ii
Introduction 1
Summary 2
The results of the elections 5
Election for Mayor of London 6 Election for the London Assembly 10 Election for the European Parliament 18 Elected Members 21
The election statistics 23
Turnout 24 Spoiled ballot papers 26 Postal ballot papers 28 Manually-entered ballot papers 30
The parties’ performances 33
British National Party 34 Conservatives 36 Greens 38 Labour 40 Liberal Democrats 42 Respect 44 United Kingdom Independence Party 46 Christian People’s Alliance 48 Residents 49
The parliamentary general election 2005 51
The London borough general elections 2006 57
page
Detailed tables - 2004 elections 63
Results – Assembly constituencies 65
Mayoral election – fi rst preference 65 Mayoral election – second preference 81 Assembly election – constituency members 97 Assembly election – Londonwide members 113 European election 129
Statistics – Assembly constituencies 147
Turnout 149 Postal ballot papers 150 Manually-entered ballot papers 151 Rejected ballot papers 152
Results – London boroughs 157
Statistics – London boroughs 163
Parliamentary election, 2005 - details 173
London borough elections, 2006 - details 187
Appendices 221
Party codes used 223
Nominations 224
Technical notes 228
Electing members for the London Assembly 228 The European Parliament elections 229 The d’Hondt formula 229 The conduct of the election 229 Electronic counting 230 Manually-entered ballot papers 230 Spoiled ballot papers 231
Page ii The 2004 London Elections GLA Data Management and Analysis Group
ForewordOne of the Greater London Returning Offi cer’s responsibilities is to make sure
that the London electorate, and the public in general, are fully informed of
the conduct and results of relevant London elections. This was accomplished
for the 2000 and 2004 Greater London Authority elections primarily through
local posting of nominations and results, and through the publication of an
extensive range of data and information on the London Elects web site. This
new publication supplements those channels with a more studied and in-depth
analysis of the results. It includes all the important information in a format
which, it is hoped, will be accessible and useful to those who have not had
access to the internet, or who prefer the more traditional forms of publication.
The 2004 combined London elections were the most complex ever undertaken
in the United Kingdom. Voters elected the Mayor of London, 25 London
Assembly Members and nine Members of the European Parliament for the
London region. Aside from the European election, these were the second series
of elections for the new system of regional government for London, following
the inaugural elections in 2000.
The election offi cers again used electronic counting to enhance the speed
and accuracy of processing. Electronic counting also facilitated the production
of detailed analyses of voting for geographic areas smaller than the divisions
traditionally used when analysing parliamentary and local authority election
results.
Anthony Mayer
Greater London Returning Offi cer
GLA Data Management and Analysis Group The 2004 London Elections Page 1
IntroductionThe electronic counting and analysis used in the 2004 London elections meant
that although candidates were being elected for Greater London Assembly
constituencies (in the Assembly election) and London as a whole (in the
Mayoral, Assembly and European elections), besides being available for those
areas (as in 2000), voting details were provided for the fi rst time for the 33
local authority areas in London and for their constituent electoral wards. This
last division of wards did not apply to the area covered by the City of London
since several of their 25 electoral wards contain very few or no residents, and
so data were provided instead for the three polling districts used by the City.
Throughout the remainder of this report, references to wards in London should
be understood to refer to wards in the 32 London boroughs and polling districts
in the City of London. The disaggregation of the data into boroughs and wards
introduced a small number of discrepancies at these levels which cannot be
reconciled to the offi cial results at constituency level. All of these differences
are trivial in size.
This report will present the full results of each election for the Assembly
constituency areas and summary results for local authority areas. Much analysis
has been carried out at ward level and summaries are provided in the form of
mapping.
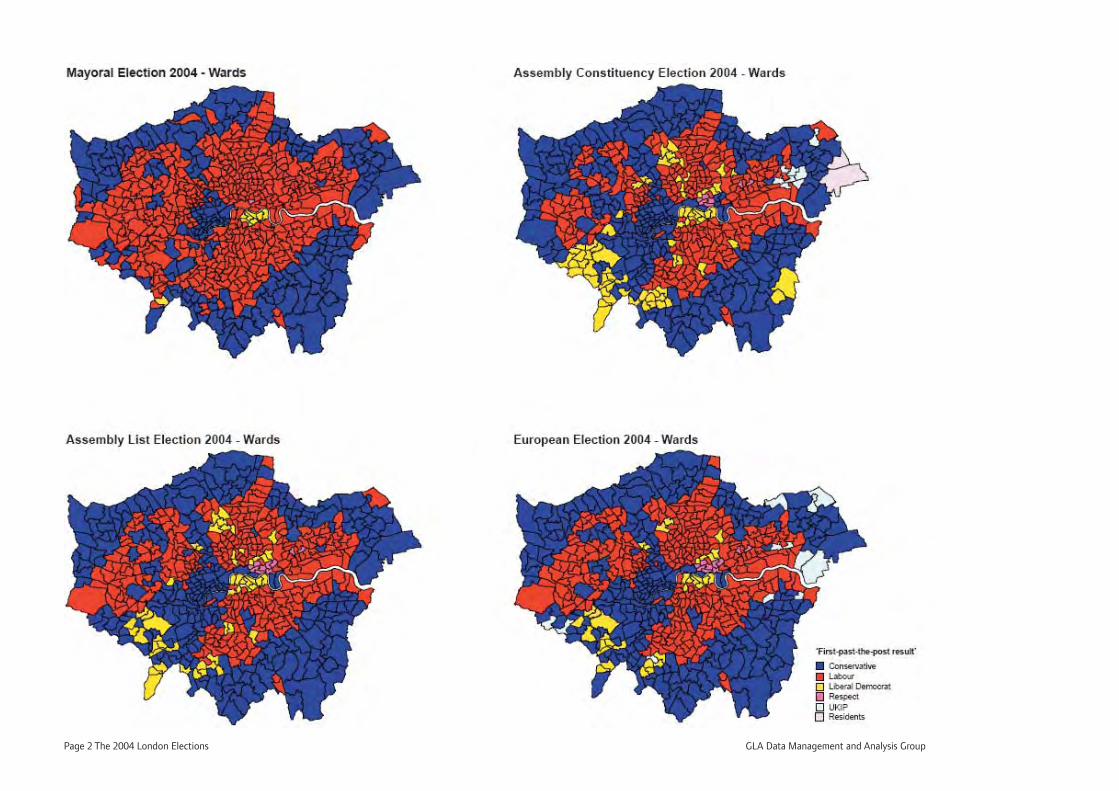
The report begins by providing a summary of the fi nal results. It then analyses
voting in each of the elections in turn, treating the Assembly election as two
entities – the election of the 14 constituency members as one, and the election
of the 11 London-wide members as the second. The remainder of the report
generally maintains this distinction, referring to the two parts of the Assembly
elections as the Assembly constituency election and the Assembly list election
as appropriate.
Brief analyses of turnout, rejected ballot papers, postal voting and manually-
entered votes follow.
The performance of individual parties in the four elections are then studied,
using mapping to illustrate voting patterns.
A brief analysis of the 2005 parliamentary general election is enhanced by
comparison with the 2004 results reworked to approximate to parliamentary
constituencies. A further brief analysis is provided of the 2006 London Borough
Council general elections.
The commentary is complemented by a comprehensive set of detailed
tabulations at Assembly constituency and local authority levels. The election
results are also available on the London Elects web site.
Page 2 The 2004 London Elections GLA Data Management and Analysis Group
GLA Data Management and Analysis Group The 2004 London Elections Page 3
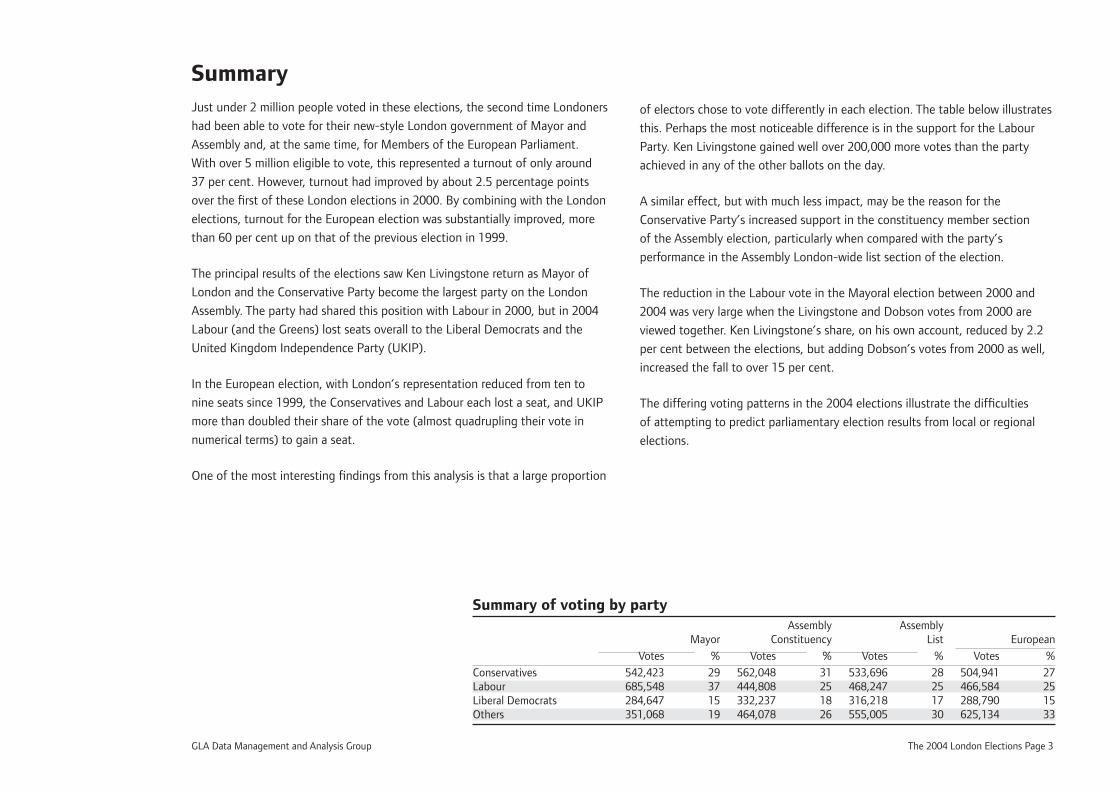
SummaryJust under 2 million people voted in these elections, the second time Londoners
had been able to vote for their new-style London government of Mayor and
Assembly and, at the same time, for Members of the European Parliament.
With over 5 million eligible to vote, this represented a turnout of only around
37 per cent. However, turnout had improved by about 2.5 percentage points
over the fi rst of these London elections in 2000. By combining with the London
elections, turnout for the European election was substantially improved, more
than 60 per cent up on that of the previous election in 1999.
The principal results of the elections saw Ken Livingstone return as Mayor of
London and the Conservative Party become the largest party on the London
Assembly. The party had shared this position with Labour in 2000, but in 2004
Labour (and the Greens) lost seats overall to the Liberal Democrats and the
United Kingdom Independence Party (UKIP).
In the European election, with London’s representation reduced from ten to
nine seats since 1999, the Conservatives and Labour each lost a seat, and UKIP
more than doubled their share of the vote (almost quadrupling their vote in
numerical terms) to gain a seat.
One of the most interesting fi ndings from this analysis is that a large proportion
of electors chose to vote differently in each election. The table below illustrates
this. Perhaps the most noticeable difference is in the support for the Labour
Party. Ken Livingstone gained well over 200,000 more votes than the party
achieved in any of the other ballots on the day.
A similar effect, but with much less impact, may be the reason for the
Conservative Party’s increased support in the constituency member section
of the Assembly election, particularly when compared with the party’s
performance in the Assembly London-wide list section of the election.
The reduction in the Labour vote in the Mayoral election between 2000 and
2004 was very large when the Livingstone and Dobson votes from 2000 are
viewed together. Ken Livingstone’s share, on his own account, reduced by 2.2
per cent between the elections, but adding Dobson’s votes from 2000 as well,
increased the fall to over 15 per cent.
The differing voting patterns in the 2004 elections illustrate the diffi culties
of attempting to predict parliamentary election results from local or regional
elections.
Summary of voting by party Assembly Assembly Mayor Constituency List European
Votes % Votes % Votes % Votes %
Conservatives 542,423 29 562,048 31 533,696 28 504,941 27Labour 685,548 37 444,808 25 468,247 25 466,584 25Liberal Democrats 284,647 15 332,237 18 316,218 17 288,790 15Others 351,068 19 464,078 26 555,005 30 625,134 33

Page 4 The 2004 London Elections GLA Data Management and Analysis Group
GLA Data Management and Analysis Group The 2004 London Elections Page 5
The results of the electionsThe results of the eleccttions
Page 6 The 2004 London Elections GLA Data Management and Analysis Group
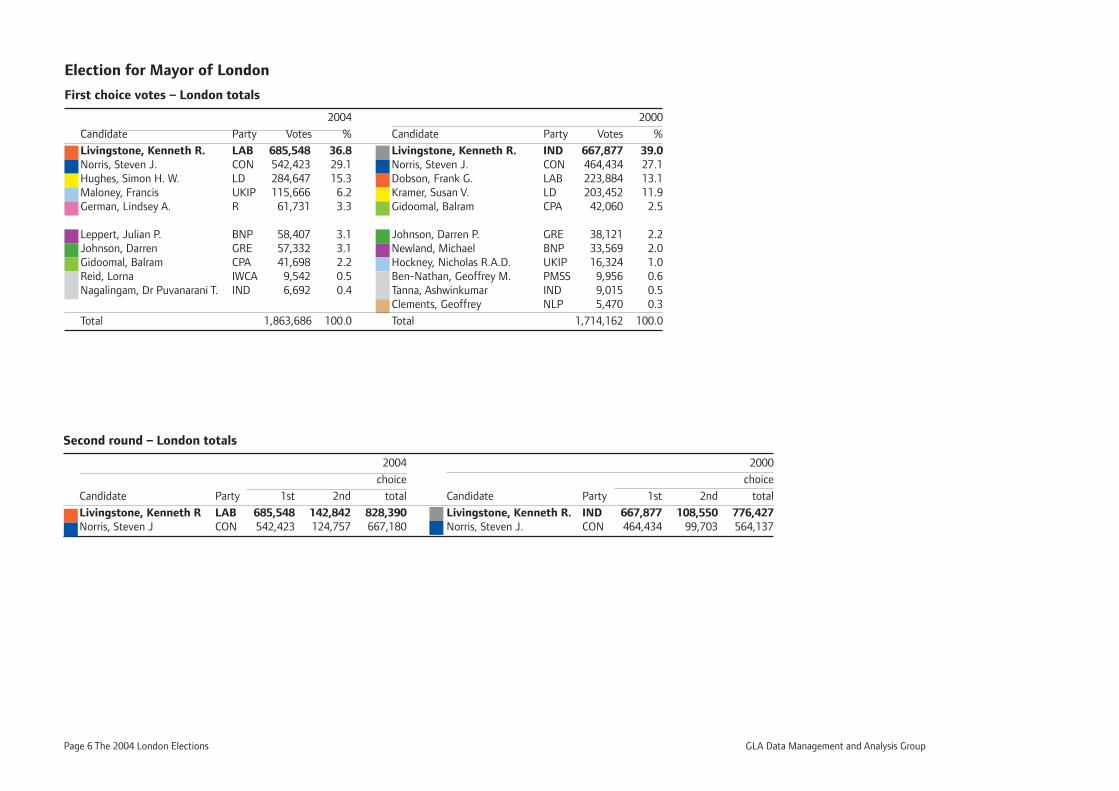
Election for Mayor of London
First choice votes – London totals
2004 2000
Candidate Party Votes % Candidate Party Votes %
Livingstone, Kenneth R. LAB 685,548 36.8 Livingstone, Kenneth R. IND 667,877 39.0Norris, Steven J. CON 542,423 29.1 Norris, Steven J. CON 464,434 27.1Hughes, Simon H. W. LD 284,647 15.3 Dobson, Frank G. LAB 223,884 13.1Maloney, Francis UKIP 115,666 6.2 Kramer, Susan V. LD 203,452 11.9German, Lindsey A. R 61,731 3.3 Gidoomal, Balram CPA 42,060 2.5
Leppert, Julian P. BNP 58,407 3.1 Johnson, Darren P. GRE 38,121 2.2Johnson, Darren GRE 57,332 3.1 Newland, Michael BNP 33,569 2.0Gidoomal, Balram CPA 41,698 2.2 Hockney, Nicholas R.A.D. UKIP 16,324 1.0Reid, Lorna IWCA 9,542 0.5 Ben-Nathan, Geoffrey M. PMSS 9,956 0.6Nagalingam, Dr Puvanarani T. IND 6,692 0.4 Tanna, Ashwinkumar IND 9,015 0.5 Clements, Geoffrey NLP 5,470 0.3
Total 1,863,686 100.0 Total 1,714,162 100.0
Second round – London totals
2004 2000
choice choice
Candidate Party 1st 2nd total Candidate Party 1st 2nd total
Livingstone, Kenneth R LAB 685,548 142,842 828,390 Livingstone, Kenneth R. IND 667,877 108,550 776,427 Norris, Steven J CON 542,423 124,757 667,180 Norris, Steven J. CON 464,434 99,703 564,137
GLA Data Management and Analysis Group The 2004 London Elections Page 7
Election for Mayor of London
The election for Mayor of London is made on the basis of the Supplementary
Vote System. This method requires the voters to mark their ballot paper in
the usual way against the candidate of their choice, and then, if they wish,
to indicate a second preference in a similar fashion. The fi rst choice votes for
each candidate are counted and if one has gained an absolute majority over
all rivals, he or she is elected. If no one has achieved this fi gure the second
choices come into play. All except the leading two candidates are eliminated.
The ballot papers containing fi rst preference votes for the eliminated candidates
are inspected and any second choice votes for the remaining two candidates
are counted. These second preference votes are then distributed appropriately
to the two leading candidates and the one with the greater total of votes at
this stage is declared the winner. In the unlikely event of a tie at this stage, the
result will be determined by drawing lots.
In the 2004 election, no candidate gained more than 50 per cent of fi rst
preference votes. The leading contenders were Ken Livingstone with 36.8 per
cent and Steven Norris with 29.1 per cent. The remaining eight candidates
were eliminated and following identifi cation and redistribution of the second
preference votes Ken Livingstone was declared Mayor with 55.4 per cent of the
votes included in the second stage (compared with 57.9 per cent in 2000).
Although Ken Livingstone increased his vote over the 2000 results by a little
over 2.6 per cent, an increased turnout determined that his share of the overall
fi rst preference vote was reduced by some 2.2 per cent. Bearing in mind that in
2000 Livingstone was standing as an independent against the offi cial Labour
Party candidate, the overall fall in the combined Livingstone/Labour share is
considerable – 15.2 per cent. Although some commentators have attributed
this shortfall to the intervention of Respect, their vote in the Mayoral election
falls far short of accounting for all the missing votes.
Steven Norris increased his vote by 16.8 per cent over the 2000 performance.
When the increased turnout is taken into account, this still resulted in a 2 per
cent increase in his share of the fi rst preference vote. The fi rst preference vote
represented a two-party swing of 3.2 per cent from Livingstone to Norris (the
more common calculation of total-vote swing gives 2.1 per cent but this fails to
isolate the two primary contenders). In contrast, the swing in overall votes used
in the second phase count was less at 1.3 per cent. This is an indication that,
although Norris increased his fi rst preference support far more than Livingstone
(16.8 per cent against 2.6 per cent as noted above), the increase in his second
preference vote was smaller (25.1 per cent compared with 31.6).
The Liberal Democrats increased their vote by almost 40 per cent and their
share by almost 3.5 per cent. They moved up from fourth to third place, but
this improved performance still left them short of second place by over 250,000
votes.
Only one of the remaining candidates achieved more than 5 per cent of the fi rst
preference vote. That was Frank Maloney for the UK independence Party. The
party’s vote increased more than sevenfold between the elections which may
refl ect the greater impact of European politics even in this regional election.
The only party or grouping to experience a reduced vote, notwithstanding the
increased turnout, was the Christian People’s Alliance whose 2004 performance
fell 362 short of that in 2000.
Page 8 The 2004 London Elections GLA Data Management and Analysis Group
Election for Mayor of London, 2004
Second choice votes by voters’ fi rst choice candidate
Candidate 2nd choice
German Gidoomal Hughes Johnson Leppert Livingstone Maloney Nagalingam Norris Reid1st choice R CPA LD GRE BNP LAB UKIP IND CON IWCA None
German R 797 10,765 6,678 506 15,118 1,631 602 4,315 2,064 10,036 Gidoomal CPA 807 9,155 2,346 471 10,213 2,314 1,075 6,309 941 4,646 Hughes LD 9,735 11,304 42,362 4,931 81,427 19,943 2,868 62,381 5,127 29,596 Johnson GRE 4,074 1,408 13,186 1,156 19,023 3,160 783 4,430 2,179 4,858 Leppert BNP 725 490 3,546 3,127 3,629 23,074 193 10,320 1,768 6,724 Livingstone LAB 29,619 20,909 231,565 110,264 7,984 24,638 8,559 60,391 14,725 112,745 Maloney UKIP 1,991 2,439 13,866 7,364 21,617 9,927 992 35,289 5,291 11,290 Nagalingam IND 264 475 857 467 127 1,610 336 821 383 829 Norris CON 5,916 15,158 166,588 31,865 28,679 43,529 111,210 4,523 6,855 90,687 Reid IWCA 944 320 1,204 1,141 455 1,895 1,253 273 892 820
Total 54,075 53,300 450,732 205,614 65,926 186,371 187,559 19,868 185,148 39,333 272,231
Both choices for same candidate 9,219 3,421 14,973 3,075 4,811 64,149 5,600 523 37,413 345
Election for Mayor of London, 2000
Second choice votes by voters’ fi rst choice candidate
Candidate 2nd choice
Ben-Nathan Clements Dobson Gidoomal Hockney Johnson Kramer Livingstone Newland Norris Tanna1st choice PMSS NLP LAB CPA UKIP GRE LD IND BNP CON IND None
Ben-Nathan PMSS 347 669 380 754 479 1,287 1,129 378 1,819 426 1,481 Clements NLP 164 438 258 252 1,045 481 749 144 368 147 977 Dobson LAB 1,522 1,932 7,276 1,506 12,754 51,413 40,367 1,871 21,577 5,013 51,067 Gidoomal CPA 477 308 4,745 1,229 2,348 10,037 4,842 325 6,983 1,898 6,036 Hockney UKIP 729 287 474 747 1,170 1,727 1,288 2,255 4,669 507 1,786 Johnson GRE 380 1,842 3,222 1,236 711 7,988 13,013 753 2,909 1,172 3,357 Kramer LD 2,801 1,933 29,103 10,292 3,162 25,764 42,166 2,938 50,173 4,887 22,566 Livingstone IND 5,296 6,480 121,663 13,565 5,778 122,013 165,671 10,773 63,064 18,240 100,731 Newland BNP 720 558 1,231 370 4,091 2,507 2,729 3,376 10,243 358 4,852 Norris CON 9,872 3,877 37,914 18,570 25,217 22,470 154,519 35,656 23,247 8,589 99,229 Tanna IND 253 174 1,050 963 287 676 1,296 1,620 119 962 1,086
Total 22,214 17,738 200,509 53,657 42,987 191,226 397,148 144,206 42,803 162,767 41,237 293,168
Both choices for same candidate 807 447 27,586 2,832 685 1,538 7,667 34,603 2,534 25,274 529
GLA Data Management and Analysis Group The 2004 London Elections Page 9
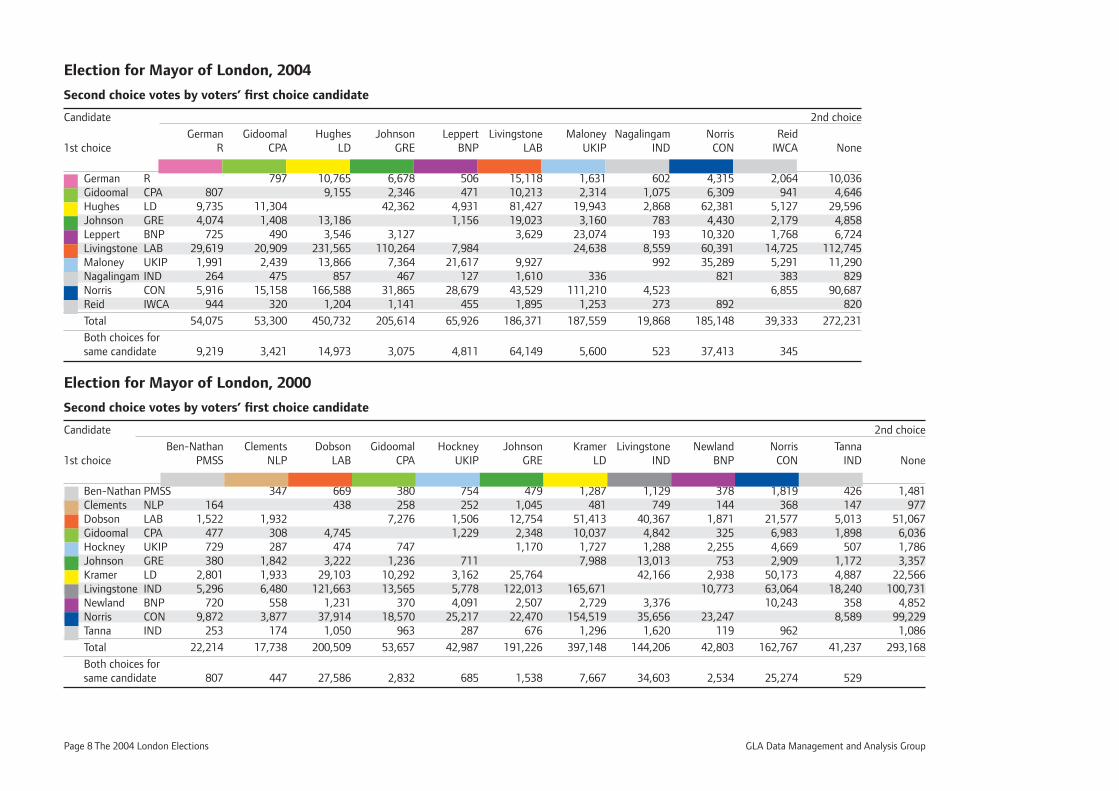
Second preference votes
The table opposite shows the destination of second preference votes by the
voters’ fi rst choice. Each row shows fi rst preference with the columns indicating
the destination of second preferences. Thus, for example, in the 2004 election
231,565 of the voters whose fi rst preference was Livingstone, gave Hughes
their second preference vote. People who chose to give both votes to the same
candidate or who failed to indicate a second choice will have wasted their
second preference vote, but nevertheless these fi gures are of some interest
and are included in the table. They will be discussed in more detail later in
the report. The rows showing total second choice votes do not include the
duplicated choices.
In 2004, Ken Livingstone was the principal second preference for all non-Labour
voters except for those choosing BNP, UKIP or Conservative as fi rst choice.
In the case of both Labour and Conservative fi rst choice voters, the Liberal
Democrat candidate was the second choice. This single fact ensured that Simon
Hughes was by far the most commonly selected second choice candidate.
Those who made the BNP and UKIP their fi rst preference, chose UKIP and
Conservative respectively as their most favoured second preference.
These patterns are somewhat different from those evident from the 2000
results. The Liberal Democrat candidate was again the most popular second
choice for those voting Labour, Conservative or independent (Livingstone) as
their fi rst choice. In this case the same was true for those voting CPA as their
fi rst preference. Ken Livingstone was the favourite second preference for those
voting Green or independent (Tanna) with their fi rst. On this occasion Steven
Norris was the second choice for those voting PMSS, BNP, Liberal Democrat
and (again) UKIP.
In 2004, voters whose fi rst choice was German, Livingstone or Norris were the
most likely to forgo the chance to use a second preference vote (all more than
16 per cent).
The proportions making no second choice in the 2000 election were generally
higher. More than one in fi ve Dobson and Norris voters fell into this category.
Indeed over 35 per cent of Dobson supporters either failed to make a second
preference vote or gave him both votes.
Page 10 The 2004 London Elections GLA Data Management and Analysis Group
Assembly constituency elections Liberal Constituency Conservative Labour Democrat UKIP Green Respect CPA Others Elected party Elected candidate
Barnet and Camden 47,640 36,121 23,603 8,685 11,921 5,150 1,914 — Conservative Brian ColemanBexley and Bromley 64,246 24,848 29,992 26,703 8,069 1,673 3,397 — Conservative Bob NeillBrent and Harrow 39,900 35,214 20,782 7,199 6,975 4,586 2,734 — Conservative Robert BlackmanCity and East London 23,749 38,085 18,255 17,997 8,687 19,675 4,461 — Labour John BiggsCroydon and Sutton 52,330 25,861 28,636 15,203 6,175 3,108 4,234 — Conservative Andrew PellingEaling and Hillingdon 45,230 34,214 23,440 14,698 9,395 4,229 3,024 5,285 Conservative Richard BarnesEnfi eld and Haringey 32,381 33,955 19,720 10,652 10,310 6,855 2,365 — Labour Joanne McCartneyGreenwich and Lewisham 22,168 36,251 19,183 13,454 11,271 2,825 3,619 — Labour Len DuvallHavering and Redbridge 44,723 28,017 13,646 18,297 6,009 5,185 2,917 10,553 Conservative Roger EvansLambeth and Southwark 17,380 36,280 30,805 8,777 11,901 4,930 3,656 608 Labour Valerie ShawcrossMerton and Wandsworth 48,295 31,417 17,864 8,327 10,163 4,291 2,782 1,240 Conservative Elizabeth HowlettNorth East 23,264 37,380 24,042 11,459 16,739 11,184 3,219 1,378 Labour Jennette ArnoldSouth West 48,858 25,225 44,791 12,477 9,866 3,785 3,008 — Conservative Tony ArbourWest Central 51,884 21,940 17,478 7,219 10,762 4,825 1,993 — Conservative Angie Bray
Assembly list election Liberal Round Conservative Labour Democrat Green UKIP BNP Respect CPA ADC Elected party Elected candidate
Percentage vote 28.5 25.0 16.9 8.6 8.4 4.8 4.7 2.9 0.3 Votes remaining 533,696 468,247 316,218 160,445 156,780 — — — —Elected above 9 5 0 0 0 1 53,370 78,041 316,218 160,445 156,780 Liberal Democrat Lynne FeatherstoneElected round 1 9 5 1 0 0 2 53,370 78,041 158,109 160,445 156,780 Green Jenny JonesElected round 2 9 5 1 1 0 3 53,370 78,041 158,109 80,223 156,780 Liberal Democrat Graham TopeElected round 3 9 5 2 1 0 4 53,370 78,041 105,406 80,223 156,780 UKIP Damian HockneyElected round 4 9 5 2 1 1 5 53,370 78,041 105,406 80,223 78,390 Liberal Democrat Sally HamweeElected round 5 9 5 3 1 1 6 53,370 78,041 79,055 80,223 78,390 Green Darren JohnsonElected round 6 9 5 3 2 1 7 53,370 78,041 79,055 53,482 78,390 Liberal Democrat Mike TuffreyElected round 7 9 5 4 2 1 8 53,370 78,041 63,244 53,482 78,390 UKIP Peter Hulme CrossElected round 8 9 5 4 2 2 9 53,370 78,041 63,244 53,482 52,260 Labour Nicky GavronElected round 9 9 6 4 2 2 10 53,370 66,892 63,244 53,482 52,260 Labour Murad QureshiElected round 10 9 7 4 2 2 11 53,370 58,531 63,244 53,482 52,260 Liberal Democrat Dee DooceyElected round 11 9 7 5 2 2
GLA Data Management and Analysis Group The 2004 London Elections Page 11
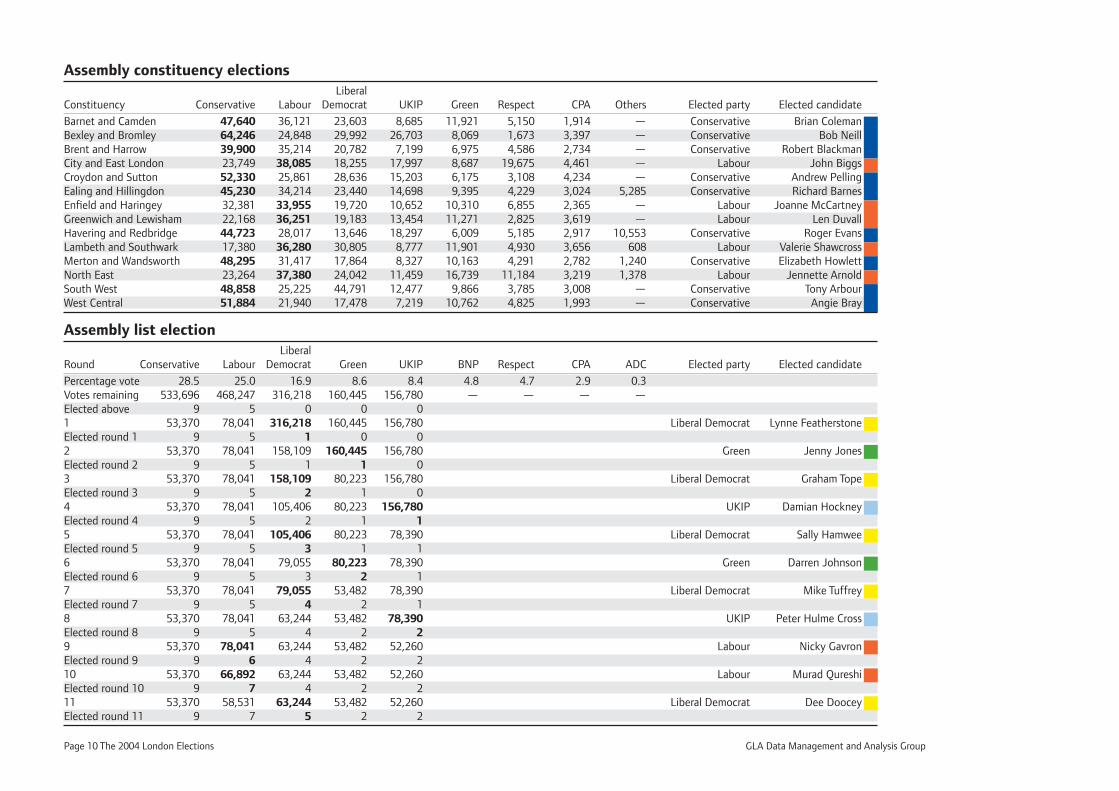
The Assembly election
Further details of the results of the elections for Assembly members are to be
found below on the pages immediately following and pages 97 to 128. Full lists
of candidates nominated are given on pages 225 and 226. Summary details of
the results are shown opposite.
The ballot for constituency members resulted in the election of nine
Conservative and fi ve Labour candidates. Electors voted for these 14 seats
using the left-hand side of the ballot paper and the winners were decided with
the fi rst-past-the-post system. Voters used the right-hand side of the ballot
paper to vote for the remaining 11 Assembly seats which were decided using
the modifi ed d’Hondt formula.
There is a description of the d’Hondt method in the Appendix (page 229) and
its use in the 2004 Assembly election is shown in detail here.
The fi rst step was to count the votes cast for each of the parties or individual
candidates in the London-wide list section of the ballot (these totals are
shown on page 13). Any party or candidate gaining less than 5 per cent of the
London-wide vote was then eliminated from further participation in the process
(see opposite). This eliminated the BNP, Respect, the CPA and the Alliance for
Diversity in the Community. The remaining fi ve parties were passed forward to
the next stages.
The number of seats won in the constituency element of the election were
carried forward to this stage and the number of votes gained by each remaining
party in the list element of the election was divided by the number of seats
already won plus one. For example, the Conservatives won nine seats in
the constituency election and gained 533,696 votes in the list election. The
533,696 votes were divided by ten (9+1) giving 53,370 (rounded) to take
forward into the fi rst round of the d’Hondt process. Clearly, since only the
Conservatives and Labour won seats in the constituency election, the other
three parties carried all their votes through (their votes being divided by one –
i.e. zero seats already won plus one).
The votes carried through to round one were inspected (the row labelled 1
opposite). It can be seen that the Liberal Democrats’ total was the largest in
this round (316,218) and so the fi rst candidate on the Liberal Democrats’ list
was declared as elected (Lynne Featherstone). The process was then repeated.
In the next round all parties except the Liberal Democrats carried their totals
through from round one. The Liberal Democrats now had one seat and so their
total was divided by two (1+1) giving 158,109 to carry forward to round two.
In this round the Greens had the largest total and were awarded the next seat,
the fi rst candidate on their list being elected. The process was then repeated
until all 11 seats had been allocated and this can be followed using the table
opposite.
Page 12 The 2004 London Elections GLA Data Management and Analysis Group
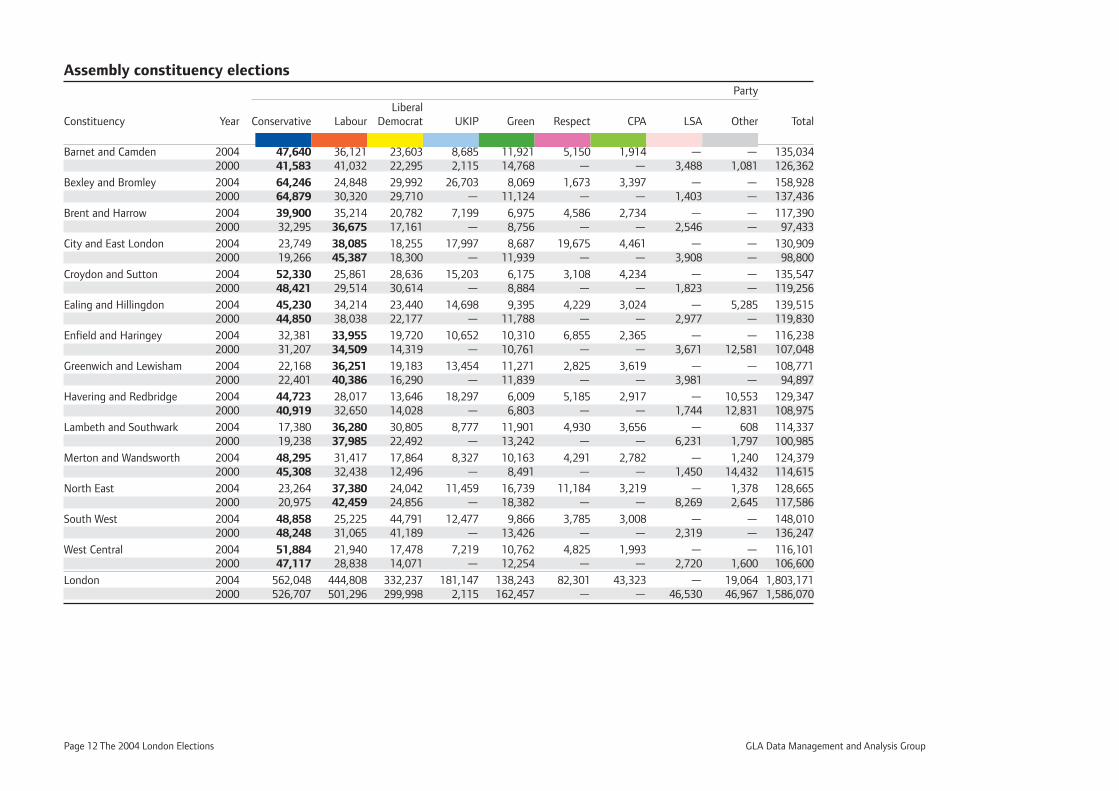
Assembly constituency elections Party
LiberalConstituency Year Conservative Labour Democrat UKIP Green Respect CPA LSA Other Total
Barnet and Camden 2004 47,640 36,121 23,603 8,685 11,921 5,150 1,914 — — 135,034 2000 41,583 41,032 22,295 2,115 14,768 — — 3,488 1,081 126,362
Bexley and Bromley 2004 64,246 24,848 29,992 26,703 8,069 1,673 3,397 — — 158,928 2000 64,879 30,320 29,710 — 11,124 — — 1,403 — 137,436
Brent and Harrow 2004 39,900 35,214 20,782 7,199 6,975 4,586 2,734 — — 117,390 2000 32,295 36,675 17,161 — 8,756 — — 2,546 — 97,433
City and East London 2004 23,749 38,085 18,255 17,997 8,687 19,675 4,461 — — 130,909 2000 19,266 45,387 18,300 — 11,939 — — 3,908 — 98,800
Croydon and Sutton 2004 52,330 25,861 28,636 15,203 6,175 3,108 4,234 — — 135,547 2000 48,421 29,514 30,614 — 8,884 — — 1,823 — 119,256
Ealing and Hillingdon 2004 45,230 34,214 23,440 14,698 9,395 4,229 3,024 — 5,285 139,515 2000 44,850 38,038 22,177 — 11,788 — — 2,977 — 119,830
Enfi eld and Haringey 2004 32,381 33,955 19,720 10,652 10,310 6,855 2,365 — — 116,238 2000 31,207 34,509 14,319 — 10,761 — — 3,671 12,581 107,048
Greenwich and Lewisham 2004 22,168 36,251 19,183 13,454 11,271 2,825 3,619 — — 108,771 2000 22,401 40,386 16,290 — 11,839 — — 3,981 — 94,897
Havering and Redbridge 2004 44,723 28,017 13,646 18,297 6,009 5,185 2,917 — 10,553 129,347 2000 40,919 32,650 14,028 — 6,803 — — 1,744 12,831 108,975
Lambeth and Southwark 2004 17,380 36,280 30,805 8,777 11,901 4,930 3,656 — 608 114,337 2000 19,238 37,985 22,492 — 13,242 — — 6,231 1,797 100,985
Merton and Wandsworth 2004 48,295 31,417 17,864 8,327 10,163 4,291 2,782 — 1,240 124,379 2000 45,308 32,438 12,496 — 8,491 — — 1,450 14,432 114,615
North East 2004 23,264 37,380 24,042 11,459 16,739 11,184 3,219 — 1,378 128,665 2000 20,975 42,459 24,856 — 18,382 — — 8,269 2,645 117,586
South West 2004 48,858 25,225 44,791 12,477 9,866 3,785 3,008 — — 148,010 2000 48,248 31,065 41,189 — 13,426 — — 2,319 — 136,247
West Central 2004 51,884 21,940 17,478 7,219 10,762 4,825 1,993 — — 116,101 2000 47,117 28,838 14,071 — 12,254 — — 2,720 1,600 106,600
London 2004 562,048 444,808 332,237 181,147 138,243 82,301 43,323 — 19,064 1,803,171 2000 526,707 501,296 299,998 2,115 162,457 — — 46,530 46,967 1,586,070
GLA Data Management and Analysis Group The 2004 London Elections Page 13
Assembly list elections Party
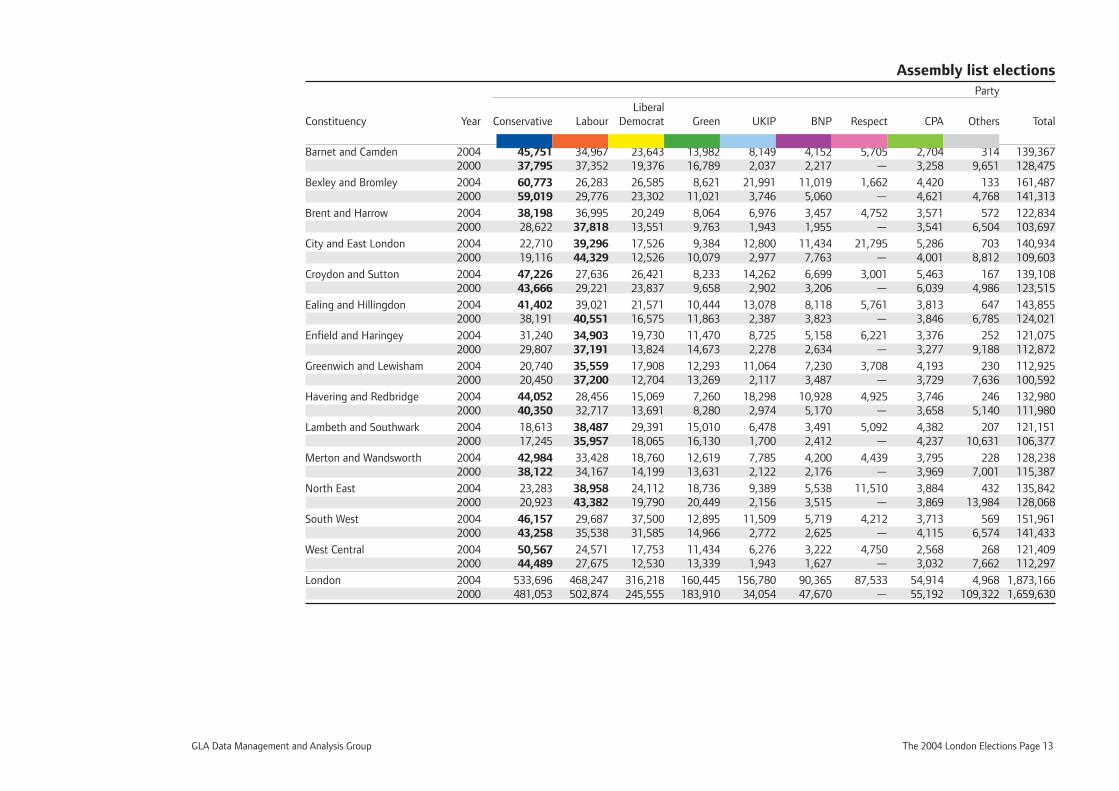
LiberalConstituency Year Conservative Labour Democrat Green UKIP BNP Respect CPA Others Total
Barnet and Camden 2004 45,751 34,967 23,643 13,982 8,149 4,152 5,705 2,704 314 139,367 2000 37,795 37,352 19,376 16,789 2,037 2,217 — 3,258 9,651 128,475
Bexley and Bromley 2004 60,773 26,283 26,585 8,621 21,991 11,019 1,662 4,420 133 161,487 2000 59,019 29,776 23,302 11,021 3,746 5,060 — 4,621 4,768 141,313
Brent and Harrow 2004 38,198 36,995 20,249 8,064 6,976 3,457 4,752 3,571 572 122,834 2000 28,622 37,818 13,551 9,763 1,943 1,955 — 3,541 6,504 103,697
City and East London 2004 22,710 39,296 17,526 9,384 12,800 11,434 21,795 5,286 703 140,934 2000 19,116 44,329 12,526 10,079 2,977 7,763 — 4,001 8,812 109,603
Croydon and Sutton 2004 47,226 27,636 26,421 8,233 14,262 6,699 3,001 5,463 167 139,108 2000 43,666 29,221 23,837 9,658 2,902 3,206 — 6,039 4,986 123,515
Ealing and Hillingdon 2004 41,402 39,021 21,571 10,444 13,078 8,118 5,761 3,813 647 143,855 2000 38,191 40,551 16,575 11,863 2,387 3,823 — 3,846 6,785 124,021
Enfi eld and Haringey 2004 31,240 34,903 19,730 11,470 8,725 5,158 6,221 3,376 252 121,075 2000 29,807 37,191 13,824 14,673 2,278 2,634 — 3,277 9,188 112,872
Greenwich and Lewisham 2004 20,740 35,559 17,908 12,293 11,064 7,230 3,708 4,193 230 112,925 2000 20,450 37,200 12,704 13,269 2,117 3,487 — 3,729 7,636 100,592
Havering and Redbridge 2004 44,052 28,456 15,069 7,260 18,298 10,928 4,925 3,746 246 132,980 2000 40,350 32,717 13,691 8,280 2,974 5,170 — 3,658 5,140 111,980
Lambeth and Southwark 2004 18,613 38,487 29,391 15,010 6,478 3,491 5,092 4,382 207 121,151 2000 17,245 35,957 18,065 16,130 1,700 2,412 — 4,237 10,631 106,377
Merton and Wandsworth 2004 42,984 33,428 18,760 12,619 7,785 4,200 4,439 3,795 228 128,238 2000 38,122 34,167 14,199 13,631 2,122 2,176 — 3,969 7,001 115,387
North East 2004 23,283 38,958 24,112 18,736 9,389 5,538 11,510 3,884 432 135,842 2000 20,923 43,382 19,790 20,449 2,156 3,515 — 3,869 13,984 128,068
South West 2004 46,157 29,687 37,500 12,895 11,509 5,719 4,212 3,713 569 151,961 2000 43,258 35,538 31,585 14,966 2,772 2,625 — 4,115 6,574 141,433
West Central 2004 50,567 24,571 17,753 11,434 6,276 3,222 4,750 2,568 268 121,409 2000 44,489 27,675 12,530 13,339 1,943 1,627 — 3,032 7,662 112,297
London 2004 533,696 468,247 316,218 160,445 156,780 90,365 87,533 54,914 4,968 1,873,166 2000 481,053 502,874 245,555 183,910 34,054 47,670 — 55,192 109,322 1,659,630
Page 14 The 2004 London Elections GLA Data Management and Analysis Group
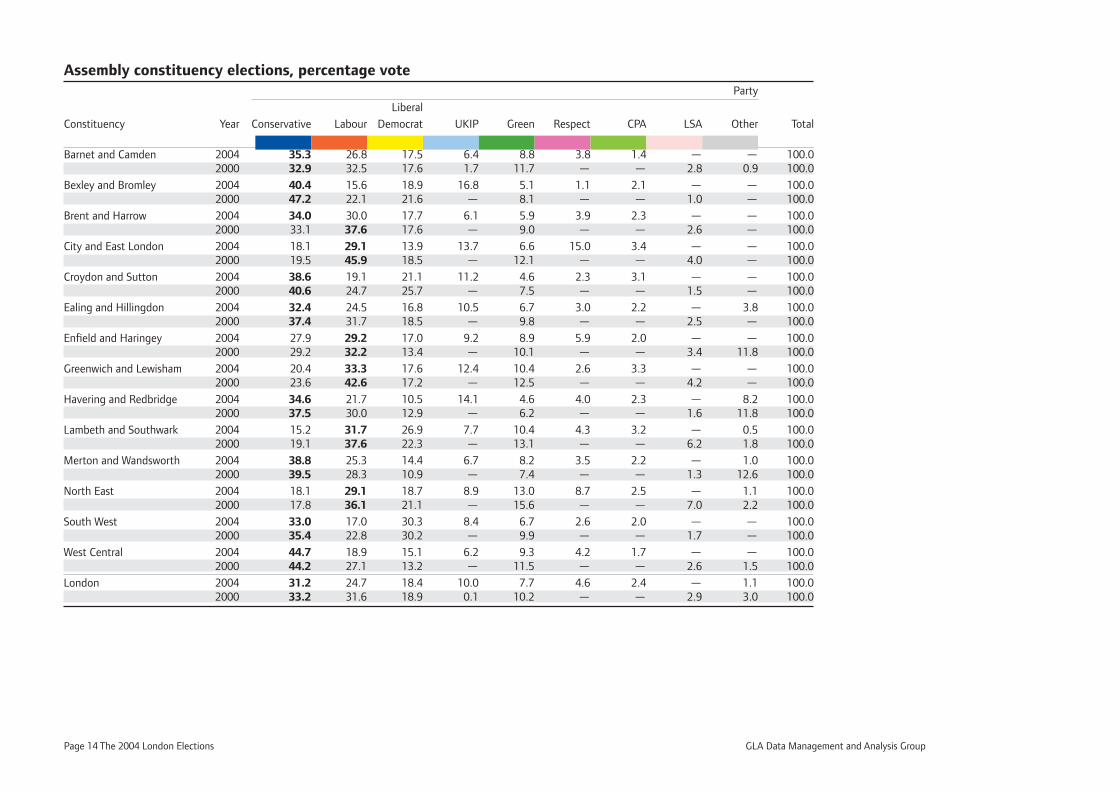
Assembly constituency elections, percentage vote Party
Liberal
Constituency Year Conservative Labour Democrat UKIP Green Respect CPA LSA Other Total
Barnet and Camden 2004 35.3 26.8 17.5 6.4 8.8 3.8 1.4 — — 100.0 2000 32.9 32.5 17.6 1.7 11.7 — — 2.8 0.9 100.0
Bexley and Bromley 2004 40.4 15.6 18.9 16.8 5.1 1.1 2.1 — — 100.0 2000 47.2 22.1 21.6 — 8.1 — — 1.0 — 100.0
Brent and Harrow 2004 34.0 30.0 17.7 6.1 5.9 3.9 2.3 — — 100.0 2000 33.1 37.6 17.6 — 9.0 — — 2.6 — 100.0
City and East London 2004 18.1 29.1 13.9 13.7 6.6 15.0 3.4 — — 100.0 2000 19.5 45.9 18.5 — 12.1 — — 4.0 — 100.0
Croydon and Sutton 2004 38.6 19.1 21.1 11.2 4.6 2.3 3.1 — — 100.0 2000 40.6 24.7 25.7 — 7.5 — — 1.5 — 100.0
Ealing and Hillingdon 2004 32.4 24.5 16.8 10.5 6.7 3.0 2.2 — 3.8 100.0 2000 37.4 31.7 18.5 — 9.8 — — 2.5 — 100.0
Enfi eld and Haringey 2004 27.9 29.2 17.0 9.2 8.9 5.9 2.0 — — 100.0 2000 29.2 32.2 13.4 — 10.1 — — 3.4 11.8 100.0
Greenwich and Lewisham 2004 20.4 33.3 17.6 12.4 10.4 2.6 3.3 — — 100.0 2000 23.6 42.6 17.2 — 12.5 — — 4.2 — 100.0
Havering and Redbridge 2004 34.6 21.7 10.5 14.1 4.6 4.0 2.3 — 8.2 100.0 2000 37.5 30.0 12.9 — 6.2 — — 1.6 11.8 100.0
Lambeth and Southwark 2004 15.2 31.7 26.9 7.7 10.4 4.3 3.2 — 0.5 100.0 2000 19.1 37.6 22.3 — 13.1 — — 6.2 1.8 100.0
Merton and Wandsworth 2004 38.8 25.3 14.4 6.7 8.2 3.5 2.2 — 1.0 100.0 2000 39.5 28.3 10.9 — 7.4 — — 1.3 12.6 100.0
North East 2004 18.1 29.1 18.7 8.9 13.0 8.7 2.5 — 1.1 100.0 2000 17.8 36.1 21.1 — 15.6 — — 7.0 2.2 100.0
South West 2004 33.0 17.0 30.3 8.4 6.7 2.6 2.0 — — 100.0 2000 35.4 22.8 30.2 — 9.9 — — 1.7 — 100.0
West Central 2004 44.7 18.9 15.1 6.2 9.3 4.2 1.7 — — 100.0 2000 44.2 27.1 13.2 — 11.5 — — 2.6 1.5 100.0
London 2004 31.2 24.7 18.4 10.0 7.7 4.6 2.4 — 1.1 100.0 2000 33.2 31.6 18.9 0.1 10.2 — — 2.9 3.0 100.0
GLA Data Management and Analysis Group The 2004 London Elections Page 15
Assembly constituency elections
London Assembly members are elected using the Additional Member System
(AMS) also used for elections to the Scottish Parliament and the Welsh
Assembly. Under this system voters have two votes, one to elect a member
for one of the 14 constituencies, and the second for a party or individual on a
London-wide list. The fi rst of these, the constituency election, is decided on a
fi rst-past-the-post system, the system traditionally used in British elections, and
thus familiar to the electorate. This part of the election is discussed here and
the London-wide list part later.
Overall in the 2004 constituency elections, Labour lost one seat, Brent and
Harrow, to the Conservatives compared with 2000.
The contrast in voting patterns between the Mayoral and Assembly elections
at constituency level is clear. Labour’s large lead in the Mayoral election
was overturned by the Conservatives in the Assembly constituency vote in
both 2004 and 2000. In 2004, they ‘won’ nine of the 14 constituencies, one
more than in 2000. Compared with the 2004 Mayoral election with around
60,000 fewer valid votes cast, the Conservatives gained an extra 20,000 votes.
Notwithstanding this they polled 2 per cent less than in 2000. Their biggest
drop was in Bexley and Bromley where UKIP had their best showing.
Labour, on the other hand polled 240,000 fewer votes than in the Mayoral
election, more than a third of their Mayoral total. Between 2000 and 2004
the party lost about 7 percentage points of support. This led to their losing
one of their seats on the Assembly – Brent and Harrow. Support was eroded
across the whole of London, from the 3 percentage points reduction in
Enfi eld and Haringey, and Merton and Wandsworth, to the loss of almost 17
percentage points in the City and East London. This last constituency also saw
the strongest result from Respect whose candidate came third, ahead of both
Liberal Democrat and UKIP.
The Liberal Democrats gained fi ve second places, one more (Bexley and
Bromley) in 2004 than in 2000, but only in the South West of London and
Lambeth and Southwark (areas of strong Liberal Democrat support) did they
come close enough to threaten a win. In those constituencies they came within
a little over 4,000 votes of the Conservative winner in the fi rst and within about
5,500 votes of the Labour winner in the second. In two other constituencies
they ran second to the Conservatives (Bexley and Bromley, and Croydon and
Sutton), and in one, to Labour (North East). In terms of overall votes, the
Liberal Democrats increased their votes by about 10 per cent over 2000, but
their share was depressed by about 0.5 of a percentage point.
Following little more than a token presence of one candidate in the 2000
election, UKIP put up a full slate and gained just over 10 per cent of the vote,
supplanting the Greens as the fourth placed party. In Bexley and Bromley, they
exceeded 26,000 votes, pushing the Labour candidate into fourth place. In one
other constituency, Havering and Redbridge, they also achieved a third place,
albeit a fairly distant one behind the Conservatives and Labour.
The Green Party was the only minor party to enter the full 14 candidates in
both 2000 and 2004 elections. However, only in Merton and Wandsworth
was the party able to improve its position between the two elections. Its best
performance in both elections was in the North East constituency.
Respect appeared for the fi rst time in the 2004 election, putting up the full 14
candidates. Overall they failed to achieve 5 per cent of the vote, but did pass
that fi gure in three constituencies in North and East London. In particular, their
result in the City and East London was especially signifi cant, gaining almost
20,000 votes, 15 per cent of the constituency total, which took them to third
place there.
Of the remaining candidates in 2004, only the CPA covered all 14
constituencies, but none reached 4 per cent of the vote. In the Havering and
Redbridge constituency, residents’ candidates stood in both 2000 and 2004,
but their vote was almost halved between the two elections. In 2000 two
independent Labour candidates, who expressed support for Ken Livingstone,
stood (one in Enfi eld and Haringey and the other in Merton and Wandsworth)
and both gained over 10,000 votes.
Page 16 The 2004 London Elections GLA Data Management and Analysis Group
Assembly list elections, percentage votes Party
LiberalConstituency Year Conservative Labour Democrat Green UKIP BNP Respect CPA Others Total
Barnet and Camden 2004 32.8 25.1 17.0 10.0 5.8 3.0 4.1 1.9 0.2 100.0 2000 29.4 29.1 15.1 13.1 1.6 1.7 — 2.5 7.5 100.0
Bexley and Bromley 2004 37.6 16.3 16.5 5.3 13.6 6.8 1.0 2.7 0.1 100.0 2000 41.8 21.1 16.5 7.8 2.7 3.6 — 3.3 3.4 100.0
Brent and Harrow 2004 31.1 30.1 16.5 6.6 5.7 2.8 3.9 2.9 0.5 100.0 2000 27.6 36.5 13.1 9.4 1.9 1.9 — 3.4 6.3 100.0
City and East London 2004 16.1 27.9 12.4 6.7 9.1 8.1 15.5 3.8 0.5 100.0 2000 17.4 40.4 11.4 9.2 2.7 7.1 — 3.7 8.0 100.0
Croydon and Sutton 2004 33.9 19.9 19.0 5.9 10.3 4.8 2.2 3.9 0.1 100.0 2000 35.4 23.7 19.3 7.8 2.3 2.6 — 4.9 4.0 100.0
Ealing and Hillingdon 2004 28.8 27.1 15.0 7.3 9.1 5.6 4.0 2.7 0.4 100.0 2000 30.8 32.7 13.4 9.6 1.9 3.1 — 3.1 5.5 100.0
Enfi eld and Haringey 2004 25.8 28.8 16.3 9.5 7.2 4.3 5.1 2.8 0.2 100.0 2000 26.4 32.9 12.2 13.0 2.0 2.3 — 2.9 8.1 100.0
Greenwich and Lewisham 2004 18.4 31.5 15.9 10.9 9.8 6.4 3.3 3.7 0.2 100.0 2000 20.3 37.0 12.6 13.2 2.1 3.5 — 3.7 7.6 100.0
Havering and Redbridge 2004 33.1 21.4 11.3 5.5 13.8 8.2 3.7 2.8 0.2 100.0 2000 36.0 29.2 12.2 7.4 2.7 4.6 — 3.3 4.6 100.0
Lambeth and Southwark 2004 15.4 31.8 24.3 12.4 5.3 2.9 4.2 3.6 0.2 100.0 2000 16.2 33.8 17.0 15.2 1.6 2.3 — 4.0 10.0 100.0
Merton and Wandsworth 2004 33.5 26.1 14.6 9.8 6.1 3.3 3.5 3.0 0.2 100.0 2000 33.0 29.6 12.3 11.8 1.8 1.9 — 3.4 6.1 100.0
North East 2004 17.1 28.7 17.8 13.8 6.9 4.1 8.5 2.9 0.3 100.0 2000 16.3 33.9 15.5 16.0 1.7 2.7 — 3.0 10.9 100.0
South West 2004 30.4 19.5 24.7 8.5 7.6 3.8 2.8 2.4 0.4 100.0 2000 30.6 25.1 22.3 10.6 2.0 1.9 — 2.9 4.6 100.0
West Central 2004 41.7 20.2 14.6 9.4 5.2 2.7 3.9 2.1 0.2 100.0 2000 39.6 24.6 11.2 11.9 1.7 1.4 — 2.7 6.8 100.0
London 2004 28.5 25.0 16.9 8.6 8.4 4.8 4.7 2.9 0.3 100.0 2000 29.0 30.3 14.8 11.1 2.1 2.9 — 3.3 6.6 100.0
GLA Data Management and Analysis Group The 2004 London Elections Page 17
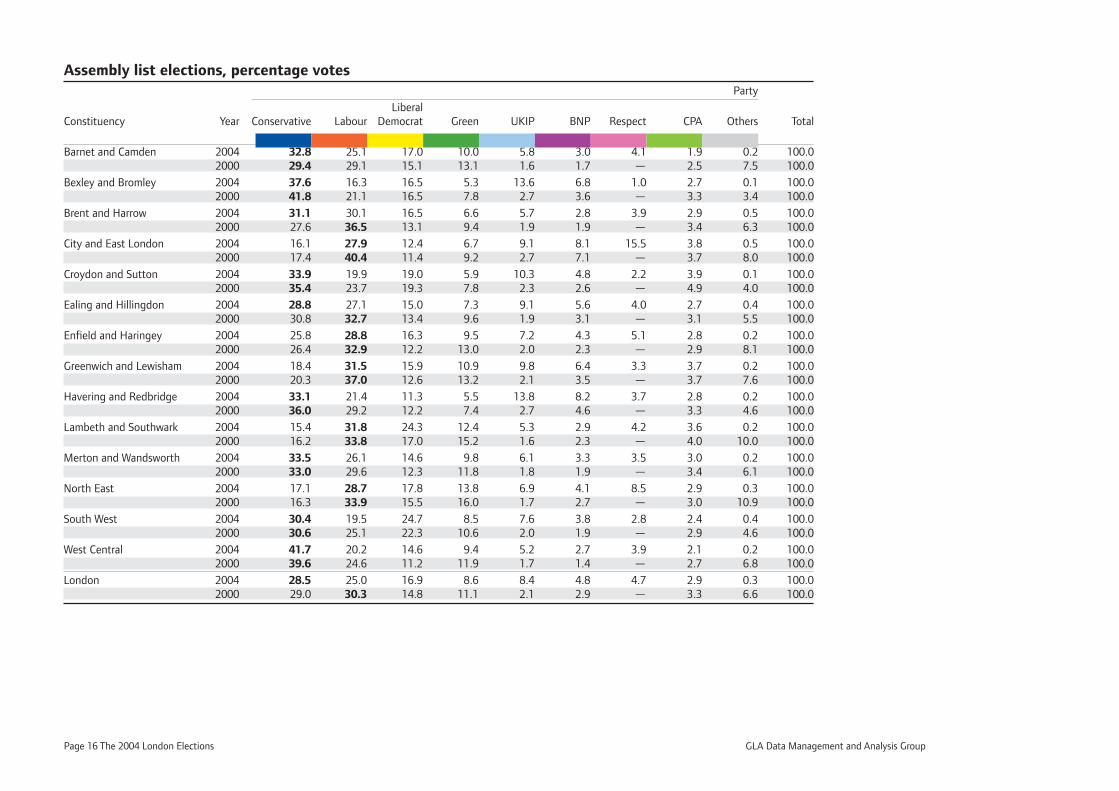
Assembly list elections
The voting in the Assembly list election was broadly in line with that in the
constituency elections. In terms of ‘winners’ (treating the contest as fi rst-past-
the-post in the same way as for the constituency election) in each constituency
the only change was in Ealing and Hillingdon where Labour ‘won’ in the list
election in 2000 but the Conservatives ‘won’ in the 2004 constituency election.
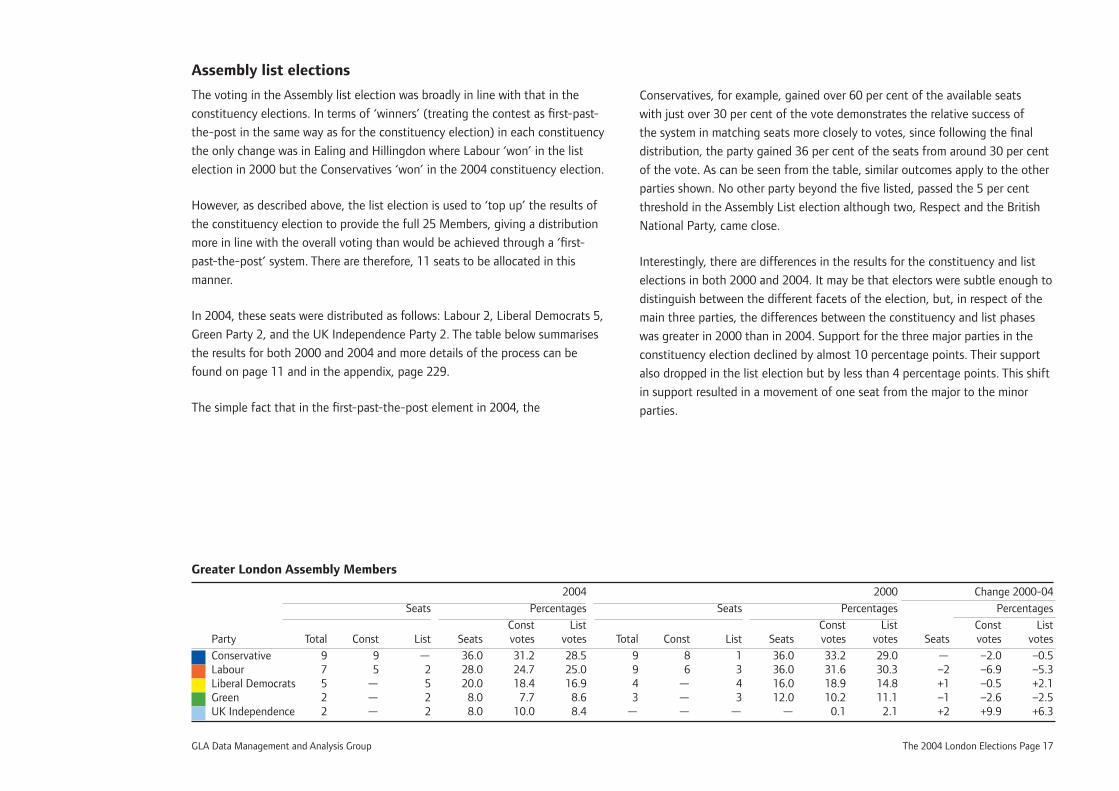
However, as described above, the list election is used to ‘top up’ the results of
the constituency election to provide the full 25 Members, giving a distribution
more in line with the overall voting than would be achieved through a ‘fi rst-
past-the-post’ system. There are therefore, 11 seats to be allocated in this
manner.
In 2004, these seats were distributed as follows: Labour 2, Liberal Democrats 5,
Green Party 2, and the UK Independence Party 2. The table below summarises
the results for both 2000 and 2004 and more details of the process can be
found on page 11 and in the appendix, page 229.
The simple fact that in the fi rst-past-the-post element in 2004, the
Greater London Assembly Members
2004 2000 Change 2000-04
Seats Percentages Seats Percentages Percentages
Const List Const List Const List Party Total Const List Seats votes votes Total Const List Seats votes votes Seats votes votes
Conservative 9 9 — 36.0 31.2 28.5 9 8 1 36.0 33.2 29.0 — –2.0 –0.5 Labour 7 5 2 28.0 24.7 25.0 9 6 3 36.0 31.6 30.3 –2 –6.9 –5.3 Liberal Democrats 5 — 5 20.0 18.4 16.9 4 — 4 16.0 18.9 14.8 +1 –0.5 +2.1 Green 2 — 2 8.0 7.7 8.6 3 — 3 12.0 10.2 11.1 –1 –2.6 –2.5 UK Independence 2 — 2 8.0 10.0 8.4 — — — — 0.1 2.1 +2 +9.9 +6.3
Conservatives, for example, gained over 60 per cent of the available seats
with just over 30 per cent of the vote demonstrates the relative success of
the system in matching seats more closely to votes, since following the fi nal
distribution, the party gained 36 per cent of the seats from around 30 per cent
of the vote. As can be seen from the table, similar outcomes apply to the other
parties shown. No other party beyond the fi ve listed, passed the 5 per cent
threshold in the Assembly List election although two, Respect and the British
National Party, came close.
Interestingly, there are differences in the results for the constituency and list
elections in both 2000 and 2004. It may be that electors were subtle enough to
distinguish between the different facets of the election, but, in respect of the
main three parties, the differences between the constituency and list phases
was greater in 2000 than in 2004. Support for the three major parties in the
constituency election declined by almost 10 percentage points. Their support
also dropped in the list election but by less than 4 percentage points. This shift
in support resulted in a movement of one seat from the major to the minor
parties.
Page 18 The 2004 London Elections GLA Data Management and Analysis Group
European election Liberal Round Conservative Labour Democrat UKIP Green Respect BNP CPA Others Elected party Elected candidate
Votes 504,941 466,584 288,790 232,633 158,986 91,175 76,152 45,038 21,150 Conservative Theresa VilliersElected round 1 1 0 0 0 0 0 0 0 0 2 252,471 466,584 288,790 232,633 158,986 91,175 76,152 45,038 21,150 Labour Claude MoraesElected round 2 1 1 0 0 0 0 0 0 0 3 252,471 233,292 288,790 232,633 158,986 91,175 76,152 45,038 21,150 Liberal Democrats Sarah LudfordElected round 3 1 1 1 0 0 0 0 0 0 4 252,471 233,292 144,395 232,633 158,986 91,175 76,152 45,038 21,150 Conservative John BowisElected round 4 2 1 1 0 0 0 0 0 0 5 168,314 233,292 144,395 232,633 158,986 91,175 76,152 45,038 21,150 Labour Mary HoneyballElected round 5 2 2 1 0 0 0 0 0 0 6 168,314 155,528 144,395 232,633 158,986 91,175 76,152 45,038 21,150 UKIP Gerard BattenElected round 6 2 2 1 1 0 0 0 0 0 7 168,314 155,528 144,395 116,317 158,986 91,175 76,152 45,038 21,150 Conservative Timothy TannockElected round 7 3 2 1 1 0 0 0 0 0 8 126,235 155,528 144,395 116,317 158,986 91,175 76,152 45,038 21,150 Green Jean LambertElected round 8 3 2 1 1 1 0 0 0 0 9 126,235 155,528 144,395 116,317 79,493 91,175 76,152 45,038 21,150 Labour Robert EvansElected round 9 3 3 1 1 1 0 0 0 0
GLA Data Management and Analysis Group The 2004 London Elections Page 19
The European election
The European election now is conducted on the basis of proportional
representation within regions using a pure form of the d’Hondt formula. London
is a single constituency in this election. Between 1999 and 2004 London lost
one seat in the European Parliament and now returns nine Members. Further
details of the voting system are to be found in the appendix (page 229), and
nominated candidates and parties are listed on page 227.
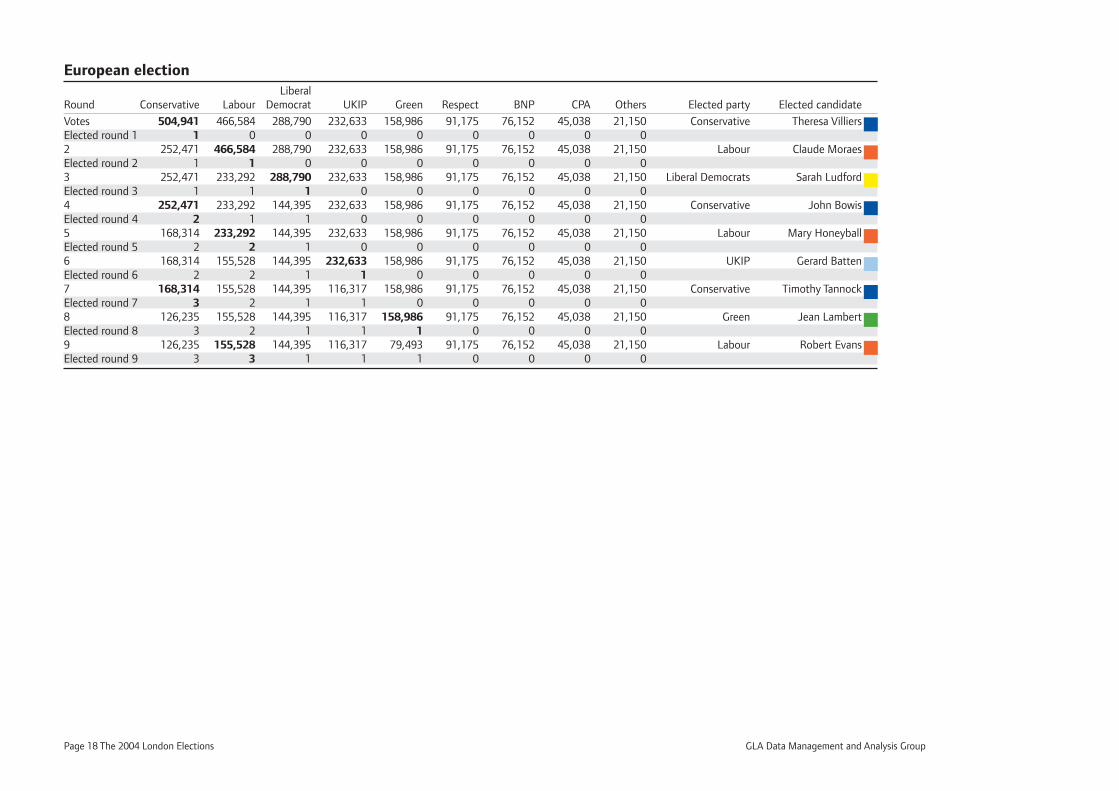
In 2004, the Conservative and Labour Parties both gained three seats (each
one fewer than in 1999), and the Liberal Democrats, UK Independence Party,
and Green Party one each (UKIP’s seat representing a gain over 1999). The
operation of the d’Hondt formula was similar to that used in the Assembly list
election but there was no lower limit on the percentage of the vote required to
gain seats. Thus the Conservatives won the fi rst seat with the highest overall
vote, and their total was then divided by two (1 seat plus 1) for the second
round. The fi rst person on the Conservative list, Theresa Villiers, was thus
elected. All other party votes were divided by one (0 seats plus 1). The Labour
Party won the second round and so their vote was divided by two for the third
round, and so on. The table opposite traces the whole process.
In terms of the simple vote, the Conservatives ‘won’ in 2004, whereas labour
‘won’ in 1999, but both parties lost vote share in 2004. The Liberal Democrats,
UK Independence Party, Green Party and British National Party all increased
their share of the vote. The substantially increased turnout meant that some of
these parties were able to increase their actual number of votes by very large
margins. The BNP more than quadrupled their vote, UKIP increased theirs 3.75
fold, the Liberal Democrats’ vote more than doubled, and the Green Party
was close to doubling its vote. Of course, the Liberal Democrats were starting
from a considerably higher base, particularly over the BNP, but the gains were
substantial.
The BNP’s rise came from a low base and in actual votes was lower than the
increase for any other party entering candidates in both 1999 and 2004. This
increase was close to the vote for the Christian People’s Alliance which did not
take part in 1999, and was substantially lower than the vote for the other main
new player, Respect. The largest gainer of votes was the UK Independence
Party which increased its vote by over 170,000, with the Liberal Democrats next
with almost 156,000.
For 2004 we have the breakdown of votes by Assembly constituency.
Conservative or Labour ‘won’ every constituency (seven each) but in fi ve
constituencies, one of those two parties did not emerge as ‘runner-up’. In three
the Liberal Democrats came second, Lambeth and Southwark, North East and
South West, and UKIP came second in Bexley and Bromley. In the City and East
London, Respect took second place to Labour, refl ecting their good showing in
the other 2004 elections in that area.
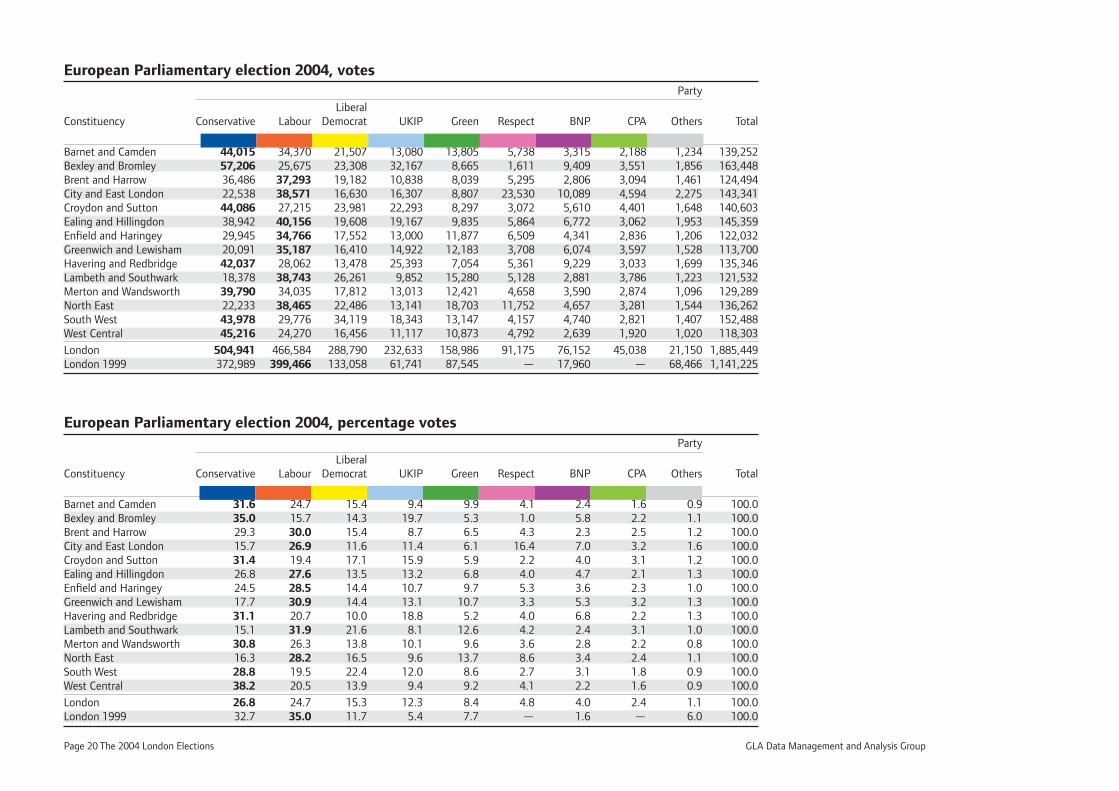
Page 20 The 2004 London Elections GLA Data Management and Analysis Group
European Parliamentary election 2004, votes Party
LiberalConstituency Conservative Labour Democrat UKIP Green Respect BNP CPA Others Total
Barnet and Camden 44,015 34,370 21,507 13,080 13,805 5,738 3,315 2,188 1,234 139,252Bexley and Bromley 57,206 25,675 23,308 32,167 8,665 1,611 9,409 3,551 1,856 163,448Brent and Harrow 36,486 37,293 19,182 10,838 8,039 5,295 2,806 3,094 1,461 124,494City and East London 22,538 38,571 16,630 16,307 8,807 23,530 10,089 4,594 2,275 143,341Croydon and Sutton 44,086 27,215 23,981 22,293 8,297 3,072 5,610 4,401 1,648 140,603Ealing and Hillingdon 38,942 40,156 19,608 19,167 9,835 5,864 6,772 3,062 1,953 145,359Enfi eld and Haringey 29,945 34,766 17,552 13,000 11,877 6,509 4,341 2,836 1,206 122,032Greenwich and Lewisham 20,091 35,187 16,410 14,922 12,183 3,708 6,074 3,597 1,528 113,700Havering and Redbridge 42,037 28,062 13,478 25,393 7,054 5,361 9,229 3,033 1,699 135,346Lambeth and Southwark 18,378 38,743 26,261 9,852 15,280 5,128 2,881 3,786 1,223 121,532Merton and Wandsworth 39,790 34,035 17,812 13,013 12,421 4,658 3,590 2,874 1,096 129,289North East 22,233 38,465 22,486 13,141 18,703 11,752 4,657 3,281 1,544 136,262South West 43,978 29,776 34,119 18,343 13,147 4,157 4,740 2,821 1,407 152,488West Central 45,216 24,270 16,456 11,117 10,873 4,792 2,639 1,920 1,020 118,303
London 504,941 466,584 288,790 232,633 158,986 91,175 76,152 45,038 21,150 1,885,449London 1999 372,989 399,466 133,058 61,741 87,545 — 17,960 — 68,466 1,141,225
European Parliamentary election 2004, percentage votes Party
LiberalConstituency Conservative Labour Democrat UKIP Green Respect BNP CPA Others Total
Barnet and Camden 31.6 24.7 15.4 9.4 9.9 4.1 2.4 1.6 0.9 100.0Bexley and Bromley 35.0 15.7 14.3 19.7 5.3 1.0 5.8 2.2 1.1 100.0Brent and Harrow 29.3 30.0 15.4 8.7 6.5 4.3 2.3 2.5 1.2 100.0City and East London 15.7 26.9 11.6 11.4 6.1 16.4 7.0 3.2 1.6 100.0Croydon and Sutton 31.4 19.4 17.1 15.9 5.9 2.2 4.0 3.1 1.2 100.0Ealing and Hillingdon 26.8 27.6 13.5 13.2 6.8 4.0 4.7 2.1 1.3 100.0Enfi eld and Haringey 24.5 28.5 14.4 10.7 9.7 5.3 3.6 2.3 1.0 100.0Greenwich and Lewisham 17.7 30.9 14.4 13.1 10.7 3.3 5.3 3.2 1.3 100.0Havering and Redbridge 31.1 20.7 10.0 18.8 5.2 4.0 6.8 2.2 1.3 100.0Lambeth and Southwark 15.1 31.9 21.6 8.1 12.6 4.2 2.4 3.1 1.0 100.0Merton and Wandsworth 30.8 26.3 13.8 10.1 9.6 3.6 2.8 2.2 0.8 100.0North East 16.3 28.2 16.5 9.6 13.7 8.6 3.4 2.4 1.1 100.0South West 28.8 19.5 22.4 12.0 8.6 2.7 3.1 1.8 0.9 100.0West Central 38.2 20.5 13.9 9.4 9.2 4.1 2.2 1.6 0.9 100.0
London 26.8 24.7 15.3 12.3 8.4 4.8 4.0 2.4 1.1 100.0London 1999 32.7 35.0 11.7 5.4 7.7 — 1.6 — 6.0 100.0
GLA Data Management and Analysis Group The 2004 London Elections Page 21
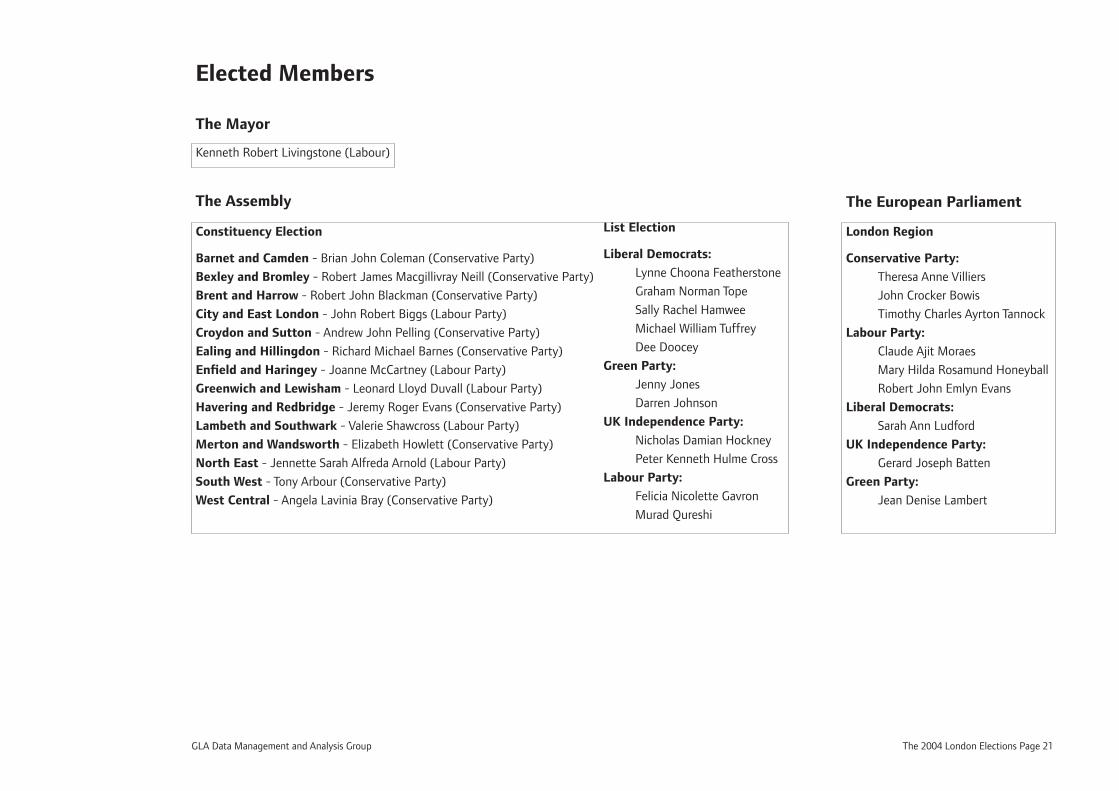
Elected Members
Kenneth Robert Livingstone (Labour)
Constituency Election
Barnet and Camden - Brian John Coleman (Conservative Party)
Bexley and Bromley - Robert James Macgillivray Neill (Conservative Party)
Brent and Harrow - Robert John Blackman (Conservative Party)
City and East London - John Robert Biggs (Labour Party)
Croydon and Sutton - Andrew John Pelling (Conservative Party)
Ealing and Hillingdon - Richard Michael Barnes (Conservative Party)
Enfi eld and Haringey - Joanne McCartney (Labour Party)
Greenwich and Lewisham - Leonard Lloyd Duvall (Labour Party)
Havering and Redbridge - Jeremy Roger Evans (Conservative Party)
Lambeth and Southwark - Valerie Shawcross (Labour Party)
Merton and Wandsworth - Elizabeth Howlett (Conservative Party)
North East - Jennette Sarah Alfreda Arnold (Labour Party)
South West - Tony Arbour (Conservative Party)
West Central - Angela Lavinia Bray (Conservative Party)
The Assembly
List Election
Liberal Democrats:
Lynne Choona Featherstone
Graham Norman Tope
Sally Rachel Hamwee
Michael William Tuffrey
Dee Doocey
Green Party:
Jenny Jones
Darren Johnson
UK Independence Party:
Nicholas Damian Hockney
Peter Kenneth Hulme Cross
Labour Party:
Felicia Nicolette Gavron
Murad Qureshi
London Region
Conservative Party:
Theresa Anne Villiers
John Crocker Bowis
Timothy Charles Ayrton Tannock
Labour Party:
Claude Ajit Moraes
Mary Hilda Rosamund Honeyball
Robert John Emlyn Evans
Liberal Democrats:
Sarah Ann Ludford
UK Independence Party:
Gerard Joseph Batten
Green Party:
Jean Denise Lambert
The Mayor
The European Parliament

Page 22 The 2004 London Elections GLA Data Management and Analysis Group
GLA Data Management and Analysis Group The 2004 London Elections Page 23
The election statistics
Page 24 The 2004 London Elections GLA Data Management and Analysis Group
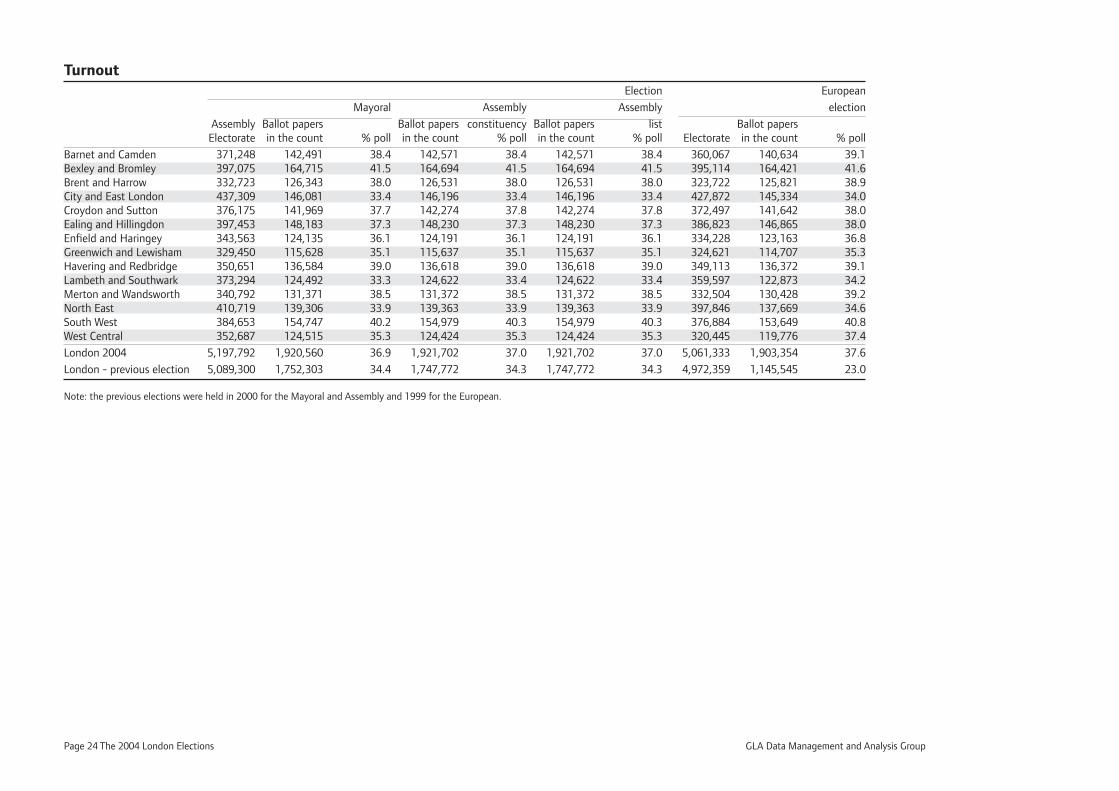
Turnout Election European
Mayoral Assembly Assembly election
Assembly Ballot papers Ballot papers constituency Ballot papers list Ballot papers Electorate in the count % poll in the count % poll in the count % poll Electorate in the count % poll
Barnet and Camden 371,248 142,491 38.4 142,571 38.4 142,571 38.4 360,067 140,634 39.1Bexley and Bromley 397,075 164,715 41.5 164,694 41.5 164,694 41.5 395,114 164,421 41.6Brent and Harrow 332,723 126,343 38.0 126,531 38.0 126,531 38.0 323,722 125,821 38.9City and East London 437,309 146,081 33.4 146,196 33.4 146,196 33.4 427,872 145,334 34.0Croydon and Sutton 376,175 141,969 37.7 142,274 37.8 142,274 37.8 372,497 141,642 38.0Ealing and Hillingdon 397,453 148,183 37.3 148,230 37.3 148,230 37.3 386,823 146,865 38.0Enfi eld and Haringey 343,563 124,135 36.1 124,191 36.1 124,191 36.1 334,228 123,163 36.8Greenwich and Lewisham 329,450 115,628 35.1 115,637 35.1 115,637 35.1 324,621 114,707 35.3Havering and Redbridge 350,651 136,584 39.0 136,618 39.0 136,618 39.0 349,113 136,372 39.1Lambeth and Southwark 373,294 124,492 33.3 124,622 33.4 124,622 33.4 359,597 122,873 34.2Merton and Wandsworth 340,792 131,371 38.5 131,372 38.5 131,372 38.5 332,504 130,428 39.2North East 410,719 139,306 33.9 139,363 33.9 139,363 33.9 397,846 137,669 34.6South West 384,653 154,747 40.2 154,979 40.3 154,979 40.3 376,884 153,649 40.8West Central 352,687 124,515 35.3 124,424 35.3 124,424 35.3 320,445 119,776 37.4
London 2004 5,197,792 1,920,560 36.9 1,921,702 37.0 1,921,702 37.0 5,061,333 1,903,354 37.6
London - previous election 5,089,300 1,752,303 34.4 1,747,772 34.3 1,747,772 34.3 4,972,359 1,145,545 23.0
Note: the previous elections were held in 2000 for the Mayoral and Assembly and 1999 for the European.
GLA Data Management and Analysis Group The 2004 London Elections Page 25
Turnout
Almost 5.2 million people in London were registered to vote in the 2004
elections with around 130,000 fewer entitled to vote in the European election.
The lower fi gure was due to the difference in qualifi cation rules for the London
and European elections.
In the Mayoral and Assembly elections, turnout was about 37 per cent, around
2.5 percentage points up on that in 2000.
The highest polls were returned in Bexley and Bromley with percentages
around 41.5 and the lowest in Lambeth and Southwark and in the City and East
London at around 33.4, although this fi gure was only about half a percentage
point lower than that in the North East Constituency.
The European fi gure was slightly higher than those for the other elements of
the 2004 elections, arising from the electorate differences noted above. The
turnout of 37.6 per cent was also substantially higher than in the previous
European election held in 1999. The rise, by more than 14.5 percentage points,
meant that over three quarters of a million more people voted in 2004 than in
1999. It seems likely that the increase resulted, at least in part, from holding
the election at the same time as the London Mayoral and Assembly elections.
Page 26 The 2004 London Elections GLA Data Management and Analysis Group
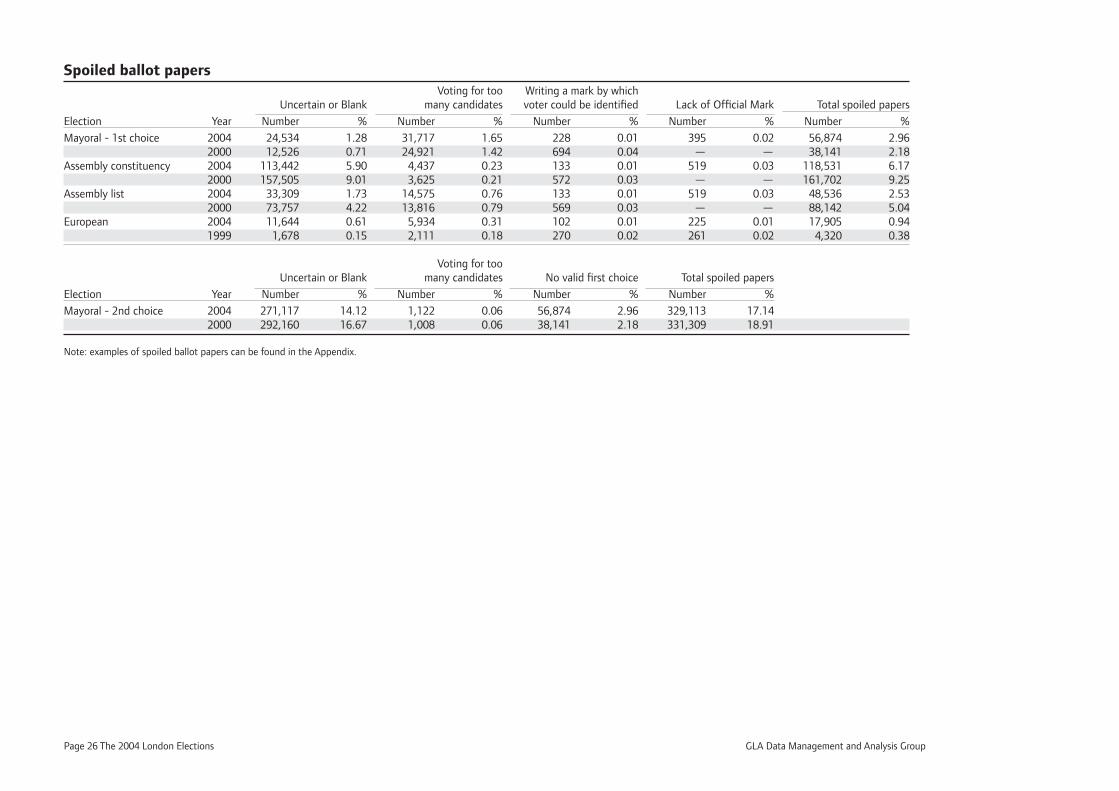
Spoiled ballot papers Voting for too Writing a mark by which Uncertain or Blank many candidates voter could be identifi ed Lack of Offi cial Mark Total spoiled papers
Election Year Number % Number % Number % Number % Number %
Mayoral - 1st choice 2004 24,534 1.28 31,717 1.65 228 0.01 395 0.02 56,874 2.96 2000 12,526 0.71 24,921 1.42 694 0.04 — — 38,141 2.18Assembly constituency 2004 113,442 5.90 4,437 0.23 133 0.01 519 0.03 118,531 6.17 2000 157,505 9.01 3,625 0.21 572 0.03 — — 161,702 9.25Assembly list 2004 33,309 1.73 14,575 0.76 133 0.01 519 0.03 48,536 2.53 2000 73,757 4.22 13,816 0.79 569 0.03 — — 88,142 5.04European 2004 11,644 0.61 5,934 0.31 102 0.01 225 0.01 17,905 0.94 1999 1,678 0.15 2,111 0.18 270 0.02 261 0.02 4,320 0.38
Voting for too Uncertain or Blank many candidates No valid fi rst choice Total spoiled papers
Election Year Number % Number % Number % Number %
Mayoral - 2nd choice 2004 271,117 14.12 1,122 0.06 56,874 2.96 329,113 17.14 2000 292,160 16.67 1,008 0.06 38,141 2.18 331,309 18.91
Note: examples of spoiled ballot papers can be found in the Appendix.
GLA Data Management and Analysis Group The 2004 London Elections Page 27
Spoiled ballot papers
Perhaps surprisingly at fi rst sight, rates of rejection of ballot papers varied
substantially between the four elections in 2004.
Since the two parts of the Assembly elections used the same form, rejections
were identical for reasons related to the ballot papers themselves (papers
which had been marked in ways which could enable identifi cation of the voter,
and where the offi cial mark was missing from the forms) rather than the votes
recorded on them. Across all the elections, rejections for these reasons were
few relative to the total number of votes cast, and also to the total numbers of
spoiled papers. But there were still more than 1,500 ballot papers discarded in
these ways.
Again perhaps surprisingly, by far the greatest numbers of rejections were in
the Assembly constituency polls – the only election of the four carried out
using the traditional fi rst-past-the-post system. Well over 100,000 votes were
rejected in this election (over 6 per cent of those attempting to vote), the
vast majority on the grounds that the form was blank or the voters’ intentions
uncertain. It may be that some voters were confused by the constituency
member list appearing alongside the Londonwide list with the latter showing
party names prominently. There was a much lower number of rejections of this
type in the Assembly list election (some 80,000 fewer) . On the other hand, the
constituency election saw fewer rejections on the grounds of ‘voting for too
many candidates’ than any of the other elections, perhaps because voters were
more familiar with this form of election.
The Mayor and Assembly list elections both resulted in around 50,000 spoiled
papers, but distributed differently between the reasons. In the Assembly list
poll, a little over two thirds of the rejections were for blank or uncertainly
marked forms. As noted above, the numbers here were considerably lower
than in the constituency member elections, and also in contrast to those polls,
a fairly large number of people attempted to vote for too many parties or
candidates (14,575 people – about three times the number in this category
in the constituency elections). Uniquely in the Mayoral election, over half the
spoiled papers arose from voting for too many candidates.
The European election resulted in by far the lowest rates of spoiled ballots with
less than 1 per cent. While sharing, in terms of voting, the same method with
the Assembly list, rejections due to blank or uncertainly marked forms were a
little over a third as high and errors of multiple voting less than half. This may
again point to the layout of the Assembly form which may have confused some
voters.
In individual constituencies, the City and East London recorded the highest
rejection rates in all four polls. In this area, more than one in ten ballot papers
were blank or uncertain in the constituency election, and one in twenty in the
Mayoral poll. Bexley and Bromley constituency consistently achieved the lowest
rates (although equalled by the South West in the Assembly list election).
Overall, the rates of rejection were substantially reduced from the 2000 London
elections, when close to 1 in 10 papers in the Assembly constituency poll were
spoiled. The exception was in the Mayoral election where almost 50 per cent
more ballot papers were rejected in 2004. There was also an improvement in
the number of rejections on the basis of marks on the ballot papers which could
identify the voter. Rejection on the grounds of lack of the offi cial mark appear
not to have been recorded in 2000.
About one in seven voters chose not to make a second preference vote for
Mayor or did not fully understand the system. This proportion was down
substantally from 2000 but still represented over a quarter of a million voters.
Comparison of the rates in the European poll with those from the last previous
such election in 1999, shows decreased rates of rejection based on problems
with the ballot papers but the reverse in the other categories arising from blank
forms or over-voting.
Page 28 The 2004 London Elections GLA Data Management and Analysis Group
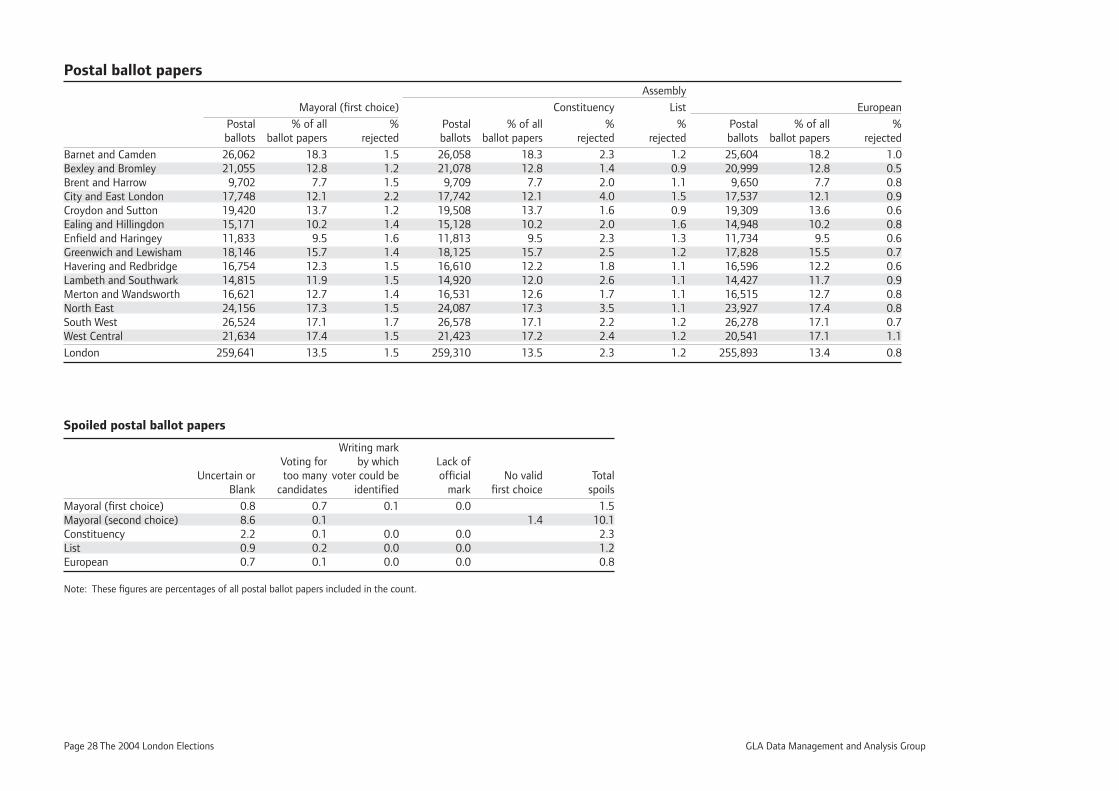
Postal ballot papers Assembly
Mayoral (fi rst choice) Constituency List European
Postal % of all % Postal % of all % % Postal % of all % ballots ballot papers rejected ballots ballot papers rejected rejected ballots ballot papers rejected
Barnet and Camden 26,062 18.3 1.5 26,058 18.3 2.3 1.2 25,604 18.2 1.0Bexley and Bromley 21,055 12.8 1.2 21,078 12.8 1.4 0.9 20,999 12.8 0.5Brent and Harrow 9,702 7.7 1.5 9,709 7.7 2.0 1.1 9,650 7.7 0.8City and East London 17,748 12.1 2.2 17,742 12.1 4.0 1.5 17,537 12.1 0.9Croydon and Sutton 19,420 13.7 1.2 19,508 13.7 1.6 0.9 19,309 13.6 0.6Ealing and Hillingdon 15,171 10.2 1.4 15,128 10.2 2.0 1.6 14,948 10.2 0.8Enfi eld and Haringey 11,833 9.5 1.6 11,813 9.5 2.3 1.3 11,734 9.5 0.6Greenwich and Lewisham 18,146 15.7 1.4 18,125 15.7 2.5 1.2 17,828 15.5 0.7Havering and Redbridge 16,754 12.3 1.5 16,610 12.2 1.8 1.1 16,596 12.2 0.6Lambeth and Southwark 14,815 11.9 1.5 14,920 12.0 2.6 1.1 14,427 11.7 0.9Merton and Wandsworth 16,621 12.7 1.4 16,531 12.6 1.7 1.1 16,515 12.7 0.8North East 24,156 17.3 1.5 24,087 17.3 3.5 1.1 23,927 17.4 0.8South West 26,524 17.1 1.7 26,578 17.1 2.2 1.2 26,278 17.1 0.7West Central 21,634 17.4 1.5 21,423 17.2 2.4 1.2 20,541 17.1 1.1
London 259,641 13.5 1.5 259,310 13.5 2.3 1.2 255,893 13.4 0.8
Spoiled postal ballot papers
Writing mark Voting for by which Lack of Uncertain or too many voter could be offi cial No valid Total Blank candidates identifi ed mark fi rst choice spoils
Mayoral (fi rst choice) 0.8 0.7 0.1 0.0 1.5Mayoral (second choice) 8.6 0.1 1.4 10.1Constituency 2.2 0.1 0.0 0.0 2.3List 0.9 0.2 0.0 0.0 1.2European 0.7 0.1 0.0 0.0 0.8
Note: These fi gures are percentages of all postal ballot papers included in the count.
GLA Data Management and Analysis Group The 2004 London Elections Page 29
line with experience in the elections overall.
At borough level there was exceptionally high use of postal voting in Hackney
and the City of London, in both cases postal ballots representing over 35
per cent of the papers included in the count. At the other end of the scale,
postal voting was used by less than 7 per cent of voters in both Brent and
Islington. Although there was necessarily more variation in rates of rejection at
borough level, the worst fi gure was 5.3 per cent in Newham in the Assembly
constituency election.
The rates of spoiled papers among postal votes were substantially below those
overall: typically, they were about half those rates. The only exception was
in the European election in which the rates were close to the overall rates for
all voters, but as already noted the overall rates in this election were already
relatively low.
Postal ballot papers
Around a quarter of a million voters used postal voting in the 2004 London
elections. This represented about 13.5 per cent of all those voting.
There was considerable variation in the percentage across the Assembly
constituencies, from 7.7 per cent in Brent and Harrow to 18.3 per cent in Barnet
and Camden (despite the geographical proximity of these areas). Generally,
between 1 and 2 per cent of postal ballot papers were rejected in the Mayoral
election and, consistently, a lower percentage in the European election. However,
there was a notable difference between the two Assembly elections. While the
Assembly constituency election showed a higher rejection of postal ballot papers
than the Mayoral election, the Assembly List rate was lower in every constituency
bar one – Ealing and Hillingdon. This argues that postal voters found the list
elections, Assembly and European, less confusing than the Mayoral in which they
had two possible votes. And perhaps more surprisingly, the least successfully
completed postal ballots were in the Assembly constituency election, the only
one of the four held in the traditional fi rst-past-the-post basis, but this was in
Page 30 The 2004 London Elections GLA Data Management and Analysis Group
Manually-entered ballot papers Assembly
Mayoral (fi rst choice) Constituency List European
Manually- % of all % Manually- % of all % % Manually- % of all % ent’d ballots ballot papers rejected ent’d ballots ballot papers rejected rejected ent’d ballots ballot papers rejected
Barnet and Camden 428 0.30 8.9 788 0.55 16.9 13.8 683 0.49 7.5Bexley and Bromley 458 0.28 12.2 171 0.10 10.5 8.8 269 0.16 5.6Brent and Harrow 433 0.34 7.6 162 0.13 13.0 7.4 299 0.24 6.4City and East London 257 0.18 9.7 333 0.23 19.2 13.2 175 0.12 6.3Croydon and Sutton 522 0.37 8.6 331 0.23 11.2 9.4 359 0.25 4.2Ealing and Hillingdon 367 0.25 14.4 242 0.16 7.4 6.2 465 0.32 4.7Enfi eld and Haringey 398 0.32 9.0 180 0.14 12.2 8.3 382 0.31 8.6Greenwich and Lewisham 420 0.36 5.0 717 0.62 17.0 14.6 336 0.29 2.4Havering and Redbridge 539 0.39 10.2 927 0.68 12.5 10.0 395 0.29 7.8Lambeth and Southwark 996 0.80 10.4 369 0.30 17.1 10.3 499 0.41 3.6Merton and Wandsworth 320 0.24 7.2 380 0.29 8.4 6.1 293 0.22 6.8North East 971 0.70 7.9 670 0.48 10.9 6.3 568 0.41 4.6South West 417 0.27 9.6 646 0.42 18.4 15.8 438 0.29 6.2West Central 428 0.34 4.7 520 0.42 10.0 7.9 252 0.21 7.5
London 6,954 0.36 9.0 6,436 0.33 13.8 10.6 5,413 0.28 5.8
Spoiled manually-entered ballot papers
Writing mark Voting for by which Lack of Uncertain or too many voter could be offi cial No valid Total Blank candidates identifi ed mark fi rst choice spoils
Mayoral (fi rst choice) 1.8 1.5 0.0 5.7 9.0Mayoral (second choice) 13.3 3.0 3.3 25.3Constituency 5.6 0.2 0.0 8.1 13.8List 1.8 0.8 0.0 8.1 10.6European 1.3 0.3 0.0 4.2 5.8
Note: These fi gures are percentages of all manually-entered ballot papers included in the count.
GLA Data Management and Analysis Group The 2004 London Elections Page 31
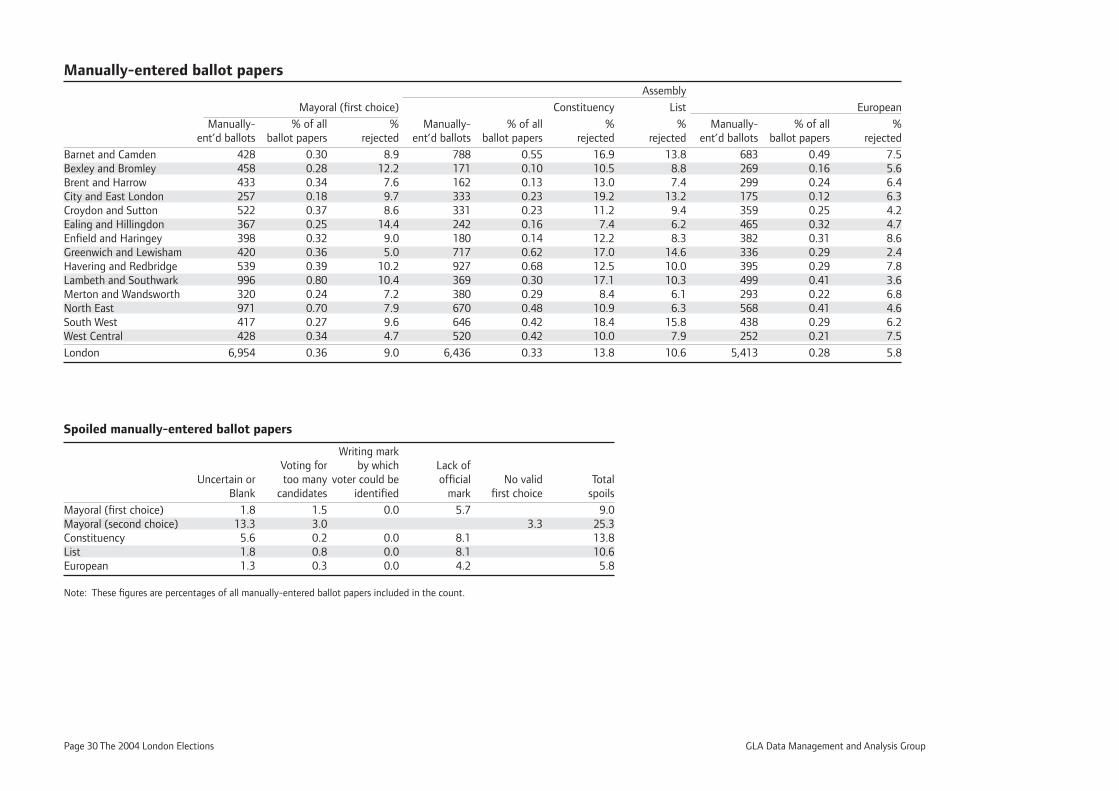
Manually-entered ballot papers
Relatively few votes were entered manually, between 5,400 and 7,000 in the
four elections – less than half of 1 per cent. In no constituency did that fi gure
exceed 0.80 per cent. The conditions under which ballot papers were entered
manually are discussed in the technical appendix (page 230).
Although a relatively small number, these votes were treated separately in the
analysis in the same way as postal votes, being allocated to borough only, not
to electoral ward. They were also extremely susceptible to rejection.
Around one in ten of these votes were rejected – slightly more (one in seven) in
the Assembly constituency election, and slightly less (one in seventeen) in the
European election. Within these fi gures, there was considerable variation. In the
Assembly constituency election the rejection rate rose to close to one in fi ve
ballot papers in two constituencies, the City and East London and the South
West; only in two constituencies was the percentage lower than 10 per cent –
Merton and Wandsworth, and Ealing and Hillingdon. This 10 per cent fi gure was
bettered in all constituencies in the European election and in ten (of the 14) in
the Mayoral election and eight in the Assembly list election.
As might be expected there was slightly greater variation in the incidence of
manually-entered votes at Borough level. However, in very few boroughs did
the percentage of votes entered in this way exceed 1.0 per cent (Hackney in
the Mayoral election and Lewisham in the Assembly). In several boroughs in the
Assembly elections, the percentage rejected exceeded 20 per cent, the highest
being Barking and Dagenham with 25.8 per cent in the constituency election.
The rates of rejection of manually-entered ballot papers were broadly similar to
those found generally across the elections. The most notable exception was in
those relating to a lack of offi cial mark on the paper. All the rejections for this
reason were of manually-entered papers. In most cases, this factor explained
the excess in the rate of spoils for manually-entered ballot papers above the
overall rate for all the elections. The incidence of blank or uncertain manually-
entered papers in the European election was also higher than in the overall
analysis.

Page 32 The 2004 London Elections GLA Data Management and Analysis Group
GLA Data Management and Analysis Group The 2004 London Elections Page 33
The parties’ performancesTTTTTTTTThhhhhhhhhhhheeeeeeeeeee ppppppppppppaaaaaaaaaaaarrrrrrrrttttttiiiiiiiiiiiieeeeeeeeeeeeessssssssss’’’’’’’’’ ppppppppppppppeeeeeeeeeeeeerrrrrrrrrrfffffffffffffooooooooooooorrrrrrrrrmmmmmmmmmmmmaaaaaaaaaaannnnnnnnnncccccccccccceeeeeeeeeeeesssssssss
Page 34 The 2004 London Elections GLA Data Management and Analysis Group
Mayoral election - fi rst choice vote
European election
Assembly list election
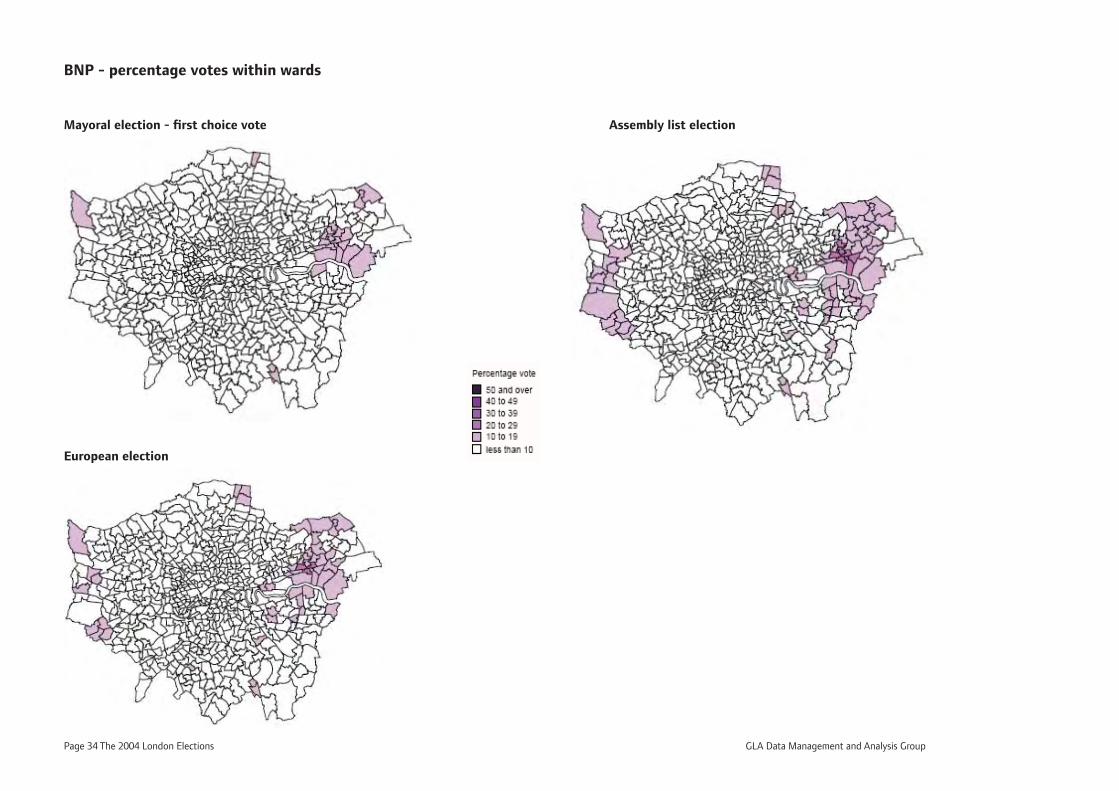
BNP - percentage votes within wards
GLA Data Management and Analysis Group The 2004 London Elections Page 35
British National Party (BNP)
The BNP took part in three of the elections in 2004 – they did not enter
candidates in the Assembly constituency election.
The fi rst three maps opposite, chart the party’s success in the elections shown
by the percentage of the vote gained in each ward in London, excluding postal
and manually entered votes. As the legend indicates, the shading deepens at 10
per cent intervals, and thus it can be seen that the BNP achieved their greatest
success in the Assembly list election. They gained more than 20 per cent of
the vote through much of the area covered by the Dagenham Parliamentary
Constituency.
The BNP’s greatest support is to be found at the Eastern and Western
extremities of London in Barking and Dagenham and Havering, and Hillingdon,
and to a lesser extent in Bexley and Hounslow, with smaller groupings to the
North and South in the Northeast of Enfi eld and Southeast of Croydon.
The maps throughout this section on party performance allow direct
comparison of different parties’ showing by using the same banding. This shows
that although the BNP obtained a measure of success in a few isolated areas,
they did not gain enough support consistently across London to turn votes into
seats.
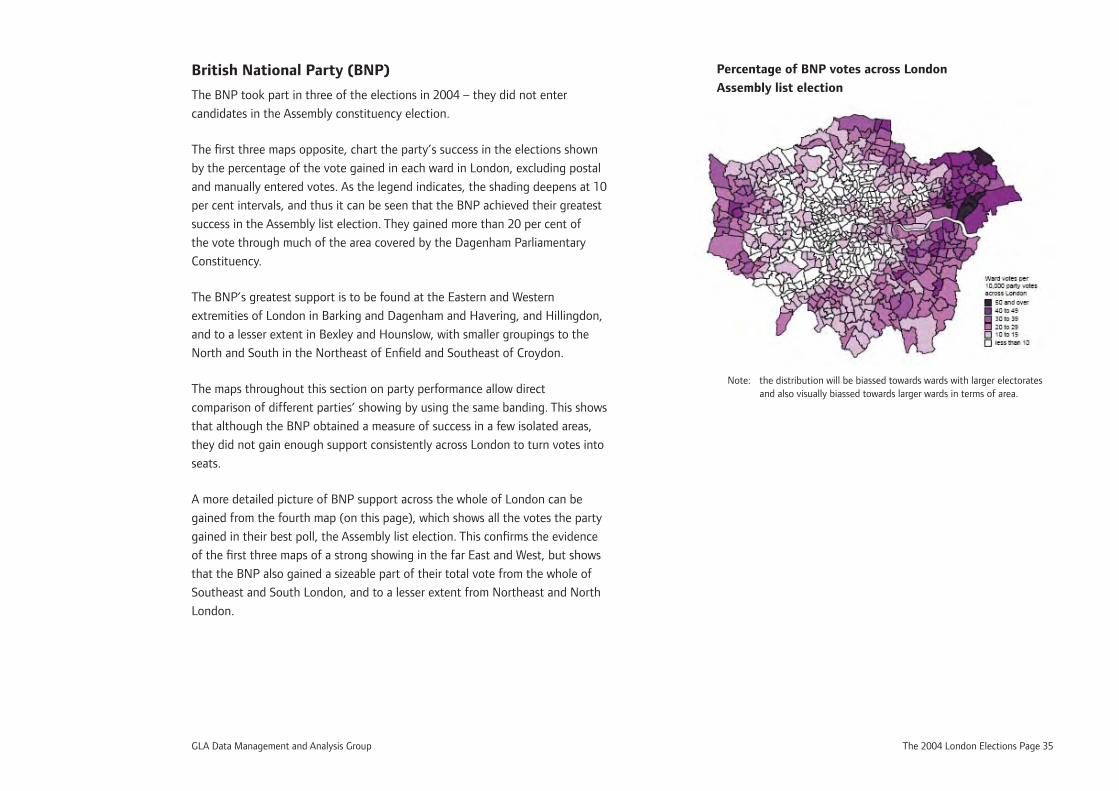
A more detailed picture of BNP support across the whole of London can be
gained from the fourth map (on this page), which shows all the votes the party
gained in their best poll, the Assembly list election. This confi rms the evidence
of the fi rst three maps of a strong showing in the far East and West, but shows
that the BNP also gained a sizeable part of their total vote from the whole of
Southeast and South London, and to a lesser extent from Northeast and North
London.
Percentage of BNP votes across London
Assembly list election
Note: the distribution will be biassed towards wards with larger electorates and also visually biassed towards larger wards in terms of area.
Page 36 The 2004 London Elections GLA Data Management and Analysis Group
Mayoral election - fi rst choice vote
European election
Assembly list election
Assembly constituency election
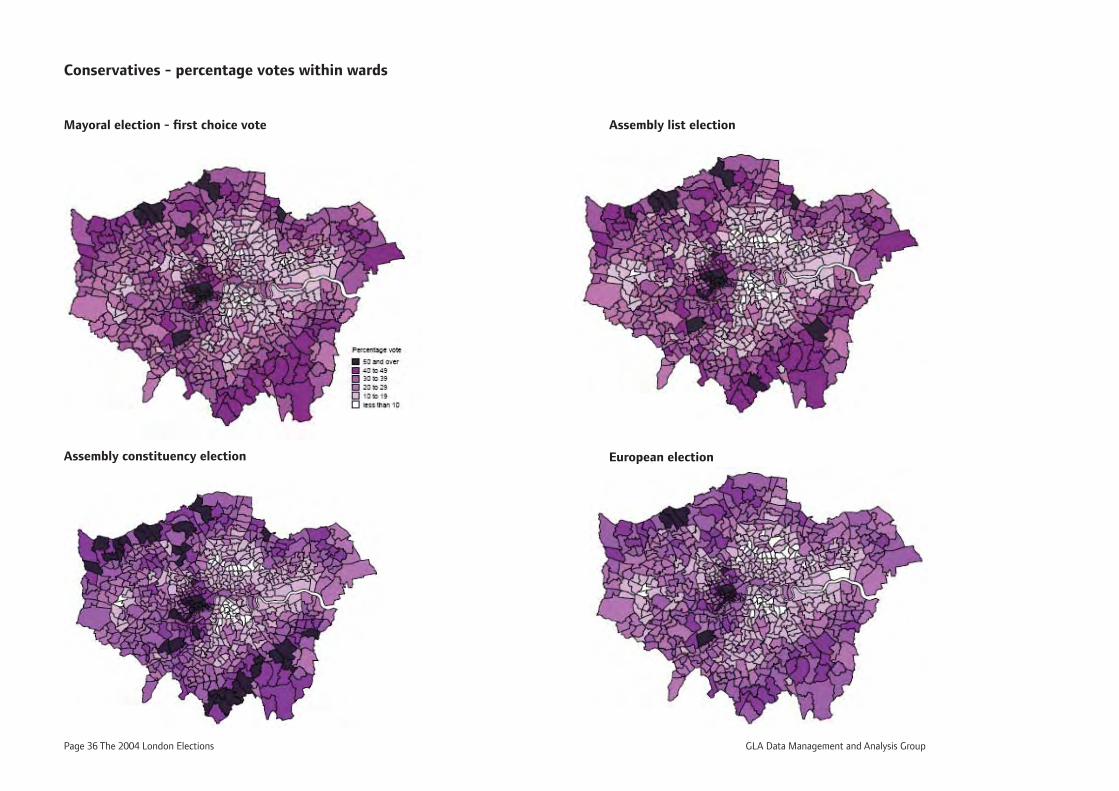
Conservatives - percentage votes within wards
GLA Data Management and Analysis Group The 2004 London Elections Page 37
Conservative Party
The darkest shading on the four maps opposite occurs where the Conservative
Party received more than 50 per cent of the vote recorded in a ward.
Comparison of the maps shows that the party consistently gained this level
of support in three areas of London, Stanmore and Edgware in North West
London, Chelsea, Belgravia and Knightsbridge in West Central London and
Wimbledon in the South West. Their weakest areas were centred North of the
river, on a ribbon of wards stretching from Leyton in the East in a Westerly
direction to Tollington and Stroud Green. To the South a group of wards around
Walworth and Camberwell saw their poorest showing.
The Assembly Constituency election gave the Conservatives their best showing
across London as a whole, with particularly strong support in three belts, along
the North West boundary, from the West End to Coombe Hill towards the
South West and, in the South East, from the Crays to Coulsdon. The party’s
performance in the Mayoral election produced a more even distribution with
both fewer high spots and fewer low.
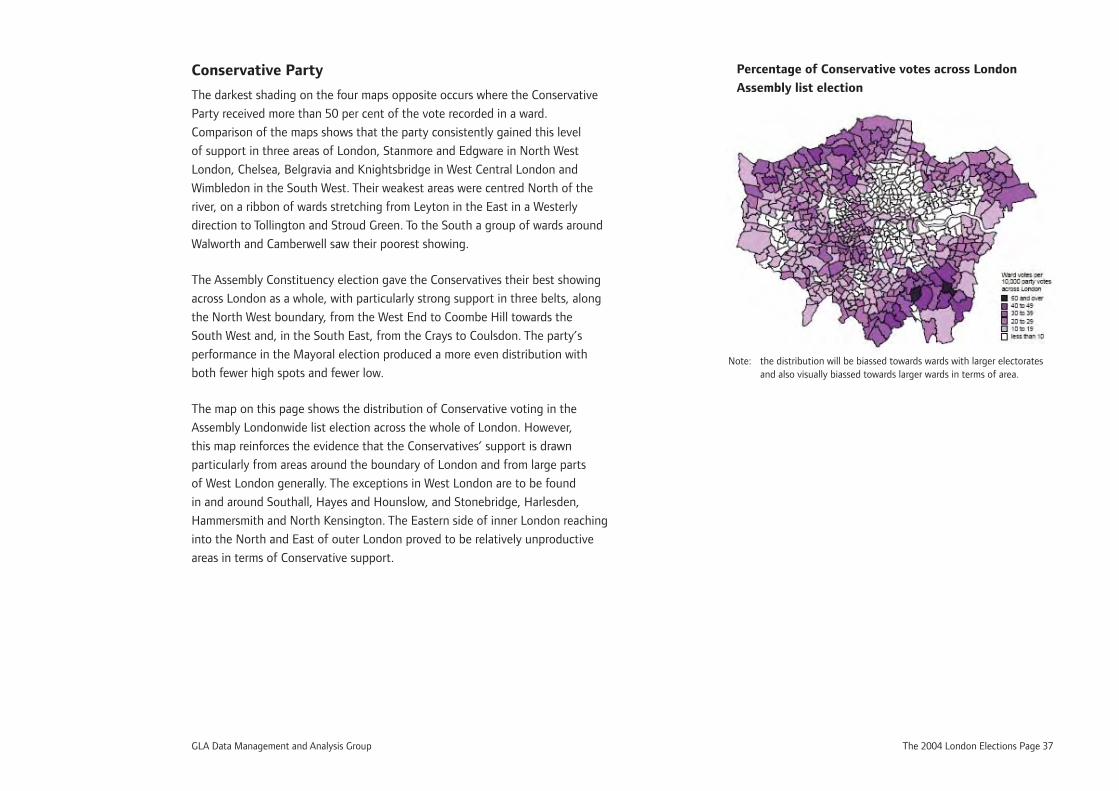
The map on this page shows the distribution of Conservative voting in the
Assembly Londonwide list election across the whole of London. However,
this map reinforces the evidence that the Conservatives’ support is drawn
particularly from areas around the boundary of London and from large parts
of West London generally. The exceptions in West London are to be found
in and around Southall, Hayes and Hounslow, and Stonebridge, Harlesden,
Hammersmith and North Kensington. The Eastern side of inner London reaching
into the North and East of outer London proved to be relatively unproductive
areas in terms of Conservative support.
Percentage of Conservative votes across London
Assembly list election
Note: the distribution will be biassed towards wards with larger electorates and also visually biassed towards larger wards in terms of area.
Page 38 The 2004 London Elections GLA Data Management and Analysis Group
Mayoral election - fi rst choice vote
European election
Assembly list election
Assembly constituency election
Greens - percentage votes within wards
GLA Data Management and Analysis Group The 2004 London Elections Page 39
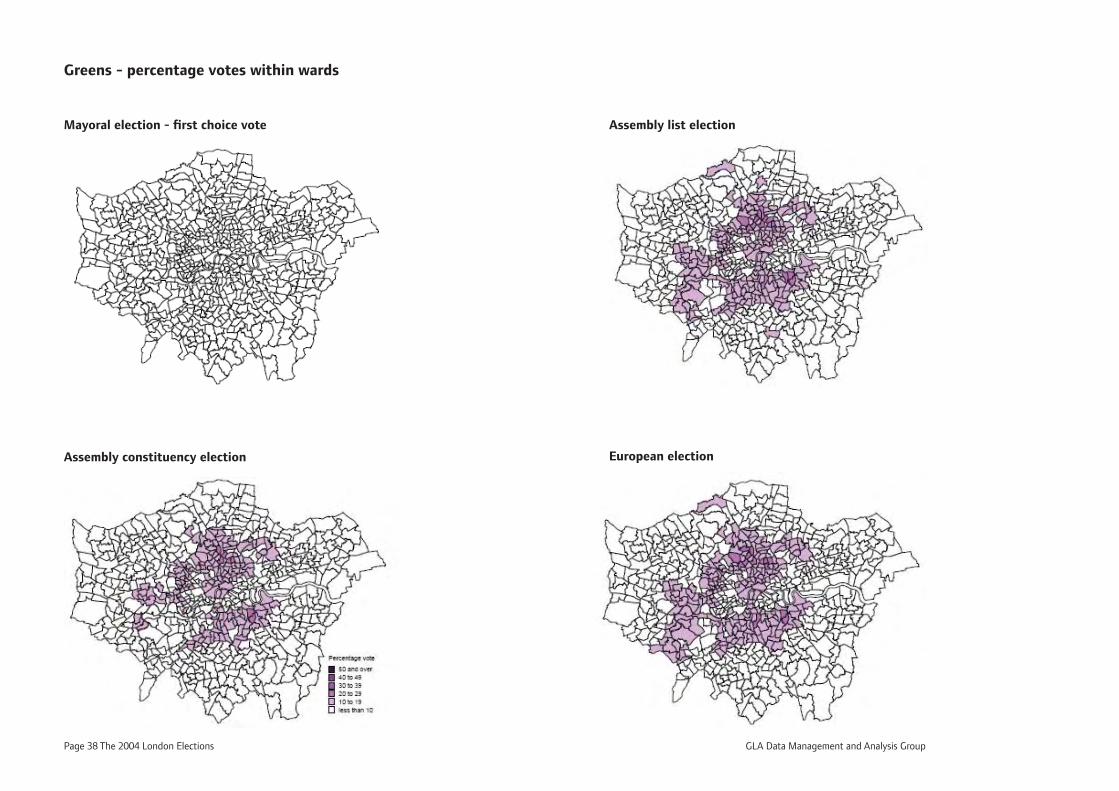
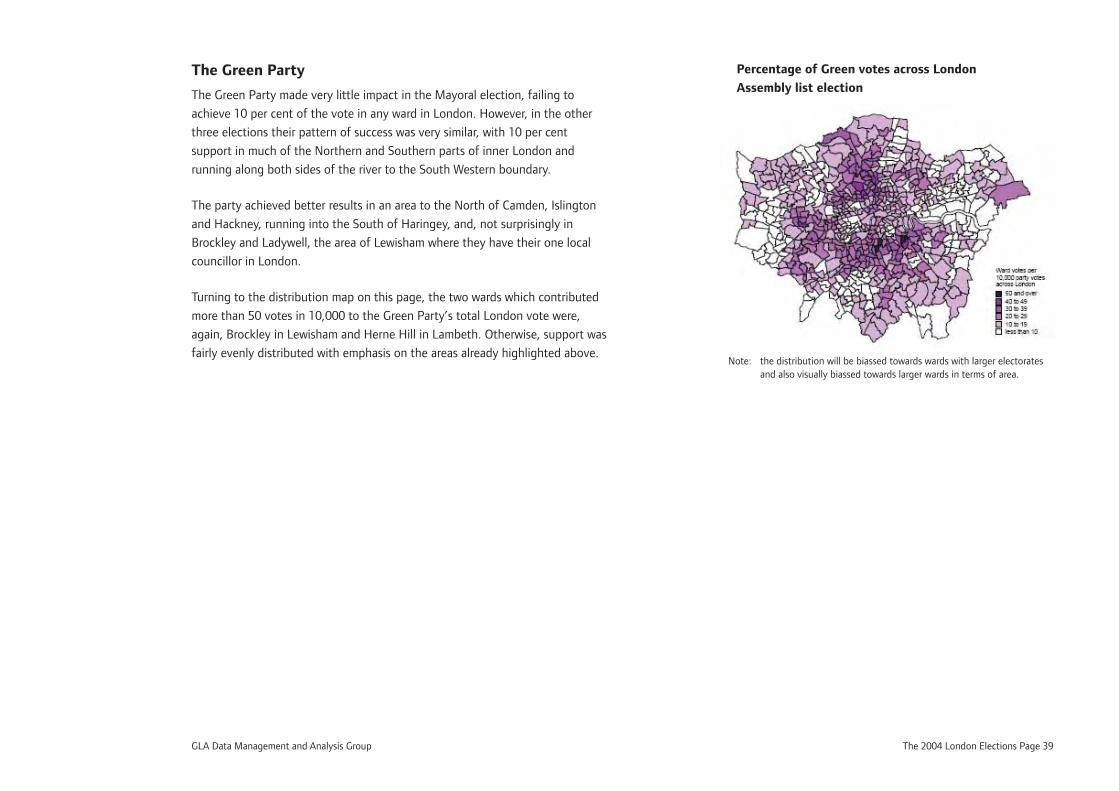
The Green Party
The Green Party made very little impact in the Mayoral election, failing to
achieve 10 per cent of the vote in any ward in London. However, in the other
three elections their pattern of success was very similar, with 10 per cent
support in much of the Northern and Southern parts of inner London and
running along both sides of the river to the South Western boundary.
The party achieved better results in an area to the North of Camden, Islington
and Hackney, running into the South of Haringey, and, not surprisingly in
Brockley and Ladywell, the area of Lewisham where they have their one local
councillor in London.
Turning to the distribution map on this page, the two wards which contributed
more than 50 votes in 10,000 to the Green Party’s total London vote were,
again, Brockley in Lewisham and Herne Hill in Lambeth. Otherwise, support was
fairly evenly distributed with emphasis on the areas already highlighted above.
Percentage of Green votes across London
Assembly list election
Note: the distribution will be biassed towards wards with larger electorates and also visually biassed towards larger wards in terms of area.
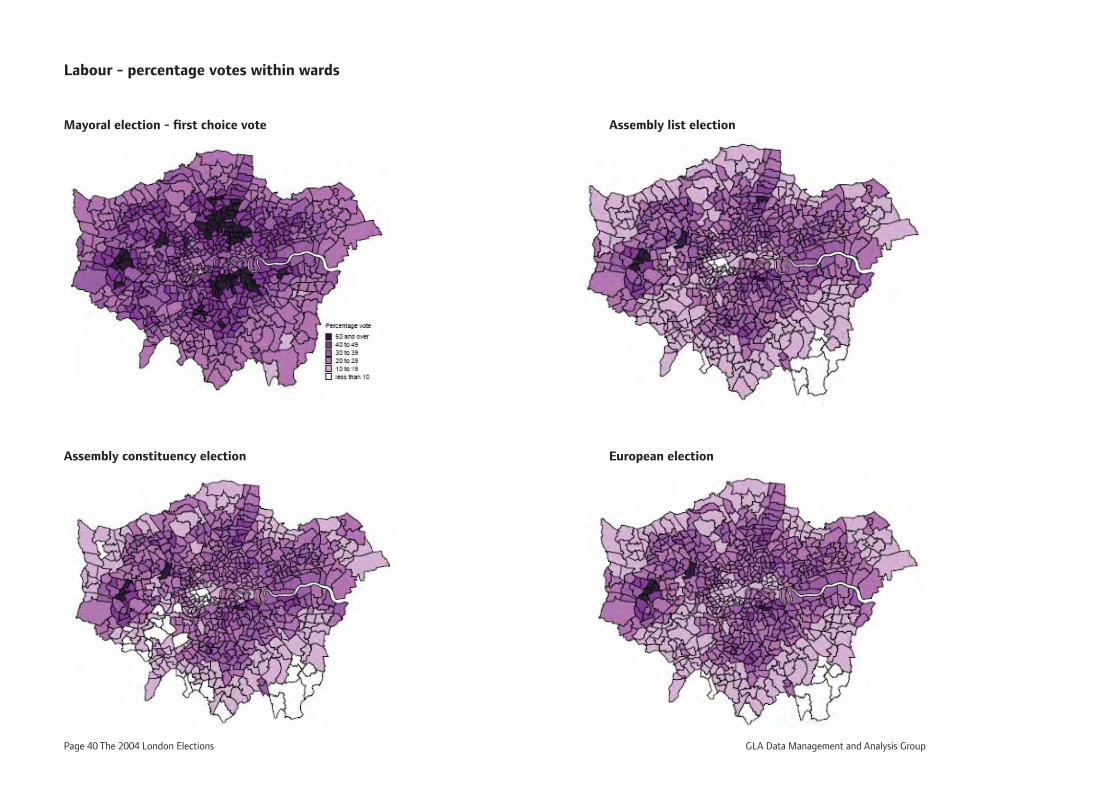
Page 40 The 2004 London Elections GLA Data Management and Analysis Group
Mayoral election - fi rst choice vote
European election
Assembly list election
Assembly constituency election
Labour - percentage votes within wards
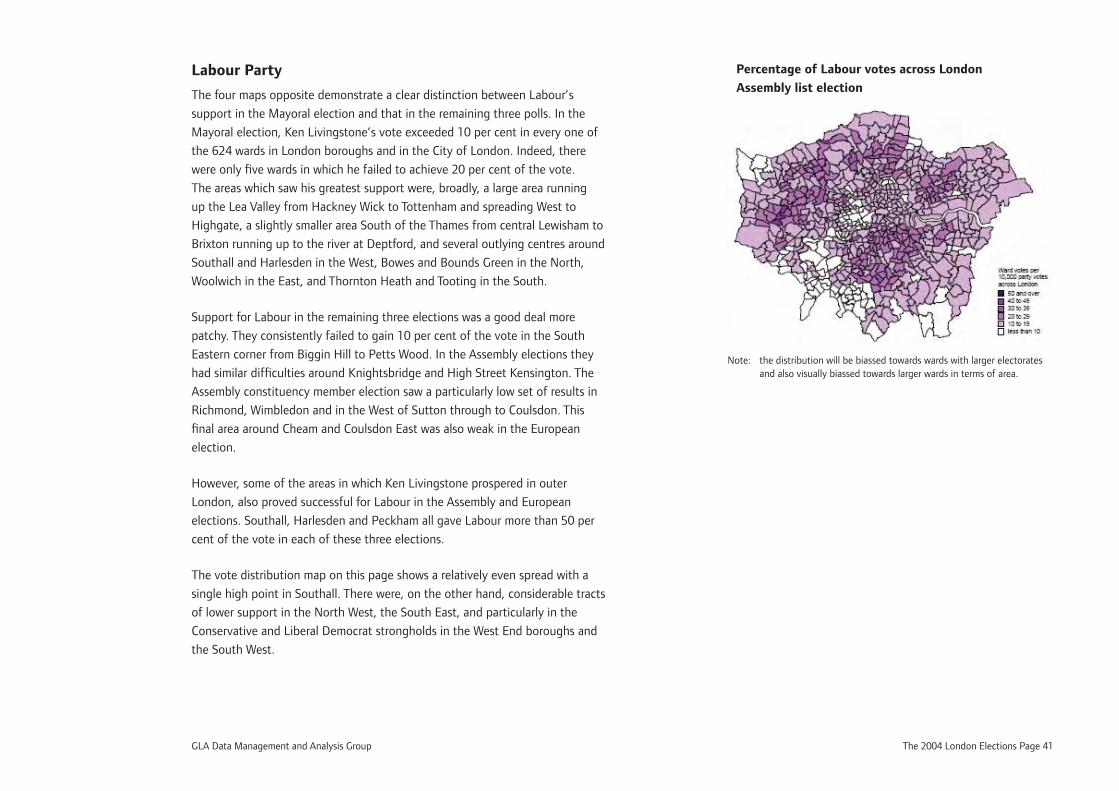
GLA Data Management and Analysis Group The 2004 London Elections Page 41
Labour Party
The four maps opposite demonstrate a clear distinction between Labour’s
support in the Mayoral election and that in the remaining three polls. In the
Mayoral election, Ken Livingstone’s vote exceeded 10 per cent in every one of
the 624 wards in London boroughs and in the City of London. Indeed, there
were only fi ve wards in which he failed to achieve 20 per cent of the vote.
The areas which saw his greatest support were, broadly, a large area running
up the Lea Valley from Hackney Wick to Tottenham and spreading West to
Highgate, a slightly smaller area South of the Thames from central Lewisham to
Brixton running up to the river at Deptford, and several outlying centres around
Southall and Harlesden in the West, Bowes and Bounds Green in the North,
Woolwich in the East, and Thornton Heath and Tooting in the South.
Support for Labour in the remaining three elections was a good deal more
patchy. They consistently failed to gain 10 per cent of the vote in the South
Eastern corner from Biggin Hill to Petts Wood. In the Assembly elections they
had similar diffi culties around Knightsbridge and High Street Kensington. The
Assembly constituency member election saw a particularly low set of results in
Richmond, Wimbledon and in the West of Sutton through to Coulsdon. This
fi nal area around Cheam and Coulsdon East was also weak in the European
election.
However, some of the areas in which Ken Livingstone prospered in outer
London, also proved successful for Labour in the Assembly and European
elections. Southall, Harlesden and Peckham all gave Labour more than 50 per
cent of the vote in each of these three elections.
The vote distribution map on this page shows a relatively even spread with a
single high point in Southall. There were, on the other hand, considerable tracts
of lower support in the North West, the South East, and particularly in the
Conservative and Liberal Democrat strongholds in the West End boroughs and
the South West.
Percentage of Labour votes across London
Assembly list election
Note: the distribution will be biassed towards wards with larger electorates and also visually biassed towards larger wards in terms of area.
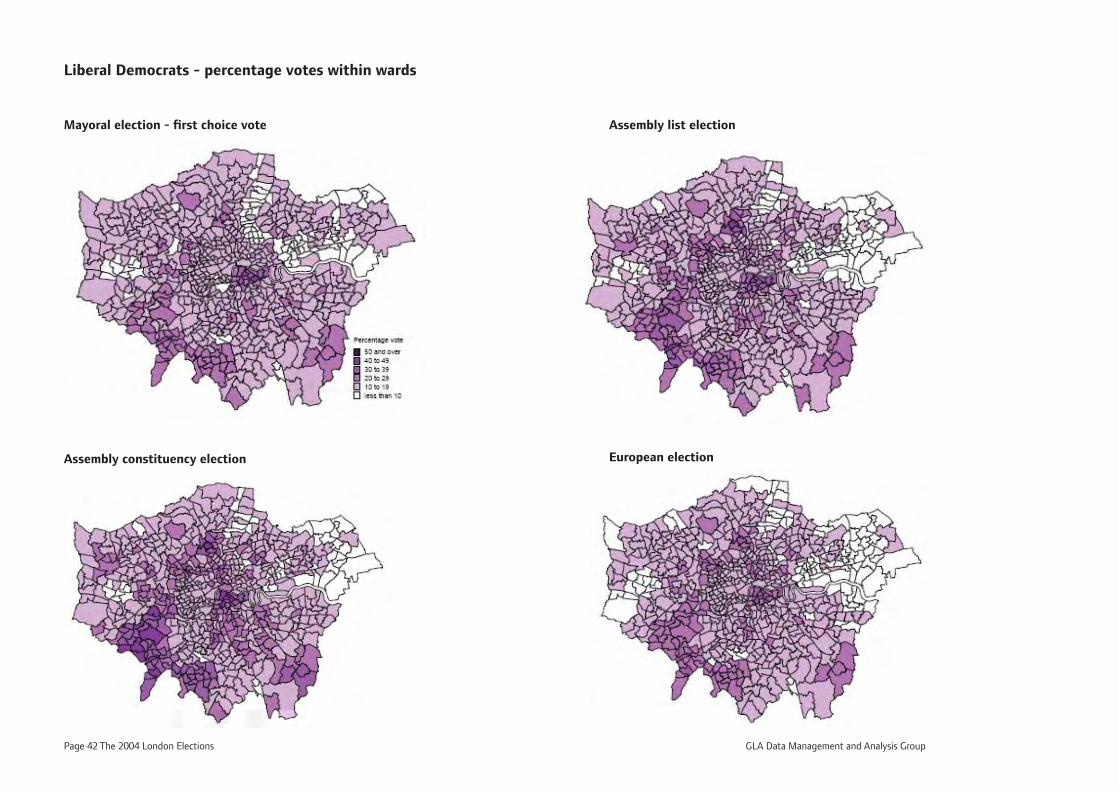
Page 42 The 2004 London Elections GLA Data Management and Analysis Group
Mayoral election - fi rst choice vote
European election
Assembly list election
Assembly constituency election
Liberal Democrats - percentage votes within wards
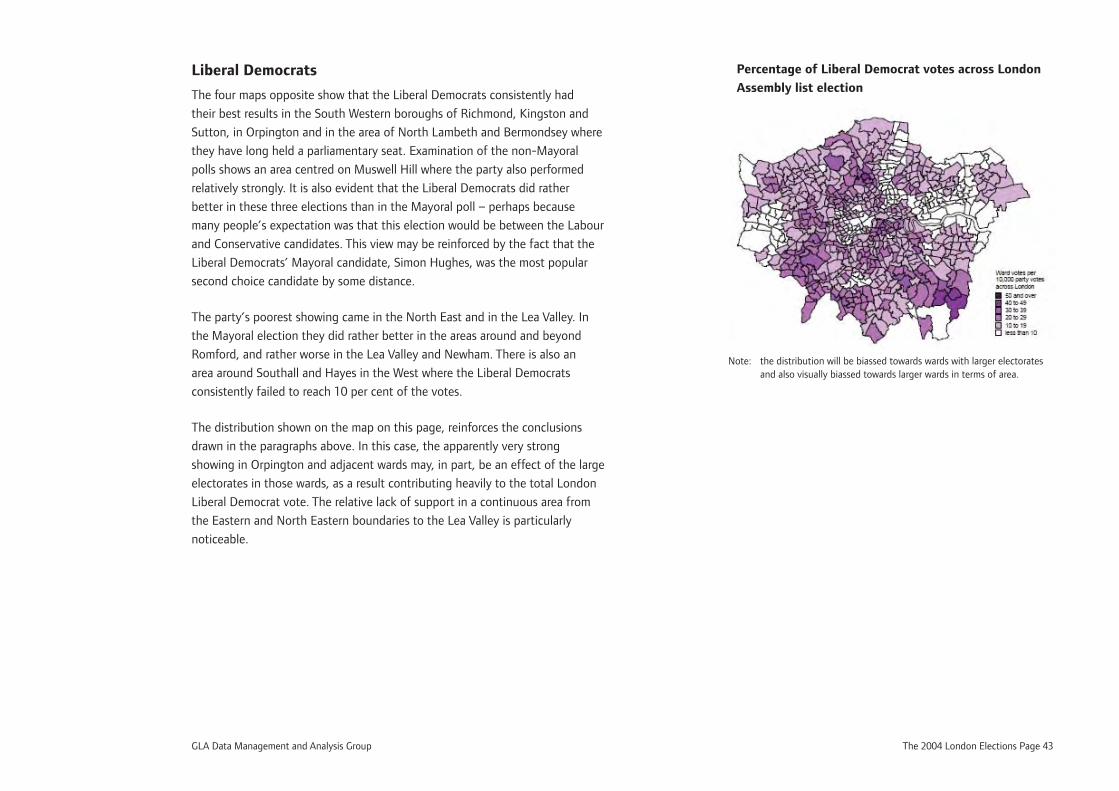
GLA Data Management and Analysis Group The 2004 London Elections Page 43
Liberal Democrats
The four maps opposite show that the Liberal Democrats consistently had
their best results in the South Western boroughs of Richmond, Kingston and
Sutton, in Orpington and in the area of North Lambeth and Bermondsey where
they have long held a parliamentary seat. Examination of the non-Mayoral
polls shows an area centred on Muswell Hill where the party also performed
relatively strongly. It is also evident that the Liberal Democrats did rather
better in these three elections than in the Mayoral poll – perhaps because
many people’s expectation was that this election would be between the Labour
and Conservative candidates. This view may be reinforced by the fact that the
Liberal Democrats’ Mayoral candidate, Simon Hughes, was the most popular
second choice candidate by some distance.
The party’s poorest showing came in the North East and in the Lea Valley. In
the Mayoral election they did rather better in the areas around and beyond
Romford, and rather worse in the Lea Valley and Newham. There is also an
area around Southall and Hayes in the West where the Liberal Democrats
consistently failed to reach 10 per cent of the votes.
The distribution shown on the map on this page, reinforces the conclusions
drawn in the paragraphs above. In this case, the apparently very strong
showing in Orpington and adjacent wards may, in part, be an effect of the large
electorates in those wards, as a result contributing heavily to the total London
Liberal Democrat vote. The relative lack of support in a continuous area from
the Eastern and North Eastern boundaries to the Lea Valley is particularly
noticeable.
Percentage of Liberal Democrat votes across London
Assembly list election
Note: the distribution will be biassed towards wards with larger electorates and also visually biassed towards larger wards in terms of area.
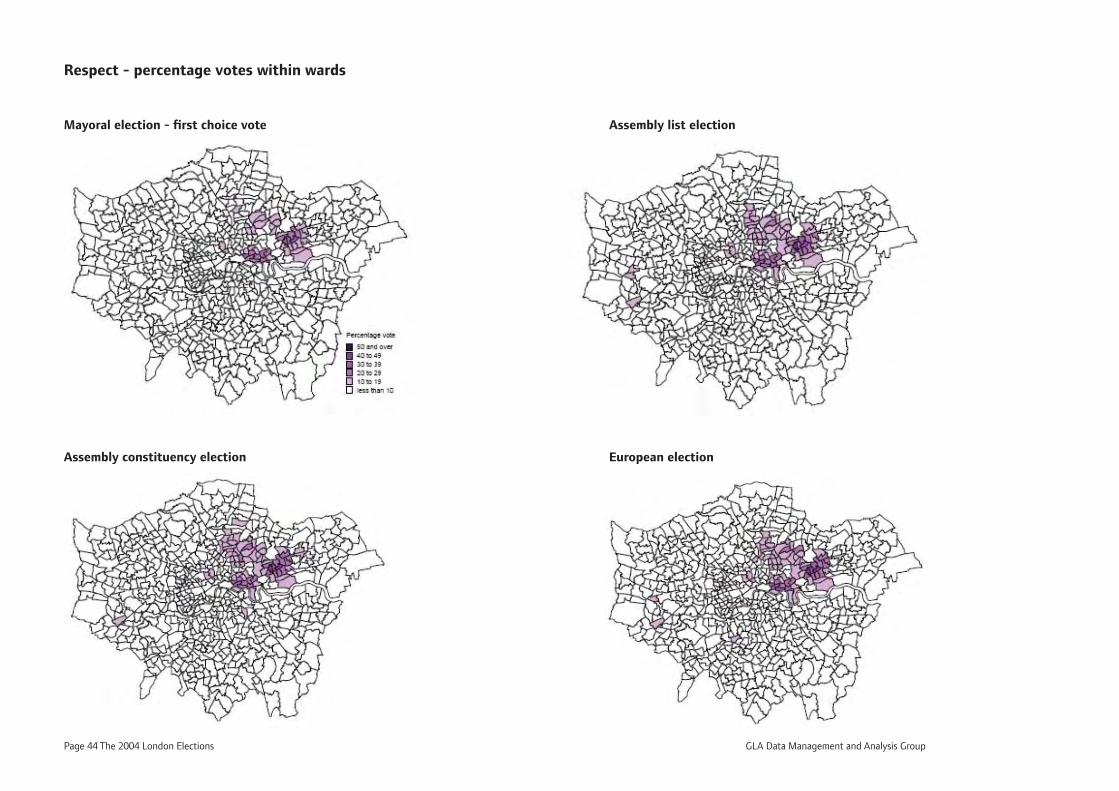
Page 44 The 2004 London Elections GLA Data Management and Analysis Group
Mayoral election - fi rst choice vote
European election
Assembly list election
Assembly constituency election
Respect - percentage votes within wards

GLA Data Management and Analysis Group The 2004 London Elections Page 45
Respect - Unity Coalition
It is very clear from the four maps opposite, that support for Respect was
localised in the 2004 elections. The extremely strong vote evident in and around
East Ham and between Whitechapel and Bromley-by-Bow is not repeated
anywhere else in the capital. The area in which the party gained more than 10
per cent of the vote is broader in the non-Mayoral elections but remains largely
confi ned to the North East quarter of inner London edging into the surrounding
boroughs. Markhouse ward in Waltham Forest is the only ward outside the core
area identifi ed in the Mayoral election, where the vote exceeds 20 per cent in
each of the other three elections, but the same feat is achieved in Forest ward
in Waltham Forest and Leabridge in Hackney in one of the three polls.
The pattern of high concentration is confi rmed by the distribution map on
this page. This map does show that, in addition, there is a level of support
throughout a considerable part of London, particularly North of the river. The
largest vote outside the East London core, can be found in Southall in West
London and Tooting in South.
Percentage of Respect votes across London
Assembly list election
Note: the distribution will be biassed towards wards with larger electorates and also visually biassed towards larger wards in terms of area.
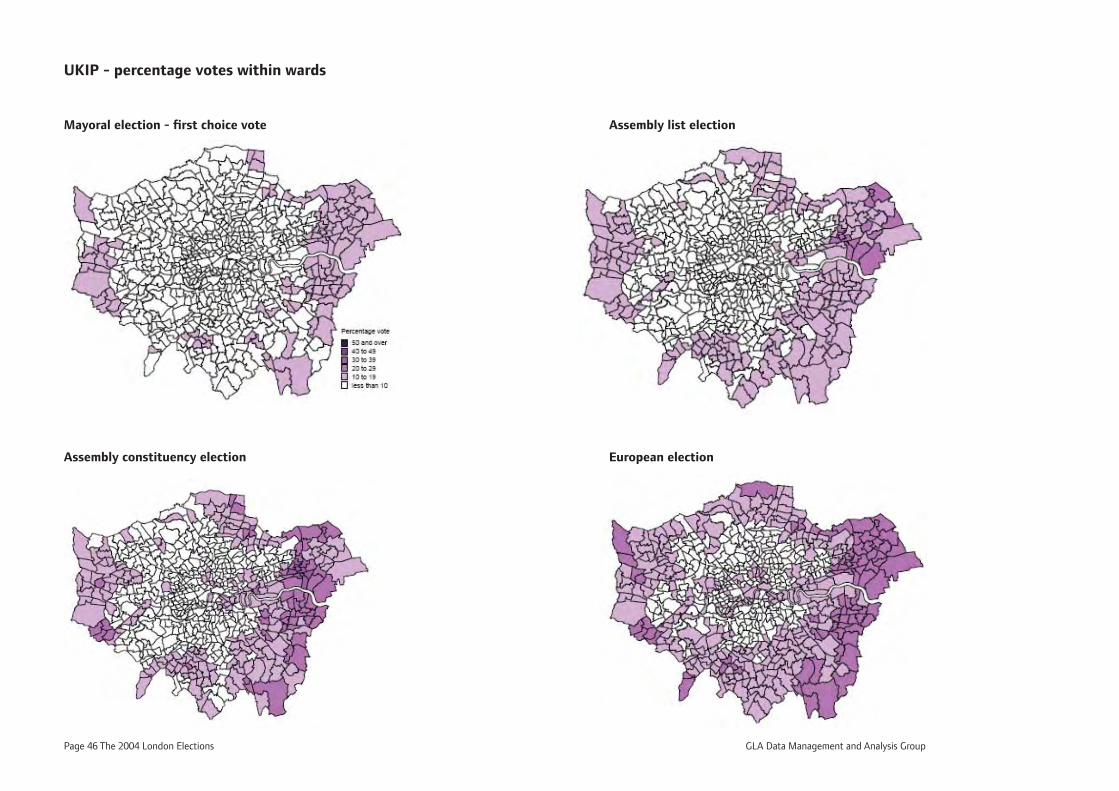
Page 46 The 2004 London Elections GLA Data Management and Analysis Group
Mayoral election - fi rst choice vote
European election
Assembly list election
Assembly constituency election
UKIP - percentage votes within wards
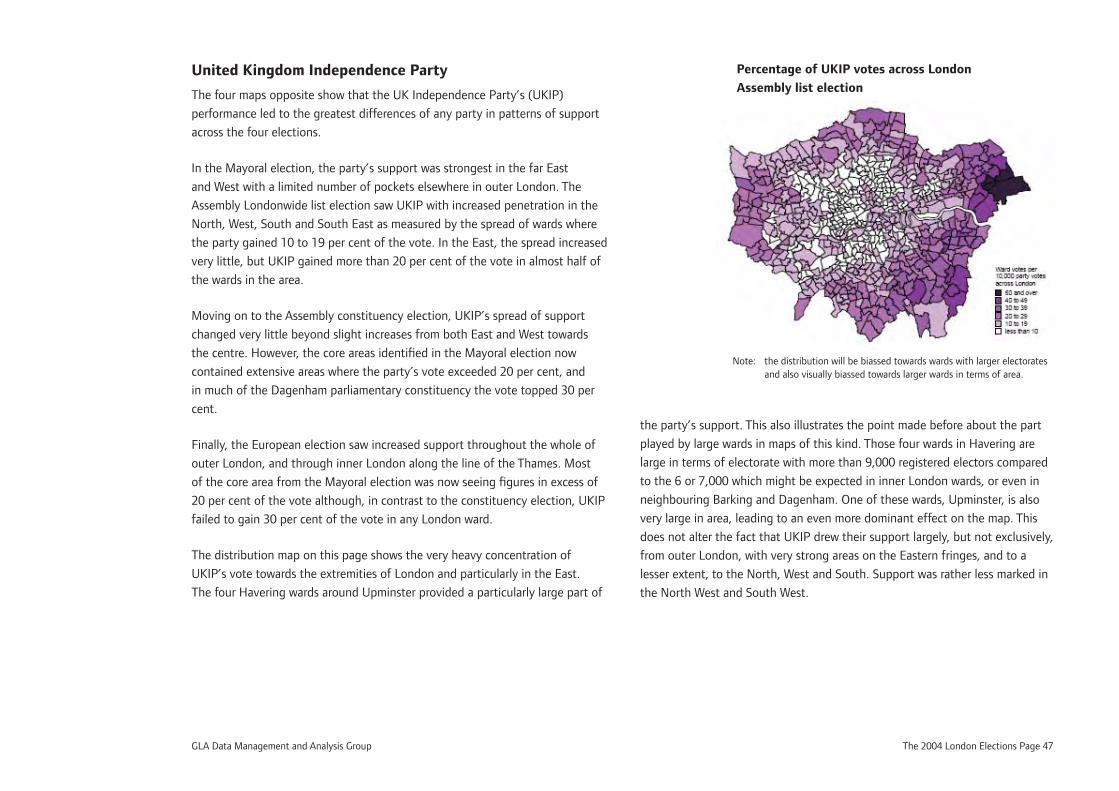
GLA Data Management and Analysis Group The 2004 London Elections Page 47
United Kingdom Independence Party
The four maps opposite show that the UK Independence Party’s (UKIP)
performance led to the greatest differences of any party in patterns of support
across the four elections.
In the Mayoral election, the party’s support was strongest in the far East
and West with a limited number of pockets elsewhere in outer London. The
Assembly Londonwide list election saw UKIP with increased penetration in the
North, West, South and South East as measured by the spread of wards where
the party gained 10 to 19 per cent of the vote. In the East, the spread increased
very little, but UKIP gained more than 20 per cent of the vote in almost half of
the wards in the area.
Moving on to the Assembly constituency election, UKIP’s spread of support
changed very little beyond slight increases from both East and West towards
the centre. However, the core areas identifi ed in the Mayoral election now
contained extensive areas where the party’s vote exceeded 20 per cent, and
in much of the Dagenham parliamentary constituency the vote topped 30 per
cent.
Finally, the European election saw increased support throughout the whole of
outer London, and through inner London along the line of the Thames. Most
of the core area from the Mayoral election was now seeing fi gures in excess of
20 per cent of the vote although, in contrast to the constituency election, UKIP
failed to gain 30 per cent of the vote in any London ward.
The distribution map on this page shows the very heavy concentration of
UKIP’s vote towards the extremities of London and particularly in the East.
The four Havering wards around Upminster provided a particularly large part of
the party’s support. This also illustrates the point made before about the part
played by large wards in maps of this kind. Those four wards in Havering are
large in terms of electorate with more than 9,000 registered electors compared
to the 6 or 7,000 which might be expected in inner London wards, or even in
neighbouring Barking and Dagenham. One of these wards, Upminster, is also
very large in area, leading to an even more dominant effect on the map. This
does not alter the fact that UKIP drew their support largely, but not exclusively,
from outer London, with very strong areas on the Eastern fringes, and to a
lesser extent, to the North, West and South. Support was rather less marked in
the North West and South West.
Percentage of UKIP votes across London
Assembly list election
Note: the distribution will be biassed towards wards with larger electorates and also visually biassed towards larger wards in terms of area.
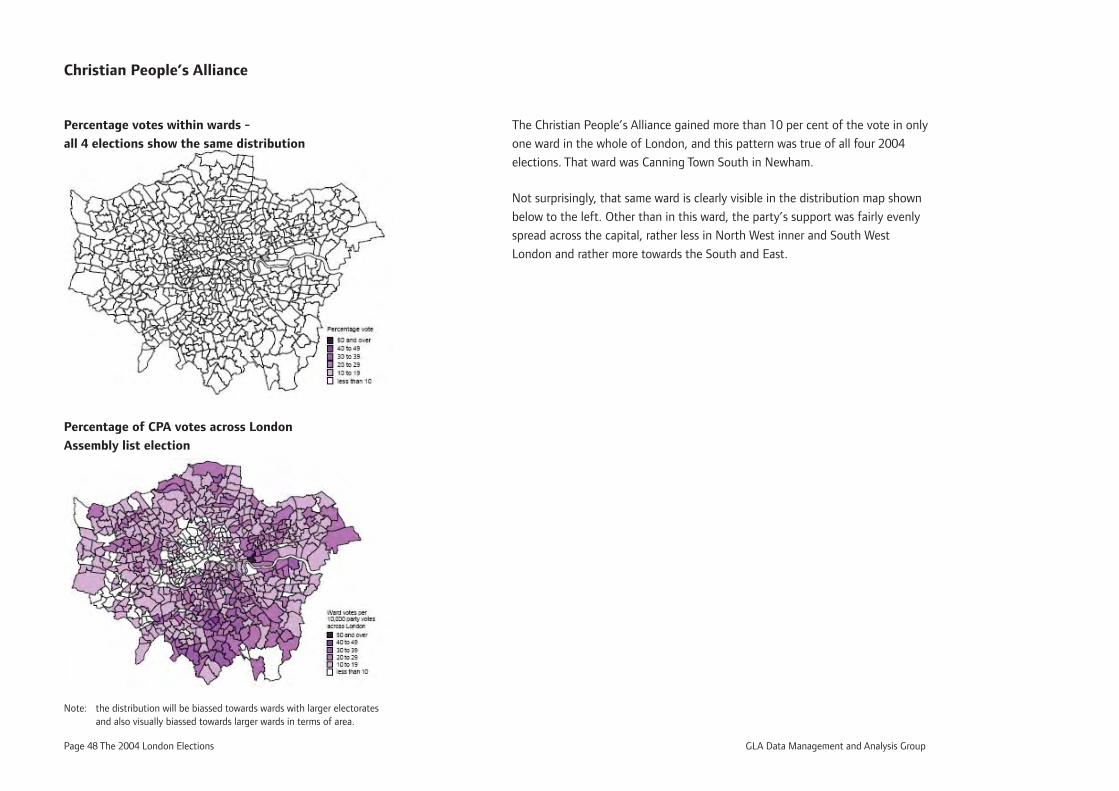
Page 48 The 2004 London Elections GLA Data Management and Analysis Group
Christian People’s Alliance
Percentage votes within wards -
all 4 elections show the same distribution
Percentage of CPA votes across London
Assembly list election
The Christian People’s Alliance gained more than 10 per cent of the vote in only
one ward in the whole of London, and this pattern was true of all four 2004
elections. That ward was Canning Town South in Newham.
Not surprisingly, that same ward is clearly visible in the distribution map shown
below to the left. Other than in this ward, the party’s support was fairly evenly
spread across the capital, rather less in North West inner and South West
London and rather more towards the South and East.
Note: the distribution will be biassed towards wards with larger electorates and also visually biassed towards larger wards in terms of area.
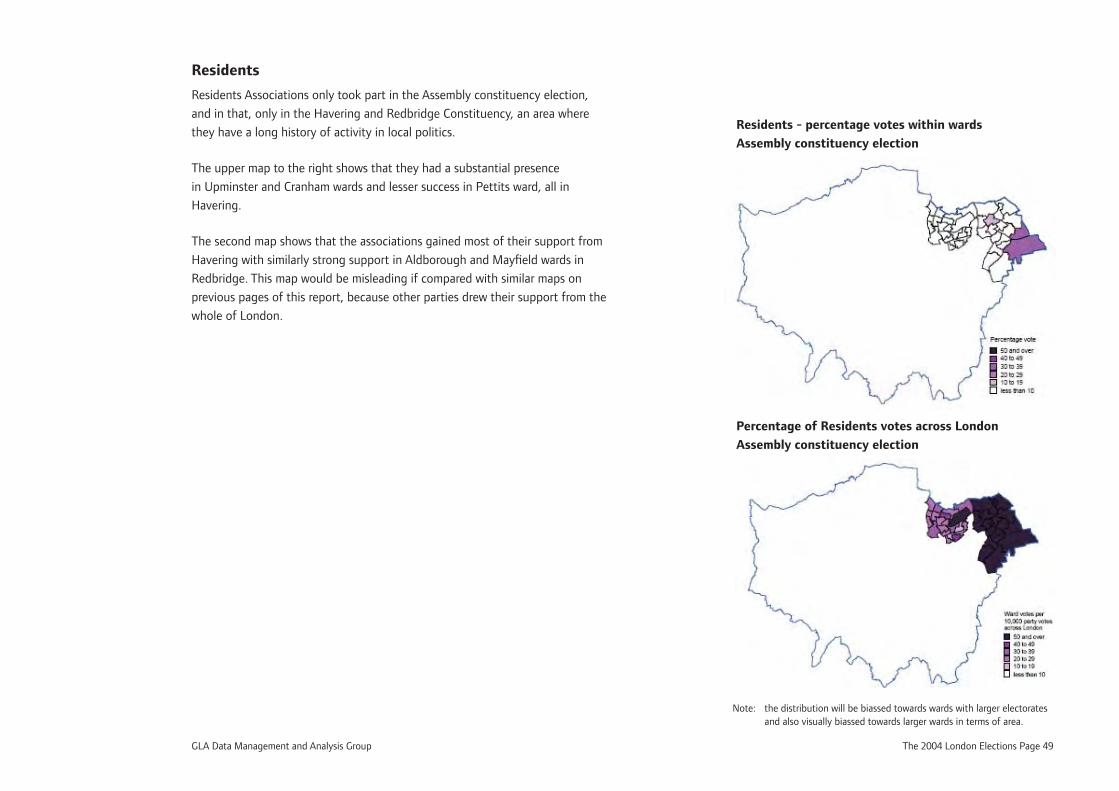
GLA Data Management and Analysis Group The 2004 London Elections Page 49
Residents
Residents Associations only took part in the Assembly constituency election,
and in that, only in the Havering and Redbridge Constituency, an area where
they have a long history of activity in local politics.
The upper map to the right shows that they had a substantial presence
in Upminster and Cranham wards and lesser success in Pettits ward, all in
Havering.
The second map shows that the associations gained most of their support from
Havering with similarly strong support in Aldborough and Mayfi eld wards in
Redbridge. This map would be misleading if compared with similar maps on
previous pages of this report, because other parties drew their support from the
whole of London.
Residents - percentage votes within wards
Assembly constituency election
Percentage of Residents votes across London
Assembly constituency election
Note: the distribution will be biassed towards wards with larger electorates and also visually biassed towards larger wards in terms of area.

Page 50 The 2004 London Elections GLA Data Management and Analysis Group
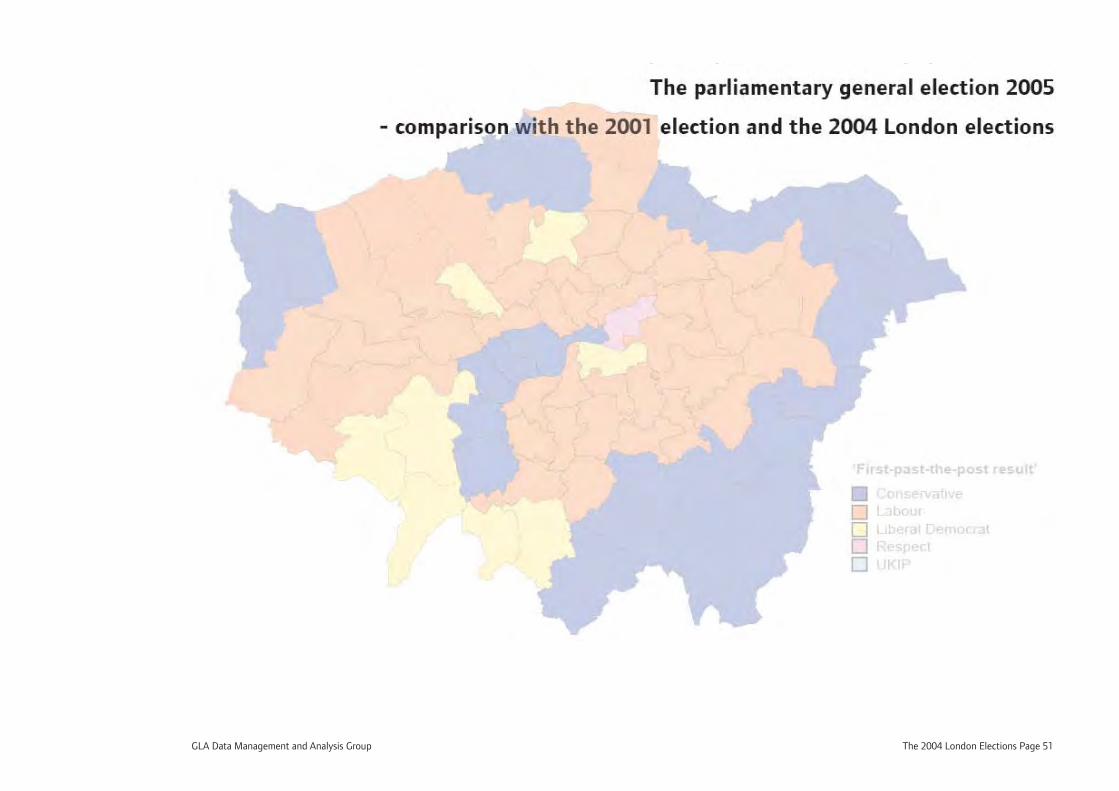
GLA Data Management and Analysis Group The 2004 London Elections Page 51
The parliamentary general election 2005
- comparison with the 2001 election and the 2004 London elections
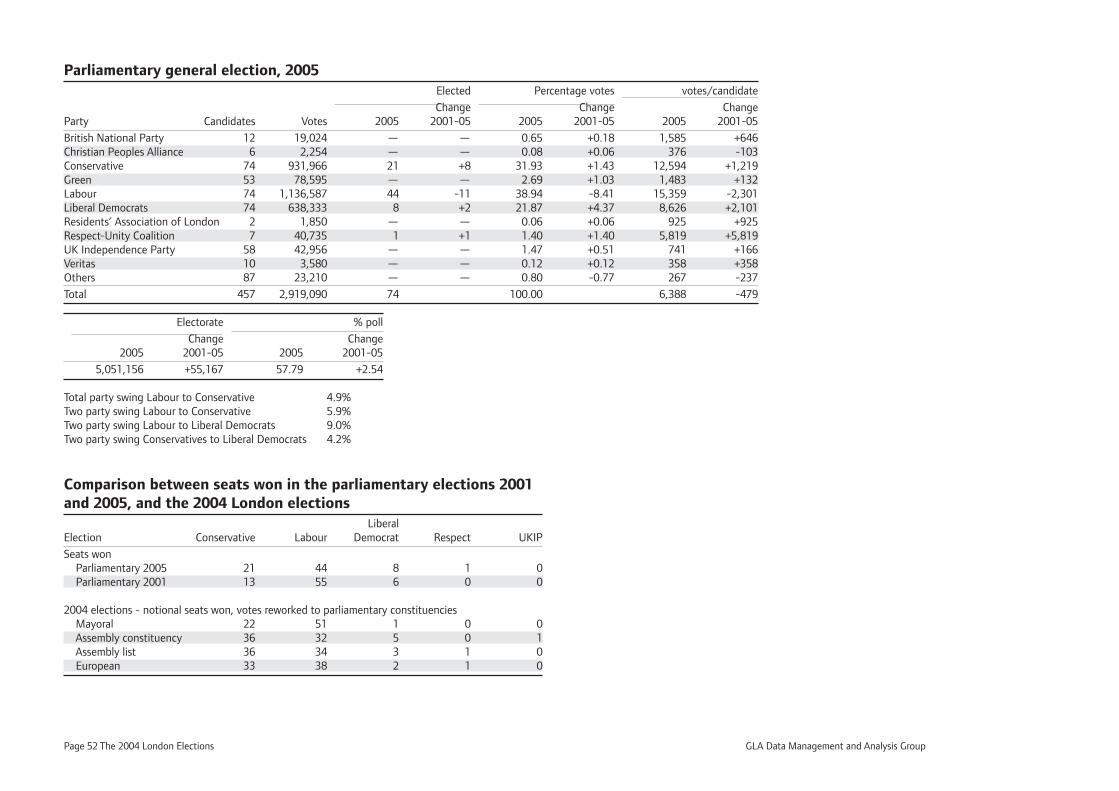
Page 52 The 2004 London Elections GLA Data Management and Analysis Group
Parliamentary general election, 2005 Elected Percentage votes votes/candidate
Change Change ChangeParty Candidates Votes 2005 2001-05 2005 2001-05 2005 2001-05
British National Party 12 19,024 — — 0.65 +0.18 1,585 +646Christian Peoples Alliance 6 2,254 — — 0.08 +0.06 376 -103Conservative 74 931,966 21 +8 31.93 +1.43 12,594 +1,219Green 53 78,595 — — 2.69 +1.03 1,483 +132Labour 74 1,136,587 44 -11 38.94 -8.41 15,359 -2,301Liberal Democrats 74 638,333 8 +2 21.87 +4.37 8,626 +2,101Residents’ Association of London 2 1,850 — — 0.06 +0.06 925 +925Respect-Unity Coalition 7 40,735 1 +1 1.40 +1.40 5,819 +5,819UK Independence Party 58 42,956 — — 1.47 +0.51 741 +166Veritas 10 3,580 — — 0.12 +0.12 358 +358Others 87 23,210 — — 0.80 -0.77 267 -237
Total 457 2,919,090 74 100.00 6,388 -479
Electorate % poll
Change Change 2005 2001-05 2005 2001-05
5,051,156 +55,167 57.79 +2.54 Total party swing Labour to Conservative 4.9% Two party swing Labour to Conservative 5.9%Two party swing Labour to Liberal Democrats 9.0%Two party swing Conservatives to Liberal Democrats 4.2%
Comparison between seats won in the parliamentary elections 2001 and 2005, and the 2004 London elections Liberal Election Conservative Labour Democrat Respect UKIP
Seats won Parliamentary 2005 21 44 8 1 0 Parliamentary 2001 13 55 6 0 0
2004 elections - notional seats won, votes reworked to parliamentary constituencies Mayoral 22 51 1 0 0 Assembly constituency 36 32 5 0 1 Assembly list 36 34 3 1 0 European 33 38 2 1 0
GLA Data Management and Analysis Group The 2004 London Elections Page 53
The 2005 parliamentary general election
Labour remained the largest party with 44 of the 74 parliamentary seats after
the 2005 election in London. However, the party lost one in fi ve of the 55 seats
it had held after the 2001 election.
Eight of those seats had been lost to the Conservatives who added to the
two East London seats of Romford and Upminster they had regained in 2001
following their disastrous showing in 1997. The swings to achieve the gains
varied from 2.7 per cent to 8.7, with two of the smaller swings resulting in
the smallest majorities: in Croydon Central (4.4 per cent, majority 75) and
Hornchurch (2.7 per cent, 480). All were areas which had been held by the
Conservatives in the past, albeit with different constituency boundaries and all
would have been expected to fall to the Conservatives with a moderate swing
against the government. They might also have expected to gain Enfi eld North
but Labour held on with relatively little change from the 2001 result.
The Liberal Democrats added Brent East and Hornsey and Wood Green to their
portfolio, again at the expense of Labour. The fi rst of these they had fi rst taken
at a by-election in September 2003 with a total party swing of 29 per cent from
Labour. This position was consolidated in the 2005 election this time with the
swing registering 30 per cent from 2001. Hornsey and Wood Green was taken
with a swing of just 14 per cent, but this came on the back of a swing of similar
proportions (13 per cent) between 1997 and 2001.
Perhaps the most signifi cant result was in Bethnal Green and Bow, where
Respect ousted the sitting Labour MP. All three of the major parties lost votes
(both in absolute numbers and in share) despite an increase of more than 5 per
cent in turnout. The fall in Labour’s share was twice the London average, and
the Conservatives’ and Liberal Democrats’ falls were in contrast to increases
across London as a whole.
Overall, the Liberal Democrats increased their share of the vote the most. The
Conservatives and the Greens both improved by over 1 per cent and UKIP by
about 0.5 per cent. Respect was a new player, and all the remaining minor
parties listed opposite made small gains. The rest of the candidates, shown
as ‘Others’ suffered a reduced share. This group consisted of 87 candidates
in 2005 and gained an average 267 votes. The comparable group in 2001
consisted of 85 candidates who gained an average 504 votes.
With the increase in electorate and turnout, some 160,000 more people
voted in 2005 than in 2001. Only six constituencies bucked this trend,
Croydon North, Ealing Southall, East Ham, Ilford South, Southwark North and
Bermondsey, and Tottenham, all, except the Southwark constituency, in a ring
around inner London.
The lower table opposite summarises the seats won in the 2001 and 2005
elections and compares these with the notional results of the 2004 elections
based on fi rst-past-the-post and reworked to parliamentary constituency
boundaries. The distinctive result of the Mayoral election among the 2004
results is plain, as is the fact that none of the 2004 outcomes is particularly
close to the parliamentary results. None of the 2004 outcomes give the
Conservatives as few seats as they gained in either 2001 or 2005. The opposite
was true of the Liberal Democrats performances in 2001 and 2005 when they
won more seats than in any of the notional results from 2004. The Mayoral and
European elections both gave Labour an absolute superiority in seats in 2004
but the European result gave Labour a much smaller share of the ‘seats’ than
the parliamentary elections. Further analysis follows in the next pages, using
maps based on these results.
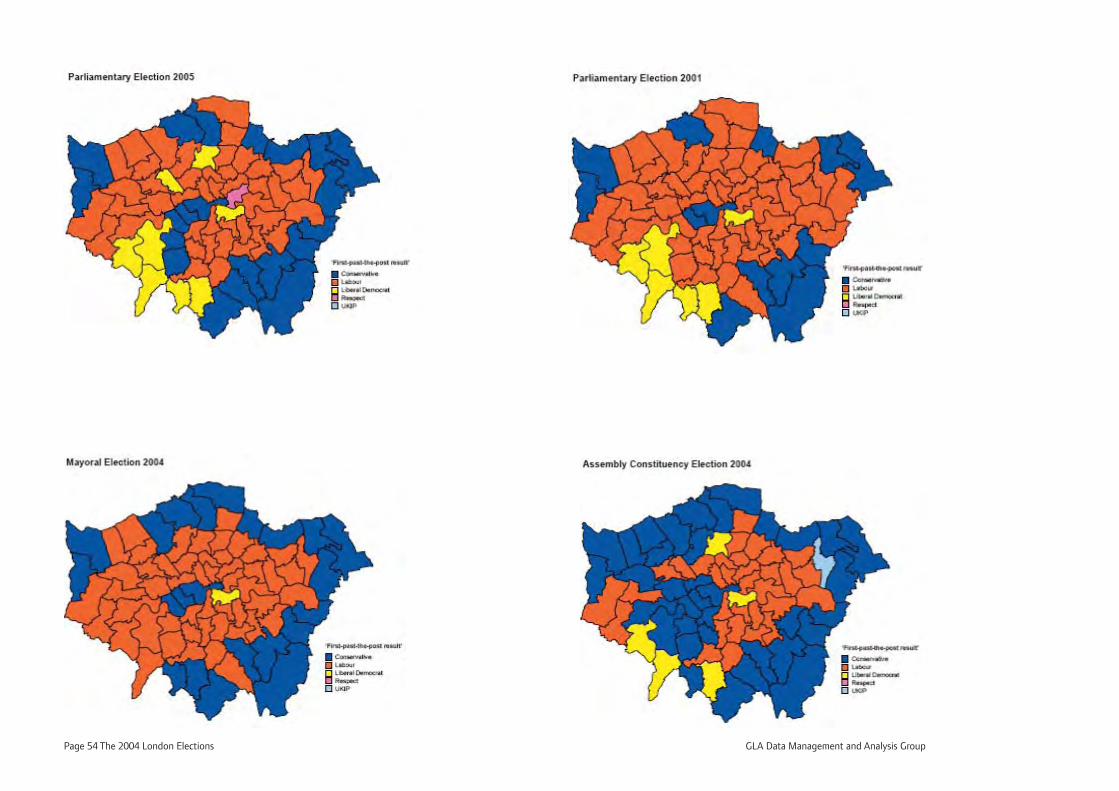
Page 54 The 2004 London Elections GLA Data Management and Analysis Group
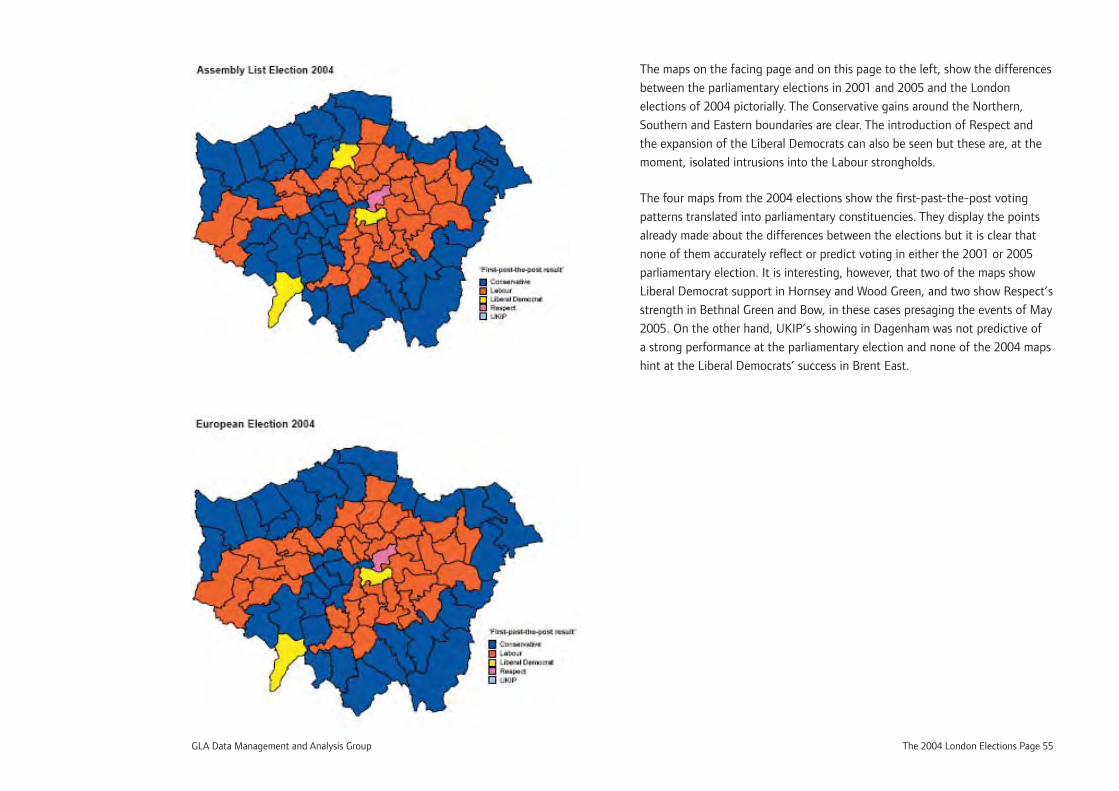
GLA Data Management and Analysis Group The 2004 London Elections Page 55
The maps on the facing page and on this page to the left, show the differences
between the parliamentary elections in 2001 and 2005 and the London
elections of 2004 pictorially. The Conservative gains around the Northern,
Southern and Eastern boundaries are clear. The introduction of Respect and
the expansion of the Liberal Democrats can also be seen but these are, at the
moment, isolated intrusions into the Labour strongholds.
The four maps from the 2004 elections show the fi rst-past-the-post voting
patterns translated into parliamentary constituencies. They display the points
already made about the differences between the elections but it is clear that
none of them accurately refl ect or predict voting in either the 2001 or 2005
parliamentary election. It is interesting, however, that two of the maps show
Liberal Democrat support in Hornsey and Wood Green, and two show Respect’s
strength in Bethnal Green and Bow, in these cases presaging the events of May
2005. On the other hand, UKIP’s showing in Dagenham was not predictive of
a strong performance at the parliamentary election and none of the 2004 maps
hint at the Liberal Democrats’ success in Brent East.

Page 56 The 2004 London Elections GLA Data Management and Analysis Group
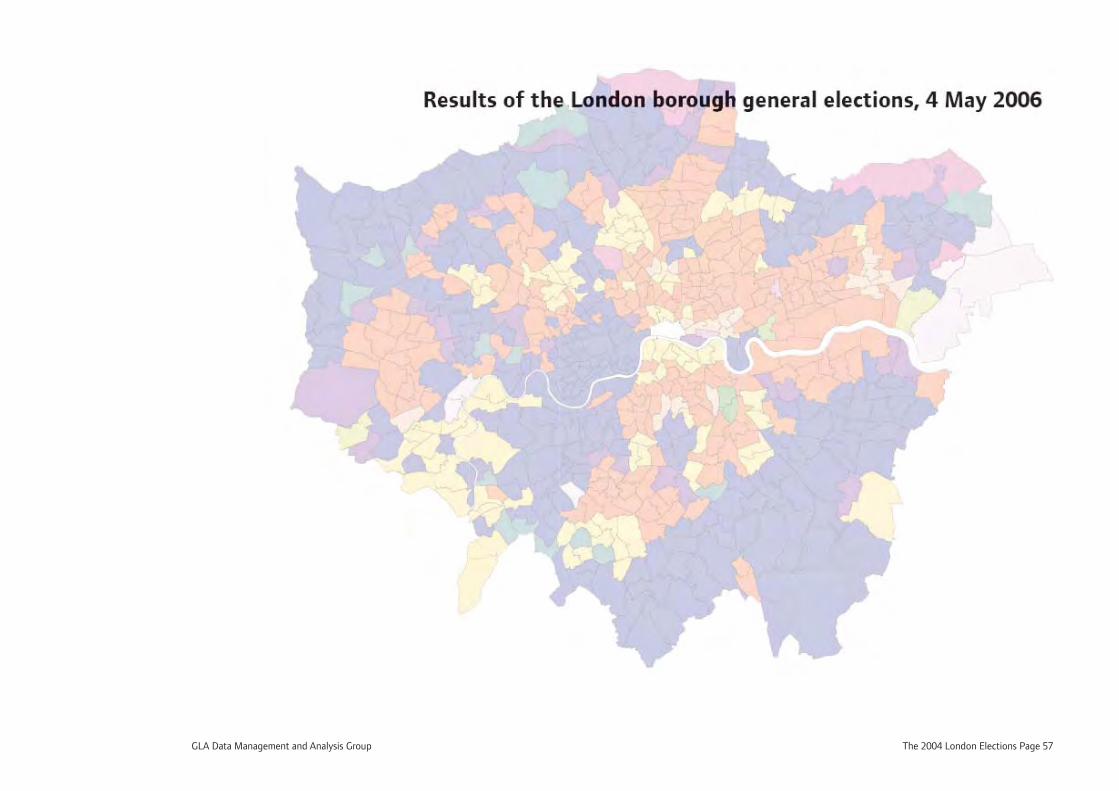
GLA Data Management and Analysis Group The 2004 London Elections Page 57
Results of the London borough general elections, 4 May 2006
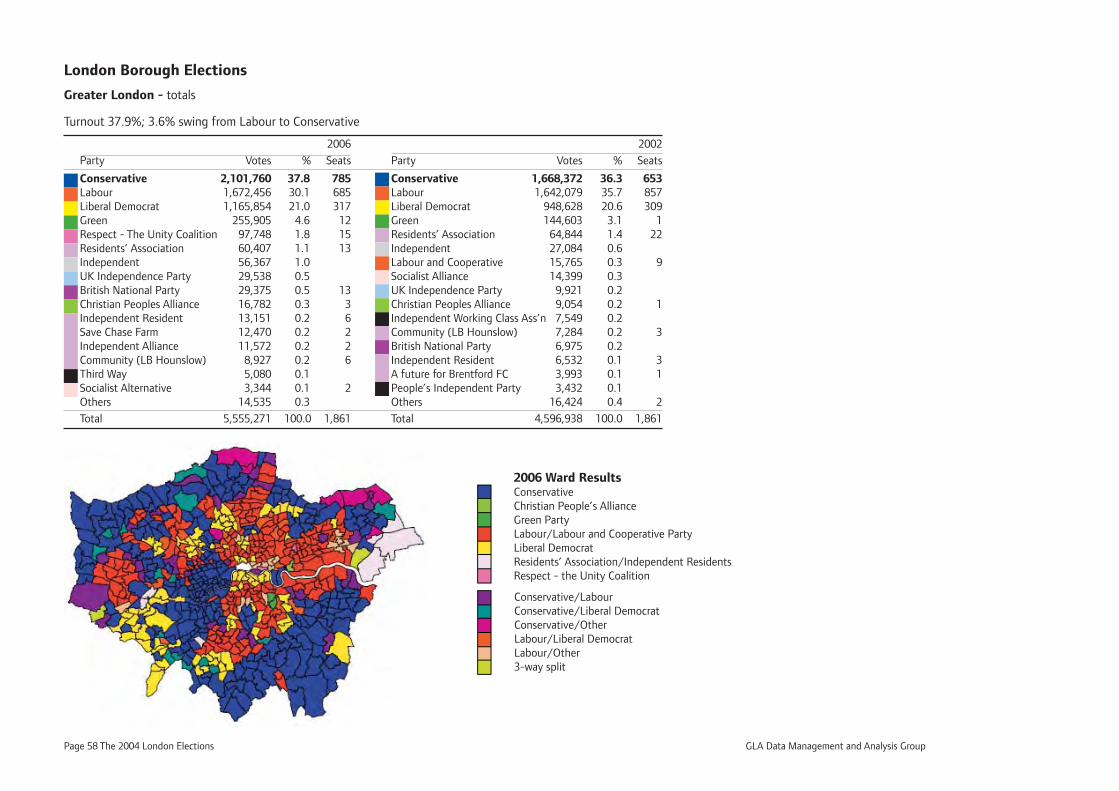
Page 58 The 2004 London Elections GLA Data Management and Analysis Group
2006 Ward ResultsConservativeChristian People’s AllianceGreen PartyLabour/Labour and Cooperative PartyLiberal DemocratResidents’ Association/Independent ResidentsRespect - the Unity Coalition
Conservative/LabourConservative/Liberal DemocratConservative/OtherLabour/Liberal DemocratLabour/Other3-way split
London Borough Elections
Greater London - totals
Turnout 37.9%; 3.6% swing from Labour to Conservative
2006 2002
Party Votes % Seats Party Votes % Seats
Conservative 2,101,760 37.8 785 Conservative 1,668,372 36.3 653Labour 1,672,456 30.1 685 Labour 1,642,079 35.7 857Liberal Democrat 1,165,854 21.0 317 Liberal Democrat 948,628 20.6 309Green 255,905 4.6 12 Green 144,603 3.1 1Respect - The Unity Coalition 97,748 1.8 15 Residents’ Association 64,844 1.4 22Residents’ Association 60,407 1.1 13 Independent 27,084 0.6 Independent 56,367 1.0 Labour and Cooperative 15,765 0.3 9UK Independence Party 29,538 0.5 Socialist Alliance 14,399 0.3 British National Party 29,375 0.5 13 UK Independence Party 9,921 0.2 Christian Peoples Alliance 16,782 0.3 3 Christian Peoples Alliance 9,054 0.2 1Independent Resident 13,151 0.2 6 Independent Working Class Ass’n 7,549 0.2 Save Chase Farm 12,470 0.2 2 Community (LB Hounslow) 7,284 0.2 3Independent Alliance 11,572 0.2 2 British National Party 6,975 0.2 Community (LB Hounslow) 8,927 0.2 6 Independent Resident 6,532 0.1 3Third Way 5,080 0.1 A future for Brentford FC 3,993 0.1 1Socialist Alternative 3,344 0.1 2 People’s Independent Party 3,432 0.1 Others 14,535 0.3 Others 16,424 0.4 2
Total 5,555,271 100.0 1,861 Total 4,596,938 100.0 1,861
GLA Data Management and Analysis Group The 2004 London Elections Page 59
The 2006 London borough general elections
The London Borough General Elections of May 2006 broke the mould in several
ways.
Following 12 years of continuously reducing turnout in London from the peak
in 1990, the poll was higher; but remained the fi fth lowest of the 11 similar
elections held in the capital since the inception of the London boroughs in
1965. In terms of elected councillors, the Conservatives had their best result
since 1982, and the Liberal Democrats, their second best ever.
Labour, again in terms of elected councillors, had their worst result except for
the 1968 election, when the Conservatives won over 75 per cent of seats in
London. The minor parties had their best result ever, with 74 seats, more than
double their total in 2002 and more than their previous best years in 1964 and
1968, when residents’ and ratepayers’ associations were very active in several
boroughs.
However, a striking element of the 2006 results was the performance achieved
by the Greens, the British National and Respect Parties. The fi rst of these had
won just two seats in 1998 and one in 2002 in previous London local general
elections. In 2006 the Greens took 12 seats on the back of an improved share
of the vote across London. They gained 4.6 per cent of the vote, by far the
biggest share achieved by any minor party in the last 20 years.
The British National Party fi rst appeared in a local general election in London
in 1990. The 2006 elections saw the BNP take seats at a general election for
the fi rst time. Their 13 seats, one more than the Greens, was achieved with only
about a tenth of the Greens’ vote, showing a much more focused approach in
terms of where they fi elded candidates. They may have gained even more seats
had they put up more candidates in the wards where they had successes.
The Respect Party was taking part in a borough general election for the fi rst
time. From this zero base, they won 15 seats. Like the BNP, their approach was
geographically focused, but their vote was about three times that of the BNP.
Both the BNP’s and Respect’s success was focused in East London with the
BNP winning seats in Havering (1), Redbridge (1) and Barking and Dagenham
(11), and Respect in Newham (3) and Tower Hamlets (12). In contrast, the
Greens’ successes were spread across six boroughs, only gaining more than one
seat in Camden (2) and Lewisham (6).
In 2006 29 seats were won by Residents Associations and other candidates
campaigning on specifi c local issues. This was exactly the same number as in
2002.
Comparing the map opposite with those on page 2 shows that the pattern
of voting in the 2006 borough elections followed that of the 2004 elections
reasonably closely.
The spread of the Liberal Democrat vote was perhaps more pronounced in
2006, particularly in North East London and in the West of the borough of
Haringey in North London. The stronger performances of Respect and the BNP
in 2006 are not refl ected in the map because all of the BNP seats and nine of
Respect’s came in split wards. The UK Independence Party which featured quite
strongly in 2004 was not in evidence at all in 2006 with just half of one per
cent of the London vote.
Borough by borough commentary
Summary results for individual London boroughs are found from page 187.
The most signifi cant factor in the result in Barking and Dagenham was the
success of the British National Party (BNP). Despite their winning more than
a fi fth of the available seats, due to the party not fi elding a full slate it was
unable to take all three seats in any ward. This masks the fact that the BNP was
successful with 11 of their 13 candidates, and that ten of the 11 were returned
with the highest votes in their ward. In contrast the Liberal Democrats who
had been in second place in 2002, fell right away to fi nish last with only a little
more than 1 per cent of the vote. In fact, the party put up only four candidates
but three were in the ward which they won in 2002.
The Conservatives consolidated their position in Barnet having lost control
briefl y in 1998. Labour lost share to all other parties.
Page 60 The 2004 London Elections GLA Data Management and Analysis Group
Except for the previously mentioned and exceptional election of 1968, the
Conservatives had their best result in Bexley in 2006 in terms of seats won, and
Labour their worst. The Liberal Democrats who had achieved around a quarter
of the vote in three past elections saw their support reduced to less than 10 per
cent.
Brent returned a hung council after eight years of Labour control. However,
in this borough it was Liberal Democrat success which affected both Labour
and Conservatives. They increased their vote by over 12 percentage points,
resulting in an additional 18 seats. The changes came mostly in the South East
of the borough where the Liberal Democrats picked up seats from both Labour
and Conservatives, refl ecting for the fi rst time at local level, the party’s recent
success in Parliamentary elections in that area. It is noteworthy that the party
holding the largest number of seats gained these from the third largest count of
votes.
Eight years after losing control of Bromley for the only time, the Conservatives
gained one of their biggest wins. The gains made by the Liberal Democrats
in terms of seats during the 1990s were reversed, and the Labour Party, with
four seats, had its worst result in the borough ever, including the 1968 election
when they won fi ve.
Labour lost Camden for the fi rst time since 1968. With a relatively small loss of
share of the vote (around 5 percentage points) but retaining the largest share,
Labour lost almost half of their seats. The Liberal Democrats are now the largest
party with the Conservatives increasing their representation and the Greens
taking their fi rst seats at a local general election in Camden as well.
Over the 40 years since the London boroughs were established, Croydon has
generally had Conservative administrations. However that did not hold true
between 1994 and 2006, when the borough had a Labour council. The election
of 2006 marked Croydon’s return to previous patterns. A sharp drop of almost
20 percentage points in Labour’s vote, led to the loss of fi ve seats which was
suffi cient for the change in political control.
The fi rst eight London borough elections resulted in four wins each for the
Conservatives and Labour in Ealing. The next three elections, from 1994 to
2002, were all won by Labour. Thus, 2006 saw the Conservative’s fi rst success
for 16 years. Despite increasing their share of the vote, the Liberal Democrats
lost a seat overall. The theory espoused by some media pundits, that Ealing is a
bell-wether borough for Parliamentary general election results appears to have
some merit. There have been 11 such Parliamentary elections since 1965, and in
only one, that of 1987, was the winner not the same as the controlling party in
Ealing at the time.
Enfi eld is another borough which over time has generally been Conservative
controlled. In 2006, the Conservatives retained control but, against the trend
elsewhere, with reduced representation and with a swing to Labour. This was,
in part, due to the intervention of a group of residents pursuing a single issue.
This group gained more than 6 per cent of the vote with nine candidates and
won two seats in otherwise Conservative wards.
Labour have generally (except during 1968–71) controlled Greenwich. With
that exception, 2006 saw them achieve their lowest number of seats although
the smaller council (51 seats as against 60 or 62 before 2002) is a factor in this.
Hackney is another borough traditionally controlled by Labour. The party failed
to win a majority in 1968 and 1998. In the second of these elections the Liberal
Democrats gained their best ever result with 17 seats and the Conservatives had
their best return (12 seats) other than in 1968. In 2006, the Greens won a seat
(their fi rst other than two in 1998). Hackney is one of three London boroughs
which have a directly elected mayor. The Labour mayor was returned with 47
per cent of the fi rst choice votes and 73 per cent after the second round.
Until now, 1968 and 1978 were the only years in which Labour failed to gain
an overall majority in Hammersmith and Fulham. The results of 1968 can
be seen as abnormal, and with this exception, 2006 was the fi rst time that
the Conservatives achieved a majority. The size of the majority (20 seats) is
therefore notable.
Labour have only failed to win Haringey on one occasion – in 1968. The
Conservatives failed to win a seat for the fi rst time in 2002 and the party’s
GLA Data Management and Analysis Group The 2004 London Elections Page 61
reduced share of the vote ensured no Conservative seats at this election in
2006. The Liberal Democrats have steadily increased their share of the vote
since 1990 to the point where they are running a close second to Labour with
27 of the 57 seats. The geographical split in representation is very clear from
the map.
Harrow is another borough where the Conservatives have generally, but not
always, been the largest party. The Conservatives took over from Labour which
had been the largest party in both 1998 and 2002. The Liberal Democrats’
strong showing in terms of seats through the 1980s and 1990s has almost
vanished, although their vote recovered from the local disaster of 2002 when
many of their nominations were rejected prior to the election.
Havering has long been the stronghold of residents’ members in London. Their
total of 16 seats in 2006 was lower than their showing in any election since
1990 but higher than in any election prior to that. The Conservatives have their
fi rst majority administration since 1986. No single party had achieved a majority
in the interim. Havering was one of the East London boroughs which returned a
BNP councillor, one of only two BNP candidates who stood in the borough.
In only two elections between 1986 and 2002 were there clear winners in
Hillingdon, and in one of these (1990) the Conservatives and Labour were
left on 35 and 34 respectively. The 2006 election resulted in a clear victor – the
Conservatives. Despite increasing their raw vote total and share, the Liberal
Democrats emerged with fi ve seats fewer than in 2002.
With the single exception of 1968-71, Hounslow has consistently returned
a Labour council. In the 2006 election, Labour remained the largest party
but short of a majority by some distance. The Conservatives picked up eight
additional seats while increasing their share of the vote by less than one
percentage point. Groups of residents have achieved more success in recent
years with eight seats falling to candidates not aligned to major parties in 2006.
In Islington, the gradual increase in the number of Liberal Democrats seats
over the past 16 years has been checked. In 1998 the council was equally
divided between the party and Labour but in 2002, the party achieved a
majority for the fi rst time. In 2006, they remained the largest party but the
Greens’ single seat prevented another equal share with Labour. The Labour
Party gained the largest proportion of raw votes in Islington for the fi rst time
since 1994.
It can be argued that Kensington and Chelsea has been the most constant
of the London boroughs. It was more than twenty years since a ward changed
politically other than through boundary alterations. The loss of St Charles ward
by Labour in 2006 is thus an event of some note although it was the most
vulnerable (in terms of swing required) of Labour’s wards in the borough.
The Liberal Democrats held an absolute majority in Kingston upon Thames
for the third time in the last four elections. This was despite the party’s vote
being reduced substantially in 2006 to fi nish below that of the Conservatives.
Lambeth was one of the few London boroughs which saw little or no reduction
in the Labour vote. The Liberal Democrats’ vote in 2006 fell away to close to its
1998 level and their presence on the council was reduced accordingly, but the
other parties failed to capitalise on this and despite their standstill in terms of
vote share, Labour were the benefi ciaries. The Greens gained one of their 12
seats in Lambeth.
Lewisham returned their directly-elected Labour mayor for a second term.
He gained 38 per cent of the fi rst vote with the Liberal Democrat candidate
second, and 57 per cent of the second round vote. In the council election,
Labour failed to gain an overall majority for the fi rst time since 1968. Their
share dropped by more than 12 per cent from the 2002 fi gure and their seat
count was down by 19. The Liberal Democrats had their best result by a large
margin with 17 seats against their previous best of four. The Greens took six
seats, improving on their 2002 showing of one, and their best result in London,
and the Socialist Alternative gained two seats, doubling their 2002 tally.
Merton returned a hung council for the fi rst time since 1964. The
Conservatives were the largest party for the fi rst time since 1986 when they
held a narrow one seat overall majority. Residents have held seats on Merton
Council for much of the borough’s existence. Merton is another borough which
Page 62 The 2004 London Elections GLA Data Management and Analysis Group
shows a marked geographical split in political support.
Not since 1982-86 have there been as many members in opposition to Labour
on Newham Council, and one has to go back a further eight years to fi nd an
opposition of greater than six. Even so, Labour’s share of the raw vote fell by
almost 20 percentage points from 2002, and the Respect Party, in their fi rst
outing in the borough general elections, took more than a quarter of the vote
to return three councillors having contested all 60 seats. The Christian People’s
Alliance held their seat from 2002 and added the remaining two seats from the
same ward. These three seats remained the party’s only successes in London.
Newham was one of the three London boroughs which elected their mayor
directly. Newham’s Labour mayor was returned with 48 per cent of the fi rst
votes, with the Respect candidate second, and 68 per cent at the second stage.
Redbridge had experienced a Labour (minority) administration for the fi rst
time in 1994 and again in 1998. Otherwise, the Conservatives have run the
borough throughout its existence, winning again in 2006. The BNP won one of
their seats in Hainault ward, having put up three candidates across the borough.
The Liberal Democrats had formed the administration in Richmond upon
Thames from 1986 until 2002 without a break. The Conservatives won the
borough back at the 2002 election, but 2006 saw the Liberal Democrats
returned to power. Labour have won seats in only fi ve of the 12 London
borough general elections, and no other party or grouping has won a seat since
the fi rst ever election of 1964.
Although the Liberal Democrats have done well in terms of seats in Southwark
since 1986 (and since 1982 in terms of votes when they gained almost a quarter
of the votes with no success in seats), it was only in 2002 that they exceeded
Labour’s total of seats and votes. The 2006 results saw the party resuming
second place in votes but holding the same number of seats as Labour.
Southwark was one of the few London boroughs where Labour’s vote increased
over 2002. For only the second election ever, a seat fell to someone outside the
three major parties, with the Greens taking a seat in South Camberwell.
The Liberal Democrats have held power in Sutton since 1986. 2006 was the
party’s worst result in seats since 1990 but they retained their majority. The
Conservatives increased their share of the vote by more than six percentage
points which gave them an additional 14 seats. The Labour Party failed to gain
a seat for the fi rst time.
The story of the 2006 election in Tower Hamlets centres on the Respect Party.
They gained 12 seats, by some distance their best performance in London,
contesting 48 of the 51 seats in the borough. The Labour Party lost more than
a quarter of their share of the vote and came close to losing their majority
in the council for the fi rst time since the Liberal Democrats controlled the
borough for eight years from 1986 to 1994. That party’s support has fallen
away with their worst result (in terms of seats) in the borough since 1974. The
Conservatives won their fi rst ever seats in Tower Hamlets. Even in 1968, they
failed to win a single seat. The major demographic shifts which have taken place
recently in Docklands may be a factor in this change.
The Liberal Democrats strengthened their position in Waltham Forest at the
expense of both the other major parties. The Greens and Respect both made
advances but not to the extent of winning seats.
The Conservatives had their best ever result in terms of seats won in
Wandsworth. It is now almost 30 years since Labour held this borough which
until then had been widely regarded as part of their natural heartland. This is
the fi rst election in which they failed won fewer than ten seats. With the single
exception of one in 1982, no other party has won any seat in the borough.
The Conservatives and Labour maintained the status quo in seats in the City of
Westminster. With the Conservatives retaining an almost identical share of the
raw vote, Labour lost around fi ve percentage points with the Liberal Democrats
benefi ting, but not suffi ciently to gain seats.
GLA Data Management and Analysis Group The 2004 London Elections Page 63
Detailed tables

Page 64 The 2004 London Elections GLA Data Management and Analysis Group
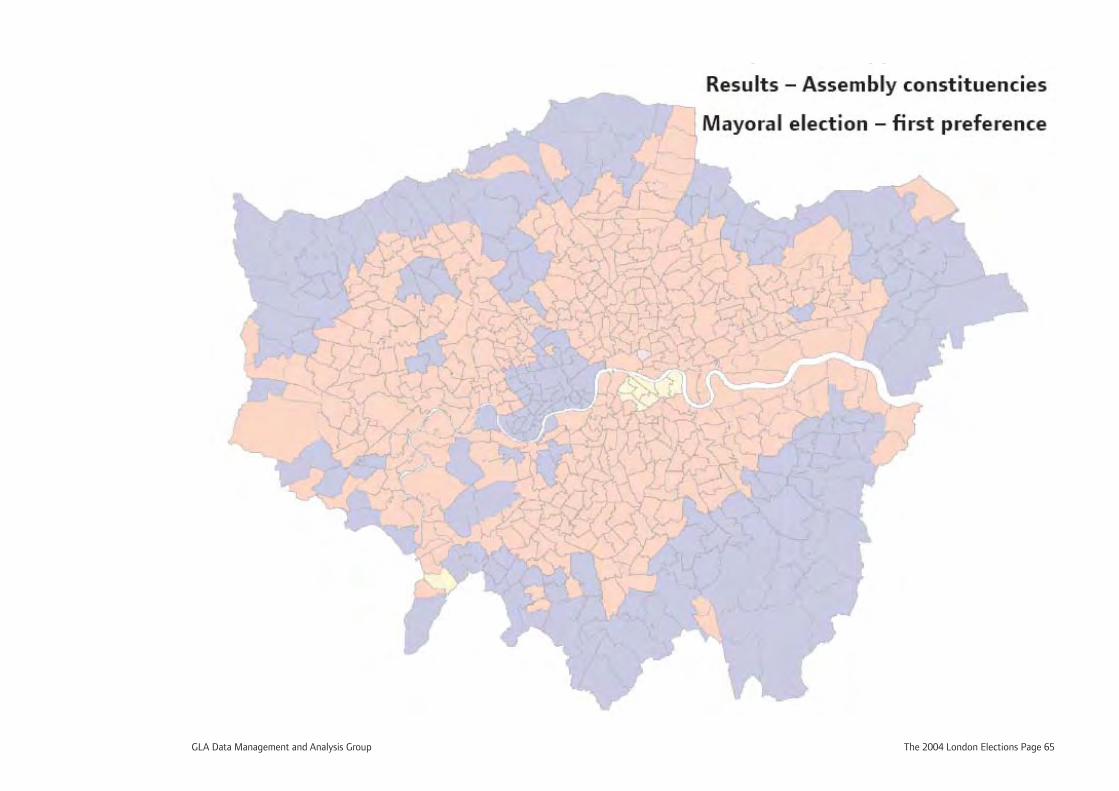
GLA Data Management and Analysis Group The 2004 London Elections Page 65
Results – Assembly constituencies
Mayoral election – fi rst preference
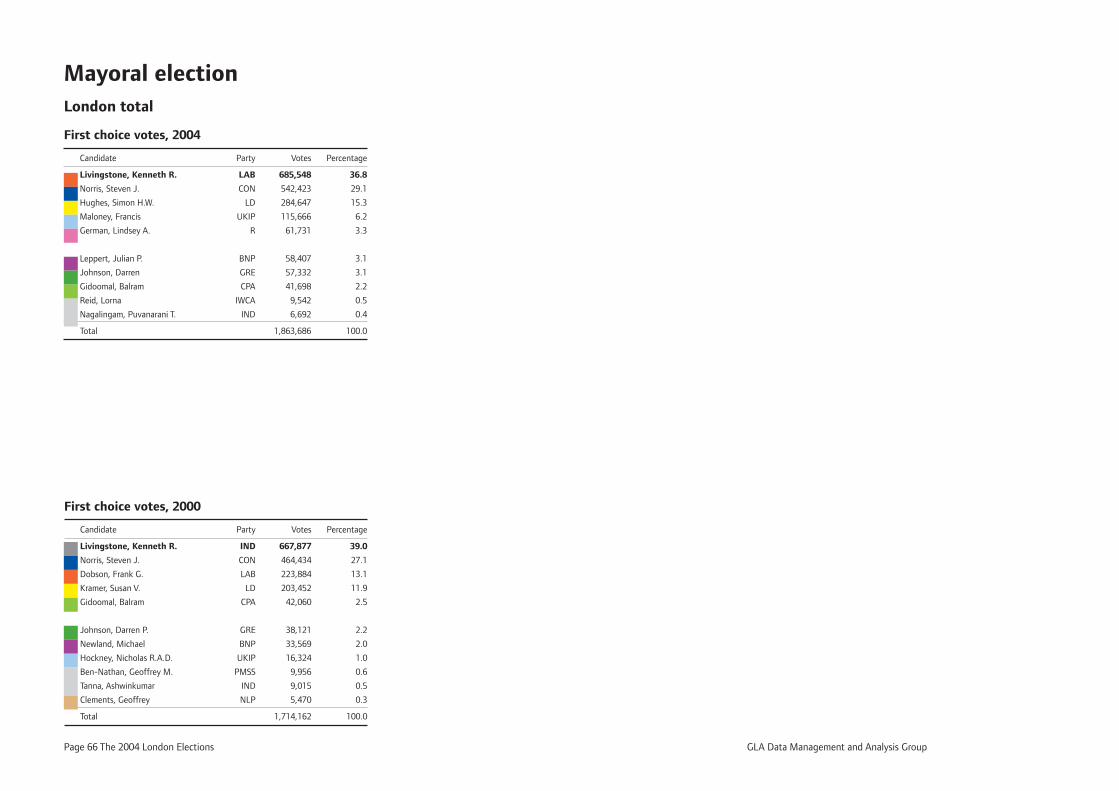
Page 66 The 2004 London Elections GLA Data Management and Analysis Group
Mayoral electionLondon total
First choice votes, 2004
Candidate Party Votes Percentage
Livingstone, Kenneth R. LAB 685,548 36.8
Norris, Steven J. CON 542,423 29.1
Hughes, Simon H.W. LD 284,647 15.3
Maloney, Francis UKIP 115,666 6.2
German, Lindsey A. R 61,731 3.3
Leppert, Julian P. BNP 58,407 3.1
Johnson, Darren GRE 57,332 3.1
Gidoomal, Balram CPA 41,698 2.2
Reid, Lorna IWCA 9,542 0.5
Nagalingam, Puvanarani T. IND 6,692 0.4
Total 1,863,686 100.0
First choice votes, 2000
Candidate Party Votes Percentage
Livingstone, Kenneth R. IND 667,877 39.0
Norris, Steven J. CON 464,434 27.1
Dobson, Frank G. LAB 223,884 13.1
Kramer, Susan V. LD 203,452 11.9
Gidoomal, Balram CPA 42,060 2.5
Johnson, Darren P. GRE 38,121 2.2
Newland, Michael BNP 33,569 2.0
Hockney, Nicholas R.A.D. UKIP 16,324 1.0
Ben-Nathan, Geoffrey M. PMSS 9,956 0.6
Tanna, Ashwinkumar IND 9,015 0.5
Clements, Geoffrey NLP 5,470 0.3
Total 1,714,162 100.0
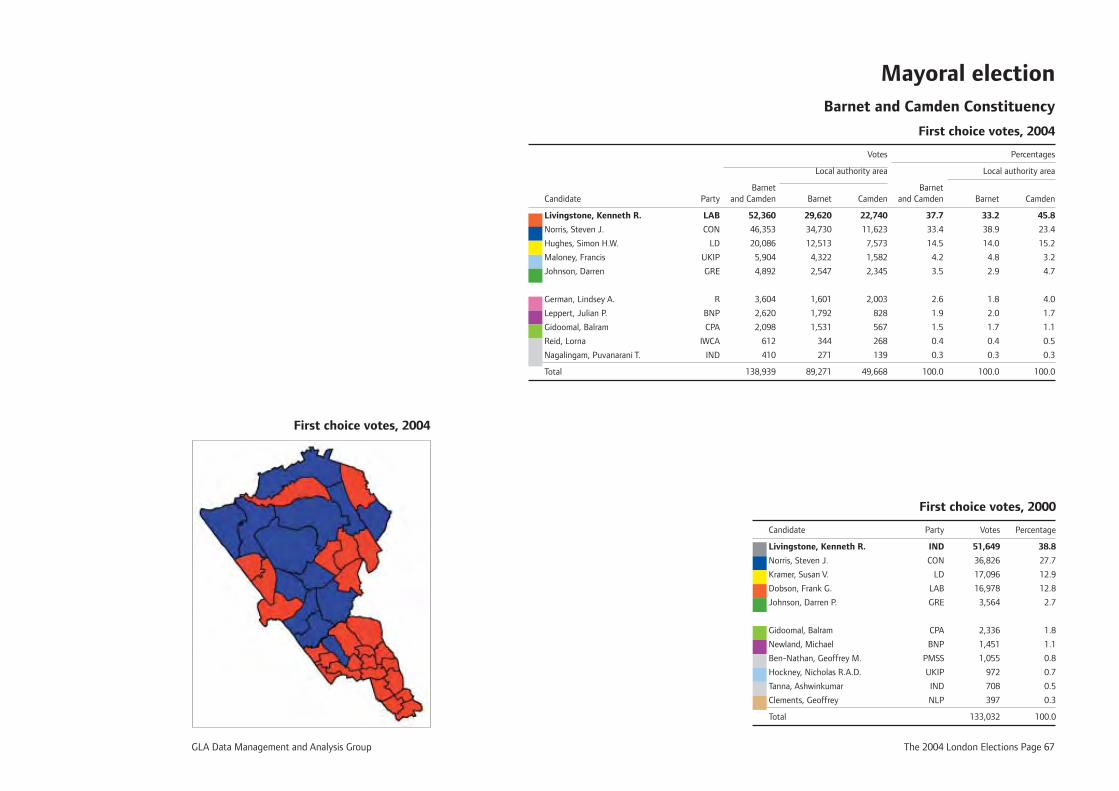
GLA Data Management and Analysis Group The 2004 London Elections Page 67
Mayoral election Barnet and Camden Constituency
First choice votes, 2004
Votes Percentages
Local authority area Local authority area
Barnet Barnet Candidate Party and Camden Barnet Camden and Camden Barnet Camden
Livingstone, Kenneth R. LAB 52,360 29,620 22,740 37.7 33.2 45.8
Norris, Steven J. CON 46,353 34,730 11,623 33.4 38.9 23.4
Hughes, Simon H.W. LD 20,086 12,513 7,573 14.5 14.0 15.2
Maloney, Francis UKIP 5,904 4,322 1,582 4.2 4.8 3.2
Johnson, Darren GRE 4,892 2,547 2,345 3.5 2.9 4.7
German, Lindsey A. R 3,604 1,601 2,003 2.6 1.8 4.0
Leppert, Julian P. BNP 2,620 1,792 828 1.9 2.0 1.7
Gidoomal, Balram CPA 2,098 1,531 567 1.5 1.7 1.1
Reid, Lorna IWCA 612 344 268 0.4 0.4 0.5
Nagalingam, Puvanarani T. IND 410 271 139 0.3 0.3 0.3
Total 138,939 89,271 49,668 100.0 100.0 100.0
First choice votes, 2000
Candidate Party Votes Percentage
Livingstone, Kenneth R. IND 51,649 38.8
Norris, Steven J. CON 36,826 27.7
Kramer, Susan V. LD 17,096 12.9
Dobson, Frank G. LAB 16,978 12.8
Johnson, Darren P. GRE 3,564 2.7
Gidoomal, Balram CPA 2,336 1.8
Newland, Michael BNP 1,451 1.1
Ben-Nathan, Geoffrey M. PMSS 1,055 0.8
Hockney, Nicholas R.A.D. UKIP 972 0.7
Tanna, Ashwinkumar IND 708 0.5
Clements, Geoffrey NLP 397 0.3
Total 133,032 100.0
First choice votes, 2004

Page 68 The 2004 London Elections GLA Data Management and Analysis Group
Mayoral election Bexley and Bromley Constituency
First choice votes, 2004
Votes Percentages
Local authority area Local authority area
Bexley and Bexley and Candidate Party Bromley Bexley Bromley Bromley Bexley Bromley
Norris, Steven J. CON 59,521 23,027 36,494 37.0 35.2 38.2
Livingstone, Kenneth R. LAB 40,983 17,182 23,801 25.5 26.2 24.9
Hughes, Simon H.W. LD 28,232 9,728 18,504 17.5 14.9 19.4
Maloney, Francis UKIP 16,990 8,484 8,506 10.6 13.0 8.9
Leppert, Julian P. BNP 6,859 3,827 3,032 4.3 5.8 3.2
Johnson, Darren GRE 3,262 1,226 2,036 2.0 1.9 2.1
Gidoomal, Balram CPA 3,200 1,226 1,974 2.0 1.9 2.1
German, Lindsey A. R 965 366 599 0.6 0.6 0.6
Reid, Lorna IWCA 611 299 312 0.4 0.5 0.3
Nagalingam, Puvanarani T. IND 327 139 188 0.2 0.2 0.2
Total 160,950 65,504 95,446 100.0 100.0 100.0
First choice votes, 2000
Candidate Party Votes Percentage
Norris, Steven J. CON 57,193 39.3
Livingstone, Kenneth R. IND 41,679 28.7
Kramer, Susan V. LD 20,610 14.2
Dobson, Frank G. LAB 11,975 8.2
Newland, Michael BNP 3,785 2.6
Gidoomal, Balram CPA 3,678 2.5
Johnson, Darren P. GRE 2,673 1.8
Hockney, Nicholas R.A.D. UKIP 2,149 1.5
Ben-Nathan, Geoffrey M. PMSS 746 0.5
Tanna, Ashwinkumar IND 617 0.4
Clements, Geoffrey NLP 286 0.2
Total 145,391 100.0
First choice votes, 2004
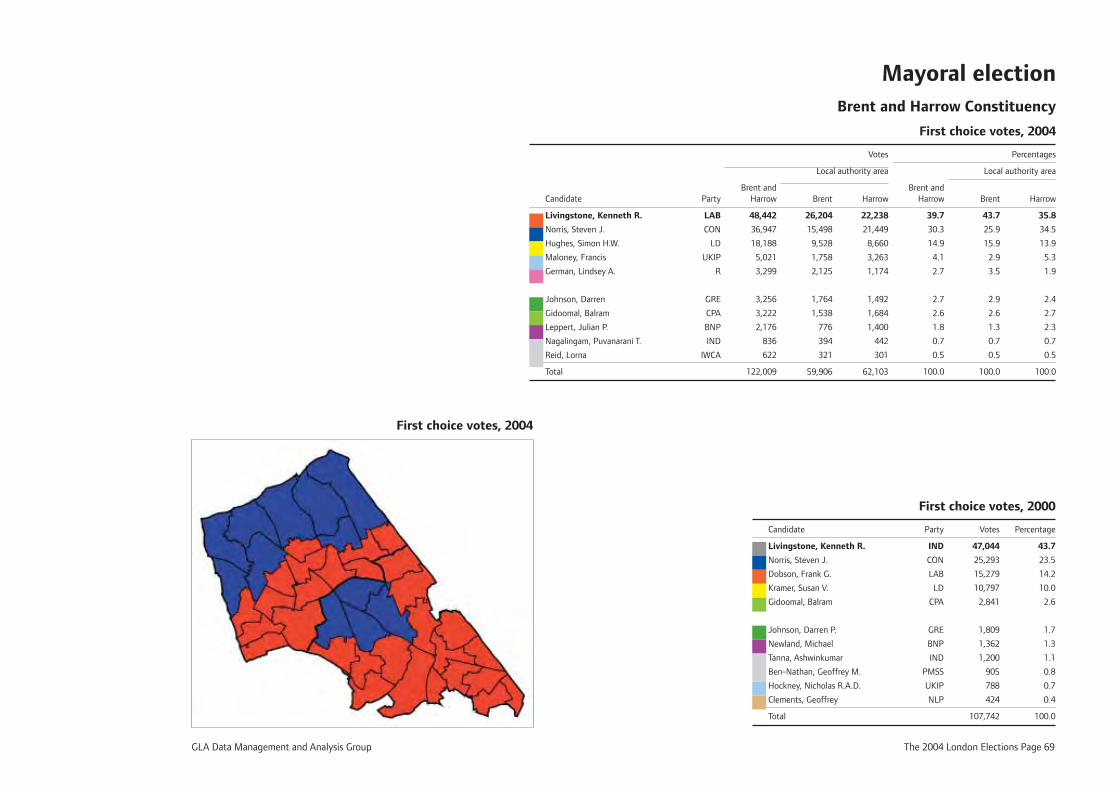
GLA Data Management and Analysis Group The 2004 London Elections Page 69
Mayoral election Brent and Harrow Constituency
First choice votes, 2004
Votes Percentages
Local authority area Local authority area
Brent and Brent and Candidate Party Harrow Brent Harrow Harrow Brent Harrow
Livingstone, Kenneth R. LAB 48,442 26,204 22,238 39.7 43.7 35.8
Norris, Steven J. CON 36,947 15,498 21,449 30.3 25.9 34.5
Hughes, Simon H.W. LD 18,188 9,528 8,660 14.9 15.9 13.9
Maloney, Francis UKIP 5,021 1,758 3,263 4.1 2.9 5.3
German, Lindsey A. R 3,299 2,125 1,174 2.7 3.5 1.9
Johnson, Darren GRE 3,256 1,764 1,492 2.7 2.9 2.4
Gidoomal, Balram CPA 3,222 1,538 1,684 2.6 2.6 2.7
Leppert, Julian P. BNP 2,176 776 1,400 1.8 1.3 2.3
Nagalingam, Puvanarani T. IND 836 394 442 0.7 0.7 0.7
Reid, Lorna IWCA 622 321 301 0.5 0.5 0.5
Total 122,009 59,906 62,103 100.0 100.0 100.0
First choice votes, 2000
Candidate Party Votes Percentage
Livingstone, Kenneth R. IND 47,044 43.7
Norris, Steven J. CON 25,293 23.5
Dobson, Frank G. LAB 15,279 14.2
Kramer, Susan V. LD 10,797 10.0
Gidoomal, Balram CPA 2,841 2.6
Johnson, Darren P. GRE 1,809 1.7
Newland, Michael BNP 1,362 1.3
Tanna, Ashwinkumar IND 1,200 1.1
Ben-Nathan, Geoffrey M. PMSS 905 0.8
Hockney, Nicholas R.A.D. UKIP 788 0.7
Clements, Geoffrey NLP 424 0.4
Total 107,742 100.0
First choice votes, 2004
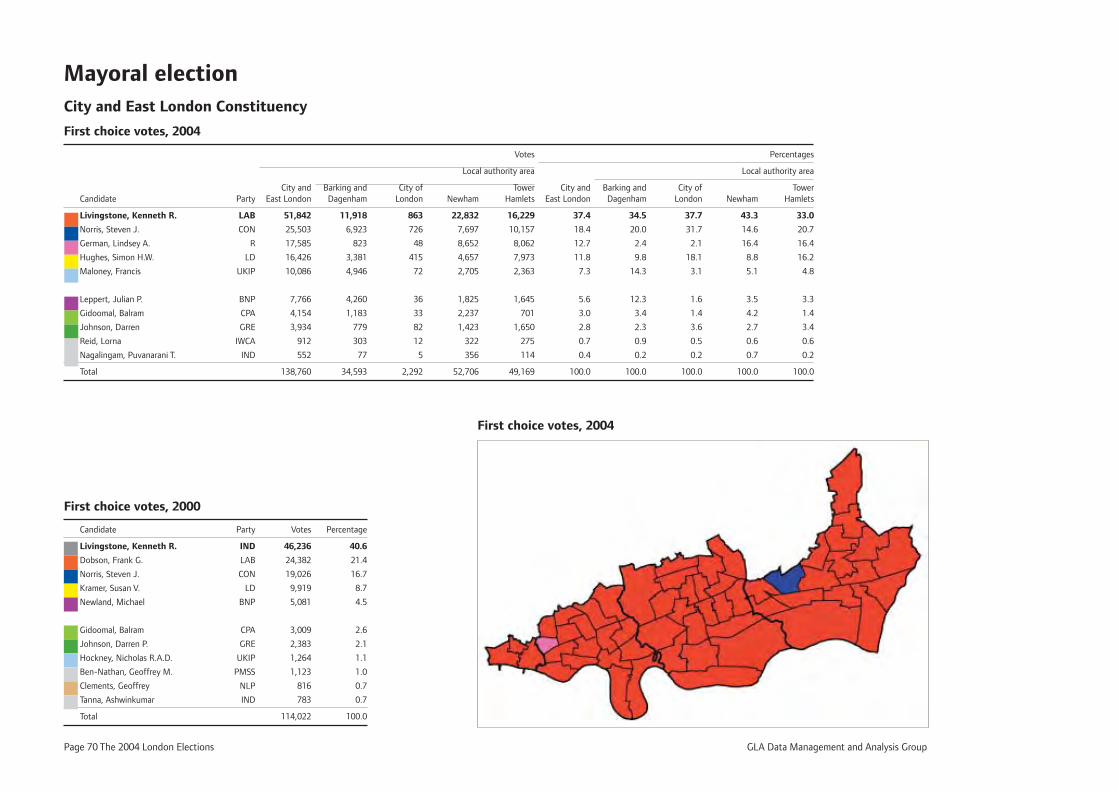
Page 70 The 2004 London Elections GLA Data Management and Analysis Group
Mayoral election City and East London Constituency
First choice votes, 2004
Votes Percentages
Local authority area Local authority area
City and Barking and City of Tower City and Barking and City of Tower Candidate Party East London Dagenham London Newham Hamlets East London Dagenham London Newham Hamlets
Livingstone, Kenneth R. LAB 51,842 11,918 863 22,832 16,229 37.4 34.5 37.7 43.3 33.0
Norris, Steven J. CON 25,503 6,923 726 7,697 10,157 18.4 20.0 31.7 14.6 20.7
German, Lindsey A. R 17,585 823 48 8,652 8,062 12.7 2.4 2.1 16.4 16.4
Hughes, Simon H.W. LD 16,426 3,381 415 4,657 7,973 11.8 9.8 18.1 8.8 16.2
Maloney, Francis UKIP 10,086 4,946 72 2,705 2,363 7.3 14.3 3.1 5.1 4.8
Leppert, Julian P. BNP 7,766 4,260 36 1,825 1,645 5.6 12.3 1.6 3.5 3.3
Gidoomal, Balram CPA 4,154 1,183 33 2,237 701 3.0 3.4 1.4 4.2 1.4
Johnson, Darren GRE 3,934 779 82 1,423 1,650 2.8 2.3 3.6 2.7 3.4
Reid, Lorna IWCA 912 303 12 322 275 0.7 0.9 0.5 0.6 0.6
Nagalingam, Puvanarani T. IND 552 77 5 356 114 0.4 0.2 0.2 0.7 0.2
Total 138,760 34,593 2,292 52,706 49,169 100.0 100.0 100.0 100.0 100.0
First choice votes, 2000
Candidate Party Votes Percentage
Livingstone, Kenneth R. IND 46,236 40.6
Dobson, Frank G. LAB 24,382 21.4
Norris, Steven J. CON 19,026 16.7
Kramer, Susan V. LD 9,919 8.7
Newland, Michael BNP 5,081 4.5
Gidoomal, Balram CPA 3,009 2.6
Johnson, Darren P. GRE 2,383 2.1
Hockney, Nicholas R.A.D. UKIP 1,264 1.1
Ben-Nathan, Geoffrey M. PMSS 1,123 1.0
Clements, Geoffrey NLP 816 0.7
Tanna, Ashwinkumar IND 783 0.7
Total 114,022 100.0
First choice votes, 2004
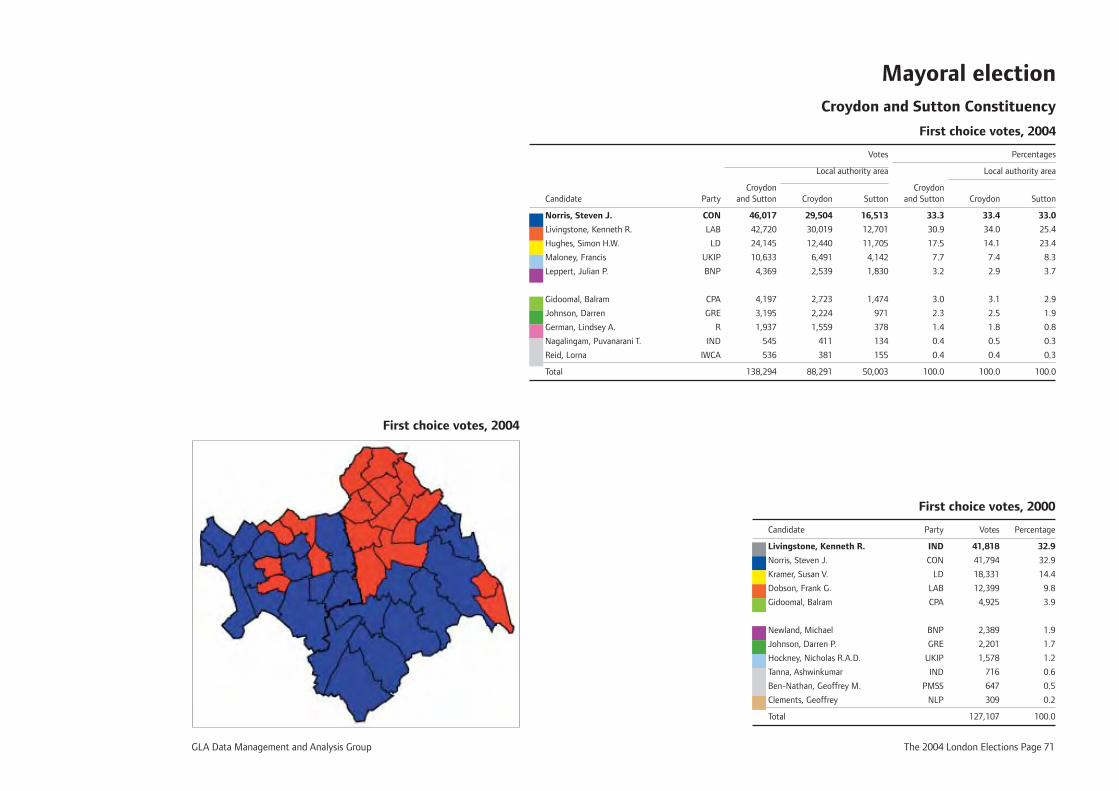
GLA Data Management and Analysis Group The 2004 London Elections Page 71
Mayoral election Croydon and Sutton Constituency
First choice votes, 2004
Votes Percentages
Local authority area Local authority area
Croydon Croydon Candidate Party and Sutton Croydon Sutton and Sutton Croydon Sutton
Norris, Steven J. CON 46,017 29,504 16,513 33.3 33.4 33.0
Livingstone, Kenneth R. LAB 42,720 30,019 12,701 30.9 34.0 25.4
Hughes, Simon H.W. LD 24,145 12,440 11,705 17.5 14.1 23.4
Maloney, Francis UKIP 10,633 6,491 4,142 7.7 7.4 8.3
Leppert, Julian P. BNP 4,369 2,539 1,830 3.2 2.9 3.7
Gidoomal, Balram CPA 4,197 2,723 1,474 3.0 3.1 2.9
Johnson, Darren GRE 3,195 2,224 971 2.3 2.5 1.9
German, Lindsey A. R 1,937 1,559 378 1.4 1.8 0.8
Nagalingam, Puvanarani T. IND 545 411 134 0.4 0.5 0.3
Reid, Lorna IWCA 536 381 155 0.4 0.4 0.3
Total 138,294 88,291 50,003 100.0 100.0 100.0
First choice votes, 2000
Candidate Party Votes Percentage
Livingstone, Kenneth R. IND 41,818 32.9
Norris, Steven J. CON 41,794 32.9
Kramer, Susan V. LD 18,331 14.4
Dobson, Frank G. LAB 12,399 9.8
Gidoomal, Balram CPA 4,925 3.9
Newland, Michael BNP 2,389 1.9
Johnson, Darren P. GRE 2,201 1.7
Hockney, Nicholas R.A.D. UKIP 1,578 1.2
Tanna, Ashwinkumar IND 716 0.6
Ben-Nathan, Geoffrey M. PMSS 647 0.5
Clements, Geoffrey NLP 309 0.2
Total 127,107 100.0
First choice votes, 2004
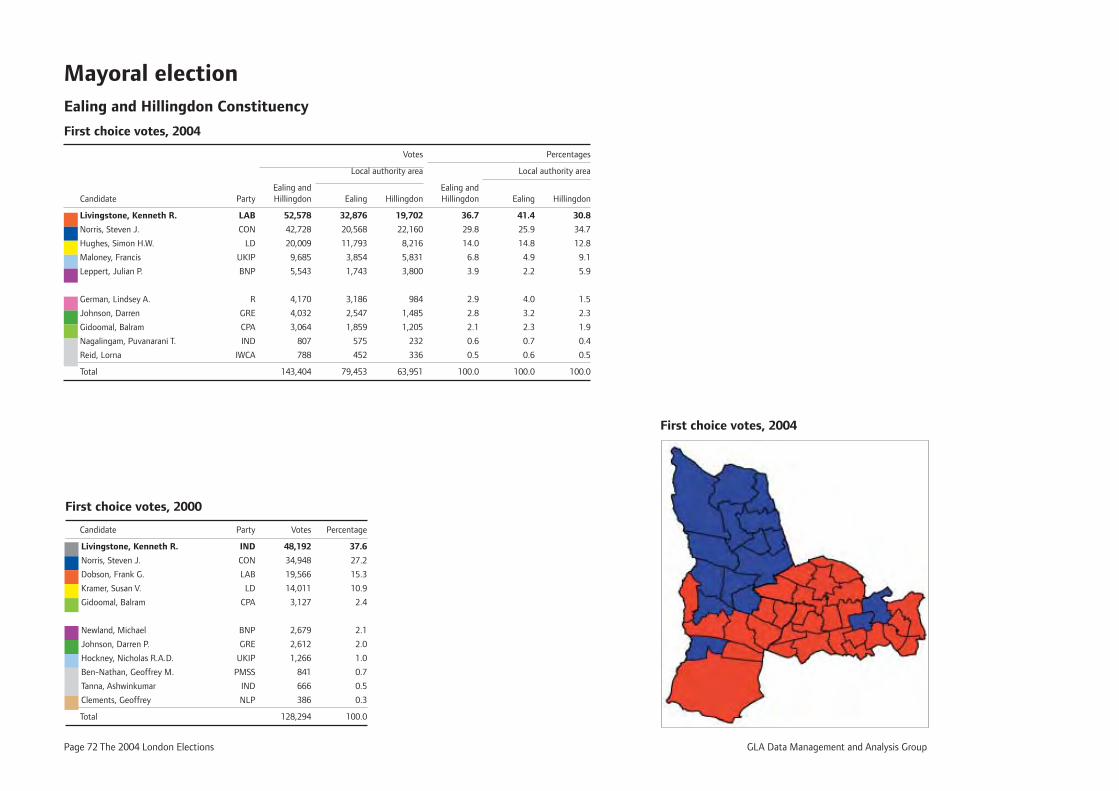
Page 72 The 2004 London Elections GLA Data Management and Analysis Group
Mayoral election Ealing and Hillingdon Constituency
First choice votes, 2004
Votes Percentages
Local authority area Local authority area
Ealing and Ealing and Candidate Party Hillingdon Ealing Hillingdon Hillingdon Ealing Hillingdon
Livingstone, Kenneth R. LAB 52,578 32,876 19,702 36.7 41.4 30.8
Norris, Steven J. CON 42,728 20,568 22,160 29.8 25.9 34.7
Hughes, Simon H.W. LD 20,009 11,793 8,216 14.0 14.8 12.8
Maloney, Francis UKIP 9,685 3,854 5,831 6.8 4.9 9.1
Leppert, Julian P. BNP 5,543 1,743 3,800 3.9 2.2 5.9
German, Lindsey A. R 4,170 3,186 984 2.9 4.0 1.5
Johnson, Darren GRE 4,032 2,547 1,485 2.8 3.2 2.3
Gidoomal, Balram CPA 3,064 1,859 1,205 2.1 2.3 1.9
Nagalingam, Puvanarani T. IND 807 575 232 0.6 0.7 0.4
Reid, Lorna IWCA 788 452 336 0.5 0.6 0.5
Total 143,404 79,453 63,951 100.0 100.0 100.0
First choice votes, 2000
Candidate Party Votes Percentage
Livingstone, Kenneth R. IND 48,192 37.6
Norris, Steven J. CON 34,948 27.2
Dobson, Frank G. LAB 19,566 15.3
Kramer, Susan V. LD 14,011 10.9
Gidoomal, Balram CPA 3,127 2.4
Newland, Michael BNP 2,679 2.1
Johnson, Darren P. GRE 2,612 2.0
Hockney, Nicholas R.A.D. UKIP 1,266 1.0
Ben-Nathan, Geoffrey M. PMSS 841 0.7
Tanna, Ashwinkumar IND 666 0.5
Clements, Geoffrey NLP 386 0.3
Total 128,294 100.0
First choice votes, 2004
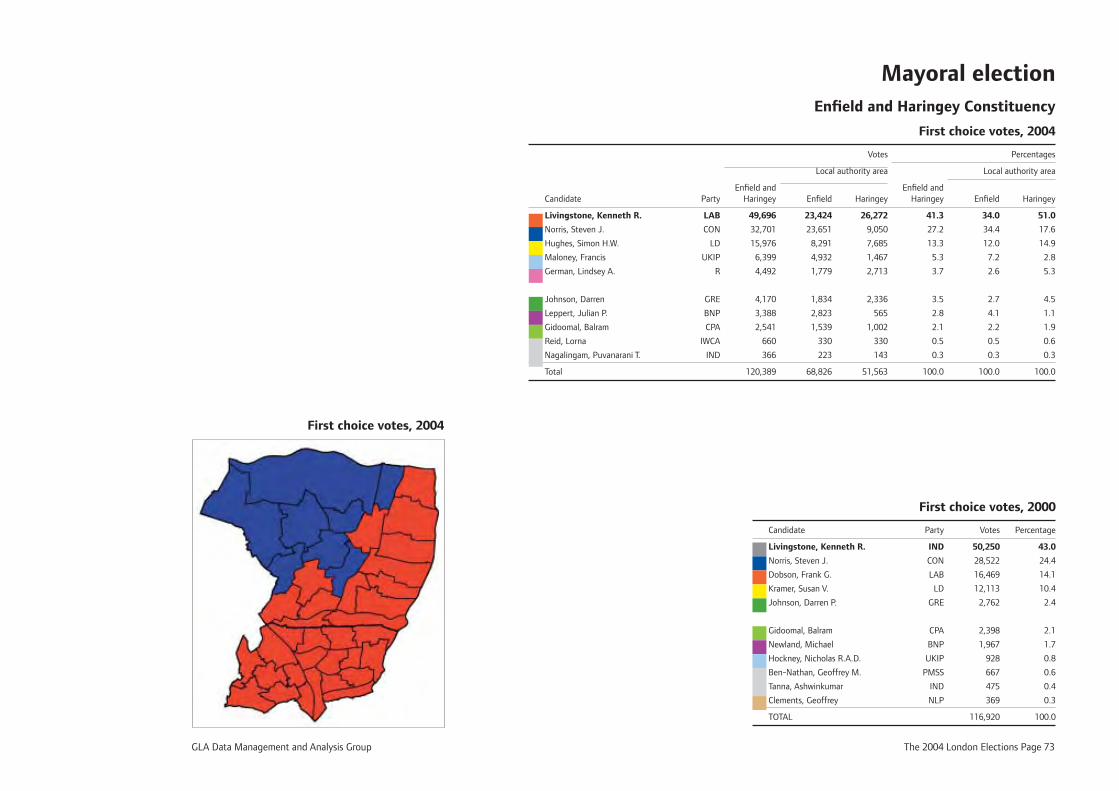
GLA Data Management and Analysis Group The 2004 London Elections Page 73
Mayoral election Enfi eld and Haringey Constituency
First choice votes, 2004
Votes Percentages
Local authority area Local authority area
Enfi eld and Enfi eld and Candidate Party Haringey Enfi eld Haringey Haringey Enfi eld Haringey
Livingstone, Kenneth R. LAB 49,696 23,424 26,272 41.3 34.0 51.0
Norris, Steven J. CON 32,701 23,651 9,050 27.2 34.4 17.6
Hughes, Simon H.W. LD 15,976 8,291 7,685 13.3 12.0 14.9
Maloney, Francis UKIP 6,399 4,932 1,467 5.3 7.2 2.8
German, Lindsey A. R 4,492 1,779 2,713 3.7 2.6 5.3
Johnson, Darren GRE 4,170 1,834 2,336 3.5 2.7 4.5
Leppert, Julian P. BNP 3,388 2,823 565 2.8 4.1 1.1
Gidoomal, Balram CPA 2,541 1,539 1,002 2.1 2.2 1.9
Reid, Lorna IWCA 660 330 330 0.5 0.5 0.6
Nagalingam, Puvanarani T. IND 366 223 143 0.3 0.3 0.3
Total 120,389 68,826 51,563 100.0 100.0 100.0
First choice votes, 2000
Candidate Party Votes Percentage
Livingstone, Kenneth R. IND 50,250 43.0
Norris, Steven J. CON 28,522 24.4
Dobson, Frank G. LAB 16,469 14.1
Kramer, Susan V. LD 12,113 10.4
Johnson, Darren P. GRE 2,762 2.4
Gidoomal, Balram CPA 2,398 2.1
Newland, Michael BNP 1,967 1.7
Hockney, Nicholas R.A.D. UKIP 928 0.8
Ben-Nathan, Geoffrey M. PMSS 667 0.6
Tanna, Ashwinkumar IND 475 0.4
Clements, Geoffrey NLP 369 0.3
TOTAL 116,920 100.0
First choice votes, 2004
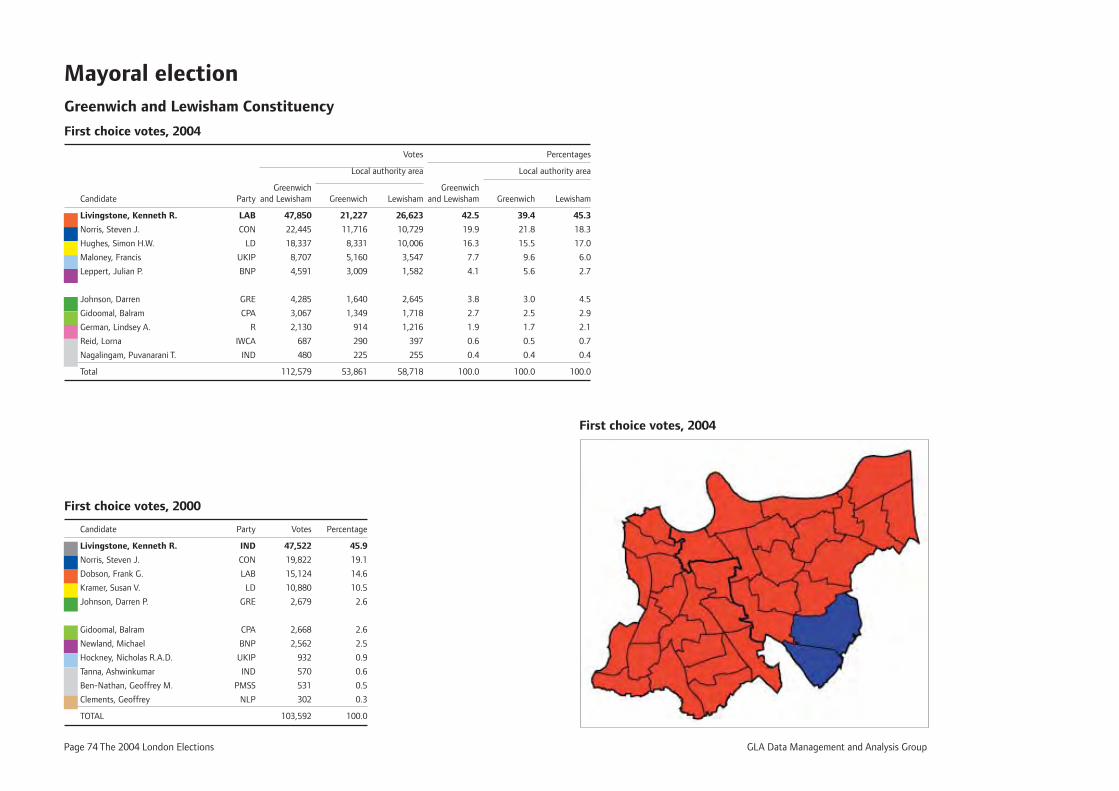
Page 74 The 2004 London Elections GLA Data Management and Analysis Group
Mayoral election Greenwich and Lewisham Constituency
First choice votes, 2004
Votes Percentages
Local authority area Local authority area
Greenwich Greenwich Candidate Party and Lewisham Greenwich Lewisham and Lewisham Greenwich Lewisham
Livingstone, Kenneth R. LAB 47,850 21,227 26,623 42.5 39.4 45.3
Norris, Steven J. CON 22,445 11,716 10,729 19.9 21.8 18.3
Hughes, Simon H.W. LD 18,337 8,331 10,006 16.3 15.5 17.0
Maloney, Francis UKIP 8,707 5,160 3,547 7.7 9.6 6.0
Leppert, Julian P. BNP 4,591 3,009 1,582 4.1 5.6 2.7
Johnson, Darren GRE 4,285 1,640 2,645 3.8 3.0 4.5
Gidoomal, Balram CPA 3,067 1,349 1,718 2.7 2.5 2.9
German, Lindsey A. R 2,130 914 1,216 1.9 1.7 2.1
Reid, Lorna IWCA 687 290 397 0.6 0.5 0.7
Nagalingam, Puvanarani T. IND 480 225 255 0.4 0.4 0.4
Total 112,579 53,861 58,718 100.0 100.0 100.0
First choice votes, 2000
Candidate Party Votes Percentage
Livingstone, Kenneth R. IND 47,522 45.9
Norris, Steven J. CON 19,822 19.1
Dobson, Frank G. LAB 15,124 14.6
Kramer, Susan V. LD 10,880 10.5
Johnson, Darren P. GRE 2,679 2.6
Gidoomal, Balram CPA 2,668 2.6
Newland, Michael BNP 2,562 2.5
Hockney, Nicholas R.A.D. UKIP 932 0.9
Tanna, Ashwinkumar IND 570 0.6
Ben-Nathan, Geoffrey M. PMSS 531 0.5
Clements, Geoffrey NLP 302 0.3
TOTAL 103,592 100.0
First choice votes, 2004
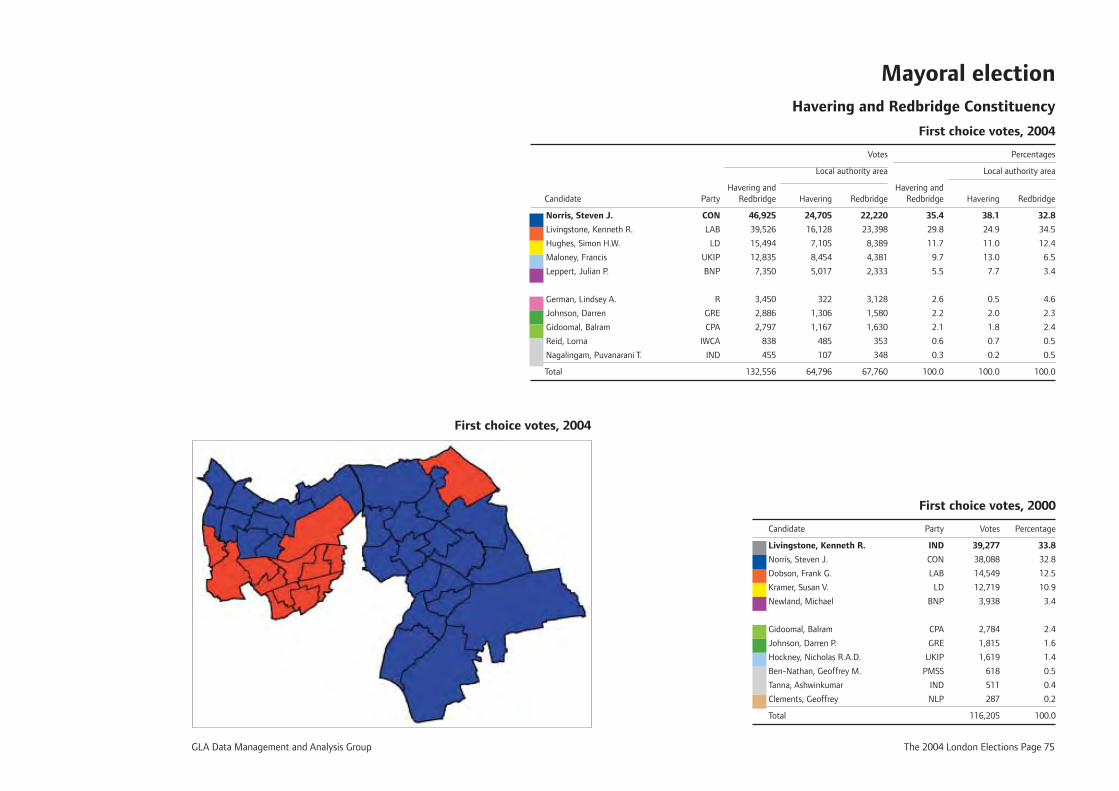
GLA Data Management and Analysis Group The 2004 London Elections Page 75
Mayoral election Havering and Redbridge Constituency
First choice votes, 2004
Votes Percentages
Local authority area Local authority area
Havering and Havering and Candidate Party Redbridge Havering Redbridge Redbridge Havering Redbridge
Norris, Steven J. CON 46,925 24,705 22,220 35.4 38.1 32.8
Livingstone, Kenneth R. LAB 39,526 16,128 23,398 29.8 24.9 34.5
Hughes, Simon H.W. LD 15,494 7,105 8,389 11.7 11.0 12.4
Maloney, Francis UKIP 12,835 8,454 4,381 9.7 13.0 6.5
Leppert, Julian P. BNP 7,350 5,017 2,333 5.5 7.7 3.4
German, Lindsey A. R 3,450 322 3,128 2.6 0.5 4.6
Johnson, Darren GRE 2,886 1,306 1,580 2.2 2.0 2.3
Gidoomal, Balram CPA 2,797 1,167 1,630 2.1 1.8 2.4
Reid, Lorna IWCA 838 485 353 0.6 0.7 0.5
Nagalingam, Puvanarani T. IND 455 107 348 0.3 0.2 0.5
Total 132,556 64,796 67,760 100.0 100.0 100.0
First choice votes, 2000
Candidate Party Votes Percentage
Livingstone, Kenneth R. IND 39,277 33.8
Norris, Steven J. CON 38,088 32.8
Dobson, Frank G. LAB 14,549 12.5
Kramer, Susan V. LD 12,719 10.9
Newland, Michael BNP 3,938 3.4
Gidoomal, Balram CPA 2,784 2.4
Johnson, Darren P. GRE 1,815 1.6
Hockney, Nicholas R.A.D. UKIP 1,619 1.4
Ben-Nathan, Geoffrey M. PMSS 618 0.5
Tanna, Ashwinkumar IND 511 0.4
Clements, Geoffrey NLP 287 0.2
Total 116,205 100.0
First choice votes, 2004
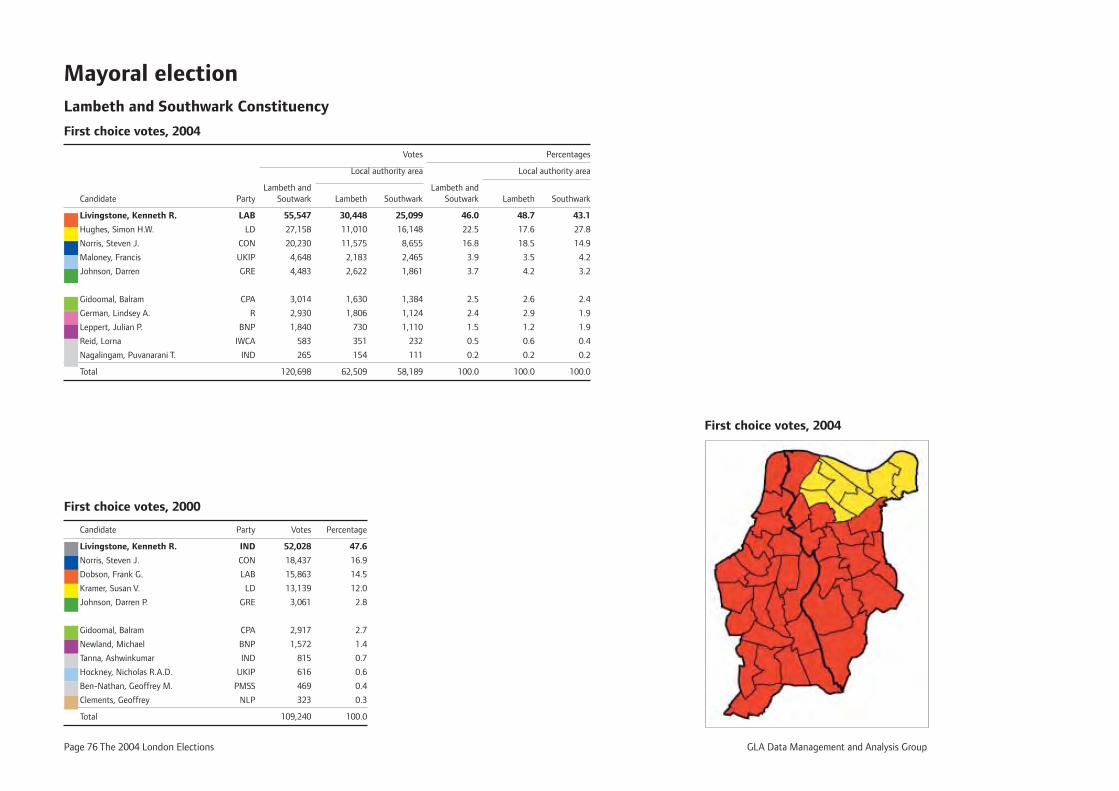
Page 76 The 2004 London Elections GLA Data Management and Analysis Group
Mayoral election Lambeth and Southwark Constituency
First choice votes, 2004
Votes Percentages
Local authority area Local authority area
Lambeth and Lambeth and Candidate Party Soutwark Lambeth Southwark Soutwark Lambeth Southwark
Livingstone, Kenneth R. LAB 55,547 30,448 25,099 46.0 48.7 43.1
Hughes, Simon H.W. LD 27,158 11,010 16,148 22.5 17.6 27.8
Norris, Steven J. CON 20,230 11,575 8,655 16.8 18.5 14.9
Maloney, Francis UKIP 4,648 2,183 2,465 3.9 3.5 4.2
Johnson, Darren GRE 4,483 2,622 1,861 3.7 4.2 3.2
Gidoomal, Balram CPA 3,014 1,630 1,384 2.5 2.6 2.4
German, Lindsey A. R 2,930 1,806 1,124 2.4 2.9 1.9
Leppert, Julian P. BNP 1,840 730 1,110 1.5 1.2 1.9
Reid, Lorna IWCA 583 351 232 0.5 0.6 0.4
Nagalingam, Puvanarani T. IND 265 154 111 0.2 0.2 0.2
Total 120,698 62,509 58,189 100.0 100.0 100.0
First choice votes, 2000
Candidate Party Votes Percentage
Livingstone, Kenneth R. IND 52,028 47.6
Norris, Steven J. CON 18,437 16.9
Dobson, Frank G. LAB 15,863 14.5
Kramer, Susan V. LD 13,139 12.0
Johnson, Darren P. GRE 3,061 2.8
Gidoomal, Balram CPA 2,917 2.7
Newland, Michael BNP 1,572 1.4
Tanna, Ashwinkumar IND 815 0.7
Hockney, Nicholas R.A.D. UKIP 616 0.6
Ben-Nathan, Geoffrey M. PMSS 469 0.4
Clements, Geoffrey NLP 323 0.3
Total 109,240 100.0
First choice votes, 2004
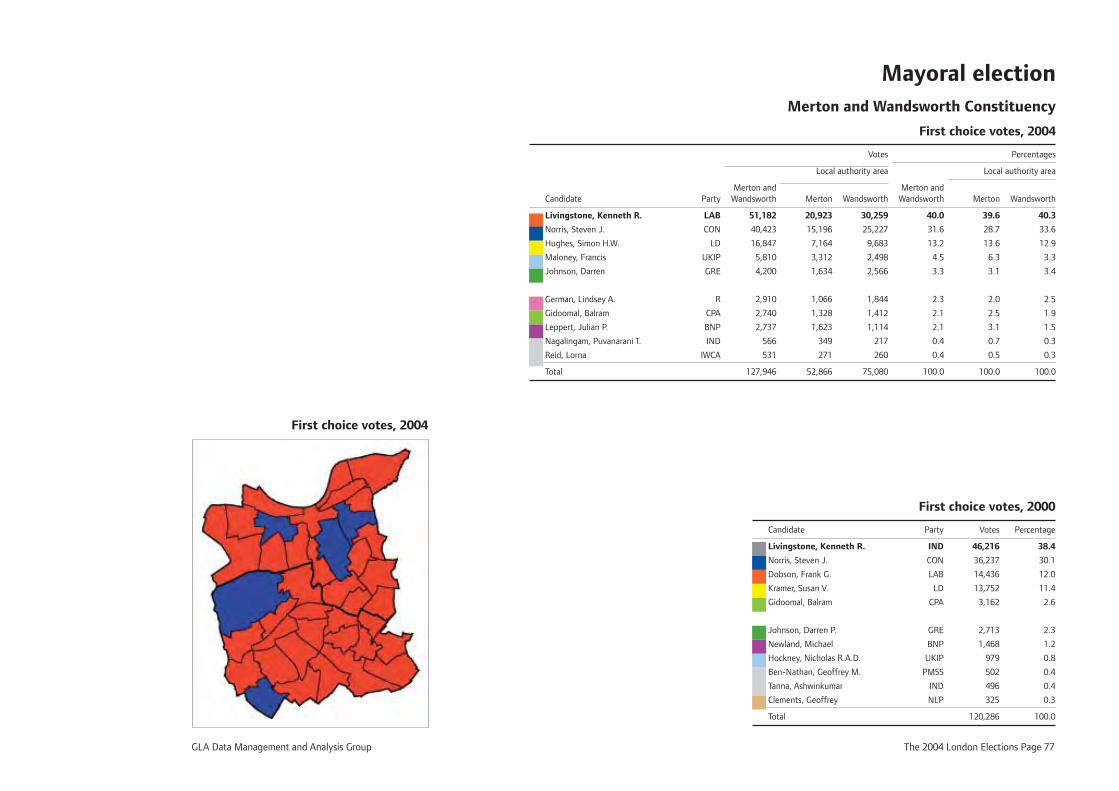
GLA Data Management and Analysis Group The 2004 London Elections Page 77
Mayoral election Merton and Wandsworth Constituency
First choice votes, 2004
Votes Percentages
Local authority area Local authority area
Merton and Merton and Candidate Party Wandsworth Merton Wandsworth Wandsworth Merton Wandsworth
Livingstone, Kenneth R. LAB 51,182 20,923 30,259 40.0 39.6 40.3
Norris, Steven J. CON 40,423 15,196 25,227 31.6 28.7 33.6
Hughes, Simon H.W. LD 16,847 7,164 9,683 13.2 13.6 12.9
Maloney, Francis UKIP 5,810 3,312 2,498 4.5 6.3 3.3
Johnson, Darren GRE 4,200 1,634 2,566 3.3 3.1 3.4
German, Lindsey A. R 2,910 1,066 1,844 2.3 2.0 2.5
Gidoomal, Balram CPA 2,740 1,328 1,412 2.1 2.5 1.9
Leppert, Julian P. BNP 2,737 1,623 1,114 2.1 3.1 1.5
Nagalingam, Puvanarani T. IND 566 349 217 0.4 0.7 0.3
Reid, Lorna IWCA 531 271 260 0.4 0.5 0.3
Total 127,946 52,866 75,080 100.0 100.0 100.0
First choice votes, 2000
Candidate Party Votes Percentage
Livingstone, Kenneth R. IND 46,216 38.4
Norris, Steven J. CON 36,237 30.1
Dobson, Frank G. LAB 14,436 12.0
Kramer, Susan V. LD 13,752 11.4
Gidoomal, Balram CPA 3,162 2.6
Johnson, Darren P. GRE 2,713 2.3
Newland, Michael BNP 1,468 1.2
Hockney, Nicholas R.A.D. UKIP 979 0.8
Ben-Nathan, Geoffrey M. PMSS 502 0.4
Tanna, Ashwinkumar IND 496 0.4
Clements, Geoffrey NLP 325 0.3
Total 120,286 100.0
First choice votes, 2004
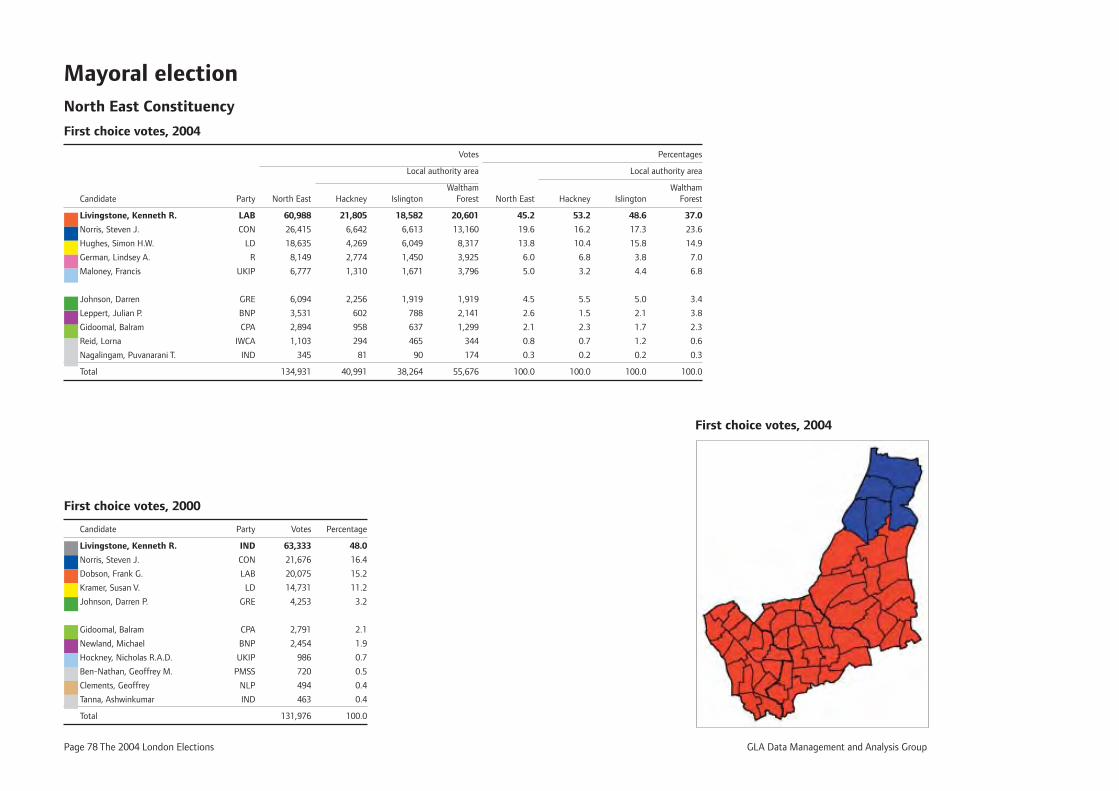
Page 78 The 2004 London Elections GLA Data Management and Analysis Group
Mayoral electionNorth East Constituency
First choice votes, 2004
Votes Percentages
Local authority area Local authority area
Waltham Waltham Candidate Party North East Hackney Islington Forest North East Hackney Islington Forest
Livingstone, Kenneth R. LAB 60,988 21,805 18,582 20,601 45.2 53.2 48.6 37.0
Norris, Steven J. CON 26,415 6,642 6,613 13,160 19.6 16.2 17.3 23.6
Hughes, Simon H.W. LD 18,635 4,269 6,049 8,317 13.8 10.4 15.8 14.9
German, Lindsey A. R 8,149 2,774 1,450 3,925 6.0 6.8 3.8 7.0
Maloney, Francis UKIP 6,777 1,310 1,671 3,796 5.0 3.2 4.4 6.8
Johnson, Darren GRE 6,094 2,256 1,919 1,919 4.5 5.5 5.0 3.4
Leppert, Julian P. BNP 3,531 602 788 2,141 2.6 1.5 2.1 3.8
Gidoomal, Balram CPA 2,894 958 637 1,299 2.1 2.3 1.7 2.3
Reid, Lorna IWCA 1,103 294 465 344 0.8 0.7 1.2 0.6
Nagalingam, Puvanarani T. IND 345 81 90 174 0.3 0.2 0.2 0.3
Total 134,931 40,991 38,264 55,676 100.0 100.0 100.0 100.0
First choice votes, 2000
Candidate Party Votes Percentage
Livingstone, Kenneth R. IND 63,333 48.0
Norris, Steven J. CON 21,676 16.4
Dobson, Frank G. LAB 20,075 15.2
Kramer, Susan V. LD 14,731 11.2
Johnson, Darren P. GRE 4,253 3.2
Gidoomal, Balram CPA 2,791 2.1
Newland, Michael BNP 2,454 1.9
Hockney, Nicholas R.A.D. UKIP 986 0.7
Ben-Nathan, Geoffrey M. PMSS 720 0.5
Clements, Geoffrey NLP 494 0.4
Tanna, Ashwinkumar IND 463 0.4
Total 131,976 100.0
First choice votes, 2004
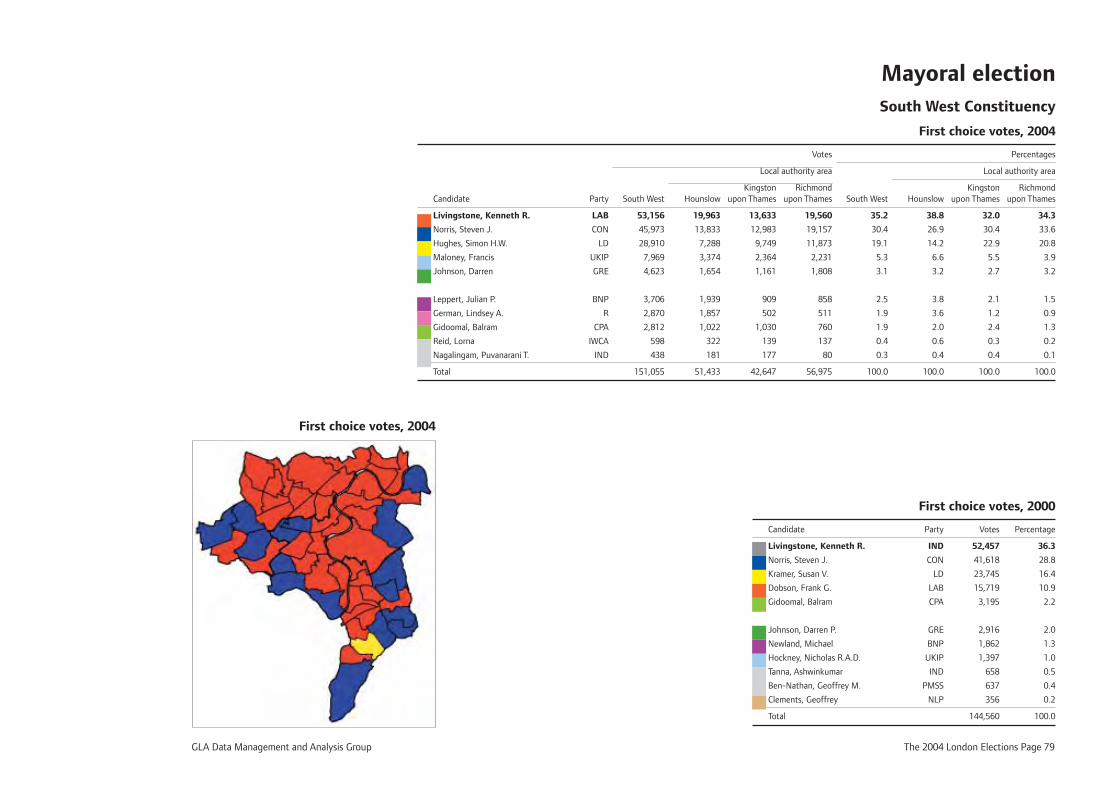
GLA Data Management and Analysis Group The 2004 London Elections Page 79
Mayoral election South West Constituency
First choice votes, 2004
Votes Percentages
Local authority area Local authority area
Kingston Richmond Kingston Richmond Candidate Party South West Hounslow upon Thames upon Thames South West Hounslow upon Thames upon Thames
Livingstone, Kenneth R. LAB 53,156 19,963 13,633 19,560 35.2 38.8 32.0 34.3
Norris, Steven J. CON 45,973 13,833 12,983 19,157 30.4 26.9 30.4 33.6
Hughes, Simon H.W. LD 28,910 7,288 9,749 11,873 19.1 14.2 22.9 20.8
Maloney, Francis UKIP 7,969 3,374 2,364 2,231 5.3 6.6 5.5 3.9
Johnson, Darren GRE 4,623 1,654 1,161 1,808 3.1 3.2 2.7 3.2
Leppert, Julian P. BNP 3,706 1,939 909 858 2.5 3.8 2.1 1.5
German, Lindsey A. R 2,870 1,857 502 511 1.9 3.6 1.2 0.9
Gidoomal, Balram CPA 2,812 1,022 1,030 760 1.9 2.0 2.4 1.3
Reid, Lorna IWCA 598 322 139 137 0.4 0.6 0.3 0.2
Nagalingam, Puvanarani T. IND 438 181 177 80 0.3 0.4 0.4 0.1
Total 151,055 51,433 42,647 56,975 100.0 100.0 100.0 100.0
First choice votes, 2000
Candidate Party Votes Percentage
Livingstone, Kenneth R. IND 52,457 36.3
Norris, Steven J. CON 41,618 28.8
Kramer, Susan V. LD 23,745 16.4
Dobson, Frank G. LAB 15,719 10.9
Gidoomal, Balram CPA 3,195 2.2
Johnson, Darren P. GRE 2,916 2.0
Newland, Michael BNP 1,862 1.3
Hockney, Nicholas R.A.D. UKIP 1,397 1.0
Tanna, Ashwinkumar IND 658 0.5
Ben-Nathan, Geoffrey M. PMSS 637 0.4
Clements, Geoffrey NLP 356 0.2
Total 144,560 100.0
First choice votes, 2004
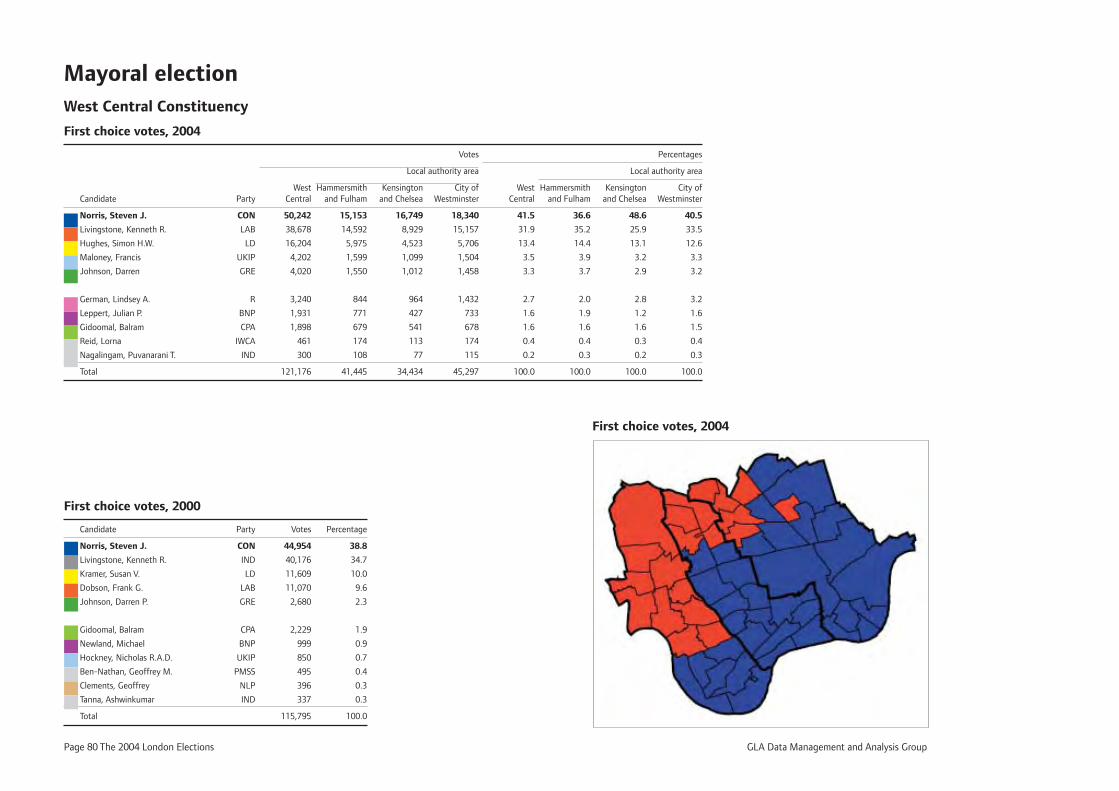
Page 80 The 2004 London Elections GLA Data Management and Analysis Group
Mayoral electionWest Central Constituency
First choice votes, 2004
Votes Percentages
Local authority area Local authority area
West Hammersmith Kensington City of West Hammersmith Kensington City of Candidate Party Central and Fulham and Chelsea Westminster Central and Fulham and Chelsea Westminster
Norris, Steven J. CON 50,242 15,153 16,749 18,340 41.5 36.6 48.6 40.5
Livingstone, Kenneth R. LAB 38,678 14,592 8,929 15,157 31.9 35.2 25.9 33.5
Hughes, Simon H.W. LD 16,204 5,975 4,523 5,706 13.4 14.4 13.1 12.6
Maloney, Francis UKIP 4,202 1,599 1,099 1,504 3.5 3.9 3.2 3.3
Johnson, Darren GRE 4,020 1,550 1,012 1,458 3.3 3.7 2.9 3.2
German, Lindsey A. R 3,240 844 964 1,432 2.7 2.0 2.8 3.2
Leppert, Julian P. BNP 1,931 771 427 733 1.6 1.9 1.2 1.6
Gidoomal, Balram CPA 1,898 679 541 678 1.6 1.6 1.6 1.5
Reid, Lorna IWCA 461 174 113 174 0.4 0.4 0.3 0.4
Nagalingam, Puvanarani T. IND 300 108 77 115 0.2 0.3 0.2 0.3
Total 121,176 41,445 34,434 45,297 100.0 100.0 100.0 100.0
First choice votes, 2000
Candidate Party Votes Percentage
Norris, Steven J. CON 44,954 38.8
Livingstone, Kenneth R. IND 40,176 34.7
Kramer, Susan V. LD 11,609 10.0
Dobson, Frank G. LAB 11,070 9.6
Johnson, Darren P. GRE 2,680 2.3
Gidoomal, Balram CPA 2,229 1.9
Newland, Michael BNP 999 0.9
Hockney, Nicholas R.A.D. UKIP 850 0.7
Ben-Nathan, Geoffrey M. PMSS 495 0.4
Clements, Geoffrey NLP 396 0.3
Tanna, Ashwinkumar IND 337 0.3
Total 115,795 100.0
First choice votes, 2004
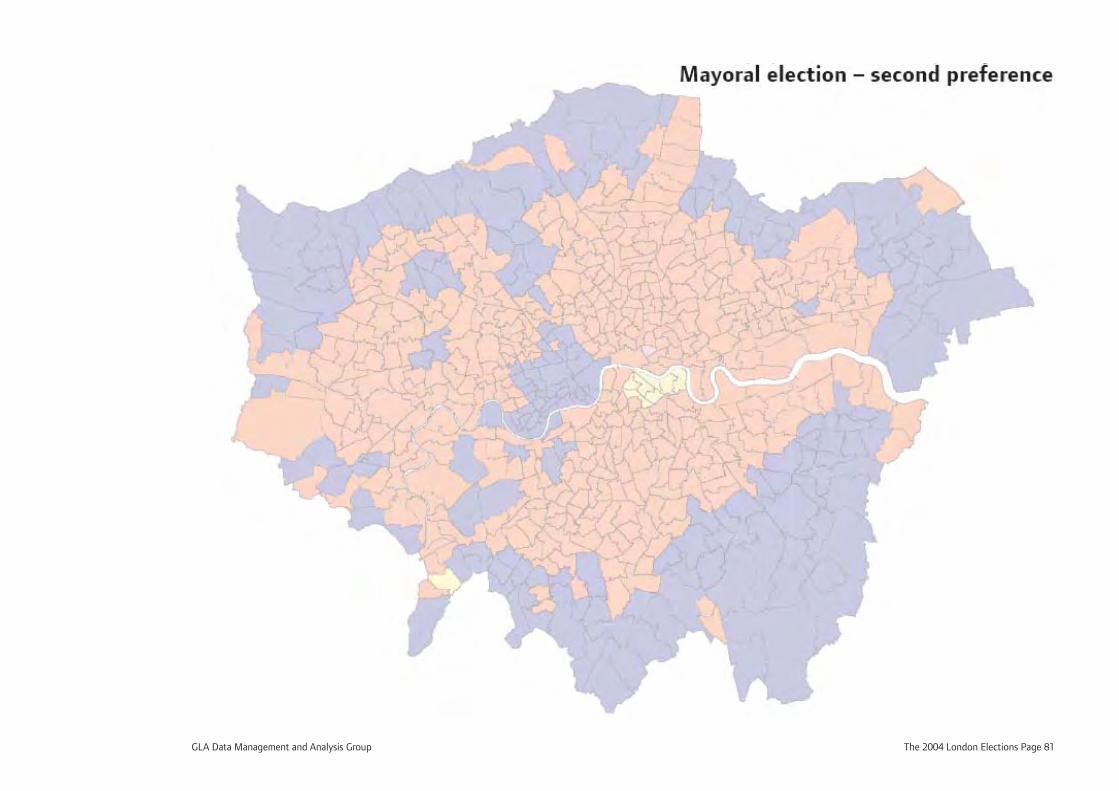
GLA Data Management and Analysis Group The 2004 London Elections Page 81
Mayoral election – second preference
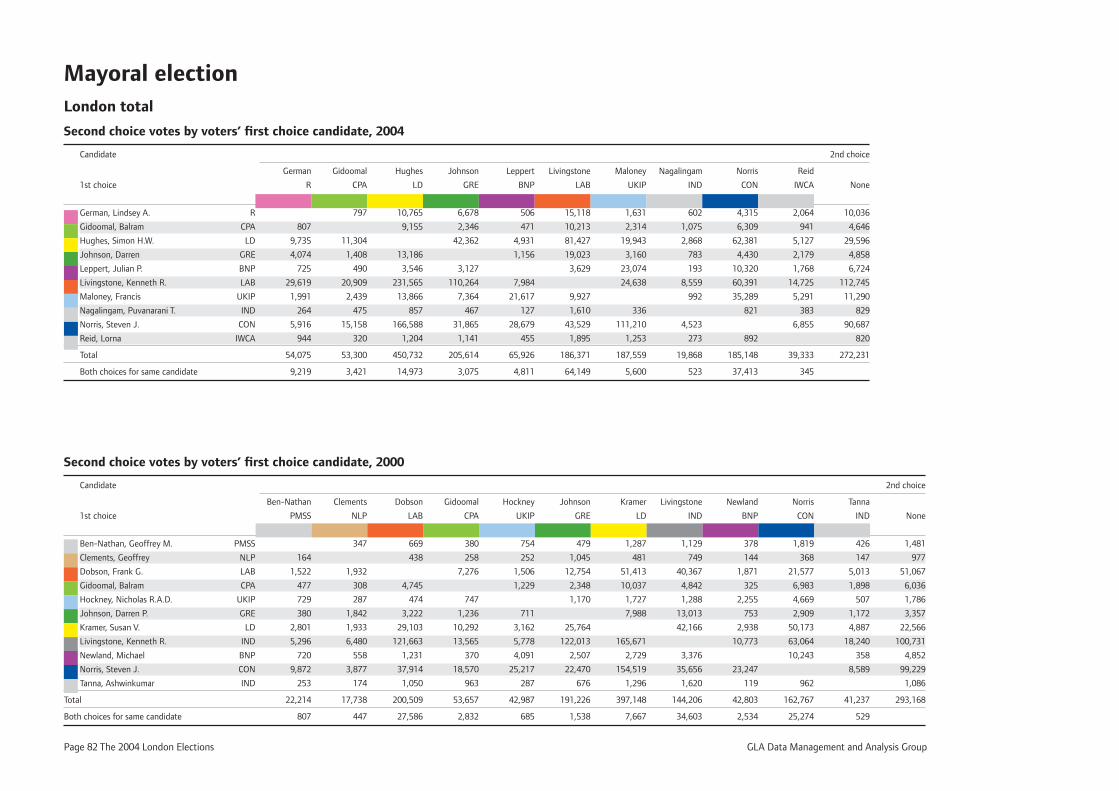
Page 82 The 2004 London Elections GLA Data Management and Analysis Group
Mayoral electionLondon total
Second choice votes by voters’ fi rst choice candidate, 2004
Candidate 2nd choice
German Gidoomal Hughes Johnson Leppert Livingstone Maloney Nagalingam Norris Reid
1st choice R CPA LD GRE BNP LAB UKIP IND CON IWCA None
German, Lindsey A. R 797 10,765 6,678 506 15,118 1,631 602 4,315 2,064 10,036
Gidoomal, Balram CPA 807 9,155 2,346 471 10,213 2,314 1,075 6,309 941 4,646
Hughes, Simon H.W. LD 9,735 11,304 42,362 4,931 81,427 19,943 2,868 62,381 5,127 29,596
Johnson, Darren GRE 4,074 1,408 13,186 1,156 19,023 3,160 783 4,430 2,179 4,858
Leppert, Julian P. BNP 725 490 3,546 3,127 3,629 23,074 193 10,320 1,768 6,724
Livingstone, Kenneth R. LAB 29,619 20,909 231,565 110,264 7,984 24,638 8,559 60,391 14,725 112,745
Maloney, Francis UKIP 1,991 2,439 13,866 7,364 21,617 9,927 992 35,289 5,291 11,290
Nagalingam, Puvanarani T. IND 264 475 857 467 127 1,610 336 821 383 829
Norris, Steven J. CON 5,916 15,158 166,588 31,865 28,679 43,529 111,210 4,523 6,855 90,687
Reid, Lorna IWCA 944 320 1,204 1,141 455 1,895 1,253 273 892 820
Total 54,075 53,300 450,732 205,614 65,926 186,371 187,559 19,868 185,148 39,333 272,231
Both choices for same candidate 9,219 3,421 14,973 3,075 4,811 64,149 5,600 523 37,413 345
Second choice votes by voters’ fi rst choice candidate, 2000
Candidate 2nd choice
Ben-Nathan Clements Dobson Gidoomal Hockney Johnson Kramer Livingstone Newland Norris Tanna
1st choice PMSS NLP LAB CPA UKIP GRE LD IND BNP CON IND None
Ben-Nathan, Geoffrey M. PMSS 347 669 380 754 479 1,287 1,129 378 1,819 426 1,481
Clements, Geoffrey NLP 164 438 258 252 1,045 481 749 144 368 147 977
Dobson, Frank G. LAB 1,522 1,932 7,276 1,506 12,754 51,413 40,367 1,871 21,577 5,013 51,067
Gidoomal, Balram CPA 477 308 4,745 1,229 2,348 10,037 4,842 325 6,983 1,898 6,036
Hockney, Nicholas R.A.D. UKIP 729 287 474 747 1,170 1,727 1,288 2,255 4,669 507 1,786
Johnson, Darren P. GRE 380 1,842 3,222 1,236 711 7,988 13,013 753 2,909 1,172 3,357
Kramer, Susan V. LD 2,801 1,933 29,103 10,292 3,162 25,764 42,166 2,938 50,173 4,887 22,566
Livingstone, Kenneth R. IND 5,296 6,480 121,663 13,565 5,778 122,013 165,671 10,773 63,064 18,240 100,731
Newland, Michael BNP 720 558 1,231 370 4,091 2,507 2,729 3,376 10,243 358 4,852
Norris, Steven J. CON 9,872 3,877 37,914 18,570 25,217 22,470 154,519 35,656 23,247 8,589 99,229
Tanna, Ashwinkumar IND 253 174 1,050 963 287 676 1,296 1,620 119 962 1,086
Total 22,214 17,738 200,509 53,657 42,987 191,226 397,148 144,206 42,803 162,767 41,237 293,168
Both choices for same candidate 807 447 27,586 2,832 685 1,538 7,667 34,603 2,534 25,274 529
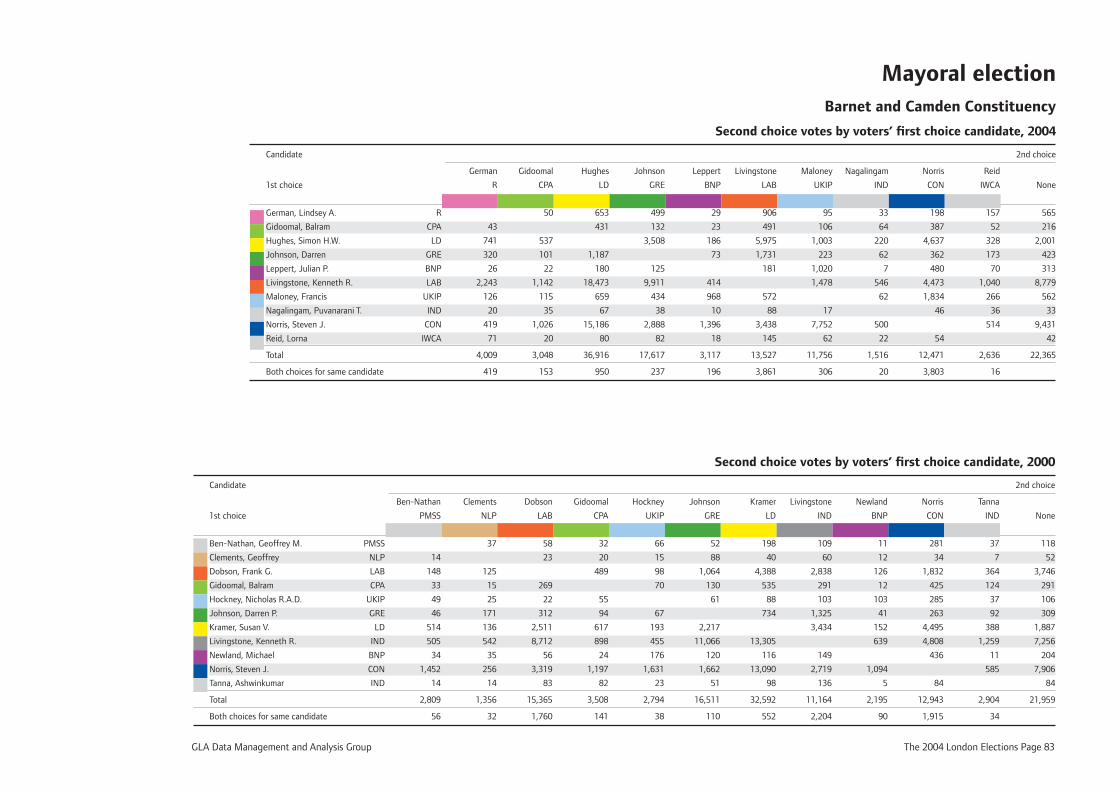
GLA Data Management and Analysis Group The 2004 London Elections Page 83
Second choice votes by voters’ fi rst choice candidate, 2000
Candidate 2nd choice
Ben-Nathan Clements Dobson Gidoomal Hockney Johnson Kramer Livingstone Newland Norris Tanna
1st choice PMSS NLP LAB CPA UKIP GRE LD IND BNP CON IND None
Ben-Nathan, Geoffrey M. PMSS 37 58 32 66 52 198 109 11 281 37 118
Clements, Geoffrey NLP 14 23 20 15 88 40 60 12 34 7 52
Dobson, Frank G. LAB 148 125 489 98 1,064 4,388 2,838 126 1,832 364 3,746
Gidoomal, Balram CPA 33 15 269 70 130 535 291 12 425 124 291
Hockney, Nicholas R.A.D. UKIP 49 25 22 55 61 88 103 103 285 37 106
Johnson, Darren P. GRE 46 171 312 94 67 734 1,325 41 263 92 309
Kramer, Susan V. LD 514 136 2,511 617 193 2,217 3,434 152 4,495 388 1,887
Livingstone, Kenneth R. IND 505 542 8,712 898 455 11,066 13,305 639 4,808 1,259 7,256
Newland, Michael BNP 34 35 56 24 176 120 116 149 436 11 204
Norris, Steven J. CON 1,452 256 3,319 1,197 1,631 1,662 13,090 2,719 1,094 585 7,906
Tanna, Ashwinkumar IND 14 14 83 82 23 51 98 136 5 84 84
Total 2,809 1,356 15,365 3,508 2,794 16,511 32,592 11,164 2,195 12,943 2,904 21,959
Both choices for same candidate 56 32 1,760 141 38 110 552 2,204 90 1,915 34
Mayoral election Barnet and Camden Constituency
Second choice votes by voters’ fi rst choice candidate, 2004
Candidate 2nd choice
German Gidoomal Hughes Johnson Leppert Livingstone Maloney Nagalingam Norris Reid
1st choice R CPA LD GRE BNP LAB UKIP IND CON IWCA None
German, Lindsey A. R 50 653 499 29 906 95 33 198 157 565
Gidoomal, Balram CPA 43 431 132 23 491 106 64 387 52 216
Hughes, Simon H.W. LD 741 537 3,508 186 5,975 1,003 220 4,637 328 2,001
Johnson, Darren GRE 320 101 1,187 73 1,731 223 62 362 173 423
Leppert, Julian P. BNP 26 22 180 125 181 1,020 7 480 70 313
Livingstone, Kenneth R. LAB 2,243 1,142 18,473 9,911 414 1,478 546 4,473 1,040 8,779
Maloney, Francis UKIP 126 115 659 434 968 572 62 1,834 266 562
Nagalingam, Puvanarani T. IND 20 35 67 38 10 88 17 46 36 33
Norris, Steven J. CON 419 1,026 15,186 2,888 1,396 3,438 7,752 500 514 9,431
Reid, Lorna IWCA 71 20 80 82 18 145 62 22 54 42
Total 4,009 3,048 36,916 17,617 3,117 13,527 11,756 1,516 12,471 2,636 22,365
Both choices for same candidate 419 153 950 237 196 3,861 306 20 3,803 16

Page 84 The 2004 London Elections GLA Data Management and Analysis Group
Mayoral electionBexley and Bromley Constituency
Second choice votes by voters’ fi rst choice candidate, 2004
Candidate 2nd choice
German Gidoomal Hughes Johnson Leppert Livingstone Maloney Nagalingam Norris Reid
1st choice R CPA LD GRE BNP LAB UKIP IND CON IWCA None
German, Lindsey A. R 30 195 138 22 225 72 17 49 72 94
Gidoomal, Balram CPA 42 961 183 36 559 250 68 630 70 263
Hughes, Simon H.W. LD 362 1,488 3,579 656 7,229 3,263 247 7,150 434 2,912
Johnson, Darren GRE 138 110 850 105 844 313 46 378 120 246
Leppert, Julian P. BNP 70 28 408 341 368 2,931 17 1,275 173 760
Livingstone, Kenneth R. LAB 767 1,164 16,734 5,460 692 2,593 424 3,801 835 6,086
Maloney, Francis UKIP 206 299 2,244 1,008 3,146 1,240 140 5,696 620 1,732
Nagalingam, Puvanarani T. IND 10 21 50 28 3 54 40 53 20 38
Norris, Steven J. CON 257 1,503 17,553 2,816 3,850 3,403 15,783 382 561 10,038
Reid, Lorna IWCA 47 20 93 82 36 83 110 15 50 53
Total 1,899 4,663 39,088 13,635 8,546 14,005 25,355 1,356 19,082 2,905 22,222
Both choices for same candidate 51 138 912 112 488 2,427 659 10 3,375 22
Second choice votes by voters’ fi rst choice candidate, 2000
Candidate 2nd choice
Ben-Nathan Clements Dobson Gidoomal Hockney Johnson Kramer Livingstone Newland Norris Tanna
1st choice PMSS NLP LAB CPA UKIP GRE LD IND BNP CON IND None
Ben-Nathan, Geoffrey M. PMSS 25 29 26 77 36 108 84 55 184 47 61
Clements, Geoffrey NLP 12 13 20 16 76 32 35 5 25 11 30
Dobson, Frank G. LAB 69 86 366 100 844 3,952 2,050 150 1,536 174 1,947
Gidoomal, Balram CPA 34 25 296 154 230 1,099 301 19 770 159 455
Hockney, Nicholas R.A.D. UKIP 84 25 32 100 167 250 129 320 707 64 203
Johnson, Darren P. GRE 26 162 197 121 83 628 678 84 274 113 221
Kramer, Susan V. LD 212 182 2,723 1,251 445 2,529 3,764 347 5,701 587 2,205
Livingstone, Kenneth R. IND 365 374 6,922 797 542 6,251 12,099 997 5,153 1,076 5,449
Newland, Michael BNP 94 57 118 29 491 281 311 349 1,264 46 515
Norris, Steven J. CON 910 427 3,833 2,174 3,579 2,786 19,418 3,794 3,355 1,077 12,990
Tanna, Ashwinkumar IND 27 11 34 73 38 49 130 97 7 88 51
Total 1,833 1,374 14,197 4,957 5,525 13,249 38,027 11,281 5,339 15,702 3,354 24,127
Both choices for same candidate 14 11 701 136 68 86 664 1,654 230 2,850 12

GLA Data Management and Analysis Group The 2004 London Elections Page 85
Second choice votes by voters’ fi rst choice candidate, 2000
Candidate 2nd choice
Ben-Nathan Clements Dobson Gidoomal Hockney Johnson Kramer Livingstone Newland Norris Tanna
1st choice PMSS NLP LAB CPA UKIP GRE LD IND BNP CON IND None
Ben-Nathan, Geoffrey M. PMSS 21 50 30 52 38 164 97 21 154 45 175
Clements, Geoffrey NLP 19 36 20 22 71 35 52 10 22 14 88
Dobson, Frank G. LAB 147 137 551 91 719 3,152 2,785 107 1,476 661 3,395
Gidoomal, Balram CPA 48 26 340 58 127 579 427 21 393 224 401
Hockney, Nicholas R.A.D. UKIP 44 11 26 34 59 109 59 92 210 20 90
Johnson, Darren P. GRE 25 90 160 63 38 360 572 41 126 69 170
Kramer, Susan V. LD 374 95 1,543 546 142 1,141 2,220 125 2,611 338 1,250
Livingstone, Kenneth R. IND 495 440 8,722 1,298 287 6,586 10,652 522 4,352 1,943 8,458
Newland, Michael BNP 40 32 48 24 168 109 112 145 393 18 190
Norris, Steven J. CON 916 201 2,187 949 1,036 965 8,024 1,984 994 576 6,056
Tanna, Ashwinkumar IND 32 14 202 190 17 49 119 217 6 98 162
Total 2,140 1,067 13,314 3,705 1,911 9,864 23,306 8,558 1,939 9,835 3,908 20,435
Both choices for same candidate 58 35 2,058 197 34 95 412 3,289 83 1,405 94
Mayoral election Brent and Harrow Constituency
Second choice votes by voters’ fi rst choice candidate, 2004
Candidate 2nd choice
German Gidoomal Hughes Johnson Leppert Livingstone Maloney Nagalingam Norris Reid
1st choice R CPA LD GRE BNP LAB UKIP IND CON IWCA None
German, Lindsey A. R 71 680 416 25 789 83 48 202 108 472
Gidoomal, Balram CPA 80 596 153 34 844 123 127 485 70 463
Hughes, Simon H.W. LD 695 683 2,294 249 5,034 976 262 4,009 299 2,457
Johnson, Darren GRE 227 96 731 58 942 172 75 257 116 379
Leppert, Julian P. BNP 46 44 135 113 166 739 11 408 56 294
Livingstone, Kenneth R. LAB 1,741 1,848 14,904 5,626 448 1,592 1,124 5,459 907 9,471
Maloney, Francis UKIP 109 136 607 345 711 498 47 1,539 226 551
Nagalingam, Puvanarani T. IND 20 49 108 39 16 263 24 106 35 103
Norris, Steven J. CON 350 1,141 11,446 1,899 1,188 3,796 5,739 357 472 7,777
Reid, Lorna IWCA 58 25 77 70 21 128 72 17 75 55
Total 3,326 4,093 29,284 10,955 2,750 12,460 9,520 2,068 12,540 2,289 22,022
Both choices for same candidate 405 247 1,230 203 164 5,322 252 73 2,782 24
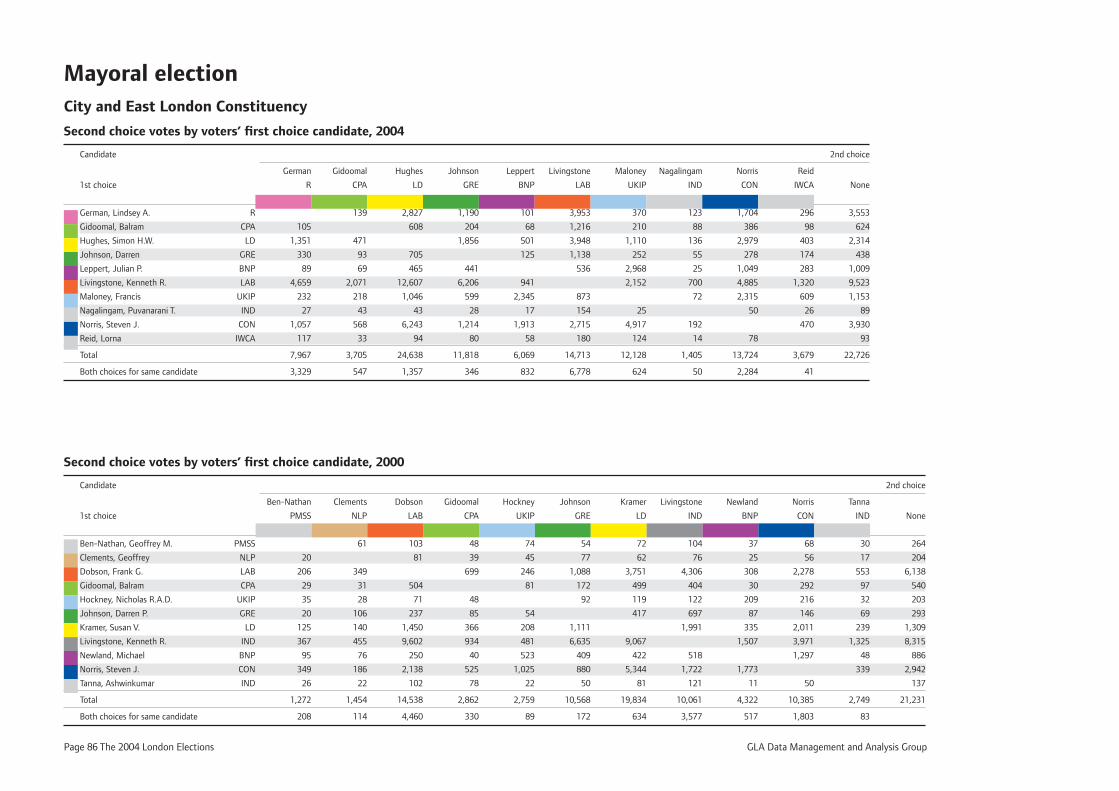
Page 86 The 2004 London Elections GLA Data Management and Analysis Group
Mayoral electionCity and East London Constituency
Second choice votes by voters’ fi rst choice candidate, 2004
Candidate 2nd choice
German Gidoomal Hughes Johnson Leppert Livingstone Maloney Nagalingam Norris Reid
1st choice R CPA LD GRE BNP LAB UKIP IND CON IWCA None
German, Lindsey A. R 139 2,827 1,190 101 3,953 370 123 1,704 296 3,553
Gidoomal, Balram CPA 105 608 204 68 1,216 210 88 386 98 624
Hughes, Simon H.W. LD 1,351 471 1,856 501 3,948 1,110 136 2,979 403 2,314
Johnson, Darren GRE 330 93 705 125 1,138 252 55 278 174 438
Leppert, Julian P. BNP 89 69 465 441 536 2,968 25 1,049 283 1,009
Livingstone, Kenneth R. LAB 4,659 2,071 12,607 6,206 941 2,152 700 4,885 1,320 9,523
Maloney, Francis UKIP 232 218 1,046 599 2,345 873 72 2,315 609 1,153
Nagalingam, Puvanarani T. IND 27 43 43 28 17 154 25 50 26 89
Norris, Steven J. CON 1,057 568 6,243 1,214 1,913 2,715 4,917 192 470 3,930
Reid, Lorna IWCA 117 33 94 80 58 180 124 14 78 93
Total 7,967 3,705 24,638 11,818 6,069 14,713 12,128 1,405 13,724 3,679 22,726
Both choices for same candidate 3,329 547 1,357 346 832 6,778 624 50 2,284 41
Second choice votes by voters’ fi rst choice candidate, 2000
Candidate 2nd choice
Ben-Nathan Clements Dobson Gidoomal Hockney Johnson Kramer Livingstone Newland Norris Tanna
1st choice PMSS NLP LAB CPA UKIP GRE LD IND BNP CON IND None
Ben-Nathan, Geoffrey M. PMSS 61 103 48 74 54 72 104 37 68 30 264
Clements, Geoffrey NLP 20 81 39 45 77 62 76 25 56 17 204
Dobson, Frank G. LAB 206 349 699 246 1,088 3,751 4,306 308 2,278 553 6,138
Gidoomal, Balram CPA 29 31 504 81 172 499 404 30 292 97 540
Hockney, Nicholas R.A.D. UKIP 35 28 71 48 92 119 122 209 216 32 203
Johnson, Darren P. GRE 20 106 237 85 54 417 697 87 146 69 293
Kramer, Susan V. LD 125 140 1,450 366 208 1,111 1,991 335 2,011 239 1,309
Livingstone, Kenneth R. IND 367 455 9,602 934 481 6,635 9,067 1,507 3,971 1,325 8,315
Newland, Michael BNP 95 76 250 40 523 409 422 518 1,297 48 886
Norris, Steven J. CON 349 186 2,138 525 1,025 880 5,344 1,722 1,773 339 2,942
Tanna, Ashwinkumar IND 26 22 102 78 22 50 81 121 11 50 137
Total 1,272 1,454 14,538 2,862 2,759 10,568 19,834 10,061 4,322 10,385 2,749 21,231
Both choices for same candidate 208 114 4,460 330 89 172 634 3,577 517 1,803 83

GLA Data Management and Analysis Group The 2004 London Elections Page 87
Second choice votes by voters’ fi rst choice candidate, 2000
Candidate 2nd choice
Ben-Nathan Clements Dobson Gidoomal Hockney Johnson Kramer Livingstone Newland Norris Tanna
1st choice PMSS NLP LAB CPA UKIP GRE LD IND BNP CON IND None
Ben-Nathan, Geoffrey M. PMSS 13 26 39 69 30 83 76 23 146 39 70
Clements, Geoffrey NLP 12 25 19 14 79 17 44 15 18 6 51
Dobson, Frank G. LAB 59 79 523 87 684 3,500 2,329 115 1,261 294 2,255
Gidoomal, Balram CPA 47 26 416 165 249 1,370 498 43 941 210 706
Hockney, Nicholas R.A.D. UKIP 84 21 36 92 118 160 111 198 502 53 149
Johnson, Darren P. GRE 33 122 162 112 55 514 608 67 211 97 137
Kramer, Susan V. LD 198 149 2,421 1,386 291 2,076 3,725 244 4,527 425 2,195
Livingstone, Kenneth R. IND 425 384 7,102 1,321 484 5,818 12,005 698 4,879 1,182 5,525
Newland, Michael BNP 45 41 77 31 368 165 200 246 761 24 287
Norris, Steven J. CON 763 334 2,659 2,057 2,619 1,972 13,775 3,174 2,128 786 9,318
Tanna, Ashwinkumar IND 26 19 86 77 32 48 100 129 11 79 76
Total 1,692 1,188 13,010 5,657 4,184 11,239 31,724 10,940 3,542 13,325 3,116 20,769
Both choices for same candidate 33 9 1,213 254 54 83 694 1,995 144 2,209 33
Mayoral election Croydon and Sutton Constituency
Second choice votes by voters’ fi rst choice candidate, 2004
Candidate 2nd choice
German Gidoomal Hughes Johnson Leppert Livingstone Maloney Nagalingam Norris Reid
1st choice R CPA LD GRE BNP LAB UKIP IND CON IWCA None
German, Lindsey A. R 43 401 240 21 464 74 31 119 82 240
Gidoomal, Balram CPA 55 1,184 211 40 903 279 107 714 68 361
Hughes, Simon H.W. LD 533 1,431 3,200 506 6,813 1,959 244 5,567 404 2,421
Johnson, Darren GRE 178 113 763 71 973 273 37 304 110 244
Leppert, Julian P. BNP 46 41 269 218 255 1,796 10 835 106 443
Livingstone, Kenneth R. LAB 1,204 1,669 16,452 5,404 605 1,933 680 4,284 899 6,023
Maloney, Francis UKIP 154 251 1,337 687 1,967 875 76 3,529 455 841
Nagalingam, Puvanarani T. IND 18 37 78 40 9 141 25 71 26 58
Norris, Steven J. CON 301 1,591 13,810 2,447 2,590 3,500 10,323 340 596 7,724
Reid, Lorna IWCA 58 22 67 64 25 99 78 16 64 32
Total 2,547 5,198 34,361 12,511 5,834 14,023 16,740 1,541 15,487 2,746 18,387
Both choices for same candidate 222 275 1,067 129 350 3,567 461 42 2,795 11
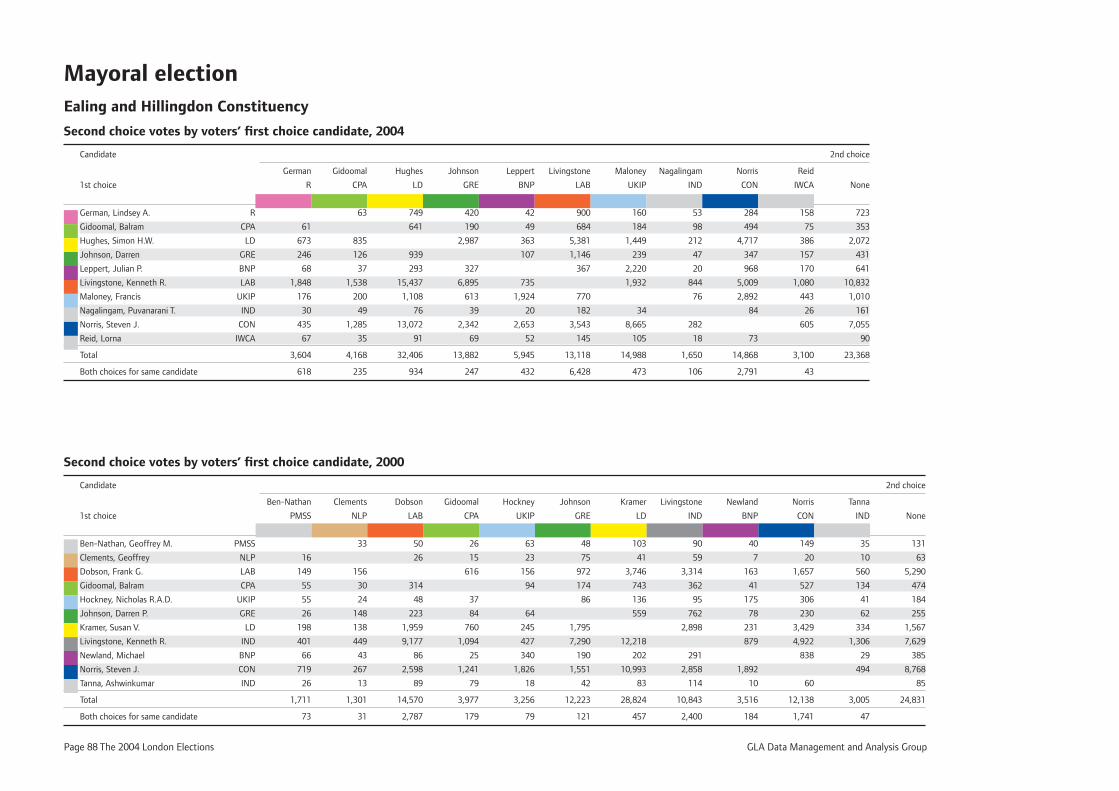
Page 88 The 2004 London Elections GLA Data Management and Analysis Group
Mayoral electionEaling and Hillingdon Constituency
Second choice votes by voters’ fi rst choice candidate, 2004
Candidate 2nd choice
German Gidoomal Hughes Johnson Leppert Livingstone Maloney Nagalingam Norris Reid
1st choice R CPA LD GRE BNP LAB UKIP IND CON IWCA None
German, Lindsey A. R 63 749 420 42 900 160 53 284 158 723
Gidoomal, Balram CPA 61 641 190 49 684 184 98 494 75 353
Hughes, Simon H.W. LD 673 835 2,987 363 5,381 1,449 212 4,717 386 2,072
Johnson, Darren GRE 246 126 939 107 1,146 239 47 347 157 431
Leppert, Julian P. BNP 68 37 293 327 367 2,220 20 968 170 641
Livingstone, Kenneth R. LAB 1,848 1,538 15,437 6,895 735 1,932 844 5,009 1,080 10,832
Maloney, Francis UKIP 176 200 1,108 613 1,924 770 76 2,892 443 1,010
Nagalingam, Puvanarani T. IND 30 49 76 39 20 182 34 84 26 161
Norris, Steven J. CON 435 1,285 13,072 2,342 2,653 3,543 8,665 282 605 7,055
Reid, Lorna IWCA 67 35 91 69 52 145 105 18 73 90
Total 3,604 4,168 32,406 13,882 5,945 13,118 14,988 1,650 14,868 3,100 23,368
Both choices for same candidate 618 235 934 247 432 6,428 473 106 2,791 43
Second choice votes by voters’ fi rst choice candidate, 2000
Candidate 2nd choice
Ben-Nathan Clements Dobson Gidoomal Hockney Johnson Kramer Livingstone Newland Norris Tanna
1st choice PMSS NLP LAB CPA UKIP GRE LD IND BNP CON IND None
Ben-Nathan, Geoffrey M. PMSS 33 50 26 63 48 103 90 40 149 35 131
Clements, Geoffrey NLP 16 26 15 23 75 41 59 7 20 10 63
Dobson, Frank G. LAB 149 156 616 156 972 3,746 3,314 163 1,657 560 5,290
Gidoomal, Balram CPA 55 30 314 94 174 743 362 41 527 134 474
Hockney, Nicholas R.A.D. UKIP 55 24 48 37 86 136 95 175 306 41 184
Johnson, Darren P. GRE 26 148 223 84 64 559 762 78 230 62 255
Kramer, Susan V. LD 198 138 1,959 760 245 1,795 2,898 231 3,429 334 1,567
Livingstone, Kenneth R. IND 401 449 9,177 1,094 427 7,290 12,218 879 4,922 1,306 7,629
Newland, Michael BNP 66 43 86 25 340 190 202 291 838 29 385
Norris, Steven J. CON 719 267 2,598 1,241 1,826 1,551 10,993 2,858 1,892 494 8,768
Tanna, Ashwinkumar IND 26 13 89 79 18 42 83 114 10 60 85
Total 1,711 1,301 14,570 3,977 3,256 12,223 28,824 10,843 3,516 12,138 3,005 24,831
Both choices for same candidate 73 31 2,787 179 79 121 457 2,400 184 1,741 47
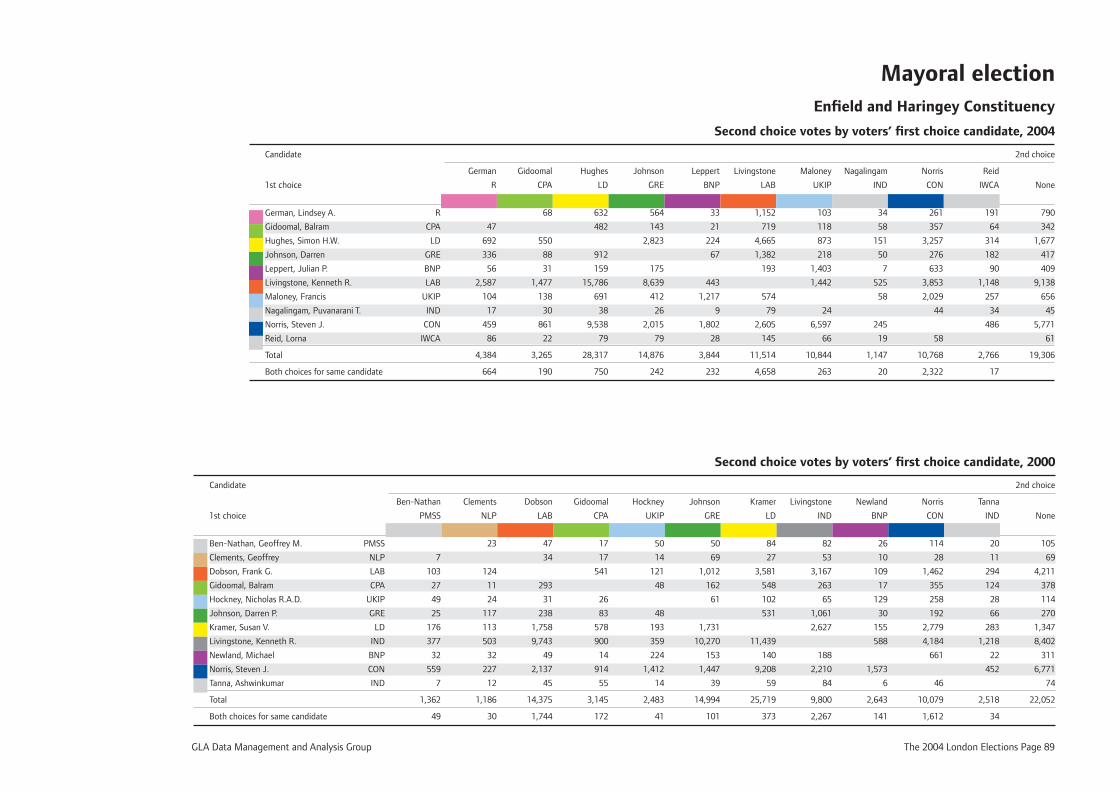
GLA Data Management and Analysis Group The 2004 London Elections Page 89
Second choice votes by voters’ fi rst choice candidate, 2000
Candidate 2nd choice
Ben-Nathan Clements Dobson Gidoomal Hockney Johnson Kramer Livingstone Newland Norris Tanna
1st choice PMSS NLP LAB CPA UKIP GRE LD IND BNP CON IND None
Ben-Nathan, Geoffrey M. PMSS 23 47 17 50 50 84 82 26 114 20 105
Clements, Geoffrey NLP 7 34 17 14 69 27 53 10 28 11 69
Dobson, Frank G. LAB 103 124 541 121 1,012 3,581 3,167 109 1,462 294 4,211
Gidoomal, Balram CPA 27 11 293 48 162 548 263 17 355 124 378
Hockney, Nicholas R.A.D. UKIP 49 24 31 26 61 102 65 129 258 28 114
Johnson, Darren P. GRE 25 117 238 83 48 531 1,061 30 192 66 270
Kramer, Susan V. LD 176 113 1,758 578 193 1,731 2,627 155 2,779 283 1,347
Livingstone, Kenneth R. IND 377 503 9,743 900 359 10,270 11,439 588 4,184 1,218 8,402
Newland, Michael BNP 32 32 49 14 224 153 140 188 661 22 311
Norris, Steven J. CON 559 227 2,137 914 1,412 1,447 9,208 2,210 1,573 452 6,771
Tanna, Ashwinkumar IND 7 12 45 55 14 39 59 84 6 46 74
Total 1,362 1,186 14,375 3,145 2,483 14,994 25,719 9,800 2,643 10,079 2,518 22,052
Both choices for same candidate 49 30 1,744 172 41 101 373 2,267 141 1,612 34
Mayoral election Enfi eld and Haringey Constituency
Second choice votes by voters’ fi rst choice candidate, 2004
Candidate 2nd choice
German Gidoomal Hughes Johnson Leppert Livingstone Maloney Nagalingam Norris Reid
1st choice R CPA LD GRE BNP LAB UKIP IND CON IWCA None
German, Lindsey A. R 68 632 564 33 1,152 103 34 261 191 790
Gidoomal, Balram CPA 47 482 143 21 719 118 58 357 64 342
Hughes, Simon H.W. LD 692 550 2,823 224 4,665 873 151 3,257 314 1,677
Johnson, Darren GRE 336 88 912 67 1,382 218 50 276 182 417
Leppert, Julian P. BNP 56 31 159 175 193 1,403 7 633 90 409
Livingstone, Kenneth R. LAB 2,587 1,477 15,786 8,639 443 1,442 525 3,853 1,148 9,138
Maloney, Francis UKIP 104 138 691 412 1,217 574 58 2,029 257 656
Nagalingam, Puvanarani T. IND 17 30 38 26 9 79 24 44 34 45
Norris, Steven J. CON 459 861 9,538 2,015 1,802 2,605 6,597 245 486 5,771
Reid, Lorna IWCA 86 22 79 79 28 145 66 19 58 61
Total 4,384 3,265 28,317 14,876 3,844 11,514 10,844 1,147 10,768 2,766 19,306
Both choices for same candidate 664 190 750 242 232 4,658 263 20 2,322 17

Page 90 The 2004 London Elections GLA Data Management and Analysis Group
Mayoral electionGreenwich and Lewisham Constituency
Second choice votes by voters’ fi rst choice candidate, 2004
Candidate 2nd choice
German Gidoomal Hughes Johnson Leppert Livingstone Maloney Nagalingam Norris Reid
1st choice R CPA LD GRE BNP LAB UKIP IND CON IWCA None
German, Lindsey A. R 37 340 347 36 649 83 38 91 116 215
Gidoomal, Balram CPA 60 662 167 24 911 125 91 298 74 346
Hughes, Simon H.W. LD 472 772 3,068 380 5,407 1,650 195 3,670 348 1,631
Johnson, Darren GRE 333 86 980 80 1,502 251 78 246 183 321
Leppert, Julian P. BNP 57 31 290 263 303 1,923 20 643 141 522
Livingstone, Kenneth R. LAB 1,679 1,652 16,131 8,609 601 1,950 660 3,235 1,018 7,717
Maloney, Francis UKIP 147 167 1,195 586 1,726 792 98 2,264 418 891
Nagalingam, Puvanarani T. IND 21 37 58 43 9 112 26 54 30 48
Norris, Steven J. CON 242 562 7,118 1,222 1,539 1,831 5,336 213 291 2,838
Reid, Lorna IWCA 63 12 79 89 38 132 96 33 64 55
Total 3,074 3,356 26,853 14,394 4,433 11,639 11,440 1,426 10,565 2,619 14,584
Both choices for same candidate 178 309 744 225 398 4,598 423 42 1,253 26
Second choice votes by voters’ fi rst choice candidate, 2000
Candidate 2nd choice
Ben-Nathan Clements Dobson Gidoomal Hockney Johnson Kramer Livingstone Newland Norris Tanna
1st choice PMSS NLP LAB CPA UKIP GRE LD IND BNP CON IND None
Ben-Nathan, Geoffrey M. PMSS 14 40 23 44 24 60 79 22 89 21 71
Clements, Geoffrey NLP 8 34 15 14 62 19 44 7 14 12 47
Dobson, Frank G. LAB 90 141 561 80 1,046 3,573 2,850 132 1,383 335 3,219
Gidoomal, Balram CPA 34 24 423 70 154 612 337 11 274 125 380
Hockney, Nicholas R.A.D. UKIP 30 15 27 43 60 110 87 131 263 36 92
Johnson, Darren P. GRE 25 128 238 68 42 563 960 48 165 94 239
Kramer, Susan V. LD 101 107 1,631 516 184 1,525 2,410 209 2,472 332 1,031
Livingstone, Kenneth R. IND 349 470 9,292 824 372 9,996 10,936 850 3,698 1,471 6,744
Newland, Michael BNP 62 44 112 31 312 195 200 276 729 36 332
Norris, Steven J. CON 349 166 1,793 757 1,104 1,108 6,902 1,746 1,331 448 3,062
Tanna, Ashwinkumar IND 14 9 61 43 25 56 102 104 13 61 58
Total 1,062 1,118 13,651 2,881 2,247 14,226 23,077 8,893 2,754 9,148 2,910 15,275
Both choices for same candidate 44 26 1,714 224 38 109 362 2,520 233 1,056 24

GLA Data Management and Analysis Group The 2004 London Elections Page 91
Second choice votes by voters’ fi rst choice candidate, 2000
Candidate 2nd choice
Ben-Nathan Clements Dobson Gidoomal Hockney Johnson Kramer Livingstone Newland Norris Tanna
1st choice PMSS NLP LAB CPA UKIP GRE LD IND BNP CON IND None
Ben-Nathan, Geoffrey M. PMSS 26 27 17 46 27 107 63 40 113 39 77
Clements, Geoffrey NLP 8 21 10 13 54 36 29 17 31 6 48
Dobson, Frank G. LAB 108 119 448 91 793 3,542 2,650 177 1,495 368 3,305
Gidoomal, Balram CPA 27 20 263 109 174 773 264 34 433 133 426
Hockney, Nicholas R.A.D. UKIP 81 30 49 60 115 180 119 288 445 51 155
Johnson, Darren P. GRE 38 114 143 84 68 381 481 76 142 61 152
Kramer, Susan V. LD 200 135 1,853 665 264 1,322 2,412 271 3,469 299 1,414
Livingstone, Kenneth R. IND 356 313 7,641 809 475 5,275 10,053 1,143 4,405 1,096 6,045
Newland, Michael BNP 93 64 140 44 465 274 303 395 1,320 33 543
Norris, Steven J. CON 711 337 2,703 1,250 2,271 1,786 12,055 2,748 2,912 620 8,701
Tanna, Ashwinkumar IND 12 7 62 64 17 39 68 100 9 56 57
Total 1,634 1,165 12,902 3,451 3,819 9,859 27,498 9,261 4,967 11,909 2,706 20,923
Both choices for same candidate 36 14 1,453 128 46 75 415 1,666 264 1,994 20
Mayoral election Havering and Redbridge Constituency
Second choice votes by voters’ fi rst choice candidate, 2004
Candidate 2nd choice
German Gidoomal Hughes Johnson Leppert Livingstone Maloney Nagalingam Norris Reid
1st choice R CPA LD GRE BNP LAB UKIP IND CON IWCA None
German, Lindsey A. R 36 609 339 33 813 95 36 267 122 562
Gidoomal, Balram CPA 47 639 161 37 600 215 72 474 48 309
Hughes, Simon H.W. LD 473 705 2,016 364 4,008 1,569 166 3,731 356 1,431
Johnson, Darren GRE 173 87 653 113 758 260 39 296 110 255
Leppert, Julian P. BNP 67 56 375 356 435 2,982 23 1,428 240 822
Livingstone, Kenneth R. LAB 1,517 1,204 12,696 5,124 871 2,321 571 4,260 1,008 6,535
Maloney, Francis UKIP 154 235 1,308 782 2,660 1,059 84 4,007 635 1,317
Nagalingam, Puvanarani T. IND 13 36 60 32 10 116 22 64 17 55
Norris, Steven J. CON 391 1,056 13,069 2,480 3,780 3,483 11,494 287 733 7,160
Reid, Lorna IWCA 56 14 127 92 57 117 134 21 108 80
Total 2,891 3,429 29,536 11,382 7,925 11,389 19,092 1,299 14,635 3,269 18,526
Both choices for same candidate 538 195 675 142 566 3,419 594 30 2,992 32

Page 92 The 2004 London Elections GLA Data Management and Analysis Group
Mayoral electionLambeth and Southwark Constituency
Second choice votes by voters’ fi rst choice candidate, 2004
Candidate 2nd choice
German Gidoomal Hughes Johnson Leppert Livingstone Maloney Nagalingam Norris Reid
1st choice R CPA LD GRE BNP LAB UKIP IND CON IWCA None
German, Lindsey A. R 42 535 415 22 913 65 29 92 118 313
Gidoomal, Balram CPA 64 710 131 17 835 129 53 320 69 334
Hughes, Simon H.W. LD 918 1,048 3,737 432 8,383 1,812 232 4,767 434 3,114
Johnson, Darren GRE 382 95 1,061 47 1,790 149 59 204 143 299
Leppert, Julian P. BNP 23 17 208 95 105 680 6 289 51 208
Livingstone, Kenneth R. LAB 2,142 1,764 20,262 10,172 370 1,226 408 3,161 1,071 8,675
Maloney, Francis UKIP 111 95 792 236 774 454 48 1,243 192 431
Nagalingam, Puvanarani T. IND 19 18 50 22 1 49 18 30 21 23
Norris, Steven J. CON 210 563 7,743 1,211 854 1,762 3,792 182 209 2,415
Reid, Lorna IWCA 66 26 85 88 17 119 61 20 40 41
Total 3,935 3,668 31,446 16,107 2,534 14,410 7,932 1,037 10,146 2,308 15,853
Both choices for same candidate 386 352 2,281 254 158 6,296 272 14 1,289 20
Second choice votes by voters’ fi rst choice candidate, 2000
Candidate 2nd choice
Ben-Nathan Clements Dobson Gidoomal Hockney Johnson Kramer Livingstone Newland Norris Tanna
1st choice PMSS NLP LAB CPA UKIP GRE LD IND BNP CON IND None
Ben-Nathan, Geoffrey M. PMSS 19 49 16 31 23 58 59 15 69 21 63
Clements, Geoffrey NLP 8 36 14 7 62 31 51 7 20 6 54
Dobson, Frank G. LAB 79 99 648 67 834 3,687 2,873 109 1,301 318 3,702
Gidoomal, Balram CPA 25 19 460 51 137 623 396 14 346 124 418
Hockney, Nicholas R.A.D. UKIP 38 13 18 28 37 64 49 92 163 33 55
Johnson, Darren P. GRE 18 104 245 83 14 617 1,356 33 177 124 201
Kramer, Susan V. LD 131 120 2,024 562 168 1,692 3,041 185 2,736 409 1,424
Livingstone, Kenneth R. IND 284 530 9,132 941 296 11,966 12,724 535 3,406 1,879 7,261
Newland, Michael BNP 41 31 62 19 169 119 148 144 448 33 205
Norris, Steven J. CON 339 135 1,828 757 878 928 6,749 1,552 896 671 2,821
Tanna, Ashwinkumar IND 19 19 73 44 16 87 149 174 11 102 85
Total 982 1,089 13,927 3,112 1,697 15,885 24,850 9,695 1,897 8,768 3,618 16,289
Both choices for same candidate 46 27 2,146 304 26 89 647 3,074 153 883 36
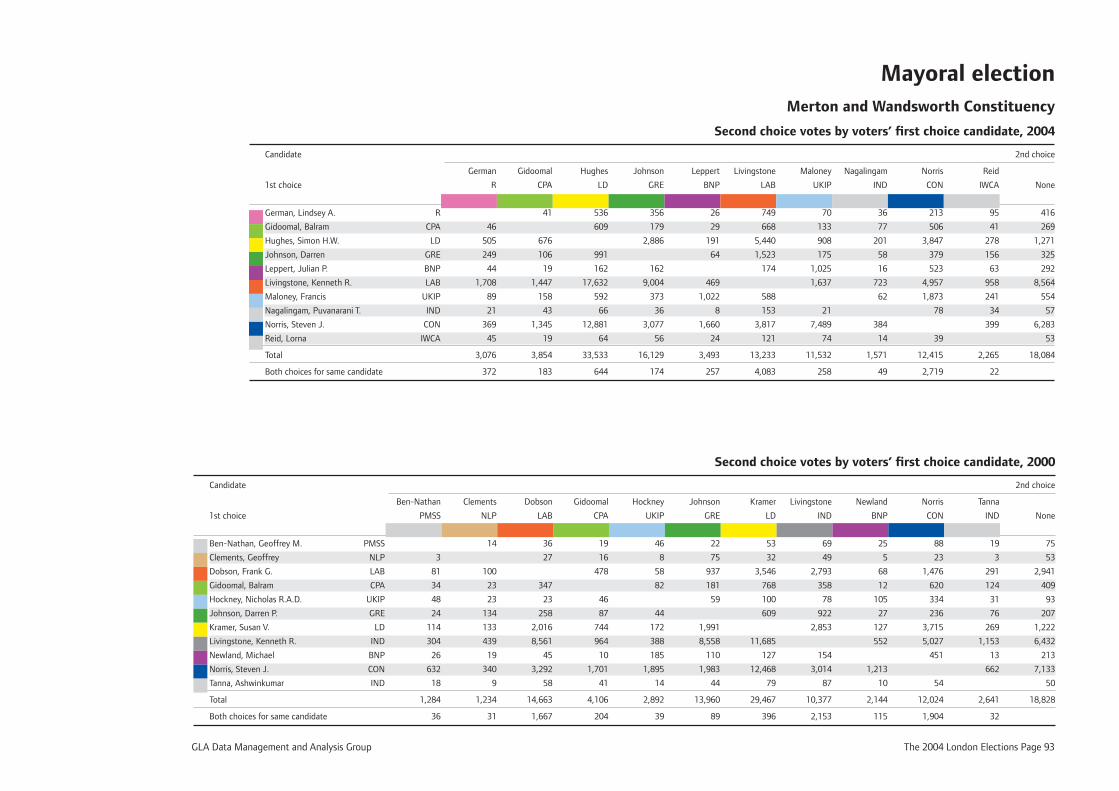
GLA Data Management and Analysis Group The 2004 London Elections Page 93
Second choice votes by voters’ fi rst choice candidate, 2000
Candidate 2nd choice
Ben-Nathan Clements Dobson Gidoomal Hockney Johnson Kramer Livingstone Newland Norris Tanna
1st choice PMSS NLP LAB CPA UKIP GRE LD IND BNP CON IND None
Ben-Nathan, Geoffrey M. PMSS 14 36 19 46 22 53 69 25 88 19 75
Clements, Geoffrey NLP 3 27 16 8 75 32 49 5 23 3 53
Dobson, Frank G. LAB 81 100 478 58 937 3,546 2,793 68 1,476 291 2,941
Gidoomal, Balram CPA 34 23 347 82 181 768 358 12 620 124 409
Hockney, Nicholas R.A.D. UKIP 48 23 23 46 59 100 78 105 334 31 93
Johnson, Darren P. GRE 24 134 258 87 44 609 922 27 236 76 207
Kramer, Susan V. LD 114 133 2,016 744 172 1,991 2,853 127 3,715 269 1,222
Livingstone, Kenneth R. IND 304 439 8,561 964 388 8,558 11,685 552 5,027 1,153 6,432
Newland, Michael BNP 26 19 45 10 185 110 127 154 451 13 213
Norris, Steven J. CON 632 340 3,292 1,701 1,895 1,983 12,468 3,014 1,213 662 7,133
Tanna, Ashwinkumar IND 18 9 58 41 14 44 79 87 10 54 50
Total 1,284 1,234 14,663 4,106 2,892 13,960 29,467 10,377 2,144 12,024 2,641 18,828
Both choices for same candidate 36 31 1,667 204 39 89 396 2,153 115 1,904 32
Mayoral election Merton and Wandsworth Constituency
Second choice votes by voters’ fi rst choice candidate, 2004
Candidate 2nd choice
German Gidoomal Hughes Johnson Leppert Livingstone Maloney Nagalingam Norris Reid
1st choice R CPA LD GRE BNP LAB UKIP IND CON IWCA None
German, Lindsey A. R 41 536 356 26 749 70 36 213 95 416
Gidoomal, Balram CPA 46 609 179 29 668 133 77 506 41 269
Hughes, Simon H.W. LD 505 676 2,886 191 5,440 908 201 3,847 278 1,271
Johnson, Darren GRE 249 106 991 64 1,523 175 58 379 156 325
Leppert, Julian P. BNP 44 19 162 162 174 1,025 16 523 63 292
Livingstone, Kenneth R. LAB 1,708 1,447 17,632 9,004 469 1,637 723 4,957 958 8,564
Maloney, Francis UKIP 89 158 592 373 1,022 588 62 1,873 241 554
Nagalingam, Puvanarani T. IND 21 43 66 36 8 153 21 78 34 57
Norris, Steven J. CON 369 1,345 12,881 3,077 1,660 3,817 7,489 384 399 6,283
Reid, Lorna IWCA 45 19 64 56 24 121 74 14 39 53
Total 3,076 3,854 33,533 16,129 3,493 13,233 11,532 1,571 12,415 2,265 18,084
Both choices for same candidate 372 183 644 174 257 4,083 258 49 2,719 22
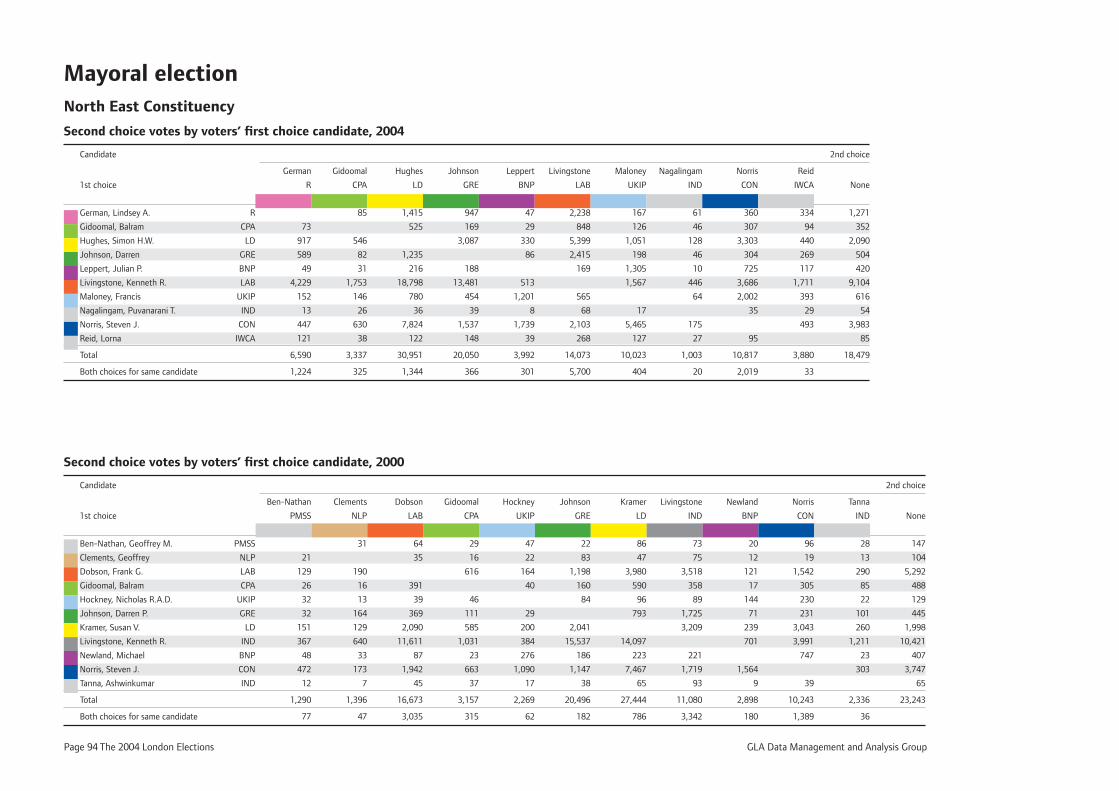
Page 94 The 2004 London Elections GLA Data Management and Analysis Group
Mayoral electionNorth East Constituency
Second choice votes by voters’ fi rst choice candidate, 2004
Candidate 2nd choice
German Gidoomal Hughes Johnson Leppert Livingstone Maloney Nagalingam Norris Reid
1st choice R CPA LD GRE BNP LAB UKIP IND CON IWCA None
German, Lindsey A. R 85 1,415 947 47 2,238 167 61 360 334 1,271
Gidoomal, Balram CPA 73 525 169 29 848 126 46 307 94 352
Hughes, Simon H.W. LD 917 546 3,087 330 5,399 1,051 128 3,303 440 2,090
Johnson, Darren GRE 589 82 1,235 86 2,415 198 46 304 269 504
Leppert, Julian P. BNP 49 31 216 188 169 1,305 10 725 117 420
Livingstone, Kenneth R. LAB 4,229 1,753 18,798 13,481 513 1,567 446 3,686 1,711 9,104
Maloney, Francis UKIP 152 146 780 454 1,201 565 64 2,002 393 616
Nagalingam, Puvanarani T. IND 13 26 36 39 8 68 17 35 29 54
Norris, Steven J. CON 447 630 7,824 1,537 1,739 2,103 5,465 175 493 3,983
Reid, Lorna IWCA 121 38 122 148 39 268 127 27 95 85
Total 6,590 3,337 30,951 20,050 3,992 14,073 10,023 1,003 10,817 3,880 18,479
Both choices for same candidate 1,224 325 1,344 366 301 5,700 404 20 2,019 33
Second choice votes by voters’ fi rst choice candidate, 2000
Candidate 2nd choice
Ben-Nathan Clements Dobson Gidoomal Hockney Johnson Kramer Livingstone Newland Norris Tanna
1st choice PMSS NLP LAB CPA UKIP GRE LD IND BNP CON IND None
Ben-Nathan, Geoffrey M. PMSS 31 64 29 47 22 86 73 20 96 28 147
Clements, Geoffrey NLP 21 35 16 22 83 47 75 12 19 13 104
Dobson, Frank G. LAB 129 190 616 164 1,198 3,980 3,518 121 1,542 290 5,292
Gidoomal, Balram CPA 26 16 391 40 160 590 358 17 305 85 488
Hockney, Nicholas R.A.D. UKIP 32 13 39 46 84 96 89 144 230 22 129
Johnson, Darren P. GRE 32 164 369 111 29 793 1,725 71 231 101 445
Kramer, Susan V. LD 151 129 2,090 585 200 2,041 3,209 239 3,043 260 1,998
Livingstone, Kenneth R. IND 367 640 11,611 1,031 384 15,537 14,097 701 3,991 1,211 10,421
Newland, Michael BNP 48 33 87 23 276 186 223 221 747 23 407
Norris, Steven J. CON 472 173 1,942 663 1,090 1,147 7,467 1,719 1,564 303 3,747
Tanna, Ashwinkumar IND 12 7 45 37 17 38 65 93 9 39 65
Total 1,290 1,396 16,673 3,157 2,269 20,496 27,444 11,080 2,898 10,243 2,336 23,243
Both choices for same candidate 77 47 3,035 315 62 182 786 3,342 180 1,389 36
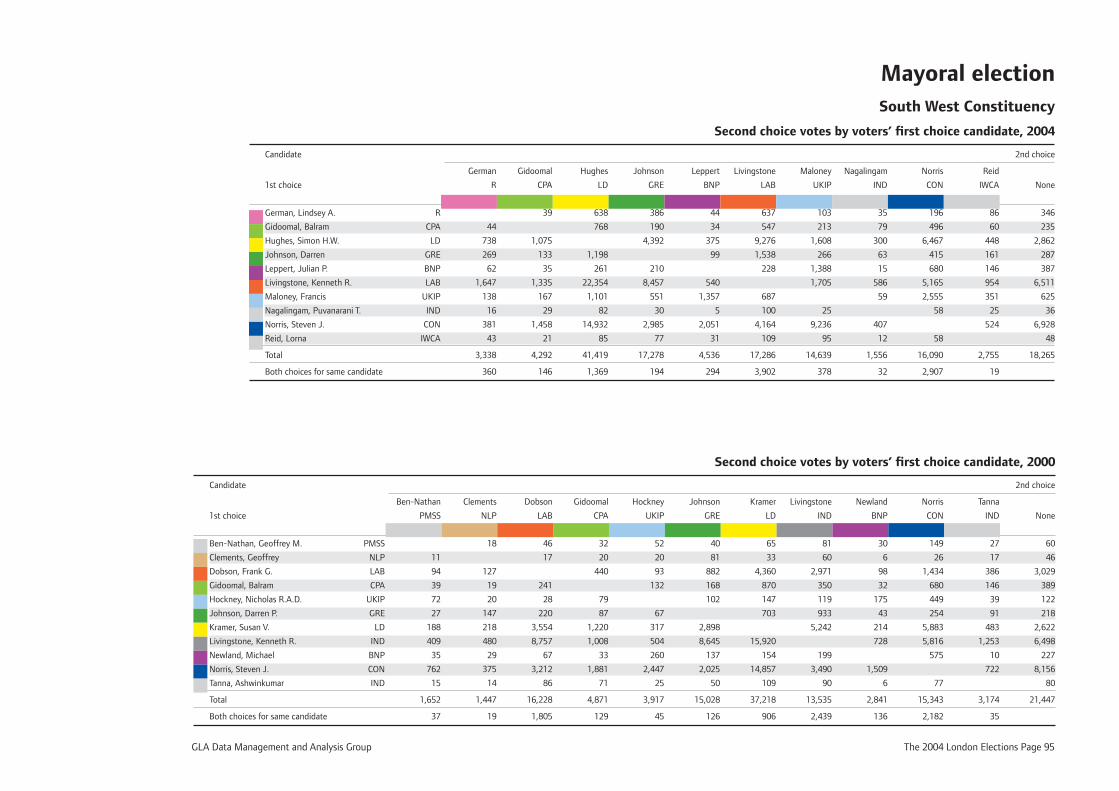
GLA Data Management and Analysis Group The 2004 London Elections Page 95
Second choice votes by voters’ fi rst choice candidate, 2000
Candidate 2nd choice
Ben-Nathan Clements Dobson Gidoomal Hockney Johnson Kramer Livingstone Newland Norris Tanna
1st choice PMSS NLP LAB CPA UKIP GRE LD IND BNP CON IND None
Ben-Nathan, Geoffrey M. PMSS 18 46 32 52 40 65 81 30 149 27 60
Clements, Geoffrey NLP 11 17 20 20 81 33 60 6 26 17 46
Dobson, Frank G. LAB 94 127 440 93 882 4,360 2,971 98 1,434 386 3,029
Gidoomal, Balram CPA 39 19 241 132 168 870 350 32 680 146 389
Hockney, Nicholas R.A.D. UKIP 72 20 28 79 102 147 119 175 449 39 122
Johnson, Darren P. GRE 27 147 220 87 67 703 933 43 254 91 218
Kramer, Susan V. LD 188 218 3,554 1,220 317 2,898 5,242 214 5,883 483 2,622
Livingstone, Kenneth R. IND 409 480 8,757 1,008 504 8,645 15,920 728 5,816 1,253 6,498
Newland, Michael BNP 35 29 67 33 260 137 154 199 575 10 227
Norris, Steven J. CON 762 375 3,212 1,881 2,447 2,025 14,857 3,490 1,509 722 8,156
Tanna, Ashwinkumar IND 15 14 86 71 25 50 109 90 6 77 80
Total 1,652 1,447 16,228 4,871 3,917 15,028 37,218 13,535 2,841 15,343 3,174 21,447
Both choices for same candidate 37 19 1,805 129 45 126 906 2,439 136 2,182 35
Mayoral election South West Constituency
Second choice votes by voters’ fi rst choice candidate, 2004
Candidate 2nd choice
German Gidoomal Hughes Johnson Leppert Livingstone Maloney Nagalingam Norris Reid
1st choice R CPA LD GRE BNP LAB UKIP IND CON IWCA None
German, Lindsey A. R 39 638 386 44 637 103 35 196 86 346
Gidoomal, Balram CPA 44 768 190 34 547 213 79 496 60 235
Hughes, Simon H.W. LD 738 1,075 4,392 375 9,276 1,608 300 6,467 448 2,862
Johnson, Darren GRE 269 133 1,198 99 1,538 266 63 415 161 287
Leppert, Julian P. BNP 62 35 261 210 228 1,388 15 680 146 387
Livingstone, Kenneth R. LAB 1,647 1,335 22,354 8,457 540 1,705 586 5,165 954 6,511
Maloney, Francis UKIP 138 167 1,101 551 1,357 687 59 2,555 351 625
Nagalingam, Puvanarani T. IND 16 29 82 30 5 100 25 58 25 36
Norris, Steven J. CON 381 1,458 14,932 2,985 2,051 4,164 9,236 407 524 6,928
Reid, Lorna IWCA 43 21 85 77 31 109 95 12 58 48
Total 3,338 4,292 41,419 17,278 4,536 17,286 14,639 1,556 16,090 2,755 18,265
Both choices for same candidate 360 146 1,369 194 294 3,902 378 32 2,907 19

Page 96 The 2004 London Elections GLA Data Management and Analysis Group
Mayoral electionWest Central Constituency
Second choice votes by voters’ fi rst choice candidate, 2004
Candidate 2nd choice
German Gidoomal Hughes Johnson Leppert Livingstone Maloney Nagalingam Norris Reid
1st choice R CPA LD GRE BNP LAB UKIP IND CON IWCA None
German, Lindsey A. R 53 555 421 25 730 91 28 279 129 476
Gidoomal, Balram CPA 40 339 133 30 388 103 47 455 58 179
Hughes, Simon H.W. LD 665 487 2,929 174 4,469 712 174 4,280 255 1,343
Johnson, Darren GRE 304 92 981 61 1,341 171 68 384 125 289
Leppert, Julian P. BNP 22 29 125 113 149 694 6 384 62 204
Livingstone, Kenneth R. LAB 1,648 845 13,299 7,276 342 1,110 322 4,163 776 5,787
Maloney, Francis UKIP 93 114 406 284 599 380 46 1,511 185 351
Nagalingam, Puvanarani T. IND 19 22 45 27 2 51 18 48 24 29
Norris, Steven J. CON 598 1,569 16,173 3,732 1,664 3,369 8,622 577 502 9,354
Reid, Lorna IWCA 46 13 61 65 11 104 49 25 36 32
Total 3,435 3,224 31,984 14,980 2,908 10,981 11,570 1,293 11,540 2,116 18,044
Both choices for same candidate 453 126 716 204 143 3,110 233 15 4,082 19
Second choice votes by voters’ fi rst choice candidate, 2000
Candidate 2nd choice
Ben-Nathan Clements Dobson Gidoomal Hockney Johnson Kramer Livingstone Newland Norris Tanna
1st choice PMSS NLP LAB CPA UKIP GRE LD IND BNP CON IND None
Ben-Nathan, Geoffrey M. PMSS 12 44 26 37 13 46 63 13 119 18 64
Clements, Geoffrey NLP 5 30 17 19 93 29 62 6 32 14 68
Dobson, Frank G. LAB 60 100 300 54 681 2,655 1,923 88 1,444 125 2,597
Gidoomal, Balram CPA 19 23 188 75 130 428 233 22 622 89 281
Hockney, Nicholas R.A.D. UKIP 28 15 24 53 69 66 63 94 301 20 91
Johnson, Darren P. GRE 15 135 220 74 38 579 933 27 262 57 240
Kramer, Susan V. LD 119 138 1,570 496 140 1,695 2,340 104 3,302 241 1,095
Livingstone, Kenneth R. IND 292 461 6,689 746 324 8,120 9,471 434 4,452 868 6,296
Newland, Michael BNP 9 22 34 23 134 59 71 101 323 12 147
Norris, Steven J. CON 939 453 4,273 2,504 2,404 2,230 14,169 2,926 1,013 854 10,858
Tanna, Ashwinkumar IND 5 4 24 29 9 34 54 74 5 68 22
Total 1,491 1,363 13,096 4,268 3,234 13,124 27,568 8,718 1,806 10,925 2,298 21,759
Both choices for same candidate 40 21 1,043 119 26 100 369 2,023 64 2,331 9
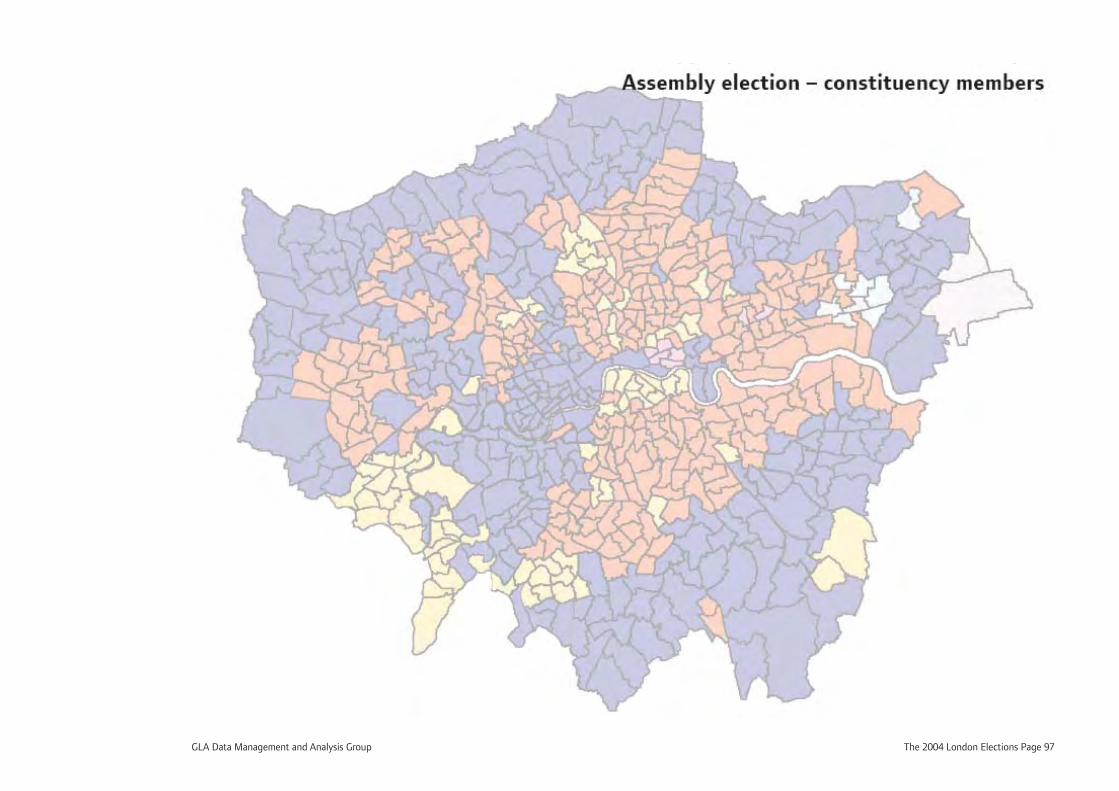
GLA Data Management and Analysis Group The 2004 London Elections Page 97
Assembly election – constituency members
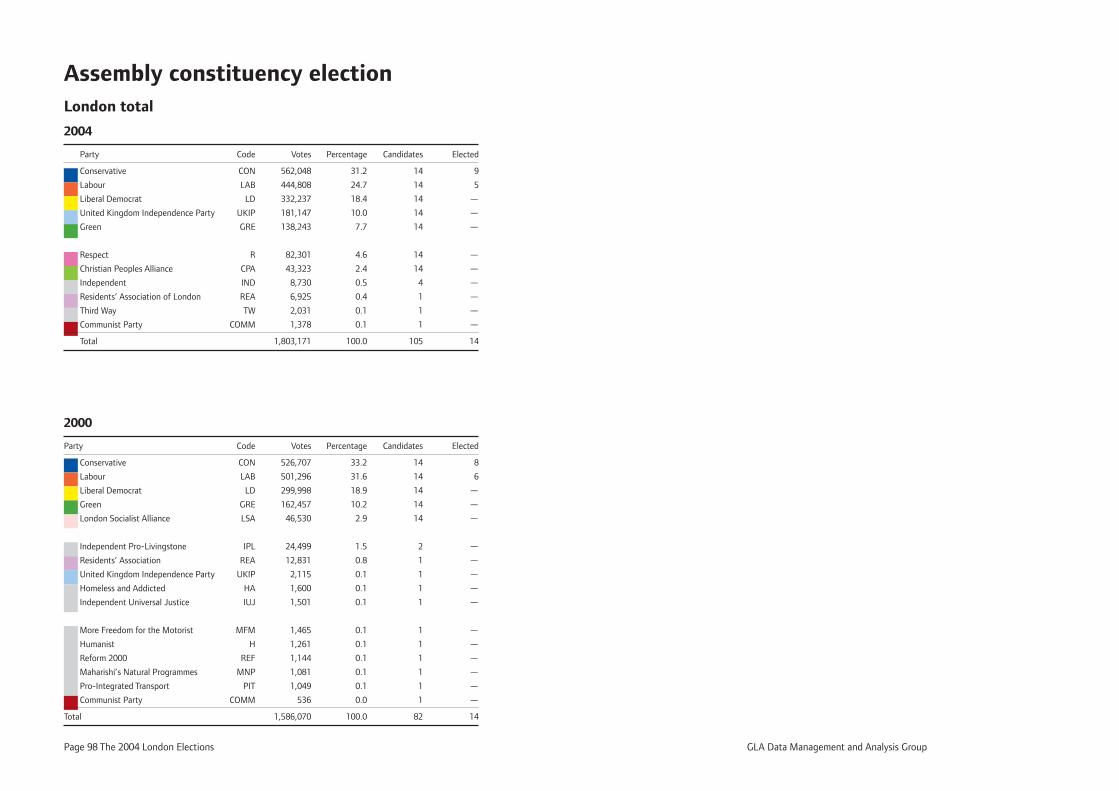
Page 98 The 2004 London Elections GLA Data Management and Analysis Group
Assembly constituency electionLondon total
2004
Party Code Votes Percentage Candidates Elected
Conservative CON 562,048 31.2 14 9
Labour LAB 444,808 24.7 14 5
Liberal Democrat LD 332,237 18.4 14 —
United Kingdom Independence Party UKIP 181,147 10.0 14 —
Green GRE 138,243 7.7 14 —
Respect R 82,301 4.6 14 —
Christian Peoples Alliance CPA 43,323 2.4 14 —
Independent IND 8,730 0.5 4 —
Residents’ Association of London REA 6,925 0.4 1 —
Third Way TW 2,031 0.1 1 —
Communist Party COMM 1,378 0.1 1 —
Total 1,803,171 100.0 105 14
2000
Party Code Votes Percentage Candidates Elected
Conservative CON 526,707 33.2 14 8
Labour LAB 501,296 31.6 14 6
Liberal Democrat LD 299,998 18.9 14 —
Green GRE 162,457 10.2 14 —
London Socialist Alliance LSA 46,530 2.9 14 —
Independent Pro-Livingstone IPL 24,499 1.5 2 —
Residents’ Association REA 12,831 0.8 1 —
United Kingdom Independence Party UKIP 2,115 0.1 1 —
Homeless and Addicted HA 1,600 0.1 1 —
Independent Universal Justice IUJ 1,501 0.1 1 —
More Freedom for the Motorist MFM 1,465 0.1 1 —
Humanist H 1,261 0.1 1 —
Reform 2000 REF 1,144 0.1 1 —
Maharishi’s Natural Programmes MNP 1,081 0.1 1 —
Pro-Integrated Transport PIT 1,049 0.1 1 —
Communist Party COMM 536 0.0 1 —
Total 1,586,070 100.0 82 14
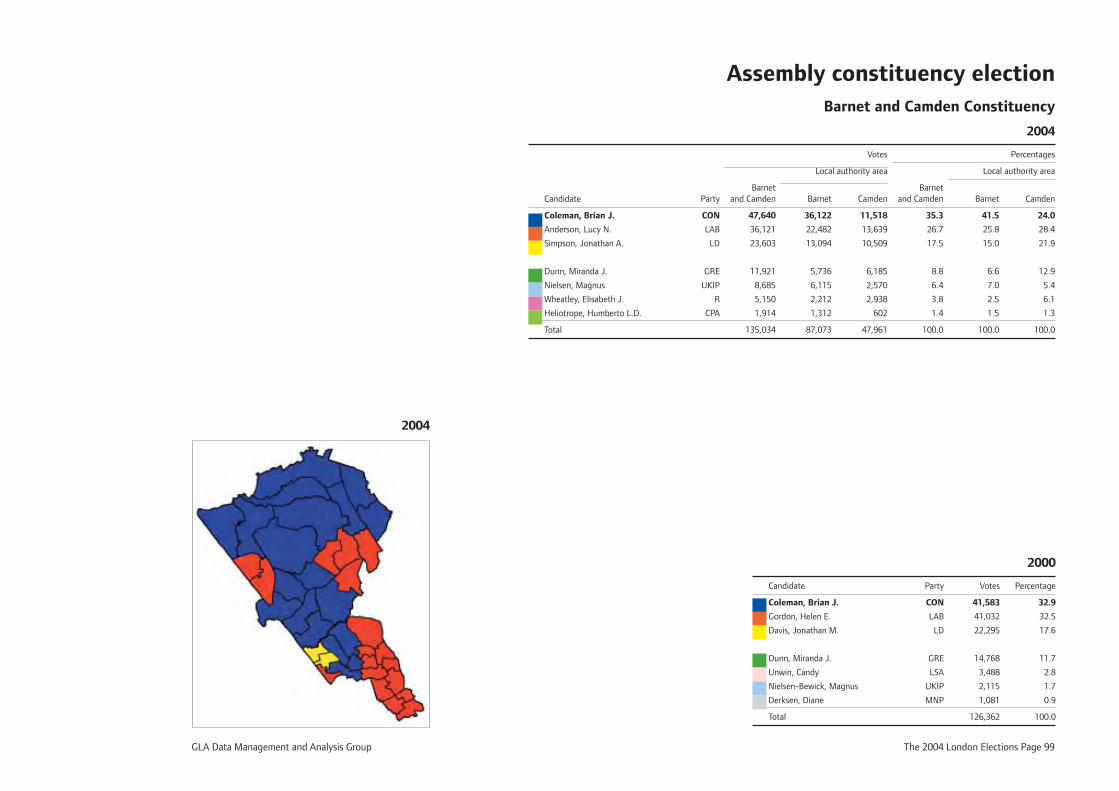
GLA Data Management and Analysis Group The 2004 London Elections Page 99
Assembly constituency election Barnet and Camden Constituency
2004
Votes Percentages
Local authority area Local authority area
Barnet Barnet Candidate Party and Camden Barnet Camden and Camden Barnet Camden
Coleman, Brian J. CON 47,640 36,122 11,518 35.3 41.5 24.0
Anderson, Lucy N. LAB 36,121 22,482 13,639 26.7 25.8 28.4
Simpson, Jonathan A. LD 23,603 13,094 10,509 17.5 15.0 21.9
Dunn, Miranda J. GRE 11,921 5,736 6,185 8.8 6.6 12.9
Nielsen, Magnus UKIP 8,685 6,115 2,570 6.4 7.0 5.4
Wheatley, Elisabeth J. R 5,150 2,212 2,938 3.8 2.5 6.1
Heliotrope, Humberto L.D. CPA 1,914 1,312 602 1.4 1.5 1.3
Total 135,034 87,073 47,961 100.0 100.0 100.0
2000
Candidate Party Votes Percentage
Coleman, Brian J. CON 41,583 32.9
Gordon, Helen E. LAB 41,032 32.5
Davis, Jonathan M. LD 22,295 17.6
Dunn, Miranda J. GRE 14,768 11.7
Unwin, Candy LSA 3,488 2.8
Nielsen-Bewick, Magnus UKIP 2,115 1.7
Derksen, Diane MNP 1,081 0.9
Total 126,362 100.0
2004
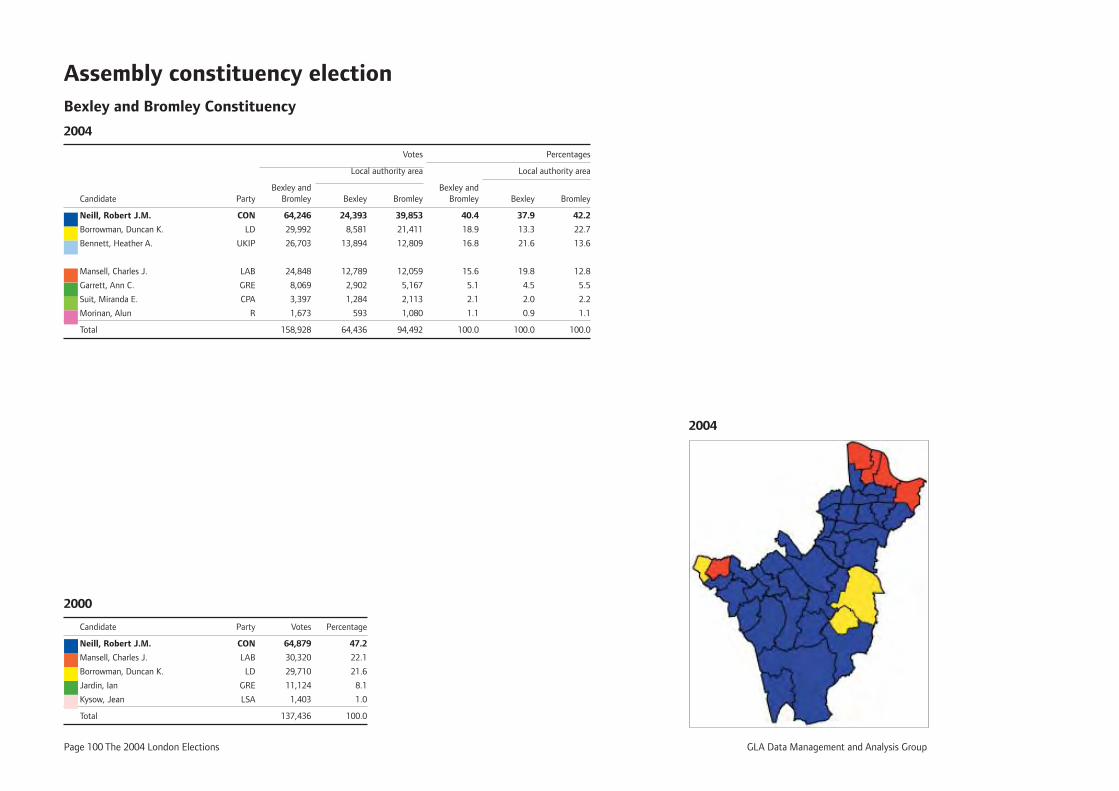
Page 100 The 2004 London Elections GLA Data Management and Analysis Group
2004
Assembly constituency election Bexley and Bromley Constituency
2004
Votes Percentages
Local authority area Local authority area
Bexley and Bexley and Candidate Party Bromley Bexley Bromley Bromley Bexley Bromley
Neill, Robert J.M. CON 64,246 24,393 39,853 40.4 37.9 42.2
Borrowman, Duncan K. LD 29,992 8,581 21,411 18.9 13.3 22.7
Bennett, Heather A. UKIP 26,703 13,894 12,809 16.8 21.6 13.6
Mansell, Charles J. LAB 24,848 12,789 12,059 15.6 19.8 12.8
Garrett, Ann C. GRE 8,069 2,902 5,167 5.1 4.5 5.5
Suit, Miranda E. CPA 3,397 1,284 2,113 2.1 2.0 2.2
Morinan, Alun R 1,673 593 1,080 1.1 0.9 1.1
Total 158,928 64,436 94,492 100.0 100.0 100.0
2000
Candidate Party Votes Percentage
Neill, Robert J.M. CON 64,879 47.2
Mansell, Charles J. LAB 30,320 22.1
Borrowman, Duncan K. LD 29,710 21.6
Jardin, Ian GRE 11,124 8.1
Kysow, Jean LSA 1,403 1.0
Total 137,436 100.0
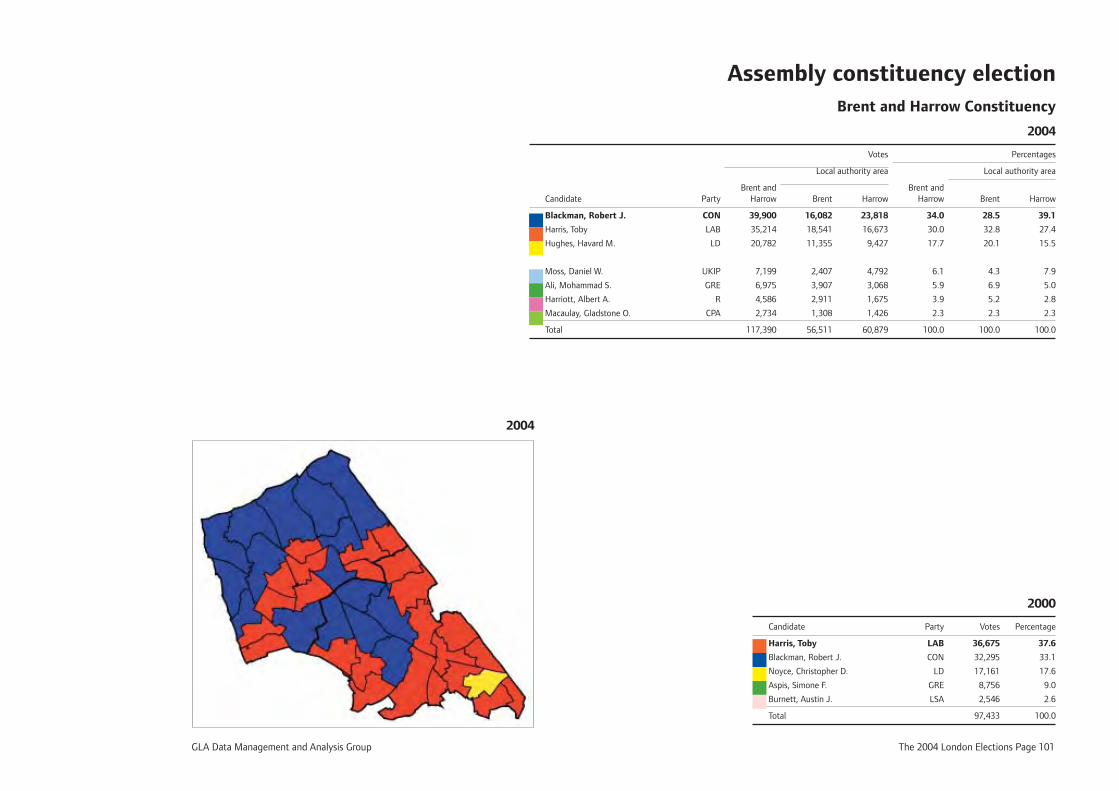
GLA Data Management and Analysis Group The 2004 London Elections Page 101
Assembly constituency election Brent and Harrow Constituency
2004
Votes Percentages
Local authority area Local authority area
Brent and Brent and Candidate Party Harrow Brent Harrow Harrow Brent Harrow
Blackman, Robert J. CON 39,900 16,082 23,818 34.0 28.5 39.1
Harris, Toby LAB 35,214 18,541 16,673 30.0 32.8 27.4
Hughes, Havard M. LD 20,782 11,355 9,427 17.7 20.1 15.5
Moss, Daniel W. UKIP 7,199 2,407 4,792 6.1 4.3 7.9
Ali, Mohammad S. GRE 6,975 3,907 3,068 5.9 6.9 5.0
Harriott, Albert A. R 4,586 2,911 1,675 3.9 5.2 2.8
Macaulay, Gladstone O. CPA 2,734 1,308 1,426 2.3 2.3 2.3
Total 117,390 56,511 60,879 100.0 100.0 100.0
2000
Candidate Party Votes Percentage
Harris, Toby LAB 36,675 37.6
Blackman, Robert J. CON 32,295 33.1
Noyce, Christopher D. LD 17,161 17.6
Aspis, Simone F. GRE 8,756 9.0
Burnett, Austin J. LSA 2,546 2.6
Total 97,433 100.0
2004
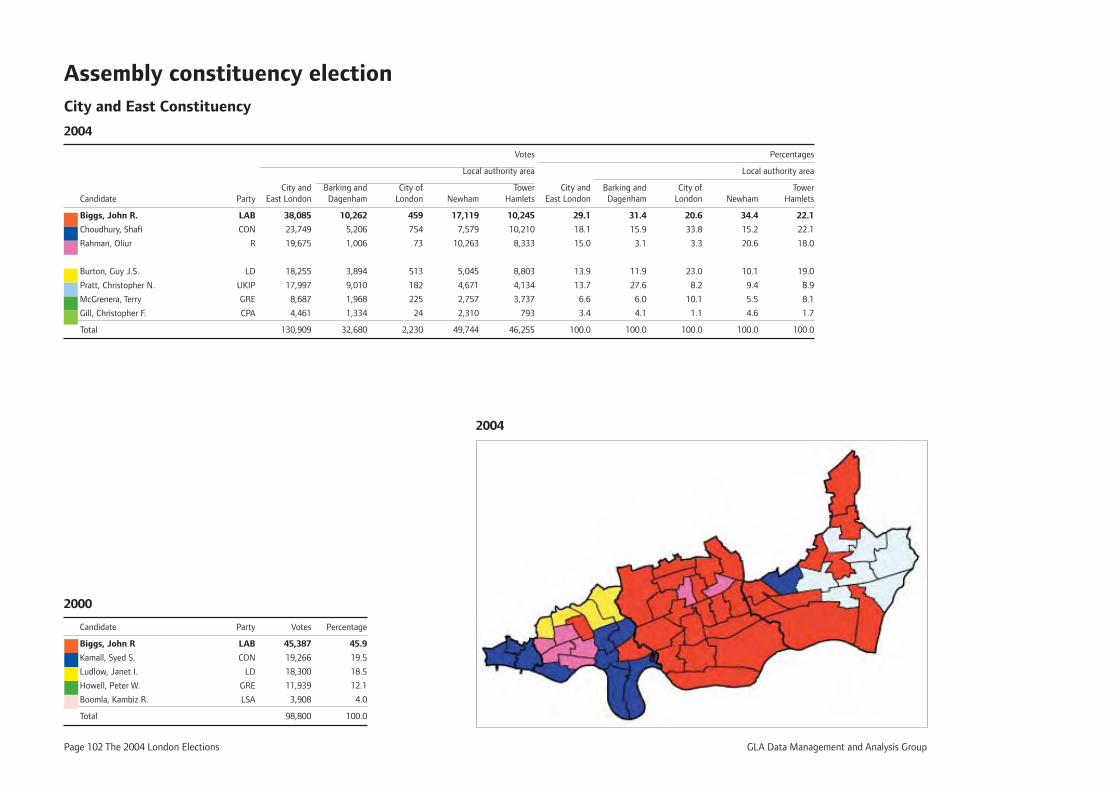
Page 102 The 2004 London Elections GLA Data Management and Analysis Group
Assembly constituency electionCity and East Constituency
2004
Votes Percentages
Local authority area Local authority area
City and Barking and City of Tower City and Barking and City of Tower Candidate Party East London Dagenham London Newham Hamlets East London Dagenham London Newham Hamlets
Biggs, John R. LAB 38,085 10,262 459 17,119 10,245 29.1 31.4 20.6 34.4 22.1
Choudhury, Shafi CON 23,749 5,206 754 7,579 10,210 18.1 15.9 33.8 15.2 22.1
Rahman, Oliur R 19,675 1,006 73 10,263 8,333 15.0 3.1 3.3 20.6 18.0
Burton, Guy J.S. LD 18,255 3,894 513 5,045 8,803 13.9 11.9 23.0 10.1 19.0
Pratt, Christopher N. UKIP 17,997 9,010 182 4,671 4,134 13.7 27.6 8.2 9.4 8.9
McGrenera, Terry GRE 8,687 1,968 225 2,757 3,737 6.6 6.0 10.1 5.5 8.1
Gill, Christopher F. CPA 4,461 1,334 24 2,310 793 3.4 4.1 1.1 4.6 1.7
Total 130,909 32,680 2,230 49,744 46,255 100.0 100.0 100.0 100.0 100.0
2000
Candidate Party Votes Percentage
Biggs, John R LAB 45,387 45.9
Kamall, Syed S. CON 19,266 19.5
Ludlow, Janet I. LD 18,300 18.5
Howell, Peter W. GRE 11,939 12.1
Boomla, Kambiz R. LSA 3,908 4.0
Total 98,800 100.0
2004
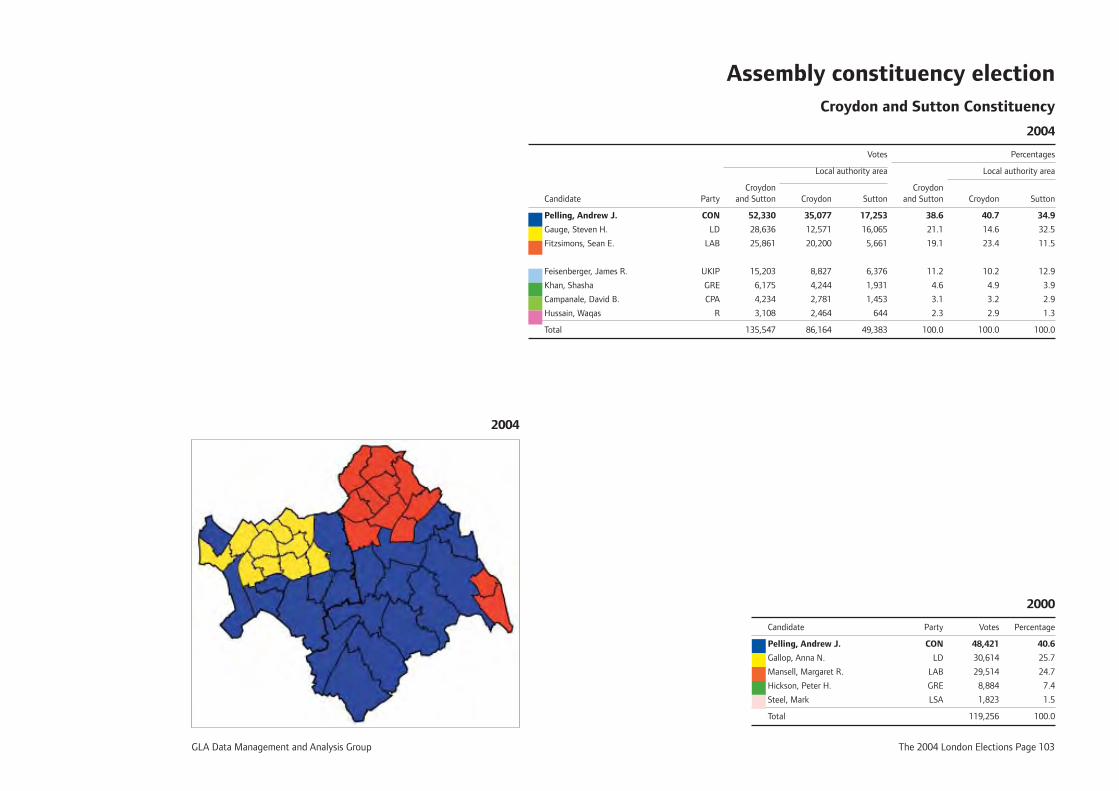
GLA Data Management and Analysis Group The 2004 London Elections Page 103
Assembly constituency election Croydon and Sutton Constituency
2004
Votes Percentages
Local authority area Local authority area
Croydon Croydon Candidate Party and Sutton Croydon Sutton and Sutton Croydon Sutton
Pelling, Andrew J. CON 52,330 35,077 17,253 38.6 40.7 34.9
Gauge, Steven H. LD 28,636 12,571 16,065 21.1 14.6 32.5
Fitzsimons, Sean E. LAB 25,861 20,200 5,661 19.1 23.4 11.5
Feisenberger, James R. UKIP 15,203 8,827 6,376 11.2 10.2 12.9
Khan, Shasha GRE 6,175 4,244 1,931 4.6 4.9 3.9
Campanale, David B. CPA 4,234 2,781 1,453 3.1 3.2 2.9
Hussain, Waqas R 3,108 2,464 644 2.3 2.9 1.3
Total 135,547 86,164 49,383 100.0 100.0 100.0
2000
Candidate Party Votes Percentage
Pelling, Andrew J. CON 48,421 40.6
Gallop, Anna N. LD 30,614 25.7
Mansell, Margaret R. LAB 29,514 24.7
Hickson, Peter H. GRE 8,884 7.4
Steel, Mark LSA 1,823 1.5
Total 119,256 100.0
2004
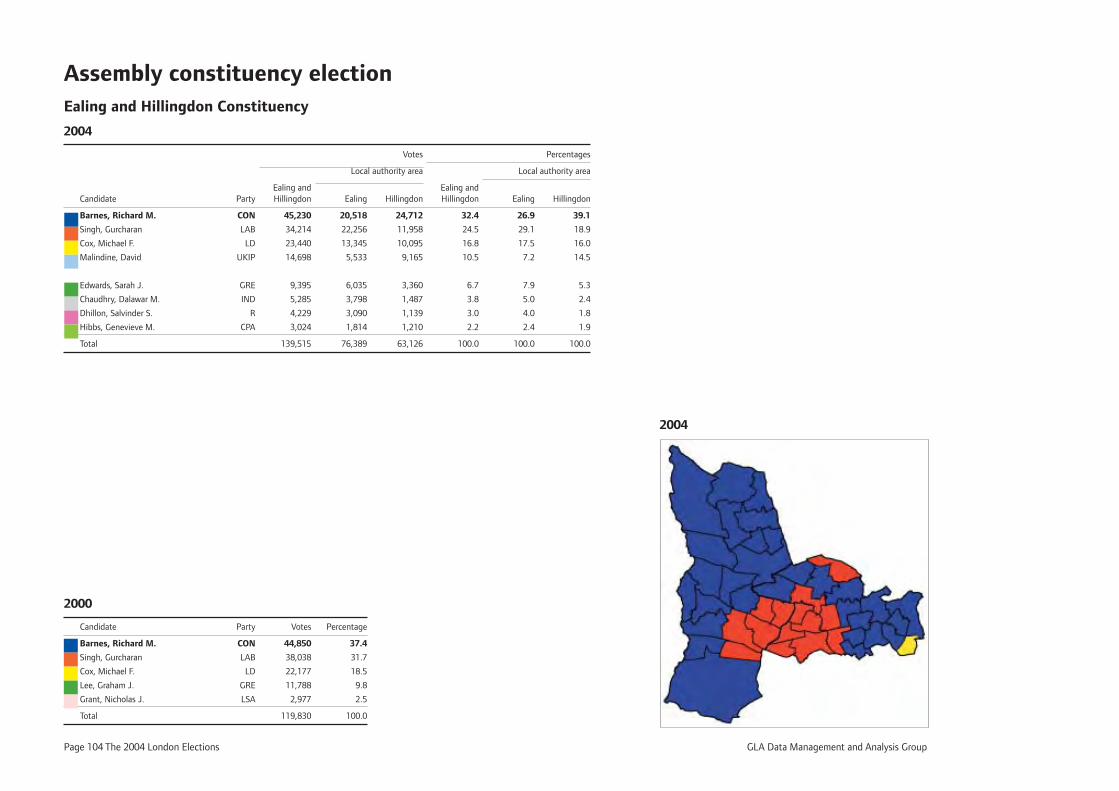
Page 104 The 2004 London Elections GLA Data Management and Analysis Group
Assembly constituency election Ealing and Hillingdon Constituency
2004
Votes Percentages
Local authority area Local authority area
Ealing and Ealing and Candidate Party Hillingdon Ealing Hillingdon Hillingdon Ealing Hillingdon
Barnes, Richard M. CON 45,230 20,518 24,712 32.4 26.9 39.1
Singh, Gurcharan LAB 34,214 22,256 11,958 24.5 29.1 18.9
Cox, Michael F. LD 23,440 13,345 10,095 16.8 17.5 16.0
Malindine, David UKIP 14,698 5,533 9,165 10.5 7.2 14.5
Edwards, Sarah J. GRE 9,395 6,035 3,360 6.7 7.9 5.3
Chaudhry, Dalawar M. IND 5,285 3,798 1,487 3.8 5.0 2.4
Dhillon, Salvinder S. R 4,229 3,090 1,139 3.0 4.0 1.8
Hibbs, Genevieve M. CPA 3,024 1,814 1,210 2.2 2.4 1.9
Total 139,515 76,389 63,126 100.0 100.0 100.0
2000
Candidate Party Votes Percentage
Barnes, Richard M. CON 44,850 37.4
Singh, Gurcharan LAB 38,038 31.7
Cox, Michael F. LD 22,177 18.5
Lee, Graham J. GRE 11,788 9.8
Grant, Nicholas J. LSA 2,977 2.5
Total 119,830 100.0
2004
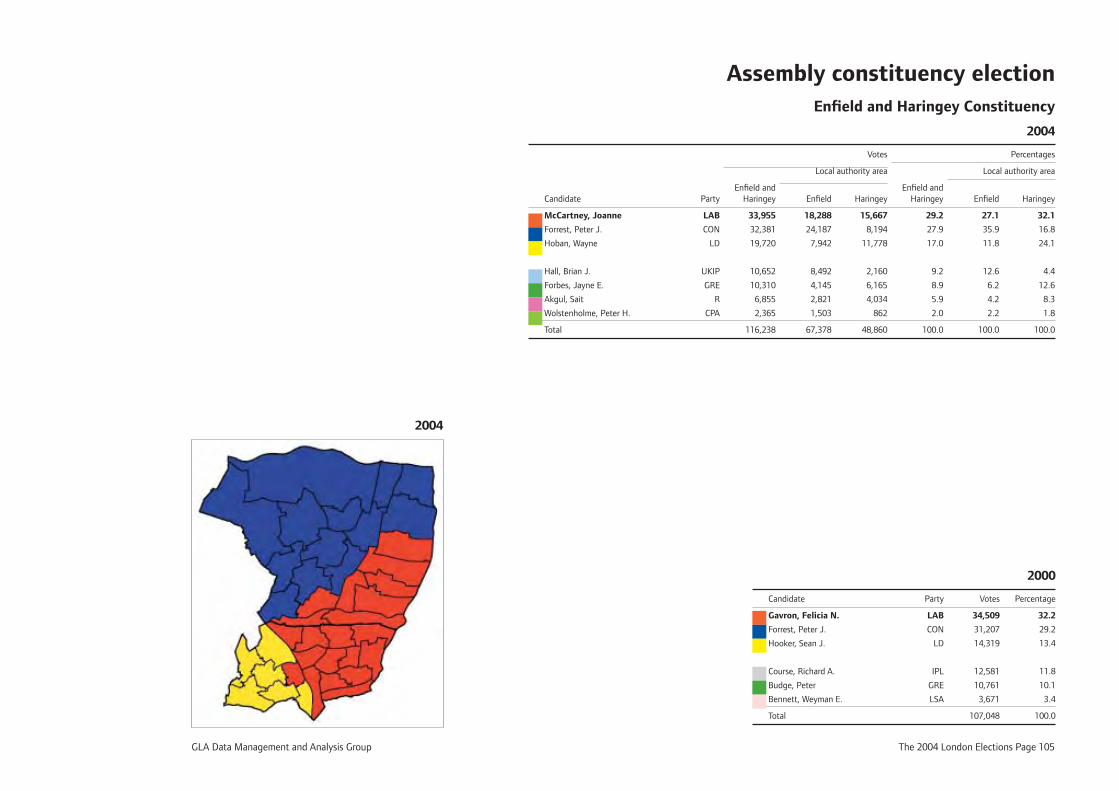
GLA Data Management and Analysis Group The 2004 London Elections Page 105
Assembly constituency election Enfi eld and Haringey Constituency
2004
Votes Percentages
Local authority area Local authority area
Enfi eld and Enfi eld and Candidate Party Haringey Enfi eld Haringey Haringey Enfi eld Haringey
McCartney, Joanne LAB 33,955 18,288 15,667 29.2 27.1 32.1
Forrest, Peter J. CON 32,381 24,187 8,194 27.9 35.9 16.8
Hoban, Wayne LD 19,720 7,942 11,778 17.0 11.8 24.1
Hall, Brian J. UKIP 10,652 8,492 2,160 9.2 12.6 4.4
Forbes, Jayne E. GRE 10,310 4,145 6,165 8.9 6.2 12.6
Akgul, Sait R 6,855 2,821 4,034 5.9 4.2 8.3
Wolstenholme, Peter H. CPA 2,365 1,503 862 2.0 2.2 1.8
Total 116,238 67,378 48,860 100.0 100.0 100.0
2000
Candidate Party Votes Percentage
Gavron, Felicia N. LAB 34,509 32.2
Forrest, Peter J. CON 31,207 29.2
Hooker, Sean J. LD 14,319 13.4
Course, Richard A. IPL 12,581 11.8
Budge, Peter GRE 10,761 10.1
Bennett, Weyman E. LSA 3,671 3.4
Total 107,048 100.0
2004
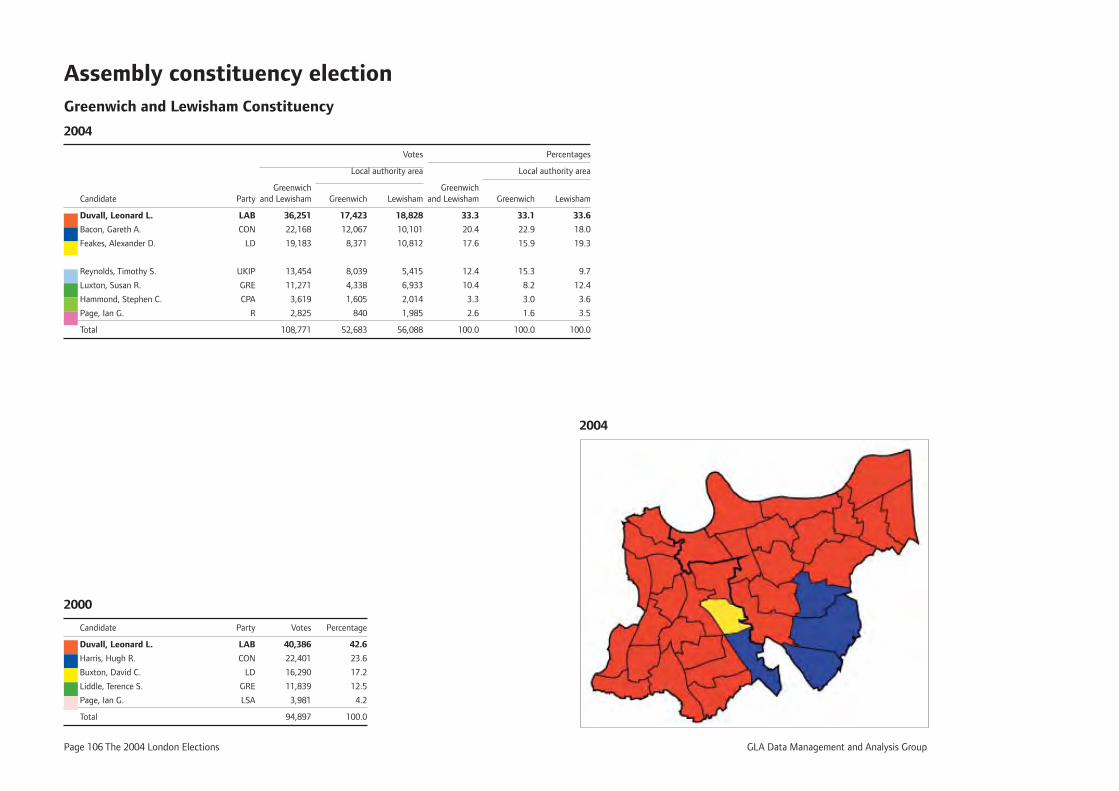
Page 106 The 2004 London Elections GLA Data Management and Analysis Group
Assembly constituency election Greenwich and Lewisham Constituency
2004
Votes Percentages
Local authority area Local authority area
Greenwich Greenwich Candidate Party and Lewisham Greenwich Lewisham and Lewisham Greenwich Lewisham
Duvall, Leonard L. LAB 36,251 17,423 18,828 33.3 33.1 33.6
Bacon, Gareth A. CON 22,168 12,067 10,101 20.4 22.9 18.0
Feakes, Alexander D. LD 19,183 8,371 10,812 17.6 15.9 19.3
Reynolds, Timothy S. UKIP 13,454 8,039 5,415 12.4 15.3 9.7
Luxton, Susan R. GRE 11,271 4,338 6,933 10.4 8.2 12.4
Hammond, Stephen C. CPA 3,619 1,605 2,014 3.3 3.0 3.6
Page, Ian G. R 2,825 840 1,985 2.6 1.6 3.5
Total 108,771 52,683 56,088 100.0 100.0 100.0
2000
Candidate Party Votes Percentage
Duvall, Leonard L. LAB 40,386 42.6
Harris, Hugh R. CON 22,401 23.6
Buxton, David C. LD 16,290 17.2
Liddle, Terence S. GRE 11,839 12.5
Page, Ian G. LSA 3,981 4.2
Total 94,897 100.0
2004
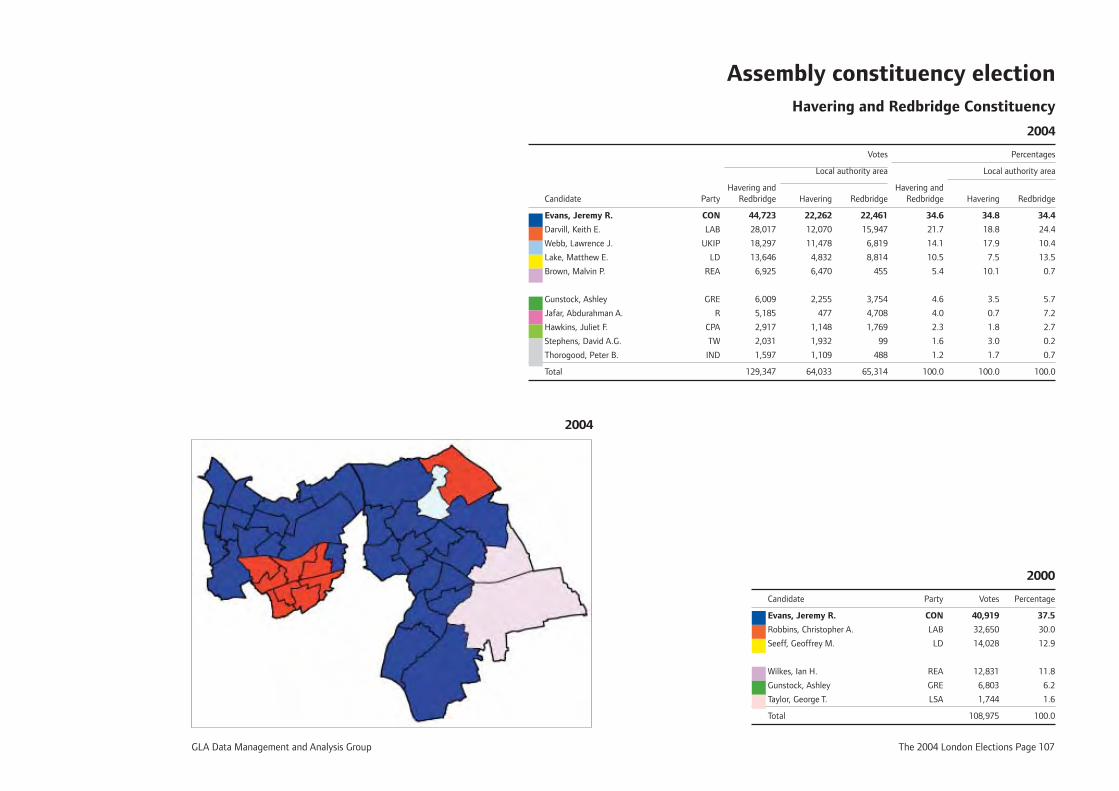
GLA Data Management and Analysis Group The 2004 London Elections Page 107
Assembly constituency election Havering and Redbridge Constituency
2004
Votes Percentages
Local authority area Local authority area
Havering and Havering and Candidate Party Redbridge Havering Redbridge Redbridge Havering Redbridge
Evans, Jeremy R. CON 44,723 22,262 22,461 34.6 34.8 34.4
Darvill, Keith E. LAB 28,017 12,070 15,947 21.7 18.8 24.4
Webb, Lawrence J. UKIP 18,297 11,478 6,819 14.1 17.9 10.4
Lake, Matthew E. LD 13,646 4,832 8,814 10.5 7.5 13.5
Brown, Malvin P. REA 6,925 6,470 455 5.4 10.1 0.7
Gunstock, Ashley GRE 6,009 2,255 3,754 4.6 3.5 5.7
Jafar, Abdurahman A. R 5,185 477 4,708 4.0 0.7 7.2
Hawkins, Juliet F. CPA 2,917 1,148 1,769 2.3 1.8 2.7
Stephens, David A.G. TW 2,031 1,932 99 1.6 3.0 0.2
Thorogood, Peter B. IND 1,597 1,109 488 1.2 1.7 0.7
Total 129,347 64,033 65,314 100.0 100.0 100.0
2000
Candidate Party Votes Percentage
Evans, Jeremy R. CON 40,919 37.5
Robbins, Christopher A. LAB 32,650 30.0
Seeff, Geoffrey M. LD 14,028 12.9
Wilkes, Ian H. REA 12,831 11.8
Gunstock, Ashley GRE 6,803 6.2
Taylor, George T. LSA 1,744 1.6
Total 108,975 100.0
2004
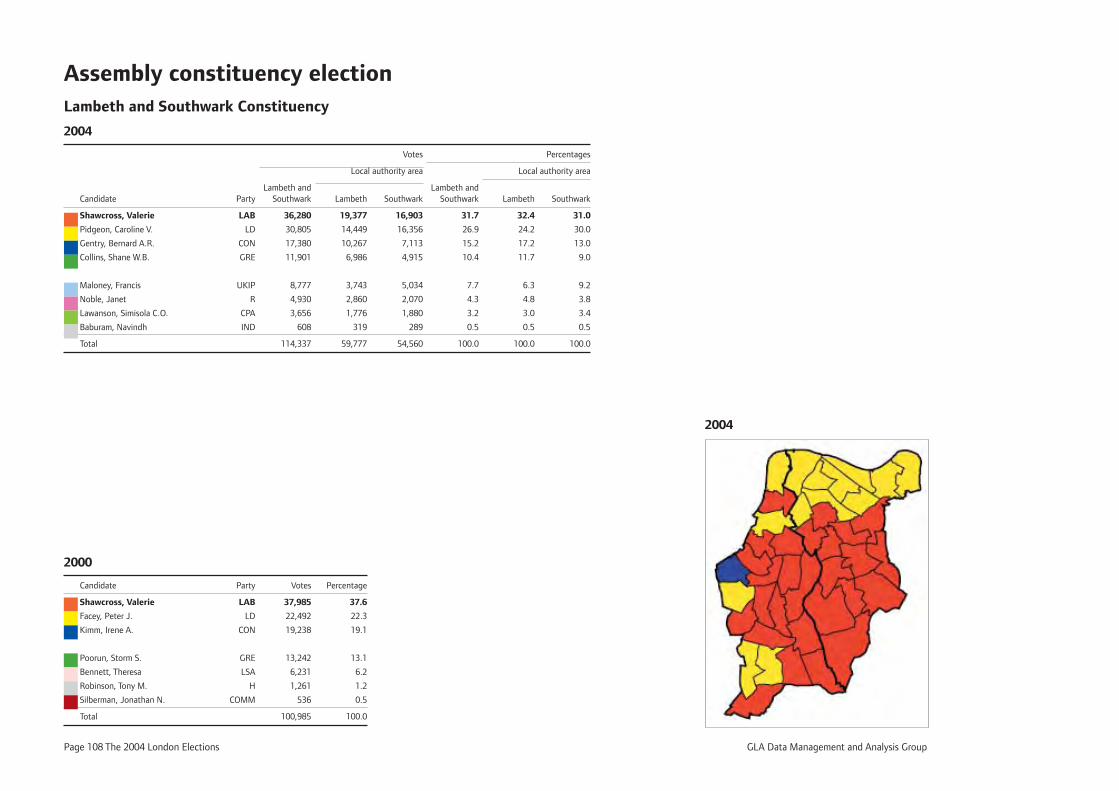
Page 108 The 2004 London Elections GLA Data Management and Analysis Group
Assembly constituency election Lambeth and Southwark Constituency
2004
Votes Percentages
Local authority area Local authority area
Lambeth and Lambeth and Candidate Party Southwark Lambeth Southwark Southwark Lambeth Southwark
Shawcross, Valerie LAB 36,280 19,377 16,903 31.7 32.4 31.0
Pidgeon, Caroline V. LD 30,805 14,449 16,356 26.9 24.2 30.0
Gentry, Bernard A.R. CON 17,380 10,267 7,113 15.2 17.2 13.0
Collins, Shane W.B. GRE 11,901 6,986 4,915 10.4 11.7 9.0
Maloney, Francis UKIP 8,777 3,743 5,034 7.7 6.3 9.2
Noble, Janet R 4,930 2,860 2,070 4.3 4.8 3.8
Lawanson, Simisola C.O. CPA 3,656 1,776 1,880 3.2 3.0 3.4
Baburam, Navindh IND 608 319 289 0.5 0.5 0.5
Total 114,337 59,777 54,560 100.0 100.0 100.0
2000
Candidate Party Votes Percentage
Shawcross, Valerie LAB 37,985 37.6
Facey, Peter J. LD 22,492 22.3
Kimm, Irene A. CON 19,238 19.1
Poorun, Storm S. GRE 13,242 13.1
Bennett, Theresa LSA 6,231 6.2
Robinson, Tony M. H 1,261 1.2
Silberman, Jonathan N. COMM 536 0.5
Total 100,985 100.0
2004
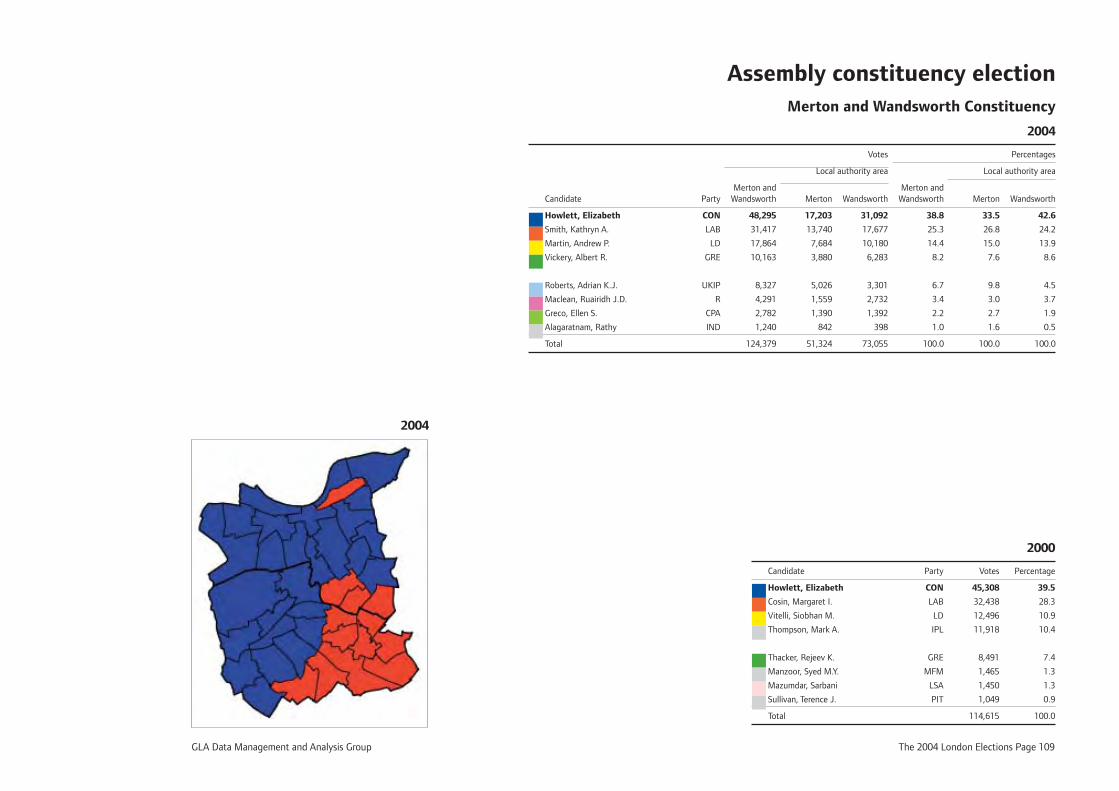
GLA Data Management and Analysis Group The 2004 London Elections Page 109
Assembly constituency election Merton and Wandsworth Constituency
2004
Votes Percentages
Local authority area Local authority area
Merton and Merton and Candidate Party Wandsworth Merton Wandsworth Wandsworth Merton Wandsworth
Howlett, Elizabeth CON 48,295 17,203 31,092 38.8 33.5 42.6
Smith, Kathryn A. LAB 31,417 13,740 17,677 25.3 26.8 24.2
Martin, Andrew P. LD 17,864 7,684 10,180 14.4 15.0 13.9
Vickery, Albert R. GRE 10,163 3,880 6,283 8.2 7.6 8.6
Roberts, Adrian K.J. UKIP 8,327 5,026 3,301 6.7 9.8 4.5
Maclean, Ruairidh J.D. R 4,291 1,559 2,732 3.4 3.0 3.7
Greco, Ellen S. CPA 2,782 1,390 1,392 2.2 2.7 1.9
Alagaratnam, Rathy IND 1,240 842 398 1.0 1.6 0.5
Total 124,379 51,324 73,055 100.0 100.0 100.0
2000
Candidate Party Votes Percentage
Howlett, Elizabeth CON 45,308 39.5
Cosin, Margaret I. LAB 32,438 28.3
Vitelli, Siobhan M. LD 12,496 10.9
Thompson, Mark A. IPL 11,918 10.4
Thacker, Rejeev K. GRE 8,491 7.4
Manzoor, Syed M.Y. MFM 1,465 1.3
Mazumdar, Sarbani LSA 1,450 1.3
Sullivan, Terence J. PIT 1,049 0.9
Total 114,615 100.0
2004
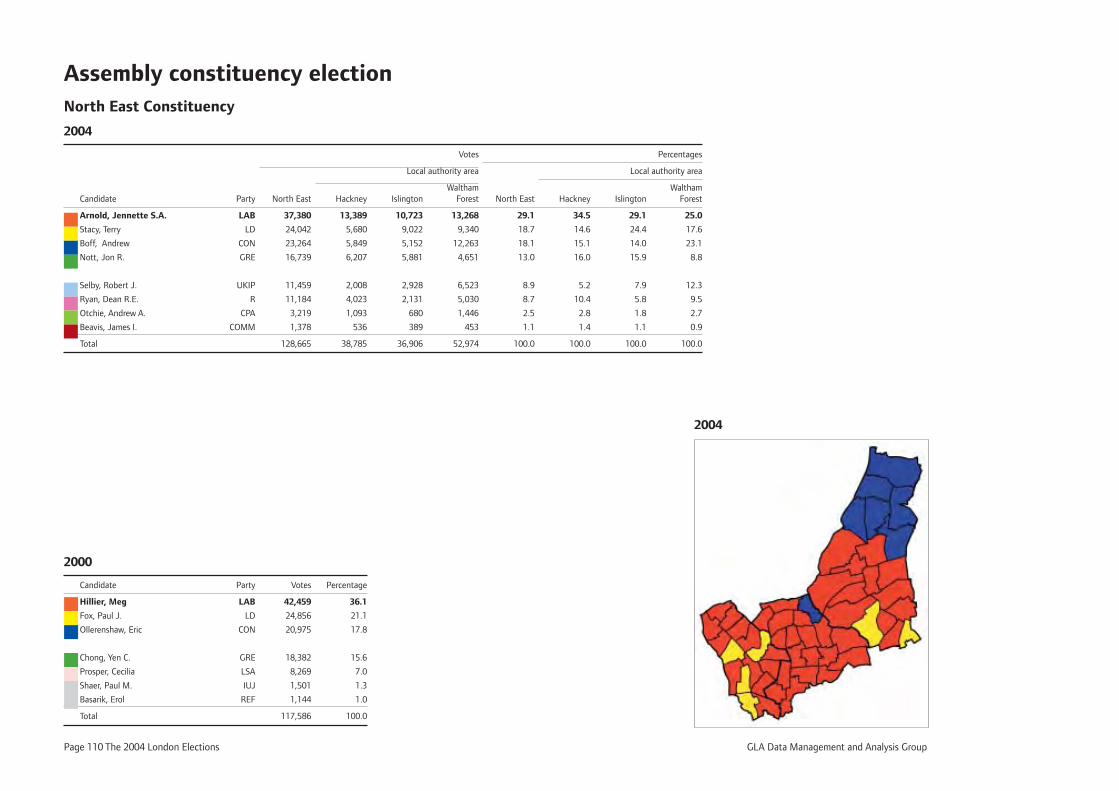
Page 110 The 2004 London Elections GLA Data Management and Analysis Group
Assembly constituency electionNorth East Constituency
2004
Votes Percentages
Local authority area Local authority area
Waltham Waltham Candidate Party North East Hackney Islington Forest North East Hackney Islington Forest
Arnold, Jennette S.A. LAB 37,380 13,389 10,723 13,268 29.1 34.5 29.1 25.0
Stacy, Terry LD 24,042 5,680 9,022 9,340 18.7 14.6 24.4 17.6
Boff, Andrew CON 23,264 5,849 5,152 12,263 18.1 15.1 14.0 23.1
Nott, Jon R. GRE 16,739 6,207 5,881 4,651 13.0 16.0 15.9 8.8
Selby, Robert J. UKIP 11,459 2,008 2,928 6,523 8.9 5.2 7.9 12.3
Ryan, Dean R.E. R 11,184 4,023 2,131 5,030 8.7 10.4 5.8 9.5
Otchie, Andrew A. CPA 3,219 1,093 680 1,446 2.5 2.8 1.8 2.7
Beavis, James I. COMM 1,378 536 389 453 1.1 1.4 1.1 0.9
Total 128,665 38,785 36,906 52,974 100.0 100.0 100.0 100.0
2000
Candidate Party Votes Percentage
Hillier, Meg LAB 42,459 36.1
Fox, Paul J. LD 24,856 21.1
Ollerenshaw, Eric CON 20,975 17.8
Chong, Yen C. GRE 18,382 15.6
Prosper, Cecilia LSA 8,269 7.0
Shaer, Paul M. IUJ 1,501 1.3
Basarik, Erol REF 1,144 1.0
Total 117,586 100.0
2004
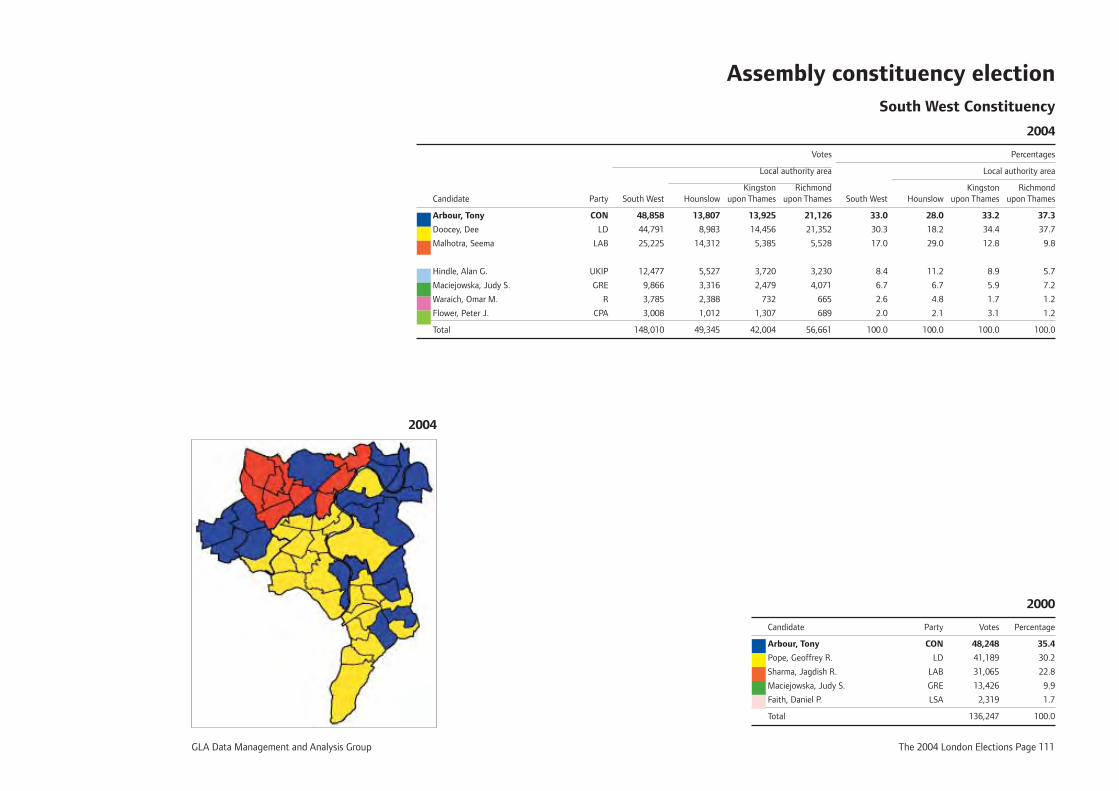
GLA Data Management and Analysis Group The 2004 London Elections Page 111
Assembly constituency election South West Constituency
2004
Votes Percentages
Local authority area Local authority area
Kingston Richmond Kingston Richmond Candidate Party South West Hounslow upon Thames upon Thames South West Hounslow upon Thames upon Thames
Arbour, Tony CON 48,858 13,807 13,925 21,126 33.0 28.0 33.2 37.3
Doocey, Dee LD 44,791 8,983 14,456 21,352 30.3 18.2 34.4 37.7
Malhotra, Seema LAB 25,225 14,312 5,385 5,528 17.0 29.0 12.8 9.8
Hindle, Alan G. UKIP 12,477 5,527 3,720 3,230 8.4 11.2 8.9 5.7
Maciejowska, Judy S. GRE 9,866 3,316 2,479 4,071 6.7 6.7 5.9 7.2
Waraich, Omar M. R 3,785 2,388 732 665 2.6 4.8 1.7 1.2
Flower, Peter J. CPA 3,008 1,012 1,307 689 2.0 2.1 3.1 1.2
Total 148,010 49,345 42,004 56,661 100.0 100.0 100.0 100.0
2000
Candidate Party Votes Percentage
Arbour, Tony CON 48,248 35.4
Pope, Geoffrey R. LD 41,189 30.2
Sharma, Jagdish R. LAB 31,065 22.8
Maciejowska, Judy S. GRE 13,426 9.9
Faith, Daniel P. LSA 2,319 1.7
Total 136,247 100.0
2004
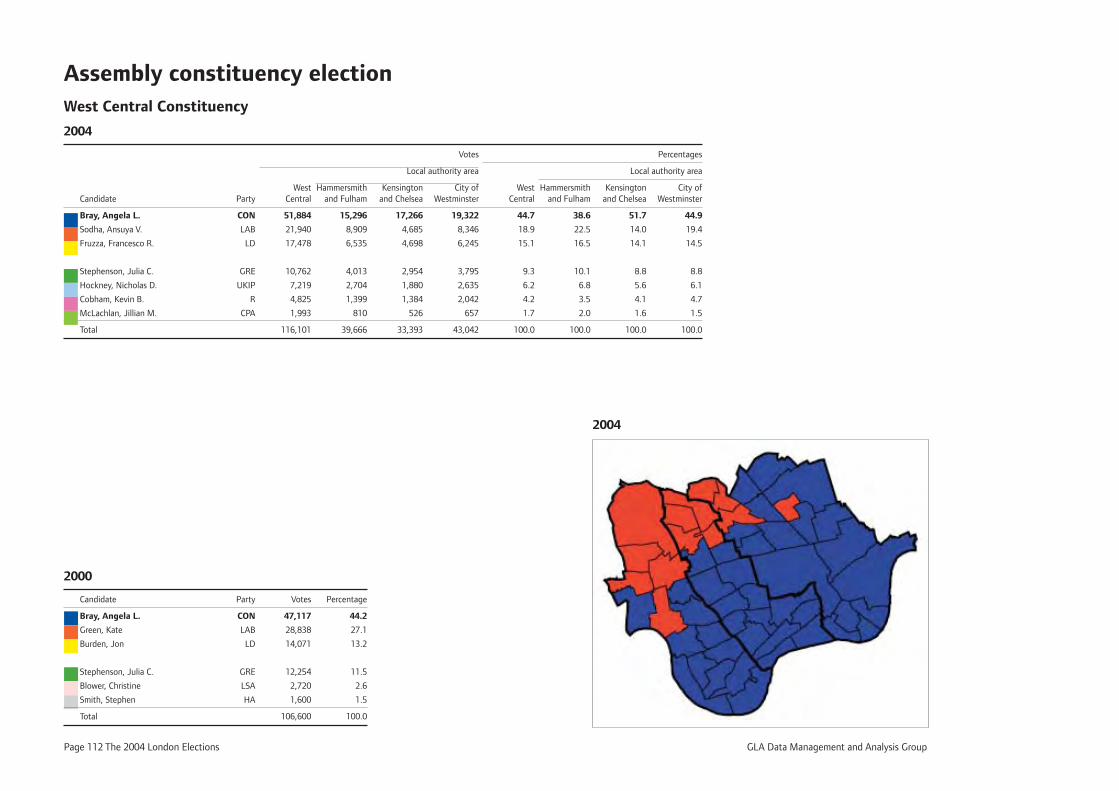
Page 112 The 2004 London Elections GLA Data Management and Analysis Group
Assembly constituency electionWest Central Constituency
2004
Votes Percentages
Local authority area Local authority area
West Hammersmith Kensington City of West Hammersmith Kensington City of Candidate Party Central and Fulham and Chelsea Westminster Central and Fulham and Chelsea Westminster
Bray, Angela L. CON 51,884 15,296 17,266 19,322 44.7 38.6 51.7 44.9
Sodha, Ansuya V. LAB 21,940 8,909 4,685 8,346 18.9 22.5 14.0 19.4
Fruzza, Francesco R. LD 17,478 6,535 4,698 6,245 15.1 16.5 14.1 14.5
Stephenson, Julia C. GRE 10,762 4,013 2,954 3,795 9.3 10.1 8.8 8.8
Hockney, Nicholas D. UKIP 7,219 2,704 1,880 2,635 6.2 6.8 5.6 6.1
Cobham, Kevin B. R 4,825 1,399 1,384 2,042 4.2 3.5 4.1 4.7
McLachlan, Jillian M. CPA 1,993 810 526 657 1.7 2.0 1.6 1.5
Total 116,101 39,666 33,393 43,042 100.0 100.0 100.0 100.0
2004
2000
Candidate Party Votes Percentage
Bray, Angela L. CON 47,117 44.2
Green, Kate LAB 28,838 27.1
Burden, Jon LD 14,071 13.2
Stephenson, Julia C. GRE 12,254 11.5
Blower, Christine LSA 2,720 2.6
Smith, Stephen HA 1,600 1.5
Total 106,600 100.0
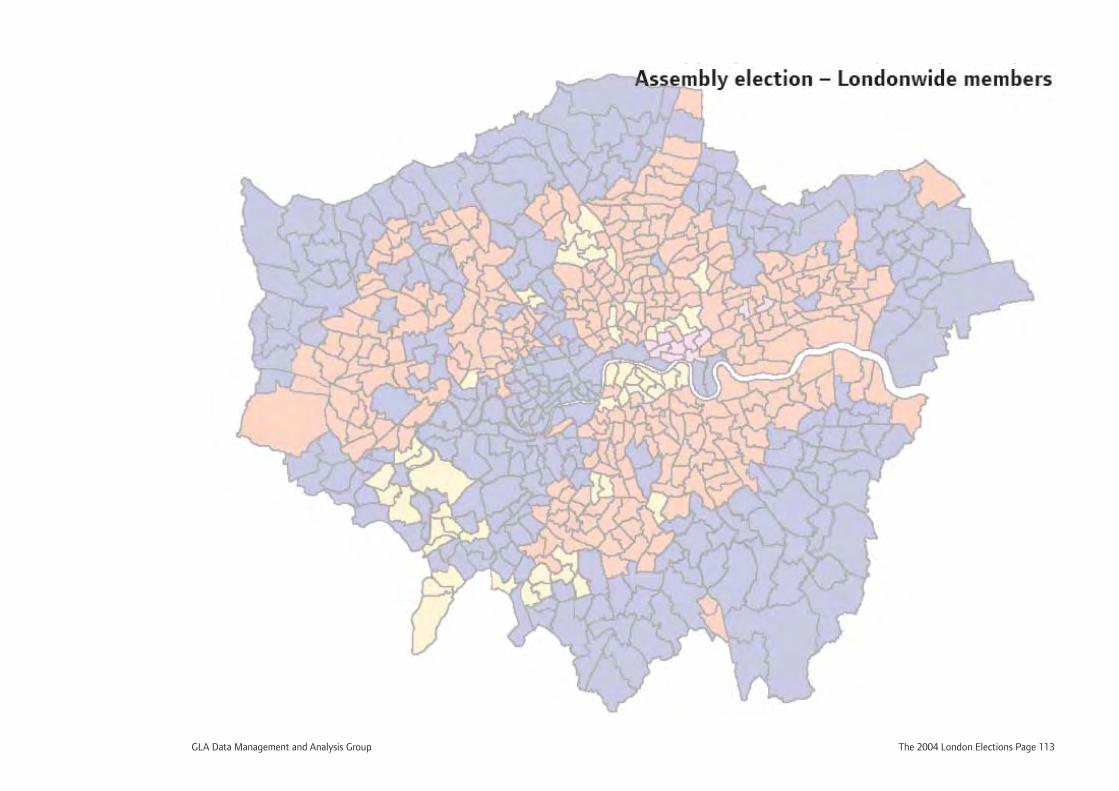
GLA Data Management and Analysis Group The 2004 London Elections Page 113
Assembly election – Londonwide members
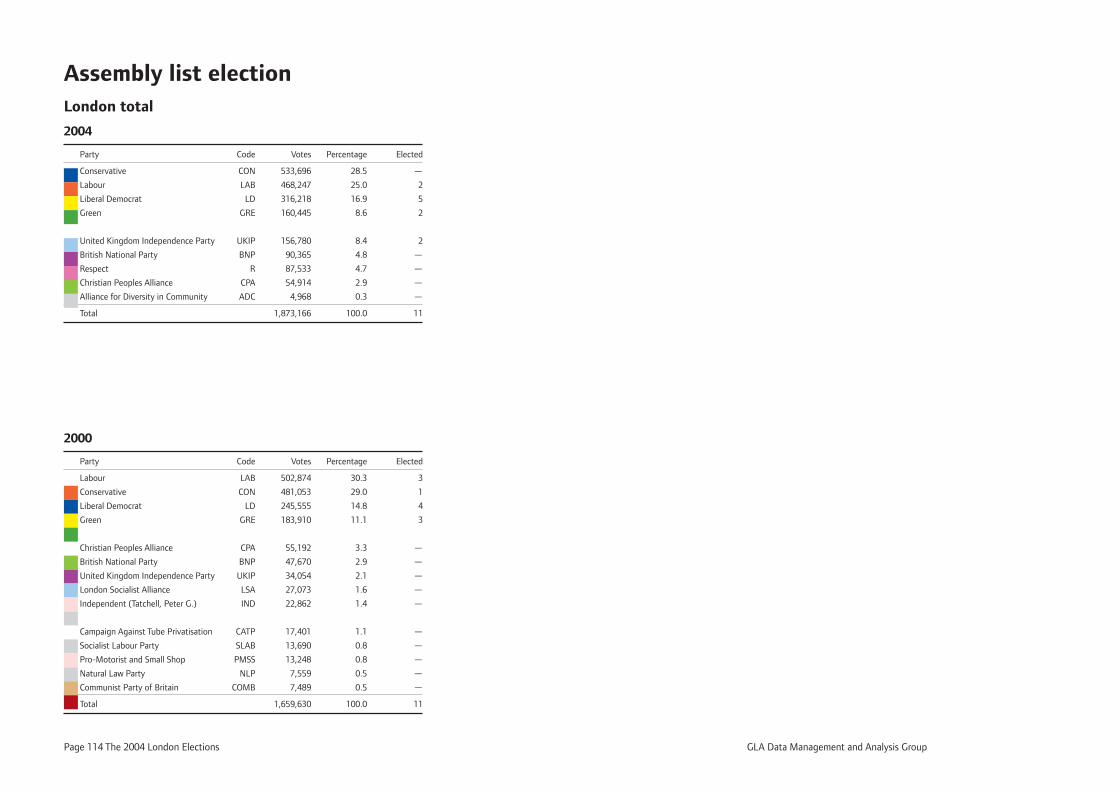
Page 114 The 2004 London Elections GLA Data Management and Analysis Group
2000
Party Code Votes Percentage Elected
Labour LAB 502,874 30.3 3
Conservative CON 481,053 29.0 1
Liberal Democrat LD 245,555 14.8 4
Green GRE 183,910 11.1 3
Christian Peoples Alliance CPA 55,192 3.3 —
British National Party BNP 47,670 2.9 —
United Kingdom Independence Party UKIP 34,054 2.1 —
London Socialist Alliance LSA 27,073 1.6 —
Independent (Tatchell, Peter G.) IND 22,862 1.4 —
Campaign Against Tube Privatisation CATP 17,401 1.1 —
Socialist Labour Party SLAB 13,690 0.8 —
Pro-Motorist and Small Shop PMSS 13,248 0.8 —
Natural Law Party NLP 7,559 0.5 —
Communist Party of Britain COMB 7,489 0.5 —
Total 1,659,630 100.0 11
Assembly list electionLondon total
2004
Party Code Votes Percentage Elected
Conservative CON 533,696 28.5 —
Labour LAB 468,247 25.0 2
Liberal Democrat LD 316,218 16.9 5
Green GRE 160,445 8.6 2
United Kingdom Independence Party UKIP 156,780 8.4 2
British National Party BNP 90,365 4.8 —
Respect R 87,533 4.7 —
Christian Peoples Alliance CPA 54,914 2.9 —
Alliance for Diversity in Community ADC 4,968 0.3 —
Total 1,873,166 100.0 11
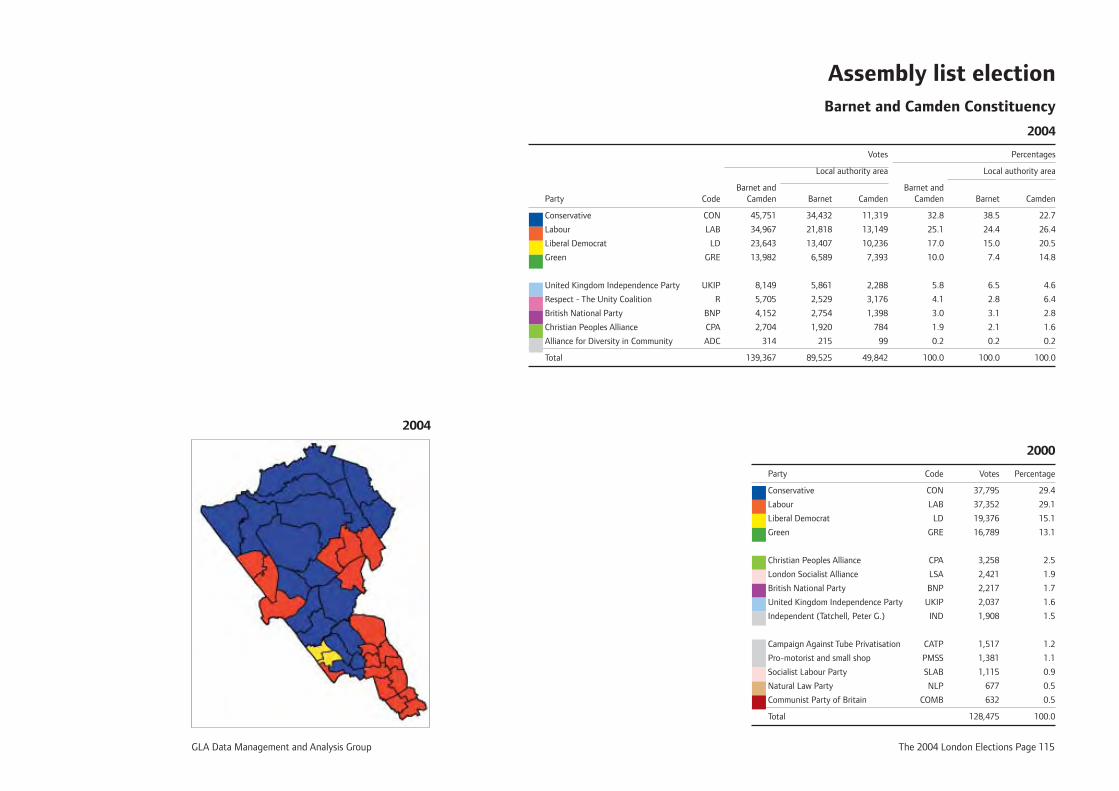
GLA Data Management and Analysis Group The 2004 London Elections Page 115
Assembly list election Barnet and Camden Constituency
2004
Votes Percentages
Local authority area Local authority area
Barnet and Barnet and Party Code Camden Barnet Camden Camden Barnet Camden
Conservative CON 45,751 34,432 11,319 32.8 38.5 22.7
Labour LAB 34,967 21,818 13,149 25.1 24.4 26.4
Liberal Democrat LD 23,643 13,407 10,236 17.0 15.0 20.5
Green GRE 13,982 6,589 7,393 10.0 7.4 14.8
United Kingdom Independence Party UKIP 8,149 5,861 2,288 5.8 6.5 4.6
Respect - The Unity Coalition R 5,705 2,529 3,176 4.1 2.8 6.4
British National Party BNP 4,152 2,754 1,398 3.0 3.1 2.8
Christian Peoples Alliance CPA 2,704 1,920 784 1.9 2.1 1.6
Alliance for Diversity in Community ADC 314 215 99 0.2 0.2 0.2
Total 139,367 89,525 49,842 100.0 100.0 100.0
2000
Party Code Votes Percentage
Conservative CON 37,795 29.4
Labour LAB 37,352 29.1
Liberal Democrat LD 19,376 15.1
Green GRE 16,789 13.1
Christian Peoples Alliance CPA 3,258 2.5
London Socialist Alliance LSA 2,421 1.9
British National Party BNP 2,217 1.7
United Kingdom Independence Party UKIP 2,037 1.6
Independent (Tatchell, Peter G.) IND 1,908 1.5
Campaign Against Tube Privatisation CATP 1,517 1.2
Pro-motorist and small shop PMSS 1,381 1.1
Socialist Labour Party SLAB 1,115 0.9
Natural Law Party NLP 677 0.5
Communist Party of Britain COMB 632 0.5
Total 128,475 100.0
2004
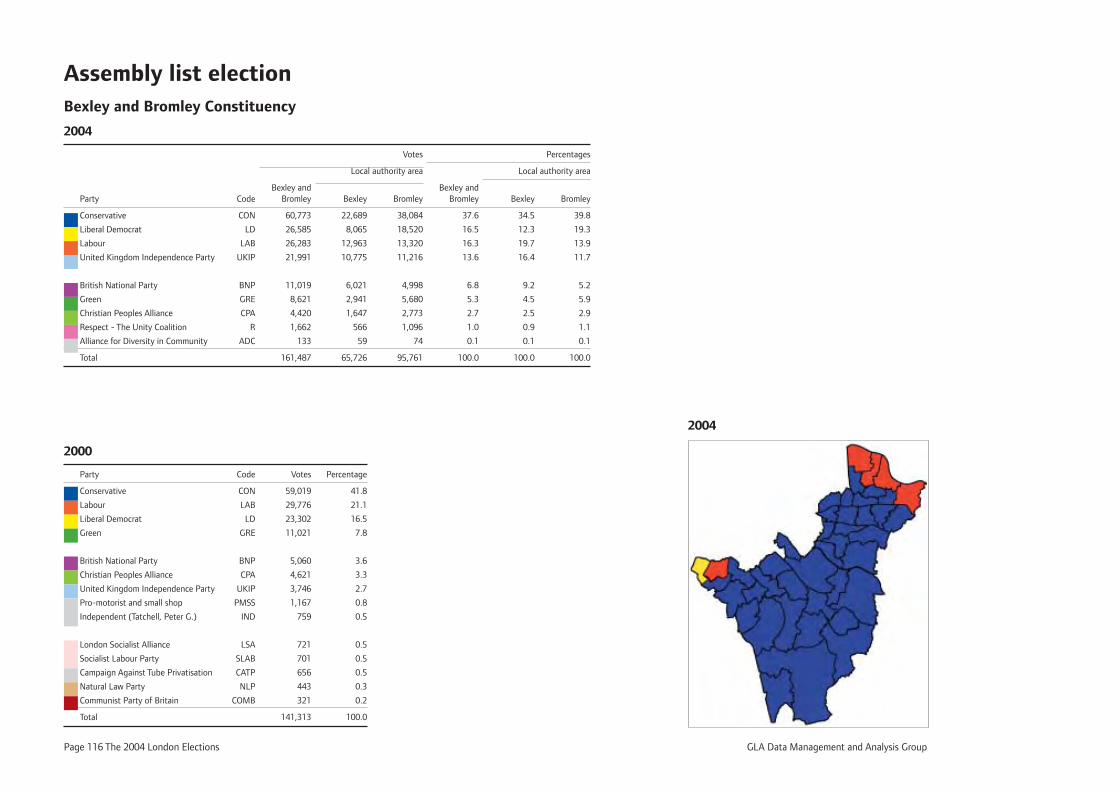
Page 116 The 2004 London Elections GLA Data Management and Analysis Group
Assembly list election Bexley and Bromley Constituency
2004
Votes Percentages
Local authority area Local authority area
Bexley and Bexley and Party Code Bromley Bexley Bromley Bromley Bexley Bromley
Conservative CON 60,773 22,689 38,084 37.6 34.5 39.8
Liberal Democrat LD 26,585 8,065 18,520 16.5 12.3 19.3
Labour LAB 26,283 12,963 13,320 16.3 19.7 13.9
United Kingdom Independence Party UKIP 21,991 10,775 11,216 13.6 16.4 11.7
British National Party BNP 11,019 6,021 4,998 6.8 9.2 5.2
Green GRE 8,621 2,941 5,680 5.3 4.5 5.9
Christian Peoples Alliance CPA 4,420 1,647 2,773 2.7 2.5 2.9
Respect - The Unity Coalition R 1,662 566 1,096 1.0 0.9 1.1
Alliance for Diversity in Community ADC 133 59 74 0.1 0.1 0.1
Total 161,487 65,726 95,761 100.0 100.0 100.0
2000
Party Code Votes Percentage
Conservative CON 59,019 41.8
Labour LAB 29,776 21.1
Liberal Democrat LD 23,302 16.5
Green GRE 11,021 7.8
British National Party BNP 5,060 3.6
Christian Peoples Alliance CPA 4,621 3.3
United Kingdom Independence Party UKIP 3,746 2.7
Pro-motorist and small shop PMSS 1,167 0.8
Independent (Tatchell, Peter G.) IND 759 0.5
London Socialist Alliance LSA 721 0.5
Socialist Labour Party SLAB 701 0.5
Campaign Against Tube Privatisation CATP 656 0.5
Natural Law Party NLP 443 0.3
Communist Party of Britain COMB 321 0.2
Total 141,313 100.0
2004
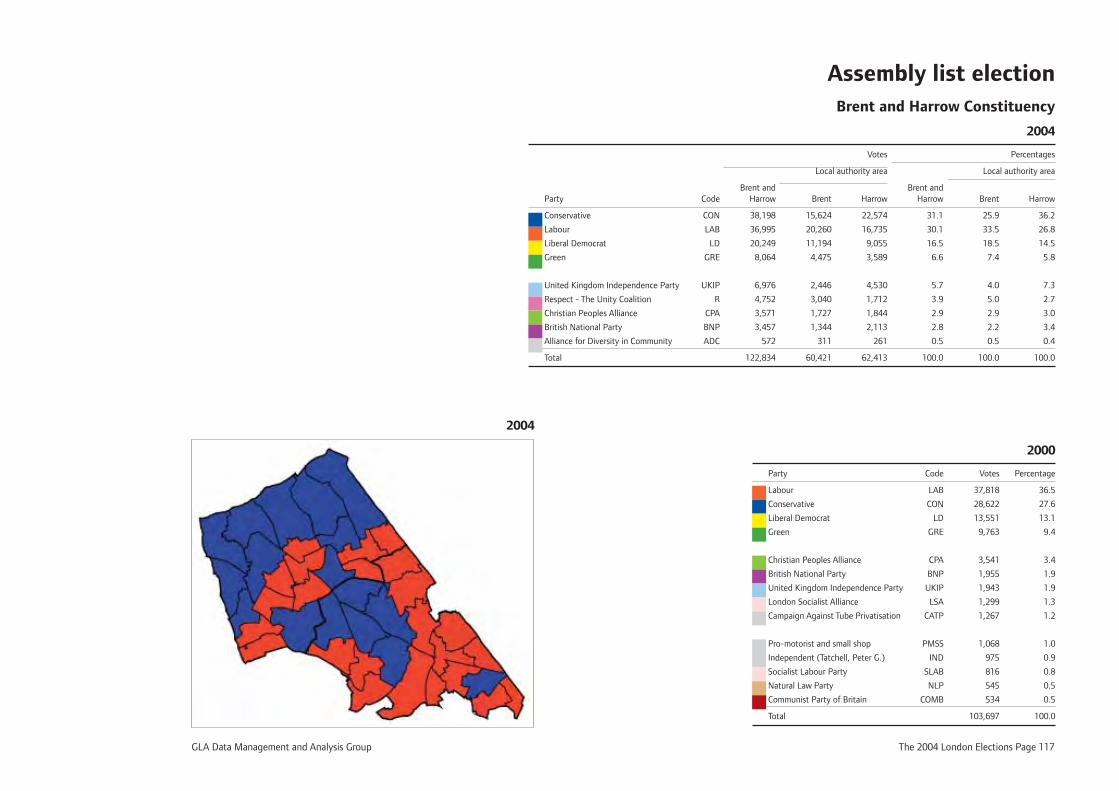
GLA Data Management and Analysis Group The 2004 London Elections Page 117
Assembly list election Brent and Harrow Constituency
2004
Votes Percentages
Local authority area Local authority area
Brent and Brent and Party Code Harrow Brent Harrow Harrow Brent Harrow
Conservative CON 38,198 15,624 22,574 31.1 25.9 36.2
Labour LAB 36,995 20,260 16,735 30.1 33.5 26.8
Liberal Democrat LD 20,249 11,194 9,055 16.5 18.5 14.5
Green GRE 8,064 4,475 3,589 6.6 7.4 5.8
United Kingdom Independence Party UKIP 6,976 2,446 4,530 5.7 4.0 7.3
Respect - The Unity Coalition R 4,752 3,040 1,712 3.9 5.0 2.7
Christian Peoples Alliance CPA 3,571 1,727 1,844 2.9 2.9 3.0
British National Party BNP 3,457 1,344 2,113 2.8 2.2 3.4
Alliance for Diversity in Community ADC 572 311 261 0.5 0.5 0.4
Total 122,834 60,421 62,413 100.0 100.0 100.0
2000
Party Code Votes Percentage
Labour LAB 37,818 36.5
Conservative CON 28,622 27.6
Liberal Democrat LD 13,551 13.1
Green GRE 9,763 9.4
Christian Peoples Alliance CPA 3,541 3.4
British National Party BNP 1,955 1.9
United Kingdom Independence Party UKIP 1,943 1.9
London Socialist Alliance LSA 1,299 1.3
Campaign Against Tube Privatisation CATP 1,267 1.2
Pro-motorist and small shop PMSS 1,068 1.0
Independent (Tatchell, Peter G.) IND 975 0.9
Socialist Labour Party SLAB 816 0.8
Natural Law Party NLP 545 0.5
Communist Party of Britain COMB 534 0.5
Total 103,697 100.0
2004

Page 118 The 2004 London Elections GLA Data Management and Analysis Group
Assembly list election City and East London Constituency
2004
Votes Percentages
Local authority area Local authority area
City and Barking and City of Tower City and Barking and City of Tower Party Code East London Dagenham London Newham Hamlets East London Dagenham London Newham Hamlets
Labour LAB 39,296 10,146 430 18,294 10,426 27.9 29.0 19.0 34.1 20.8
Conservative CON 22,710 5,402 771 6,939 9,598 16.1 15.5 34.1 12.9 19.2
Respect - The Unity Coalition R 21,795 1,043 85 11,168 9,499 15.5 3.0 3.8 20.8 19.0
Liberal Democrat LD 17,526 3,318 445 4,875 8,888 12.4 9.5 19.7 9.1 17.8
United Kingdom Independence Party UKIP 12,800 6,116 141 3,477 3,066 9.1 17.5 6.2 6.5 6.1
British National Party BNP 11,434 5,820 69 2,788 2,757 8.1 16.7 3.1 5.2 5.5
Green GRE 9,384 1,602 282 3,097 4,403 6.7 4.6 12.5 5.8 8.8
Christian Peoples Alliance CPA 5,286 1,380 36 2,723 1,147 3.8 3.9 1.6 5.1 2.3
Alliance for Diversity in Community ADC 703 113 3 313 274 0.5 0.3 0.1 0.6 0.5
Total 140,934 34,940 2,262 53,674 50,058 100.0 100.0 100.0 100.0 100.0
2000
Party Code Votes Percentage
Labour LAB 44,329 40.4
Conservative CON 19,116 17.4
Liberal Democrat LD 12,526 11.4
Green GRE 10,079 9.2
British National Party BNP 7,763 7.1
Christian Peoples Alliance CPA 4,001 3.7
United Kingdom Independence Party UKIP 2,977 2.7
London Socialist Alliance LSA 1,844 1.7
Independent (Tatchell, Peter G.) IND 1,835 1.7
Campaign Against Tube Privatisation CATP 1,710 1.6
Socialist Labour Party SLAB 1,149 1.0
Pro-motorist and small shop PMSS 818 0.7
Communist Party of Britain COMB 784 0.7
Natural Law Party NLP 672 0.6
Total 109,603 100.0
2004
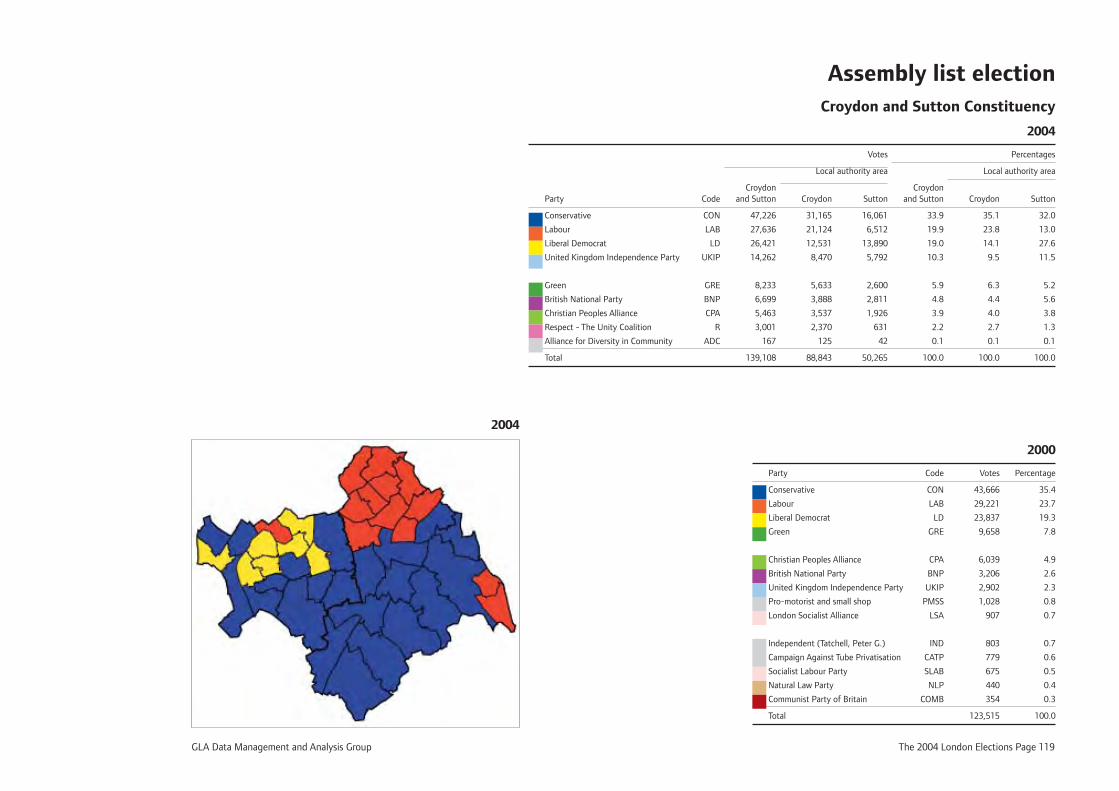
GLA Data Management and Analysis Group The 2004 London Elections Page 119
Assembly list election Croydon and Sutton Constituency
2004
Votes Percentages
Local authority area Local authority area
Croydon Croydon Party Code and Sutton Croydon Sutton and Sutton Croydon Sutton
Conservative CON 47,226 31,165 16,061 33.9 35.1 32.0
Labour LAB 27,636 21,124 6,512 19.9 23.8 13.0
Liberal Democrat LD 26,421 12,531 13,890 19.0 14.1 27.6
United Kingdom Independence Party UKIP 14,262 8,470 5,792 10.3 9.5 11.5
Green GRE 8,233 5,633 2,600 5.9 6.3 5.2
British National Party BNP 6,699 3,888 2,811 4.8 4.4 5.6
Christian Peoples Alliance CPA 5,463 3,537 1,926 3.9 4.0 3.8
Respect - The Unity Coalition R 3,001 2,370 631 2.2 2.7 1.3
Alliance for Diversity in Community ADC 167 125 42 0.1 0.1 0.1
Total 139,108 88,843 50,265 100.0 100.0 100.0
2000
Party Code Votes Percentage
Conservative CON 43,666 35.4
Labour LAB 29,221 23.7
Liberal Democrat LD 23,837 19.3
Green GRE 9,658 7.8
Christian Peoples Alliance CPA 6,039 4.9
British National Party BNP 3,206 2.6
United Kingdom Independence Party UKIP 2,902 2.3
Pro-motorist and small shop PMSS 1,028 0.8
London Socialist Alliance LSA 907 0.7
Independent (Tatchell, Peter G.) IND 803 0.7
Campaign Against Tube Privatisation CATP 779 0.6
Socialist Labour Party SLAB 675 0.5
Natural Law Party NLP 440 0.4
Communist Party of Britain COMB 354 0.3
Total 123,515 100.0
2004
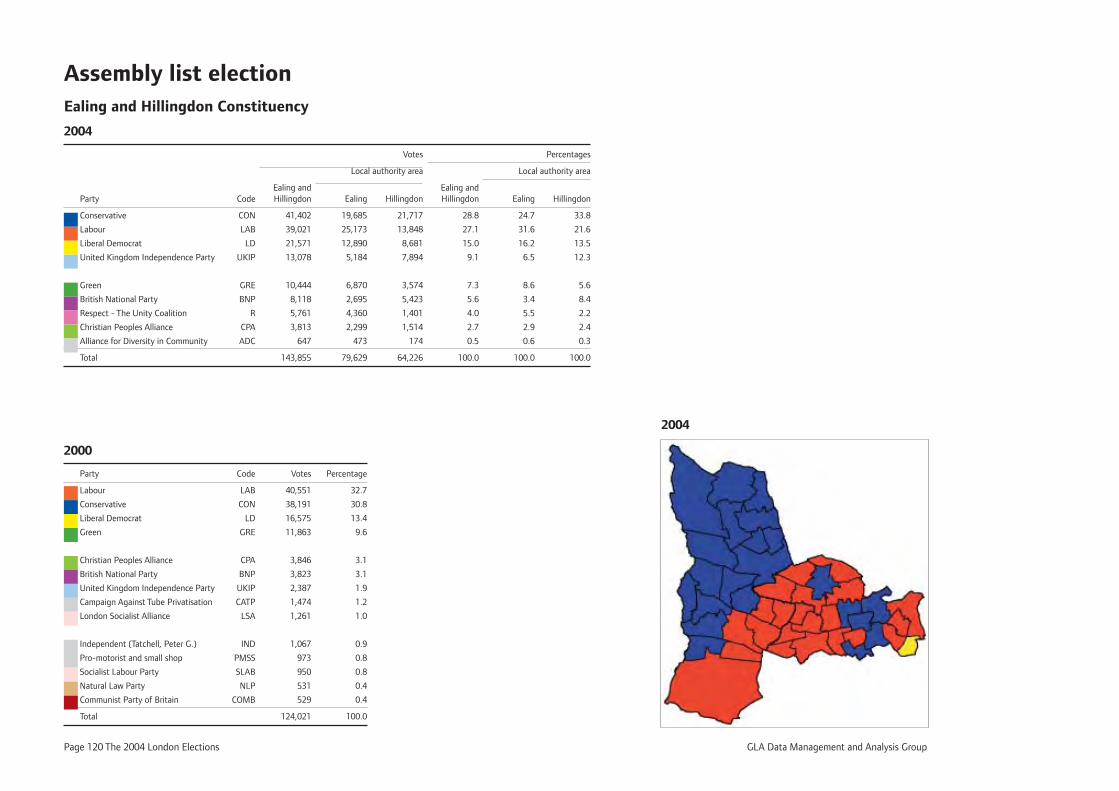
Page 120 The 2004 London Elections GLA Data Management and Analysis Group
Assembly list election Ealing and Hillingdon Constituency
2004
Votes Percentages
Local authority area Local authority area
Ealing and Ealing and Party Code Hillingdon Ealing Hillingdon Hillingdon Ealing Hillingdon
Conservative CON 41,402 19,685 21,717 28.8 24.7 33.8
Labour LAB 39,021 25,173 13,848 27.1 31.6 21.6
Liberal Democrat LD 21,571 12,890 8,681 15.0 16.2 13.5
United Kingdom Independence Party UKIP 13,078 5,184 7,894 9.1 6.5 12.3
Green GRE 10,444 6,870 3,574 7.3 8.6 5.6
British National Party BNP 8,118 2,695 5,423 5.6 3.4 8.4
Respect - The Unity Coalition R 5,761 4,360 1,401 4.0 5.5 2.2
Christian Peoples Alliance CPA 3,813 2,299 1,514 2.7 2.9 2.4
Alliance for Diversity in Community ADC 647 473 174 0.5 0.6 0.3
Total 143,855 79,629 64,226 100.0 100.0 100.0
2000
Party Code Votes Percentage
Labour LAB 40,551 32.7
Conservative CON 38,191 30.8
Liberal Democrat LD 16,575 13.4
Green GRE 11,863 9.6
Christian Peoples Alliance CPA 3,846 3.1
British National Party BNP 3,823 3.1
United Kingdom Independence Party UKIP 2,387 1.9
Campaign Against Tube Privatisation CATP 1,474 1.2
London Socialist Alliance LSA 1,261 1.0
Independent (Tatchell, Peter G.) IND 1,067 0.9
Pro-motorist and small shop PMSS 973 0.8
Socialist Labour Party SLAB 950 0.8
Natural Law Party NLP 531 0.4
Communist Party of Britain COMB 529 0.4
Total 124,021 100.0
2004
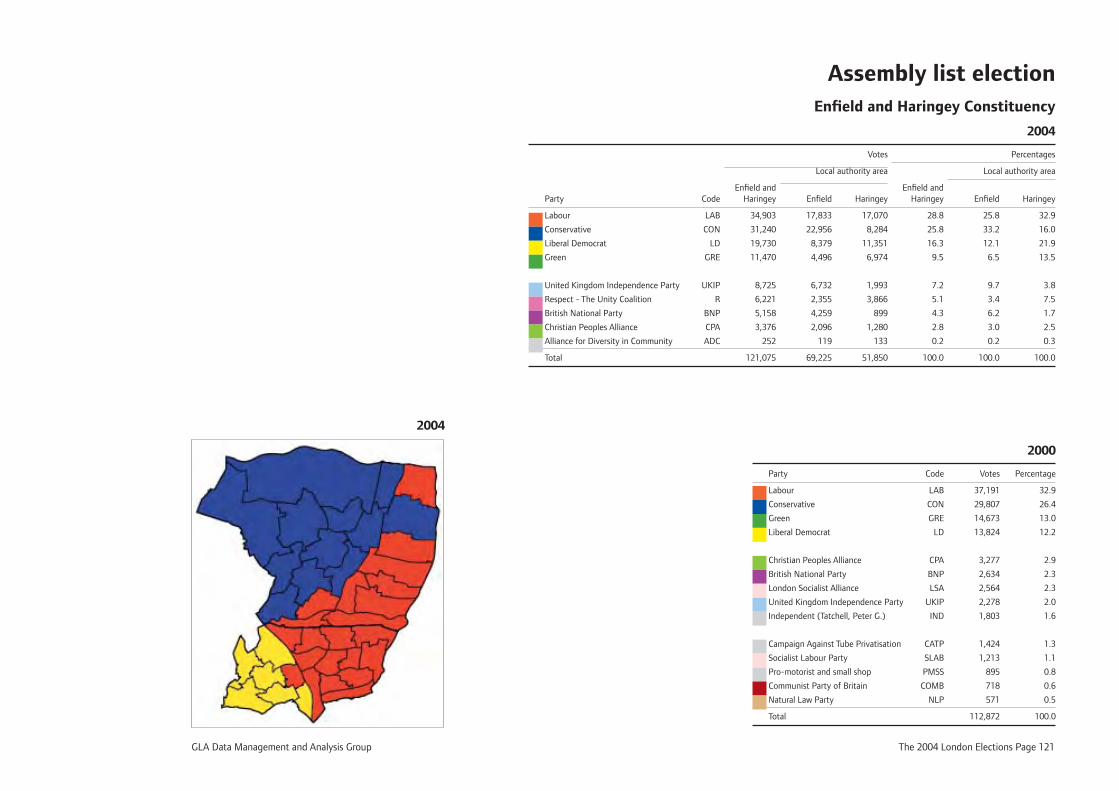
GLA Data Management and Analysis Group The 2004 London Elections Page 121
Assembly list election Enfi eld and Haringey Constituency
2004
Votes Percentages
Local authority area Local authority area
Enfi eld and Enfi eld and Party Code Haringey Enfi eld Haringey Haringey Enfi eld Haringey
Labour LAB 34,903 17,833 17,070 28.8 25.8 32.9
Conservative CON 31,240 22,956 8,284 25.8 33.2 16.0
Liberal Democrat LD 19,730 8,379 11,351 16.3 12.1 21.9
Green GRE 11,470 4,496 6,974 9.5 6.5 13.5
United Kingdom Independence Party UKIP 8,725 6,732 1,993 7.2 9.7 3.8
Respect - The Unity Coalition R 6,221 2,355 3,866 5.1 3.4 7.5
British National Party BNP 5,158 4,259 899 4.3 6.2 1.7
Christian Peoples Alliance CPA 3,376 2,096 1,280 2.8 3.0 2.5
Alliance for Diversity in Community ADC 252 119 133 0.2 0.2 0.3
Total 121,075 69,225 51,850 100.0 100.0 100.0
2000
Party Code Votes Percentage
Labour LAB 37,191 32.9
Conservative CON 29,807 26.4
Green GRE 14,673 13.0
Liberal Democrat LD 13,824 12.2
Christian Peoples Alliance CPA 3,277 2.9
British National Party BNP 2,634 2.3
London Socialist Alliance LSA 2,564 2.3
United Kingdom Independence Party UKIP 2,278 2.0
Independent (Tatchell, Peter G.) IND 1,803 1.6
Campaign Against Tube Privatisation CATP 1,424 1.3
Socialist Labour Party SLAB 1,213 1.1
Pro-motorist and small shop PMSS 895 0.8
Communist Party of Britain COMB 718 0.6
Natural Law Party NLP 571 0.5
Total 112,872 100.0
2004
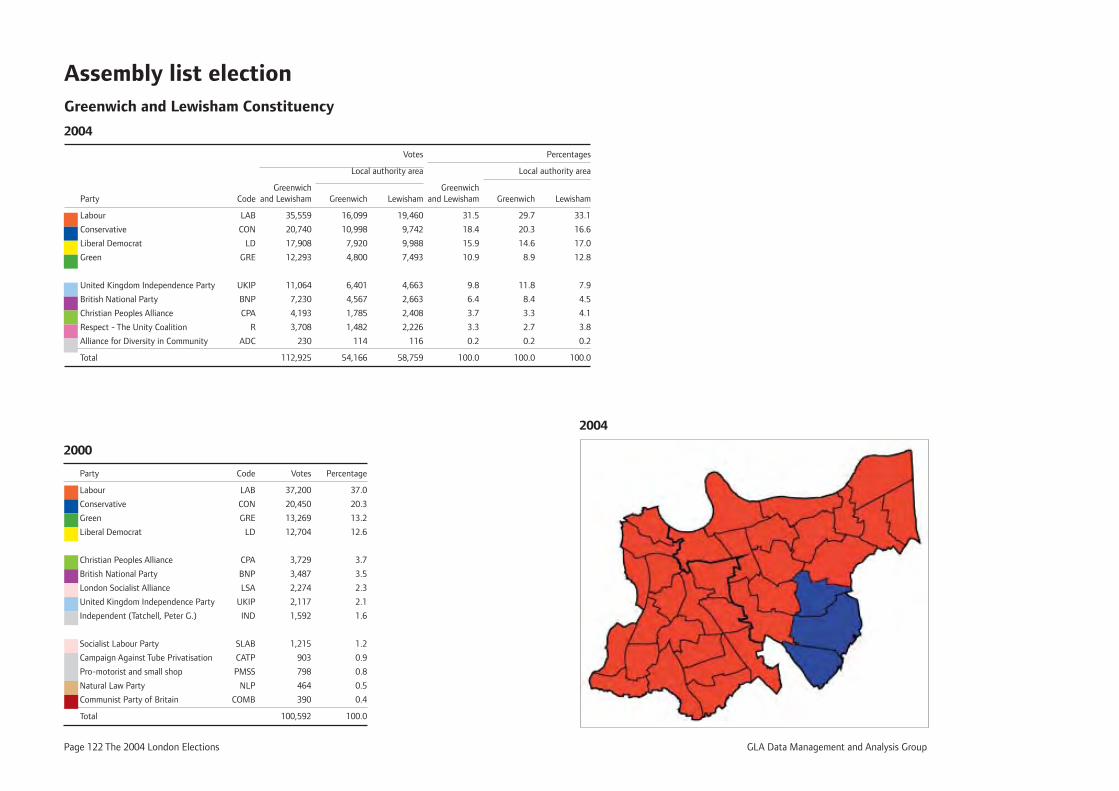
Page 122 The 2004 London Elections GLA Data Management and Analysis Group
Assembly list election Greenwich and Lewisham Constituency
2004
Votes Percentages
Local authority area Local authority area
Greenwich Greenwich Party Code and Lewisham Greenwich Lewisham and Lewisham Greenwich Lewisham
Labour LAB 35,559 16,099 19,460 31.5 29.7 33.1
Conservative CON 20,740 10,998 9,742 18.4 20.3 16.6
Liberal Democrat LD 17,908 7,920 9,988 15.9 14.6 17.0
Green GRE 12,293 4,800 7,493 10.9 8.9 12.8
United Kingdom Independence Party UKIP 11,064 6,401 4,663 9.8 11.8 7.9
British National Party BNP 7,230 4,567 2,663 6.4 8.4 4.5
Christian Peoples Alliance CPA 4,193 1,785 2,408 3.7 3.3 4.1
Respect - The Unity Coalition R 3,708 1,482 2,226 3.3 2.7 3.8
Alliance for Diversity in Community ADC 230 114 116 0.2 0.2 0.2
Total 112,925 54,166 58,759 100.0 100.0 100.0
2000
Party Code Votes Percentage
Labour LAB 37,200 37.0
Conservative CON 20,450 20.3
Green GRE 13,269 13.2
Liberal Democrat LD 12,704 12.6
Christian Peoples Alliance CPA 3,729 3.7
British National Party BNP 3,487 3.5
London Socialist Alliance LSA 2,274 2.3
United Kingdom Independence Party UKIP 2,117 2.1
Independent (Tatchell, Peter G.) IND 1,592 1.6
Socialist Labour Party SLAB 1,215 1.2
Campaign Against Tube Privatisation CATP 903 0.9
Pro-motorist and small shop PMSS 798 0.8
Natural Law Party NLP 464 0.5
Communist Party of Britain COMB 390 0.4
Total 100,592 100.0
2004
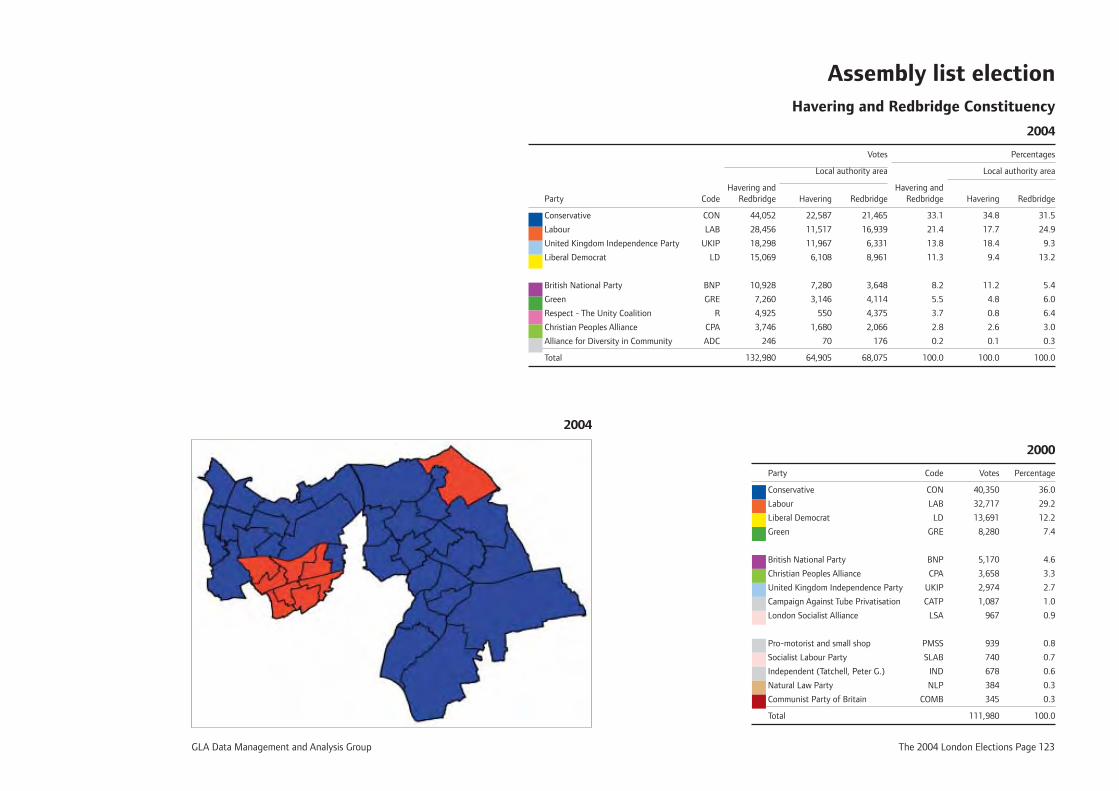
GLA Data Management and Analysis Group The 2004 London Elections Page 123
Assembly list election Havering and Redbridge Constituency
2004
Votes Percentages
Local authority area Local authority area
Havering and Havering and Party Code Redbridge Havering Redbridge Redbridge Havering Redbridge
Conservative CON 44,052 22,587 21,465 33.1 34.8 31.5
Labour LAB 28,456 11,517 16,939 21.4 17.7 24.9
United Kingdom Independence Party UKIP 18,298 11,967 6,331 13.8 18.4 9.3
Liberal Democrat LD 15,069 6,108 8,961 11.3 9.4 13.2
British National Party BNP 10,928 7,280 3,648 8.2 11.2 5.4
Green GRE 7,260 3,146 4,114 5.5 4.8 6.0
Respect - The Unity Coalition R 4,925 550 4,375 3.7 0.8 6.4
Christian Peoples Alliance CPA 3,746 1,680 2,066 2.8 2.6 3.0
Alliance for Diversity in Community ADC 246 70 176 0.2 0.1 0.3
Total 132,980 64,905 68,075 100.0 100.0 100.0
2000
Party Code Votes Percentage
Conservative CON 40,350 36.0
Labour LAB 32,717 29.2
Liberal Democrat LD 13,691 12.2
Green GRE 8,280 7.4
British National Party BNP 5,170 4.6
Christian Peoples Alliance CPA 3,658 3.3
United Kingdom Independence Party UKIP 2,974 2.7
Campaign Against Tube Privatisation CATP 1,087 1.0
London Socialist Alliance LSA 967 0.9
Pro-motorist and small shop PMSS 939 0.8
Socialist Labour Party SLAB 740 0.7
Independent (Tatchell, Peter G.) IND 678 0.6
Natural Law Party NLP 384 0.3
Communist Party of Britain COMB 345 0.3
Total 111,980 100.0
2004
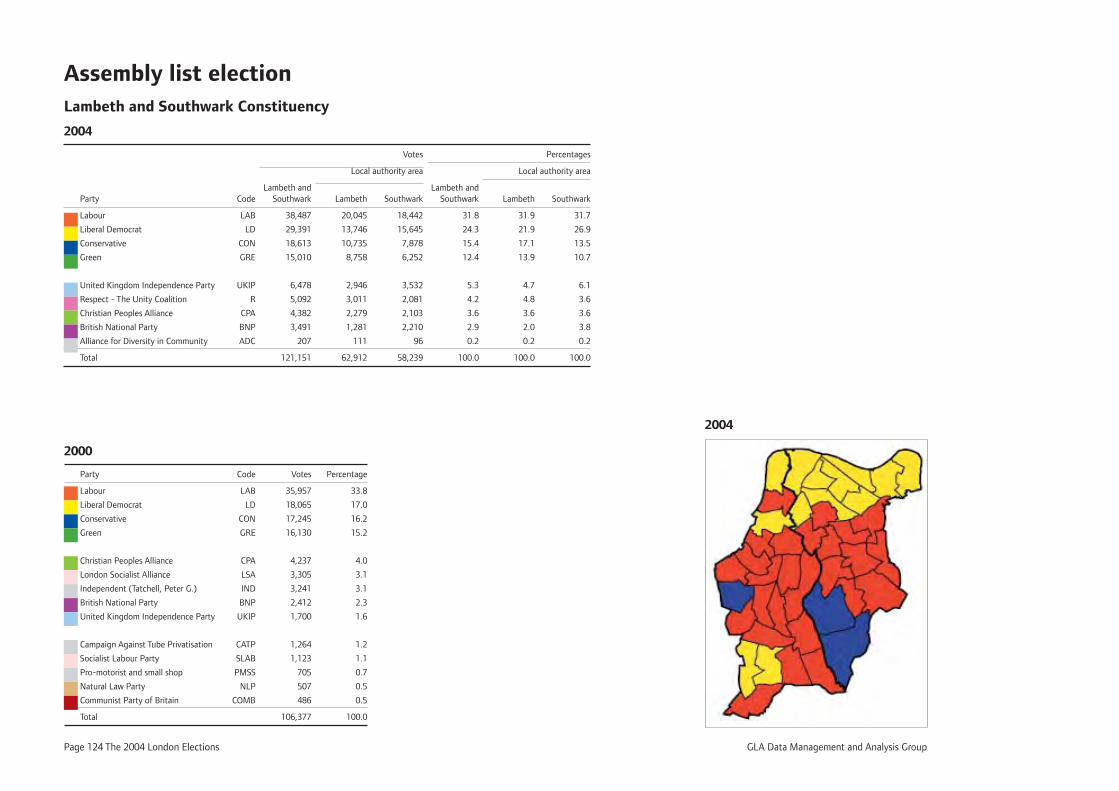
Page 124 The 2004 London Elections GLA Data Management and Analysis Group
Assembly list election Lambeth and Southwark Constituency
2004
Votes Percentages
Local authority area Local authority area
Lambeth and Lambeth and Party Code Southwark Lambeth Southwark Southwark Lambeth Southwark
Labour LAB 38,487 20,045 18,442 31.8 31.9 31.7
Liberal Democrat LD 29,391 13,746 15,645 24.3 21.9 26.9
Conservative CON 18,613 10,735 7,878 15.4 17.1 13.5
Green GRE 15,010 8,758 6,252 12.4 13.9 10.7
United Kingdom Independence Party UKIP 6,478 2,946 3,532 5.3 4.7 6.1
Respect - The Unity Coalition R 5,092 3,011 2,081 4.2 4.8 3.6
Christian Peoples Alliance CPA 4,382 2,279 2,103 3.6 3.6 3.6
British National Party BNP 3,491 1,281 2,210 2.9 2.0 3.8
Alliance for Diversity in Community ADC 207 111 96 0.2 0.2 0.2
Total 121,151 62,912 58,239 100.0 100.0 100.0
2000
Party Code Votes Percentage
Labour LAB 35,957 33.8
Liberal Democrat LD 18,065 17.0
Conservative CON 17,245 16.2
Green GRE 16,130 15.2
Christian Peoples Alliance CPA 4,237 4.0
London Socialist Alliance LSA 3,305 3.1
Independent (Tatchell, Peter G.) IND 3,241 3.1
British National Party BNP 2,412 2.3
United Kingdom Independence Party UKIP 1,700 1.6
Campaign Against Tube Privatisation CATP 1,264 1.2
Socialist Labour Party SLAB 1,123 1.1
Pro-motorist and small shop PMSS 705 0.7
Natural Law Party NLP 507 0.5
Communist Party of Britain COMB 486 0.5
Total 106,377 100.0
2004
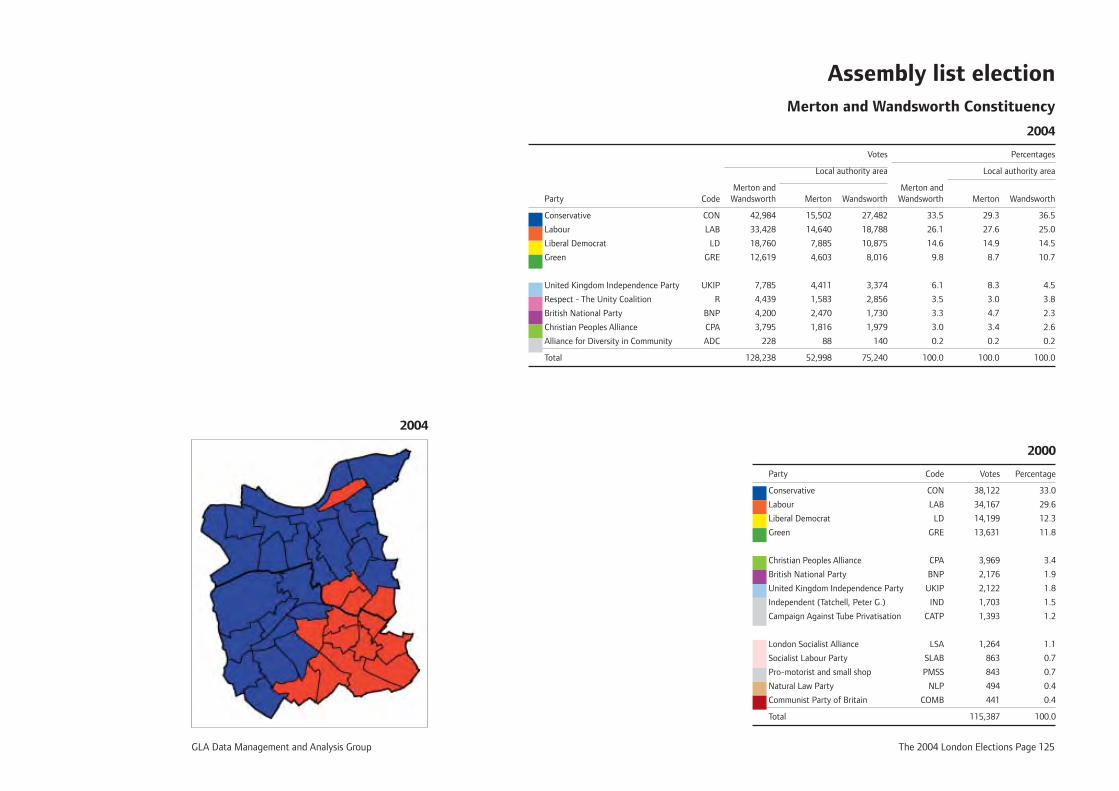
GLA Data Management and Analysis Group The 2004 London Elections Page 125
Assembly list election Merton and Wandsworth Constituency
2004
Votes Percentages
Local authority area Local authority area
Merton and Merton and Party Code Wandsworth Merton Wandsworth Wandsworth Merton Wandsworth
Conservative CON 42,984 15,502 27,482 33.5 29.3 36.5
Labour LAB 33,428 14,640 18,788 26.1 27.6 25.0
Liberal Democrat LD 18,760 7,885 10,875 14.6 14.9 14.5
Green GRE 12,619 4,603 8,016 9.8 8.7 10.7
United Kingdom Independence Party UKIP 7,785 4,411 3,374 6.1 8.3 4.5
Respect - The Unity Coalition R 4,439 1,583 2,856 3.5 3.0 3.8
British National Party BNP 4,200 2,470 1,730 3.3 4.7 2.3
Christian Peoples Alliance CPA 3,795 1,816 1,979 3.0 3.4 2.6
Alliance for Diversity in Community ADC 228 88 140 0.2 0.2 0.2
Total 128,238 52,998 75,240 100.0 100.0 100.0
2000
Party Code Votes Percentage
Conservative CON 38,122 33.0
Labour LAB 34,167 29.6
Liberal Democrat LD 14,199 12.3
Green GRE 13,631 11.8
Christian Peoples Alliance CPA 3,969 3.4
British National Party BNP 2,176 1.9
United Kingdom Independence Party UKIP 2,122 1.8
Independent (Tatchell, Peter G.) IND 1,703 1.5
Campaign Against Tube Privatisation CATP 1,393 1.2
London Socialist Alliance LSA 1,264 1.1
Socialist Labour Party SLAB 863 0.7
Pro-motorist and small shop PMSS 843 0.7
Natural Law Party NLP 494 0.4
Communist Party of Britain COMB 441 0.4
Total 115,387 100.0
2004
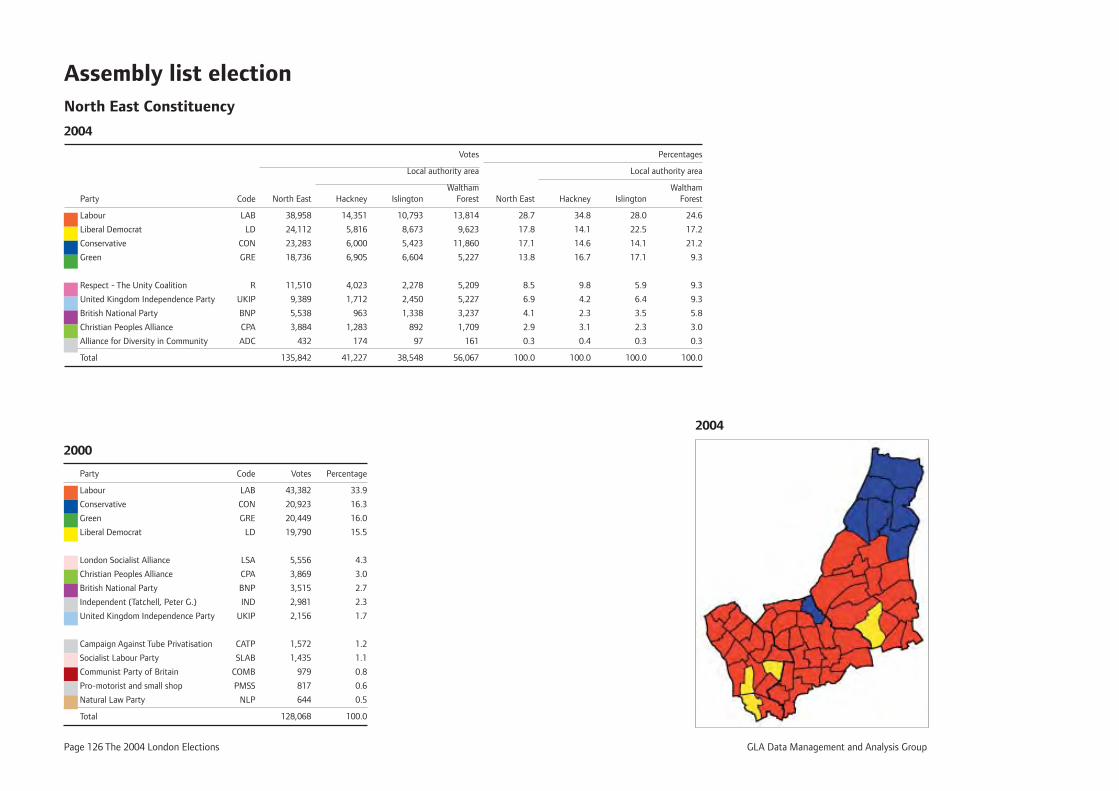
Page 126 The 2004 London Elections GLA Data Management and Analysis Group
Assembly list electionNorth East Constituency
2004
Votes Percentages
Local authority area Local authority area
Waltham Waltham Party Code North East Hackney Islington Forest North East Hackney Islington Forest
Labour LAB 38,958 14,351 10,793 13,814 28.7 34.8 28.0 24.6
Liberal Democrat LD 24,112 5,816 8,673 9,623 17.8 14.1 22.5 17.2
Conservative CON 23,283 6,000 5,423 11,860 17.1 14.6 14.1 21.2
Green GRE 18,736 6,905 6,604 5,227 13.8 16.7 17.1 9.3
Respect - The Unity Coalition R 11,510 4,023 2,278 5,209 8.5 9.8 5.9 9.3
United Kingdom Independence Party UKIP 9,389 1,712 2,450 5,227 6.9 4.2 6.4 9.3
British National Party BNP 5,538 963 1,338 3,237 4.1 2.3 3.5 5.8
Christian Peoples Alliance CPA 3,884 1,283 892 1,709 2.9 3.1 2.3 3.0
Alliance for Diversity in Community ADC 432 174 97 161 0.3 0.4 0.3 0.3
Total 135,842 41,227 38,548 56,067 100.0 100.0 100.0 100.0
2000
Party Code Votes Percentage
Labour LAB 43,382 33.9
Conservative CON 20,923 16.3
Green GRE 20,449 16.0
Liberal Democrat LD 19,790 15.5
London Socialist Alliance LSA 5,556 4.3
Christian Peoples Alliance CPA 3,869 3.0
British National Party BNP 3,515 2.7
Independent (Tatchell, Peter G.) IND 2,981 2.3
United Kingdom Independence Party UKIP 2,156 1.7
Campaign Against Tube Privatisation CATP 1,572 1.2
Socialist Labour Party SLAB 1,435 1.1
Communist Party of Britain COMB 979 0.8
Pro-motorist and small shop PMSS 817 0.6
Natural Law Party NLP 644 0.5
Total 128,068 100.0
2004
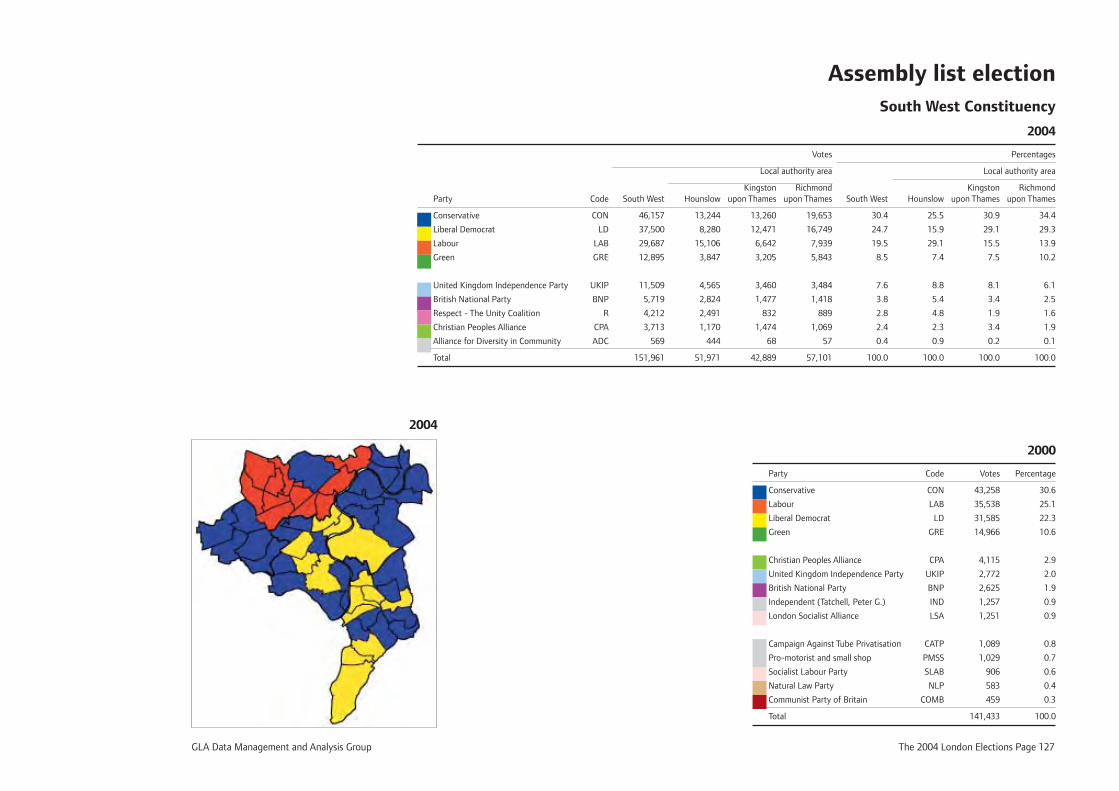
GLA Data Management and Analysis Group The 2004 London Elections Page 127
Assembly list election South West Constituency
2004
Votes Percentages
Local authority area Local authority area
Kingston Richmond Kingston Richmond Party Code South West Hounslow upon Thames upon Thames South West Hounslow upon Thames upon Thames
Conservative CON 46,157 13,244 13,260 19,653 30.4 25.5 30.9 34.4
Liberal Democrat LD 37,500 8,280 12,471 16,749 24.7 15.9 29.1 29.3
Labour LAB 29,687 15,106 6,642 7,939 19.5 29.1 15.5 13.9
Green GRE 12,895 3,847 3,205 5,843 8.5 7.4 7.5 10.2
United Kingdom Independence Party UKIP 11,509 4,565 3,460 3,484 7.6 8.8 8.1 6.1
British National Party BNP 5,719 2,824 1,477 1,418 3.8 5.4 3.4 2.5
Respect - The Unity Coalition R 4,212 2,491 832 889 2.8 4.8 1.9 1.6
Christian Peoples Alliance CPA 3,713 1,170 1,474 1,069 2.4 2.3 3.4 1.9
Alliance for Diversity in Community ADC 569 444 68 57 0.4 0.9 0.2 0.1
Total 151,961 51,971 42,889 57,101 100.0 100.0 100.0 100.0
2000
Party Code Votes Percentage
Conservative CON 43,258 30.6
Labour LAB 35,538 25.1
Liberal Democrat LD 31,585 22.3
Green GRE 14,966 10.6
Christian Peoples Alliance CPA 4,115 2.9
United Kingdom Independence Party UKIP 2,772 2.0
British National Party BNP 2,625 1.9
Independent (Tatchell, Peter G.) IND 1,257 0.9
London Socialist Alliance LSA 1,251 0.9
Campaign Against Tube Privatisation CATP 1,089 0.8
Pro-motorist and small shop PMSS 1,029 0.7
Socialist Labour Party SLAB 906 0.6
Natural Law Party NLP 583 0.4
Communist Party of Britain COMB 459 0.3
Total 141,433 100.0
2004
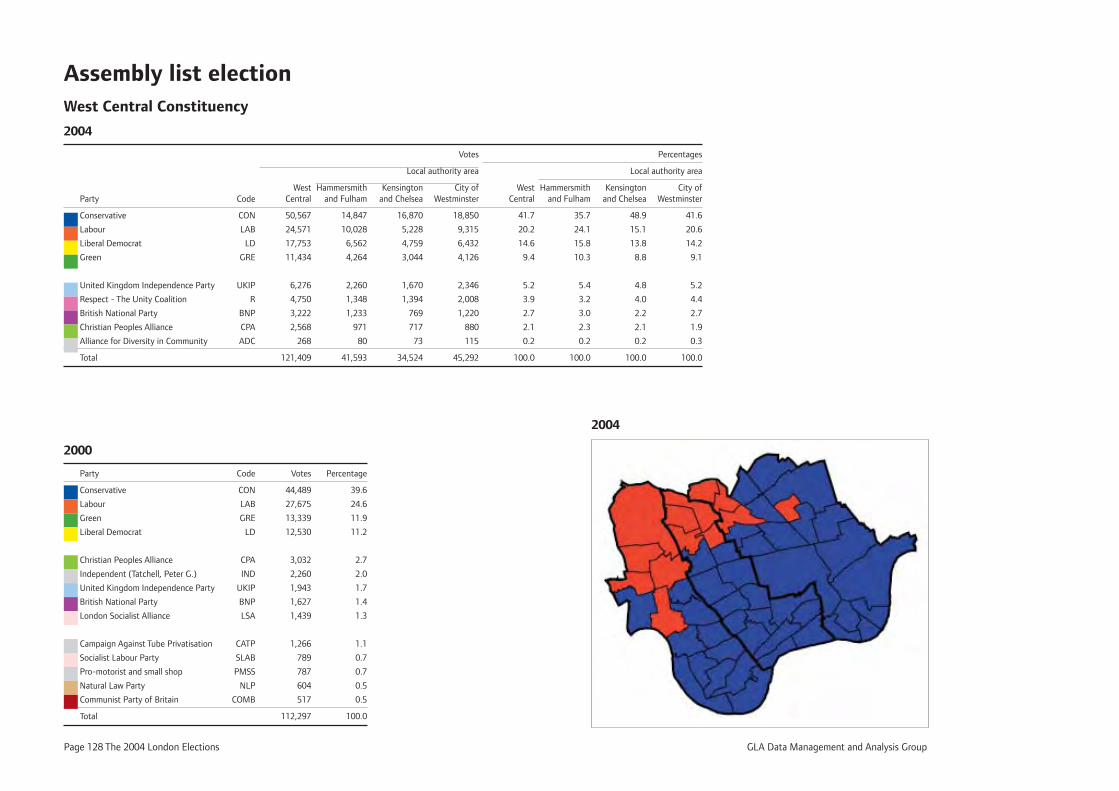
Page 128 The 2004 London Elections GLA Data Management and Analysis Group
Assembly list electionWest Central Constituency
2004
Votes Percentages
Local authority area Local authority area
West Hammersmith Kensington City of West Hammersmith Kensington City of Party Code Central and Fulham and Chelsea Westminster Central and Fulham and Chelsea Westminster
Conservative CON 50,567 14,847 16,870 18,850 41.7 35.7 48.9 41.6
Labour LAB 24,571 10,028 5,228 9,315 20.2 24.1 15.1 20.6
Liberal Democrat LD 17,753 6,562 4,759 6,432 14.6 15.8 13.8 14.2
Green GRE 11,434 4,264 3,044 4,126 9.4 10.3 8.8 9.1
United Kingdom Independence Party UKIP 6,276 2,260 1,670 2,346 5.2 5.4 4.8 5.2
Respect - The Unity Coalition R 4,750 1,348 1,394 2,008 3.9 3.2 4.0 4.4
British National Party BNP 3,222 1,233 769 1,220 2.7 3.0 2.2 2.7
Christian Peoples Alliance CPA 2,568 971 717 880 2.1 2.3 2.1 1.9
Alliance for Diversity in Community ADC 268 80 73 115 0.2 0.2 0.2 0.3
Total 121,409 41,593 34,524 45,292 100.0 100.0 100.0 100.0
2000
Party Code Votes Percentage
Conservative CON 44,489 39.6
Labour LAB 27,675 24.6
Green GRE 13,339 11.9
Liberal Democrat LD 12,530 11.2
Christian Peoples Alliance CPA 3,032 2.7
Independent (Tatchell, Peter G.) IND 2,260 2.0
United Kingdom Independence Party UKIP 1,943 1.7
British National Party BNP 1,627 1.4
London Socialist Alliance LSA 1,439 1.3
Campaign Against Tube Privatisation CATP 1,266 1.1
Socialist Labour Party SLAB 789 0.7
Pro-motorist and small shop PMSS 787 0.7
Natural Law Party NLP 604 0.5
Communist Party of Britain COMB 517 0.5
Total 112,297 100.0
2004
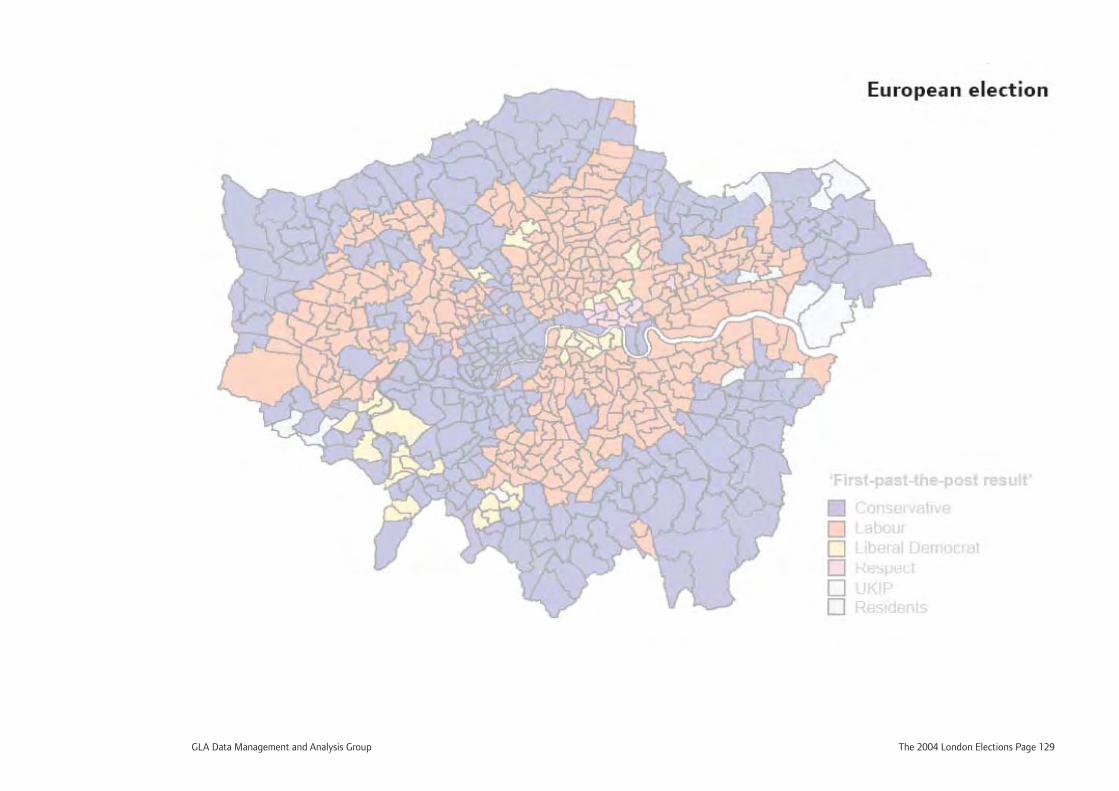
GLA Data Management and Analysis Group The 2004 London Elections Page 129
European election

Page 130 The 2004 London Elections GLA Data Management and Analysis Group
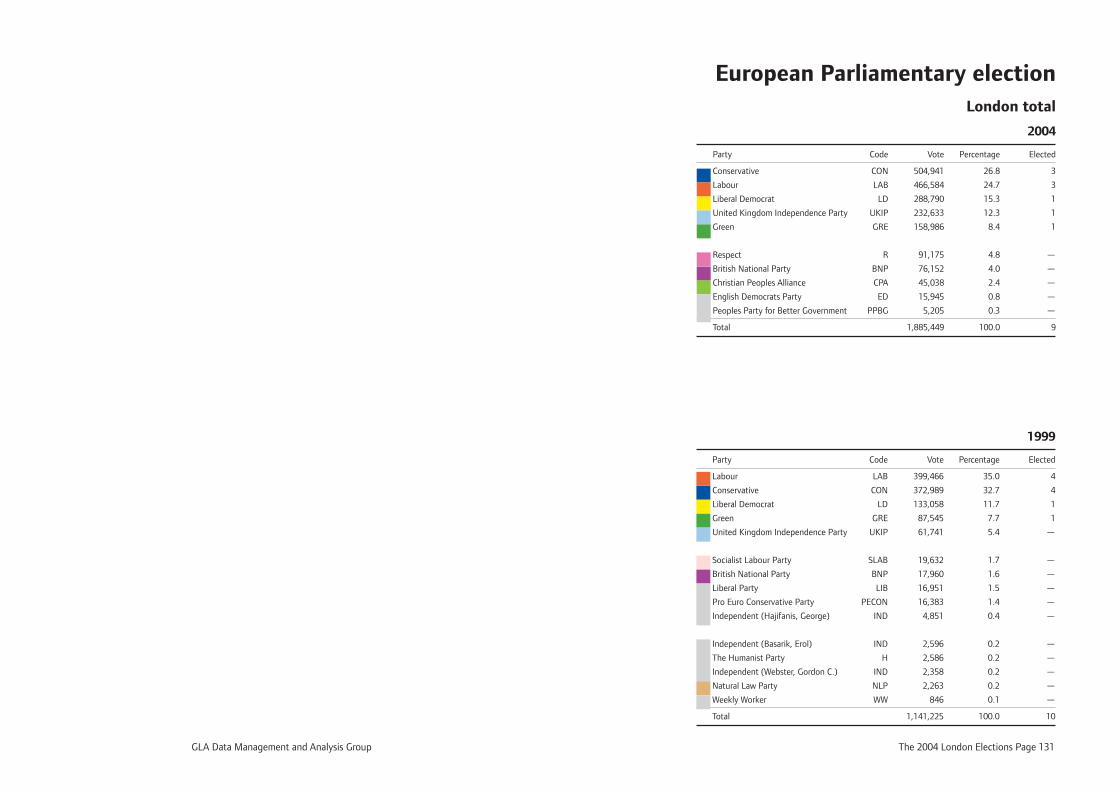
GLA Data Management and Analysis Group The 2004 London Elections Page 131
European Parliamentary election London total
2004
Party Code Vote Percentage Elected
Conservative CON 504,941 26.8 3
Labour LAB 466,584 24.7 3
Liberal Democrat LD 288,790 15.3 1
United Kingdom Independence Party UKIP 232,633 12.3 1
Green GRE 158,986 8.4 1
Respect R 91,175 4.8 —
British National Party BNP 76,152 4.0 —
Christian Peoples Alliance CPA 45,038 2.4 —
English Democrats Party ED 15,945 0.8 —
Peoples Party for Better Government PPBG 5,205 0.3 —
Total 1,885,449 100.0 9
1999
Party Code Vote Percentage Elected
Labour LAB 399,466 35.0 4
Conservative CON 372,989 32.7 4
Liberal Democrat LD 133,058 11.7 1
Green GRE 87,545 7.7 1
United Kingdom Independence Party UKIP 61,741 5.4 —
Socialist Labour Party SLAB 19,632 1.7 —
British National Party BNP 17,960 1.6 —
Liberal Party LIB 16,951 1.5 —
Pro Euro Conservative Party PECON 16,383 1.4 —
Independent (Hajifanis, George) IND 4,851 0.4 —
Independent (Basarik, Erol) IND 2,596 0.2 —
The Humanist Party H 2,586 0.2 —
Independent (Webster, Gordon C.) IND 2,358 0.2 —
Natural Law Party NLP 2,263 0.2 —
Weekly Worker WW 846 0.1 —
Total 1,141,225 100.0 10
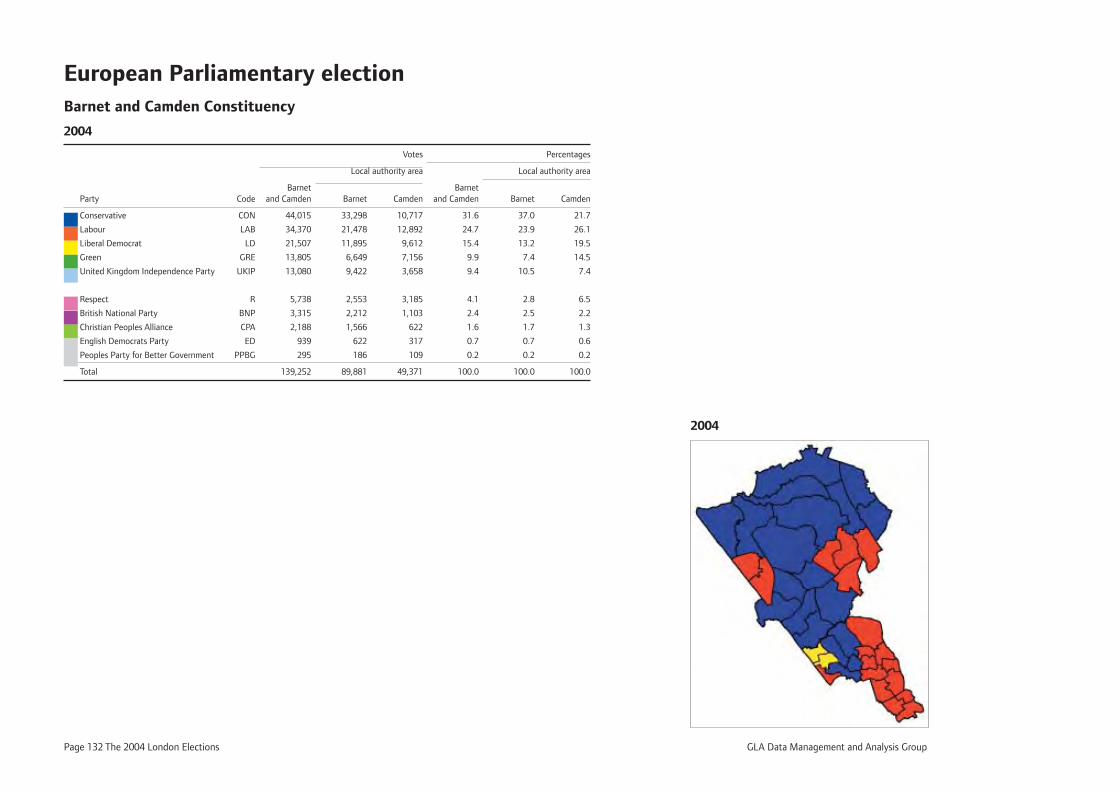
Page 132 The 2004 London Elections GLA Data Management and Analysis Group
European Parliamentary election Barnet and Camden Constituency
2004
Votes Percentages
Local authority area Local authority area
Barnet Barnet Party Code and Camden Barnet Camden and Camden Barnet Camden
Conservative CON 44,015 33,298 10,717 31.6 37.0 21.7
Labour LAB 34,370 21,478 12,892 24.7 23.9 26.1
Liberal Democrat LD 21,507 11,895 9,612 15.4 13.2 19.5
Green GRE 13,805 6,649 7,156 9.9 7.4 14.5
United Kingdom Independence Party UKIP 13,080 9,422 3,658 9.4 10.5 7.4
Respect R 5,738 2,553 3,185 4.1 2.8 6.5
British National Party BNP 3,315 2,212 1,103 2.4 2.5 2.2
Christian Peoples Alliance CPA 2,188 1,566 622 1.6 1.7 1.3
English Democrats Party ED 939 622 317 0.7 0.7 0.6
Peoples Party for Better Government PPBG 295 186 109 0.2 0.2 0.2
Total 139,252 89,881 49,371 100.0 100.0 100.0
2004
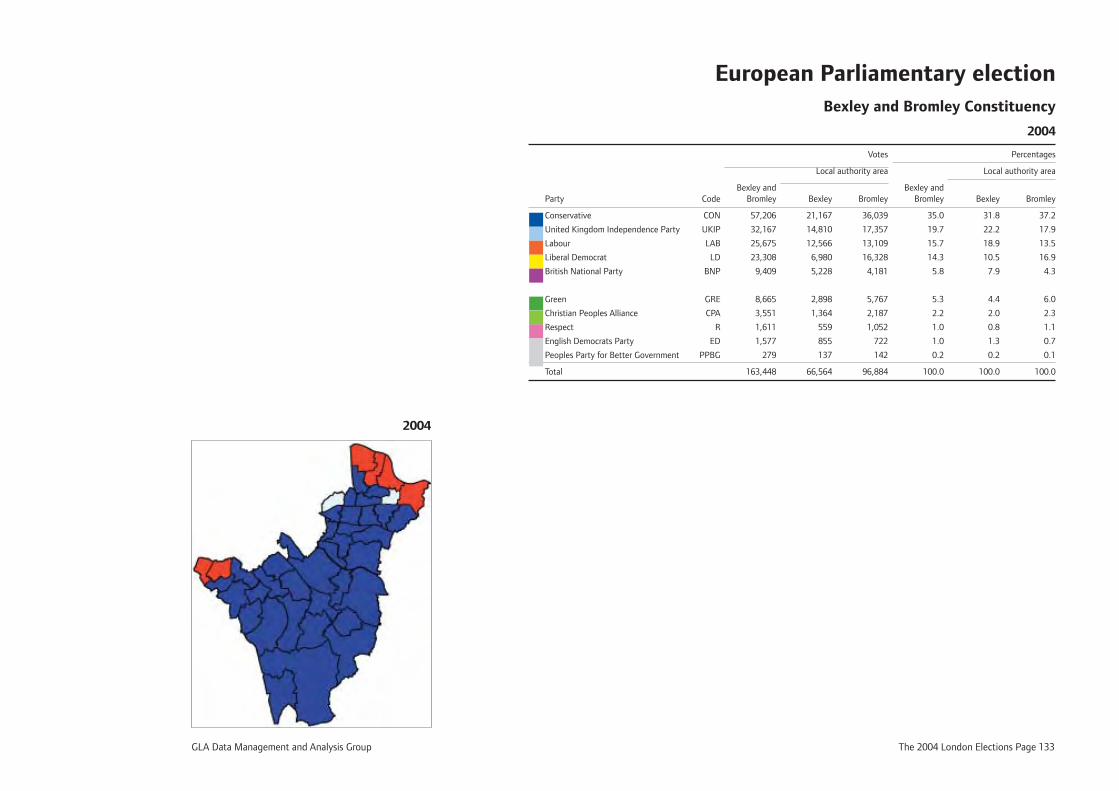
GLA Data Management and Analysis Group The 2004 London Elections Page 133
European Parliamentary election Bexley and Bromley Constituency
2004
Votes Percentages
Local authority area Local authority area
Bexley and Bexley and Party Code Bromley Bexley Bromley Bromley Bexley Bromley
Conservative CON 57,206 21,167 36,039 35.0 31.8 37.2
United Kingdom Independence Party UKIP 32,167 14,810 17,357 19.7 22.2 17.9
Labour LAB 25,675 12,566 13,109 15.7 18.9 13.5
Liberal Democrat LD 23,308 6,980 16,328 14.3 10.5 16.9
British National Party BNP 9,409 5,228 4,181 5.8 7.9 4.3
Green GRE 8,665 2,898 5,767 5.3 4.4 6.0
Christian Peoples Alliance CPA 3,551 1,364 2,187 2.2 2.0 2.3
Respect R 1,611 559 1,052 1.0 0.8 1.1
English Democrats Party ED 1,577 855 722 1.0 1.3 0.7
Peoples Party for Better Government PPBG 279 137 142 0.2 0.2 0.1
Total 163,448 66,564 96,884 100.0 100.0 100.0
2004
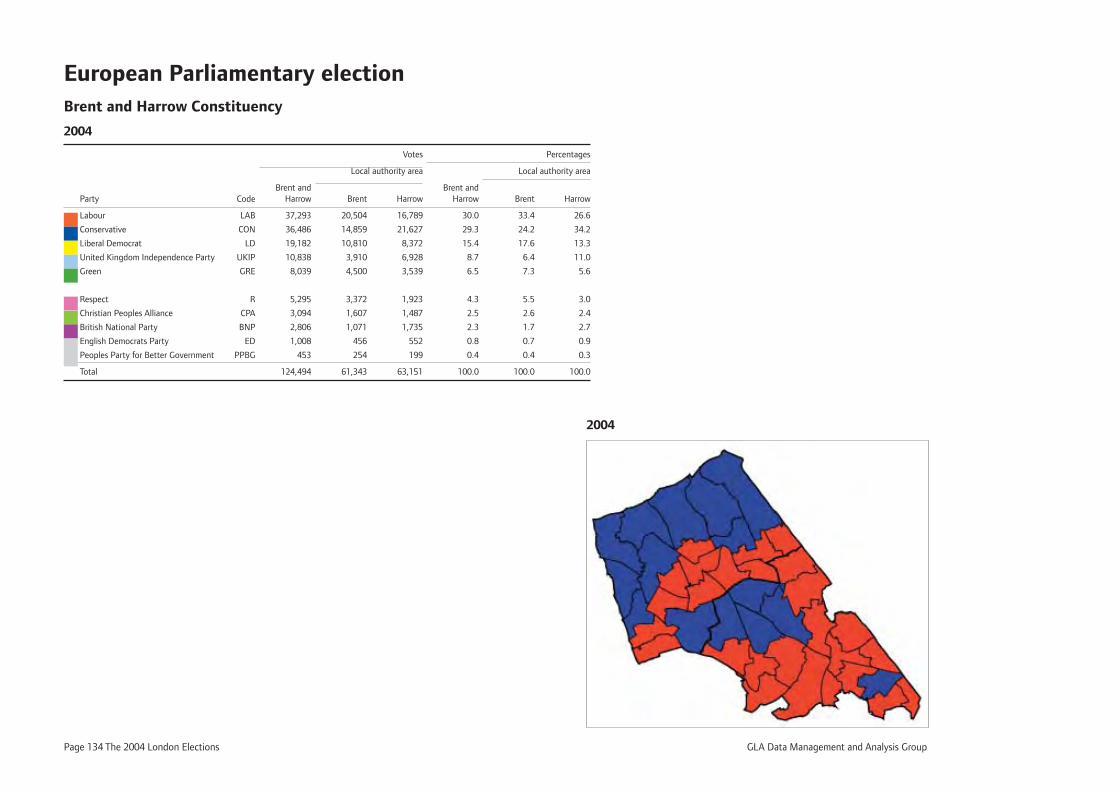
Page 134 The 2004 London Elections GLA Data Management and Analysis Group
European Parliamentary election Brent and Harrow Constituency
2004
Votes Percentages
Local authority area Local authority area
Brent and Brent and Party Code Harrow Brent Harrow Harrow Brent Harrow
Labour LAB 37,293 20,504 16,789 30.0 33.4 26.6
Conservative CON 36,486 14,859 21,627 29.3 24.2 34.2
Liberal Democrat LD 19,182 10,810 8,372 15.4 17.6 13.3
United Kingdom Independence Party UKIP 10,838 3,910 6,928 8.7 6.4 11.0
Green GRE 8,039 4,500 3,539 6.5 7.3 5.6
Respect R 5,295 3,372 1,923 4.3 5.5 3.0
Christian Peoples Alliance CPA 3,094 1,607 1,487 2.5 2.6 2.4
British National Party BNP 2,806 1,071 1,735 2.3 1.7 2.7
English Democrats Party ED 1,008 456 552 0.8 0.7 0.9
Peoples Party for Better Government PPBG 453 254 199 0.4 0.4 0.3
Total 124,494 61,343 63,151 100.0 100.0 100.0
2004
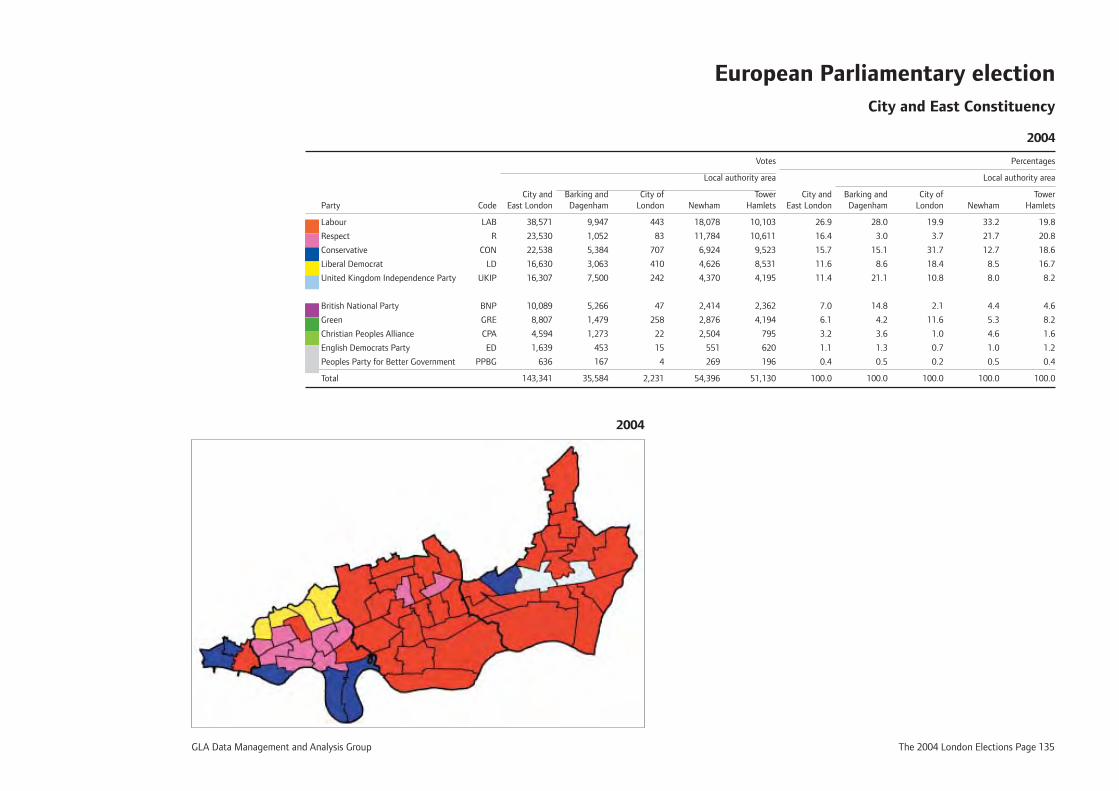
GLA Data Management and Analysis Group The 2004 London Elections Page 135
European Parliamentary election City and East Constituency
2004
Votes Percentages
Local authority area Local authority area
City and Barking and City of Tower City and Barking and City of Tower Party Code East London Dagenham London Newham Hamlets East London Dagenham London Newham Hamlets
Labour LAB 38,571 9,947 443 18,078 10,103 26.9 28.0 19.9 33.2 19.8
Respect R 23,530 1,052 83 11,784 10,611 16.4 3.0 3.7 21.7 20.8
Conservative CON 22,538 5,384 707 6,924 9,523 15.7 15.1 31.7 12.7 18.6
Liberal Democrat LD 16,630 3,063 410 4,626 8,531 11.6 8.6 18.4 8.5 16.7
United Kingdom Independence Party UKIP 16,307 7,500 242 4,370 4,195 11.4 21.1 10.8 8.0 8.2
British National Party BNP 10,089 5,266 47 2,414 2,362 7.0 14.8 2.1 4.4 4.6
Green GRE 8,807 1,479 258 2,876 4,194 6.1 4.2 11.6 5.3 8.2
Christian Peoples Alliance CPA 4,594 1,273 22 2,504 795 3.2 3.6 1.0 4.6 1.6
English Democrats Party ED 1,639 453 15 551 620 1.1 1.3 0.7 1.0 1.2
Peoples Party for Better Government PPBG 636 167 4 269 196 0.4 0.5 0.2 0.5 0.4
Total 143,341 35,584 2,231 54,396 51,130 100.0 100.0 100.0 100.0 100.0
2004
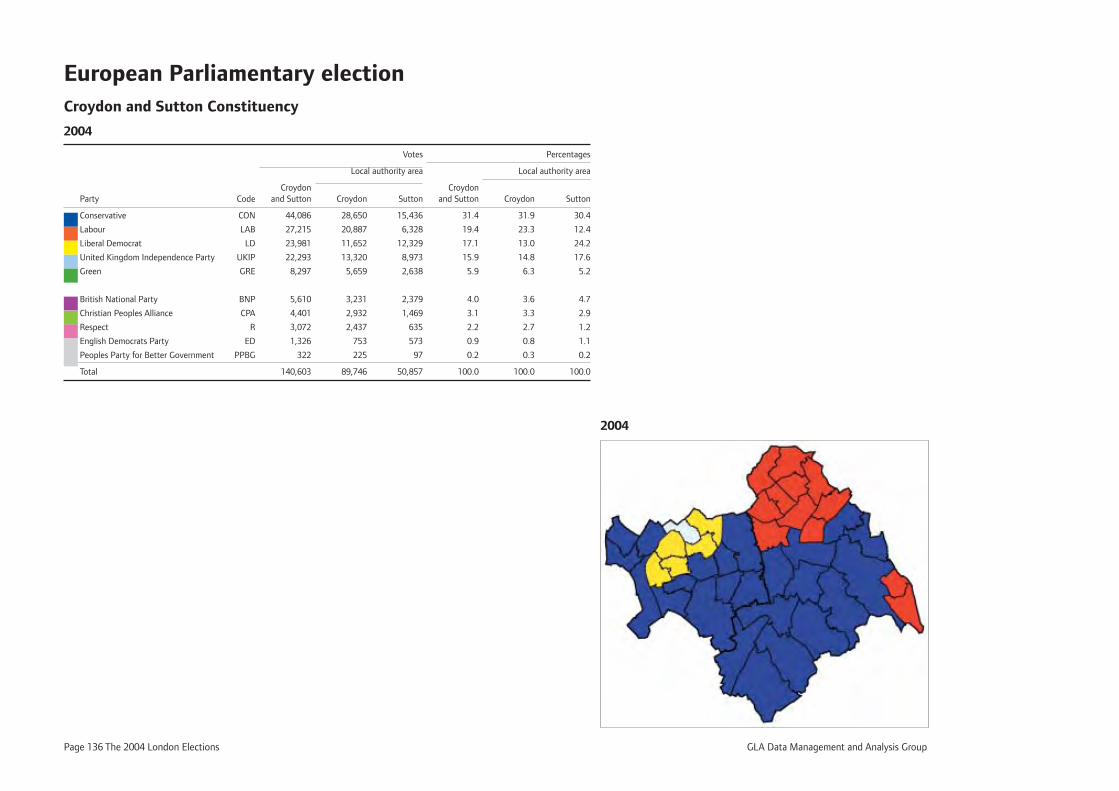
Page 136 The 2004 London Elections GLA Data Management and Analysis Group
European Parliamentary election Croydon and Sutton Constituency
2004
Votes Percentages
Local authority area Local authority area
Croydon Croydon Party Code and Sutton Croydon Sutton and Sutton Croydon Sutton
Conservative CON 44,086 28,650 15,436 31.4 31.9 30.4
Labour LAB 27,215 20,887 6,328 19.4 23.3 12.4
Liberal Democrat LD 23,981 11,652 12,329 17.1 13.0 24.2
United Kingdom Independence Party UKIP 22,293 13,320 8,973 15.9 14.8 17.6
Green GRE 8,297 5,659 2,638 5.9 6.3 5.2
British National Party BNP 5,610 3,231 2,379 4.0 3.6 4.7
Christian Peoples Alliance CPA 4,401 2,932 1,469 3.1 3.3 2.9
Respect R 3,072 2,437 635 2.2 2.7 1.2
English Democrats Party ED 1,326 753 573 0.9 0.8 1.1
Peoples Party for Better Government PPBG 322 225 97 0.2 0.3 0.2
Total 140,603 89,746 50,857 100.0 100.0 100.0
2004
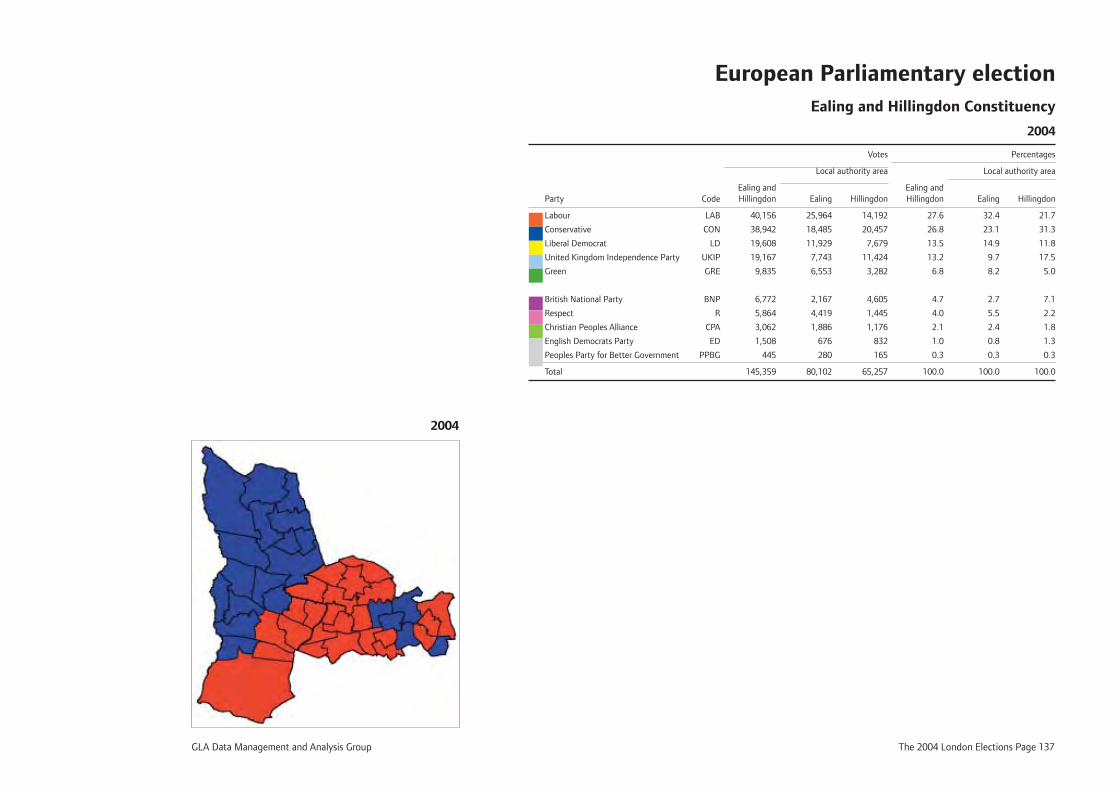
GLA Data Management and Analysis Group The 2004 London Elections Page 137
European Parliamentary election Ealing and Hillingdon Constituency
2004
Votes Percentages
Local authority area Local authority area
Ealing and Ealing and Party Code Hillingdon Ealing Hillingdon Hillingdon Ealing Hillingdon
Labour LAB 40,156 25,964 14,192 27.6 32.4 21.7
Conservative CON 38,942 18,485 20,457 26.8 23.1 31.3
Liberal Democrat LD 19,608 11,929 7,679 13.5 14.9 11.8
United Kingdom Independence Party UKIP 19,167 7,743 11,424 13.2 9.7 17.5
Green GRE 9,835 6,553 3,282 6.8 8.2 5.0
British National Party BNP 6,772 2,167 4,605 4.7 2.7 7.1
Respect R 5,864 4,419 1,445 4.0 5.5 2.2
Christian Peoples Alliance CPA 3,062 1,886 1,176 2.1 2.4 1.8
English Democrats Party ED 1,508 676 832 1.0 0.8 1.3
Peoples Party for Better Government PPBG 445 280 165 0.3 0.3 0.3
Total 145,359 80,102 65,257 100.0 100.0 100.0
2004
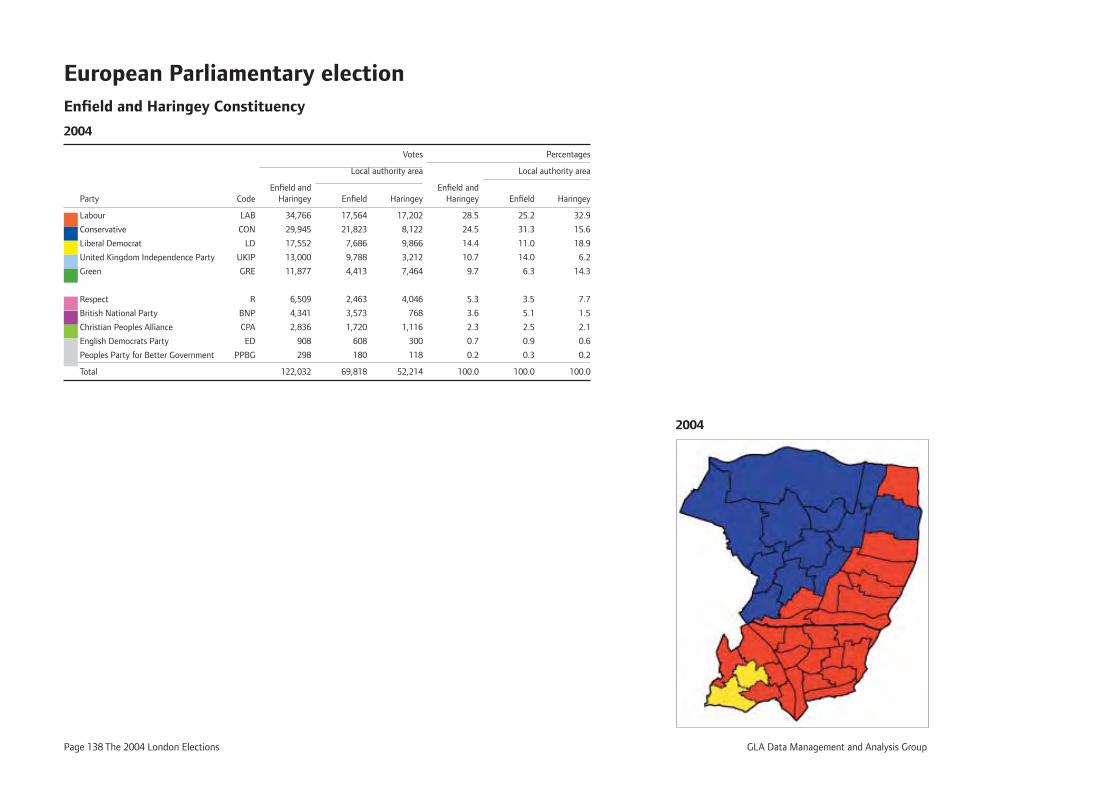
Page 138 The 2004 London Elections GLA Data Management and Analysis Group
European Parliamentary election Enfi eld and Haringey Constituency
2004
Votes Percentages
Local authority area Local authority area
Enfi eld and Enfi eld and Party Code Haringey Enfi eld Haringey Haringey Enfi eld Haringey
Labour LAB 34,766 17,564 17,202 28.5 25.2 32.9
Conservative CON 29,945 21,823 8,122 24.5 31.3 15.6
Liberal Democrat LD 17,552 7,686 9,866 14.4 11.0 18.9
United Kingdom Independence Party UKIP 13,000 9,788 3,212 10.7 14.0 6.2
Green GRE 11,877 4,413 7,464 9.7 6.3 14.3
Respect R 6,509 2,463 4,046 5.3 3.5 7.7
British National Party BNP 4,341 3,573 768 3.6 5.1 1.5
Christian Peoples Alliance CPA 2,836 1,720 1,116 2.3 2.5 2.1
English Democrats Party ED 908 608 300 0.7 0.9 0.6
Peoples Party for Better Government PPBG 298 180 118 0.2 0.3 0.2
Total 122,032 69,818 52,214 100.0 100.0 100.0
2004
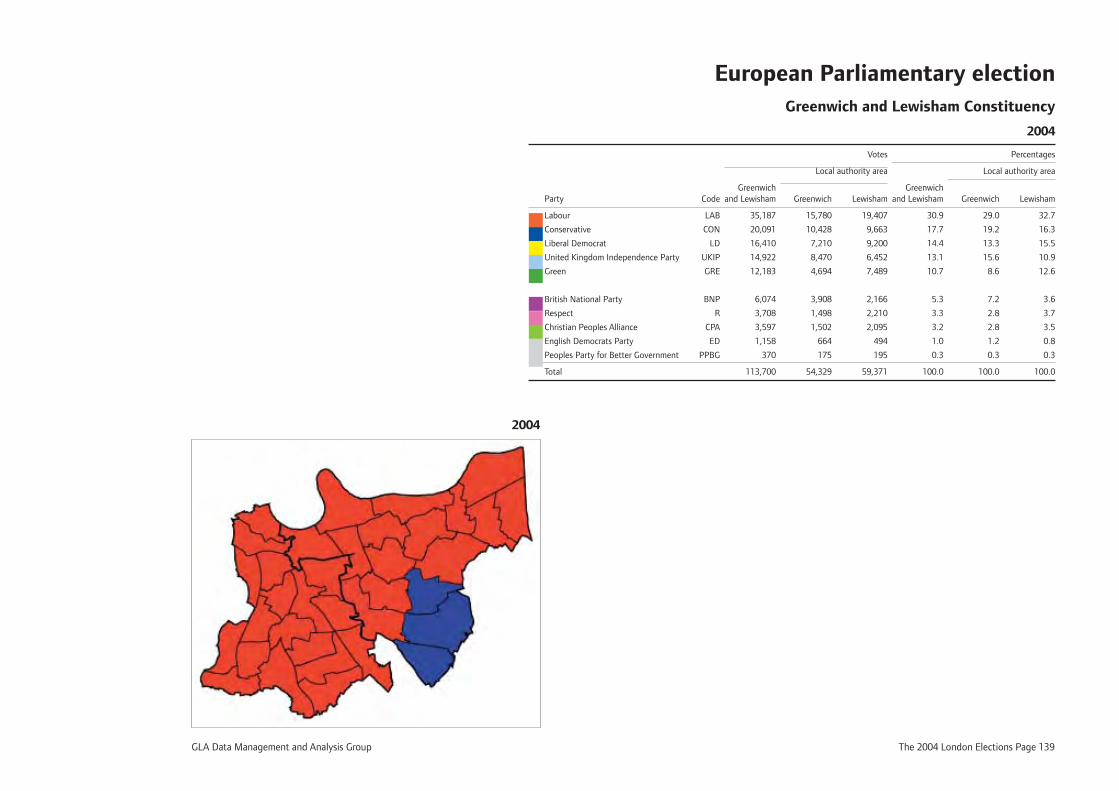
GLA Data Management and Analysis Group The 2004 London Elections Page 139
European Parliamentary election Greenwich and Lewisham Constituency
2004
Votes Percentages
Local authority area Local authority area
Greenwich Greenwich Party Code and Lewisham Greenwich Lewisham and Lewisham Greenwich Lewisham
Labour LAB 35,187 15,780 19,407 30.9 29.0 32.7
Conservative CON 20,091 10,428 9,663 17.7 19.2 16.3
Liberal Democrat LD 16,410 7,210 9,200 14.4 13.3 15.5
United Kingdom Independence Party UKIP 14,922 8,470 6,452 13.1 15.6 10.9
Green GRE 12,183 4,694 7,489 10.7 8.6 12.6
British National Party BNP 6,074 3,908 2,166 5.3 7.2 3.6
Respect R 3,708 1,498 2,210 3.3 2.8 3.7
Christian Peoples Alliance CPA 3,597 1,502 2,095 3.2 2.8 3.5
English Democrats Party ED 1,158 664 494 1.0 1.2 0.8
Peoples Party for Better Government PPBG 370 175 195 0.3 0.3 0.3
Total 113,700 54,329 59,371 100.0 100.0 100.0
2004
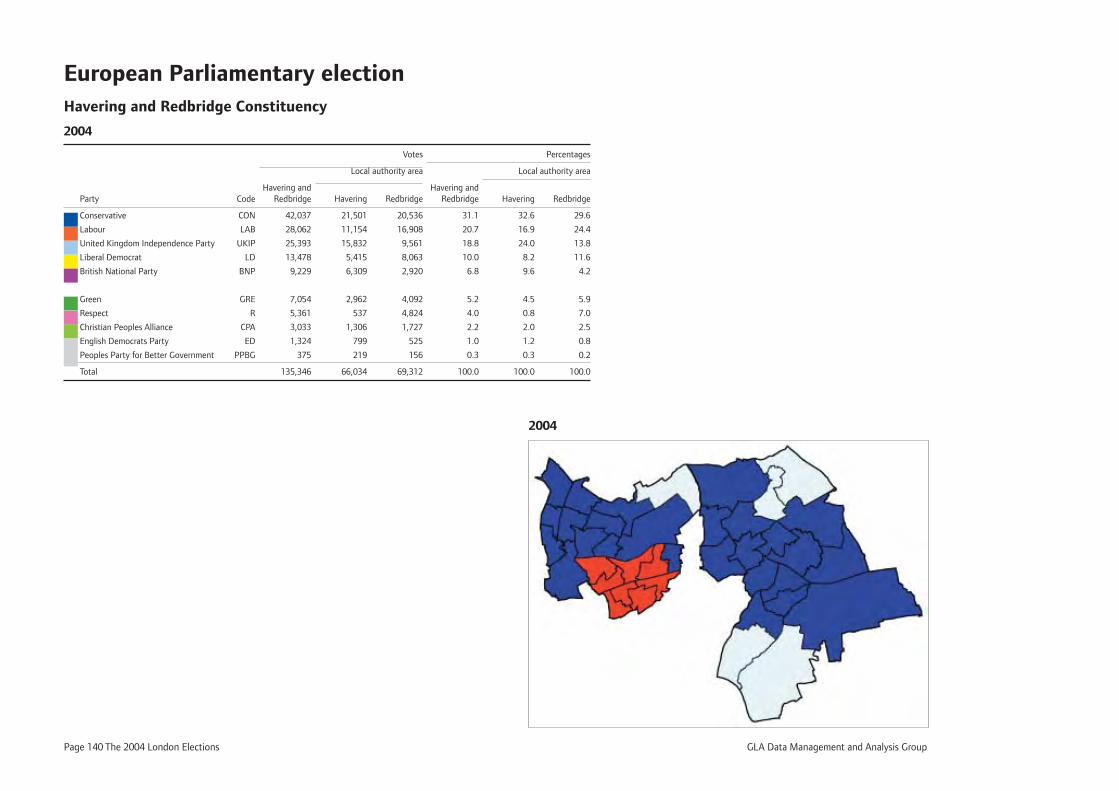
Page 140 The 2004 London Elections GLA Data Management and Analysis Group
European Parliamentary election Havering and Redbridge Constituency
2004
Votes Percentages
Local authority area Local authority area
Havering and Havering and Party Code Redbridge Havering Redbridge Redbridge Havering Redbridge
Conservative CON 42,037 21,501 20,536 31.1 32.6 29.6
Labour LAB 28,062 11,154 16,908 20.7 16.9 24.4
United Kingdom Independence Party UKIP 25,393 15,832 9,561 18.8 24.0 13.8
Liberal Democrat LD 13,478 5,415 8,063 10.0 8.2 11.6
British National Party BNP 9,229 6,309 2,920 6.8 9.6 4.2
Green GRE 7,054 2,962 4,092 5.2 4.5 5.9
Respect R 5,361 537 4,824 4.0 0.8 7.0
Christian Peoples Alliance CPA 3,033 1,306 1,727 2.2 2.0 2.5
English Democrats Party ED 1,324 799 525 1.0 1.2 0.8
Peoples Party for Better Government PPBG 375 219 156 0.3 0.3 0.2
Total 135,346 66,034 69,312 100.0 100.0 100.0
2004
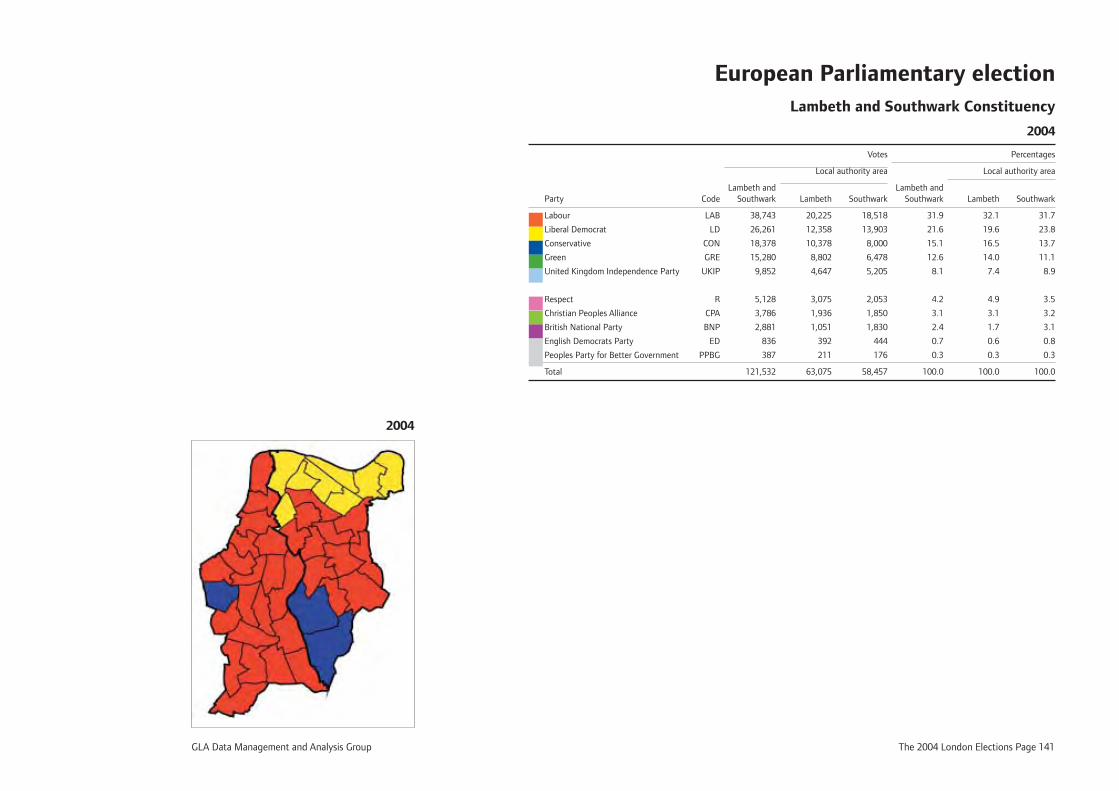
GLA Data Management and Analysis Group The 2004 London Elections Page 141
European Parliamentary election Lambeth and Southwark Constituency
2004
Votes Percentages
Local authority area Local authority area
Lambeth and Lambeth and Party Code Southwark Lambeth Southwark Southwark Lambeth Southwark
Labour LAB 38,743 20,225 18,518 31.9 32.1 31.7
Liberal Democrat LD 26,261 12,358 13,903 21.6 19.6 23.8
Conservative CON 18,378 10,378 8,000 15.1 16.5 13.7
Green GRE 15,280 8,802 6,478 12.6 14.0 11.1
United Kingdom Independence Party UKIP 9,852 4,647 5,205 8.1 7.4 8.9
Respect R 5,128 3,075 2,053 4.2 4.9 3.5
Christian Peoples Alliance CPA 3,786 1,936 1,850 3.1 3.1 3.2
British National Party BNP 2,881 1,051 1,830 2.4 1.7 3.1
English Democrats Party ED 836 392 444 0.7 0.6 0.8
Peoples Party for Better Government PPBG 387 211 176 0.3 0.3 0.3
Total 121,532 63,075 58,457 100.0 100.0 100.0
2004
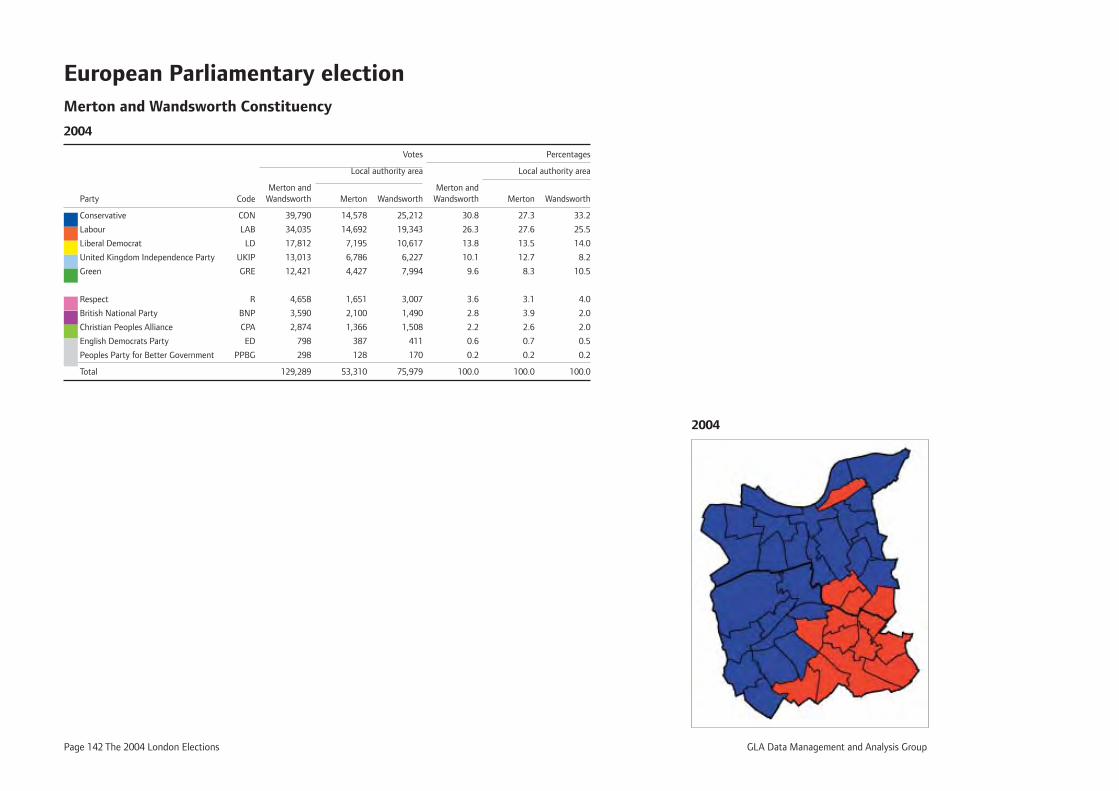
Page 142 The 2004 London Elections GLA Data Management and Analysis Group
European Parliamentary election Merton and Wandsworth Constituency
2004
Votes Percentages
Local authority area Local authority area
Merton and Merton and Party Code Wandsworth Merton Wandsworth Wandsworth Merton Wandsworth
Conservative CON 39,790 14,578 25,212 30.8 27.3 33.2
Labour LAB 34,035 14,692 19,343 26.3 27.6 25.5
Liberal Democrat LD 17,812 7,195 10,617 13.8 13.5 14.0
United Kingdom Independence Party UKIP 13,013 6,786 6,227 10.1 12.7 8.2
Green GRE 12,421 4,427 7,994 9.6 8.3 10.5
Respect R 4,658 1,651 3,007 3.6 3.1 4.0
British National Party BNP 3,590 2,100 1,490 2.8 3.9 2.0
Christian Peoples Alliance CPA 2,874 1,366 1,508 2.2 2.6 2.0
English Democrats Party ED 798 387 411 0.6 0.7 0.5
Peoples Party for Better Government PPBG 298 128 170 0.2 0.2 0.2
Total 129,289 53,310 75,979 100.0 100.0 100.0
2004
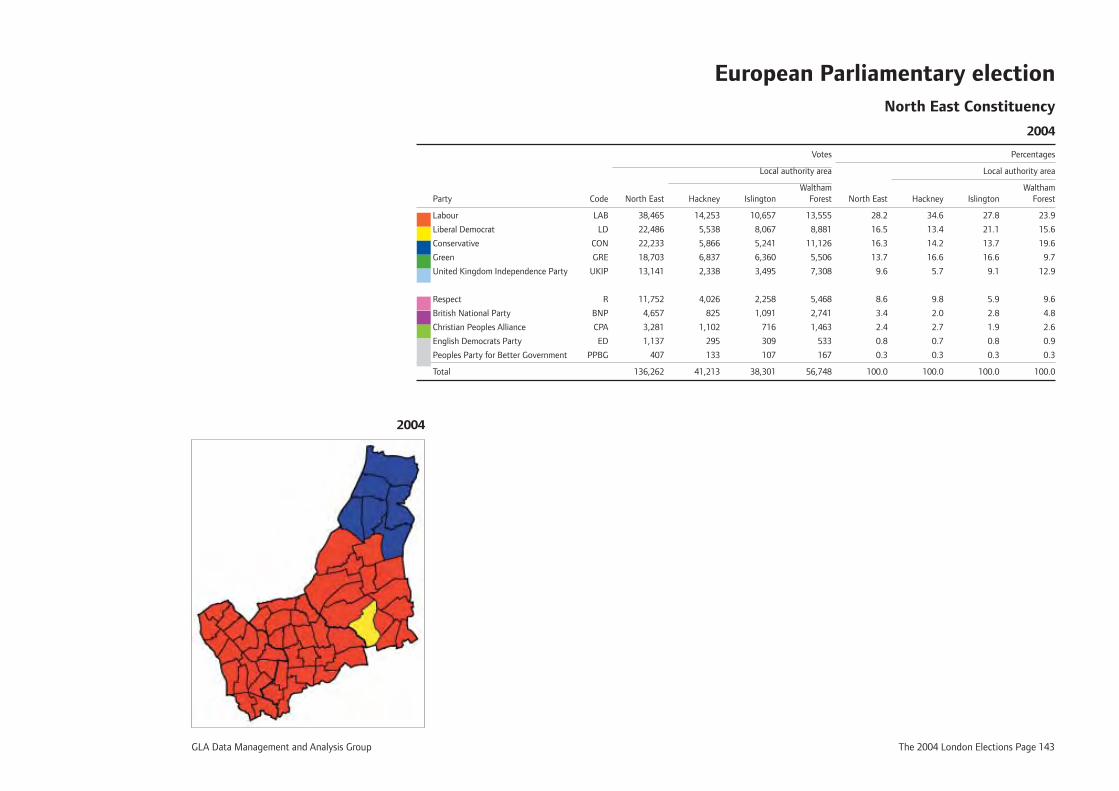
GLA Data Management and Analysis Group The 2004 London Elections Page 143
European Parliamentary election North East Constituency
2004
Votes Percentages
Local authority area Local authority area
Waltham Waltham Party Code North East Hackney Islington Forest North East Hackney Islington Forest
Labour LAB 38,465 14,253 10,657 13,555 28.2 34.6 27.8 23.9
Liberal Democrat LD 22,486 5,538 8,067 8,881 16.5 13.4 21.1 15.6
Conservative CON 22,233 5,866 5,241 11,126 16.3 14.2 13.7 19.6
Green GRE 18,703 6,837 6,360 5,506 13.7 16.6 16.6 9.7
United Kingdom Independence Party UKIP 13,141 2,338 3,495 7,308 9.6 5.7 9.1 12.9
Respect R 11,752 4,026 2,258 5,468 8.6 9.8 5.9 9.6
British National Party BNP 4,657 825 1,091 2,741 3.4 2.0 2.8 4.8
Christian Peoples Alliance CPA 3,281 1,102 716 1,463 2.4 2.7 1.9 2.6
English Democrats Party ED 1,137 295 309 533 0.8 0.7 0.8 0.9
Peoples Party for Better Government PPBG 407 133 107 167 0.3 0.3 0.3 0.3
Total 136,262 41,213 38,301 56,748 100.0 100.0 100.0 100.0
2004
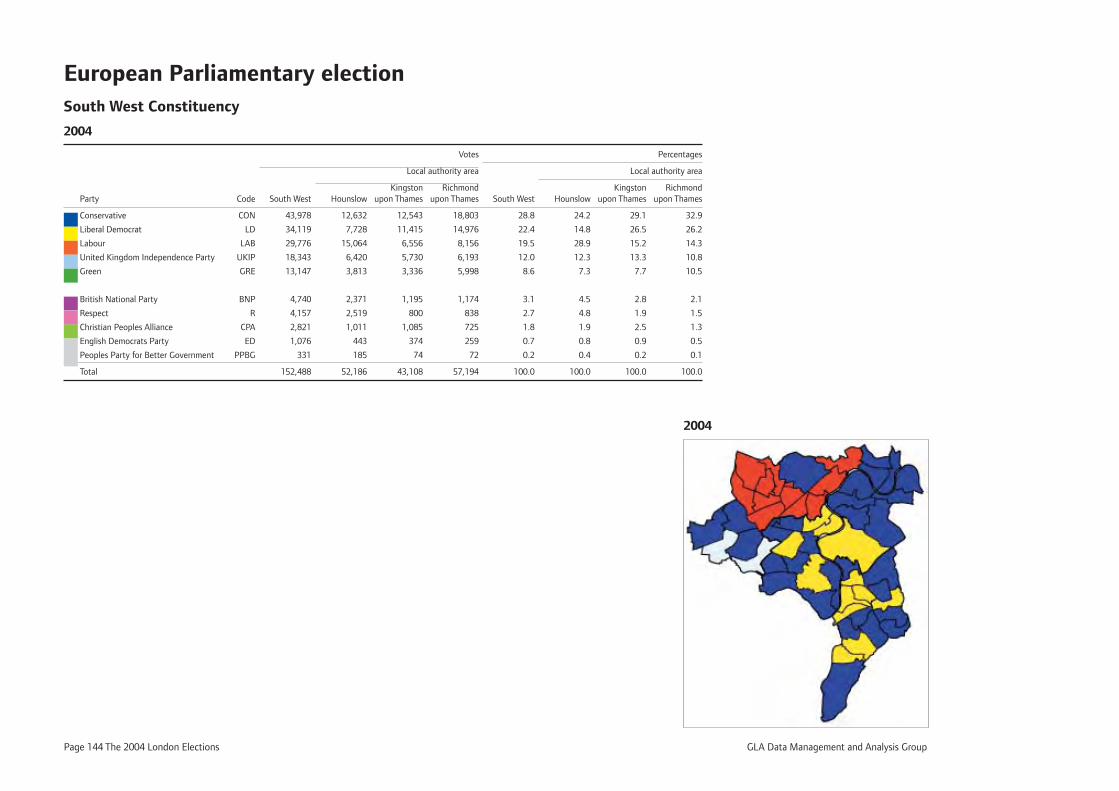
Page 144 The 2004 London Elections GLA Data Management and Analysis Group
European Parliamentary election South West Constituency
2004
Votes Percentages
Local authority area Local authority area
Kingston Richmond Kingston Richmond Party Code South West Hounslow upon Thames upon Thames South West Hounslow upon Thames upon Thames
Conservative CON 43,978 12,632 12,543 18,803 28.8 24.2 29.1 32.9
Liberal Democrat LD 34,119 7,728 11,415 14,976 22.4 14.8 26.5 26.2
Labour LAB 29,776 15,064 6,556 8,156 19.5 28.9 15.2 14.3
United Kingdom Independence Party UKIP 18,343 6,420 5,730 6,193 12.0 12.3 13.3 10.8
Green GRE 13,147 3,813 3,336 5,998 8.6 7.3 7.7 10.5
British National Party BNP 4,740 2,371 1,195 1,174 3.1 4.5 2.8 2.1
Respect R 4,157 2,519 800 838 2.7 4.8 1.9 1.5
Christian Peoples Alliance CPA 2,821 1,011 1,085 725 1.8 1.9 2.5 1.3
English Democrats Party ED 1,076 443 374 259 0.7 0.8 0.9 0.5
Peoples Party for Better Government PPBG 331 185 74 72 0.2 0.4 0.2 0.1
Total 152,488 52,186 43,108 57,194 100.0 100.0 100.0 100.0
2004
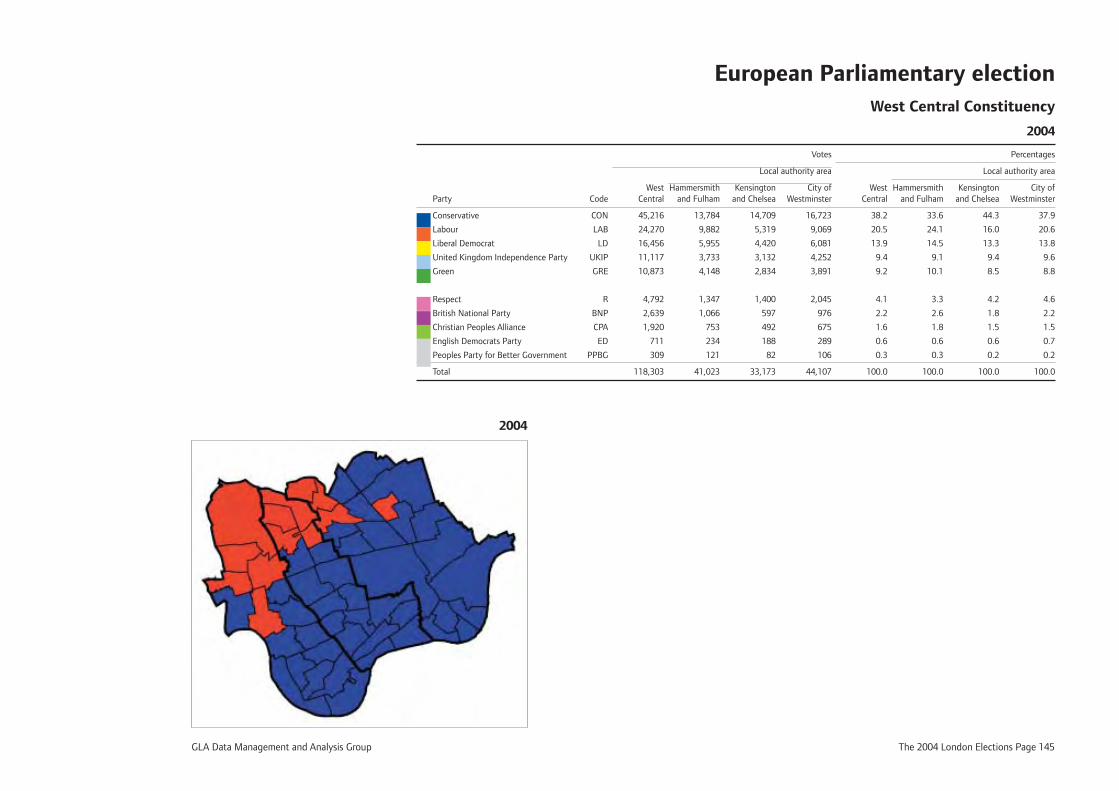
GLA Data Management and Analysis Group The 2004 London Elections Page 145
European Parliamentary election West Central Constituency
2004
Votes Percentages
Local authority area Local authority area
West Hammersmith Kensington City of West Hammersmith Kensington City of Party Code Central and Fulham and Chelsea Westminster Central and Fulham and Chelsea Westminster
Conservative CON 45,216 13,784 14,709 16,723 38.2 33.6 44.3 37.9
Labour LAB 24,270 9,882 5,319 9,069 20.5 24.1 16.0 20.6
Liberal Democrat LD 16,456 5,955 4,420 6,081 13.9 14.5 13.3 13.8
United Kingdom Independence Party UKIP 11,117 3,733 3,132 4,252 9.4 9.1 9.4 9.6
Green GRE 10,873 4,148 2,834 3,891 9.2 10.1 8.5 8.8
Respect R 4,792 1,347 1,400 2,045 4.1 3.3 4.2 4.6
British National Party BNP 2,639 1,066 597 976 2.2 2.6 1.8 2.2
Christian Peoples Alliance CPA 1,920 753 492 675 1.6 1.8 1.5 1.5
English Democrats Party ED 711 234 188 289 0.6 0.6 0.6 0.7
Peoples Party for Better Government PPBG 309 121 82 106 0.3 0.3 0.2 0.2
Total 118,303 41,023 33,173 44,107 100.0 100.0 100.0 100.0
2004

Page 146 The 2004 London Elections GLA Data Management and Analysis Group
GLA Data Management and Analysis Group The 2004 London Elections Page 147
Statistics - Assembly constituencies

Page 148 The 2004 London Elections GLA Data Management and Analysis Group
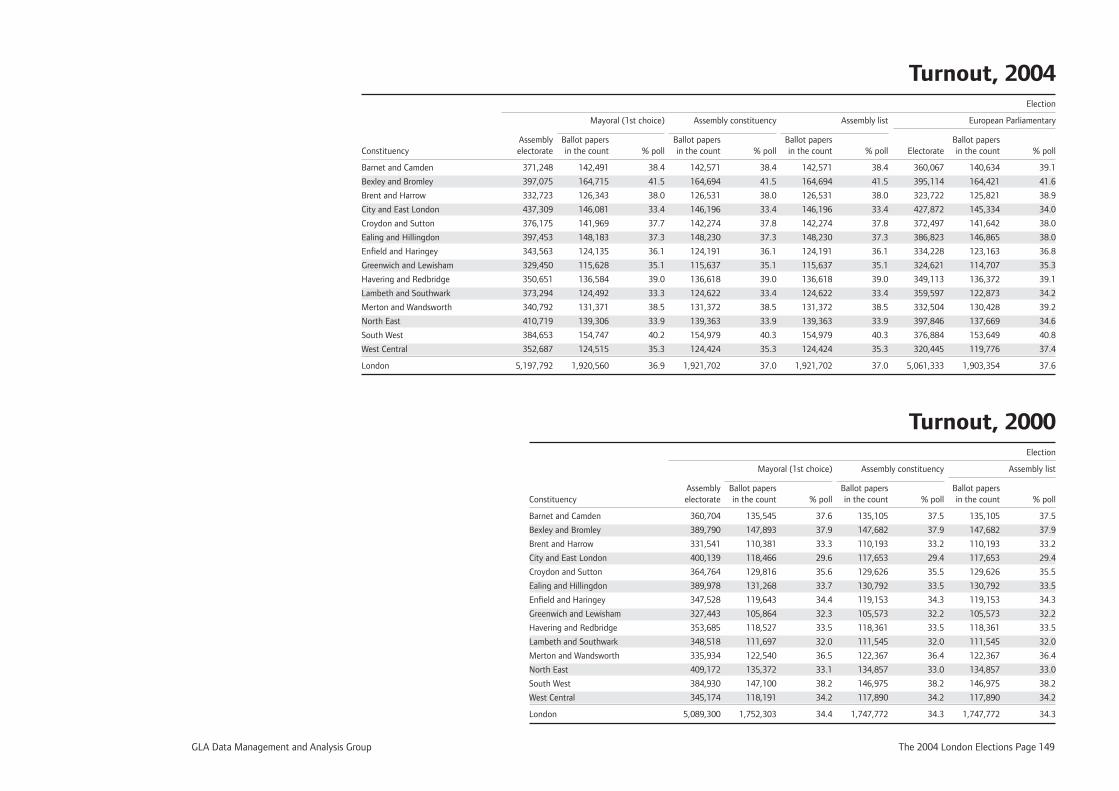
GLA Data Management and Analysis Group The 2004 London Elections Page 149
Turnout, 2004 Election
Mayoral (1st choice) Assembly constituency Assembly list European Parliamentary
Assembly Ballot papers Ballot papers Ballot papers Ballot papers Constituency electorate in the count % poll in the count % poll in the count % poll Electorate in the count % poll
Barnet and Camden 371,248 142,491 38.4 142,571 38.4 142,571 38.4 360,067 140,634 39.1
Bexley and Bromley 397,075 164,715 41.5 164,694 41.5 164,694 41.5 395,114 164,421 41.6
Brent and Harrow 332,723 126,343 38.0 126,531 38.0 126,531 38.0 323,722 125,821 38.9
City and East London 437,309 146,081 33.4 146,196 33.4 146,196 33.4 427,872 145,334 34.0
Croydon and Sutton 376,175 141,969 37.7 142,274 37.8 142,274 37.8 372,497 141,642 38.0
Ealing and Hillingdon 397,453 148,183 37.3 148,230 37.3 148,230 37.3 386,823 146,865 38.0
Enfi eld and Haringey 343,563 124,135 36.1 124,191 36.1 124,191 36.1 334,228 123,163 36.8
Greenwich and Lewisham 329,450 115,628 35.1 115,637 35.1 115,637 35.1 324,621 114,707 35.3
Havering and Redbridge 350,651 136,584 39.0 136,618 39.0 136,618 39.0 349,113 136,372 39.1
Lambeth and Southwark 373,294 124,492 33.3 124,622 33.4 124,622 33.4 359,597 122,873 34.2
Merton and Wandsworth 340,792 131,371 38.5 131,372 38.5 131,372 38.5 332,504 130,428 39.2
North East 410,719 139,306 33.9 139,363 33.9 139,363 33.9 397,846 137,669 34.6
South West 384,653 154,747 40.2 154,979 40.3 154,979 40.3 376,884 153,649 40.8
West Central 352,687 124,515 35.3 124,424 35.3 124,424 35.3 320,445 119,776 37.4
London 5,197,792 1,920,560 36.9 1,921,702 37.0 1,921,702 37.0 5,061,333 1,903,354 37.6
Turnout, 2000 Election
Mayoral (1st choice) Assembly constituency Assembly list
Assembly Ballot papers Ballot papers Ballot papers Constituency electorate in the count % poll in the count % poll in the count % poll
Barnet and Camden 360,704 135,545 37.6 135,105 37.5 135,105 37.5
Bexley and Bromley 389,790 147,893 37.9 147,682 37.9 147,682 37.9
Brent and Harrow 331,541 110,381 33.3 110,193 33.2 110,193 33.2
City and East London 400,139 118,466 29.6 117,653 29.4 117,653 29.4
Croydon and Sutton 364,764 129,816 35.6 129,626 35.5 129,626 35.5
Ealing and Hillingdon 389,978 131,268 33.7 130,792 33.5 130,792 33.5
Enfi eld and Haringey 347,528 119,643 34.4 119,153 34.3 119,153 34.3
Greenwich and Lewisham 327,443 105,864 32.3 105,573 32.2 105,573 32.2
Havering and Redbridge 353,685 118,527 33.5 118,361 33.5 118,361 33.5
Lambeth and Southwark 348,518 111,697 32.0 111,545 32.0 111,545 32.0
Merton and Wandsworth 335,934 122,540 36.5 122,367 36.4 122,367 36.4
North East 409,172 135,372 33.1 134,857 33.0 134,857 33.0
South West 384,930 147,100 38.2 146,975 38.2 146,975 38.2
West Central 345,174 118,191 34.2 117,890 34.2 117,890 34.2
London 5,089,300 1,752,303 34.4 1,747,772 34.3 1,747,772 34.3
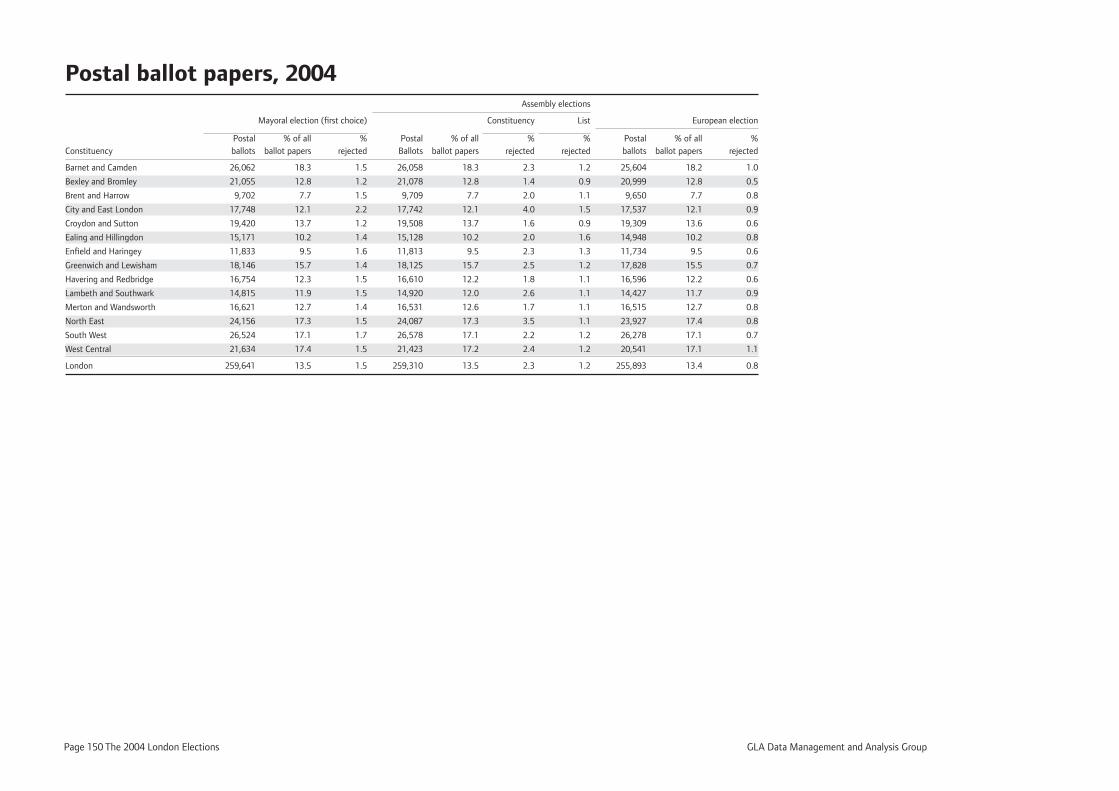
Page 150 The 2004 London Elections GLA Data Management and Analysis Group
Postal ballot papers, 2004 Assembly elections
Mayoral election (fi rst choice) Constituency List European election
Postal % of all % Postal % of all % % Postal % of all %Constituency ballots ballot papers rejected Ballots ballot papers rejected rejected ballots ballot papers rejected
Barnet and Camden 26,062 18.3 1.5 26,058 18.3 2.3 1.2 25,604 18.2 1.0
Bexley and Bromley 21,055 12.8 1.2 21,078 12.8 1.4 0.9 20,999 12.8 0.5
Brent and Harrow 9,702 7.7 1.5 9,709 7.7 2.0 1.1 9,650 7.7 0.8
City and East London 17,748 12.1 2.2 17,742 12.1 4.0 1.5 17,537 12.1 0.9
Croydon and Sutton 19,420 13.7 1.2 19,508 13.7 1.6 0.9 19,309 13.6 0.6
Ealing and Hillingdon 15,171 10.2 1.4 15,128 10.2 2.0 1.6 14,948 10.2 0.8
Enfi eld and Haringey 11,833 9.5 1.6 11,813 9.5 2.3 1.3 11,734 9.5 0.6
Greenwich and Lewisham 18,146 15.7 1.4 18,125 15.7 2.5 1.2 17,828 15.5 0.7
Havering and Redbridge 16,754 12.3 1.5 16,610 12.2 1.8 1.1 16,596 12.2 0.6
Lambeth and Southwark 14,815 11.9 1.5 14,920 12.0 2.6 1.1 14,427 11.7 0.9
Merton and Wandsworth 16,621 12.7 1.4 16,531 12.6 1.7 1.1 16,515 12.7 0.8
North East 24,156 17.3 1.5 24,087 17.3 3.5 1.1 23,927 17.4 0.8
South West 26,524 17.1 1.7 26,578 17.1 2.2 1.2 26,278 17.1 0.7
West Central 21,634 17.4 1.5 21,423 17.2 2.4 1.2 20,541 17.1 1.1
London 259,641 13.5 1.5 259,310 13.5 2.3 1.2 255,893 13.4 0.8
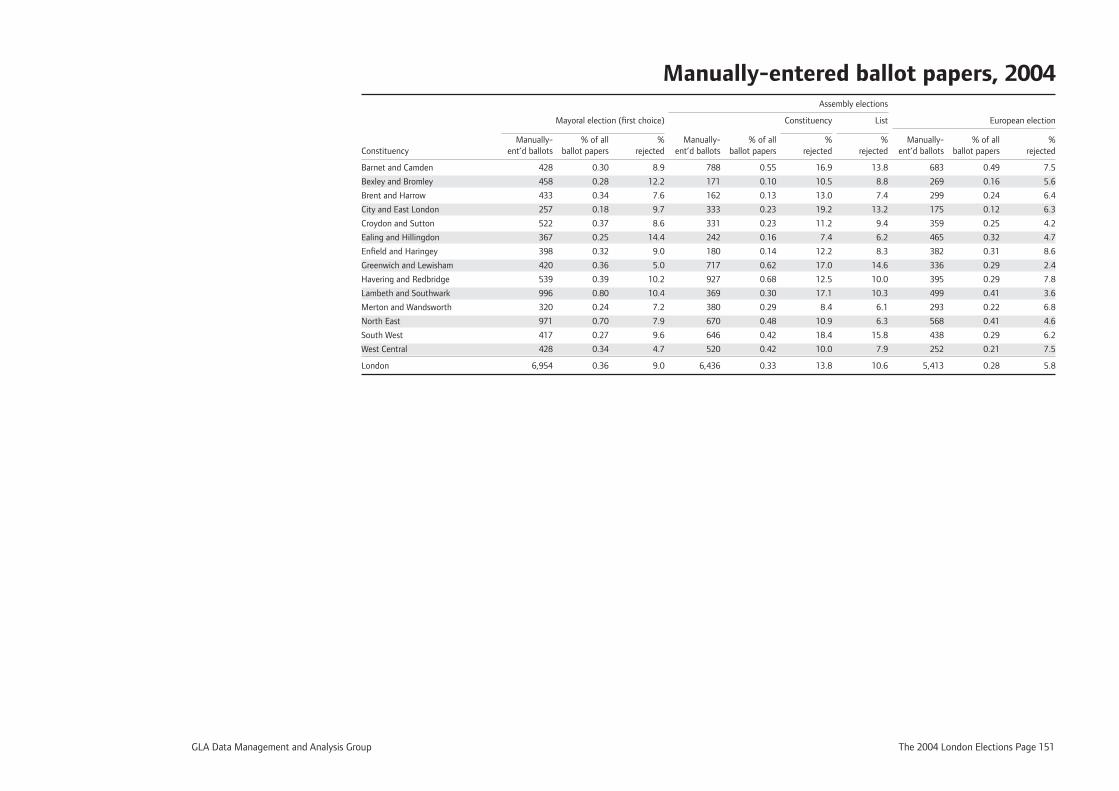
GLA Data Management and Analysis Group The 2004 London Elections Page 151
Manually-entered ballot papers, 2004 Assembly elections
Mayoral election (fi rst choice) Constituency List European election
Manually- % of all % Manually- % of all % % Manually- % of all %Constituency ent’d ballots ballot papers rejected ent’d ballots ballot papers rejected rejected ent’d ballots ballot papers rejected
Barnet and Camden 428 0.30 8.9 788 0.55 16.9 13.8 683 0.49 7.5
Bexley and Bromley 458 0.28 12.2 171 0.10 10.5 8.8 269 0.16 5.6
Brent and Harrow 433 0.34 7.6 162 0.13 13.0 7.4 299 0.24 6.4
City and East London 257 0.18 9.7 333 0.23 19.2 13.2 175 0.12 6.3
Croydon and Sutton 522 0.37 8.6 331 0.23 11.2 9.4 359 0.25 4.2
Ealing and Hillingdon 367 0.25 14.4 242 0.16 7.4 6.2 465 0.32 4.7
Enfi eld and Haringey 398 0.32 9.0 180 0.14 12.2 8.3 382 0.31 8.6
Greenwich and Lewisham 420 0.36 5.0 717 0.62 17.0 14.6 336 0.29 2.4
Havering and Redbridge 539 0.39 10.2 927 0.68 12.5 10.0 395 0.29 7.8
Lambeth and Southwark 996 0.80 10.4 369 0.30 17.1 10.3 499 0.41 3.6
Merton and Wandsworth 320 0.24 7.2 380 0.29 8.4 6.1 293 0.22 6.8
North East 971 0.70 7.9 670 0.48 10.9 6.3 568 0.41 4.6
South West 417 0.27 9.6 646 0.42 18.4 15.8 438 0.29 6.2
West Central 428 0.34 4.7 520 0.42 10.0 7.9 252 0.21 7.5
London 6,954 0.36 9.0 6,436 0.33 13.8 10.6 5,413 0.28 5.8
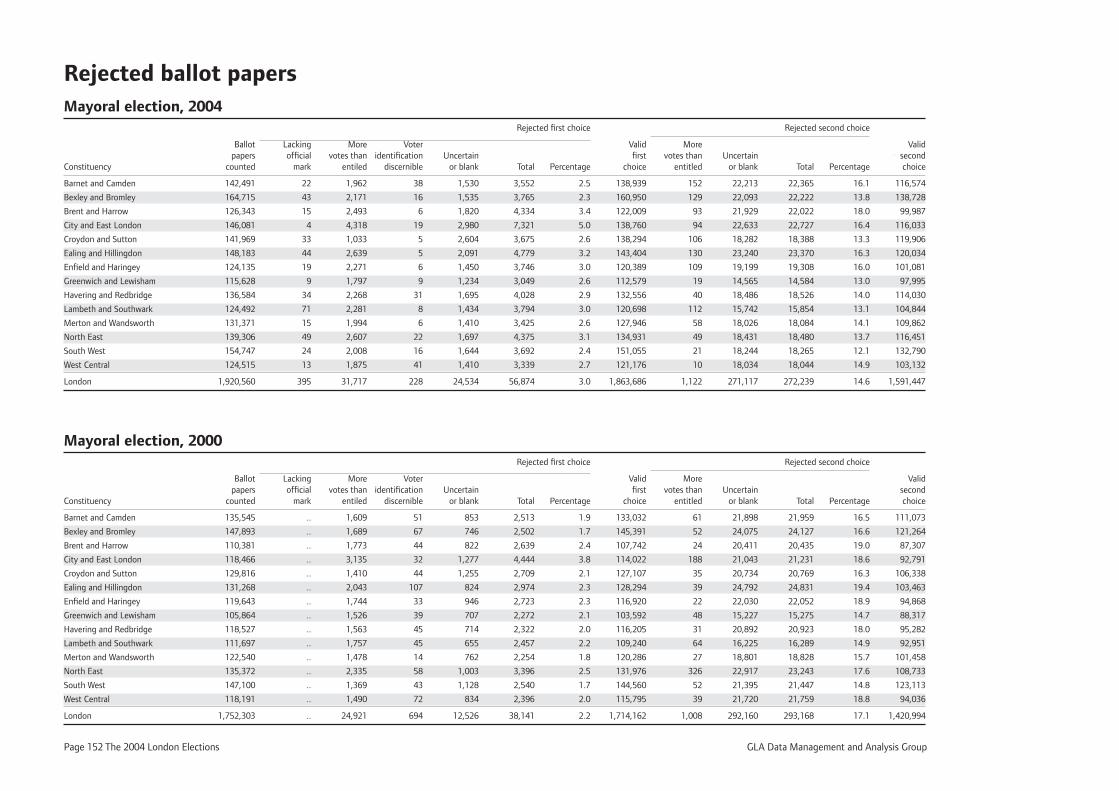
Page 152 The 2004 London Elections GLA Data Management and Analysis Group
Rejected ballot papersMayoral election, 2004 Rejected fi rst choice Rejected second choice
Ballot Lacking More Voter Valid More Valid papers offi cial votes than identifi cation Uncertain fi rst votes than Uncertain secondConstituency counted mark entiled discernible or blank Total Percentage choice entitled or blank Total Percentage choice
Barnet and Camden 142,491 22 1,962 38 1,530 3,552 2.5 138,939 152 22,213 22,365 16.1 116,574
Bexley and Bromley 164,715 43 2,171 16 1,535 3,765 2.3 160,950 129 22,093 22,222 13.8 138,728
Brent and Harrow 126,343 15 2,493 6 1,820 4,334 3.4 122,009 93 21,929 22,022 18.0 99,987
City and East London 146,081 4 4,318 19 2,980 7,321 5.0 138,760 94 22,633 22,727 16.4 116,033
Croydon and Sutton 141,969 33 1,033 5 2,604 3,675 2.6 138,294 106 18,282 18,388 13.3 119,906
Ealing and Hillingdon 148,183 44 2,639 5 2,091 4,779 3.2 143,404 130 23,240 23,370 16.3 120,034
Enfi eld and Haringey 124,135 19 2,271 6 1,450 3,746 3.0 120,389 109 19,199 19,308 16.0 101,081
Greenwich and Lewisham 115,628 9 1,797 9 1,234 3,049 2.6 112,579 19 14,565 14,584 13.0 97,995
Havering and Redbridge 136,584 34 2,268 31 1,695 4,028 2.9 132,556 40 18,486 18,526 14.0 114,030
Lambeth and Southwark 124,492 71 2,281 8 1,434 3,794 3.0 120,698 112 15,742 15,854 13.1 104,844
Merton and Wandsworth 131,371 15 1,994 6 1,410 3,425 2.6 127,946 58 18,026 18,084 14.1 109,862
North East 139,306 49 2,607 22 1,697 4,375 3.1 134,931 49 18,431 18,480 13.7 116,451
South West 154,747 24 2,008 16 1,644 3,692 2.4 151,055 21 18,244 18,265 12.1 132,790
West Central 124,515 13 1,875 41 1,410 3,339 2.7 121,176 10 18,034 18,044 14.9 103,132
London 1,920,560 395 31,717 228 24,534 56,874 3.0 1,863,686 1,122 271,117 272,239 14.6 1,591,447
Mayoral election, 2000 Rejected fi rst choice Rejected second choice
Ballot Lacking More Voter Valid More Valid papers offi cial votes than identifi cation Uncertain fi rst votes than Uncertain secondConstituency counted mark entiled discernible or blank Total Percentage choice entitled or blank Total Percentage choice
Barnet and Camden 135,545 .. 1,609 51 853 2,513 1.9 133,032 61 21,898 21,959 16.5 111,073
Bexley and Bromley 147,893 .. 1,689 67 746 2,502 1.7 145,391 52 24,075 24,127 16.6 121,264
Brent and Harrow 110,381 .. 1,773 44 822 2,639 2.4 107,742 24 20,411 20,435 19.0 87,307
City and East London 118,466 .. 3,135 32 1,277 4,444 3.8 114,022 188 21,043 21,231 18.6 92,791
Croydon and Sutton 129,816 .. 1,410 44 1,255 2,709 2.1 127,107 35 20,734 20,769 16.3 106,338
Ealing and Hillingdon 131,268 .. 2,043 107 824 2,974 2.3 128,294 39 24,792 24,831 19.4 103,463
Enfi eld and Haringey 119,643 .. 1,744 33 946 2,723 2.3 116,920 22 22,030 22,052 18.9 94,868
Greenwich and Lewisham 105,864 .. 1,526 39 707 2,272 2.1 103,592 48 15,227 15,275 14.7 88,317
Havering and Redbridge 118,527 .. 1,563 45 714 2,322 2.0 116,205 31 20,892 20,923 18.0 95,282
Lambeth and Southwark 111,697 .. 1,757 45 655 2,457 2.2 109,240 64 16,225 16,289 14.9 92,951
Merton and Wandsworth 122,540 .. 1,478 14 762 2,254 1.8 120,286 27 18,801 18,828 15.7 101,458
North East 135,372 .. 2,335 58 1,003 3,396 2.5 131,976 326 22,917 23,243 17.6 108,733
South West 147,100 .. 1,369 43 1,128 2,540 1.7 144,560 52 21,395 21,447 14.8 123,113
West Central 118,191 .. 1,490 72 834 2,396 2.0 115,795 39 21,720 21,759 18.8 94,036
London 1,752,303 .. 24,921 694 12,526 38,141 2.2 1,714,162 1,008 292,160 293,168 17.1 1,420,994
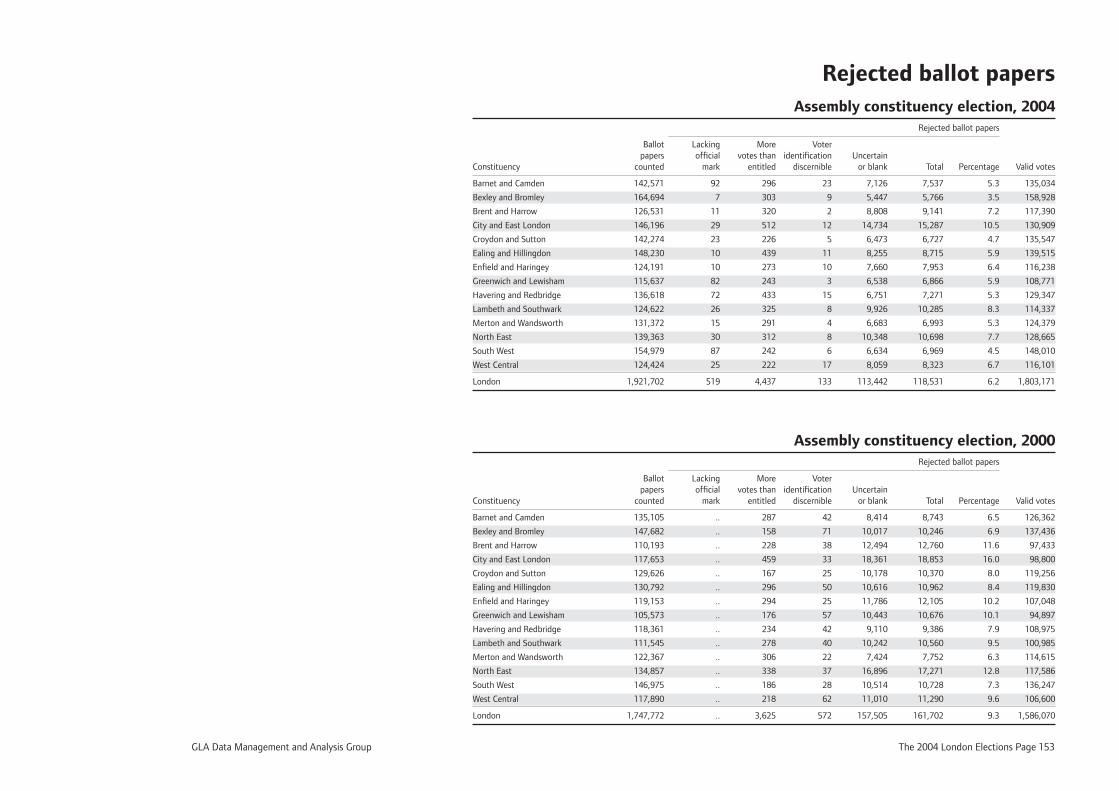
GLA Data Management and Analysis Group The 2004 London Elections Page 153
Rejected ballot papers Assembly constituency election, 2004 Rejected ballot papers
Ballot Lacking More Voter papers offi cial votes than identifi cation Uncertain
Constituency counted mark entitled discernible or blank Total Percentage Valid votes
Barnet and Camden 142,571 92 296 23 7,126 7,537 5.3 135,034
Bexley and Bromley 164,694 7 303 9 5,447 5,766 3.5 158,928
Brent and Harrow 126,531 11 320 2 8,808 9,141 7.2 117,390
City and East London 146,196 29 512 12 14,734 15,287 10.5 130,909
Croydon and Sutton 142,274 23 226 5 6,473 6,727 4.7 135,547
Ealing and Hillingdon 148,230 10 439 11 8,255 8,715 5.9 139,515
Enfi eld and Haringey 124,191 10 273 10 7,660 7,953 6.4 116,238
Greenwich and Lewisham 115,637 82 243 3 6,538 6,866 5.9 108,771
Havering and Redbridge 136,618 72 433 15 6,751 7,271 5.3 129,347
Lambeth and Southwark 124,622 26 325 8 9,926 10,285 8.3 114,337
Merton and Wandsworth 131,372 15 291 4 6,683 6,993 5.3 124,379
North East 139,363 30 312 8 10,348 10,698 7.7 128,665
South West 154,979 87 242 6 6,634 6,969 4.5 148,010
West Central 124,424 25 222 17 8,059 8,323 6.7 116,101
London 1,921,702 519 4,437 133 113,442 118,531 6.2 1,803,171
Assembly constituency election, 2000 Rejected ballot papers
Ballot Lacking More Voter papers offi cial votes than identifi cation Uncertain
Constituency counted mark entitled discernible or blank Total Percentage Valid votes
Barnet and Camden 135,105 .. 287 42 8,414 8,743 6.5 126,362
Bexley and Bromley 147,682 .. 158 71 10,017 10,246 6.9 137,436
Brent and Harrow 110,193 .. 228 38 12,494 12,760 11.6 97,433
City and East London 117,653 .. 459 33 18,361 18,853 16.0 98,800
Croydon and Sutton 129,626 .. 167 25 10,178 10,370 8.0 119,256
Ealing and Hillingdon 130,792 .. 296 50 10,616 10,962 8.4 119,830
Enfi eld and Haringey 119,153 .. 294 25 11,786 12,105 10.2 107,048
Greenwich and Lewisham 105,573 .. 176 57 10,443 10,676 10.1 94,897
Havering and Redbridge 118,361 .. 234 42 9,110 9,386 7.9 108,975
Lambeth and Southwark 111,545 .. 278 40 10,242 10,560 9.5 100,985
Merton and Wandsworth 122,367 .. 306 22 7,424 7,752 6.3 114,615
North East 134,857 .. 338 37 16,896 17,271 12.8 117,586
South West 146,975 .. 186 28 10,514 10,728 7.3 136,247
West Central 117,890 .. 218 62 11,010 11,290 9.6 106,600
London 1,747,772 .. 3,625 572 157,505 161,702 9.3 1,586,070
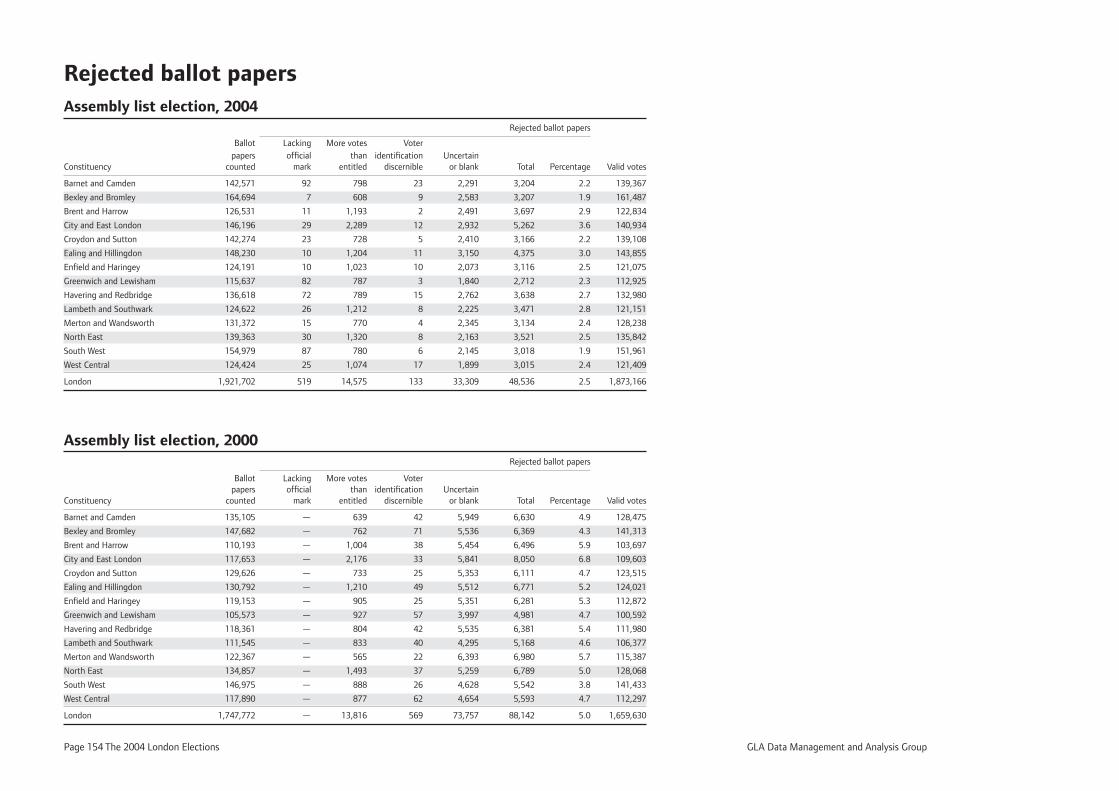
Page 154 The 2004 London Elections GLA Data Management and Analysis Group
Rejected ballot papersAssembly list election, 2004 Rejected ballot papers
Ballot Lacking More votes Voter papers offi cial than identifi cation Uncertain
Constituency counted mark entitled discernible or blank Total Percentage Valid votes
Barnet and Camden 142,571 92 798 23 2,291 3,204 2.2 139,367
Bexley and Bromley 164,694 7 608 9 2,583 3,207 1.9 161,487
Brent and Harrow 126,531 11 1,193 2 2,491 3,697 2.9 122,834
City and East London 146,196 29 2,289 12 2,932 5,262 3.6 140,934
Croydon and Sutton 142,274 23 728 5 2,410 3,166 2.2 139,108
Ealing and Hillingdon 148,230 10 1,204 11 3,150 4,375 3.0 143,855
Enfi eld and Haringey 124,191 10 1,023 10 2,073 3,116 2.5 121,075
Greenwich and Lewisham 115,637 82 787 3 1,840 2,712 2.3 112,925
Havering and Redbridge 136,618 72 789 15 2,762 3,638 2.7 132,980
Lambeth and Southwark 124,622 26 1,212 8 2,225 3,471 2.8 121,151
Merton and Wandsworth 131,372 15 770 4 2,345 3,134 2.4 128,238
North East 139,363 30 1,320 8 2,163 3,521 2.5 135,842
South West 154,979 87 780 6 2,145 3,018 1.9 151,961
West Central 124,424 25 1,074 17 1,899 3,015 2.4 121,409
London 1,921,702 519 14,575 133 33,309 48,536 2.5 1,873,166
Assembly list election, 2000 Rejected ballot papers
Ballot Lacking More votes Voter papers offi cial than identifi cation Uncertain
Constituency counted mark entitled discernible or blank Total Percentage Valid votes
Barnet and Camden 135,105 — 639 42 5,949 6,630 4.9 128,475
Bexley and Bromley 147,682 — 762 71 5,536 6,369 4.3 141,313
Brent and Harrow 110,193 — 1,004 38 5,454 6,496 5.9 103,697
City and East London 117,653 — 2,176 33 5,841 8,050 6.8 109,603
Croydon and Sutton 129,626 — 733 25 5,353 6,111 4.7 123,515
Ealing and Hillingdon 130,792 — 1,210 49 5,512 6,771 5.2 124,021
Enfi eld and Haringey 119,153 — 905 25 5,351 6,281 5.3 112,872
Greenwich and Lewisham 105,573 — 927 57 3,997 4,981 4.7 100,592
Havering and Redbridge 118,361 — 804 42 5,535 6,381 5.4 111,980
Lambeth and Southwark 111,545 — 833 40 4,295 5,168 4.6 106,377
Merton and Wandsworth 122,367 — 565 22 6,393 6,980 5.7 115,387
North East 134,857 — 1,493 37 5,259 6,789 5.0 128,068
South West 146,975 — 888 26 4,628 5,542 3.8 141,433
West Central 117,890 — 877 62 4,654 5,593 4.7 112,297
London 1,747,772 — 13,816 569 73,757 88,142 5.0 1,659,630
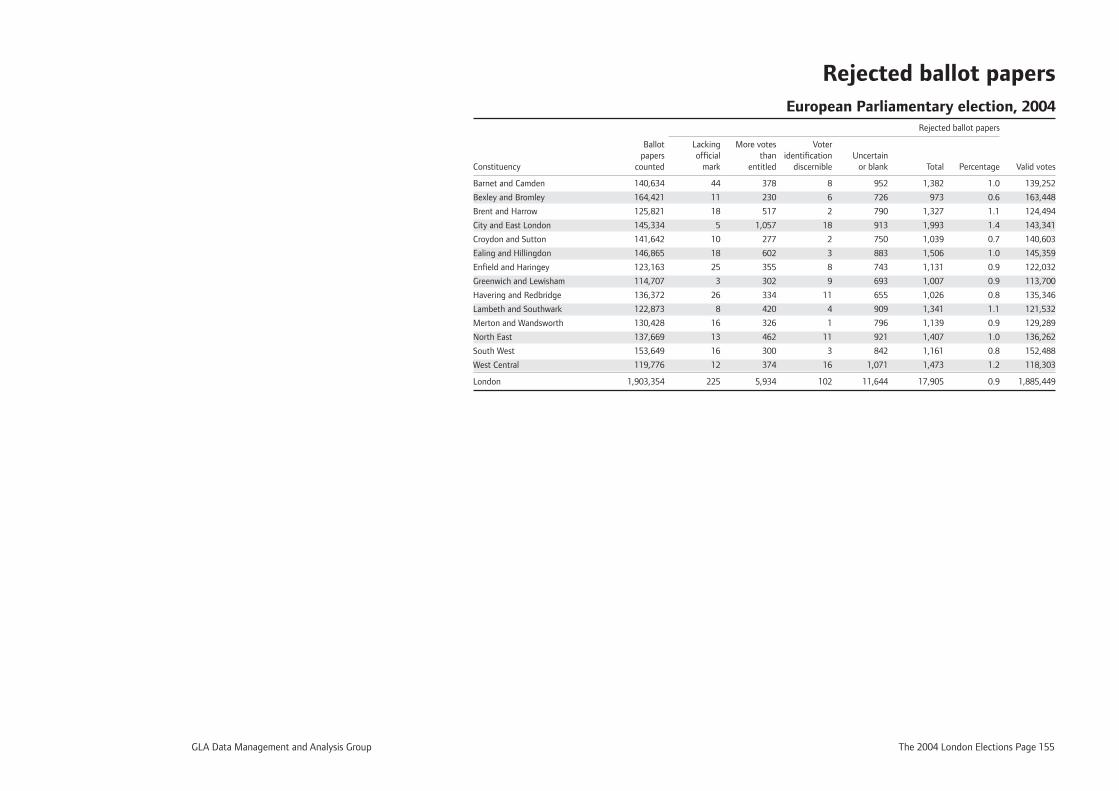
GLA Data Management and Analysis Group The 2004 London Elections Page 155
Rejected ballot papers European Parliamentary election, 2004 Rejected ballot papers
Ballot Lacking More votes Voter papers offi cial than identifi cation Uncertain
Constituency counted mark entitled discernible or blank Total Percentage Valid votes
Barnet and Camden 140,634 44 378 8 952 1,382 1.0 139,252
Bexley and Bromley 164,421 11 230 6 726 973 0.6 163,448
Brent and Harrow 125,821 18 517 2 790 1,327 1.1 124,494
City and East London 145,334 5 1,057 18 913 1,993 1.4 143,341
Croydon and Sutton 141,642 10 277 2 750 1,039 0.7 140,603
Ealing and Hillingdon 146,865 18 602 3 883 1,506 1.0 145,359
Enfi eld and Haringey 123,163 25 355 8 743 1,131 0.9 122,032
Greenwich and Lewisham 114,707 3 302 9 693 1,007 0.9 113,700
Havering and Redbridge 136,372 26 334 11 655 1,026 0.8 135,346
Lambeth and Southwark 122,873 8 420 4 909 1,341 1.1 121,532
Merton and Wandsworth 130,428 16 326 1 796 1,139 0.9 129,289
North East 137,669 13 462 11 921 1,407 1.0 136,262
South West 153,649 16 300 3 842 1,161 0.8 152,488
West Central 119,776 12 374 16 1,071 1,473 1.2 118,303
London 1,903,354 225 5,934 102 11,644 17,905 0.9 1,885,449

Page 156 The 2004 London Elections GLA Data Management and Analysis Group
GLA Data Management and Analysis Group The 2004 London Elections Page 157
Results – London boroughs
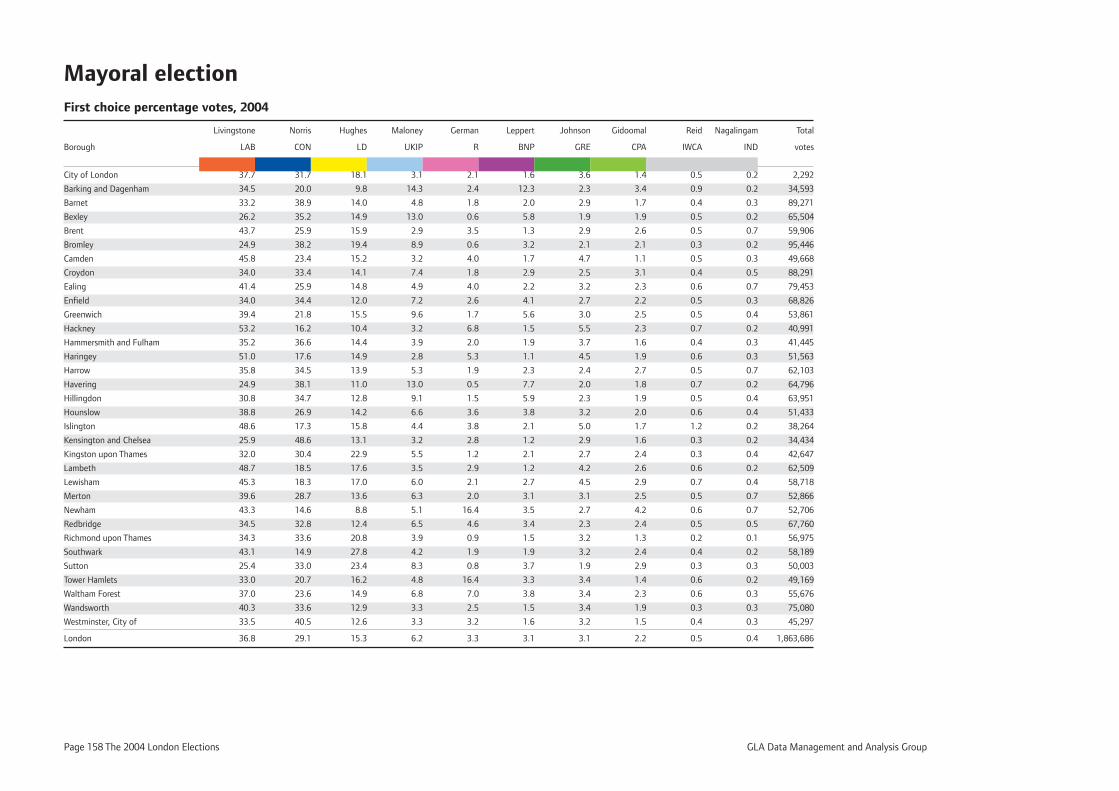
Page 158 The 2004 London Elections GLA Data Management and Analysis Group
Mayoral electionFirst choice percentage votes, 2004
Livingstone Norris Hughes Maloney German Leppert Johnson Gidoomal Reid Nagalingam Total
Borough LAB CON LD UKIP R BNP GRE CPA IWCA IND votes
City of London 37.7 31.7 18.1 3.1 2.1 1.6 3.6 1.4 0.5 0.2 2,292
Barking and Dagenham 34.5 20.0 9.8 14.3 2.4 12.3 2.3 3.4 0.9 0.2 34,593
Barnet 33.2 38.9 14.0 4.8 1.8 2.0 2.9 1.7 0.4 0.3 89,271
Bexley 26.2 35.2 14.9 13.0 0.6 5.8 1.9 1.9 0.5 0.2 65,504
Brent 43.7 25.9 15.9 2.9 3.5 1.3 2.9 2.6 0.5 0.7 59,906
Bromley 24.9 38.2 19.4 8.9 0.6 3.2 2.1 2.1 0.3 0.2 95,446
Camden 45.8 23.4 15.2 3.2 4.0 1.7 4.7 1.1 0.5 0.3 49,668
Croydon 34.0 33.4 14.1 7.4 1.8 2.9 2.5 3.1 0.4 0.5 88,291
Ealing 41.4 25.9 14.8 4.9 4.0 2.2 3.2 2.3 0.6 0.7 79,453
Enfi eld 34.0 34.4 12.0 7.2 2.6 4.1 2.7 2.2 0.5 0.3 68,826
Greenwich 39.4 21.8 15.5 9.6 1.7 5.6 3.0 2.5 0.5 0.4 53,861
Hackney 53.2 16.2 10.4 3.2 6.8 1.5 5.5 2.3 0.7 0.2 40,991
Hammersmith and Fulham 35.2 36.6 14.4 3.9 2.0 1.9 3.7 1.6 0.4 0.3 41,445
Haringey 51.0 17.6 14.9 2.8 5.3 1.1 4.5 1.9 0.6 0.3 51,563
Harrow 35.8 34.5 13.9 5.3 1.9 2.3 2.4 2.7 0.5 0.7 62,103
Havering 24.9 38.1 11.0 13.0 0.5 7.7 2.0 1.8 0.7 0.2 64,796
Hillingdon 30.8 34.7 12.8 9.1 1.5 5.9 2.3 1.9 0.5 0.4 63,951
Hounslow 38.8 26.9 14.2 6.6 3.6 3.8 3.2 2.0 0.6 0.4 51,433
Islington 48.6 17.3 15.8 4.4 3.8 2.1 5.0 1.7 1.2 0.2 38,264
Kensington and Chelsea 25.9 48.6 13.1 3.2 2.8 1.2 2.9 1.6 0.3 0.2 34,434
Kingston upon Thames 32.0 30.4 22.9 5.5 1.2 2.1 2.7 2.4 0.3 0.4 42,647
Lambeth 48.7 18.5 17.6 3.5 2.9 1.2 4.2 2.6 0.6 0.2 62,509
Lewisham 45.3 18.3 17.0 6.0 2.1 2.7 4.5 2.9 0.7 0.4 58,718
Merton 39.6 28.7 13.6 6.3 2.0 3.1 3.1 2.5 0.5 0.7 52,866
Newham 43.3 14.6 8.8 5.1 16.4 3.5 2.7 4.2 0.6 0.7 52,706
Redbridge 34.5 32.8 12.4 6.5 4.6 3.4 2.3 2.4 0.5 0.5 67,760
Richmond upon Thames 34.3 33.6 20.8 3.9 0.9 1.5 3.2 1.3 0.2 0.1 56,975
Southwark 43.1 14.9 27.8 4.2 1.9 1.9 3.2 2.4 0.4 0.2 58,189
Sutton 25.4 33.0 23.4 8.3 0.8 3.7 1.9 2.9 0.3 0.3 50,003
Tower Hamlets 33.0 20.7 16.2 4.8 16.4 3.3 3.4 1.4 0.6 0.2 49,169
Waltham Forest 37.0 23.6 14.9 6.8 7.0 3.8 3.4 2.3 0.6 0.3 55,676
Wandsworth 40.3 33.6 12.9 3.3 2.5 1.5 3.4 1.9 0.3 0.3 75,080
Westminster, City of 33.5 40.5 12.6 3.3 3.2 1.6 3.2 1.5 0.4 0.3 45,297
London 36.8 29.1 15.3 6.2 3.3 3.1 3.1 2.2 0.5 0.4 1,863,686
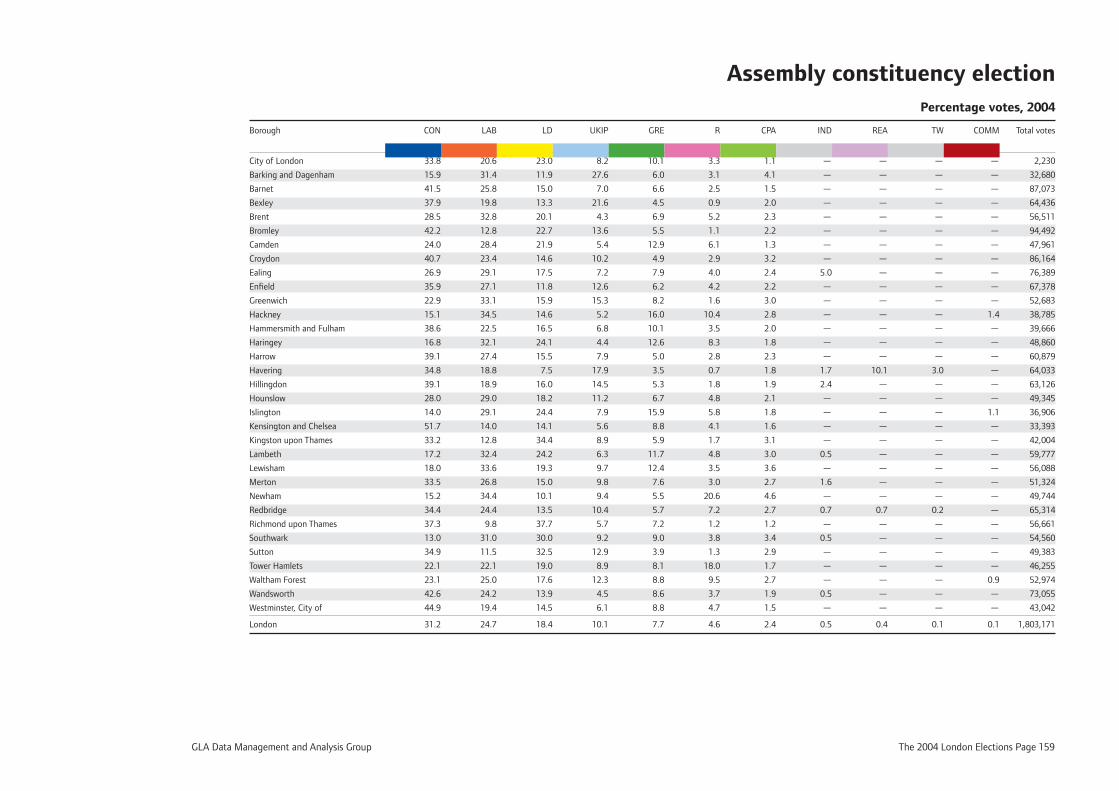
GLA Data Management and Analysis Group The 2004 London Elections Page 159
Assembly constituency election Percentage votes, 2004
Borough CON LAB LD UKIP GRE R CPA IND REA TW COMM Total votes
City of London 33.8 20.6 23.0 8.2 10.1 3.3 1.1 — — — — 2,230
Barking and Dagenham 15.9 31.4 11.9 27.6 6.0 3.1 4.1 — — — — 32,680
Barnet 41.5 25.8 15.0 7.0 6.6 2.5 1.5 — — — — 87,073
Bexley 37.9 19.8 13.3 21.6 4.5 0.9 2.0 — — — — 64,436
Brent 28.5 32.8 20.1 4.3 6.9 5.2 2.3 — — — — 56,511
Bromley 42.2 12.8 22.7 13.6 5.5 1.1 2.2 — — — — 94,492
Camden 24.0 28.4 21.9 5.4 12.9 6.1 1.3 — — — — 47,961
Croydon 40.7 23.4 14.6 10.2 4.9 2.9 3.2 — — — — 86,164
Ealing 26.9 29.1 17.5 7.2 7.9 4.0 2.4 5.0 — — — 76,389
Enfi eld 35.9 27.1 11.8 12.6 6.2 4.2 2.2 — — — — 67,378
Greenwich 22.9 33.1 15.9 15.3 8.2 1.6 3.0 — — — — 52,683
Hackney 15.1 34.5 14.6 5.2 16.0 10.4 2.8 — — — 1.4 38,785
Hammersmith and Fulham 38.6 22.5 16.5 6.8 10.1 3.5 2.0 — — — — 39,666
Haringey 16.8 32.1 24.1 4.4 12.6 8.3 1.8 — — — — 48,860
Harrow 39.1 27.4 15.5 7.9 5.0 2.8 2.3 — — — — 60,879
Havering 34.8 18.8 7.5 17.9 3.5 0.7 1.8 1.7 10.1 3.0 — 64,033
Hillingdon 39.1 18.9 16.0 14.5 5.3 1.8 1.9 2.4 — — — 63,126
Hounslow 28.0 29.0 18.2 11.2 6.7 4.8 2.1 — — — — 49,345
Islington 14.0 29.1 24.4 7.9 15.9 5.8 1.8 — — — 1.1 36,906
Kensington and Chelsea 51.7 14.0 14.1 5.6 8.8 4.1 1.6 — — — — 33,393
Kingston upon Thames 33.2 12.8 34.4 8.9 5.9 1.7 3.1 — — — — 42,004
Lambeth 17.2 32.4 24.2 6.3 11.7 4.8 3.0 0.5 — — — 59,777
Lewisham 18.0 33.6 19.3 9.7 12.4 3.5 3.6 — — — — 56,088
Merton 33.5 26.8 15.0 9.8 7.6 3.0 2.7 1.6 — — — 51,324
Newham 15.2 34.4 10.1 9.4 5.5 20.6 4.6 — — — — 49,744
Redbridge 34.4 24.4 13.5 10.4 5.7 7.2 2.7 0.7 0.7 0.2 — 65,314
Richmond upon Thames 37.3 9.8 37.7 5.7 7.2 1.2 1.2 — — — — 56,661
Southwark 13.0 31.0 30.0 9.2 9.0 3.8 3.4 0.5 — — — 54,560
Sutton 34.9 11.5 32.5 12.9 3.9 1.3 2.9 — — — — 49,383
Tower Hamlets 22.1 22.1 19.0 8.9 8.1 18.0 1.7 — — — — 46,255
Waltham Forest 23.1 25.0 17.6 12.3 8.8 9.5 2.7 — — — 0.9 52,974
Wandsworth 42.6 24.2 13.9 4.5 8.6 3.7 1.9 0.5 — — — 73,055
Westminster, City of 44.9 19.4 14.5 6.1 8.8 4.7 1.5 — — — — 43,042
London 31.2 24.7 18.4 10.1 7.7 4.6 2.4 0.5 0.4 0.1 0.1 1,803,171
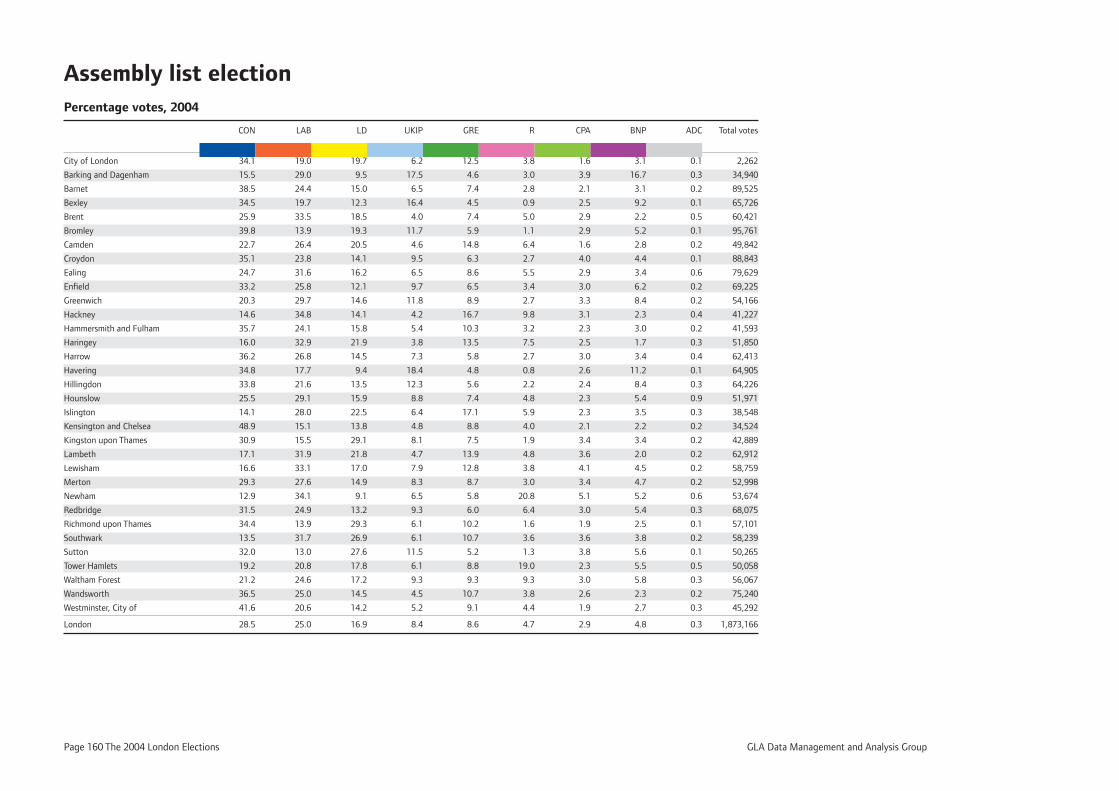
Page 160 The 2004 London Elections GLA Data Management and Analysis Group
Assembly list electionPercentage votes, 2004
CON LAB LD UKIP GRE R CPA BNP ADC Total votes
City of London 34.1 19.0 19.7 6.2 12.5 3.8 1.6 3.1 0.1 2,262
Barking and Dagenham 15.5 29.0 9.5 17.5 4.6 3.0 3.9 16.7 0.3 34,940
Barnet 38.5 24.4 15.0 6.5 7.4 2.8 2.1 3.1 0.2 89,525
Bexley 34.5 19.7 12.3 16.4 4.5 0.9 2.5 9.2 0.1 65,726
Brent 25.9 33.5 18.5 4.0 7.4 5.0 2.9 2.2 0.5 60,421
Bromley 39.8 13.9 19.3 11.7 5.9 1.1 2.9 5.2 0.1 95,761
Camden 22.7 26.4 20.5 4.6 14.8 6.4 1.6 2.8 0.2 49,842
Croydon 35.1 23.8 14.1 9.5 6.3 2.7 4.0 4.4 0.1 88,843
Ealing 24.7 31.6 16.2 6.5 8.6 5.5 2.9 3.4 0.6 79,629
Enfi eld 33.2 25.8 12.1 9.7 6.5 3.4 3.0 6.2 0.2 69,225
Greenwich 20.3 29.7 14.6 11.8 8.9 2.7 3.3 8.4 0.2 54,166
Hackney 14.6 34.8 14.1 4.2 16.7 9.8 3.1 2.3 0.4 41,227
Hammersmith and Fulham 35.7 24.1 15.8 5.4 10.3 3.2 2.3 3.0 0.2 41,593
Haringey 16.0 32.9 21.9 3.8 13.5 7.5 2.5 1.7 0.3 51,850
Harrow 36.2 26.8 14.5 7.3 5.8 2.7 3.0 3.4 0.4 62,413
Havering 34.8 17.7 9.4 18.4 4.8 0.8 2.6 11.2 0.1 64,905
Hillingdon 33.8 21.6 13.5 12.3 5.6 2.2 2.4 8.4 0.3 64,226
Hounslow 25.5 29.1 15.9 8.8 7.4 4.8 2.3 5.4 0.9 51,971
Islington 14.1 28.0 22.5 6.4 17.1 5.9 2.3 3.5 0.3 38,548
Kensington and Chelsea 48.9 15.1 13.8 4.8 8.8 4.0 2.1 2.2 0.2 34,524
Kingston upon Thames 30.9 15.5 29.1 8.1 7.5 1.9 3.4 3.4 0.2 42,889
Lambeth 17.1 31.9 21.8 4.7 13.9 4.8 3.6 2.0 0.2 62,912
Lewisham 16.6 33.1 17.0 7.9 12.8 3.8 4.1 4.5 0.2 58,759
Merton 29.3 27.6 14.9 8.3 8.7 3.0 3.4 4.7 0.2 52,998
Newham 12.9 34.1 9.1 6.5 5.8 20.8 5.1 5.2 0.6 53,674
Redbridge 31.5 24.9 13.2 9.3 6.0 6.4 3.0 5.4 0.3 68,075
Richmond upon Thames 34.4 13.9 29.3 6.1 10.2 1.6 1.9 2.5 0.1 57,101
Southwark 13.5 31.7 26.9 6.1 10.7 3.6 3.6 3.8 0.2 58,239
Sutton 32.0 13.0 27.6 11.5 5.2 1.3 3.8 5.6 0.1 50,265
Tower Hamlets 19.2 20.8 17.8 6.1 8.8 19.0 2.3 5.5 0.5 50,058
Waltham Forest 21.2 24.6 17.2 9.3 9.3 9.3 3.0 5.8 0.3 56,067
Wandsworth 36.5 25.0 14.5 4.5 10.7 3.8 2.6 2.3 0.2 75,240
Westminster, City of 41.6 20.6 14.2 5.2 9.1 4.4 1.9 2.7 0.3 45,292
London 28.5 25.0 16.9 8.4 8.6 4.7 2.9 4.8 0.3 1,873,166
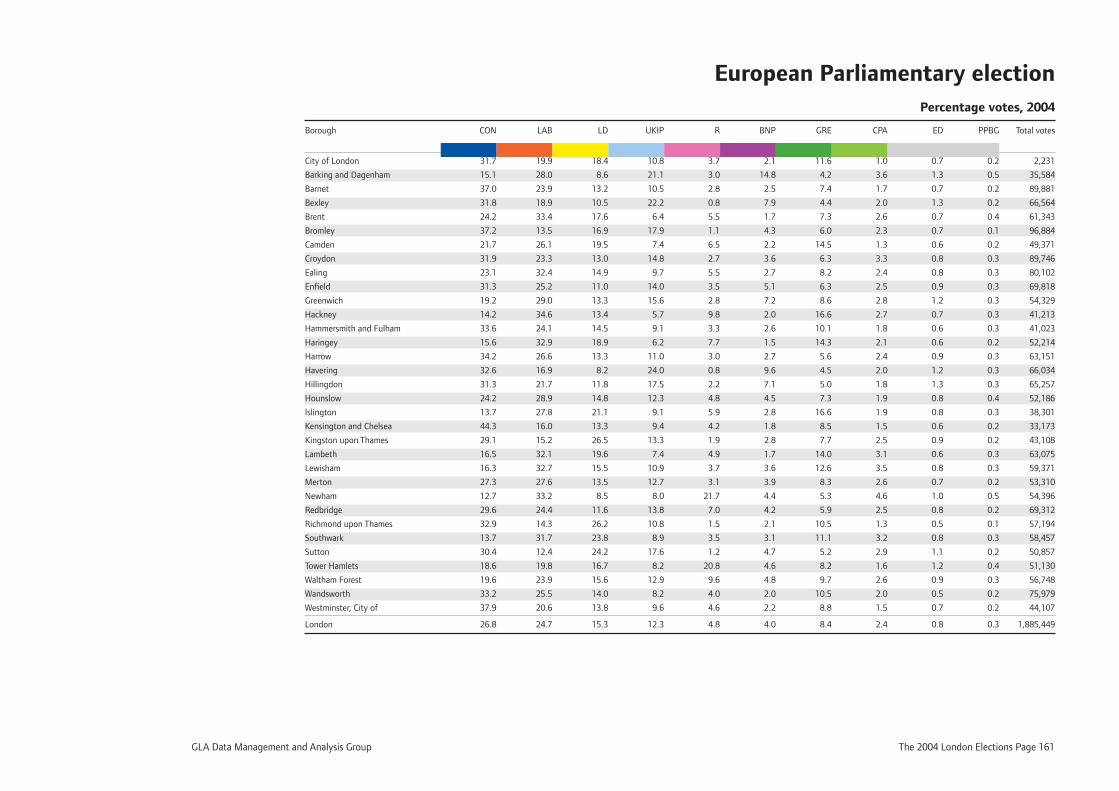
GLA Data Management and Analysis Group The 2004 London Elections Page 161
European Parliamentary election Percentage votes, 2004
Borough CON LAB LD UKIP R BNP GRE CPA ED PPBG Total votes
City of London 31.7 19.9 18.4 10.8 3.7 2.1 11.6 1.0 0.7 0.2 2,231
Barking and Dagenham 15.1 28.0 8.6 21.1 3.0 14.8 4.2 3.6 1.3 0.5 35,584
Barnet 37.0 23.9 13.2 10.5 2.8 2.5 7.4 1.7 0.7 0.2 89,881
Bexley 31.8 18.9 10.5 22.2 0.8 7.9 4.4 2.0 1.3 0.2 66,564
Brent 24.2 33.4 17.6 6.4 5.5 1.7 7.3 2.6 0.7 0.4 61,343
Bromley 37.2 13.5 16.9 17.9 1.1 4.3 6.0 2.3 0.7 0.1 96,884
Camden 21.7 26.1 19.5 7.4 6.5 2.2 14.5 1.3 0.6 0.2 49,371
Croydon 31.9 23.3 13.0 14.8 2.7 3.6 6.3 3.3 0.8 0.3 89,746
Ealing 23.1 32.4 14.9 9.7 5.5 2.7 8.2 2.4 0.8 0.3 80,102
Enfi eld 31.3 25.2 11.0 14.0 3.5 5.1 6.3 2.5 0.9 0.3 69,818
Greenwich 19.2 29.0 13.3 15.6 2.8 7.2 8.6 2.8 1.2 0.3 54,329
Hackney 14.2 34.6 13.4 5.7 9.8 2.0 16.6 2.7 0.7 0.3 41,213
Hammersmith and Fulham 33.6 24.1 14.5 9.1 3.3 2.6 10.1 1.8 0.6 0.3 41,023
Haringey 15.6 32.9 18.9 6.2 7.7 1.5 14.3 2.1 0.6 0.2 52,214
Harrow 34.2 26.6 13.3 11.0 3.0 2.7 5.6 2.4 0.9 0.3 63,151
Havering 32.6 16.9 8.2 24.0 0.8 9.6 4.5 2.0 1.2 0.3 66,034
Hillingdon 31.3 21.7 11.8 17.5 2.2 7.1 5.0 1.8 1.3 0.3 65,257
Hounslow 24.2 28.9 14.8 12.3 4.8 4.5 7.3 1.9 0.8 0.4 52,186
Islington 13.7 27.8 21.1 9.1 5.9 2.8 16.6 1.9 0.8 0.3 38,301
Kensington and Chelsea 44.3 16.0 13.3 9.4 4.2 1.8 8.5 1.5 0.6 0.2 33,173
Kingston upon Thames 29.1 15.2 26.5 13.3 1.9 2.8 7.7 2.5 0.9 0.2 43,108
Lambeth 16.5 32.1 19.6 7.4 4.9 1.7 14.0 3.1 0.6 0.3 63,075
Lewisham 16.3 32.7 15.5 10.9 3.7 3.6 12.6 3.5 0.8 0.3 59,371
Merton 27.3 27.6 13.5 12.7 3.1 3.9 8.3 2.6 0.7 0.2 53,310
Newham 12.7 33.2 8.5 8.0 21.7 4.4 5.3 4.6 1.0 0.5 54,396
Redbridge 29.6 24.4 11.6 13.8 7.0 4.2 5.9 2.5 0.8 0.2 69,312
Richmond upon Thames 32.9 14.3 26.2 10.8 1.5 2.1 10.5 1.3 0.5 0.1 57,194
Southwark 13.7 31.7 23.8 8.9 3.5 3.1 11.1 3.2 0.8 0.3 58,457
Sutton 30.4 12.4 24.2 17.6 1.2 4.7 5.2 2.9 1.1 0.2 50,857
Tower Hamlets 18.6 19.8 16.7 8.2 20.8 4.6 8.2 1.6 1.2 0.4 51,130
Waltham Forest 19.6 23.9 15.6 12.9 9.6 4.8 9.7 2.6 0.9 0.3 56,748
Wandsworth 33.2 25.5 14.0 8.2 4.0 2.0 10.5 2.0 0.5 0.2 75,979
Westminster, City of 37.9 20.6 13.8 9.6 4.6 2.2 8.8 1.5 0.7 0.2 44,107
London 26.8 24.7 15.3 12.3 4.8 4.0 8.4 2.4 0.8 0.3 1,885,449

Page 162 The 2004 London Elections GLA Data Management and Analysis Group
GLA Data Management and Analysis Group The 2004 London Elections Page 163
Statistics – London boroughs

Page 164 The 2004 London Elections GLA Data Management and Analysis Group
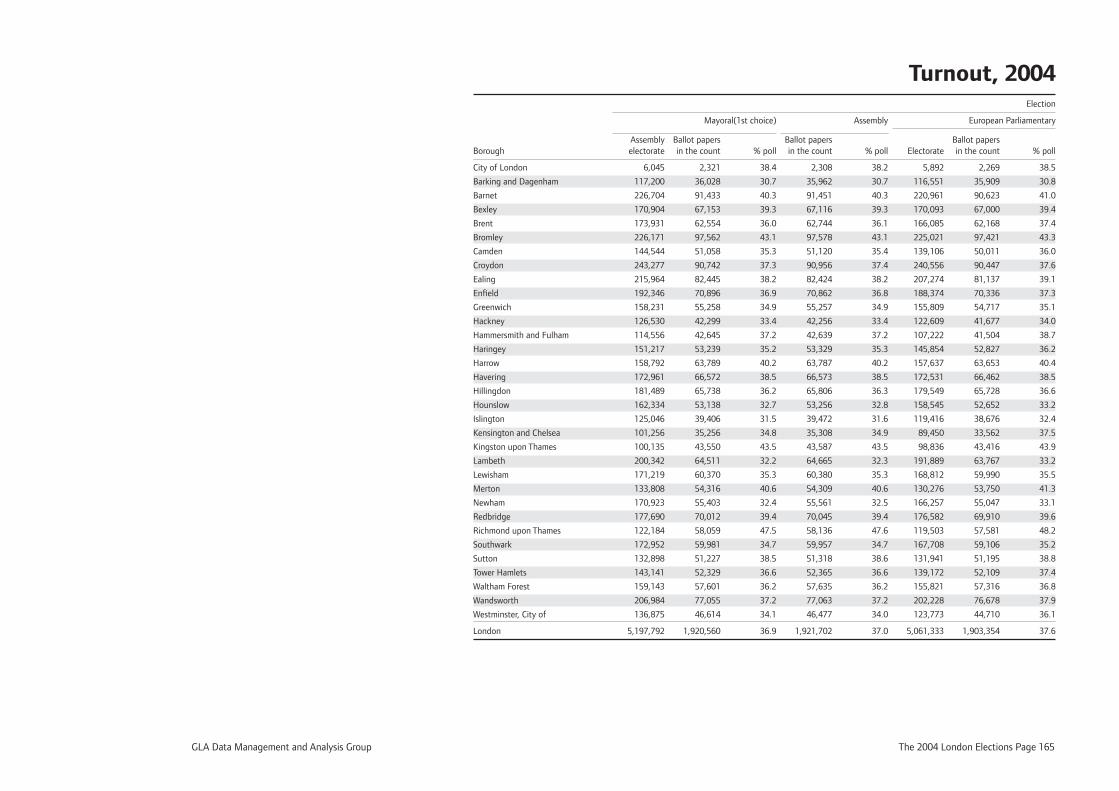
GLA Data Management and Analysis Group The 2004 London Elections Page 165
Turnout, 2004 Election
Mayoral(1st choice) Assembly European Parliamentary
Assembly Ballot papers Ballot papers Ballot papers Borough electorate in the count % poll in the count % poll Electorate in the count % poll
City of London 6,045 2,321 38.4 2,308 38.2 5,892 2,269 38.5
Barking and Dagenham 117,200 36,028 30.7 35,962 30.7 116,551 35,909 30.8
Barnet 226,704 91,433 40.3 91,451 40.3 220,961 90,623 41.0
Bexley 170,904 67,153 39.3 67,116 39.3 170,093 67,000 39.4
Brent 173,931 62,554 36.0 62,744 36.1 166,085 62,168 37.4
Bromley 226,171 97,562 43.1 97,578 43.1 225,021 97,421 43.3
Camden 144,544 51,058 35.3 51,120 35.4 139,106 50,011 36.0
Croydon 243,277 90,742 37.3 90,956 37.4 240,556 90,447 37.6
Ealing 215,964 82,445 38.2 82,424 38.2 207,274 81,137 39.1
Enfi eld 192,346 70,896 36.9 70,862 36.8 188,374 70,336 37.3
Greenwich 158,231 55,258 34.9 55,257 34.9 155,809 54,717 35.1
Hackney 126,530 42,299 33.4 42,256 33.4 122,609 41,677 34.0
Hammersmith and Fulham 114,556 42,645 37.2 42,639 37.2 107,222 41,504 38.7
Haringey 151,217 53,239 35.2 53,329 35.3 145,854 52,827 36.2
Harrow 158,792 63,789 40.2 63,787 40.2 157,637 63,653 40.4
Havering 172,961 66,572 38.5 66,573 38.5 172,531 66,462 38.5
Hillingdon 181,489 65,738 36.2 65,806 36.3 179,549 65,728 36.6
Hounslow 162,334 53,138 32.7 53,256 32.8 158,545 52,652 33.2
Islington 125,046 39,406 31.5 39,472 31.6 119,416 38,676 32.4
Kensington and Chelsea 101,256 35,256 34.8 35,308 34.9 89,450 33,562 37.5
Kingston upon Thames 100,135 43,550 43.5 43,587 43.5 98,836 43,416 43.9
Lambeth 200,342 64,511 32.2 64,665 32.3 191,889 63,767 33.2
Lewisham 171,219 60,370 35.3 60,380 35.3 168,812 59,990 35.5
Merton 133,808 54,316 40.6 54,309 40.6 130,276 53,750 41.3
Newham 170,923 55,403 32.4 55,561 32.5 166,257 55,047 33.1
Redbridge 177,690 70,012 39.4 70,045 39.4 176,582 69,910 39.6
Richmond upon Thames 122,184 58,059 47.5 58,136 47.6 119,503 57,581 48.2
Southwark 172,952 59,981 34.7 59,957 34.7 167,708 59,106 35.2
Sutton 132,898 51,227 38.5 51,318 38.6 131,941 51,195 38.8
Tower Hamlets 143,141 52,329 36.6 52,365 36.6 139,172 52,109 37.4
Waltham Forest 159,143 57,601 36.2 57,635 36.2 155,821 57,316 36.8
Wandsworth 206,984 77,055 37.2 77,063 37.2 202,228 76,678 37.9
Westminster, City of 136,875 46,614 34.1 46,477 34.0 123,773 44,710 36.1
London 5,197,792 1,920,560 36.9 1,921,702 37.0 5,061,333 1,903,354 37.6
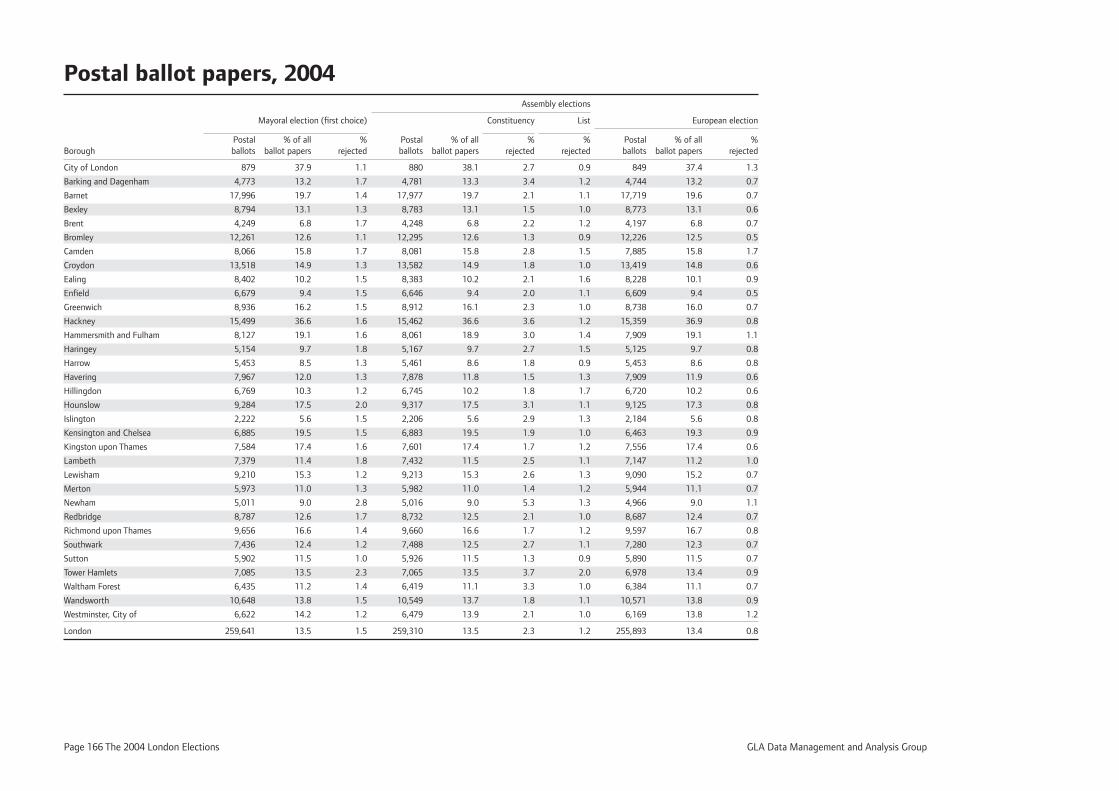
Page 166 The 2004 London Elections GLA Data Management and Analysis Group
Postal ballot papers, 2004 Assembly elections
Mayoral election (fi rst choice) Constituency List European election
Postal % of all % Postal % of all % % Postal % of all %Borough ballots ballot papers rejected ballots ballot papers rejected rejected ballots ballot papers rejected
City of London 879 37.9 1.1 880 38.1 2.7 0.9 849 37.4 1.3
Barking and Dagenham 4,773 13.2 1.7 4,781 13.3 3.4 1.2 4,744 13.2 0.7
Barnet 17,996 19.7 1.4 17,977 19.7 2.1 1.1 17,719 19.6 0.7
Bexley 8,794 13.1 1.3 8,783 13.1 1.5 1.0 8,773 13.1 0.6
Brent 4,249 6.8 1.7 4,248 6.8 2.2 1.2 4,197 6.8 0.7
Bromley 12,261 12.6 1.1 12,295 12.6 1.3 0.9 12,226 12.5 0.5
Camden 8,066 15.8 1.7 8,081 15.8 2.8 1.5 7,885 15.8 1.7
Croydon 13,518 14.9 1.3 13,582 14.9 1.8 1.0 13,419 14.8 0.6
Ealing 8,402 10.2 1.5 8,383 10.2 2.1 1.6 8,228 10.1 0.9
Enfi eld 6,679 9.4 1.5 6,646 9.4 2.0 1.1 6,609 9.4 0.5
Greenwich 8,936 16.2 1.5 8,912 16.1 2.3 1.0 8,738 16.0 0.7
Hackney 15,499 36.6 1.6 15,462 36.6 3.6 1.2 15,359 36.9 0.8
Hammersmith and Fulham 8,127 19.1 1.6 8,061 18.9 3.0 1.4 7,909 19.1 1.1
Haringey 5,154 9.7 1.8 5,167 9.7 2.7 1.5 5,125 9.7 0.8
Harrow 5,453 8.5 1.3 5,461 8.6 1.8 0.9 5,453 8.6 0.8
Havering 7,967 12.0 1.3 7,878 11.8 1.5 1.3 7,909 11.9 0.6
Hillingdon 6,769 10.3 1.2 6,745 10.2 1.8 1.7 6,720 10.2 0.6
Hounslow 9,284 17.5 2.0 9,317 17.5 3.1 1.1 9,125 17.3 0.8
Islington 2,222 5.6 1.5 2,206 5.6 2.9 1.3 2,184 5.6 0.8
Kensington and Chelsea 6,885 19.5 1.5 6,883 19.5 1.9 1.0 6,463 19.3 0.9
Kingston upon Thames 7,584 17.4 1.6 7,601 17.4 1.7 1.2 7,556 17.4 0.6
Lambeth 7,379 11.4 1.8 7,432 11.5 2.5 1.1 7,147 11.2 1.0
Lewisham 9,210 15.3 1.2 9,213 15.3 2.6 1.3 9,090 15.2 0.7
Merton 5,973 11.0 1.3 5,982 11.0 1.4 1.2 5,944 11.1 0.7
Newham 5,011 9.0 2.8 5,016 9.0 5.3 1.3 4,966 9.0 1.1
Redbridge 8,787 12.6 1.7 8,732 12.5 2.1 1.0 8,687 12.4 0.7
Richmond upon Thames 9,656 16.6 1.4 9,660 16.6 1.7 1.2 9,597 16.7 0.8
Southwark 7,436 12.4 1.2 7,488 12.5 2.7 1.1 7,280 12.3 0.7
Sutton 5,902 11.5 1.0 5,926 11.5 1.3 0.9 5,890 11.5 0.7
Tower Hamlets 7,085 13.5 2.3 7,065 13.5 3.7 2.0 6,978 13.4 0.9
Waltham Forest 6,435 11.2 1.4 6,419 11.1 3.3 1.0 6,384 11.1 0.7
Wandsworth 10,648 13.8 1.5 10,549 13.7 1.8 1.1 10,571 13.8 0.9
Westminster, City of 6,622 14.2 1.2 6,479 13.9 2.1 1.0 6,169 13.8 1.2
London 259,641 13.5 1.5 259,310 13.5 2.3 1.2 255,893 13.4 0.8
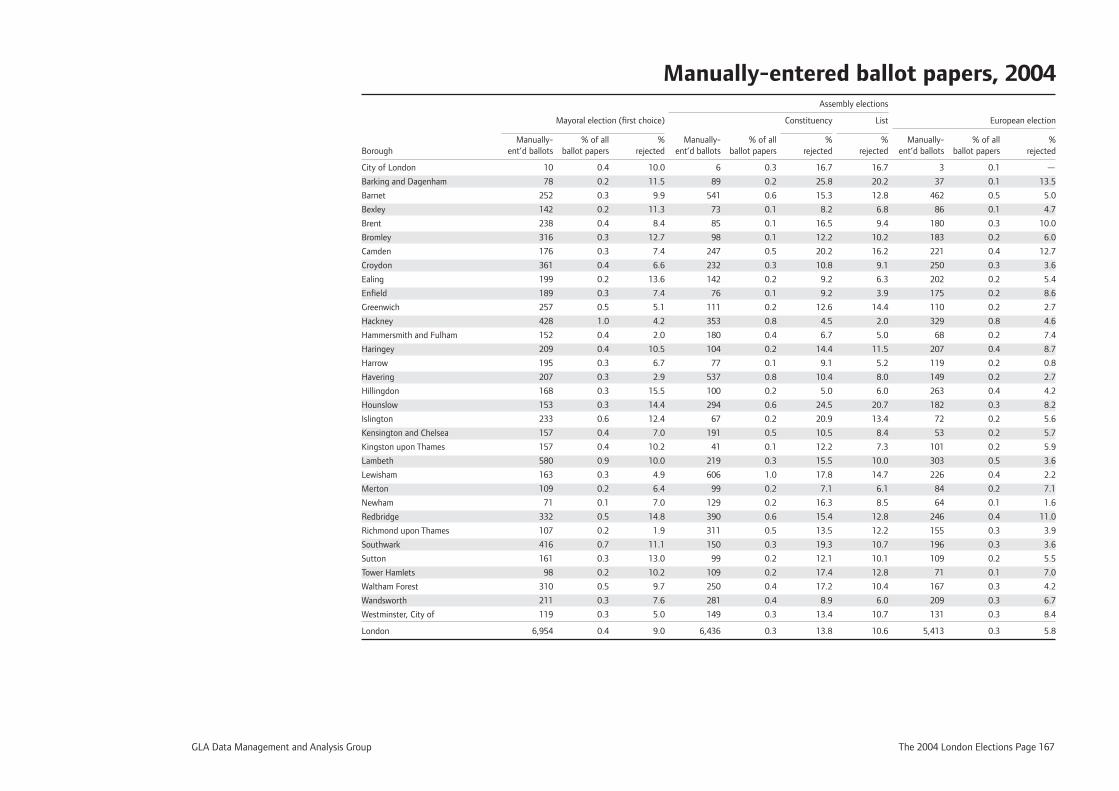
GLA Data Management and Analysis Group The 2004 London Elections Page 167
Manually-entered ballot papers, 2004 Assembly elections
Mayoral election (fi rst choice) Constituency List European election
Manually- % of all % Manually- % of all % % Manually- % of all %Borough ent’d ballots ballot papers rejected ent’d ballots ballot papers rejected rejected ent’d ballots ballot papers rejected
City of London 10 0.4 10.0 6 0.3 16.7 16.7 3 0.1 —
Barking and Dagenham 78 0.2 11.5 89 0.2 25.8 20.2 37 0.1 13.5
Barnet 252 0.3 9.9 541 0.6 15.3 12.8 462 0.5 5.0
Bexley 142 0.2 11.3 73 0.1 8.2 6.8 86 0.1 4.7
Brent 238 0.4 8.4 85 0.1 16.5 9.4 180 0.3 10.0
Bromley 316 0.3 12.7 98 0.1 12.2 10.2 183 0.2 6.0
Camden 176 0.3 7.4 247 0.5 20.2 16.2 221 0.4 12.7
Croydon 361 0.4 6.6 232 0.3 10.8 9.1 250 0.3 3.6
Ealing 199 0.2 13.6 142 0.2 9.2 6.3 202 0.2 5.4
Enfi eld 189 0.3 7.4 76 0.1 9.2 3.9 175 0.2 8.6
Greenwich 257 0.5 5.1 111 0.2 12.6 14.4 110 0.2 2.7
Hackney 428 1.0 4.2 353 0.8 4.5 2.0 329 0.8 4.6
Hammersmith and Fulham 152 0.4 2.0 180 0.4 6.7 5.0 68 0.2 7.4
Haringey 209 0.4 10.5 104 0.2 14.4 11.5 207 0.4 8.7
Harrow 195 0.3 6.7 77 0.1 9.1 5.2 119 0.2 0.8
Havering 207 0.3 2.9 537 0.8 10.4 8.0 149 0.2 2.7
Hillingdon 168 0.3 15.5 100 0.2 5.0 6.0 263 0.4 4.2
Hounslow 153 0.3 14.4 294 0.6 24.5 20.7 182 0.3 8.2
Islington 233 0.6 12.4 67 0.2 20.9 13.4 72 0.2 5.6
Kensington and Chelsea 157 0.4 7.0 191 0.5 10.5 8.4 53 0.2 5.7
Kingston upon Thames 157 0.4 10.2 41 0.1 12.2 7.3 101 0.2 5.9
Lambeth 580 0.9 10.0 219 0.3 15.5 10.0 303 0.5 3.6
Lewisham 163 0.3 4.9 606 1.0 17.8 14.7 226 0.4 2.2
Merton 109 0.2 6.4 99 0.2 7.1 6.1 84 0.2 7.1
Newham 71 0.1 7.0 129 0.2 16.3 8.5 64 0.1 1.6
Redbridge 332 0.5 14.8 390 0.6 15.4 12.8 246 0.4 11.0
Richmond upon Thames 107 0.2 1.9 311 0.5 13.5 12.2 155 0.3 3.9
Southwark 416 0.7 11.1 150 0.3 19.3 10.7 196 0.3 3.6
Sutton 161 0.3 13.0 99 0.2 12.1 10.1 109 0.2 5.5
Tower Hamlets 98 0.2 10.2 109 0.2 17.4 12.8 71 0.1 7.0
Waltham Forest 310 0.5 9.7 250 0.4 17.2 10.4 167 0.3 4.2
Wandsworth 211 0.3 7.6 281 0.4 8.9 6.0 209 0.3 6.7
Westminster, City of 119 0.3 5.0 149 0.3 13.4 10.7 131 0.3 8.4
London 6,954 0.4 9.0 6,436 0.3 13.8 10.6 5,413 0.3 5.8
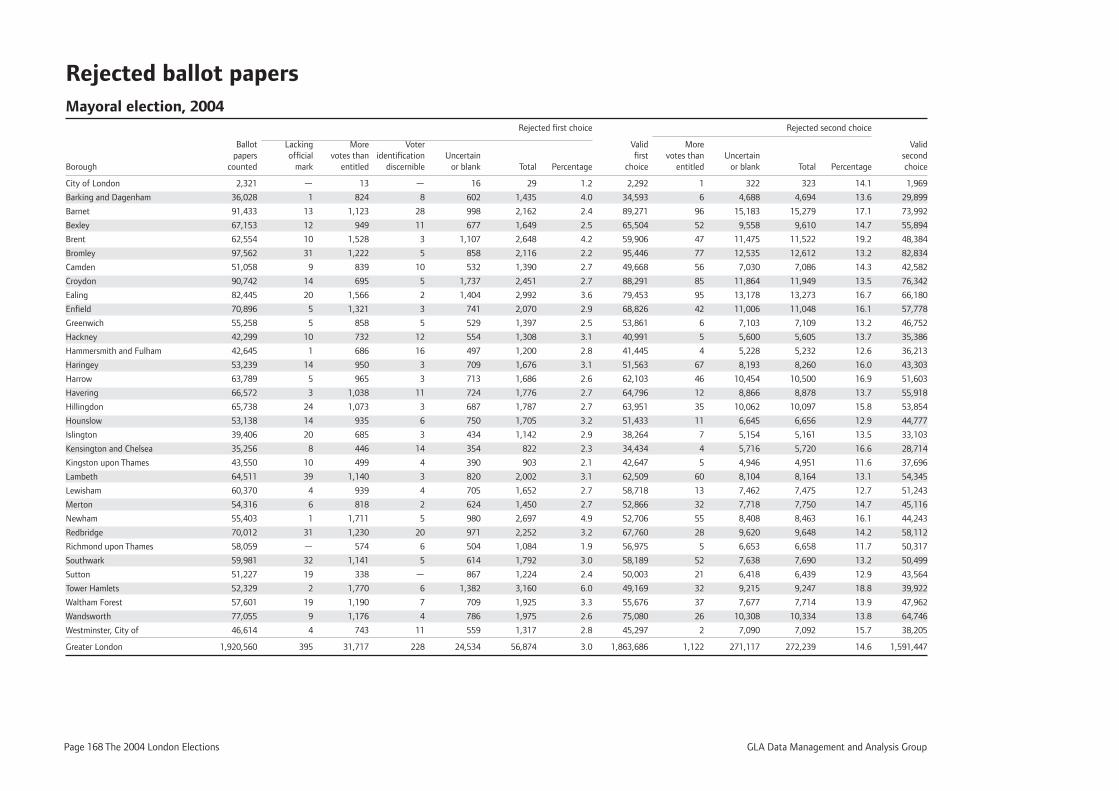
Page 168 The 2004 London Elections GLA Data Management and Analysis Group
Rejected ballot papersMayoral election, 2004 Rejected fi rst choice Rejected second choice
Ballot Lacking More Voter Valid More Valid papers offi cial votes than identifi cation Uncertain fi rst votes than Uncertain secondBorough counted mark entitled discernible or blank Total Percentage choice entitled or blank Total Percentage choice
City of London 2,321 — 13 — 16 29 1.2 2,292 1 322 323 14.1 1,969
Barking and Dagenham 36,028 1 824 8 602 1,435 4.0 34,593 6 4,688 4,694 13.6 29,899
Barnet 91,433 13 1,123 28 998 2,162 2.4 89,271 96 15,183 15,279 17.1 73,992
Bexley 67,153 12 949 11 677 1,649 2.5 65,504 52 9,558 9,610 14.7 55,894
Brent 62,554 10 1,528 3 1,107 2,648 4.2 59,906 47 11,475 11,522 19.2 48,384
Bromley 97,562 31 1,222 5 858 2,116 2.2 95,446 77 12,535 12,612 13.2 82,834
Camden 51,058 9 839 10 532 1,390 2.7 49,668 56 7,030 7,086 14.3 42,582
Croydon 90,742 14 695 5 1,737 2,451 2.7 88,291 85 11,864 11,949 13.5 76,342
Ealing 82,445 20 1,566 2 1,404 2,992 3.6 79,453 95 13,178 13,273 16.7 66,180
Enfi eld 70,896 5 1,321 3 741 2,070 2.9 68,826 42 11,006 11,048 16.1 57,778
Greenwich 55,258 5 858 5 529 1,397 2.5 53,861 6 7,103 7,109 13.2 46,752
Hackney 42,299 10 732 12 554 1,308 3.1 40,991 5 5,600 5,605 13.7 35,386
Hammersmith and Fulham 42,645 1 686 16 497 1,200 2.8 41,445 4 5,228 5,232 12.6 36,213
Haringey 53,239 14 950 3 709 1,676 3.1 51,563 67 8,193 8,260 16.0 43,303
Harrow 63,789 5 965 3 713 1,686 2.6 62,103 46 10,454 10,500 16.9 51,603
Havering 66,572 3 1,038 11 724 1,776 2.7 64,796 12 8,866 8,878 13.7 55,918
Hillingdon 65,738 24 1,073 3 687 1,787 2.7 63,951 35 10,062 10,097 15.8 53,854
Hounslow 53,138 14 935 6 750 1,705 3.2 51,433 11 6,645 6,656 12.9 44,777
Islington 39,406 20 685 3 434 1,142 2.9 38,264 7 5,154 5,161 13.5 33,103
Kensington and Chelsea 35,256 8 446 14 354 822 2.3 34,434 4 5,716 5,720 16.6 28,714
Kingston upon Thames 43,550 10 499 4 390 903 2.1 42,647 5 4,946 4,951 11.6 37,696
Lambeth 64,511 39 1,140 3 820 2,002 3.1 62,509 60 8,104 8,164 13.1 54,345
Lewisham 60,370 4 939 4 705 1,652 2.7 58,718 13 7,462 7,475 12.7 51,243
Merton 54,316 6 818 2 624 1,450 2.7 52,866 32 7,718 7,750 14.7 45,116
Newham 55,403 1 1,711 5 980 2,697 4.9 52,706 55 8,408 8,463 16.1 44,243
Redbridge 70,012 31 1,230 20 971 2,252 3.2 67,760 28 9,620 9,648 14.2 58,112
Richmond upon Thames 58,059 — 574 6 504 1,084 1.9 56,975 5 6,653 6,658 11.7 50,317
Southwark 59,981 32 1,141 5 614 1,792 3.0 58,189 52 7,638 7,690 13.2 50,499
Sutton 51,227 19 338 — 867 1,224 2.4 50,003 21 6,418 6,439 12.9 43,564
Tower Hamlets 52,329 2 1,770 6 1,382 3,160 6.0 49,169 32 9,215 9,247 18.8 39,922
Waltham Forest 57,601 19 1,190 7 709 1,925 3.3 55,676 37 7,677 7,714 13.9 47,962
Wandsworth 77,055 9 1,176 4 786 1,975 2.6 75,080 26 10,308 10,334 13.8 64,746
Westminster, City of 46,614 4 743 11 559 1,317 2.8 45,297 2 7,090 7,092 15.7 38,205
Greater London 1,920,560 395 31,717 228 24,534 56,874 3.0 1,863,686 1,122 271,117 272,239 14.6 1,591,447
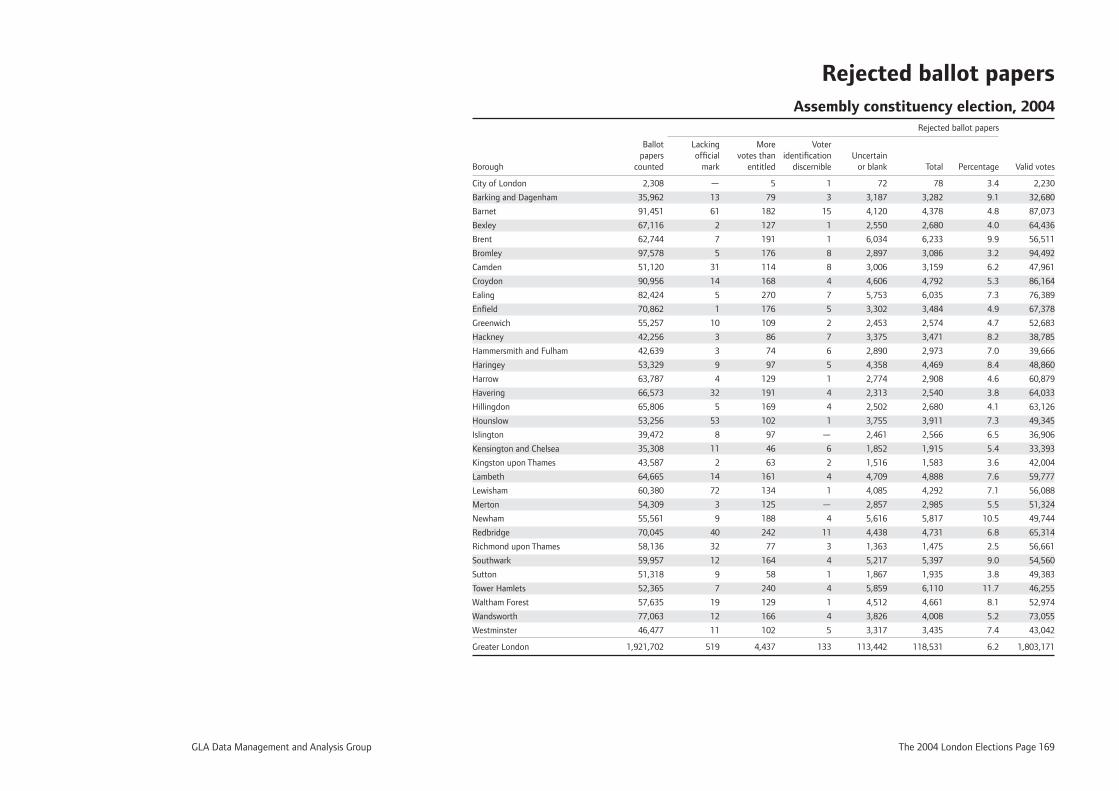
GLA Data Management and Analysis Group The 2004 London Elections Page 169
Rejected ballot papers Assembly constituency election, 2004 Rejected ballot papers
Ballot Lacking More Voter papers offi cial votes than identifi cation Uncertain Borough counted mark entitled discernible or blank Total Percentage Valid votes
City of London 2,308 — 5 1 72 78 3.4 2,230
Barking and Dagenham 35,962 13 79 3 3,187 3,282 9.1 32,680
Barnet 91,451 61 182 15 4,120 4,378 4.8 87,073
Bexley 67,116 2 127 1 2,550 2,680 4.0 64,436
Brent 62,744 7 191 1 6,034 6,233 9.9 56,511
Bromley 97,578 5 176 8 2,897 3,086 3.2 94,492
Camden 51,120 31 114 8 3,006 3,159 6.2 47,961
Croydon 90,956 14 168 4 4,606 4,792 5.3 86,164
Ealing 82,424 5 270 7 5,753 6,035 7.3 76,389
Enfi eld 70,862 1 176 5 3,302 3,484 4.9 67,378
Greenwich 55,257 10 109 2 2,453 2,574 4.7 52,683
Hackney 42,256 3 86 7 3,375 3,471 8.2 38,785
Hammersmith and Fulham 42,639 3 74 6 2,890 2,973 7.0 39,666
Haringey 53,329 9 97 5 4,358 4,469 8.4 48,860
Harrow 63,787 4 129 1 2,774 2,908 4.6 60,879
Havering 66,573 32 191 4 2,313 2,540 3.8 64,033
Hillingdon 65,806 5 169 4 2,502 2,680 4.1 63,126
Hounslow 53,256 53 102 1 3,755 3,911 7.3 49,345
Islington 39,472 8 97 — 2,461 2,566 6.5 36,906
Kensington and Chelsea 35,308 11 46 6 1,852 1,915 5.4 33,393
Kingston upon Thames 43,587 2 63 2 1,516 1,583 3.6 42,004
Lambeth 64,665 14 161 4 4,709 4,888 7.6 59,777
Lewisham 60,380 72 134 1 4,085 4,292 7.1 56,088
Merton 54,309 3 125 — 2,857 2,985 5.5 51,324
Newham 55,561 9 188 4 5,616 5,817 10.5 49,744
Redbridge 70,045 40 242 11 4,438 4,731 6.8 65,314
Richmond upon Thames 58,136 32 77 3 1,363 1,475 2.5 56,661
Southwark 59,957 12 164 4 5,217 5,397 9.0 54,560
Sutton 51,318 9 58 1 1,867 1,935 3.8 49,383
Tower Hamlets 52,365 7 240 4 5,859 6,110 11.7 46,255
Waltham Forest 57,635 19 129 1 4,512 4,661 8.1 52,974
Wandsworth 77,063 12 166 4 3,826 4,008 5.2 73,055
Westminster 46,477 11 102 5 3,317 3,435 7.4 43,042
Greater London 1,921,702 519 4,437 133 113,442 118,531 6.2 1,803,171
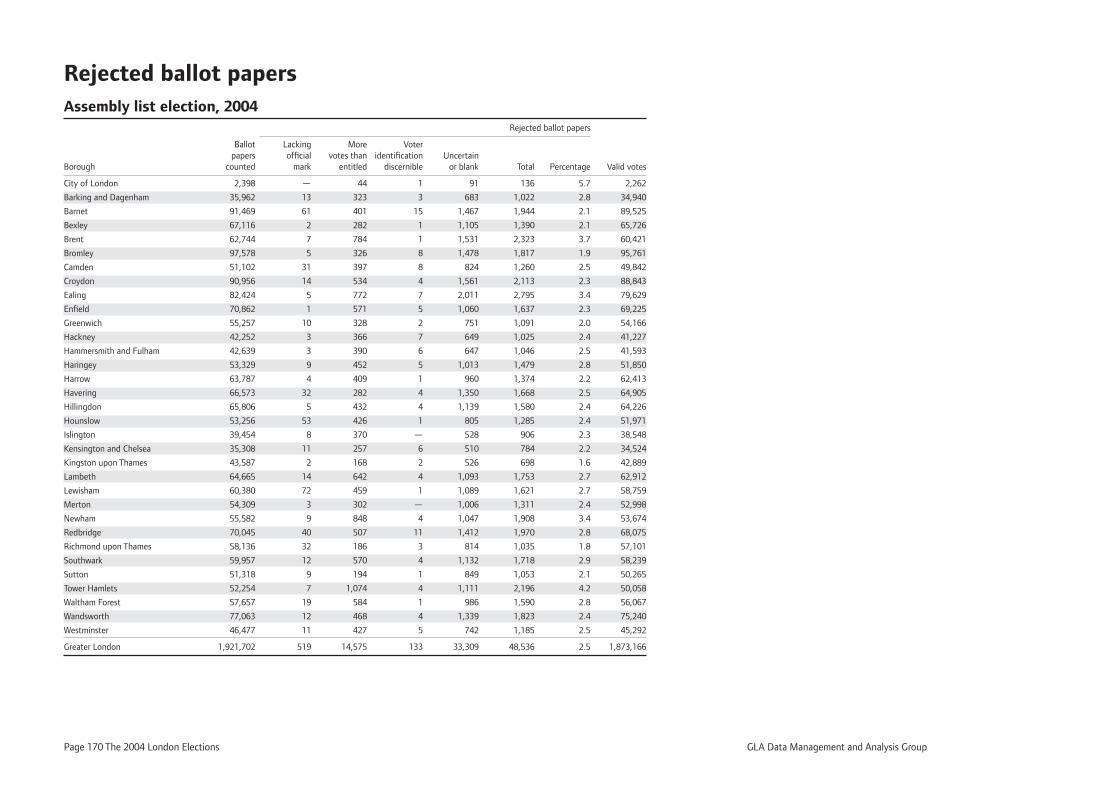
Page 170 The 2004 London Elections GLA Data Management and Analysis Group
Rejected ballot papersAssembly list election, 2004 Rejected ballot papers
Ballot Lacking More Voter papers offi cial votes than identifi cation Uncertain Borough counted mark entitled discernible or blank Total Percentage Valid votes
City of London 2,398 — 44 1 91 136 5.7 2,262
Barking and Dagenham 35,962 13 323 3 683 1,022 2.8 34,940
Barnet 91,469 61 401 15 1,467 1,944 2.1 89,525
Bexley 67,116 2 282 1 1,105 1,390 2.1 65,726
Brent 62,744 7 784 1 1,531 2,323 3.7 60,421
Bromley 97,578 5 326 8 1,478 1,817 1.9 95,761
Camden 51,102 31 397 8 824 1,260 2.5 49,842
Croydon 90,956 14 534 4 1,561 2,113 2.3 88,843
Ealing 82,424 5 772 7 2,011 2,795 3.4 79,629
Enfi eld 70,862 1 571 5 1,060 1,637 2.3 69,225
Greenwich 55,257 10 328 2 751 1,091 2.0 54,166
Hackney 42,252 3 366 7 649 1,025 2.4 41,227
Hammersmith and Fulham 42,639 3 390 6 647 1,046 2.5 41,593
Haringey 53,329 9 452 5 1,013 1,479 2.8 51,850
Harrow 63,787 4 409 1 960 1,374 2.2 62,413
Havering 66,573 32 282 4 1,350 1,668 2.5 64,905
Hillingdon 65,806 5 432 4 1,139 1,580 2.4 64,226
Hounslow 53,256 53 426 1 805 1,285 2.4 51,971
Islington 39,454 8 370 — 528 906 2.3 38,548
Kensington and Chelsea 35,308 11 257 6 510 784 2.2 34,524
Kingston upon Thames 43,587 2 168 2 526 698 1.6 42,889
Lambeth 64,665 14 642 4 1,093 1,753 2.7 62,912
Lewisham 60,380 72 459 1 1,089 1,621 2.7 58,759
Merton 54,309 3 302 — 1,006 1,311 2.4 52,998
Newham 55,582 9 848 4 1,047 1,908 3.4 53,674
Redbridge 70,045 40 507 11 1,412 1,970 2.8 68,075
Richmond upon Thames 58,136 32 186 3 814 1,035 1.8 57,101
Southwark 59,957 12 570 4 1,132 1,718 2.9 58,239
Sutton 51,318 9 194 1 849 1,053 2.1 50,265
Tower Hamlets 52,254 7 1,074 4 1,111 2,196 4.2 50,058
Waltham Forest 57,657 19 584 1 986 1,590 2.8 56,067
Wandsworth 77,063 12 468 4 1,339 1,823 2.4 75,240
Westminster 46,477 11 427 5 742 1,185 2.5 45,292
Greater London 1,921,702 519 14,575 133 33,309 48,536 2.5 1,873,166
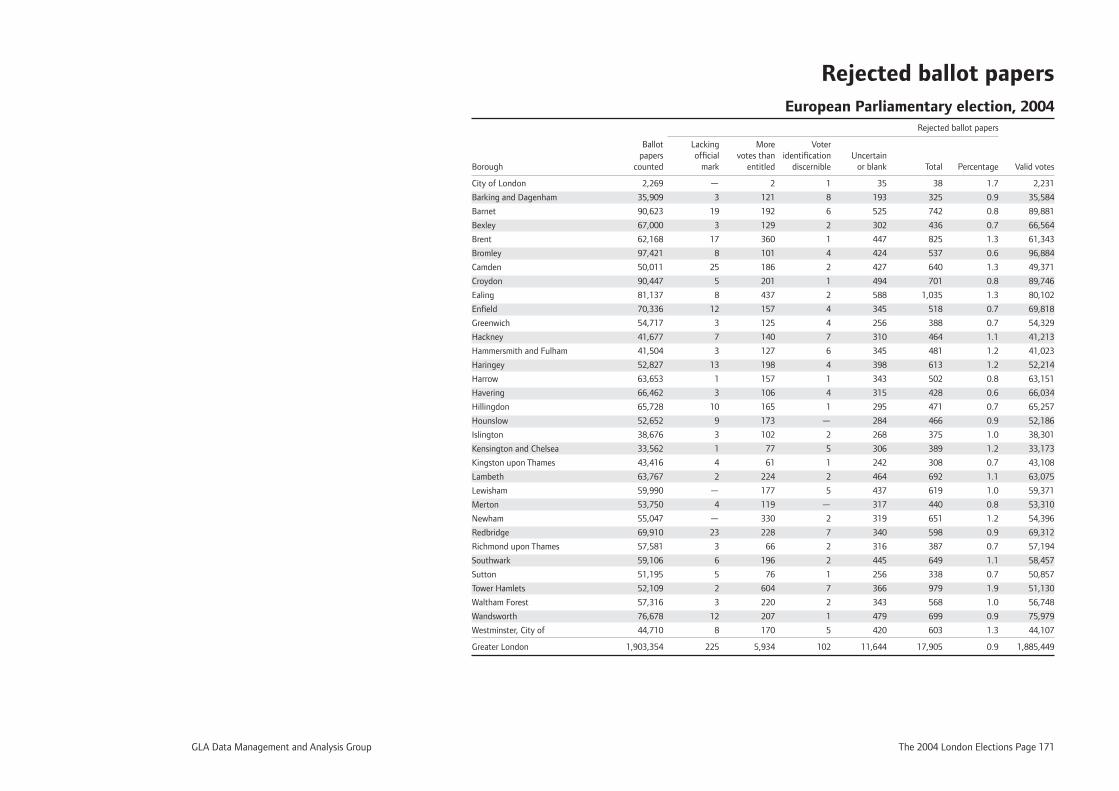
GLA Data Management and Analysis Group The 2004 London Elections Page 171
Rejected ballot papers European Parliamentary election, 2004 Rejected ballot papers
Ballot Lacking More Voter papers offi cial votes than identifi cation Uncertain Borough counted mark entitled discernible or blank Total Percentage Valid votes
City of London 2,269 — 2 1 35 38 1.7 2,231
Barking and Dagenham 35,909 3 121 8 193 325 0.9 35,584
Barnet 90,623 19 192 6 525 742 0.8 89,881
Bexley 67,000 3 129 2 302 436 0.7 66,564
Brent 62,168 17 360 1 447 825 1.3 61,343
Bromley 97,421 8 101 4 424 537 0.6 96,884
Camden 50,011 25 186 2 427 640 1.3 49,371
Croydon 90,447 5 201 1 494 701 0.8 89,746
Ealing 81,137 8 437 2 588 1,035 1.3 80,102
Enfi eld 70,336 12 157 4 345 518 0.7 69,818
Greenwich 54,717 3 125 4 256 388 0.7 54,329
Hackney 41,677 7 140 7 310 464 1.1 41,213
Hammersmith and Fulham 41,504 3 127 6 345 481 1.2 41,023
Haringey 52,827 13 198 4 398 613 1.2 52,214
Harrow 63,653 1 157 1 343 502 0.8 63,151
Havering 66,462 3 106 4 315 428 0.6 66,034
Hillingdon 65,728 10 165 1 295 471 0.7 65,257
Hounslow 52,652 9 173 — 284 466 0.9 52,186
Islington 38,676 3 102 2 268 375 1.0 38,301
Kensington and Chelsea 33,562 1 77 5 306 389 1.2 33,173
Kingston upon Thames 43,416 4 61 1 242 308 0.7 43,108
Lambeth 63,767 2 224 2 464 692 1.1 63,075
Lewisham 59,990 — 177 5 437 619 1.0 59,371
Merton 53,750 4 119 — 317 440 0.8 53,310
Newham 55,047 — 330 2 319 651 1.2 54,396
Redbridge 69,910 23 228 7 340 598 0.9 69,312
Richmond upon Thames 57,581 3 66 2 316 387 0.7 57,194
Southwark 59,106 6 196 2 445 649 1.1 58,457
Sutton 51,195 5 76 1 256 338 0.7 50,857
Tower Hamlets 52,109 2 604 7 366 979 1.9 51,130
Waltham Forest 57,316 3 220 2 343 568 1.0 56,748
Wandsworth 76,678 12 207 1 479 699 0.9 75,979
Westminster, City of 44,710 8 170 5 420 603 1.3 44,107
Greater London 1,903,354 225 5,934 102 11,644 17,905 0.9 1,885,449

Page 172 The 2004 London Elections GLA Data Management and Analysis Group
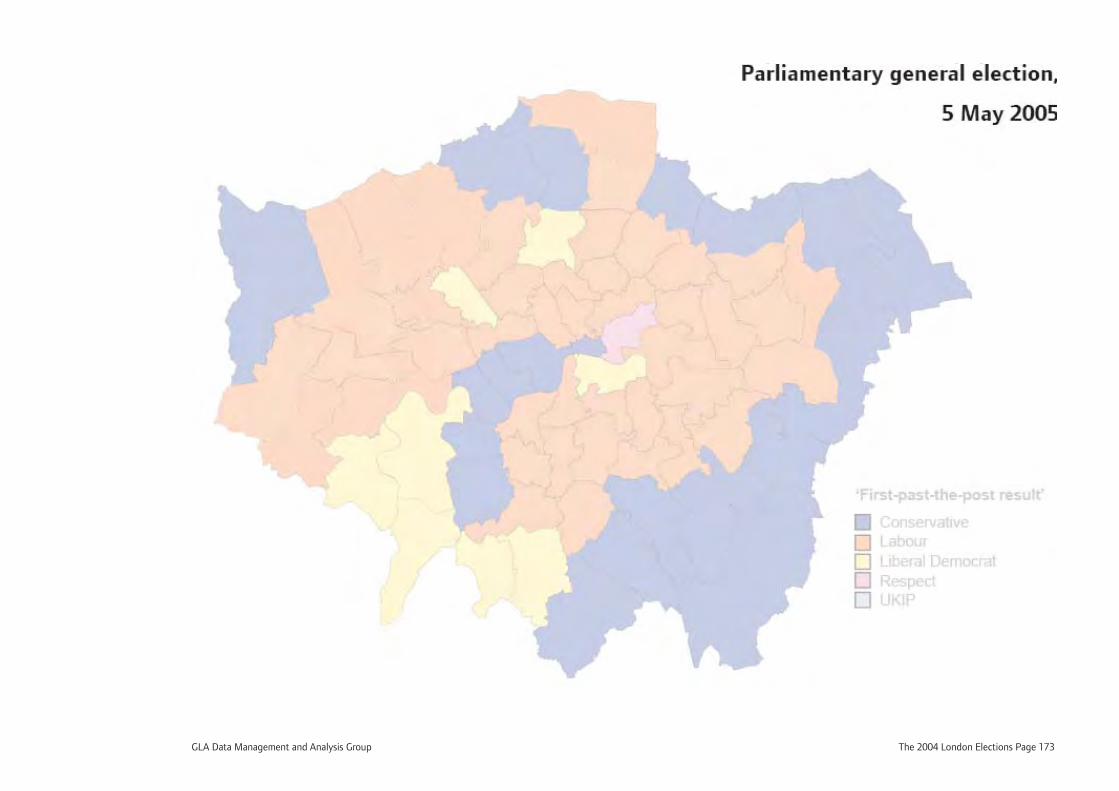
GLA Data Management and Analysis Group The 2004 London Elections Page 173
Parliamentary general election,
5 May 2005
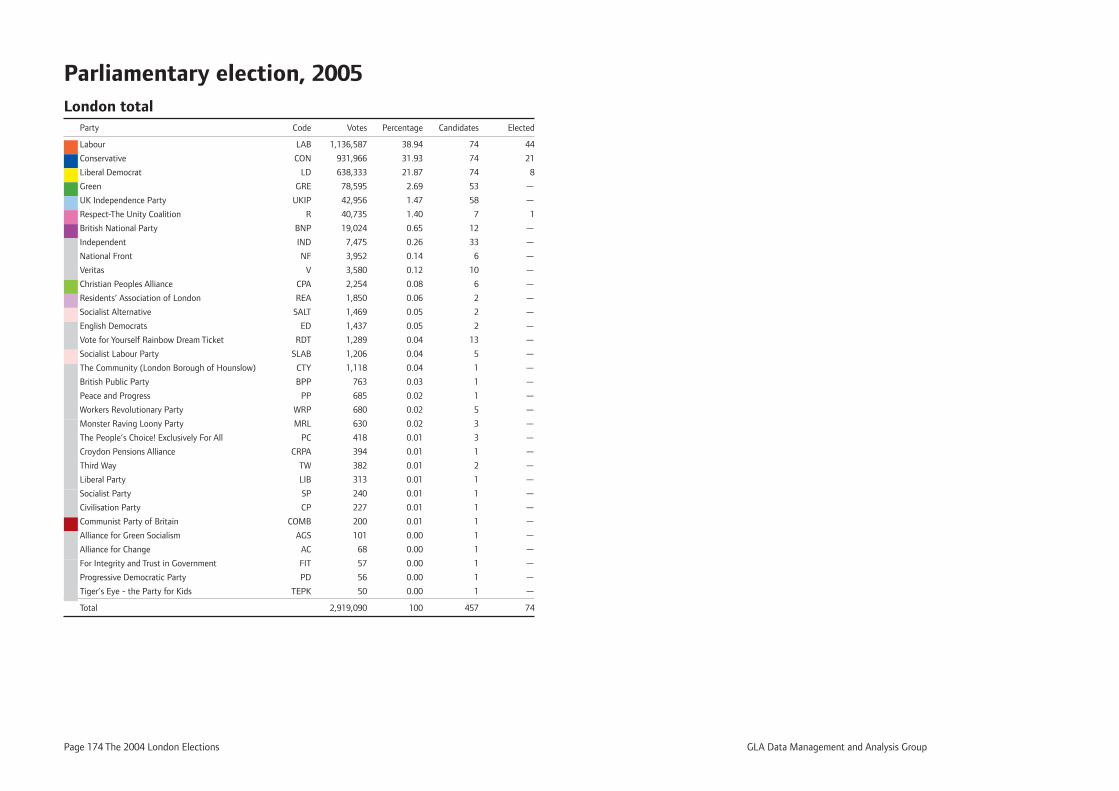
Page 174 The 2004 London Elections GLA Data Management and Analysis Group
Parliamentary election, 2005London total Party Code Votes Percentage Candidates Elected
Labour LAB 1,136,587 38.94 74 44
Conservative CON 931,966 31.93 74 21
Liberal Democrat LD 638,333 21.87 74 8
Green GRE 78,595 2.69 53 —
UK Independence Party UKIP 42,956 1.47 58 —
Respect-The Unity Coalition R 40,735 1.40 7 1
British National Party BNP 19,024 0.65 12 —
Independent IND 7,475 0.26 33 —
National Front NF 3,952 0.14 6 —
Veritas V 3,580 0.12 10 —
Christian Peoples Alliance CPA 2,254 0.08 6 —
Residents’ Association of London REA 1,850 0.06 2 —
Socialist Alternative SALT 1,469 0.05 2 —
English Democrats ED 1,437 0.05 2 —
Vote for Yourself Rainbow Dream Ticket RDT 1,289 0.04 13 —
Socialist Labour Party SLAB 1,206 0.04 5 —
The Community (London Borough of Hounslow) CTY 1,118 0.04 1 —
British Public Party BPP 763 0.03 1 —
Peace and Progress PP 685 0.02 1 —
Workers Revolutionary Party WRP 680 0.02 5 —
Monster Raving Loony Party MRL 630 0.02 3 —
The People’s Choice! Exclusively For All PC 418 0.01 3 —
Croydon Pensions Alliance CRPA 394 0.01 1 —
Third Way TW 382 0.01 2 —
Liberal Party LIB 313 0.01 1 —
Socialist Party SP 240 0.01 1 —
Civilisation Party CP 227 0.01 1 —
Communist Party of Britain COMB 200 0.01 1 —
Alliance for Green Socialism AGS 101 0.00 1 —
Alliance for Change AC 68 0.00 1 —
For Integrity and Trust in Government FIT 57 0.00 1 —
Progressive Democratic Party PD 56 0.00 1 —
Tiger’s Eye - the Party for Kids TEPK 50 0.00 1 —
Total 2,919,090 100 457 74
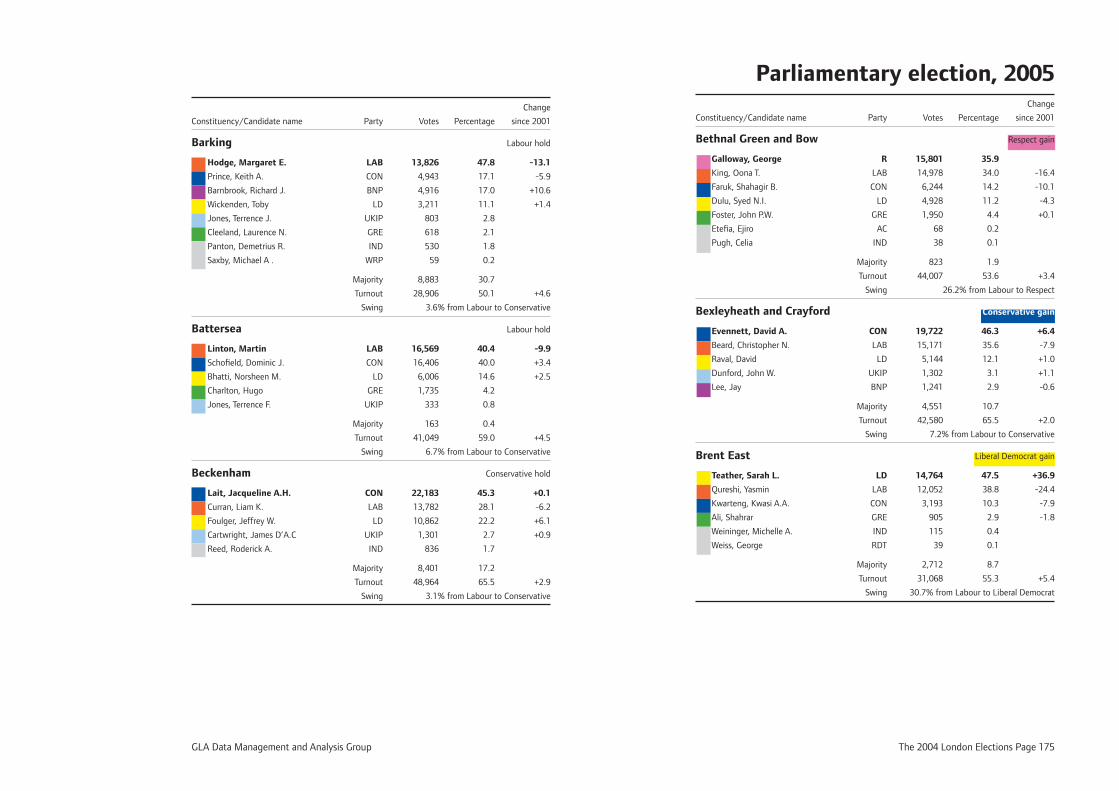
GLA Data Management and Analysis Group The 2004 London Elections Page 175
Change
Constituency/Candidate name Party Votes Percentage since 2001
Barking Labour hold
Hodge, Margaret E. LAB 13,826 47.8 -13.1
Prince, Keith A. CON 4,943 17.1 -5.9
Barnbrook, Richard J. BNP 4,916 17.0 +10.6
Wickenden, Toby LD 3,211 11.1 +1.4
Jones, Terrence J. UKIP 803 2.8
Cleeland, Laurence N. GRE 618 2.1
Panton, Demetrius R. IND 530 1.8
Saxby, Michael A . WRP 59 0.2
Majority 8,883 30.7
Turnout 28,906 50.1 +4.6
Swing 3.6% from Labour to Conservative
Battersea Labour hold
Linton, Martin LAB 16,569 40.4 -9.9
Schofi eld, Dominic J. CON 16,406 40.0 +3.4
Bhatti, Norsheen M. LD 6,006 14.6 +2.5
Charlton, Hugo GRE 1,735 4.2
Jones, Terrence F. UKIP 333 0.8
Majority 163 0.4
Turnout 41,049 59.0 +4.5
Swing 6.7% from Labour to Conservative
Beckenham Conservative hold
Lait, Jacqueline A.H. CON 22,183 45.3 +0.1
Curran, Liam K. LAB 13,782 28.1 -6.2
Foulger, Jeffrey W. LD 10,862 22.2 +6.1
Cartwright, James D’A.C UKIP 1,301 2.7 +0.9
Reed, Roderick A. IND 836 1.7
Majority 8,401 17.2
Turnout 48,964 65.5 +2.9
Swing 3.1% from Labour to Conservative
Parliamentary election, 2005 Change
Constituency/Candidate name Party Votes Percentage since 2001
Bethnal Green and Bow Respect gain
Galloway, George R 15,801 35.9
King, Oona T. LAB 14,978 34.0 -16.4
Faruk, Shahagir B. CON 6,244 14.2 -10.1
Dulu, Syed N.I. LD 4,928 11.2 -4.3
Foster, John P.W. GRE 1,950 4.4 +0.1
Etefi a, Ejiro AC 68 0.2
Pugh, Celia IND 38 0.1
Majority 823 1.9
Turnout 44,007 53.6 +3.4
Swing 26.2% from Labour to Respect
Bexleyheath and Crayford Conservative gain
Evennett, David A. CON 19,722 46.3 +6.4
Beard, Christopher N. LAB 15,171 35.6 -7.9
Raval, David LD 5,144 12.1 +1.0
Dunford, John W. UKIP 1,302 3.1 +1.1
Lee, Jay BNP 1,241 2.9 -0.6
Majority 4,551 10.7
Turnout 42,580 65.5 +2.0
Swing 7.2% from Labour to Conservative
Brent East Liberal Democrat gain
Teather, Sarah L. LD 14,764 47.5 +36.9
Qureshi, Yasmin LAB 12,052 38.8 -24.4
Kwarteng, Kwasi A.A. CON 3,193 10.3 -7.9
Ali, Shahrar GRE 905 2.9 -1.8
Weininger, Michelle A. IND 115 0.4
Weiss, George RDT 39 0.1
Majority 2,712 8.7
Turnout 31,068 55.3 +5.4
Swing 30.7% from Labour to Liberal Democrat
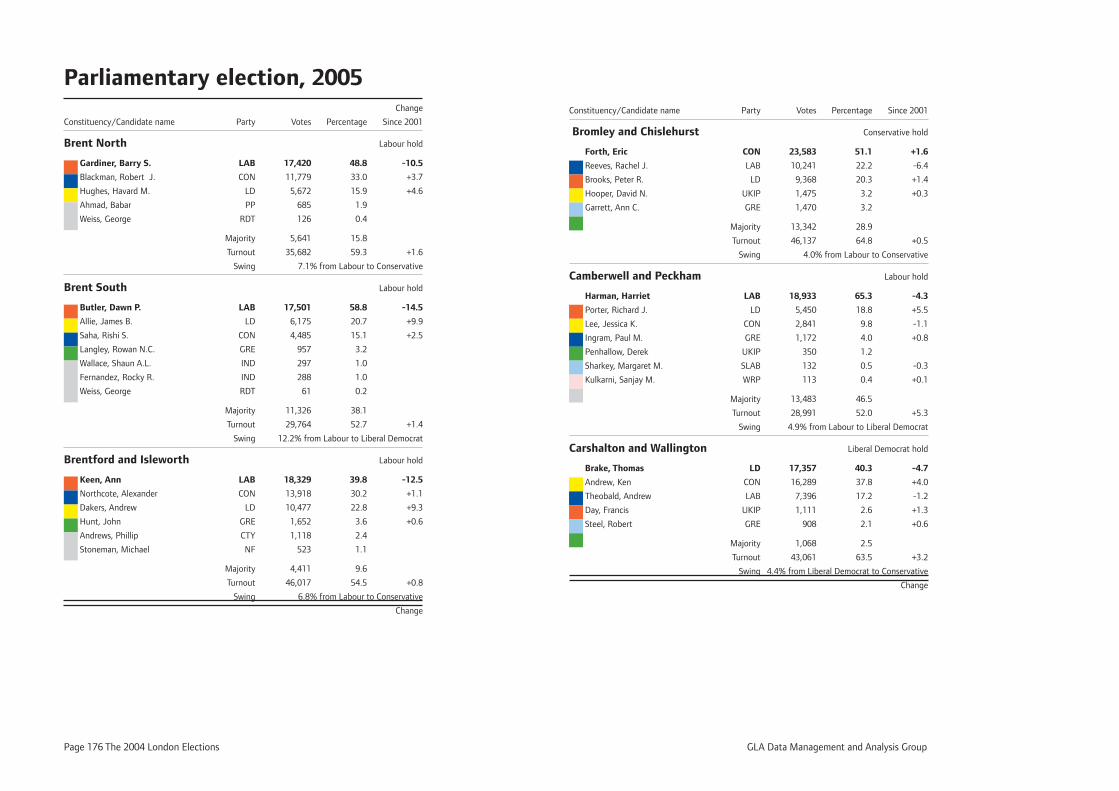
Page 176 The 2004 London Elections GLA Data Management and Analysis Group
Parliamentary election, 2005 Change
Constituency/Candidate name Party Votes Percentage Since 2001
Brent North Labour hold
Gardiner, Barry S. LAB 17,420 48.8 -10.5
Blackman, Robert J. CON 11,779 33.0 +3.7
Hughes, Havard M. LD 5,672 15.9 +4.6
Ahmad, Babar PP 685 1.9
Weiss, George RDT 126 0.4
Majority 5,641 15.8
Turnout 35,682 59.3 +1.6
Swing 7.1% from Labour to Conservative
Brent South Labour hold
Butler, Dawn P. LAB 17,501 58.8 -14.5
Allie, James B. LD 6,175 20.7 +9.9
Saha, Rishi S. CON 4,485 15.1 +2.5
Langley, Rowan N.C. GRE 957 3.2
Wallace, Shaun A.L. IND 297 1.0
Fernandez, Rocky R. IND 288 1.0
Weiss, George RDT 61 0.2
Majority 11,326 38.1
Turnout 29,764 52.7 +1.4
Swing 12.2% from Labour to Liberal Democrat
Brentford and Isleworth Labour hold
Keen, Ann LAB 18,329 39.8 -12.5
Northcote, Alexander CON 13,918 30.2 +1.1
Dakers, Andrew LD 10,477 22.8 +9.3
Hunt, John GRE 1,652 3.6 +0.6
Andrews, Phillip CTY 1,118 2.4
Stoneman, Michael NF 523 1.1
Majority 4,411 9.6
Turnout 46,017 54.5 +0.8
Swing 6.8% from Labour to Conservative
Change
Constituency/Candidate name Party Votes Percentage Since 2001
Bromley and Chislehurst Conservative hold
Forth, Eric CON 23,583 51.1 +1.6
Reeves, Rachel J. LAB 10,241 22.2 -6.4
Brooks, Peter R. LD 9,368 20.3 +1.4
Hooper, David N. UKIP 1,475 3.2 +0.3
Garrett, Ann C. GRE 1,470 3.2
Majority 13,342 28.9
Turnout 46,137 64.8 +0.5
Swing 4.0% from Labour to Conservative
Camberwell and Peckham Labour hold
Harman, Harriet LAB 18,933 65.3 -4.3
Porter, Richard J. LD 5,450 18.8 +5.5
Lee, Jessica K. CON 2,841 9.8 -1.1
Ingram, Paul M. GRE 1,172 4.0 +0.8
Penhallow, Derek UKIP 350 1.2
Sharkey, Margaret M. SLAB 132 0.5 -0.3
Kulkarni, Sanjay M. WRP 113 0.4 +0.1
Majority 13,483 46.5
Turnout 28,991 52.0 +5.3
Swing 4.9% from Labour to Liberal Democrat
Carshalton and Wallington Liberal Democrat hold
Brake, Thomas LD 17,357 40.3 -4.7
Andrew, Ken CON 16,289 37.8 +4.0
Theobald, Andrew LAB 7,396 17.2 -1.2
Day, Francis UKIP 1,111 2.6 +1.3
Steel, Robert GRE 908 2.1 +0.6
Majority 1,068 2.5
Turnout 43,061 63.5 +3.2
Swing 4.4% from Liberal Democrat to Conservative
Change
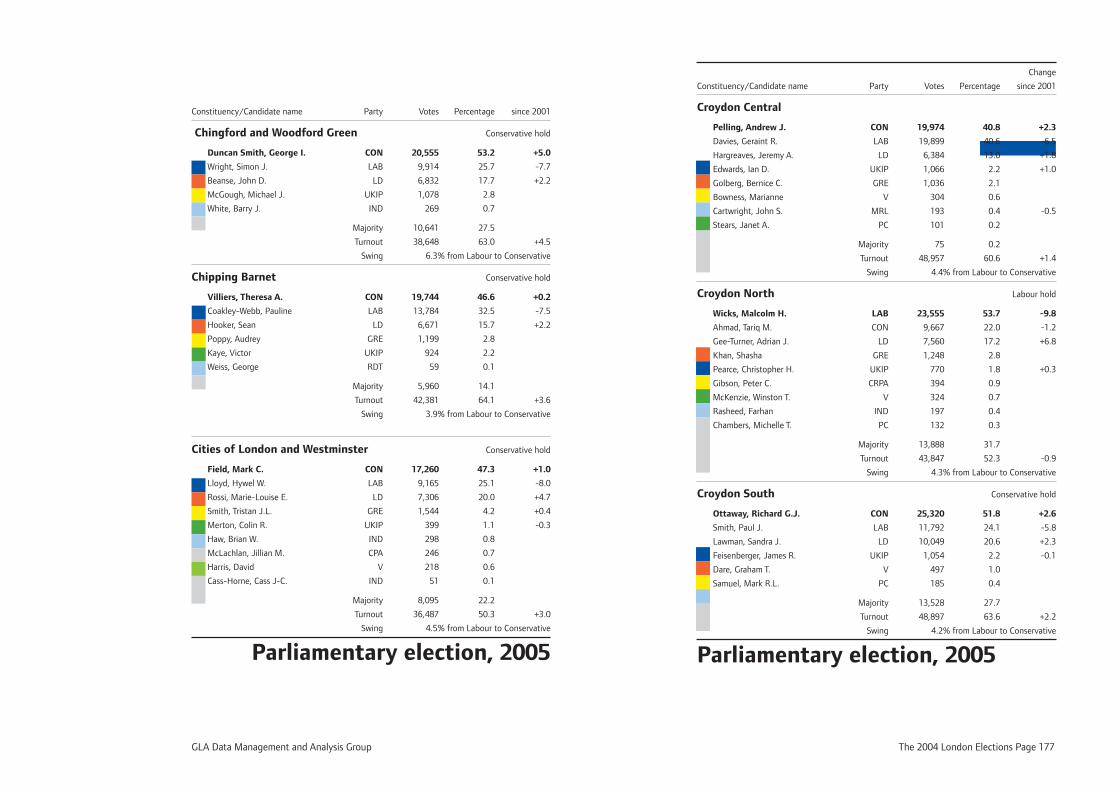
GLA Data Management and Analysis Group The 2004 London Elections Page 177
Constituency/Candidate name Party Votes Percentage since 2001
Chingford and Woodford Green Conservative hold
Duncan Smith, George I. CON 20,555 53.2 +5.0
Wright, Simon J. LAB 9,914 25.7 -7.7
Beanse, John D. LD 6,832 17.7 +2.2
McGough, Michael J. UKIP 1,078 2.8
White, Barry J. IND 269 0.7
Majority 10,641 27.5
Turnout 38,648 63.0 +4.5
Swing 6.3% from Labour to Conservative
Chipping Barnet Conservative hold
Villiers, Theresa A. CON 19,744 46.6 +0.2
Coakley-Webb, Pauline LAB 13,784 32.5 -7.5
Hooker, Sean LD 6,671 15.7 +2.2
Poppy, Audrey GRE 1,199 2.8
Kaye, Victor UKIP 924 2.2
Weiss, George RDT 59 0.1
Majority 5,960 14.1
Turnout 42,381 64.1 +3.6
Swing 3.9% from Labour to Conservative
Cities of London and Westminster Conservative hold
Field, Mark C. CON 17,260 47.3 +1.0
Lloyd, Hywel W. LAB 9,165 25.1 -8.0
Rossi, Marie-Louise E. LD 7,306 20.0 +4.7
Smith, Tristan J.L. GRE 1,544 4.2 +0.4
Merton, Colin R. UKIP 399 1.1 -0.3
Haw, Brian W. IND 298 0.8
McLachlan, Jillian M. CPA 246 0.7
Harris, David V 218 0.6
Cass-Horne, Cass J-C. IND 51 0.1
Majority 8,095 22.2
Turnout 36,487 50.3 +3.0
Swing 4.5% from Labour to Conservative
Parliamentary election, 2005
Change
Constituency/Candidate name Party Votes Percentage since 2001
Croydon Central Conservative gain
Pelling, Andrew J. CON 19,974 40.8 +2.3
Davies, Geraint R. LAB 19,899 40.6 -6.5
Hargreaves, Jeremy A. LD 6,384 13.0 +1.8
Edwards, Ian D. UKIP 1,066 2.2 +1.0
Golberg, Bernice C. GRE 1,036 2.1
Bowness, Marianne V 304 0.6
Cartwright, John S. MRL 193 0.4 -0.5
Stears, Janet A. PC 101 0.2
Majority 75 0.2
Turnout 48,957 60.6 +1.4
Swing 4.4% from Labour to Conservative
Croydon North Labour hold
Wicks, Malcolm H. LAB 23,555 53.7 -9.8
Ahmad, Tariq M. CON 9,667 22.0 -1.2
Gee-Turner, Adrian J. LD 7,560 17.2 +6.8
Khan, Shasha GRE 1,248 2.8
Pearce, Christopher H. UKIP 770 1.8 +0.3
Gibson, Peter C. CRPA 394 0.9
McKenzie, Winston T. V 324 0.7
Rasheed, Farhan IND 197 0.4
Chambers, Michelle T. PC 132 0.3
Majority 13,888 31.7
Turnout 43,847 52.3 -0.9
Swing 4.3% from Labour to Conservative
Croydon South Conservative hold
Ottaway, Richard G.J. CON 25,320 51.8 +2.6
Smith, Paul J. LAB 11,792 24.1 -5.8
Lawman, Sandra J. LD 10,049 20.6 +2.3
Feisenberger, James R. UKIP 1,054 2.2 -0.1
Dare, Graham T. V 497 1.0
Samuel, Mark R.L. PC 185 0.4
Majority 13,528 27.7
Turnout 48,897 63.6 +2.2
Swing 4.2% from Labour to Conservative
Parliamentary election, 2005
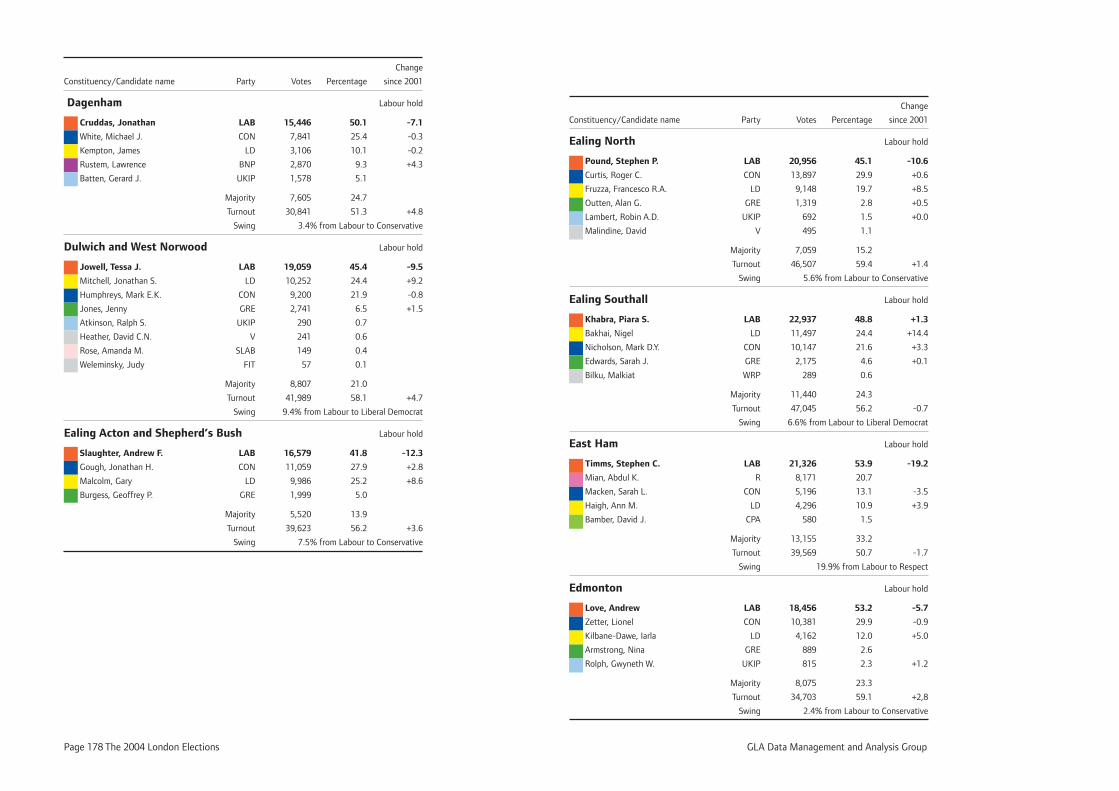
Page 178 The 2004 London Elections GLA Data Management and Analysis Group
Change
Constituency/Candidate name Party Votes Percentage since 2001
Dagenham Labour hold
Cruddas, Jonathan LAB 15,446 50.1 -7.1
White, Michael J. CON 7,841 25.4 -0.3
Kempton, James LD 3,106 10.1 -0.2
Rustem, Lawrence BNP 2,870 9.3 +4.3
Batten, Gerard J. UKIP 1,578 5.1
Majority 7,605 24.7
Turnout 30,841 51.3 +4.8
Swing 3.4% from Labour to Conservative
Dulwich and West Norwood Labour hold
Jowell, Tessa J. LAB 19,059 45.4 -9.5
Mitchell, Jonathan S. LD 10,252 24.4 +9.2
Humphreys, Mark E.K. CON 9,200 21.9 -0.8
Jones, Jenny GRE 2,741 6.5 +1.5
Atkinson, Ralph S. UKIP 290 0.7
Heather, David C.N. V 241 0.6
Rose, Amanda M. SLAB 149 0.4
Weleminsky, Judy FIT 57 0.1
Majority 8,807 21.0
Turnout 41,989 58.1 +4.7
Swing 9.4% from Labour to Liberal Democrat
Ealing Acton and Shepherd’s Bush Labour hold
Slaughter, Andrew F. LAB 16,579 41.8 -12.3
Gough, Jonathan H. CON 11,059 27.9 +2.8
Malcolm, Gary LD 9,986 25.2 +8.6
Burgess, Geoffrey P. GRE 1,999 5.0
Majority 5,520 13.9
Turnout 39,623 56.2 +3.6
Swing 7.5% from Labour to Conservative
Change
Constituency/Candidate name Party Votes Percentage since 2001
Ealing North Labour hold
Pound, Stephen P. LAB 20,956 45.1 -10.6
Curtis, Roger C. CON 13,897 29.9 +0.6
Fruzza, Francesco R.A. LD 9,148 19.7 +8.5
Outten, Alan G. GRE 1,319 2.8 +0.5
Lambert, Robin A.D. UKIP 692 1.5 +0.0
Malindine, David V 495 1.1
Majority 7,059 15.2
Turnout 46,507 59.4 +1.4
Swing 5.6% from Labour to Conservative
Ealing Southall Labour hold
Khabra, Piara S. LAB 22,937 48.8 +1.3
Bakhai, Nigel LD 11,497 24.4 +14.4
Nicholson, Mark D.Y. CON 10,147 21.6 +3.3
Edwards, Sarah J. GRE 2,175 4.6 +0.1
Bilku, Malkiat WRP 289 0.6
Majority 11,440 24.3
Turnout 47,045 56.2 -0.7
Swing 6.6% from Labour to Liberal Democrat
East Ham Labour hold
Timms, Stephen C. LAB 21,326 53.9 -19.2
Mian, Abdul K. R 8,171 20.7
Macken, Sarah L. CON 5,196 13.1 -3.5
Haigh, Ann M. LD 4,296 10.9 +3.9
Bamber, David J. CPA 580 1.5
Majority 13,155 33.2
Turnout 39,569 50.7 -1.7
Swing 19.9% from Labour to Respect
Edmonton Labour hold
Love, Andrew LAB 18,456 53.2 -5.7
Zetter, Lionel CON 10,381 29.9 -0.9
Kilbane-Dawe, Iarla LD 4,162 12.0 +5.0
Armstrong, Nina GRE 889 2.6
Rolph, Gwyneth W. UKIP 815 2.3 +1.2
Majority 8,075 23.3
Turnout 34,703 59.1 +2,8
Swing 2.4% from Labour to Conservative
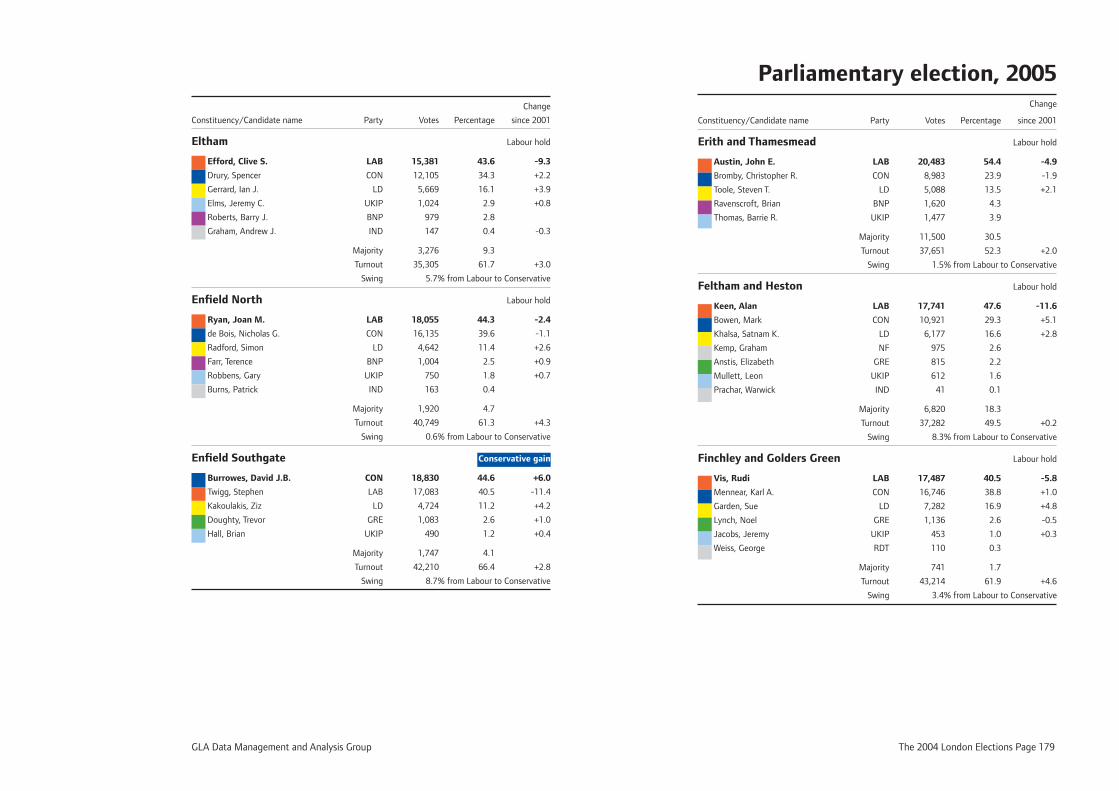
GLA Data Management and Analysis Group The 2004 London Elections Page 179
Change
Constituency/Candidate name Party Votes Percentage since 2001
Eltham Labour hold
Efford, Clive S. LAB 15,381 43.6 -9.3
Drury, Spencer CON 12,105 34.3 +2.2
Gerrard, Ian J. LD 5,669 16.1 +3.9
Elms, Jeremy C. UKIP 1,024 2.9 +0.8
Roberts, Barry J. BNP 979 2.8
Graham, Andrew J. IND 147 0.4 -0.3
Majority 3,276 9.3
Turnout 35,305 61.7 +3.0
Swing 5.7% from Labour to Conservative
Enfi eld North Labour hold
Ryan, Joan M. LAB 18,055 44.3 -2.4
de Bois, Nicholas G. CON 16,135 39.6 -1.1
Radford, Simon LD 4,642 11.4 +2.6
Farr, Terence BNP 1,004 2.5 +0.9
Robbens, Gary UKIP 750 1.8 +0.7
Burns, Patrick IND 163 0.4
Majority 1,920 4.7
Turnout 40,749 61.3 +4.3
Swing 0.6% from Labour to Conservative
Enfi eld Southgate Conservative gain
Burrowes, David J.B. CON 18,830 44.6 +6.0
Twigg, Stephen LAB 17,083 40.5 -11.4
Kakoulakis, Ziz LD 4,724 11.2 +4.2
Doughty, Trevor GRE 1,083 2.6 +1.0
Hall, Brian UKIP 490 1.2 +0.4
Majority 1,747 4.1
Turnout 42,210 66.4 +2.8
Swing 8.7% from Labour to Conservative
Parliamentary election, 2005 Change
Constituency/Candidate name Party Votes Percentage since 2001
Erith and Thamesmead Labour hold
Austin, John E. LAB 20,483 54.4 -4.9
Bromby, Christopher R. CON 8,983 23.9 -1.9
Toole, Steven T. LD 5,088 13.5 +2.1
Ravenscroft, Brian BNP 1,620 4.3
Thomas, Barrie R. UKIP 1,477 3.9
Majority 11,500 30.5
Turnout 37,651 52.3 +2.0
Swing 1.5% from Labour to Conservative
Feltham and Heston Labour hold
Keen, Alan LAB 17,741 47.6 -11.6
Bowen, Mark CON 10,921 29.3 +5.1
Khalsa, Satnam K. LD 6,177 16.6 +2.8
Kemp, Graham NF 975 2.6
Anstis, Elizabeth GRE 815 2.2
Mullett, Leon UKIP 612 1.6
Prachar, Warwick IND 41 0.1
Majority 6,820 18.3
Turnout 37,282 49.5 +0.2
Swing 8.3% from Labour to Conservative
Finchley and Golders Green Labour hold
Vis, Rudi LAB 17,487 40.5 -5.8
Mennear, Karl A. CON 16,746 38.8 +1.0
Garden, Sue LD 7,282 16.9 +4.8
Lynch, Noel GRE 1,136 2.6 -0.5
Jacobs, Jeremy UKIP 453 1.0 +0.3
Weiss, George RDT 110 0.3
Majority 741 1.7
Turnout 43,214 61.9 +4.6
Swing 3.4% from Labour to Conservative
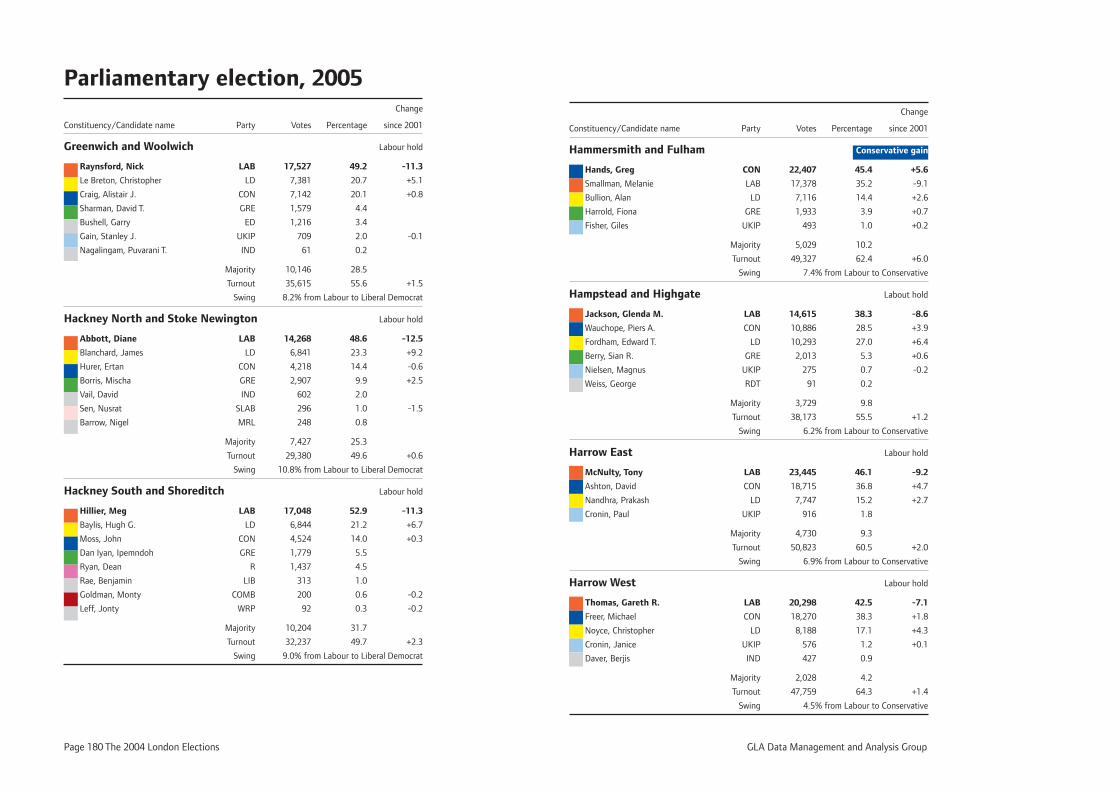
Page 180 The 2004 London Elections GLA Data Management and Analysis Group
Parliamentary election, 2005 Change
Constituency/Candidate name Party Votes Percentage since 2001
Greenwich and Woolwich Labour hold
Raynsford, Nick LAB 17,527 49.2 -11.3
Le Breton, Christopher LD 7,381 20.7 +5.1
Craig, Alistair J. CON 7,142 20.1 +0.8
Sharman, David T. GRE 1,579 4.4
Bushell, Garry ED 1,216 3.4
Gain, Stanley J. UKIP 709 2.0 -0.1
Nagalingam, Puvarani T. IND 61 0.2
Majority 10,146 28.5
Turnout 35,615 55.6 +1.5
Swing 8.2% from Labour to Liberal Democrat
Hackney North and Stoke Newington Labour hold
Abbott, Diane LAB 14,268 48.6 -12.5
Blanchard, James LD 6,841 23.3 +9.2
Hurer, Ertan CON 4,218 14.4 -0.6
Borris, Mischa GRE 2,907 9.9 +2.5
Vail, David IND 602 2.0
Sen, Nusrat SLAB 296 1.0 -1.5
Barrow, Nigel MRL 248 0.8
Majority 7,427 25.3
Turnout 29,380 49.6 +0.6
Swing 10.8% from Labour to Liberal Democrat
Hackney South and Shoreditch Labour hold
Hillier, Meg LAB 17,048 52.9 -11.3
Baylis, Hugh G. LD 6,844 21.2 +6.7
Moss, John CON 4,524 14.0 +0.3
Dan Iyan, Ipemndoh GRE 1,779 5.5
Ryan, Dean R 1,437 4.5
Rae, Benjamin LIB 313 1.0
Goldman, Monty COMB 200 0.6 -0.2
Leff, Jonty WRP 92 0.3 -0.2
Majority 10,204 31.7
Turnout 32,237 49.7 +2.3
Swing 9.0% from Labour to Liberal Democrat
Change
Constituency/Candidate name Party Votes Percentage since 2001
Hammersmith and Fulham Conservative gain
Hands, Greg CON 22,407 45.4 +5.6
Smallman, Melanie LAB 17,378 35.2 -9.1
Bullion, Alan LD 7,116 14.4 +2.6
Harrold, Fiona GRE 1,933 3.9 +0.7
Fisher, Giles UKIP 493 1.0 +0.2
Majority 5,029 10.2
Turnout 49,327 62.4 +6.0
Swing 7.4% from Labour to Conservative
Hampstead and Highgate Labout hold
Jackson, Glenda M. LAB 14,615 38.3 -8.6
Wauchope, Piers A. CON 10,886 28.5 +3.9
Fordham, Edward T. LD 10,293 27.0 +6.4
Berry, Sian R. GRE 2,013 5.3 +0.6
Nielsen, Magnus UKIP 275 0.7 -0.2
Weiss, George RDT 91 0.2
Majority 3,729 9.8
Turnout 38,173 55.5 +1.2
Swing 6.2% from Labour to Conservative
Harrow East Labour hold
McNulty, Tony LAB 23,445 46.1 -9.2
Ashton, David CON 18,715 36.8 +4.7
Nandhra, Prakash LD 7,747 15.2 +2.7
Cronin, Paul UKIP 916 1.8
Majority 4,730 9.3
Turnout 50,823 60.5 +2.0
Swing 6.9% from Labour to Conservative
Harrow West Labour hold
Thomas, Gareth R. LAB 20,298 42.5 -7.1
Freer, Michael CON 18,270 38.3 +1.8
Noyce, Christopher LD 8,188 17.1 +4.3
Cronin, Janice UKIP 576 1.2 +0.1
Daver, Berjis IND 427 0.9
Majority 2,028 4.2
Turnout 47,759 64.3 +1.4
Swing 4.5% from Labour to Conservative
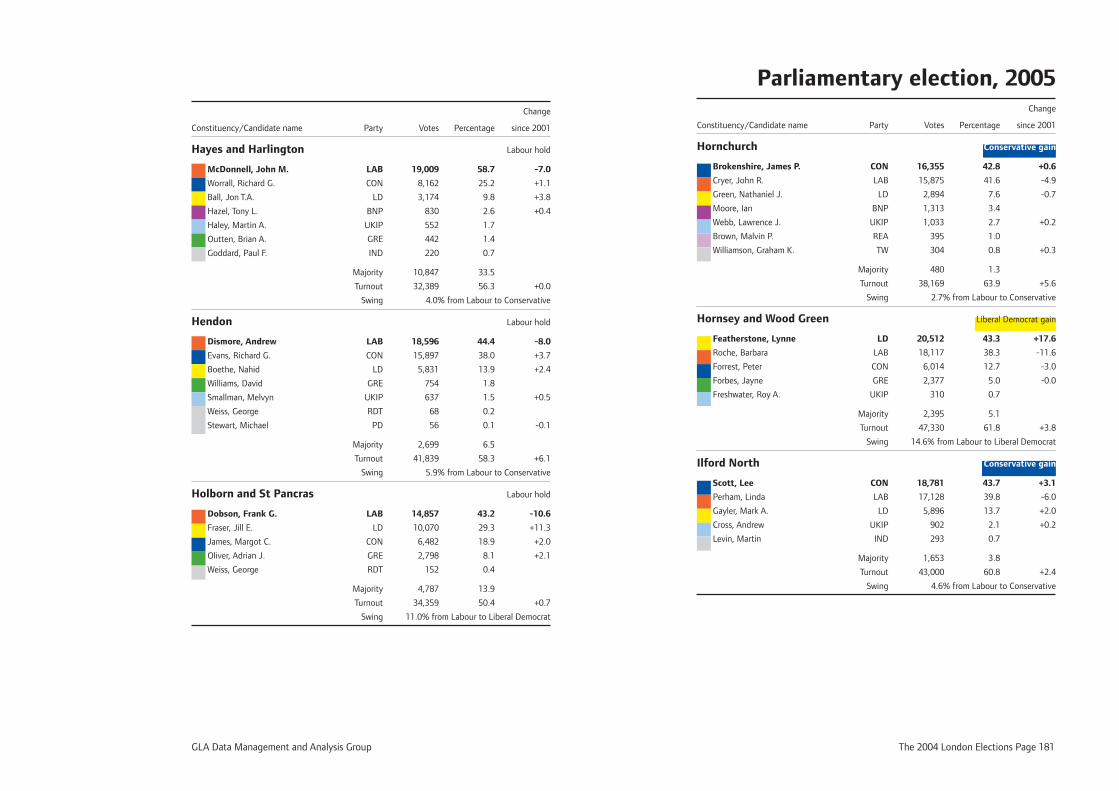
GLA Data Management and Analysis Group The 2004 London Elections Page 181
Change
Constituency/Candidate name Party Votes Percentage since 2001
Hayes and Harlington Labour hold
McDonnell, John M. LAB 19,009 58.7 -7.0
Worrall, Richard G. CON 8,162 25.2 +1.1
Ball, Jon T.A. LD 3,174 9.8 +3.8
Hazel, Tony L. BNP 830 2.6 +0.4
Haley, Martin A. UKIP 552 1.7
Outten, Brian A. GRE 442 1.4
Goddard, Paul F. IND 220 0.7
Majority 10,847 33.5
Turnout 32,389 56.3 +0.0
Swing 4.0% from Labour to Conservative
Hendon Labour hold
Dismore, Andrew LAB 18,596 44.4 -8.0
Evans, Richard G. CON 15,897 38.0 +3.7
Boethe, Nahid LD 5,831 13.9 +2.4
Williams, David GRE 754 1.8
Smallman, Melvyn UKIP 637 1.5 +0.5
Weiss, George RDT 68 0.2
Stewart, Michael PD 56 0.1 -0.1
Majority 2,699 6.5
Turnout 41,839 58.3 +6.1
Swing 5.9% from Labour to Conservative
Holborn and St Pancras Labour hold
Dobson, Frank G. LAB 14,857 43.2 -10.6
Fraser, Jill E. LD 10,070 29.3 +11.3
James, Margot C. CON 6,482 18.9 +2.0
Oliver, Adrian J. GRE 2,798 8.1 +2.1
Weiss, George RDT 152 0.4
Majority 4,787 13.9
Turnout 34,359 50.4 +0.7
Swing 11.0% from Labour to Liberal Democrat
Parliamentary election, 2005 Change
Constituency/Candidate name Party Votes Percentage since 2001
Hornchurch Conservative gain
Brokenshire, James P. CON 16,355 42.8 +0.6
Cryer, John R. LAB 15,875 41.6 -4.9
Green, Nathaniel J. LD 2,894 7.6 -0.7
Moore, Ian BNP 1,313 3.4
Webb, Lawrence J. UKIP 1,033 2.7 +0.2
Brown, Malvin P. REA 395 1.0
Williamson, Graham K. TW 304 0.8 +0.3
Majority 480 1.3
Turnout 38,169 63.9 +5.6
Swing 2.7% from Labour to Conservative
Hornsey and Wood Green Liberal Democrat gain
Featherstone, Lynne LD 20,512 43.3 +17.6
Roche, Barbara LAB 18,117 38.3 -11.6
Forrest, Peter CON 6,014 12.7 -3.0
Forbes, Jayne GRE 2,377 5.0 -0.0
Freshwater, Roy A. UKIP 310 0.7
Majority 2,395 5.1
Turnout 47,330 61.8 +3.8
Swing 14.6% from Labour to Liberal Democrat
Ilford North Conservative gain
Scott, Lee CON 18,781 43.7 +3.1
Perham, Linda LAB 17,128 39.8 -6.0
Gayler, Mark A. LD 5,896 13.7 +2.0
Cross, Andrew UKIP 902 2.1 +0.2
Levin, Martin IND 293 0.7
Majority 1,653 3.8
Turnout 43,000 60.8 +2.4
Swing 4.6% from Labour to Conservative
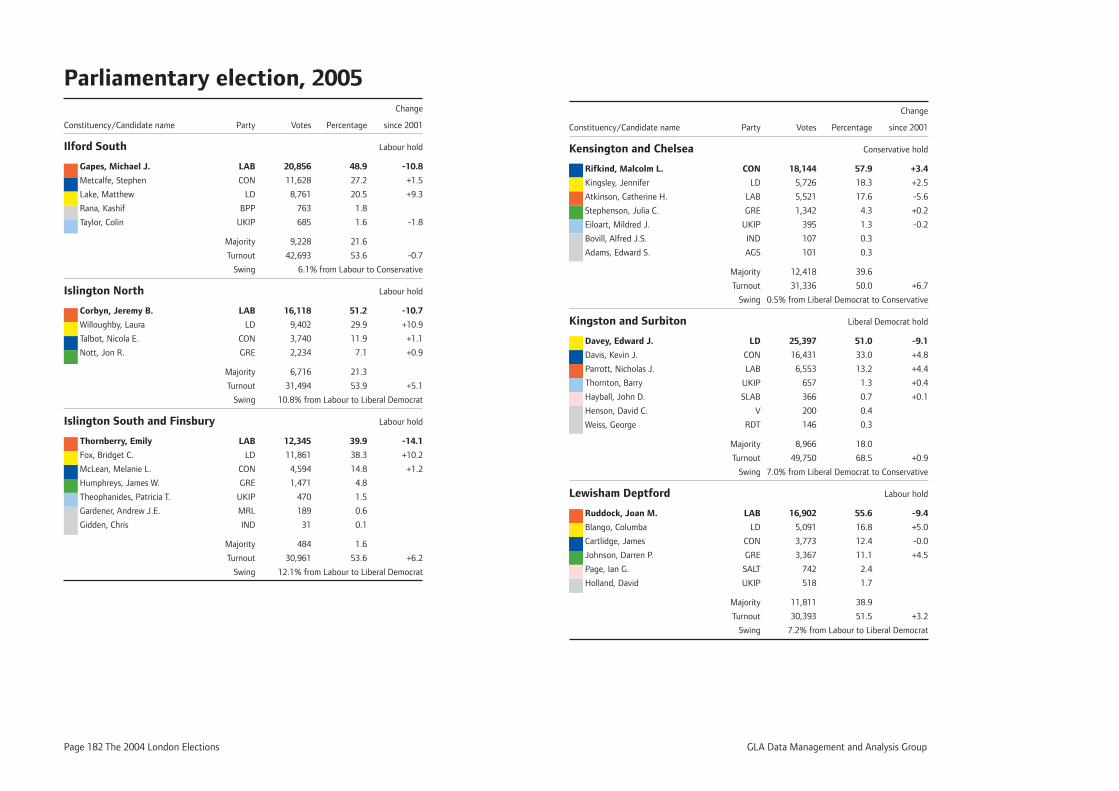
Page 182 The 2004 London Elections GLA Data Management and Analysis Group
Parliamentary election, 2005 Change
Constituency/Candidate name Party Votes Percentage since 2001
Ilford South Labour hold
Gapes, Michael J. LAB 20,856 48.9 -10.8
Metcalfe, Stephen CON 11,628 27.2 +1.5
Lake, Matthew LD 8,761 20.5 +9.3
Rana, Kashif BPP 763 1.8
Taylor, Colin UKIP 685 1.6 -1.8
Majority 9,228 21.6
Turnout 42,693 53.6 -0.7
Swing 6.1% from Labour to Conservative
Islington North Labour hold
Corbyn, Jeremy B. LAB 16,118 51.2 -10.7
Willoughby, Laura LD 9,402 29.9 +10.9
Talbot, Nicola E. CON 3,740 11.9 +1.1
Nott, Jon R. GRE 2,234 7.1 +0.9
Majority 6,716 21.3
Turnout 31,494 53.9 +5.1
Swing 10.8% from Labour to Liberal Democrat
Islington South and Finsbury Labour hold
Thornberry, Emily LAB 12,345 39.9 -14.1
Fox, Bridget C. LD 11,861 38.3 +10.2
McLean, Melanie L. CON 4,594 14.8 +1.2
Humphreys, James W. GRE 1,471 4.8
Theophanides, Patricia T. UKIP 470 1.5
Gardener, Andrew J.E. MRL 189 0.6
Gidden, Chris IND 31 0.1
Majority 484 1.6
Turnout 30,961 53.6 +6.2
Swing 12.1% from Labour to Liberal Democrat
Change
Constituency/Candidate name Party Votes Percentage since 2001
Kensington and Chelsea Conservative hold
Rifkind, Malcolm L. CON 18,144 57.9 +3.4
Kingsley, Jennifer LD 5,726 18.3 +2.5
Atkinson, Catherine H. LAB 5,521 17.6 -5.6
Stephenson, Julia C. GRE 1,342 4.3 +0.2
Eiloart, Mildred J. UKIP 395 1.3 -0.2
Bovill, Alfred J.S. IND 107 0.3
Adams, Edward S. AGS 101 0.3
Majority 12,418 39.6
Turnout 31,336 50.0 +6.7
Swing 0.5% from Liberal Democrat to Conservative
Kingston and Surbiton Liberal Democrat hold
Davey, Edward J. LD 25,397 51.0 -9.1
Davis, Kevin J. CON 16,431 33.0 +4.8
Parrott, Nicholas J. LAB 6,553 13.2 +4.4
Thornton, Barry UKIP 657 1.3 +0.4
Hayball, John D. SLAB 366 0.7 +0.1
Henson, David C. V 200 0.4
Weiss, George RDT 146 0.3
Majority 8,966 18.0
Turnout 49,750 68.5 +0.9
Swing 7.0% from Liberal Democrat to Conservative
Lewisham Deptford Labour hold
Ruddock, Joan M. LAB 16,902 55.6 -9.4
Blango, Columba LD 5,091 16.8 +5.0
Cartlidge, James CON 3,773 12.4 -0.0
Johnson, Darren P. GRE 3,367 11.1 +4.5
Page, Ian G. SALT 742 2.4
Holland, David UKIP 518 1.7
Majority 11,811 38.9
Turnout 30,393 51.5 +3.2
Swing 7.2% from Labour to Liberal Democrat
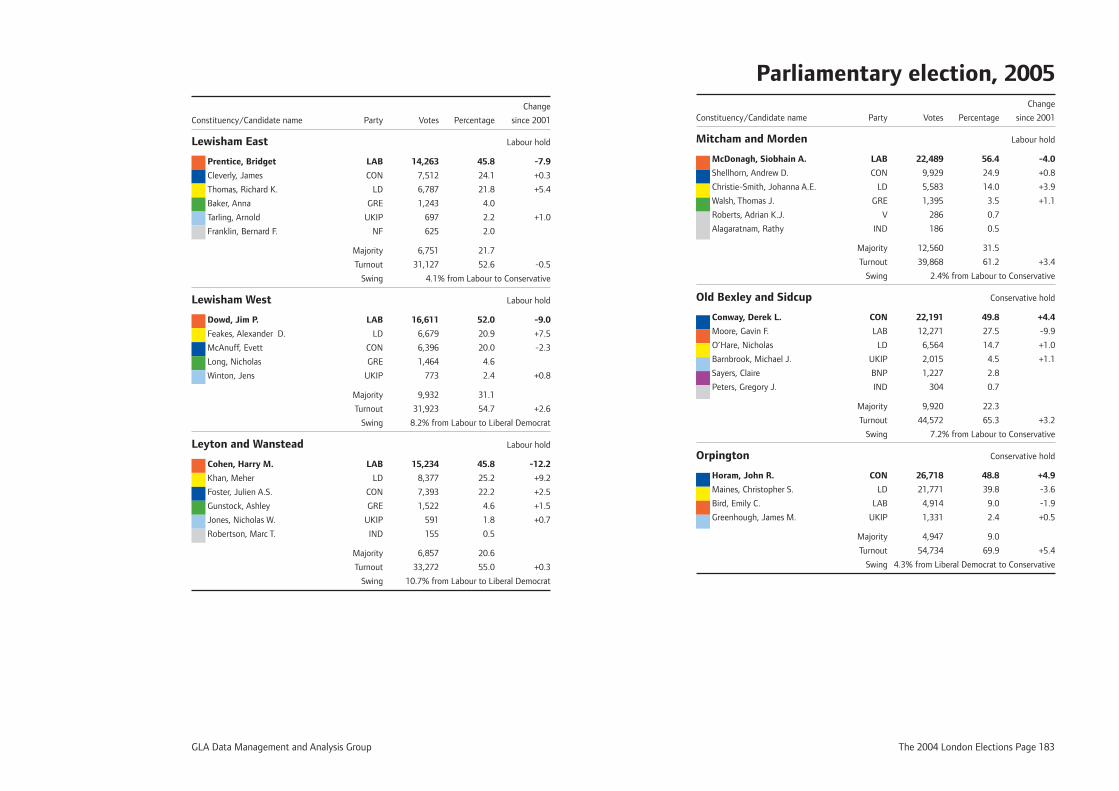
GLA Data Management and Analysis Group The 2004 London Elections Page 183
Change
Constituency/Candidate name Party Votes Percentage since 2001
Lewisham East Labour hold
Prentice, Bridget LAB 14,263 45.8 -7.9
Cleverly, James CON 7,512 24.1 +0.3
Thomas, Richard K. LD 6,787 21.8 +5.4
Baker, Anna GRE 1,243 4.0
Tarling, Arnold UKIP 697 2.2 +1.0
Franklin, Bernard F. NF 625 2.0
Majority 6,751 21.7
Turnout 31,127 52.6 -0.5
Swing 4.1% from Labour to Conservative
Lewisham West Labour hold
Dowd, Jim P. LAB 16,611 52.0 -9.0
Feakes, Alexander D. LD 6,679 20.9 +7.5
McAnuff, Evett CON 6,396 20.0 -2.3
Long, Nicholas GRE 1,464 4.6
Winton, Jens UKIP 773 2.4 +0.8
Majority 9,932 31.1
Turnout 31,923 54.7 +2.6
Swing 8.2% from Labour to Liberal Democrat
Leyton and Wanstead Labour hold
Cohen, Harry M. LAB 15,234 45.8 -12.2
Khan, Meher LD 8,377 25.2 +9.2
Foster, Julien A.S. CON 7,393 22.2 +2.5
Gunstock, Ashley GRE 1,522 4.6 +1.5
Jones, Nicholas W. UKIP 591 1.8 +0.7
Robertson, Marc T. IND 155 0.5
Majority 6,857 20.6
Turnout 33,272 55.0 +0.3
Swing 10.7% from Labour to Liberal Democrat
Parliamentary election, 2005 Change
Constituency/Candidate name Party Votes Percentage since 2001
Mitcham and Morden Labour hold
McDonagh, Siobhain A. LAB 22,489 56.4 -4.0
Shellhorn, Andrew D. CON 9,929 24.9 +0.8
Christie-Smith, Johanna A.E. LD 5,583 14.0 +3.9
Walsh, Thomas J. GRE 1,395 3.5 +1.1
Roberts, Adrian K.J. V 286 0.7
Alagaratnam, Rathy IND 186 0.5
Majority 12,560 31.5
Turnout 39,868 61.2 +3.4
Swing 2.4% from Labour to Conservative
Old Bexley and Sidcup Conservative hold
Conway, Derek L. CON 22,191 49.8 +4.4
Moore, Gavin F. LAB 12,271 27.5 -9.9
O’Hare, Nicholas LD 6,564 14.7 +1.0
Barnbrook, Michael J. UKIP 2,015 4.5 +1.1
Sayers, Claire BNP 1,227 2.8
Peters, Gregory J. IND 304 0.7
Majority 9,920 22.3
Turnout 44,572 65.3 +3.2
Swing 7.2% from Labour to Conservative
Orpington Conservative hold
Horam, John R. CON 26,718 48.8 +4.9
Maines, Christopher S. LD 21,771 39.8 -3.6
Bird, Emily C. LAB 4,914 9.0 -1.9
Greenhough, James M. UKIP 1,331 2.4 +0.5
Majority 4,947 9.0
Turnout 54,734 69.9 +5.4
Swing 4.3% from Liberal Democrat to Conservative
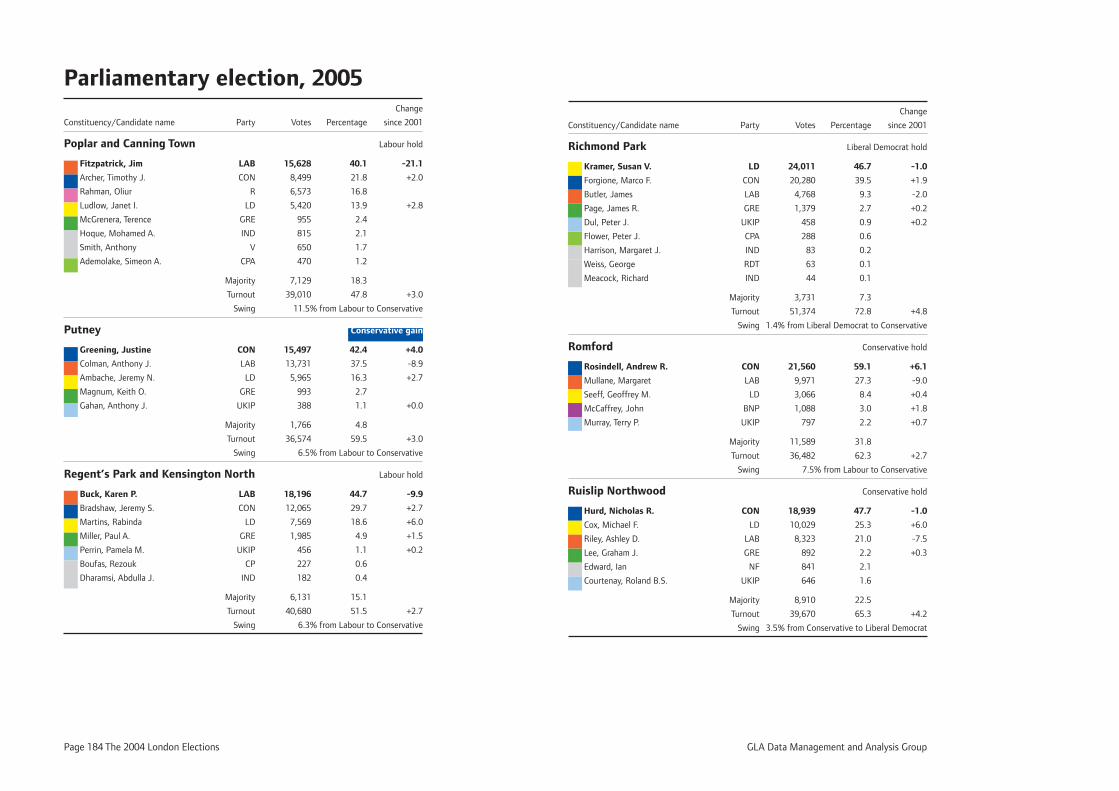
Page 184 The 2004 London Elections GLA Data Management and Analysis Group
Parliamentary election, 2005 Change
Constituency/Candidate name Party Votes Percentage since 2001
Poplar and Canning Town Labour hold
Fitzpatrick, Jim LAB 15,628 40.1 -21.1
Archer, Timothy J. CON 8,499 21.8 +2.0
Rahman, Oliur R 6,573 16.8
Ludlow, Janet I. LD 5,420 13.9 +2.8
McGrenera, Terence GRE 955 2.4
Hoque, Mohamed A. IND 815 2.1
Smith, Anthony V 650 1.7
Ademolake, Simeon A. CPA 470 1.2
Majority 7,129 18.3
Turnout 39,010 47.8 +3.0
Swing 11.5% from Labour to Conservative
Putney Conservative gain
Greening, Justine CON 15,497 42.4 +4.0
Colman, Anthony J. LAB 13,731 37.5 -8.9
Ambache, Jeremy N. LD 5,965 16.3 +2.7
Magnum, Keith O. GRE 993 2.7
Gahan, Anthony J. UKIP 388 1.1 +0.0
Majority 1,766 4.8
Turnout 36,574 59.5 +3.0
Swing 6.5% from Labour to Conservative
Regent’s Park and Kensington North Labour hold
Buck, Karen P. LAB 18,196 44.7 -9.9
Bradshaw, Jeremy S. CON 12,065 29.7 +2.7
Martins, Rabinda LD 7,569 18.6 +6.0
Miller, Paul A. GRE 1,985 4.9 +1.5
Perrin, Pamela M. UKIP 456 1.1 +0.2
Boufas, Rezouk CP 227 0.6
Dharamsi, Abdulla J. IND 182 0.4
Majority 6,131 15.1
Turnout 40,680 51.5 +2.7
Swing 6.3% from Labour to Conservative
Change
Constituency/Candidate name Party Votes Percentage since 2001
Richmond Park Liberal Democrat hold
Kramer, Susan V. LD 24,011 46.7 -1.0
Forgione, Marco F. CON 20,280 39.5 +1.9
Butler, James LAB 4,768 9.3 -2.0
Page, James R. GRE 1,379 2.7 +0.2
Dul, Peter J. UKIP 458 0.9 +0.2
Flower, Peter J. CPA 288 0.6
Harrison, Margaret J. IND 83 0.2
Weiss, George RDT 63 0.1
Meacock, Richard IND 44 0.1
Majority 3,731 7.3
Turnout 51,374 72.8 +4.8
Swing 1.4% from Liberal Democrat to Conservative
Romford Conservative hold
Rosindell, Andrew R. CON 21,560 59.1 +6.1
Mullane, Margaret LAB 9,971 27.3 -9.0
Seeff, Geoffrey M. LD 3,066 8.4 +0.4
McCaffrey, John BNP 1,088 3.0 +1.8
Murray, Terry P. UKIP 797 2.2 +0.7
Majority 11,589 31.8
Turnout 36,482 62.3 +2.7
Swing 7.5% from Labour to Conservative
Ruislip Northwood Conservative hold
Hurd, Nicholas R. CON 18,939 47.7 -1.0
Cox, Michael F. LD 10,029 25.3 +6.0
Riley, Ashley D. LAB 8,323 21.0 -7.5
Lee, Graham J. GRE 892 2.2 +0.3
Edward, Ian NF 841 2.1
Courtenay, Roland B.S. UKIP 646 1.6
Majority 8,910 22.5
Turnout 39,670 65.3 +4.2
Swing 3.5% from Conservative to Liberal Democrat
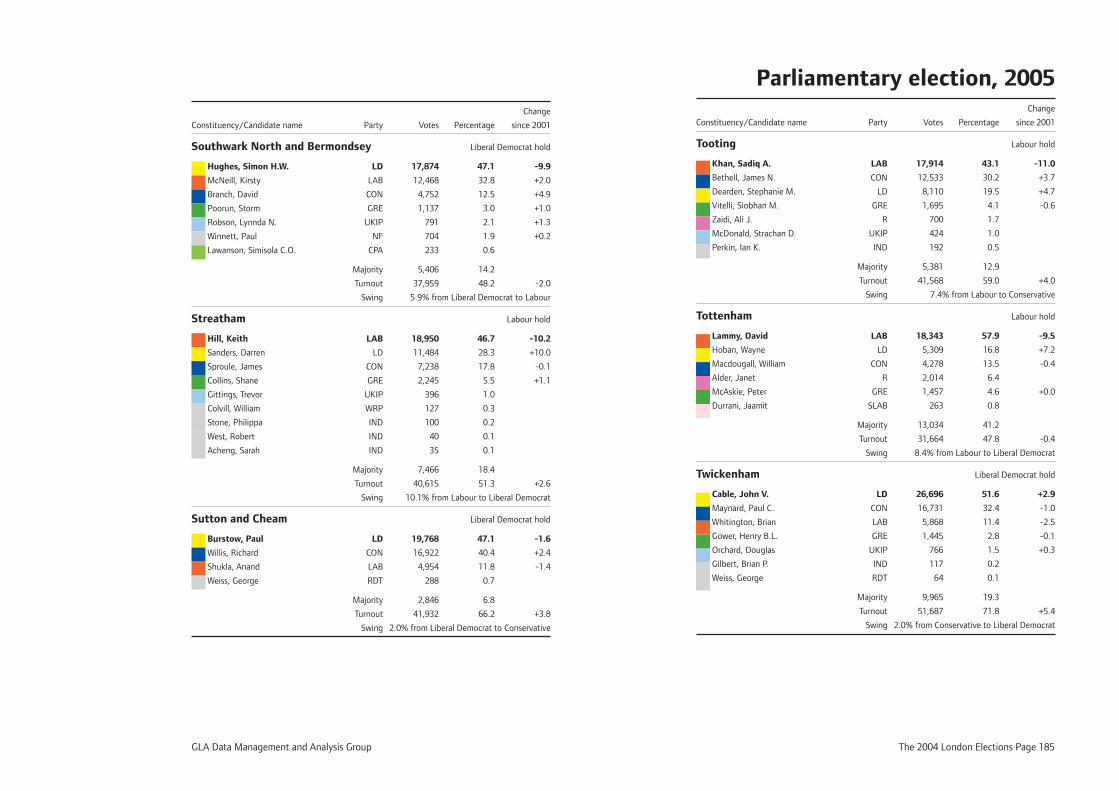
GLA Data Management and Analysis Group The 2004 London Elections Page 185
Change
Constituency/Candidate name Party Votes Percentage since 2001
Southwark North and Bermondsey Liberal Democrat hold
Hughes, Simon H.W. LD 17,874 47.1 -9.9
McNeill, Kirsty LAB 12,468 32.8 +2.0
Branch, David CON 4,752 12.5 +4.9
Poorun, Storm GRE 1,137 3.0 +1.0
Robson, Lynnda N. UKIP 791 2.1 +1.3
Winnett, Paul NF 704 1.9 +0.2
Lawanson, Simisola C.O. CPA 233 0.6
Majority 5,406 14.2
Turnout 37,959 48.2 -2.0
Swing 5.9% from Liberal Democrat to Labour
Streatham Labour hold
Hill, Keith LAB 18,950 46.7 -10.2
Sanders, Darren LD 11,484 28.3 +10.0
Sproule, James CON 7,238 17.8 -0.1
Collins, Shane GRE 2,245 5.5 +1.1
Gittings, Trevor UKIP 396 1.0
Colvill, William WRP 127 0.3
Stone, Philippa IND 100 0.2
West, Robert IND 40 0.1
Acheng, Sarah IND 35 0.1
Majority 7,466 18.4
Turnout 40,615 51.3 +2.6
Swing 10.1% from Labour to Liberal Democrat
Sutton and Cheam Liberal Democrat hold
Burstow, Paul LD 19,768 47.1 -1.6
Willis, Richard CON 16,922 40.4 +2.4
Shukla, Anand LAB 4,954 11.8 -1.4
Weiss, George RDT 288 0.7
Majority 2,846 6.8
Turnout 41,932 66.2 +3.8
Swing 2.0% from Liberal Democrat to Conservative
Parliamentary election, 2005 Change
Constituency/Candidate name Party Votes Percentage since 2001
Tooting Labour hold
Khan, Sadiq A. LAB 17,914 43.1 -11.0
Bethell, James N. CON 12,533 30.2 +3.7
Dearden, Stephanie M. LD 8,110 19.5 +4.7
Vitelli, Siobhan M. GRE 1,695 4.1 -0.6
Zaidi, Ali J. R 700 1.7
McDonald, Strachan D. UKIP 424 1.0
Perkin, Ian K. IND 192 0.5
Majority 5,381 12.9
Turnout 41,568 59.0 +4.0
Swing 7.4% from Labour to Conservative
Tottenham Labour hold
Lammy, David LAB 18,343 57.9 -9.5
Hoban, Wayne LD 5,309 16.8 +7.2
Macdougall, William CON 4,278 13.5 -0.4
Alder, Janet R 2,014 6.4
McAskie, Peter GRE 1,457 4.6 +0.0
Durrani, Jaamit SLAB 263 0.8
Majority 13,034 41.2
Turnout 31,664 47.8 -0.4
Swing 8.4% from Labour to Liberal Democrat
Twickenham Liberal Democrat hold
Cable, John V. LD 26,696 51.6 +2.9
Maynard, Paul C. CON 16,731 32.4 -1.0
Whitington, Brian LAB 5,868 11.4 -2.5
Gower, Henry B.L. GRE 1,445 2.8 -0.1
Orchard, Douglas UKIP 766 1.5 +0.3
Gilbert, Brian P. IND 117 0.2
Weiss, George RDT 64 0.1
Majority 9,965 19.3
Turnout 51,687 71.8 +5.4
Swing 2.0% from Conservative to Liberal Democrat
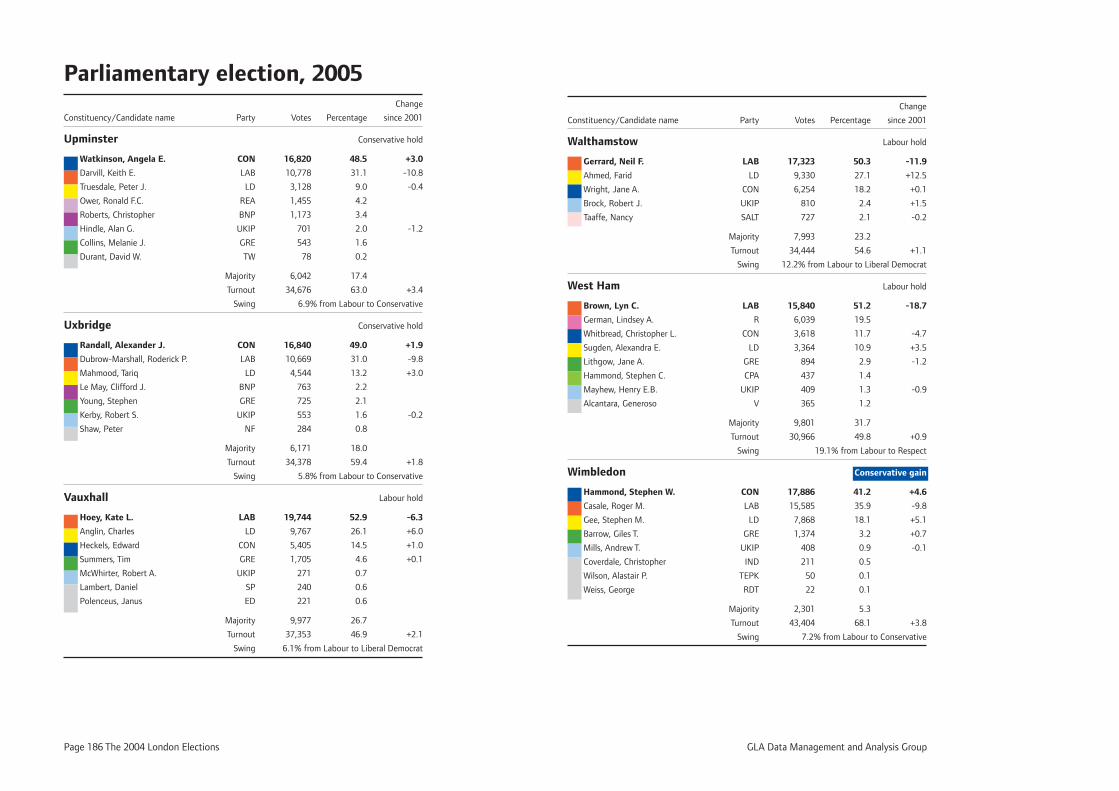
Page 186 The 2004 London Elections GLA Data Management and Analysis Group
Parliamentary election, 2005 Change
Constituency/Candidate name Party Votes Percentage since 2001
Upminster Conservative hold
Watkinson, Angela E. CON 16,820 48.5 +3.0
Darvill, Keith E. LAB 10,778 31.1 -10.8
Truesdale, Peter J. LD 3,128 9.0 -0.4
Ower, Ronald F.C. REA 1,455 4.2
Roberts, Christopher BNP 1,173 3.4
Hindle, Alan G. UKIP 701 2.0 -1.2
Collins, Melanie J. GRE 543 1.6
Durant, David W. TW 78 0.2
Majority 6,042 17.4
Turnout 34,676 63.0 +3.4
Swing 6.9% from Labour to Conservative
Uxbridge Conservative hold
Randall, Alexander J. CON 16,840 49.0 +1.9
Dubrow-Marshall, Roderick P. LAB 10,669 31.0 -9.8
Mahmood, Tariq LD 4,544 13.2 +3.0
Le May, Clifford J. BNP 763 2.2
Young, Stephen GRE 725 2.1
Kerby, Robert S. UKIP 553 1.6 -0.2
Shaw, Peter NF 284 0.8
Majority 6,171 18.0
Turnout 34,378 59.4 +1.8
Swing 5.8% from Labour to Conservative
Vauxhall Labour hold
Hoey, Kate L. LAB 19,744 52.9 -6.3
Anglin, Charles LD 9,767 26.1 +6.0
Heckels, Edward CON 5,405 14.5 +1.0
Summers, Tim GRE 1,705 4.6 +0.1
McWhirter, Robert A. UKIP 271 0.7
Lambert, Daniel SP 240 0.6
Polenceus, Janus ED 221 0.6
Majority 9,977 26.7
Turnout 37,353 46.9 +2.1
Swing 6.1% from Labour to Liberal Democrat
Change
Constituency/Candidate name Party Votes Percentage since 2001
Walthamstow Labour hold
Gerrard, Neil F. LAB 17,323 50.3 -11.9
Ahmed, Farid LD 9,330 27.1 +12.5
Wright, Jane A. CON 6,254 18.2 +0.1
Brock, Robert J. UKIP 810 2.4 +1.5
Taaffe, Nancy SALT 727 2.1 -0.2
Majority 7,993 23.2
Turnout 34,444 54.6 +1.1
Swing 12.2% from Labour to Liberal Democrat
West Ham Labour hold
Brown, Lyn C. LAB 15,840 51.2 -18.7
German, Lindsey A. R 6,039 19.5
Whitbread, Christopher L. CON 3,618 11.7 -4.7
Sugden, Alexandra E. LD 3,364 10.9 +3.5
Lithgow, Jane A. GRE 894 2.9 -1.2
Hammond, Stephen C. CPA 437 1.4
Mayhew, Henry E.B. UKIP 409 1.3 -0.9
Alcantara, Generoso V 365 1.2
Majority 9,801 31.7
Turnout 30,966 49.8 +0.9
Swing 19.1% from Labour to Respect
Wimbledon Conservative gain
Hammond, Stephen W. CON 17,886 41.2 +4.6
Casale, Roger M. LAB 15,585 35.9 -9.8
Gee, Stephen M. LD 7,868 18.1 +5.1
Barrow, Giles T. GRE 1,374 3.2 +0.7
Mills, Andrew T. UKIP 408 0.9 -0.1
Coverdale, Christopher IND 211 0.5
Wilson, Alastair P. TEPK 50 0.1
Weiss, George RDT 22 0.1
Majority 2,301 5.3
Turnout 43,404 68.1 +3.8
Swing 7.2% from Labour to Conservative
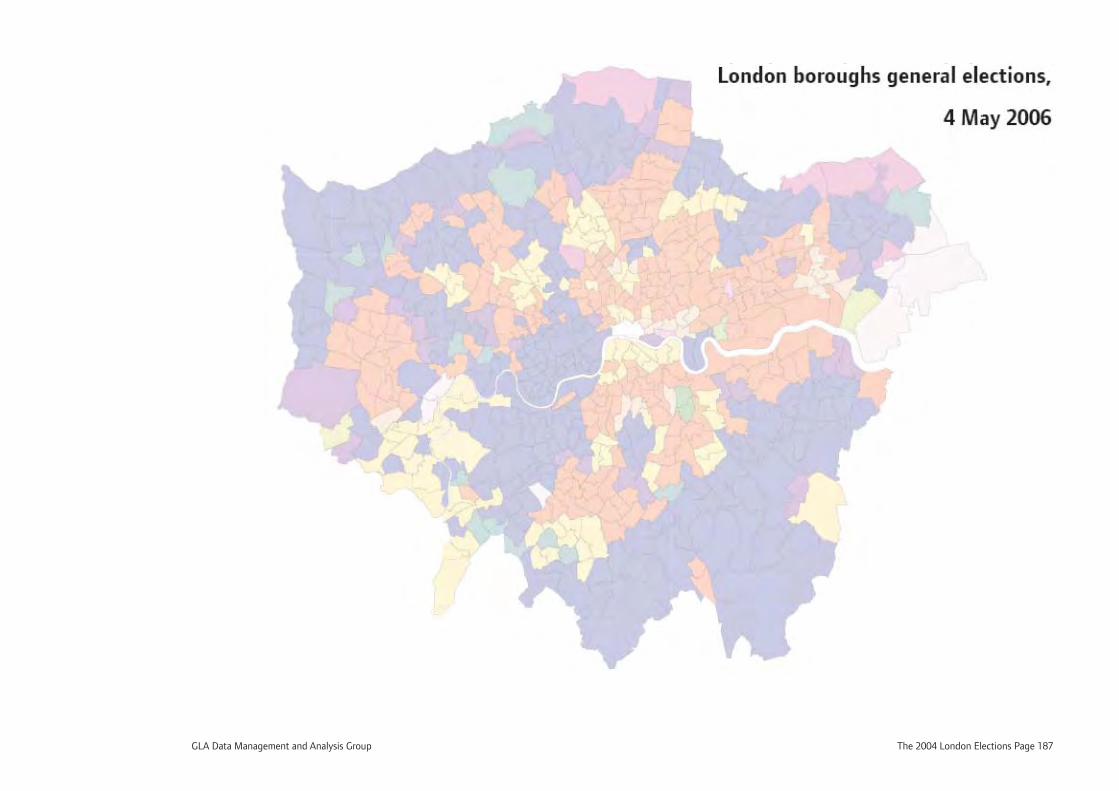
GLA Data Management and Analysis Group The 2004 London Elections Page 187
London boroughs general elections,
4 May 2006
Page 188 The 2004 London Elections GLA Data Management and Analysis Group
The borough summaries
The following pages present summaries of the 2006 elections
in each London borough. The City of London does not appear
because Common Council is elected on a different basis. The votes
(and derived percentages) shown are the raw votes and make no
allowance for differing sizes of ward representation nor of patterns of
nominations by different parties and groups. The swings shown are
the total vote swings and are also based on the raw votes cast.
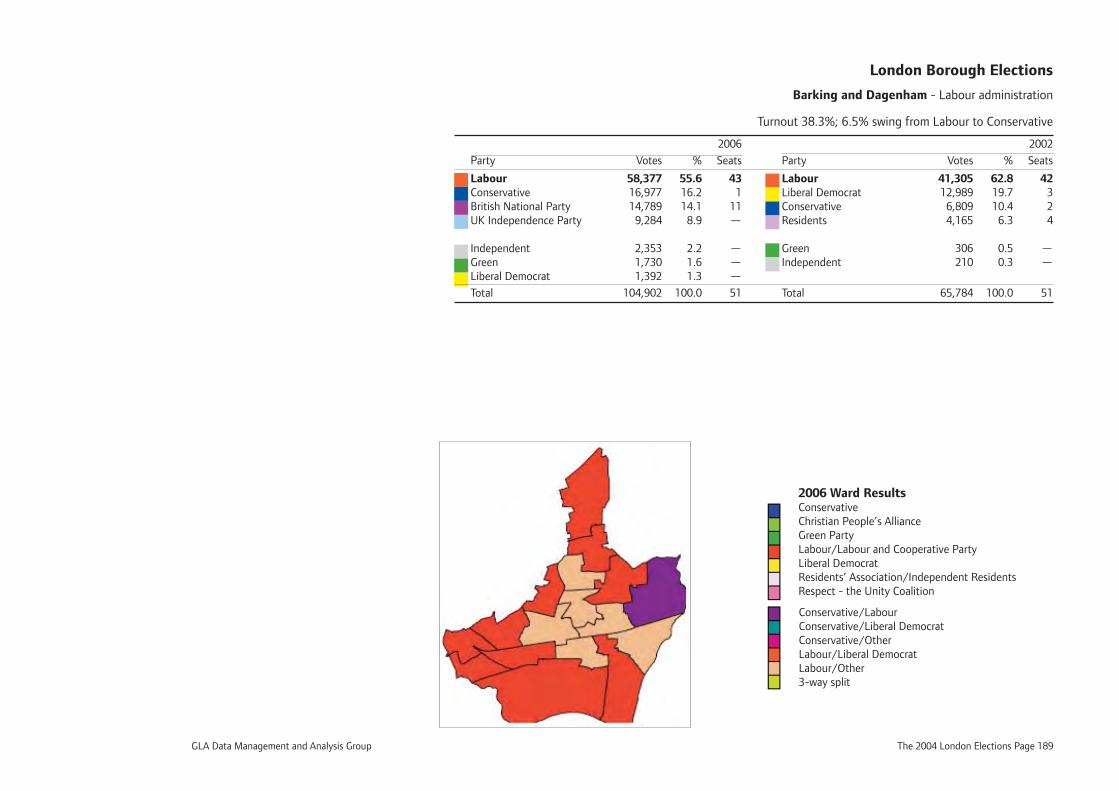
GLA Data Management and Analysis Group The 2004 London Elections Page 189
London Borough Elections
Barking and Dagenham - Labour administration
Turnout 38.3%; 6.5% swing from Labour to Conservative
2006 2002
Party Votes % Seats Party Votes % Seats
Labour 58,377 55.6 43 Labour 41,305 62.8 42Conservative 16,977 16.2 1 Liberal Democrat 12,989 19.7 3British National Party 14,789 14.1 11 Conservative 6,809 10.4 2UK Independence Party 9,284 8.9 — Residents 4,165 6.3 4
Independent 2,353 2.2 — Green 306 0.5 —Green 1,730 1.6 — Independent 210 0.3 —Liberal Democrat 1,392 1.3 —
Total 104,902 100.0 51 Total 65,784 100.0 51
2006 Ward ResultsConservativeChristian People’s AllianceGreen PartyLabour/Labour and Cooperative PartyLiberal DemocratResidents’ Association/Independent ResidentsRespect - the Unity Coalition
Conservative/LabourConservative/Liberal DemocratConservative/OtherLabour/Liberal DemocratLabour/Other3-way split
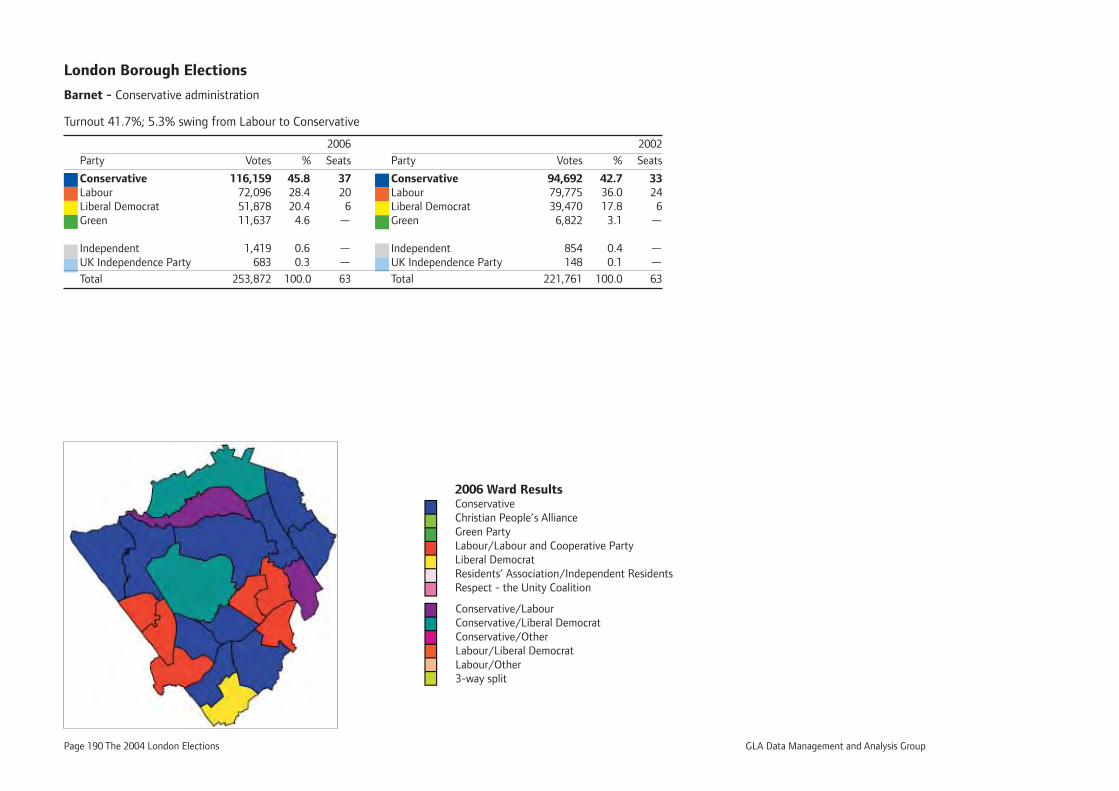
Page 190 The 2004 London Elections GLA Data Management and Analysis Group
London Borough Elections
Barnet - Conservative administration
Turnout 41.7%; 5.3% swing from Labour to Conservative
2006 2002
Party Votes % Seats Party Votes % Seats
Conservative 116,159 45.8 37 Conservative 94,692 42.7 33Labour 72,096 28.4 20 Labour 79,775 36.0 24Liberal Democrat 51,878 20.4 6 Liberal Democrat 39,470 17.8 6Green 11,637 4.6 — Green 6,822 3.1 —
Independent 1,419 0.6 — Independent 854 0.4 —UK Independence Party 683 0.3 — UK Independence Party 148 0.1 —
Total 253,872 100.0 63 Total 221,761 100.0 63
2006 Ward ResultsConservativeChristian People’s AllianceGreen PartyLabour/Labour and Cooperative PartyLiberal DemocratResidents’ Association/Independent ResidentsRespect - the Unity Coalition
Conservative/LabourConservative/Liberal DemocratConservative/OtherLabour/Liberal DemocratLabour/Other3-way split
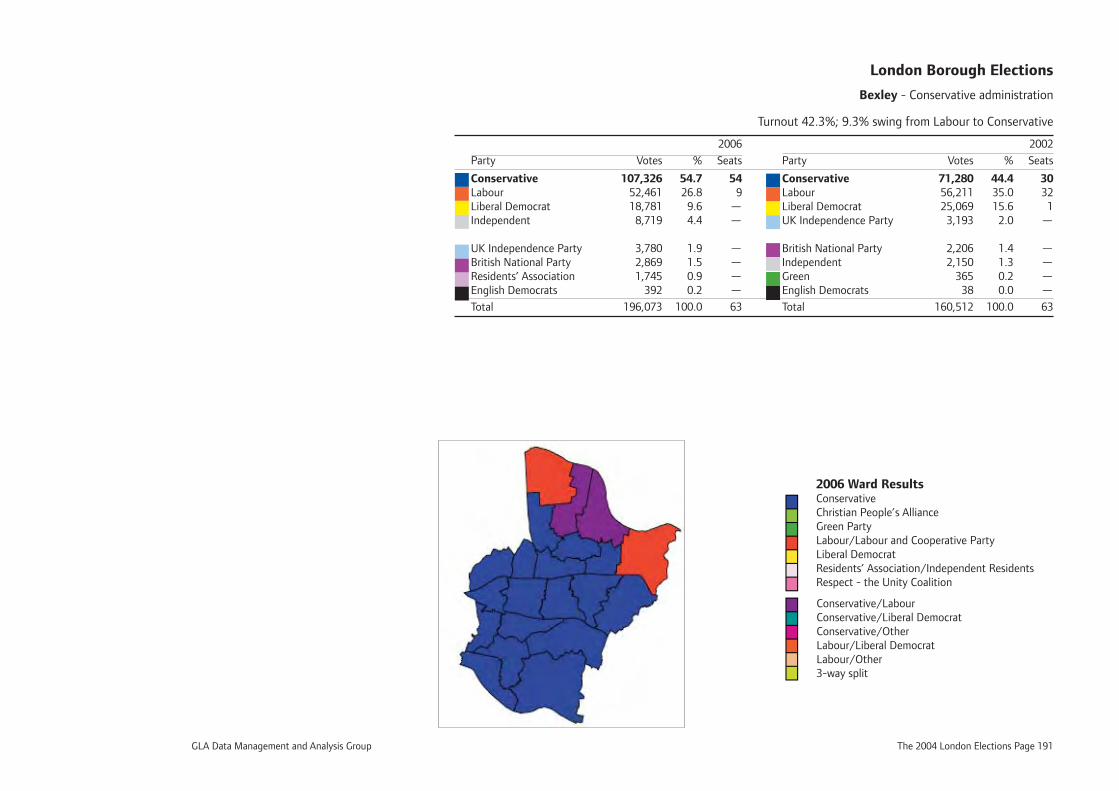
GLA Data Management and Analysis Group The 2004 London Elections Page 191
London Borough Elections
Bexley - Conservative administration
Turnout 42.3%; 9.3% swing from Labour to Conservative
2006 2002
Party Votes % Seats Party Votes % Seats
Conservative 107,326 54.7 54 Conservative 71,280 44.4 30Labour 52,461 26.8 9 Labour 56,211 35.0 32Liberal Democrat 18,781 9.6 — Liberal Democrat 25,069 15.6 1Independent 8,719 4.4 — UK Independence Party 3,193 2.0 —
UK Independence Party 3,780 1.9 — British National Party 2,206 1.4 —British National Party 2,869 1.5 — Independent 2,150 1.3 —Residents’ Association 1,745 0.9 — Green 365 0.2 —English Democrats 392 0.2 — English Democrats 38 0.0 —
Total 196,073 100.0 63 Total 160,512 100.0 63
2006 Ward ResultsConservativeChristian People’s AllianceGreen PartyLabour/Labour and Cooperative PartyLiberal DemocratResidents’ Association/Independent ResidentsRespect - the Unity Coalition
Conservative/LabourConservative/Liberal DemocratConservative/OtherLabour/Liberal DemocratLabour/Other3-way split
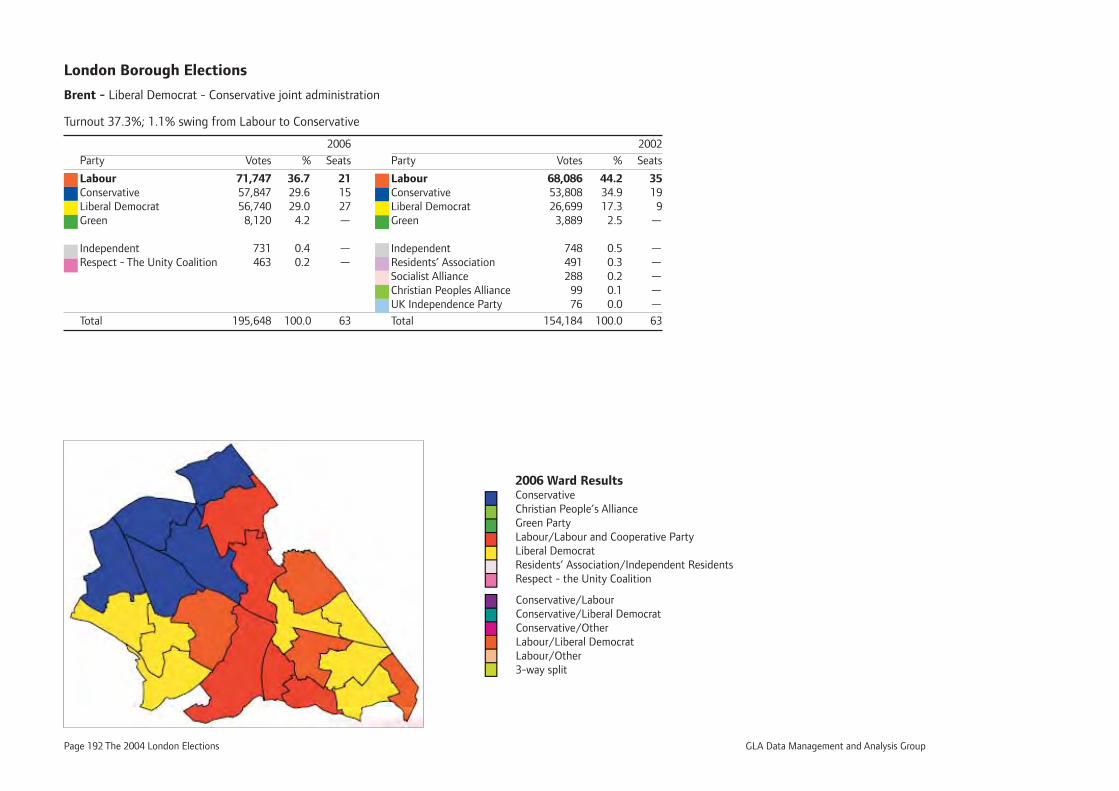
Page 192 The 2004 London Elections GLA Data Management and Analysis Group
London Borough Elections
Brent - Liberal Democrat - Conservative joint administration
Turnout 37.3%; 1.1% swing from Labour to Conservative
2006 2002
Party Votes % Seats Party Votes % Seats
Labour 71,747 36.7 21 Labour 68,086 44.2 35Conservative 57,847 29.6 15 Conservative 53,808 34.9 19Liberal Democrat 56,740 29.0 27 Liberal Democrat 26,699 17.3 9Green 8,120 4.2 — Green 3,889 2.5 —
Independent 731 0.4 — Independent 748 0.5 —Respect - The Unity Coalition 463 0.2 — Residents’ Association 491 0.3 — Socialist Alliance 288 0.2 — Christian Peoples Alliance 99 0.1 — UK Independence Party 76 0.0 —
Total 195,648 100.0 63 Total 154,184 100.0 63
2006 Ward ResultsConservativeChristian People’s AllianceGreen PartyLabour/Labour and Cooperative PartyLiberal DemocratResidents’ Association/Independent ResidentsRespect - the Unity Coalition
Conservative/LabourConservative/Liberal DemocratConservative/OtherLabour/Liberal DemocratLabour/Other3-way split
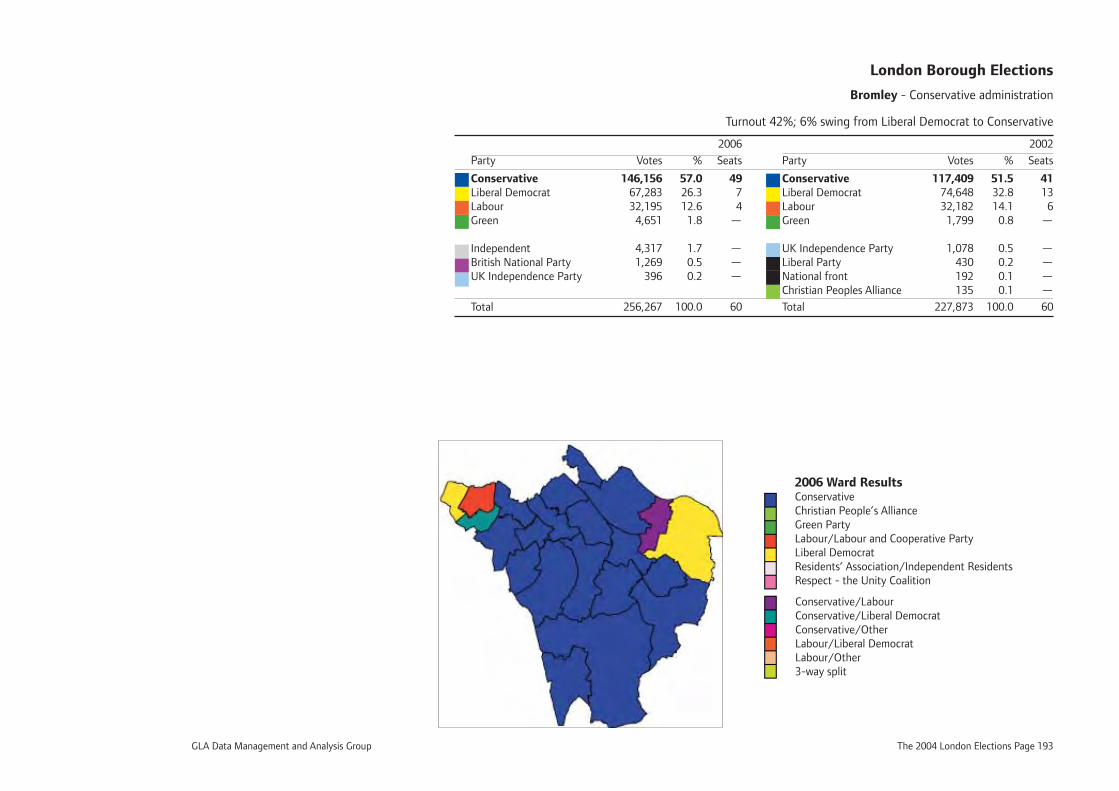
GLA Data Management and Analysis Group The 2004 London Elections Page 193
London Borough Elections
Bromley - Conservative administration
Turnout 42%; 6% swing from Liberal Democrat to Conservative
2006 2002
Party Votes % Seats Party Votes % Seats
Conservative 146,156 57.0 49 Conservative 117,409 51.5 41Liberal Democrat 67,283 26.3 7 Liberal Democrat 74,648 32.8 13Labour 32,195 12.6 4 Labour 32,182 14.1 6Green 4,651 1.8 — Green 1,799 0.8 —
Independent 4,317 1.7 — UK Independence Party 1,078 0.5 —British National Party 1,269 0.5 — Liberal Party 430 0.2 —UK Independence Party 396 0.2 — National front 192 0.1 — Christian Peoples Alliance 135 0.1 —
Total 256,267 100.0 60 Total 227,873 100.0 60
2006 Ward ResultsConservativeChristian People’s AllianceGreen PartyLabour/Labour and Cooperative PartyLiberal DemocratResidents’ Association/Independent ResidentsRespect - the Unity Coalition
Conservative/LabourConservative/Liberal DemocratConservative/OtherLabour/Liberal DemocratLabour/Other3-way split
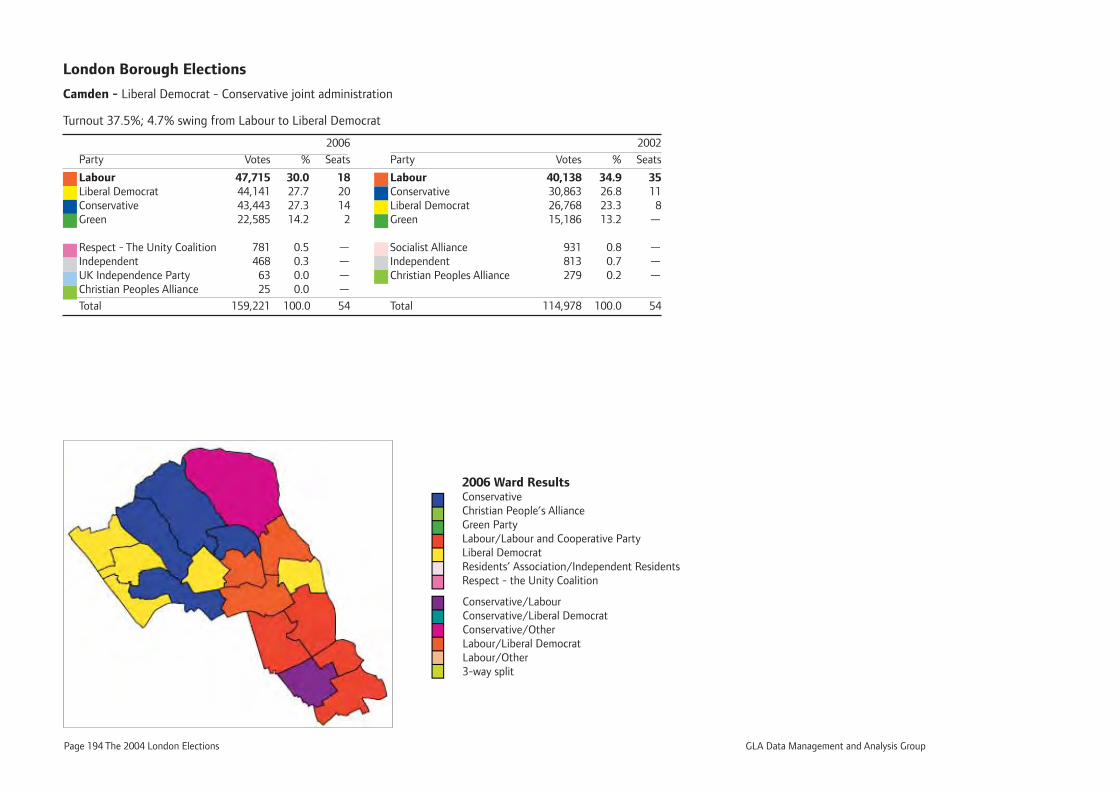
Page 194 The 2004 London Elections GLA Data Management and Analysis Group
London Borough Elections
Camden - Liberal Democrat - Conservative joint administration
Turnout 37.5%; 4.7% swing from Labour to Liberal Democrat
2006 2002
Party Votes % Seats Party Votes % Seats
Labour 47,715 30.0 18 Labour 40,138 34.9 35Liberal Democrat 44,141 27.7 20 Conservative 30,863 26.8 11Conservative 43,443 27.3 14 Liberal Democrat 26,768 23.3 8Green 22,585 14.2 2 Green 15,186 13.2 —
Respect - The Unity Coalition 781 0.5 — Socialist Alliance 931 0.8 —Independent 468 0.3 — Independent 813 0.7 —UK Independence Party 63 0.0 — Christian Peoples Alliance 279 0.2 —Christian Peoples Alliance 25 0.0 —
Total 159,221 100.0 54 Total 114,978 100.0 54
2006 Ward ResultsConservativeChristian People’s AllianceGreen PartyLabour/Labour and Cooperative PartyLiberal DemocratResidents’ Association/Independent ResidentsRespect - the Unity Coalition
Conservative/LabourConservative/Liberal DemocratConservative/OtherLabour/Liberal DemocratLabour/Other3-way split
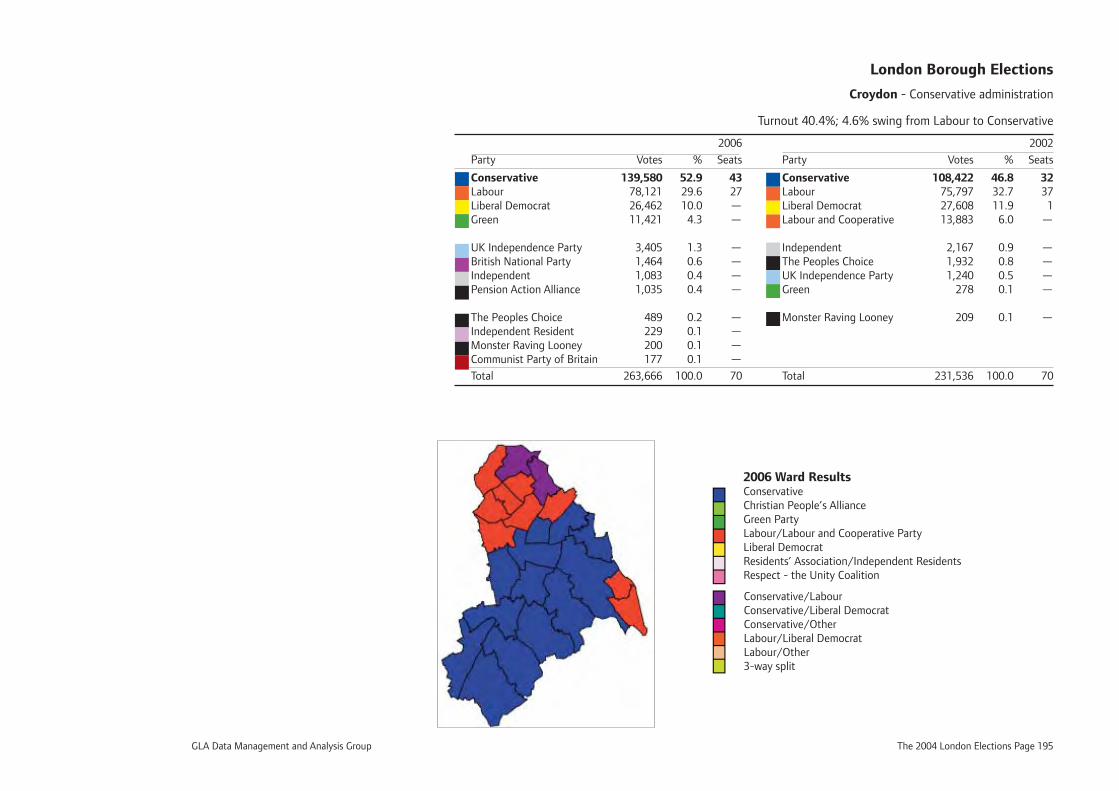
GLA Data Management and Analysis Group The 2004 London Elections Page 195
London Borough Elections
Croydon - Conservative administration
Turnout 40.4%; 4.6% swing from Labour to Conservative
2006 2002
Party Votes % Seats Party Votes % Seats
Conservative 139,580 52.9 43 Conservative 108,422 46.8 32Labour 78,121 29.6 27 Labour 75,797 32.7 37Liberal Democrat 26,462 10.0 — Liberal Democrat 27,608 11.9 1Green 11,421 4.3 — Labour and Cooperative 13,883 6.0 —
UK Independence Party 3,405 1.3 — Independent 2,167 0.9 —British National Party 1,464 0.6 — The Peoples Choice 1,932 0.8 —Independent 1,083 0.4 — UK Independence Party 1,240 0.5 —Pension Action Alliance 1,035 0.4 — Green 278 0.1 —
The Peoples Choice 489 0.2 — Monster Raving Looney 209 0.1 —Independent Resident 229 0.1 — Monster Raving Looney 200 0.1 — Communist Party of Britain 177 0.1 —
Total 263,666 100.0 70 Total 231,536 100.0 70
2006 Ward ResultsConservativeChristian People’s AllianceGreen PartyLabour/Labour and Cooperative PartyLiberal DemocratResidents’ Association/Independent ResidentsRespect - the Unity Coalition
Conservative/LabourConservative/Liberal DemocratConservative/OtherLabour/Liberal DemocratLabour/Other3-way split
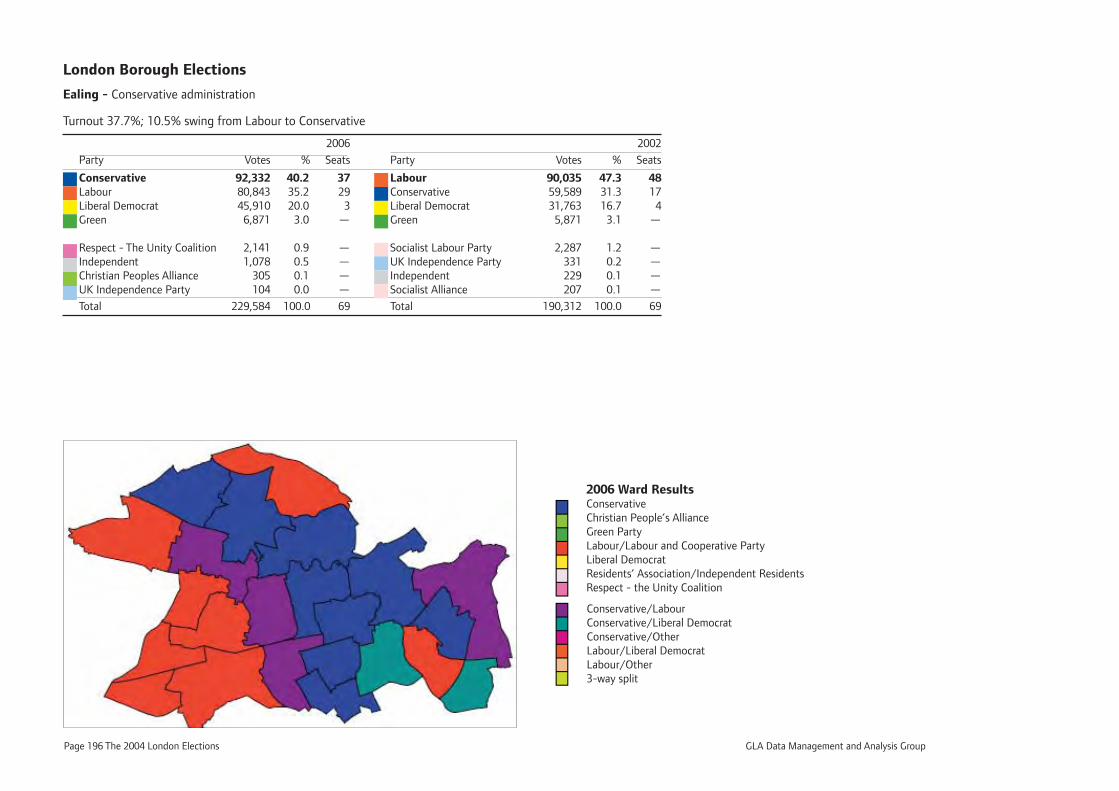
Page 196 The 2004 London Elections GLA Data Management and Analysis Group
London Borough Elections
Ealing - Conservative administration
Turnout 37.7%; 10.5% swing from Labour to Conservative
2006 2002
Party Votes % Seats Party Votes % Seats
Conservative 92,332 40.2 37 Labour 90,035 47.3 48Labour 80,843 35.2 29 Conservative 59,589 31.3 17Liberal Democrat 45,910 20.0 3 Liberal Democrat 31,763 16.7 4Green 6,871 3.0 — Green 5,871 3.1 —
Respect - The Unity Coalition 2,141 0.9 — Socialist Labour Party 2,287 1.2 —Independent 1,078 0.5 — UK Independence Party 331 0.2 —Christian Peoples Alliance 305 0.1 — Independent 229 0.1 —UK Independence Party 104 0.0 — Socialist Alliance 207 0.1 —
Total 229,584 100.0 69 Total 190,312 100.0 69
2006 Ward ResultsConservativeChristian People’s AllianceGreen PartyLabour/Labour and Cooperative PartyLiberal DemocratResidents’ Association/Independent ResidentsRespect - the Unity Coalition
Conservative/LabourConservative/Liberal DemocratConservative/OtherLabour/Liberal DemocratLabour/Other3-way split
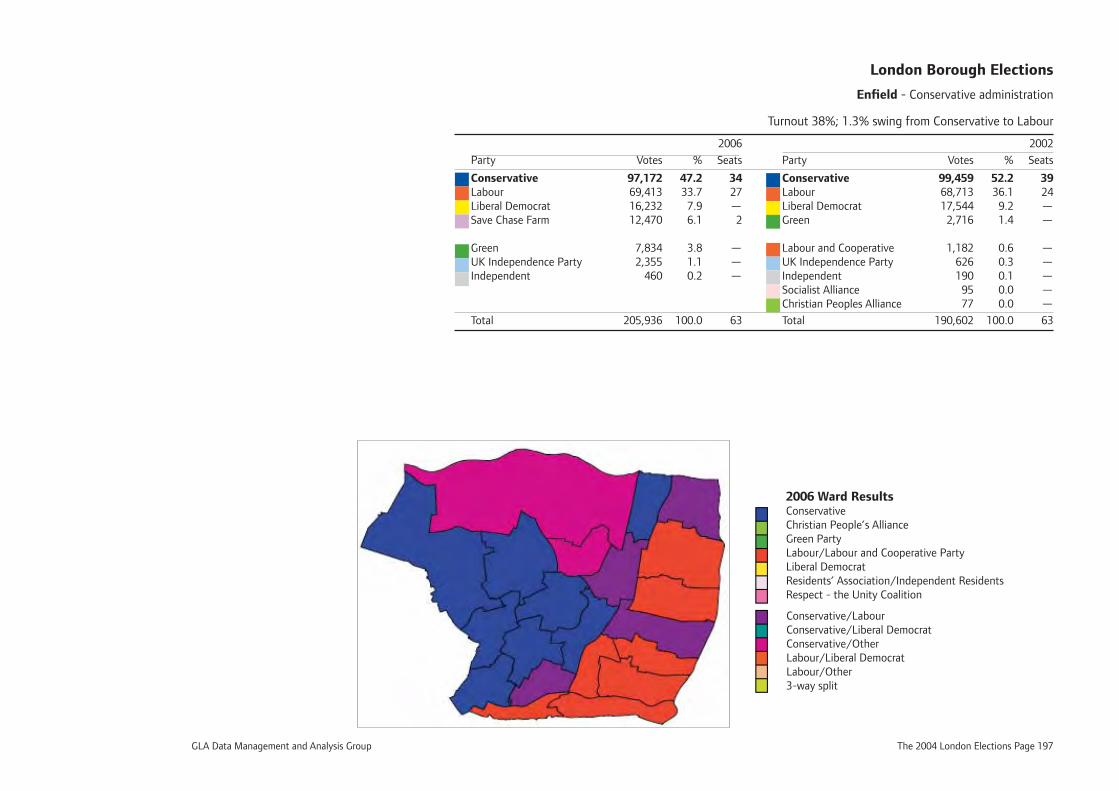
GLA Data Management and Analysis Group The 2004 London Elections Page 197
London Borough Elections
Enfi eld - Conservative administration
Turnout 38%; 1.3% swing from Conservative to Labour
2006 2002
Party Votes % Seats Party Votes % Seats
Conservative 97,172 47.2 34 Conservative 99,459 52.2 39Labour 69,413 33.7 27 Labour 68,713 36.1 24Liberal Democrat 16,232 7.9 — Liberal Democrat 17,544 9.2 —Save Chase Farm 12,470 6.1 2 Green 2,716 1.4 —
Green 7,834 3.8 — Labour and Cooperative 1,182 0.6 —UK Independence Party 2,355 1.1 — UK Independence Party 626 0.3 —Independent 460 0.2 — Independent 190 0.1 — Socialist Alliance 95 0.0 — Christian Peoples Alliance 77 0.0 —
Total 205,936 100.0 63 Total 190,602 100.0 63
2006 Ward ResultsConservativeChristian People’s AllianceGreen PartyLabour/Labour and Cooperative PartyLiberal DemocratResidents’ Association/Independent ResidentsRespect - the Unity Coalition
Conservative/LabourConservative/Liberal DemocratConservative/OtherLabour/Liberal DemocratLabour/Other3-way split
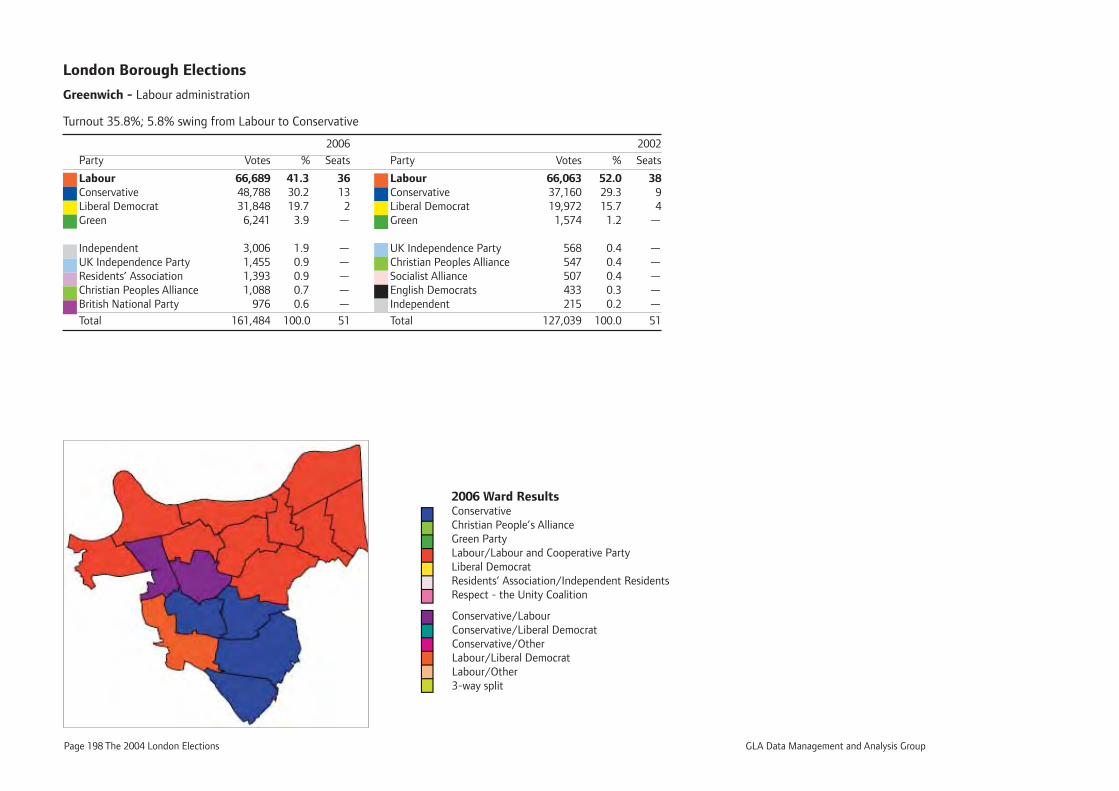
Page 198 The 2004 London Elections GLA Data Management and Analysis Group
London Borough Elections
Greenwich - Labour administration
Turnout 35.8%; 5.8% swing from Labour to Conservative
2006 2002
Party Votes % Seats Party Votes % Seats
Labour 66,689 41.3 36 Labour 66,063 52.0 38Conservative 48,788 30.2 13 Conservative 37,160 29.3 9Liberal Democrat 31,848 19.7 2 Liberal Democrat 19,972 15.7 4Green 6,241 3.9 — Green 1,574 1.2 —
Independent 3,006 1.9 — UK Independence Party 568 0.4 —UK Independence Party 1,455 0.9 — Christian Peoples Alliance 547 0.4 —Residents’ Association 1,393 0.9 — Socialist Alliance 507 0.4 —Christian Peoples Alliance 1,088 0.7 — English Democrats 433 0.3 —British National Party 976 0.6 — Independent 215 0.2 —
Total 161,484 100.0 51 Total 127,039 100.0 51
2006 Ward ResultsConservativeChristian People’s AllianceGreen PartyLabour/Labour and Cooperative PartyLiberal DemocratResidents’ Association/Independent ResidentsRespect - the Unity Coalition
Conservative/LabourConservative/Liberal DemocratConservative/OtherLabour/Liberal DemocratLabour/Other3-way split
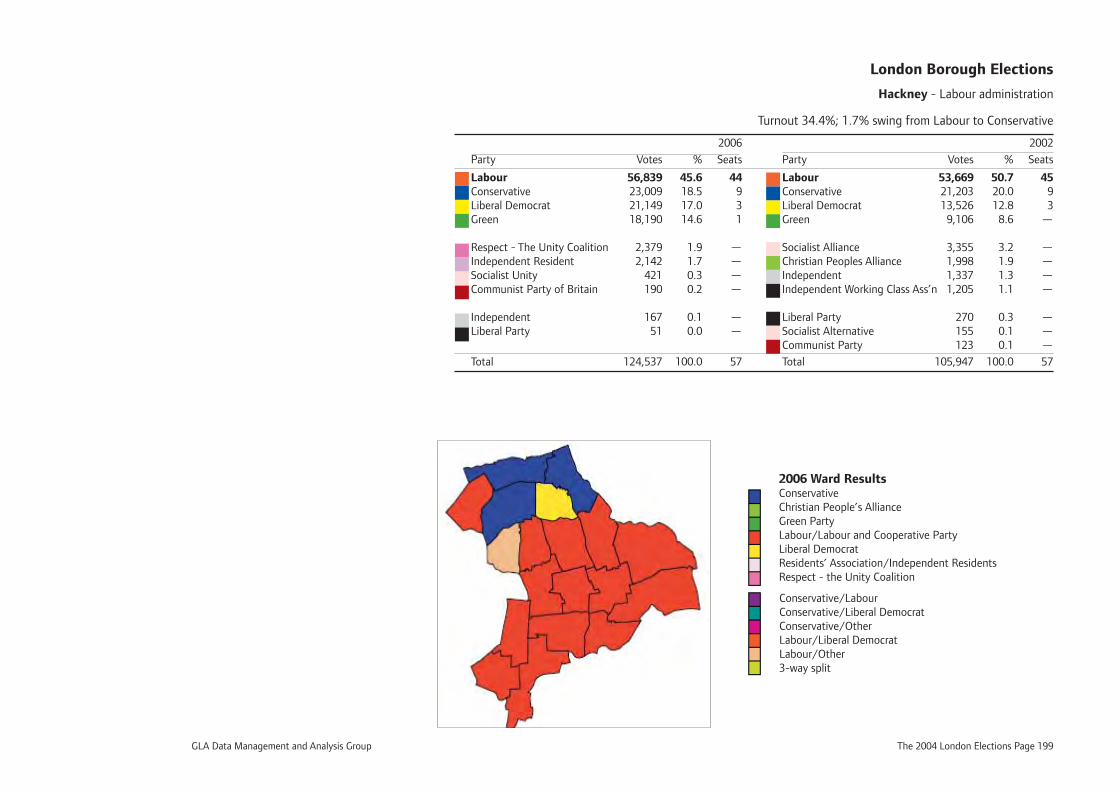
GLA Data Management and Analysis Group The 2004 London Elections Page 199
London Borough Elections
Hackney - Labour administration
Turnout 34.4%; 1.7% swing from Labour to Conservative
2006 2002
Party Votes % Seats Party Votes % Seats
Labour 56,839 45.6 44 Labour 53,669 50.7 45Conservative 23,009 18.5 9 Conservative 21,203 20.0 9Liberal Democrat 21,149 17.0 3 Liberal Democrat 13,526 12.8 3Green 18,190 14.6 1 Green 9,106 8.6 —
Respect - The Unity Coalition 2,379 1.9 — Socialist Alliance 3,355 3.2 —Independent Resident 2,142 1.7 — Christian Peoples Alliance 1,998 1.9 —Socialist Unity 421 0.3 — Independent 1,337 1.3 —Communist Party of Britain 190 0.2 — Independent Working Class Ass’n 1,205 1.1 —
Independent 167 0.1 — Liberal Party 270 0.3 —Liberal Party 51 0.0 — Socialist Alternative 155 0.1 — Communist Party 123 0.1 —
Total 124,537 100.0 57 Total 105,947 100.0 57
2006 Ward ResultsConservativeChristian People’s AllianceGreen PartyLabour/Labour and Cooperative PartyLiberal DemocratResidents’ Association/Independent ResidentsRespect - the Unity Coalition
Conservative/LabourConservative/Liberal DemocratConservative/OtherLabour/Liberal DemocratLabour/Other3-way split
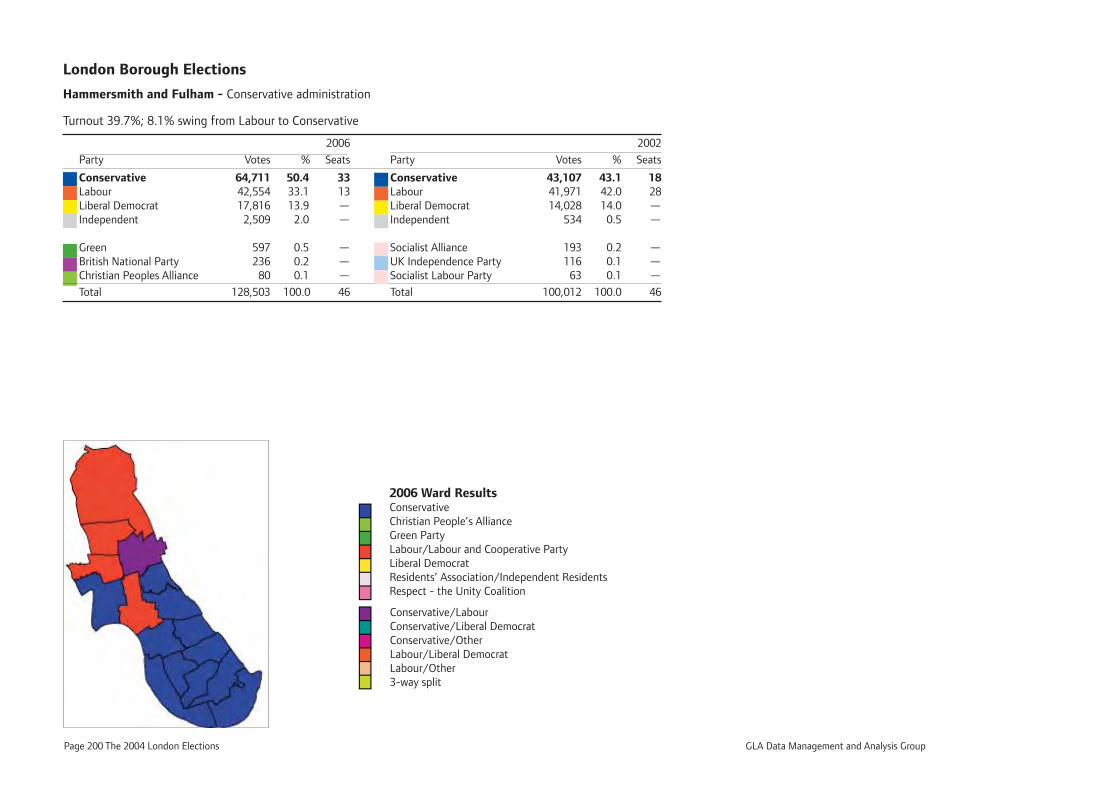
Page 200 The 2004 London Elections GLA Data Management and Analysis Group
London Borough Elections
Hammersmith and Fulham - Conservative administration
Turnout 39.7%; 8.1% swing from Labour to Conservative
2006 2002
Party Votes % Seats Party Votes % Seats
Conservative 64,711 50.4 33 Conservative 43,107 43.1 18Labour 42,554 33.1 13 Labour 41,971 42.0 28Liberal Democrat 17,816 13.9 — Liberal Democrat 14,028 14.0 —Independent 2,509 2.0 — Independent 534 0.5 —
Green 597 0.5 — Socialist Alliance 193 0.2 —British National Party 236 0.2 — UK Independence Party 116 0.1 —Christian Peoples Alliance 80 0.1 — Socialist Labour Party 63 0.1 —
Total 128,503 100.0 46 Total 100,012 100.0 46
2006 Ward ResultsConservativeChristian People’s AllianceGreen PartyLabour/Labour and Cooperative PartyLiberal DemocratResidents’ Association/Independent ResidentsRespect - the Unity Coalition
Conservative/LabourConservative/Liberal DemocratConservative/OtherLabour/Liberal DemocratLabour/Other3-way split
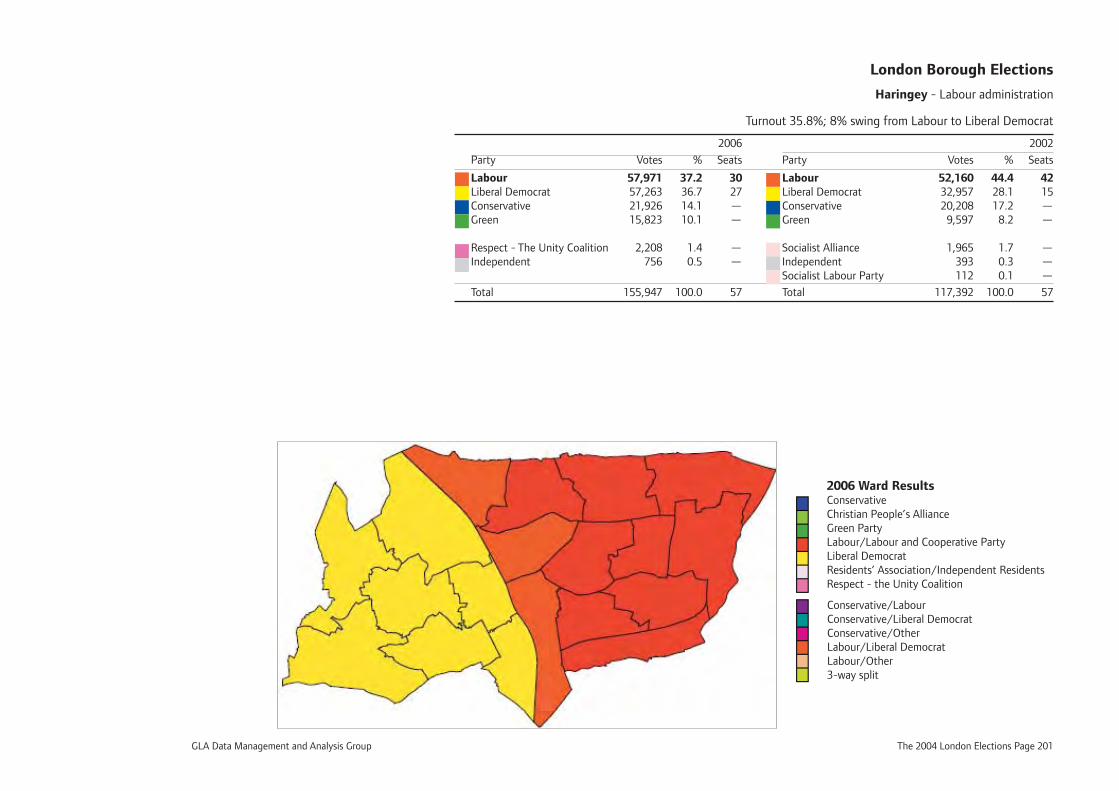
GLA Data Management and Analysis Group The 2004 London Elections Page 201
London Borough Elections
Haringey - Labour administration
Turnout 35.8%; 8% swing from Labour to Liberal Democrat
2006 2002
Party Votes % Seats Party Votes % Seats
Labour 57,971 37.2 30 Labour 52,160 44.4 42Liberal Democrat 57,263 36.7 27 Liberal Democrat 32,957 28.1 15Conservative 21,926 14.1 — Conservative 20,208 17.2 —Green 15,823 10.1 — Green 9,597 8.2 —
Respect - The Unity Coalition 2,208 1.4 — Socialist Alliance 1,965 1.7 —Independent 756 0.5 — Independent 393 0.3 — Socialist Labour Party 112 0.1 —
Total 155,947 100.0 57 Total 117,392 100.0 57
2006 Ward ResultsConservativeChristian People’s AllianceGreen PartyLabour/Labour and Cooperative PartyLiberal DemocratResidents’ Association/Independent ResidentsRespect - the Unity Coalition
Conservative/LabourConservative/Liberal DemocratConservative/OtherLabour/Liberal DemocratLabour/Other3-way split
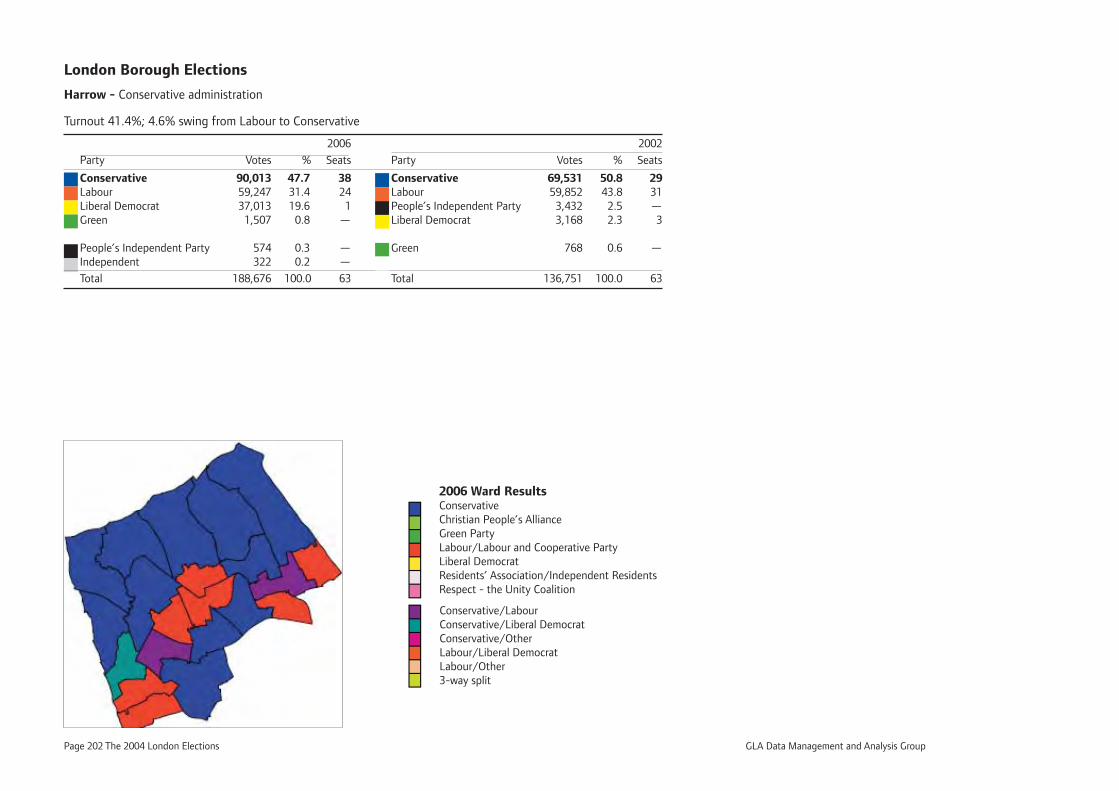
Page 202 The 2004 London Elections GLA Data Management and Analysis Group
London Borough Elections
Harrow - Conservative administration
Turnout 41.4%; 4.6% swing from Labour to Conservative
2006 2002
Party Votes % Seats Party Votes % Seats
Conservative 90,013 47.7 38 Conservative 69,531 50.8 29Labour 59,247 31.4 24 Labour 59,852 43.8 31Liberal Democrat 37,013 19.6 1 People’s Independent Party 3,432 2.5 —Green 1,507 0.8 — Liberal Democrat 3,168 2.3 3
People’s Independent Party 574 0.3 — Green 768 0.6 —Independent 322 0.2 —
Total 188,676 100.0 63 Total 136,751 100.0 63
2006 Ward ResultsConservativeChristian People’s AllianceGreen PartyLabour/Labour and Cooperative PartyLiberal DemocratResidents’ Association/Independent ResidentsRespect - the Unity Coalition
Conservative/LabourConservative/Liberal DemocratConservative/OtherLabour/Liberal DemocratLabour/Other3-way split
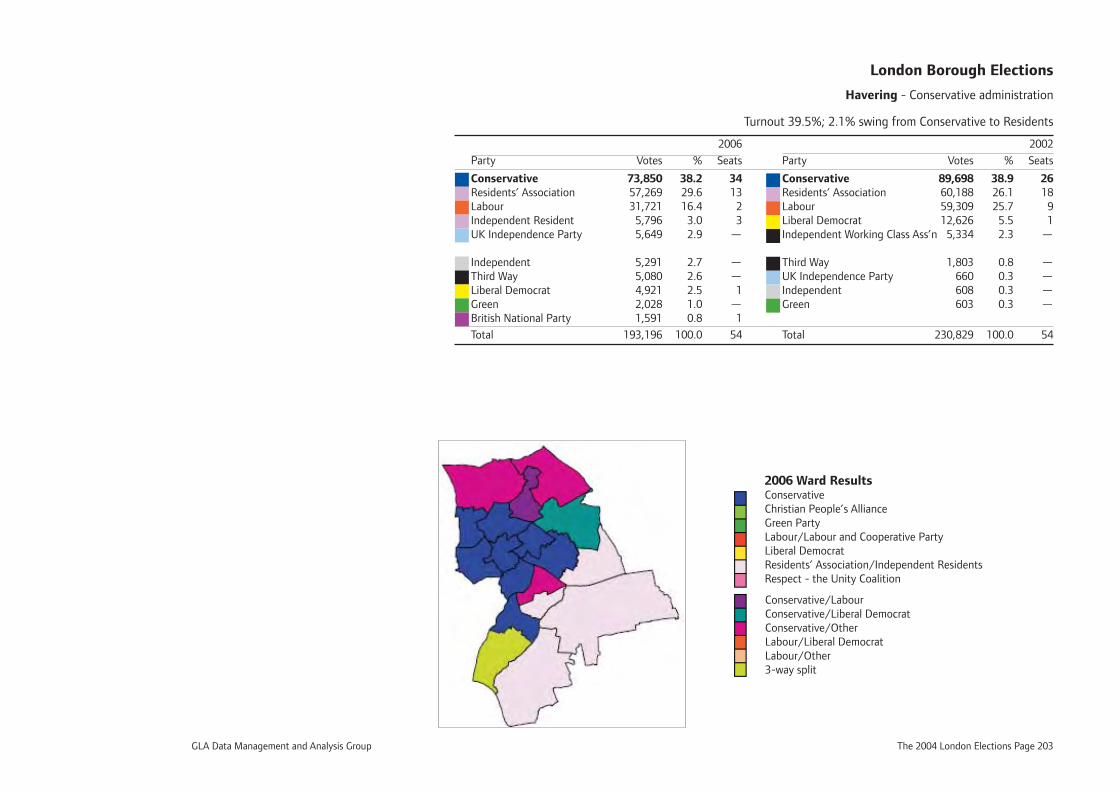
GLA Data Management and Analysis Group The 2004 London Elections Page 203
London Borough Elections
Havering - Conservative administration
Turnout 39.5%; 2.1% swing from Conservative to Residents
2006 2002
Party Votes % Seats Party Votes % Seats
Conservative 73,850 38.2 34 Conservative 89,698 38.9 26Residents’ Association 57,269 29.6 13 Residents’ Association 60,188 26.1 18Labour 31,721 16.4 2 Labour 59,309 25.7 9Independent Resident 5,796 3.0 3 Liberal Democrat 12,626 5.5 1UK Independence Party 5,649 2.9 — Independent Working Class Ass’n 5,334 2.3 —
Independent 5,291 2.7 — Third Way 1,803 0.8 —Third Way 5,080 2.6 — UK Independence Party 660 0.3 —Liberal Democrat 4,921 2.5 1 Independent 608 0.3 —Green 2,028 1.0 — Green 603 0.3 —British National Party 1,591 0.8 1
Total 193,196 100.0 54 Total 230,829 100.0 54
2006 Ward ResultsConservativeChristian People’s AllianceGreen PartyLabour/Labour and Cooperative PartyLiberal DemocratResidents’ Association/Independent ResidentsRespect - the Unity Coalition
Conservative/LabourConservative/Liberal DemocratConservative/OtherLabour/Liberal DemocratLabour/Other3-way split
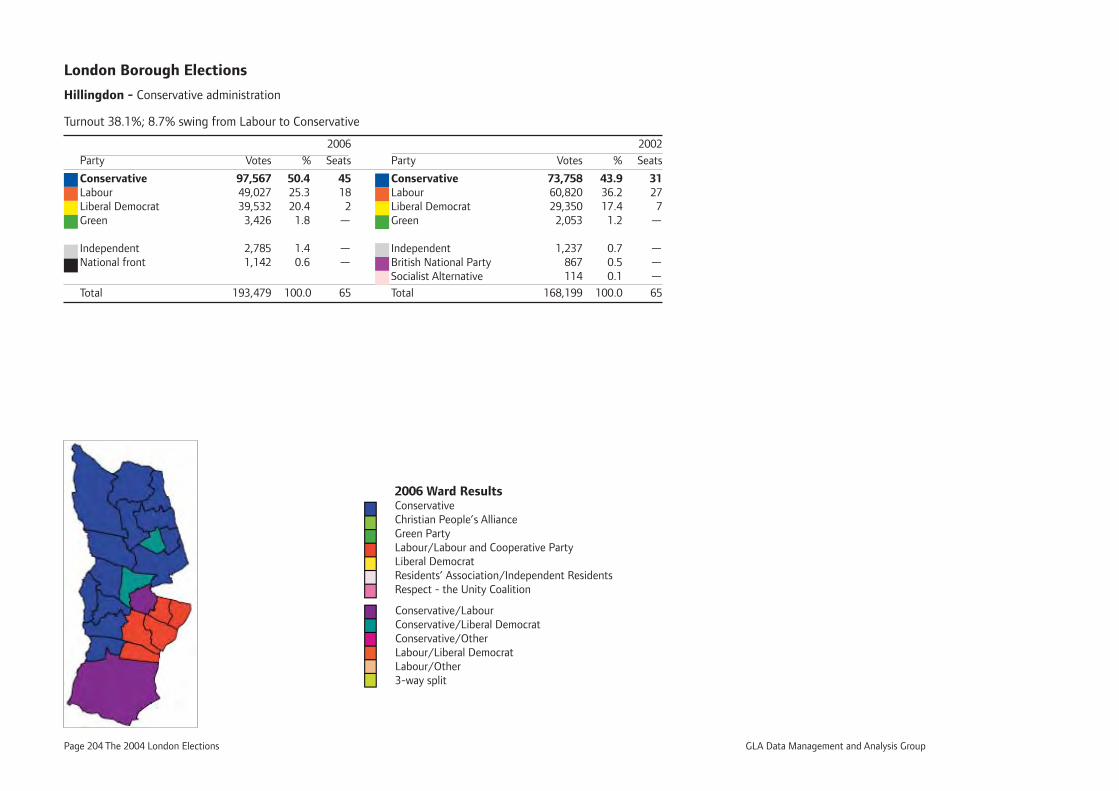
Page 204 The 2004 London Elections GLA Data Management and Analysis Group
London Borough Elections
Hillingdon - Conservative administration
Turnout 38.1%; 8.7% swing from Labour to Conservative
2006 2002
Party Votes % Seats Party Votes % Seats
Conservative 97,567 50.4 45 Conservative 73,758 43.9 31Labour 49,027 25.3 18 Labour 60,820 36.2 27Liberal Democrat 39,532 20.4 2 Liberal Democrat 29,350 17.4 7Green 3,426 1.8 — Green 2,053 1.2 —
Independent 2,785 1.4 — Independent 1,237 0.7 —National front 1,142 0.6 — British National Party 867 0.5 — Socialist Alternative 114 0.1 —
Total 193,479 100.0 65 Total 168,199 100.0 65
2006 Ward ResultsConservativeChristian People’s AllianceGreen PartyLabour/Labour and Cooperative PartyLiberal DemocratResidents’ Association/Independent ResidentsRespect - the Unity Coalition
Conservative/LabourConservative/Liberal DemocratConservative/OtherLabour/Liberal DemocratLabour/Other3-way split
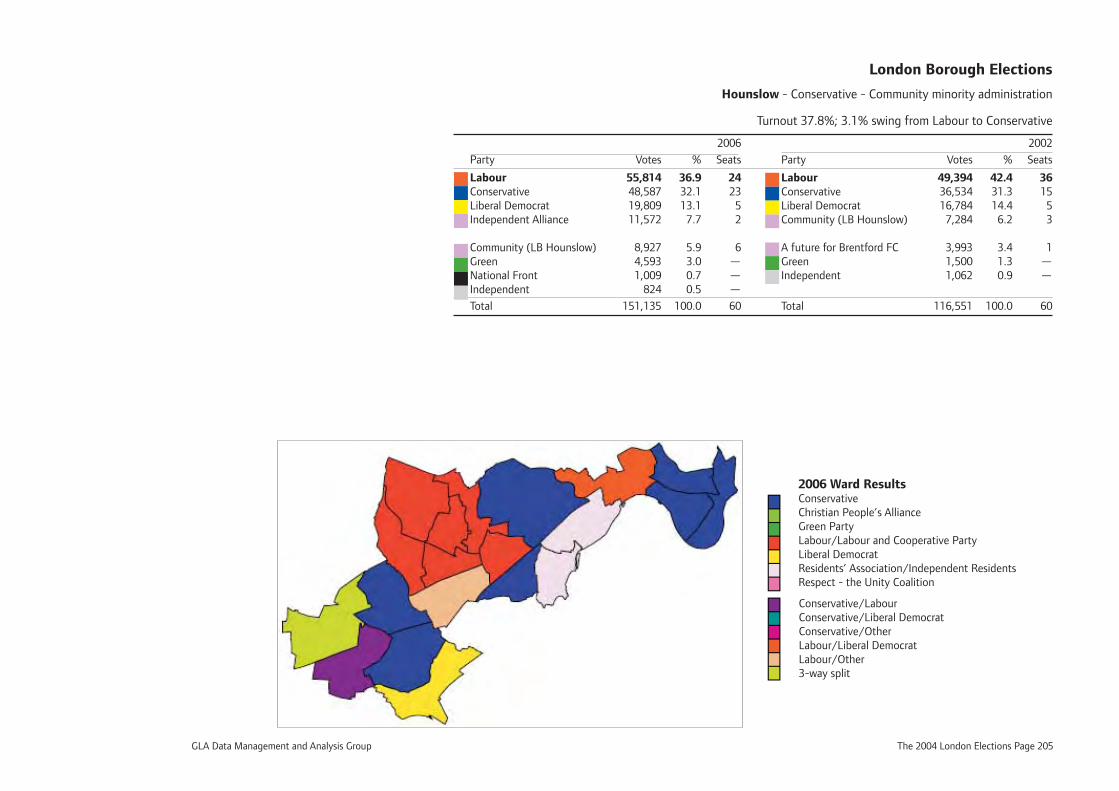
GLA Data Management and Analysis Group The 2004 London Elections Page 205
London Borough Elections
Hounslow - Conservative - Community minority administration
Turnout 37.8%; 3.1% swing from Labour to Conservative
2006 2002
Party Votes % Seats Party Votes % Seats
Labour 55,814 36.9 24 Labour 49,394 42.4 36Conservative 48,587 32.1 23 Conservative 36,534 31.3 15Liberal Democrat 19,809 13.1 5 Liberal Democrat 16,784 14.4 5Independent Alliance 11,572 7.7 2 Community (LB Hounslow) 7,284 6.2 3
Community (LB Hounslow) 8,927 5.9 6 A future for Brentford FC 3,993 3.4 1Green 4,593 3.0 — Green 1,500 1.3 —National Front 1,009 0.7 — Independent 1,062 0.9 —Independent 824 0.5 —
Total 151,135 100.0 60 Total 116,551 100.0 60
2006 Ward ResultsConservativeChristian People’s AllianceGreen PartyLabour/Labour and Cooperative PartyLiberal DemocratResidents’ Association/Independent ResidentsRespect - the Unity Coalition
Conservative/LabourConservative/Liberal DemocratConservative/OtherLabour/Liberal DemocratLabour/Other3-way split
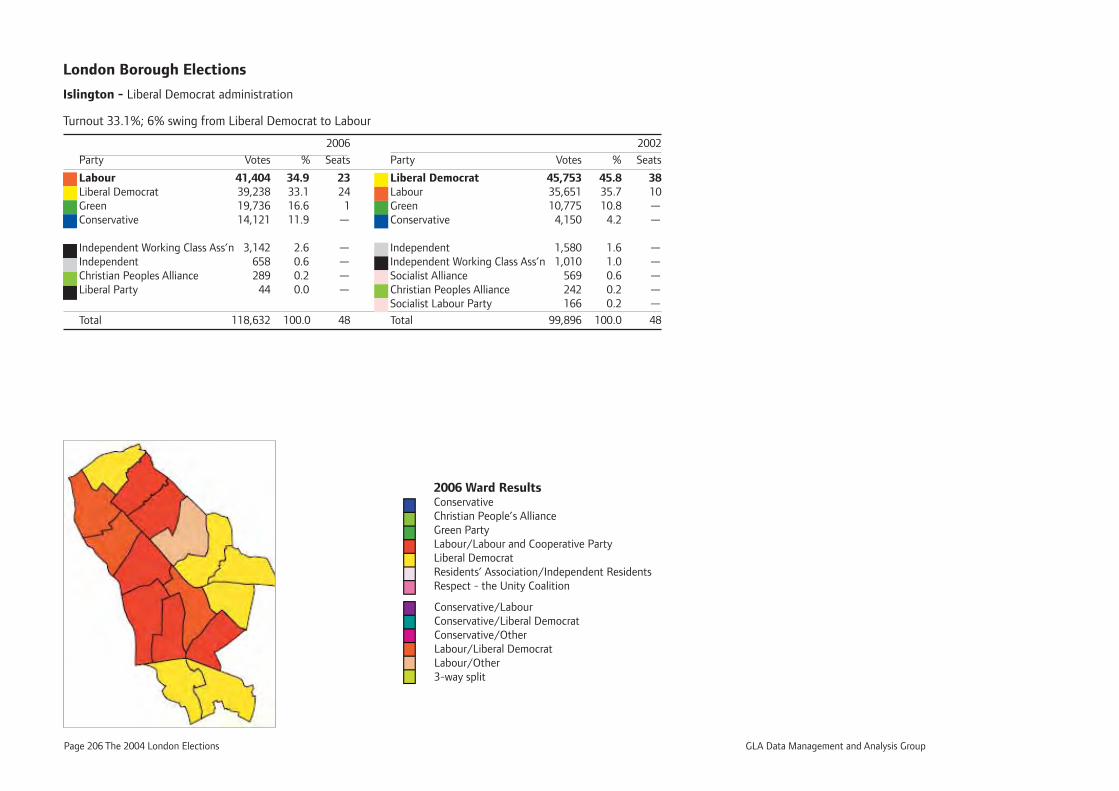
Page 206 The 2004 London Elections GLA Data Management and Analysis Group
London Borough Elections
Islington - Liberal Democrat administration
Turnout 33.1%; 6% swing from Liberal Democrat to Labour
2006 2002
Party Votes % Seats Party Votes % Seats
Labour 41,404 34.9 23 Liberal Democrat 45,753 45.8 38Liberal Democrat 39,238 33.1 24 Labour 35,651 35.7 10Green 19,736 16.6 1 Green 10,775 10.8 —Conservative 14,121 11.9 — Conservative 4,150 4.2 —
Independent Working Class Ass’n 3,142 2.6 — Independent 1,580 1.6 —Independent 658 0.6 — Independent Working Class Ass’n 1,010 1.0 —Christian Peoples Alliance 289 0.2 — Socialist Alliance 569 0.6 —Liberal Party 44 0.0 — Christian Peoples Alliance 242 0.2 — Socialist Labour Party 166 0.2 —
Total 118,632 100.0 48 Total 99,896 100.0 48
2006 Ward ResultsConservativeChristian People’s AllianceGreen PartyLabour/Labour and Cooperative PartyLiberal DemocratResidents’ Association/Independent ResidentsRespect - the Unity Coalition
Conservative/LabourConservative/Liberal DemocratConservative/OtherLabour/Liberal DemocratLabour/Other3-way split
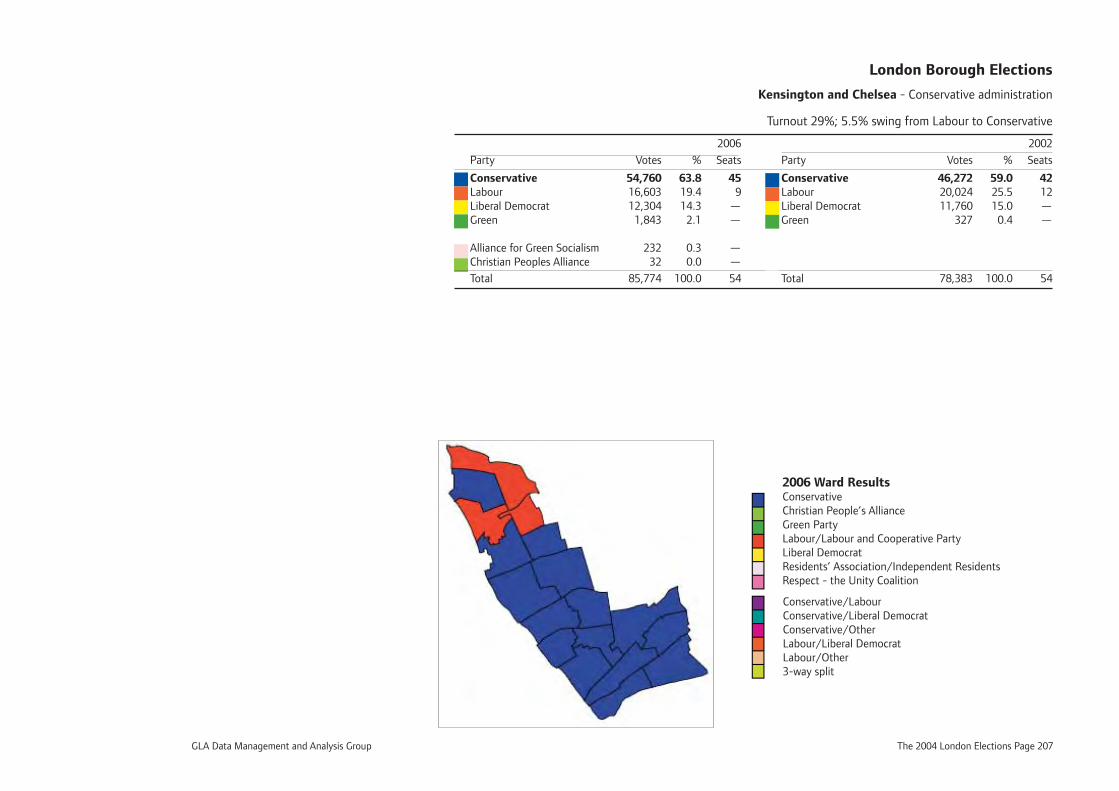
GLA Data Management and Analysis Group The 2004 London Elections Page 207
London Borough Elections
Kensington and Chelsea - Conservative administration
Turnout 29%; 5.5% swing from Labour to Conservative
2006 2002
Party Votes % Seats Party Votes % Seats
Conservative 54,760 63.8 45 Conservative 46,272 59.0 42Labour 16,603 19.4 9 Labour 20,024 25.5 12Liberal Democrat 12,304 14.3 — Liberal Democrat 11,760 15.0 —Green 1,843 2.1 — Green 327 0.4 —
Alliance for Green Socialism 232 0.3 — Christian Peoples Alliance 32 0.0 —
Total 85,774 100.0 54 Total 78,383 100.0 54
2006 Ward ResultsConservativeChristian People’s AllianceGreen PartyLabour/Labour and Cooperative PartyLiberal DemocratResidents’ Association/Independent ResidentsRespect - the Unity Coalition
Conservative/LabourConservative/Liberal DemocratConservative/OtherLabour/Liberal DemocratLabour/Other3-way split
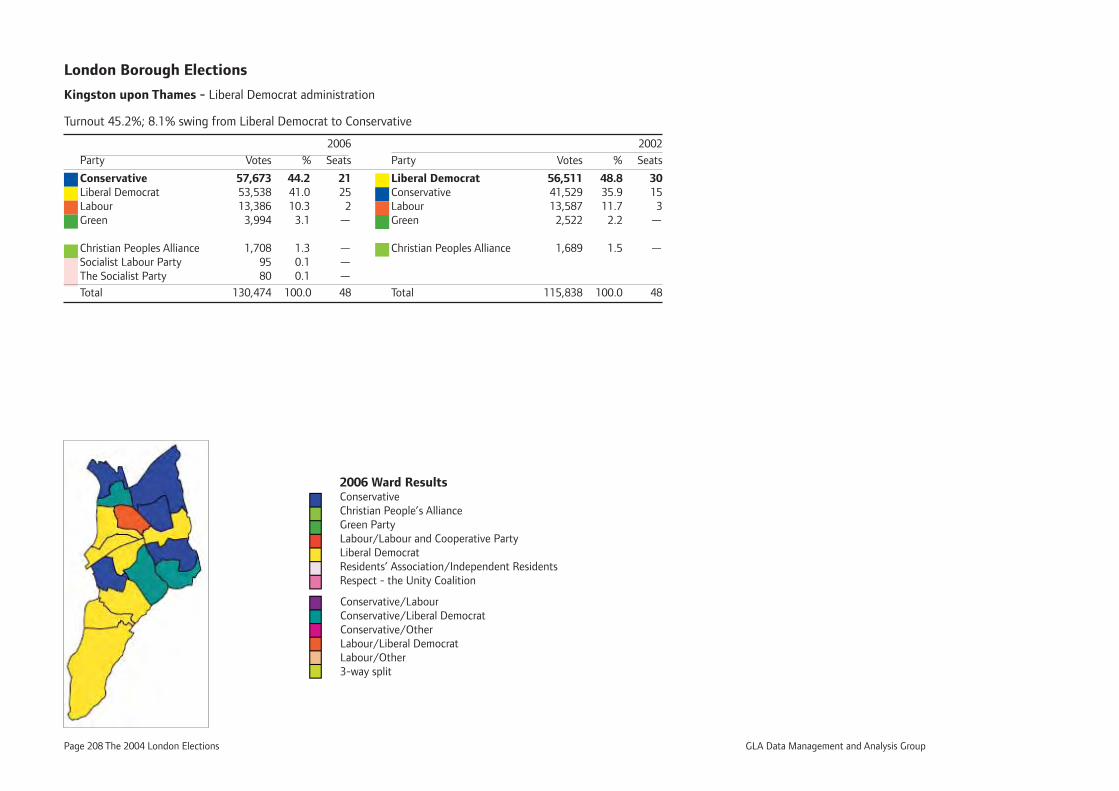
Page 208 The 2004 London Elections GLA Data Management and Analysis Group
London Borough Elections
Kingston upon Thames - Liberal Democrat administration
Turnout 45.2%; 8.1% swing from Liberal Democrat to Conservative
2006 2002
Party Votes % Seats Party Votes % Seats
Conservative 57,673 44.2 21 Liberal Democrat 56,511 48.8 30Liberal Democrat 53,538 41.0 25 Conservative 41,529 35.9 15Labour 13,386 10.3 2 Labour 13,587 11.7 3Green 3,994 3.1 — Green 2,522 2.2 —
Christian Peoples Alliance 1,708 1.3 — Christian Peoples Alliance 1,689 1.5 —Socialist Labour Party 95 0.1 — The Socialist Party 80 0.1 —
Total 130,474 100.0 48 Total 115,838 100.0 48
2006 Ward ResultsConservativeChristian People’s AllianceGreen PartyLabour/Labour and Cooperative PartyLiberal DemocratResidents’ Association/Independent ResidentsRespect - the Unity Coalition
Conservative/LabourConservative/Liberal DemocratConservative/OtherLabour/Liberal DemocratLabour/Other3-way split
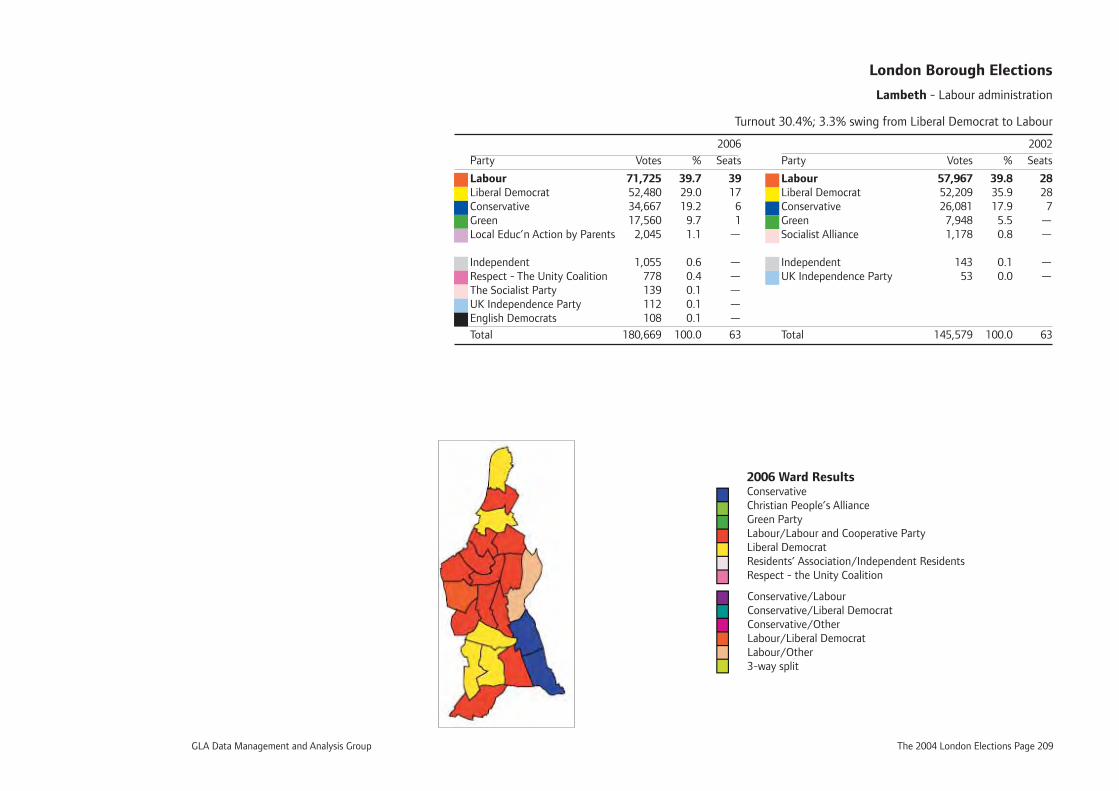
GLA Data Management and Analysis Group The 2004 London Elections Page 209
London Borough Elections
Lambeth - Labour administration
Turnout 30.4%; 3.3% swing from Liberal Democrat to Labour
2006 2002
Party Votes % Seats Party Votes % Seats
Labour 71,725 39.7 39 Labour 57,967 39.8 28Liberal Democrat 52,480 29.0 17 Liberal Democrat 52,209 35.9 28Conservative 34,667 19.2 6 Conservative 26,081 17.9 7Green 17,560 9.7 1 Green 7,948 5.5 —Local Educ’n Action by Parents 2,045 1.1 — Socialist Alliance 1,178 0.8 —
Independent 1,055 0.6 — Independent 143 0.1 —Respect - The Unity Coalition 778 0.4 — UK Independence Party 53 0.0 —The Socialist Party 139 0.1 — UK Independence Party 112 0.1 — English Democrats 108 0.1 —
Total 180,669 100.0 63 Total 145,579 100.0 63
2006 Ward ResultsConservativeChristian People’s AllianceGreen PartyLabour/Labour and Cooperative PartyLiberal DemocratResidents’ Association/Independent ResidentsRespect - the Unity Coalition
Conservative/LabourConservative/Liberal DemocratConservative/OtherLabour/Liberal DemocratLabour/Other3-way split
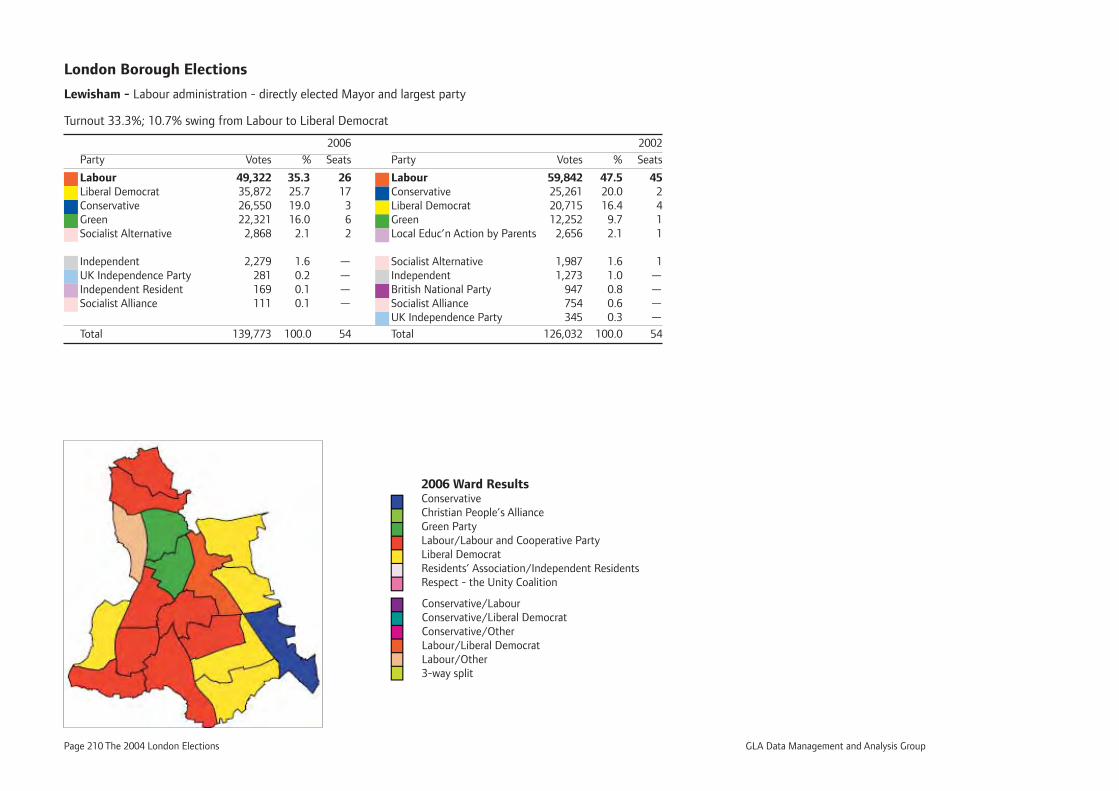
Page 210 The 2004 London Elections GLA Data Management and Analysis Group
London Borough Elections
Lewisham - Labour administration - directly elected Mayor and largest party
Turnout 33.3%; 10.7% swing from Labour to Liberal Democrat
2006 2002
Party Votes % Seats Party Votes % Seats
Labour 49,322 35.3 26 Labour 59,842 47.5 45Liberal Democrat 35,872 25.7 17 Conservative 25,261 20.0 2Conservative 26,550 19.0 3 Liberal Democrat 20,715 16.4 4Green 22,321 16.0 6 Green 12,252 9.7 1Socialist Alternative 2,868 2.1 2 Local Educ’n Action by Parents 2,656 2.1 1
Independent 2,279 1.6 — Socialist Alternative 1,987 1.6 1UK Independence Party 281 0.2 — Independent 1,273 1.0 —Independent Resident 169 0.1 — British National Party 947 0.8 —Socialist Alliance 111 0.1 — Socialist Alliance 754 0.6 — UK Independence Party 345 0.3 —
Total 139,773 100.0 54 Total 126,032 100.0 54
2006 Ward ResultsConservativeChristian People’s AllianceGreen PartyLabour/Labour and Cooperative PartyLiberal DemocratResidents’ Association/Independent ResidentsRespect - the Unity Coalition
Conservative/LabourConservative/Liberal DemocratConservative/OtherLabour/Liberal DemocratLabour/Other3-way split
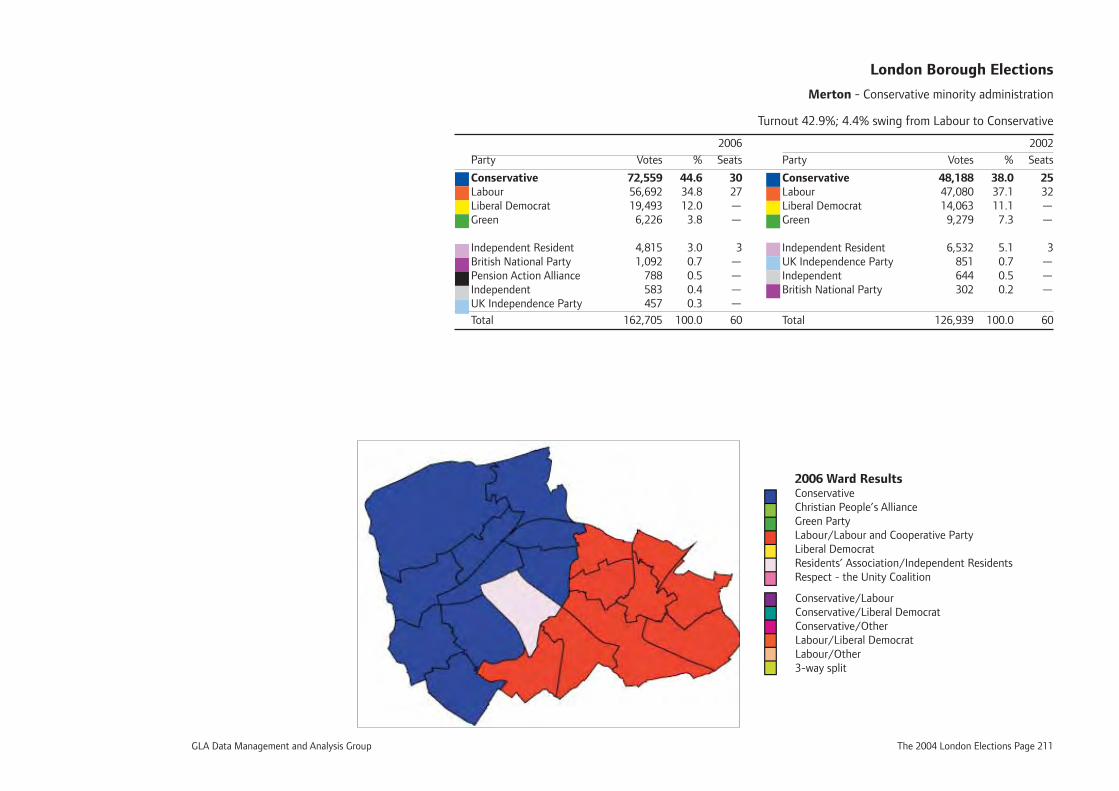
GLA Data Management and Analysis Group The 2004 London Elections Page 211
London Borough Elections
Merton - Conservative minority administration
Turnout 42.9%; 4.4% swing from Labour to Conservative
2006 2002
Party Votes % Seats Party Votes % Seats
Conservative 72,559 44.6 30 Conservative 48,188 38.0 25Labour 56,692 34.8 27 Labour 47,080 37.1 32Liberal Democrat 19,493 12.0 — Liberal Democrat 14,063 11.1 —Green 6,226 3.8 — Green 9,279 7.3 —
Independent Resident 4,815 3.0 3 Independent Resident 6,532 5.1 3British National Party 1,092 0.7 — UK Independence Party 851 0.7 —Pension Action Alliance 788 0.5 — Independent 644 0.5 —Independent 583 0.4 — British National Party 302 0.2 —UK Independence Party 457 0.3 —
Total 162,705 100.0 60 Total 126,939 100.0 60
2006 Ward ResultsConservativeChristian People’s AllianceGreen PartyLabour/Labour and Cooperative PartyLiberal DemocratResidents’ Association/Independent ResidentsRespect - the Unity Coalition
Conservative/LabourConservative/Liberal DemocratConservative/OtherLabour/Liberal DemocratLabour/Other3-way split
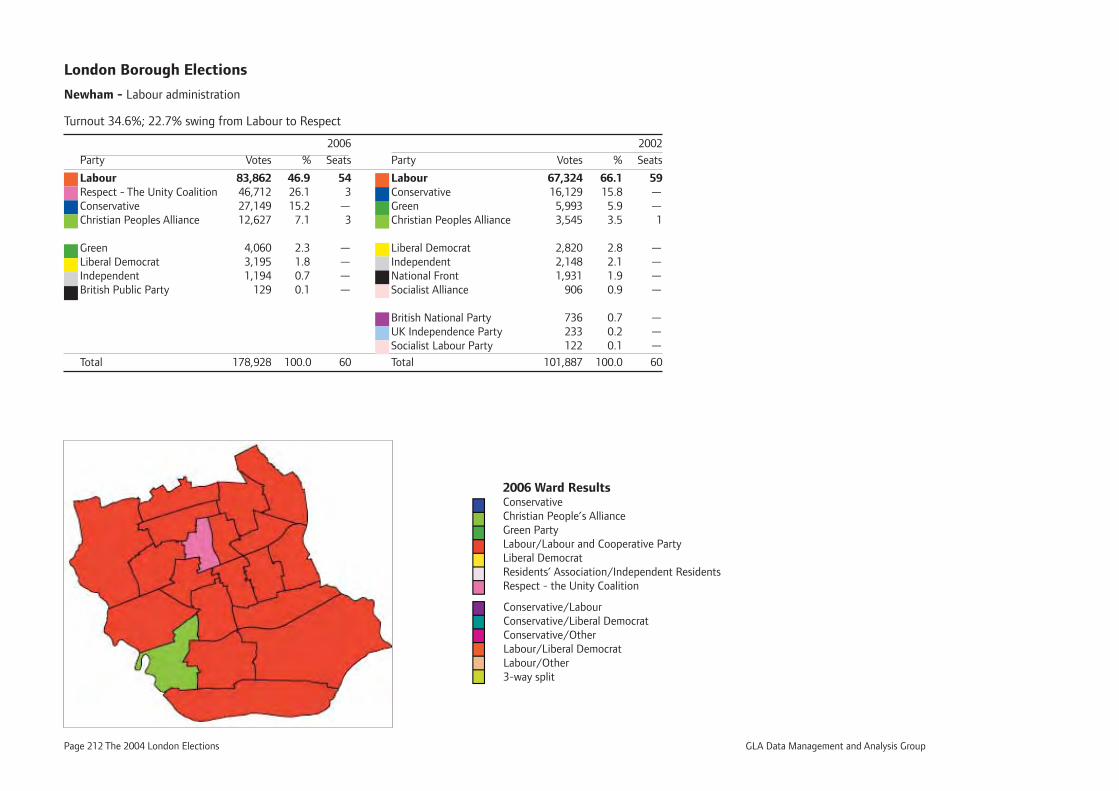
Page 212 The 2004 London Elections GLA Data Management and Analysis Group
London Borough Elections
Newham - Labour administration
Turnout 34.6%; 22.7% swing from Labour to Respect
2006 2002
Party Votes % Seats Party Votes % Seats
Labour 83,862 46.9 54 Labour 67,324 66.1 59Respect - The Unity Coalition 46,712 26.1 3 Conservative 16,129 15.8 —Conservative 27,149 15.2 — Green 5,993 5.9 —Christian Peoples Alliance 12,627 7.1 3 Christian Peoples Alliance 3,545 3.5 1
Green 4,060 2.3 — Liberal Democrat 2,820 2.8 —Liberal Democrat 3,195 1.8 — Independent 2,148 2.1 —Independent 1,194 0.7 — National Front 1,931 1.9 —British Public Party 129 0.1 — Socialist Alliance 906 0.9 —
British National Party 736 0.7 — UK Independence Party 233 0.2 — Socialist Labour Party 122 0.1 —
Total 178,928 100.0 60 Total 101,887 100.0 60
2006 Ward ResultsConservativeChristian People’s AllianceGreen PartyLabour/Labour and Cooperative PartyLiberal DemocratResidents’ Association/Independent ResidentsRespect - the Unity Coalition
Conservative/LabourConservative/Liberal DemocratConservative/OtherLabour/Liberal DemocratLabour/Other3-way split
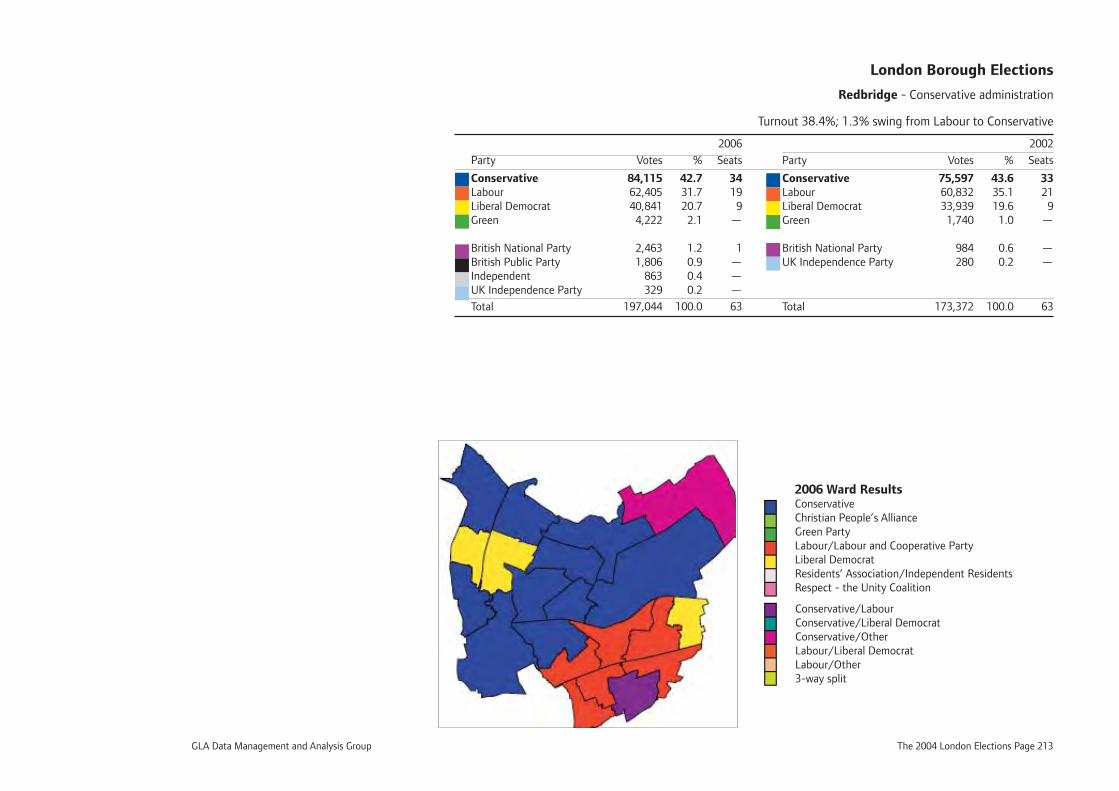
GLA Data Management and Analysis Group The 2004 London Elections Page 213
London Borough Elections
Redbridge - Conservative administration
Turnout 38.4%; 1.3% swing from Labour to Conservative
2006 2002
Party Votes % Seats Party Votes % Seats
Conservative 84,115 42.7 34 Conservative 75,597 43.6 33Labour 62,405 31.7 19 Labour 60,832 35.1 21Liberal Democrat 40,841 20.7 9 Liberal Democrat 33,939 19.6 9Green 4,222 2.1 — Green 1,740 1.0 —
British National Party 2,463 1.2 1 British National Party 984 0.6 —British Public Party 1,806 0.9 — UK Independence Party 280 0.2 —Independent 863 0.4 — UK Independence Party 329 0.2 —
Total 197,044 100.0 63 Total 173,372 100.0 63
2006 Ward ResultsConservativeChristian People’s AllianceGreen PartyLabour/Labour and Cooperative PartyLiberal DemocratResidents’ Association/Independent ResidentsRespect - the Unity Coalition
Conservative/LabourConservative/Liberal DemocratConservative/OtherLabour/Liberal DemocratLabour/Other3-way split
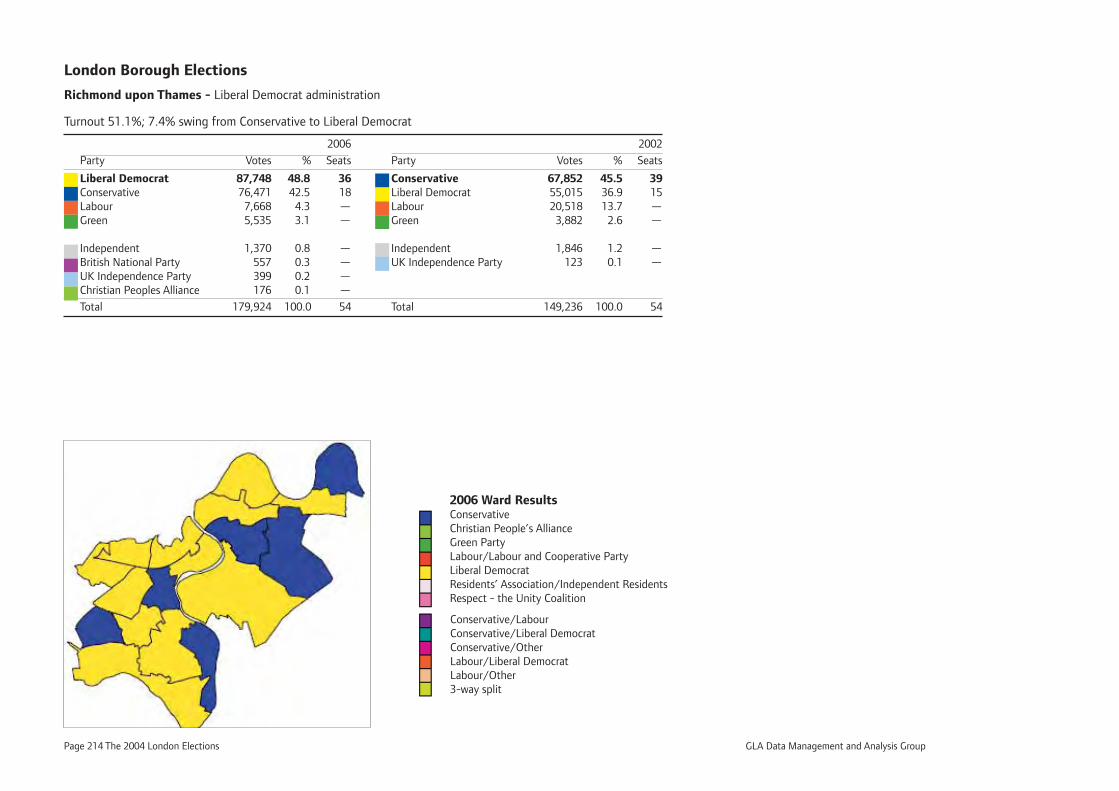
Page 214 The 2004 London Elections GLA Data Management and Analysis Group
London Borough Elections
Richmond upon Thames - Liberal Democrat administration
Turnout 51.1%; 7.4% swing from Conservative to Liberal Democrat
2006 2002
Party Votes % Seats Party Votes % Seats
Liberal Democrat 87,748 48.8 36 Conservative 67,852 45.5 39Conservative 76,471 42.5 18 Liberal Democrat 55,015 36.9 15Labour 7,668 4.3 — Labour 20,518 13.7 —Green 5,535 3.1 — Green 3,882 2.6 —
Independent 1,370 0.8 — Independent 1,846 1.2 —British National Party 557 0.3 — UK Independence Party 123 0.1 —UK Independence Party 399 0.2 — Christian Peoples Alliance 176 0.1 —
Total 179,924 100.0 54 Total 149,236 100.0 54
2006 Ward ResultsConservativeChristian People’s AllianceGreen PartyLabour/Labour and Cooperative PartyLiberal DemocratResidents’ Association/Independent ResidentsRespect - the Unity Coalition
Conservative/LabourConservative/Liberal DemocratConservative/OtherLabour/Liberal DemocratLabour/Other3-way split
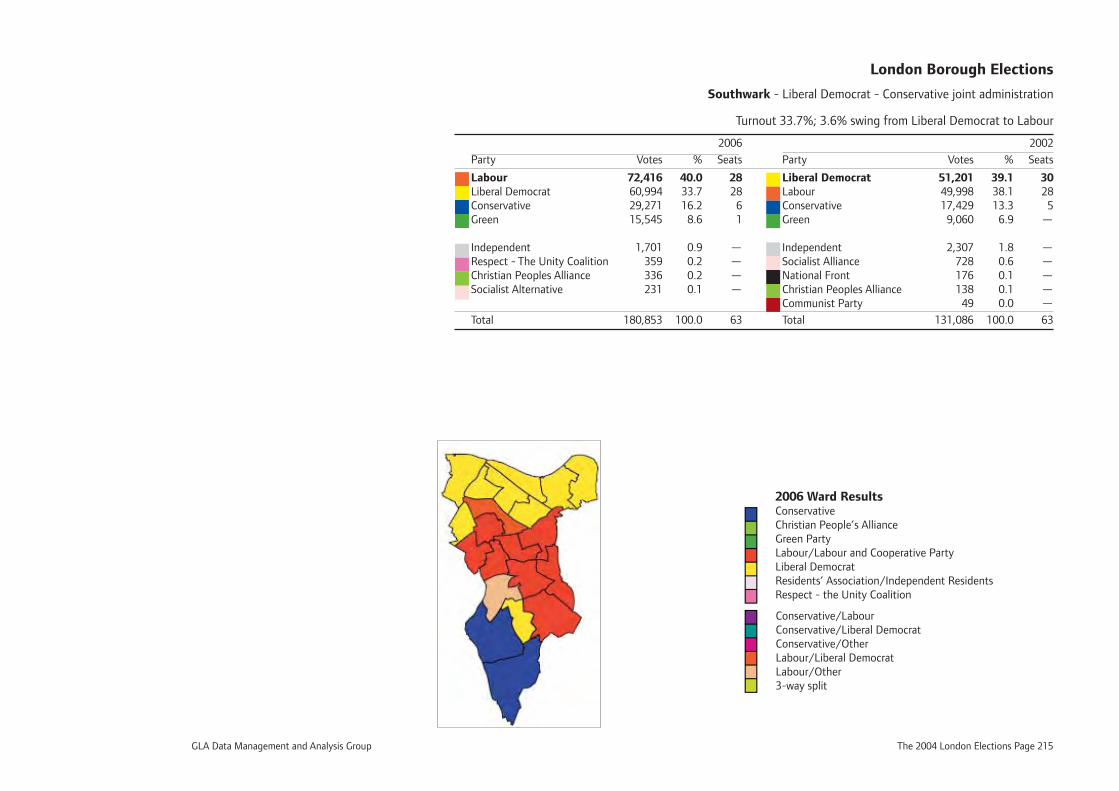
GLA Data Management and Analysis Group The 2004 London Elections Page 215
London Borough Elections
Southwark - Liberal Democrat - Conservative joint administration
Turnout 33.7%; 3.6% swing from Liberal Democrat to Labour
2006 2002
Party Votes % Seats Party Votes % Seats
Labour 72,416 40.0 28 Liberal Democrat 51,201 39.1 30Liberal Democrat 60,994 33.7 28 Labour 49,998 38.1 28Conservative 29,271 16.2 6 Conservative 17,429 13.3 5Green 15,545 8.6 1 Green 9,060 6.9 —
Independent 1,701 0.9 — Independent 2,307 1.8 —Respect - The Unity Coalition 359 0.2 — Socialist Alliance 728 0.6 —Christian Peoples Alliance 336 0.2 — National Front 176 0.1 —Socialist Alternative 231 0.1 — Christian Peoples Alliance 138 0.1 — Communist Party 49 0.0 —
Total 180,853 100.0 63 Total 131,086 100.0 63
2006 Ward ResultsConservativeChristian People’s AllianceGreen PartyLabour/Labour and Cooperative PartyLiberal DemocratResidents’ Association/Independent ResidentsRespect - the Unity Coalition
Conservative/LabourConservative/Liberal DemocratConservative/OtherLabour/Liberal DemocratLabour/Other3-way split
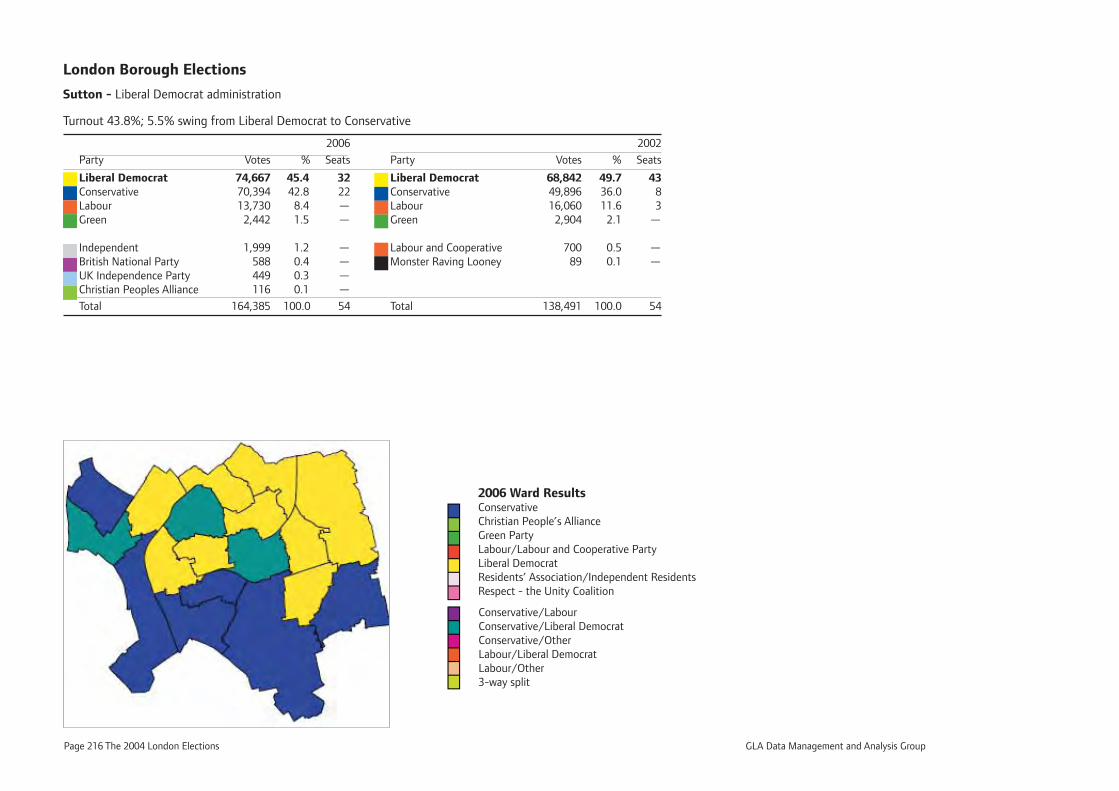
Page 216 The 2004 London Elections GLA Data Management and Analysis Group
London Borough Elections
Sutton - Liberal Democrat administration
Turnout 43.8%; 5.5% swing from Liberal Democrat to Conservative
2006 2002
Party Votes % Seats Party Votes % Seats
Liberal Democrat 74,667 45.4 32 Liberal Democrat 68,842 49.7 43Conservative 70,394 42.8 22 Conservative 49,896 36.0 8Labour 13,730 8.4 — Labour 16,060 11.6 3Green 2,442 1.5 — Green 2,904 2.1 —
Independent 1,999 1.2 — Labour and Cooperative 700 0.5 —British National Party 588 0.4 — Monster Raving Looney 89 0.1 —UK Independence Party 449 0.3 — Christian Peoples Alliance 116 0.1 —
Total 164,385 100.0 54 Total 138,491 100.0 54
2006 Ward ResultsConservativeChristian People’s AllianceGreen PartyLabour/Labour and Cooperative PartyLiberal DemocratResidents’ Association/Independent ResidentsRespect - the Unity Coalition
Conservative/LabourConservative/Liberal DemocratConservative/OtherLabour/Liberal DemocratLabour/Other3-way split
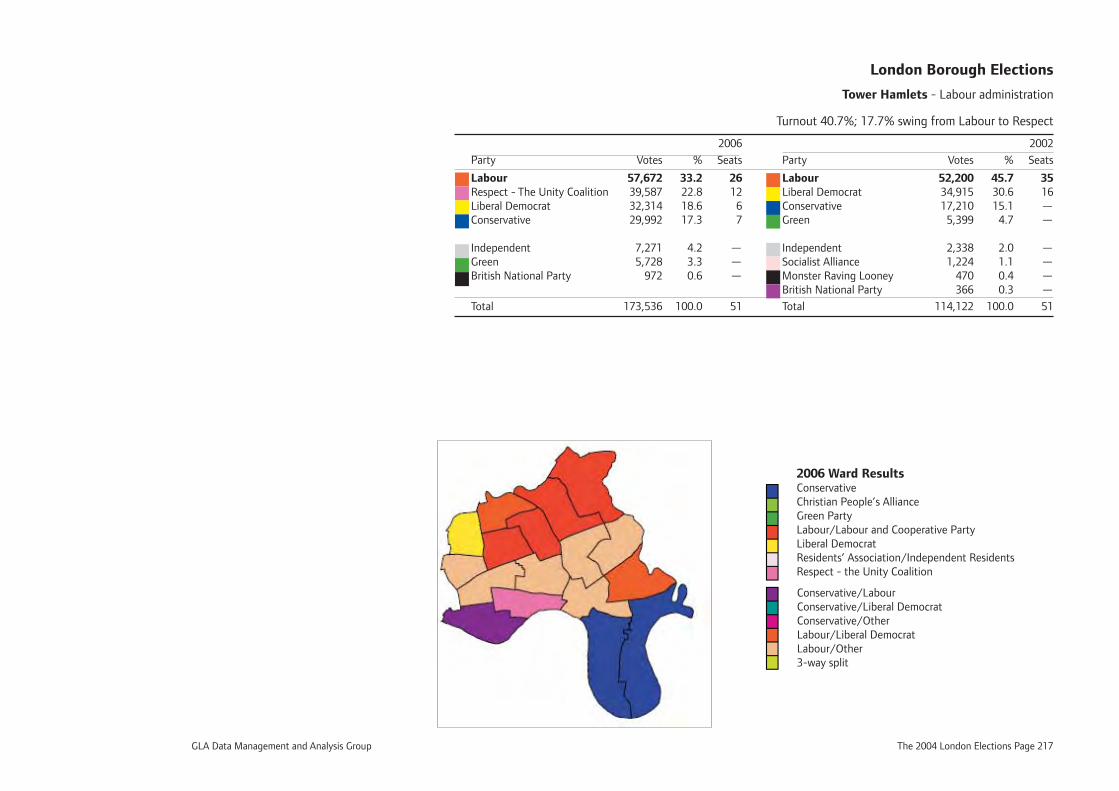
GLA Data Management and Analysis Group The 2004 London Elections Page 217
London Borough Elections
Tower Hamlets - Labour administration
Turnout 40.7%; 17.7% swing from Labour to Respect
2006 2002
Party Votes % Seats Party Votes % Seats
Labour 57,672 33.2 26 Labour 52,200 45.7 35Respect - The Unity Coalition 39,587 22.8 12 Liberal Democrat 34,915 30.6 16Liberal Democrat 32,314 18.6 6 Conservative 17,210 15.1 —Conservative 29,992 17.3 7 Green 5,399 4.7 —
Independent 7,271 4.2 — Independent 2,338 2.0 —Green 5,728 3.3 — Socialist Alliance 1,224 1.1 —British National Party 972 0.6 — Monster Raving Looney 470 0.4 — British National Party 366 0.3 —
Total 173,536 100.0 51 Total 114,122 100.0 51
2006 Ward ResultsConservativeChristian People’s AllianceGreen PartyLabour/Labour and Cooperative PartyLiberal DemocratResidents’ Association/Independent ResidentsRespect - the Unity Coalition
Conservative/LabourConservative/Liberal DemocratConservative/OtherLabour/Liberal DemocratLabour/Other3-way split
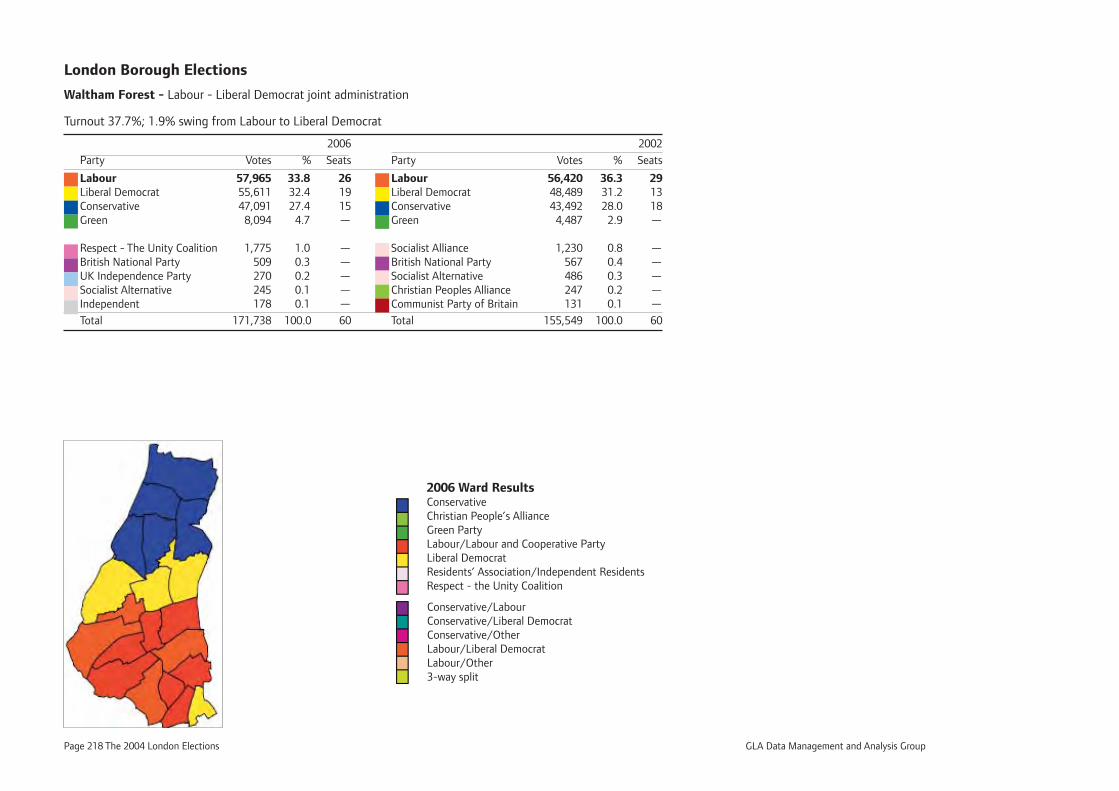
Page 218 The 2004 London Elections GLA Data Management and Analysis Group
London Borough Elections
Waltham Forest - Labour - Liberal Democrat joint administration
Turnout 37.7%; 1.9% swing from Labour to Liberal Democrat
2006 2002
Party Votes % Seats Party Votes % Seats
Labour 57,965 33.8 26 Labour 56,420 36.3 29Liberal Democrat 55,611 32.4 19 Liberal Democrat 48,489 31.2 13Conservative 47,091 27.4 15 Conservative 43,492 28.0 18Green 8,094 4.7 — Green 4,487 2.9 —
Respect - The Unity Coalition 1,775 1.0 — Socialist Alliance 1,230 0.8 —British National Party 509 0.3 — British National Party 567 0.4 —UK Independence Party 270 0.2 — Socialist Alternative 486 0.3 —Socialist Alternative 245 0.1 — Christian Peoples Alliance 247 0.2 —Independent 178 0.1 — Communist Party of Britain 131 0.1 —
Total 171,738 100.0 60 Total 155,549 100.0 60
2006 Ward ResultsConservativeChristian People’s AllianceGreen PartyLabour/Labour and Cooperative PartyLiberal DemocratResidents’ Association/Independent ResidentsRespect - the Unity Coalition
Conservative/LabourConservative/Liberal DemocratConservative/OtherLabour/Liberal DemocratLabour/Other3-way split
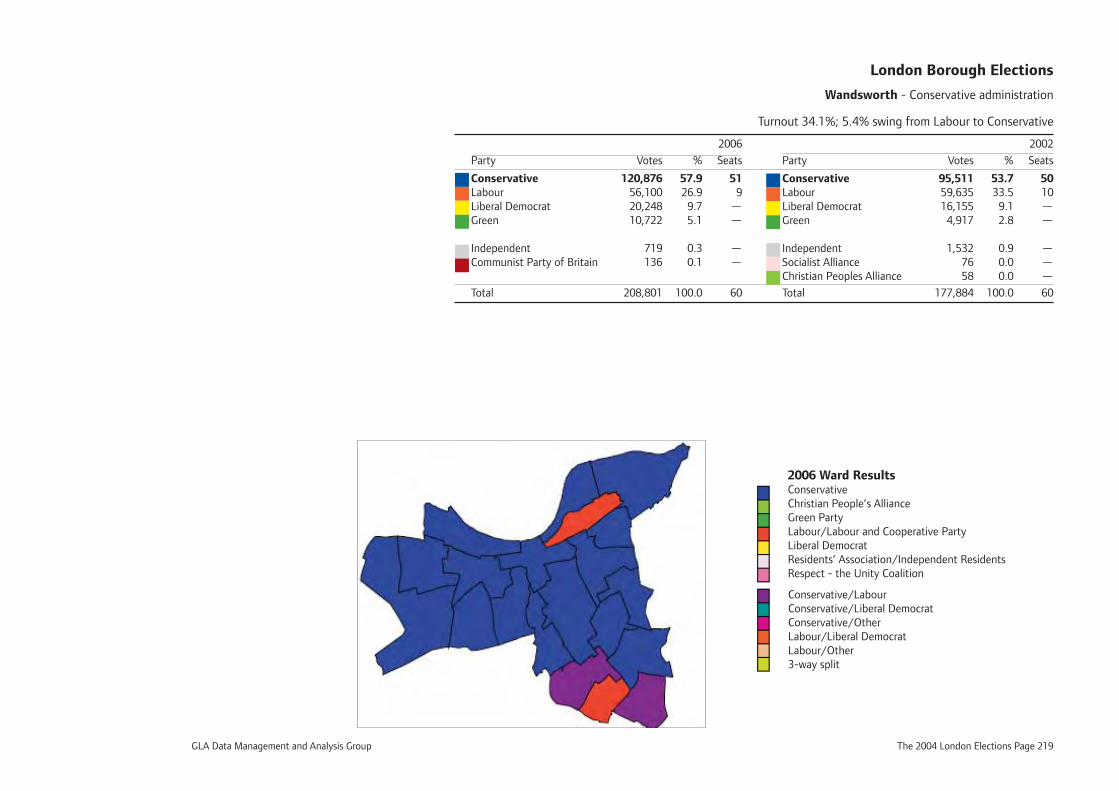
GLA Data Management and Analysis Group The 2004 London Elections Page 219
London Borough Elections
Wandsworth - Conservative administration
Turnout 34.1%; 5.4% swing from Labour to Conservative
2006 2002
Party Votes % Seats Party Votes % Seats
Conservative 120,876 57.9 51 Conservative 95,511 53.7 50Labour 56,100 26.9 9 Labour 59,635 33.5 10Liberal Democrat 20,248 9.7 — Liberal Democrat 16,155 9.1 —Green 10,722 5.1 — Green 4,917 2.8 —
Independent 719 0.3 — Independent 1,532 0.9 —Communist Party of Britain 136 0.1 — Socialist Alliance 76 0.0 — Christian Peoples Alliance 58 0.0 —
Total 208,801 100.0 60 Total 177,884 100.0 60
2006 Ward ResultsConservativeChristian People’s AllianceGreen PartyLabour/Labour and Cooperative PartyLiberal DemocratResidents’ Association/Independent ResidentsRespect - the Unity Coalition
Conservative/LabourConservative/Liberal DemocratConservative/OtherLabour/Liberal DemocratLabour/Other3-way split
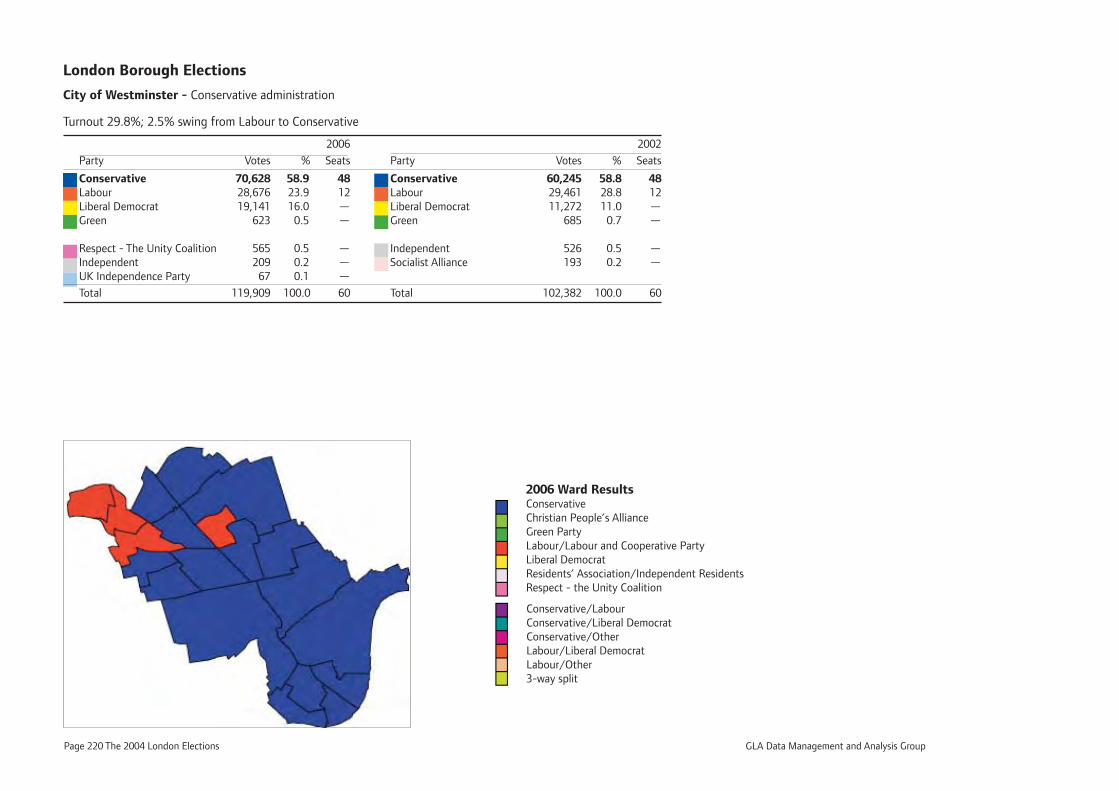
Page 220 The 2004 London Elections GLA Data Management and Analysis Group
London Borough Elections
City of Westminster - Conservative administration
Turnout 29.8%; 2.5% swing from Labour to Conservative
2006 2002
Party Votes % Seats Party Votes % Seats
Conservative 70,628 58.9 48 Conservative 60,245 58.8 48Labour 28,676 23.9 12 Labour 29,461 28.8 12Liberal Democrat 19,141 16.0 — Liberal Democrat 11,272 11.0 —Green 623 0.5 — Green 685 0.7 —
Respect - The Unity Coalition 565 0.5 — Independent 526 0.5 —Independent 209 0.2 — Socialist Alliance 193 0.2 —UK Independence Party 67 0.1 —
Total 119,909 100.0 60 Total 102,382 100.0 60
2006 Ward ResultsConservativeChristian People’s AllianceGreen PartyLabour/Labour and Cooperative PartyLiberal DemocratResidents’ Association/Independent ResidentsRespect - the Unity Coalition
Conservative/LabourConservative/Liberal DemocratConservative/OtherLabour/Liberal DemocratLabour/Other3-way split
GLA Data Management and Analysis Group The 2004 London Elections Page 221
Appendix

Page 222 The 2004 London Elections GLA Data Management and Analysis Group
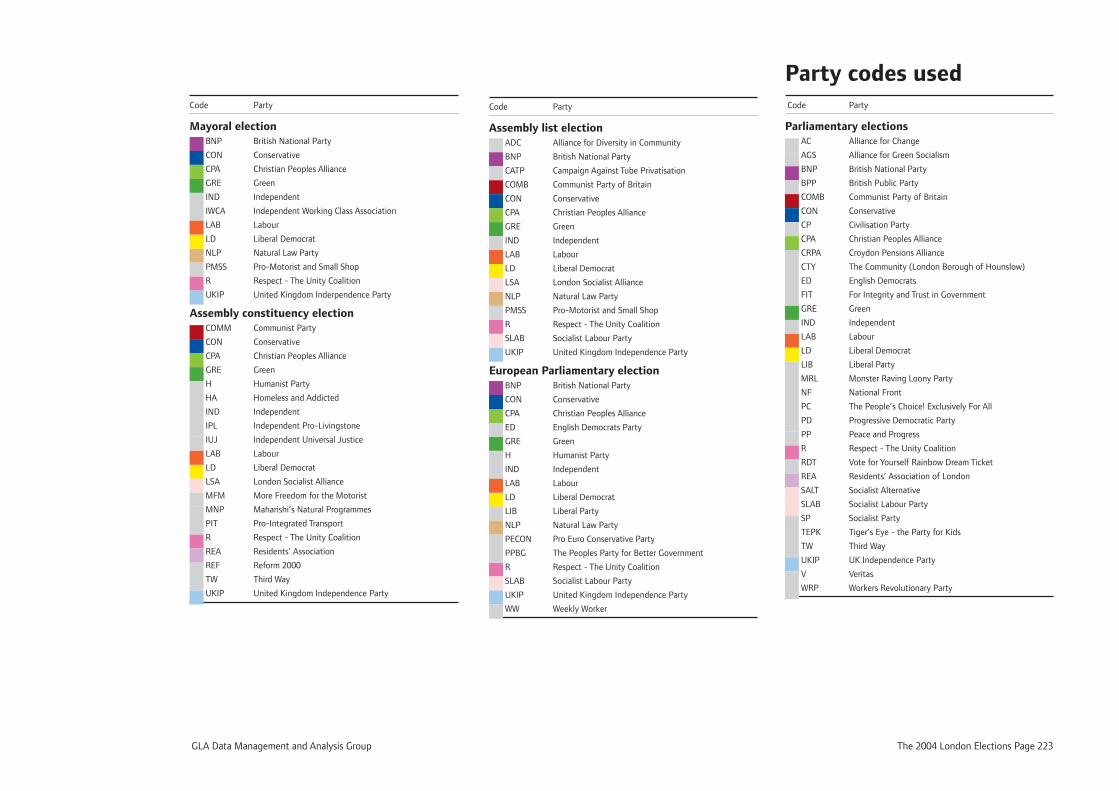
GLA Data Management and Analysis Group The 2004 London Elections Page 223
Code Party
Mayoral election BNP British National Party
CON Conservative
CPA Christian Peoples Alliance
GRE Green
IND Independent
IWCA Independent Working Class Association
LAB Labour
LD Liberal Democrat
NLP Natural Law Party
PMSS Pro-Motorist and Small Shop
R Respect - The Unity Coalition
UKIP United Kingdom Inderpendence Party
Assembly constituency election COMM Communist Party
CON Conservative
CPA Christian Peoples Alliance
GRE Green
H Humanist Party
HA Homeless and Addicted
IND Independent
IPL Independent Pro-Livingstone
IUJ Independent Universal Justice
LAB Labour
LD Liberal Democrat
LSA London Socialist Alliance
MFM More Freedom for the Motorist
MNP Maharishi’s Natural Programmes
PIT Pro-Integrated Transport
R Respect - The Unity Coalition
REA Residents’ Association
REF Reform 2000
TW Third Way
UKIP United Kingdom Independence Party
Code Party
Assembly list election ADC Alliance for Diversity in Community
BNP British National Party
CATP Campaign Against Tube Privatisation
COMB Communist Party of Britain
CON Conservative
CPA Christian Peoples Alliance
GRE Green
IND Independent
LAB Labour
LD Liberal Democrat
LSA London Socialist Alliance
NLP Natural Law Party
PMSS Pro-Motorist and Small Shop
R Respect - The Unity Coalition
SLAB Socialist Labour Party
UKIP United Kingdom Independence Party
European Parliamentary election BNP British National Party
CON Conservative
CPA Christian Peoples Alliance
ED English Democrats Party
GRE Green
H Humanist Party
IND Independent
LAB Labour
LD Liberal Democrat
LIB Liberal Party
NLP Natural Law Party
PECON Pro Euro Conservative Party
PPBG The Peoples Party for Better Government
R Respect - The Unity Coalition
SLAB Socialist Labour Party
UKIP United Kingdom Independence Party
WW Weekly Worker
Party codes used Code Party
Parliamentary elections AC Alliance for Change
AGS Alliance for Green Socialism
BNP British National Party
BPP British Public Party
COMB Communist Party of Britain
CON Conservative
CP Civilisation Party
CPA Christian Peoples Alliance
CRPA Croydon Pensions Alliance
CTY The Community (London Borough of Hounslow)
ED English Democrats
FIT For Integrity and Trust in Government
GRE Green
IND Independent
LAB Labour
LD Liberal Democrat
LIB Liberal Party
MRL Monster Raving Loony Party
NF National Front
PC The People’s Choice! Exclusively For All
PD Progressive Democratic Party
PP Peace and Progress
R Respect - The Unity Coalition
RDT Vote for Yourself Rainbow Dream Ticket
REA Residents’ Association of London
SALT Socialist Alternative
SLAB Socialist Labour Party
SP Socialist Party
TEPK Tiger’s Eye - the Party for Kids
TW Third Way
UKIP UK Independence Party
V Veritas
WRP Workers Revolutionary Party
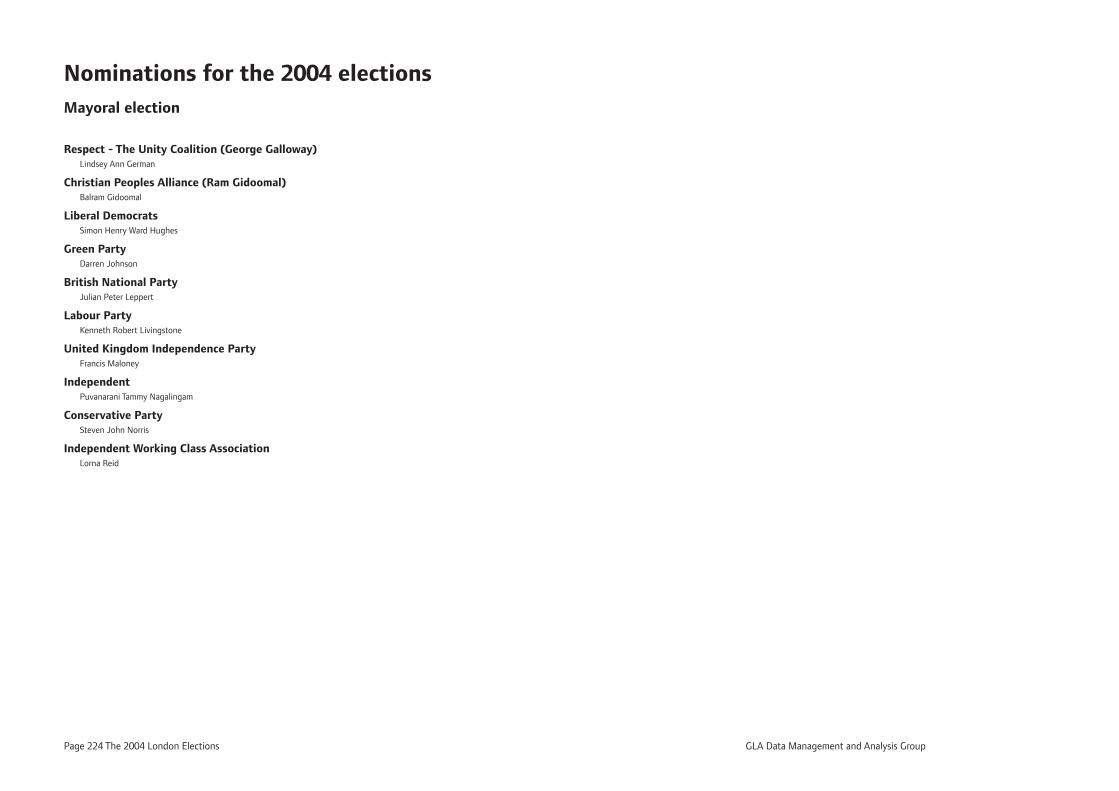
Page 224 The 2004 London Elections GLA Data Management and Analysis Group
Nominations for the 2004 electionsMayoral election
Respect - The Unity Coalition (George Galloway) Lindsey Ann German
Christian Peoples Alliance (Ram Gidoomal) Balram Gidoomal
Liberal Democrats Simon Henry Ward Hughes
Green Party Darren Johnson
British National Party Julian Peter Leppert
Labour Party Kenneth Robert Livingstone
United Kingdom Independence Party Francis Maloney
Independent Puvanarani Tammy Nagalingam
Conservative Party Steven John Norris
Independent Working Class Association Lorna Reid
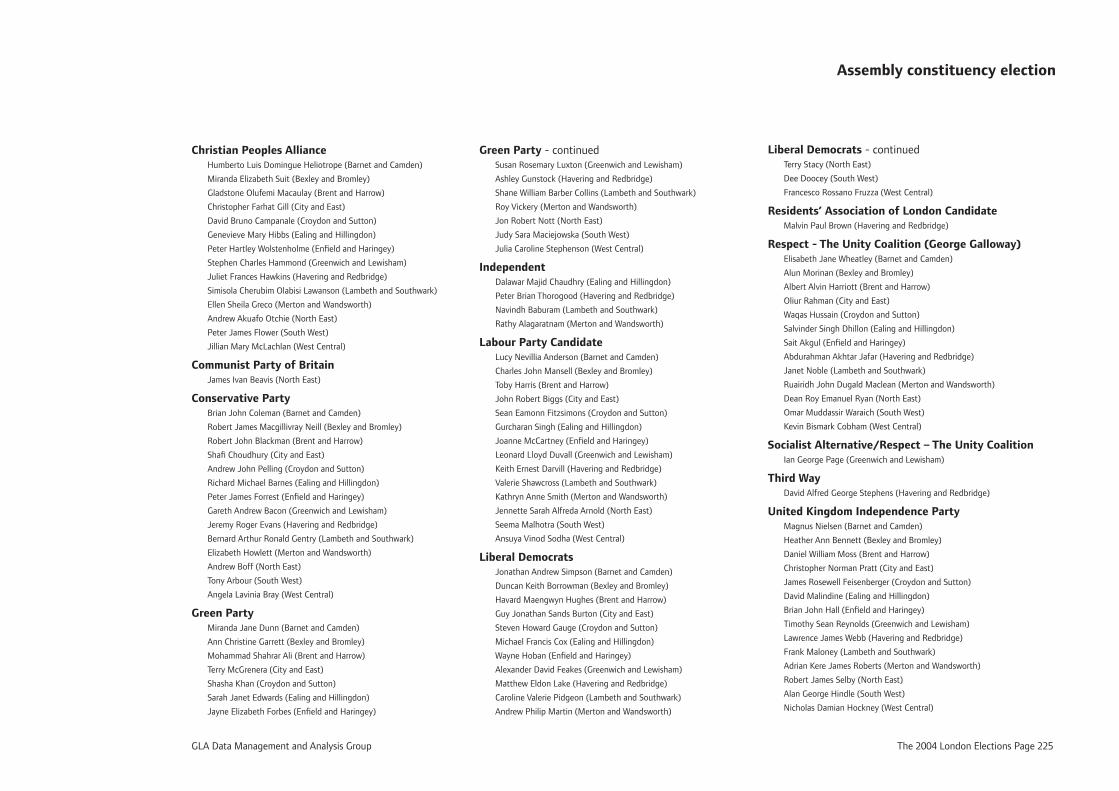
GLA Data Management and Analysis Group The 2004 London Elections Page 225
Assembly constituency election
Christian Peoples Alliance Humberto Luis Domingue Heliotrope (Barnet and Camden)
Miranda Elizabeth Suit (Bexley and Bromley)
Gladstone Olufemi Macaulay (Brent and Harrow)
Christopher Farhat Gill (City and East)
David Bruno Campanale (Croydon and Sutton)
Genevieve Mary Hibbs (Ealing and Hillingdon)
Peter Hartley Wolstenholme (Enfi eld and Haringey)
Stephen Charles Hammond (Greenwich and Lewisham)
Juliet Frances Hawkins (Havering and Redbridge)
Simisola Cherubim Olabisi Lawanson (Lambeth and Southwark)
Ellen Sheila Greco (Merton and Wandsworth)
Andrew Akuafo Otchie (North East)
Peter James Flower (South West)
Jillian Mary McLachlan (West Central)
Communist Party of Britain James Ivan Beavis (North East)
Conservative Party Brian John Coleman (Barnet and Camden)
Robert James Macgillivray Neill (Bexley and Bromley)
Robert John Blackman (Brent and Harrow)
Shafi Choudhury (City and East)
Andrew John Pelling (Croydon and Sutton)
Richard Michael Barnes (Ealing and Hillingdon)
Peter James Forrest (Enfi eld and Haringey)
Gareth Andrew Bacon (Greenwich and Lewisham)
Jeremy Roger Evans (Havering and Redbridge)
Bernard Arthur Ronald Gentry (Lambeth and Southwark)
Elizabeth Howlett (Merton and Wandsworth)
Andrew Boff (North East)
Tony Arbour (South West)
Angela Lavinia Bray (West Central)
Green Party Miranda Jane Dunn (Barnet and Camden)
Ann Christine Garrett (Bexley and Bromley)
Mohammad Shahrar Ali (Brent and Harrow)
Terry McGrenera (City and East)
Shasha Khan (Croydon and Sutton)
Sarah Janet Edwards (Ealing and Hillingdon)
Jayne Elizabeth Forbes (Enfi eld and Haringey)
Green Party - continued Susan Rosemary Luxton (Greenwich and Lewisham)
Ashley Gunstock (Havering and Redbridge)
Shane William Barber Collins (Lambeth and Southwark)
Roy Vickery (Merton and Wandsworth)
Jon Robert Nott (North East)
Judy Sara Maciejowska (South West)
Julia Caroline Stephenson (West Central)
Independent Dalawar Majid Chaudhry (Ealing and Hillingdon)
Peter Brian Thorogood (Havering and Redbridge)
Navindh Baburam (Lambeth and Southwark)
Rathy Alagaratnam (Merton and Wandsworth)
Labour Party Candidate Lucy Nevillia Anderson (Barnet and Camden)
Charles John Mansell (Bexley and Bromley)
Toby Harris (Brent and Harrow)
John Robert Biggs (City and East)
Sean Eamonn Fitzsimons (Croydon and Sutton)
Gurcharan Singh (Ealing and Hillingdon)
Joanne McCartney (Enfi eld and Haringey)
Leonard Lloyd Duvall (Greenwich and Lewisham)
Keith Ernest Darvill (Havering and Redbridge)
Valerie Shawcross (Lambeth and Southwark)
Kathryn Anne Smith (Merton and Wandsworth)
Jennette Sarah Alfreda Arnold (North East)
Seema Malhotra (South West)
Ansuya Vinod Sodha (West Central)
Liberal Democrats Jonathan Andrew Simpson (Barnet and Camden)
Duncan Keith Borrowman (Bexley and Bromley)
Havard Maengwyn Hughes (Brent and Harrow)
Guy Jonathan Sands Burton (City and East)
Steven Howard Gauge (Croydon and Sutton)
Michael Francis Cox (Ealing and Hillingdon)
Wayne Hoban (Enfi eld and Haringey)
Alexander David Feakes (Greenwich and Lewisham)
Matthew Eldon Lake (Havering and Redbridge)
Caroline Valerie Pidgeon (Lambeth and Southwark)
Andrew Philip Martin (Merton and Wandsworth)
Liberal Democrats - continued Terry Stacy (North East)
Dee Doocey (South West)
Francesco Rossano Fruzza (West Central)
Residents’ Association of London Candidate Malvin Paul Brown (Havering and Redbridge)
Respect - The Unity Coalition (George Galloway) Elisabeth Jane Wheatley (Barnet and Camden)
Alun Morinan (Bexley and Bromley)
Albert Alvin Harriott (Brent and Harrow)
Oliur Rahman (City and East)
Waqas Hussain (Croydon and Sutton)
Salvinder Singh Dhillon (Ealing and Hillingdon)
Sait Akgul (Enfi eld and Haringey)
Abdurahman Akhtar Jafar (Havering and Redbridge)
Janet Noble (Lambeth and Southwark)
Ruairidh John Dugald Maclean (Merton and Wandsworth)
Dean Roy Emanuel Ryan (North East)
Omar Muddassir Waraich (South West)
Kevin Bismark Cobham (West Central)
Socialist Alternative/Respect – The Unity Coalition Ian George Page (Greenwich and Lewisham)
Third Way David Alfred George Stephens (Havering and Redbridge)
United Kingdom Independence Party Magnus Nielsen (Barnet and Camden)
Heather Ann Bennett (Bexley and Bromley)
Daniel William Moss (Brent and Harrow)
Christopher Norman Pratt (City and East)
James Rosewell Feisenberger (Croydon and Sutton)
David Malindine (Ealing and Hillingdon)
Brian John Hall (Enfi eld and Haringey)
Timothy Sean Reynolds (Greenwich and Lewisham)
Lawrence James Webb (Havering and Redbridge)
Frank Maloney (Lambeth and Southwark)
Adrian Kere James Roberts (Merton and Wandsworth)
Robert James Selby (North East)
Alan George Hindle (South West)
Nicholas Damian Hockney (West Central)
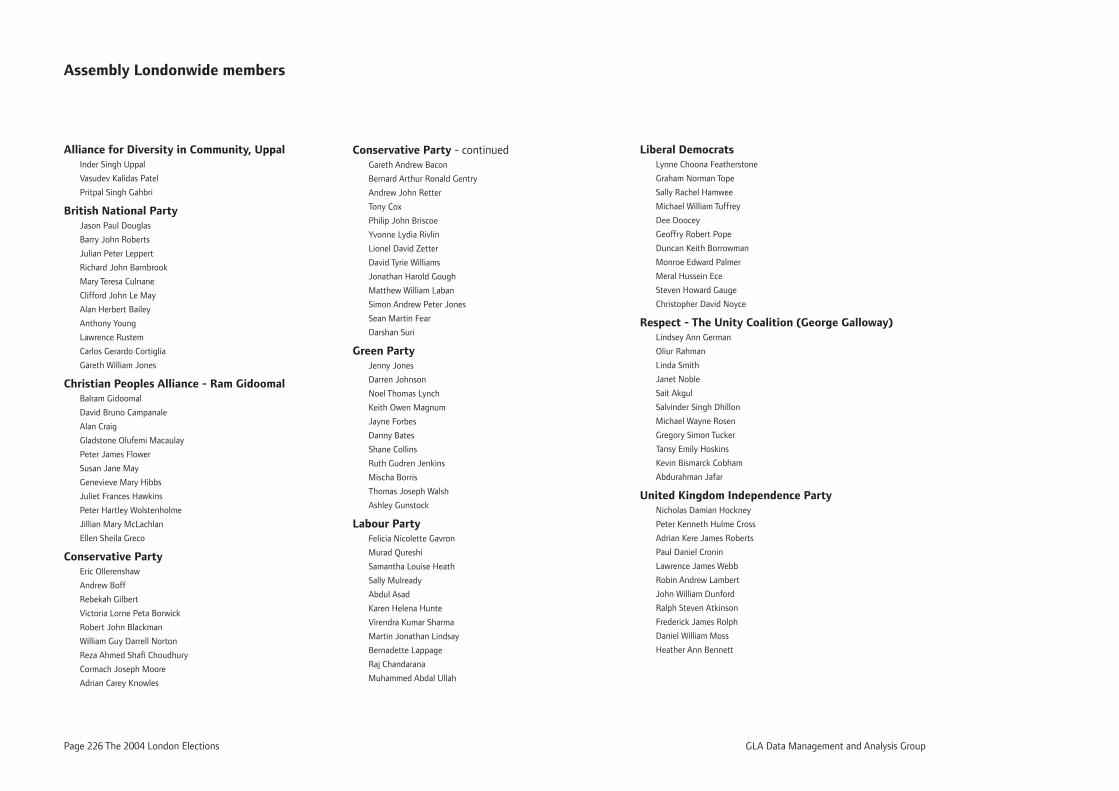
Page 226 The 2004 London Elections GLA Data Management and Analysis Group
Assembly Londonwide members
Alliance for Diversity in Community, Uppal Inder Singh Uppal
Vasudev Kalidas Patel
Pritpal Singh Gahbri
British National Party Jason Paul Douglas
Barry John Roberts
Julian Peter Leppert
Richard John Barnbrook
Mary Teresa Culnane
Clifford John Le May
Alan Herbert Bailey
Anthony Young
Lawrence Rustem
Carlos Gerardo Cortiglia
Gareth William Jones
Christian Peoples Alliance - Ram Gidoomal Balram Gidoomal
David Bruno Campanale
Alan Craig
Gladstone Olufemi Macaulay
Peter James Flower
Susan Jane May
Genevieve Mary Hibbs
Juliet Frances Hawkins
Peter Hartley Wolstenholme
Jillian Mary McLachlan
Ellen Sheila Greco
Conservative Party Eric Ollerenshaw
Andrew Boff
Rebekah Gilbert
Victoria Lorne Peta Borwick
Robert John Blackman
William Guy Darrell Norton
Reza Ahmed Shafi Choudhury
Cormach Joseph Moore
Adrian Carey Knowles
Conservative Party - continued Gareth Andrew Bacon
Bernard Arthur Ronald Gentry
Andrew John Retter
Tony Cox
Philip John Briscoe
Yvonne Lydia Rivlin
Lionel David Zetter
David Tyrie Williams
Jonathan Harold Gough
Matthew William Laban
Simon Andrew Peter Jones
Sean Martin Fear
Darshan Suri
Green Party Jenny Jones
Darren Johnson
Noel Thomas Lynch
Keith Owen Magnum
Jayne Forbes
Danny Bates
Shane Collins
Ruth Gudren Jenkins
Mischa Borris
Thomas Joseph Walsh
Ashley Gunstock
Labour Party Felicia Nicolette Gavron
Murad Qureshi
Samantha Louise Heath
Sally Mulready
Abdul Asad
Karen Helena Hunte
Virendra Kumar Sharma
Martin Jonathan Lindsay
Bernadette Lappage
Raj Chandarana
Muhammed Abdal Ullah
Liberal Democrats Lynne Choona Featherstone
Graham Norman Tope
Sally Rachel Hamwee
Michael William Tuffrey
Dee Doocey
Geoffry Robert Pope
Duncan Keith Borrowman
Monroe Edward Palmer
Meral Hussein Ece
Steven Howard Gauge
Christopher David Noyce
Respect - The Unity Coalition (George Galloway) Lindsey Ann German
Oliur Rahman
Linda Smith
Janet Noble
Sait Akgul
Salvinder Singh Dhillon
Michael Wayne Rosen
Gregory Simon Tucker
Tansy Emily Hoskins
Kevin Bismarck Cobham
Abdurahman Jafar
United Kingdom Independence Party Nicholas Damian Hockney
Peter Kenneth Hulme Cross
Adrian Kere James Roberts
Paul Daniel Cronin
Lawrence James Webb
Robin Andrew Lambert
John William Dunford
Ralph Steven Atkinson
Frederick James Rolph
Daniel William Moss
Heather Ann Bennett
GLA Data Management and Analysis Group The 2004 London Elections Page 227
British National Party Christopher Roberts
Mary Teresa Culnane
Lee John Barnes
James Edward Seadon
John Ernest Bowles
Jay Lee
John Alfred Evans
Alan Herbert Bailey
Lawrence Rustem
Christian Peoples Alliance - Ram Gidoomal Michael William Francis Elmer
Genevieve Mary Hibbs
Peter James Flower
Keith Anthony McLeod
Debra Smith-Gorick
Douglas Brian Lloyd Gibbons
Roger Edmund Glencross
Glenton Keith Downs
Conservative Party Theresa Anne Villiers
John Crocker Bowis
Timothy Charles Ayrton Tannock
Syed Salah Kamall
Richard Andrew Balfe
Ian David Twinn
Roseanne Serrelli
Heather Leigh Mendelsohn
Ashok Kumar
English Democrats Party Robin Charles William Tilbrook
Timothy Patrick Bragg
Terence Peter Brown
Robert Howells
Alan Gerald Sutton
Robert John Poulton
Green Party Jean Denise Lambert
Paul Martin Ingram
Judy Sara Maciejowska
Timothy Michael Turner
Christopher Paul Cotton
Douglas Earl
Shahrar Ali
Peter Budge
Joseph Healy
Liberal Democrats Sarah Ann Ludford
Jonathan Harold Fryer
John Christopher Courtenay Stevens
Dinti Wakefi eld
Ian Richard McDonald
Kishwer Falkner
Nigel Bakhai
Keith Moffi tt
Sandra Joy Lawman
Respect - The Unity Coalition (George Galloway) George Galloway
Unjum Mirza
Elaine Amanda Graham-Leigh
Paul Mackintosh Foot
Rita May Carter
John Anthony Mulrenan
Victoria Catherine Brittain
Gary Alexander Joseph McFarlane
Kenneth Charles Loach
Labour Party Claude Ajit Moraes
Mary Hilder Rosamund Honeyball
Robert John Emlyn Evans
Anita Jane Pollack
Hugh David Malyan
Stephanie Elizabeth Elsy
Munir Malik
Jane Rachael Briginshaw
Joseph Ejiofor
The Peoples Party for Better Government Christopher Moreton Richard Prior
United Kingdom Independence Party Gerald Joseph Batten
Nicholas Damian Hockney
Christopher Norman Pratt
John De Roeck
Anthony John Edward Scholefi eld
Janice Cronin
Kathleen Garner
Harun Khan
Ralph Steven Atkinson
European election
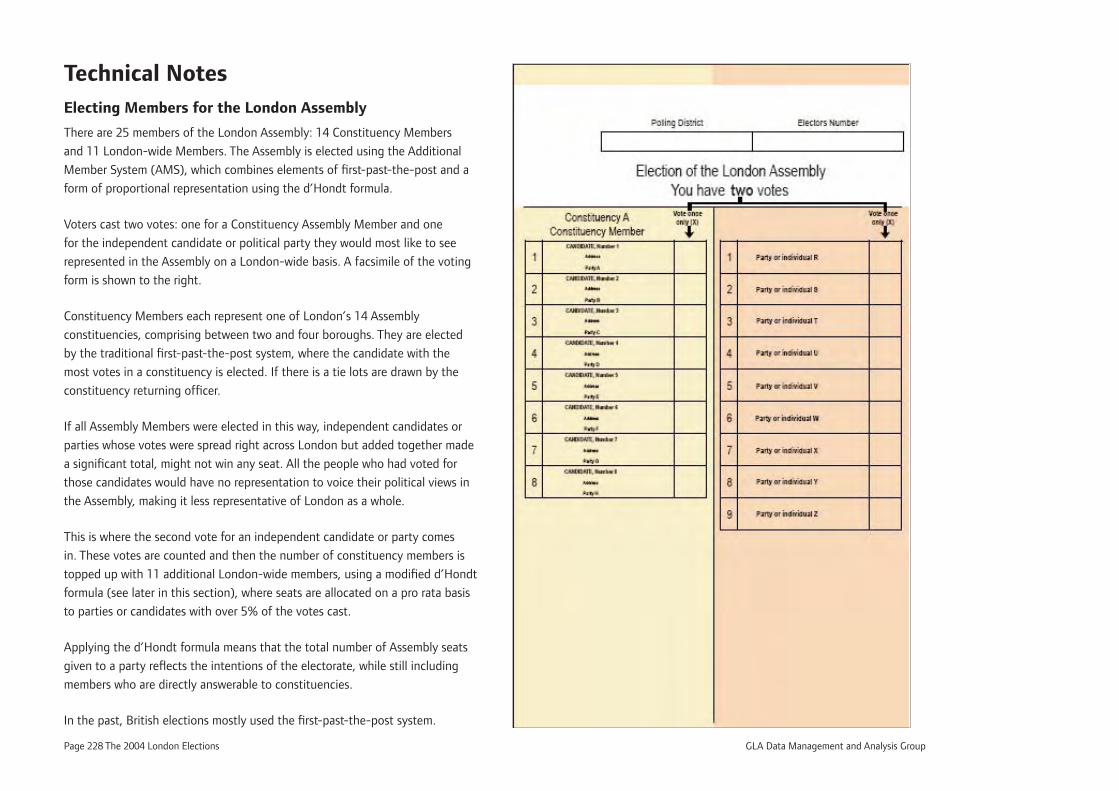
Page 228 The 2004 London Elections GLA Data Management and Analysis Group
Technical NotesElecting Members for the London Assembly
There are 25 members of the London Assembly: 14 Constituency Members
and 11 London-wide Members. The Assembly is elected using the Additional
Member System (AMS), which combines elements of fi rst-past-the-post and a
form of proportional representation using the d’Hondt formula.
Voters cast two votes: one for a Constituency Assembly Member and one
for the independent candidate or political party they would most like to see
represented in the Assembly on a London-wide basis. A facsimile of the voting
form is shown to the right.
Constituency Members each represent one of London’s 14 Assembly
constituencies, comprising between two and four boroughs. They are elected
by the traditional fi rst-past-the-post system, where the candidate with the
most votes in a constituency is elected. If there is a tie lots are drawn by the
constituency returning offi cer.
If all Assembly Members were elected in this way, independent candidates or
parties whose votes were spread right across London but added together made
a signifi cant total, might not win any seat. All the people who had voted for
those candidates would have no representation to voice their political views in
the Assembly, making it less representative of London as a whole.
This is where the second vote for an independent candidate or party comes
in. These votes are counted and then the number of constituency members is
topped up with 11 additional London-wide members, using a modifi ed d’Hondt
formula (see later in this section), where seats are allocated on a pro rata basis
to parties or candidates with over 5% of the votes cast.
Applying the d’Hondt formula means that the total number of Assembly seats
given to a party refl ects the intentions of the electorate, while still including
members who are directly answerable to constituencies.
In the past, British elections mostly used the fi rst-past-the-post system.
GLA Data Management and Analysis Group The 2004 London Elections Page 229
This system often creates an imbalance between the number of seats a party
has and its share of votes cast. In the 2000 London election for Assembly
constituency members, which used fi rst-past-the-post, the Conservative party
had 33 per cent of the votes but 57 per cent of constituency member seats. The
Labour Party had 32 per cent of the votes, but 43 per cent of these seats. The
Liberal Democrats and the Greens had no seats, but had 19 per cent and 10 per
cent of the votes respectively. Under the fi rst-past-the-post system, all votes
for candidates other than the winner are rendered irrelevant in determining the
political structure of the elected body, thus ignoring the wishes of those voters.
The d’Hondt formula seeks to redress this imbalance.
The European Parliament elections
This used the pure d’Hondt formula (see below).
The d’Hondt formula
Victor d’Hondt was a Belgian lawyer, professor of civil law at Ghent University,
and a mathematician. He devised this seat-allocation method in 1878. The
process in practice can easily be followed by reference to the Results Chapter at
the beginning of this report (pages 11 and 19) but the following describes how
the system works.
The calculation is carried out using all the votes cast in the election.
In ‘round one’, the votes cast for each party or individual candidate are
examined and the one receiving the highest number gains the fi rst seat.
In ‘round two’, the total number of votes for each party or candidate is divided
by the number of seats that each party has already won plus one. In other
words the party or candidate which won the fi rst seat has their vote divided
by two and all the others have their vote divided by one. The results of this
calculation are examined and the party or candidate with the highest number
wins the second seat.
The process is then repeated until all seats have been allocated, with, at each
round, the parties’ or candidates’ votes being divided by the number of seats
they have already gained plus one, and the party or candidate with the largest
result from this calculation gaining the next seat.
In the Assembly election, the intention is that the overall polital composition
of the Assembly should refl ect as far as possible, the distribution of votes cast
across the whole of London. The seats won in the constituency member stage
of the election are, therefore, taken into account in allocating the London-wide
seats. A d’Hondt formula is used to allocate the London-wide seats, modifi ed to
allow only those parties or individual candidates who have gained more than 5
per cent of the vote to be considered.
In the European election, the pure d’Hondt system is used where the 5 per cent
minimum qualifi cation is not applied.
The conduct of the election
DRS, Data and Research Services plc provided the e-counting system for the
2004 London elections. DRS designs and manufactures its own e-counting
software and hardware for specifi c needs, and has extensive elections
experience. In May 2003, DRS provided a successful e-counting system for the
fi rst multiple council elections in the United Kingdom in County Durham.
DRS provided the electronic vote-counting for the fi rst Mayoral and London
Assembly election in 2000. The system worked well and the results were
announced by lunchtime the following day. Minor problems which arose in
2000 were addressed and resolved, and the software for the 2004 election
was greatly improved, not least by the ability to detect and take an image of
doubtful ballot papers.
The electronic counting or ‘e-counting’ used, involves scanning ballot papers
through specially designed machines rather than counting them by hand. These
machines automatically count the vote (or votes) on each ballot paper. This
means that multiple votes using different voting systems can be counted at the
same time. Once the votes are counted, the system calculates the results for
each election.
E-counting was chosen because it is very accurate and the ballot papers would
take too long to count by hand with the three different voting systems being
Page 230 The 2004 London Elections GLA Data Management and Analysis Group
used, and voters casting fi ve votes on three separate ballot papers. Machines
can count these effi ciently and quickly, whereas a manual count of the ballot
papers would have taken days.
London Elects was the offi ce involved with planning and managing the
organisation and publicity for the elections. It reported to the Greater London
Returning Offi cer (GLRO) under separate budgetary and reporting lines from
the GLA.
In the election for the Mayor of London and London Assembly, each London
borough had a borough returning offi cer (BRO) who was responsible for
identifying polling stations, appointing staff, conducting the election and
sending out postal votes. However, responsibility for the counting of votes
rested with the constituency returning offi cer (CRO). London Assembly
constituencies are made up of between two and four London local authorities.
The BRO of the constituency’s largest borough (usually the one with the most
registered voters) became its CRO.
For the European election, there was a regional returning offi cer (RRO) for
each of the UK’s 12 European parliamentary regions, who was responsible
for organising a fair and accurate election. London was one region. The RRO
announced the results of the European Parliament election well after the
declaration from the London elections, once all polling stations across the
European Union closed.
The GLRO was responsible for overseeing the election for the Mayor of London
and the London Assembly across the whole of London. The role is designated as
the responsibility of the ‘proper offi cer’ of the Greater London Authority (GLA),
according to the GLA Act 1999.
The GLRO announced the results of the Mayoral election and the London-
wide Assembly Member elections and CROs declared the results in their home
constituencies. The GLRO cannot order a London-wide recount – recounts can
only take place at constituency level and this responsibility falls to CROs.
Anthony Mayer, the chief executive of the GLA, was both GLRO and London
RRO. He was appointed to the GLRO role by the London Assembly, and as RRO
by the Department for Constitutional Affairs. Both roles had deputies. The
deputy GLRO was John Bennett, Head of Assembly Support at the GLA and the
deputy RRO was David Wechsler, chief executive of Croydon Borough Council.
Electronic counting (e-counting)
Electors in the London elections had fi ve votes:
• a fi rst choice for Mayor of London
• a second choice for Mayor of London
• one vote for a constituency member of the London Assembly
• one vote for a London-wide Member of the London Assembly
• one vote for a Member of the European Parliament
Voters inserted their completed ballot papers into ballot boxes at the polling
station. Voters were asked not to fold their ballot papers, as this would slow
down the e-counting process. When the polling station closed, the ballot boxes
were taken to the constituency counting centre, which was under the control
of the CRO. Ballot papers from each polling station were then removed and
organised into piles with a control sheet, which listed the number of ballot
papers issued by the polling station. Each control sheet was scanned, and the
number of papers entered into a database. Ballot papers in each pile were then
fed through the same scanning machines.
The scanner performed a number of operations at the same time. It checked
the ballot paper against various security features to ensure it was genuine. It
counted the number of ballot papers being fed through it, recorded how each
vote had been cast and stored images of doubtful ballot papers (where the
voter’s intention was unclear).
Manually-entered ballot papers
Images of all doubtful papers were taken and stored for later adjudication by
election offi cials. They decided how to interpret the voter’s intent and entered
votes or the reason for rejecting them separately into the database. Any ballot
papers that could not physically be fed through the scanner (e.g. if torn or
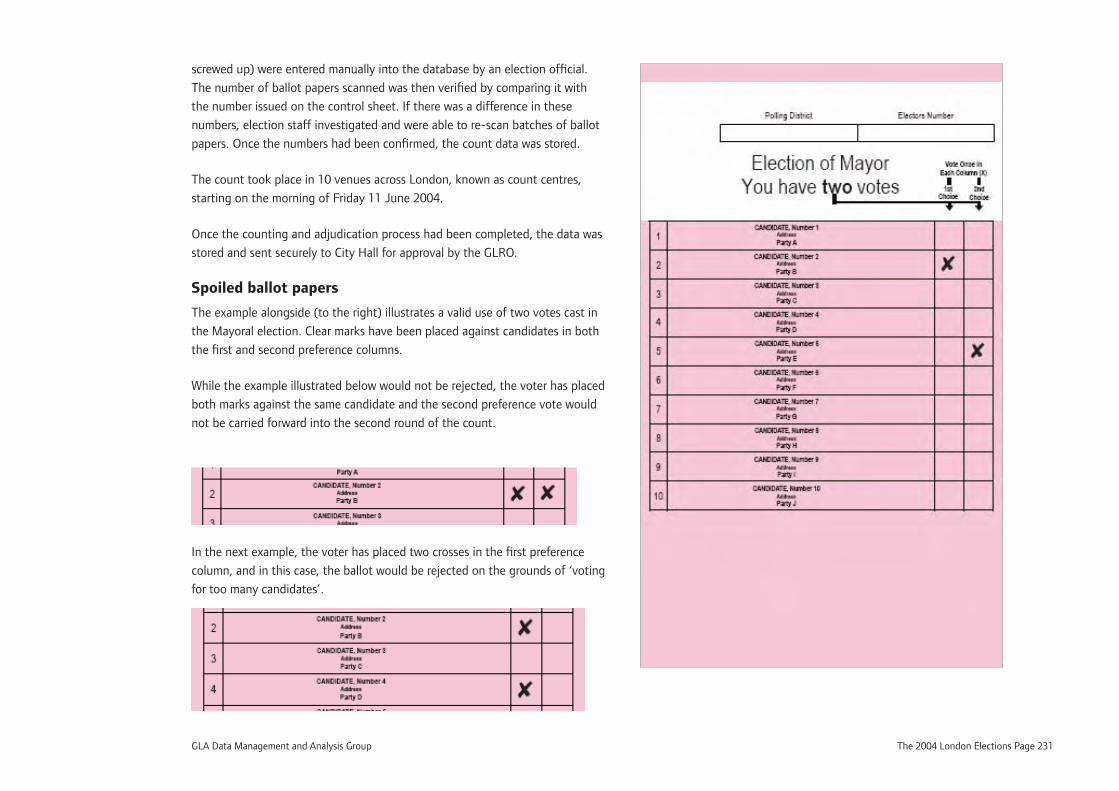
GLA Data Management and Analysis Group The 2004 London Elections Page 231
screwed up) were entered manually into the database by an election offi cial.
The number of ballot papers scanned was then verifi ed by comparing it with
the number issued on the control sheet. If there was a difference in these
numbers, election staff investigated and were able to re-scan batches of ballot
papers. Once the numbers had been confi rmed, the count data was stored.
The count took place in 10 venues across London, known as count centres,
starting on the morning of Friday 11 June 2004.
Once the counting and adjudication process had been completed, the data was
stored and sent securely to City Hall for approval by the GLRO.
Spoiled ballot papers
The example alongside (to the right) illustrates a valid use of two votes cast in
the Mayoral election. Clear marks have been placed against candidates in both
the fi rst and second preference columns.
While the example illustrated below would not be rejected, the voter has placed
both marks against the same candidate and the second preference vote would
not be carried forward into the second round of the count.
In the next example, the voter has placed two crosses in the fi rst preference
column, and in this case, the ballot would be rejected on the grounds of ‘voting
for too many candidates’.
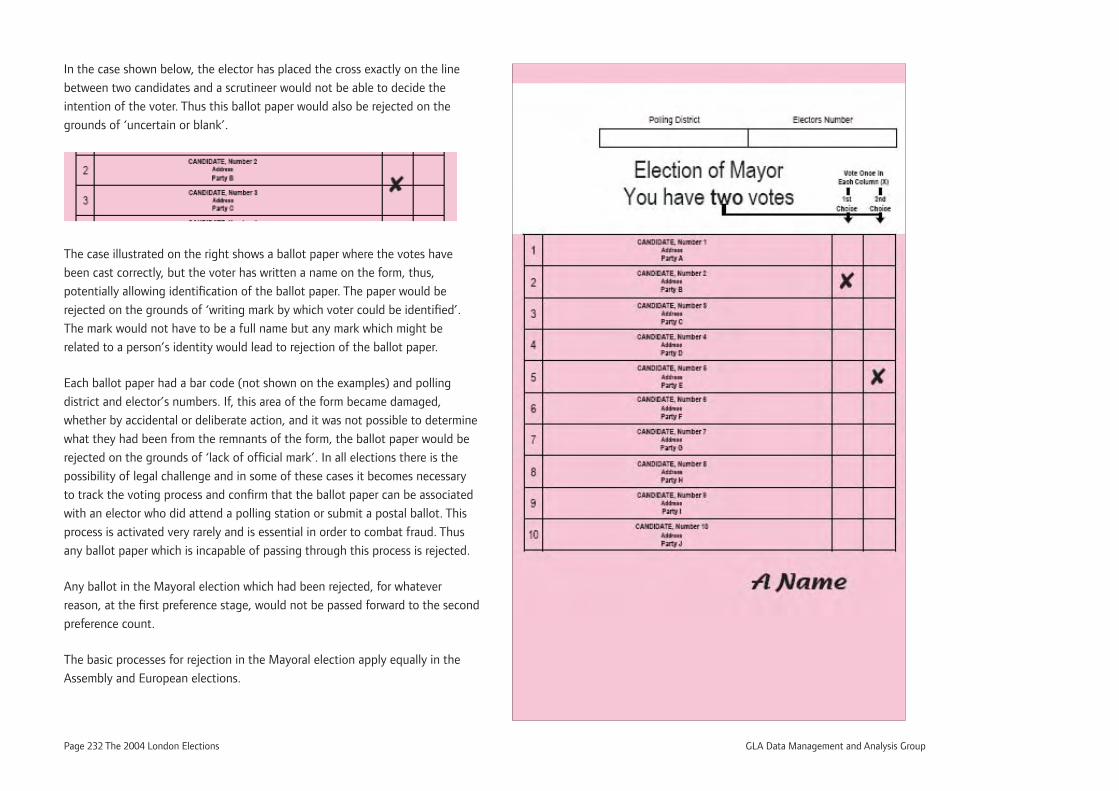
Page 232 The 2004 London Elections GLA Data Management and Analysis Group
In the case shown below, the elector has placed the cross exactly on the line
between two candidates and a scrutineer would not be able to decide the
intention of the voter. Thus this ballot paper would also be rejected on the
grounds of ‘uncertain or blank’.
The case illustrated on the right shows a ballot paper where the votes have
been cast correctly, but the voter has written a name on the form, thus,
potentially allowing identifi cation of the ballot paper. The paper would be
rejected on the grounds of ‘writing mark by which voter could be identifi ed’.
The mark would not have to be a full name but any mark which might be
related to a person’s identity would lead to rejection of the ballot paper.
Each ballot paper had a bar code (not shown on the examples) and polling
district and elector’s numbers. If, this area of the form became damaged,
whether by accidental or deliberate action, and it was not possible to determine
what they had been from the remnants of the form, the ballot paper would be
rejected on the grounds of ‘lack of offi cial mark’. In all elections there is the
possibility of legal challenge and in some of these cases it becomes necessary
to track the voting process and confi rm that the ballot paper can be associated
with an elector who did attend a polling station or submit a postal ballot. This
process is activated very rarely and is essential in order to combat fraud. Thus
any ballot paper which is incapable of passing through this process is rejected.
Any ballot in the Mayoral election which had been rejected, for whatever
reason, at the fi rst preference stage, would not be passed forward to the second
preference count.
The basic processes for rejection in the Mayoral election apply equally in the
Assembly and European elections.

GLA Data Management and Analysis Group The 2004 London Elections Page 233
Page 234 The 2004 London Elections GLA Data Management and Analysis Group
Data Management and Analysis Group (DMAG)DMAG is a team of statisticians and researchers within the Greater London Authority dealing with various types of socio-economic and demographic data, its
management and analysis. We offer a range of professional and technical skills in the fi elds of statistics, research, demography, data presentation and computing.
DMAG’s main stream of publications is the briefi ngs series. Examples include:
2006-19 Child Poverty in London: Income and Labour Market Indicators
2006-11 Borough and Sub-regional Demographic Profi les 2006
2006-06 Parents and work in London: An analysis of Annual Population Survey data for 2004
2006-04 London Borough residents by country of birth: An analysis of 2001 Census data
2005-24 Ward Risks of Population Change
2005-21 Transgenerational Ethnicity
2005-12 Ethnic Diversity Indices
2005-06 London – the world in a city: an analysis of 2001 Census results
2005-01 Country of Birth and Labour Market Outcomes in London: An analysis of Labour Force Survey and Census data
2004-18 Indices of Deprivation 2004: A London Perspective
2003-09 2001 Census Key Statistics: Ethnicity, religion and country of birth
For further information or for a full list of DMAG briefi ngs, please contact [email protected] . A CD containing PDF versions of the briefi ngs, or hard
copies, can also be provided.


![[UK] The Labour Party Manifesto : Mayor and London Assembly elections April 2015](https://img.pdfslide.us/doc/110x75/55a5e4341a28ab2d368b4781/uk-the-labour-party-manifesto-mayor-and-london-assembly-elections-april-2015.jpg)