Embed Size (px)
Citation preview

~ Department of ~ United States
Agriculture .£
t Forest Service ~~
-t: Rocky Mountain Forest and Range Experiment Station
Fort Collins Colorado 80526
General Technical Report RM-GTR-259
The 1993 RPA Timber Assessment Update
Richard W. Haynes, Darius M. Adams, and John R. Mills
This file was created by scanning the printed publication.Errors identified by the software have been corrected;
however, some errors may remain.
Acknowledgements
This Update required help from a group of dedicated individuals. Henry Spelter (FPL) updated the product demand relations; Ken Skog (FPL) updated the fuelwood projections, Peter Ince (FPL) provided the various fiber demands for the pulp sector; Robert Phelps (WO) helped with projections of the macroeconomic variables and determinants of end use activity; Bill Luppold (NE) revised hardwood lumber production and trade data; Tom Farrenkopf (PNW), Joanne Faulkner (SO), John Kelly (SO), Ray Sheffield (SE), and Sharon Woudenberg (IN) provided PIA inventory data for updating the ATLAS input decks. Jonna Kincaid (University of Washington) and Eric Jensen (University of Montana) provided outstanding programming assistance. Finally, Judy Mikowski (PNW) helped assemble input files, complied various output summaries, and provided valuable assistance in preparing this draft.
This publication was printed on recycled paper.
USDA Forest Service General Technical Report RM-259
March 1995
The 1993 RPA Timber Assessment Update
Richard W. Haynes, Darius M. Adams, and John R. Mills*
*Richard W. Haynes and John R. Mills are Research Foresters at the PNW Research Station Portland, OR. Darius M. Adams is a Professor at the School of Forestry, University of Montana Missoula, MT.
Contents
Page
C H A P T E R 1. M A N A G E M E N T I M P L I C A T I O N S . . . . . . . . . . . . . . . . . . . . . . . . . . . . . . . . . . . . . . . . . . . . . . . . . . . . . . . . . . . . . . . . . . . . . . . . . . . . . . . . . . . . . . . . . . . . . . . . . . . . . . . . . . . . 1
S T U D Y F I N D I N G S . . . . . . . . . . . . . . . . . . . . . . . . . . . . . . . . . . . . . . . . . . . . . . . . . . . . . . . . . . . . . . . . . . . . . . . . . . . . . . . . . . . . . . . . . . . . . . . . . . . . . . . . . . . . . . . . . . . . . . . . . . . . . . . . . . . . . . . . . . . . . . . . . . . . . . . . . . . . . 1
C H A P T E R 2. M A J O R D E M A N D A N D S U P P L Y A S S U M P T I O N S . . . . . . . . . . . . . . . . . . . . . . . . . . . . . . . . . . . . . . . . . . . . . . . . . . . . . . . . . . . . . . . . . . . . . . . . . . . . . . 4
B A S I C A S S U M P T I O N S . . . . . . . . . . . . . . . . . . . . . . . . . . . . . . . . . . . . . . . . . . . . . . . . . . . . . . . . . . . . . . . . . . . . . . . . . . . . . . . . . . . . . . . . . . . . . . . . . . . . . . . . . . . . . . . . . . . . . . . . . . . . . . . . . . . . . . . . . . . . . . . . . . . . 4
Economic Activity and Demographics . . . . . . . . . . . . . . . . . . . . . . . . . . . . . . . . . . . . . . . . . . . . . . . . . . . . . . . . . . . . . . . . . . . . . . . . . . . . . . . . . . . . . . . . . . . . . . . . . . . . . . . . . . . . . . . . . . . . . . . 4
Energy Costs . . . . . . . . . . . . . . . . . . . . . . . . . . . . . . . . . . . . . . . . . . . . . . . . . . . . . . . . . . . . . . . . . . . . . . . . . . . . . . . . . . . . . . . . . . . . . . . . . . . . . . . . . . . . . . . . . . . . . . . . . . . . . . . . . . . . . . . . . . . . . . . . . . . . . . . . . . . . . . . . . . . . 4
T I M B E R D E M A N D A S S U M P T I O N S . . . . . . . . . . . . . . . . . . . . . . . . . . . . . . . . . . . . . . . . . . . . . . . . . . . . . . . . . . . . . . . . . . . . . . . . . . . . . . . . . . . . . . . . . . . . . . . . . . . . . . . . . . . . . . . . . . . . . . . . . . . . 4
Determinants of End-Use Activity . . . . . . . . . . . . . . . . . . . . . . . . . . . . . . . . . . . . . . . . . . . . . . . . . . . . . . . . . . . . . . . . . . . . . . . . . . . . . . . . . . . . . . . . . . . . . . . . . . . . . . . . . . . . . . . . . . . . . . . . . . . . . . 5
Trends in End-Use Factors . . . . . . . . . . . . . . . . . . . . . . . . . . . . . . . . . . . . . . . . . . . . . . . . . . . . . . . . . . . . . . . . . . . . . . . . . . . . . . . . . . . . . . . . . . . . . . . . . . . . . . . . . . . . . . . . . . . . . . . . . . . . . . . . . . . . . . . . . . . . 7
Demand for Pulpwood . . . . . . . . . . . . . . . . . . . . . . . . . . . . . . . . . . . . . . . . . . . . . . . . . . . . . . . . . . . . . . . . . . . . . . . . . . . . . . . . . . . . . . . . . . . . . . . . . . . . . . . . . . . . . . . . . . . . . . . . . . . . . . . . . . . . . . . . . . . . . . . . . . 8
Wood Fuel . . . . . . . . . . . . . . . . . . . . . . . . . . . . . . . . . . . . . . . . . . . . . . . . . . . . . . . . . . . . . . . . . . . . . . . . . . . . . . . . . . . . . . . . . . . . . . . . . . . . . . . . . . . . . . . . . . . . . . . . . . . . . . . . . . . . . . . . . . . . . . . . . . . . . . . . . . . . . . . . . . . . . . . . 9
Trade Projections . . . . . . . . . . . . . . . . . . . . . . . . . . . . . . . . . . . . . . . . . . . . . . . . . . . . . . . . . . . . . . . . . . . . . . . . . . . . . . . . . . . . . . . . . . . . . . . . . . . . . . . . . . . . . . . . . . . . . . . . . . . . . . . . . . . . . . . . . . . . . . . . . . . . . . . . . . 1 2
T I M B E R S U P P L Y A S S U M P T I O N S . . . . . . . . . . . . . . . . . . . . . . . . . .. . . . . . . . . . . . . . . . . . . . . . . . . . . . . . . . . . . . . . . . . . . . . . . . . . . . . . . . . . . . . . . . . . . . . . . . . . . . . . . . . . . . . . . . . . . . . . . . . . . . 1 2
Inventory Projection System . . . . . . . . . . . . . . . . . . . . . . . . . . . . . . . . . . . . . . . . . . . . . . . . . . . . . . . . . . . . . . . . . . . . . . . . . . . . . . . . . . . . . . . . . . . . . . . . . . . . . . . . . . . . . . . . . . . . . . . . . . . . . . . . . . . . . . 1 3
Timber Management Assumptions . . . . . . . . . . . . . . . . . . . . . . . . . . . . . . . . . . . . . . . . . . . . . . . . . . . . . . . . . . . . . . . . . . . . . . . . . . . . . . . . . . . . . . . . . . . . . . . . . . . . . . . . . . . . . . . . . . . . . . . . . . 1 3
Projected Area Changes for Forest Ownerships and Forest Management Types . . . . . . . . . . . . . . . . . . . . . . . . . . . . . . . . . . . . . . . . . . 1 4
Adjustments for Timber Removals . . . . . . . . . . . . . . . . . . . . . . . . . . . . . . . . . . . . . . . . . . . . . . . . . . . . . . . . . . . . . . . . . . . . . . . . . . . . . . . . . . . . . . . . . . . . . . . . . . . . . . . . . . . . . . . . . . . . . . . . . . 1 4
National Forest Harvest L e v e l s . . . . . . . . . . . . . . . . . . . . . . . . . . . . . . . . . . . . . . . . . . . . . . . . . . . . . . . . . . . . . . . . . . . . . . . . . . . . . . . . . . . . . . . . . . . . . . . . . . . . . . . . . . . . . . . . . . . . . . . . . . . . . . . . . . 1 7
Other Public Harvest L e v e l s . . . . . . . . . . . . . . . . . . . . . . . . . . . . . . . . . . . . . . . . . . . . . . . . . . . . . . . . . . . . . . . . . . . . . . . . . . . . . . . . . . . . . . . . . . . . . . . . . . . . . . . . . . . . . . . . . . . . . . . . . . . . . . . . . . . . . . 2 1
P R O J E C T E D T R E N D S I N P R O C E S S I N G . . . . . . . . . . . . . . . . . . . . . . . . . . . . . . . . . . . . . . . . . . . . . . . . . . . . . . . . . . . . . . . . . . . . . . . . . . . . . . . . . . . . . . . . . . . . . . . . . . . . . . . . . . . . . . . . . . . 2 1
C H A P T E R 3. T I M B E R D E M A N D - S U P P L Y R E L A T I O N S H I P S : B A S E P R O J E C T I O N . . . . . . . . . . . . . . . . . . . . . . . . . . . . . . . . . . . . . . . . . 2 4
P R O J E C T E D C O N S U M P T I O N , P R O D U C T I O N , T R A D E A N D P R I C E S F O R T I M B E R P R O D U C T S ... . . . . . 2 4
Lumber . . . . . . . . . . . . . . . . . . . . . . . . . . . . . . . . . . . . . . . . . . . . . . . . . . . . . . . . . . . . . . . . . . . . . . . . . . . . . . . . . . . . . . . . . . . . . . . . . . . . . . . . . . . . . . . . . . . . . . . . . . . . . . . . . . . . . . . . . . . . . . . . . . . . . . . . . . . . . . . . . . . . . . . . . . . . 2 4
Structural Panel Products . . . . . . . . . . . . . . . . . . . . . . . . . . . . . . . . . . . . . . . . . . . . . . . . . . . . . . . . . . . . . . . . . . . . . . . . . . . . . . . . . . . . . . . . . . . . . . . . . . . . . . . . . . . . . . . . . . . . . . . . . . . . . . . . . . . . . . . . . . . 2 7
Nonstructural Panel Products . . . . . . . . . . . . . . . . . . . . . . . . . . . . . . . . . . . . . . . . . . . . . . . . . . . . . . . . . . . . . . . . . . . . . . . . . . . . . . . . . . . . . . . . . . . . . . . . . . . . . . . . . . . . . . . . . . . . . . . . . . . . . . . . . . . . 2 8
Paper and Board . . . . . . . . . . . . . . . . . . . . . . . . . . . . . . . . . . . . . . . . . . . . . . . . . . . . . . . . . . . . . . . . . . . . . . . . . . . . . . . . . . . . . . . . . . . . . . . . . . . . . . . . . . . . . . . . . . . . . . . . . . . . . . . . . . . . . . . . . . . . . . . . . . . . . . . . . . . . 2 9
Pulpwood . . . . . . . . . . . . . . . . . . . . . . . . . . . . . . . . . . . . . . . . . . . . . . . . . . . . . . . . . . . . . . . . . . . . . . . . . . . . . . . . . . . . . . . . . . . . . . . . . . . . . . . . . . . . . . . . . . . . . . . . . . . . . . . . . . . . . . . . . . . . . . . . . . . . . . . . . . . . . . . . . . . . . . . 3 0
Other Industrial Timber Products . . . . . . . . . . . . . . . . . . . . . . . . . . . . . . . . . . . . . . . . . . . . . . . . . . . . . . . . . . . . . . . . . . . . . . . . . . . . . . . . . . . . . . . . . . . . . . . . . . . . . . . . . . . . . . . . . . . . . . . . . . . . 3 1
Product Price Projections . . . . . . . . . . . . . . . . . . . . . . . . . . . . . . . . . . . . . . . . . . . . . . . . . . . . . . . . . . . . . . . . . . . . . . . . . . . . . . . . . . . . . . . . . . . . . . . . . . . . . . . . . . . . . . . . . . . . . . . . . . . . . . . . . . . . . . . . . . . . 3 1
T H E S T U M P A G E M A R K E T . . . . . . . . . . . . . . . . . . . . . . . . . . . . . . . . . . . . . . . . . . . . . . . . . . . . . . . . . . . . . . . . . . . . . . . . . . . . . . . . . . . . . . . . . . . . . . . . . . . . . . . . . . . . . . . . . . . . . . . . . . . . . . . . . . . . . . . . . . . 3 3
Projected Consumption and Harvest of Timber . . . . . . . . . . . . . . . . . . . . . . . . . . . . . . . . . . . . . . . . . . . . . . . . . . . . . . . . . . . . . . . . . . . . . . . . . . . . . . . . . . . . . . . . . . . . . . . . . . . . 3 3
Projected Sawtimber Stumpage and Pulpwood Prices . . . . . . . . . . . . . . . . . . . . . . . . . . . . . . . . . . . . . . . . . . . . . . . . . . . . . . . . . . . . . . . . . . . . . . . . . . . . . . . . . . . . . . . . 3 5
Projected Regional Harvest Volumes . . . . . . . . . . . . . . . . . . . . . . . . . . . . . . . . . . . . . . . . . . . . . . . . . . . . . . . . . . . . . . . . . . . . . . . . . . . . . . . . . . . . . . . . . . . . . . . . . . . . . . . . . . . . . . . . . . . . . . 3 7
T R E N D S I N T I M B E R G R O W T H A N D I N V E N T O R I E S . . . . . . . . . . . . . . . . . . . . . . . . . . . . . . . . . . . . . . . . . . . . . . . . . . . . . . . . . . . . . . . . . . . . . . . . . . . . . . . . . . . . . . . . . 3 7
P R O J E C T I O N S O F C A N A D I A N H A R V E S T . . . . . . . . . . . . . . . . . . . . . . . . . . . . . . . . . . . . . . . . . . . . . . . . . . . . . . . . . . . . . . . . . . . . . . . . . . . . . . . . . . . . . . . . . . . . . . . . . . . . . . . . . . . . . 4 6
I M P L I C A T I O N S O F T H E B A S E P R O J E C T I O N . . . . . . . . . . . . . . . . . . . . . . . . . . . . . . . . . . . . . . . . . . . . . . . . . . . . . . . . . . . . . . . . . . . . . . . . . . . . . . . . . . . . . . . . . . . . . . . . . . . . . . . . 4 7
C H A P T E R 4. A L T E R N A T I V E F U T U R E S . . . . . . . . . . . . . . . . . . . . . . . . . . . . . . . . . . . . . . . . . . . . . . . . . . . . . . . . . . . . . . . . . . . . . . . . . . . . . . . . . . . . . . . . . . . . . . . . . . . . . . . . . . . . . . . . . . . . . . . . . 5 0
L O W E R C A N A D I A N L U M B E R P R O D U C T I O N . . . . . . . . . . . . . . . . . . . . . . . . . . . . . . . . . . . . . . . . . . . . . . . . . . . . . . . . . . . . . . . . . . . . . . . . . . . . . . . . . . . . . . . . . . . . . . . . . . . . . . 51
E X P A N D E D R E G U L A T I O N O F P R I V A T E T I M B E R L A N D S . . . . . . . . . . . . . . . . . . . . . . . . . . . . . . . . . . . . . . . . . . . . . . . . . . . . . . . . . . . . . . . . . . . . . . . . . . . . . . . . 51
R E D U C E D R A T E S O F P I N E P L A N T A T I O N E S T A B L I S H M E N T I N T H E S O U T H . . . . . . . . . . . . . . . . . . . . . . . . . . . . . . . . . . . . . . . . . 5 7
H I G H E R R A T E S O F R E C Y C L I N G . . . . . . . . . . . . . . . . . . . . . . . . . . . . . . . . . . . . . . . . . . . . . . . . . . . . . . . . . . . . . . . . . . . . . . . . . . . . . . . . . . . . . . . . . . . . . . . . . . . . . . . . . . . . . . . . . . . . . . . . . . . . . . . 5 8
A L T E R N A T I V E M A C R O E C O N O M I C A S S U M P T I O N S . . . . . . . . . . . . . . . . . . . . . . . . . . . . . . . . . . . . . . . . . . . . . . . . . . . . . . . . . . . . . . . . . . . . . . . . . . . . . . . . . . . . . . . . 5 9
T R E E P L A N T I N G P R O G R A M S . . . . . . . . . . . . . . . . . . . . . . . . . . . . . . . . . . . . . . . . . . . . . . . . . . . . . . . . . . . . . . . . . . . . . . . . . . . . . . . . . . . . . . . . . . . . . . . . . . . . . . . . . . . . . . . . . . . . . . . . . . . . . . . . . . . . 6 0
I M P A C T S O F G L O B A L C L I M A T E C H A N G E . . . . . . . . . . . . . . . . . . . . . . . . . . . . . . . . . . . . . . . . . . . . . . . . . . . . . . . . . . . . . . . . . . . . . . . . . . . . . . . . . . . . . . . . . . . . . . . . . . . . . . . . . . . 6 1
W O O D E N E R G Y . . . . . . . . . . . . . . . . . . . . . . . . . . . . . . . . . . . . . . . . . . . . . . . . . . . . . . . . . . . . . . . . . . . . . . . . . . . . . . . . . . . . . . . . . . . . . . . . . . . . . . . . . . . . . . . . . . . . . . . . . . . . . . . . . . . . . . . . . . . . . . . . . . . . . . . . . . . . . . . 6 2
C H A N G E S I N N A T I O N A L F O R E S T H A R V E S T . . . . . . . . . . . . . . . . . . . . . . . . . . . . . . . . . . . . . . . . . . . . . . . . . . . . . . . . . . . . . . . . . . . . . . . . . . . . . . . . . . . . . . . . . . . . . . . . . . . . . . 6 3
C O M B I N E D E N V I R O N M E N T A L A N D E N E R G Y P O L I C I E S . . . . . . . . . . . . . . . . . . . . . . . . . . . . . , . . . . . . . . . . . . . . . . . . . . . . . . . . . . . . . . . . . . . . . . . . . . . . . . . 6 3
R E F E R E N C E S . . . . . . . . . . . . . . . . . . . . . . . . . . . . . . . . . . . . . . . . . . . . . . . . . . . . . . . . . . . . . . . . . . . . . . . . . . . . . . . . . . . . . . . . . . . . . . . . . . . . . . . . . . . . . . . . . . . . . . . . . . . . . . . . . . . . . . . . . . . . . . . . . . . . . . . . . . . . . . . . . . . . . . . . . . 6 4
R E F E R E N C E S C I T E D m U N P U B L I S H E D .. . . . . . . . . . . . . . '. . . . . . . . . . . . . . . . . . . . . . . . . . . . . . . . . . . . . . . . . . . . . . . . . . . . . . . . . . . . . . . . . . . . . . . . 2 . . . . . . . . . . . . . . . . . . . . . . . . . . . . . . . . . 6 5
The 1993 RPA Timber Assessment Update
Richard W. Haynes, Darius M. Adams, and John R. Mills
CHAPTER I. MANAGEMENT IMPLICATIONS
The Forest and Rangeland Renewable Resources Planning Act (RPA) of 1974, as amended by the National Forest Management Act of 1976, directs the Secretary of Agriculture to prepare a Renewable Resource Assessment each decade and a Renewable Resource Program every 5 years. This Update reports changes in the timber resource situation first de- scribed in the 1989 RPA Timber Assessment (Haynes 1990).1 More specifically, the purposes of this Update are two-fold.
1. Analyze the timber resource situation to pro- vide projections of the future cost and avail- ability of timber products to meet the Nation's demands. The Update focuses on prospective trends in demands for, and supplies of tim- ber,.and the factors that affect these trends, including changes in the land and timber resource base.
. Identify changing resource conditions that may warrant policy changes, or that may represent opportunities for private or public investment. This Update interprets market and resource trends as a basis for determin- ing how to manage and use the resource base to better meet private and public sector goals.
STUDY FINDINGS
The base projection represents an outlook in which the major economic determinants of timber demand and forest products supply evolve according to a
1Analysis of the demand~supply situation for timber has a history dating back to 1876. This history is described in Appendix C of the 1989 RPA Timber Assessment. The structure, methodol- ogy, and much of the historical base developed in earlier assess- ments, and particularly those immediately preceding, have been carried forward with modifications, and refinements.
specific set of assumptions (as described in chap- ter 2), but the policy environment--policies regulat- ing both public and private forests and their manage- ment~is fixed. The base case provides an initial view of future prospects and a datum against which to measure the impacts of alternative assumptions on economic and policy developments. Because poli- cies are assumed to be fixed, the base case s h o u l d n o t b e interpreted as a "best guess" or "most prob- able" forecast.
In broad terms, the base projection shows a future in which rising trends in the consumption of forest products are juxtaposed with a much more cyclical outlook for timber growth and inventories. Over the period 1990 to 2040, softwood harvests from U.S. forests rise by 35%, while hardwood harvest rises by more than 51%. Obtaining these increments in con- sumption requires annual sawtimber stumpage real price growth on the order of 1-2%. Softwood sawtim- ber markets are in a state of adjustment during the first two decades of the projection, rebalancing wood demands with a reduced stumpage supply. Inven- tory and harvest expansion on forest industry lands eventually force prices to stabilize and ultimately to decline. This is aided by reduced demand for soft- wood pulpwood in the South. At the same time, growing pulpwood demand for hardwoods pro- duces a decline in hardwood inventories, lower hard- wood lumber output, and rising hardwood sawtim- her and pulpwood stumpage prices.
Earlier assessments (USDA Forest Service 1974, 1982) consistently projected a future with rising con- sumption, less rapid growth in timber inventories, and increasing real prices for stumpage and prod- ucts. The present base analysis yields a similar view until about 2010, when declining growth in rates of consumption and increasing timber inventories about stabilize prices.
1. Over the next five decades, the consumption of paper and paperboard will grow more rapidly than any other category of forest prod- ucts (about 1.2% per year). Consumption of roundwood in the manufacture of these prod- ucts will rise at about 0.7% per year). Uncer- tainties in the outlook related to this sector, such as rates of wastepaper recycling and use, are particularly critical to the round- wood use projection.
2. Real prices of softwood sawtimber and soft- wood lumber rise steadily from current levels until 2010-2015, then stabilize or fall in subse- quent periods. This reflects:
a. In the near-term:
(i) Reduction in public harvests in all re- gions, but particularly in the West.
(ii) Limited ability of private timber owners in the West to sustain increased harvest because of limited merchantable inven- tories.
(iii)Lumber demand recovers to near 1987 peak levels by 1995 and does not fall below that level for the remainder of the projection.
b. In the long-term:
(i) Maturation of young-growth forests on industrial timberlands in the Douglas- fir subregion and both industrial and nonindustrial lands in the South leads to increases in softwood cut.
(ii) Growing utilization of recycled waste- paper in the production of paper and paperboard reduces growth in demand for softwood pulpwood, particularly in the South, allowing expanded harvest for solidwood products as pulpwood stands increase to sawtimber size.
. The national impacts of public timber harvest reductions in the West will be lessened by significant interregional substitution, includ- ing increased lumber imports from Canada. Over the projection period,western regions will continue to lose market share (in all products) to eastern regions because of rising relative wood costs. This trend will accelerate if public harvest decreases further, if waste- paper recycling rates increase, or if major public tree planting programsare undertaken on nonindustrial lands.
. Price increases in solidwood products and sawtimber until 2010 appear to be nearly inevitable, unless there is some major imme- diate reduction in timber demand, as might be possible with major shifts toward substi- tutes for solidwood products or higher levels of recycling. Pulp and paper prices, in con- trast, exhibit either little or no price changes.
. The South will be the major source of any expansion in softwood timber supply for the next 50 years. If high planting rates in the South continue into the 1990s, as assumed in the base case, product and timber prices will stabilize, and in some cases decline, after 2020.
. Structural panel prices will be stable because of competition between plywood and ori- ented strandboard and waferboard, and nearly constant fiber costs for board prod- ucts. Oriented strandboard and waferboard absorb essentially all of the growth for this class of product.
. Rising real prices for hardwood lumber are caused by declining inventory trends which, in turn, result from land conversion to soft- woods, limited intensity of hardwood silvi- culture, and large increases in demands for pulpwood.
8. Demands for softwood lumber and plywood are higher after 2000 than in the 1989 Assess- ment because of revised projections of con- sumption in the construction, residential up- keep and improvement, and shipping end- u s e s .
9. Softwood pulp product outputs grow less rapidly in this projection than the 1989 As- sessment, while hardwood demand for pulp products grows much faster. Nonetheless, by 2040, pulpwood demand for softwoods rises to twice that for hardwoods in the base pro- jection.
10.While there is considerable regional varia- tion, total U.S. private softwood timber in- ventories will decline until 2000 on forest industry lands, then rise steadily through 2040; nonindustrial private inventories will rise steadily through the full projection pe- riod. Private hardwood inventories in 2040 are about 3% smaller than the 1991 levels on both industrial and nonindustrial ownerships.
11. Hardwoods will increase in importance rela- tive to softwoods in total U.S. harvest as a result of increased use in lumber, fiber prod- ucts, and fuelwood. In this expansion, the North has the potential to match the South in contributions to incremental fiber output. Hardwood area and inventory will drop, however, if past trends in softwood planta- tion establishment and limited hardwood management in the South continue.
12. Inventories on public forests will increase as harvest levels decrease in the early 1990s, and will remain at these reduced levels through- out the projection.
13.By 2040, U.S. forestland will comprise two distinct components: private inventories with relatively stable total volume, rapid growth, harvested close to minimum merchantable ages, and employing increasingly intensive silvicultural methods to grow softwoods; and public lands with rising inventories of older stands using much less intensive silviculture.
14.By 2040, the U.S. will remain a net forest products importer, but the gap between im- ports and exports on a volume basis will decline.
The alternative futures projections in chapter 4 augment these findings in several ways.
1. More intensive forest management and more planting do not limit short-term price in- creases or harvest shortfalls, although their long-term impacts can be substantial.
. Demand for roundwood is quite sensitive to pulpwood price in the manufacture of paper and paperboard, but is fairly insensitive to sawtimber price in the production of lumber. Restrictions on roundwood supply that act to raise prices of pulpwood cause paper and board producers to shift rapidly to alterna- tive fiber sources (including waste paper). This lessens, or potentially even reverses, the impact of the restriction on sawtimber users as unharvested pulpwood grows to sawtim- ber sizes. Increments in supply have the op- posite effects.
. Restrictions on Canadian timber harvest could have major impacts on U.S. markets for prod- ucts and stumpage, raising prices, domestic output and lowering consumption.
3
CHAPTER 2. MAJOR DEMAND AND SUPPLY ASSUMPTIONS
Projections are consequences of assumptions used in the projection process. This chapter provides a summary of the changes in key assumptions since the 1989 Assessment, especially those that are impor- tant determinants of the supply and the demand for various forest products. These assumptions are re- quired as inputs to the model of the forest sector 2 used to develop projections for this Assessment. This model (the Timber Assessment Market Model-- TAMM 3) was originally developed for the 1979 RPA Assessment. It is based on systems analysis and quantitative techniques, and has been extensively revised for this Update. 4
2. Growth in aggregate economic activity (as measured by the gross national product [GNP]) is expected to range between 2% and 3% over the next 50 years, in contrast to the average of 3-4% characteristic of the 1960- 1990 period. Paralleling expansion in GNP, total disposable personal income increases more than three times (table 1) and some 2.5 times on a per capita basis. Although antici- pated economic growth is slower than in the past, this projection still portrays a strong and resilient future economy, with a larger and increasingly affluent population.
BASIC ASSUMPTIONS
In the future, trends in the demand for forest products will continue to be largely determined by growth in U.S. population, income, and economic activity. Projections of future levels for these key demand determinants, many of which were derived from "U.S. Long-Term Economic Outlook" (Wharton Econometric Forecasting Associates 1991), are summa- rized in table 1. For the most part, these projections are little changed from the 1989 Assessment, except for revisions in the population series to reflect the 1990 Census and associated population projections.
Economic Activity and Demographics
The projections in table I indicate:
1. U.S. population growth that slows because of reduced fertility rates but does not achieve a zero rate during the projection period, be- cause of net immigration.
2A forest sector model, in general, combines activities related to the use of wood: forest growth and harvest; the manufacture of pulp, paper, and sofid wood products; and international trade and intermediate and final consumption of these products (Kallio et al. 1987).
3The original model is described in Adams and Haynes (1980) and Haynes and Adams (1985).
4Some of these revisions include a new model for the hard- wood section; the division of the Rockies into two regions--the Northern Rockies and the Southern Rockies; a complete model of the National Forest sales process including bid prices and uncut volume under contract; and reestimation of all of the various relationships in TAMM with updated data sets.
Energy Costs
The long-term outlook for energy costs has moder- ated in the past 5 years. The 1989 Assessment as- sumed that there would be a resumption of growth in energy prices despite sharp price drops in the 1980s. Recent projections by the Department of Energy
5 provide a rough view of trends through 2040. These projections show world crude oil prices (prices are in 1982 dollars, net of inflation or deflation) increasing from $13.35 in 1990 to $37.85 per barrel in 2040. These projections are substantially lower than those used in the 1989 Assessment and result from increased substitution of methanol produced from natural gas and liquid fuels produced from other sources.
TIMBER DEMAND ASSUMPTIONS
Projections of demand for lumber, structural pan- els, and nonstructural panels were based on the end- use ~ipproach used in previous Assessments. In this approach, future consumption of a particular prod- uct (such as lumber) in a specific end-use market (such as housing) is estimated by multiplying the projected consumption per unit of activity in the end- use market (termed end-use factors) times the pro- jected level of end-use activity. This requires as- sumptions about the levels of activity in each end- use category and the consumption of various forest products per unit of end-use activity (the end-use factors).
5personal Communication. 1992. Ken Skog, FPL, Madison, WI.
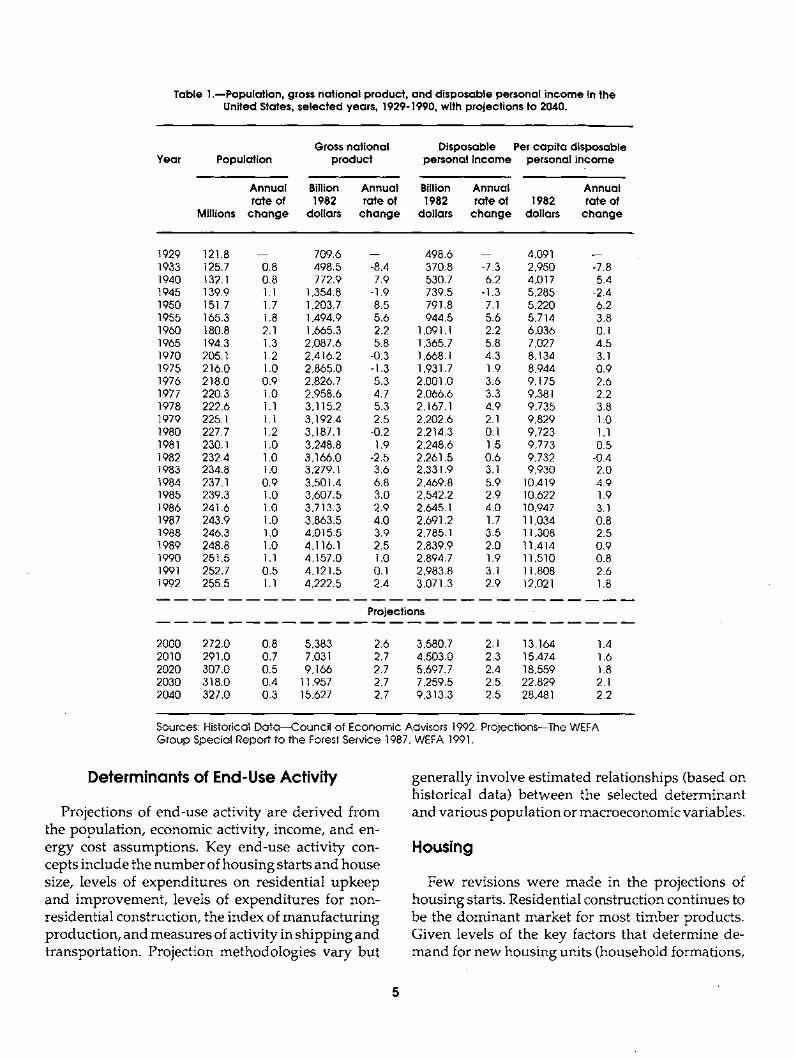
Table 1.mPopulation, gross national product, and disposable personal income in the United States, selected years, 1929-1990, with projections to 2040.
Gross national Disposable Per capita disposable Year Population product personal income personal income
Annual Billion Annual Billion Annual Annual rate of 1982 rate of 1982 rate of 1982 rate of
Millions change dollars change dollars change dollars change
1929 121.8 - - 709.6 - - 498.6 - - 4,091 - - 1933 125.7 0.8 498.5 -8.4 370.8 -7,3 2,950 -7.8 1940 132.1 0.8 772.9 7.9 530.7 6.2 4,017 5.4 1945 139.9 1.1 1,354.8 -1.9 739.5 -1.3 5,285 -2.4 1950 151.7 1.7 1,203.7 8.5 791.8 7.1 5,220 6.2 1955 165.3 1.8 1,494.9 5.6 944.5 5.6 5,714 3.8 1960 180.8 2.1 1,665.3 2.2 1,091.1 2.2 6,036 0.1 1965 194.3 1.3 2,087.6 5,8 1,365.7 5.8 7,027 4.5 1970 205.1 1.2 2,416.2 -0.3 1,668.1 4.3 8,134 3.1 1975 216.0 1.0 2,865.0 -1.3 1,931.7 1.9 8,944 0.9 1976 218.0 0.9 2,826.7 5.3 2,001.0 3.6 9,175 2.6 1977 220.3 1.0 2,958.6 4.7 2,066.6 3.3 9,381 2.2 1978 222.6 1.1 3,115.2 5.3 2,167.1 4.9 9,735 3.8 1979 225.1 1.1 3,192.4 2.5 2,202.6 2.1 9,829 1.0 1980 227.7 1.2 3,187.1 -0.2 2,214.3 0.1 9,723 1.1 1981 230.1 1.0 3,248.8 1.9 2,248.6 1.5 9,773 0.5 1982 232.4 1.0 3,166.0 -2.5 2,261.5 0.6 9,732 -0.4 1983 234.8 1.0 3,279.1 3.6 2,331.9 3.1 9,930 2.0 1984 237.1 0.9 3,501.4 6.8 2,469.8 5.9 10,419 4.9 1985 239.3 1.0 3,607.5 3.0 2,542.2 2.9 10,622 1.9 1986 241.6 1.0 3,713.3 2.9 2,645.1 4.0 10,947 3.1 1987 243.9 1.0 3,863.5 4.0 2,691.2 1.7 11,034 0.8 1988 246.3 1.0 4,015.5 3.9 2,785.1 3.5 11,308 2.5 1989 248.8 1.0 4,116.1 2.5 2,83919 2.0 11,414 0.9 1990 251.5 1.1 4,157.0 1.0 2,894.7 1.9 11,510 0.8 1991 252.7 0.5 4,121.5 0.1 2,983.8 3.1 11,808 2.6 1992 255.5 1.1 4,222.5 2.4 3,071,3 2.9 12,021 1.8
Projections
2000 272.0 0.8 5,383 2.6 3,580.7 2.1 13,164 1.4 2010 291.0 0.7 7,031 2.7 4,503.0 2.3 15,474 1.6 2020 307.0 0.5 9,166 2.7 5,697.7 2.4 18,559 1.8 2030 318.0 0.4 11,957 2.7 7,259.5 2.5 22,829 2.1 2040 327.0 0.3 15,627 2.7 9,313.3 2.5 28,481 2.2
Sources: Historical Data--Council of Economic Advisors 1992. Projections--The WEFA Group Special Report to the Forest Service 1987, WEFA 1991.
Determinants of End-Use Activity
Projections of end-use activity are derived from the population, economic activity, income, and en- ergy cost assumptions. Key end-use activity con- cepts include the number of housing starts and house size, levels of expenditures on residential upkeep and improvement, levels of expenditures for non- residential construction, the index of manufacturing production, and measures of activity in shipping and transportation. Projection methodologies vary but
generally involve estimated relationships (based on historical data) between the selected determinant and various population or macroeconomic variables.
Housing
Few revisions were made in the projections of housing starts. Residential construction continues to be the dominant market for most timber products. Given levels of the key factors that determine de- mand for new housing units (household formations,
5
~-'- .~,:~.
Table 2.--Projections of number (in millions) 6f:'~o'useholds, housing starts, and replacement assumptions.
Number of Total Single Year households s t a r t s family Multiple Mobile
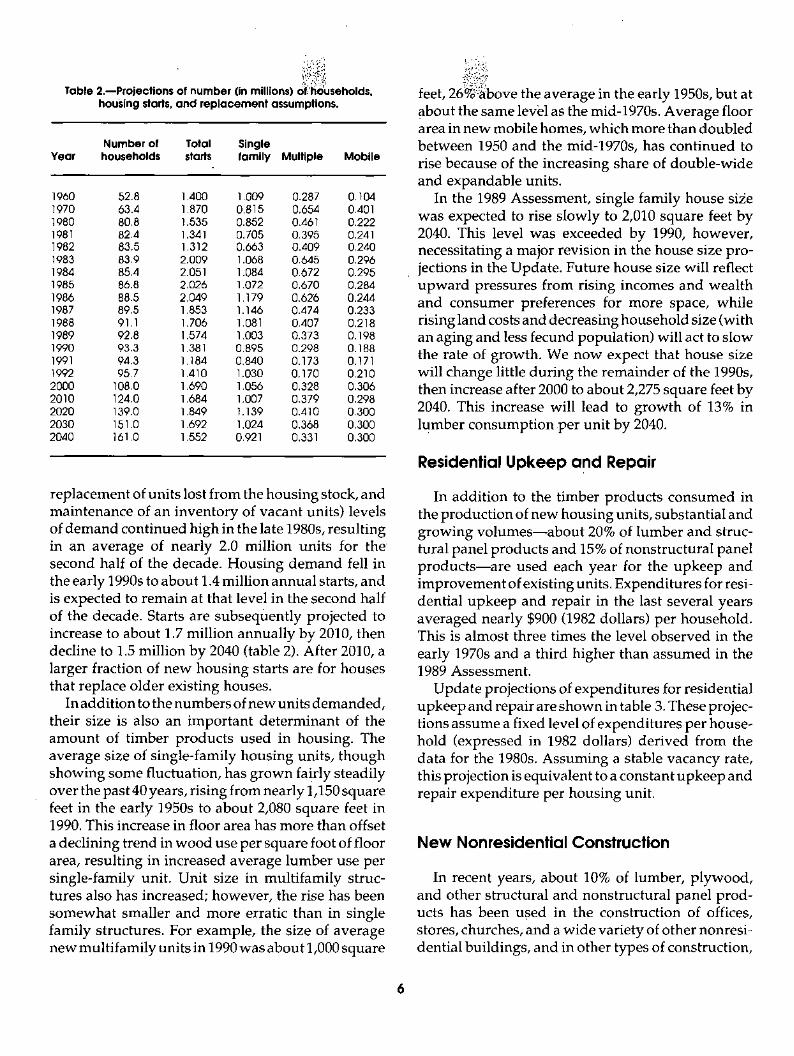
1960 52.8 1,400 1.009 0.287 0.104 1970 63.4 1,870 0.815 0.654 0.401 1980 80.8 1,535 0.852 0.461 0.222 1981 82.4 1,341 0.705 0.395 0.241 1982 83.5 1,312 0.663 0.409 0.240 1983 83.9 2,009 1.068 0.645 0.296 1984 85.4 2.051 1.084 0.672 0,295 1985 86.8 2.026 1.072 0.670 0.284 1986 88.5 2,049 1.179 0.626 0.244 1987 89.5 1.853 1.146 0.474 0.233 1988 91.1 1.706 1.081 0.407 0.218 1989 92.8 1.574 1.003 0.373 0.198 1990 93.3 1.381 0.895 0.298 0.188 1991 94.3 1.184 0.840 0.173 0.171 1992 95.7 1.410 1.030 0.170 0.210 2000 108.0 1.690 1.056 0.328 0.306 2010 124.0 1.684 1.007 0.379 0.298 2020 139.0 1.849 1.139 0.410 0.300 2030 151.0 1.692 1.024 0.368 0.300 2040 161.0 1.552 0.921 0.331 0.300
replacement of units lost from the housing stock, and maintenance of an inventory of vacant units) levels of demand continued high in the late 1980s, resulting in an average of nearly 2.0 million units for the second half of the decade. Housing demand fell in the early 1990s to about 1.4 million annual starts, and is expected to remain at that level in the second half of the decade. Starts are subsequently projected to increase to about 1.7 million annually by 2010, then decline to 1.5 million by 2040 (table 2). After 2010, a larger fraction of new housing starts are for houses that replace older existing houses.
In addition to the numbers of new units demanded, their size is also an important determinant of the amount of timber products used in housing. The average size of single-family housing units, though showing some fluctuation, has grown fairly steadily over the past 40 years, rising from nearly 1,150 square feet in the early 1950s to about 2,080 square feet in 1990. This increase in floor area has more than offset a declining trend in wood use per square foot of floor area, resulting in increased average lumber use per single-family unit. Unit size in multifamily struc- tures also has increased; however, the rise has been somewhat smaller and more erratic than in single family structures. For example, the size of average new multifamily units in 1990 was about 1,000 square
feet, 26~i~bove the average in the early 1950s, but at about the same level as the mid-1970s. Average floor area in new mobile homes, which more than doubled between 1950 and the mid-1970s, has continued to rise because of the increasing share of double-wide and expandable units.
In the 1989 Assessment, single family house siT.e was expected to rise slowly to 2,010 square feet by 2040. This level was exceeded by 1990, however, necessitating a major revision in the house size pro- jections in the Update. Future house size will reflect upward pressures from rising incomes and wealth and consumer preferences for more space, while rising land costs and decreasing household size (with an aging and less fecund population) will act to slow the rate of growth. We now expect that house size will change little during the remainder of the 1990s, then increase after 2000 to about 2,275 square feet by 2040. This increase will lead to growth of 13% in lumber consumption per unit by 2040.
Residential Upkeep and Repair
In addition to the timber products consumed in the production of new housing units, substantial and growing volumes--about 20% of lumber and struc- tural panel products and 15% of nonstructural panel products--are used each year for the upkeep and improvement of existing units. Expenditures for resi- dential upkeep and repair in the last several years averaged nearly $900 (1982 dollars) per household. This is almost three times the level observed in the early 1970s and a third higher than assumed in the 1989 Assessment.
Update projections of expenditures for residential upkeep and repair are shown in table 3. These projec- tions assume a fixed level of expenditures per house- hold (expressed in 1982 dollars) derived from the data for the 1980s. Assuming a stable vacancy rate, this projection is equivalent to a constant upkeep and repair expenditure per housing unit.
New Nonresidential Construction
In recent years, about 10% of lumber, plywood, and other structural and nonstructural panel prod- ucts has been used in the construction of offices, stores, churches, and a wide variety of other nonresi- dential buildings, and in other types of construction,
6
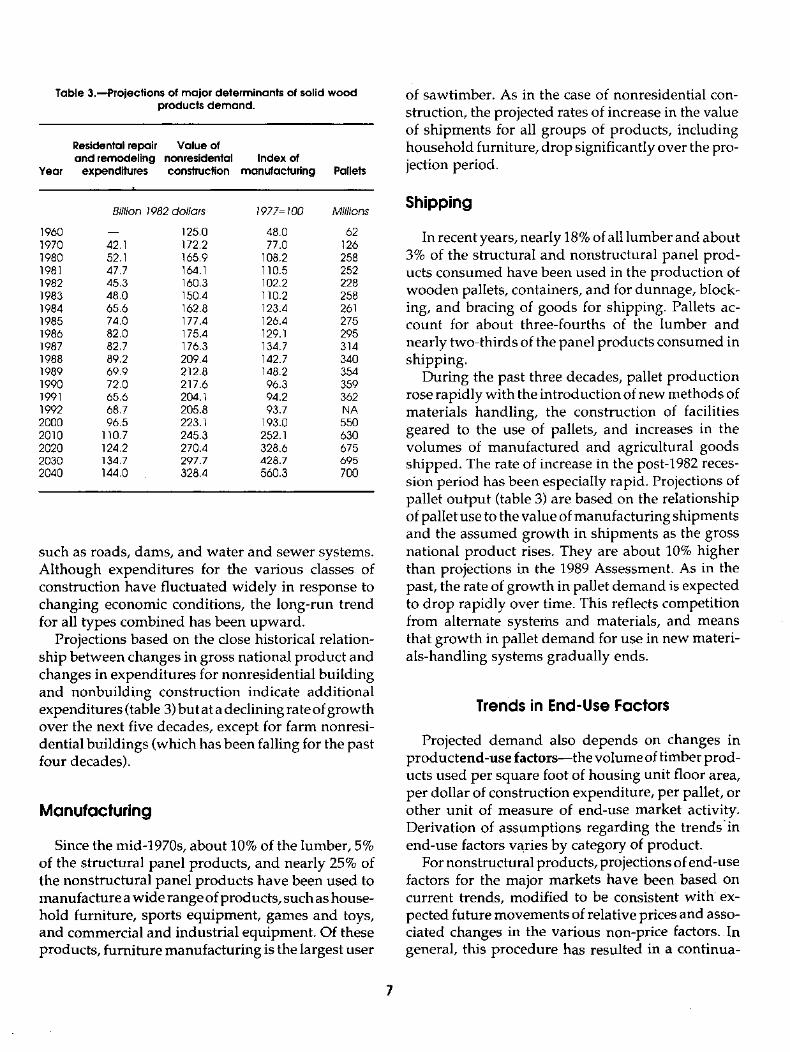
Table 3.DProjections of major determinants of solid wood products demand.
Year
Residental repair Value of and remodeling nonresidental Index of
expenditures construction manufacturing Pallets
Billion 1982 dollars 1977= 100 Millions
1960 - - 125.0 48.0 62 1970 42.1 172.2 77.0 126 1980 52.1 165.9 108.2 258 1981 47.7 164.1 110.5 252 1982 45.3 160.3 102.2 228 1983 48.0 150.4 110.2 258 1984 65.6 162.8 123.4 261 1985 74.0 177.4 126.4 275 1986 82.0 175.4 129.1 295 1987 82.7 176.3 134.7 314 1988 89.2 209.4 142.7 340 1989 69.9 212.8 148.2 354 1990 72.0 217.6 96.3 359 1991 65.6 204.1 94.2 362 1992 68.7 205.8 93.7 NA 2000 96.5 223.1 193.0 550 2010 110.7 245.3 252.1 630 2020 124.2 270.4 328.6 675 2030 134.7 297.7 428.7 695 2040 144.0 328.4 560.3 700
such as roads, dams, and water and sewer systems. Although expenditures for the various classes of construction have fluctuated widely in response to changing economic conditions, the long-run trend for all types combined has been upward.
Projections based on the close historical relation- ship between changes in gross national product and changes in expenditures for nonresidential building and nonbuilding construction indicate additional expenditures (table 3) but at a declining rate of growth over the next five decades, except for farm nonresi- dential buildings (which has been falling for the past four decades).
Manufacturing
Since the mid-1970s, about 10% of the lumber, 5% of the structural panel products, and nearly 25% of the nonstructural panel products have been used to manufacture a wide range of products, such as house- hold furniture, sports equipment, games and toys, and commercial and industrial equipment. Of these products, furniture manufacturing is the largest user
of sawtimber. As in the case of nonresidential con- struction, the projected rates of increase in the value of shipments for all groups of products, including household furniture, drop significantly over the pro- jection period.
Shipping
In recent years, nearly 18% of all lumber and about 3% of the structural and nonstructural panel prod- ucts consumed have been used in the production of wooden pallets, containers, and for dunnage, block- ing, and bracing of goods for shipping. Pallets ac- count for about three-fourths of the lumber and nearly two-thirds of the panel products consumed in shipping.
During the past three decades, pallet production rose rapidly with the introduction of new methods of materials handling, the construction of facilities geared to the use of pallets, and increases in the volumes of manufactured and agricultural goods shipped. The rate of increase in the post-1982 reces- sion period has been especially rapid. Projections of pallet output (table 3) are based on the relationship of pallet use to the value of manufacturing shipments and the assumed growth in shipments as the gross national product rises. They are about 10% higher than projections in the 1989 Assessment. As in the past, the rate of growth in pallet demand is expected to drop rapidly over time. This reflects competition from alternate systems and materials, and means that growth in pallet demand for use in new materi- als-handling systems gradually ends.
Trends in End-Use Factors
Projected demand also depends on changes in productend-use factors--the volume of timber prod- ucts used per square foot of housing unit floor area, per dollar of construction expenditure, per pallet, or other unit of measure of end-use market activity. Derivation of assumptions regarding the trends'in end-use factors varies by category of product.
For nonstructural products, projections of end-use factors for the major markets have been based on current trends, modified to be consistent with ex- pected future movements of relative prices and asso- ciated changes in the various non-price factors. _In general, this procedure has resulted in a continua-
tion of recent trends in the various end-use factors. For example, additional decreases in the factor for particleboard use in housing and other light building construction are projected because of the likely pen- etration of oriented strandboard and waferboard products in these uses caused by price and environ- mental factors. After 2000, the projected rates of increase or decrease for the various product end-use factors were reduced, recognizing that continued change becomes more difficult as markets are satu- rated or as market share approaches zero. This phe- nomenon of declining rates of substitution as limits of market share (0 or 1) are approached may reflect sharply declining importance of the product in total cost or other factors. An example in the forest prod- ucts sector is the case of insulation board used in residential construction, where there has been exten- sive displacement by other products, but reduction in market share has slowed sharply short of zero.
For lumber and structural panels, projected use factors were based on two calculations. First, upper and lower limits for each factor were calculated. The upper limit estimates the potential max imum level that a product 's end-use factor might reach if its substitutes are consistently more costly to use. Simi- larly, the lower limit is the min imum potential level to which its use factors might fall if the product is consistently more costly than its substitutes. This latter level need not be zero. Non-zero lower limits imply some characteristics of an end-use where there are no technically or economically feasible substi- tutes foreseen over the projection. These limits de- fine the range of possible use factor variation over time.
Second, the projected paths of the end-use factors within these limits were based on the relative in- place costs of key competing products or systems. In- place cost projections are based on calculations in- volving the amount of inputs used in competing production systems and the prices of these inputs. For example, in one aspect of residential construc- tion, we compare the relative costs of a concrete block versus treated wood foundations. These two systems use different amounts of labor, wood, and concrete, and they compete as alternative methods of founda- tion construction in single family homes.
The change in wood end-use factors over time depends on which system's position is favored by the in-place cost comparison. If the system that uses more wood is less expensive, then the end-use factor
for wood in that application rises. When the wood- intensive system is more expensive, then wood 's end-use factor falls. The amount of change is partly determined by functional relationships derived from numerical analysis of past end-use factor trends (Spelter 1984, 1985), and varies with the product and proximity of the end-use factor to its limits. Finally, these estimated relationships along with assump- tions regarding costs of non-wood inputs and end- use activities are used to make the projections of demand contained in this Update.
Demand for Pulpwood
The demand for pu lpwood is derived from the demand for paper and board, modified in the near term by increases in the use of recycled fiber. Revi- sions to paper and board demand estimates for the 1993 Update indicate a somewhat slower growth in paper and board consumption than projected in the 1989 Assessment. In the base case, paper and board consumption in the United States is projected to reach nearly 100 million tons by the year 2000, and nearly 150 million tons by the year 2040. Although these projections indicate slower growth than paper and board consumption than in the 1989 Assess- ment, the base projections still indicate increasing aggregate demand for fiber products (paper and board). In the base projection, the United States would maintain per capita consumption levels (cur- rently about 700 pounds per capita) for paper and board that are much higher than in other industrial countries (Ince 1994). Fundamenta l determinants of demand for paper and board are gross domestic product (GDP) and population, with d o w n w a r d adjustments 'in relationships of demand to GDP re- flecting some anticipated substitution of paper and board products by electronic media, plastics, etc. Demand for pu lpwood is determined by regional production capacities and production volumes by process for paper and board commodities. Produc- tion capacities by process are projected to change over time, in response to demand growth and market conditions, with growth by process determined by relative profitability and costs of each process. Pro- cesses encompass recycled and virgin fiber technolo- gies.
An important change in the Update was linkage of the model of the pulp and paper sector (the North
L 8
American Pulp and Paper or NAPAP Model) 6 and TAMM/ATLAS in an iterative solution process to arrive at a set of fiber requirements that balance prices, timber removals and timber inventories in both models. This solution method approximates how the solid wood and fiber sectors interact thro.ugh the market for pulpwood.
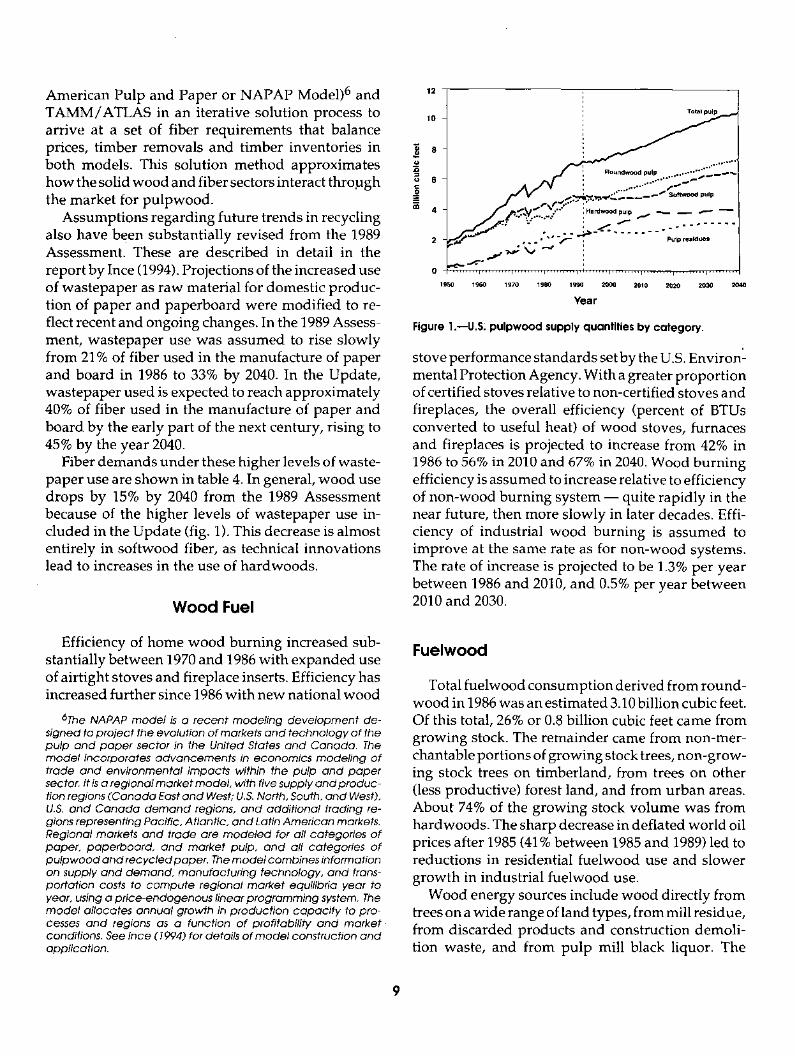
Assumptions regarding future trends in recycling also have been substantially revised from the 1989 Assessment. These are described in detail in the report by Ince (1994). Projections of the increased use of wastepaper as raw material for domestic produc- tion of paper and paperboard were modified to re- flect recent and ongoing changes. In the 1989 Assess- ment, wastepaper use was assumed to rise slowly from 21% of fiber used in the manufacture of paper and board in 1986 to 33% by 2040. In the Update, wastepaper used is expected to reach approximately 40% of fiber used in the manufacture of paper and board by the early part of the next century, rising to 45% by the year 2040.
Fiber demands under these higher levels of waste- paper use are shown in table 4. In general, wood use drops by 15% by 2040 from the 1989 Assessment because of the higher levels of wastepaper use in- cluded in the Update (fig. 1). This decrease is almost entirely in softwood fiber, as technical innovations lead to increases in the use of hardwoods.
Wood Fuel
Efficiency of home wood burning increased sub- stantially between 1970 and 1986 with expanded use of airtight stoves and fireplace inserts. Efficiency has increased further since 1986 with new national wood
6The NAPAP model is a recent modeling development de- signed to project the evolution of markets and technology of the pulp and paper sector in the United States and Canada. The model incorporates advancements in economics modeling of trade and environmental impacts within the pulp and paper sector. It is a regional market model, with five supply and produc- tion regions (Canada East and West; U.S. North, South, and West), U.S. and Canada demand regions, and additional trading re- gions representing Pacific, Atlantic, and Latin American markets. Regional markets and trade are modeled for aft categories of paper, paperboard, and market pulp, and all categories of pulpwood and recycled paper. The model combines information on supply and demand, manufacturing technology, and trans- portation costs to compute regional market equilibria year to year, using a price-endogenous linear programming system. The model aflocates annual growth in production capacity to pro- cesses and regions as a function of profitability and market. conditions. See Ince (1994) for details of model construction and application.
"R
=_
12
10
8
6
4
2
0
, , . , . . . . ,-"~
' Roundwood pu p " " * ' " " " m ~ ' ~ '
. . . .
. . . . . . . . . I . . . . . . . . . I . . . . . . . . . I . . . . . . . . . i l l . . . . . . . ] . . . . . . . . . I . . . . . . . . . I . . . . . . . . . I . . . . . . . . .
1950 1960 1970 1980 1990 2000 2010 2020 2030 2040
Year
Figure I.--U.S. pulpwood supply quantities by category.
stove performance standards set by the U.S. Environ'- mental Protection Agency. With a greater proport ion of certified stoves relative to non-certified stoves and fireplaces, the overall efficiency (percent of BTUs converted to useful heat) of wood stoves, furnaces and fireplaces is projected to increase from 42% in 1986 to 56% in 2010 and 67% in 2040. Wood burning efficiency is assumed to increase relative to efficiency of non-wood burning system - - quite rapidly in the near future, then more slowly in later decades. Effi- ciency of industrial wood burning is assumed to improve at the same rate as for non-wood systems. The rate of increase is projected to be 1.3% per year between 1986 and 2010, and 0.5% per year between 2010 and 2030.
Fuelwood
Total fuelwood consumption derived from round- wood in 1986 was an estimated 3.10 billion cubic feet. Of this total, 26% or 0.8 billion cubic feet came from growing stock. The remainder came from non-mer- chantable portions of growing stock trees, non-grow- ing stock trees on timberland, from trees on other (less productive) forest land, and from urban areas. About 74% of the growing stock volume was from hardwoods. The sharp decrease in deflated world oil prices after 1985 (41% between 1985 and 1989) led to reductions in residential fuelwood use and slower growth in industrial fuelwood use.
Wood energy sources include wood directly from trees on a wide range of land types, from mill residue, from discarded products and construction demoli- tion waste, and from pulp mill black liquor. The
9
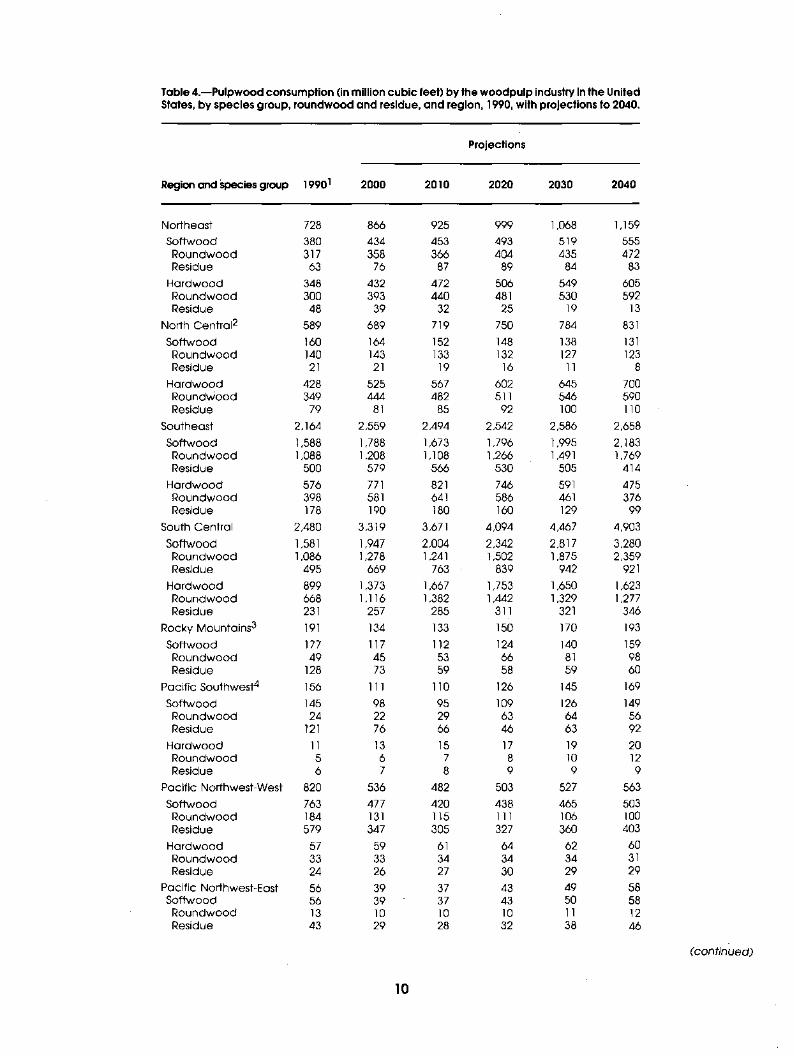
Table 4.--Pulpwood consumption (in million cubic feet) by the woodpulp industry in the United States, by species group, roundwood and residue, and region, 1990, with projections to 2040.
Projections
Region and species group 19901 2000 2010 2020 2030 2040
Northeast 728 866 925 999 1,068 1,159
Softwood 380 434 453 493 519 555 Roundwood 317 358 366 404 435 472 Residue 63 76 87 89 84 83
Hardwood 348 432 472 506 549 605 Roundwood 300 393 440 481 530 592 Residue 48 39 32 25 19 13
North Central 2 589 689 719 750 784 831
Softwood 160 164 152 148 138 131 Roundwood 140 143 133 132 127 123 Residue 21 21 19 16 11 8
Hardwood 428 525 567 602 645 700 Roundwood 349 444 482 511 546 590 Residue 79 81 85 92 100 110
Southeast 2,164 2,559 2,494 2,542 2,586 2,658
Softwood 1,588 1,788 1,673 1,796 1,995 2,183 Roundwood 1,088 1,208 1,108 1,266 1,491 1,769 Residue 500 579 566 530 505 414
Hardwood 576 771 821 746 591 475 Roundwood 398 581 641 586 461 376 Residue 178 190 180 160 129 99
South Central 2,480 3,319 3,671 4,094 4,467 4,903
Softwood 1,581 1,947 2,004 2,342 2,817 3,280 Roundwood 1,086 1,278 1,241 1,502 1,875 2,359 Residue 495 669 763 839 942 921
Hardwood 899 1,373 1,667 1,753 1,650 1,623 Roundwood 668 1,116 1,382 1,442 1,329 1,277 Residue 231 257 285 311 321 346
Rocky Mountains 3 191 134 133 150 170 193
Softwood 177 117 112 124 140 159 Roundwood 49 45 53 66 81 98 Residue 128 73 59 58 59 60
Pacific Southwest 4 156 111 110 126 145 169
Softwood 145 98 95 109 126 149 Roundwood 24 22 29 63 64 56 Residue 121 76 66 46 63 92
Hardwood 11 13 15 17 19 20 Roundwood 5 6 7 8 10 12 Residue 6 7 8 9 9 9
Pacific Northwest-West 820 536 482 503 527 563
Softwood 763 477 420 438 465 503 Roundwood 184 131 115 111 106 100 Residue 579 347 305 327 360 403
Hardwood 57 59 61 64 62 60 Roundwood 33 33 34 34 34 31 Residue 24 26 27 30 29 29
Pacific Northwest-East 56 39 37 43 49 58 Softwood 56 39 37 43 50 58 Roundwood 13 10 10 10 11 12 Residue 43 29 28 32 38 46
(continued)
10
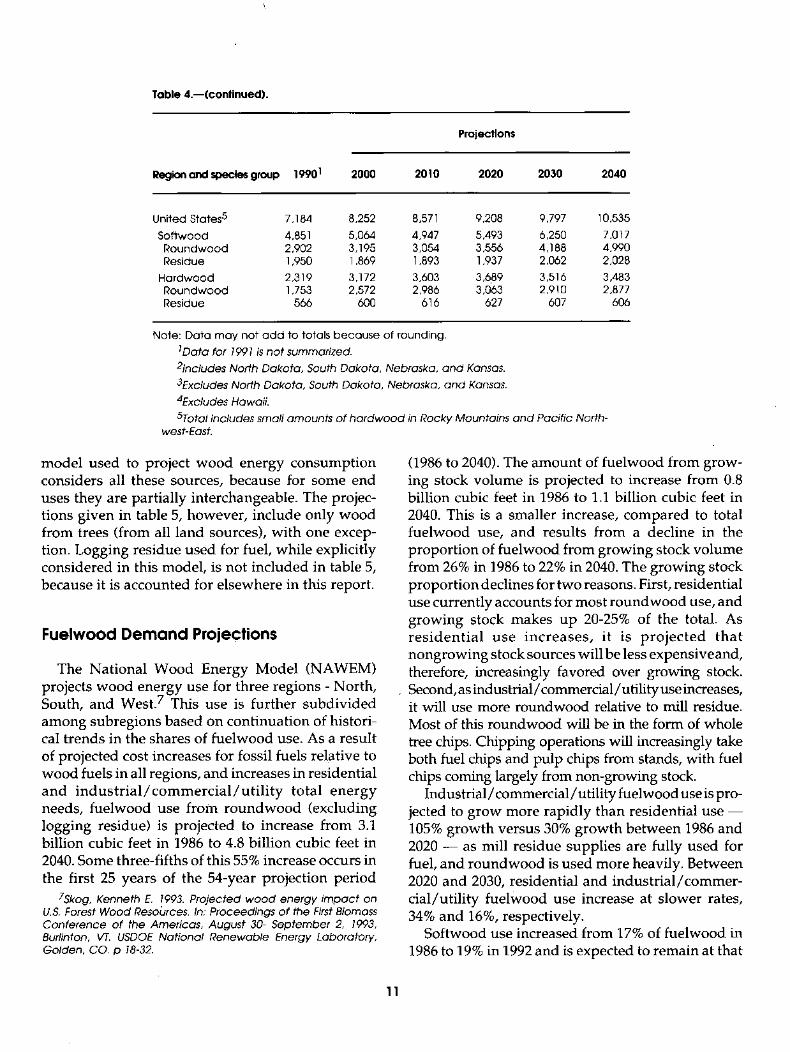
Table 4.re(continued).
Projections
Region and species group 19901 2000 2010 2020 2030 2040
United States 5 7,184 8,252 8,571 9,208 9,797 10,535
Softwood 4,851 5,064 4,947 5,493 6,250 7,017 Roundwood 2,902 3,195 3,054 3,556 4,188 4,990 Residue 1,950 1,869 1,893 1,937 2,062 2,028
Hardwood 2,319 3,172 3,603 3,6,89 3,516 3,483 Roundwood 1,753 2,572 2,986 3,063 2,910 2,877 Residue 566 600 616 627 607 606
Note: Data may not add to totals because of rounding.
1Data for 1991 is not summarized. 2Includes North Dakota, South Dakota, Nebraska, and Kansas. 3Excludes North Dakota, South Dakota, Nebraska, and Kansas. 4Excludes Hawafi.
5Total includes small amounts of hardwood in Rocky Mountains and Pacific North- west-East.
mode l used to project w o o d energy consumpt ion considers all these sources, because for some end uses they are partially interchangeable. The projec- tions given in table 5, however , include only w o o d from trees (from all land sources), wi th one excep- tion. Logging residue used for fuel, while explicitly considered in this model , is not inc luded in table 5, because it is accounted for elsewhere in this report.
Fuelwood Demand Projections
The National Wood Energy Model (NAWEM) projects w o o d energy use for three regions - North, South, and West. 7 This use is fur ther subd iv ided a m o n g subregions based on cont inuat ion of histori- cal t rends in the shares of fue lwood use. As a result of projected cost increases for fossil fuels relative to wood fuels in all regions, and increases in residential and i n d u s t r i a l / c o m m e r c i a l / u t i l i t y total ene rgy needs, fue lwood use f rom r o u n d w o o d (excluding logging residue) is projected to increase f rom 3.1 billion cubic feet in 1986 to 4.8 billion cubic feet in 2040. Some three-fifths of this 55% increase occurs in the first 25 years of the 54-year projection per iod
7Skog, Kenneth E. 1993. Projected wood energy impact on U.S. Forest Wood Resources. In: Proceedings of the First Biomass Conference of the Americas, August 30- September 2, 1993, Burlinton, VT. USDOE National Renewable Energy Laboratory, Golden, CO. p 18-32.
(1986 to 2040). The a m o u n t of fue lwood f rom grow- ing stock vo lume is projected to increase f rom 0.8 billion cubic feet in 1986 to 1.1 billion cubic feet in 2040. This is a smaller increase, compared to total fue lwood use, and results f rom a decline in the propor t ion of fue lwood f rom growing stock vo lume from 26% in 1986 to 22% in 2040. The growing stock propor t ion declines for two reasons. First, residential use current ly accounts for most r o u n d w o o d use, and growing stock makes up 20-25% of the total. As r e s i d e n t i a l u se inc reases , it is p r o j e c t e d tha t nong rowing stock sources will be less expensiveand, therefore, increasingly favored over growing stock. Second, as industr ial /commercial /ut i l i ty use increases, it will use more roundwood relative to mill residue. Most of this roundwood will be in the form of whole tree chips. Chipping operations will increasingly take both fuel chips and pulp chips from stands, with fuel chips coming largely from non-growing stock.
Indust r ia l /commercia l /u t i l i ty fuelwood use is pro- jected to g row more rapidly than residential use - - 105% growth versus 30% growth be tween 1986 and 2020 - - as mill residue supplies are fully used for fuel, and r o u n d w o o d is used more heavily. Between 2020 and 2030, residential and indus t r i a l / commer - cial /ut i l i ty fue lwood use increase at s lower rates, 34% and 16%, respectively.
Sof twood use increased from 17% of fue lwood in 1986 to 19% in 1992 and is expected to remain at that
11

Table 5.--Fuelwood consumed (in billion cubic feet) in the United States by species group, and growing stock/non growing stock source, in 1986 with projections to 2040.
Roundwood Growing stock
Hard- Soft Hard- Soft- Year Total wood wood Total wood wood
Northeast
1986 0.98 0.89 0,08 0,13 0.12 0,01 2000 1.19 1,04 0,16 0.18 0,14 0.04 2010 1,34 1,12 0,22 0.20 0,15 • 0.05 2020 1,39 1,19 0,20 0,20 O, 16 0.05 2030 1,47 1.30 O, 17 0,20 O, 16 0.04 2040 1,59 1.45 0,14 0,21 0.18 0,03
North Central
1986 0.85 0,81 0.04 O, 11 0.11 0,01 2000 1,00 0,92 0,08 O, 15 O. 13 0,02 2010 1.10 0.98 0.12 0.16 0.13 0.03 2020 1,14 1.02 0,12 0.17 0,14 0.03 2030 1.21 1,10 0,10 0,16 0.14 0,02 2040 1,31 1.21 0,09 0.17 0.15 0,02
South
1986 0,74 0,68 0.06 0.33 0,29 0.04 2000 0.80 0.74 0.06 0,37 0,32 0.04 2010 0.86 0,75 0,12 0,40 0,32 0.07 2020 0,88 0.77 O. 10 0,38 0.32 0,06 2030 0,91 0.85 0,07 0.36 0,31 0.05 2040 1,00 0.93 0,07 0.35 0,30 0.06
Rocky Mountains
1986 0,10 0,03 0.08 0,01 0.00 0,01 2000 O. 11 0,03 0.08 0,01 0,00 0.01 2010 0.12 0.03 0,09 0.01 0.00 0,01 2020 0.14 0,04 0.10 0,01 0.00 0,01 2030 O, 15 0.05 O, 10 0,01 0.00 0,01 2040 O, 17 0.05 O, 12 0,02 0.00 0,01
Pacific Coast
1986 0,43 0.17 0,26 0.22 0.08 0,14 2000 0.46 O, 17 0,29 0,26 0.09 O, 17 2010 0,52 0,19 0,32 0.29 0,11 0.18 2020 0.57 0,21 0,36 0,30 0.11 0.19 2030 0,65 0.25 0.40 0.30 O. 11 O, 19 2040 0.74 0,25 0,49 0,30 0.12 0.18
United States
1986 3.10 2.58 0.52 0.80 0.60 0,20 2000 3,56 2.90 0,67 0.96 0,69 0.28 2010 3.95 3,07 0.88 1.06 0.71 0.35 2020 4,11' 3,24 0,88 1.07 0,73 0.34 2030 4,39 3,55 0.84 1.03 0,72 0.30 2040 4,81 3,90 0,91 1,05 0.75 0.30
level. The proportion of softwood roundwood use in 1986 varied from 73% and 64% for the Rocky Moun- tains and Pacific Coast Regions to less than 10% in other regions. The Northeast, North Central, and
South have the largest total fuelwood use at present; this predominance is projected to continue through 2040. The most rapid growth in demand is projected for the Pacific Coast, Rocky Mountains, and North- east with increases of 73%, 64%, and 63%, respec- tively, between 1986and 2040.
Trade Projections
Most solid wood trade flow projections are devel- oped by analysis outside of TAMM/ATLAS. The single exception is the importation of softwood lum- ber from Canada that is explicitly considered in the model. These projections include:
• Softwood lumber: exports; imports from coun- tries other than Canada.
• Hardwood lumber: exports; imports.
• Structural Panels: plywood imports, exports; oriented strandboard/waferboard imports, exports.
• Non-structural Panels: hardwood plywood imports, exports; insulating board imports, exports; hardboard imports, exports; particle- board imports, exports.
• Logs: softwood imports, exports; hardwood imports, exports.
Specific assumptions are shown in chapter 3 in tables for specific products. Methodologies used for these projections vary from product to product, but most rest on the experience and judgment of Update analysts and reflect continuation Of current trends.
TIMBER SUPPLY ASSUMPTIONS
The supply of timber at any point in time is mod- eled, in part, as a function of private timber inventory levels, stumpage prices, and the amount of public harvest available. Projections require models of for- est growth, and assumptions on private timberland
• management, timberland area change and forest type transition, the efficiency of harvest utilization, har- vest flows from public timberlands, and an array of market forces.
12
Several modeling changes have taken place since the 1989 Assessment. First, new timber inventories for the entire South required an update and review of parameters for growth and yield relations in the South. Second, the Rocky Mountain region was split into northern and southern subregions, and all growth and yield parameters were updated. New invento- ries were available for the two states in the northern subregion (Idaho and Montana). Third, the Douglas- fir subregion in the Pacific Northwest was updated with a new inventory from western Washington.
Inventory Projection System
The Aggregate Timberland Assessment System (ATLAS; Mills and Kincaid 1992) was used to project inventories on the approximately 343 million acres of privately owned timberland. This system is a time- based, deterministic framework that allows for customization of inputs to reflect regional and subre- gional timber growth and yield attributes. The tim- ber inventory data were derived from 79,000 plot summary records provided by various USDA Forest Service Forest Inventory and Analysis (FIA) Units. These inventories were aggregated into strata de- fined by 9 regions, 2 ownerships, up to 10 forest types, and 18 age classes. Three site classes and five management types were developed for the South and in the Pacific Northwest Douglas-fir regions. In other regions, only one site group and one manage- ment intensity type were used. Age class intervals were set at 5 years in the South and 10 years else- where.
Projection periods for these strata are consistent with inventory age classes. The projection mecha- nism computes growth using density standards (yield tables) and density change parameters. Each cell in the starting inventory has an independent yield func- tion. Growth is the result of an interaction between the current stocking density, the yield standard, and the density change function. Projected cells reflect net cubic feet of inventory growing stock. Private harvests are generated through an interaction be- tween ATLAS and TAMM that results in an equilib- rium solution between supply and demand in both product and stumpage markets.
In principle, ATLAS is not strictly an even-aged model. When inputs are aggregated at the regional level, age classes function, in effect, like growth
classes. Growth and harvest take place across this range of classes. The ATLAS harvest mechanism can account for both partial harvests and commercial thinning. Final harvest also can be proportioned across a range of age classes: the treated acres may be regenerated in alternative management levels, as- sumed to change timber type, or withdrawn from the timberland base.
The area change and type transition inputs for this Update were derived from other models (see the 1989 Assessment). Yield tables and density change parameters were either computed from the FIA plot data, derived from previous studies, generated from other models, or acquired from published sources. 8
Timber Management Assumptions
A major attribute of the ATLAS model is that it can simulate the shifting of acres into management in- tensities and compute resulting changes in yields based upon alternative assumptions about future land management activities. This mechanism was implemented for the two Southern regions and the Pacific Northwest Douglas-fir subregion. In each case, five alternative management intensities were developed.
In the South, it was assumed that intensive site preparation and management would occur on pine plantations in the industry and corporate owner- ships. New inventories were fitted to the yields and growth coefficients developed for the 1989 Assess- ment. The management alternatives were: (1) regular planted stock without thinning, (2) regular planting stock with thinning, (3) genetically improved plant- ing stock without thinning, (4) genetically improved planting stock with thinning, and (5) genetically improved planting stock without thinning but with the most intensive site-preparation and manage- ment practices. Past 1995, it was assumed that all new pine plantations would be planted with genetically improved stock. By 1995, it was also assumed that 50% of all new pine plantations established on indus- try land were enrolled in management intensity 5. Slightly lower levels were assumed on other corpo- rate lands, and on the farmer and other private ownership only 5% of the plantation acres were
8The inventory data inputs and assumptions are summarized in Inventory, growth and management assumptions for the 1993 RPA timber assessment, Mills 1993.
13
enrolled in management intensity 5. Stands of natu- ral pine also included a management intensity for commercial thinning, but no shifts in management occur in the projection.
In the Pacific Northwest Douglas-fir subregion, five management intensities were developed for the Douglas-fir, and two were developed for western hemlock and mixed conifer types. These five were (1) custodial management, (2) plant only, (3) plant and precommercial thin, (4) genetically improved plant- ing stock with precommercial thinning and fertiliza- tion, and (5) management intensity 4 plus commer- cial thinning. Enrollment rates varied by site produc- tivity class and by ownership. Industrial owners are assumed to shift between 90% and 95% of regener- ated acres out of the custodial class, while the same shift for Other private owners is about 50% to 55 %. On industry lands, generally 55% to 60% of regeneration was to management intensity 4; meanwhile, on other private ownerships, this management intensity re- ceived 15% to 30% of regenerated acres. On medium and high site industry lands, management intensity 5 received between 10% and 15% of regeneration, while equivalent sites on other private ownerships received 5%. Depending on ownership and site class, between 20% and 35% of regeneration is split be- tween management intensities 2 and 3.
The alternative management intensity for western hemlock assumed planting and precommercial thin- ning. The shift on industry lands was between 40% and 70% of regeneration from low to high site classes, while on other private ownerships the parallel shift was between 20% and 50%. The alternate manage- ment intensity for the mixed conifer type assumed to be Douglas-fir management intensity 2. For both ownerships and across all site classes, 50% of all mixed conifer regeneration was to Douglas-fir.
Projected Area Changes for Forest Ownerships and Forest Management Types
Projections of timber supply and corresponding prices are sensitive to the assumptions made regard- ing future forest area. Forest area assumptions in- clude changes in area by ownership, forest manage- ment type, and site (Alig et al. 1983). Projections of area changes for the timberland base were made for the North, South, Rocky Mountains and Great Plains, and the Pacific Coast. Within sections, projections
were made fo r two private forest ownership classes-- forest industry, and farmer and other private; and public timberland projections were provided by pub- lic agency personnel. The area projection methods and results are described in more detail in a support- ing technical document (USDA Forest Service 1989), and state level projections are discussed by Alig and others (1990). Projections of timberland area are based on competitive economic returns from land alterna- tive uses, including demographic and public policy influences on economic returns. These projections also considered public programs (e.g. the CRP tree planting program 9) designed to expand forest area. Other than changes for Indian lands these projec- tions have not been changed for the Assessment Update, and are summarized in table 6. The sensitiv- ity of the forest sector to key, but uncertain, determi- nants of land use (e.g. changes in agricultural poli- cies) are examined in chapter 4, where we look at an hypothetical scenario dealing with an expanded tree planting program designed to increase the seques- tration of atmospheric carbon.
Adjustments for Timber Removals
Estimates of timber harvest (also called round- wood supplies) include removals from several dif- ferent sources. The most important source (in an inventory accounting sense) are those from growing stock. These include: (1) harvest of roundwood prod- ucts, such as sawlogs, veneer logs, and pulpwood from growing stock; (2) logging residues; and (3) other removals resulting from noncommercial thinnings, changes in land use such as clearing for cropland, highways or housing developments, and withdrawal of commercial timberland for parks, wildernesses, and other nontimber uses.
The projected supplies (harvest) of roundwood products are internally generated in TAMM/AT- LAS. Timber removals are determined by adjusting
9The Conservation Reserve Program (CRP) was intended to convert up to 45 million acres of highly erodible or otherwise environmentally sensifive cropland to permanent cover. The 1990 Farm Bill authorized the continuation up through 1995 of the CRP, which was init iated through the Conservation Title of the Food Security Ac t of 1985. A total of 2.5 million acres of trees have been p lanted in the CRP, with owners receiving cost-sharing for estab- lishment costs and annual land rental payments for 10 years. The 1995 Farm Bill will present opportunities through a new conserva- tion title to convert some CRP grassland to trees and to achieve the original goal of plant ing 12.5% of CRP acres to trees (Soft and Water Conservation Society 1994).
14
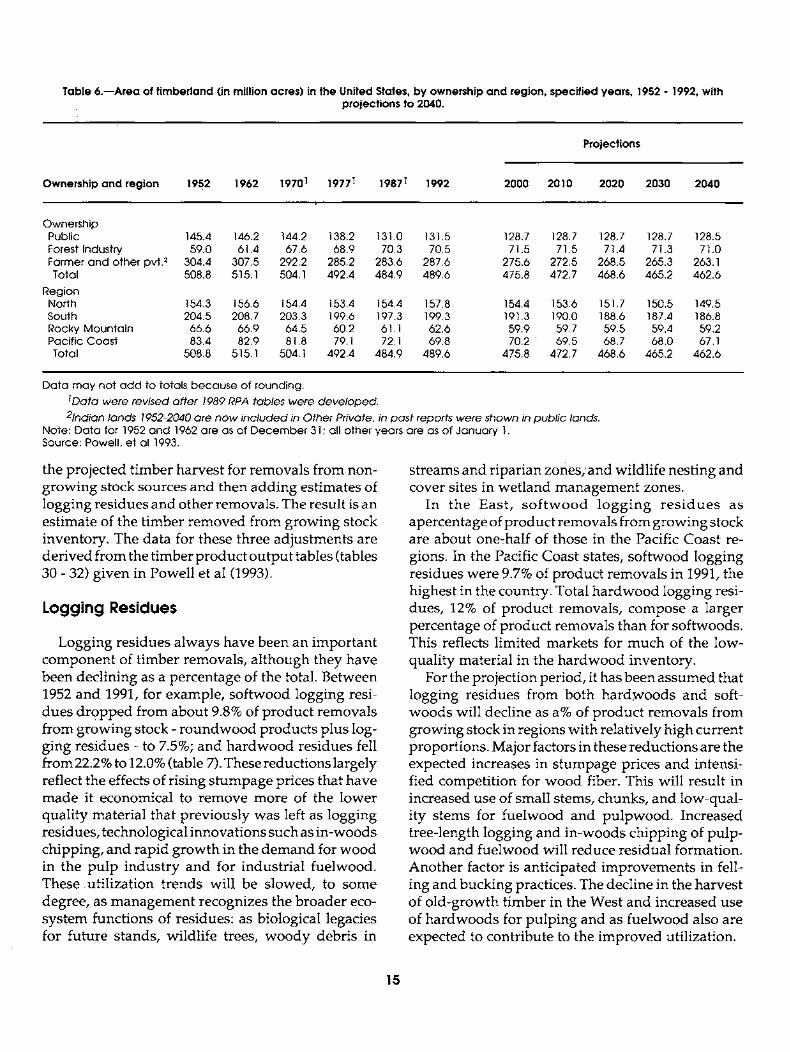
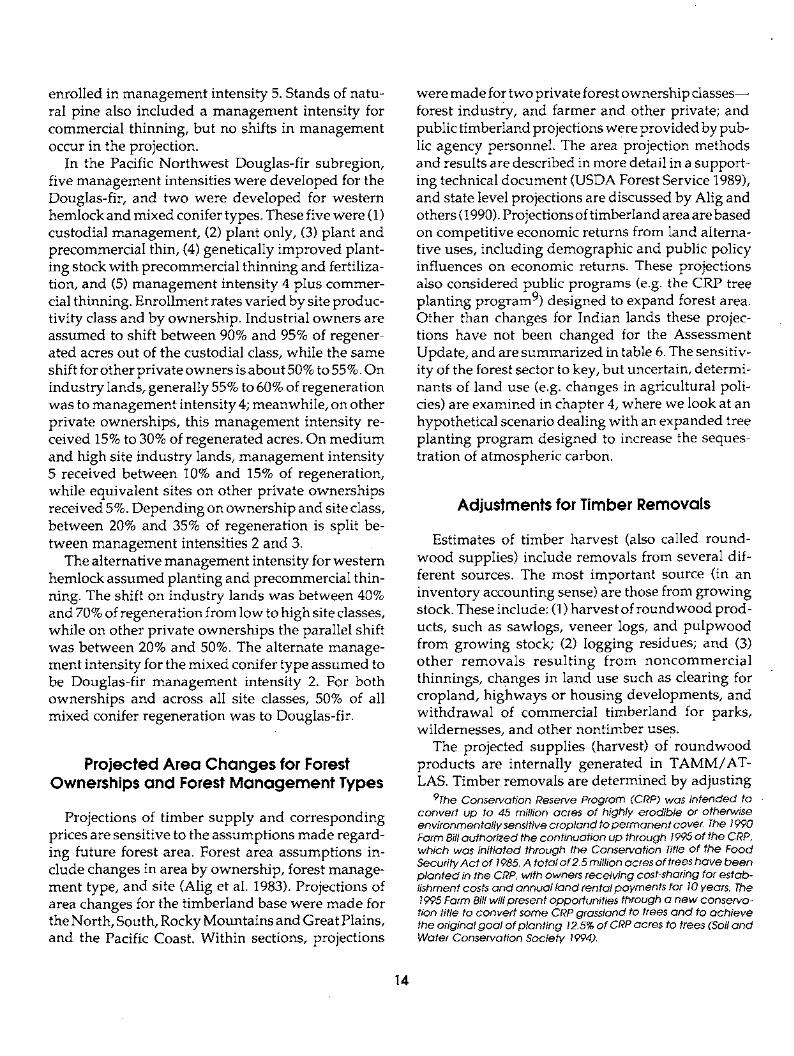
Table 6 .mArea of t imberland (in million acres) in the United States, by ownership and region, specified years, 1952 - 1992, with projections to 2040.
Ownership and region 1952 1962
Projections
19701 19771 19871 1992 2000 2010 2020 2030 2040
Ownership Public 145.4 146.2 144.2 138.2 131.0 131.5 128.7 128.7 128.7 128.7 128.5 Forest Industry 59.0 61.4 67.6 68.9 70.3 70.5 71.5 71.5 71.4 71.3 71.0 Farmer and other pvt. 2 304.4 307.5 292.2 285.2 283.6 287.6 275.6 272.5 268.5 265.3 263.1 Total 508.8 515.1 504.1 492.4 484.9 489.6 475.8 472.7 468.6 465.2 462.6
Region North 154.3 156.6 154.4 153.4 154.4 157.8 154.4 153.6 151.7 150.5 149.5 South 204.5 208.7 203.3 199.6 197.3 199.3 191.3 190.0 188.6 187.4 186.8 Rocky Mounta in 66.6 66.9 64.5 60.2 61.1 62.6 59.9 59.7 59.5 59.4 59.2 Pacific Coast 83.4 82.9 81.8 79.1 72.1 69.8 70.2 " 69.5 68.7 68.0 67.1 Total 508.8 515.1 504.1 492.4 484.9 489.6 475.8 472.7 468.6 465.2 462.6
Data may not a d d to totals because of rounding.
1Data were revised after 1989 RPA tables were deve loped.
2Indian lands 1952-2040 are n o w inc luded in Other Private, in past reports were shown in pub l ic lands. Note: Data for 1952 and 1962 are as of December 31; all other years are as of January 1. Source: Powell, et al 1993.
the projected timber harvest for removals from non- growing stock sources and then adding estimates of logging residues and other removals. The result is an estimate of the timber removed from growing stock inventory. The data for these three adjustments are derived from the timber product output tables (tables 30 - 32) given in Powell et al (1993).
Logging Residues
Logging residues always have been an important component of timber removals, although they have been declining as a percentage of the total. Between 1952 and 1991, for example, softwood logging resi- dues dropped from about 9.8% of product removals from growing stock - roundwood products plus log- ging residues - to 7.5%; and hardwood residues fell from 22.2% to 12.0% (table 7). These reductions largely reflect the effects of rising stumpage prices that have made it economical to remove more of the lower quality material that previously was left as logging residues, technological innovations such as in-woods chipping, and rapid growth in the demand for wood in the pulp industry and for industrial fuelwood. These utilization trends will be slowed, to some degree, as management recognizes the broader eco- system functions of residues: as biological legacies for future stands, wildlife trees, woody debris in
streams and riparian zones;and wildlife nesting and cover sites in wetland management zones.
In the East, sof twood logging res idues as apercentage of product removals from growing stock are about one-half of those in the Pacific Coast re- gions. In the Pacific Coast states, softwood logging residues were 9.7% of product removals in 1991, the highest in the country. Total hardwood logging resi- dues, 12% of product removals, compose a larger percentage of product removals than for softwoods. This reflects limited markets for much of the low- quality material in the hardwood inventory.
For the projection period, it has been assumed that logging residues from both hardwoods and soft- woods will decline as a% of product removals from growing stock in regions with relatively high current proportions. Major factors in these reductions are the expected increases in stumpage prices and intensi- fied competition for wood fiber. This will result in increased use of small stems, chunks, and low-qual- ity stems for fuelwood and pulpwood. Increased tree-length logging and in-woods chipping of pulp- wood and fuelwood will reduce residual formation. Another factor is anticipated improvements in fell- ing and bucking practices. The decline in the harvest of old-growth timber in the West and increased use of hardwoods for pulping and as fuelwood also are expected to contribute to the improved utilization.
15
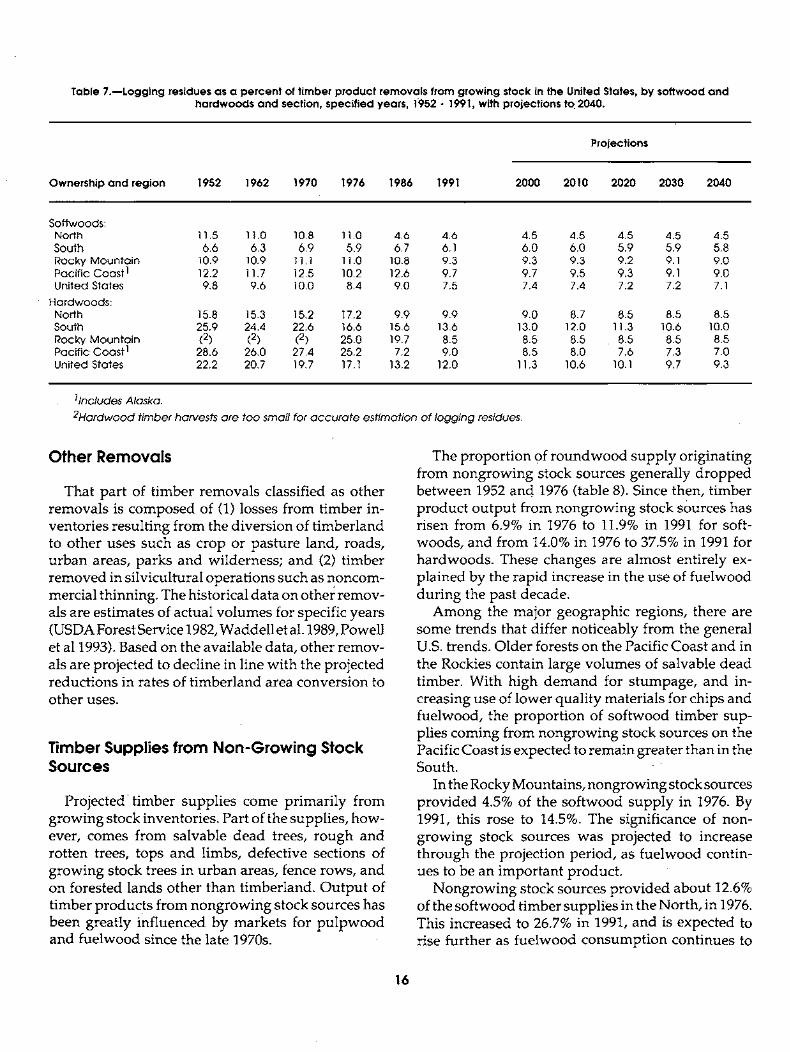
Table 7.ELogging residues as a percent of timber product removals from growing stock in the United States, by softwood and hardwoods and section, specified years, I952 - 1991, with projections to 2040.
Projections
Ownership and region 1952 1962 1970 1976 1986 1991 2000 2010 2020 2030 2040
Softwoods: North 11.5 11.0 10.8 11.0 4.6 4.6 4.5 4.5 4.5 4.5 4.5 South 6.6 6.3 6.9 5.9 6.7 6.1 6.0 6.0 5.9 5.9 5.8 Rocky Mountain 10.9 10.9 11.1 11.0 10.8 9.3 9.3 9.3 9.2 9.1 9.0 Pacific Coast 1 12.2 11.7 12.5 10.2 12.6 9.7 9.7 9.5 9.3 9.1 9.0 United States 9.8 9.6 10.0 8.4 9.0 7.5 7.4 7.4 7.2 7.2 7.1
Hardwoods: North 15.8 15.3 15.2 17.2 9.9 9.9 9.0 8.7 8.5 8.5 8.5 South 25.9 24.4 22.6 16.6 15.6 13.6 13.0 12.0 11.3 10.6 10.0 Rocky Mountain (2) (2) (2) 25.0 19.7 8.5 8.5 8.5 8.5 8.5 8.5 Pacific Coast 1 28.6 26.0 27.4 25.2 7.2 9.0 8.5 8.0 7.6 7.3 7.0 United States 22.2 20.7 19.7 17.1 13.2 12.0 11.3 10.6 10.1 9.7 9.3
l lncludes Alaska.
2Hardwood t imber harvests are too small for accurate estimation of logging residues.
Other Removals
That part of t imber removals Classified as other removals is composed of (1) losses from timber in- ventories resulting from the diversion of t imberland to other uses such as crop or pasture land, roads, urban areas, parks and wilderness; and (2) timber removed in silvicultural operations such as noncom- mercial thinning. The historical data on other remov- als are estimates of actual volumes for specific years (USDA Forest Service 1982, Waddell et al. 1989, Powell et a11993). Based on the available data, other remov- als are projected to decline in line with the projected reductions in rates of t imberland area conversion to other uses.
Timber Supplies from Non-Growing Stock Sources
Projected timber supplies come primarily from growing stock inventories. Part of the supplies, how- ever, comes from salvable dead trees, rough and rotten trees, tops and limbs, defective sections of growing stock trees in urban areas, fence rows, and on forested lands other than timberland. Output of timber products from nongrowing stock sources has been greatly influenced by markets for pu lpwood and fuelwood since the late 1970s.
The proportion of roundwood supply originating from nongrowing stock sources generally dropped between 1952 and 1976 (table 8). Since then, t imber product output from nongrowing stock sources has risen from 6.9% in 1976 to 11.9% in 1991 for soft- woods, and from 14.0% in 1976 to 37.5% in 1991 for hardwoods. These changes are almost entirely ex- plained by the rapid increase in the use of fuelwood during the past decade.
Among the major geographic regions, there are some trends that differ noticeably from the general U.S. trends. Older forests on the Pacific Coast and in the Rockies contain large volumes of salvable dead timber. With high demand for stumpage, and in- creasing use of lower quality materials for chips and fuelwood, the proportion of softwood timber sup- plies coming from nongrowing stock sources on the Pacific Coast is expected to remain greater than in the South.
In the Rocky Mountains, nongrowing stock sources provided 4.5% of the softwood supply in 1976. By 1991, this rose to 14.5%. The significance of non- growing stock sources was projected to increase through the projection period, as fuelwood contin- ues to be an important product.
Nongrowing stock sources provided about 12.6% of the softwood timber supplies in the North, in 1976. This increased to 26.7% in 1991, and is expected to rise further as fuelwood consumption continues to
16
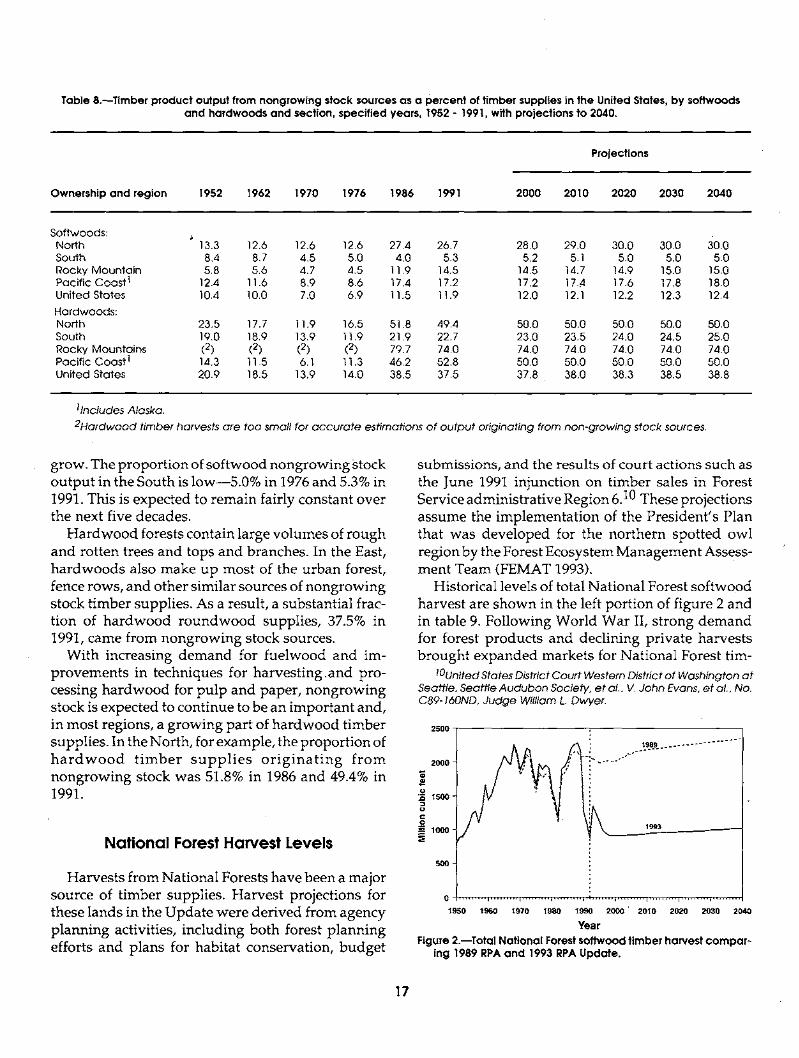
Table 8.--Timber product output from nongrowing stock sources as a percent of timber supplies in the United States, by softwoods and hardwoods and section, specified years, 1952 - 1991, with projections to 2040.
Projections
Ownership and region 1952 1962 1970 1976 1986 1991 2000 2010 2020 2030 2040
Softwoods: North 13.3 12.6 12.6 12,6 27.4 26.7 28.0 29.0 30,0 30.0 30.0 South 8.4 8.7 4.5 5.0 4.0 5.3 5.2 5.1 5.0 5.0 5.0 Rocky Mountain 5.8 5.6 4.7 4.5 11.9 14,5 14.5 14.7 14.9 15.0 15.0 Pacific Coast 1 12.4 11.6 8.9 8.6 17.4 17.2 17.2 17..4 17.6 17.8 18.0 United States 10.4 10.0 7.0 6.9 11.5 11.9 12.0 12.1 12.2 12.3 12.4
Hardwoods: North 23.5 17,7 11.9 16.5 51.8 49.4 50.0 50.0 50,0 50.0 50.0 South 19.0 18.9 13.9 11.9 21.9 22.7 23.0 23.5 24.0 24.5 25.0 Rocky Mountains (2) (2) (2) (2) 79.7 74.0 74.0 74.0 74,0 74.0 74.0 Pacific Coast 1 14.3 11.5 6.1 11.3 46.2 52.8 50.0 50.0 50.0 50.0 50.0 United States 20.9 18.5 13.9 14.0 38.5 37.5 37.8 38.0 38.3 38.5 38.8
1Includes Alaska,
2Hardwood timber harvests are too small for accurate estimations of output originating from non-growing stock sources,
grow. The proportion of softwood nongrowing Stock output in the South is low--5.0% in 1976 and 5.3% in 1991. This is expected to remain fairly constant over the next five decades.
Hardwood forests contain large volumes of rough and rotten trees and tops and branches. In the East, hardwoods also make up most of the urban forest, fence rows, and other similar sources of nongrowing stock timber supplies. As a result, a substantial frac- tion of hardwood roundwood supplies, 37.5% in 1991, came from nongrowing stock sources.
With increasing demand for fuelwood and im- provements in techniques for harvesting.and pro- cessing hardwood for pulp and paper, n0ngrowing stock is expected to continue to be an important and, in most regions, a growing part of hardwood timber supplies. In the North, for example, the proportion of h a r d w o o d t imber suppl ies or ig inat ing from nongrowing stock was 51.8% in 1986 and 49.4% in 1991.
National Forest Harvest Levels
Harvests from National Forests have been a major source of timber supplies. Harvest projections for these lands in the Update were derived from agency planning activities, including both forest planning efforts and plans for habitat conservation, budget
submissions, and the results of court actions such as the June 1991 injunction on timber sales in Forest Service administrative Region 6.10 These projections assume the implementation of the President's Plan that was developed for the northern spotted owl region by the Forest Ecosystem Management Assess- ment Team (FEMAT 1993).
Historical levels of total National Forest softwood harvest are shown in the left portion of figure 2 and in table 9. Following World War II, strong demand for forest products and declining private harvests brought expanded markets for National Forest tim-
10United States District Court Western District of Washington at Seattle, Seattle Audubon Society, et al., V. John Evans, et al., No, C89-160ND, Judge William L. Dwyer.
2500
2 0 0 0 ~ " 1 9 8 9 . . . . . . . . . . . . . . . . . . .
1500 .
---- 1 0 0 0 9 3 ~
500
i
0 . . . . . . . . . i . . . . . . . . . i . . . . . . . . . i . . . . . . . . . i ,L . . . . . . . i . . . . . . . . . i . . . . . . . . . i . . . . . . . . . i . . . . . . . . .
1950 1960 1970 1980 1990 2000' 2010 2020 2030 2040
Year Figure 2.--Total Notional Forest softwood timber harvest compar-
ing 1989 RPA and 1993 RPA Update,
17
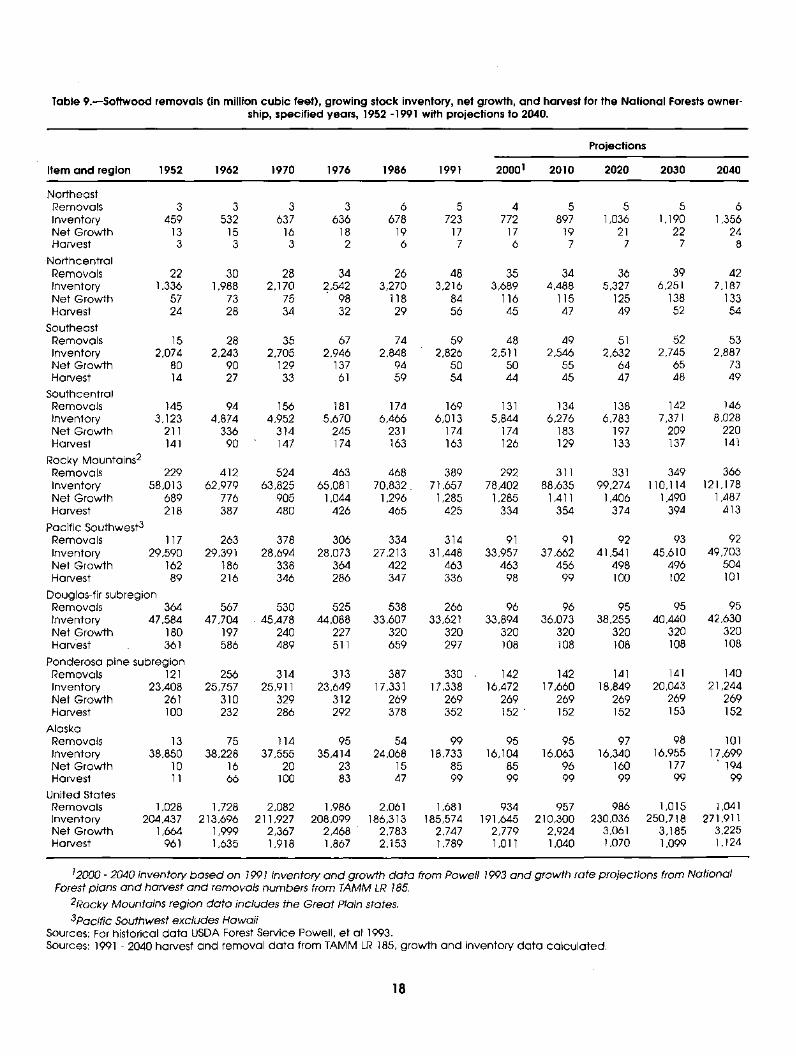
Table 9.--Softwood removals (in million cubic feet), growing stock inventory, net growth, and harvest for the National Forests owner- ship, specified years, 1952 -1991 with projections to 2040.
Projections
Item and region 1952 1962 1970 1976 1986 1991 20001 2010 2020 2030 2040
Northeast Removals 3 Inventory 459 Net Growth 13 Harvest 3
Northcentra l Removals 22 Inventory 1,336 Net Growth 57 Harvest 24
Southeast Removals 15 Inventory 2,074 Net Growth 80 Harvest 14
Southcentral Removals 145 Inventory 3,123 Net Growth 211 H a rvest 141
Rocky Mountains 2 Removals 229 Inventory 58,013 Net Growth 689 H a rvest 218
Pacific Southwest 3 Removals 117 Inventory 29,590 Net Growth 162 Harvest 89
Douglas-fir subregion Removals 364 Inventory 47,584 Net Growth 180 Harv'est 361
Ponderosa pine subregion
3 3 3 6 5 4 5 5 5 6 532 637 636 678 723 772 897 1,036 1,190 1,356
15 16 18 19 17 17 19 21 22 24 3 3 2 6 7 6 7 7 7 8
30 28 34 26 48 35 34 36 39 42 1,988 2,170 7,542 3,270 3,216 3,689 4,488 5,327 6,251 7,187
73 75 98 118 84 116 115 125 138 133 28 34 32 29 56 45 47 49 52 54
28 35 67 74 59 48 49 51 52 53 2,243 2,705 2,946 2,848 2,826 2,511 2,546 2,632 2,745 2,887
90 129 137 94 50 50 55 64 65 73 27 33 61 59 54 44 45 47 48 49
94 156 181 174 169 131 134 138 142 146 4,874 4,952 5,670 6,466 6,013 5,844 6,276 6,783 7,371 8,028
336 314 245 231 174 174 183 197 209 220 90 ' 147 174 163 163 126 129 133 137 141
412 524 463 468 389 292 311 331 349 366 62,979 63,825 65,081 70,832. 71,657 78,402 88,635 99,274 110,114 121,178
776 905 1,044 1,296 1,285 1,285 1,411 1,406 1,490 1,487 387 480 426 465 425 334 354 374 394 413
263 378 306 334 314 91 91 92 93 92 29,391 28,694 28,073 27,213 31,448 33,957 37,662 41,541 45,610 49,703
186 338 364 422 463 463 456 498 496 504 216 346 286 347 336 98 99 100 102 101
567 530 525 538 266 96 96 95 95 95 47,704 . 45,478 44,088 33,607 33,621 33,894 36,073 38,255 40,440 42,630
197 240 227 320 320 320 320 320 320 320 586 489 511 659 297 108 108 108 108 108
Removals 121 256 314 313 387 330 142 142 141 141 140 Inventory 23,408 25,757 25,911 23,649 1 7 , 3 3 1 17,338 16,472 17,660 18,849 20,043 21,244 Net Growth 261 310 329 312 269 269 269 269 269 269 269 Harvest 100 232 286 292 378 352 152 " 152 152 153 152
Alaska Removals 13 75 114 95 54 99 95 95 97 98 101 Inventory 38,850 38,228 37,555 35,414 24,068 18,733 16,104 16,063 16,340 16,955 17,699 Net Growth 10 16 20 23 15 85 85 96 160 177 194 Harvest 11 66 100 83 47 99 99 99 99 99 99
United States Removals 1,028 1,728 2,082 1,986 2,061 1,681 934 957 986 1,015 1,041 Inventory 204,437 213,696 211,927 208,099 186,313 185,574 191,645 210,300 230,036 250,718 271,911 Net Growth 1,664 1,999 2,367 2,468 " 2,783 2,747 2,779 2,924 3,061 3,185 3,225 Harvest 961 1,635 1,918 1,867 2,153 1,789 1,011 1,040 1,070 1,099 1,124
12000 - 2040 inventory based on 1991 inventory and growth data from Powell 1993 and growth rate projections from National Forest plans and harvest and removals numbers from TAMM LR 185.
2Rocky Mountains region data includes the Great Plain states.
3pacific Southwest excludes Hawafi Sources: For historical da ta USDA Forest Service Powell, et al 1993. Sources: 1991 - 2040 harvest and removal da ta from TAMM LR 185, growth and inventory da ta calculated.
18
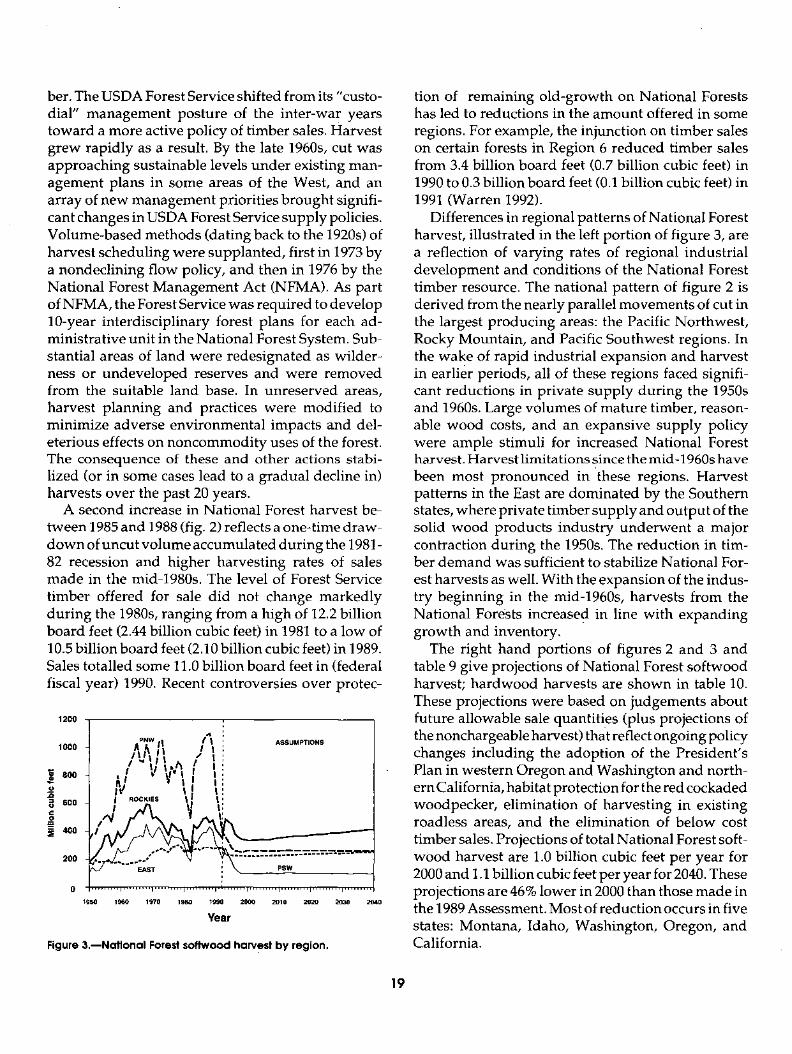
ber. The USDA Forest Service shifted from its "custo- dial" management posture of the inter-war years toward a more active policy of timber sales. Harvest grew rapidly as a result. By the late 1960s, cut was approaching sustainable levels under existing man- agement plans in some areas of the West, and an array of new management priorities brought signifi- cant changes in USDA Forest Service supply policies. Volume-based methods (dating back to the 1920s) of harvest scheduling were supplanted, first in 1973 by a nondeclining flow policy, and then in 1976 by the National Forest Management Act (NFMA). As part of NFMA, the Forest Service was required to develop 10-year interdisciplinary forest plans for each ad- ministrative unit in the National Forest System. Sub- stantial areas of land were redesignated as wilder- ness or undeveloped reserves and were removed from the suitable land base. In unreserved areas, harvest planning and practices were modified to minimize adverse environmental impacts and del- eterious effects on noncommodi ty uses of the forest. The consequence of these and other actions stabi- lized (or in some cases lead to a gradual decline in) harvests over the past 20 years.
A second increase in National Forest harvest be- tween 1985 and 1988 (fig. 2) reflects a one-time draw- down of uncut volume accumulated dur ing the 1981- 82 recession and higher harvesting rates of sales made in the mid-1980s. The level of Forest Service timber offered for sale did not change markedly dur ing the 1980s, ranging from a high of 12.2 billion board feet (2.44 billion cubic feet) in 1981 to a low of 10.5 billion board feet (2.10 billion cubic feet) in 1989. Sales totalled some 11.0 billion board feet in (federal fiscal year) 1990. Recent controversies over protec-
1200
1000
800 O
600
.~ 40o
200
PNW e~ ~'41 ASSUMPTIONS
I I . W ; / I
! " U I , _ ^ I i , ' i ," ~ r l ; I , ~l j • t l t', I l , t', I R O C K I E S I ~ I ',
,
. . . . . . . . . I . . . . . . . . . I . . . . . . . . . I . . . . . . . . . I ' I . . . . . . . I . . . . . . . . . l . . . . . . . . . I . . . . . . . . . I . . . . . . . .
1950 1960 1970 1980 1990 2 0 0 0 2 0 1 0 2 0 2 0 2030 2040
Year
Figure 3 . - - N a t i o n a l Forest sof twood harvest b y region.
tion of remaining old-growth on National Forests has led to reductions in the amount offered in some regions. For example, the injunction on timber sales on certain forests in Region 6 reduced timber sales from 3.4 billion board feet (0.7 billion cubic feet) in 1990 to 0.3 billion board feet (0.1 billion cubic feet) in 1991 (Warren 1992).
Differences in regional patterns of National Forest harvest, illustrated in the left portion of figure 3, are a reflection of varying rates of regional industrial development and conditions of the National Forest timber resource. The national pattern of figure 2 is derived from the nearly parallel movements of cut in the largest producing areas: the Pacific Northwest , Rocky Mountain, and Pacific Southwest regions. In the wake of rapid industrial expansion and harvest in earlier periods, all of these regions faced signifi- cant reductions in private supply dur ing the 1950s and 1960s. Large volumes of mature timber, reason- able wood costs, and an expansive supply policy were ample stimuli for increased National Forest harvest. Harvest limitations since the mid-1960s have been most pronounced in 'these regions. Harvest patterns in the East are dominated by the Southern states, where private timber supply and output of the solid wood products industry underwen t a major contraction dur ing the 1950s. The reduction in tim- ber demand was sufficient to stabilize National For- est harvests as well. With the expansion of the indus- try beginning in the mid-1960s, harvests from the National Forests increased in line with expanding growth and inventory.
The right hand portions of figures 2 and 3 and table 9 give projections of National Forest softwood harvest; ha rdwood harvests are shown in table 10. These projections were based on judgements about future allowable sale quantities (plus projections of the nonchargeable harvest) that reflect ongoing policy changes including the adoption of the President 's Plan in western Oregon and Washington and north- ern California, habitat protection for the red cockaded woodpecker, elimination of harvesting in existing roadless areas, and the elimination of below cost timber sales. Projections of total National Forest soft- wood harvest are 1.0 billion cubic feet per year for 2000 and 1.1 billion cubic feet per year for 2040. These projections are 46% lower in 2000 than those made in the 1989 Assessment. Most of reduction occurs in five states: Montana, Idaho, Washington, Oregon, and California.
19
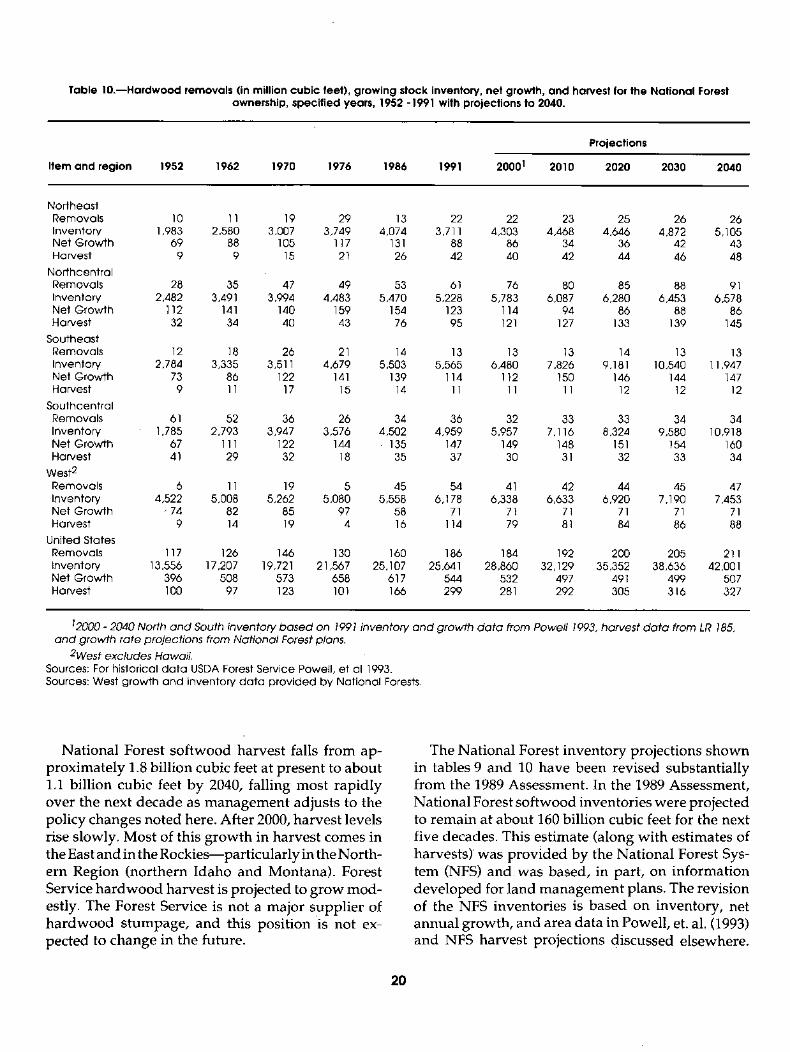
Table 10.--Hardwood removals (in million cubic feet), growing stock inventory, net growth, and harvest for the National Forest ownership, specified years, 1952 -1991 with projections to 2040.
Projections
Item and region 1952 1962 1970 1976 1986 1991 20001 2010 2020 2030 2040
Northeast Removals 10 11 19 29 13 22 22 23 25 26 26 Inventory 1,983 2,580 3,007 3,749 4,074 3,711 4,303 4,468 4,646 4,872 5,105 Net Growth 69 88 105 117 131 88 86 34 36 42 43 Harvest 9 9 15 21 26 42 40 42 44 46 48
Northcentral Removals 28 35 47 49 53 61 76 80 85 88 91 Inventory 2,482 3,491 3,994 4,483 5,470 5,228 5,783 6,087 6,280 6,453 6,578 Net Growth 112 141 140 159 154 123 114 94 86 88 86 Harvest 32 34 40 43 76 95 121 127 133 139 145
Southeast Removals 12 18 26 21 14 13 13 13 14 13 13 Inventory 2,784 3,335 3,511 4,679 5,503 5,565 6,480 7,826 9,181 10,540 11,947 Net Growth 73 86 122 141 139 114 112 150 146 144 147 Harvest 9 11 17 15 14 11 11 11 12 12 12
Southcentral Removals 61 52 3 6 26 34 36 32 33 33 34 34 Inventory 1,785 2,793 3,947 3,576 4,502 4,959 5,957 7,116 8,324 9,580 10,918 Net Growth 67 111 122 144 . 135 147 149 148 151 154 160 Harvest 41 29 32 18 35 37 30 31 32 33 34
West 2 Removals 6 11 19 5 45 54 41 42 44 45 47 Inventory 4,522 5,008 5,262 5,080 5,558 6,178 6,338 6,633 6,920 7,190 7,453 Net Growth ~ 74 82 85 97 58 71 71 71 71 71 71 Harvest 9 14 19 4 16 114 79 81 84 86 88
United States Removals 117 126 146 130 160 186 184 192 200 205 211 Inventory 13,556 17,207 1 9 , 7 2 1 21,567 25,107 25,641 28,860 32,129 35,352 38,636 42,001 Net Growth 396 508 573 658 617 544 532 497 491 499 507 Harvest 100 97 123 101 166 299 281 292 305 316 327
12000 - 2040 North and South inventorY based on 1991 inventorY and growth data from Powell and growth rate projections from National Forest plans.
2West excludes Hawaii. Sources: For historical da ta USDA Forest Service Powell, et al 1993. Sources: West growth and inventory da ta provided by National Forests.
1993, harvest data from LR 185,
National Forest softwood harvest falls from ap- proximately 1.8 billion cubic feet at present to about 1.1 billion cubic feet by 2040, falling most rapidly over the next decade as management adjusts to the policy changes noted here. After 2000, harvest levels rise slowly. Most of this growth in harvest comes in the East and in the Rockies--particularly in the North- ern Region (northern Idaho and Montana). Forest Service ha rdwood harvest is projected to grow mod- estly. The Forest Service is not a major supplier of ha rdwood stumpage, and this position is not ex- pected to change in the future.
The National Forest inventory projections shown in tables 9 and 10 have been revised substantially from the 1989 Assessment. In the 1989 Assessment, National Forest softwood inventories were projected to remain at about 160 billion cubic feet for the next five decades. This estimate (along with estimates of harvests) was provided by the National Forest Sys- tem (NFS) a n d was based, in part, on information developed for land management plans. The revision of the NFS inventories is based on inventory, net annual growth, and area data in Powell, et. al. (1993) and NFS harvest projections discussed elsewhere.
20
The inventories are for timber on available acres, and do not include timber on acres administratively with- d rawn from timber harvesting. The projection proce- dure used a growth drain identity.11.The starting inventory was increased each year by the net annual growth and decreased by projected removals. Net annual growth and the number of available acres are assumed to be constant throughout the projection period.
The resulting projections should be considered an estimate of the upper limit for NFS inventories. Over time, both the available and suitable acres have de- clined, and this trend may continue. Net annual growth also may change over time, as new ecosystem management regimes are developed.
For purposes of estimating carbon sequestration or other uses where an estimate of total NFS inventory is needed, it is important to note again that the inventory estimates in tables 9 and 10 are for inventories on available acres. They do not include inventories on NFS areas administratively withdrawn from timber har- vesting, such as those acres in wilderness areas.
Other Public Harvest Levels
Other public ownerships comprise a diverse group of public organizations including federal agencies, such as the Bureau of Land Management and Depart- ment of Defense, as well as forest land holding enti- ties in city, county and state governments. Historical and projected r o u n d w o o d supplies, net annual growth, and growing stock inventories are shown in table 11 for softwoods and table 12 for hardwoods. The historical data for 1952-76 were extracted from similar tables in the 1989 Assessment and reflect
ownership definitions at that time. The data for 1986 and 1990 were compiled from Waddell et al. 1989, and Powell et al 1993.12
Reporting of forest resource statistics for this group has been revised since the 1989 Assessment with the movement of t imberland owned by Native Ameri- can groups (administered by the Bureau of Indian Affairs) from the Other Public to the Other Private owner category. This shift can be seen in the abrupt change in harvest and inventory levels shown in tables 11 and 12 between 1986 and 1991. A further change involved land base, harvest and inventory adjustments on BLM timberlands in Oregon and state lands in Washington, reflecting management changes to protect habitat for the northern spotted owl. Even with these changes, both softwood and hardwood other public inventories are expected to continue to increase during the next five decades. Hardwood inventories increase at a somewhat faster rate than do the softwoods inventories. Only toward the end of the projection period do harvest and growth come into balance for both hardwoods and softwoods. Net growth, especially for hardwoods, is expected to drop as stands mature. The largest reduc- tions in hardwood growth are projected in the next 15 years.
PROJECTED TRENDS IN PROCESSING
No changes were made in projected trends in processing technology, wood use efficiency and re- lated assumptions (other than those noted for pulp and paper). The assumptions used in this Update are those described in the 1989 Assessment.
11Th e basic form of the growth-drain identity used to update t imber inventories was:
It+ l = It + Gt - Ht wh ere
G is t imber growth, and
H is t imber harvest.
All units were expressed in million cubic feet and the time interval was one decade.
72The projections in tables 11 and 12 have been revised from similar projections prepared as par t of the Fourth Forest (USDA Forest Service 1988) for the South and for the other regions as par t of the last Assessment by first compar ing the actual data for 1986 with the pro jected values for 1986. In the next step, harvest projections from the past studies were judgmental ly adjusted by the ratio of pro jected to actual harvest for 1986. The growth projections were retained from the last Assessment and the value for 2040 was compu ted as the continuation of the trend between 2000 and 2030. Inventory levels were computed for all projections using a growth-drain identity.
21
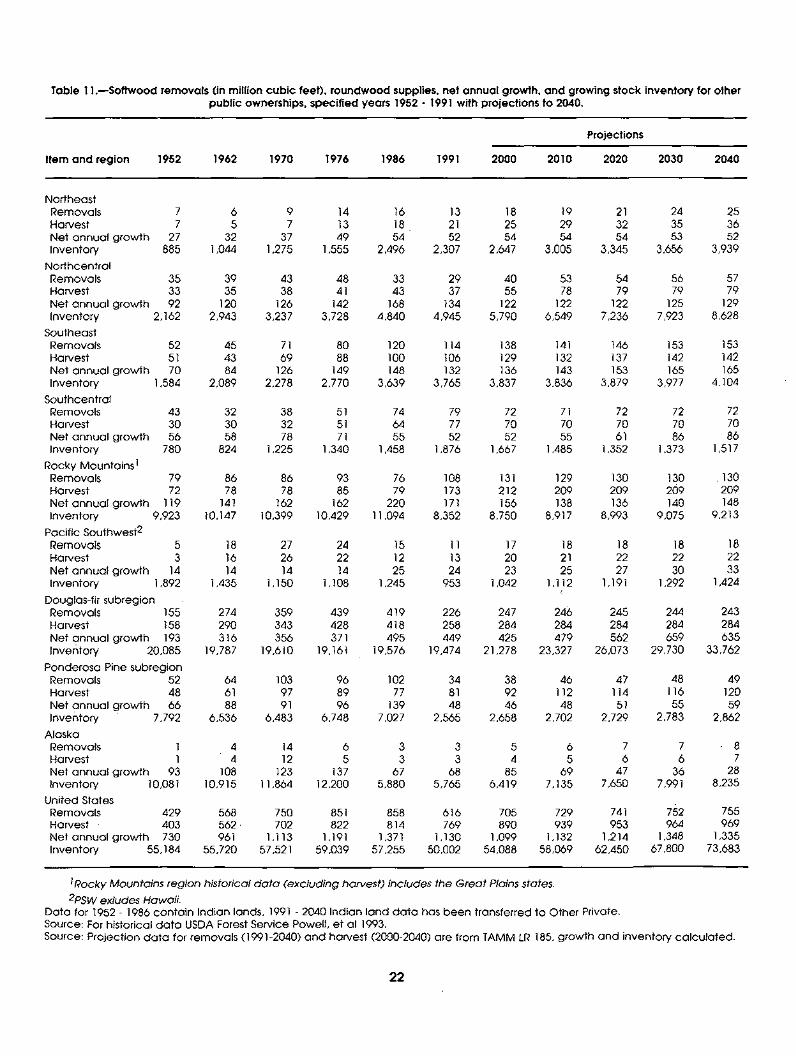
Table 11 .--Softwood removals (in million cubic feet), roundwood supplies, net annual growth, and growing stock inventory for other public ownerships, specified years 1952 - 1991 with projections to 2040.
Projections
Item and region 1952 1962 1970 1976 1986 1991 2000 2010 2020 2030 2040
Northeast Removals 7 6 9 14 16 13 18 19 21 24 25 Harvest 7 5 7 13 18 21 25 29 32 35 36 Net annual growth 27 32 37 49 54 52 54 54 54 53 52 Inventory 885 1,044 1,275 1,555 2,496 2,307 2,647 3,005 3,345 3,656 3,939
Northcentral Removals 35 39 43 48 33 29 40 53 54 56 57 Harvest 33 35 38 41 43 37 55 78 79 79 79 Net annual growth 92 120 126 142 168 134 122 122 122 125 129 Inventory 2,162 2,943 3,237 3,728 4,840 4,945 5,790 6,549 7,236 7,923 8,628
Southeast Removals 52 45 71 80 120 114 138 141 146 153 153 Harvest 51 43 69 88 100 106 129 132 137 142 142 Net annual growth 70 84 126 149 148 132 136 143 153 165 165 Inventory 1,584 2,089 2,278 2,770 3,639 3,765 3,837 3,836 3,879 3,977 4,104
Southcentral Removals 43 32 38 51 74 79 72 71 72 72 72 Harvest 30 30 32 51 64 77 70 70 70 70 70 Net annual growth 56 58 78 71 55 52 52 55 61 86 86 Inventory 780 824 1,225 1,340 1,458 1,876 1,667 1,485 1,352 1,373 1,517
Rocky Mountains 1 Removals 79 86 86 93 76 108 131 129 130 130 .130 Harvest 72 78 78 85 79 173 212 209 209 2[]9 209 Net annual growth 119 141 162 162 220 171 156 138 136 140 148 Inventory 9,923 10,147 10,399 10,429 11,094 8,352 8,750 8,917 8,993 9,075 9,213
Pacific Southwest 2 Removals 5 18 27 24 15 11 17 18 18 18 18 Harvest 3 16 26 22 12 13 20 21 22 22 22 Net annual growth 14 14 14 14 25 24 23 25 27 30 33 Inventory 1,892 1,435 1,150 1,108 1,245 953 1,042 1,112 1,191 1,292 1,424
Douglas-fir subregion Removals 155 274 359 439 419 226 247 246 245 244 243 Harvest 158 290 343 428 418 258 284 284 284 284 284 Net annual growth 193 316 356 371 495 449 425 479 562 659 635 Inver~tory 20,085 19,787 19,610 19, t 61 19,576 19,474 21,278 23,327 26,073 29,730 33,762
Ponderosa Pine subregion Removals 52 64 103 96 102 34 38 46 47 48 49 Harvest 48 61 97 89 77 81 92 112 114 116 120 Net annual growth 66 88 91 96 139 48 46 48 51 55 59 Inventory 7,792 6,536 6,483 6,748 7,027 2,565 2,658 2,702 2,729 2,783 2,862
Alaska Removals 1 4 14 6 3 3 5 6 7 7 8 Harvest 1 4 12 5 3 3 4 5 6 6 7 Net annual growth 93 108 123 137 67 68 85 69 47 36 28 Inventory 10,081 10,915 11,864 12,200 5,880 5,765 6,419 7,135 7,650 7,991 8,235
United States Removals 429 568 750 851 858 616 705 729 741 752 755 Harvest - 403 562, 702 822 814 769 890 939 953 964 969 Net annual growth 730 961 1,113 1,191 1,371 1,130 1,099 1,132 1,214 1,348 1,335 Inventory 55,184 55,720 57,521 59,039 57,255 50,002 54,088 58,069 62,450 67,800 73,683
1Rocky Mountains region historical data (excluding harvest) includes the Great Plains states. 2PSW exludes Hawafi.
Data for 1952 - 1986 contain Indian lands, 1991 - 2040 Indian land da ta has been transferred to Other Private. Source: For historical da ta USDA Forest Service Powell, et al 1993. Source: Projection da ta for removals (1991-2040) and harvest (2000-2040) are from TAM M LR 185, growth and inventory calculated.
22
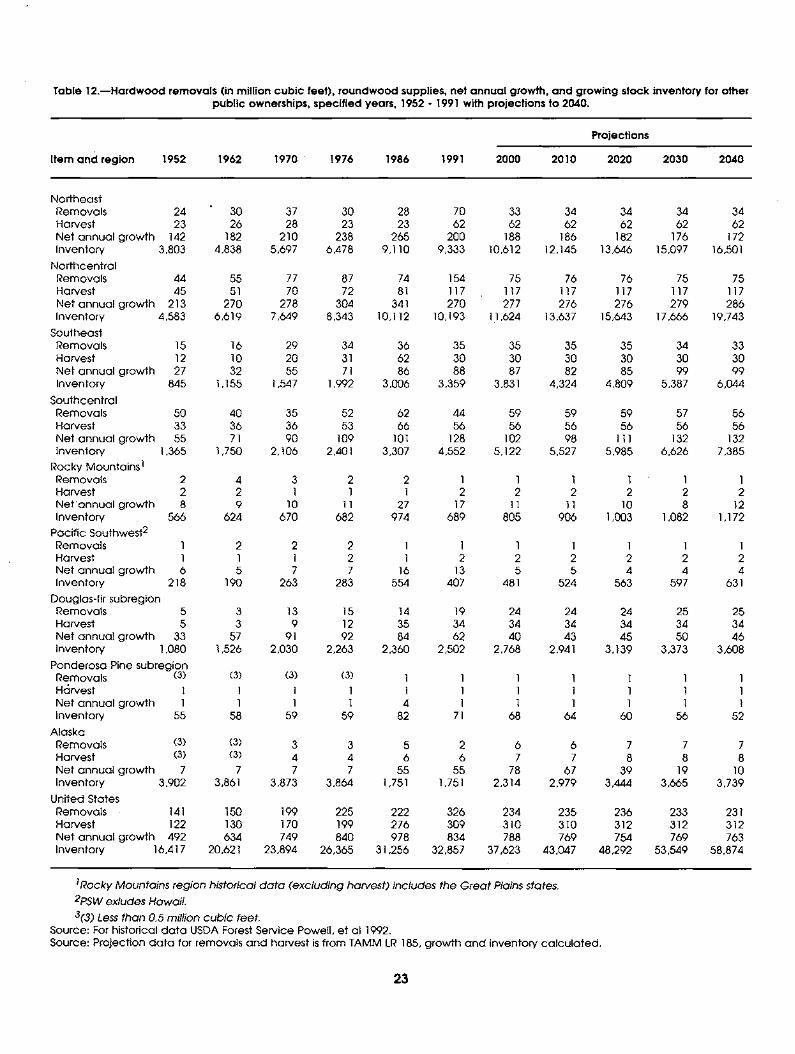
Table 12.mHardwood removals (in million cubic feet), roundwood supplies, net annual growth, and growing stock inventory for other public ownerships, specified years, 1952 - 1991 with projections to 2040.
Projections
Item and region 1952 1962 1970 " 1976 1986 1991 2000 2010 2020 2030 2040
Northeast Removals 24 30 37 30 28 70 33 34 34 34 34 Harvest 23 26 28 23 23 62 62 62 62 62 62 Net annual growth 142 182 210 238 265 200 188 186 182 176 172 Inventory 3,803 4,838 5,697 6,478 9,110 9,333 10,612 12,145 13,646 15,097 16,501
Northcentral Removals 44 55 77 87 74 154 75 76 76 75 75 Harvest 45 51 70 72 81 117 117 117 117 117 117 Net annual growth 213 270 278 304 341 270 277 276 276 279 286 Inventory 4,583 6,619 7,649 8,343 10,112 1 O, 193 11,624 13,637 15,643 17,666 19,743
Southeast Removals 15 16 29 34 36 35 35 35 35 34 33 Harvest 12 10 20 31 62 30 30 30 30 30 30 Net annual growth 27 32 55 71 86 88 87 82 85 99 99 Inventory 845 1,155 1,547 1,992 3,006 3,359 3,831 4,324 4,809 5,387 6,044
Southcentral Removals 50 40 35 52 62 44 59 59 59 57 56 Harvest 33 36 36 53 66 56 56 56 56 56 56 Net annual growth 55 71 90 109 101 128 102 98 111 132 132 Inventory 1,365 1,750 2,106 2,401 3,307 4,552 5,122 5,527 5,985 6,626 7,385
Rocky Mountains 1 Removals 2 4 3 2 2 1 1 1 1 1 1 Harvest 2 2 1 1 1 2 2 2 2 2 2 Net 'annual growth 8 9 10 11 27 17 11 11 10 8 12 Inventory 566 624 670 682 974 689 805 906 1,003 1,082 1,172
Pacific Southwest 2 Removals 1 2 2 2 1 1 1 1 1 1 1 Harvest 1 1 1 2 1 2 2 2 2 2 2 Net annual growth 6 5 7 7 16 13 5 5 4 4 4 Inventory 218 190 263 283 554 407 481 524 563 597 631
Douglas-fir subregion Removals 5 3 13 15 14 19 24 24 24 25 25 Harvest 5 3 9 12 35 34 34 34 34 34 34 Net annual growth 33 57 91 92 84 62 40 43 45 50 46 Inventory 1,080 1,526 2,030 2,263 2,360 2,502 2,768 2,941 3,139 3,373 3,608
Ponderosa Pine subregion Removals (3) (3) (3) (3) 1 1 1 1 1 1 1 Harvest 1 1 1 1 1 1 1 1 1 1 1 Net annual growth 1 1 1 1 4 1 1 1 1 1 1 Inventory 55 58 59 59 82 71 68 64 60 56 52
Alaska Removals (3) (3) 3 3 5 2 6 6 7 7 7 Harvest (3) (3) 4 4 6 6 7 7 8 8 8 Net annual growth 7 7 7 7 55 55 78 67 39 19 10 Inventory 3,902 3,861 3,873 3,864 1,751 1,751 2,314 2,979 3,444 3,665 3,739
United States Removals 141 150 199 225 222 326 234 235 236 233 231 Harvest 122 130 170 199 276 309 310 310 312 312 312 Net annual growth 492 634 749 840 978 834 788 769 754 769 763 Inventory 16,417 20,621 23,894 26,365 31,256 32,857 37,623 43,047 48,292 53,549 58,874
1Rocky Mountains region historical data (excluding harvest) includes the Great Plains states. 2psw exludes Hawaii. 3(3) Less than 0.5 million cubic feet.
Source: For historical da ta USDA Forest Service Powelh et al 1992. Source: Projection da ta for removals and harvest is from TAMM LR 185, growth and inventory calculated.
23
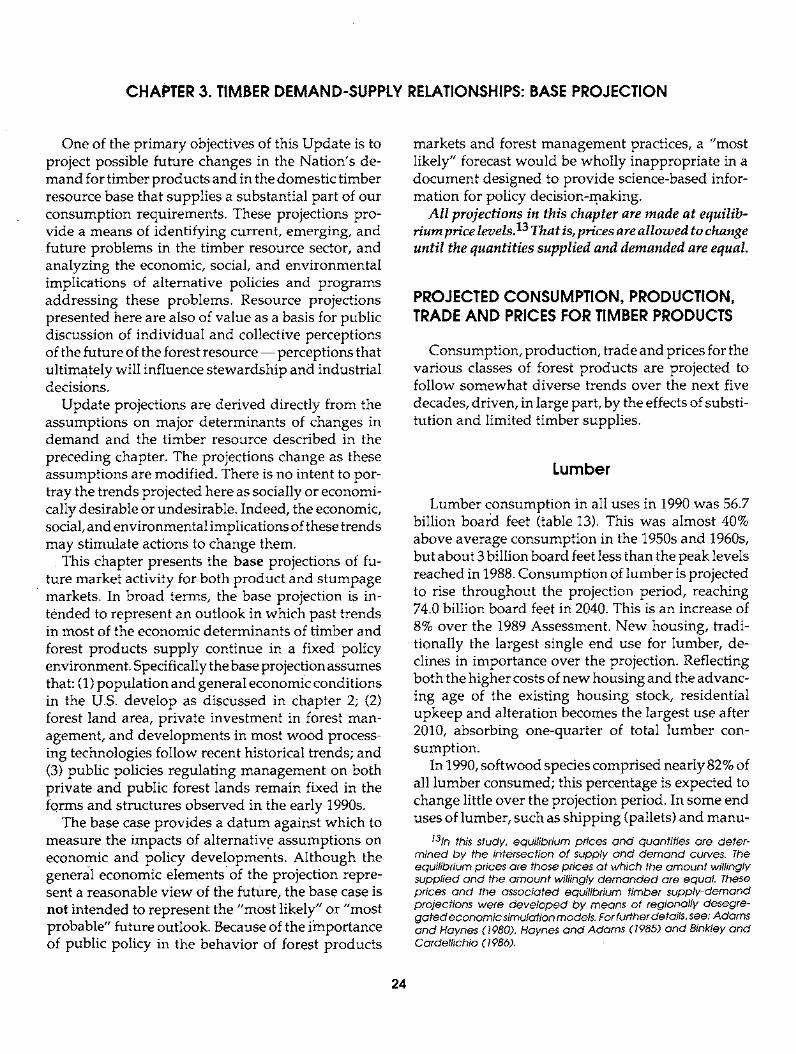
CHAPTER 3. TIMBER DEMAND-SUPPLY RELATIONSHIPS: BASE PROJECTION
One of the primary objectives of this Update is to project possible future changes in the Nation's de- mand for timber products and in the domestic timber resource base that supplies a substantial part of our consumption requirements. These projections pro- vide a means of identifying current, emerging, and future problems in the timber resource sector, and analyzing the economic, social, and environmental implications of alternative policies and programs addressing these problems. Resource projections presented here are also of value as a basis for public discussion of individual and collective perceptions of the future of the forest resource-- perceptions that ultimately will influence stewardship and industrial decisions.
Update projections are derived directly from the assumptions on major determinants of changes in demand and the timber resource described in the preceding chapter. The projections change as these assumptions are modified. There is no intent to por- tray the trends projected here as socially or economi- cally desirable or undesirable. Indeed, the economic, social, and environmental implications of these trends may stimulate actions to change them.
• This chapter presents the base projections of fu- ture market activity for both product and stumpage markets. In broad terms, the base projection is in- tended to represent an outlook in which past trends in most of the economic determinants of timber and forest products supply continue in a fixed policy environment. Specifically the base projection assumes that: (1) population and general economic conditions in the U.S. develop as discussed in chapter 2; (2) forest land area, private investment in forest man- agement, and developments in most wood process- ing technologies follow recent historical trends; and (3) public policies regulating management on both private and public forest lands remain fixed in the forms and structures observed in the early 1990s.
The base case provides a datum against which to measure the impacts of alternative assumptions on economic and policy developments. Although the general economic elements of the projection repre- sent a reasonable view of the future, the base case is n o t intended to represent the "most likely" or "most probable" future outlook. Because of the importance of public policy in the behavior of forest products
markets and forest management practices, a "most likely" forecast would be wholly inappropriate in a document designed to provide science-based infor- mation for policy decision-making.
All projections in this chapter are made at equilib- rium price levels. 13 That is, prices are allowed to change until the quantities supplied and demanded are equal.
PROJECTED CONSUMPTION, PRODUCTION, TRADE AND PRICES FOR TIMBER PRODUCTS
Consumption, production, trade and prices for the various classes of forest products are projected to follow somewhat diverse trends over the next five decades, driven, in large part, by the effects of substi- tution and limited timber supplies.
Lumber
Lumber consumption in all uses in 1990 was 56.7 billion board feet (table 13). This was almost 40% above average consumption in the 1950s and 1960s, but about 3 billion board feet less thanthe peak levels reached in 1988. Consumption of lumber is projected to rise throughout the projection period, reaching 74.0 billion board feet in 2040. This is an increase of 8% over the 1989 Assessment. New housing, tradi- tionally the largest single end use for lumber, de- clines in importance over the projection. Reflecting both the higher costs of new housing and the advanc- ing age of the existing housing stock, residential upkeep and alteration becomes the largest use after 2010, absorbing one-quarter of total lumber con- sumption.
In 1990, softwood species comprised nearly 82% of all lumber consumed; this percentage is expected to change little over the projection period. In some end uses of lumber, such as shipping (pallets) and manu-
131n this study, equilibrium prices and quantities are deter- mined by the intersection of supply and demand curves. The equilibrium prices are those prices at which the amount willingly suppfied and the amount willingly demanded are equal. These prices and the associated equilibrium timber supply-demand projections were developed by means of regionally desegre- gated economic simulation models. For further details, see: Adams and Haynes (1980), Haynes and Adams (1985) and Binkley and Cardellichio (1986).
24
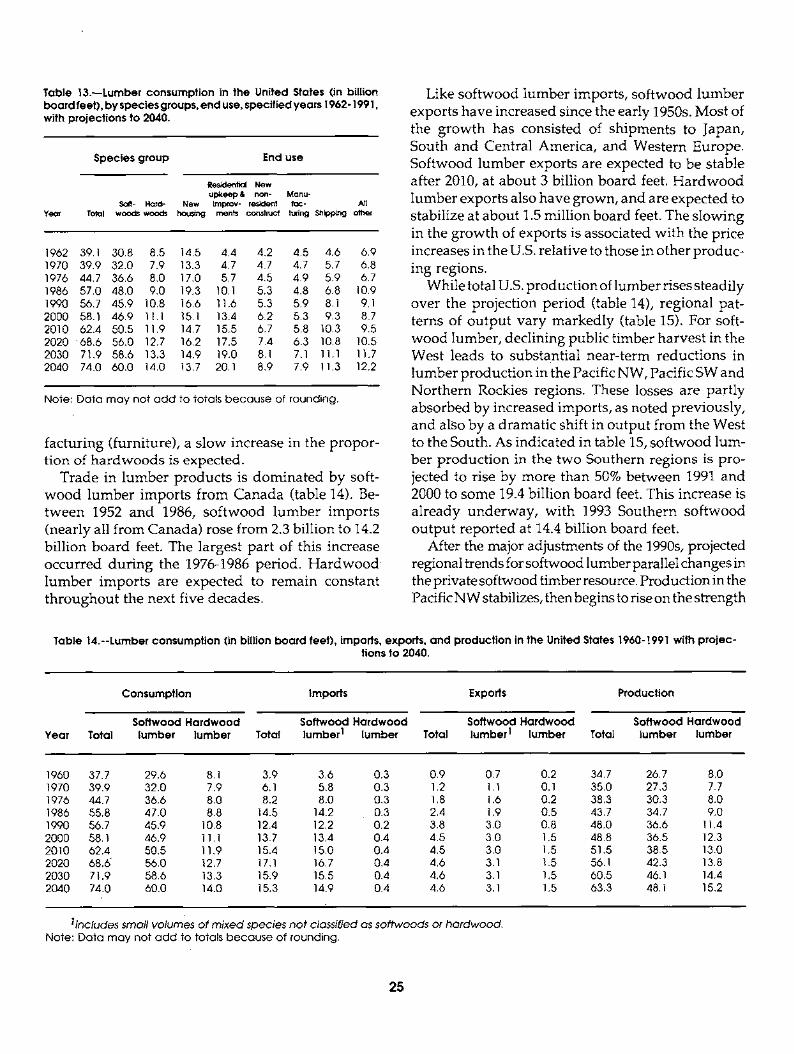
Table 13.--Lumber consumption in the United States (in billion board feet), by species groups, end use, specified years 1962-199 I, with projections to 2040.
Species group End use
Residential New upkeep & non- Manu-
Soft- Hard- New improv- resident fac- All Year Total woods woods housing ments constnJct turing Shipping other
1962 39.1 30.8 8.5 14.5 4.4 4.2 4.5 4.6 6,9 1970 39.9 32.0 7.9 13.3 4.7 4.7 4.7 5.7 6.8 1976 44.7 36.6 8.0 17.0 5.7 4.5 4.9 5.9 6.7 1986 57.0 48.0 9.0 19.3 10.1 5.3 4.8 6.8 10,9 1990 56,7 45.9 10.8 16.6 11.6 5,3 5.9 8.1 9,1 2000 58,1 46.9 11.1 15.1 13.4 6.2 5.3 9,3 8.7 2010 62.4 50.5 11.9 14.7 15.5 6.7 5.8 10.3 9.5 2020 68,6 56.0 12.7 16.2 17.5 7.4 6.3 10.8 10.5 2030 71,9 58.6 13.3 14.9 19.0 8.1 7.1 11.1 11.7 2040 74,0 60.0 14.0 13,7 20.1 8.9 7.9 11.3 12.2
Note: Data may not add to totals because of rounding.
facturing (furniture), a slow increase in the propor- tion of hardwoods is expected.
Trade in lumber products is dominated by soft- wood lumber imports from Canada (table 14). Be- tween 1952 and 1986, softwood lumber imports (nearly all from Canada) rose from 2.3 billion to 14.2 billion board feet. The largest part of this increase occurred during the 1976-1986 period. Hardwood • lumber imports are expected to remain constant throughout the next five decades.
Like softwood lumber imports, softwood lumber exports have increased since the early 1950s. Most of the growth has consisted of shipments to Japan, South and Central America, and Western Europe. Softwood lumber exports are expected to be stable after 2010, at about 3 billion board feet. Hardwood lumber exports also have grown, and are expected to stabilize at about 1.5 million board feet. The slowing in the growth of exports is associated with the price increases in the U.S. relative to those in other produc- ing regions.
While total U.S. production of lumber rises steadily over the projection period (table 14), regional pat- terns of output vary markedly (table 15). For soft- wood lumber, declining public timber harvest in the West leads to substantial near-term reductions in lumber production in the Pacific NW, Pacific SW and Northern Rockies regions. These losses are partly absorbed by increased imports, as noted previously, and also by a dramatic shift in output from the West to the South. As indicated in table 15, softwood lum- ber production in the two Southern regions is pro- jected to rise by more than 50% between 1991 and 2000 to some 19.4 billion board feet. This increase is already underway, with 1993 Southern softwood output reported at 14.4 billion board feet.
After the major adjustments of the 1990s, projected regional trends for softwood lumber parallel changes in the private softwood timber resource. Production in the Pacific NW stabilizes, then begins to rise on the strength
Table 14.--Lumber consumption (in billion board feet), imports, exports, and production in the United States 1960-1991 with projec- tions to 2040.
Consumption Imports Exports Production
Softwood Hardwood Softwood Hardwood Year Total lumber lumber Total lumber I lumber
Softwood Hardwood Softwood Hardwood Total lumber I lumber Total lumber lumber
1960 37.7 29.6 8.1 3.9 3.6 0.3 0.9 0.7 0,2 34.7 26.7 8.0 1970 39.9 32.0 7.9 6.1 5.8 0.3 1.2 1.1 0,1 35.0 27.3 7.7 1976 44.7 36.6 8.0 8.2 8.0 0.3 1,8 1.6 0.2 38,3 30.3 8.0 1986 55.8 47.0 8.8 14.5 14.2 0.3 2.4 1.9 0.5 43.7 34.7 9.0 1990 56.7 45.9 10.8 12.4 12.2 0.2 3.8 3.0 0.8 48.0 36.6 11.4 2000 58.1 . 46.9 11.1 13.7 13,4 0.4 4.5 3.0 1.5 48.8 36.5 12.3 2010 62.4 50.5 11.9 15.4 15.0 0.4 4.5 3.0 1.5 51.5 38.5 13.0 2020 68.6" 56.0 12.7 17.1 16.7 0.4 4,6 3.1 1,5 56.1 42.3 13.8 2030 71.9 58,6 13.3 15.9 15.5 0.4 4.6 3.1 1.5 60.5 46.1 14.4 2040 74.0 60.0 14.0 15.3 14.9 0.4 4.6 3.1 1.5 63.3 48.1 15.2
l lnc ludes smal l vo lumes o f m i x e d species no t classi f ied as so f twoods or h a r d w o o d . Note: Data may not add to totals because of rounding,
25
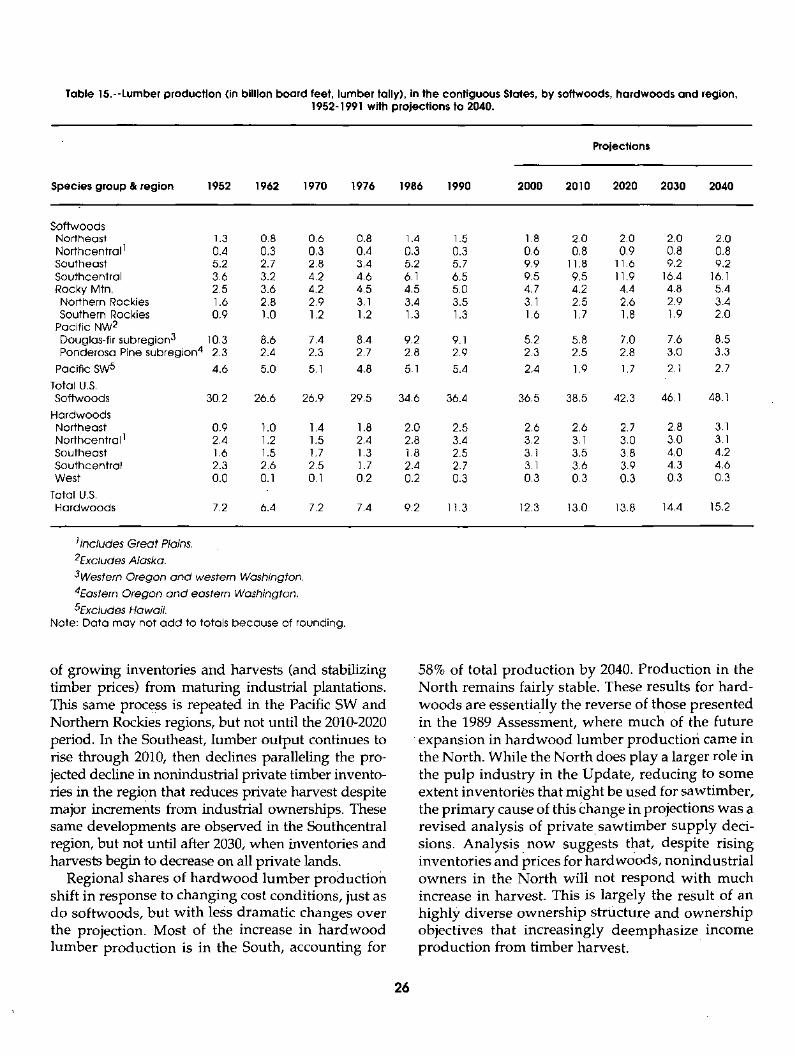
Table 15.--Lumber production (in billion board feet, lumber tally), in the contiguous States, by softwoods, hardwoods and region, 1952-1991 with projections to 2040.
Projections
Species group & region 1952 1962 1970 1976 1986 1990 2000 2010 2020 2030 2040
Softwoods Northeast 1.3 0.8 0.6 0.8 1.4 1.5 1.8 2.0 2.0 2.0 2.0 Northcentral 1 0.4 0.3 0.3 0.4 0.3 0.3 0.6 0.8 0.9 0.8 0.8 Southeast 5.2 2.7 2.8 3.4 5.2 5.7 9.9 11.8 11.6 9.2 9.2 Southcentral 3.6 3.2 4.2 4.6 6.1 6.5 9.5 9.5 11.9 16.4 16.1 Rocky Mtn. 2.5 3.6 4.2 4.5 4.5 5.0 4.7 4.2 4.4 4,8 5.4 Northern Rockies 1.6 2.8 2.9 3.1 3.4 3.5 3.1 2.5 2.6 2.9 3.4 Southern Rockies 0.9 1.0 1.2 1.2 1.3 1.3 1.6 1.7 1,8 1.9 2.0
Pacific NW 2 Douglas-fir subregion 3 10.3 8.6 7.4 8.4 9.2 9.1 5.2 5.8 7.0 7.6 8.5 Ponderosa Pine subregion 4 2.3 2.4 2.3 2.7 2.8 2.9 2.3 2.5 2.8 3.0 3.3
Pacific SW 5 4.6 5.0 5.1 4.8 5.1 5.4 2.4 1.9 1.7 2.1 2.7
Total U.S. Softwoods 30.2 26.6 26.9 29.5 34.6 36.4 36.5 38.5 42.3 46,1 48.1
Hardwoods Northeast 0.9 1.0 1.4 1.8 2.0 2.5 2.6 2.6 2.7 2.8 3.1 Northcentral 1 2.4 1.2 1.5 2.4 2.8 3.4 3.2 3.1 3.0 3.0 3.1 Southeast 1.6 1.5 1.7 1.3 1.8 2.5 3.1 3.5 3.8 4.0 4.2 Southcentral 2.3 2.6 2.5 1.7 2.4 2.7 3.1 3.6 3.9 4.3 4.6 West 0.0 0.1 0.1 0.2 0.2 0.3 0.3 0.3 0.3 0.3 0.3
Total U.S. Hardwoods 7,2 6.4 7.2 7.4 9.2 11.3 12.3 t3.0 13.8 14,4 15.2
1Includes Great Plains. 2Excludes Alaska. 3Western Oregon and western Washington. 4Eastern Oregon and eastern Washington. 5Excludes Hawafi.
Note: Data may not a d d to totals because of rounding.
of growing inventories and harvests (and stabilizing timber prices) from maturing industrial plantations. This same process is repeated in the Pacific SW and Northern Rockies regions, but not until the 2010-2020 period. In the Southeast, lumber output continues to rise through 2010, then declines paralleling the pro- jected decline in nonindustrial private timber invento- ries in the region that reduces private harvest despite major increments from industrial ownerships. These same developments are observed in the Southcentral region, but not until after 2030, when inventories and harvests begin to decrease on all private lands.
Regional shares of hardwood lumber production shift in response to changing cost conditions, just as do softwoods, but with less dramatic changes over the projection. Most of the increase in hardwood lumber production is in the South, accounting for
58% of total production by 2040. Production in the North remains fairly stable. These results for hard- woods are essentially the reverse of those presented in the 1989 Assessment, where much of the future
expansion in hardwood lumber productiofi came in the North. While the North does play a larger role in the pulp industry in the Update, reducing to some extent inventories that might be used for sawtimber, the primary cause of this change in projections was a revised analysis of private sawtimber supply deci- sions. Analysis n o w suggests that, despite rising inventories and prices for hardwoods, nonindustrial owners in the North will not respond with much increase in harvest. This is largely the result of an highly diverse ownership structure and ownership objectives that increasingly deemphasiz e income production from timber harvest.
26
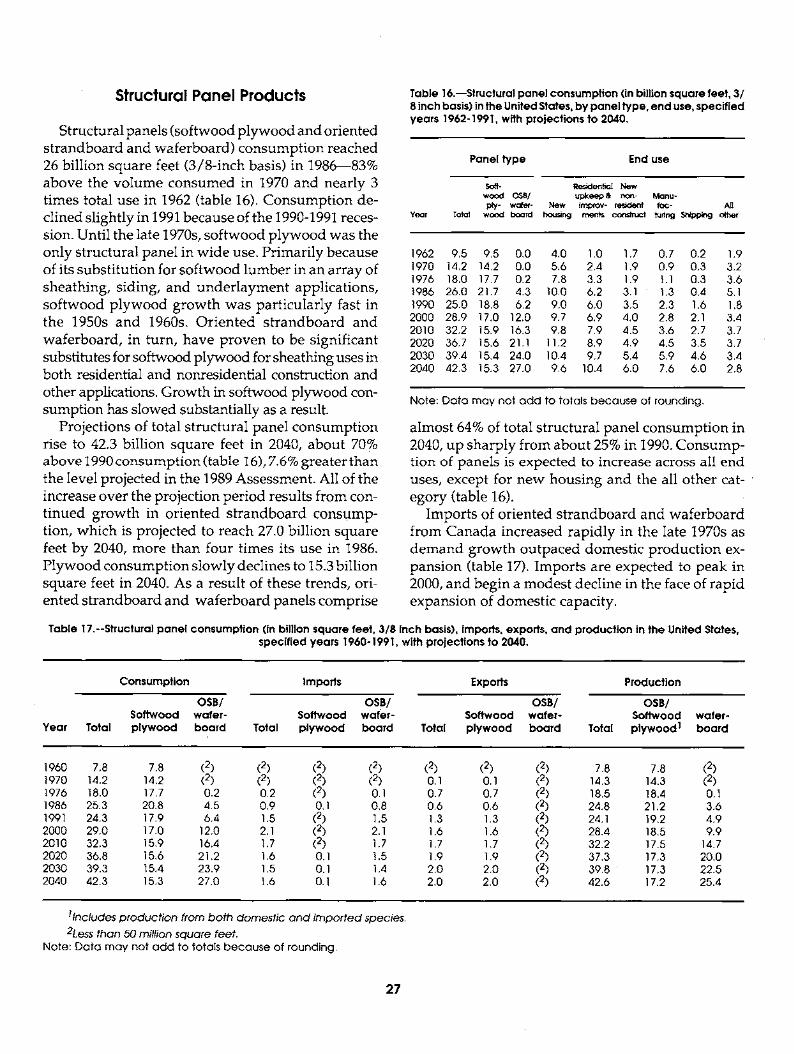
Structural Panel Products
Structural panels (softwood plywood and oriented strandboard and waferboard) consumption reached 26 billion square feet (3/8-inch basis) in 1986--83% above the volume consumed in 1970 and nearly 3 times total use in 1962 (table 16). Consumption de- clined slightly in 1991 because of the 1990-1991 reces- sion. Until the late 1970s, softwood plywood was the only structural panel in wide use. Primarily because of its substitution for softwood lumber in an array of sheathing, siding, and underlayment applications, softwood plywood growth was particularly fast in the 1950s and 1960s. Oriented strandboard and waferboard, in turn, have proven to be significant substitutes for softwood plywood for sheathing uses in both residential and nonresidential construction and other applications. Growth in softwood plywood con- sumption has slowed substantially as a result.
Projections of total structural panel consumption rise to 42.3 billion square feet in 2040, about 70% above 1990 consumption (table 16), 7.6% greater than the level projected in the 1989 Assessment. All of the increase over the projection period results from con- tinued growth in oriented strandboard consump- tion, which is projected to reach 27.0 billion square feet by 2040, more than four times its use in 1986. Plywood consumption slowly declines to 15.3 billion square feet in 2040. As a result of these trends, ori- ented strandboard and waferboard panels comprise
Table 16.mStructural panel consumption (in billion square feet, 3/ 8 inch basis) in the United States, by panel type, end use, specified years 1962-1991, with projections to 2040.
Yeer Total
Panel type End use
Soft- Re~dential New wood OSB/ upkeep & non- Manu- ply- wafer- New improv- resident fac- All
wood board housing ments construct luting Shipping other
1962 9.5 9.5 0.0 4.0 1.0 1.7 0.7 0.2 1.9 1970 14.2 14.2 0.0 5.6 2.4 1.9 0.9 0.3 3.2 1976 18.0 17.7 0.2 7.8 3.3 1.9 1.1 0.3 3.6 1986 26.0 21.7 4.3 10.0 6.2 3.1 ' 1.3 0.4 5.1 1990 25.0 18.8 6.2 9.0 6.0 3.5 2.3 1.6 1.8 2000 28.9 17.0 12.0 9.7 6.9 4.0 2.8 2.1 3.4 2010 32.2 15.9 16.3 9.8 7.9 4.5 3.6 2.7 3.7 2020 36.7 15.6 21 .1 11.2 8.9 4.9 4.5 3.5 3.7 2030 39.4 15.4 24.0 10.4 9.7 5.4 5.9 4.6 3.4 2040 42.3 15.3 27.0 9.6 10.4 6.0 7.6 6.0 2.8
Note: Data may not add to totals because of rounding.
almost 64% of total structural panel consumption in 2040, up sharply from about 25% in 1990. Consump- tion of panels is expected to increase across all end uses, except for new housing and the all other cat- egory (table 16).
Imports of oriented strandboard and waferboard from Canada increased rapidly in the late 1970s as demand growth outpaced domestic production ex- pansion (table 17). Imports are expected to peak in 2000, and begin a modest decline in the face of rapid expansion of domestic capacity.
Table 17.--Structural panel consumption (in billion square feet, 3/8 inch basis), imports, exports, and production in the United States, specified years 1960-1991, with projections to 2040.
Consumption Imports Exports Production
OSB/ OSB/ OSB/ OSB/ Softwood wafer- Softwood wafer- Softwood wafer- Softwood wafer-
Year Total plywood board Total plywood board Total plywood board Total plywood I board
1960 7.8 7.8 (2) (2) (2) (2) (2) (2) (2) 7.8 7.8 (2) 1970 14.2 14.2 (2) (2) (2) (2) 0.1 0.1 (2) 14.3 14.3 (2) 1976 18.0 17.7 0.2 0.2 (2) 0.1 0.7 0.7 (2) 18.5 18.4 0.1 1986 25.3 20.8 4.5 0.9 0.1 0.8 0.6 0.6 (2) 24.8 21.2 3.6 1991 24.3 17.9 6.4 1.5 (2) 1.5 1.3 1.3 (2) 24.1 19.2 4.9 2000 29.0 17.0 12.0 2.1 (2) 2.1 1.6 1.6 (2) 28.4 18.5 9.9 2010 32.3 15.9 16.4 1.7 (2) 1.7 1.7 1.7 (2) 32.2 17.5 14.7 2020 36.8 15.6 21.2 1.6 0.1 1.5 1.9 1.9 (2) 37.3 17.3 20.0 2030 39.3 15.4 23.9 1.5 0.1 1.4 2.0 2.0 (2) 39.8 " 17.3 22.5 2040 42.3 15.3 27.0 1.6 0.1 1.6 2.0 2.0 (2) 42.6 17.2 25.4
l lncludes production from both domestic and imported species. 2Less than 50 million square feet.
Note: Data may not add to totals because of rounding.
27
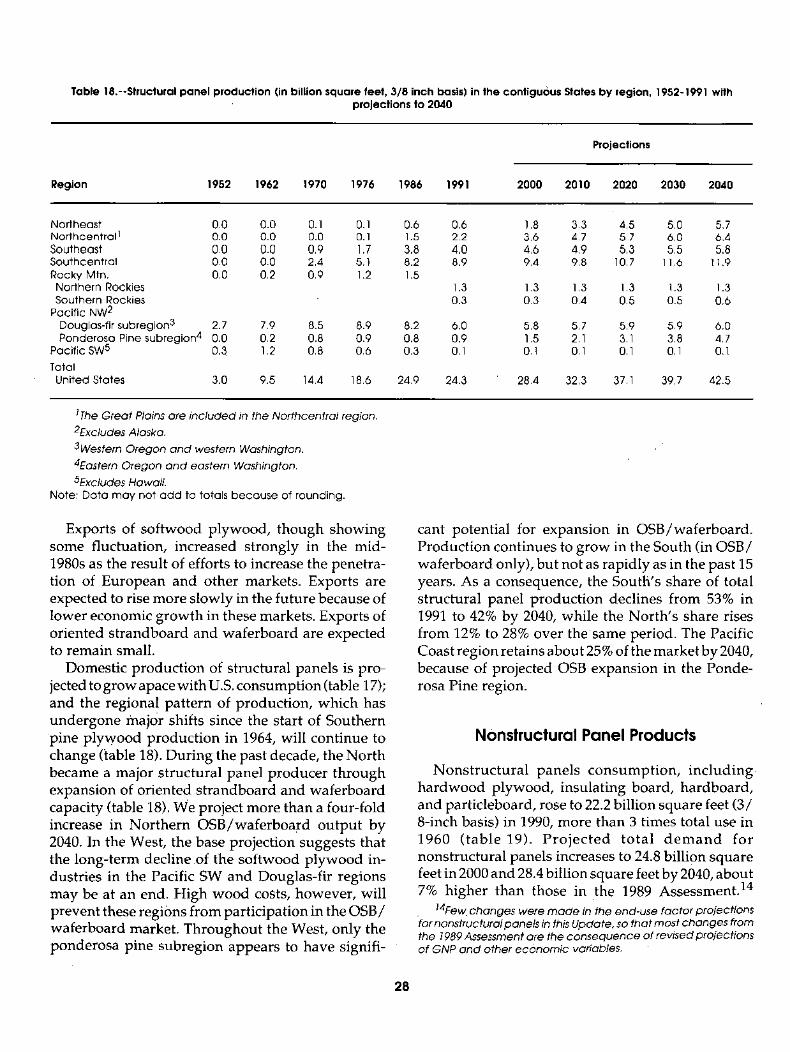
Table 1&-oStructural panel production (in billion square feet, 3/8 inch basis) in the contiguous States by region, 1952-1991 with projections to 2040
Projections
Region 1952 1962 1970 1976 1986 1991 2000 2010 2020 2030 2040
Northeast 0.0 0.0 0.1 0.1 0.6 0.6 1.8 3.3 4.5 5.0 5.7 Northcentral 1 0.0 0.0 0.0 0.1 1.5 2.2 3.6 4.7 5.7 6.0 6.4 Southeast 0.0 0.0 0.9 1.7 3.8 4.0 4.6 4.9 5.3 5.5 5.8 Southcentral 0.0 0.0 2.4 5.1 8.2 8.9 9.4 9.8 10.7 11.6 11.9 Rocky Mtn. 0.0 0.2 0.9 1.2 1.5 Northern Rockies 1.3 1.3 1.3 1.3 1.3 1.3 Southern Rockies 0.3 0.3 0.4 0.5 0.5 0.6
Pacific NW 2 Douglas-fir subregion 3 2.7 7.9 8.5 8.9 8.2 6.0 5.8 5.7 5.9 5.9 6.0 Ponderosa Pine subregion 4 0.0 0.2 0.8 0.9 0.8 0.9 1.5 2.1 3.1 3.8 4.7
Pacific SW 5 0.3 1.2 0.8 0.6 0.3 0.1 0.1 0.1 0.1 0.1 0.1
Total United States 3.0 9.5 14.4 18.6 24.9 24.3 28.4 32.3 37.1 39.7 42.5
1 The Great Plains are included in the Northcentral region,
2Excludes Alaska.
3Western Oregon and western Washington.
4Eastern Oregon and eastern Washington,
5Excludes Hawafi. Note: Data may not add to totals because of rounding.
Exports of softwood plywood, though showing some fluctuation, increased strongly in the mid- 1980s as the result of efforts to increase the penetra- tion of European and other markets. Exports are expected to rise more slowly in the future because of lower economic growth in these markets. Exports of oriented strandboard and waferboard are expected to remain small.
Domestic production of structural panels is pro- jected to grow apace with U.S. consumption (table 17); and the regiona ! pattern of production, which has undergone major shifts since the start of Southern pine plywood production in 1964, will continue to change (fable 18). During the past decade, the North became a major structural panel producer through expansion of oriented strandboard and waferboard capacity (table 18). We project more than a four-fold increase in Northern OSB/waferboard output by 2040. In the West, the base projection suggests that the long-term decline of the softwood plywood in- dustries in the Pacific SW and Douglas-fir regions may be at an end. High wood costs, however, will prevent these regions from participation in the OSB/ waferboard market. Throughout the West, only the ponderosa pine subregion appears to have signifi-
cant potential for expansion in OSB/waferboard. Production continues to grow in the South (in OSB/ waferboard only), but not as rapidly as in the past 15 years. As a consequence, the South's share of total structural panel production declines from 53% in 1991 to 42% by 2040, while the North's share rises from 12% to 28% over thesame period. The Pacific Coast region retains about 25 % of the market by 2040, because of projected OSB expansion in the Ponde- rosa Pine region.
Nonstructural Panel Products
Nonstructural panels consumption, including hardwood plywood, insulating board, hardboard, and particleboard, rose to 22.2 billion square feet (3/ 8-inch basis) in 1990, more than 3 times total use in 1960 (table 19). Projected total d e m a n d for nonstructural panels increases to 24.8 billion square feet in 2000 and 28.4 billion square feet by 2040, about 7% higher than those in the 1989 Assessment. 14
14Fe~ changes were made in the end-use factor projections for nonstructural panels in this Update, so that most changes from the 1989 Assessment are the consequence of revised projections of GNP and other economic variables.
28
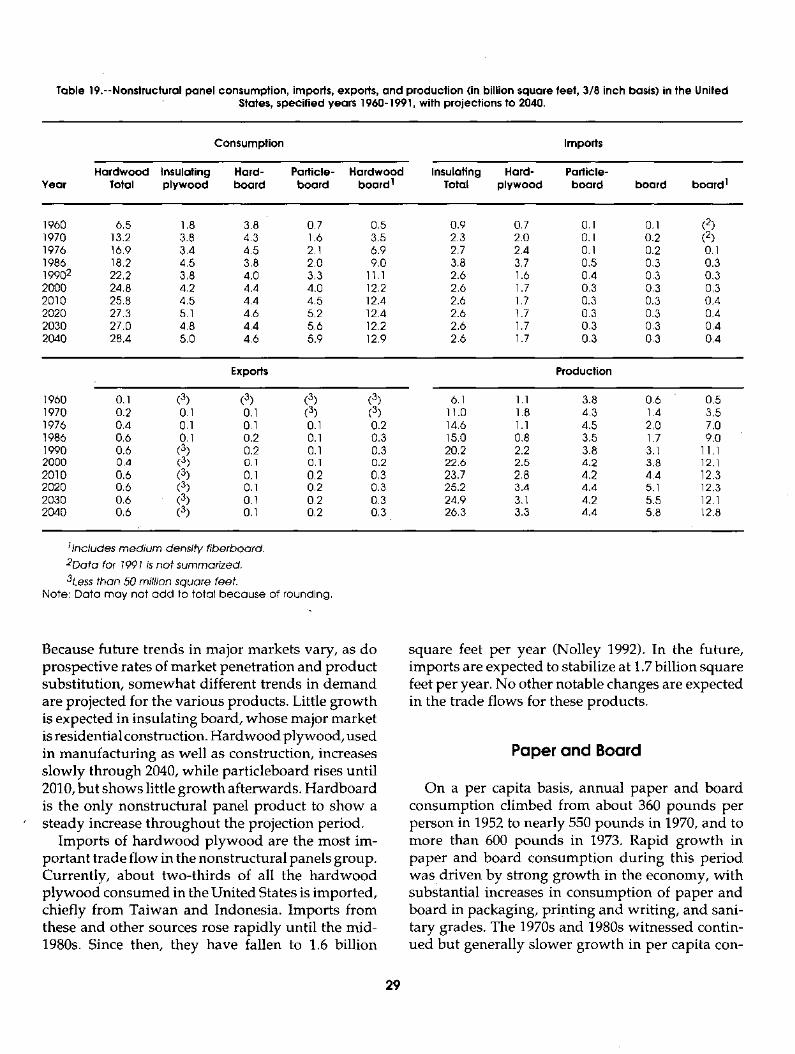
Table 19.--Nonstructural panel consumption, imports, exports, and production (in billion square feet, 3/8 inch basis) in the United States, specified years 1960-199 I, with projections to 2040.
Consumption Imports
Hardwood Insulating Hard- Particle- Hardwood Insulating Hard- Particle- Year Total plywood board board board I Total plywood board board board I
1960 6.5 1.8 3.8 0.7 0.5 0.9 0.7 0.1 0.1 (2) 1970 13.2 3.8 4.3 1.6 3.5 2.3 2.0 0.1 0.2 (2) 1976 16.9 3.4 4.5 2.1 6.9 2.7 2.4 0.1 0.2 0,1 1986 18.2 4.5 3.8 2.0 9.0 3.8 3.7 0.5 0.3 0.3 19902 22.2 3.8 4.0 3.3 11.1 2.6 1.6 0.4 0,3 0,3 2000 24.8 4,2 4.4 4.0 12.2 2.6 1.7 0.3 0.3 0.3 2010 25.8 4.5 4.4 4.5 12.4 2.6 1.7 0.3 0.3 0.4 2020 27.3 5.1 4.6 5.2 12.4 2.6 1.7 0.3 0.3 0.4 2030 27.0 4.8 4.4 5.6 12.2 2.6 1.7 0.3 0.3 0.4 2040 28.4 5.0 4.6 5.9 12.9 2.6 1.7 0.3 0,3 0.4
Exports Production
1960 0.1 (3) (3) (3) (3) 6.1 1.1 3.8 0.6 0.5 1970 0.2 0.1 0.1 (3) (3) 11.0 1.8 4.3 1.4 3.5 1976 0.4 0.1 0.1 0.1 0.2 14.6 1.1 4.5 2.0 7.0 1986 0.6 0.1 0.2 0.1 0.3 15.0 0.8 3.5 1.7 9.0 1990 0.6 (3) 0.2 0.1 0.3 20.2 2.2 3.8 3.1 11.1 2000 0.4 (3) O. 1 O. 1 0.2 22.6 2.5 4.2 3.8 12.1 2010 0.6 (3) 0.1 0.2 0.3 23.7 2.8 4.2 4.4 12.3 2020 0.6 (3) 0.1 0.2 0.3 25.2 3.4 4.4 5.1 12.3 2030 0.6 (3) 0.1 0.2 0.3 24.9 3.1 4.2 5.5 12.1 2040 0.6 (3) 0.1 0.2 0.3 26.3 3.3 4.4 5.8 12.8
l lncludes medium density fiberboard.
2Data for 1991 is not summarized.
3Less than 50 million square feet. Note: Data may not add to total because of rounding.
Because future trends in major markets vary, as do prospective rates of market penetration and product substitution, somewhat different trends in demand are projected for the various products. Little growth is expected in insulating board, whose major market is residential construction. Hardwood plywood, used in manufacturing as well as construction, increases slowly through 2040, while particleboard rises until 2010, but shows little growth afterwards. Hardboard is the only nonstructural panel product to show a steady increase throughout the projection period.
Imports of hardwood plywood are the most im- portant trade flow in the nonstructural panels group. Currently, about two-thirds of all the hardwood plywood consumed in the United States is imported, chiefly from Taiwan and Indonesia. Imports from these and other sources rose rapidly until the mid- 1980s. Since then, they have fallen to 1.6 billion
square feet per year (Nolley 1992). In the future, imports are expected to stabilize at 1.7 billion square feet per year. No other notable changes are expected in the trade flows for these products.
Paper and Board
On a per capita basis, annual paper and board consumption climbed from about 360 pounds per person in 1952 to nearly 550 pounds in 1970, and to more than 600 pounds in 1973. Rapid growth in paper and board consumption during this period was driven by strong growth in the economy, with substantial increases in consumption of paper and board in packaging, printing and writing, and sani- tary grades. The 1970s and 1980s witnessed contin- ued but generally slower growth in per capita con-
29
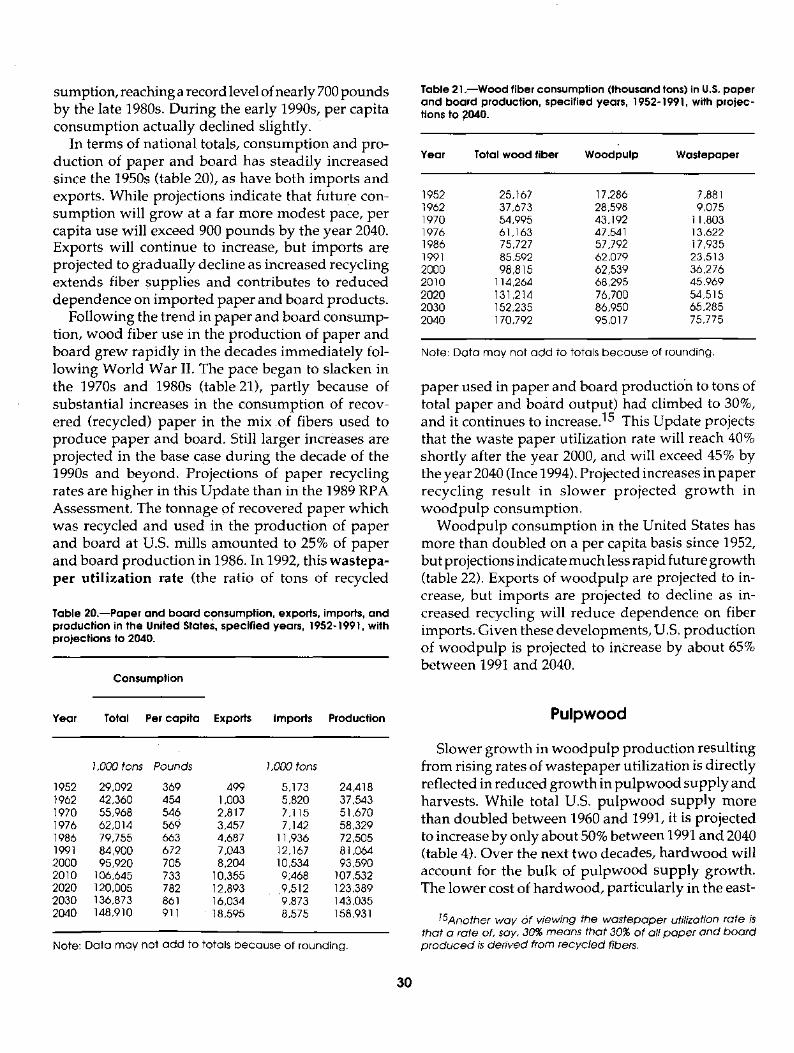
sumption, reaching a record level of nearly 700 pounds by the late 1980s. During the early 1990s, per capita consumption actually declined slightly.
In terms of national totals, consumption and pro- duction of paper and board has steadily increased since the 1950s (table 20), as have both imports and exports. While projections indicate that future con- sumption will grow at a far more modest pace, per capita use will exceed 900 pounds by the year 2040. Exports will continue to increase, but imports are projected to gradually decline as increased recycling extends fiber Supplies and contributes to reduced dependence on imported paper and board products.
Following the trend in paper and board consump- tion, wood fiber use in the production of paper and board grew rapidly in the decades immediately fol- lowing World War II. The pace began to slacken in the 1970s and 1980s (table 21), partly because of substantial increases in the consumption of recov- ered (recycled) paper in the mix of fibers used to produce paper and board. Still larger increases are projected in the base case during the decade of the 1990s and beyond. Projections of paper recycling rates are higher in this Update than in the 1989 RPA Assessment. The tonnage of recovered paper which was recycled and used in the production of paper and board at U.S. mills amounted to 25% of paper and board production in 1986. In 1992, this wastepa- per util ization rate (the ratio of tons of recycled
Table 20.--Paper and board consumption, exports, imports, and production in the United States, specified years, 1952-1991, with projections to 2040.
Consumption
Year Total Per capita Exports Imports Production
1,000 tons Pounds 1,000 tons
1952 29,092 369 499 5,173 24,418 1962 42,360 454 1,003 5,820 37,543 1970 55,968 546 2,817 7,115 51,670 1976 62,014 569 3,457 7,142 58,329 1986 79,755 663 4,687 11,936 72,505 1991 84,900 672 7,043 12,167 81,064 2000 95,920 705 8,204 10,534 93,590 2010 106,645 733 10,355 9;468 107,532 2020 120,005 782 12,893 . 9,512 123,389 2030 136,873 861 16,034 9,873 143,035 2040 148,910 911 18,595 8,575 158,931
Note: Data may not add to totals because of rounding.
Table 21 . iWood fiber consumption (thousand tons) in U.S. paper and board production, specified years, 1952-1991, with projec- tions to 2040.
Year Total wood fiber Woodpulp Wastepaper
1952 25,167 17,286 7,881 1962 37,673 28,598 9,075 1970 54,995 43,192 11,803 1976 61,163 47,541 13,622 1986 75,727 57,792 17,935 1991 85,592 62,079 23,513 2000 98,815 62,539 36,276 2010 114,264 68,295 45,969 2020 131,214 76,700 54,515 2030 152,235 86,950 65,285 2040 170,792 95,017 75,775
Note: Data may not add to totals because of rounding.
paper used in paper and board production to tons of total paper and board output) had climbed to 30%, and it continues to increase. 15 This Update projects that the waste paper utilization rate will reach 40% shortly after the year 2000, and will exceed 45% by the year 2040 (Ince 1994). Projected increases in paper recycling result in slower projected growth in woodpulp consumption.
Woodpulp consumption in the United States has more than doubled on a per capita basis since 1952, but projections indicate much less rapid future growth (table 22). Exports of woodpulp are projected to in- crease, but imports are projected to decline as in- creased recycling will reduce dependence on fiber imports.Given these developments, U.S. production of woodpulp is projected to increase by about 65% between 1991 and 2040.
Pulpwood
Slower growth in woodpulp production resulting from rising rates of wastepaper utilization is directly reflected in reduced growth in pulpwood supply and harvests. While total U.S. pulpwood supply more than doubled between 1960 and 1991, it is projected to increase by only about 50% between 1991 and 2040 (table 4). Over the next two decades, hardwood will account for the bulk of pulpwood supply growth. The lower cost of hardwood, particularly in the east-
15Another way 6f viewing the wastepaper utilization rate is that a rate of, say, 30% means that 30% of all paper and board produced is derived from recycled fibers.
30
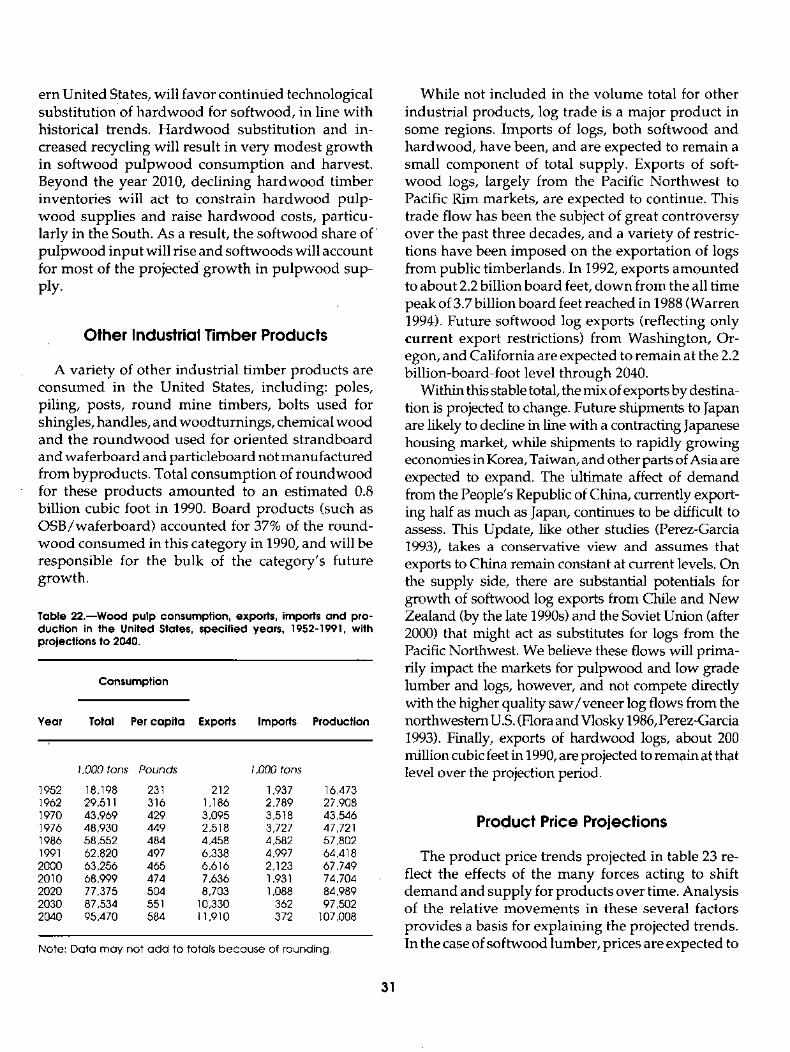
ern United States, will favor continued technological substitutionof hardwood for softwood, in line with historical trends. Hardwood substitution and in- creased recycling will result in very modest growth in softwood pulpwood consumption and harvest. Beyond the year 2010, declining hardwood timber inventories will act to constrain hardwood pulp- wood supplies and raise hardwood costs, particu- larly in the South. As a result, the softwood share of' pulpwood input will rise and softwoods will account for most of the projected growth in pulpwood sup- ply.
Other Industrial Timber Products
A variety of other industrial timber products are consumed in the United States, including: poles, piling, posts, round mine timbers, bolts used for shingles, handles, and woodturnings, chemical wood and the roundwood used for oriented strandboard and waferboard and particleboard not manufactured from byproducts. Total consumption of roundwood for these products amounted to an estimated 0.8 billion cubic foot in 1990. Board products (such as OSB/waferboard) accounted for 37% of the round- wood consumed in this category in 1990, and will be responsible for the bulk of the category's future growth.
Table 22.--Wood pulp consumption, exports, imports and pro- duction in the United States, specified years, 1952-1991, with projections to 2040.
Consumption
Year Total Per capita Exports Imports Production
1,000tons Pounds 1,000 tons
1952 18,198 231 212 1,937 16,473 1962 29,511 316 1,186 2,789 27,908 1970 43,969 429 3,095 3,518 43,546 1976 48,930 449 2,518 3,727 47,721 1986 58,552 484 4,458 4,582 57,802 1991 62,820 497 6,338 4,997 64,418 2000 63,256 465 6,616 2,123 67,749 2010 68,999 474 7,636 1,931 74,704 2020 77,375 504 8,703 1,088 84,989 2030 87,534 551 10,330 362 97,502 2040 95,470 584 11,910 372 107,008
Note: Data may not add to totals because of rounding.
While not included in the volume total for other industrial products, log trade is a major product in some regions. Imports of logs, both softwood and hardwood, have been, and are expected to remain a small component of total supply. Exports of soft- wood logs, largely from the Pacific Northwest to Pacific Rim markets, are expected to continue. This trade flow has been the subject of great controversy over the past three decades, and a variety of restric- tions have been imposed on the exportation of logs from public timberlands. In 1992, exports amounted to about 2.2 billion board feet, down from the all time peak of 3.7 billion board feet reached in 1988 (Warren 1994). Future softwood log exports (reflecting only current export restrictions) from Washington, Or- egon, and California are expected to remain at the 2.2 billion-board-foot level through 2040.
Within this stable total, the mix of exports by destina- tion is projected to change. Future shipments to Japan are likely to decline in line with a contracting Japanese housing market, while shipments to rapidly growing economies in Korea, Taiwan, and other parts of Asia are expected to expand. The Ultimate affect of demand from the People's Republic of China, currently export- ing half as much as Japan, continues to be difficult to assess. This Update, like other studies (Perez-Garcia 1993), takes a conservative view and assumes that exports to China remain constant at current levels. On the supply side, there are substantial potentials for growth of softwood log exports from Chile and New Zealand (by the late 1990s) and the Soviet Union (after 2000) that might act as substitutes for logs from the Pacific Northwest. We believe these flows will prima- rily impact the markets for pulpwood and low grade lumber and logs, however, and not compete directly with the higher quality saw/veneer log flows from the northwestern U.S. (Flora and Vlosky 1986, Perez-Garcia 1993). Finally, exports of hardwood logs, about 200 million cubic feet in 1990, are projected to remain at that level over the projection period.
Product Price Projections
The product price trends projected in table 23 re- flect the effects of the many forces acting to shift demand and supply for products over time. Analysis of the relative movements in these several factors provides a basis for explaining the projected trends. In the case of softwood lumber, prices are expected to
31
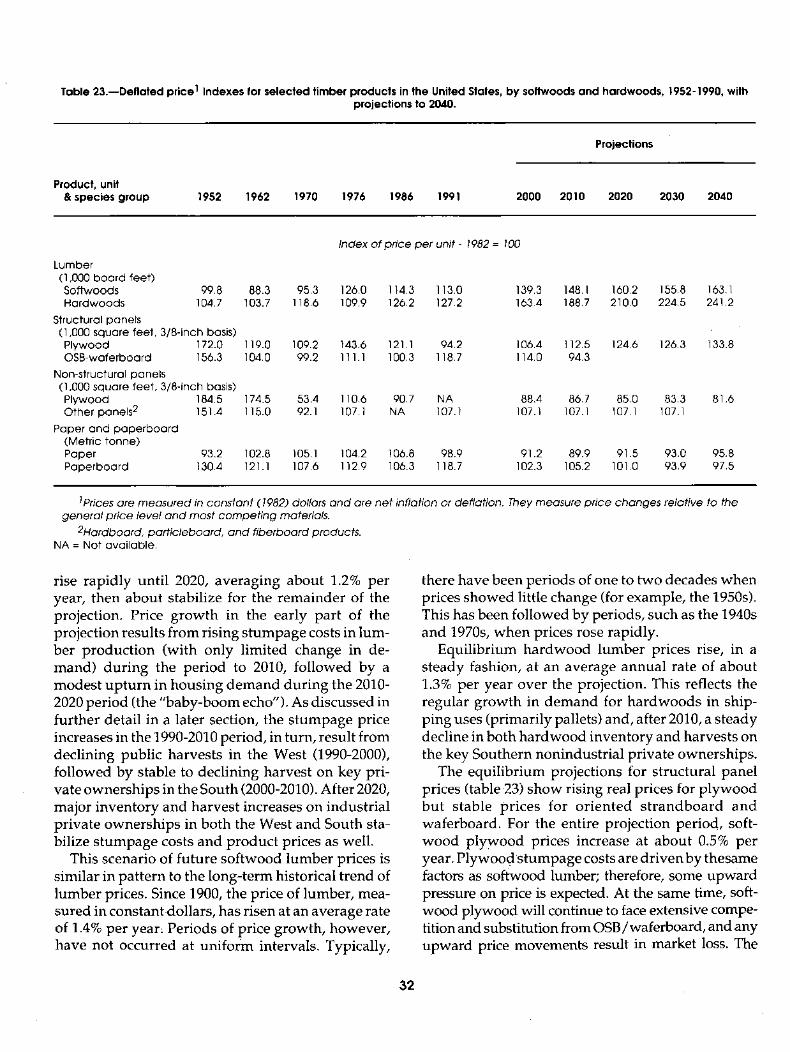
Table 23.--Deflated price I indexes for selected timber products in the United States, by softwoods and hardwoods, 1952-1990, with projections to 2040.
Projections
Product, unit & species group 1952 1962 1970 1976 1986 1991 2000 2010 2020 2030 2040
Index of price per unit - 1982 = 100
Lumber (1,000 board feet) Softwoods 99.8 88.3 95.3 1 2 6 . 0 1 1 4 . 3 113.0 139.3 148 .1 1 6 0 . 2 1 5 5 . 8 163.1 Hardwoods 104.7 1 0 3 . 7 1 1 8 . 6 1 0 9 . 9 1 2 6 . 2 127.2 163.4 1 8 8 . 7 210.0 224.5 241.2
Structural panels (1,000 square feet, 3/8-inch basis) Plywood 172.0 1 1 9 . 0 1 0 9 . 2 1 4 3 . 6 121.1 94.2 106.4 1 1 2 . 5 1 2 4 . 6 1 2 6 . 3 133.8 OSB-waferboard 156.3 104.0 99.2 111.1 100.3 118.7 114.0 94.3
Non-structural panels (1,000 square feet, 3/8-inch basis) Plywood 184.5 174.5 53.4 110.6 90.7 NA 88.4 86.7 85.0 83.3 81.6 Other panels 2 151.4 115.0 92.1 107.1 NA 107.1 107.1 107.1 107.1 107.1
Paper and paperboard (Metric tonne) Paper 93.2 1 0 2 . 8 105 .1 1 0 4 . 2 106.8 98.9 91.2 89.9 91.5 93.0 95.8 Paperboard 130.4 121 .1 1 0 7 . 6 1 1 2 . 9 1 0 6 . 3 118.7 102.3 1 0 5 . 2 101.0 93.9 97.5
1prices are measured in constant (1982) dollars and are net inflation or deflation. They measure price changes relative to the general price level and most compet ing materials.
2Hardboard, part icleboard, and f iberboard products. NA = Not available.
rise rapidly until 2020, averaging about 1.2% per year, then about stabilize for the remainder of the projection. Price growth in the early part of the projection results from rising stumpage costs in lum- ber production (with only limited change in de- mand) during the period to 2010, followed by a modest upturn in housing demand during the 2010- 2020 period (the "baby-boom echo"). As discussed in further detail in a later section, the stumpage price increases in the 1990-2010 period, in turn, result from declining public harvests in the West (1990-2000), followed by stable to declining harvest on key pri- vate ownerships in the South (2000-2010). After 2020, major inventory and harvest increases on industrial private ownerships in both the West and South sta- bilize stumpage costs and product prices as well.
This scenario of future softwood lumber prices is similar in pattern to the long-term historical trend of lumber prices. Since 1900, the price of lumber, mea- sured in constantdollars, has risen at an average rate of 1.4% per year: Periods of price growth, however, have not occurred at uniform intervals. Typically,
there have been periods of one to two decades when prices showed little change (for example, the 1950s). This has been followed by periods, such as the 1940s and 1970s, when prices rose rapidly.
Equilibrium hardwood lumber prices rise, in a steady fashion, at an average annual rate of about 1.3% per year over the projection. This reflects the regular growth in demand for hardwoods in ship- ping uses (primarily pallets) and, after 2010, a steady decline in both hardwood inventory and harvests on the key Southern nonindustrial private ownerships.
The equilibrium projections for structural panel prices (table 23) show rising real prices for plywood but stable prices for oriented strandboard and waferboard. For the entire projection period, soft- wood plywood prices increase at about 0.5% per year. Plywood stumpage costs are driven by thesame factors as softwood lumber; therefore, some upward pressure on price is expected. At the same time, soft- wood plywood will continue to face extensive compe- tition and substitution from OSB/waferboard, and any upward price movements result in market loss. The
32
interaction of these two considerations yields the limited but steady price growth projected. In contrast, price projections for OSB / waferboard show little change over the projection period. This is the consequence of very limited growth in wood costs because of lower wood input quality requirements.
Little change is projected for the prices ofnonstructural panels. Real prices of hardwood plywood are expected to continue to decline (at a decreasing rate) throughout the projection period. Prices for the other board products are expected to remain constant in real terms.
Projected paper and paperboard prices exhibit a different trend than most of the solid wood products. In general, paper and paperboard prices are expected to remain about constant over the next 50 years. Among other things, this reflects the effects of increased recycling that extends fiber supplies and enhances competitiveness of U.s. producers (these projections show that the U.s. becomes a net exporter of paper and paperboard products). Pulp and paper prices exhibit a tendency to rise and fall with business cycles, and prices for several grades have been rising in the past year, especially market pulp prices. But, without some major demand shift (for example, a shift away from substitution of electronic media and plastics for paper and board products), per ca pi ta consumption for most paper and board products should increase only gradually from around 700 pounds at present to 900 pounds in 2040.
THE STUMPAGE MARKET
Projected Consumption and Harvest of Timber
The projections of timber products consumption in previous sections have been presented, for the most part, in standard units of measure, such as board feet of lumber, square feet of panel products, cords of pulpwood and fuelwood, and cubic feet of miscellaneous industrial round wood. To aggregate the wood volumes consumed in the manufacture of these products and to estimate the associated timber harvests, these projections are converted to a common unit of measure-cubic feet of roundwood. Rates of conversion vary by product, region, species, and over time, reflecting the projected wood utilization efficiencies of the industries involved and our estimates of future changes in technology and type of timber processed.
33
Consumption of Roundwood
In 1991, total U.s. consumption of timber products in terms of round wood volume was 18.7 billion cubic feet, including fuelwood obtained from nongrowing stock sources (table 24).16 Total consumption of timber products is projected to increase to 20.4 billion cubic feet in 2000, and 26.5 billion cubic feet in 2040, an average growth rate of about 0.6% per year over the next 50 years. The growth rate for hard woods will be higher than that for softwoods, particularly in the period prior to 2010, as hardwood use in pulping grows sharply. Pulpwood and fuelwood show the largest increases in volume. By 2040, these two products account for 47% of the timber consumed in the United States. Miscellaneous products exhibits the largest increase on a percentage basis, because of the growth in roundwood used for oriented strandboard and waferboard. Wood use for veneer remains constant or declines relative to 1991 levels for both softwoods and hardwoods.
These results differ from the 1989 and past Assessments, showing substantially lower volumes of wood consumed in pulping. The 1989 RP A Assessment, for example, projected an increase of some 5 billion cubic feet of pulpwood by 2040. The higher levels of recycling used in this Update eliminate these large increases in pulpwood harvest.
Part of this total consumption is met by trade with other countries. The scale of this trade relative to consumption and u.s. harvest can be seen in table 25. In 1991, nearly 20% of total demand was filled by imports. Total imports in 1991 amounted to 2.8 billion cubic feet, almost double the volume imported in 1952. Over the same period, exports rose more than 22 times, to 2.2 billion cubic feet.
Projected levels of total imports change little over the projection because of compensating shifts in component products: increases in lumber and panel products are offset by declining imports of pulp and paper products. Total hardwood imports rise in the near term but return to current levels by 2040. Projected total exports increase about 13% to 2.5 billion cubic feet in 2040 as a result of general increases in exports of all products. Exports of hardwood prod-
761nclusion of fuelwood from non-growing stock sources is consistent with conventions used in post Assessments. The 7983 Assessment Supplement (Haynes and Adams 7985) and the South's Fourth Forest Study (USDA Forest Service 7988), however, did not include non-growing stock fuelwood in their estimates of total roundwood consumption:
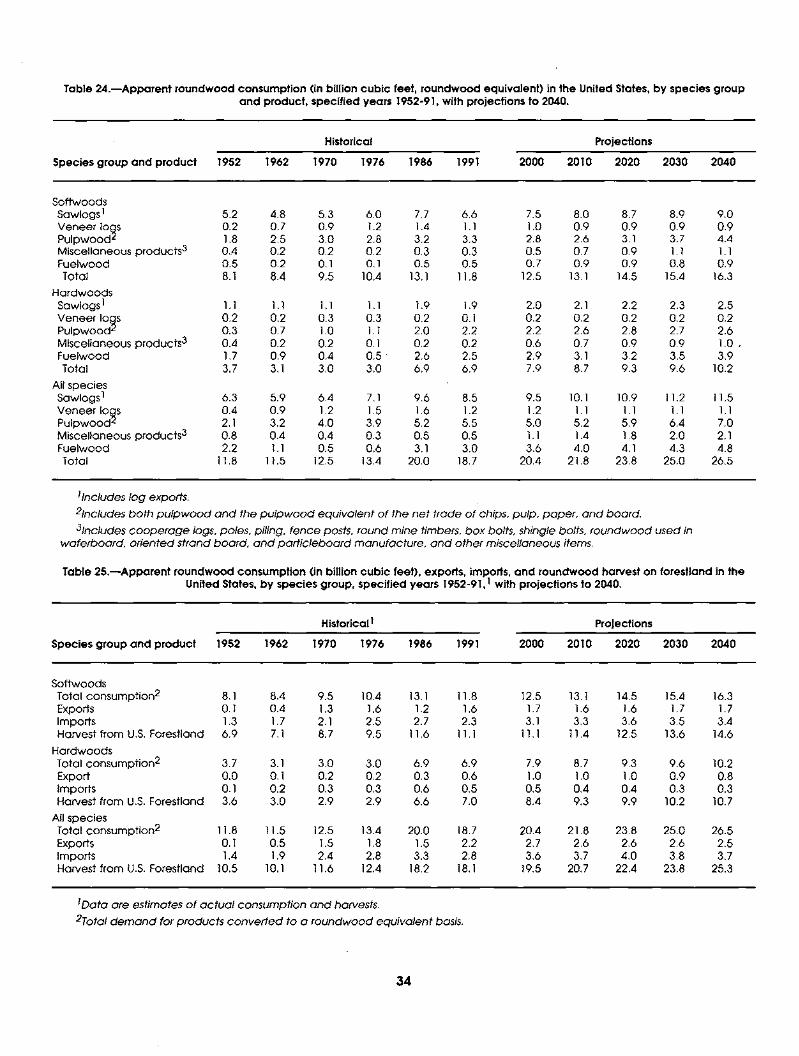
Table 24.mApparent roundwood consumption (in billion cubic feet, roundwood equivalent) in the United States, by species group and product, specified years 1952-91, with projections to 2040.
Historical Projections
Species group and product 1952 1962 1970 1976 1986 1991 2000 2010 2020 2030 2040
Softwoods Sawlogs 1 5.2 4.8 5.3 6.0 7.7 6.6 7.5 8.0 8.7 8.9 9.0 Veneer Io~s 0.2 0.7 0.9 1.2 1.4 1.1 1.0 0.9 0.9 0.9 0.9 Pulpwood z 1.8 2.5 3.0 2.8 3.2 3.3 2.8 2.6 3.1 3.7 4.4 Miscellaneous products 3 0..4 0.2 0.2 0.2 0.3 0.3 0.5 0.7 0.9 1.1 1.1 Fuelwood 0.5 0.2 0.1 0.1 0.5 0.5 0.7 0.9 0.9 0.8 0.9 Total 8.1 8.4 9.5 10.4 13.1 11.8 12.5 13.1 14.5 15.4 16.3
Hardwoods Sawlogs 1 1.1 1.1 1.1 1.1 1.9 1.9 2.0 2.1 2.2 2.3 2.5 Veneer Io~s 0.2 0.2 0.3 0.3 0.2 0.1 0.2 0.2 0.2 0.2 0.2 Pulpwood z 0.3 0.7 1.0 1.1 2.0 2.2 2.2 2.6 2.8 2.7 2.6 Miscellaneous products 3 0.4 0.2 0.2 0.1 0.2 0.2 0.6 0.7 0.9 0.9 1.0 Fuelwood 1.7 0.9 0.4 0.5 " 2.6 2.5 2.9 3.1 3,2 3.5 3.9 Total 3.7 3.1 3.0 3.0 6.9 6.9 7.9 8.7 9.3 9.6 10.2
All species Sawlogs 1 6.3 5.9 6.4 7.1 9.6 8.5 9.5 10.1 10.9 11.2 11.5 Veneer Io~s 0.4 0.9 1.2 1.5 1.6 1.2 1.2 1.1 1.1 1.1 1.1 Pulpwood L 2.1 3.2 4.0 3.9 5.2 5.5 5.0 5.2 5.9 6.4 7.0 Miscellaneous products 3 0.8 0.4 0.4 0.3 0.5 0.5 1.1 1.4 1.8 2.0 2.1 Fuelwood 2.2 1.1 0.5 0.6 3.1 3.0 3.6 4.0 4.1 4.3 4,8 Total 11.8 11.5 12.5 13.4 20.0 18.7 20.4 21.8 23.8 25.0 26.5
l lncludes log exports.
2Includes both pulpwood and the pulpwood equivalent of the net trade of chips, pulp, paper, and board.
3Includes cooperage logs, poles, piling, fence posts, round mine timbers, box bolts, shingle bolts, roundwood used in waferboard, oriented strand board, and particleboard manufacture, and other miscellaneous items.
Table 25.--Apparent roundwood consumption (in billion cubic feet), exports, imports, and roundwood harvest on forestland in the United States, by species group, specified years 1952-91,1 with projections to 2040.
Historical I Projections
Species group and product 1952 1962 1970 1976 1986 1991 2000 2010 2020 2030 2040
Softwoods Total consumption 2 8.1 8.4 9.5 10.4 13.1 11.8 12.5 13.1 14.5 15.4 16.3 Exports 0.1 0.4 1.3 1.6 1.2 1.6 1.7 1.6 1.6 1.7 1.7 Imports 1.3 1.7 2.1 2.5 2.7 2.3 3.1 3.3 3.6 3.5 3.4 Harvest from U.S. Forestland 6.9 7.1 8.7 9.5 11.6 11.1 11.1 11.4 12.5 13.6 14.6
Hardwoods Total consumption 2 3.7 3.1 3.0 3.0 6.9 6.9 7.9 8.7 9.3 9.6 10.2 Export 0.0 0.1 0.2 0.2 0.3 0.6 1.0 1.0 1.0 0.9 0.8 Imports 0.1 0.2 0.3 0.3 0.6 0.5 0.5 0.4 0.4 0.3 0.3 Harvest from U.S. Forestland 3.6 3.0 2.9 2.9 6.6 7.0 8.4 9.3 9.9 10.2 10.7
All species Total consumption 2 11.8 11.5 12.5 13.4 20.0 18.7 20.4 21.8 23.8 25.0 26.5 Exports 0.1 0.5 1.5 1.8 1.5 2.2 2.7 2.6 2.6 2.6 2.5 Imports 1.4 1.9 2.4 2.8 3.3 2.8 3.6 3.7 4.0 3.8 3.7 Harvest from U,S. Forestland 10.5 10.1 11.6 12.4 18.2 18.1 19.5 20.7 22.4 23.8 25.3
I Data are estimates of actual consumption and harvests. 2Total demand for products converted to a roundwood equivalent basis.
34
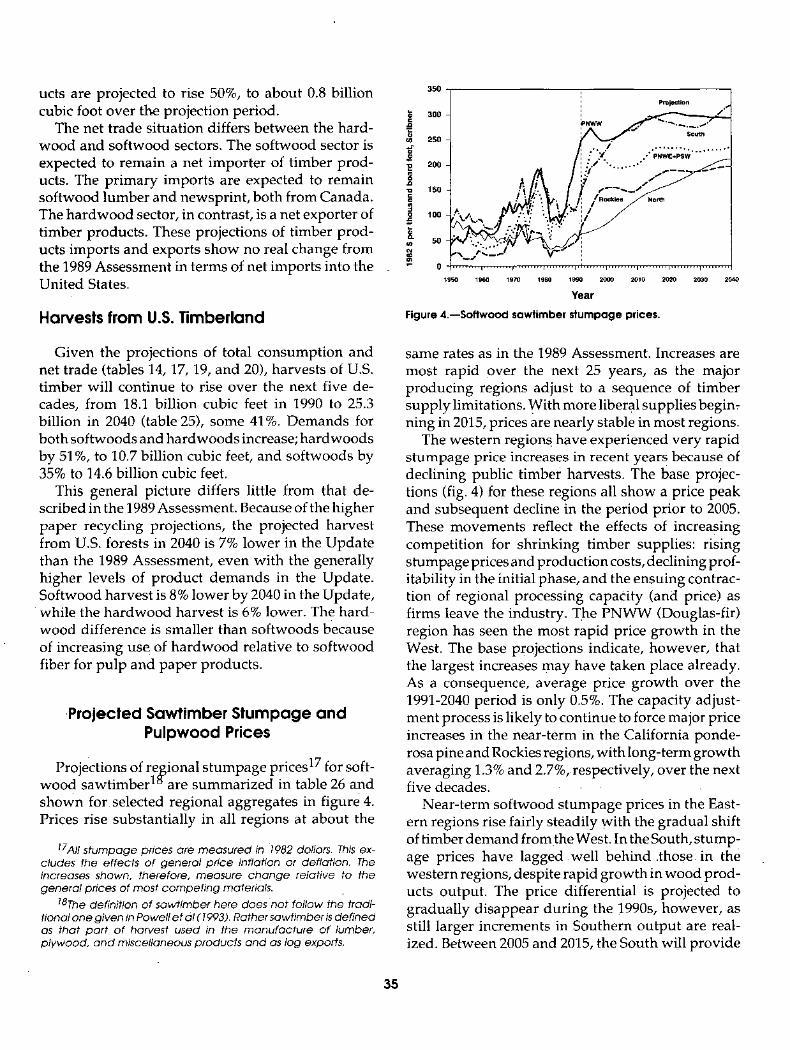
ucts are projected to rise 50%, to about 0.8 billion cubic foot over tl'~e projection period.
The net trade situation differs between the hard- wood and softwood sectors. The softwood sector is expected to remain a net importer of timber prod- ucts. The primary imports are expected to remain softwood lumber and newsprint, both from Canada. The hardwood sector, in contrast, is a net exporter of timber products. These projections of timber prod- ucts imports and exports show no real change from the 1989 Assessment in terms of net imports into the United States.
Harvests from U.S. Timberland
Given the projections of total consumption and net trade (tables 14, 17, 19, and 20), harvests of U.S. timber will continue to rise over the next five de- cades, from 18.1 billion cubic feet in 1990 to 25.3 billion in 2040 (table 25), some 41%. Demands for both softwoods and hardwoods increase; hardwoods by 51%, to 10.7 billion cubic feet, and softwoods by 35% to 14.6 billion cubic feet.
This general picture differs little from that de- scribed in the 1989 Assessment. Because of the higher paper recycling projections, the projected harvest from U.S. forests in 2040 is 7% lower in the Update than the 1989 Assessment, even with the generally higher levels of product demands in the Update. Softwood harvest is 8% lower by 2040 in the Update,
whi le the hardwood harvest is 6% lower. The hard- wood difference is smaller than softwoods because of increasing use of hardwood relative to softwood fiber for pulp and paper products.
Projected Sawtimber Stumpage and Pulpwood Prices
Projections of regional stumpage prices 17 for soft- wood sawtimberl~are summarized in table 26 and shown for selected regional aggregates in figure 4. Prices rise substantially in all regions at about the
17,411 stumpage prices are measured in 1982 dollars. This ex- cludes the effects of general price inflation or deflation. The increases shown, therefore, measure change relative to the general prices of most competing materials.
18The definition of sawtimber here does no t foflow the tradi- tional one given in Powell et al (1993). Rather sawtimber is defined as that part of harvest used in the manufacture of lumber, plywood, and miscellaneous products and as log exports.
350
300
250
i 200
150
100
5O
0
projection
PNWW /*~" " South
, .. /* .. . . . . . . . . .... .-
( f ,:->-'7"" • I ~ /Rockies / /Nor lh 1../: ! . . . . . . . . / . . . . . . .
. . . . . . . . . i . . . . . . . . . i . . . . . . . . . i . . . . . . . . . t , I . . . . . . . i . . . . . . . . . i . . . . . . . . . i . . . . . . . . . i . . . . . . . . .
1950 1960 1970 1980 1990 2000 2010 2020 2030 2040 Y e a r
Figure 4.--Softwood sawtimber stumpage prices.
same rates as in the 1989 Assessment. Increases are most rapid over the next 25 years, as the major producing regions adjust to a sequence of timber supply limitations. With more liberal supplies begin: ning in 2015, prices are nearly stable in most regions.
The western regions, have experienced very rapid stumpage price increases in recent year s because of declining public timber harvests. The base projec- tions (fig. 4) for these regions all show a price peak and subsequent decline in the period prior to 2005. These movements reflect the effects of increasing competition for shrinking timber supplies: rising stumpage prices and production costs, declining prof- itability in the initial phase, and the ensuing contrac- tion of regional processing capadty (and price) as firms leave the industry. The PNWW (Douglas-fir) region has seen the most rapid price growth in the West. The base projections indicate, however, that the largest increases may have taken place already. As a consequence, average price growth over the 1991-2040 period is only 0.5%. The capacity adjust- ment process is likely to continue to force major price increases in the near-term in the California ponde- rosa pine and Rockies regions, with long-term growth averaging 1.3% and 2.7%, respectively, over the next five decades.
Near-term softwood stumpage prices in the East- ern regions rise fairly steadily with the gradual shift of timber demand fromthe West. In the South, stump- age prices have lagged ~well behind .those: in the western regions, despite rapid growth in wood prod- ucts output. The price differential is projected to gradually disappear during the !990s, however, as still larger increments in Southern output are real- ized. Between 2005 and 2015, the South will provide
35
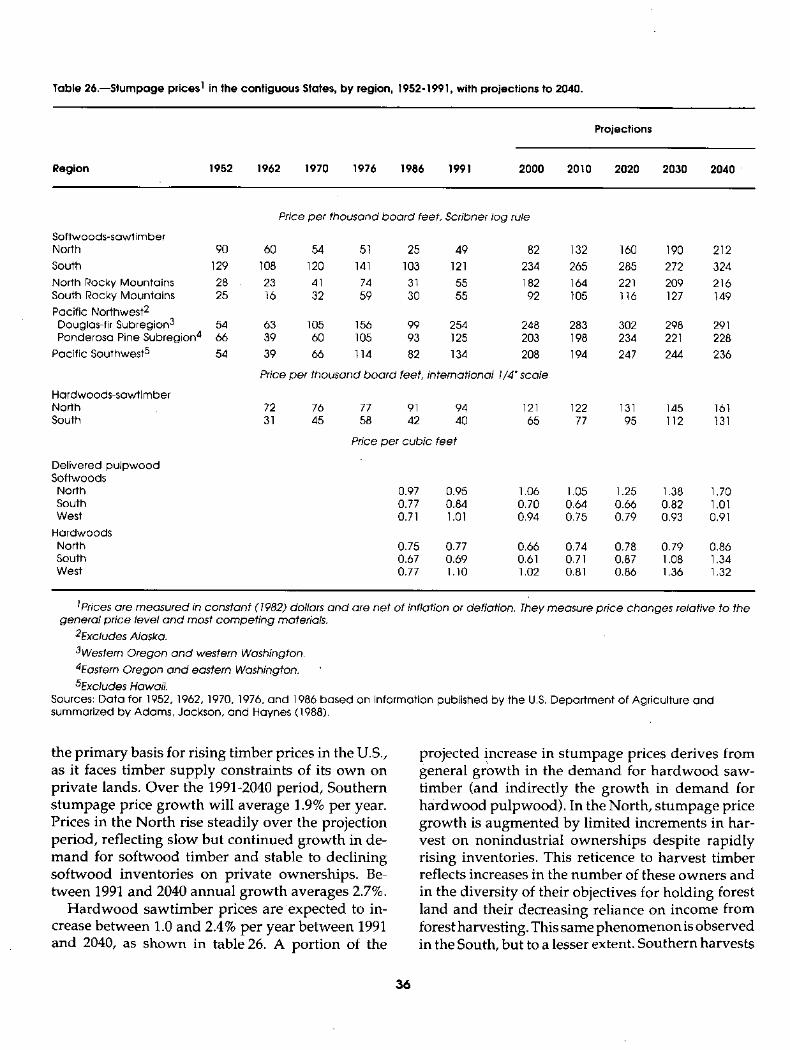
Table 26.mStumpage prices I in the contiguous States, by region, 1952-1991, with projections to 2040.
Projections
Region 1952 1962 1970 1976 1986 1991 2000 2010 2020 2030 2040
Softwoods-sawtimber North 90
South 129
North Rocky Mountains 28 South Rocky Mountains 25
Pacific Northwest 2 Douglas-fir Subregion 3 54 Ponderosa Pine Subregion 4 66
Pacific Southwest 5 54
Hardwoods-sawt imber North South
Price per thousand board feet, Scribner log rule
60 54 51 25 49 82 132 160 190 212
108 120 141 103 121 234 265 285 272 324
23 41 74 31 55 182 164 221 209 216 16 32 59 30 55 92 105 116 127 149
63 105 156 99 254 248 283 302 298 291 39 60 105 93 125 203 198 234 221 228
39 66 114 82 134 208 194 247 244 236
Price per thousand board feeL ~ternaf ional l /4"sca~
72 76 77 91 94 121 122 131 145 161 31 45 58 42 40 65 77 95 112 131
Price per cubic feet
Delivered pu lpwood Softwoods
North 0.97 0.95 1.06 1.05 1.25 1.38 1.70 South 0.77 0.84 0.70 0.64 0.66 0.82 1.01 West 0.71 1.01 0.94 0.75 0.79 0.93 0.91
Hardwoods North 0.75 0.77 0.66 0.74 0.78 0.79 0.86 South 0.67 0.69 0.61 0.71 0.87 1.08 1.34 West 0.77 1.10 1.02 0.81 0.86 1.36 1.32
1prices are measured in constant (1982) dollars and are net of inflation or deflation. They measure price changes relative to the general price level and most competing materials.
2Excludes Alaska.
3Western Oregon and western Washington. 4Eastern Oregon and eastern Washington. 5Excludes Hawaii.
Sources: Data for 1952, 1962, 1970, 1976, and 1986 based on information published by the U.S. Depar tment of Agriculture and summarized by Adams, Jackson, and Haynes (1988).
the primary basis for rising timber prices in the U.S., as it faces timber supply constraints of its own on private lands. Over the 1991-2040 period, Southern stumpage price growth will average 1.9% per year. Prices in the North rise steadily over the projection period, reflecting slow but continued growth in de- mand for softwood timber and stable to declining softwood inventories on private ownerships. Be- tween 1991 and 2040 annual growth averages 2.7%.
Hardwood sawtimber prices are expected to in- crease between 1.0 and 2.4% per year between 1991 and 2040, as shown in table 26. A portion of the
projected increase in stumpage prices derives from general growth in the demand for hardwood saw- timber (and indirectly the growth in demand for hardwood pulpwood). In the North, stumpage price growth is augmented by limited increments in har- vest on nonindustrial ownerships despite rapidly rising inventories. This reticence to harvest timber reflects increases in the number of these owners and in the diversity of their objectives for holding forest land and their decreasing reliance on income from forest harvesting. This same phenomenon is observed in the South, but to a lesser extent. Southern harvests
36
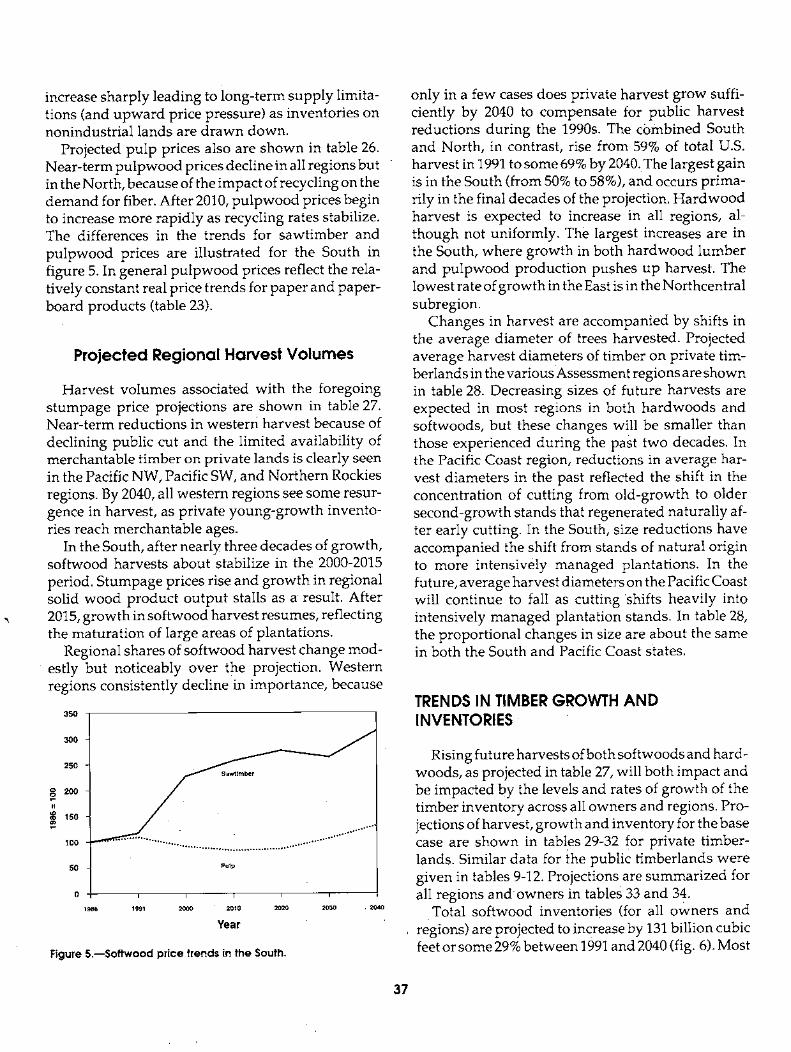
increase sharply leading to long-term supply limita- tions (and upward price pressure) as inventories on nonindustrial lands are drawn down.
Projected pulp prices also are shown in table 26. Near-term pulpwood prices decline in all regions but in the North, because of the impact of recycling on the demand for fiber. After 2010, pulpwood prices begin to increase more rapidly as recycling rates stabilize. The differences in the trends for sawtimber and pulpwood prices are illustrated for the South in figure 5. In general pulpwood prices reflect the rela- tively constant real price trends for paper and paper- board products (table 23).
Projected Regional Harvest Volumes
Harvest volumes associated with the foregoing stumpage price projections are shown in table 27. Near-term reductions in western harvest because of declining public cut and the limited availability of merchantable timber on private lands is clearly seen in the Pacific NW, Pacific SW, and Northern Rockies regions. By 2040, all western regions see some resur- gence in harvest, as private young-growth invento- ries reach merchantable ages.
In the South, after nearly three decades of growth, softwood harvests about stabilize in the 2000-2015 period. Stumpage prices rise and growth in regional solid wood product output stalls as a result. After 2015, growth in softwood harvest resumes, reflecting the maturation of large areas of plantations.
Regional shares of softwood harvest change mod- estly but noticeably over the projection. Western regions consistently decline in importance, because
3 5 0
300
250
200
150
100
50
0
Pulp
1986 1991 2000 ' 2010 2020 2030
Year
Figure 5.--Softwood price trends in the South.
• 2 0 4 0
only in a few cases does private harvest grow suffi- ciently by 2040 to compensate for public harvest reductions during the 1990s. The combined South and North, in contrast, rise from 59% of total U.S. harvest in 1991 to some 69% by 2040.The largest gain is in the South (from 50% to 58%), and occurs prima- rily in the final decades of the projection. Hardwood harvest is expected to increase in all regions, al- though not uniformly. The largest increases are in the South, where growth in both hardwood lumber and pulpwood production pushes up harvest. The lowest rate of growth in the East is in the Northcentral subregion.
Changes in harvest are accompanied by shifts in the average diameter of trees harvested. Projected average harvest diameters of timber on private tim- berlands in the various Assessment regions are shown in table 28. Decreasing sizes of future harvests are expected in most regions in both hardwoods and softwoods, but these changes will be smaller than those experienced during the past two decades. In the Pacific Coast region, reductions in average har- vest diameters in the past reflected the shift in the concentration of cutting from old-growth to older second-growth stands that regenerated naturally af- ter early cutting. In the South, size reductions have accompanied the shift from stands of natural origin to more intensively managed plantations. In the future, average harvest diameters on the Pacific Coast will continue to fall as cutting 'shifts heavily into intensively managed plantation stands. In table 28, the proportional changes in size are about the same in both the South and Pacific Coast states.
TRENDS IN TIMBER GROWTH AND INVENTORIES
Rising future harvests of both softwoods and hard- woods, as projected in table 27, will both impact and be impacted by the levels and rates of growth of the timber inventory across all owners and regions. Pro- jections of harvest, growth and inventory for the base case are shown in tables 29-32 for private timber- lands. Similar data for the public timberlands were given in tables 9-12. Projections are summarized for all regions and owners in tables 33 and 34.
Total softwood inventories (for all owners and regions) are projected to increase by 131 billion cubic feet or some 29% between 1991 and 2040 (fig. 6). Most
37
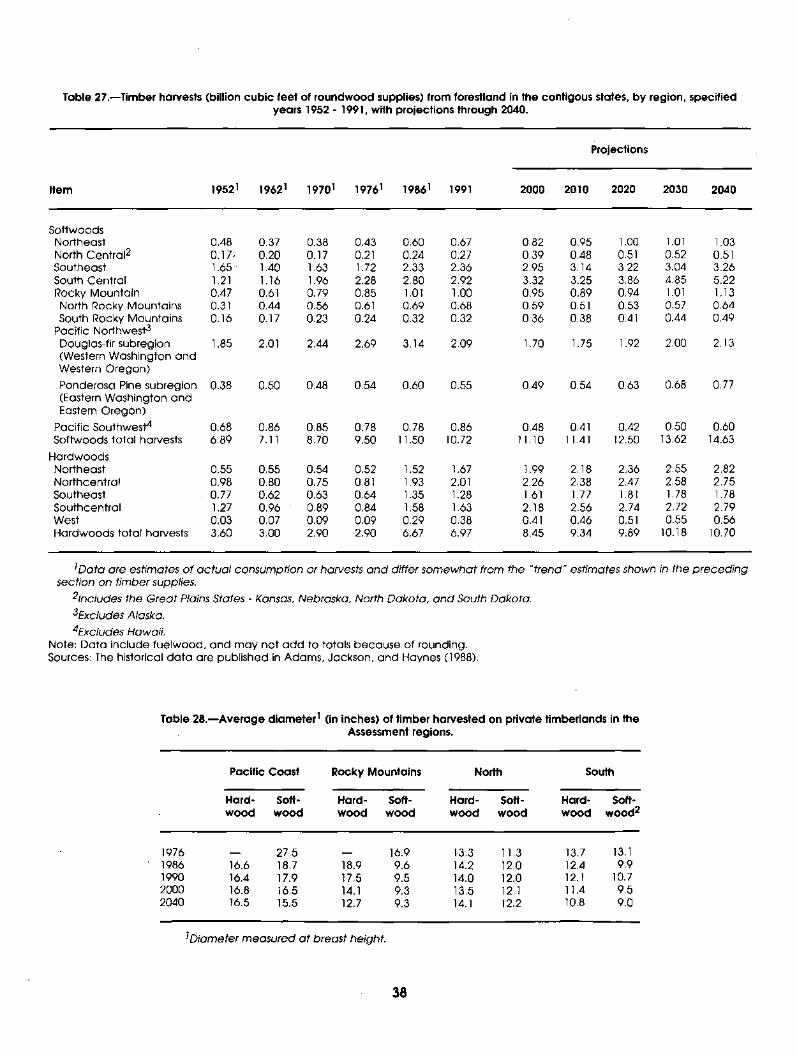
Table 27.--Timber harvests (billion cubic feet of roundwood supplies) from forestland in the contigous states, by region, specified years 1952 - 1991, with projections through 2040.
Projections
Item 19521 19621 19701 19761 19861 1991 2000 2010 2020 2030 2040
Softwoods Northeast 0.48 0.37 0.38 0.43 0.60 0.67 0.82 0.95 1.00 1.01 1.03 North Central 2 0.17, 0.20 0.17 0.21 0.24 0.27 0.39 0.48 0.51 0.52 0.51 Southeast 1.65 - 1.40 1.63 1.72 2.33 2.36 2.95 3.14 3.22 3.04 3.26 South Central 1.21 1.16 1.96 2.28 2.80 2.92 3.32 3.25 3.86 4.85 5.22 Rocky Mountain 0.47 0.61 0.79 0.85 1.01 1.00 0.95 0.89 0.94 1.01 1.13 NoKrh Rocky Mountains 0.31 0.44 0.56 0.61 0.69 0.68 0.59 0.51 0.53 0.57 0.64 South Rocky Mountains 0.16 0.17 0.23 0.24 0.32 0.32 0.36 0.38 0.41 0.44 0.49
Pacific Northwest 3 Douglas-fir subregion 1.85 2.01 2.44 2.69 3.14 2.09 1.70 1.75 1.92 2.00 2.13 (Western Washington and Western Oregon)
Ponderosa Pine subregion 0.38 0.50 0.48 0.54 0.60 0.55 0.49 0.54 0.63 0.68 0.77 (Eastern Washington and Eastern Oregon)
Pacific Southwest 4 0.68 0.86 0.85 0.78 0.78 0.86 0.48 0.41 0.42 0.50 0.60 Softwoods total harvests 6.89 7.11 8.70 9.50 11.50 10.72 11.10 11.41 12.50 13.62 14.63
Hardwoods Northeast 0.55 0.55 0.54 0.52 1.52 1.67 1.99 2.18 2.36 2.55 2.82 Northcentral 0.98 0.80 0.75 0.81 1.93 2.01 2.26 2.38 2.47 2.58 2.75 Southeast . 0.77 0.62 0.63 0.64 1.35 1.28 1.61 1.77 1.81 1.78 1.78 Southcentral 1.27 0.96 ' 0.89 0.84 1.58 1.63 2.18 2.56 2.74 2.72 2.79 West 0.03 0.07 0.09 0.09 0.29 0.38 0.41 0.46 0.51 0.55 0.56 Hardwoods total harvests 3.60 3.00 2.90 2.90 6.67 6.97 8.45 9.34 9.89 10.18 10.70
1Data are estimates of actual consumption or harvests and differ somewhat from the "trend" section on t imber supplies.
2Includes the Great Plains States - Kansas, Nebraska, North Dakota, and South Dakota.
3Excludes Alaska.
4Excludes Hawafi. Note: Data include fuelwood, and may not a d d to totals because of rounding. Sources: The historical da ta are published in Adams, Jackson, and Haynes (1988).
estimates shown in the preceding
Table 28.- -Average diameter I (in inches) of timber harvested on private timberlands in the Assessment regions.
Pacific Coast Rocky Mountains North South
Hard- Soft- Hard- Soft- Hard- Soft- Hard- Soft- wood wood wood wood wood wood wood wood 2
1976 - - 27.5 - - 16.9 13.3 11.3 13.7 13.1 1986 16.6 18.7 18.9 9.6 14.2 12.0 12.4 9.9 1990 16.4 17.9 17.5 9.5 14.0 12.0 12.1 10.7 2000 16.8 16.5 14.1 9.3 13.5 12.1 11.4 9.5 2040 16.5 15.5 12.7 9.3 14.1 12.2 10.8 9.0
I Diameter measured at breast height.
38
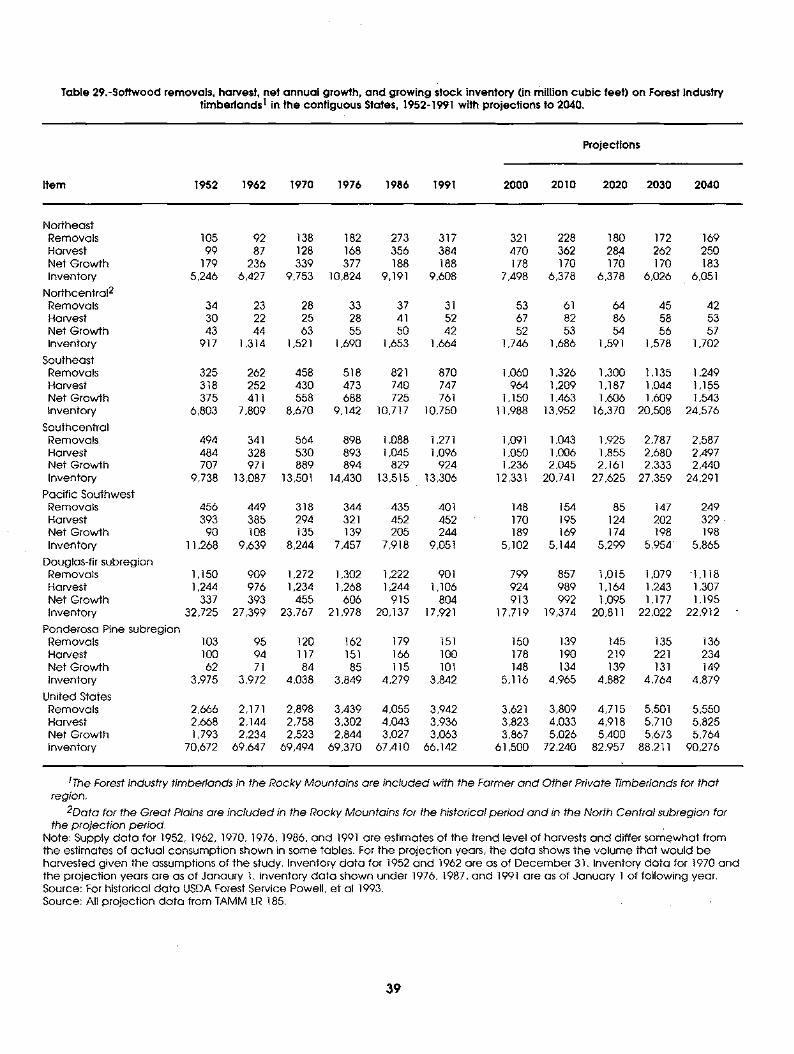
Table 29.-Softwood removals, harvest, net annual growth, and growing stock inventory (in million cubic feet) on Forest Industry timberlands I in the contiguous States, 1952-1991 with projections to 2040.
Projections
Item 1952 1962 1970 1976 1986 1991 2000 2010 2020 2030 2040
Northeast Removals 105 92 138 182 273 317 321 228 180 172 169 Harvest 99 87 128 168 356 384 470 362 284 262 250 Net Growth 179 236 339 377 188 188 178 170 170 170 183 Inventory 5,246 6 , 4 2 7 9 ,753 10,824 9 ,191 9,608 7,498 6 , 3 7 8 6 , 3 7 8 6,026 6,051
Northcentral 2 Removals 34 23 28 33 37 31 53 61 64 45 42 Harvest 30 22 25 28 41 52 67 82 86 58 53 Net Growth 43 44 63 55 50 42 52 53 54 56 57 Inventory 917 1 , 3 1 4 1 ,521 1 , 6 9 0 1 ,653 1,664 1,746 1,686 1,591 1 , 5 7 8 1,702
Southeast Removals 325 262 458 518 821 870 1,060 1 , 3 2 6 1 ,300 1 ,135 1,249 Harvest 318 252 430 473 740 747 964 1 , 2 0 9 1 ,187 1 ,044 1,155 Net Growth 375 411 558 688 725 761 1,150 1 , 4 6 3 1 , 6 0 6 1 ,609 1,543 inventory 6,803 7 , 8 0 9 8 , 6 7 0 9 ,142 10,717 10,750 11,988 13,952 16,370 20,508 24,576
Southcentral Removals 494 341 564 898 1 ,088 1,271 1,091 1 , 0 4 3 1 ,925 2 , 7 8 7 2,587 Harvest 484 328 530 893 1 ,045 1,096 1,050 1 , 0 0 6 1 ,855 2,680 2,497 Net Growth 707 971 889 894 829 924 1,236 2 , 0 4 5 2 ,161 2 , 3 3 3 2,440 Inventory 9,738 13,087 13,501 14,430 13,515 13,306 12,331 20,741 27,625 27,359 24,291
Pacific Southwest Removals 456 449 318 344 435 401 148 154 85 147 249 Harvest 393 385 294 321 452 452 170 195 124 202 329 Net Growth 90 108 135 139 205 244 189 169 174 198 198 Inventory 11,268 9,639 8 , 2 4 4 7 , 4 5 7 7 , 9 1 8 9,051 5,102 5 , 1 4 4 5,299 5,954 5,865
Douglas-fir subregion Removals 1,150 909 1 ,272 1 ,302 1,222 901 799 857 1 , 0 1 5 1 ,079 "1,118 Harvest 1,244 976 1 ,234 1 ,268 11244 1,106 924 989 1 ,164 1 ,243 1,307 Net Growth 337 393 455 606 915 804 913 992 1 , 0 9 5 1 ,177 1,195 inventory 32,725 27,399 23,767 21,978 20,137 17,921 17,719 19,374 20,811 22,022 22,912
Ponderosa Pine subregion Removals 103 95 120 162 179 151 150 139 145 135 136 Harvest 100 94 117 151 166 100 178 190 219 221 234 Net Growth 62 71 84 85 115 101 148 134 139 131 149 inventory 3,975 3 , 9 7 2 4 , 0 3 8 3 , 8 4 9 4,279 3,842 5,116 4,965 4,882 4,764 4,879
United States Removals 2,666 2 ,171 2 , 8 9 8 3 , 4 3 9 4,055 3,942 3,621 3 , 8 0 9 4,715 5 ,501 5,550 Harvest 2,668 2 , 1 4 4 2 , 7 5 8 3 , 3 0 2 4 , 0 4 3 3,936 3,823 4 , 0 3 3 4,918 5,710 5,825 Net Growth 1,793 2 , 2 3 4 2 , 5 2 3 2 , 8 4 4 3 , 0 2 7 3,063 3,867 5 , 0 2 6 5 , 4 0 0 5 , 6 7 3 5,764 inventory 70,672 69,647 69,494 69,370 67,410 66,142 61,500 72,240 82,957 88,211 90,276
1The Forest Industry timberlands in the Rocky Mountains are included with the Farmer and Other Private Timberlands for that region.
2Data for the Great Plains are included in the Rocky Mountains for the historical period and in the North Central subregion for the projection period.
Note: Supply data for 1952, 1962, 1970, 1976, 1986, and 1991 are estimates of the trend level of harvests and differ somewhat from the estimates of actual consumption shown in some tables. For the projection years, the data shows the volume that would be harvested given the assumptions of the study, inventory data for 1952 and 1962 are as of December 31. Inventory data for 1970 and the projection years are as of Janaury 1. Inventory data shown under 1976, 1987, and 1991 are as of January 1 of following year. Source: For historical data USDA Forest Service Powell, et al 1993. Source: All projection data from TAMM LR 185.
39
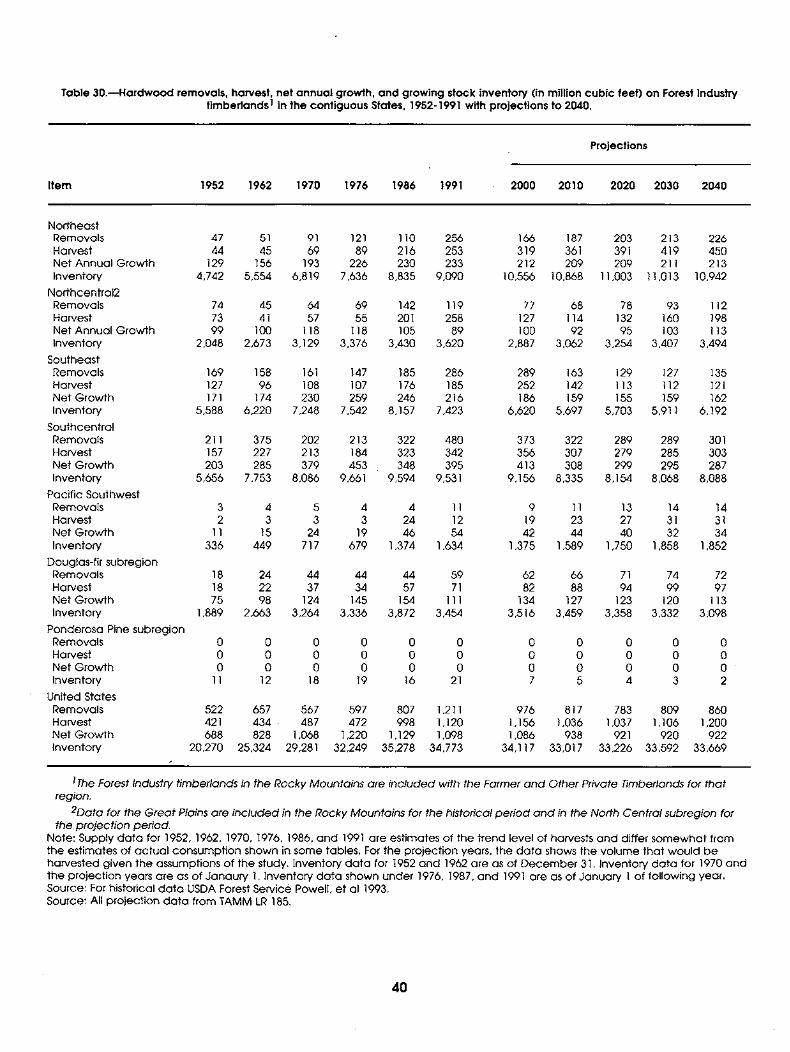
Table 30 .BHardwood removals, harvest, net annual growth, and growing stock inventory (in million cubic feet) on Forest Industry timberlands I in the contiguous States, 1952-1991 with projections to 2040.
Projections
Item 1952 1962 1970 1976 1986 1991 2000 2010 2020 2030 2040
Northeast Removals 47 51 91 121 110 256 166 187 203 213 226 Harvest 44 45 69 89 216 253 319 361 391 419 450 Net Annual Growth 129 156 193 226 230 233 212 209 209 211 213 Inventory 4,742 5,554 6,819 7,636 8,835 9,090 10,556 10,868 11,003 11,013 10,942
Northcentral2 Removals 74 45 64 69 142 119 77 68 78 93 112 Harvest 73 41 57 55 201 258 127 114 132 160 198 Net Annual Growth 99 100 118 118 105 89 100 92 95 103 113 Inventory 2,048 2,673 3,129 3,376 3,430 3,620 2,887 3,062 3,254 3,407 3,494
Southeast Removals 169 158 161 147 185 286 289 163 129 127 135 Harvest 127 96 108 107 176 185 252 142 113 112 121 Net Growth 171 174 230 259 246 216 186 159 155 159 162 Inventory 5,588 6,220 7,248 7,542 8,157 7,423 6,620 5,697 5,703 5,911 6,192
Southcentral Removals 211 375 202 213 322 480 373 322 289 289 301 Harvest 157 227 213 184 323 342 356 307 279 285 303 Net Growth 203 285 379 453 348 395 413 308 299 295 287 Inventory 5,656 7,753 8,086 9,661 9,594 9,531 9,156 8,335 8,154 8,068 8,088
Pacific Southwest Removals 3 4 5 4 4 11 9 11 13 14 14 Harvest 2 3 3 3 24 12 19 23 27 31 31 Net Growth 11 15 24 19 46 54 42 44 40 32 34 Inventory 336 449 717 679 1,374 1,634 1,375 1,589 1,750 1,858 1,852
Douglas-fir subregion Removals 18 24 44 44 44 59 62 66 71 74 72 Harvest 18 22 37 34 57 71 82 88 94 99 97 Net Growth 75 98 124 145 154 111 134 127 123 120 113 Inventory 1,889 2,663 3,264 3,336 3,872 3,454 3,516 3,459 3,358 3,332 3,098
Ponderosa Pine subregion Removals 0 0 0 0 0 0 0 0 0 0 Harvest 0 0 0 0 0 0 0 0 0 0 Net Growth 0 0 0 0 0 0 0 0 0 0 Inventory 11 12 18 19 16 21 7 5 4 3
United States Removals 522 657 567 597 807 1,211 976 817 783 809 860 Harvest 421 434 • 487 472 998 1,120 1,156 1,036 1,037 1,106 1,200 Net Growth 688 828 1,068 1,220 1,129 1,098 1,086 938 921 920 922 Inventory 20,270 25,324 29,281 32,249 35,278 34,773 34,117 33,017 33,226 33,592 33,669
0 0 O 2
1The Forest Industry timberlands in the Rocky Mountains are included with the Farmer and Other Private Timberlands for that region.
2Data for the Great Plains are included in the Rocky Mountains for the historical period and in the North Central subregion for the projection period.
Note: Supply da ta for 1952, 1962, 1970, 1976, 1986, and 1991 are estimates of the trend level of harvests and differ somewhat from the estimates of actual consumption shown in some tables. For the project ion years, the da ta shows the volume that would be harvested given the assumptions of the study. Inventory da ta for 1952 and 1962 are as of December 31. Inventory da ta for 1970 and the projection years are as of Janaury 1. Inventory da ta shown under 1976, 1987, and 1991 are as of January 1 of fol lowing year. Source: For historical da ta USDA Forest Service Powell, et al 1993. Source: All project ion da ta from TAMM LR 185.
40
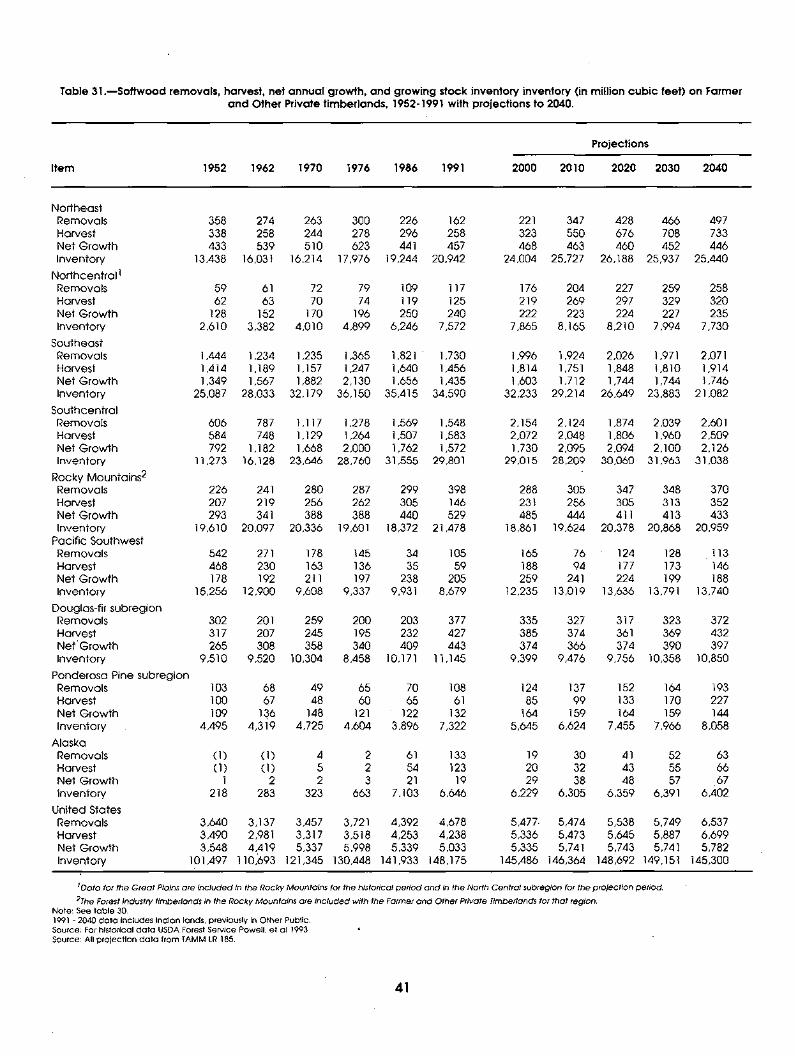
Table 31 .--Softwood removals, harvest, net annual growth, and growing stock inventory inventory (in million cubic feet) on Farmer and Other Private timberlands, 1952-1991 with projections to 2040.
Projections
Item 1952 1962 1970 1976 1986 1991 2000 2010 2020 2030 2040
Northeast Removals 358 274 263 300 226 162 221 347 428 466 497 Harvest 338 258 244 278 296 258 323 550 676 708 733 Net Growth 433 539 510 623 441 457 468 463 460 452 446 Inventory 13,438 16,031 16,214 17,976 19,244 20,942 24,004 25,727 26,188 25,937 25,440
Northcentral 1 Removals 59 61 72 79 109 117 176 204 227 259 258 Harvest 62 63 70 74 119 125 219 269 297 329 320 Net Growth 128 152 170 196 250 240 222 223 224 227 235 Inventory 2,610 3,382 4,010 4,899 6,246 7,572 7,865 8,165 8,210 7,994 7,730
Southeast Removals 1,444 1,234 1,235 1,365 1,821 " 1,730 1,996 1,924 2,026 1 , 9 7 1 2,071 Harvest 1,414 1,189 1,157 1,247 1,640 1,456 1,814 1,751 1,848 1,810 1,914 Net Growth 1,349 1,567 1,882 2,130 1,656 1,435 1,603 1,712 1,744 1,744 1,746 Inventory 25,087 28,033 32,179 36,150 35,415 34,590 32,233 29,214 26,649 23,883 21,082
Southcentral Removals 606 787 1,117 1,278 1,569 1,548 2,154 2,124 1,874 2,039 2,601 Harvest 584 748 1,129 1,264 1,507 1,583 2,072 2,048 1,806 1,960 2,509 Net Growth 792 1,182 1,668 2,000 1,762 1,572 1,730 2,095 2,094 2,100 2,126 Inventory 11,273 16,128 23,646 28,760 31,555 29,801 29,015 28,209 30,060 31,963 31,038
Rocky Mountains 2 Removals 226 241 280 287 299 398 288 305 347 348 370 Harvest 207 219 256 262 305 146 231 256 305 313 352 Net Growth 293 341 388 388 440 529 485 444 411 413 433 Inventory 19,610 20,097 20,336 19,601 18,372 21,478 18,861 19,624 20,378 20,868 20,959
Pacific Southwest Removals 542 271 178 145 34 105 165 76 124 128 113 Harvest 468 230 163 136 35 59 188 94 177 173 146 Net Growth 178 192 211 197 238 205 259 241 224 199 188 Inventory 15,256 12,900 9,608 9,337 9,931 8,679 12,235 13,019 13,636 13,791 13,740
Douglas-fir subregion Removals 302 201 259 200 203 377 335 327 317 323 372 Harvest 317 207 245 195 232 427 385 374 361 369 432 Ne tGrowth 265 308 358 340 409 443 374 366 374 390 397 Inventory 9,510 9,520 10,304 8,458 10,171 11,145 9,399 9,476 9,756 10,358 10,850
Ponderosa Pine subregion Removals 103 68 49 65 70 108 124 137 152 164 193 Harvest 100 67 48 60 65 61 85 99 133 170 227 Net Growth 109 156 148 121 122 132 164 159 164 159 144 Inventory 4,495 4,319 4,725 4,604 3,896 7,322 5,645 6,624 7,455 7,966 8,058
Alaska Removals (1) (1) 4 2 61 133 19 30 41 52 63 Harvest (1) (1) 5 2 54 123 20 32 43 55 66 Net Growth 1 2 2 3 21 19 29 38 48 57 67 Inventory 218 283 323 663 7,103 6,646 6,229 6,305 6,359 6,391 6,402
United States Removals 3,640 3,137 3,457 3,721 4,392 4,678 5,477, 5,474 5,538 5,749 6,537 Harvest 3,490 2,981 3,317 3,518 4,253 4,238 5,336 5,473 5,645 5,887 6,699 Net Growth 3,548 4,419 5,337 5,998 5,339 5,033 5,335 5,741 5,743 5,741 5,782 Inventory 101,497 110,693 121,345 130,448 141,933 148,175 145,486 146,364 148,692 149,151 145,300
1Data for the Great Plains are included in the Rocky Mountains for the historical period and In the North Central subregion for the projection
2The Forest Industry timberlands In the Rocky Mountains are included with the Farmer and Other Private Timberlands for that region. Note: See table 30. 1991 - 2040 data Includes Indian lands, previously In Other Public. Source: For historical data USDA Forest Service Powell, et a11993. Source: All projection data from TAMM LR 185.
period.
41
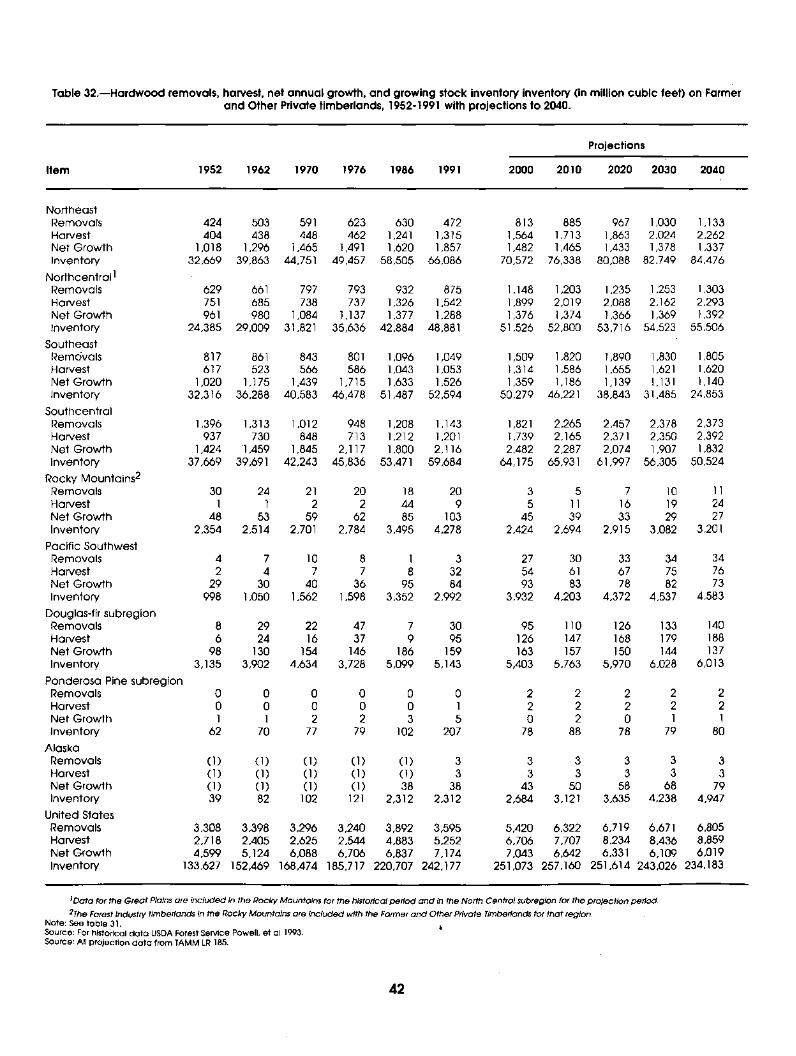
Table 32.wHardwood removals, harvest, net annual growth, and growing stock inventory inventory (in million cubic feet) on Farmer and Other Private timberlands, 1952-1991 with projections to 2040.
Projections
Item 1952 1962 1970 1976 1986 1991 2000 2010 2020 2030 2040
Northeast Removals 424 503 591 623 Harvest 404 438 448 462 Net Growth 1,018 1 , 2 9 6 1 ,465 1,491 Inventory 32,669 39,863 44,751 49,457
Northcentral 1 Removals 629 661 797 793 Harvest 751 685 738 737 Net Growth 961 980 1 ,084 1,137 Inventory 24.385 29,009 31,821 35,636
Southeast Removals 817 861 843 801 Harvest 617 523 566 586 Net Growth 1,020 1 , 1 7 5 1 , 4 3 9 1,715 Inventory 32,316 36,288 40,583 46,478
Southcentral Removals 1,396 1 . 3 1 3 1,012 948 Harvest 937 730 848 713 Net Growth 1.424 "1,459 1 ,845 2,117 Inventory 37,669 39,691 42,243 45,836
Rocky Mountains 2 Removals 30 24 21 20 Harvest 1 1 2 2 Net Growth 48 53 59 62 Inventory 2,354 2 . 5 1 4 2 ,701 2,784
Pacific Southwest Removals 4 7 10 8 Harvest 2 4 7 7 Net Growth 29 30 40 36 Inventory 998 1 , 0 5 0 1 . 5 6 2 1,598
Douglas-fir subregion Removals 8 29 22 47 Harvest 6 24 16 37 Net Growth 98 130 154 146 Inventory 3,135 3,902 4.634 3,728
Ponderosa Pine subregion Removals 0 0 0 0 Harvest 0 0 0 0 Net Growth 1 1 2 2 Inventory 62 70 77 79
Alaska Removals (1) (1) (1) (1) Harvest (1) (1) (1) (1) Net Growth (1) (1) (1) (1) Inventory 39 82 102 121
United States Removals 3,308 3,398 3,296 3,240 Harvest 2,718 2,405 2,625 2,544 Net Growth 4,599 5,124 6,088 6,706 Inventory 133,627 152,469 168,474 185,717
630 472 813 885 967 1 ,030 1,133 1,241 1,315 1,564 1,713 1,863 2 , 0 2 4 2,262 1,620 1,857 1,482 1 , 4 6 5 1 ,433 1 ,378 1,337
58,505 66,086 70,572 76,338 80,088 82,749 84,476
932 875 1,148 1 , 2 0 3 1 , 2 3 5 1 ,253 1,303 1,326 1,542 1,899 2 , 0 1 9 2 , 0 8 8 2 ,162 2,293 1,377 1,288 1,376 1 , 3 7 4 1 , 3 6 6 1 ,369 1,392
42,884 48,881 51,526 52,800 53,716 54,523 55,506
1,096 1,049 1,509 1 , 8 2 0 1 , 8 9 0 1 ,830 1,805 1,043 1.053 1,314 1 , 5 8 6 1 , 6 5 5 1,621 1,620 1,633 1,526 1,359 1 , 1 8 6 1 , 1 3 9 1,131 1,140
51,487 52,594 50,279 46,221 38,843 31,485 24,853
1,208 1.143 1,821 2 , 2 6 5 2 , 4 5 7 2 ,378 2.373 1,212 1,201 1,739 2 . 1 6 5 2 ,371 2 , 3 5 0 2,392 1,800 2,116 2,482 2 , 2 8 7 2,074 1 ,907 1,832
53,471 59,684 64,175 65,931 61,997 56,305 50,524
18 20 3 5 7 10 11 44 9 5 11 16 19 24 85 103 45 39 33 29 27
3.495 4,278 2,424 2 , 6 9 4 2,915 3 , 0 8 2 3,201
1 3 27 30 33 34 34 8 32 54 61 67 75 76
95 84 93 83 78 82 73 3,352 2,992 3,932 4 , 2 0 3 4,372 4 , 5 3 7 4,583
7 30 95 110 126 133 140 9 95 126 147 168 179 188
186 159 163 157 150 144 137 5,099 5,143 5,403 5 , 7 6 3 5,970 6 , 0 2 8 6,013
0 0 2 2 2 2 2 0 1 2 2 2 2 2 3 5 0 2 0 1 1
102 207 78 88 78 79 80
(1) 3 3 3 3 3 3 (1) 3 3 3 3 3 3 38 38 43 50 58 68 79
2,312 2,312 2,684 3 , 1 2 1 3 , 6 3 5 4,238 4,947
3,892 3.595 5,420 6,322 6 , 7 1 9 6 .671 6,805 4,883 5,252 6,706 7 , 7 0 7 8 . 2 3 4 8,436 8,859 6,837 7,174 7,043 6 , 6 4 2 6 ,331 6,109 6,019
220,707 242,177 251,073 257,160 251,614 243,026 234,183
I Data for the Great Plains are included in the Rocky Mountains for the historical period and in the North Central subregion for the projection period.
2The Forest Industry timberlands in the Rocky Mountains are included with the Farmer and Other Private Timberlands for that region. Note: See table 31. Source: For historical data USDA Forest Service Powell, et a11993. Source: All projection data from TAMM LR 185.
42
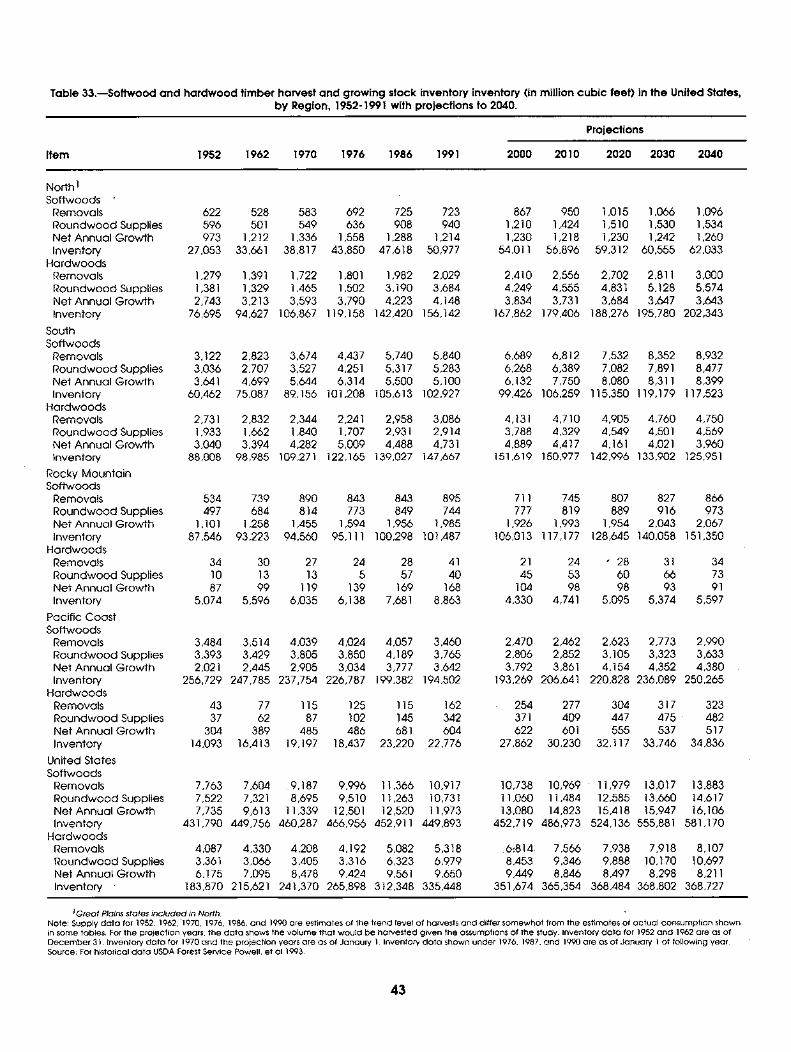
Table 33.--Softwood and hardwood timber harvest and growing stock inventory inventory (in million cubic feet) in the United States, by Region, 1952-1991 with projections to 2040.
Projections
Item 1952 1962 1970 1976 1986 1991 2000 20 I0 2020 2030 2040
North 1 Softwoods '
Removals 622 Roundwood Supplies 596 Net Annual Growth 973 Inventory 27,053
Hardwoods Removals 1,279 Roundwood Supplies 1,381 Net Annual Growth 2,743 Inventory 76,695
South Softwoods
Removals 3,122 Roundwood Supplies 3,036 Net Annual Growth 3,641 Inventory 60,462
Hardwoods Removals 2,731 Roundwood Supplies 1,933 Net Annual Growth 3,040 Inventory 88,008
Rocky Mountain Softwoods
Removals 534 Roundwood Supplies 497 Net Annual Growth 1,101 Inventory 87,546
Hardwoods Removals 34 Roundwood Supplies 10 Net Annual Growth 87 Inventory 5,074
Pacific Coast Softwoods
Removals 3,484 Roundwood Supplies 3,393 Net Annual Growth 2,021 Inventory 256,729
Hardwoods Removals 43 Roundwood Supplies 37 Net Annual Growth 304 Inventory 14,093
United States Softwoods
Removals 7,763 Roundwood Supplies 7,522 Net Annual Growth 7,735 Inventory 431,790
Hardwoods Removals 4,087 Roundwood Supplies 3,361 Net Annual Growth 6,175 Inventory ' 183,870
528 583 692 725 723 867 950 1 , 0 1 5 1 ,066 1,096 501 549 636 908 940 1,210 1 , 4 2 4 1 , 5 1 0 1 ,530 1,534
1,212 1 , 3 3 6 1 ,558 1 , 2 8 8 1,214 1,230 1 , 2 1 8 1 , 2 3 0 1 ,242 1,260 33,661 38,817 43,850 47,618 50,977 54,011 56,896 59,312 60,555 62,033
1,391 1 , 7 2 2 1 ,801 1 , 9 8 2 2,029 2,410 2,556 2 , 7 0 2 2 ,811 3,000 1,329 1 , 4 6 5 1 ,502 3 , 1 9 0 3,684 4,249 4,555 4 ,831 5,128 5,574 3,213 3 , 5 9 3 3 , 7 9 0 4,223 4,148 3,834 3 ,731 3 , 6 8 4 3 , 6 4 7 3,643
94,627 106,867 119,158 142,420 156,142 167,862 179,406 188,276 195,780 202,343
2,823 3 , 6 7 4 4 , 4 3 7 5 , 7 4 0 5,840 6,689 6,812 7 , 5 3 2 8 , 3 5 2 8,932 2,707 3 , 5 2 7 4 ,251 5 , 3 1 7 5,283 6,268 6,389 7 , 0 8 2 7 ,891 8,47.7 4,699 5 , 6 4 4 6,314 5,500 5,100 6,132 7 , 7 5 0 8 , 0 8 0 8 ,311 8,399
75,087 89,156 101,208 105,613 102,927 99,426 106,259 115,350 119,179 117,523
2,832 2 , 3 4 4 2 ,241 2 , 9 5 8 3,086 4,131 4,710 4,905 4,760 4,750 1,662 1 ,840 1 ,707 2 ,931 2,914 3,788 4,329 4,549 4 ,501 4,569 3,394 4,282 5,009 4,488 4,731 4,889 4 , 4 1 7 4 ,161 4 ,021 3,960
98,985 109,271 122,165 139,027 147,667 151,619 150,977 142,996 133,902 125,951
739 890 843 843 895 711 745 807 827 866 684 814 773 849 744 777 819 889 916 973
1,258 1 , 4 5 5 1 ,594 1 , 9 5 6 1,985 1,926 1 , 9 9 3 1 ,954 2 , 0 4 3 2,067 93,223 94,560 95,111 100,298 101,487 106,013 117,177 128,645 140,058 151,350
30 27 24 28 41 21 24 " 28 31 34 13 13 5 57 40 45 53 60 66 73 99 119 139 169 168 104 98 98 93 91
5,596 6,035 6 , 1 3 8 7 ,681 8,863 4,330 4 ,741 5,095 5 , 3 7 4 5,597
3,514 4,039 4,024 4 , 0 5 7 3,460 2,470 2 , 4 6 2 2 , 6 2 3 2 , 7 7 3 2,990 3,429 3 , 8 0 5 3 , 8 5 0 4,189 3,765 2,806 2 , 8 5 2 3 , 1 0 5 3 , 3 2 3 3,633 2,445 2 , 9 0 5 3 , 0 3 4 3 , 7 7 7 3,642 3,792 3 ,861 4,154 4,352 4,380
247,785 237,754 226,787 199,382 194,502 193,269 206,641 220,828 236,089 250,265
77 115 125 115 162 254 277 304 317 323 62 87 102 145 342 371 409 447 4 7 5 482
389 485 486 681 604 622 601 555 537 517 16,413 19,197 18,437 23,220 22,776 27,862 30,230 32,117 33,746 34,836
7,604 ,9,187 9 ,996 11,366 10,917 10,738 10,969 11,979 13,017 13,883 7,321 8 , 6 9 5 9 ,510 11,263 10,731 11,060 11,484 12,585 13,660 14,617 9,613 11,339 12,501 12,520 11,973 13,080 14,823 15,418 15,947 .16,106
449,756 460,287 466,956 452,911 449,893 452,719 486,973 524,136 555,881 581,170.
4,330 4 , 2 0 8 4,192 5 , 0 8 2 5,318 ,61814. 7 , 5 6 6 7 , 9 3 8 7 ,918 8,107 3,066 3 , 4 0 5 3,316 6 , 3 2 3 6,979 8,453 9,346 9 ,888 10,170 10,697 7,095 8 , 4 7 8 9 , 4 2 4 9 ,561 9,650 9,449 8 , 8 4 6 8 , 4 9 7 8 , 2 9 8 8,211
215,621 241,370 265,898 312,348 335,448 351,674 365,354 368,484 368,802 368,727
I Great Plains states inc luded in North, Note: Supply data for 1952, 1962,'1970, 1976, 1986, and 1990 are estimates of the trend level of harvests and differ somewhat from the estimates of actual consumption shown in some tables, For the projection years, the data shows the volume that would be harvested given the assumptions of the study. Inventory data' for 1952 and 1962 are as of December 31, Inventory data for 1970 and the projection years are as of Janaury 1. Inventory data shown under 1976, 1987, and 1990 are as of January 1 of following year, Source: For historical data USDA Forest Service Powell, et a11993.
43
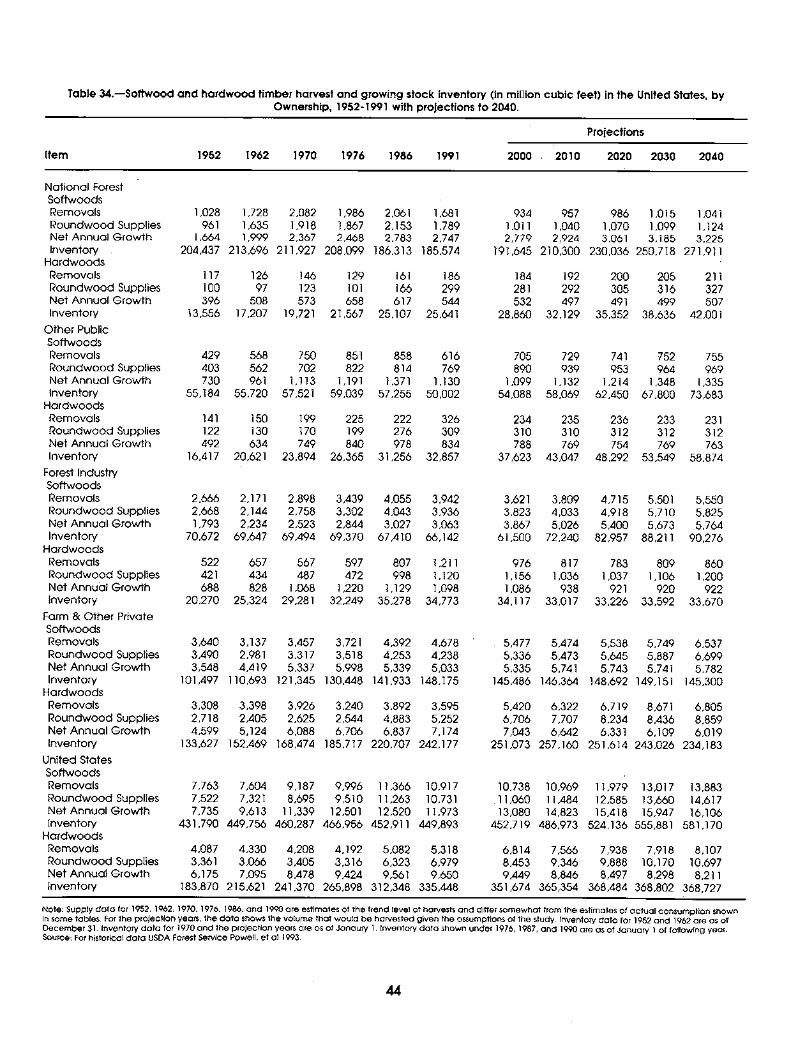
Table 34.--Softwood and hardwood timber harvest and growing stock !nventory (in million cubic feet) in the United States, by Ownership, 1952-1991 with projections to 2040.
Item
Projections
1952 1962 1970 1976 1986 1991 2000 . 2010 2020 2030 2040
National Forest Softwoods Removals 1,028 Roundwood Supplies 961 Net Annual Growth 1,664 Inventory 204,437
Hardwoods Removals 117 Roundwood Supplies 100 Net Annual Growth 396 Inventory 13,556
Other Public Softwoods Removals 429 Roundwood Supplies 403 Net Annual Growth 730 Inventory 55,184
Hardwoods Removals 141 Roundwood Supplies 122 Net Annual Growth 492 Inventory 16,417
Forest Industry Softwoods Removals 2,666 Roundwood Supplies 2,668 Net Annual Growth 1,793 Inventory 70,672
Hardwoods Removals 522 Roundwood Supplies 421 Net Annual Growth 688 Inventory 20,270
Farm & Other Private Softwoods Removals 3,640 Roundwood Supplies 3,490 Net Annual Growth 3,548 Inventory 101,497
Hardwoods Removals 3,308 Roundwood Supplies 2,718 Net Annual Growth 4,599 Inventory 133,627
United States Softwoods Removals Roundwood Supplies Net Annual Growth Inventory
Hardwoods Removals 4,087 Roundwood Supplies 3,361 Net Annual Growth 6,175 Inventory 183,870
1,728 2,082 1,986 2,061 1,681 934 957 986 1,015 1,041 1,635 1,918 1,867 2,153 1,789 1,011 1,040 1,070 1,099 1,124 1,999 2,367 2,468 2,783 2,747 2,779 2,924 3,061 3,185 3,225
213,696 211,927 208,099 186,313 185,574 191,645 210,300 230,036 250,718 271,911
126 146 129 161 186 184 192 200 205 211 97 123 101 166 299 281 292 305 316 327
508 573 658 617 544 532 497 491 499 507 17,207 19,721 21,567 25,107 25,641 28,860 32,129 35,352 38,636 42,001
568 750 851 858 616 705 729 741 752 755 562 702 822 814 769 890 939 953 964 969 961 1,113 1,191 1,371 1,130 1,099 1,132 1,214 1,348 1,335
55,720 57,521 59,039 57,255 50,002 54,088 58,069 62,450 67,800 73,683
150 199 225 222 326 234 235 236 233 231 130 170 199 276 309 310 310 312 312 312 634 749 840 978 834 788 769 754 769 763
20,621 23,894 26,365 31,256 32,857 37,623 43,047 48,292 53,549 58,874
2,171 2,898 3,439 4,055 3,942 3,621 3,809 4,715 5,501 5,550 2,144 2,758 3,302 4,043 3,936 3,823 4,033 4,918 5,710 5,825 2,234 2,523 2,844 3,027 3,063 3,867 5,026 5,400 5,673 5,764
69,647 69,494 69,370 67,410 66,142 61,500 72,240 82,957 88,211 90,276
657 567 597 807 1,211 976 817 783 809 860 434 487 472 998 1,120 1,156 1,036 1,037 1,106 1,200 828 1,068 1,220 1,129 1,098 1,086 938 921 920 922
25,324 29,281 32,249 35,278 34,773 34,117 33,017 33,226 33,592 33,670
3,137 3,457 3,721 2,981 3,317 3,518 4,419 5,337 5,998
110,693 121,345 130,448
3,398 3,926 3,240 2,405 2,625 2,544 5,124 6,088 6,706
152,469 168,474 185,717
4,392 4,678 5,477 5,474 5,538 5,749 6,537 4,253 4,238 5,336 5,473 5,645 5,887 6,699 5,339 5,033 5,335 5,741 5,743 5,741 5,782
141,933 148,175 145,486 146,364 148,692 149,151 145,300
3,892 3,595 5,420 6,322 6,719 8,671 6,805 4,883 5,252 6,706 7,707 8,234 8,436 8,859 6,837 7,174 7,043 6,642 6,331 6,109 6,019
220,707 242,177 251,073 257,160 251,614 243,026 234,183
7,763 7,604 9,187 9,996 11,366 10,917 10,738 10,969 11,979 13,017 13,883 7,522 7,321 8,695 9,510 11,263 10,731 11,060 11,484 12,585 13,660 14,617 7,735 9,613 11,339 12,501 12,520 11,973 13,080 14,823 15,418 15,947 16,106
431,790 449,756 460,287 466,956 452,911 449,893 452,719 486,973 524,136 555,881 581,170
4,330 4,208 4,192 5,082 5,318 6,814 7,566 7,938 7,918 8,107 3,066 3,405 3,316 6,323 6,979 8,453 9,346 9,888 10,170 10,697 7,095 8,478 9,424 9,561 9,650 9,449 8,846 8,497 8,298 8,211
215,621 241,370 265,898 312,348 335,448 351,674 365,354 368,484 368,802 368,727
Note: Supply data for 1952, 1962, 1970, 1976. 1986. and 1990 are estimates of the trend level of harvests and differ somewhat from the estimates of actual consumption shown in some tables. For the projection years, the data shows the volume that would be harvested given the assumptions of the study. Inventory data for 1952 and 1962 are as of December 31. Inventory data for 1970 and the projection years ore as of Janaury 1, Inventory data shown under 1976. 1987, and 1990 are as of January 1 of following year, Source: For historical data USDA Forest Service PowelJ, et a11993.
44
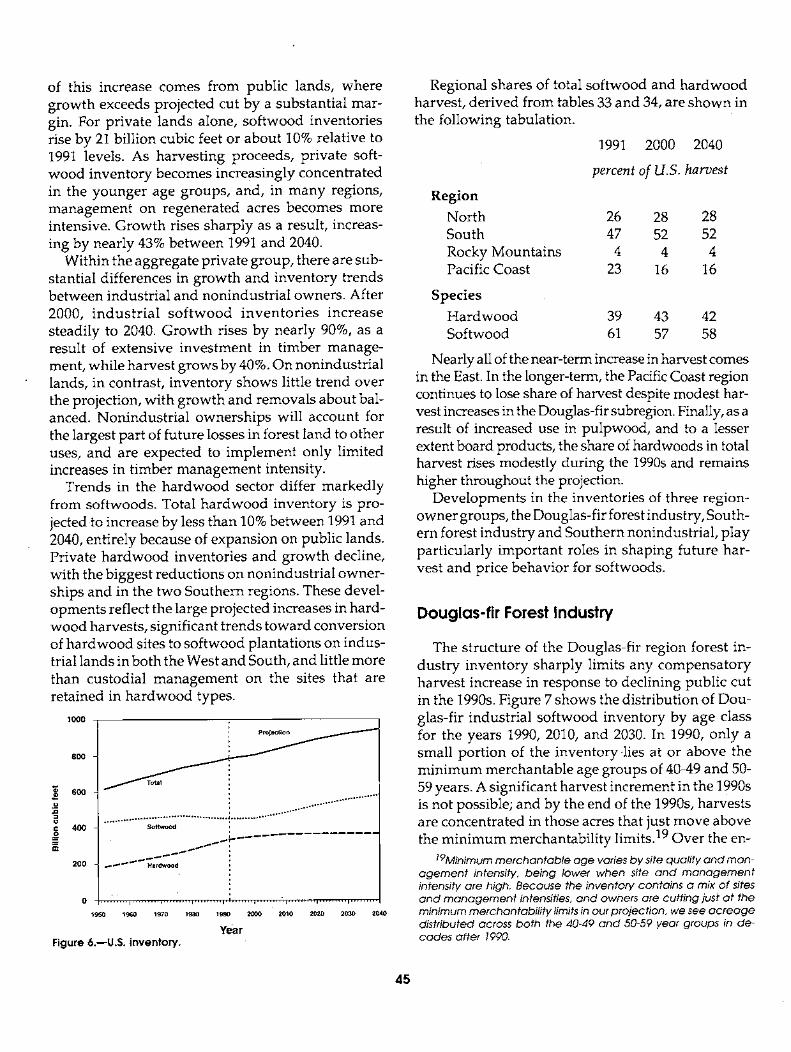
of this increase comes from public lands, where growth exceeds projected cut by a substantial mar- gin. For private lands alone, softwood inventories rise by 21 billion cubic feet or about 10% relative to 1991 levels. As harvesting proceeds, private soft- wood inventory becomes increasingly concentrated in the younger age groups, and, in many regions, management on regenerated acres becomes more intensive. Growth rises sharply as a result, increas- ing by nearly 43% between 1991 and 2040.
Within the aggregate private group, there are sub- stantial differences in growth and inventory trends between industrial and nonindustrial owners. After 2000, indus t r ia l so f twood inventor ies increase steadily to 2040. Growth rises by nearly 90%, as a result of extensive investment in timber manage- ment, while harvest grows by 40%. On nonindustrial lands, in contrast, inventory shows little trend over the projection, with growth and removals about bal- anced. Nonindustr ial ownerships will account for the largest part of future losses in forest land to other uses, and are expected to implement only limited increases in timber management intensity.
Trends in the ha rdwood sector differ markedly from softwoods. Total ha rdwood inventory is pro- jected to increase by less than 10% between 1991 and 2040, entirely because of expansion on public lands. Private ha rdwood inventories and growth decline, with the biggest reductions on nonindustrial owner- ships and in the two Southern regions. These devel- opments reflect the large projected increases in hard- wood harvests, significant trends toward conversion of ha rdwood sites to softwood plantations on indus- trial lands in both the West and South, and little more than custodial management on the sites that are retained in ha rdwood types.
1000 Projection
800 ~ 600
i 400 Softwood , 2--- ....--~
200 ~ Hardwood ',
0 . . . . . . . . . i . . . . . . . . . ~ . . . . . . . . . I . . . . . . . . . I ' 1 . . . . . . . I . . . . . . . . . I . . . . . . . . . I . . . . . . . . . I . . . . . . . . .
1 9 5 0 1 9 6 0 1970 1980 19g0 2000 2010 2020 2 0 3 0 2 0 4 0
Year Figure 6.--U.S. inventory.
Regional shares of total softwood and hardwood harvest, derived from tables 33 and 34, are shown in the following tabulation.
1991 2000 2040
percent of U.S. harvest
Region North 26 28 28 South 47 52 52 Rocky Mountains 4 4 4 Pacific Coast 23 16 16
Species Hardwood 39 43 42 Softwood 61 57 58
Nearly all of the near-term increase in harvest comes in the East. In the longer-term, the Pacific Coast region continues to lose share of harvest despite modest har- vest increases in the Douglas-fir subregion. Finally, as a result of increased use in pulpwood, and to a lesser extent board products, the share of hardwoods in total harvest rises modestly during the 1990s and remains higher throughout the projection.
Developments in the inventories of three region- owner groups, the Douglas-fir forest industry, South- ern forest industry and Southern nonindustrial, play particularly important roles in shaping future har- vest and price behavior for softwoods.
Douglas-fir Forest Industry
The structure of the Douglas-fir region forest in- dustry inventory sharply limits any compensatory harvest increase in response to declining public cut in the 1990s. Figure 7 shows the distribution of Dou- glas-fir industrial softwood inventory by age class for the years 1990, 2010, and 2030. In 1990, only a small portion of the inventory .lies at or above the min imum merchantable age groups of 40-49 and 50- 59 years. A significant harvest increment in the 1990s is not possible; and by the end of the 1990s, harvests are concentrated in those acres that just move above the min imum merchantability limits. 19 Over the en-
19Minimum merchantable age varies by site quality and man- agement intensity, being lower when site and management intensity are high. Because the inventory contains a mix of sites and management intensities, and owners are cutting just a t the minimum merchantabil i ty limits in our projection, we see acreage distributed across both the 40-49 and 50-59 year groups in de- cades after 1990.
45
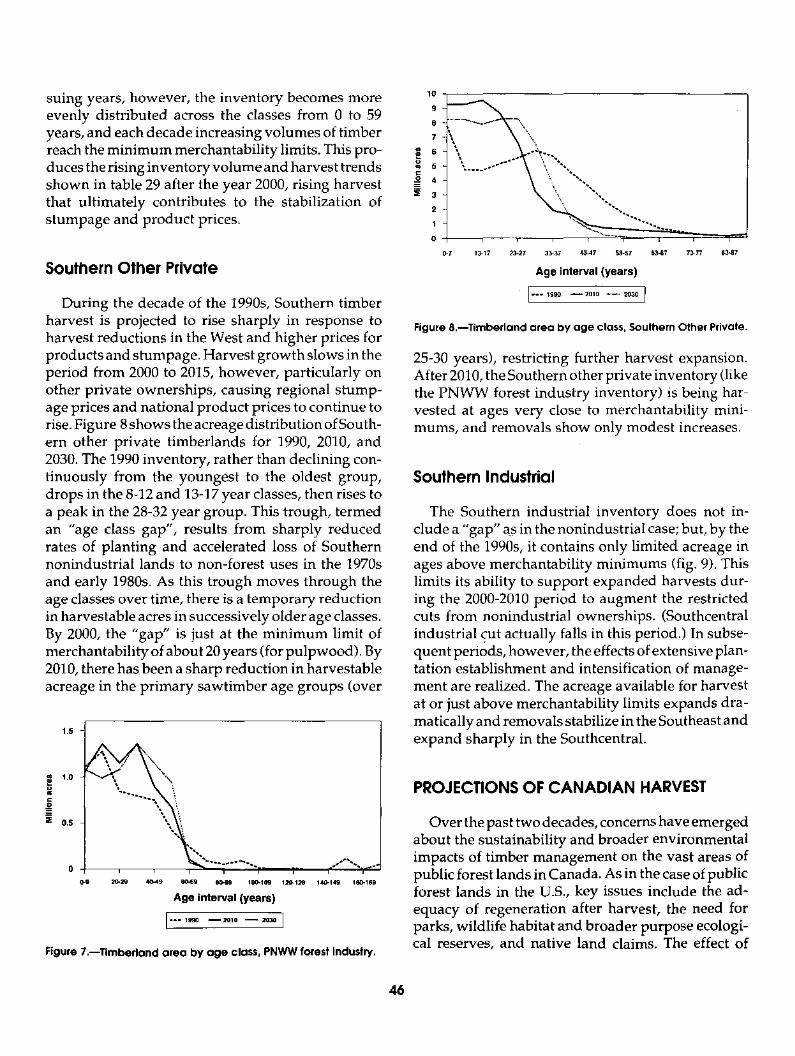
suing years, however, the inventory becomes more evenly distributed across the classes from 0 to 59 years, and each decade increasing volumes of timber reach the minimum merchantability limits. This pro- duces the rising inventory volume and harvest trends shown in table 29 after the year 2000, rising harvest that ultimately contributes to the stabilization of stumpage and product prices.
Southern Other Private
During the decade of the 1990s, Southern timber harvest is projected to rise sharply in response to harvest reductions in the West and higher prices for products and stumpage. Harvest growth slows in the period from 2000 to 2015, however, particularly on other private ownerships, causing regional stump- age prices and national product prices to continue to rise. Figure 8 shows the acreage distribution of South- ern other private timberlands for 1990, 2010, and 2030. The 1990 inventory, rather than declining con- tinuously from the youngest to the oldest group, drops in the 8-12 and 13-17 year classes, then rises to a peak in the 28-32 year group. This trough, termed an "age class gap", results from sharply reduced rates of planting and accelerated loss of Southern nonindustrial lands to non-forest uses in the 1970s and early 1980s. As this trough moves through the age classes over time, there is a temporary reduction in harvestable acres in successively older age classes. By 2000, the "gap" is just at the minimum limit of merchantability of about 20 years (for pulpwood). By 2010, there has been a sharp reduction in harvestable acreage in the primary sawtimber age groups (over
1.5
== 1.0 ==
g _=
:E 0.5
,%
\ -
0"9 20-29 40-49 60-69 80-89 100-109 120-129 140-149 160-169
Age interval ( y e a r s )
I - - - 1990 ~ 2010 - - 2030 J
Figure 7.--Timberland area by age class, PNWW forest industry.
10
9
8
7
~, s
g 4 i 3
2
1
0
• , ° ° ~ . . ,
. . . . . . . . . . . . , , , , . z . . . . . . . . . . . . , - .
0-7 13-17 23-27 33-37 43-47 53-57 63-67 73-77 83"87
Age interval (years)
" I . . . , , 9 o - - 2 0 , 0 ........ ~o30 I
Figure 8.--Timberland area by age class, Southern Other Private.
25-30 years), restricting further harvest expansion. After 2010, the Southern other private inventory (like the PNWW forest industry inventory) is being har- vested at ages very close to merchantability mini- mums, and removals show only modest increases.
Southern Industrial
The Southern industrial inventory does not in- clude a "gap" as in the nonindustrial case; but, by the end of the 1990s, it contains only limited acreage in ages above merchantability minimums (fig. 9). This limits its ability to support expanded harvests dur- ing the 2000-2010 period to augment the restricted cuts from nonindustrial ownerships. (Southcentral industrial cut actually falls in this period.) In subse- quent periods, however, the effects of extensive plan- tation establishment and intensification of manage- ment are realized. The acreage available for harvest at or just above merchantability limits expands dra- matically and removals stabilize in the Southeast and expand sharply in the Southcentral.
PROJECTIONS OF CANADIAN HARVEST
Over the past two decades, concerns have emerged about the sustainability and broader environmental impacts of timber management on the vast areas of public forest lands in Canada. As in the case of public forest lands in the U.S., key issues include the ad- equacy of regeneration after harvest, the need for parks, wildlife habitat and broader purpose ecologi- cal reserves, and native land claims. The effect of
4 6
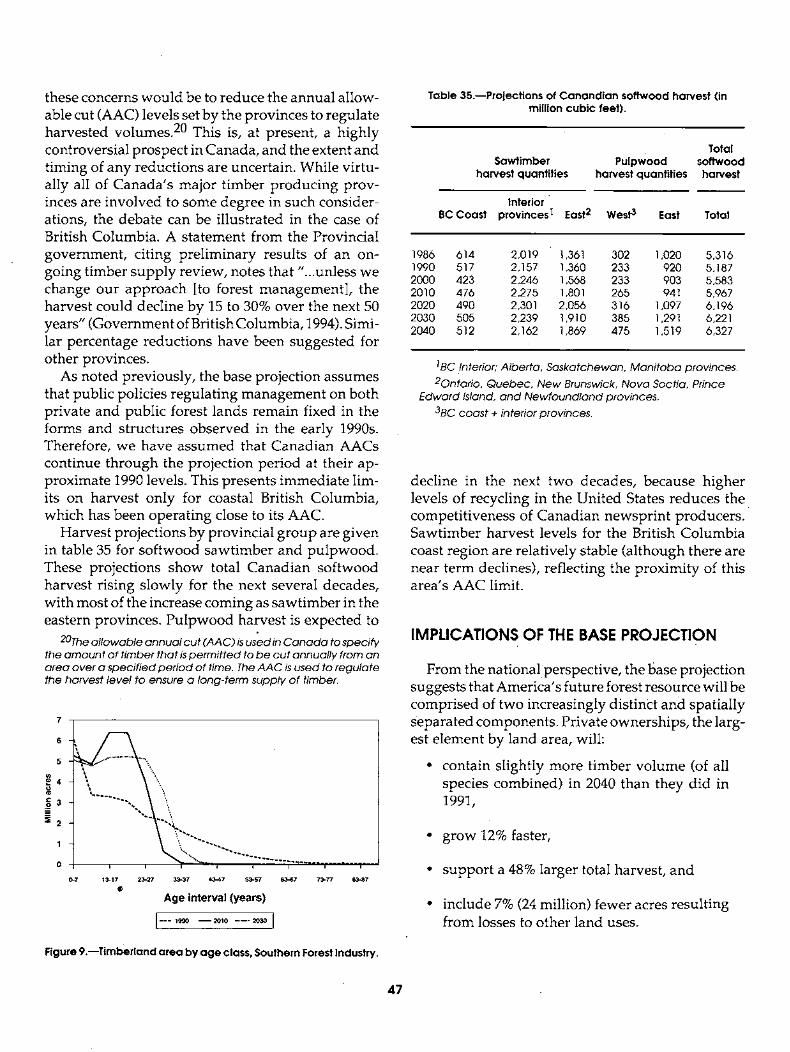
these concerns would be to reduce the annual allow- able cut (AAC) levels set by the provinces to regulate harvested volumes. 20 This is, at present, a highly controversial prospect in Canada, and the extent and timing of any reductions are uncertain. While virtu- ally all of Canada's major timber producing prov- inces are involved to some degree in such consider- ations, the debate can be illustrated in the case of British Columbia. A statement from the Provincial government, citing prel iminary results of an on- going timber supply review, notes that "...unless we change our approach [to forest management] , the harvest could decline by 15 to 30% over the next 50 years" (Government of British Columbia, 1994). Simi- lar percentage reductions have been suggested for other provinces.
As noted previously, the base projection assumes that public policies regulating management on both private and public forest lands remain fixed in the forms and structures observed in the early 1990s. Therefore, we have assumed that Canadian AACs continue through the projection period at their ap- proximate 1990 levels. This presents immediate lim- its on harvest only for coastal British Columbia, which has been operating close to its AAC.
Harvest projections by provincial group are given in table 35 for softwood sawtimber and pulpwood. These projections show total Canadian softwood harvest rising slowly for the next several decades, with most of the increase coming as sawtimber in the eastern provinces. Pulpwood harvest is expected to
20The allowable annual cut (AA C) is used in Canada to specify the amount of t imber that is permi t ted to be cut annuafly from an area over a specified per iod of time. The AAC is used to regulate the harvest level to ensure a long-term supply of timber.
6
~ 4
~3
0 "l ....... ~ .... l i . . . . . . . . . . . . . . . . . . m=,
0-7 13-17 23-27 33-37 43-47 53-57 6.3-67 73-77 83-87
o Age interval (years)
I----- --- ......... - . . I
Figure 9.--Timberland area by age class, Southern Forest Industry.
Table 35.--Projections of Canandian softwood harvest (in million cubic feet).
Total Sawtimber Pulpwood softwood
harvest quantities harvest quantities harvest
Interior BCCoast provinces I East 2 West 3 East Total
1986 614 2,019 1,361 302 1,020 5,316 1990 517 2,157 1,360 233 920 5,187 2000 423 2,246 1,568 233 903 5,583 2010 476 2,275 1,801 265 941 5,967 2020 490 2,301 2,056 316 1,097 6,196 2030 505 2,239 1,910 385 1,291 6,221 2040 512 2,162 1,869 475 1,519 6,327
1BC Interior; Alberta, Saskatchewan, Mani toba provinces.
2Ontario, Quebec, New Brunswick, Nova Socfia, Prince Edward Island, and Newfoundland provinces.
3BC coast + interior provinces.
decline in the next two decades, because higher levels of recycling in the United States reduces the competitiveness of Canadian newsprint p roducer s . Sawtimber harvest levels for the British Columbia coast region are relatively stable (although there are near term declines), reflecting the proximity of this area's AAC limit.
IMPLICATIONS OF THE BASE PROJECTION
From the nationalperspective, the base projection suggests that America's future forest resource will be comprised of two increasingly distinct and spatially Separated components. Private ownerships, the larg- est element by land area, will:
• contain slightly more timber volume (of all species combined) in 2040 than they did in 1991,
• grow 12% faster,
• support a 48% larger total harvest, and
• include 7% (24 million) fewer acres resulting from losses to other land uses.
47

Achieving these productivity increases on a re- duced land base will, however, entail a significant change in the structure of these forests.
1. H a r d w o o d inventory, growth and land area will decline, both because of limited manage- ment and because of conversion of some ar- eas to softwoods. Losses in hardwoods ex- plain the imbalance between increases in growth and harvest in the aggregate of all species noted. In 2040, there still will be more ha rdwood inventory than there is softwood, but softwood inventory and growth will have risen in both relative and absolute terms. The softwood inventory will change as well, with plantat ions (often of genetical ly selected stock) replacing stands of natural origin.
. On both industrial and nonindustr ial lands, most of the inventory will be concentrated in ages near or below mi n i mum merchantabil- ity limits. On industrial ownerships in both the West and South, these age classes will be arrayed in approximately equal areas from smallest to largest. Al though there will be variation by region and species groups, pri- vate forests will be younger and, on average, smaller in diameter, and there will be no significant areas of private old-growth tim- ber remaining.
. Timber management will become more in- tensive, particularly on industrial ownerships. The intent of management intensification is generally to reduce delays in stand regenera- tion and increase rates of tree growth once stands are established. The effect is to reduce the area of stands on private lands in the earlier stages of successional development (grass-forb, shrub, and open sapling-pole- sawtimber) by accelerating site occupancy and hastening closure of the stand canopy (moving stands more quickly into the closed sapling-pole-sawtimber and larger stages).
Public ownerships, in contrast, will have experi- enced a lengthy period of reduced harvests and will contain:
• rising and aging inventories,
• rising absolute growth though a declining growth rate, and
• the only significant remaining areas of old- growth.
There will be variation across ownerships, just as in the private sector, and some groups of public lands (mostly non-federal) will more closely resemble the private industrial structure. The age class structures of public lands will be spread across a wide range and will not be approaching a uniform condition. Both hardwoods and softwoods will increase in vol- ume, al though only softwoods will experience rising growth rates. Management intensity on these lands may remain somewhere intermediate between that on industrial and nonindustrial private ownerships, depending on how the shift to ecosystem manage- ment on federal t imberland evolves.
Given the geographic concentrations of public and private ownerships, both within and across regions in the U.S, lands of these two types will not be uniformly intermingled. The bulk of public forest land is in the West and, in both the West and East, concentrated largely in the mounta inous and less accessible portions of the regions. Therefore, the two owner classes contain different mixtures of forest ecosystem types and site qualities.
The inventory trends described here will have important impacts on water quality and the timing and extent of water yields, wildlife populations and fisheries, recreation and amenity values, and the extent and quality of forested range available for domestic livestock. These concerns are addressed in detail in other parts of this Update. Here we offer only a few observations on terrestrial wildlife habitat impacts as they relate directly to the structure of the timber inventory.
48
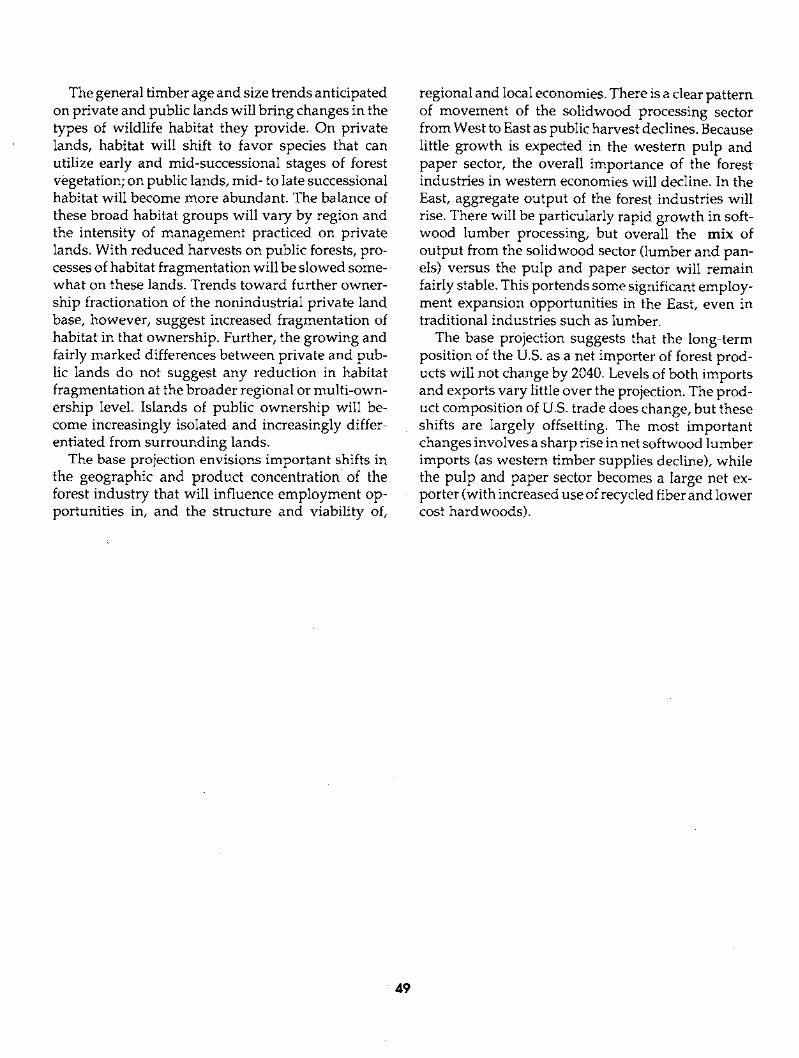
The general timber age and size trends anticipated on private and public lands will bring changes in the types of wildlife habitat they provide. On private lands, habitat will shift to favor species that can utilize early and mid-successional stages of forest vegetation; on public lands, mid- to late successional habitat will become more abundant. The balance of these broad habitat groups will vary by region and the intensity of management practiced on private lands. With reduced harvests on public forests, pro- cesses of habitat fragmentation will be slowed some- what on these lands. Trends toward further owner- ship fractionation of the nonindustrial private land base, however, suggest increased fragmentation of habitat in that ownership. Further, the growing and fairly marked differences between private and pub- lic lands do not suggest any reduction in habitat fragmentation at the broader regional or multi-own- ership level. Islands of public ownership will be- come increasingly isolated and increasingly differ- entiated from surrounding lands.
The base projection envisions important shifts in the geographic and product concentration of the forest industry that will influence employment op- portunities in, and the structure and viability of,
regional and local economies. There is a clear pattern of movement of the solidwood processing sector from West to East as public harvest declines. Because little growth is expected in the western pulp and paper sector, the overall importance of the forest industries in western economies will decline. In the East, aggregate output of the forest industries will rise. There will be particularly rapid growth in soft- wood lumber processing, but overall the mix of output from the solidwood sector (lumber and pan- els) versus the pulp and paper sector will remain fairly stable. This portends some significant employ- ment expansion opportunities in the East, even in traditional industries such as lumber.
The base projection suggests that the long-term position of the U.S. as a net importer of forest prod- ucts will not change by 2040. Levels of both imports and exports vary little over the projection. The prod- uct composition of U.S. trade does change, but these shifts are largely offsetting. The most important changes involves a sharp rise in net softwood lumber imports (as western timber supplies decline), while the pulp and paper sector becomes a large net ex- porter (with increased use of recycled fiber and lower cost hardwoods).
CHAPTER 4. ALTERNATIVE FUTURES
The base projection gives one view of the future based on assumptions about determinants of timber demands and supplies described in chapter 2. As is true of all projections, the base case was strongly influenced by conditions in the forest products sector and general economy at the time it was made. 21 But there are many possible views of the future derived from divergent opinions about changes in the major determinants of supply and demand for both prod- ucts and s tumpage (including public harvests and other public policies, rates of recycling, develop- ments in the general economy, etc.). Both individu- ally and together, such changes can lead to projected trends in the forest sector that differ significantly from the base case. This chapter examines some of these alternative futures and their economic impacts on the forest sector and timber markets. The objective is to demonstrate both the sensitivity of the base projections to changes in input assumptions and to provide a basis for assessing the robustness of policy conclusions d rawn from the base Assessment projec- tions.
Thirteen alternative futures were examined. The following descriptions highlight key points in each.
1. Lower Canadian Lumber Production.---Ca- nadian sawtimber harvest is limited to vol- umes at or below current levels in all prov- inces. Even in .provinces where current al- lowable cuts would allow some increase in harvest, it is assumed that no increases will result from policy changes.
. Expanded Regulat ion of Private Timber- lands .MTwo alternatives examine the poten- tial impact of increased state and local regu- lation of private timberlands. The first deals with the effects of current (1990-91) regula- tions on private timber supply once these regulations are fully implemented. The sec- ond examines the impacts of addit ional regu- lations in the future---regulations now being debated but not adopted.
21The base assessment projections were made in fail 1993. Most series had been revised through 1989, and some (especially the various macroeconomic variables) had been revised through 1992,
. Reduced Pine Plantations in the South . - - This scenario examines reduced rates of pine plantation establishment in the South, with more area retained in natural pine and oak- pine stands. By 2040 the projected area of plantations is reduced by 5.1 million acres or about 11% of the base case level.
. Higher Rates of Recycl ing. - -Future efforts to reduce waste by recycling waste paper are increased. By 2040, the waste paper utilization rate rises from the 45% level in the base to 60%.
.
.
Alternative Macroeconomic Assumpt ions .m The U.S. economy develops according to a sce- nario from the President's Council of Economic Advisors (CEA) showing, among other differ- ences, slower GNP growth, lower housing starts, and higher expenditures on residential upkeep and alteration than the base case assumptions.
Tree Planting Programs . - -We examine three alternative views of the future where tree planting on nonindustrial private ownerships is subsidized by Federal Government fund- ing as a means to sequester atmospheric car- bon. Two strategies focus on marginal crop and pasture lands suitable for conversion or afforestation to softwood plantations. The first assumes federal funding of $110 million per year for 10 years, distributed across re- gions so as to obtain the largest tonnage of carbon sequestered. The second strategy in- volves public subsidies sufficient to plant all acres of marginal crop and pasture land suit- able for conversion to forest cover. A third approach concentrates exclusively on tim- berlands, aiming to accelerate management on all those areas that promise to return at least 4% on monies invested.
. Changes in Nat ional Forest Harvest .MTim- ber harvests from the national forests are assumed to continue at their late 1980s levels in most regions, increasing in the Rockies and South. Harvest levels in this scenario are well above those in the base.
5O I
. Increased Use of W o o d for Energy.mThis alternative examines the impacts of increased use of wood for energy based on the Depart- ment of Energy's National Energy Strategy. Fuelwood demand rises by about 2.8 times over the base.
. G loba l Cl imate Change.---One view of the impact of global warming on U.S. forests sees timber growth rise over time, because of in- creased rainfall and temperatures.
10. C o m b i n e d Environmenta l and Energy Poli- c ies .mThis run examines the net effect of a mixture of three policies a imed at environ- mental and energy issues much debated in recent years: (1) the higher wastepaper utili- zation rates from scenario 4 above; (2) in- creased use of wood for energy from scenario 8; and (3) tree planting subsidized bythe $110 million funding per year for 10 years from scenario 6.
Table 36 summarizes the resource and market pro- jections from the several alternatives. Results are displayed by region and category of impact.
LOWER CANADIAN LUMBER PRODUCTION
There has been some discussion in recent years of possible reductions in allowable cut levels on Crown lands in virtually all Canadian provinces (Govern- ment of British Columbia, 1994; Reed 22, Apsey and Reed, 1994). Reductions would result from a combi- nation of land withdrawals for wildlife habitat, parks, and ecosystem preserves, and because of lagging regeneration on harvested lands. The extent of any restrictions is highly uncertain, as is the distribution of reductions between the sol idwood and fiber prod- ucts sectors. To obtain some prel iminary idea of the potential impacts of such changes on U.S. markets, we examine a case in which harvest restrictions are limited to the sol idwood sector and act to constrain output in the future to levels no higher than those observed in recent years.
In the base projection, softwood sawtimber har- vest increased in Canada in response to rising lum-
22 Personnel correspondence, Les Reed, 6/22/93, on file with the authors.
ber prices in the U.S. As shown in the following tabulation, Canadian harvests were projected to in- crease by 20% over the next three decades:
N o increase Base alternative
million cubic feet
1990 4034 4034
2000 4237 4084
2020 4847 4089
2040 4543 3878
The restriction reduces total Canadian softwood lumber output by an average of 3.6 billion board feet per year between 2000 and 2040 relative to the base. Because Canadian domestic and non-U.S, export demands are insensitive to price in Our projections, exports to the U.S. fall by a similar amount. Net U.S. consumption falls by an average of 0.8 billion board feet per year (relative to a total of about 52 billion board feet) as U.S. domestic output rises by 2.8 billion board feet per yea r . Softwood lumber prices in the U.S. are, on average, 4.8% higher than the base. 23
EXPANDED REGULATION OF PRIVATE TIMBERLANDS
During the past decade, many states have ex- panded the scope of their regulation of forest prac- tices on private lands. Common objectives of these changes have been the preservation of, or reduction of disturbances in, key habitat areas for an array of wildlife species, including reservation of riparian areas to ameliorate hydrologic and fish habitat im- pacts. There has been much debate about the eco- nomic impacts of these and any further state and local regulation. In a recent s tudy Greene and Siegel (1994) obtained judgmental estimates of the timber supply impacts of current and potential future changes in public regulation of private forest prac- tices from panels of forestry experts in various U.S. regions. The result of this process was a set of average percentage reductions in private timber "supply" by region associated with the two levels of regulation (current and potential future).
23price increases of this magni tude would raise the cost of lumber used in a typical single-family house by about $160 in 2010 and about $300 in 2040.
51
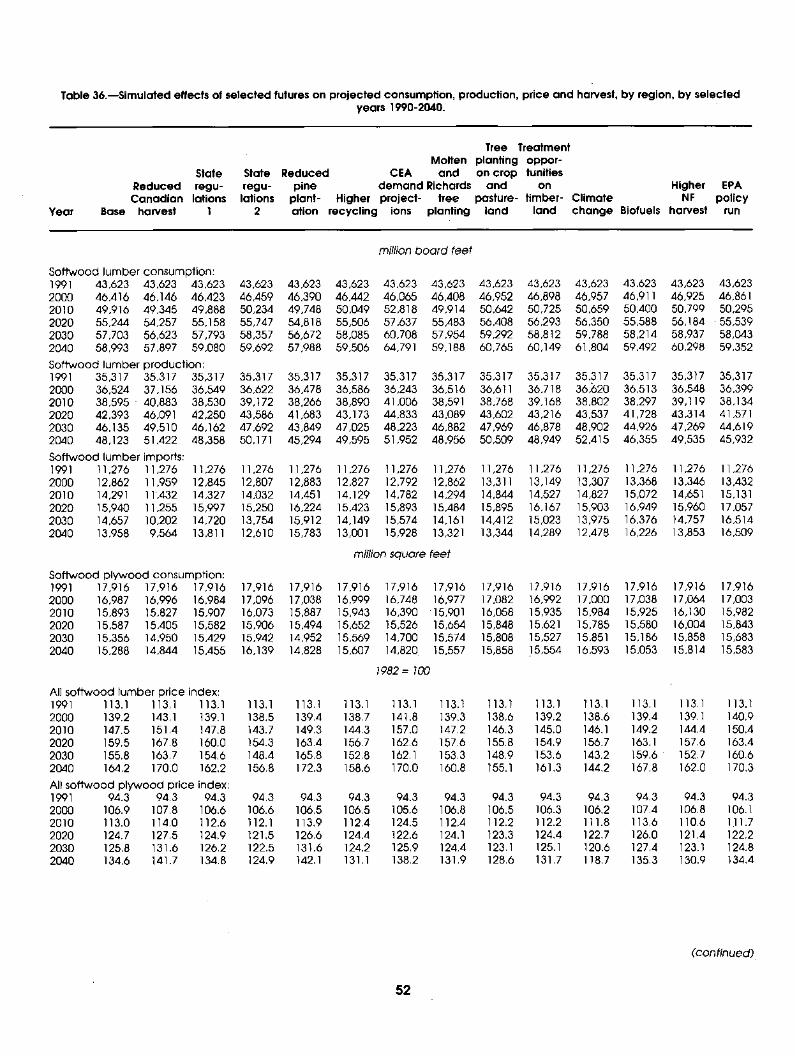
Table 36.mSimulated effects of selected futures on projected consumption, production, price and harvest, by region, by selected years 1990-2040.
Year
Tree Treatment Molten planting oppor-
State State Reduced CEA and on crop tunities Reduced regu- regu- pine demand Richards and on Higher EPA Canadian latJons lations plant- Higher project- tree pasture-timber- Climate NF policy
Base harvest I 2 ation recycling ions planting land land change Biofuels harvest run
million board feet
Softwood lumber consumption: 1991 43,623 43,623 43,623 43,623 43,623 43,623 43,623 43,623 43,623 43,623 43,623 43,623 43,623 43,623 2000 46,416 46,146 46,423 46,459 46,390 46,442 46,065 46,408 46,952 46,898 46,957 46,911 46,925 46,861 2010 49,916 49,345 49,888 50,234 49,748 50,049 52,818 49,914 50,642 50,725 50,659 50,400 50,799 50,295 2020 55,244 54,257 55,158 55,747 54,818 55,506 57,637 55,483 56,408 56,293 56,350 55,588 56,184 .55,539 2030 57,703 56,623 57,793 58,357 56,672 58,085 60,708 57,954 59,292 58,812 59,788 58,214 58,937 58,043 2040 58,993 57,897 59,080 59,692 57,988 59,506 64,791 59,188 60,765 60,149 61,804 59,492 60,298 59,352
Softwood lumber production: 1991 35,317 35,317 35,317 35,317 35,317 35,317 35,317 35,317 35,317 35,317 35,317 35,317 35,317 35,317 2000 36,524 37,156 36,549 36,622 36,478 36,586 36,243 36,516 36,611 36,718 36,620 36,513 36,548 36,399 2010 38,595, 40,883 38,530 39,172 38,266 38,890 41,006 38,591 38,768 39,168 38,802 38,297 39,119 38,134 2020 42,393 46,091 42,250 43,586 41,683 43,173 44,833 43,089 43,602 43,216 43,537 41,728 43,314 41,571 2030 46,135 49,510 46,162 47,692 43,849 47,025 48,223 46,882 47,969 46,878 48,902 44,926 47,269 44,619 2040 48,123 51,422 48,358 50,171 45,294 49,595 51,952 48,956 50,509 48,949 52,415 46,355 49,535 45,932
Softwood lumberimpoffs: 1991 11 ,276 11,276 11,276 11,276 11,276 11,276 11,276 11,276 11,276 11,276 11,276 11,276 11,276 11,276 2000 12,862 11,959 12,845 12,807 12,883 12,827 12,792 12,862 13,311 13,149 13,307 13,368 13,346 13,432 2010 14,291 11,432 14,327 14,032 14,451 14,129 14,782 14,294 14,844 14,527 14,827 15,072 14,651. 15,131 2020 15,940 11,255 15,997 15,250 16,224 15,423 15,893 15,484 15,895 16,167 15,903 16,949 15,960 17,057 2030 14,657 10,202 14,720 13,754 15,912 14,149 15,574 14,161 14,412 15,023 13,975 16,376 14,757 16,514 2040 13 ,958 9,564 13,811 12,610 15,783 13,001 15,928 13,321 13,344 14,289 12,478 16,226 13,853 16,509
million square feet
Softwood plywood consumption: 1991 17 ,916 17,916 17,916 17,916 17,916 17,916 17,916 17,916 17,916 17,916 17,916 17,916 17,916 17,916 2000 16,987 16,996 16,984 17,096 17,038 16,999 16,748 16,977 17,082 16,992 17,000 17,038 17,064 17,003 2010 15,893 15,827 15,907 16,073 15,887 15,943 16,390 15,901 16,058 15,935 15,984 15,925 16,130 15,982 2020 15,587 15,405 15,582 15,906 15,494 15,652 15,526 15,654 15,848 15,621 15,785 15,580 16,004 15,843 2030 15,356 14,950 15,429 15,942 14,952 15,569 14,700 15,574 15,808 15,527 15,851 15,186 15,858 15,683 2040 15,288 14,844 15,455 16,139 14,828 15,607 14,820 15,557 15,858 ]5,554 16,593 15,053 15,814 15,583
1982 = 100
AIIsoftwood lumber price index: 1991 113.1 113.1 113.1 113.1 113.1 113.1 113.1 113.1 113.1 113.1 113.1 113.1 113.1 113.1 2000 139.2 143.1 139.1 1 3 8 . 5 1 3 9 . 4 1 3 8 . 7 1 4 1 . 8 139 .3 1 3 8 . 6 1 3 9 . 2 1 3 8 . 6 1 3 9 . 4 139 .1 140.9 2010 147.5 1 5 1 . 4 1 4 7 . 8 1 4 3 . 7 1 4 9 . 3 1 4 4 . 3 1 5 7 . 0 1 4 7 . 2 1 4 6 . 3 1 4 5 . 0 146 .1 1 4 9 . 2 1 4 4 . 4 150.4 2020 159.5 1 6 7 . 8 1 6 0 . 0 1 5 4 . 3 1 6 3 . 4 1 5 6 . 7 1 6 2 . 6 1 5 7 . 6 1 5 5 . 8 1 5 4 . 9 1 5 6 . 7 163 .1 1 5 7 . 6 163.4 2030 155.8 1 6 3 . 7 1 5 4 . 6 1 4 8 . 4 1 6 5 . 8 1 5 2 . 8 162 .1 1 5 3 . 3 1 4 8 . 9 1 5 3 . 6 1 4 3 . 2 159.6 152 .7 160.6 2040 164.2 1 7 0 . 0 1 6 2 . 2 1 5 6 . 8 1 7 2 . 3 1 5 8 . 6 1 7 0 . 0 1 6 0 . 8 155 .1 1 6 1 . 3 1 4 4 . 2 1 6 7 . 8 1 6 2 . 0 170.3
All softwood plywood price index: 1991 94.3 94.3 94.3 94.3 94.3 94.3 94.3 94.3 94.3 94.3 94.3 94.3 94.3 94.3 2000 106.9 1 0 7 . 8 1 0 6 . 6 1 0 6 . 6 1 0 6 . 5 1 0 6 . 5 1 0 5 . 6 1 0 6 . 8 1 0 6 . 5 1 0 6 . 3 1 0 6 . 2 1 0 7 . 4 1 0 6 . 8 106.1 2010 113.0 1 1 4 . 0 1 1 2 . 6 112 .1 1 1 3 . 9 1 1 2 . 4 1 2 4 . 5 1 1 2 . 4 1 1 2 . 2 1 1 2 . 2 1 1 1 . 8 1 1 3 . 6 1 1 0 . 6 111.7 2020 124.7 1 2 7 . 5 1 2 4 . 9 1 2 1 . 5 1 2 6 . 6 1 2 4 . 4 1 2 2 . 6 124 .1 1 2 3 . 3 1 2 4 . 4 1 2 2 . 7 1 2 6 . 0 1 2 1 . 4 122.2 2030 125.8 1 3 1 . 6 1 2 6 . 2 1 2 2 . 5 1 3 1 . 6 1 2 4 . 2 1 2 5 . 9 1 2 4 . 4 123.1 125.1 1 2 0 . 6 1 2 7 . 4 123 .1 124.8 2040 134.6 1 4 1 . 7 1 3 4 . 8 1 2 4 . 9 142.1 131.1 1 3 8 . 2 1 3 1 . 9 1 2 8 . 6 1 3 1 . 7 1 1 8 . 7 1 3 5 . 3 1 3 0 . 9 134.4
(continued).
52
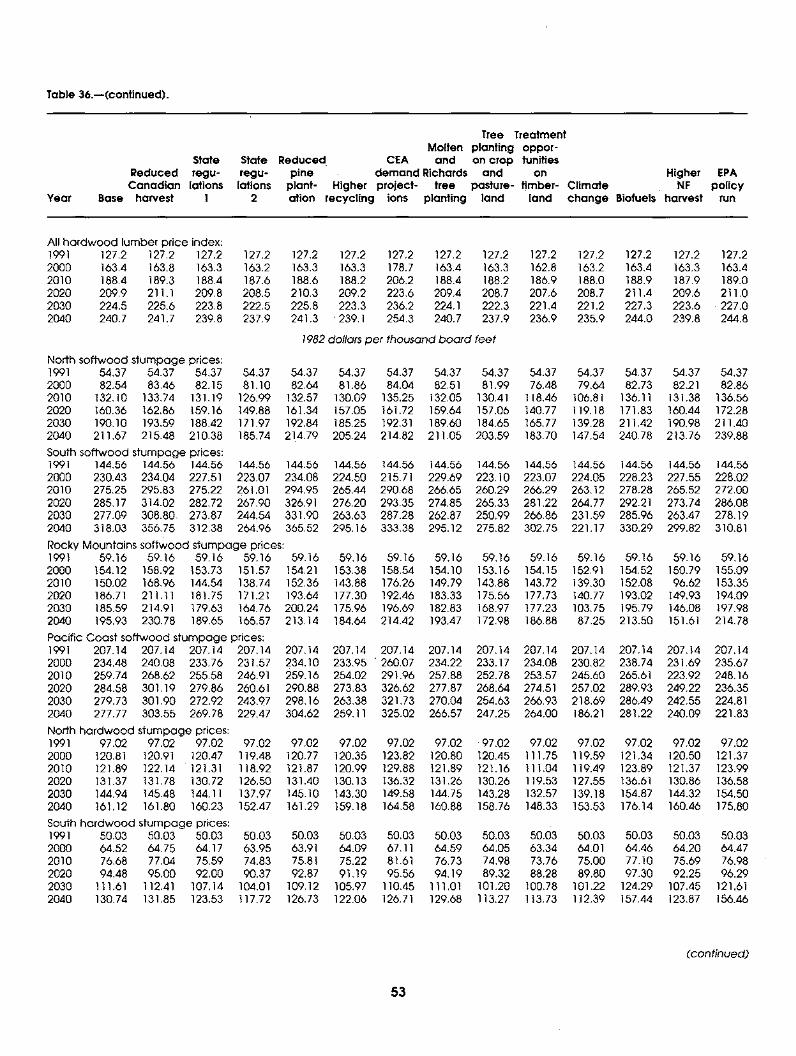
Table 36.re(continued).
Year
Tree Treatment Molten planting oppor-
State State Reduced CEA and on crop tunities Reduced regu- regu- pine demand Richards and on Higher EPA Canadian lations lations plant- Higher project- tree pasture-t!mber- Climate NF policy
Base harvest I 2 ation recycling ions planting land land change Biofuelsharvest run
AIIhardwoodlumber priceindex: 1991 127,2 1 2 7 . 2 1 2 7 , 2 1 2 7 . 2 1 2 7 . 2 1 2 7 , 2 1 2 7 , 2 1 2 7 . 2 1 2 7 , 2 1 2 7 . 2 1 2 7 , 2 1 2 7 . 2 1 2 7 , 2 127.2 2000 163.4 1 6 3 . 8 1 6 3 , 3 1 6 3 , 2 1 6 3 . 3 1 6 3 , 3 1 7 8 . 7 1 6 3 , 4 1 6 3 , 3 1 6 2 . 8 1 6 3 , 2 1 6 3 , 4 1 6 3 , 3 163,4 2010 188,4 1 8 9 . 3 1 8 8 , 4 1 8 7 , 6 1 8 8 . 6 1 8 8 , 2 2 0 6 . 2 1 8 8 . 4 1 8 8 . 2 1 8 6 , 9 1 8 8 , 0 1 8 8 , 9 1 8 7 . 9 189,0 2020 209,9 2 1 1 , 1 2 0 9 . 8 208,5 210.3 209,2 2 2 3 , 6 209.4 2 0 8 , 7 207.6 2 0 8 , 7 211,4 209,6 211.0 2030 224.5 225,6 223,8 222,5 225.8 223,3 2 3 6 . 2 2 2 4 , 1 222,3 221,4 2 2 1 . 2 227,3 223,6 . 227,0 2040 240,7 2 4 1 . 7 239,8 237,9 241.3 • 239,1 2 5 4 . 3 2 4 0 . 7 237,9 236.9 235,9 244.0 239.8 244,8
1982 dorian per thousand board feet
Noffh softwood stumpage prices: 1991 54,37 5 4 , 3 7 54,37 54,37 5 4 . 3 7 54.37 5 4 . 3 7 5 4 . 3 7 5 4 , 3 7 5 4 . 3 7 5 4 , 3 7 54.37 5 4 . 3 7 54,37 2000 82.54 83,46 82.15 81,10 82,64 81.86 8 4 , 0 4 82 ,51 81.99 7 6 , 4 8 7 9 . 6 4 8 2 , 7 3 8 2 , 2 1 82.86 2010 132,10 133,74 131,19 126,99 132.57 130,09 135.25 132.05 130.41 118.46 106,81 136,11 131.38 136.56 2020 160.36 162,86 159.16 149.88 161,34 157.05 161,72 159.64 157.06 140,77 119.18 171,83 160.44 172.28 2030 190.10 193.59 188,42 171,97 192,84 185.25 192,31 189,60 184.65 165.77 139.28 211,42 190,98 211.40 2040 211,67 215,48 210,38 185,74 214.79 205,24 214,82 211,05 203,59 183.70 147,54 240.78 213.76 239,88
South softwood stumpage prices: 1991 144,56 144.56 144,56 144.56 144,56 144.56 144.56 144.56 144.56 144,56 144.56 144.56 144,56 144.56 2000 230,43 234,04 227.51 223,07 234,08 224,50 215.71 229,69 223.10 223,07 224.05 228.23 227,55 228,02 2010 275,25 295,83 275,22 261,01 294,95 265,44 290.68 266.65 260,29 266,29 263.12 278,28 265.52 272.00 2020 285,17 314.02 282,72 267.90 326,91 276.20 293,35 274.85 265.33 281,22 264.77 292.21 273,74 286.08 2030 277,09 308.80. 273,87 244.54 331,90 263.63 287,28 262,87 250,99 266,86 231.59 285.96 263.47 278,19 2040 318,03 356.75 312.38 264.96 365,52 295.16 333,38 295.12 275.82 302.75 221,17 330.29 299,82 310.81
Rocky Mountains softwood stumpage prices: 1991 59,16 59,16 59.16 59,16 59.16 59,16 59,16 59.16 59,16 59.16 59,16 59,16 59,16 59,16 2000 154,12 158.92 153.73 151,57 154.21 153.38 158,54 154.10 153.16 154.15 152.91 154.52 150.79 155.09 2010 150.02 168,96 144,54 138.74 152,36 143,88 176,26 149.79 143.88 143.72 139,30 152,08 96.62 153,35 2020 186.71 211,11 181.75 171,21 193,64 177.30 192,46 183.33 175.56 177,73 140.77 193,02 149.93 194.09 2030 185.59 214.91 179,63 164,76 200,24 175,96 196,69 182,83 168.97 177,23 103,75 195,79 146.08 197.98 2040 195,93 230.78 189.65 165.57 213.14 184.64 214,42 193,47 172,98 186.88 87.25 213,50 151,61 214,78
Pacific Coastsoftwood stumpage prices: 1991 207,14 207,14 207.14 207,14 207,14 207,14 207,14 207.14 207.14 207,14 207,14 207,14 207.14 207.14 2000 234.48 240.08 233,76 231.57 234.10 233,95 '260.07 234,22 233.17 234,08 230,82 238,74 231,69 235,67 2010 259.74 268.62 255.58 246.91 259.16 254.02 291,96 257.88 252,78 253,57 245.60 265,61 223,92 248.16 2020 284,58 301.19 279,86 260.61 290.88 273,83 326,62 277.87 268,64 274.51 257,02 289.93 249,22 236,35 2030 279,73 301,90 272.92 243.97 298,16 263.38 321,73 270,04 254.63 266.93 218,69 286,49 242,55 224.81 2040 277.77 303,55 269.78 229,47 304,62 259,11 325.02 266,57 247.25 264,00 186.21 281,22 240.09 221.83
Noflh hardwood stumpage prices: 1991 97,02 97,02 97,02 97.02 97,02 97.02 97.02 97,02 .97.02 97,02 9 7 . 0 2 97,02 97,02 97,02 2000 120.81 120,91 120,47 119.48 120,77 120.35 123,82 120.80 120,45 111,75 119.59 121.34 120.50 121,37 2010 121,89 122.14 121,31 118,92 121.87 120,99 129.88 121,89 121,16 111,04 119.49 123,89 121.37 123,99 2020 131,37 131.78 130,72 126.50 131.40 130.13 136.32 131.26 130,26 119,53 127.55 136,61 130,86 136,58 2030 144,94 145.48 144,11 137,97 145.10 143,30 149.58 144.75 143.28 132,57 139,18 154,87 144.32 154,50 2040 161,12 161,80 160.23 152.47 161,29 159.18 164.58 160.88 158.76 148.33 153.53 176,14 160.46 175,80
South hardwood stumpage prices: 1991 50,03 50.03 50,03 50.03 5 0 . 0 3 50.03 50,03 5 0 . 0 3 50,03 5 0 . 0 3 50,03 5 0 , 0 3 50,03 50.03 2000 64,52 64,75 6 4 , 1 7 63.95 63 ,91 64,09 67 ,11 64.59 64,05 6 3 . 3 4 64 .01 64,46 64.20 64.47 2010 76,68 7 7 , 0 4 7 5 , 5 9 74,83 7 5 . 8 1 75.22 81 .61 7 6 . 7 3 7 4 , 9 8 7 3 , 7 6 75,00 7 7 . 1 0 75.69 76.98 2020 94.48 95.00 92,00 90,37 9 2 , 8 7 91,19 95,56 94.19 8 9 . 3 2 88.28 89,80 97,30 92.25 96.29 2030 111.61 112.41 107,14 104.01 109,12 105.97 110,45 111,01 101.20 100,78 101.22 124.29 107.45 121.61 2040 130,74 131,85 123.53 117,72 126.73 122,06 126.71 129,68 113,27 113,73 112.39 157.44 123,87 156.46
(continued)
53
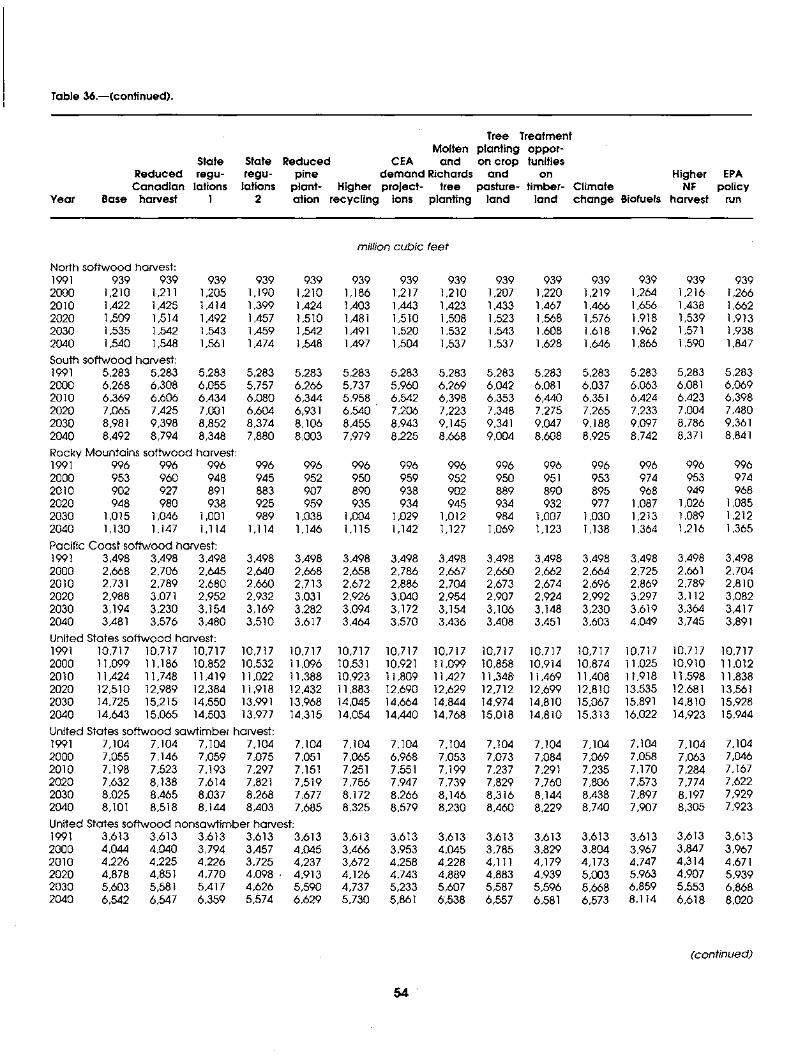
Table 36.--(continued).
Year
Tree Treatment Molten planting oppor-
State State Reduced CEA and on crop tunities Reduced regu- regu- pine demand Richards and on Higher EPA
Canadian lations lations plant- Higher project- tree pasture-timber- Climate NF policy Base harvest I 2 ation recycling ions planting land land change Biofuels harvest run
million cubic feet
North softwood harvest: 1991 939 939 939 939 939 939 939 939 939 939 939 939 939 939 2000 1,210 1 ,211 1 , 2 0 5 1 , 1 9 0 1 , 2 1 0 1 , 1 8 6 1 , 2 1 7 1 , 2 1 0 1 , 2 0 7 1 , 2 2 0 1 , 2 1 9 1 ,264 1 , 2 1 6 1,266 2010 1,422 1 , 4 2 5 1 , 4 1 4 1 , 3 9 9 1 , 4 2 4 1 , 4 0 3 1 , 4 4 3 1 , 4 2 3 1 , 4 3 3 1 , 4 6 7 1 , 4 6 6 1 ,656 1 , 4 3 8 1,662 2020 1,509 1 , 5 1 4 1 , 4 9 2 1 , 4 5 7 1 , 5 1 0 1 ,481 1 , 5 1 0 1 , 5 0 8 1 , 5 2 3 1 , 5 6 8 1 , 5 7 6 1 ,918 1 , 5 3 9 1,913 2030 1,535 1 , 5 4 2 1 , 5 4 3 1 , 4 5 9 1 , 5 4 2 1 ,491 1 , 5 2 0 1 , 5 3 2 1 , 5 4 3 1 , 6 0 8 1 , 6 1 8 1 ,962 1 ,571 1,938 2040 1,540 1 , 5 4 8 1 ,561 1 , 4 7 4 1 , 5 4 8 1 , 4 9 7 1 , 5 0 4 1 , 5 3 7 1 , 5 3 7 1 , 6 2 8 1 , 6 4 6 1 ,866 1 , 5 9 0 1,847 South softwood harvest: 1991 5,283 5,283 5,283 5,283 5,283 5,283 5,283 5,283 5,283 5,283 5,283 5 , 2 8 3 5,283 5,283 2000 6,268 6,308 6,055 5,757 6,266 5,737 5,960 6,269 6,042 6 ,081 6,037 6,063 6 ,081 6,069 2010 6,369 6,606 6,434 6,080 6,344 5,958 6,542 6,398 6,353 6,440 6 ,351 6,424 6,423 6,398 2020 7,065 7,425 7 ,001 6,604 6 , 9 3 1 6,540 7,206 7,223 7,348 7,275 7,265 7 , 2 3 3 7 , 0 0 4 7,480 2030 8,981 9,398 8,852 8,374 8,106 8,455 8,943 9,145 9 ,341 9,047 9,188 9 , 0 9 7 8,786 9,361 2040 8,492 8,794 8,348 7,880 8,003 7,979 8,225 8,668 9,004 8,608 8,925 8 , 7 4 2 8 ,371 8,841 Rocky Mountains softwood harvest: 1991 996 996 996 996 996 996 996 996 996 996 996 996 996 996 2000 953 960 948 945 952 950 959 952 950 951 953 974 953 974 2010 902 927 891 883 907 890 938 902 889 890 895 968 949 968 2020 948 980 938 925 959 935 934 945 934 932 977 1 , 0 8 7 1 ,026 1,085 2030 1,015 1 , 0 4 6 1,001 989 1 , 0 3 8 1 , 0 0 4 1 , 0 2 9 1,012 984 1 , 0 0 7 1 , 0 3 0 1 ,213 1 ,089 1,212 2040 1,130 1 , 1 4 7 1 , 1 1 4 1 , 1 1 4 1 , 1 4 6 1 , 1 1 5 1 , 1 4 2 1 , 1 2 7 1 , 0 6 9 1 , 1 2 3 1 , 1 3 8 1 ,364 1 ,216 1,365 Pacific Coast softwood harvest: 1991 3,498 3,498 3,498 3,498 3,498 3,498 3,498 3,498 3,498 3,498 3,498 3,498 3,498 3,498 2000 2,668 2,706 2,645 2,640 2,668 2,658 2,786 2,667 2,660 2,662 2,664 2,725 2 ,661 2,704 2010 2,731 2,789 2,680 2,660 2,713 2,672 2,886 2,704 2,673 2,674 2,696 2,869 2,789 2,810 2020 2,988 3 ,071 2,952 2,932 3 ,031 2,926 3,040 2,954 2,907 2,924 2,992 3 , 2 9 7 3,112 3,082 2030 3,194 3,230 3,154 3,169 3,282 3,094 3,172 3,154 3,106 3,148 3,230 3,619 3,364 3,417 2040 3,481 3,576 3,480 3,510 3,617 3,464 3,570 3,436 3,408 3 ,451 3,603 4,049 3,745 3,891 United States softwood harvest: 1991 10,717 10,717 10,717 10,717 10,717 10,717 10,717 10,717 10,717 10,717 10,717 10,717 10,717 10,717 2000 11,099 11,186 10,852 10,532 11,096 10,531 10,921 11,099 10,858 10,914 10,874 11,025 10,910 11,012 2010 11,424 11,748 11,419 11,022 11,388 10,923 11,809 11,427 11,348 11,469 11,408 11,918 11,598 11,838 2020 12,510 12,989 12,384 11,918 12,432 11,883 12,690 12,629 12,712 12,699 12,810 13,535 12,681 13,561 2030 14,725 15,215 14,550 13,991 13,968 14,045 14,664 14,844 14,974 14,810 15,067 15,891 14,810 15,928 2040 14,643 15,065 14,503 13,977 14,315 14,054 14,440 14,768 15,018 14,810 15,313 16,022 14,923 15,944
United States softwood sawtimber harvest: 1991 7,104 7,104 7,104 7,104 7,104 7,104 7,104 7,104 7,104 7,104 7,104 7,104 7,104 7,104 2000 7,055 7,146 7,059 7,075 7 ,051 7,065 6,968 7,053 7 , 0 7 3 7,084 7,069 7,058 7,063 7,046 2010 7,198 7,523 7,193 7,297 7 , 1 5 1 7 , 2 5 1 7 , 5 5 1 7,199 7,237 7 ,291 7,235 7,170 7,284 7,167 2020 7,632 8,138 7,614 7 , 8 2 1 7,519 7,756 7 , 9 4 7 7,739 7,829 7,760 7 , 8 0 6 7,573 7 , 7 7 4 7,622 2030 8,025 8,465 8,037 8,268 7,677 8,172 8,266 8,146 8,316 8,144 8 , 4 3 8 7,897 8 , 1 9 7 7,929 2040 8,101 8,518 8,144 8,403 7,685 8,325 8,579 8,230 8,460 8,229 8,740 7,907 8,305 7,923 United States softwood nonsawtimber harvest: 1991 3,613 3,613 3,613 3,613 3,613 3,613 3,613 3,613 3,613 3,613 3,613 3,613 3,613 3,613 2000 4,044 4,040 3,794 3,457 4,045 3,466 3,953 4,045 3,785 3,829 3,804 3 , 9 6 7 3,847 3,967 2010 4,226 4,225 4,226 3,725 4,237 3,672 4,258 4,228 4 ,111 4,179 4,173 4,747 4,314 4,671 2020 4,878 4 ,851 4,770 4,098 . 4,913 4,126 4,743 4,889 4,883 4,939 5,003 5 , 9 6 3 4,907 5,939 2030 5,603 5 , 5 8 1 5,417 4,626 5,590 4,737 5,233 5,607 5,587 5,596 5,668 6,859 5,553 6,868 2040 6,542 6,547 6,359 5,574 6,629 5,730 5 ,861 6,538 6,557 6 , 5 8 1 6,573 8,114 6,618 8,020
(continued)
4 "
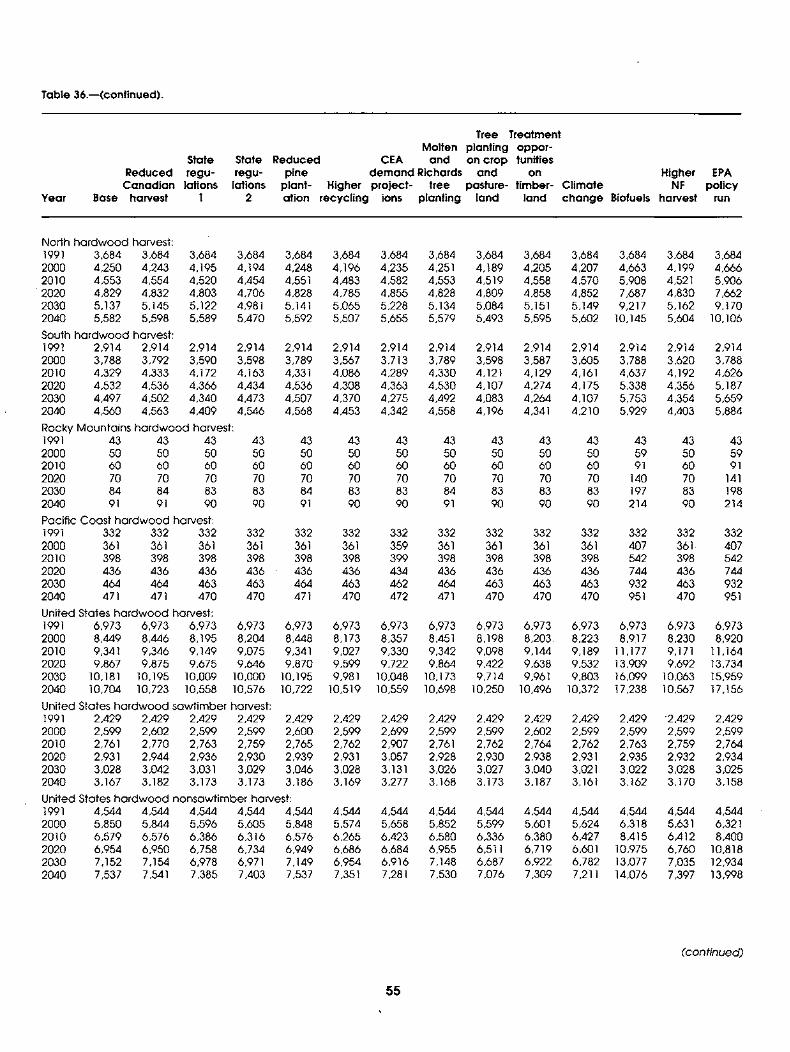
Table 36.--(continued).
Year
Tree Treatment Molten planting oppor-
State State Reduced CEA and on crop tunities Reduced regu- regu- pine d e m a n d Richards and on Higher EPA
Canadian lations lations plant- Higher project- tree pasture- t imber- Climate NF policy Base harvest I 2 ation recycling ions planting land land change Biofuels harvest run
Noffh hardwood hamest: 1991 3,684 3 , 6 8 4 3,684 2000 4,250 4 , 2 4 3 4,195 2010 4,553 4 , 5 5 4 4,520
2020 4,829 4 , 8 3 2 4,803 2030 5,137 5 , 1 4 5 5,122 2040 5,582 5 , 5 9 8 5,589
South hardwood harvest: 1991 2,914 2,914 2000 3,788 3,792 2010 4,329 4,333 2020 4,532 4,536 2030 4,497 4,502 2040 4,560 4,563
3,684 3 , 6 8 4 3 , 6 8 4 3 , 6 8 4 3 , 6 8 4 3 , 6 8 4 3 , 6 8 4 3 , 6 8 4 3 , 6 8 4 3 , 6 8 4 3,684 4,194 4 , 2 4 8 4,196 4,235 4 ,251 4,189 4,205 4 , 2 0 7 4,663 4,199 4,666 4,454 4 ,551 4,483 4 , 5 8 2 4,553 4,519 4,558 4,570 5 , 9 0 8 4 ,521 5,906 4,706 4,828 4,785 4,855 4,828 4,809 4,858 4 , 8 5 2 7 , 6 8 7 4,830 7,662 4,981 5 , 1 4 1 5 , 0 6 5 5 , 2 2 8 5 , 1 3 4 5 , 0 8 4 5 ,151 5 , 1 4 9 9 , 2 1 7 5 , 1 6 2 9,170 5,470 5 , 5 9 2 5 , 5 0 7 5,655 5 , 5 7 9 5 , 4 9 3 5,595 5 ,602 10,145 5 ,604 10,106
2,914 2,914 2,914 2,914 3,590 3 , 5 9 8 3,789 3,567 4,172 4,163 4 ,331 4,086 4,366 4,434 4,536 4,308 4,340 4 , 4 7 3 4 , 5 0 7 4,370 4,409 4,546 4 , 5 6 8 4,453
Rocky Mountains hardwood hamest: 1991 43 43 43 2000 50 50 50 2010 60 60 60 2020 70 70 70 2030 84 84 83 2040 91 91 90
Pacific Coast hardwood hamest: 1991 332 332 332 2000 361 361 361 2010 398 398 398 2020 436 436 436 2030 464 464 463 2040 471 471 470
United States hardwood hamest: 1991 6,973 6 , 9 7 3 6,973 2000 8,449 8 , 4 4 6 8,195 2010 9,341 9 , 3 4 6 9,149 2020 9,867 9 , 8 7 5 9,675
2,914 2 , 9 1 4 2 , 9 1 4 2 , 9 1 4 2 , 9 1 4 2 , 9 1 4 2 , 9 1 4 2,914 3,713 3 , 7 8 9 3 , 5 9 8 3 , 5 8 7 3 , 6 0 5 3 , 7 8 8 3,620 3,788 4,289 4,330 4 ,121 4,129 4 ,161 4 , 6 3 7 4,192 4,626 4,363 4,530 4 , 1 0 7 4 , 2 7 4 4,175 5 , 3 3 8 4,356 5,187 4,275 4 , 4 9 2 4,083 4,264 4 , 1 0 7 5 , 7 5 3 4,354 5,659 4,342 4 , 5 5 8 4,196 4 ,341 4,210 5 , 9 2 9 4 , 4 0 3 5,884
43 43 43 43 50 50 50 50 60 60 60 60 70 70 70 70 83 84 83 83 90 91 90 90
332 332 332 332 361 361 361 359 398 398 398 399 436 • 436 436 434 463 464 463 462 470 471 470 472
6,973 6 , 9 7 3 6 , 9 7 3 6,973 8,204 8 , 4 4 8 8 , 1 7 3 8,357 9,075 9 ,341 9 , 0 2 7 9,330 9,646 9,870 9,599 9,722
43 43 43 43 43 43 43 50 50 50 50 59 50 59 60 60 60 60 91 60 91 70 70 70 70 140 70 141 84 83 83 83 197 83 198 91 90 90 90 214 90 214
332 332 332 332 332 332 332 361 361 361 361 407 361. 407 398 398 398 398 542 398 542 436 436 436 436 744 436 744 464 463 463 463 932 463 932 471 470 470 470 951 470 951
6,973 6 , 9 7 3 6 , 9 7 3 6 , 9 7 3 6 , 9 7 3 6 , 9 7 3 6,973 8,451 8 , 1 9 8 8 ,203. 8 , 223 8,9.17 8,230 8,920 9,342 9,098 9 , 1 4 4 9,189 11,177 9 ,171 11,164 9,864 9,422 9 , 6 3 8 9 ,532 13,909 9 ,692 13,734
2030 2040
United States hardwood sawtimber hamest: 1991 2,429 2,429 2,429 2,429 2,429 2,429 2,429 2000 2,599 2 , 6 0 2 2,599 2,599 2,600 2,599 2,699 2010 2,761 2 , 7 7 0 2 , 7 6 3 2,759 2,765 2 , 7 6 2 2,907 2020 2,931 2 , 9 4 4 2,936 2,930 2,939 2 ,931 3,057 2030 3,028 3 , 0 4 2 3 ,031 3 , 0 2 9 3 , 0 4 6 3 , 0 2 8 3,131 2040 3,167 3 , 1 8 2 3 , 1 7 3 3 , 1 7 3 3 , 1 8 6 3 , 1 6 9 3,277
United States hardwood nonsawtimber hamest: 1991 4,544 4,544 4,544 4,544 4,544 4,544 4,544 2000 5,850 5 , 8 4 4 5 , 5 9 6 5 , 6 0 5 5 , 8 4 8 5,574 5,658 2010 6,579 6,576 6,386 6,316 6,576 6,265 6,423 2020 6,954 6,950 6 , 7 5 8 6 , 7 3 4 6,949 6,686 6,684 2030 7,152 7 , 1 5 4 6 , 9 7 8 6 ,971 7 , 1 4 9 6,954 6,916 2040 7,537 7 ,541 7 , 3 8 5 7 , 4 0 3 7 , 5 3 7 7 ,351 7,281
10,181 10,195 10,009 10,000 10,195 9 ,981 10,048 10,173 9,714 9 ,961 9 ,803 16,099 10,063 15,959 10,704 10,723 10,558 10,576 10,722 10,519 10,559 10,698 10,250 10,496 10,372 17,238 10,567 17,156
2,429 2 , 4 2 9 2,429 2,599 2 , 5 9 9 2,602 2,761 2 , 7 6 2 2,764 2,928 2 , 9 3 0 2,938 3,026 3 , 0 2 7 3,040 3,168 3 , 1 7 3 3,187
2,429 2,429 '2,429 2,429 2,599 2,599 2,599 2,599 2,762 2 , 7 6 3 2,759 2,764 2,931 2,935 2,932 2,934 3,021 3 , 0 2 2 3 , 0 2 8 3,025 3,161 3 , 1 6 2 3 , 1 7 0 3,158
4,544 4,544 4,544 5,852 5,599 5,601 6,580 6,336 6,380 6,955 6 ,511 6,719 7,148 6 , 6 8 7 6,922 7,530 7 , 0 7 6 7,309
4,544 4,544 4,544 4,544 5,624 6 , 3 1 8 5 ,631 6,321 6,427 8 , 4 1 5 6 , 4 1 2 8,400 6,601 10,975 6,760 10,818 6,782 13,077 7 ,035 12,934 7,211 14,076 7 ,397 13,998
(continued)
55
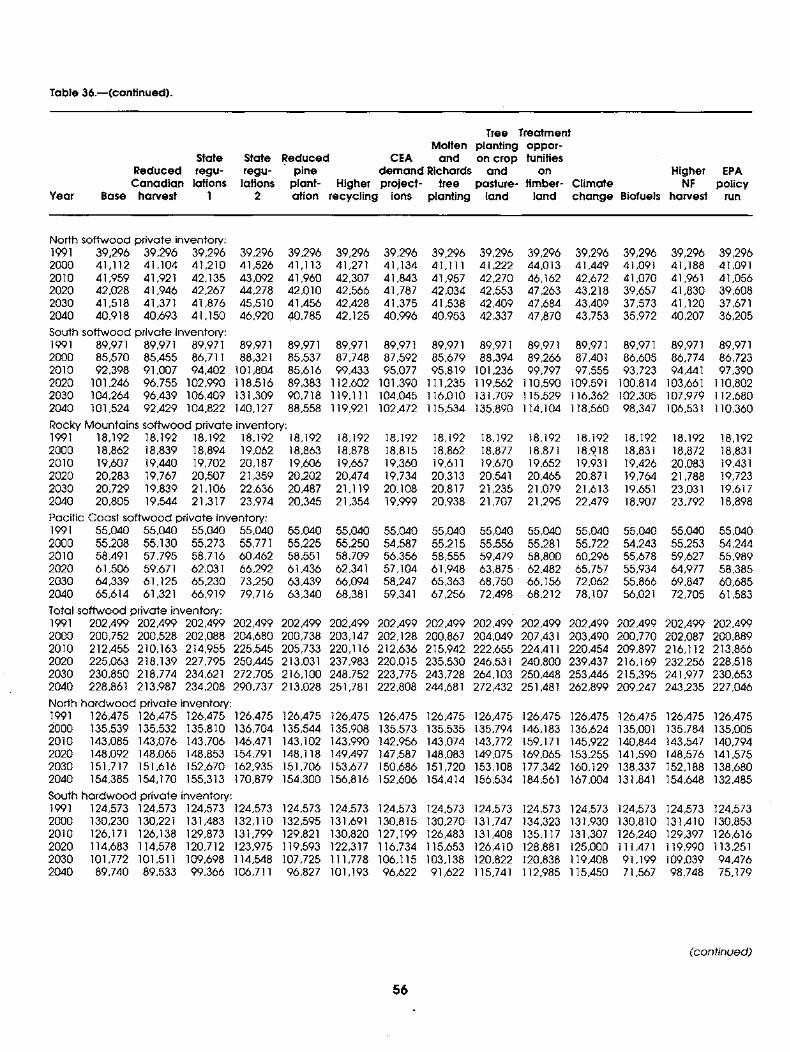
Table 36.re(continued).
Year
Tree Treatment Molten planting oppor-
State State Reduced CEA and on crop tunities Reduced regu- regu- pine demand Richards and on Higher EPA
Canadian lations lations plant- Higher project- tree pasture-timber- Climate NF policy Base harvest I 2 ation recycling ions planting land land change Biofuels harvest run
North softwood private inventory: 1991 39,296 39,296 39,296 39,296 39,296 39,296 39,296 39,296 39,296 39,296 39,296 39,296 39,296 39,296 2000 41,112 41,104 41,210 41,526 41,113 41,271 41,134 41,111 41,222 44,013 41,449 41,091 41,188 41,091 2010 41,959 41,921 42,135 43,092 41,960 42,307 41,843 41,957 42,270 46,162 42,672 41,070 41,961 41,056 2020 42,028 41,946 42,267 44,278 42,010 42,566 41,787 42,034 42,553 47,263 43,218 39,657 41,830 39,608 2030 41,518 41,371 41,876 45,510 41,456 42,428 41,375 41,538 42,409 47,684 43,409 37,573 41,120 37,671 2040 40,918 40,693 41,150 46,920 40,785 42,125 40,996 40,953 42,337 47,870 43,753 35,972 40,207 36,205 South softwood private inventory: 1991 89,971 89,971 89,971 89,971 89,971 89,971 89,971 89,971 89,971 89,971 89,971 89,971 89,971 89,971 2000 85,570 85,455 86,711 88,321 85,537 87,748 87,592 85,679 88,394 89,266 87,401 86,605 86,774 86,723 2010 92,398 91,007 94,402 101,804 85,616 99,433 95,077 95,819 101,236 99,797 97,555 93,723 94,441 97,390 2020 101,246 96,755 102,990 118,516 89,383 112,602 101,390 111,235 119,562 110,590 109,591 100,814 103,661 110,802 2030 104,264 96,439 106,409 131,309 90,718 119,111 104,045 116,010 131,709 115,529 116,362 102,305 107,979 112,680 2040 101,524 92,429 104,822 140,127 88,558 119,921 102,472 115,534 135,890 114,104 118,560 98,347 106,531 110,360
Rocky Mountains softwood private inventory: 1991 18 ,192 18,192 18,192 18,192 18,192 18,192 18,192 18,192 18,192 18,192 18,192 18,192 18,192 18,192 2000 18,862 18,839 18,894 19,062 18,863 18,878 18,815 18,862 18,877 18,871 18,9,18 18,831 18,872 18,831 2010 19,607 19,440 19,702 20,187 19,606 19,667 19,360 19,611 19,670 19,652 19,931 19,426 20,083 19,431 2020 20,283 19,767 20,507 21,359 20,202 20,474 19,734 20,313 20,541 20,465 20,871 19,764 21,788 19,723 2030 20,729 19,839 21,106 22,636 20,487 21,119 20,108 20,817 21,235 21,079 21,613 19,651 23,031 19,617 2040 20,805 19,544 21,317 23,974 20,345 21,354 19,999 20,938 21,707 21,295 22,479 18,907 23,792 18,898 Pacific Coast softwood private inventory: 1991 55,040 55,040 55,040 55,040 55,040 55,040 55,040 55,040 55,040 55,040 55,040 55,040 55,040 55,040 2000 55,208 55,130 55,273 55,771 55,225 55,250 54,587 55,215 55,556 55,281 55,722 54,243 55,253 54,244 2010 58,491 57,795 58,716 60,462 58,551 58,709 56,356 58,555 59,479 58,800 60,296 55,678 59,627 55,989 2020 61,506 59,671 62,031 66,292 61,436 62,341 57,104 61,948 63,875. 62,482 65,757 55,934 64,977 58,385 2030 64,339 61,125 65,230 73,250 63,439 66,094 58,247 65,363 68,750 66,156 72,062 55,866 69,847 60,685 2040 65,614 61,321 66,919 79,716 63,340 68,381 59,341 67,256 72,498 68,212 78,107 56,021 72,705 61,583 Total softwood private inventory: 1991 202,499 202,499 202,499 202,499 202,499 202,499 202,499 202,499 202,499 202,499 202,499 202,499 202,499 202,499 2000 200,752 200,528 202,088 204,680 200,738 203,147 202,128 200,867 204,049 207,431 203,490 200,770 202,087 200,889 2010 212,455 210,163 214,955 225,545 205,733 220,116 212,636 215,942 222,655 224,411 220,454 209,897 216,112 213,866 2020 225,063 218,139 227,795 250,445 213,031 237,983 220,015 235,530 246,531 240,800 239,437 216,169 232,256 228,518 2030 230,850 218,774 234,621 272,705 216,100 248,752 223,775 243,728 264,103 250,448 253,446 215,395 241,977 230,653 2040 228,861 213,987 234,208 290,737 213,028 251,781 222,808 244,681 272,432 251,481 262,899 209,247 243,235 227,046 North hardwood private inventory: 1991 126,475 126,475 126,475 126,475 126,475 126,475 126,475 126,475 126,475 126,475 126,475 t26,475 126,475 126,475 2000 135,539 135,532 135,810 136,704 135,544 135,908 135,573 135,535 135,794 146,183 136,624 135,001 135,784 135,005 2010 143,085 143,076 143,706 146,471 143,102 143,990 142,956 143,074 143,772 159,171 145,922 140,844 143,547 140,794 2020 148,092 148,065 148,853 154,791 148,118 149,497 147,587 148,083 149,075 169,065 153,255 141,590 148,576 141,575 2030 151,717 151,616 152,670 162,935 151,706 153,677 150,686 151,720 153,108 177,342 160,129 138,337 152,188 138,680 2040 154,385 154,170 155,313 170,879 154,300 156,816 152,606 154,414 156,534 184,561 167,004 131,841 154,648 132,485 South hardwood private inventory: 1991 124,573 124,573 124,573 124,573 124,573 124,573 124,573 124,573 124,573 124,573 124,573 124,573 124,573 124,573 2000 130,230 130,221 131,483 132,110 132,595 131,691 130,815 130,270 131,747 134,323 131,930 130,810 131,410 130,853 2010 126,171 126,138 129,873 131,799 129,821 130,820 127,199 126,483 131,408 135,117 131,307 126,240 129,397 126,616 2020 114,683 114,578 120,712 123,975 119,593 122,317 116,734 115,653 126,410 128,881 125,000 111,471 119,990 113,251 2030 101,772 101,511 109,698 114,548 107,725 111,778 106,115 103,138 120,822 120,838 119,408 91,199 109,039 94,476 2040 89,740 89,533 99,366 106,711 96,827 101,193 96,622 91,622 115,741 112,985 115,450 71,567 98,748 75,179
(continued)
56
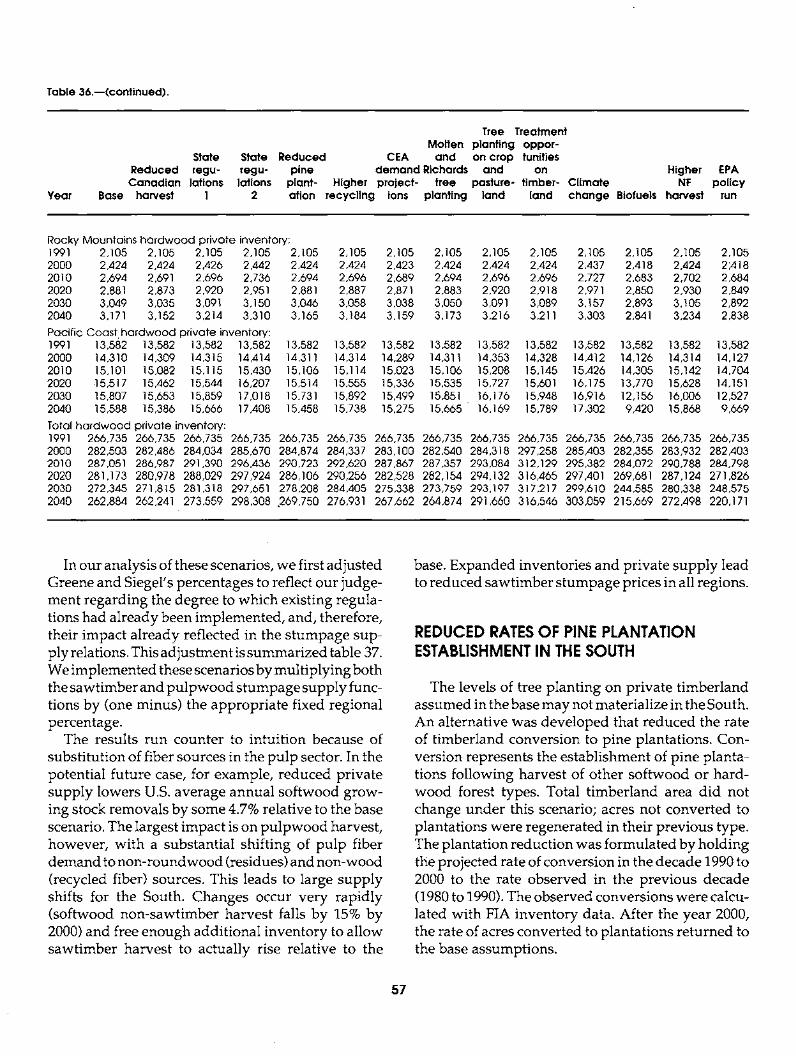
Table 36.--(continued).
Year Base
Tree Treatment Molten planting oppor-
State State Reduced CEA and on crop tunities Reduced regu- regu- pine demand Richards and on Higher EPA Canadian lations lations plant- Higher project- tree pasture-timber- Climate NF policy
harvest I 2 ation recycling ions planting land land change Biofuels harvest run
Rocky Mountains hardwood private inventory: 1991 2,105 2,105 2,105 2,105 2,105 2,105 2,105 2,105 2,105 2,105 2,105 2,105 2,105 2,105 2000 2,424 2,424 2,426 2,442 2,424 2,424 2,423 2,424 2,424 2,424 2,437 2,418 2,424 2;418 2010 2,694 2 ,691 2,696 2,736 2,694 2,696 2,689 2,694 2,696 2,696 2,727 2,683 2,702 2,684 2020 2,881 2,873 2,920 2 ,951 2 , 8 8 1 2 , 8 8 7 2 , 8 7 1 2,883 2,920 2,918 2 ,971 2,850 2,930 2,849 2030 3,049 3,035 3 ,091 3,150 3,046 3,058 3,038 3,050 3 ,091 3,089 3,157 2,893 3,105 2,892 2040 3,171 3,152 3,214 3,310 3,165 3,184 3,159 3 , 1 7 3 3,216 3 ,211 3,303 2 ,841 3,234 2,838 Pacific Coast hardwood private inventory: 1991 13,582 13,582 13,582 13,582 13,582 13,582 13,582 13,582 13,582 13,582 13,582 13,582 13,582 13,582 2000 14,310 14,309 14,315 14,414 14,311 14,314 14,289 14,311 14,353 14,328 14,412 14,126 14,314 14,127 2010 15,101 15,082 15,115 15,430 15,106 15,114 15,023 15,106 15,208 15,145 15,426 14,305 15,142 14,704 2020 .15,517 15,462 15,544 16,207 15,514 15,555 15,336 15,535 15,727 15,601 16,175 13,770 15,628 14,151 2030 15,807 15,653 15,859 17,018 15,731 15,892 15,499 15,851 16,176 15,948 16,916 12,156 16,006 12,527 2040 15,588 15,386 15,666 17,408 15,458 15,738 15,275 15,665 16,169 15,789 17,302 9,420 15,868 9,669
Total hardwood private inventory: 1991 2000 2010 2020 2030 2040
266,735 266,735 266,735 266,735 266,735 266,735 266,735 266,735 266,735 266,735 282,503 282,486 284,034 285,670 284,874 284,337 283,100 282,540 284,318 297,258 287,051 286,987 291,390 296,436 290,723 292,620 287,867 287,357 293,084 312,129 281,173 280,978 288,029 297,924 286,106 290,256 282,528 282,154 294,132 316,465 272,345 271,815 281,318 297,651 278,208 284,405 275,338 273,759 293,197 317,217 262,884 262,241 273,559 298,308 269,750 276,931 267,662 264,874 291,660 316,546
266,735 266,735 266,735 266,735 285,403 282,355 283,932 282,403 295,382 284,072 290,788 284,798 297,401 269,681 287,124 271,826 299,610 244,585 280,338 248,575 303,059 215,669 272,498 220,171
In our analysis of these scenarios, we first adjusted Greene and Siegel's percentages to reflect our judge- ment regarding the degree to which existing regula- tions had already been implemented, and, therefore, their impact already reflected in the stumpage sup- ply relations. This adjustment is summarized table 37. We implemented these scenarios by multiplying both the sawtimber and pulpwood stumpage supply func- tions by (one minus) the appropriate fixed regional percentage.
The results run counter to intuition because of substitution of fiber sources in the pulp sector. In the potential future case, for example, reduced private supply lowers U.S. average annual softwood grow- ing stock removals by some 4.7% relative to the base scenario. The largest impact is on pulpwood harvest, however, with a substantial shifting of pulp fiber demand to non-roundwood (residues) and non-wood (recycled fiber) sources. This leads to large supply shifts for the South. Changes occur very rapidly (softwood non-sawtimber harvest falls by 15% by 2000) and free enough additional inventory to allow sawtimber harvest to actually rise relative to the
base. Expanded inventories and private supply lead to reduced sawtimber stumpage prices in all regions.
REDUCED RATES OF PINE PLANTATION ESTABLISHMENT IN THE SOUTH
The levels of tree planting on private timberland assumed in the base may not materialize in the South. An alternative was developed that reduced the rate of timberland conversion to pine plantations. Con- version represents the establishment of pine planta- tions following harvest of other softwood or hard- wood forest types. Total timberland area did not change under this scenario; acres not converted to plantations were regenerated in their previous type. The plantation reduction was formulated by holding the projected rate of conversion in the decade 1990 to 2000 to the rate observed in the previous decade (1980 to 1990). The observed conversions were calcu- lated with FIA inventory data. After the year 2000, the rate of acres converted to plantations returned to the base assumptions.
57
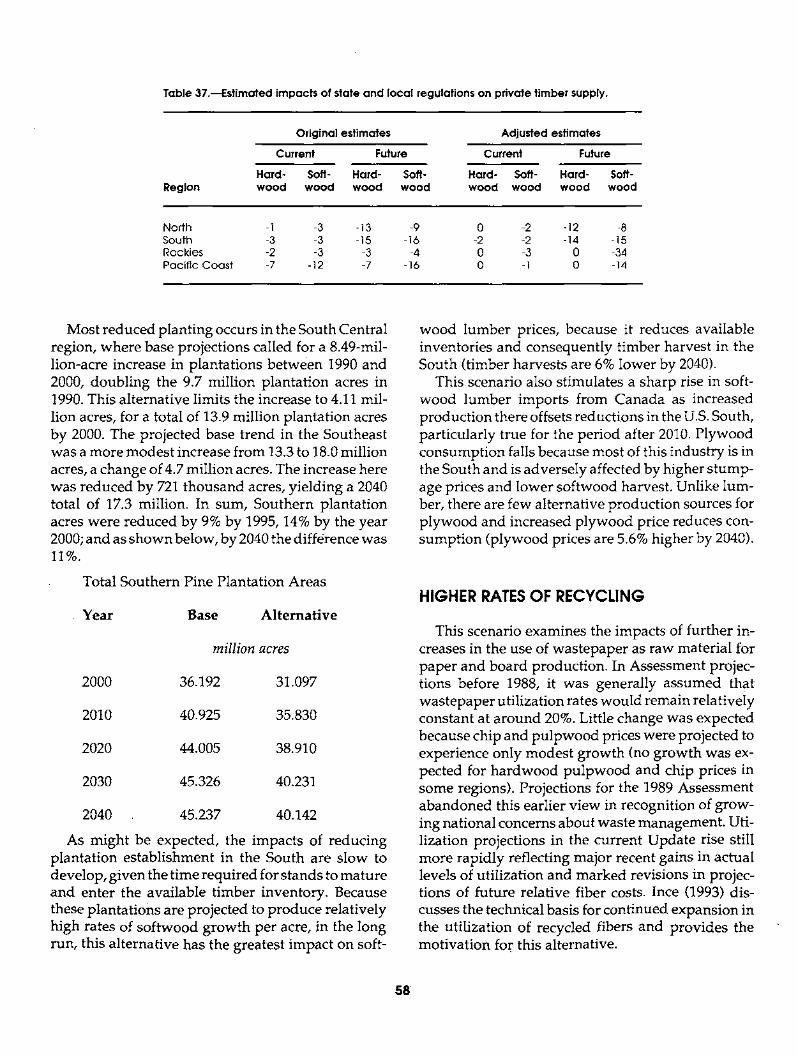
Table 37.--Estimated impacts of state and local regulations on private timber supply.
Original estimates Adjusted estimates
Current Future Current Future
Hard- Soft- Hard- Soft- Hard- Soft- Hard- Soft- Region wood wood wood wood wood wood wood wood
North -1 -3 -13 -9 0 -2 -12 -8 South -3 -3 -15 -16 -2 -2 -14 -15 Rockies -2 -3 -3 -4 0 -3 0 -34 Pacific Coast -7 -12 -7 -16 0 -1 0 -14
Most reduced planting occurs in the South Central region, where base projections called for a 8.49-mil- lion-acre increase in plantations between 1990 and 2000, doubling the 9.7 million plantation acres in 1990. This alternative limits the increase to 4.11 mil- lion acres, for a total of 13.9 million plantation acres by 2000. The projected base trend in the Southeast was a more modest increase from 13.3 to 18.0 million acres, a change of 4.7 million acres. The increase here was reduced by 721 thousand acres, yielding a 2040 total of 17.3 million. In sum, Southern plantation acres were reduced by 9% by 1995, 14% by the year 2000; and as shown below, by 2040 the difference was 11%.
Total Southern Pine Plantation Areas
Year Base Alternative
million acres
2000 36.192 31.097
2010 40.925 35.830
2020 44.005 38.910
2030 45.326 40.231
2040 45.237 40.142
As might be expected, the impacts of reducing plantation establishment in the South are slow to develop, given the time required for stands to mature and enter the available timber inventory. Because these plantations are projected to produce relatively high rates of softwood growth per acre, in the long run, this alternative has the greatest impact on soft-
wood lumber prices, because it reduces available inventories and consequently timber harvest in the South (timber harvests are 6% lower by 2040).
This scenario also stimulates a sharp rise in soft- wood lumber imports from Canada as increased production there offsets reductions in the U.S. South, particularly true for the period after 2010. Plywood consumption falls because most of this industry is in the South and is adversely affected by higher Stump- age prices and lower softwood harvest. Unlike lum- ber, there are few alternative production sources for plywood and increased plywood price reduces con- sumption (plywood prices are 5.6% higher by 2040).
HIGHER RATES OF RECYCLING
This scenario examines the impacts of further in- creases in the use of wastepaper as raw material for paper and board production. In Assessment projec- tions before 1988, it was generally assumed that wastepaper utilization rates would remain relativeiy constant at around 20%. Little change was expected because chip and pulpwood prices were projected to experience only modest growth (no growth was ex- pected for hardwood pulpwood and chip prices in some regions). Projections for the 1989 Assessment abandoned this earlier view in recognition of grow- ing national concerns about waste management. Uti- lization projections in the current Update rise still more rapidly reflecting major recent gains in actual levels of utilization and marked revisions in projec- tions of future relative fiber costs. Ince (1993) dis- cusses the technical basis for continued expansion in the utilization of recycled fibers and provides the motivation for. this alternative.
58
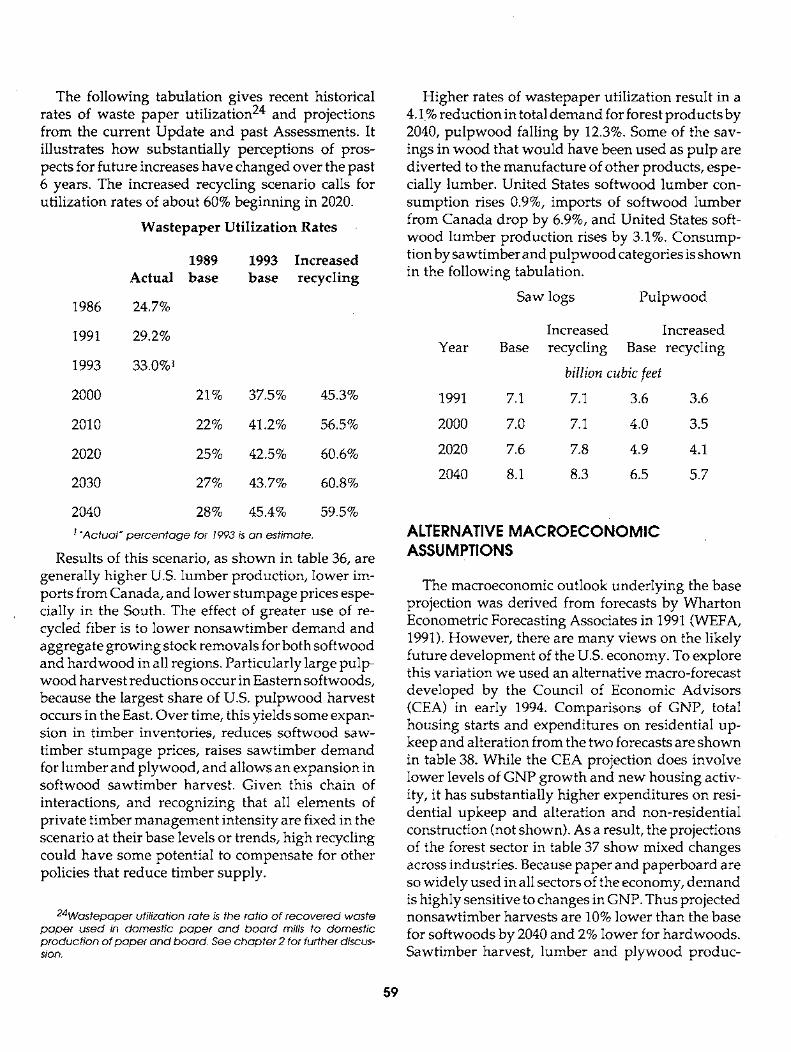
The following tabulation gives recent historical rates of waste paper utilization 24 and projections from the current Update and past Assessments. It illustrates how substantially perceptions of pros- pects for future increases have changed over the past 6 years. The increased recycling scenario calls for utilization rates of about 60% beginning in 2020.
Wastepaper Uti l ization Rates
1989 1993 Increased Actual base base recycling
1986 24.7%
1991 29.2%
1993 33.0% 1
2000 21% 37.5% 45.3%
2010 22% 41.2% 56.5%
2020 25% 42.5% 60.6%
2030 27% 43.7% 60.8%
2040 28% 45.4% 59.5%
1"Actual" percentage for 1993 is an estimate.
Results of this scenario, as shown in table 36, are generally higher U.S. lumber production, lower im- ports from Canada, and lower stumpage prices espe- cially in the South. The effect of greater use of re- cycled fiber is to lower nonsawtimber demand and aggregate growing stock removals for both softwood and hardwood in all regions. Particularly large pulp- wood harvest reductions occur in Eastern softwoods, because the largest share of U.S. pulpwood harvest occurs in the East. Over time, this yields some expan- sion in timber inventories, reduces softwood saw- timber stumpage prices, raises sawtimber demand for lumber and plywood, and allows an expansion in softwood sawtimber harvest. Given this chain of interactions, and recognizing that all elements of private timber management intensity are fixed in the scenario at their base levels or trends, high recycling could have some potential to compensate for other policies that reduce timber supply.
24Wastepaper utilization rate is the ratio of recovered waste paper used in domestic paper and board mills to domestic product ion of paper and board. See chap te r2 for further discus- sion.
Higher rates of wastepaper utilization result in a 4.1% reduction in total demand for forest products by 2040, pulpwood falling by 12.3%. Some of the sav- ings in wood that would have been used as pulp are diverted to the manufacture of other products, espe- cially lumber. United States softwood lumber con- sumption rises 0.9%, imports of softwood lumber from Canada drop by 6.9%, and United States soft- wood lumber production rises by 3.1%. Consump- tion by sawtimber and pulpwood categories is shown in the following tabulation.
Saw logs Pulpwood
Increased Increased Year Base recycling Base recycling
billion cubic feet
1991 7.1 7.1 3.6 3.6
2000 7.0 7.1 4.0 3.5
2020 7.6 7.8 4.9 4.1
2040 8.1 8.3 6.5 5.7
ALTERNATIVE MACROECONOMIC ASSUMPTIONS
The macroeconomic outlook underlying the base projection was derived from forecasts by Wharton Econometric Forecasting Associates in 1991 (WEFA, 1991). However, there are many views on the likely future development of the U.S. economy. To explore this variation we used an alternative macro-forecast developed by the Council of Economic Advisors (CEA) in early 1994. Comparisons of GNP, total housing starts and expenditures on residential up- keep and alteration from the two forecasts are shown in table 38. While the CEA projection does involve lower levels of GNP growth and new housing activ- ity, it has substantially higher expenditures on resi- dential upkeep and alteration and non-residential construction (not shown). As a result, the projections of the forest sector in table 37 show mixed changes across industries. Because paper and paperboard are so widely used in all sectors of the economy, demand is highly sensitive to changes in GNP. Thus projected nonsawtimber harvests are 10% lower than the base for softwoods by 2040 and 2% lower for hardwoods. Sawtimber harvest, lumber and plywood produc-
59
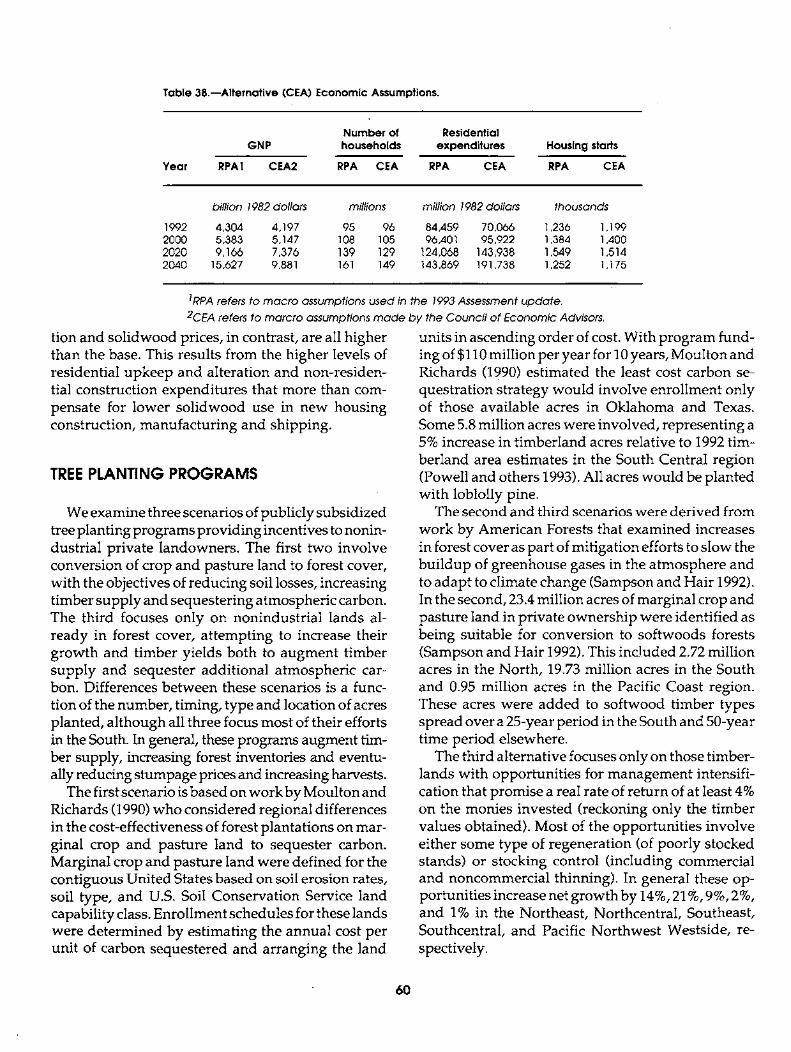
Table 38.mAlternative (CEA) Economic Assumptions.
Number of Residential GNP households expenditures Housing starts
Year RPAI CEA2 RPA CEA RPA CEA RPA CEA
1992 2000 2020 2040
billion 1982 dolla~ millions million 1982 dorian thousands
4,304 4,197 95 96 84,459 70,066 1,236 1,199 5,383 5,147 108 105 96,401 95,922 1,384 1,400 9,166 7,376 139 129 124,068 143,938 1,549 1,514
15,627 9,881 161 149 143,869 191,738 1,252 1,175
1RPA refers to macro assumptions used in the 1993 Assessment update.
2CEA refers to marcro assumptions made by the Council of Economic Advisors.
tion and solidwood prices, in contrast, are all higher than the base. This results from the higher levels of residential upkeep and alteration and non-residen- tial construction expenditures that more than com- pensate for lower solidwood use in new housing construction, manufacturing and shipping.
TREE PLANTING PROGRAMS
We examine three scenarios of publicly subsidized tree planting programs providing incentives to nonin- dustrial private landowners. The first two involve conversion of crop and pasture land to forest cover, with the objectives of reducing soil losses, increasing timber supply and sequestering atmospheric carbon. The third focuses only on nonindustrial lands al- ready in forest cover, attempting to increase their growth and timber yields both to augment timber supply and sequester additional atmospheric car- bon. Differences between these scenarios is a func- tion of the number, timing, type and location of acres planted, although all three focus most of their efforts in the South. In general, these programs augment tim- ber supply, increasing forest inventories and eventu- ally reducing s~mpage prices and increasing harvests.
The first scenario is based on work by Moulton and Richards (1990) who considered regional differences in the cost-effectiveness of forest plantations on mar- ginal crop and pasture land to sequester carbon. Marginal crop and pasture land were defined for the contiguous United States based on soil erosion rates, soil type, and U.S. Soil Conservation Service land capability class. Enrollment schedules for these lands were determined by estimating the annual cost per unit of carbon sequestered and arranging the land
units in ascending order of cost. With program fund- ing of $110 million per year for 10 years, Moulton and Richards (1990) estimated the least cost carbon se- questration strategy would involve enrollment only of those available acres in Oklahoma and Texas. Some 5.8 million acres were involved, representing a 5% increase in timberland acres relative to 1992 tim- berland area estimates in the South Central region (Powell and others 1993). All acres would be planted with loblolly pine.
The second and third scenarios were derived from work by American Forests that examined increases in forest cover as part of mitigation efforts to slow the buildup of greenhouse gases in the atmosphere and to adapt to climate change (Sampson and Hair 1992). In the second, 23.4 million acres of marginal crop and pasture land in private ownership were identified as being suitable for conversion to softwoods forests (Sampson and Hair 1992). This inc!uded 2.72 million acres in the North, 19.73 million acres in the South and 0.95 million acres in the Pacific Coast region. These acres were added to softwood timber types spread over a 25-year period in the South and 50-year time period elsewhere.
The third alternative focuses only on those timber- lands with opportunities for management intensifi- cation that promise a real rate of return of at least 4% on the monies invested (reckoning only the timber values obtained). Most of the opportunities involve either some type of regeneration (of poorly stocked stands) or stocking control (including commercial and noncommercial thinning). In general these op- portunities increase net growth by 14%, 21%, 9%, 2%, and 1% in the Northeast, Northcentral, Southeast, Southcentral, and Pacific Northwest Westside, re- spectively.
60
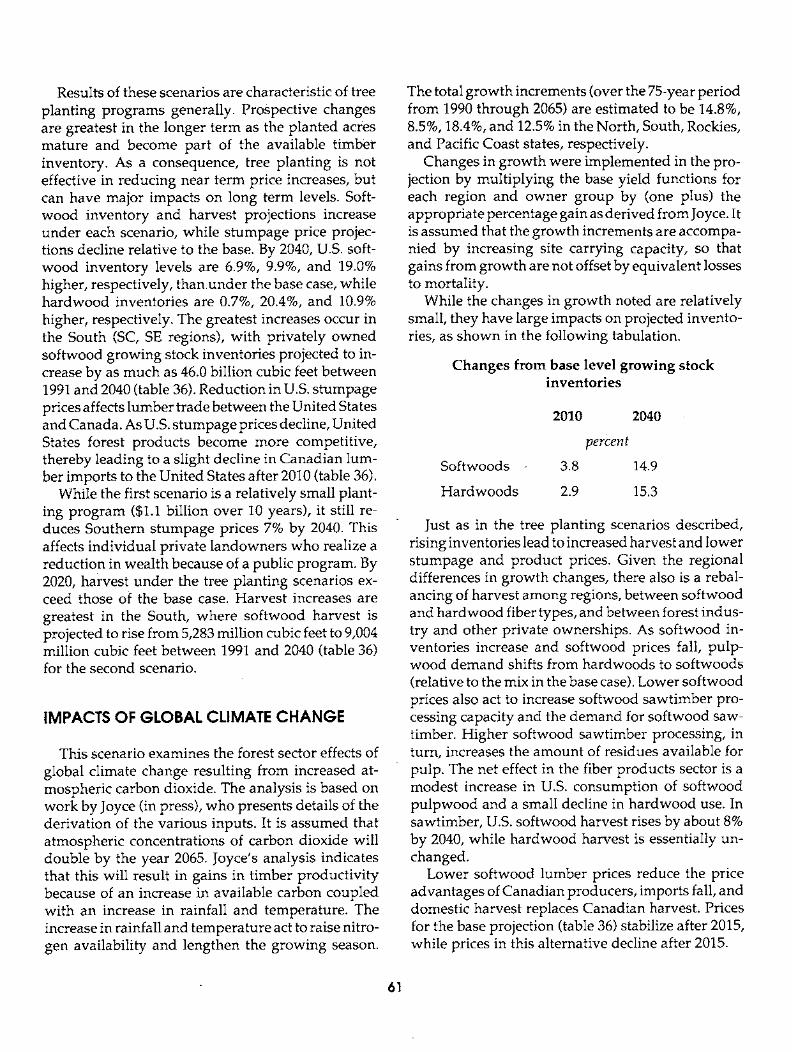
Results of these scenarios are characteristic of tree planting programs generally. Prospective changes are greatest in the longer term as the planted acres mature and become part of the available timber inventory. As a consequence, tree planting is not effective in reducing near term price increases, but can have major impacts on long term levels. Soft- wood inventory and harvest projections increase under each scenario, while stumpage price projec- tions decline relative to the base. By 2040, U.S. soft- wood inventory levels are 6.9%, 9.9%, and 19.0% higher, respectively, thanunder the base case, while hardwood inventories are 0.7%, 20.4%, and 10.9% higher, respectively. The greatest increases occur in the South (SC, SE regions), with privately owned softwood growing stock inventories projected to in- crease by as much as 46.0 billion cubic feet between 1991 and 2040 (table 36). Reduction in U.S. stumpage prices affects lumber trade between the United States and Canada. As U.S. stumpage prices decline, United States forest products become more competitive, thereby leading to a slight decline in Canadian lum- ber imports to the United States after 2010 (table 36).
While the first scenario is a relatively small plant- ing program ($1.1 billion over 10 years), it still re- duces Southern stumpage prices 7% by 2040. This affects individual private landowners who realize a reduction in wealth because of a public program. By 2020, harvest under the tree planting scenarios ex- ceed those of the base case. Harvest increases are greatest in the South, where softwood harvest is projected to rise from 5,283 million cubic feet to 9,004 million cubic feet between 1991 and 2040 (table 36) for the second scenario.
IMPACTS OF GLOBAL CLIMATE CHANGE
This scenario examines the forest sector effects of global climate change resulting from increased at- mospheric carbon dioxide. The analysis is based on work by Joyce (in press), who presents details of the derivation of the various inputs. It is assumed that atmospheric concentrations of carbon dioxide will double by the year 2065. Joyce's analysis indicates that this will result in gains in timber productivity because of an increase in available carbon coupled with an increase in rainfall and temperature. The increase in rainfall and temperature act to raise nitro- gen availability and lengthen the growing season.
The total growth increments (over the 75-year period from 1990 through 2065) are estimated to be 14.8%, 8.5%, 18.4%, and 12.5% in the North, South, Rockies, and Pacific Coast states, respectively.
Changes in growth were implemented in the pro- jection by multiplying the base yield functions for each region and owner group by (one plus) the appropriate percentage gain as derived from Joyce. It is assumed that the growth increments are accompa- nied by increasing site carrying capacity, so that gains from growth are not offset by equivalent losses to mortality.
While the changes in growth noted are relatively small, they have large impacts on projected invento- ries, as shown in the following tabulation.
Changes from base level growing stock inventories
2010 2040
percent Softwoods 3.8 14.9
Hardwoods 2.9 15.3
Just as in the tree planting scenarios described, rising inventories lead to increased harvest and lower stumpage and product prices. Given the regional differences in growth changes, there also is a rebal- ancing of harvest among regions, between softwood and hardwood fiber types, and between forest indus- try and other private ownerships. As softwood in- ventories increase and softwood prices fall, pulp- wood demand shifts from hardwoods to softwoods (relative to the mix in the base case). Lower softwood prices also act to increase softwood sawtimber pro- cessing capacity and the demand for softwood saw- timber. Higher softwood sawtimber processing, in turn, increases the amount of residues available for pulp. The net effect in the fiber products sector is a modest increase in U.S. consumption of softwood pulpwood and a small decline in hardwood use. In sawtimber, U.S. softwood harvest rises by about 8% by 2040, while hardwood harvest is essentially un- changed.
Lower softwood lumber prices reduce the price advantages of Canadian producers, imports fall, and domestic harvest replaces Canadian harvest. Prices for the base projection (table 36) stabilize after 2015, while prices in this alternative decline after 2015.
61
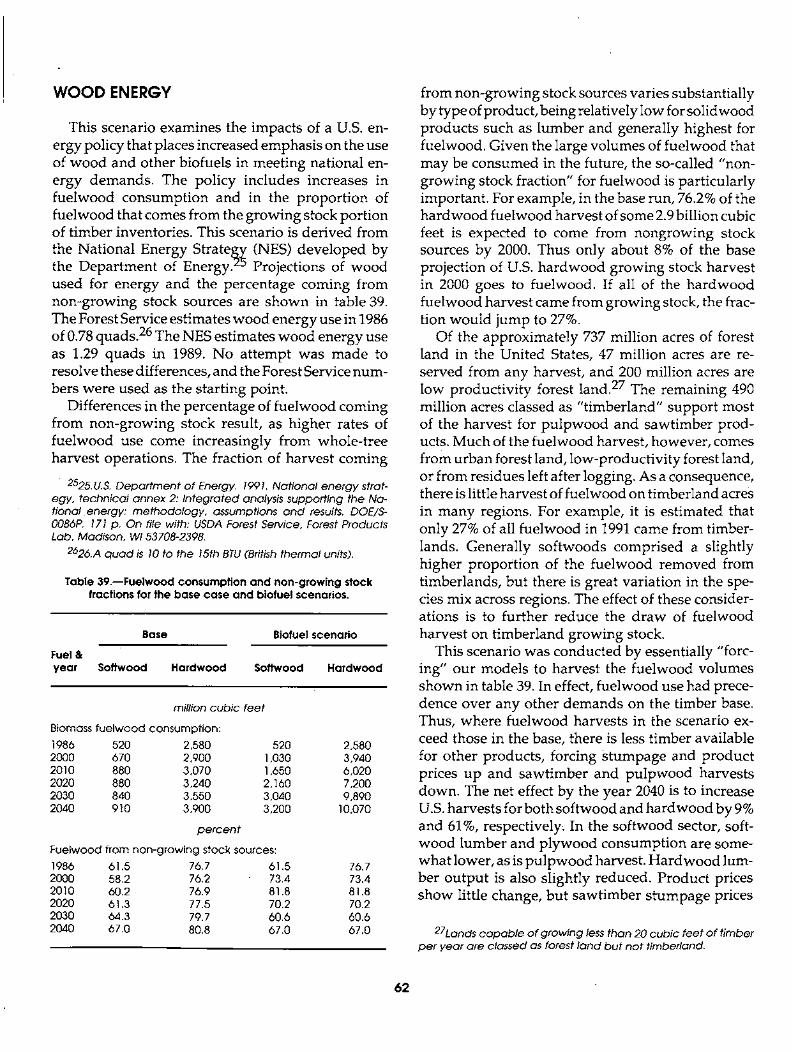
WOOD ENERGY
This scenario examines the impacts of a U.S. en- ergy policy that places increased emphasis on the use of wood and other biofuels in meeting national en- ergy demands . The policy includes increases in fuelwood consumption and in the proport ion of fuelwood that comes from the growing stock portion of timber inventories. This scenario is derived from the National Energy S t r a t e ~ (NES) developed by the Department of Energy. L~ Projections of wood used for energy and the percentage coming from non-growing stock sources are shown in table 39. The Forest Service estimates wood energy use in 1986 of 0.78 quads. 26 The NES estimates wood energy use as 1.29 quads in 1989. No at tempt was made to resolve these differences, and the Forest Service num- bers were used as the starting point.
Differences in the percentage of fuelwood coming from non-growing stock result, as higher rates of fuelwood use come increasingly from whole-tree harvest operations. The fraction of harvest coming
• 2525.U.8. Department of Energy. 1991. National energy strat- egy, technical annex 2: Integrated analysis supporting the Na- tional energy: methodology, assumptions and results. DOE/S- 0086P. 171 p. On file with: USDA Forest Service, Forest Products Lab, Madison, WI 53708-2398.
2626.A quad is 10 to the 15th BTU (British thermal units).
Table 39.--Fuelwood consumption and non-growing stock fractions for the base case and biofuel scenarios.
Base Biofuel scenario
Fuel & year Softwood Hardwood Softwood Hardwood
million cubic feet
Biomass fuelwood consumption:
1986 520 2,580 520 2,580 2000 670 2,900 1,030 3,940 2010 880 3,070 1,650 6,020 2020 880 3,240 2,160 7,200 2030 840 3,550 3,040 9,890 2040 910 3,900 3,200 10,070
percent
Fuelwood from non-growing stock sources:
1986 61.5 76.7 61.5 76.7 2000 58.2 76.2 73.4 73.4 2010 60.2 76.9 81.8 81.8 2020 61.3 77.5 70.2 70.2 2030 64.3 79.7 60.6 60.6 2040 67.0 80.8 67.0 67.0
from non-growing stock sources varies substantially by type of product, being relatively low for solidwood products such as lumber and generally highest for fuelwood. Given the large volumes of fuelwood that may be consumed in the future, the so-called "non- growing stock fraction" for fuelwood is particularly important. For example, in the base run, 76.2% of the ha rdwood fuelwood harvest of some 2.9 billion cubic feet is expected to come from nongrowing stock sources by 2000. Thus only about 8% of the base projection of U.S. ha rdwood growing stock harvest in 2000 goes to fuelwood. If all of the ha rdwood fuelwood harvest came from growing stock, the frac- tion would jump to 27%.
Of the approximately 737 million acres of forest land in the United States, 47 million acres are re- served from any harvest, and 200 million acres are low productivity forest land. 27 The remaining 490 million acres classed as "t imberland" support most of the harvest for pu lpwood and sawtimber prod- ucts. Much of the fuelwood harvest, however, comes from urban forest land, low-productivity forest land, or from residues left after logging. As a consequence, there is little harvest of fuelwood on timberland acres in many regions. For example, it is estimated that only 27% of all fuelwood in 1991 came from timber- lands. Generally softwoods comprised a slightly higher proportion of the fuelwood removed from timberlands, but there is great variation in the spe- cies mix across regions. The effect of these consider- ations is to further reduce the d raw of fuelwood harvest on t imberland growing stock.
This scenario was conducted by essentially "forc- ing" our models to harvest the fuelwood volumes shown in table 39. In effect, fuelwood use had prece- dence over any other demands on the timber base. Thus, where fuelwood harvests in the scenario ex- ceed those in the base, there is less timber available for other products, forcing Stumpage and product prices up and sawtimber and pulpwood harvests down. The net effect by the year 2040 is to increase U.S. harvests for both softwood and ha rdwood by 9% and 61%, respectively. In the softwood sector, soft- wood lumber and p lywood consumption are some- what lower, as is pu lpwood harvest. H a r d w o o d lum- ber output is also slightly reduced. Product prices show little change, but sawtimber s tumpage prices
27Lands capable of growing less than 20 cubic feet of timber per year are classed as forest land but not timberland.
62
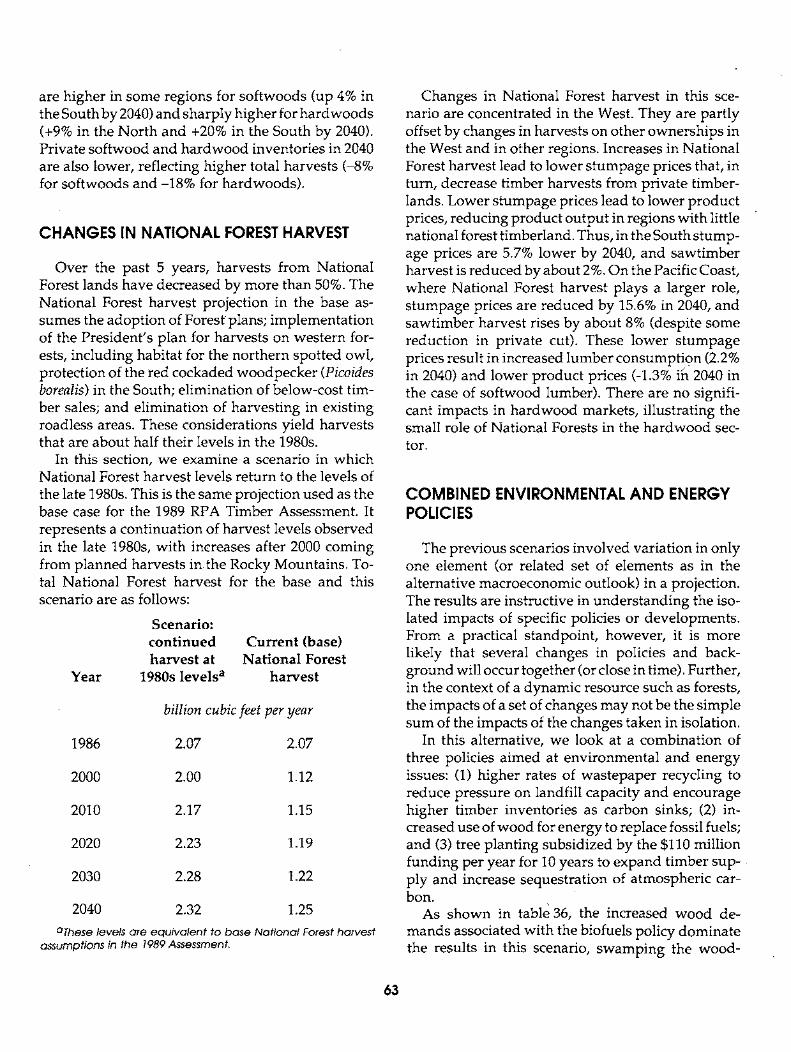
are higher in some regions for softwoods (up 4% in the South by 2040) and sharply higher for hardwoods (+9% in the North and +20% in the South by 2040). Private softwood and ha rdwood inventories in 2040 are also lower, reflecting higher total harvests (-8% for softwoods and -18% for hardwoods) .
CHANGES IN NATIONAL FOREST HARVEST
Over the past 5 years, harvests from National Forest lands have decreased by more than 50%. The National Forest harvest projection in the base as- sumes the adoption of Forest plans; implementat ion of the President 's plan for harvests on western for- ests, including habitat for the northern spotted owl, protection of the red cockaded woodpecker (Picoides borealis) in the South; elimination of below-cost tim- ber sales; and elimination of harvesting in existing roadless areas. These considerations yield harvests that are about half their levels in the 1980s.
In this section, we examine a scenario in which National Forest harvest levels return to the levels of the late 1980s. This is the same projection used as the base case for the 1989 RPA Timber Assessment. It represents a continuation of harvest levels observed in the late 1980s, with increases after 2000 coming from planned harvests in the Rocky Mountains. To- tal National Forest harvest for the base and this scenario are as follows:
Scenario: c o n t i n u e d Current (base) harvest at Nat iona l Forest
Year 1980s l eve l s a harvest
billion cubic feet per year
1986 2.07 2.07
2000 2.00 1.12
2010 2.17 1.15
2020 2.23 1.19
2030 2.28 1.22
2040 2.32 1.25
aThese levels are equivalent to base National Forest harvest assumptions in the 1989 Assessment.
Changes in National Forest harvest in this sce- nario are concentrated in the West. They are partly offset by changes in harvests on other ownerships in the West and in other regions. Increases in National Forest harvest lead to lower s tumpage prices that, in turn, decrease timber harvests from private timber- lands. Lower s tumpage prices lead to lower product prices, reducing product output in regions with little national forest timberland. Thus, in the South stump- age prices are 5.7% lower by 2040, and sawtimber harvest is reduced by about 2%. On the Pacific Coast, where National Forest harvest plays a larger role, s tumpage prices are reduced by 15.6% in 2040, and sawtimber harvest rises by about 8% (despite some reduction in private cut). These lower s tumpage prices result in increased lumber consumption (2.2% in 2040) and lower product prices (-1.3% ii~ 2040 in the case of softwood lumber). There are no signifi- cant impacts in hardwood markets, illustrating the small role of National Forests in the ha rdwood sec- tor.
COMBINED ENVIRONMENTAL AND ENERGY POLICIES
The previous scenarios involved variation in only one element (or related set of elements as in the alternative macroeconomic outlook) in a projection. The results are instructive in unders tanding the iso- lated impacts of specific policies or developments. From a practical standpoint, however, it is more likely that several changes in policies and back- ground will occur together (or close in time). Further, in the context of a dynamic resource such as forests, the impacts of a set of changes may not be the simple sum of the impacts of the changes taken in isolation.
In this alternative, we look at a combination of three policies a imed at environmental and energy issues: (1) higher rates of wastepaper recycling to reduce pressure on landfill capacity and encourage higher timber inventories as carbon sinks; (2) in- creased use of wood for energy to replace fossil fuels; and (3) tree planting subsidized by the $110 million funding per year for 10 years to expand timber sup- ply and increase sequestration of atmospheric car- bon.
As shown in table 36, the increased wood de- mands associated with the biofuels policy dominate the results in this scenario, swamping the wood-
63
saving effects of increased recycling and the inven- tory augmentation of higher planting rates. By 2040, increments in total U.S. harvest of softwoods and hardwoods, at 9% and 60%, respectively, are little different from the biofuels alternative. During the initial portion of the projection, private softwood inventories rise above the base, reflecting the addi- tional planting of 5.1 million acres to softwoods in the Southcentral region. By 2040, however, both soft- wood and hardwood inventories have been reduced below the base as cut continues to rise. Solidwood and pulpwood consumption are lower and stump- age prices are higher, because fuelwood use is as- sumed to take precedence in harvests.
REFERENCES
Adams, Darius M.; Jackson, Kristine C.; Haynes, Rich- ard W. 1988. Production, consumption, and prices of softwood products in North America: regional time series data, 1950-85. Resour. Bull. PNW-RB-151. Port- land, OR: U.S. Department of Agriculture, Forest Service, Pacific Northwest Research Station. 49 p.
Adams, Darius M.; Haynes, Richard W. 1980. The 1980 timber assessment market model: structure, projec- tions, and policy simulations. Forest Science 26(3): Monograph 22. 64 p.
Adams, Darius M.; Haynes, Richard W. 1989. A model of National Forest timber supply and stumpage markets in the western United States. Forest Science 35(2):401-424.
Alexander, Susan; Greber, Brian. 1991. Environmental ramification of materials used in construction and manufacturing in the United States. Gen. Tech. Rep. PNW-GTR-277. Portland, OR: U.S. Department of Agriculture, Forest Service, Pacific Northwest Re- search Station. 21 p.
Alig, Ralph J.; Adams, Darius M.; Haynes, Richard W. 1983. Long-range projection of forestland area change: New approaches are needed. Journal of Forestry 81:723-727.
Alig, Ralph J.; Murray, Brian; Hohenstein, William; Haight, Robert. 1990. Changes in area of timberland in the United States, 1952-2040, by ownership, cover type, region, and State. General Technical Report, SE-64. Asheville, NC: : U.S. Depa~-tment of Agricul- ture, Forest Service, Southeastern Forest Experiment Station. 34 p.
Apsey, M.; Reed, L. 1994. "World Softwood Timber Resources: A Discussion Paper." Canadian-Japan Business Conference, Kyoto, Japan, 15-18 May i994.
Bowyer, Jim L. 1992. Responsible environmentalism: the ethical features of forest harvest and wood use on a global scale. Forest Perspectives. 1(4):12-14
- Brooks, David J.; Haynes, Richard W. 1994. Timber products output and timber harvest in Alaska: pro- jections 1992-2010. Gen. Tech. Rep. PNW-GTR-334. Portland, OR: U.S. Department of Agriculture, For- est Service, Pacific Northwest Research Station. 32 p.
COuncil of Economic Advisors 1987. Economic Report of the President. February. Washington DC: U.S.
-..Gov. Print Off. 4i9 p. FEMAT. 1993. Forest ecosystem management: An eco-
"logical, economic, and social assessment. Report of the Forest Ecosystem Management Assessment Team, July 1993. USGPO 1993-793-071.
Flora, Donald F.; Vlosky, Richard P. 1986. Potential pacific rim demand of construction-grade softwood logs. Res. Pap. PNW-364. Portland, OR: U.S. Depart- ment of Agriculture, Forest Service, Pacific North- west Research Station. 29 p.
Government of British Columbia. 1994. Working in partnership, British Columbia's forest renewal plan. Queen's Printer, Victoria, BC. 3 p.
Greene, John L.; Siegel, William C. 1994. The status and impact of state and local regulation on private timber supply. Gen. Tech. Rep. RM-255. Fort Collins, CO. U.S. Department of Agriculture, Forest Service, Rocky Mountain Forest and Range Experiment Station. 22 p.
Haynes, Richard W. 1990. An analysis of the timber situation in the United States: 1989-2040. Gen. Tech. Rep. RM-199. Fort Collins, CO. U.S. Department of Agriculture, Forest Service, Rocky Mountain Forest and Range Experiment Station. 286 p.
Haynes, Richard W.; Adams, Darius M. 1985. Simula- tions of the effects of alternative assumptions on demand-supply determinants on the timber situa- tion in the United States. Washington, DC: : U.S. Department of Agriculture, Forest Service, Forest Resources Economics Research. 113 p.
Ince, P.J. 1994. Recyding and long-range timber outlook. Gen. Tech. Rep. RM-242. Fort Collins, CO. U.S. Depart- ment of Agriculture, Forest Service, Rocky Mount~tin Forest and Range Experiment Station. 23 p.
64
Ince, Peter J.; Roberts, Don G.; Jacques, Romain. 1992. North American pulp and paper model: Market trends, technological changes and impacts of acceler- ated paper recycling. Proceedings, Forest Sector, Trade and Environmental Impact Models, Theory and Applications. 1992, April 30- May 1; Seattle WA: Center for International Trade in Forest Products, University of Washington, College of Forest Re- sources. 33-38.
Kallio, Markku; Dykstra, Dennis P.; Binkley, Clark S. 1987. The global forest sector: An analytical perspec- tive. John Wiley & Sons, New York. 703 p.
Mills, John R.; Kincaid, Jonna C. 1992. The aggregate timberland assessment system--ATLAS: a compre- hensive timber projection model. Gen. Tech. Rep. PNW-GTR-281. Portland, OR: U.S. Department of Agriculture, Forest Service, Pacific Norttiwest Re- search Station. 160 p.
Moulton, Robert J.; Richards, Kenneth R. 1990. Costs o f sequestering carbon through tree planting and forest management in the United States. Gen. Tech. Rep. WO-58. Washington DC: U.S. Department of Agri- culture, Forest Service 47 p.
Nolley, Jean W. 1992. Bulletin of hardwood market statistics: Spring 1992. ResearchNote.NE-350 Radnor, PA: U.S. Department of Agriculture, Forest Service, Northeastern Forest Experiment Station. 43 p.
Perez-Garcia, J. 1993. Global forestry impacts of reduc- ing softwood supplies from North America. CINTRAFOR Working Paper 43. Seattle, WA: Uni- versity of Washington. 35 p. '
Powell, Douglas S.; Faulkner, Joanne L.; Darr, David R.; Zhu, Zhiliang; and MacCleery, Douglas W. 1993. Forest resources of the United States, 1992. Gen. Tech. Rep. RM- 234. Fort. Collins, CO. U.S. Department of Agriculture, Forest Service, Rocky Mountain Forest and Range Ex- periment Station. 132 P. [Revised 1994]
Runyon, K.L. 1991. Canada's timber supply: Current ~ status and outlook. Information Report E-X-45. For- estry Canada. Ottawa. 132 p.
Soil and Water Conservation Society. 1994. when Con- servati6n Reserve Program contracts expire: The policy options. Conference Proceedings, 1994 Feb. 10-11, Arlington, VA. Ankeny, Iowa. 143 p.
Spelter, Henry. 1984. Price elasticities for softwood plywood and structural particleboard in the United States. Can.-J. For. Res. 14:528-535
Spelter, Henry. 1985. A product diffusion approach to modeling softwood lumber demand. Forest Sci. 31(3):685-700
Ulrich, Alice H. 1989. U.S. timber production, trade, consumption, ahd price statistics, 1950-1987. Misc. Pub. No. 1471. Washington, DC: U.S. Department of Agriculture, Forest Service.
USDC, BEA. 1994. Integrated Economic and Environ- mental Satellite Accounts. Survey of Current Busi- ness. 74(4):1-16.
USDA Forest Service. 1982. An analysis of the timber situation in the United States, 1952-2030. Forest Re- source Report No. 23. Washington, DC. 499 p.
USDA Forest Service. 1988. The South's fourth forest: Alternatives for the future. Forest Resource Report No. 24. Washington, D.C. 512 p.
USDA Forest Service. 1989. Land base analysis for the 1989 RPA Assessment. RM - 181. Fort Collins, CO. 76 p.
Waddell, Karen L.; Oswald, Daniel D.; Powell, Douglas S. 1989. Forest Statistic of the United States, 1987. Resour. Bull. PNW-RB-168. Portland OR: U.S. De- partment of Agriculture, ForestService, Pacific North- west Station. 106 p.
Warren, Debra D. 1992. Production, prices, employ- ment, and trade in Northwest forest industries, fourth quarter 1991. Resour. Bull. PNW-RB-192. Portland OR: U.S. Department of Agriculture, Forest Service, Pacific Northwest Station. 112 p.
REFERENCES CITEDmUNPUBLISHED
Binkley, Clark S; Cardellichio, Peter A. 1986. The Hard- wood Assessment Market Model: working papers. Report under Cooperative agreement number PNW- 81-137 to the USDA Forest Service, PaCific Northwest Research Station, Portland, OR.
Mills, John R. 1988. Inventory, growth, and manage- ment assumptions for the 1989 RPA Timber Assess- ment; Part I-The South and Part II-The North and West, Reports on file at the USDA Forest Service, Pacific Northwest Research Station, Portland, OR.
Mills, John. R. 1993. Inventory, growth, and manage- ment assumptions for the 1993 RPA-Timber Assess-
ment. Report on file at the USDA Forest Service, Pacific Northwest Research Station, Portland, OR.
WEFA. 1991. U.S. Long-Term Economic Outlook. Vol. 1 Trend \ Moderate Growth Scenario. Wharton Econo- metric Forecasting Associates, Bala Cynwyd, PA. [not paged]. Copy on file with USDA Forest Service, Washington, DC.
65
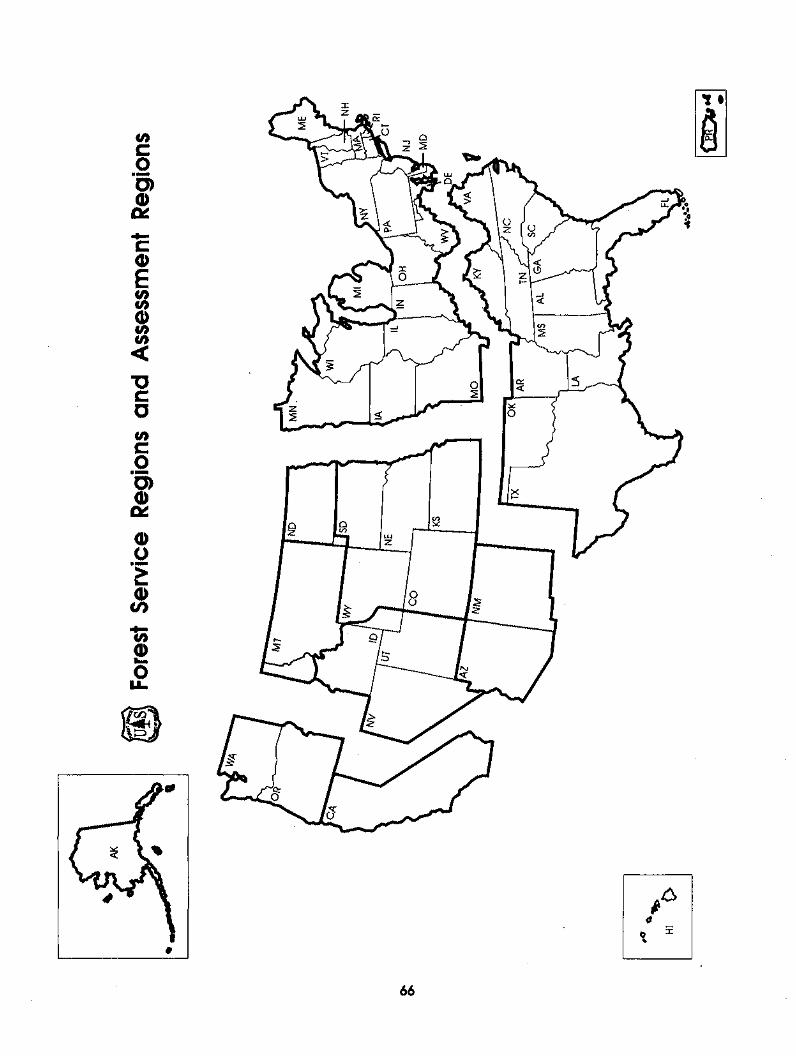
o=~~
~ ~
Fore
st Se
rvic
e Reg
ions
and
Asse
ssm
ent R
egio
ns
#.,1~
HI
C~
NE
KS
IA
3E
Mo
~"
~ fw
'h It
N
C
TN
~1
CT
NJ MD
• "-31
-- N
H
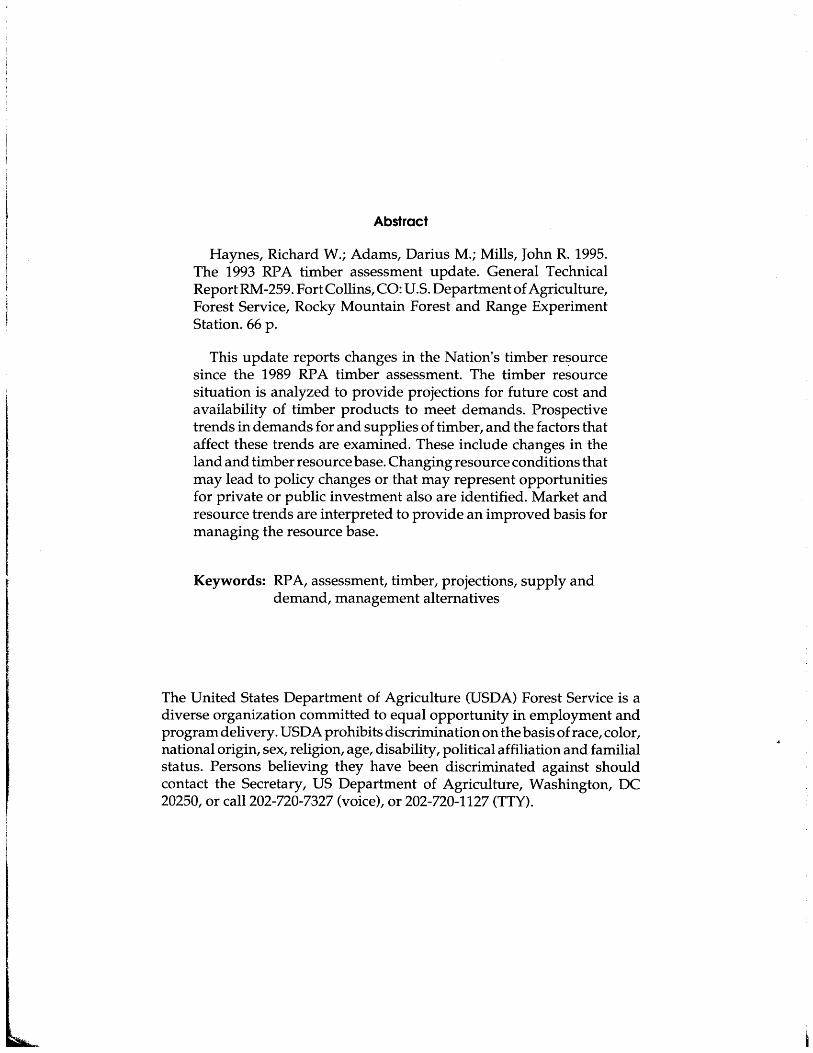
Abstract
Haynes, Richard W.; Adams, Darius M.; Mills, John R. 1995. The 1993 RP A timber assessment update. General Technical Report RM -259. Fort Collins, CO: U.5. Department of Agriculture, Forest Service, Rocky Mountain Forest and Range Experiment Station. 66 p.
This update reports changes in the Nation's timber re~ource since the 1989 RP A timber assessment. The timber resource situation is analyzed to provide projections for future cost and availability of timber products to meet demands. Prospective trends in demands for and supplies of timber, and the factors that affect these trends are examined. These include changes in the land and timber resource base. Changing resource conditions that may lead to policy changes or that may represent opportunities for private or public investment also are identified. Market and resource trends are interpreted to provide an improved basis for managing the resource base.
Keywords: RPA, assessment, timber, projections, supply and demand, management alternatives
The United States Department of Agriculture (USDA) Forest Service is a diverse organization committed to equal opportunity in employment and program delivery. USDA prohibits discrimination on the basis of race, color, national origin, sex, religion, age, disability, political affiliation and familial status. Persons believing they have been discriminated against should contact the Secretary, US Department of Agriculture, Washington, DC 20250, or call 202-720-7327 (voice), or 202-720-1127 (TTY).