Embed Size (px)
Citation preview

The 1903 and 1993 Floods in Kansas The Effects of Changing Times and Technology Lanna J. Combs and Charles A. Perry
One hundred years ago this Memorial Day, the Kansas River overflowed its banks, flooding North Topeka with up to 12 feet of water in some places. Twenty- four people were drowned. Ninety years and almost 2 months later on July 25, 1993,floodwaters again threatened the city, but time and technology had changed the effects of too much water. Floodwaters in 1993 were contained within protective levees and by regulated outflow from several Federal reservoirs located upstream. No lives were lost in Kansas, and property damage was much less than it otherwise would have been.
1903 Flood
"Memorial Day, 1903, will be long remembered in Topeka. On that day the homes of 8,000people, nearly all residents of North Topeka, were desolate and the muddy waters of the Kansas River flowed in their dooryards and stood in their parlors" L.L. Kiene, in Strickrott (1903)
The historic flood of 1903 affected the Missouri, Kansas, and lower Republican River Basins as far west as Ellsworth, Kansas (fig. 1). Flooding along the Kansas River in May 1903 was the largest since the Kansas "Big Water" of 1844 (Juracek and others, 2001). In terms of lives lost and property damage, however, the 1903 flood was vastly more destructive than the 1844 flood as a result of westward expansion, population growth, and land development along the river (Murphy, 1904).
The Storm
Rainfall was above normal during the first half of May 1903 in northeast and north-central Kansas. As a result, soils in the Kansas and lower-Republican River Basins were already saturated when the
NEBRASKA Black Vet-million River96°
25 50 75 1 DO KILOMETERS
EXPLANATION 6 Line of equal total precipitation for May 1903 Interval 2 A U.S. Geological Survey streamflow-gaging station-
Stations from figure 3 and table 1 are shown in red.and 5 inches Drainage basin boundary
Drainage basin06 Missouri River Basin07 Lower Mississippi River Basin
Numbers on map are shown without basin prefix (06, 07)
Figure 1. Lines of equal total precipitation for May 1903 and location of U.S. Geological Survey streamflow-gaging stations in operation during flooding (lines of equal precipitation from Murphy, 1904).
North Topeka during height of 1903 flood (photograph courtesy of the Kansas State Historical Society, Topeka).
excessive rains began in late May. In much of northeast and north-central Kansas, it rained daily between May 16 and 31. Salina had more than 17 inches of rain during the month, and most of northeast and north-central Kansas had more than 10 inches of rain (fig. 1). The lack of surface storage in the river basins and already saturated soils made the flood of 1903 of exceptional magnitude (Murphy, 1904).
The Result
On May 27, 1903, the Topeka Capital reported
"...200 homeless in Salina, Kans. ..."
On May 28, the same paper reported streams in Iowa, Missouri, Nebraska, and Oklahoma out of their banks. On May 29, the Topeka Capital reported
"...the worst flood situation that has ever confronted Kansas for many years; bridges and tracks under water; many families driven from their homes; thousands of acres of corn ruined..."
On Sunday, May 31, 1903, the flood on the Kansas River reached its maximum height. The maximum daily gage height of the U.S. Geological Survey (USGS) Lecompton gage (station 06891000) for this date was 27.9 feet (streamflow of 320,000 cubic feet per second, table 1),
U.S. Department of the Interior U.S. Geological Survey
USGS Fact Sheet 019-03 March 2003
Lawrence residents awaiting rescue on tiny piece of "high ground," May 1903 (photograph courtesy of the Kansas State Historical Society, Topeka).
which was 6.4 feet higher than the highest reading during the previous 22 years of record.
The Missouri River gage at Kansas City (station 06893000) recorded its highest reading during the 1903 flood, nearly 35 feet, on June 2, which was only 2 feet below the highest mark of the great flood of June 20, 1844 (Murphy, 1904). The Kansas City Times on June 1 described the condition of Kansas City as follows:
"Kansas City passed yesterday the most disastrous day in its history; and to-day an emergency confronts its people greater than they have ever known before.... All Saturday night and all yesterday the torrents swept down the Missouri and Kansas until the valleys of the Kansas and Missouri were a solid mass of raging water from bluff to bluff. On the Union Depot platform there were 6 feet in depth of water, and all over the west bottoms... there was an equal or greater depth. Several lives it is known have been lost, and many more it is feared have perished."
For a period of 11 days (May 28 through June 7), the Kansas River was higher than it had been in the previous 22 years of record. Hundreds of homes were swept away by floodwaters and property damage was great totaling $22 million in Kansas and Kansas City, Missouri (Murphy, 1904). Twenty-four people lost their lives in North Topeka alone (Strickrott, 1903). Of the 16 bridges spanning the Kansas River from the Armourdale District in Kansas City, Kansas, to its joining with the Missouri River (a distance of 4 miles), all except one were in part or wholly destroyed. One of the bridges carried a 36-inch water pipe that supplied Kansas City, Missouri, and a part of Kansas City, Kansas. As a result of the pipe loss, the whole city was without water for 12 days, and electric and gas companies, and street railways were
forced to shut down (Murphy, 1904). In Lawrence, the north span of the Massachusetts Street Bridge over the Kansas River was swept off its piers by a house that was being carried along by the raging torrent. Had it not been for the forethought of authorities in uncoupling this bridge span from the others, the entire bridge might have been lost.
Bowersock Mill was swept away, and during the day on May 30, 50 houses were counted as they were swept over the mill dam (Lawrence Daily Journal, June 1, 1903).
1993 Flood
The historic flood of 1993 affected more than just Kansas and spanned nearly 2 months from mid-June to early August. The area of significant flooding extended into much of the upper Mississippi River Basin and included parts of southern Minnesota, southwestern Wisconsin, Iowa, western Illinois, northern Missouri, southern North Dakota, and eastern parts of South Dakota, Nebraska, and Kansas (Parrett and others, 1993). Fifty deaths occurred, and damages approached $15 billion in the nine-State area
(National Oceanic and Atmospheric Administration, 1993, p. i).
"The severity, wide spread nature and length of time of this flood event made it the greatest flood ever to hit the United States..." (National Oceanic and Atmospheric Administration, 1993, p. 1 1).
The Storm
The magnitude and timing of several rainstorms in mid-June and July 1993, combined with wet antecedent conditions, were the principal causes of the severe flooding in the upper Mississippi River Basin in 1993 (Parrett and others, 1993). In Kansas, January-July monthly precipitation totals ranged from 64 percent (April) to 535 percent (July) of normal (1961-90) for the National Weather Service station at Manhattan (Wahl and others, 1993). From July 22 to 24, 2 to 13 inches of rain fell in parts of Kansas and Nebraska contributing large flows to already filled reservoirs in the Kansas River Basin. Lines of equal total precipitation in Kansas for July 1993 are shown in figure 2.
The Result
Moderate to major flooding occurred in a large part of the Kansas River Basin during July 1993. The Kansas, Big Blue, Black Vermillion, Smoky Hill, Solomon, Saline, and Republican Rivers, along with
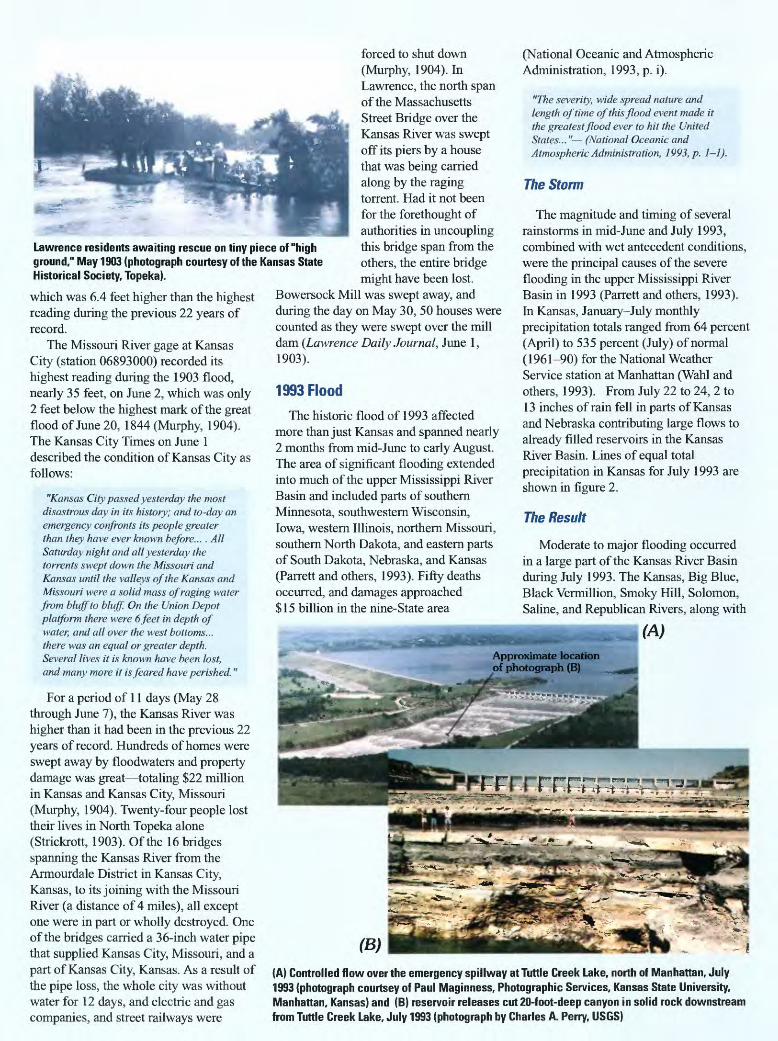
(A)Approximate location of photograph (B)
(B)
(A) Controlled flow over the emergency spillway at Turtle Creek Lake, north of Manhattan, July 1993 (photograph courtsey of Paul Maginness, Photographic Services, Kansas State University, Manhattan, Kansas) and (B) reservoir releases cut 20-foot-deep canyon in solid rock downstream from Turtle Creek Lake, July 1993 (photograph by Charles A. Perry, USGS)

their tributaries, produced flooding of agricultural fields, numerous secondary roads, and many county, State, and Federal highways (National Oceanic and Atmospheric Administration, 1993, p. 2-76). Eighteen of the 163 USGS streamflow-gaging stations in operation during 1993 measured record maximum daily peak flows, and 68 stations measured mean annual streamflows for the 1993 water year (October 1, 1992, through September 30, 1993) that exceeded the greatest mean annual Streamflow for their periods of record, which ranged from 6 to 78 years in length (Geiger and others, 1994).
Tuttle Creek andMilford reservoirs can't contain all the water... "This lake [Tuttle Creek] is usually 16 miles long. Right now, we're 50 miles long. We usually cover 13.350 acres of ground. Right now we cover 54,000 acres. We're shooting 150,000 gallons of water each second through our release valves, and we're still getting in more water than we're getting rid of." Paul Weidhaas, Tuttle Creek Lake park ranger, The Kansas City Star, July 21, 1993
In the Kansas City metropolitan area, the Missouri and Kansas Rivers reached their highest flows almost simultaneously on July 27, 1993. Excessive rainfall upstream, saturated soil conditions, and high river stages combined to create a flood of historic magnitude on the Missouri River. Without the reservoirs in the Missouri and Kansas River Basins, the maximum daily peak flow at the USGS gaging station on the Missouri River at Kansas City, Missouri (station 06893000), could have been as high as 713,000 cubic feet per second, overtopping the Federal levee system (Perry, 1994). With the reservoirs, Streamflow was contained within the levees. Observed flows on July 27 were less than 2 feet from the top of the Federal levees (Perry and others, 1997), and despite upstream regulation of flows, the Missouri River at Kansas City, Missouri, gaging station was above flood stage (32 feet) from July 6 through August 6 (National Oceanic and Atmospheric Administration, 1993). No lives were lost in Kansas as a result of the flooding.
Comparison of Major Kansas River Floods
The results of the historic flood of 1993 were different from those of the
Table 1. Comparison of maximum daily peak streamflows for floods of 1903, 1951, and 1993 at selected U.S. Geological Survey streamflow-gaging stations[Source of data: U.S. Geological Survey National Water Information System peak-flow file for Kansas, available on the World Wide Web at URL http://ks.waterdata.usgs.gov/nwis. frVs, cubic feet per second]
U.S. Geological Survey
streamflow- gaging station
number(figs. 1 and 3}
06856000
06856600
06864500
06866500
06876900
06877600
06887000
06887500
06889000
06891000
06892350
06893000
Station name
Republican River at ConcordiaRepublican River at Clay CenterSmoky Hill River at EllsworthSmoky Hill River at MentorSolomon River at NilesSmoky Hill River at EnterpriseBig Blue River near ManhattanKansas River atWamegoKansas River atTopekaKansas River at LecomptonKansas River at DeSoto4Missouri River at Kansas City, Missouri
Maximum daily peak Streamflow (frVs)
1903
2-341,000(May29)2-384,000(May29}
18,000 (May 29}332,000 (May 29}30,000 (June 3)
390,000 (May)393,800{May31)280,000 (May 30)300,000 (May 30)320,000 (May 31)
3337,000(June1)548,000 (June 2)
1951
33,600 (July 13}51,000 (July 12}
1 30,000(May23|] 20,000 (July 13)178,000 (July 14)
'233,000 (July 14)393,400 (July 12)
1 400,000(July13)1 469,000(July13)'483,000 (July 13)'510,000 (July 13)'573,000 (July 14)
1993
'37,700 (July 22)'46,000 (July 24)130,300(July23)'13,100 (June 24)'17,900 (July 22)'47,600 (July 22}'58,800 (July 23)
'199,000 (July 26)'170,000 (July 25)'190,000 (July 27)'170,000 (July 27)'541,000 (July 27)
Long-term annual mean Streamflow(ftVs) (period of
record)
657(1946-2001)978(1918-2001)241 (1896-2001)399(1925-2001)576(1898-2001)
1,627(1935-2001)2,499(1963-2001}5,248(1920-2001}5,903(1918-2001)7,437(1937-2001)7,528(1918-2001)
57,030(1958-2000)
1 Streamflow is affected by regulation or diversion. 2 Streamflow is an estimate. 3 Streamflow is an historic peak. 4 Prior to October 1973 published as "at Bonner Springs" (station 06892500 in figure 1}.
1903 flood in many respects. Time, technology, and population growth all contributed to these differences. Figure 3 compares maximum daily peak flows for 1903, 1951, and 1993 at 12 USGS streamflow-gaging stations. Along the Kansas River, the highest flows were recorded during the 1951 flood, followed respectively by the 1903 and 1993 floods (fig. 4). If the flood-control reservoirs in the Kansas River Basin had not been in place during 1993, the resulting flood flows would have been greater but still not as great as the floods of 1903 or 1951 (Perry, 1994).
For comparison, flood-peak flows can be referenced to a specific recurrence
interval or likelihood of occurrence. The recurrence interval is the average number of years between occurrences of the annual peak flow that equal or exceed a specified Streamflow. For example, a Streamflow that has a 100-year recurrence interval is so large that an equal or greater annual peak flow is expected, on average, only once in any 100-year period. Streamflows during the 1903 flood in the Republican and Kansas River Basins had greater than 50-year recurrence intervals, with flows greater than any flood since 1844 (Clement, 1991). Streamflows during the 1951 flood in the Solomon, Kansas, Marais des Cygnes, and Neosho River Basins had recurrence intervals that
NEBRASKA
50 75
25 75 100 KILOMETERS
OKLAHOMA
EXPLANATION 8 Line of equal total precipitation for July 1993 Interval A U.S. Geological Survey streamflow-gaging statioi
100 MILES
4 inches Drainage basin boundary
Drainage basin06 Missouri River Basin07 Lower Mississippi River Basin
Stations from figure 3 and table 1 are shown in red. Numbers on map are shown without basin prefix (06, 07)
Figure 2. Lines of equal total precipitation for July 1993 and location of U.S. Geological Survey streamflow-gaging stations in operation during flooding (lines of equal precipitation from National Oceanic and Atmospheric Administration, 1993).

ranged from 25 to greater than 100 years (Clement, 1991). Streamflows during the 1993 flood in the Kansas River Basin had 10- to 100-year recurrence intervals (Parrett and others, 1993).
Real-Time Streamflow Information During Flooding
Currently (2003), the USGS maintains more than 7,000 streamflow-gaging stations nationwide in cooperation with various local, State, and Federal agencies. Real-time streamflow data from the USGS are used by the National Weather Service's River Forecast Centers to determine flood stages for various streams and to help forecast when and where streams will crest during floods. The U.S. Army Corps of Engineers uses real-time streamflow data to schedule reservoir releases that are designed to lessen the amount of potential damage from overflowing streams and to prevent water from backing up into smaller tributaries when the main stem is already bankfull. USGS streamflow data are also used to design bridges, highways, and culverts that will convey sufficient streamflow so that transportation infrastructures remain above water during flooding. The Federal Emergency Management Agency uses USGS streamflow data to develop flood- insurance rate maps and to address emergency-response needs before, during, and after flooding.
The USGS streamflow-gaging-station network in Kansas has grown from 38 stations in 1903 to 163 stations in 1993 to 177 stations in 2003. Information from these stations is available on the World Wide Web at:
http://ks. water.usgs.gov/nwis/
current/?type=flow
References
References in bold are available on the World Wide Web at:
http://ks.water.usgs.gov/
Clement, R.W., 1991, Kansas floods and droughts, in Paulson, R.W., Chase, E.B., Roberts, R.S., and Moody, D.W., compilers, National water summary 1988-89 hydrologic events and floods and droughts: U.S. Geological Survey Water-Supply Paper 2375, p. 287-294.
Geiger, C.O., Lacock, D.L., Schneider, D.R., Carlson, M.D., and Dague, B.J., 1994, Water resources data, Kansas, water year 1993: U.S. Geological Survey Water-Data Report KS-93-1,497 p.
Juracek, K.E., Perry, C.A., and Putnam, J.E., 2001, The 1951 floods in Kansas revisited: U.S. Geological Survey Fact Sheet 041^01, 6 p.
Murphy, E.G., 1904, Kansas floods and hydrologic data, in Destructive floods in the United States in 1903: U.S. Geological Survey Water-Supply Paper 96. p. 21-81.
imum daily peak flow, in cubic feet per second
-* ro GO & en a3 O O O O C = 0 0 0 0 C 3 O O O O C 3 O O O O C
3 O O O O C
i
0
i i i i i i i i i 1 1 on^ « Sl l ivuo g §
C=]1951 3 2
CZ11992CM
1 iCM in,
Long-term annual ^. iA "~"
and period of record o -1
-
-^ o -I CM O 1o ofcN STTC^ W
5 n" a .
mTirCO CO CO CZ
g§ gl.2 to .> mCC 00 CC CO
co co a
\ * ^ s\ * - °\ ^ n « ̂ ^^ O so *^ ^ f^* as
! i "ji__ S* c^ 5. 00 cl £i
5 °^ ^) ^ 1
iH::Pl i ^:Hir ni
2M
in.
l
r»
l l
0 0
en>H
1^.3r^
^ C3 j_o i^a ^CD ojco i»o i_o
cc oo cc oo cc oo cc oo goo cc oo cc oo
It IS 2<» I. ^ro §) "^
1
rHa\I-H
00 CMmt
l
§
(57,030, 1958-2C
i- ° fc_ in Qj CD Q) CO
.S S .> cn cc oo re oo
£ <= !2 oCO Q CO 4-1
l
-
uri River at ty,Missouri (893000)
Figure 3. Comparison of maximum daily annual peak flows for 1903, 1951, and 1993 at selected U.S. Geological Survey streamflow-gaging stations. Location of stations shown in figures 1 and 2.
500,000
450.000
400,000
350,000
t; 300,000
250,000
>- 200,000
150,000
100,000
50,000
1951
,1903
Long-term annual mean, 5,903 ft3/s (1918-2001) 1993
AAA
CNJLnOLDCOLDCOLn O Lf3 O Lf3 O Lf3 O Lf3 CD CD r^r^ OOOO C73O}cncncncnoioi
Figure 4. Annual peak flows for Kansas River at Topeka (station 06889000, fig. 1) and long-term annual mean streamflow, 1918-2001.
National Oceanic and Atmospheric Administration, 1993, The great Midwest flood of '93: Kansas City, Missouri, Natural Disaster Survey Report, various pagination.
Parrett, Charles, Melcher, N.B., and James, R.W., Jr., 1993, Flood discharges in the upper Mississippi River Basin, 1993: U.S. Geological Survey Circular 1120-A, 14 p.
Perry, C.A., 1994, Effects of reservoirs on flood discharges in the Kansas and Missouri River Basins, 1993: U.S. Geological Survey Circular 1120-E, 20 p.
Perry, C.A., Clement, R.W., and Studley, S.E., 1997, Delineation of flooding within the upper Mississippi River Basin flood of July 10 and 27, 1993, in Kansas City, Missouri, and Kansas City, Kansas, and vicinity: U.S. Geological Survey Hydrologic Investigations Atlas HA735-E, 3 sheets, scale 1:24,000.
Strickrott, John, 1903, Strickrott's photographic souvenir of the flood, Topeka, Kansas. A.D. 1903. with a brief Story of the flood by L.L. Kiene: Topeka, Kansas, 53 p.
Wahl, K.L., Vining, K.C., and Wiche, G.J., 1993,Precipitation in the upper Mississippi River Basin, January 1 through July 31, 1993: U.S. Geological Survey Circular 1120-B, 13 p.
For more information on the water in Kansas, visit the USGS Web site at:
http://ks.water.usgs.gov/or contact:
District ChiefU.S. Geological Survey4821 Quail Crest Place
Lawrence, Kansas 66049-3839(785) 842-9909
E-mail: [email protected]
Design and layout by Michael Kemppainen
Printed on recycled paper