Embed Size (px)
Citation preview
15th Annual Conference Proceedings–A System of Care for Children’s Mental Health: Expanding the Research Base–285
Cultural
Competence
Chapter Five
286 – Research and Training Center for Children’s Mental Health –Tampa, FL – 2003
Chapter Five — Cultural Competence
15th Annual Conference Proceedings – A System of Care for Children’s Mental Health: Expanding the Research Base – 287
Tamara S. Davis
Beth Ann Rodriguez
Frances Barraza
Toni K. Johnson
Cultural Competence Assessmentin Systems of Care:A Concept Mapping Alternative
Introduction
At a time when the populace of this country increasingly reflect avery diverse world, human service organizations strive to developculturally competent services, programs, and employees. Census data indicate that the growingpopulation of children and adolescents in this country is extremely diverse. It is estimated that by theyear 2005, 40% of the population of children and adolescents in this country will be of color(“Embracing the Dynamics of Difference,” 1997). Historically, mental health services have noteffectively addressed the needs of children of color and their families (Hernandez & Isaacs, 1998;Knitzer, 1982). However, by including cultural competence as a key philosophical value, systems ofcare for children with serious emotional disturbance and their families are bringing this value to theforefront of service delivery systems (Stroul & Friedman, 1986).
A framework for developing effective, culturally competent services for emotionally disturbedminority children was provided by Cross, Bazron, Dennis and Issacs (1989). With few methodsavailable for measuring the development of cultural assessment in systems of care, monitoring thisprocess is a challenging yet critical component of evaluation. For example, the Cultural CompetenceSelf-Assessment Questionnaire (CCSAQ; Mason, 1995), offers a scaling tool for organizations toassess the competence of their direct service workers and administrative staff with people of color onfive sub-scales. Another instrument, the System of Care Practice Review (SOCPR; Hernandez,Gomez & Worthington, 2001), offers a case study approach for assessing culturally competentpractice within organizational and familial cultural contexts along four sub-domains. While thesemethods provide valuable options, the CCSAQ does not gather input from family members andfocuses primarily on people of color; and the lengthy data gathering process of the SOCPR limits itsuse by communities.
This study was developed to allow participants in the local system of care to offer views of culturalcompetence from their individual perspectives and determine which aspects of cultural competenceare most critical for them. The assessment process used in this study was guided by systems of carevalues and offers a mixed-method approach for assessing cultural competence from multipleperspectives in a relatively short period of time. Preliminary findings from this study suggest that themethodology used offers a unique alternative for systems of care to define, assess, and track culturalcompetence within an individual community’s context.
A specialized team was assembled for the specific purpose of conducting a cultural competenceassessment of the systems of care efforts in Texas. These preliminary results focus on an assessmentconducted in a Center for Mental Health Services (CMHS), Substance Abuse Mental Health ServicesAdministration (SAMHSA) grant site. The core team consists of a research associate, a familyevaluator, and two contracted facilitators. This culturally diverse team, reflecting the various culturesof Texas communities, and a committee of representatives from systems of care communities in Texas,participated in planning the assessment. The purpose of the evaluation was twofold: (1) to providecommunities with a baseline assessment and process for monitoring their development of culturalcompetence, and (2) to provide individual communities with information necessary for developingtechnical assistance and training plans to address issues related to cultural competence.
288 – Research and Training Center for Children’s Mental Health – Tampa, FL – 2003
Davis, Rodriguez, Barraza & Johnson
Method
Sample. The sample for this study included caregivers, youth, staff of various levels (direct service,administration, board members), and providers. Responses from 19 people are included in thesepreliminary data, with 11 participants represented in the sorting and rating results.
Methodology. The methodology chosen for the study was Concept Mapping as developed byConcept Systems, Inc. (Trochim, 1989). This methodology uses a participatory approach to conduct amixed-method evaluation. An additional strength of the methodology is its ability to use theinformation gathered from participants to create clear and concise graphic pictures and numericalresults, providing immediate feedback to the community. The Concept Systems software usesmultivariate statistical techniques, including multidimensional scaling and hierarchical cluster analysis,to provide pictorial representations of relationships and relevance of the data generated. The graphicmaps depict how participants’ ideas group together and how they place value on these conceptualgroups. Comparisons can be made between two groups, producing a correlation coefficient indicatingthe strength of that relationship. Maps were produced for the community indicating how participantsview the relationships among the data elements and which elements indicate the most substantivesignificance.
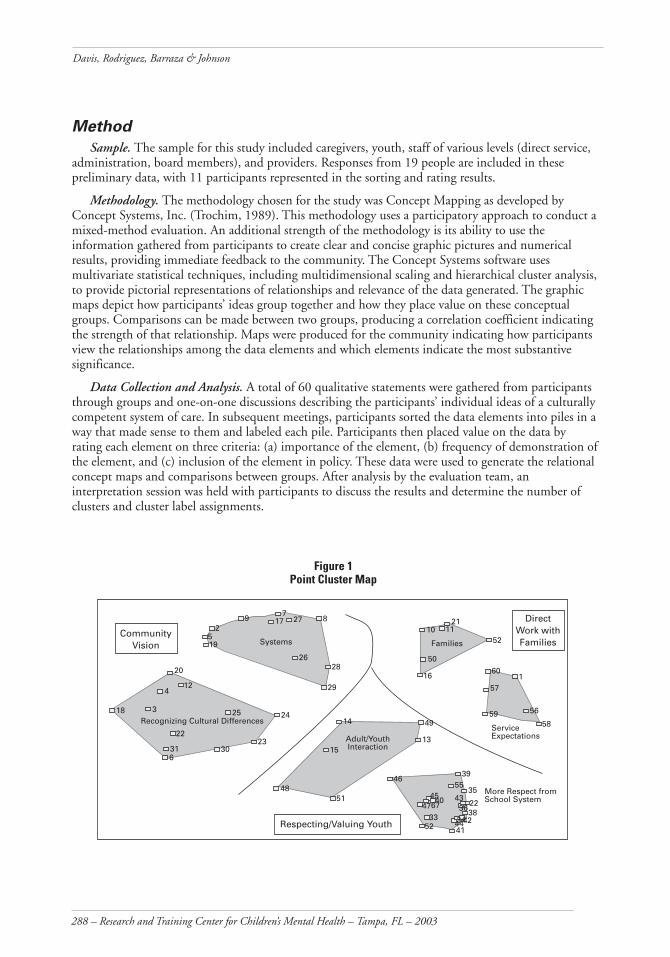
Data Collection and Analysis. A total of 60 qualitative statements were gathered from participantsthrough groups and one-on-one discussions describing the participants’ individual ideas of a culturallycompetent system of care. In subsequent meetings, participants sorted the data elements into piles in away that made sense to them and labeled each pile. Participants then placed value on the data byrating each element on three criteria: (a) importance of the element, (b) frequency of demonstration ofthe element, and (c) inclusion of the element in policy. These data were used to generate the relationalconcept maps and comparisons between groups. After analysis by the evaluation team, aninterpretation session was held with participants to discuss the results and determine the number ofclusters and cluster label assignments.
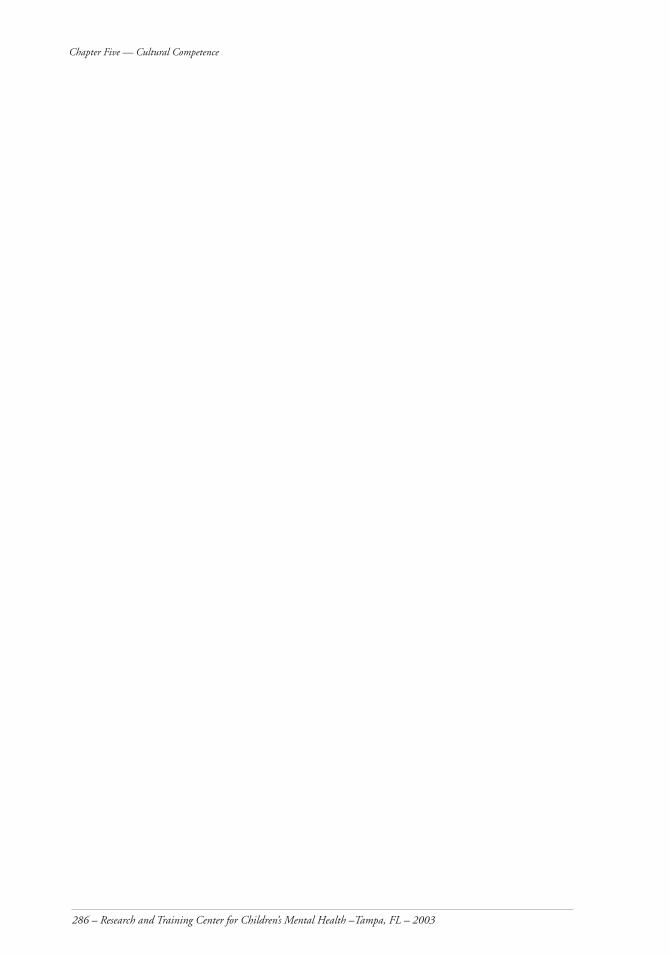
Figure 1 Point Cluster Map
26
195
29
717 27 8
28
29
SystemsCommunity
Vision
20
412
18 3
22
316
30
25 24
23
Recognizing Cultural Differences
10 1121
52
50
16
Families
601
57
59 56
58Service Expectations
14 49
1315
4851
Adult/Youth Interaction
4639
5535
4547
4067
3352 41
4322
3638444234
More Respect from School System
Respecting/Valuing Youth
Direct Work withFamilies
15th Annual Conference Proceedings – A System of Care for Children’s Mental Health: Expanding the Research Base – 289
Cultural Competence Assessment: A Concept Mapping Alternative
Preliminary Results
Concept Mapping offered a helpful method for conceptualizing cultural competence in the localsystem of care community. Concrete examples of cultural competence were generated along withnumerical comparisons of participant group priorities. Figure 1 illustrates the 6-cluster map solutionchosen by participants to depict the data gathered. Points on the map represent each of the examplesgenerated. The distance between the points indicates their relationship to one another. Points placedcloser together are more similar in conceptual meaning. The farther away the points are from eachother, the less similar they are in meaning. The names of each of the clusters provide a brief indicationof the area of cultural competence described by the clustered qualitative statements. For example, thecluster “Families” describes the focus of qualitative statements 10, 11, 16, 21, 50, and 52. The clusterswere categorized into three distinct groupings: (a) community vision, (b) direct work with families,and (c) respecting/valuing youth. Statements assigned to each of the clusters offer concrete examples ofwhat a culturally competent system of care would look like as described by participants.
Ratings of participants indicate very high levels of importance (4.55-4.81 on a 1-5 Likert-typescale) and lower levels of frequency of demonstration (2.33-3.24 on a 1-5 scale) of the examples in theclusters. On importance, statements in the Families and Service Expectations clusters were rated thehighest, and statements in the Systems cluster were rated the lowest. On frequency of demonstrationratings Service Expectations and Adult/Youth Interaction were rated the highest, and Systems andRecognizing Cultural Differences were rated the lowest.
A moderate correlation was found between patterns of importance and frequency of demonstration(r = .66), indicating a modest baseline for tracking progress. There were, however, differences betweensome of the participant groupings in how they rated importance and demonstration of the examples.For example, the People of Color and White/European groups were not in agreement on the rankingof cluster importance (r = .01), but these groups strongly correlated in rankings of demonstration (r =.89). The Family and Staff groups demonstrated moderate agreement on importance (r = .60) and ondemonstration (r = .62).
Finally, participants rated how often the examples of cultural competence are included in agencies’written policies. There were no group comparisons on the policy ratings since the results are based oninput from only nine participants. A total of 41% of all the ratings indicated no participant knowledgeof policies related to the examples. Overall, statement ratings indicated fairly low averages of inclusionin policies. Service Expectations and Families clusters were rated as most often included in policies,and Recognizing Cultural Differences and More Respect from School System were rated as least oftenincluded in policies.
These preliminary results offer early indications that the method of assessment used will helpestablish a baseline for tracking cultural competence development over time. Additionally, thestatements generated by participants offer concrete information for developing technical assistance andtraining plans around issues of cultural competence. The authors expect that data currently beingcollected from additional participants will strengthen the reliability of the results and will furtherdefine differences between participant groups.
Summary
The inherent nature of cultural competence demands individualization at the family,organizational, and community levels. The Concept Mapping methodology offers a unique way ofgathering data from many individuals that can then be analyzed across multiple levels of acommunity’s system of care. Investigators suggest that this study demonstrates a promising method forintegrating participatory principles and values of systems of care philosophy in planning,implementation, and reporting design.
290 – Research and Training Center for Children’s Mental Health – Tampa, FL – 2003
Davis, Rodriguez, Barraza & Johnson
References
Cross, T., Bazron, B., Dennis, K., & Isaacs, M. (1989). Toward a culturally competent system of care: Amonograph on effective services for minority children who are severely emotionally disturbed. Washington, DC:Georgetown University Child Development Center, National Technical Assistance Center for Children’sMental Health.
Embracing the dynamics of difference: Cultural competence in children’s mental health. (1997,Spring). Networks. Alexandria, VA: National Technical Assistance Center for State Mental Health Planning.
Hernandez, M., Gomez, A., & Worthington, J. (2001). System of care practice review. Tampa:Department of Child & Family Studies, Louis de la Parte Florida Mental Health Institute, University ofSouth Florida.
Hernandez, M., & Issacs, M. R. (1998). Promoting cultural competence in children’s mental healthservices. Baltimore: Brookes.
Knitzer, J. (1982). Unclaimed children: The failure of public responsibility to children and adolescents inneed of mental health services. Washington, DC: Children’s Defense Fund.
Mason, J. (1989). The cultural competence self-assessment questionnaire. Portland, OR: The PortlandState University Research and Training Center for children and Youth with Serious Emotional Handicapsand their Families.
Stroul, B. A. & Friedman, R. M. (1986). A System of care for children and youth with severe emotionaldisturbances. (Revised edition). Washington, DC: Georgetown University Child Development Center,CASSP Technical Assistance Center.
Trochim, W. M. K. (1989). An introduction to concept mapping for planning and evaluation.Evaluation and Program Planning, 12, 1-16.
CONTRIBUTING AUTHORS
Tamara S. Davis, M.S.S.W.Research Associate/Doctoral Candidate; 512-232-7903 fax: 512-232-2165; e-mail:[email protected]
Beth Ann Rodriguez, M.S.W.Facilitator, 512-635-8288 fax: 512-232-2165; e-mail: [email protected]
Frances Barraza, L.M.S.W.Family Evaluator, 512-232-7323 fax: 512-232-2165; e-mail: [email protected]
Toni K. Johnson, L.M.S.W.-A.C.P.Facilitator/Doctoral Candidate, 512-929-0142 fax: 512-232-2165; e-mail:[email protected] Authors: University of Texas at Austin, Center for Social Work Research, 1925 San JacintoBlvd., Austin, TX 78712-1203.
15th Annual Conference Proceedings – A System of Care for Children’s Mental Health: Expanding the Research Base – 291
Catherine Woodstock Striley
Eddie Brown
Arlene Rubin Stiffman
Emily Ostmann
American Indian Cultural IdentityInsignificant Resiliency Factor inFace of Trauma
Introduction
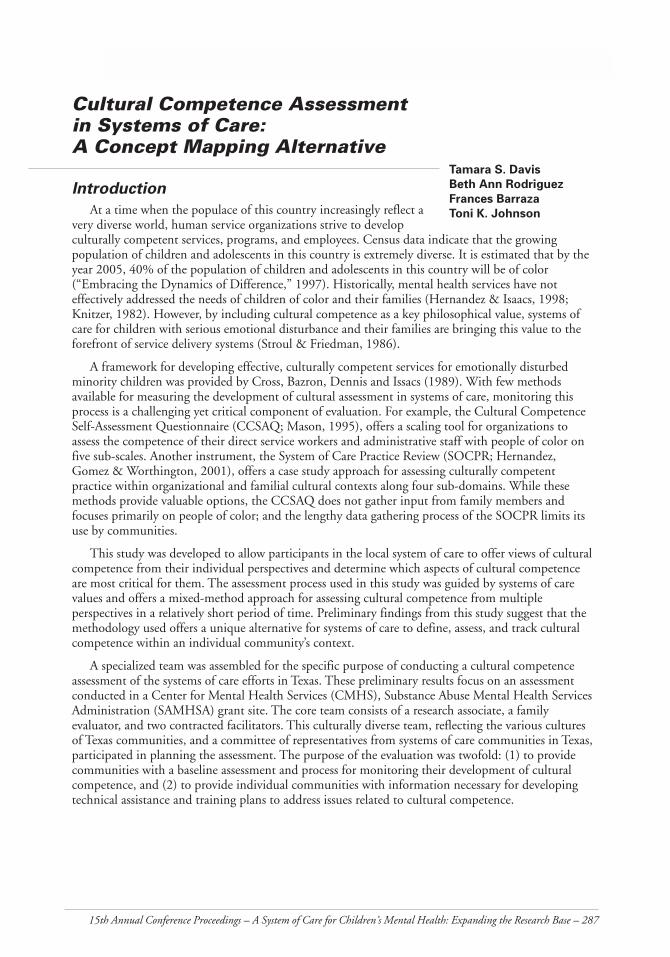
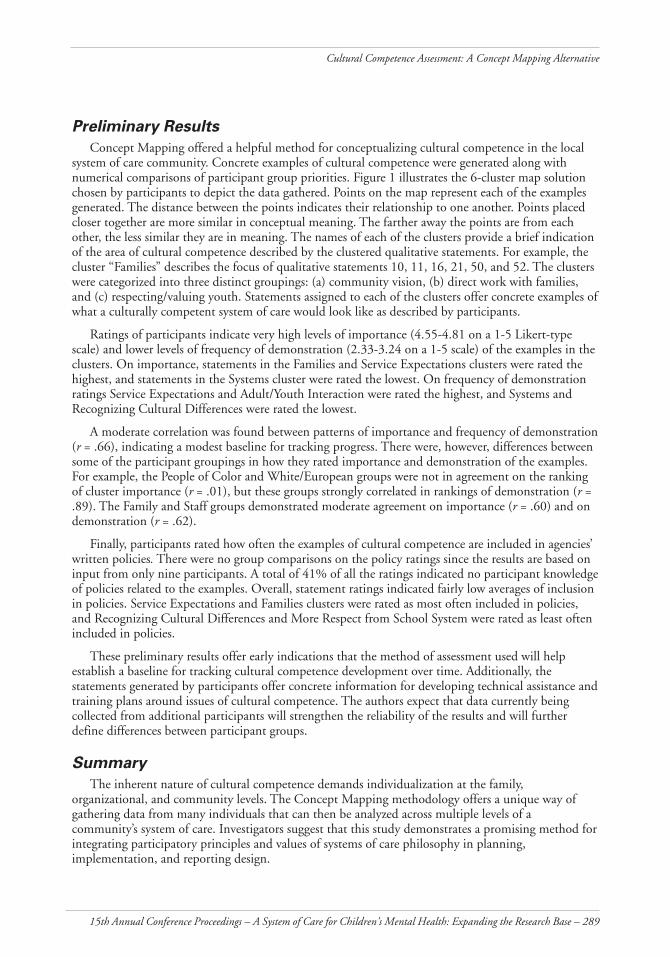
Cultural factors such as identity and enculturation in one’sculture of origin have been posited to serve as resiliency factors forAmerican Indian youth. As such they may directly reduce symptoms or reduce the effect of traumaticevents and other risk factors in producing symptoms related to addictions, mental health and dailyfunctioning. Models such as Aponte & Johnson’s (2000) posit that such cultural factors effect symptomsand functioning. The “Indigenist” Stress-Coping Model of Walters and Simoni (2002) posits thatcultural factors such as enculturation and “identityattitudes” buffer the results of traumatic life events,abuse and historical trauma. This paper tests theroles of cultural identity and enculturation indirectly effecting and moderating the risk factor ofexposure to traumatic events on outcomes ofmental health, substance use symptoms, and lifefunctioning. The model tested herein is based onboth of these models (see Figure 1), and includesboth cultural identity as a product andenculturation as a process as resiliency factors thatlead directly to better outcomes (less symptoms andless functioning problems) and serve a protectivefunction in the context of the risk factor ofexposure to traumatic events.
Methods
Four hundred and one American Indian youth from both an urban setting and a peri-urbanreservation were interviewed as a part of the American Indian Multisector Health Investigation (AIM-HI) and a National Institute on Drug Abuse (NIDA) funded project, “Culture in Congruence andSubstance and Mental Health Treatment Access.” A random sample, based on school records andtribal records of 600 youth (300 from both areas), were given a short screening questionnaire whichincluded the Columbia Impairment Scale (CIS; Bird et al., 1993) and the Youth Self-Report of theChild Behavior Checklist (CBCL; Achenbach, 1991). One hundred and fifty youth from each areawere then randomly selected to do a longer (1.5-2 hour ) interview to ascertain their mental healthand substance use symptoms and daily functioning, their cultural identity and enculturation, and theservices they had received. In addition, 50 youth from each area who exceeded clinical cutoffs on thescreening interview were selected for the long interview, to enrich the sample with high-need youth.
Symptoms of conduct disorder, substance abuse or dependence (including inhalants, marijuana, orany drug identified by the youth), alcohol abuse and dependence, depression, suicidality, and posttraumatic stress were identified by the Diagnostic Interview Schedule (DIS-IV; Robins & Helzer,1994). All symptoms were summed into a single total symptom count variable. Although the datacould have been looked at by diagnosis, symptom clusters may more accurately identify need, sincesome diagnoses are difficult to meet in adolescence. Summing the symptoms allows for the fullvariance, from no symptoms to the total co-occurring symptoms most youth experience.
Figure 1Cultural Resiliency Model
Cultural
Outcomes
TraumaticExposures
Enculturation
Identity
Symptoms of mentalhealth and
substance useFunctioning
Funding: National Institute for Drug Abuse funded, American Indian Multisector HelpInquiry RO1 DA 13227; Culture in Congruence RO3 DA 14398 (Dissertation funding).
292 – Research and Training Center for Children’s Mental Health – Tampa, FL – 2003
Striley, Brown, Stiffman & Ostmann
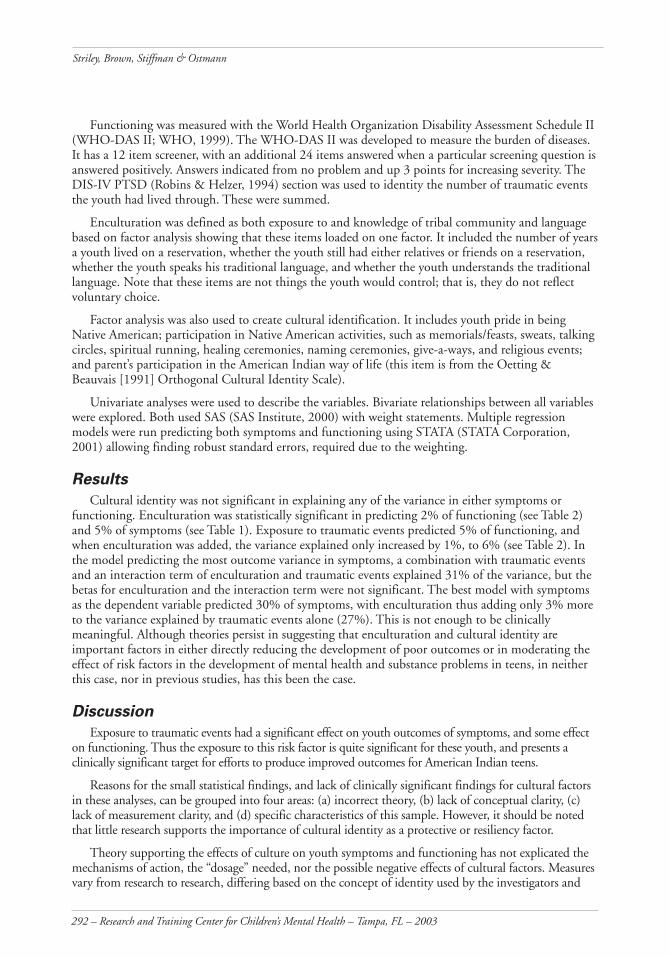
Functioning was measured with the World Health Organization Disability Assessment Schedule II(WHO-DAS II; WHO, 1999). The WHO-DAS II was developed to measure the burden of diseases.It has a 12 item screener, with an additional 24 items answered when a particular screening question isanswered positively. Answers indicated from no problem and up 3 points for increasing severity. TheDIS-IV PTSD (Robins & Helzer, 1994) section was used to identity the number of traumatic eventsthe youth had lived through. These were summed.
Enculturation was defined as both exposure to and knowledge of tribal community and languagebased on factor analysis showing that these items loaded on one factor. It included the number of yearsa youth lived on a reservation, whether the youth still had either relatives or friends on a reservation,whether the youth speaks his traditional language, and whether the youth understands the traditionallanguage. Note that these items are not things the youth would control; that is, they do not reflectvoluntary choice.
Factor analysis was also used to create cultural identification. It includes youth pride in beingNative American; participation in Native American activities, such as memorials/feasts, sweats, talkingcircles, spiritual running, healing ceremonies, naming ceremonies, give-a-ways, and religious events;and parent’s participation in the American Indian way of life (this item is from the Oetting &Beauvais [1991] Orthogonal Cultural Identity Scale).
Univariate analyses were used to describe the variables. Bivariate relationships between all variableswere explored. Both used SAS (SAS Institute, 2000) with weight statements. Multiple regressionmodels were run predicting both symptoms and functioning using STATA (STATA Corporation,2001) allowing finding robust standard errors, required due to the weighting.
Results
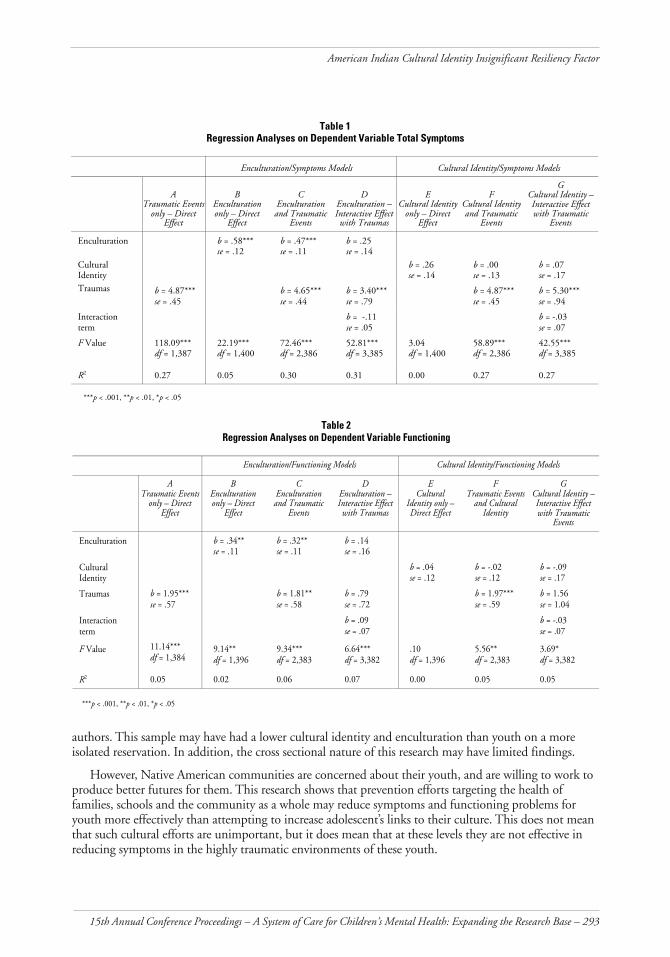
Cultural identity was not significant in explaining any of the variance in either symptoms orfunctioning. Enculturation was statistically significant in predicting 2% of functioning (see Table 2)and 5% of symptoms (see Table 1). Exposure to traumatic events predicted 5% of functioning, andwhen enculturation was added, the variance explained only increased by 1%, to 6% (see Table 2). Inthe model predicting the most outcome variance in symptoms, a combination with traumatic eventsand an interaction term of enculturation and traumatic events explained 31% of the variance, but thebetas for enculturation and the interaction term were not significant. The best model with symptomsas the dependent variable predicted 30% of symptoms, with enculturation thus adding only 3% moreto the variance explained by traumatic events alone (27%). This is not enough to be clinicallymeaningful. Although theories persist in suggesting that enculturation and cultural identity areimportant factors in either directly reducing the development of poor outcomes or in moderating theeffect of risk factors in the development of mental health and substance problems in teens, in neitherthis case, nor in previous studies, has this been the case.
Discussion
Exposure to traumatic events had a significant effect on youth outcomes of symptoms, and some effecton functioning. Thus the exposure to this risk factor is quite significant for these youth, and presents aclinically significant target for efforts to produce improved outcomes for American Indian teens.
Reasons for the small statistical findings, and lack of clinically significant findings for cultural factorsin these analyses, can be grouped into four areas: (a) incorrect theory, (b) lack of conceptual clarity, (c)lack of measurement clarity, and (d) specific characteristics of this sample. However, it should be notedthat little research supports the importance of cultural identity as a protective or resiliency factor.
Theory supporting the effects of culture on youth symptoms and functioning has not explicated themechanisms of action, the “dosage” needed, nor the possible negative effects of cultural factors. Measuresvary from research to research, differing based on the concept of identity used by the investigators and
15th Annual Conference Proceedings – A System of Care for Children’s Mental Health: Expanding the Research Base – 293
American Indian Cultural Identity Insignificant Resiliency Factor
authors. This sample may have had a lower cultural identity and enculturation than youth on a moreisolated reservation. In addition, the cross sectional nature of this research may have limited findings.
However, Native American communities are concerned about their youth, and are willing to work toproduce better futures for them. This research shows that prevention efforts targeting the health offamilies, schools and the community as a whole may reduce symptoms and functioning problems foryouth more effectively than attempting to increase adolescent’s links to their culture. This does not meanthat such cultural efforts are unimportant, but it does mean that at these levels they are not effective inreducing symptoms in the highly traumatic environments of these youth.
Table 1Regression Analyses on Dependent Variable Total Symptoms
Enculturation/Symptoms Models Cultural Identity/Symptoms Models
ATraumatic Events
only – DirectEffect
BEnculturationonly – Direct
Effect
CEnculturationand Traumatic
Events
DEnculturation –Interactive Effectwith Traumas
ECultural Identity
only – DirectEffect
FCultural Identityand Traumatic
Events
GCultural Identity –Interactive Effectwith Traumatic
Events
Enculturation b = .58***se = .12
b = .47***se = .11
b = .25se = .14
CulturalIdentity
b = .26se = .14
b = .00se = .13
b = .07se = .17
Traumas b = 4.87***se = .45
b = 4.65***se = .44
b = 3.40***se = .79
b = 4.87***se = .45
b = 5.30***se = .94
Interactionterm
b = -.11se = .05
b = -.03se = .07
F Value 118.09***df = 1,387
22.19***df = 1,400
72.46***df = 2,386
52.81***df = 3,385
3.04df = 1,400
58.89***df = 2,386
42.55***df = 3,385
R2 0.27 0.05 0.30 0.31 0.00 0.27 0.27
***p < .001, **p < .01, *p < .05
Table 2Regression Analyses on Dependent Variable Functioning
Enculturation/Functioning Models Cultural Identity/Functioning Models
ATraumatic Events
only – DirectEffect
BEnculturationonly – Direct
Effect
CEnculturationand Traumatic
Events
DEnculturation –Interactive Effectwith Traumas
ECultural
Identity only –Direct Effect
FTraumatic Events
and CulturalIdentity
GCultural Identity –Interactive Effectwith Traumatic
Events
Enculturation b = .34**se = .11
b = .32**se = .11
b = .14se = .16
CulturalIdentity
b = .04se = .12
b = -.02se = .12
b = -.09se = .17
Traumas b = 1.95***se = .57
b = 1.81**se = .58
b = .79se = .72
b = 1.97***se = .59
b = 1.56se = 1.04
Interactionterm
b = .09se = .07
b = -.03se = .07
F Value 11.14***df = 1,384
9.14**df = 1,396
9.34***df = 2,383
6.64***df = 3,382
.10df = 1,396
5.56**df = 2,383
3.69*df = 3,382
R2 0.05 0.02 0.06 0.07 0.00 0.05 0.05
***p < .001, **p < .01, *p < .05
294 – Research and Training Center for Children’s Mental Health – Tampa, FL – 2003
Striley, Brown, Stiffman & Ostmann
References
Achenbach, T. M. (1991). Manual for the Youth Self-Report and 1991 profile. Burlington: Departmentof Psychiatry, University of Vermont.
Aponte, J. F. & Johnson, L. R. (2000). The impact of culture on the intervention and treatment ofethnic populations. In J. F. Aponte & J. Wohl (Eds.), Psychological intervention and cultural diversity (2nd
ed.). Needham Heights, MA: Allyn & Bacon.
Bird, H. R., Shaffer, D., Fisher, P., Gould, M. S. Staghezza, B., Chen, J. Y., & Hoven, C. (1993). TheColumbia Impairment Scale (CIS): Pilot findings on a measure of global impairment for children andadolescents. International Journal of Methods and Psychiatric Research, 3, 167-176.
Oetting, E. & Beauvais, F. (1991). Orthogonal cultural identification theory: The culturalidentification of minority adolescents. International Journal of Addictions, 25(5A&6A), 655-685.
Robins, L. & Helzer, J. E. (1994). The half-life of a structured interview: The NIMH DiagnosticInterview Schedule (DIS). International Journal of Methods in Psychiatric Research Special Issue: A ten-yearretrospective on the NIMH Epidemiologic Catchment Area (ECA) Program 4(2), 95-102.
SAS Institute Inc. (2000). SAS procedures guide, (Version 8). Cary, NC: SAS Institute Inc.
STATA Corporation. (2001). STATA Reference Manuals, (Version 7). College Station, TX: Author.
Walters, K. L. & Simoni, J. M. (2002). Reconceptualizing Native women’s health: An “indigenist”stress-coping model. American Journal of Public Health, 92(4), 520-524.
World Health Organization. (1999). WHO disability assessment schedule II: Interviewer training manual(Version 3.1a: Phase 2 field trials). Geneva, Switzerland: World Health Organization.
CONTRIBUTING AUTHORS
Catherine Woodstock Striley, M.S.W., Ph.D.NIMH Postdoctoral Fellow, Department of Psychiatry, Washington University MedicalSchool, 40 N. Kingshighway, Suite 4; St. Louis, MO 63108; 314-286-2268,fax: 314-286-2265; e-mail: [email protected]
Eddie Brown, D.S.W.Co-Principal Investigator, Director of Kathryn M. Buder Center for American IndianStudies, George Warren Brown School of Social Work, Washington University, Campus Box1196, 1 Brookings Drive, St. Louis Missouri, 63130; 314-935-4677, fax: 314-935-8511;e-mail: [email protected]
Arlene Rubin Stiffman, Ph.D.Principal Investigator, Director of Comorbidity and Addiction Center; George WarrenBrown School of Social Work, Washington University, Campus Box 1196, 1 BrookingsDrive, St. Louis Missouri, 63130; 314-935-6685, fax: 314-935-8511;e-mail: [email protected]
Emily Ostmann, B.S.Data Manager, George Warren Brown School of Social Work, Washington University,Campus Box 1196, 1 Brookings Drive, St. Louis Missouri, 63130; 314-935-9798,fax: 314-935-8511; e-mail: [email protected]
15th Annual Conference Proceedings – A System of Care for Children’s Mental Health: Expanding the Research Base – 295
Chair
Arlene Rubin Stiffman
Authors
Arlene Rubin Stiffman et al.
Catherine Woodstock Striley et al.
Gordon Limb et al.
Symposium Overview
The American Indian MultisectorHelp Inquiry (AIMHI)
Symposium Introduction
The papers from this symposium are all based on datafrom AIM-HI (American Indian Multisector Help Inquiry), aNIDA-funded study of service use and drug-use informationon two American Indian populations, one urban and onereservation. The samples are unique in that both are from a Southwestern state, and this state providesstable, state-financed mental health services. A total of 401 youth were interviewed in person in 2001.Two hundred youth were from the reservation population, and 200 were from the urban population.These youth will later be followed yearly to obtain ongoing information about service needs andpathways of use.
Results reported in this group of papers address: (1) service utilization patterns; (2) the relationshipbetween functioning and service utilization; (3) the impact of out-of-home placement on drug/alcoholuse and service utilization; and (4) issues related to balancing research integrity with sensitivity to thehuman and cultural needs of participants for this population.
American Indian Teens: Southwestern Urban and ReservationYouths’ Need for Services and Who They Turn to for HelpArlene Rubin Stiffman, Eddie F. Brown, Catherine Woodstock Striley, Gordon E. Limb, &
Emily Ostmann
Introduction
American Indian youth suffer from many problems that require services. American Indian youth havehigher rates of substance use (Gfellner & Hundleby, 1995), antisocial behavior, pathological gambling,panic disorder (Novins, Harman, Mitchell, & Manson, 1996), depression (Dick, Manson, & Beals,1993), and suicide (Manson, Beals, Dick & Duclos, 1989) than other ethnic groups. In addition, the gapfor American Indian youth between service need and use is larger than the known large gap for thegeneral population (Costello et al., 1995; Swinomish Tribal Mental Health Project, 1991). This paperdetails the service configurations reported for both the ruban and reservation study groups.
Method
Measures of service use came from the Service Assessment for Children and Adolescents (SACA;Stiffman et al., 2000). Data were collected on lifetime and past year use of informal, inpatient,outpatient, and school service settings. Questions were refined to include culturally relevant services,such as informal help and traditional American Indian healing practices.
Results
Seventy-nine percent of the youth had some mental health or addiction problems, and 25%percent of youth with a problem did not have any identified helper.
Youth who did receive help used a variety of service configurations or combinations of helpers. Thethree most common service configurations were: (a) only informal adult friends and peers (n = 54),(b) all helpers except traditional (n = 47), and (c) informal adult friends and specialist or nonspecialistprofessionals (n = 24). Reservation youth were twice as likely as urban youth to use “only informal
296 – Research and Training Center for Children’s Mental Health – Tampa, FL – 2003
Stiffman et al., Striley et al. & Limb et al.
adult and specialist or nonspecialist professionals” (10% and 4.6%, respectively; χ2= 3.5, p = .05). Incontrast, twice as many urban youth than reservation youth used “all helpers except specialist ornonspecialist professional” (4.6% and 2.5%, respectively; χ2= 6, p = .01).
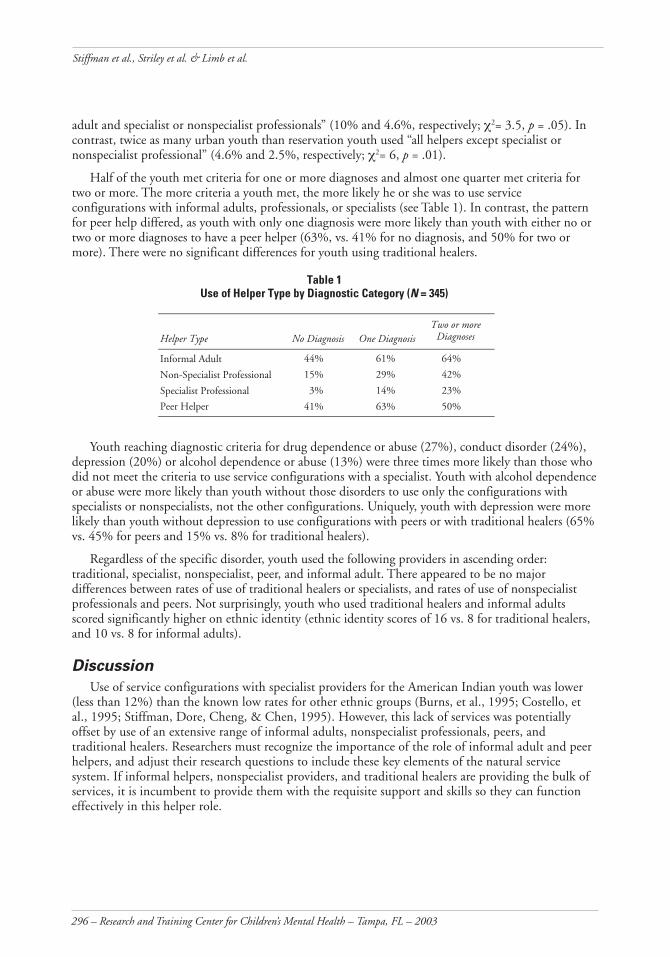
Half of the youth met criteria for one or more diagnoses and almost one quarter met criteria fortwo or more. The more criteria a youth met, the more likely he or she was to use serviceconfigurations with informal adults, professionals, or specialists (see Table 1). In contrast, the patternfor peer help differed, as youth with only one diagnosis were more likely than youth with either no ortwo or more diagnoses to have a peer helper (63%, vs. 41% for no diagnosis, and 50% for two ormore). There were no significant differences for youth using traditional healers.
Table 1Use of Helper Type by Diagnostic Category (N = 345)
Helper Type No Diagnosis One DiagnosisTwo or more
Diagnoses
Informal Adult 44% 61% 64%
Non-Specialist Professional 15% 29% 42%
Specialist Professional 3% 14% 23%
Peer Helper 41% 63% 50%
Youth reaching diagnostic criteria for drug dependence or abuse (27%), conduct disorder (24%),depression (20%) or alcohol dependence or abuse (13%) were three times more likely than those whodid not meet the criteria to use service configurations with a specialist. Youth with alcohol dependenceor abuse were more likely than youth without those disorders to use only the configurations withspecialists or nonspecialists, not the other configurations. Uniquely, youth with depression were morelikely than youth without depression to use configurations with peers or with traditional healers (65%vs. 45% for peers and 15% vs. 8% for traditional healers).
Regardless of the specific disorder, youth used the following providers in ascending order:traditional, specialist, nonspecialist, peer, and informal adult. There appeared to be no majordifferences between rates of use of traditional healers or specialists, and rates of use of nonspecialistprofessionals and peers. Not surprisingly, youth who used traditional healers and informal adultsscored significantly higher on ethnic identity (ethnic identity scores of 16 vs. 8 for traditional healers,and 10 vs. 8 for informal adults).
Discussion
Use of service configurations with specialist providers for the American Indian youth was lower(less than 12%) than the known low rates for other ethnic groups (Burns, et al., 1995; Costello, etal., 1995; Stiffman, Dore, Cheng, & Chen, 1995). However, this lack of services was potentiallyoffset by use of an extensive range of informal adults, nonspecialist professionals, peers, andtraditional healers. Researchers must recognize the importance of the role of informal adult and peerhelpers, and adjust their research questions to include these key elements of the natural servicesystem. If informal helpers, nonspecialist providers, and traditional healers are providing the bulk ofservices, it is incumbent to provide them with the requisite support and skills so they can functioneffectively in this helper role.
15th Annual Conference Proceedings – A System of Care for Children’s Mental Health: Expanding the Research Base – 297
Symposium Overview: The American Indian Multisector Help Inquiry (AIMHI)
American Indian Teen’s Functioning Predicts Teen Desire forTalking About, and Receiving ServicesCatherine Woodstock Striley, Arlene Stiffman, Emily Ostmann, & Eddie F. Brown
Introduction
Services researchers often measure symptomatology rather than functionality to predict bothrecognition of need for services and service receipt. This aspect of the AIM-HI explores the utility ofmeasures of functioning through examination of three hypotheses: 1) that functioning predicts youthdesire for services even though they haven’t received any; 2) that functioning predicts youth talking toan adult about their problems; and 3) that functioning predicts actual service receipt.
Method
Questions designed to measure functionality came from the World Health Organization DisabilityAssessment II (WHO-DAS II; World Health Organization 2000), a promising instrument formeasuring adolescent functioning in research and practice, capturing a great deal of variation withpredictive validity. This instrument is a 12-item screener that includes an additional 24 items that areasked when a screening question is answered positively. The WHO-DAS II contains six domains:(a) understanding and communication, (b) getting around, (c) self-care, (d) getting along with people,(e) life activities (e.g., work and chores), and (f ) participation in society. Functioning (weighted) is setas greater than or equal to 2, that is, there must have been one area of moderate difficulty on thescreener, or 2 of mild to have a functioning difficulty, or the two questions in each area were bothscored as mild difficulty.
Results
A little more than half (52%) of the sample of 401 youth had at least one moderate or two mildfunctioning difficulties due to physical, emotional or behavioral problems. Twenty three percent hadproblems with understanding and communicating. Functioning in the community was a problem for21% of the youth. Nineteen percent had problems getting around. Eleven percent had functioningproblems related to home responsibilities, and seven percent had problems with work, for a total of18% having problems in the life domain. Getting along with others was effected in 18% of the youth.Self care, a physical functioning problem, was a problem for 2% of the youth.
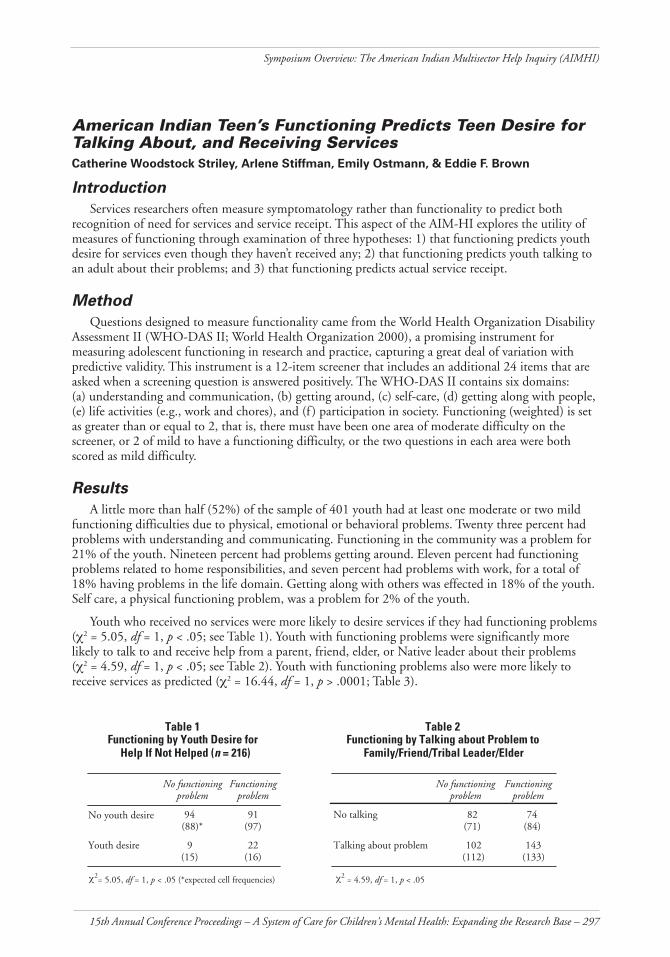
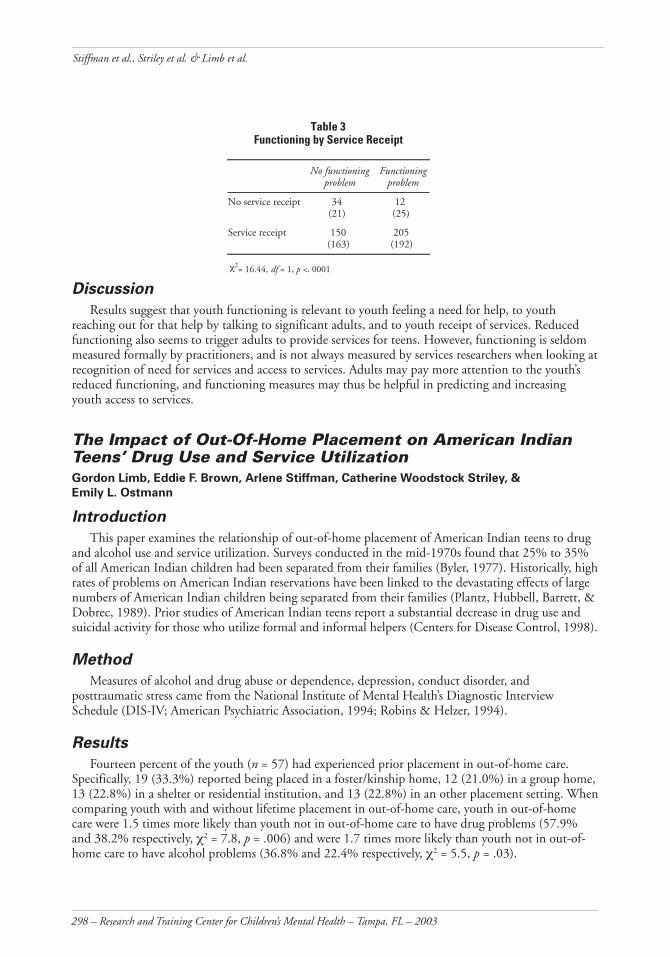
Youth who received no services were more likely to desire services if they had functioning problems(χ2 = 5.05, df = 1, p < .05; see Table 1). Youth with functioning problems were significantly morelikely to talk to and receive help from a parent, friend, elder, or Native leader about their problems(χ2 = 4.59, df = 1, p < .05; see Table 2). Youth with functioning problems also were more likely toreceive services as predicted (χ2 = 16.44, df = 1, p > .0001; Table 3).
Table 1Functioning by Youth Desire for
Help If Not Helped (n = 216)
No functioningproblem
Functioningproblem
94(88)*
91(97)
Youth desire
No youth desire
9(15)
22(16)
2= 5.05, df = 1, p < .05 (*expected cell frequencies)χ
Table 2Functioning by Talking about Problem to
Family/Friend/Tribal Leader/Elder
No functioningproblem
Functioningproblem
No talking 82(71)
74(84)
Talking about problem 102(112)
143(133)
2 = 4.59, df = 1, p < .05χ
298 – Research and Training Center for Children’s Mental Health – Tampa, FL – 2003
Stiffman et al., Striley et al. & Limb et al.
Discussion
Results suggest that youth functioning is relevant to youth feeling a need for help, to youthreaching out for that help by talking to significant adults, and to youth receipt of services. Reducedfunctioning also seems to trigger adults to provide services for teens. However, functioning is seldommeasured formally by practitioners, and is not always measured by services researchers when looking atrecognition of need for services and access to services. Adults may pay more attention to the youth’sreduced functioning, and functioning measures may thus be helpful in predicting and increasingyouth access to services.
The Impact of Out-Of-Home Placement on American IndianTeens’ Drug Use and Service UtilizationGordon Limb, Eddie F. Brown, Arlene Stiffman, Catherine Woodstock Striley, &
Emily L. Ostmann
Introduction
This paper examines the relationship of out-of-home placement of American Indian teens to drugand alcohol use and service utilization. Surveys conducted in the mid-1970s found that 25% to 35%of all American Indian children had been separated from their families (Byler, 1977). Historically, highrates of problems on American Indian reservations have been linked to the devastating effects of largenumbers of American Indian children being separated from their families (Plantz, Hubbell, Barrett, &Dobrec, 1989). Prior studies of American Indian teens report a substantial decrease in drug use andsuicidal activity for those who utilize formal and informal helpers (Centers for Disease Control, 1998).
Method
Measures of alcohol and drug abuse or dependence, depression, conduct disorder, andposttraumatic stress came from the National Institute of Mental Health’s Diagnostic InterviewSchedule (DIS-IV; American Psychiatric Association, 1994; Robins & Helzer, 1994).
Results
Fourteen percent of the youth (n = 57) had experienced prior placement in out-of-home care.Specifically, 19 (33.3%) reported being placed in a foster/kinship home, 12 (21.0%) in a group home,13 (22.8%) in a shelter or residential institution, and 13 (22.8%) in an other placement setting. Whencomparing youth with and without lifetime placement in out-of-home care, youth in out-of-homecare were 1.5 times more likely than youth not in out-of-home care to have drug problems (57.9%and 38.2% respectively, χ2 = 7.8, p = .006) and were 1.7 times more likely than youth not in out-of-home care to have alcohol problems (36.8% and 22.4% respectively, χ2 = 5.5, p = .03).
Table 3Functioning by Service Receipt
No functioningproblem
Functioningproblem
No service receipt 34(21)
12(25)
Service receipt 150(163)
205(192)
2= 16.44, df = 1, p <. 0001χ
15th Annual Conference Proceedings – A System of Care for Children’s Mental Health: Expanding the Research Base – 299
Symposium Overview: The American Indian Multisector Help Inquiry (AIMHI)
American Indian teens placed in out-of-home care were 1.8 times more likely than those not in out-of-home care to access professionals (73.7% and 40.2% respectively, χ2 = 22.1, p < .001) and were 1.7times more likely to use traditional healers/helpers (24.6% and 14.1% respectively, χ2 = 4.1, p = .05).More importantly, American Indian teens placed in out-of-home care were 1.3 times more likely tosolicit help from family members than teens who were not in out-of-home care (83.9% and 65.5%respectively, χ2 =7.5, p = .005). Even after being separated from their parents, a higher proportion ofAmerican Indian teens placed in out-of-home care still went to their parents for help. Of youthreporting that they went to their parents for help, 56.1% were in out-of-home care, and 48.4% werenot. American Indians placed in out-of-home care were also significantly more likely than AmericanIndians not placed in out-of-home care to go to grandparents (1.8 times more likely, 43.6% and24.6% respectively, χ2 = 8.6, p = .005) and other relatives (1.5 times more likely, 64.9% and 44.6%respectively, χ2 = 8.1, p = .006) for the help they need.
Discussion
Even in circumstances resulting in out-of-home placement of American Indian children and youth,family ties were not broken. In fact, when seeking help, the kinship or family network was actuallyutilized to a significantly greater degree than for those not placed in out-of-home care.
Research Solutions for Cultural and Human Subjects IssuesConcerning American Indian YouthArlene Rubin Stiffman, Eddie F. Brown, Catherine Woodstock Striley, Gordon E. Limb, &
Emily Ostmann
Introduction
Researchers have a basic dilemma in handling the competing pressures between research and theethical needs of human subjects. For example, research must: (a) obtain the same responses each timefrom each person, (b) avoid influencing the responses, (c) avoid interfering with natural changes overtime, and (d) maintain promises of confidentiality. How can one handle these issues without eitherimpacting research integrity or violating ethical concerns? This question is especially poignant forresearch among American Indians, as they have a history of having been “cheated” by unscrupulousbusiness and research arrangements.
Methods
Initial project planning for AIM-HI interviews was made with the guidance of a researchimplementation team composed of tribal elders, American Indian human service workers, councilmembers, parents, and representative youth. Extensive plans were incorporated in the research to reassurethe community that the youth would not be stressed, and that any questions that the communitythought engendered stress would be brought to the attention of the appropriate authorities.
Two methods were implemented. First, sensitive questions were flagged in the computerizedinterview. At the end of the interview, if any flagged questions had been answered positively, aprocedure was initiated through additional follow up questions for referral of the youth to services, anabuse/neglect hotline report, or an emergency suicidal intervention service. The researchers arranged,in both the urban and the reservation areas, individualized service providers on 24-hour call. Second,sections that the council members thought might be upsetting were prefaced with the statement that“some people may wish not to answer these.” The youth were also shown the questions so they coulddecide whether they wanted to skip the section or answer it themselves without an interviewer.
300 – Research and Training Center for Children’s Mental Health – Tampa, FL – 2003
Stiffman et al., Striley et al. & Limb et al.
Results
Despite being given the choice to “skip out” of seven different sections of the interview, mostyouth did not skip any sections (90%), while 4% skipped one, 1% skipped two, and 1% skipped threeor more.
Almost 90% of the youth were flagged as having problems. Over one-third had a flag triggered forabuse or neglect, one-third had a flag triggered for suicidality, and the other flags were triggered forenvironmental issues. This rate was 2-3 times higher than in the authors’ other research projects, butconsonant with the known high needs of the American Indian community.
Reports of abuse presented a significant problem, especially because the communities are close knitand small. Of those youth who triggered a flag for abuse, approximately one quarter were alreadyinvolved with protective services, 5% agreed to an immediate call with the interviewer to protectiveservices. When asked to clarify the bullying incident, 20% described an incident that was clearly notabuse (e.g., bullying or being picked on in a playground). For 40% of respondents, the last occurrenceof abuse was over a year ago, with half of those having been ten or more years ago. Over 10% said theyalready received help and were now in a new family situation (i.e., the abuser had left home, or wasincarcerated).
A third of the youth reported feelings of suicidality, with 30% having thought about it and over15% having attempted suicide. For actively suicidal feelings, the interviewer stayed with the youthuntil a parent or provider was present. Only 18% of the youth with a suicidality flag were currentlysuicidal. Almost all agreed to call a crisis line, call a parent, or call a doctor. Of the youth who were notactively or currently suicidal, 22% refused any help.
For both abuse and suicidality, incident reports documented the flags and the youth’s responses.The interviewer’s supervisor was informed immediately. In the reservation area, these incident reportswere turned over to Human Services. At the specific request of the agency and of the tribal council,human services were to screen those reports and provide services.
Discussion
The pressure within the American Indian community to provide services, and the concern aboutthe sensitivity of the questions asked, required creative balancing of human subjects and ethical issueswith the research concerns. The positive response of so many youth to questions that required servicesstrained the project. Despite these difficulties, the researchers and the American Indian communitywere satisfied that the interview did bring many youth who were in need of services to the attention ofproviders.
References
American Psychiatric Association. (1994). Diagnostic and statistical manual of mental disorders. (4threvised ed.). Washington, DC: Author.
Burns, B. J., Costello, E. J., Angold, A., Tweed, D., Stangl, D., Farmer, E. M. Z., & Erkanli, A.(1995). Children’s mental health service use across service sectors. Health Affairs 14(3), 147-159.
Byler, W. (1977). Removing children: The destruction of American Indian families. Civil Rights Digest,9(4), 19-27.
Centers for Disease Control. (1998). Youth risk behavior surveillance: United States, 1997. Morbidityand Mortality Weekly Report 47(3), 1-89.
Costello E. J., Angold A., Burns, B. J., Farmer, E. M. Z., Stangl, D. K., Erkanli, A. & Messer, S. C.(1995). Great Smoky Mountains study: 1. Use of service for mental health care. NIMH Mental HealthServices Research Conference.
15th Annual Conference Proceedings – A System of Care for Children’s Mental Health: Expanding the Research Base – 301
Symposium Overview: The American Indian Multisector Help Inquiry (AIMHI)
Dick, R. W., Manson, S. M., & Beals, J. (1993). Alcohol use among male and female Native Americanadolescents: Patterns and correlates of student drinking in a boarding school. Journal of the Study of Alcohol54(2), 172-177.
Gfellner, B. M., & Hundelby, J. D. (1995). Patterns of drug use among Native and white adolescents:1990-1993. Canadian Journal of Public Health 86(2), 95-97.
Plantz, M., Hubbell, R., Barrett, B., & Dobrec, A. (1989). Indian child welfare: A status report.Children Today, 18(1), 24-29.
Manson, S. M., Beals, J., Dick, R. W., & Duclos, C. (1989). Risk factor for suicide among Indianadolescents at a boarding school. Public Health Report 104(6), 609-614.
Novins, D. K., Harman, C. P., Mitchell, C. M., & Manson, S. M. (1996). Factors associated with thereceipt of alcohol treatment services among American Indian adolescents. Journal of the American Academyof Child and Adolescent Psychiatry, 35(1), 110-117.
Robins, L. N., & Helzer, J. E. (1994). The half-life of a structured interview: The NIMH DiagnosticInterview Schedule (DIS). [Special Issue: A ten-year retrospective on the NIMH Epidemiologic CatchmentArea (ECA) Program]. International Journal of Method in Psychiatric Research, 4(2), 95-102.
Stiffman, A. R., Horwitz, S. M., Hoagwood, K., Compton, W., Cottler, L., Narrow, W., & Weisz, J.(2000). Adult and child reports of mental health services in the Service Assessment for Children andAdolescents (SACA). Journal of the American Academy of Child and Adolescent Psychiatry, 39(8), 1-8.
Stiffman, A. R., Doré, P., Cheng, L., & Chen, Y. (1995). Adolescent mental health problems andhealth clinic treatment. Paper presented at The 8th Annual Research Conference, A System of Care forChildren’s Mental Health: Expanding the Research Base. Tampa, FL.
Swinomish Tribal Mental Health Project. (1991). A gathering of wisdoms, Tribal mental health: Acultural perspective. Mt. Vernon, Washington: Veda Vanguard.
World Health Organization (2000). World Health Organization Disability Assessment II TrainingManual: A Guide to Administration. Geneva: Author.
302 – Research and Training Center for Children’s Mental Health – Tampa, FL – 2003
Stiffman et al., Striley et al. & Limb et al.
CONTRIBUTING AUTHORS
Arlene Rubin Stiffman, Ph.D.314-935-6685, fax 314-935-8511; e-mail: [email protected]
Catherine Woodstock Striley, Ph.D.314-935-6685, fax 314-935-8511; e-mail: [email protected]
Eddie Brown, D.S.W.314-935-6685, fax 314-935-8511; e-mail: [email protected]
Gordon Limb, Ph.D.314-935-6685, fax 314-935-8511; e-mail: [email protected]
Emily Ostmann, B.S.314-935-6685, fax 314-935-8511
All authors: George Warren Brown School of Social Work, Washington University, OneBrookings Drive, Campus Box 1196, St. Louis, MO 63130.
15th Annual Conference Proceedings – A System of Care for Children’s Mental Health: Expanding the Research Base – 303
Author
Richard Briscoe
Discussant
Robert Hill
Presenters
Gwen McClain
W. James Favorite
Flossie Brooks
Symposium Overview
Strengths of African-AmericanFamilies: Identifying and Buildingon African-American FamilyStrengths
Introduction
The purpose of the African-American Family Supports Coalition(AAFSC) analysis was to identify strengths of African-Americanfamilies in order to help improve the services or systems of care thatare most utilized by them. The analysis focused on providing datathat would help to better understand and assess the community-basedfamily support systems designed to meet the needs of children andfamilies in African-American communities. This analysis provides findings that can be useful indeveloping a culturally-sensitive instrument for service delivery (see “Developing a strengths basedinstrument for African-American children and families,” this volume). This paper will describe theintegrated approach used to identify African-American family strengths and community supports inthe Tampa Bay area. It will highlight the university/community and neighborhood partnershipsinvolved in this initiative, along with the strength-based, action research and grounded theoryapproaches used as the overall research methodologies in this project.
Many early studies characterized African-American families as being highly unstable, disorganized,deprived, and disadvantaged. This deficit model leads to a service system that fails to address strengthsin African-American children and their families. Although a theoretical framework that recognizesstrengths of African-American families is being constructed, there remains a lack of definitive researchin this area.
AAFSC Community Context and Background
The AAFSC was established in 1997 to plan, coordinate and implement a project to collectinformation that could be used by human service providers—and to initiate a plan of action toincrease community capacity to more effectively empower families in African-Americanneighborhoods in Hillsborough County. Key individuals in the community formed the initiative as away to begin discussing the need for an analysis of African-American family support systems and acoordinated service delivery system. The group was comprised of individuals representing a broadspectrum of the community, and included many other individuals and organizations within thecommunity that the group had identified as potential coalition members. These coalition memberswork in partnership with the University of South Florida, Hillsborough Community College, andBeulah Institutional Baptist Church, to promote of African-American family strengths.
The 1997/1998 AAFSC Analyses
Through the proposed analysis, The AAFSC membership outlined three goals that it sought toaccomplish: (a) to create, from existing services, a community-wide coordinated team of stakeholderswith the expertise, willingness and the ability to make positive changes in their communities throughthe service delivery process; (b) to create strategic action plans that would promote resiliency inAfrican-American families, and; (c) to create awareness and provide educational opportunities throughearnest and honest discussions that address a culturally sensitive service delivery system.
The analysis was conducted in two phases. Phase I involved strategic community planning thatincluded a series of neighborhood meetings where volunteers and partners were recruited; informationgathering and sharing were the intended outcomes of these meetings. The primary focus of Phase Iwas to assemble a diverse, representative group of community stakeholders who would assist in a morein-depth system analysis and determine the target and scope of the initiative activities. The details ofthe analysis plan were contingent upon the outcome of the discussions and planning meetings with
304 – Research and Training Center for Children’s Mental Health – Tampa, FL – 2003
Briscoe, Hill, McClain, Favorite & Brooks
this larger group of stakeholders. In Phase II of the analysis, data were gathered from multiple sources.Data were then analyzed and disseminated though summit meetings, reports, and presentations.
AAFSC Project Framework
The overall AAFSC project involved several theoretical frameworks, philosophies and principals. Forexample, the project adopted a university and community partnership approach by which universityresearchers use the most fundamental components of action research theory to implement the project.This strategy helped to build relationships with communities. The AAFSC also used a multi-facetedresearch approach based on the fundamental belief that families and individual members within variousfamily structures possess certain strengths, and that communities also have resources and strengths. Theproject adopted several theoretical frameworks, including: (a) Hill’s findings (1972, 1997, 1998); (b) agrounded theory approach (Glaser & Strauss, 1967; Strauss, 1990); (c) action research (Dick, 1997;Lewin, 1946; O’Brien, 1998; (d) systems of care (Stroul & Friedman 1996); and (d) communitydevelopment (Anderson, Kubisch, & Connell, 1998). The framework that finally emerged was based onsome of the elements and principles related to the strength-based models (Hill, 1972, 1997), actionresearch and grounded theory. The framework also reflects the experiences, expertise and values of theresearch team. Other features of the AAFSC include its own unique philosophy about how the study wasto be implemented. This study was centered on Stroul and Friedman’s system-of-care principles that arecommunity-based, family-centered, culturally sensitive, and strengths-based.
Methodology and Findings
The overall methodology used in this study included a number of research methods that are brieflydiscussed in this section.
Local Literature. Information from a local literature review, along with national, state and localdata, were analyzed. Local data from newspaper articles, as well as a number of studies and reports,formed the basis of this review.
Documented Research. Research literature on the strengths that exist within African-Americanfamilies and their communities were also synthesized. More than 100 articles were reviewed; amajority supported the traditional deficit-deficiency model describing African-American families.
Census Analysis. A census analysis of the was also undertaken to identify demographic factorsincluding family type, education, home ownership, and employment for four Tampa Bay areaneighborhoods. Twenty-four maps and eleven tables containing current local demographicinformation on families and households were examined. Assets were found in the areas of family roles,kinship bonds, work orientation and the corresponding areas of income, school enrollment, academicachievement, education and employment.
Community Summits. Community summit meetings were held with providers, residents and otherprofessionals to gather additional information on perceptions, strengths and resources within thetarget communities. Community participants also reflected on various strategies that they foundhelpful when working collaboratively with university researchers. They shared their experiences andassisted with funding plans and implementation of services using strength-based neighborhoodoriented approaches. Fifty-five participants attended these summits; some residents were identified forleadership roles (i.e., taking positive community action), and were asked what government and otheragencies could do to assist them.
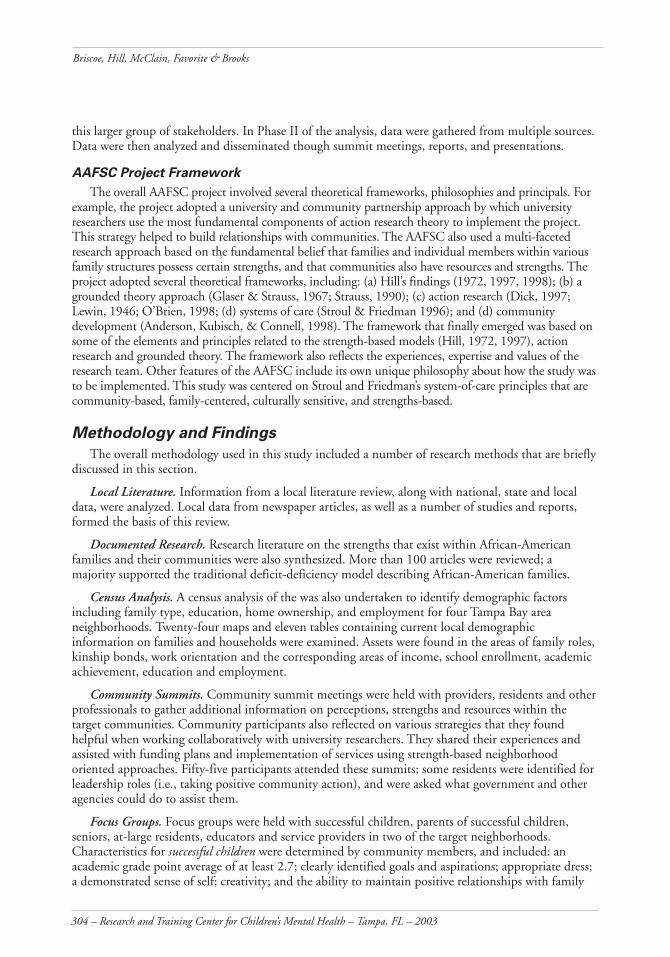
Focus Groups. Focus groups were held with successful children, parents of successful children,seniors, at-large residents, educators and service providers in two of the target neighborhoods.Characteristics for successful children were determined by community members, and included: anacademic grade point average of at least 2.7; clearly identified goals and aspirations; appropriate dress;a demonstrated sense of self; creativity; and the ability to maintain positive relationships with family
15th Annual Conference Proceedings – A System of Care for Children’s Mental Health: Expanding the Research Base – 305
Symposium Overview: Strengths of African-American Families
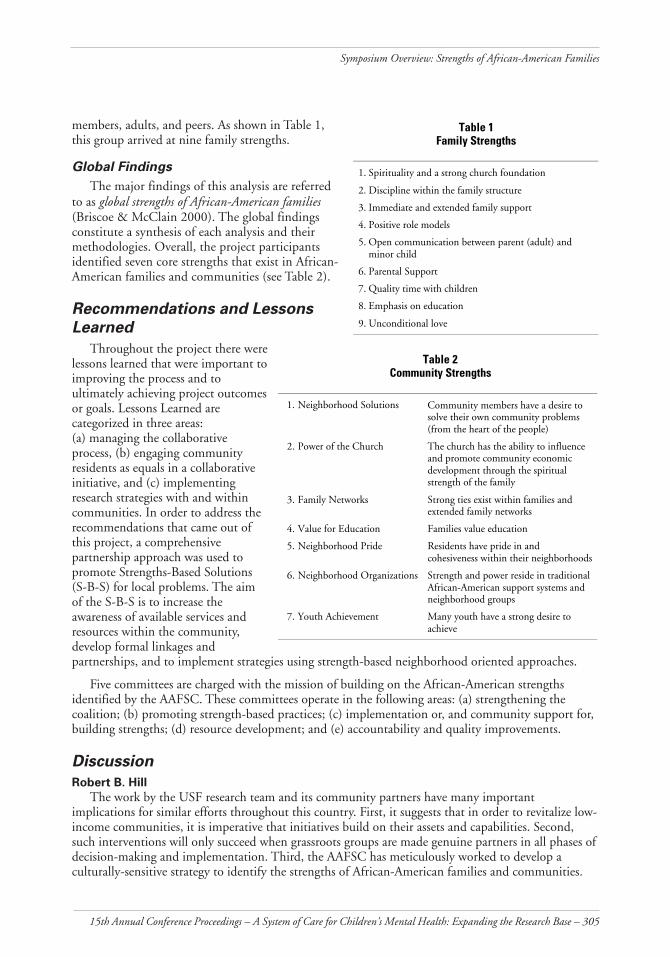
members, adults, and peers. As shown in Table 1,this group arrived at nine family strengths.
Global Findings
The major findings of this analysis are referredto as global strengths of African-American families(Briscoe & McClain 2000). The global findingsconstitute a synthesis of each analysis and theirmethodologies. Overall, the project participantsidentified seven core strengths that exist in African-American families and communities (see Table 2).
Recommendations and LessonsLearned
Throughout the project there werelessons learned that were important toimproving the process and toultimately achieving project outcomesor goals. Lessons Learned arecategorized in three areas:(a) managing the collaborativeprocess, (b) engaging communityresidents as equals in a collaborativeinitiative, and (c) implementingresearch strategies with and withincommunities. In order to address therecommendations that came out ofthis project, a comprehensivepartnership approach was used topromote Strengths-Based Solutions(S-B-S) for local problems. The aimof the S-B-S is to increase theawareness of available services andresources within the community,develop formal linkages andpartnerships, and to implement strategies using strength-based neighborhood oriented approaches.
Five committees are charged with the mission of building on the African-American strengthsidentified by the AAFSC. These committees operate in the following areas: (a) strengthening thecoalition; (b) promoting strength-based practices; (c) implementation or, and community support for,building strengths; (d) resource development; and (e) accountability and quality improvements.
Discussion
Robert B. Hill
The work by the USF research team and its community partners have many importantimplications for similar efforts throughout this country. First, it suggests that in order to revitalize low-income communities, it is imperative that initiatives build on their assets and capabilities. Second,such interventions will only succeed when grassroots groups are made genuine partners in all phases ofdecision-making and implementation. Third, the AAFSC has meticulously worked to develop aculturally-sensitive strategy to identify the strengths of African-American families and communities.
Table 1Family Strengths
1. Spirituality and a strong church foundation
2. Discipline within the family structure
3. Immediate and extended family support
4. Positive role models
5. Open communication between parent (adult) andminor child
6. Parental Support
7. Quality time with children
8. Emphasis on education
9. Unconditional love
Table 2Community Strengths
1. Neighborhood Solutions Community members have a desire tosolve their own community problems(from the heart of the people)
2. Power of the Church The church has the ability to influenceand promote community economicdevelopment through the spiritualstrength of the family
3. Family Networks Strong ties exist within families andextended family networks
4. Value for Education Families value education
5. Neighborhood Pride Residents have pride in andcohesiveness within their neighborhoods
6. Neighborhood Organizations Strength and power reside in traditionalAfrican-American support systems andneighborhood groups
7. Youth Achievement Many youth have a strong desire toachieve
306 – Research and Training Center for Children’s Mental Health – Tampa, FL – 2003
Briscoe, Hill, McClain, Favorite & Brooks
An instrument to measure African-American strengths will be based upon the findings of the AAFSCstudy. The instrument will be one of the few assessment tools in this nation to be developed andvalidated based on periodic feedback from community residents. The following symposium overview,“Developing a strengths-based instrument for African-American children and families” (this volume)discusses this pioneering tool. When completed, this instrument will make a major contributiontoward enhancing the resilience of families and empowering communities of color.
References
Briscoe, R. V., & McClain, G. (2000). African-American family support analysis: Strengths of African-American families. Tampa, FL: Children’s Board of Hillsborough County.
Dick, B. (1997). Action learning and action research. Retrieved from: www.scu.edu.au/schools/gcm/ar/arp/actlearn.html
Glasser, B., & Strauss, A. (1967). The discovery of grounded theory: Strategies for qualitative research.Chicago: Aldine.
Hill, R. (1972). The strengths of Black families: New York, NY: Emerson Hall Press.
Hill, R. (1997). The strengths of Black families: Twenty-five years later. Washington, DC: R & BPublishers.
Hill, R. (1998). Enhancing the resilience of African-American families. In L. A. See (Ed.), Humanbehavior in the social environment from an African-American perspective. New York: Hawwin Press.
Lewin, K. (1946). Action research and minority problems. Journal of Social Issues, 2(4), 34-46.
O’Brien, R. (1998). An overview of the methodological approach of action research. University of Toronto.Retrieved from: www.web.net/~robrien/papers/arfinal.html
Strauss, A.. (1990). Basics of qualitative research: Ground theory procedures and techniques. NewburyPark, CA: Sage.
Stroul, B., & Friedman, R. (1996). A system of care for children and youth with severe emotionaldisturbances (revised edition). Washington, DC: Georgetown University Child Development Center, CASSP,Technical Assistance Center.
SYMPOSIUM PARTICIPANTS
Richard Briscoe, Ph.D.Assistant Professor, Louis de la Parte, Florida Mental Health Institute, 13301 Bruce B.Downs Boulevard, Tampa, Florida 33612-3899; 813-974-6413, fax: 813-974-4651;e-mail: [email protected]
Gwen McClain, M.A.Instrument Development Consultant, 505 South Gordon Street, Plant City, FL 33563
Rev. W. James FavoritePastor, Beulah Baptist Church, 1006 W. Cypress Street, Tampa, Florida 33606;813-251-5591, fax: 813-254-0671; e-mail: [email protected]
Flossie BrooksExecutive Director, Neighborhoods United, Inc., 515 South Maryland Avenue, Plant City,Florida 33566; 813-759-9343, fax: 813-659-3390; e-mail: [email protected]
Robert Hill, Ph.D.Discussant, WESTAT, 1650 Research Boulevard, Rockville, MD. 20850-3195; 301-251-1500,fax: 888-294-2040; e-mail: [email protected].
15th Annual Conference Proceedings – A System of Care for Children’s Mental Health: Expanding the Research Base – 307
Author & Chair
Richard Briscoe
Discussant
Robert Hill
Presenters
Aaron Smith
Ruby Joseph
Joko Sengova
Gwen McClain
Symposium Overview
Developing a Strengths-BasedInstrument for African-AmericanChildren and Families
Introduction
Identifying Strengths in African-American Families (ISAAF) is atwo-year study designed to develop an instrument for measuringstrengths in African-American families. ISAAF was aimed atvalidating or nullifying findings from two previous studies by theAfrican-American Family Supports Coalition (AAFSC), conducted in1997 and 1998 (see “Strengths of African-American families:Identifying and building on African-American families’ strengths,”this volume). The findings of the AAFSC comprised several key factors crucial to determining thesuccessful well being of African-American children and families and to help families and providersassess individual and family strengths. The purpose of this paper is to briefly describe the major familyand child strength findings obtained from ISAAF’s year 2000 focus groups, and the strengths-basedinstrument development process in year 2001.
Methodology
ISAAF’s basic research framework was embedded in a grounded theory and action research strategy. Theformer stresses discovery work and theory development, where data are grounded in the realities of the livedexperiences of the targeted study group (Strauss & Corbin, 1998). The latter strategy involves the themes of“learning by actions” (O’Brien, 1998), and of concurrently pursuing action and research outcomes.
Focus groups
Focus groups comprised the primary data collection tool to engage community residents andservice providers in conversations about their opinions and insights on family and child strengths,strategies and methods they use to raise healthy, successful children and youth. Twenty-five focusgroups were conducted in Baltimore, Detroit, San Diego, Savannah, and Plant City, Florida. Therewere five discussants in each group and groups consisted of successful youth ages 11-17, parents ofsuccessful youth, senior citizens, at-large community residents, and service providers. Characteristicsfor successful youth were determined by community members, and included academic achievement andsocial goals (e.g., a demonstrated sense of self; creativity; the ability to maintain positive relationshipswith family members, adults, and peers; appropriate dress; and goals and aspirations). Focus grouptranscripts were then analyzed and summit meetings were held at the five sites to report on researchfindings and to provide feedback to families.
Demographic Profile
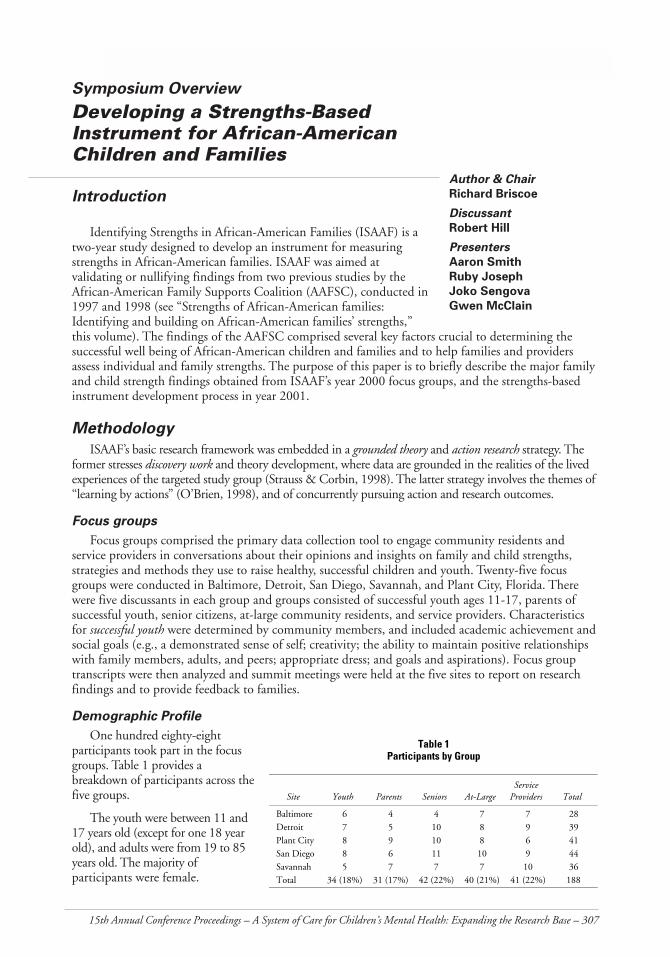
One hundred eighty-eightparticipants took part in the focusgroups. Table 1 provides abreakdown of participants across thefive groups.
The youth were between 11 and17 years old (except for one 18 yearold), and adults were from 19 to 85years old. The majority ofparticipants were female.
Table 1Participants by Group
Site Youth Parents Seniors At-LargeService
Providers Total
Baltimore 6 4 4 7 7 28Detroit 7 5 10 8 9 39Plant City 8 9 10 8 6 41San Diego 8 6 11 10 9 44Savannah 5 7 7 7 10 36Total 34 (18%) 31 (17%) 42 (22%) 40 (21%) 41 (22%) 188
308 – Research and Training Center for Children’s Mental Health – Tampa, FL – 2003
Briscoe, Hill, Smith, Joseph, Sengova & McClain
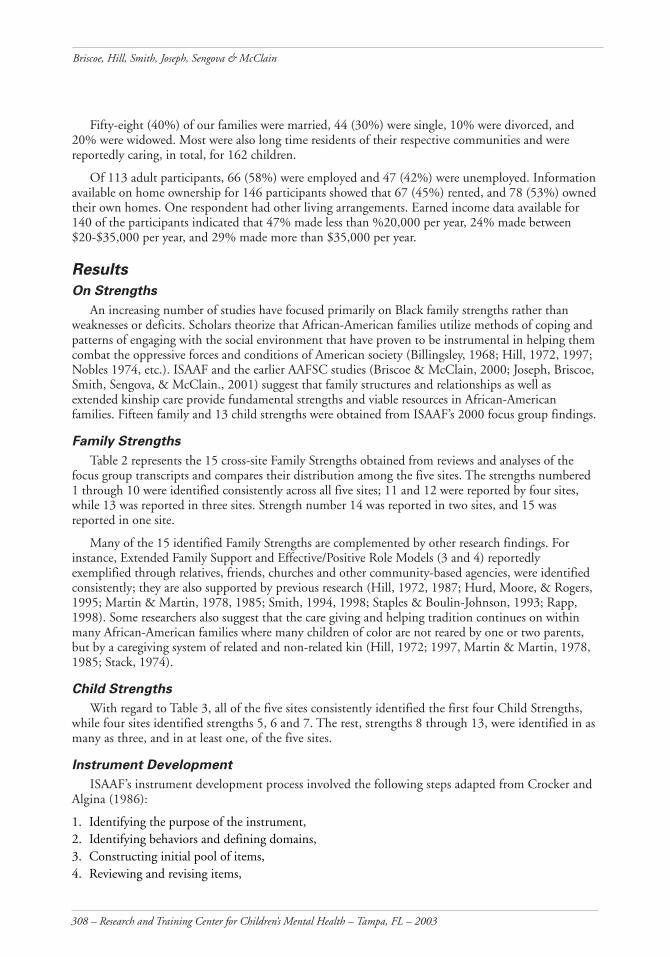
Fifty-eight (40%) of our families were married, 44 (30%) were single, 10% were divorced, and20% were widowed. Most were also long time residents of their respective communities and werereportedly caring, in total, for 162 children.
Of 113 adult participants, 66 (58%) were employed and 47 (42%) were unemployed. Informationavailable on home ownership for 146 participants showed that 67 (45%) rented, and 78 (53%) ownedtheir own homes. One respondent had other living arrangements. Earned income data available for140 of the participants indicated that 47% made less than %20,000 per year, 24% made between$20-$35,000 per year, and 29% made more than $35,000 per year.
Results
On Strengths
An increasing number of studies have focused primarily on Black family strengths rather thanweaknesses or deficits. Scholars theorize that African-American families utilize methods of coping andpatterns of engaging with the social environment that have proven to be instrumental in helping themcombat the oppressive forces and conditions of American society (Billingsley, 1968; Hill, 1972, 1997;Nobles 1974, etc.). ISAAF and the earlier AAFSC studies (Briscoe & McClain, 2000; Joseph, Briscoe,Smith, Sengova, & McClain., 2001) suggest that family structures and relationships as well asextended kinship care provide fundamental strengths and viable resources in African-Americanfamilies. Fifteen family and 13 child strengths were obtained from ISAAF’s 2000 focus group findings.
Family Strengths
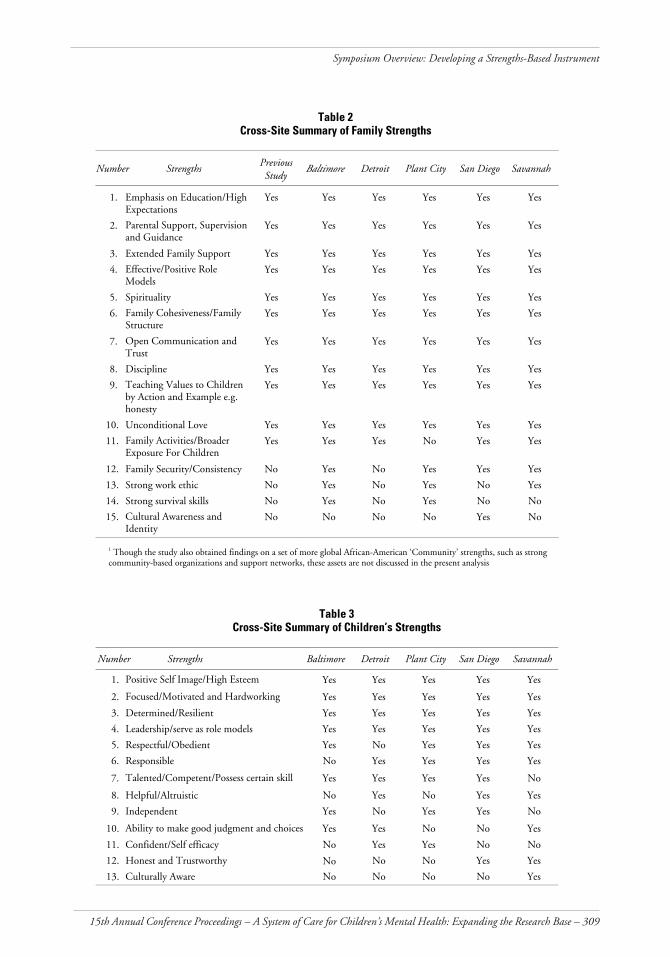
Table 2 represents the 15 cross-site Family Strengths obtained from reviews and analyses of thefocus group transcripts and compares their distribution among the five sites. The strengths numbered1 through 10 were identified consistently across all five sites; 11 and 12 were reported by four sites,while 13 was reported in three sites. Strength number 14 was reported in two sites, and 15 wasreported in one site.
Many of the 15 identified Family Strengths are complemented by other research findings. Forinstance, Extended Family Support and Effective/Positive Role Models (3 and 4) reportedlyexemplified through relatives, friends, churches and other community-based agencies, were identifiedconsistently; they are also supported by previous research (Hill, 1972, 1987; Hurd, Moore, & Rogers,1995; Martin & Martin, 1978, 1985; Smith, 1994, 1998; Staples & Boulin-Johnson, 1993; Rapp,1998). Some researchers also suggest that the care giving and helping tradition continues on withinmany African-American families where many children of color are not reared by one or two parents,but by a caregiving system of related and non-related kin (Hill, 1972; 1997, Martin & Martin, 1978,1985; Stack, 1974).
Child Strengths
With regard to Table 3, all of the five sites consistently identified the first four Child Strengths,while four sites identified strengths 5, 6 and 7. The rest, strengths 8 through 13, were identified in asmany as three, and in at least one, of the five sites.
Instrument Development
ISAAF’s instrument development process involved the following steps adapted from Crocker andAlgina (1986):
1. Identifying the purpose of the instrument,2. Identifying behaviors and defining domains,3. Constructing initial pool of items,4. Reviewing and revising items,
15th Annual Conference Proceedings – A System of Care for Children’s Mental Health: Expanding the Research Base – 309
Symposium Overview: Developing a Strengths-Based Instrument
Table 2Cross-Site Summary of Family Strengths
Number StrengthsPreviousStudy
Baltimore Detroit Plant City San Diego Savannah
1. Emphasis on Education/HighExpectations
Yes Yes Yes Yes Yes Yes
2. Parental Support, Supervisionand Guidance
Yes Yes Yes Yes Yes Yes
3. Extended Family Support Yes Yes Yes Yes Yes Yes
4. Effective/Positive RoleModels
Yes Yes Yes Yes Yes Yes
5. Spirituality Yes Yes Yes Yes Yes Yes
6. Family Cohesiveness/FamilyStructure
Yes Yes Yes Yes Yes Yes
7. Open Communication andTrust
Yes Yes Yes Yes Yes Yes
8. Discipline Yes Yes Yes Yes Yes Yes
9. Teaching Values to Childrenby Action and Example e.g.honesty
Yes Yes Yes Yes Yes Yes
10. Unconditional Love Yes Yes Yes Yes Yes Yes
11. Family Activities/BroaderExposure For Children
Yes Yes Yes No Yes Yes
12. Family Security/Consistency No Yes No Yes Yes Yes
13. Strong work ethic No Yes No Yes No Yes
14. Strong survival skills No Yes No Yes No No
15. Cultural Awareness andIdentity
No No No No Yes No
1 Though the study also obtained findings on a set of more global African-American ‘Community’ strengths, such as strongcommunity-based organizations and support networks, these assets are not discussed in the present analysis
Table 3Cross-Site Summary of Children’s Strengths
Number Strengths Baltimore Detroit Plant City San Diego Savannah
1. Positive Self Image/High Esteem Yes Yes Yes Yes Yes
2. Focused/Motivated and Hardworking Yes Yes Yes Yes Yes
3. Determined/Resilient Yes Yes Yes Yes Yes
4. Leadership/serve as role models Yes Yes Yes Yes Yes
5. Respectful/Obedient Yes No Yes Yes Yes
6. Responsible No Yes Yes Yes Yes
7. Talented/Competent/Possess certain skill Yes Yes Yes Yes No
8. Helpful/Altruistic No Yes No Yes Yes
9. Independent Yes No Yes Yes No
10. Ability to make good judgment and choices Yes Yes No No Yes
11. Confident/Self efficacy No Yes Yes No No
12. Honest and Trustworthy No No Yes Yes
13. Culturally Aware No No No No Yes
No
310 – Research and Training Center for Children’s Mental Health – Tampa, FL – 2003
Briscoe, Hill, Smith, Joseph, Sengova & McClain
5. Pilot testing the instrument,6. Field testing the items,7. Determining statistical properties on item scores,8. Designing and conducting reliability and validity studies, and9. Developing guidelines for instrument administration.
In addition to reviewing the literature on instrument development and African-Americanstrengths, researchers successfully completed steps 1 through 5 above. Step 2, identifying behaviorsand defining domains, and step 5, pilot testing, were particularly crucial to the instrumentdevelopment process.
Identifying Behaviors and Defining Domains
In order to identify the behaviors and define the domains, an iterative test specification process wasused to elucidate the substantive content of the fifteen Family Strength domains. This iterative testspecification involved describing behaviors, activities and values using the nuances and terminologyarticulated by focus group participants. This was an extremely important step because it ensured thatthe terminology, language and cultural ethnic nuances of the African-American families were capturedfrom the data.
Pilot Test and Data Analysis
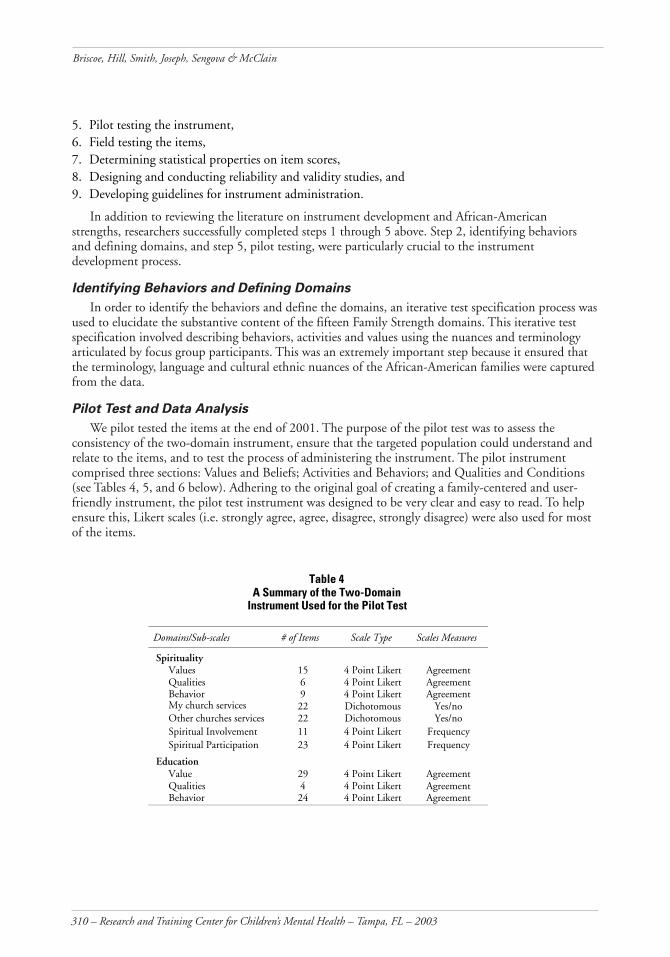
We pilot tested the items at the end of 2001. The purpose of the pilot test was to assess theconsistency of the two-domain instrument, ensure that the targeted population could understand andrelate to the items, and to test the process of administering the instrument. The pilot instrumentcomprised three sections: Values and Beliefs; Activities and Behaviors; and Qualities and Conditions(see Tables 4, 5, and 6 below). Adhering to the original goal of creating a family-centered and user-friendly instrument, the pilot test instrument was designed to be very clear and easy to read. To helpensure this, Likert scales (i.e. strongly agree, agree, disagree, strongly disagree) were also used for mostof the items.
Table 4A Summary of the Two-Domain
Instrument Used for the Pilot Test
Domains/Sub-scales # of Items Scale Type Scales Measures
SpiritualityValues 15 4 Point Likert AgreementQualities 6 4 Point Likert AgreementBehavior 9 4 Point Likert AgreementMy church services 22 Dichotomous Yes/noOther churches services 22 Dichotomous Yes/noSpiritual Involvement 11 4 Point Likert FrequencySpiritual Participation 23 4 Point Likert Frequency
EducationValue 29 4 Point Likert AgreementQualities 4 4 Point Likert AgreementBehavior 24 4 Point Likert Agreement
15th Annual Conference Proceedings – A System of Care for Children’s Mental Health: Expanding the Research Base – 311
Symposium Overview: Developing a Strengths-Based Instrument
Table 5Selected Results from Reliability Analysis for Two Scales,
10 Subscales and a Global Score on Pilot Study ofAssessment Instrument with Two Domains N=26
Scales/Subscales N Mean SDNumber of
Items Alpha
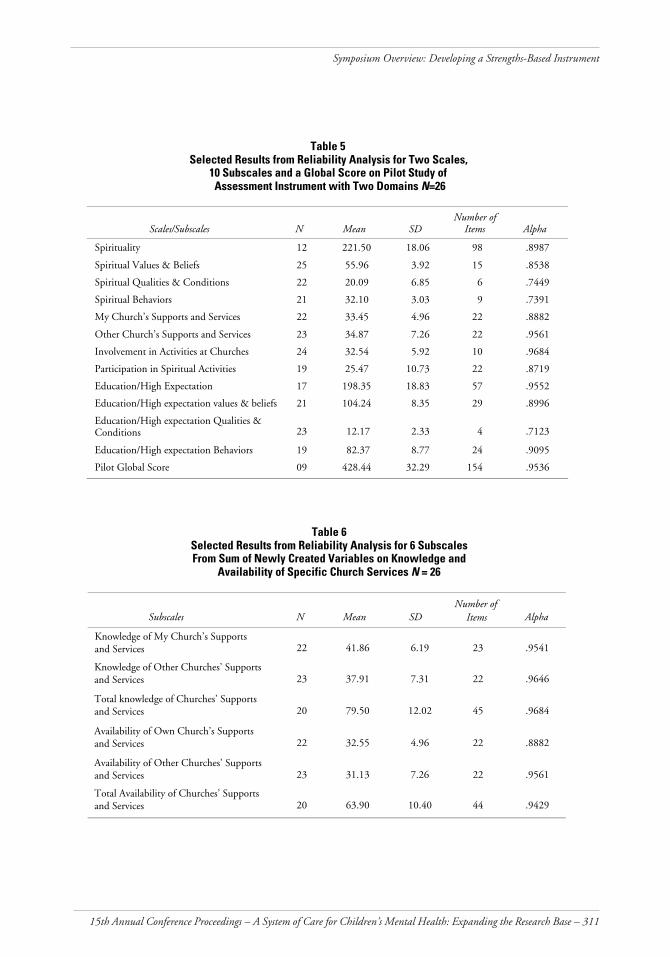
Spirituality 12 221.50 18.06 98 .8987
Spiritual Values & Beliefs 25 55.96 3.92 15 .8538
Spiritual Qualities & Conditions 22 20.09 6.85 6 .7449
Spiritual Behaviors 21 32.10 3.03 9 .7391
My Church’s Supports and Services 22 33.45 4.96 22 .8882
Other Church’s Supports and Services 23 34.87 7.26 22 .9561
Involvement in Activities at Churches 24 32.54 5.92 10 .9684
Participation in Spiritual Activities 19 25.47 10.73 22 .8719
Education/High Expectation 17 198.35 18.83 57 .9552
Education/High expectation values & beliefs 21 104.24 8.35 29 .8996
Education/High expectation Qualities &Conditions 23 12.17 2.33 4 .7123
Education/High expectation Behaviors 19 82.37 8.77 24 .9095
Pilot Global Score 09 428.44 32.29 154 .9536
Table 6Selected Results from Reliability Analysis for 6 SubscalesFrom Sum of Newly Created Variables on Knowledge and
Availability of Specific Church Services N = 26
Subscales N Mean SDNumber of
Items Alpha
Knowledge of My Church’s Supports and Services 22 41.86 6.19 23 .9541
Knowledge of Other Churches’ Supports and Services 23 37.91 7.31 22 .9646
Total knowledge of Churches’ Supports and Services 20 79.50 12.02 45 .9684
Availability of Own Church’s Supports and Services 22 32.55 4.96 22 .8882
Availability of Other Churches’ Supports and Services 23 31.13 7.26 22 .9561
Total Availability of Churches’ Supports and Services 20 63.90 10.40 44 .9429
312 – Research and Training Center for Children’s Mental Health – Tampa, FL – 2003
Briscoe, Hill, Smith, Joseph, Sengova & McClain
The pilot sample was obtained through an outreach and screening process similar to that used inthe recruitment of the focus groups. Twenty-six African-American caregivers who were raising or hadpreviously raised children were selected. They ranged in age from 19 to 74 years, with a mean averageage of 45 years.
Data analyses of the pilot test included the sample’s socio-demographic data from the screeningforms and the psychometric qualities of the instrument. Statistical analysis of the instrument wasbased on participants’ responses to the pilot test items and a descriptive analysis was performed on allvariables. Data were re-coded, making positive responses the higher values to aid in interpretingfindings. Cross tabs and an independent means t-test were performed on all scales using successful/non successful status to get some indication as to how the two groupings scored differently. Nosignificant differences were revealed between any scale or sub-scale scores.
Pilot Test Results and Findings
Initial data analysis indicated that overall, the items used to measure the two pilot domains ofSpirituality and Education were fairly consistently matched and showed promising internalconsistency on all scales. As indicated in Table 5, these items generally had alpha scores of .70 andabove. ISAAF researchers consider this estimate promising and a move in the right direction because itshows that the items in each of the two domains share much in common.
Discussion
ISAAF findings on African-American strengths obtained through these focus groups provided astrong foundation for the development of a strengths-based instrument. When fully developed, thisinstrument is expected to help African-American families, as well as their service providers, to identifyfamily strengths. Furthermore, it is expected that, with the support of their service providers, familiescan use these strengths to help support and nurture successful African-American children.
In order to revitalize low-income communities, it is imperative that initiatives build on their assetsand capabilities. Yet such initiatives will only succeed when grassroots groups are made genuinepartners in all phases of decision-making and implementation. ISAAF researchers have beencommitted to the scientific rigor involved in developing a culturally-sensitive instrument to identifythe strengths of African-American families and communities; this is one of the few assessment tools inthis nation to be developed and validated based on periodic feedback from community residents.
In summary, the implications and expectations of the value of this strengths-based instrumentremain very positive. Further studies are needed however, to help validate and expand on some of theISAAF strengths not previously identified; and more research on children’s strengths is needed tosupport/nullify some of the child strengths identified in this study. Researchers will pilot test thecomplete instrument with all fifteen strengths domains in 2002, and field-testing, reliability andvalidity testing are scheduled to occur in 2003 and 2004.
References
Billingsley, A. (1968). Black families in white America. Englewood Cliffs, N.J.: Prentice Hall.
Bonecutter, J., & J.P Gleeson. (1999). Achieving permanency for children in kinship foster care: Atraining manual. University Chicago Press.
Briscoe, R. V., & McClain, G., (2000). African-American family support analysis: Strengths of African-American families. Tampa, FL: Children’s Board of Hillsborough County.
Hill R. (1997). The strength of Black Families: Twenty five years later. Washington, DC: R & BPublishers.
15th Annual Conference Proceedings – A System of Care for Children’s Mental Health: Expanding the Research Base – 313
Symposium Overview: Developing a Strengths-Based Instrument
Hill, R. (1972). The strengths of Black families: New York, NY: Emerson Hall Press.
Hurd, E. P., Moore, C., & Rogers, R. (1995). Quiet success: parenting strengths among African-Americans. The Journal of Contemporary Human Services. 76(7), 434-443.
Joseph, R., Briscoe, J. R., Smith, A., Sengova, J., & McClain, G. (2001). Strengths of African-Americanfamilies: A cross-site analysis of families in Baltimore, Detroit, Plant City, San Diego and Savannah. Tampa, FL:Department of Child and Family Studies, Louis de la Parte Florida Mental Health Institute, University ofSouth Florida.
Martin, E. P., & Martin, J. M. (1978). The Black extended family. Chicago: University of Chicago Press.
Martin, J. M., & Martin, E. P. (1985). The helping tradition in the Black family and community. SilverSpring, MD: National Association of Social Workers.
Nobles, W. (1974). African Root and American Fruit. Journal of Social and Behavioral Sciences, 16: 52-64.
O’Brien, R. (1998). An overview of the methodological approach of action research. University of Toronto.Retrieved from: www.web.net/~robrien/papers/arfinal.html
Rapp, C. A. (1998). The strengths model; Care management with people from severe and persistent mentalillness. New York: Oxford University Press.
Smith, A. (1994, Summer). African American grandmothers’ war against the crack cocaine epidemic,Arete, 19. University of South Carolina Press.
Smith, A. (1998). Sisterhood among African-American mothers of daughters addicted to crackcocaine. In Kim M. Vaz (Ed.). Black women in America. Thousand Oaks, CA: Sage.
Stack, C. (1974). All our kin. New York: Harper & Row.
Staples, R., & Boulin-Johnson, L. (1993). Black families at the crossroads: Challenges and prospects. SanFrancisco: Jossey-Buss.
Strauss, A., & Corbin, J. M. (1998). Basics of qualitative research: Techniques and procedures fordeveloping grounded theory. Thousand Oaks, CA: Sage.
314 – Research and Training Center for Children’s Mental Health – Tampa, FL – 2003
Briscoe, Hill, Smith, Joseph, Sengova & McClain
SYMPOSIUM PRESENTERS
Richard Briscoe, Ph.D.Principal Investigator, Department of Child & Family Studies, Louis de la Parte FloridaMental Health Institute, University of South Florida, Tampa FL 33612; 813-974-6413,fax: 813-9747563; e-mail: [email protected]
Aaron Smith, Ph.D.Co-Principal Investigator, Department of Social Work, University of South Florida, TampaFL 33620; 813-974-1356, fax: 813-9747563; e-mail: [email protected]
Ruby Joseph, M.P.A.Co-Principal Investigator, Department of Child & Family Studies, Louis de la ParteFlorida Mental Health Institute, University of South Florida, Tampa FL 33612;813-974-9339, fax: 813-9747563; e-mail: [email protected]
Joko Sengova, Ph.D.Project Coordinator, Department of Child & Family Studies, Louis de la Parte FloridaMental Health Institute, University of South Florida, Tampa FL 33612; 813-974-4686,fax: 813-9747563; e-mail: [email protected]
Gwen McClain, M.A.Instrument Development Consultant, 505 South Gordon Street, Plant City, FL 33563
Robert Hill, Ph.D.Symposium Discussant, WESTAT, 1650 Research Boulevard, Rockville, MD. 20850-3195;301-251-1500, fax: 888-294-2040; e-mail: [email protected]