Embed Size (px)
Citation preview
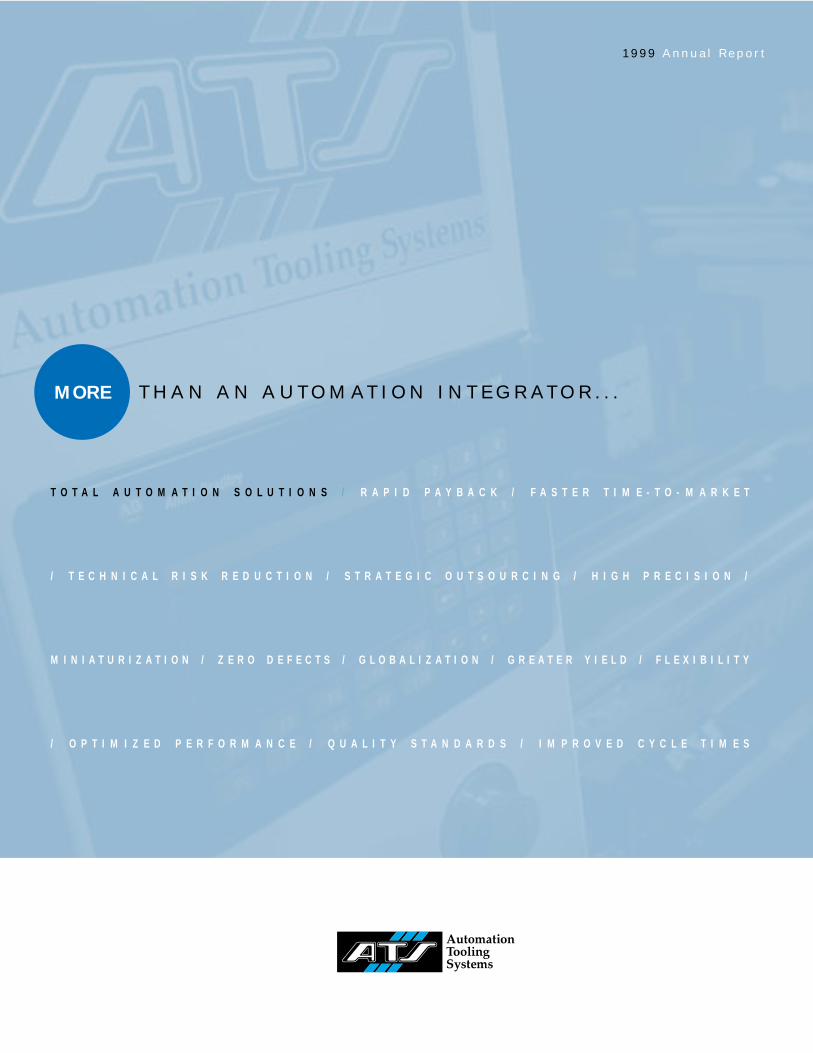
1 9 9 9 A n n u a l R e p o r t
T O T A L A U T O M A T I O N S O L U T I O N S / R A P I D P A Y B A C K / F A S T E R T I M E - T O - M A R K E T
/ T E C H N I C A L R I S K R E D U C T I O N / S T R A T E G I C O U T S O U R C I N G / H I G H P R E C I S I O N /
M I N I A T U R I Z A T I O N / Z E R O D E F E C T S / G L O B A L I Z A T I O N / G R E A T E R Y I E L D / F L E X I B I L I T Y
/ O P T I M I Z E D P E R F O R M A N C E / Q U A L I T Y S T A N D A R D S / I M P R O V E D C Y C L E T I M E S
M O R E T H A N A N A U T O M A T I O N I N T E G R A T O R . . .MORE
ATS Automation Tooling Systems Inc. is a
leading designer and producer of turn-key
automated manufacturing and test systems,
which are used primarily by multinational
corporations to reduce costs, improve quality
and expand capacity.
Using its own custom-built manufacturing
systems, process knowledge and automation
technology, the Company is also a high
volume manufacturer of plastic and metal
precision components and sub-assemblies
for automotive, microelectronics and other
customers.
ATS employs approximately 2,400 people
at 19 facilities in Canada, the United States,
Europe and Asia-Pacific. The Company’s
shares are traded on The Toronto Stock
Exchange under the symbol ATA. (Internet
website address: www.atsautomation.com).
C O R P O R AT E P R O F I L E
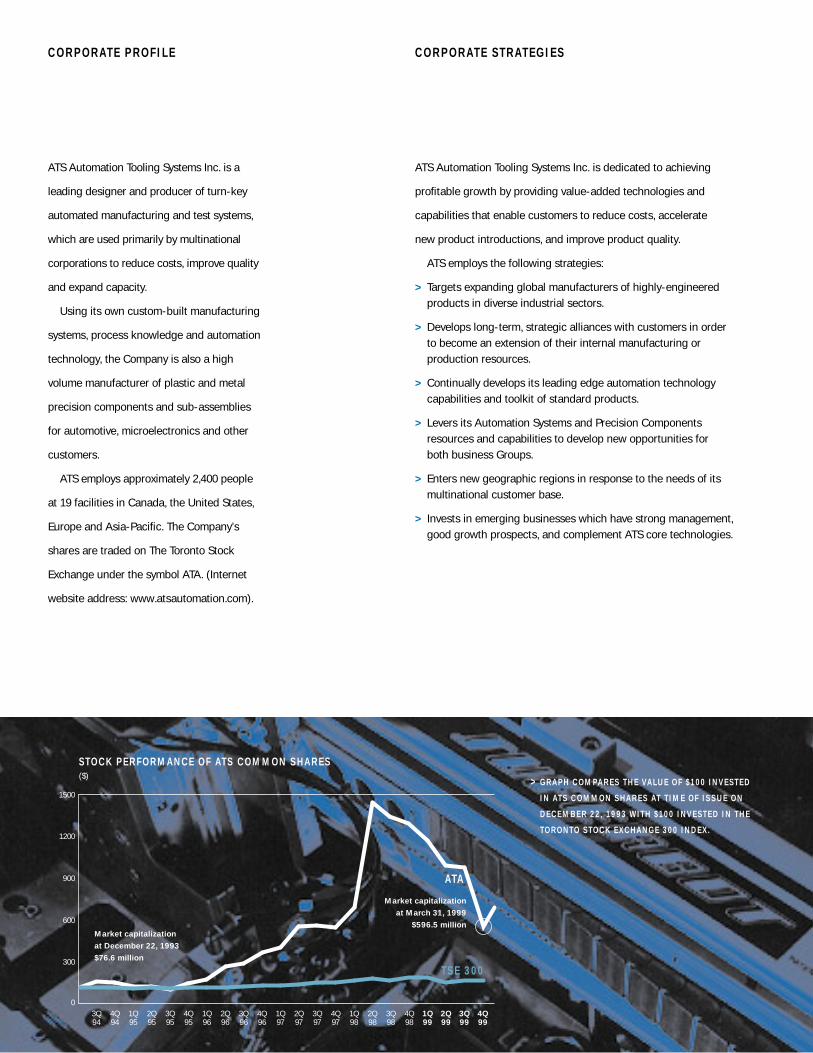
> G R A P H C O M PA R E S T H E VA L U E O F $ 10 0 I N V E ST E D
I N ATS C O M M O N S H A R E S AT T I M E O F I S S U E O N
D E C E M B E R 2 2 , 19 9 3 W I T H $ 10 0 I N V E ST E D I N T H E
TO R O N TO STO C K E X C H A N G E 3 0 0 I N D E X .
STO C K P E R F O R M A N C E O F ATS C O M M O N S H A R E S ($)
3Q 94
4Q 94
1Q 95
2Q 95
3Q 95
4Q 95
1Q 96
2Q 96
3Q 96
4Q 96
1Q 97
2Q 97
3Q 97
4Q 97
1Q 98
2Q 98
3Q 98
4Q 98
1Q 99
2Q 99
3Q 99
4Q 99
0
300
600
900
1200
1500
Market capitalization at March 31, 1999
$596.5 million
ATA
TS E 3 0 0
Market capitalization at December 22, 1993 $76.6 million
ATS Automation Tooling Systems Inc. is dedicated to achieving
profitable growth by providing value-added technologies and
capabilities that enable customers to reduce costs, accelerate
new product introductions, and improve product quality.
ATS employs the following strategies:
> Targets expanding global manufacturers of highly-engineeredproducts in diverse industrial sectors.
> Develops long-term, strategic alliances with customers in order to become an extension of their internal manufacturing orproduction resources.
> Continually develops its leading edge automation technologycapabilities and toolkit of standard products.
> Levers its Automation Systems and Precision Componentsresources and capabilities to develop new opportunities forboth business Groups.
> Enters new geographic regions in response to the needs of itsmultinational customer base.
> Invests in emerging businesses which have strong management,good growth prospects, and complement ATS core technologies.
C O R P O R AT E ST R AT E G I E S
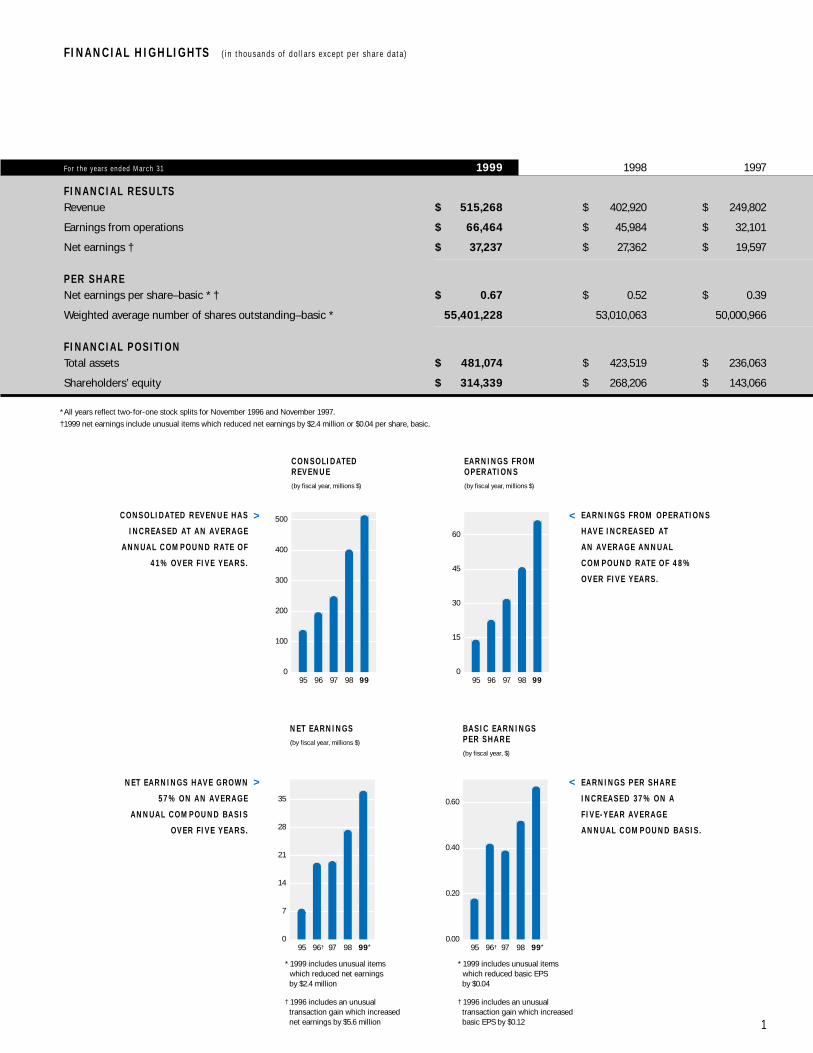
F o r t h e y e a r s e n d e d M a r c h 3 1 1999 1998 1997
F I N A N C I A L R E S U LTSRevenue $ 515,268 $ 402,920 $ 249,802
Earnings from operations $ 66,464 $ 45,984 $ 32,101
Net earnings † $ 37,237 $ 27,362 $ 19,597
P E R S H A R ENet earnings per share–basic * † $ 0.67 $ 0.52 $ 0.39
Weighted average number of shares outstanding–basic * 55,401,228 53,010,063 50,000,966
F I N A N C I A L P O S I T I O NTotal assets $ 481,074 $ 423,519 $ 236,063
Shareholders’ equity $ 314,339 $ 268,206 $ 143,066
* All years reflect two-for-one stock splits for November 1996 and November 1997.
†1999 net earnings include unusual items which reduced net earnings by $2.4 million or $0.04 per share, basic.
1
F I N A N C I A L H I G H L I G H TS ( i n t h o u s a n d s o f d o l l a r s e x c e p t p e r s h a r e d a t a )
0
100
200
300
400
500
95 96 97 98 99
C O N S O L I DAT E D R E V E N U E (by fiscal year, millions $)
BA S I C E A R N I N G S P E R S H A R E (by fiscal year, $)
0.00
0.20
0.40
0.60
* 1999 includes unusual items which reduced basic EPS by $0.04
† 1996 includes an unusual transaction gain which increased basic EPS by $0.12
95 96† 97 98 99*
95 96 97 98 99
E A R N I N G S F R O M O P E R AT I O N S (by fiscal year, millions $)
0
15
30
45
60
N E T E A R N I N G S (by fiscal year, millions $)
0
7
14
21
28
35
95 96† 97 98 99*
* 1999 includes unusual items which reduced net earnings by $2.4 million
† 1996 includes an unusual transaction gain which increased net earnings by $5.6 million
C O N S O L I DAT E D R E V E N U E H A S
I N C R E A S E D AT A N AV E R A G E
A N N UA L C O M P O U N D R AT E O F
4 1% O V E R F I V E Y E A R S .
E A R N I N G S F R O M O P E R AT I O N S
H AV E I N C R E A S E D AT
A N AV E R A G E A N N UA L
C O M P O U N D R AT E O F 4 8 %
O V E R F I V E Y E A R S .
N E T E A R N I N G S H AV E G R O W N
57 % O N A N AV E R A G E
A N N UA L C O M P O U N D BA S I S
O V E R F I V E Y E A R S .
E A R N I N G S P E R S H A R E
I N C R E A S E D 37 % O N A
F I V E -Y E A R AV E R A G E
A N N UA L C O M P O U N D BA S I S .
> >
> >
2
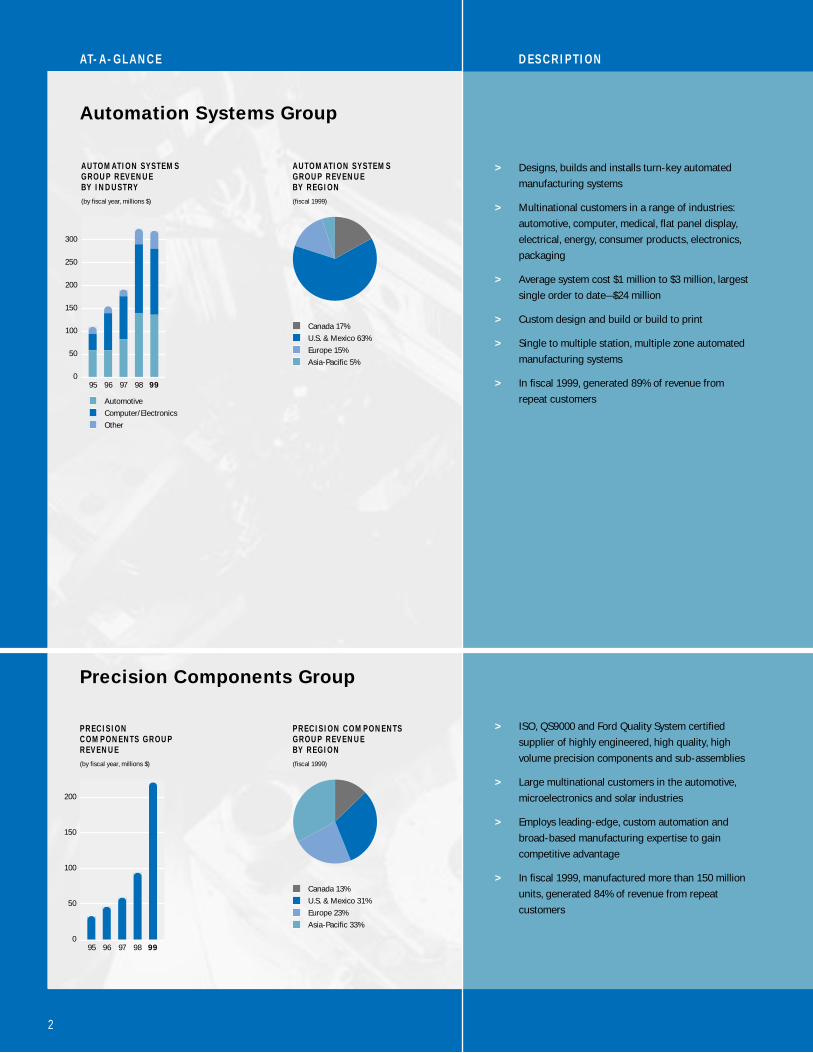
Automation Systems Group
> Designs, builds and installs turn-key automated
manufacturing systems
> Multinational customers in a range of industries:
automotive, computer, medical, flat panel display,
electrical, energy, consumer products, electronics,
packaging
> Average system cost $1 million to $3 million, largest
single order to date—$24 million
> Custom design and build or build to print
> Single to multiple station, multiple zone automated
manufacturing systems
> In fiscal 1999, generated 89% of revenue from
repeat customers
Precision Components Group
> ISO, QS9000 and Ford Quality System certified
supplier of highly engineered, high quality, high
volume precision components and sub-assemblies
> Large multinational customers in the automotive,
microelectronics and solar industries
> Employs leading-edge, custom automation and
broad-based manufacturing expertise to gain
competitive advantage
> In fiscal 1999, manufactured more than 150 million
units, generated 84% of revenue from repeat
customers
95 96
Automotive
Computer/Electronics
Other
97 98 99
A U TO M AT I O N SYST E M S G R O U P R E V E N U E BY I N D U ST RY (by fiscal year, millions $)
0
50
100
150
200
250
300
Canada 17%
U.S. & Mexico 63%
Europe 15%
Asia-Pacific 5%
A U TO M AT I O N SYST E M S G R O U P R E V E N U E BY R E G I O N (fiscal 1999)
0
50
100
150
200
95 96 97 98 99
P R E C I S I O N C O M P O N E N TS G R O U P R E V E N U E (by fiscal year, millions $)
Canada 13%
U.S. & Mexico 31%
Europe 23%
Asia-Pacific 33%
P R E C I S I O N C O M P O N E N TS G R O U P R E V E N U E BY R E G I O N (fiscal 1999)
AT- A - G L A N C E D E S C R I P T I O N
3
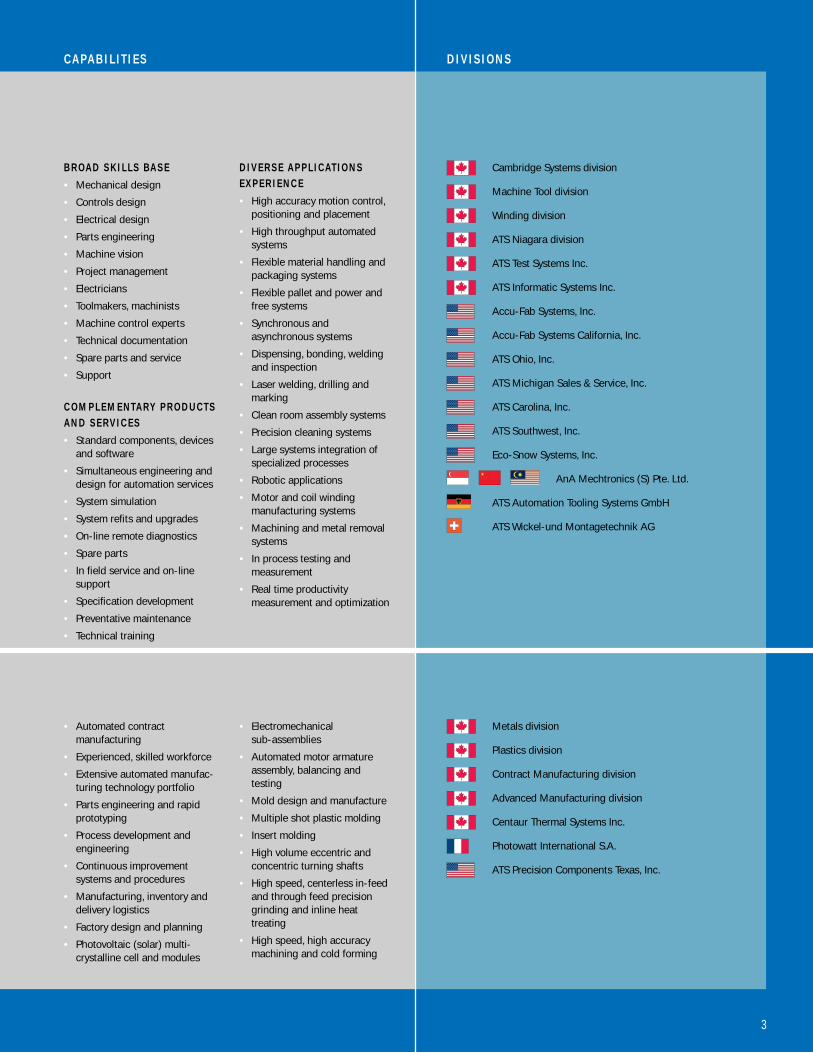
B R OA D S K I L LS BA S E
• Mechanical design
• Controls design
• Electrical design
• Parts engineering
• Machine vision
• Project management
• Electricians
• Toolmakers, machinists
• Machine control experts
• Technical documentation
• Spare parts and service
• Support
C O M P L E M E N TA RY P R O D U CTSA N D S E R V I C E S
• Standard components, devicesand software
• Simultaneous engineering anddesign for automation services
• System simulation
• System refits and upgrades
• On-line remote diagnostics
• Spare parts
• In field service and on-linesupport
• Specification development
• Preventative maintenance
• Technical training
D I V E R S E A P P L I CAT I O N SE X P E R I E N C E
• High accuracy motion control,positioning and placement
• High throughput automatedsystems
• Flexible material handling andpackaging systems
• Flexible pallet and power andfree systems
• Synchronous andasynchronous systems
• Dispensing, bonding, weldingand inspection
• Laser welding, drilling andmarking
• Clean room assembly systems
• Precision cleaning systems
• Large systems integration ofspecialized processes
• Robotic applications
• Motor and coil windingmanufacturing systems
• Machining and metal removalsystems
• In process testing andmeasurement
• Real time productivitymeasurement and optimization
Cambridge Systems division
Machine Tool division
Winding division
ATS Niagara division
ATS Test Systems Inc.
ATS Informatic Systems Inc.
Accu-Fab Systems, Inc.
Accu-Fab Systems California, Inc.
ATS Ohio, Inc.
ATS Michigan Sales & Service, Inc.
ATS Carolina, Inc.
ATS Southwest, Inc.
Eco-Snow Systems, Inc.
AnA Mechtronics (S) Pte. Ltd.
ATS Automation Tooling Systems GmbH
ATS Wickel-und Montagetechnik AG
• Automated contractmanufacturing
• Experienced, skilled workforce
• Extensive automated manufac-turing technology portfolio
• Parts engineering and rapidprototyping
• Process development andengineering
• Continuous improvementsystems and procedures
• Manufacturing, inventory anddelivery logistics
• Factory design and planning
• Photovoltaic (solar) multi-crystalline cell and modules
• Electromechanicalsub-assemblies
• Automated motor armatureassembly, balancing andtesting
• Mold design and manufacture
• Multiple shot plastic molding
• Insert molding
• High volume eccentric andconcentric turning shafts
• High speed, centerless in-feedand through feed precisiongrinding and inline heattreating
• High speed, high accuracymachining and cold forming
Metals division
Plastics division
Contract Manufacturing division
Advanced Manufacturing division
Centaur Thermal Systems Inc.
Photowatt International S.A.
ATS Precision Components Texas, Inc.
CA PA B I L I T I E S D I V I S I O N S
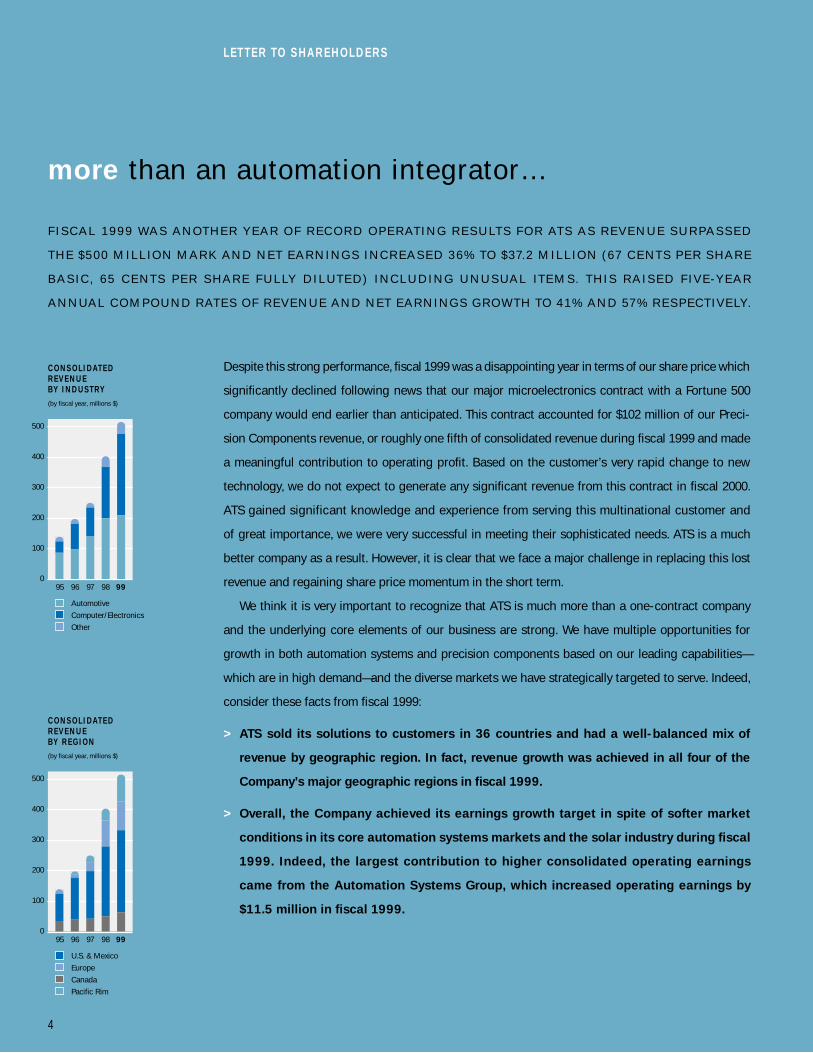
more than an automation integrator…
F I S C A L 1 9 9 9 WA S A N OT H E R Y E A R O F R E C O R D O P E R AT I N G R E S U LT S F O R AT S A S R E V E N U E S U R PA S S E D
T H E $ 5 0 0 M I L L I O N M A R K A N D N E T E A R N I N G S I N C R E A S E D 3 6 % TO $ 37. 2 M I L L I O N ( 67 C E N T S P E R S H A R E
B A S I C , 6 5 C E N T S P E R S H A R E F U L LY D I L U T E D ) I N C L U D I N G U N U S UA L I T E M S . T H I S R A I S E D F I V E -Y E A R
A N N UA L C O M P O U N D R AT E S O F R E V E N U E A N D N E T E A R N I N G S G R O W T H TO 4 1 % A N D 57 % R E S P E CT I V E LY.
Despite this strong performance, fiscal 1999 was a disappointing year in terms of our share price which
significantly declined following news that our major microelectronics contract with a Fortune 500
company would end earlier than anticipated. This contract accounted for $102 million of our Preci-
sion Components revenue, or roughly one fifth of consolidated revenue during fiscal 1999 and made
a meaningful contribution to operating profit. Based on the customer’s very rapid change to new
technology, we do not expect to generate any significant revenue from this contract in fiscal 2000.
ATS gained significant knowledge and experience from serving this multinational customer and
of great importance, we were very successful in meeting their sophisticated needs. ATS is a much
better company as a result. However, it is clear that we face a major challenge in replacing this lost
revenue and regaining share price momentum in the short term.
We think it is very important to recognize that ATS is much more than a one-contract company
and the underlying core elements of our business are strong. We have multiple opportunities for
growth in both automation systems and precision components based on our leading capabilities—
which are in high demand—and the diverse markets we have strategically targeted to serve. Indeed,
consider these facts from fiscal 1999:
> ATS sold its solutions to customers in 36 countries and had a well-balanced mix of
revenue by geographic region. In fact, revenue growth was achieved in all four of the
Company’s major geographic regions in fiscal 1999.
> Overall, the Company achieved its earnings growth target in spite of softer market
conditions in its core automation systems markets and the solar industry during fiscal
1999. Indeed, the largest contribution to higher consolidated operating earnings
came from the Automation Systems Group, which increased operating earnings by
$11.5 million in fiscal 1999.
4
L E T T E R TO S H A R E H O L D E R S
0
100
200
300
400
500
95 96
U.S. & Mexico
Europe
Canada
Pacific Rim
97 98 99
C O N S O L I DAT E D R E V E N U E BY R E G I O N (by fiscal year, millions $)
0
100
200
300
400
500
95 96
Automotive
Computer/Electronics
Other
97 98 99
C O N S O L I DAT E D R E V E N U E BY I N D U ST RY (by fiscal year, millions $)
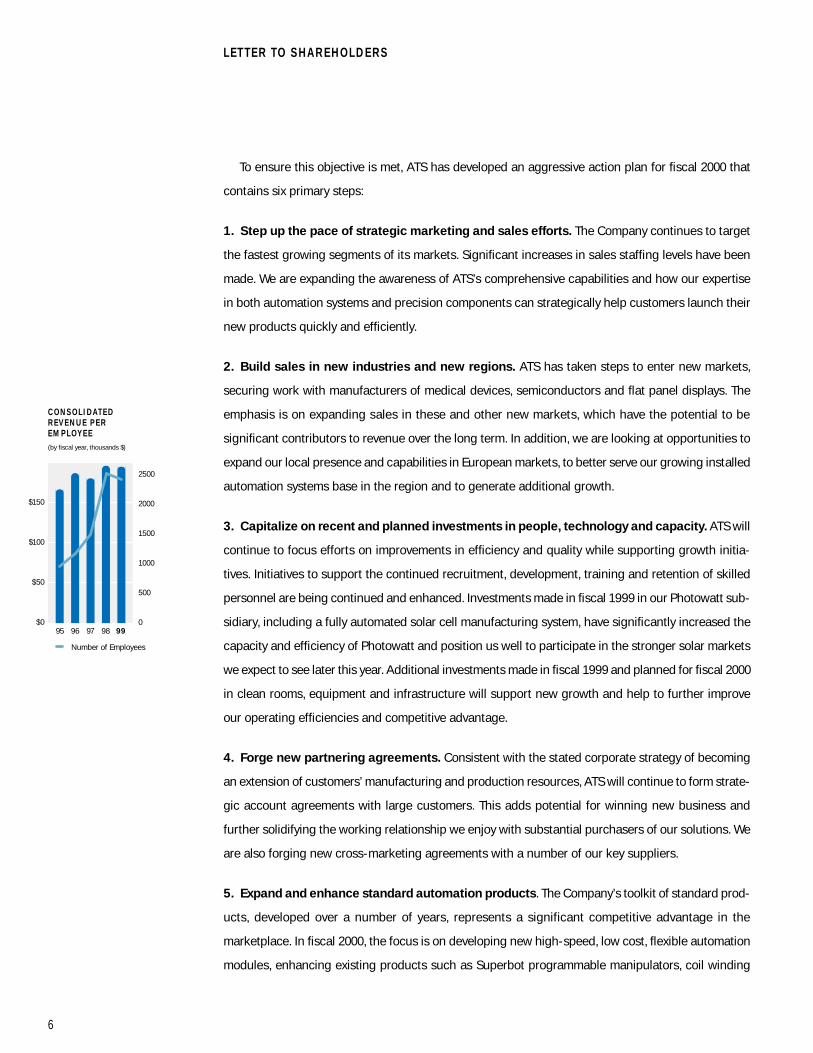
> Excluding the microelectronics contract, our Precision Components Group expanded its
revenue by 27% in fiscal 1999 to $118.9 million.
> ATS served many different industries that generated substantial revenue and growth
in fiscal 1999 including automotive ($209.4 million, up 5%), computer/electronics
($266.3 million, up 57%) and other diverse industries ($39.6 million, up 16%).
Operationally, we also made significant progress, both in preparing for new growth and in secur-
ing new sources of revenue. For example:
> In fiscal 1999, ATS opened a precision components facility in McAllen, Texas to serve a
growing number of customers in the southwestern United States and Mexico.
> A facility dedicated to building smaller custom automation systems was established in
southern Ontario and is now generating attractive volumes.
> Photowatt International launched a new 125 mm solar cell as well as 75 and 100 kilowatt
solar modules which are attracting high interest and orders in the solar energy market.
> The Company successfully launched a proprietary standard workcell using Eco-SnowTM
Precision Cleaning technology to clean magneto resistive read/write heads—a niche
segment of the disk drive industry. Eco-Snow significantly outpaced its fiscal 1999
revenue target.
Our unique global presence and combination of knowledge, experience, innovation and toolkit of
advanced products and technologies makes us more than just an automation integrator. It means ATS
is a company that is well positioned to capitalize on the market trends and needs which create demand
for our products and technology. We are strong in many ways and we are committed to building
shareholder wealth.
5
95 96 97 98 99
E A R N I N G S F R O M O P E R AT I O N S (by fiscal year, millions $)
0
15
30
45
60
95 96 97 98 99
A U TO M AT I O N SYST E M S O R D E R BA C K LO G * (at March 31, millions $)
0
35
70
105
140
* excludes internal backlog
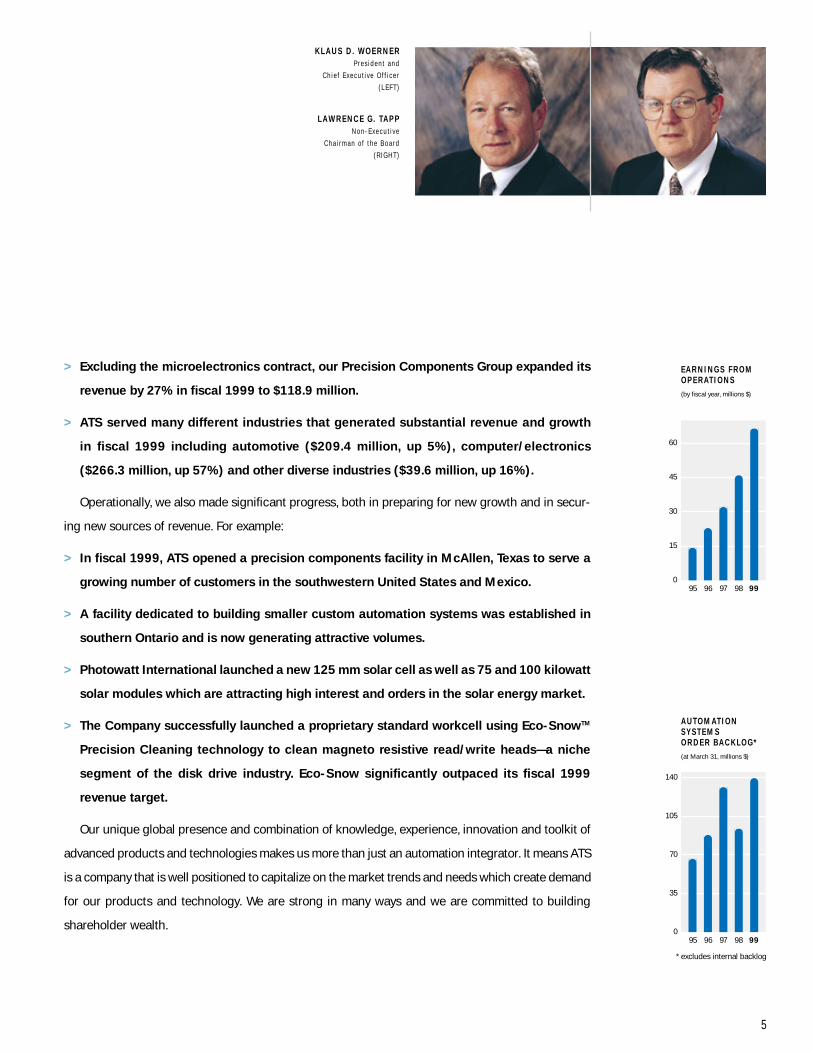
K L A U S D . W O E R N E RP r e s i d e n t a n d
C h i e f E x e c u t i v e O f f i c e r
( L E F T )
L A W R E N C E G . TA P PN o n - E x e c u t i v e
C h a i r m a n o f t h e B o a r d
( R I G H T )
To ensure this objective is met, ATS has developed an aggressive action plan for fiscal 2000 that
contains six primary steps:
1. Step up the pace of strategic marketing and sales efforts. The Company continues to target
the fastest growing segments of its markets. Significant increases in sales staffing levels have been
made. We are expanding the awareness of ATS’s comprehensive capabilities and how our expertise
in both automation systems and precision components can strategically help customers launch their
new products quickly and efficiently.
2. Build sales in new industries and new regions. ATS has taken steps to enter new markets,
securing work with manufacturers of medical devices, semiconductors and flat panel displays. The
emphasis is on expanding sales in these and other new markets, which have the potential to be
significant contributors to revenue over the long term. In addition, we are looking at opportunities to
expand our local presence and capabilities in European markets, to better serve our growing installed
automation systems base in the region and to generate additional growth.
3. Capitalize on recent and planned investments in people, technology and capacity. ATS will
continue to focus efforts on improvements in efficiency and quality while supporting growth initia-
tives. Initiatives to support the continued recruitment, development, training and retention of skilled
personnel are being continued and enhanced. Investments made in fiscal 1999 in our Photowatt sub-
sidiary, including a fully automated solar cell manufacturing system, have significantly increased the
capacity and efficiency of Photowatt and position us well to participate in the stronger solar markets
we expect to see later this year. Additional investments made in fiscal 1999 and planned for fiscal 2000
in clean rooms, equipment and infrastructure will support new growth and help to further improve
our operating efficiencies and competitive advantage.
4. Forge new partnering agreements. Consistent with the stated corporate strategy of becoming
an extension of customers’ manufacturing and production resources, ATS will continue to form strate-
gic account agreements with large customers. This adds potential for winning new business and
further solidifying the working relationship we enjoy with substantial purchasers of our solutions. We
are also forging new cross-marketing agreements with a number of our key suppliers.
5. Expand and enhance standard automation products. The Company’s toolkit of standard prod-
ucts, developed over a number of years, represents a significant competitive advantage in the
marketplace. In fiscal 2000, the focus is on developing new high-speed, low cost, flexible automation
modules, enhancing existing products such as Superbot programmable manipulators, coil winding
6
95 96 97 98 99
C O N S O L I DAT E D R E V E N U E P E R E M P LOY E E (by fiscal year, thousands $)
Number of Employees
$0
$50
$100
$150
0
500
1000
1500
2000
2500
L E T T E R TO S H A R E H O L D E R S
and machine tool equipment and launching standard automation workcells for targeted markets.
Supertrak, a multi-speed, pallet-based revolutionary transport system, is expected to begin Beta test-
ing with selected customers in fiscal 2000. A new Eco-Snow proprietary standard workcell for disk
cleaning applications is in advanced development and will be launched in fiscal 2000 and additional
product applications for this promising cleaning technology are being considered.
6. Continue to control costs, enhance productivity and improve quality and cycle times.
These are ongoing priorities for ATS, reflecting the Company’s desire to reward customers with bet-
ter custom designed automation systems delivered more rapidly and shareholders with solid profit
margins. The Company continues to benefit from the dedicated application of ISO 9001 and related
quality systems throughout the organization. Project and department managers have been tasked with
specific objectives in support of these goals.
ATS is focused on deploying capital in areas that will generate profitable growth and has the finan-
cial foundation to carry out each of these steps. Balance sheet data at March 31, 1999 shows the
Company had $65.9 million in cash, $314 million in shareholders’ equity and a very healthy debt to
equity ratio of 0.16 to one. This strong platform gives ATS considerable financial flexibility to enhance
operations and pursue new growth going forward.
Outlook
ATS started the new fiscal year with a substantial amount of new automation systems work on hand.
Period end automation systems backlog was $140 million, up 49% from year-end fiscal 1998, reflect-
ing recent successes in winning new business and what appears to be a more robust automation
systems market. The outlook for our core Precision Components businesses is also positive based on
their positioning in key geographic markets, accelerating demand for strategic outsourcing among
customers, and the foundation of automation technologies and advanced manufacturing knowledge
that make this Group a value-added supplier.
In summary, ATS is capable of offering more to both customers and shareholders over the long term.
The best is by no means behind us. We are dedicated to rewarding our loyal shareholders, customers
and employees for many years to come.
Klaus D. Woerner (Signed) Lawrence G. Tapp (Signed)P R E S I D E N T A N D C H I E F E X E C U T I V E O F F I C E R N O N - E X E C U T I V E C H A I R M A N O F T H E B O A R D
J U N E 2 2 , 1 9 9 9
7
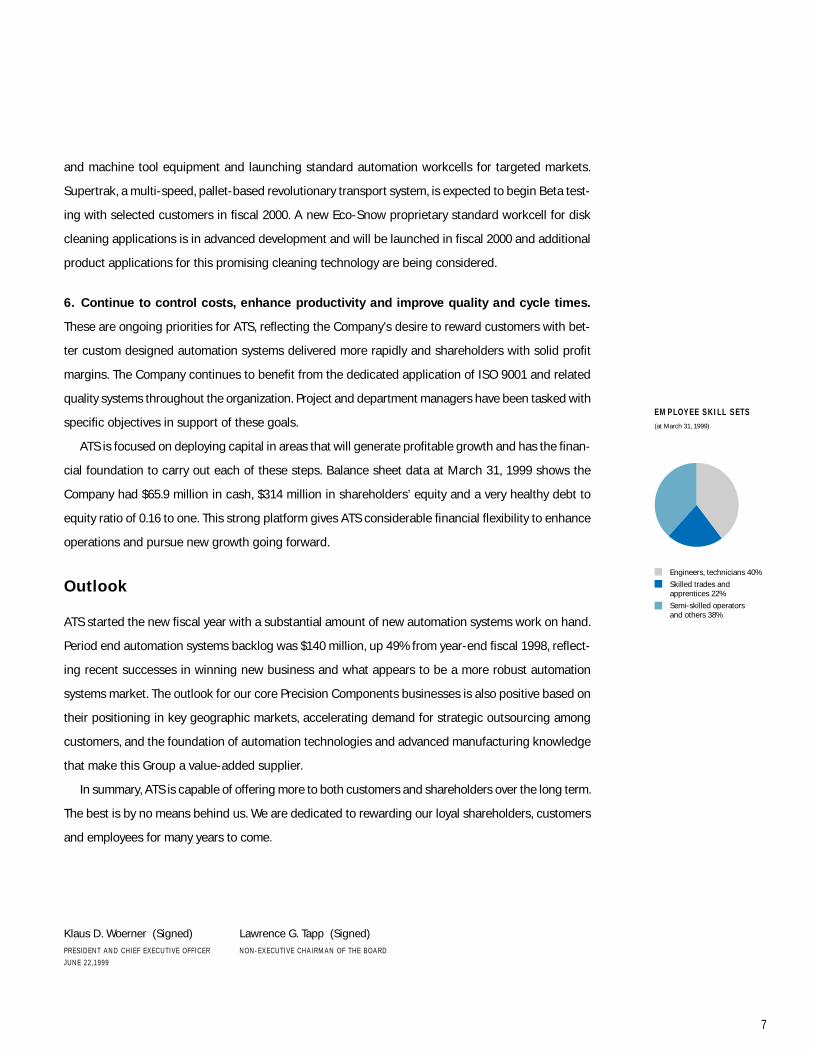
Engineers, technicians 40%
Skilled trades and apprentices 22%
Semi-skilled operators and others 38%
E M P LOY E E S K I L L S E TS (at March 31, 1999)
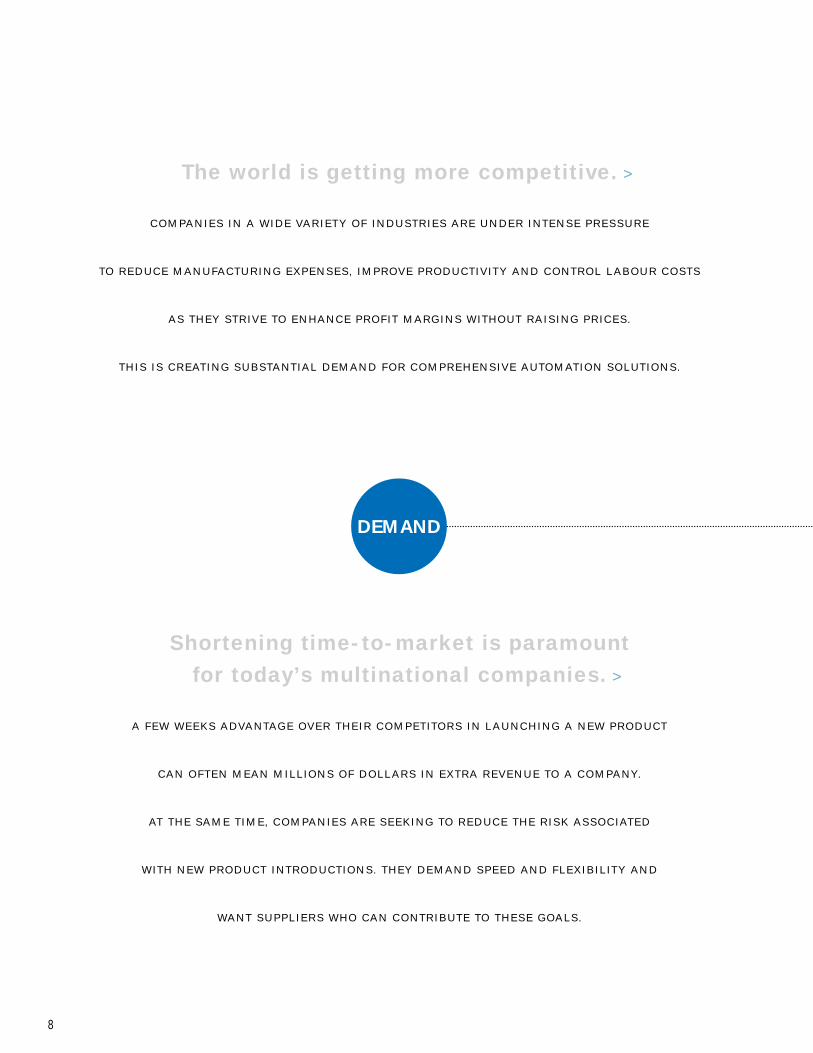
> The world is getting more competitive. >
C O M PA N I E S I N A W I D E VA R I E T Y O F I N D U S T R I E S A R E U N D E R I N T E N S E P R E S S U R E
TO R E D U C E M A N U FA CT U R I N G E X P E N S E S , I M P R O V E P R O D U CT I V I T Y A N D C O N T R O L L A B O U R C O S T S
A S T H E Y S T R I V E TO E N H A N C E P R O F I T M A R G I N S W I T H O U T R A I S I N G P R I C E S .
T H I S I S C R E AT I N G S U B S TA N T I A L D E M A N D F O R C O M P R E H E N S I V E A U TO M AT I O N S O L U T I O N S .
Shortening time-to-market is paramount > for today’s multinational companies. >
A F E W W E E K S A D VA N TA G E O V E R T H E I R C O M P E T I TO R S I N L A U N C H I N G A N E W P R O D U CT
C A N O F T E N M E A N M I L L I O N S O F D O L L A R S I N E X T R A R E V E N U E TO A C O M PA N Y.
AT T H E S A M E T I M E , C O M PA N I E S A R E S E E K I N G TO R E D U C E T H E R I S K A S S O C I AT E D
W I T H N E W P R O D U CT I N T R O D U CT I O N S . T H E Y D E M A N D S P E E D A N D F L E X I B I L I T Y A N D
WA N T S U P P L I E R S W H O C A N C O N T R I B U T E TO T H E S E G OA L S .
8
DEMAND
A S A S I N G L E S O U R C E S U P P L I E R O F A U TO M AT I O N P R O D U CT S , S K I L L S , T E C H N O LO G I E S
and knowledge, ATS is strategically positioned to dramatically increase the competitiveness of its customers.
Its turn-key automation systems offer customers rapid payback—usually within 18 to 24 months—through
sharp increases in productivity and manufacturing yields and a reduction in direct costs.
AT S H A S T H E B R OA D R A N G E O F T E C H N I C A L R E S O U R C E S , K N O W L E D G E
and skills to help customers bring their new products to market quickly and cost effec-
tively. To further assist customers in accelerating their time-to-market while reducing
their technical risks, ATS has a toolkit of standard automation products that can be
rapidly deployed as part of a complete custom-designed turn-key automation system.
These products include vision inspection systems, coil winders, motor armature winders,
automated machining centres, high accuracy, programmable robots, clean room con-
veyors and high-volume metal removal and machining systems. Each is proven to deliver
superior performance, flexibility and reliability compared to other commercially
available products. Employing standard products or standard automated workcells
gives ATS customers highly flexible and redeployable automation assets. With standard
products at the ready, ATS is also able to channel greater resources into those areas of
each automation project that require inventive thinking. The net result is better solutions
more rapidly deployed.
9
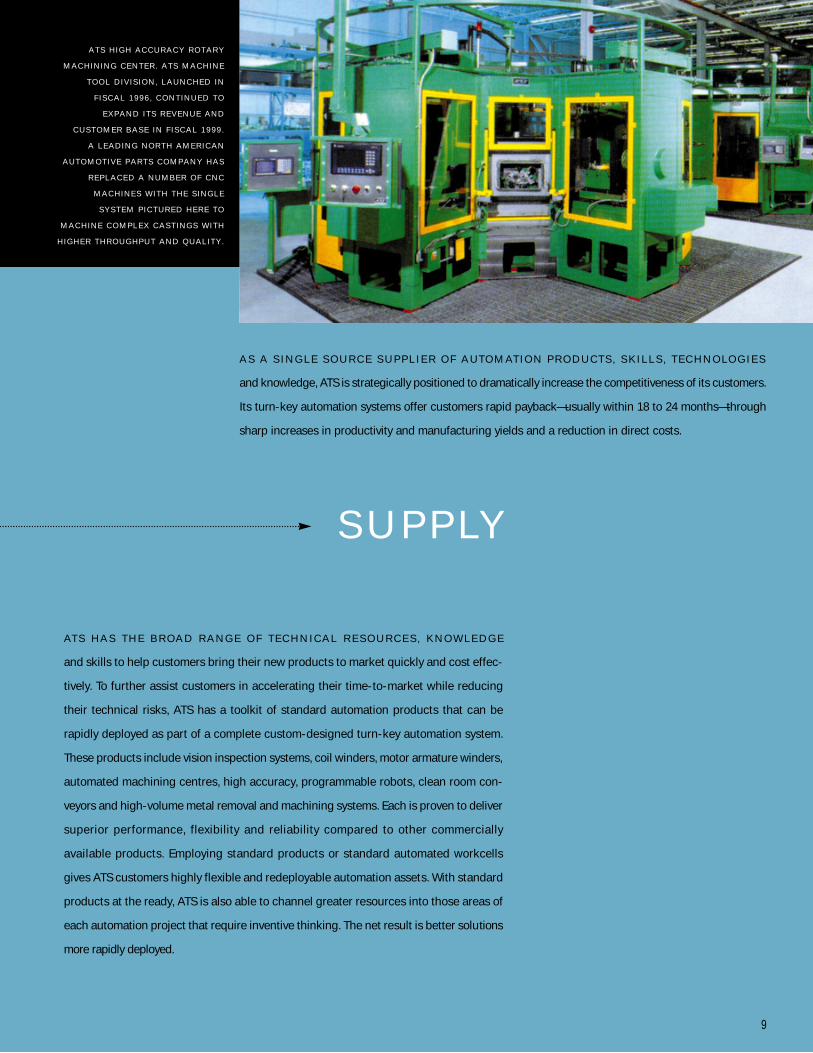
A T S H I G H A C C U R A C Y R O T A R Y
M A C H I N I N G C E N T E R . A T S M A C H I N E
T O O L D I V I S I O N , L A U N C H E D I N
F I S C A L 1 9 9 6 , C O N T I N U E D T O
E X P A N D I T S R E V E N U E A N D
C U S T O M E R B A S E I N F I S C A L 1 9 9 9 .
A L E A D I N G N O R T H A M E R I C A N
A U T O M O T I V E P A R T S C O M P A N Y H A S
R E P L A C E D A N U M B E R O F C N C
M A C H I N E S W I T H T H E S I N G L E
S Y S T E M P I C T U R E D H E R E T O
M A C H I N E C O M P L E X C A S T I N G S W I T H
H I G H E R T H R O U G H P U T A N D Q U A L I T Y .
S U P P LY
> Product innovation is the key to growth. >
M A N U FA CT U R E R S A R E C O N T I N UA L LY S T R I V I N G TO I M P R O V E T H E F U N CT I O N A L I T Y A N D P E R F O R M A N C E
O F T H E I R P R O D U CT S . T H I S O F T E N M E A N S I N C O R P O R AT I N G C O M P L E X N E W T E C H N O LO G I E S A N D
U N T R I E D M A N U FA CT U R I N G P R O C E S S E S I N TO P R O D U CT I O N .
T H I S S T I M U L AT E S D E M A N D F O R S U P P L I E R S T H AT C A N A D D R E A L VA L U E TO N E W P R O D U CT
D E V E LO P M E N T A N D L A U N C H A CT I V I T I E S .
> Quality and precision are fundamental to survival. >
M A N U FA CT U R E R S A R E W O R K I N G TO E N H A N C E P R O D U CT Q UA L I T Y, LO W E R D E F E CT R AT E S
A N D E L I M I N AT E WA S T E TO B U I L D P R O F I TA B I L I T Y A N D LOYA L C U S TO M E R R E L AT I O N S H I P S .
T H I S C R E AT E S D E M A N D F O R A U TO M AT E D M A N U FA CT U R I N G S Y S T E M S A N D A D VA N C E D P R O D U CT I O N T E S T I N G
A N D C L E A N I N G T E C H N O LO G I E S A I M E D AT I M P R O V I N G M A N U FA CT U R I N G Y I E L D A N D R E T U R N O N I N V E S T M E N T.
AT T H E S A M E T I M E , P R O D U CT S A R E B E I N G M I N I AT U R I Z E D , C R E AT I N G A N E E D F O R S U P P L I E R S
W H O C A N M E E T T H E E X A CT I N G S TA N DA R D S O F H I G H P R E C I S I O N I N D U S T R I E S .
10
DEMAND
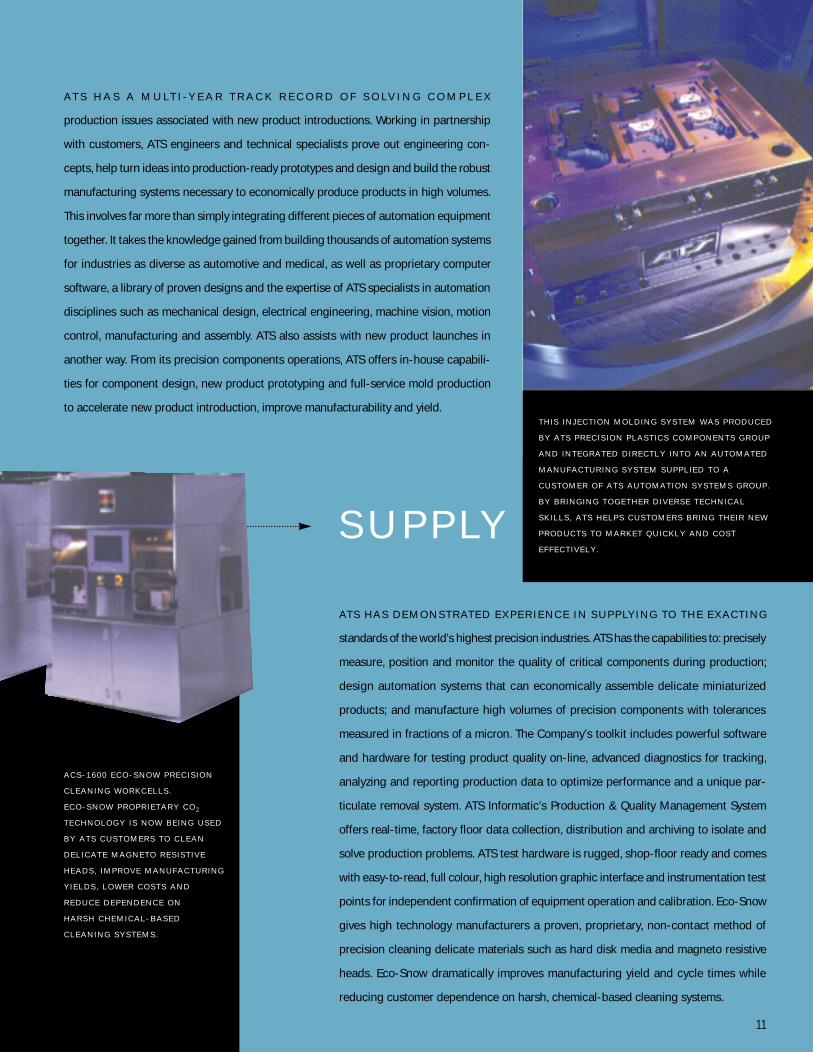
A C S - 1 6 0 0 E C O - S N O W P R E C I S I O N
C L E A N I N G W O R K C E L L S .
E C O - S N O W P R O P R I E T A R Y C O 2
T E C H N O L O G Y I S N O W B E I N G U S E D
B Y A T S C U S T O M E R S T O C L E A N
D E L I C A T E M A G N E T O R E S I S T I V E
H E A D S , I M P R O V E M A N U F A C T U R I N G
Y I E L D S , L O W E R C O S T S A N D
R E D U C E D E P E N D E N C E O N
H A R S H C H E M I C A L - B A S E D
C L E A N I N G S Y S T E M S .
A T S H A S A M U LT I -Y E A R T R A C K R E C O R D O F S O LV I N G C O M P L E X
production issues associated with new product introductions. Working in partnership
with customers, ATS engineers and technical specialists prove out engineering con-
cepts, help turn ideas into production-ready prototypes and design and build the robust
manufacturing systems necessary to economically produce products in high volumes.
This involves far more than simply integrating different pieces of automation equipment
together. It takes the knowledge gained from building thousands of automation systems
for industries as diverse as automotive and medical, as well as proprietary computer
software, a library of proven designs and the expertise of ATS specialists in automation
disciplines such as mechanical design, electrical engineering, machine vision, motion
control, manufacturing and assembly. ATS also assists with new product launches in
another way. From its precision components operations, ATS offers in-house capabili-
ties for component design, new product prototyping and full-service mold production
to accelerate new product introduction, improve manufacturability and yield.
ATS H A S D E M O N STR ATE D E X P E R I E N C E I N S U P P LY I N G TO TH E E XACT I N G
standards of the world’s highest precision industries. ATS has the capabilities to: precisely
measure, position and monitor the quality of critical components during production;
design automation systems that can economically assemble delicate miniaturized
products; and manufacture high volumes of precision components with tolerances
measured in fractions of a micron. The Company’s toolkit includes powerful software
and hardware for testing product quality on-line, advanced diagnostics for tracking,
analyzing and reporting production data to optimize performance and a unique par-
ticulate removal system. ATS Informatic’s Production & Quality Management System
offers real-time, factory floor data collection, distribution and archiving to isolate and
solve production problems. ATS test hardware is rugged, shop-floor ready and comes
with easy-to-read, full colour, high resolution graphic interface and instrumentation test
points for independent confirmation of equipment operation and calibration. Eco-Snow
gives high technology manufacturers a proven, proprietary, non-contact method of
precision cleaning delicate materials such as hard disk media and magneto resistive
heads. Eco-Snow dramatically improves manufacturing yield and cycle times while
reducing customer dependence on harsh, chemical-based cleaning systems.
11
S U P P LY
T H I S I N J E C T I O N M O L D I N G S Y S T E M W A S P R O D U C E D
B Y A T S P R E C I S I O N P L A S T I C S C O M P O N E N T S G R O U P
A N D I N T E G R A T E D D I R E C T L Y I N T O A N A U T O M A T E D
M A N U F A C T U R I N G S Y S T E M S U P P L I E D T O A
C U S T O M E R O F A T S A U T O M A T I O N S Y S T E M S G R O U P .
B Y B R I N G I N G T O G E T H E R D I V E R S E T E C H N I C A L
S K I L L S , A T S H E L P S C U S T O M E R S B R I N G T H E I R N E W
P R O D U C T S T O M A R K E T Q U I C K L Y A N D C O S T
E F F E C T I V E L Y .
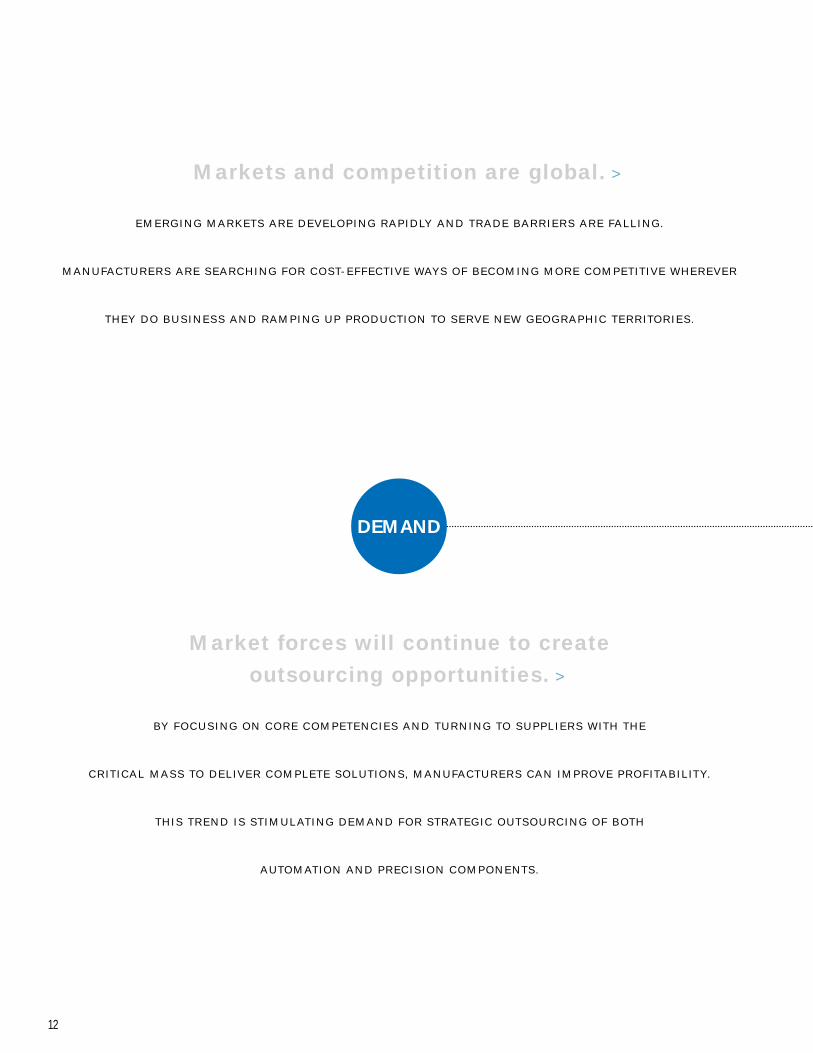
> Markets and competition are global. >
E M E R G I N G M A R K E T S A R E D E V E LO P I N G R A P I D LY A N D T R A D E B A R R I E R S A R E FA L L I N G .
M A N U FA CT U R E R S A R E S E A R C H I N G F O R C O S T- E F F E CT I V E WAY S O F B E C O M I N G M O R E C O M P E T I T I V E W H E R E V E R
T H E Y D O B U S I N E S S A N D R A M P I N G U P P R O D U CT I O N TO S E R V E N E W G E O G R A P H I C T E R R I TO R I E S .
Market forces will continue to create > outsourcing opportunities. >
BY F O C U S I N G O N C O R E C O M P E T E N C I E S A N D T U R N I N G TO S U P P L I E R S W I T H T H E
C R I T I C A L M A S S TO D E L I V E R C O M P L E T E S O L U T I O N S , M A N U FA CT U R E R S C A N I M P R O V E P R O F I TA B I L I T Y.
T H I S T R E N D I S S T I M U L AT I N G D E M A N D F O R S T R AT E G I C O U T S O U R C I N G O F B OT H
A U TO M AT I O N A N D P R E C I S I O N C O M P O N E N T S .
12
DEMAND
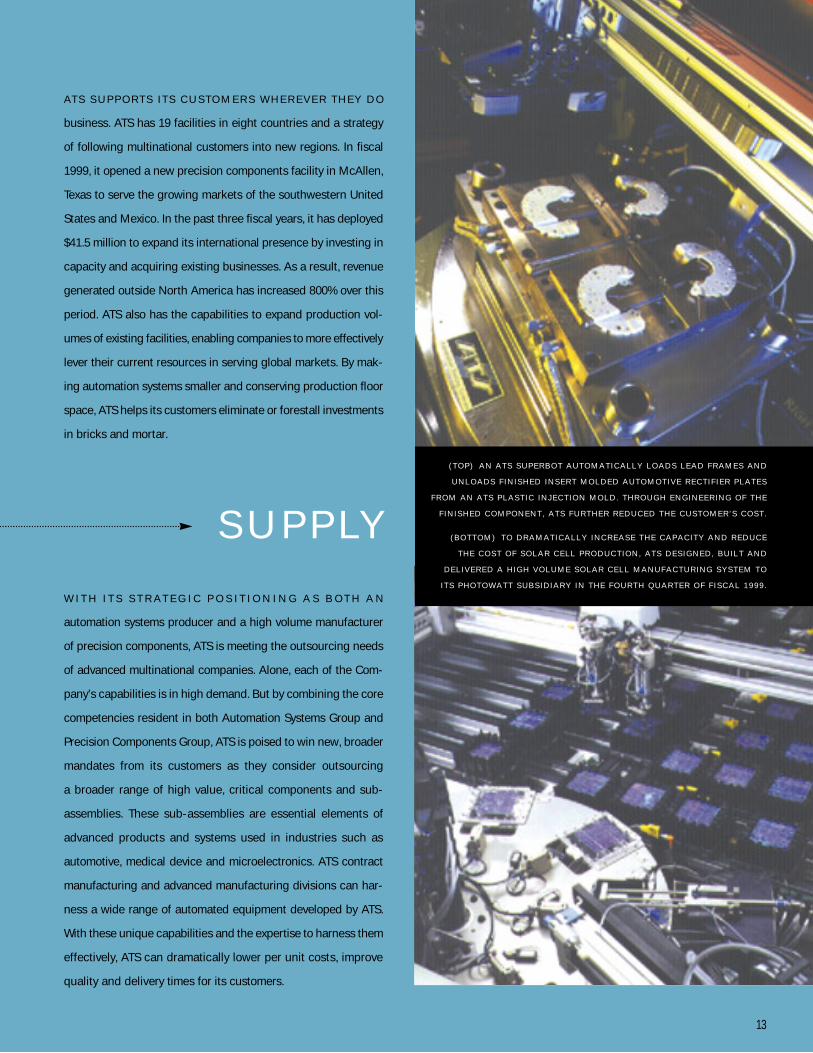
AT S S U P P O R T S I T S C U S TO M E R S W H E R E V E R T H E Y D O
business. ATS has 19 facilities in eight countries and a strategy
of following multinational customers into new regions. In fiscal
1999, it opened a new precision components facility in McAllen,
Texas to serve the growing markets of the southwestern United
States and Mexico. In the past three fiscal years, it has deployed
$41.5 million to expand its international presence by investing in
capacity and acquiring existing businesses. As a result, revenue
generated outside North America has increased 800% over this
period. ATS also has the capabilities to expand production vol-
umes of existing facilities, enabling companies to more effectively
lever their current resources in serving global markets. By mak-
ing automation systems smaller and conserving production floor
space, ATS helps its customers eliminate or forestall investments
in bricks and mortar.
W I T H I T S S T R A T E G I C P O S I T I O N I N G A S B O T H A N
automation systems producer and a high volume manufacturer
of precision components, ATS is meeting the outsourcing needs
of advanced multinational companies. Alone, each of the Com-
pany’s capabilities is in high demand. But by combining the core
competencies resident in both Automation Systems Group and
Precision Components Group, ATS is poised to win new, broader
mandates from its customers as they consider outsourcing
a broader range of high value, critical components and sub-
assemblies. These sub-assemblies are essential elements of
advanced products and systems used in industries such as
automotive, medical device and microelectronics. ATS contract
manufacturing and advanced manufacturing divisions can har-
ness a wide range of automated equipment developed by ATS.
With these unique capabilities and the expertise to harness them
effectively, ATS can dramatically lower per unit costs, improve
quality and delivery times for its customers.
13
S U P P LY
( T O P ) A N A T S S U P E R B O T A U T O M A T I C A L L Y L O A D S L E A D F R A M E S A N D
U N L O A D S F I N I S H E D I N S E R T M O L D E D A U T O M O T I V E R E C T I F I E R P L A T E S
F R O M A N A T S P L A S T I C I N J E C T I O N M O L D . T H R O U G H E N G I N E E R I N G O F T H E
F I N I S H E D C O M P O N E N T , A T S F U R T H E R R E D U C E D T H E C U S T O M E R ’ S C O S T .
( B O T T O M ) T O D R A M A T I C A L L Y I N C R E A S E T H E C A P A C I T Y A N D R E D U C E
T H E C O S T O F S O L A R C E L L P R O D U C T I O N , A T S D E S I G N E D , B U I L T A N D
D E L I V E R E D A H I G H V O L U M E S O L A R C E L L M A N U F A C T U R I N G S Y S T E M T O
I T S P H O T O W A T T S U B S I D I A R Y I N T H E F O U R T H Q U A R T E R O F F I S C A L 1 9 9 9 .
14 A T S 1 9 9 9 A N N U A L R E P O R T
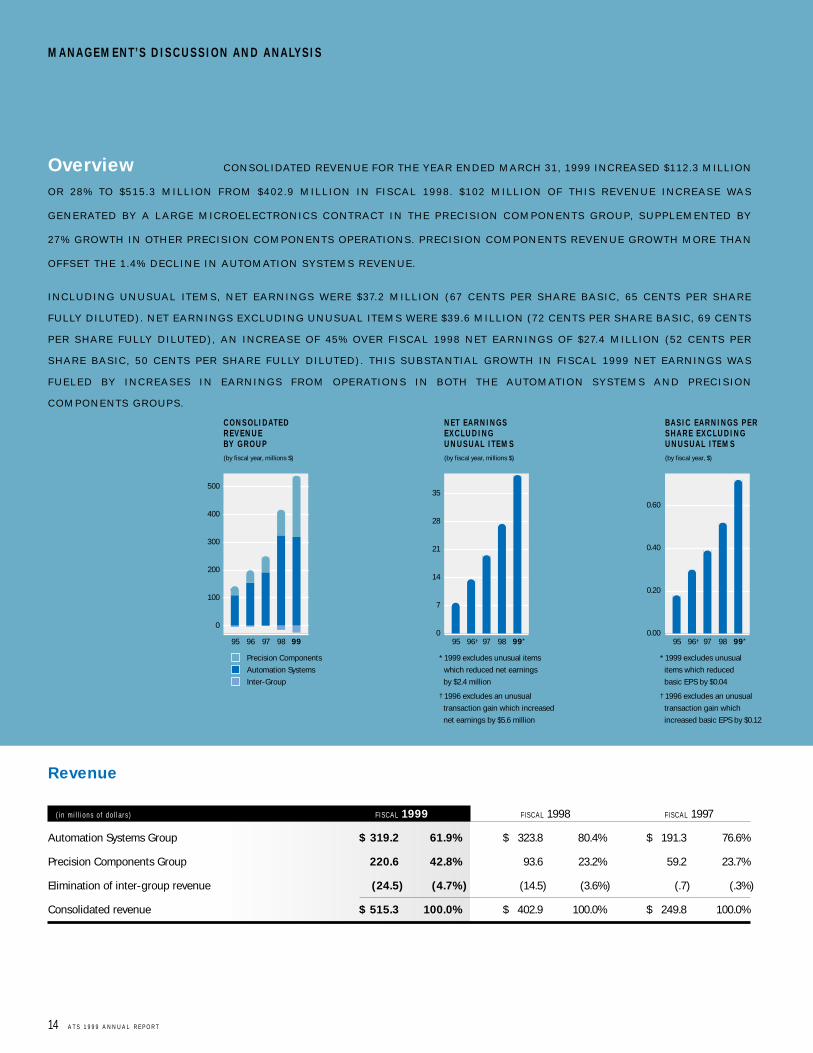
Overview C O N S O L I DAT E D R E V E N U E F O R T H E Y E A R E N D E D M A R C H 3 1 , 1 9 9 9 I N C R E A S E D $ 1 1 2 . 3 M I L L I O N
O R 2 8 % TO $ 5 1 5 . 3 M I L L I O N F R O M $ 4 0 2 . 9 M I L L I O N I N F I S C A L 1 9 9 8 . $ 1 0 2 M I L L I O N O F T H I S R E V E N U E I N C R E A S E WA S
G E N E R AT E D BY A L A R G E M I C R O E L E C T R O N I C S C O N T R A C T I N T H E P R E C I S I O N C O M P O N E N T S G R O U P, S U P P L E M E N T E D BY
27 % G R O W T H I N OT H E R P R E C I S I O N C O M P O N E N T S O P E R AT I O N S . P R E C I S I O N C O M P O N E N T S R E V E N U E G R O W T H M O R E T H A N
O F F S E T T H E 1 . 4 % D E C L I N E I N A U TO M AT I O N S Y S T E M S R E V E N U E .
I N C L U D I N G U N U S U A L I T E M S , N E T E A R N I N G S W E R E $ 37. 2 M I L L I O N ( 67 C E N T S P E R S H A R E B A S I C , 6 5 C E N T S P E R S H A R E
F U L LY D I L U T E D ) . N E T E A R N I N G S E X C L U D I N G U N U S UA L I T E M S W E R E $ 3 9 . 6 M I L L I O N ( 7 2 C E N T S P E R S H A R E B A S I C , 6 9 C E N T S
P E R S H A R E F U L LY D I L U T E D ) , A N I N C R E A S E O F 4 5 % O V E R F I S C A L 1 9 9 8 N E T E A R N I N G S O F $ 27. 4 M I L L I O N ( 5 2 C E N T S P E R
S H A R E B A S I C , 5 0 C E N T S P E R S H A R E F U L LY D I L U T E D ) . T H I S S U B S TA N T I A L G R O W T H I N F I S C A L 1 9 9 9 N E T E A R N I N G S WA S
F U E L E D BY I N C R E A S E S I N E A R N I N G S F R O M O P E R AT I O N S I N B OT H T H E A U TO M AT I O N S Y S T E M S A N D P R E C I S I O N
C O M P O N E N T S G R O U P S .
Revenue
( i n m i l l i o n s o f d o l l a r s ) F I S C A L 1999 F I S C A L 1998 F I S C A L 1997
Automation Systems Group $ 319.2 61.9% $ 323.8 80.4% $ 191.3 76.6%
Precision Components Group 220.6 42.8% 93.6 23.2% 59.2 23.7%
Elimination of inter-group revenue (24.5) (4.7%) (14.5) (3.6%) (.7) (.3%)
Consolidated revenue $ 515.3 100.0% $ 402.9 100.0% $ 249.8 100.0%
95 96
Precision Components
Automation Systems
Inter-Group
97 98 99
C O N S O L I DAT E D R E V E N U E BY G R O U P (by fiscal year, millions $)
0
100
200
300
400
500
N E T E A R N I N G S E X C L U D I N G U N U S UA L I T E M S (by fiscal year, millions $)
0
7
14
21
28
35
* 1999 excludes unusual items
which reduced net earnings
by $2.4 million
† 1996 excludes an unusual
transaction gain which increased
net earnings by $5.6 million
95 96† 97 98 99*
BA S I C E A R N I N G S P E R S H A R E E X C L U D I N G U N U S UA L I T E M S (by fiscal year, $)
0.00
0.20
0.40
0.60
* 1999 excludes unusual
items which reduced
basic EPS by $0.04
† 1996 excludes an unusual
transaction gain which
increased basic EPS by $0.12
95 96† 97 98 99*
M A N A G E M E N T ’ S D I S C U S S I O N A N D A N A LYS I S
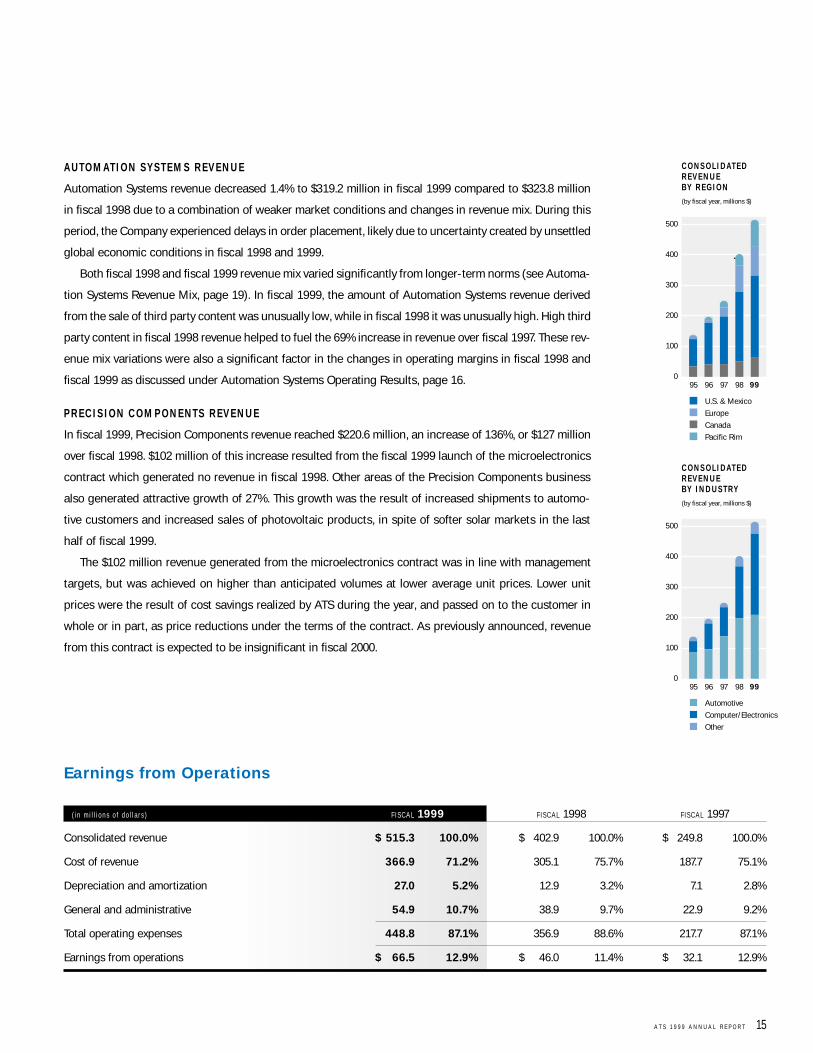
A U TO M AT I O N SYST E M S R E V E N U E
Automation Systems revenue decreased 1.4% to $319.2 million in fiscal 1999 compared to $323.8 million
in fiscal 1998 due to a combination of weaker market conditions and changes in revenue mix. During this
period, the Company experienced delays in order placement, likely due to uncertainty created by unsettled
global economic conditions in fiscal 1998 and 1999.
Both fiscal 1998 and fiscal 1999 revenue mix varied significantly from longer-term norms (see Automa-
tion Systems Revenue Mix, page 19). In fiscal 1999, the amount of Automation Systems revenue derived
from the sale of third party content was unusually low, while in fiscal 1998 it was unusually high. High third
party content in fiscal 1998 revenue helped to fuel the 69% increase in revenue over fiscal 1997. These rev-
enue mix variations were also a significant factor in the changes in operating margins in fiscal 1998 and
fiscal 1999 as discussed under Automation Systems Operating Results, page 16.
P R E C I S I O N C O M P O N E N TS R E V E N U E
In fiscal 1999, Precision Components revenue reached $220.6 million, an increase of 136%, or $127 million
over fiscal 1998. $102 million of this increase resulted from the fiscal 1999 launch of the microelectronics
contract which generated no revenue in fiscal 1998. Other areas of the Precision Components business
also generated attractive growth of 27%. This growth was the result of increased shipments to automo-
tive customers and increased sales of photovoltaic products, in spite of softer solar markets in the last
half of fiscal 1999.
The $102 million revenue generated from the microelectronics contract was in line with management
targets, but was achieved on higher than anticipated volumes at lower average unit prices. Lower unit
prices were the result of cost savings realized by ATS during the year, and passed on to the customer in
whole or in part, as price reductions under the terms of the contract. As previously announced, revenue
from this contract is expected to be insignificant in fiscal 2000.
Earnings from Operations
( i n m i l l i o n s o f d o l l a r s ) F I S C A L 1999 F I S C A L 1998 F I S C A L 1997
Consolidated revenue $ 515.3 100.0% $ 402.9 100.0% $ 249.8 100.0%
Cost of revenue 366.9 71.2% 305.1 75.7% 187.7 75.1%
Depreciation and amortization 27.0 5.2% 12.9 3.2% 7.1 2.8%
General and administrative 54.9 10.7% 38.9 9.7% 22.9 9.2%
Total operating expenses 448.8 87.1% 356.9 88.6% 217.7 87.1%
Earnings from operations $ 66.5 12.9% $ 46.0 11.4% $ 32.1 12.9%
A T S 1 9 9 9 A N N U A L R E P O R T 15
0
100
200
300
400
500
95 96
U.S. & Mexico
Europe
Canada
Pacific Rim
97 98 99
C O N S O L I DAT E D R E V E N U E BY R E G I O N (by fiscal year, millions $)
0
100
200
300
400
500
95 96
Automotive
Computer/Electronics
Other
97 98 99
C O N S O L I DAT E D R E V E N U E BY I N D U ST RY (by fiscal year, millions $)
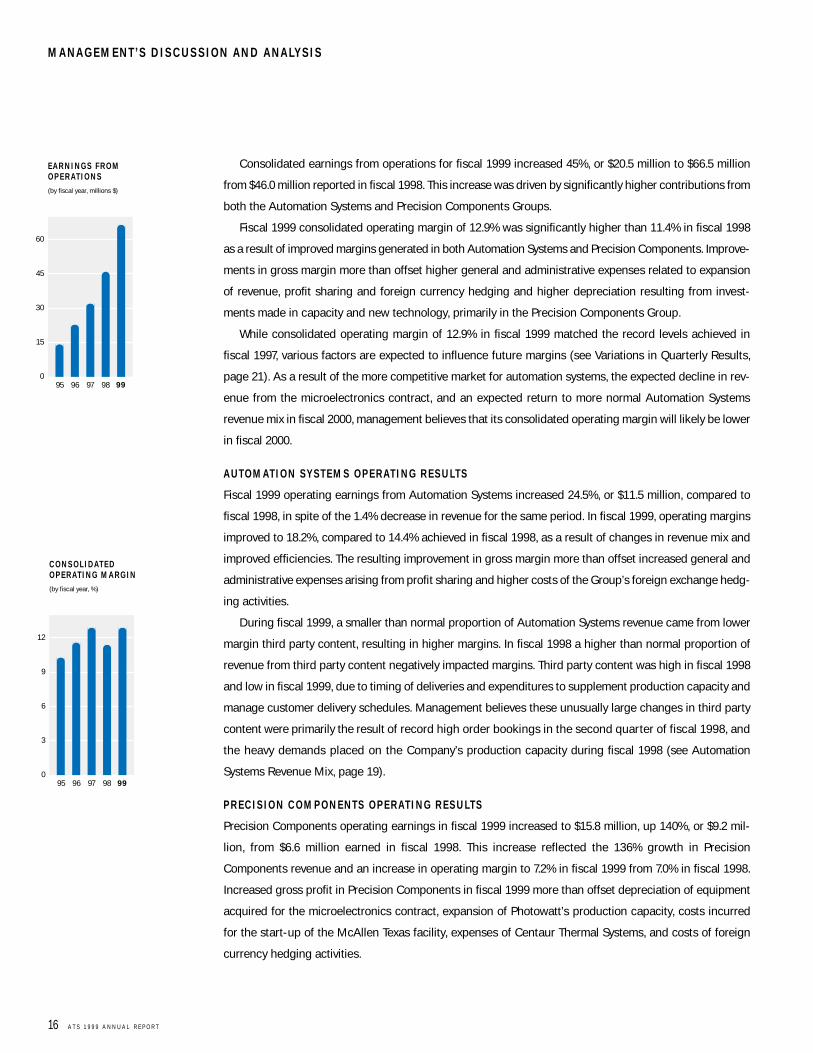
Consolidated earnings from operations for fiscal 1999 increased 45%, or $20.5 million to $66.5 million
from $46.0 million reported in fiscal 1998. This increase was driven by significantly higher contributions from
both the Automation Systems and Precision Components Groups.
Fiscal 1999 consolidated operating margin of 12.9% was significantly higher than 11.4% in fiscal 1998
as a result of improved margins generated in both Automation Systems and Precision Components. Improve-
ments in gross margin more than offset higher general and administrative expenses related to expansion
of revenue, profit sharing and foreign currency hedging and higher depreciation resulting from invest-
ments made in capacity and new technology, primarily in the Precision Components Group.
While consolidated operating margin of 12.9% in fiscal 1999 matched the record levels achieved in
fiscal 1997, various factors are expected to influence future margins (see Variations in Quarterly Results,
page 21). As a result of the more competitive market for automation systems, the expected decline in rev-
enue from the microelectronics contract, and an expected return to more normal Automation Systems
revenue mix in fiscal 2000, management believes that its consolidated operating margin will likely be lower
in fiscal 2000.
A U TO M AT I O N SYST E M S O P E R AT I N G R E S U LTS
Fiscal 1999 operating earnings from Automation Systems increased 24.5%, or $11.5 million, compared to
fiscal 1998, in spite of the 1.4% decrease in revenue for the same period. In fiscal 1999, operating margins
improved to 18.2%, compared to 14.4% achieved in fiscal 1998, as a result of changes in revenue mix and
improved efficiencies. The resulting improvement in gross margin more than offset increased general and
administrative expenses arising from profit sharing and higher costs of the Group’s foreign exchange hedg-
ing activities.
During fiscal 1999, a smaller than normal proportion of Automation Systems revenue came from lower
margin third party content, resulting in higher margins. In fiscal 1998 a higher than normal proportion of
revenue from third party content negatively impacted margins. Third party content was high in fiscal 1998
and low in fiscal 1999, due to timing of deliveries and expenditures to supplement production capacity and
manage customer delivery schedules. Management believes these unusually large changes in third party
content were primarily the result of record high order bookings in the second quarter of fiscal 1998, and
the heavy demands placed on the Company’s production capacity during fiscal 1998 (see Automation
Systems Revenue Mix, page 19).
P R E C I S I O N C O M P O N E N TS O P E R AT I N G R E S U LTS
Precision Components operating earnings in fiscal 1999 increased to $15.8 million, up 140%, or $9.2 mil-
lion, from $6.6 million earned in fiscal 1998. This increase reflected the 136% growth in Precision
Components revenue and an increase in operating margin to 7.2% in fiscal 1999 from 7.0% in fiscal 1998.
Increased gross profit in Precision Components in fiscal 1999 more than offset depreciation of equipment
acquired for the microelectronics contract, expansion of Photowatt’s production capacity, costs incurred
for the start-up of the McAllen Texas facility, expenses of Centaur Thermal Systems, and costs of foreign
currency hedging activities.
16 A T S 1 9 9 9 A N N U A L R E P O R T
M A N A G E M E N T ’ S D I S C U S S I O N A N D A N A LYS I S
95 96 97 98 99
C O N S O L I DAT E D O P E R AT I N G M A R G I N (by fiscal year, %)
0
3
6
9
12
95 96 97 98 99
E A R N I N G S F R O M O P E R AT I O N S (by fiscal year, millions $)
0
15
30
45
60
Cash Flow and Financial Resources
( i n m i l l i o n s o f d o l l a r s , e x c e p t d e b t t o e q u i t y r a t i o ) F I S C A L 1999 F I S C A L 1998 F I S C A L 1997
Cash and short-term investments $ 65.9 $ 25.4 $ 4.0
Other current assets 213.1 227.4 129.4
Current liabilities (109.5) (105.7) (59.6)
Working capital $ 169.5 $ 147.1 $ 73.8
Long-term debt $ 51.8 $ 44.0 $ 24.4
Shareholders’ equity $ 314.3 $ 268.2 $ 143.1
Debt to equity ratio 0.16:1 0.16:1 0.17:1
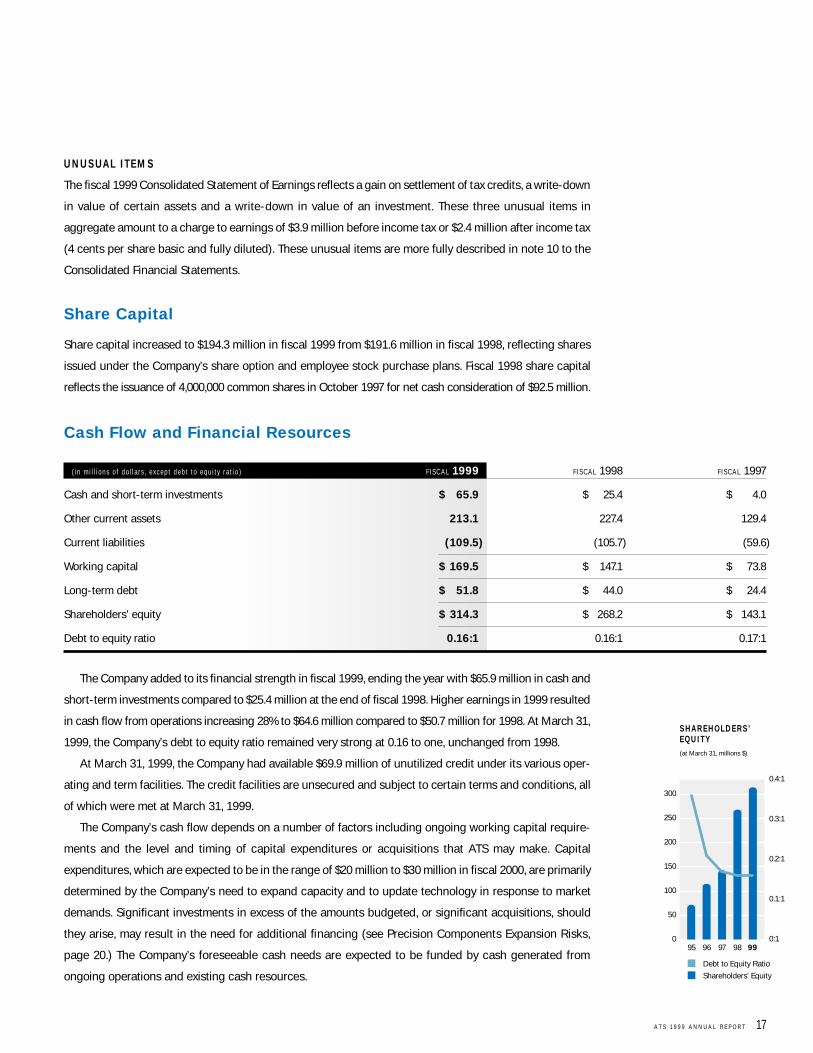
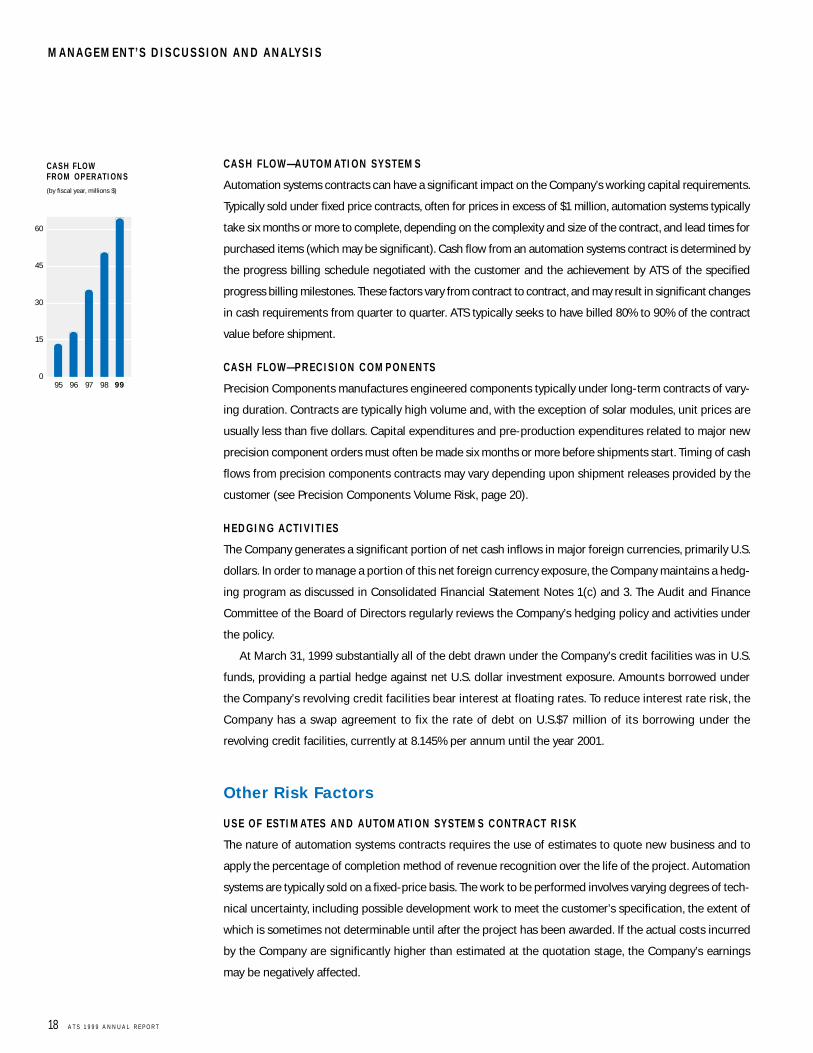
The Company added to its financial strength in fiscal 1999, ending the year with $65.9 million in cash and
short-term investments compared to $25.4 million at the end of fiscal 1998. Higher earnings in 1999 resulted
in cash flow from operations increasing 28% to $64.6 million compared to $50.7 million for 1998. At March 31,
1999, the Company’s debt to equity ratio remained very strong at 0.16 to one, unchanged from 1998.
At March 31, 1999, the Company had available $69.9 million of unutilized credit under its various oper-
ating and term facilities. The credit facilities are unsecured and subject to certain terms and conditions, all
of which were met at March 31, 1999.
The Company’s cash flow depends on a number of factors including ongoing working capital require-
ments and the level and timing of capital expenditures or acquisitions that ATS may make. Capital
expenditures, which are expected to be in the range of $20 million to $30 million in fiscal 2000, are primarily
determined by the Company’s need to expand capacity and to update technology in response to market
demands. Significant investments in excess of the amounts budgeted, or significant acquisitions, should
they arise, may result in the need for additional financing (see Precision Components Expansion Risks,
page 20.) The Company’s foreseeable cash needs are expected to be funded by cash generated from
ongoing operations and existing cash resources.
A T S 1 9 9 9 A N N U A L R E P O R T 17
U N U S UA L I T E M S
The fiscal 1999 Consolidated Statement of Earnings reflects a gain on settlement of tax credits, a write-down
in value of certain assets and a write-down in value of an investment. These three unusual items in
aggregate amount to a charge to earnings of $3.9 million before income tax or $2.4 million after income tax
(4 cents per share basic and fully diluted). These unusual items are more fully described in note 10 to the
Consolidated Financial Statements.
Share Capital
Share capital increased to $194.3 million in fiscal 1999 from $191.6 million in fiscal 1998, reflecting shares
issued under the Company’s share option and employee stock purchase plans. Fiscal 1998 share capital
reflects the issuance of 4,000,000 common shares in October 1997 for net cash consideration of $92.5 million.
95 96 97 98 99
S H A R E H O L D E R S ’ E Q U I T Y (at March 31, millions $)
0
50
100
150
200
250
300
Debt to Equity Ratio
Shareholders’ Equity
0:1
0.1:1
0.2:1
0.3:1
0.4:1
CA S H F LO W — A U TO M AT I O N SYST E M S
Automation systems contracts can have a significant impact on the Company’s working capital requirements.
Typically sold under fixed price contracts, often for prices in excess of $1 million, automation systems typically
take six months or more to complete, depending on the complexity and size of the contract, and lead times for
purchased items (which may be significant). Cash flow from an automation systems contract is determined by
the progress billing schedule negotiated with the customer and the achievement by ATS of the specified
progress billing milestones. These factors vary from contract to contract, and may result in significant changes
in cash requirements from quarter to quarter. ATS typically seeks to have billed 80% to 90% of the contract
value before shipment.
CA S H F LO W — P R E C I S I O N C O M P O N E N TS
Precision Components manufactures engineered components typically under long-term contracts of vary-
ing duration. Contracts are typically high volume and, with the exception of solar modules, unit prices are
usually less than five dollars. Capital expenditures and pre-production expenditures related to major new
precision component orders must often be made six months or more before shipments start. Timing of cash
flows from precision components contracts may vary depending upon shipment releases provided by the
customer (see Precision Components Volume Risk, page 20).
H E D G I N G A CT I V I T I E S
The Company generates a significant portion of net cash inflows in major foreign currencies, primarily U.S.
dollars. In order to manage a portion of this net foreign currency exposure, the Company maintains a hedg-
ing program as discussed in Consolidated Financial Statement Notes 1(c) and 3. The Audit and Finance
Committee of the Board of Directors regularly reviews the Company’s hedging policy and activities under
the policy.
At March 31, 1999 substantially all of the debt drawn under the Company’s credit facilities was in U.S.
funds, providing a partial hedge against net U.S. dollar investment exposure. Amounts borrowed under
the Company’s revolving credit facilities bear interest at floating rates. To reduce interest rate risk, the
Company has a swap agreement to fix the rate of debt on U.S.$7 million of its borrowing under the
revolving credit facilities, currently at 8.145% per annum until the year 2001.
Other Risk Factors
U S E O F E ST I M AT E S A N D A U TO M AT I O N SYST E M S C O N T R A CT R I S K
The nature of automation systems contracts requires the use of estimates to quote new business and to
apply the percentage of completion method of revenue recognition over the life of the project. Automation
systems are typically sold on a fixed-price basis. The work to be performed involves varying degrees of tech-
nical uncertainty, including possible development work to meet the customer’s specification, the extent of
which is sometimes not determinable until after the project has been awarded. If the actual costs incurred
by the Company are significantly higher than estimated at the quotation stage, the Company’s earnings
may be negatively affected.
18 A T S 1 9 9 9 A N N U A L R E P O R T
M A N A G E M E N T ’ S D I S C U S S I O N A N D A N A LYS I S
95 96 97 98 99
CA S H F LO W F R O M O P E R AT I O N S (by fiscal year, millions $)
0
15
30
45
60
Certain contracts may include penalties for late delivery and/or may expose the Company to liability.
Automation systems contracts may be terminated by customers in the event of a default by the Company,
or for convenience of the customer. In the event of a termination for convenience, ATS must typically nego-
tiate a settlement reflective of the progress achieved on the contract and/or the costs incurred to the
termination date.
A U TO M AT I O N SYST E M S P R I C I N G
Individual prices and terms for automation systems contracts are typically negotiated between ATS and its
customers. Profit margins on contracts vary depending on a number of factors, including market conditions,
technical risk, competition, the results of negotiation and the amount of subcontracting and third party
equipment integrated into the automation system.
A U TO M AT I O N SYST E M S R E V E N U E M I X
An Automation Systems order typically requires ATS to integrate third party content with its own products
and services (“ATS Value Added”) to produce a complete automated manufacturing system. Third party con-
tent consists primarily of third party equipment and subcontract work and typically comprises a significant
portion of the total value of an automation systems order. Specific third party equipment, reflecting the func-
tional requirements of the system, is often required under the terms of the customer’s order. ATS typically
subcontracts work on an automation systems order as required to supplement internal resources and to
manage capacity, order backlog and customer delivery schedules.
The amount of revenue ATS earns from third party content in automation systems in a particular report-
ing period depends primarily on the value of such content acquired by ATS during that period. The value of
third party content acquired in a period will depend upon the nature and specifications of the automation sys-
tems orders in process, the value and timing of deliveries of third party content, and the amount of
subcontracting used in the period. Therefore, the amount of third party content is often subject to significant
fluctuations from period to period. The amount of revenue ATS earns from ATS Value-Added in a period
depends primarily on the amount, utilization and efficiency of its internal resources and tends to be less
volatile from period to period than are changes in third party content.
The Company typically earns significantly lower margins on third party content compared to margins
from ATS Value-Added. Therefore, higher than normal third party content in a period tends to increase
revenue and reduce margins, while lower third party content in a period tends to reduce revenue but
increase margins.
A U TO M AT I O N SYST E M S R E V E N U E A N D CA P I TA L E X P E N D I T U R E CYC L E S
Historically, capital expenditures on industrial equipment have tended to be cyclical in nature. The
Company’s broad customer base and its strategy of diversification through participation in different indus-
tries and geographic regions are intended to reduce cyclical risk and to provide opportunities to generate
new revenue.
A T S 1 9 9 9 A N N U A L R E P O R T 19
P R E C I S I O N C O M P O N E N TS V O L U M E R I S K
Typically, precision components contracts do not provide volume guarantees. The actual volume of parts
shipped may vary materially from planned levels during the term of the contract and from quarter to quar-
ter. Variations from planned volumes may occur for a number of reasons including capacity constraints,
quality problems, competition, obsolescence and changes in demand for the customer’s end product.
The majority of precision components orders obtained from automotive industry customers have
historically been single source contracts with three-to-five-year durations. Typically, ATS has not been
sole-sourced under other non-automotive contracts. The existence of competitive suppliers of these
precision components may expose the Company to greater pricing pressure and volume risk.
Precision Components revenue is derived from automotive, solar and other industries. The automotive
sector has historically been cyclical in nature. General economic trends, product life cycles and product
changes may impact all of these markets. Negative changes in any of these factors may adversely impact
the demand for precision components and the Company’s earnings from this segment.
P R E C I S I O N C O M P O N E N TS P R I C I N G , Q UA L I T Y A N D D E L I V E RY
ATS is required to remain competitive on price, quality and delivery as a condition of many of its precision
components contracts. Pricing for precision components is often subject to revision and adjustment as a
result of negotiations and cost reduction obligations to which the Company is subject. Price reductions
may be mandatory under the terms of some contracts. The Company may also believe it necessary to
voluntarily reduce prices as a way to secure higher proportions of the customer’s releases when
competitive circumstances exist. To the extent ATS is obligated, or agrees, to reduce prices and the impact
of the reduced prices is not offset through cost reductions or efficiencies gained from higher volumes,
operating margins and earnings will be negatively impacted. Failure to remain competitive on price,
quality and delivery may result in the loss of single source status (if in place), reduced shipments and
possible termination of the contract. Management believes such terms are customary in the industries in
which it currently operates.
P R E C I S I O N C O M P O N E N TS E X PA N S I O N R I S K S
New precision components contracts often require the Company to invest in new production equipment,
systems and sometimes facilities, often on tight time schedules. Bringing these investments into produc-
tion quickly may expose the Company to certain risks depending on the size of the investment, the schedule,
the technology involved, and the nature of the precision components to be produced. When production is
first started, the Company often incurs higher costs and lower production rates than for more established
programs, and may encounter significant costs to correct problems which may arise. Furthermore, failure
to meet a customer’s scheduled requirements may negatively impact the Company, including possible
termination of the contract.
R I S K S R E L AT E D TO M AT E R I A L P R E C I S I O N C O M P O N E N TS C O N T R A CTS
In addition to the other risks noted herein, individually material precision components contracts (such as
the large microelectronics contract in fiscal 1999) expose the Company to additional risk. Contracts of this
type are sufficiently large that any material variation in volumes, pricing or contract term would likely have
20 A T S 1 9 9 9 A N N U A L R E P O R T
M A N A G E M E N T ’ S D I S C U S S I O N A N D A N A LYS I S
a significant impact on the Company’s revenue and earnings. To the extent the Company has not secured
new orders sufficient to replace any reduction or loss of business that may arise under individually
material contracts, the future revenue and earnings of ATS may be materially negatively impacted.
AVA I L A B I L I T Y O F H U M A N R E S O U R C E S
The Company’s business, especially Automation Systems, is knowledge-based. Management believes that
to increase Automation Systems revenue it must continue to attract, retain and develop technical
employees whose skills are increasingly in demand. To a lesser degree, ability to increase Precision
Components revenue is dependent upon availability of key employees with the specialized skills required
to support growth. Typically, new employees require ATS-specific training before becoming fully productive.
The Company’s future success also depends upon a number of key employees, including Klaus D. Woerner,
ATS’ President and Chief Executive Officer, and other members of senior management.
VA R I AT I O N S I N Q UA R T E R LY R E S U LTS
The revenue, operating margin and earnings of ATS may vary from quarter to quarter as a result of factors
discussed in this report. Additional factors which may impact quarterly results include: changes in the
proportion of revenue derived from the different activities of the Company, different margins on work
performed, acquisitions, level of investment in new operations, number of new employees added in a period,
level of general and administrative expenses required to support the Company’s growth and level of research
and development activities.
The Company may also experience negative impacts on operating margins during periods of rapid
expansion. Significant growth in the Automation Systems Group may necessitate increased use of sub-
contracting and premium costs to rapidly increase internal capacity. In the Precision Components Group,
growth from the launch of significant new programs may impact the Company’s results as described in
Precision Components Expansion Risks, page 20.
While ATS products are not seasonal in nature, the Company’s quarterly results have often reflected
lower earnings during the summer months, or second quarter. This has generally been the result of lower
revenue due to staff vacations (which reduces capacity, especially in the Automation Systems Group) and
seasonal customer plant shutdowns (which reduces volumes in the Precision Components Group).
Year 2000
C O M PA N Y ’ S V U L N E R A B I L I T Y TO Y E A R 2 0 0 0 I S S U E S
Like most large organizations, the Company uses many different computer systems and other chip-based
devices (IT and non-IT systems) in the continuing conduct of its business. Older IT and non-IT systems
may fail to recognize certain dates prior to, during, and after the year 2000 which may result in failure
to operate or improper operation. The Company’s exposure to the potential problems of the Year 2000
Issue exists in two general areas a) IT and non-IT systems in the sole control of the Company, including
those resident in both internal systems and in products supplied to customers, and b) IT and non-IT
systems dependent in some way on one or more third parties.
A T S 1 9 9 9 A N N U A L R E P O R T 21
The potential risk of the Year 2000 Issue materially affecting the Company’s internal IT and non-IT
systems, or the products supplied to customers, is assessed as minimal. The Company’s internal IT and non-IT
systems (including manufacturing and production controls as well as financial systems) are typically stand-
alone for each operating entity, with no corporate-wide or complex Enterprise Resource Planning systems
in place. The interaction between the Company’s internal systems and those of critical third parties are not
usually of a nature that could result in a material Year 2000 problem, due to the existence of alternative
methods of communication. Products supplied to Precision Components customers do not contain any
IT or non-IT systems. Automation Systems products may contain IT or non-IT systems of two types:
a) ATS-developed applications such as machine control programs and b) third party systems integrated
into an overall ATS automation system. The typical machine control program does not use date or time
functions. Third party systems integrated into an ATS automation system are addressed under the “critical
third parties” component of the Company’s Year 2000 Compliance Assessment Plan (the “Plan”).
While the Company has made substantial progress towards internal Year 2000 compliance, the Year 2000
readiness of third parties with which the Company has material relationships is largely outside the Company’s
control. Consequently, it is not possible to be certain that all aspects of the Year 2000 Issue affecting the
Company and its products, including those related to the efforts of customers, suppliers or other third
parties, will be fully resolved.
E VA L UAT I O N O F T H E C O M PA N Y ’ S S I T UAT I O N , A N D P L A N S F O R
M I S S I O N C R I T I CA L I T A N D N O N - I T SYST E M S
A comprehensive corporate-wide Plan is in place for Mission Critical systems (i.e. IT and non-IT systems
assessed as materially impacting the Company’s operations in the case of failure). The Plan includes review
of critical third parties (defined as those that, if they cannot achieve Year 2000 compliance, could have
a material impact on the Company). Key components of the Plan are: a) implementation responsibilities
b) a timetable c) a step-by-step procedure to test internal business systems and Company-designed and
manufactured products that are date-dependent, and d) criteria for assessing critical third parties. Year 2000
compliance has been defined under the Plan to mean that neither performance nor functionality is affected
by dates prior to, during, or after the year 2000 change. The Company’s internal testing procedure was
developed using guidelines developed by the automotive and electronics industries, based on the most
commonly accepted definition of Year 2000 compliance included in BSI standard DISC PD2000-1
A definition of Year 2000 Conformity Requirements.
The Company’s Plan was implemented in April 1998, with defined responsibilities at the corporate level
as well as at each operating location. All Mission Critical systems were identified, inventoried and assessed
under the Company’s Plan by December 1998. This review showed that, for the most part, systems were
already compliant. The identification, inventory and assessment phase of the Plan included identification
and assessment of risk relating to all critical third parties.
STAT U S O F T H E C O M PA N Y ’ S R E M E D I AT I O N P L A N S
Internal testing of Mission Critical systems was complete in December 1998. Replacement or correction of
non-compliant internal systems is on schedule, is believed to be approximately 90% complete to date and
is scheduled to be 100% complete by September 1999.
22 A T S 1 9 9 9 A N N U A L R E P O R T
M A N A G E M E N T ’ S D I S C U S S I O N A N D A N A LYS I S
To date, the Company has identified and contacted all critical third parties. Those that have not currently
completed their Year 2000 assessments continue to be monitored by the Company under its Plan. If a
critical third party is unable to complete its assessment, the Company’s contingency plan includes provi-
sions to replace the third party with an identified compliant third party. Assessment of new Mission Critical
systems or new critical third parties is ongoing as they arise, and will continue through to the Year 2000.
Because the Plan has not identified any material internal or customer product issues to date, or any
material non-compliant third parties who cannot be replaced with a compliant third party, the Company
has not drafted complex contingency and business continuity plans in the event of disruptions resulting
from the Year 2000 Issue.
A Year 2000 status report is provided to the Audit and Finance Committee of the Board of Directors on
a quarterly basis.
Y E A R 2 0 0 0 C O STS
All compliance costs under the Plan, which to date have been immaterial internal staff costs, have been
expensed as incurred. Expected future costs are also expected to be immaterial, and will be expensed
as incurred.
Outlook
As a result of the significant reduction in microelectronics contract revenue, revenue and earnings in the
Company’s Precision Components Group are not expected to grow in fiscal 2000. This contract gener-
ated 20% of fiscal 1999 consolidated revenue and is not expected to provide any significant revenue in fiscal
2000 as a result of the customer accelerating its transition to new technology which does not use the
product supplied by ATS. Management believes there is evidence to suggest that the solar market is begin-
ning to improve. However, any photovoltaics revenue improvements that may result would likely not be felt
until the second half of fiscal 2000. Management believes, based on expected market conditions, and
orders received or anticipated, that many areas of its Precision Components business will grow in fiscal
2000. However, it is unlikely that this growth, combined with ramp up of any new large contracts that may
be secured, will be sufficient to fully replace the expected decline in the microelectronics revenue in fiscal
2000. Given the size of the lost microelectronics revenue, management believes that it will be difficult for
the Company to achieve, in fiscal 2000, the basic earnings per share of $0.67 generated in fiscal 1999.
Beyond fiscal 2000, the outlook for obtaining sufficient Precision Components revenue to replace the
microelectronics contract, and to resume growth in this Group, is more positive. Management believes that
its Precision Components Group will continue to secure new business and grow as strong outsourcing
trends continue to develop in its markets. The Company continues to seek out opportunities for its
precision components capabilities, primarily in the automotive, electronics, medical and photovoltaics
sectors. In fiscal 1999, ATS strategically demonstrated its extensive and unique capabilities in management,
engineering and high volume manufacturing of precision components. Management believes that the
experience and credibility it has gained as a precision components supplier, along with its unique manu-
facturing and engineering capabilities, will help ATS to secure attractive new business opportunities
in future.
A T S 1 9 9 9 A N N U A L R E P O R T 23
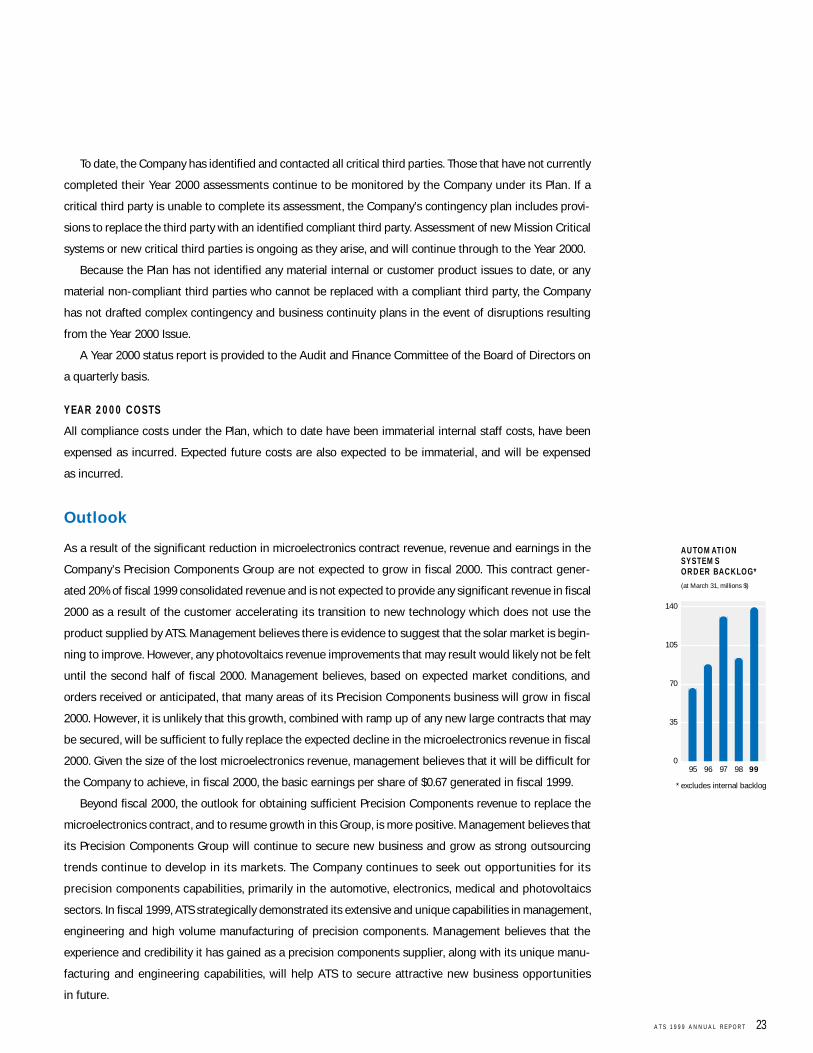
95 96 97 98 99
A U TO M AT I O N SYST E M S O R D E R BA C K LO G * (at March 31, millions $)
0
35
70
105
140
* excludes internal backlog
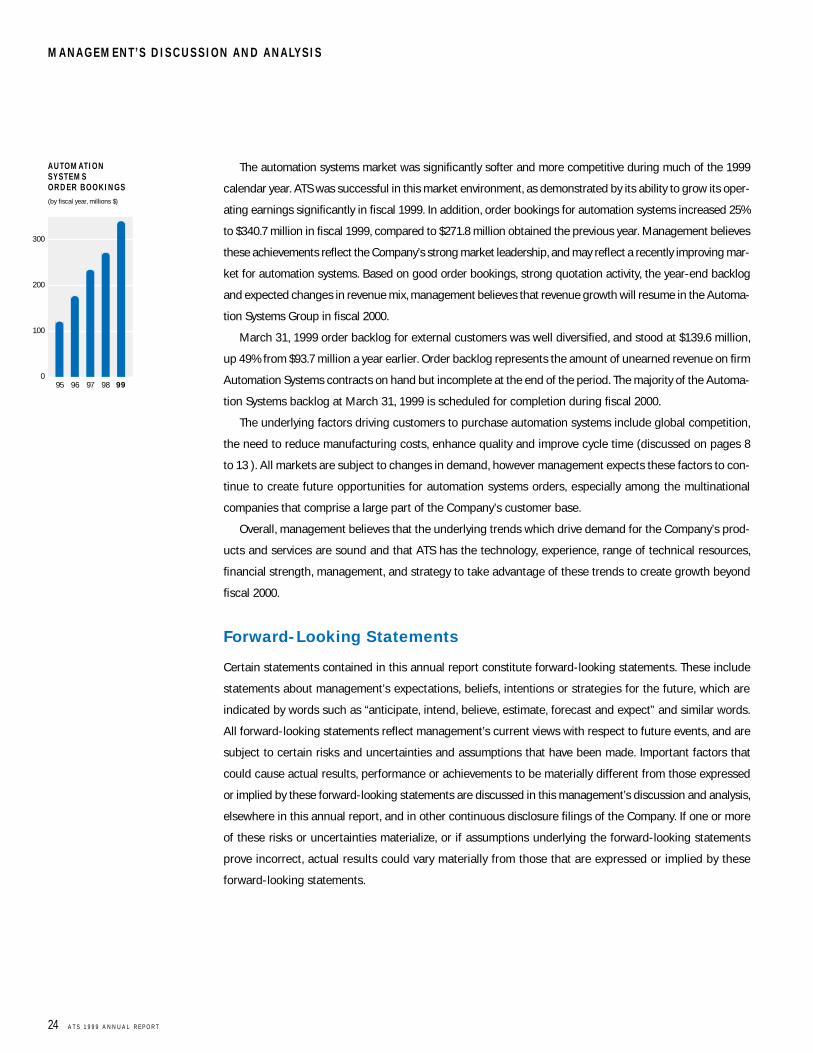
The automation systems market was significantly softer and more competitive during much of the 1999
calendar year. ATS was successful in this market environment, as demonstrated by its ability to grow its oper-
ating earnings significantly in fiscal 1999. In addition, order bookings for automation systems increased 25%
to $340.7 million in fiscal 1999, compared to $271.8 million obtained the previous year. Management believes
these achievements reflect the Company’s strong market leadership, and may reflect a recently improving mar-
ket for automation systems. Based on good order bookings, strong quotation activity, the year-end backlog
and expected changes in revenue mix, management believes that revenue growth will resume in the Automa-
tion Systems Group in fiscal 2000.
March 31, 1999 order backlog for external customers was well diversified, and stood at $139.6 million,
up 49% from $93.7 million a year earlier. Order backlog represents the amount of unearned revenue on firm
Automation Systems contracts on hand but incomplete at the end of the period. The majority of the Automa-
tion Systems backlog at March 31, 1999 is scheduled for completion during fiscal 2000.
The underlying factors driving customers to purchase automation systems include global competition,
the need to reduce manufacturing costs, enhance quality and improve cycle time (discussed on pages 8
to 13 ). All markets are subject to changes in demand, however management expects these factors to con-
tinue to create future opportunities for automation systems orders, especially among the multinational
companies that comprise a large part of the Company’s customer base.
Overall, management believes that the underlying trends which drive demand for the Company’s prod-
ucts and services are sound and that ATS has the technology, experience, range of technical resources,
financial strength, management, and strategy to take advantage of these trends to create growth beyond
fiscal 2000.
Forward-Looking Statements
Certain statements contained in this annual report constitute forward-looking statements. These include
statements about management’s expectations, beliefs, intentions or strategies for the future, which are
indicated by words such as “anticipate, intend, believe, estimate, forecast and expect” and similar words.
All forward-looking statements reflect management’s current views with respect to future events, and are
subject to certain risks and uncertainties and assumptions that have been made. Important factors that
could cause actual results, performance or achievements to be materially different from those expressed
or implied by these forward-looking statements are discussed in this management’s discussion and analysis,
elsewhere in this annual report, and in other continuous disclosure filings of the Company. If one or more
of these risks or uncertainties materialize, or if assumptions underlying the forward-looking statements
prove incorrect, actual results could vary materially from those that are expressed or implied by these
forward-looking statements.
24 A T S 1 9 9 9 A N N U A L R E P O R T
M A N A G E M E N T ’ S D I S C U S S I O N A N D A N A LYS I S
95 96 97 98 99
A U TO M AT I O N SYST E M S O R D E R B O O K I N G S (by fiscal year, millions $)
0
100
200
300
The accompanying consolidated financial statements of ATS Automation Tooling Systems Inc. were prepared by management in accordance withaccounting principles generally accepted in Canada. The significant accounting policies, which management believes are appropriate for the Company,are described in note 1 to the consolidated financial statements. The financial information contained elsewhere in this document is consistent withthat in the consolidated financial statements.
Management is responsible for the integrity and objectivity of the financial statements. Estimates are necessary in the preparation of thesestatements and, based on careful judgements, have been properly reflected in the financial statements. Management has established systems ofinternal control which are designed to provide reasonable assurance that assets are safeguarded from loss or unauthorized use and to producereliable accounting records for the preparation of financial information.
The Board of Directors is responsible for ensuring that management fulfills its responsibilities for financial reporting and internal control. The Boardexercises its responsibilities through the Audit and Finance Committee of the Board, which is comprised of outside directors and which meetsperiodically with management and the independent auditors to discuss the Company’s financial reporting practices and procedures, its systems ofinternal accounting controls, the planned scope of examinations by independent auditors and their findings and recommendations. It also reviews theCompany’s consolidated financial statements.
The Company’s independent auditors, KPMG LLP Chartered Accountants, conduct an independent examination on behalf of the shareholders, inaccordance with generally accepted auditing standards and express their opinion on the financial statements. Their report outlines the scope of theirexamination and their opinion on the consolidated financial statements of the Company. The independent auditors have free access to the Auditand Finance Committee of the Board.
Klaus D. Woerner (Signed) Ron J. Jutras (Signed)P R E S I D E N T A N D S E C R E T A R Y A N D
C H I E F E X E C U T I V E O F F I C E R C H I E F F I N A N C I A L O F F I C E R
A U D I TO R S ’ R E P O R T TO T H E S H A R E H O L D E R S
We have audited the consolidated balance sheets of ATS Automation Tooling Systems Inc. as at March 31, 1999 and March 31, 1998 and the consol-idated statements of earnings, retained earnings and changes in financial position for the years then ended. These financial statements are theresponsibility of the Company’s management. Our responsibility is to express an opinion on these financial statements based on our audits.
We conducted our audits in accordance with generally accepted auditing standards. Those standards require that we plan and perform an auditto obtain reasonable assurance whether the financial statements are free of material misstatement. An audit includes examining, on a test basis,evidence supporting the amounts and disclosures in the financial statements. An audit also includes assessing the accounting principles used andsignificant estimates made by management, as well as evaluating the overall financial statement presentation.
In our opinion, these consolidated financial statements present fairly, in all material respects, the financial position of the Company as atMarch 31, 1999 and March 31, 1998 and the results of its operations and the changes in its financial position for the years then ended in accordancewith generally accepted accounting principles.
Chartered AccountantsW A T E R L O O , C A N A D A
M A Y 1 3 , 1 9 9 9
A T S 1 9 9 9 A N N U A L R E P O R T 25
M A N A G E M E N T ’ S R E S P O N S I B I L I T Y F O R F I N A N C I A L R E P O R T I N G
KPMG LLP (Signed)
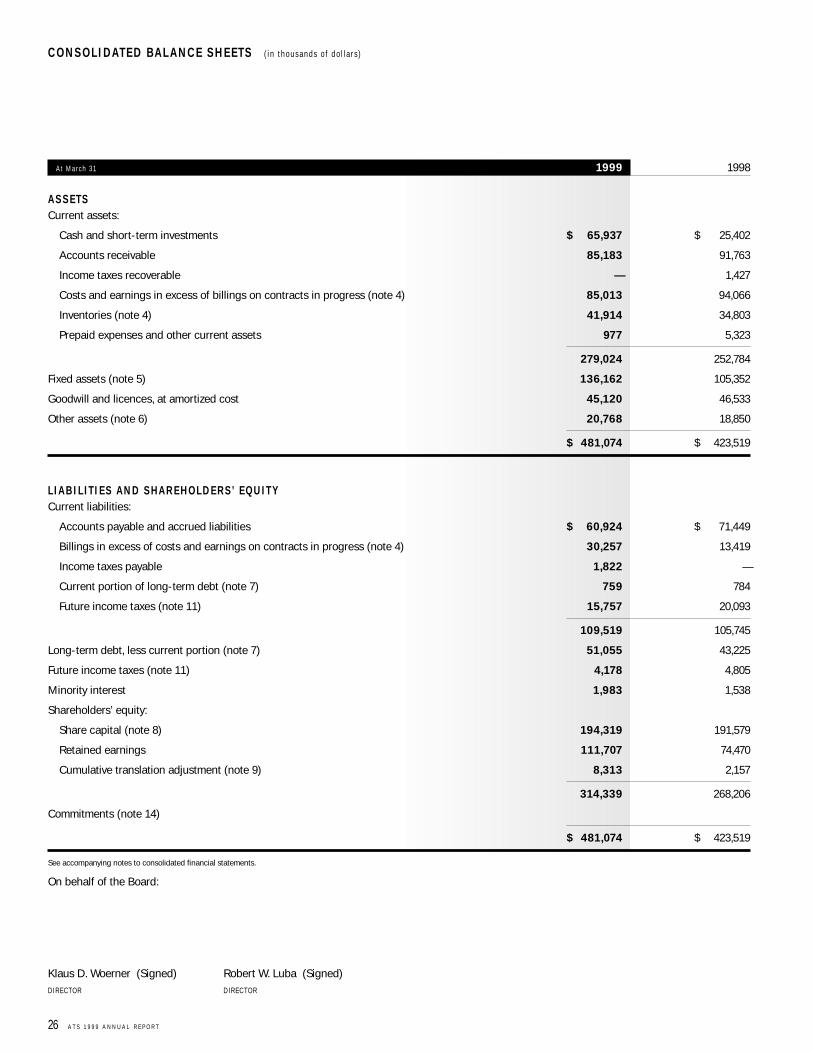
A t M a r c h 3 1 1999 1998
A S S E TSCurrent assets:
Cash and short-term investments $ 65,937 $ 25,402
Accounts receivable 85,183 91,763
Income taxes recoverable — 1,427
Costs and earnings in excess of billings on contracts in progress (note 4) 85,013 94,066
Inventories (note 4) 41,914 34,803
Prepaid expenses and other current assets 977 5,323
279,024 252,784
Fixed assets (note 5) 136,162 105,352
Goodwill and licences, at amortized cost 45,120 46,533
Other assets (note 6) 20,768 18,850
$ 481,074 $ 423,519
L I A B I L I T I E S A N D S H A R E H O L D E R S ’ E Q U I T YCurrent liabilities:
Accounts payable and accrued liabilities $ 60,924 $ 71,449
Billings in excess of costs and earnings on contracts in progress (note 4) 30,257 13,419
Income taxes payable 1,822 —
Current portion of long-term debt (note 7) 759 784
Future income taxes (note 11) 15,757 20,093
109,519 105,745
Long-term debt, less current portion (note 7) 51,055 43,225
Future income taxes (note 11) 4,178 4,805
Minority interest 1,983 1,538
Shareholders’ equity:
Share capital (note 8) 194,319 191,579
Retained earnings 111,707 74,470
Cumulative translation adjustment (note 9) 8,313 2,157
314,339 268,206
Commitments (note 14)
$ 481,074 $ 423,519
See accompanying notes to consolidated financial statements.
On behalf of the Board:
Klaus D. Woerner (Signed) Robert W. Luba (Signed)D I R E C T O R D I R E C T O R
26 A T S 1 9 9 9 A N N U A L R E P O R T
C O N S O L I DAT E D BA L A N C E S H E E TS ( i n t h o u s a n d s o f d o l l a r s )
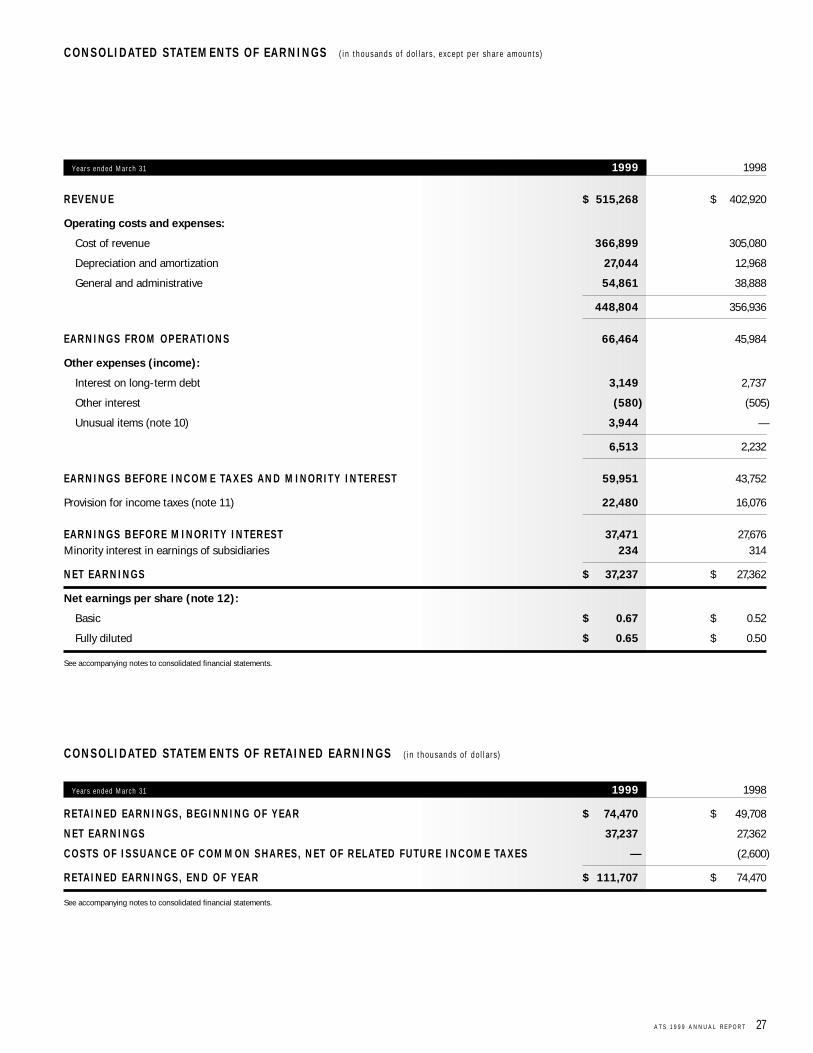
Y e a r s e n d e d M a r c h 3 1 1999 1998
R E V E N U E $ 515,268 $ 402,920
Operating costs and expenses:
Cost of revenue 366,899 305,080
Depreciation and amortization 27,044 12,968
General and administrative 54,861 38,888
448,804 356,936
E A R N I N G S F R O M O P E R AT I O N S 66,464 45,984
Other expenses (income):
Interest on long-term debt 3,149 2,737
Other interest (580) (505)
Unusual items (note 10) 3,944 —
6,513 2,232
E A R N I N G S B E F O R E I N C O M E TA X E S A N D M I N O R I T Y I N T E R E ST 59,951 43,752
Provision for income taxes (note 11) 22,480 16,076
E A R N I N G S B E F O R E M I N O R I T Y I N T E R E ST 37,471 27,676Minority interest in earnings of subsidiaries 234 314
N E T E A R N I N G S $ 37,237 $ 27,362
Net earnings per share (note 12):
Basic $ 0.67 $ 0.52
Fully diluted $ 0.65 $ 0.50
See accompanying notes to consolidated financial statements.
C O N S O L I DAT E D STAT E M E N TS O F R E TA I N E D E A R N I N G S ( i n t h o u s a n d s o f d o l l a r s )
Y e a r s e n d e d M a r c h 3 1 1999 1998
R E TA I N E D E A R N I N G S , B E G I N N I N G O F Y E A R $ 74,470 $ 49,708
N E T E A R N I N G S 37,237 27,362
C O STS O F I S S UA N C E O F C O M M O N S H A R E S , N E T O F R E L AT E D F U T U R E I N C O M E TA X E S — (2,600)
R E TA I N E D E A R N I N G S , E N D O F Y E A R $ 111,707 $ 74,470
See accompanying notes to consolidated financial statements.
A T S 1 9 9 9 A N N U A L R E P O R T 27
C O N S O L I DAT E D STAT E M E N TS O F E A R N I N G S ( i n t h o u s a n d s o f d o l l a r s , e x c e p t p e r s h a r e a m o u n t s )

Y e a r s e n d e d M a r c h 3 1 1999 1998
CA S H P R O V I D E D BY ( U S E D I N ) :Operating activities:
Net earnings $ 37,237 $ 27,362
Items not involving cash 27,381 23,297
Cash flow from operations 64,618 50,659
Change in non-cash operating working capital 21,988 (54,826)
86,606 (4,167)
Investing activities:
Acquisition of interest in subsidiaries, net of cash (note 2) — (22,021)
Acquisition of fixed assets (54,898) (57,393)
Investments (11,022) (5,826)
(65,920) (85,240)
Financing activities:
Issuance of common shares, net of cost of issuance 2,740 95,330
Change in long-term debt 7,805 17,037
Investment tax credits and other 9,304 (1,538)
19,849 110,829
I N C R E A S E I N CA S H 40,535 21,422
CA S H A N D S H O R T-T E R M I N V E ST M E N TS , B E G I N N I N G O F Y E A R 25,402 3,980
CA S H A N D S H O R T-T E R M I N V E ST M E N TS , E N D O F Y E A R $ 65,937 $ 25,402
See accompanying notes to consolidated financial statements.
28 A T S 1 9 9 9 A N N U A L R E P O R T
C O N S O L I DAT E D STAT E M E N TS O F C H A N G E S I N F I N A N C I A L P O S I T I O N ( i n t h o u s a n d s o f d o l l a r s )
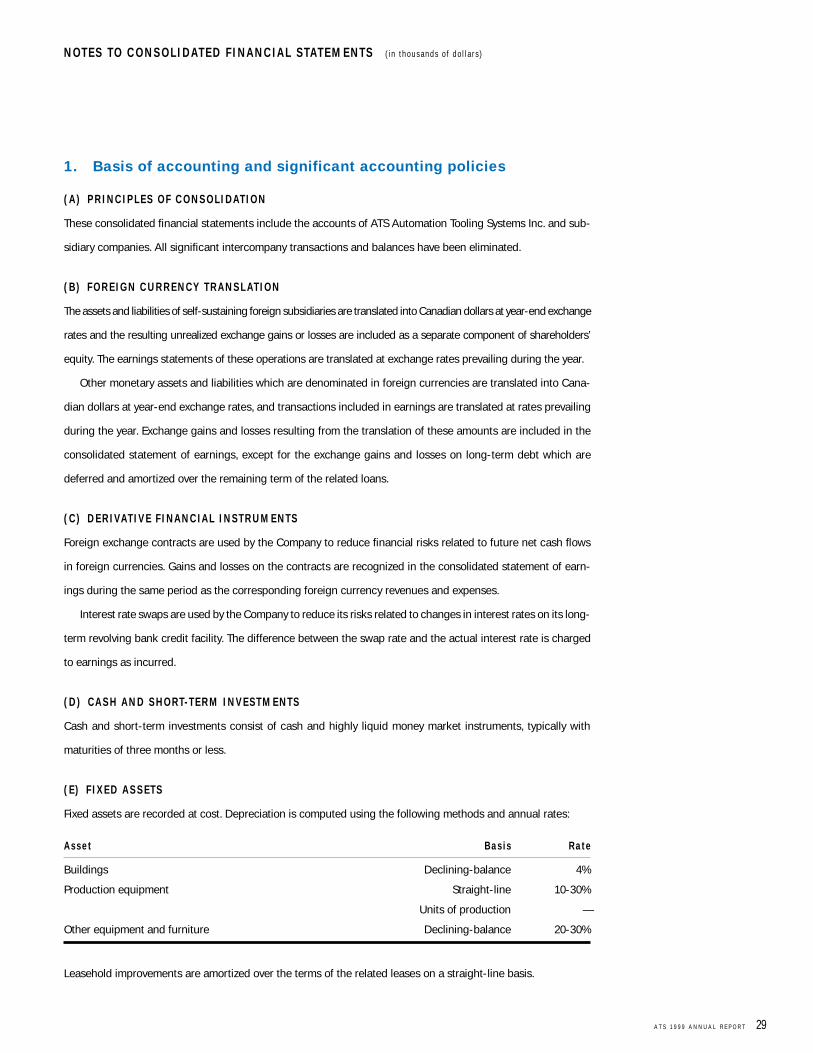
1. Basis of accounting and significant accounting policies
( A ) P R I N C I P L E S O F C O N S O L I DAT I O N
These consolidated financial statements include the accounts of ATS Automation Tooling Systems Inc. and sub-
sidiary companies. All significant intercompany transactions and balances have been eliminated.
( B ) F O R E I G N C U R R E N CY T R A N S L AT I O N
The assets and liabilities of self-sustaining foreign subsidiaries are translated into Canadian dollars at year-end exchange
rates and the resulting unrealized exchange gains or losses are included as a separate component of shareholders’
equity. The earnings statements of these operations are translated at exchange rates prevailing during the year.
Other monetary assets and liabilities which are denominated in foreign currencies are translated into Cana-
dian dollars at year-end exchange rates, and transactions included in earnings are translated at rates prevailing
during the year. Exchange gains and losses resulting from the translation of these amounts are included in the
consolidated statement of earnings, except for the exchange gains and losses on long-term debt which are
deferred and amortized over the remaining term of the related loans.
( C ) D E R I VAT I V E F I N A N C I A L I N ST R U M E N TS
Foreign exchange contracts are used by the Company to reduce financial risks related to future net cash flows
in foreign currencies. Gains and losses on the contracts are recognized in the consolidated statement of earn-
ings during the same period as the corresponding foreign currency revenues and expenses.
Interest rate swaps are used by the Company to reduce its risks related to changes in interest rates on its long-
term revolving bank credit facility. The difference between the swap rate and the actual interest rate is charged
to earnings as incurred.
( D ) CA S H A N D S H O R T-T E R M I N V E ST M E N TS
Cash and short-term investments consist of cash and highly liquid money market instruments, typically with
maturities of three months or less.
( E ) F I X E D A S S E TS
Fixed assets are recorded at cost. Depreciation is computed using the following methods and annual rates:
A s s e t B a s i s R a t e
Buildings Declining-balance 4%
Production equipment Straight-line 10-30%
Units of production —
Other equipment and furniture Declining-balance 20-30%
Leasehold improvements are amortized over the terms of the related leases on a straight-line basis.
A T S 1 9 9 9 A N N U A L R E P O R T 29
N OT E S TO C O N S O L I DAT E D F I N A N C I A L STAT E M E N TS ( i n t h o u s a n d s o f d o l l a r s )
( F ) G O O D W I L L A N D L I C E N C E S
Goodwill is recorded at cost and is amortized using the straight-line method over periods from five to forty years.
The Company evaluates goodwill each year to determine if there has been a permanent decline in value based
on current and expected operating earnings of each underlying business, taking into consideration operating
trends and other relevant factors.
Licences are recorded at cost and are amortized over their estimated economic life.
( G ) C O N T R A CT R E V E N U E A N D I N V E N TO R I E S
Contract revenue in the Automation Systems segment is recognized using the percentage of completion method.
Complete provision is made for losses on contracts in progress when such losses first become known. Revisions
in cost and profit estimates, which can be significant, are reflected in the accounting period in which the rele-
vant facts become known. Revenue in the Precision Components segment is recognized at time of shipment.
Inventories are valued at the lower of cost (first-in, first-out basis) and net realizable value.
( H ) R E S E A R C H A N D D E V E LO P M E N T C O STS
Research costs are charged as an expense of the period in which they are incurred. Development costs are deferred
and amortized over the period in which the Company expects to benefit from the resulting product or process.
( I ) P R E - P R O D U CT I O N C O STS
Pre-production costs related to new precision components orders are deferred and amortized over the life of the
related contract on a units of production basis.
( J ) I N V E ST M E N T TA X C R E D I TS
Investment tax credits are accounted for as a reduction in the cost of the related asset or expense when there is
reasonable assurance that such credits will be realized.
( K ) I N C O M E TA X E S
In the year ended March 31, 1999, the Company adopted the liability method of tax allocation for accounting for
income taxes as provided for in the new recommendations of The Canadian Institute of Chartered Accountants.
Under the liability method of tax allocation, future tax assets and liabilities are determined based on differences
between the financial reporting and tax bases of assets and liabilities, and are measured using the substantially
enacted tax rates and laws that will be in effect when the differences are expected to reverse.
Prior to the adoption of the recommendations, income tax expense was determined using the deferral method
of tax allocation. Under this method, future tax expense was based on items of income and expense that were
reported in different years in the financial statements and tax returns, and measured at the tax rate in effect in
the year the difference originated.
30 A T S 1 9 9 9 A N N U A L R E P O R T
N OT E S TO C O N S O L I DAT E D F I N A N C I A L STAT E M E N TS ( i n t h o u s a n d s o f d o l l a r s )
2. Acquisitions
During the year ended March 31, 1998, the following businesses were acquired: 100% of a Swiss manufacturer
of automated assembly equipment; 96% of a French manufacturer of solar cells and modules; and 100% of a U.S.
precision cleaning business.
The acquisitions have been accounted for using the purchase method as follows:
1998
Assets, net of cash acquired $ 32,837
Liabilities (18,201)
Increase in goodwill 8,288
22,924
Less minority interest in subsidiaries (903)
$ 22,021
Consideration at fair value:
Cash $ 22,021
The consolidated statements of earnings include the results of acquired businesses from their respective
dates of acquisition.
3. Financial instruments
The contract nature of the Company’s business may result in significant fluctuations from period to period in the
relative percentages of accounts receivable and contracts in progress concentrated with any one customer,
industry or geographic region. At March 31, 1999, one customer accounted for approximately 11% of the com-
bined balance of accounts receivable and contracts in progress. At March 31, 1998, a different customer
accounted for approximately 17% of the combined accounts receivable and contracts in progress balances.
The Company generates significant revenues in major foreign currencies, primarily U.S. dollars, which exceed
the natural hedge provided by purchases of goods and services in those currencies. In order to manage a
portion of this net foreign currency exposure, the Company has entered into foreign exchange contracts. The
timing and amount of foreign exchange contracts are estimated based on existing customer contracts on hand
or anticipated, current conditions in the Company’s markets, and the Company’s past experience.
At March 31, 1999, the Company had outstanding forward contracts of U.S.$60,450,000 maturing on or before
February 2000, at rates ranging from Cdn$1.3656 to Cdn$1.5336 to U.S.$1.00; outstanding forward contracts of
DM2,000,000 maturing on or before August 1999, at rates ranging from Cdn$0.8499 to Cdn$0.8545 to DM1.00;
and outstanding forward contracts of DM3,000,000 maturing on or before August 1999, at rates ranging from
Chf0.8050 to Chf0.8200 to DM1.00. Based on foreign exchange rates as at March 31, 1999 for contracts with
A T S 1 9 9 9 A N N U A L R E P O R T 31
similar remaining terms to maturity, the unrecognized net losses relating to the Company’s forward exchange
contracts are approximately $1,477,000.
The carrying amounts reported in the balance sheets for cash and short-term investments, accounts
receivable, contracts in progress and accounts payable and accrued liabilities approximate their fair values, due
to the short-term nature of those instruments.
The carrying value of long-term debt approximates fair value since the effective interest rates reflect current
market rates. The Company has an interest rate swap agreement whereby the interest rate on U.S.$7,000,000 of
the revolving bank credit facility has been fixed at 8.145% until the year 2001. The fair value of the interest rate
swap approximates an unrealized loss of U.S.$415,000 at March 31, 1999 (1998—U.S.$423,000 unrealized loss).
4. Contracts in progress and inventories
A t M a r c h 3 1 1999 1998
Contracts in progress at the balance sheet date:
Costs incurred on contracts in progress $ 263,696 $ 231,305
Estimated earnings 68,902 74,358
332,598 305,663
Progress billings (277,842) (225,016)
$ 54,756 $ 80,647
Disclosed as:
Costs and earnings in excess of billings on contracts in progress $ 85,013 $ 94,066
Billings in excess of costs and earnings on contracts in progress (30,257) (13,419)
$ 54,756 $ 80,647
Inventories are summarized as follows:
Raw materials to be used in manufacturing $ 23,149 $ 20,267
Work in process 10,193 11,789
Finished goods available for sale 8,572 2,747
$ 41,914 $ 34,803
32 A T S 1 9 9 9 A N N U A L R E P O R T
N OT E S TO C O N S O L I DAT E D F I N A N C I A L STAT E M E N TS ( i n t h o u s a n d s o f d o l l a r s )
5. Fixed assets
A t M a r c h 3 1 1999 1998
A c c u m u l a t e d N e t b o o k N e t b o o kC o s t d e p re c i a t i o n va l u e v a l u e
Land and land improvements $ 7,743 $ — $ 7,743 $ 6,299
Buildings 29,508 2,449 27,059 19,528
Leasehold improvements 8,232 1,836 6,396 4,832
Production equipment 117,604 31,032 86,572 66,957
Other equipment and furniture 16,519 8,127 8,392 7,736
$ 179,606 $ 43,444 $136,162 $ 105,352
6. Other assets
A t M a r c h 3 1 1999 1998
Investment tax credits $ 4,161 $ 9,656
Deferred foreign exchange loss on long-term debt, net 2,660 1,492
Deferred pre-production costs, net 973 1,573
Deferred development costs, net 3,541 4,135
Interest bearing notes receivable 4,672 494
Subordinated loan receivable 1,500 1,500
Long-term investments 3,261 —
$ 20,768 $ 18,850
The Company leases, at market rates, a manufacturing facility from 1032123 Ontario Limited, a corporation
controlled by the President, a significant shareholder of the Company. In fiscal 1994, in return for certain concessions
under the lease, including specified purchase and renewal options, the Company made an interest-free loan to
1032123 Ontario Limited in the amount of $1,500,000. This loan is repayable upon the earlier of termination of the
lease, the occurrence of certain events of default, the date the facility is sold and January 1, 2009. The loan is
subordinated to the repayment of the first mortgage on the property.
The Company has guaranteed $6,600,000 of the mortgage on the manufacturing facility described above,
during the initial term of the lease.
A T S 1 9 9 9 A N N U A L R E P O R T 33
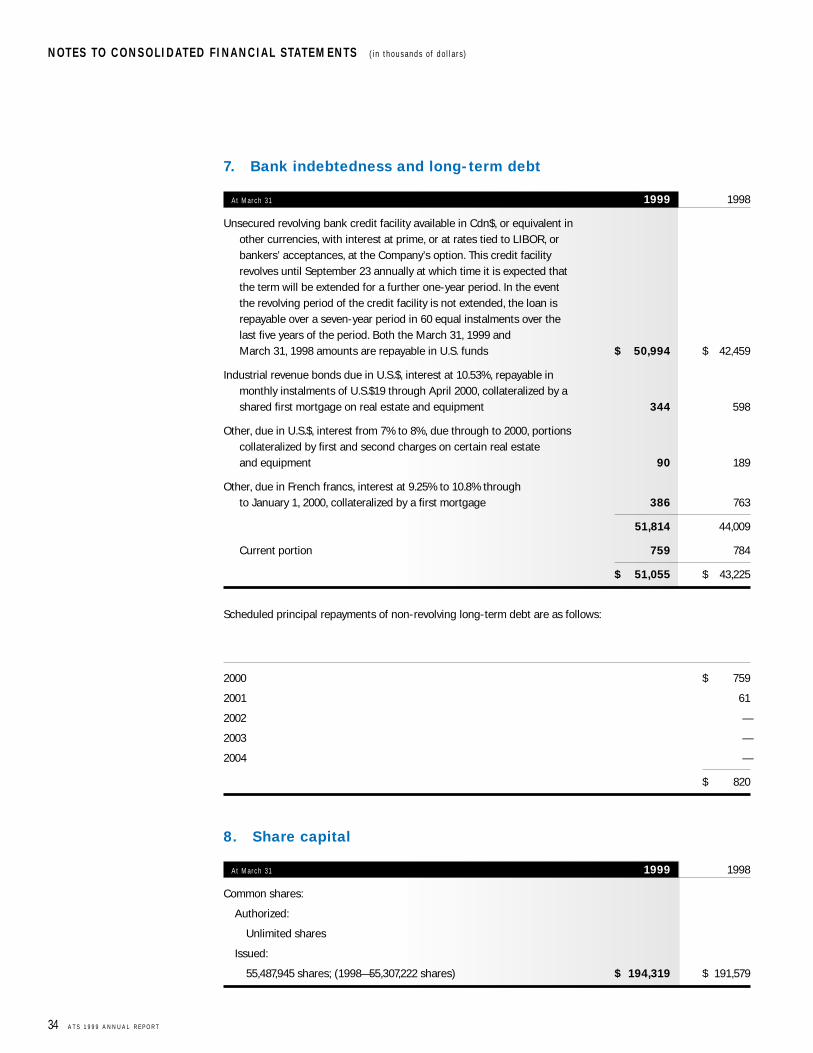
7. Bank indebtedness and long-term debt
A t M a r c h 3 1 1999 1998
Unsecured revolving bank credit facility available in Cdn$, or equivalent inother currencies, with interest at prime, or at rates tied to LIBOR, orbankers’ acceptances, at the Company’s option. This credit facilityrevolves until September 23 annually at which time it is expected thatthe term will be extended for a further one-year period. In the eventthe revolving period of the credit facility is not extended, the loan isrepayable over a seven-year period in 60 equal instalments over thelast five years of the period. Both the March 31, 1999 and March 31, 1998 amounts are repayable in U.S. funds $ 50,994 $ 42,459
Industrial revenue bonds due in U.S.$, interest at 10.53%, repayable inmonthly instalments of U.S.$19 through April 2000, collateralized by a shared first mortgage on real estate and equipment 344 598
Other, due in U.S.$, interest from 7% to 8%, due through to 2000, portionscollateralized by first and second charges on certain real estate and equipment 90 189
Other, due in French francs, interest at 9.25% to 10.8% throughto January 1, 2000, collateralized by a first mortgage 386 763
51,814 44,009
Current portion 759 784
$ 51,055 $ 43,225
Scheduled principal repayments of non-revolving long-term debt are as follows:
2000 $ 759
2001 61
2002 —
2003 —
2004 —
$ 820
8. Share capital
A t M a r c h 3 1 1999 1998
Common shares:
Authorized:
Unlimited shares
Issued:
55,487,945 shares; (1998—55,307,222 shares) $ 194,319 $ 191,579
34 A T S 1 9 9 9 A N N U A L R E P O R T
N OT E S TO C O N S O L I DAT E D F I N A N C I A L STAT E M E N TS ( i n t h o u s a n d s o f d o l l a r s )

The Company’s employee stock purchase plan provides that a maximum of 1,200,000 common shares may
be purchased by employees at the market price of the shares at the date of subscription. During the year ended
March 31, 1999, 119,500 shares were fully paid and issued at purchase prices ranging from $18.30 to $24.24
(1998—181,500 shares).
Under the terms of the share option plan the Company may grant options to employees, officers and directors
to purchase not more than 3,354,932 common shares at prices which may not be less than the market price of
the shares at the date of the grant. The right to exercise the options, which vest over periods from 4 to 5 years
from the date of grant, expires if not exercised by the tenth anniversary of grant. During the year ended March 31,
1999, 61,223 shares (1998—144,390 shares) were issued pursuant to share options exercised.
At March 31, 1999, there were share options outstanding in respect of 2,486,190 (1998—2,090,698 shares)
common shares at prices ranging from $2.00 to $28.38 per share.
9. Cumulative translation adjustment
The cumulative translation adjustment represents the net unrealized foreign currency translation gain on the
Company’s net investment in self-sustaining foreign operations, principally in the United States.
A t M a r c h 3 1 1999 1998
Cumulative unrealized gain at beginning of year $ 2,157 $ 1,172
Unrealized gains (losses) on translation of non-current items 3,958 (4,382)
Unrealized gains on translation of current items 2,198 5,367
Cumulative unrealized gain at end of year $ 8,313 $ 2,157
10. Unusual items
Items comprising unusual expenses (income) are as follows:
Y e a r s e n d e d M a r c h 3 1 1999 1998
Write-down for decline in value of assets $ 3,500 $ —
Investment tax credits relating to prior years’ research and development expenses (5,599) —
Write-down for impairment in value of investments 6,043 —
$ 3,944 $ —
During 1999, a customer advised the Company that the expected future shipments under a large Precision
Components contract would be materially lower than previously estimated. As a result, during the third quarter
the Company recorded a charge to earnings of $3,500,000 before income taxes ($2,205,000 after income taxes)
to reflect the estimated decline in realizable value of certain assets related to the contract.
A T S 1 9 9 9 A N N U A L R E P O R T 35
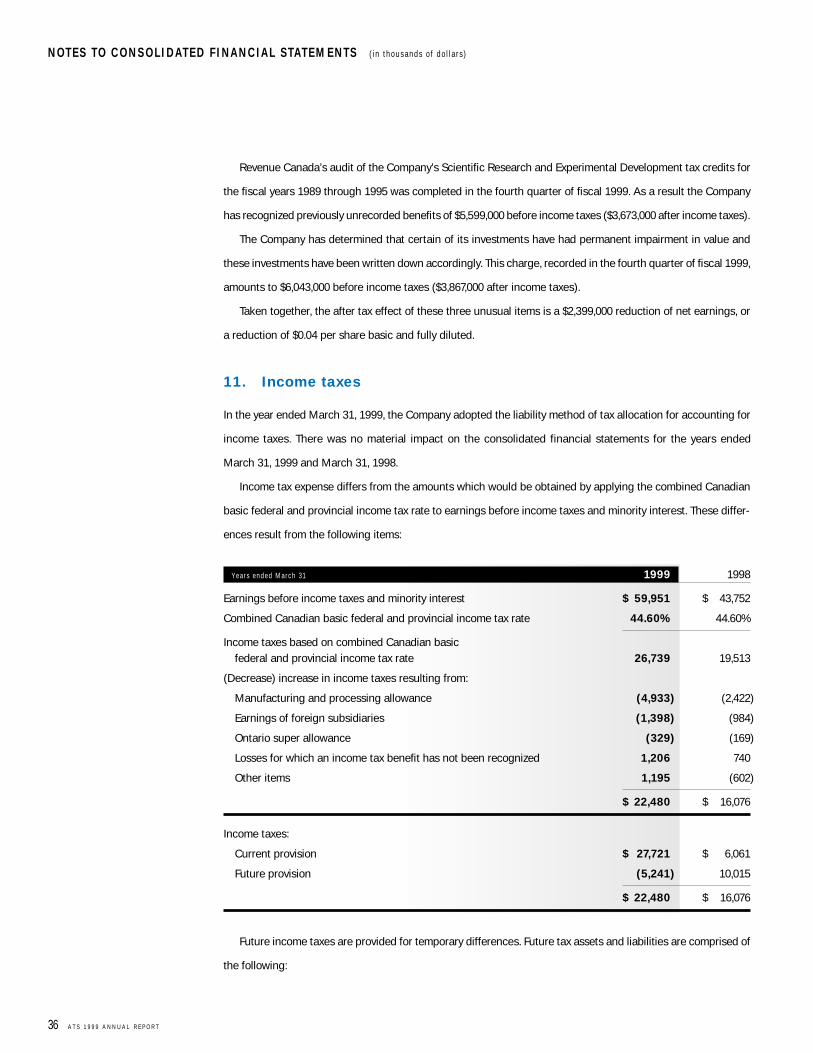
Revenue Canada’s audit of the Company’s Scientific Research and Experimental Development tax credits for
the fiscal years 1989 through 1995 was completed in the fourth quarter of fiscal 1999. As a result the Company
has recognized previously unrecorded benefits of $5,599,000 before income taxes ($3,673,000 after income taxes).
The Company has determined that certain of its investments have had permanent impairment in value and
these investments have been written down accordingly. This charge, recorded in the fourth quarter of fiscal 1999,
amounts to $6,043,000 before income taxes ($3,867,000 after income taxes).
Taken together, the after tax effect of these three unusual items is a $2,399,000 reduction of net earnings, or
a reduction of $0.04 per share basic and fully diluted.
11. Income taxes
In the year ended March 31, 1999, the Company adopted the liability method of tax allocation for accounting for
income taxes. There was no material impact on the consolidated financial statements for the years ended
March 31, 1999 and March 31, 1998.
Income tax expense differs from the amounts which would be obtained by applying the combined Canadian
basic federal and provincial income tax rate to earnings before income taxes and minority interest. These differ-
ences result from the following items:
Y e a r s e n d e d M a r c h 3 1 1999 1998
Earnings before income taxes and minority interest $ 59,951 $ 43,752
Combined Canadian basic federal and provincial income tax rate 44.60% 44.60%
Income taxes based on combined Canadian basicfederal and provincial income tax rate 26,739 19,513
(Decrease) increase in income taxes resulting from:
Manufacturing and processing allowance (4,933) (2,422)
Earnings of foreign subsidiaries (1,398) (984)
Ontario super allowance (329) (169)
Losses for which an income tax benefit has not been recognized 1,206 740
Other items 1,195 (602)
$ 22,480 $ 16,076
Income taxes:
Current provision $ 27,721 $ 6,061
Future provision (5,241) 10,015
$ 22,480 $ 16,076
Future income taxes are provided for temporary differences. Future tax assets and liabilities are comprised of
the following:
36 A T S 1 9 9 9 A N N U A L R E P O R T
N OT E S TO C O N S O L I DAT E D F I N A N C I A L STAT E M E N TS ( i n t h o u s a n d s o f d o l l a r s )
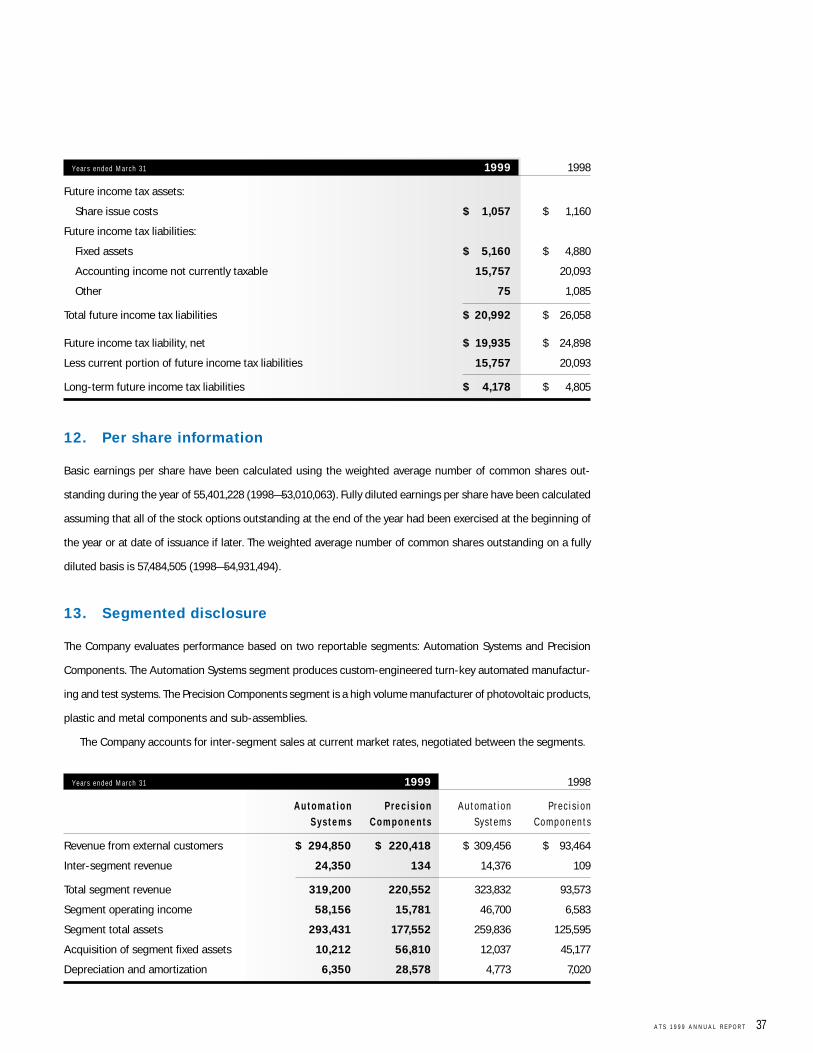
Y e a r s e n d e d M a r c h 3 1 1999 1998
Future income tax assets:
Share issue costs $ 1,057 $ 1,160
Future income tax liabilities:
Fixed assets $ 5,160 $ 4,880
Accounting income not currently taxable 15,757 20,093
Other 75 1,085
Total future income tax liabilities $ 20,992 $ 26,058
Future income tax liability, net $ 19,935 $ 24,898
Less current portion of future income tax liabilities 15,757 20,093
Long-term future income tax liabilities $ 4,178 $ 4,805
12. Per share information
Basic earnings per share have been calculated using the weighted average number of common shares out-
standing during the year of 55,401,228 (1998—53,010,063). Fully diluted earnings per share have been calculated
assuming that all of the stock options outstanding at the end of the year had been exercised at the beginning of
the year or at date of issuance if later. The weighted average number of common shares outstanding on a fully
diluted basis is 57,484,505 (1998—54,931,494).
13. Segmented disclosure
The Company evaluates performance based on two reportable segments: Automation Systems and Precision
Components. The Automation Systems segment produces custom-engineered turn-key automated manufactur-
ing and test systems. The Precision Components segment is a high volume manufacturer of photovoltaic products,
plastic and metal components and sub-assemblies.
The Company accounts for inter-segment sales at current market rates, negotiated between the segments.
Y e a r s e n d e d M a r c h 3 1 1999 1998
A u t o m a t i o n Pre c i s i o n A u t o m a t i o n P r e c i s i o nS y s t e m s C o m p o n e n t s Sy s t e m s C o m p o n e n t s
Revenue from external customers $ 294,850 $ 220,418 $ 309,456 $ 93,464
Inter-segment revenue 24,350 134 14,376 109
Total segment revenue 319,200 220,552 323,832 93,573
Segment operating income 58,156 15,781 46,700 6,583
Segment total assets 293,431 177,552 259,836 125,595
Acquisition of segment fixed assets 10,212 56,810 12,037 45,177
Depreciation and amortization 6,350 28,578 4,773 7,020
A T S 1 9 9 9 A N N U A L R E P O R T 37
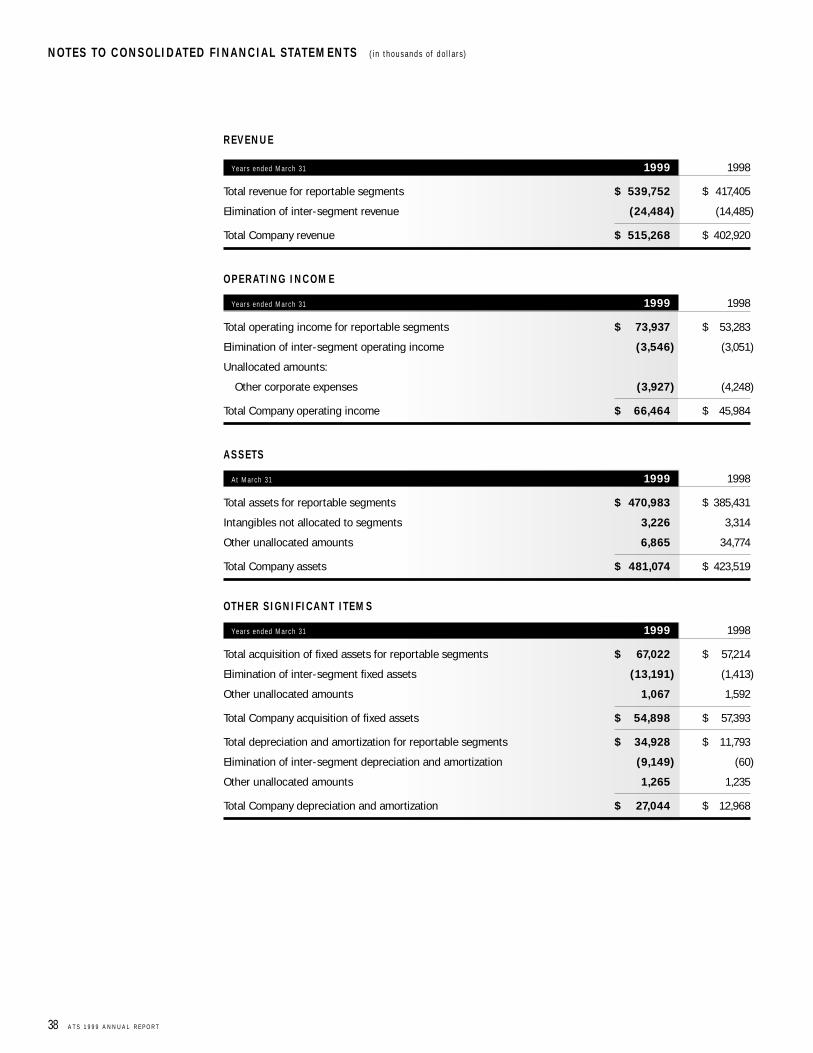
R E V E N U E
Y e a r s e n d e d M a r c h 3 1 1999 1998
Total revenue for reportable segments $ 539,752 $ 417,405
Elimination of inter-segment revenue (24,484) (14,485)
Total Company revenue $ 515,268 $ 402,920
O P E R AT I N G I N C O M E
Y e a r s e n d e d M a r c h 3 1 1999 1998
Total operating income for reportable segments $ 73,937 $ 53,283
Elimination of inter-segment operating income (3,546) (3,051)
Unallocated amounts:
Other corporate expenses (3,927) (4,248)
Total Company operating income $ 66,464 $ 45,984
A S S E TS
A t M a r c h 3 1 1999 1998
Total assets for reportable segments $ 470,983 $ 385,431
Intangibles not allocated to segments 3,226 3,314
Other unallocated amounts 6,865 34,774
Total Company assets $ 481,074 $ 423,519
OT H E R S I G N I F I CA N T I T E M S
Y e a r s e n d e d M a r c h 3 1 1999 1998
Total acquisition of fixed assets for reportable segments $ 67,022 $ 57,214
Elimination of inter-segment fixed assets (13,191) (1,413)
Other unallocated amounts 1,067 1,592
Total Company acquisition of fixed assets $ 54,898 $ 57,393
Total depreciation and amortization for reportable segments $ 34,928 $ 11,793
Elimination of inter-segment depreciation and amortization (9,149) (60)
Other unallocated amounts 1,265 1,235
Total Company depreciation and amortization $ 27,044 $ 12,968
38 A T S 1 9 9 9 A N N U A L R E P O R T
N OT E S TO C O N S O L I DAT E D F I N A N C I A L STAT E M E N TS ( i n t h o u s a n d s o f d o l l a r s )
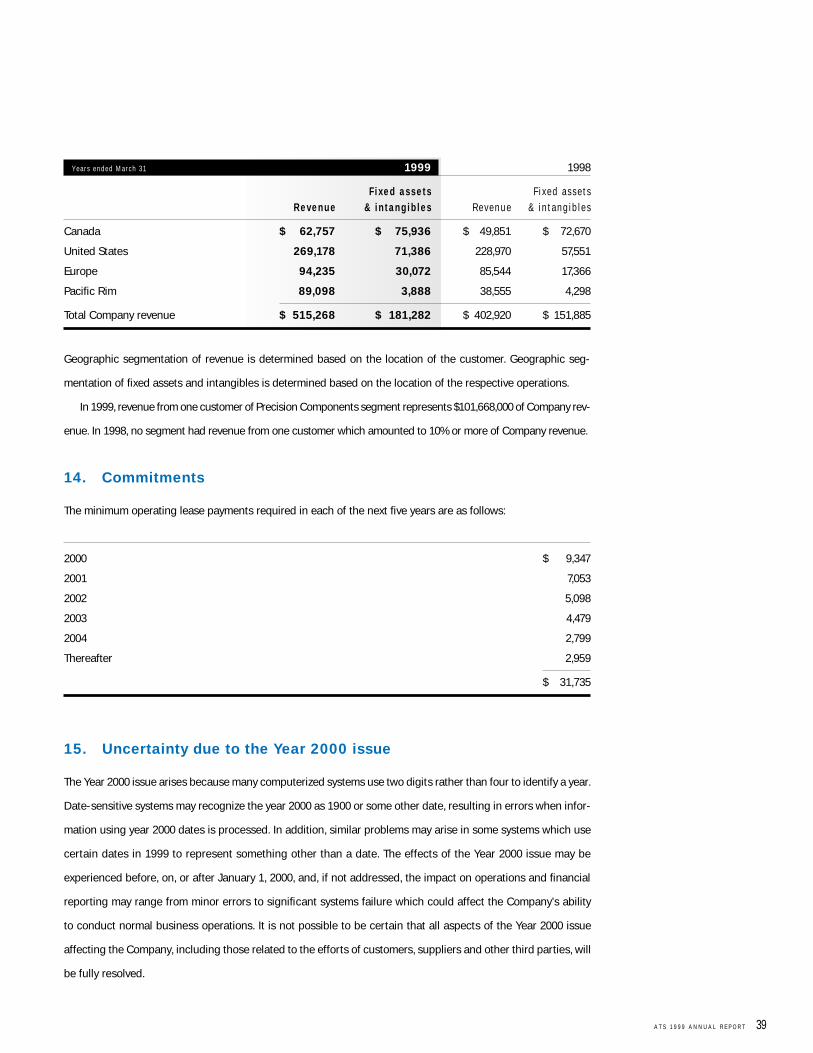
Y e a r s e n d e d M a r c h 3 1 1999 1998
F i xe d a s s e t s F i x e d a s s e t sR e ve n u e & i n t a n g i b l e s R e v e n u e & i n t a n g i b l e s
Canada $ 62,757 $ 75,936 $ 49,851 $ 72,670
United States 269,178 71,386 228,970 57,551
Europe 94,235 30,072 85,544 17,366
Pacific Rim 89,098 3,888 38,555 4,298
Total Company revenue $ 515,268 $ 181,282 $ 402,920 $ 151,885
Geographic segmentation of revenue is determined based on the location of the customer. Geographic seg-
mentation of fixed assets and intangibles is determined based on the location of the respective operations.
In 1999, revenue from one customer of Precision Components segment represents $101,668,000 of Company rev-
enue. In 1998, no segment had revenue from one customer which amounted to 10% or more of Company revenue.
14. Commitments
The minimum operating lease payments required in each of the next five years are as follows:
2000 $ 9,347
2001 7,053
2002 5,098
2003 4,479
2004 2,799
Thereafter 2,959
$ 31,735
15. Uncertainty due to the Year 2000 issue
The Year 2000 issue arises because many computerized systems use two digits rather than four to identify a year.
Date-sensitive systems may recognize the year 2000 as 1900 or some other date, resulting in errors when infor-
mation using year 2000 dates is processed. In addition, similar problems may arise in some systems which use
certain dates in 1999 to represent something other than a date. The effects of the Year 2000 issue may be
experienced before, on, or after January 1, 2000, and, if not addressed, the impact on operations and financial
reporting may range from minor errors to significant systems failure which could affect the Company’s ability
to conduct normal business operations. It is not possible to be certain that all aspects of the Year 2000 issue
affecting the Company, including those related to the efforts of customers, suppliers and other third parties, will
be fully resolved.
A T S 1 9 9 9 A N N U A L R E P O R T 39
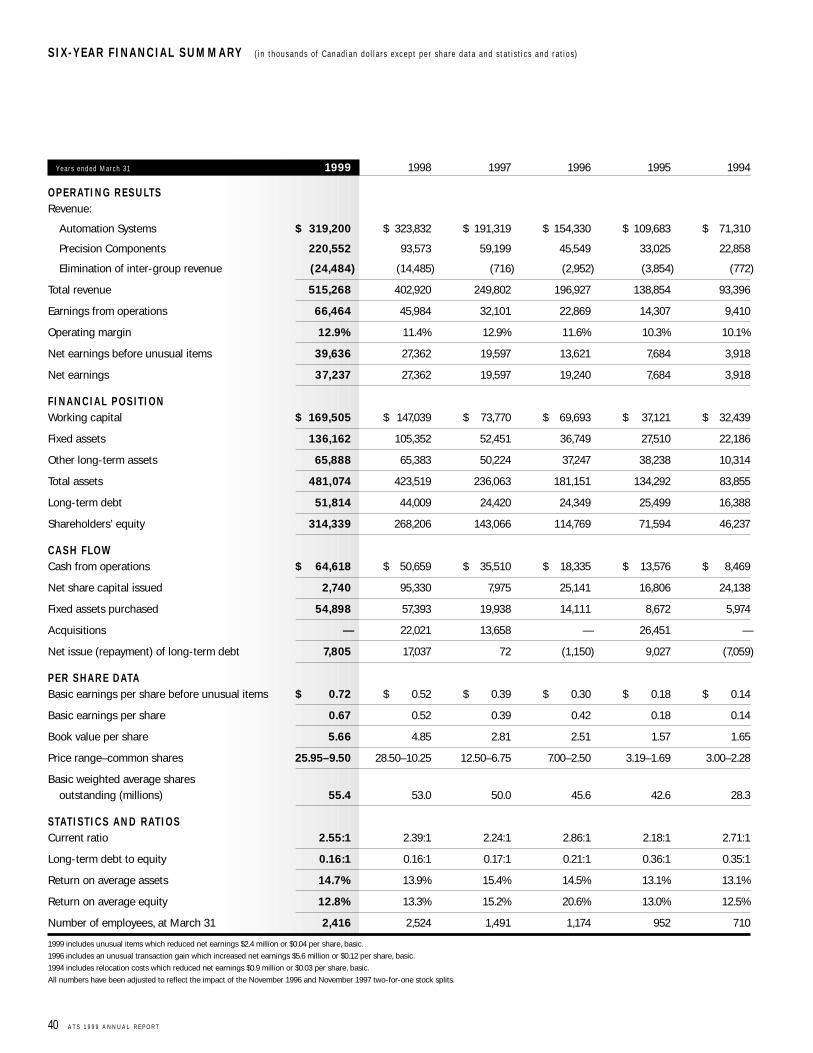
Y e a r s e n d e d M a r c h 3 1 1999 1998 1997 1996 1995 1994
O P E R AT I N G R E S U LTSRevenue:
Automation Systems $ 319,200 $ 323,832 $ 191,319 $ 154,330 $ 109,683 $ 71,310
Precision Components 220,552 93,573 59,199 45,549 33,025 22,858
Elimination of inter-group revenue (24,484) (14,485) (716) (2,952) (3,854) (772)
Total revenue 515,268 402,920 249,802 196,927 138,854 93,396
Earnings from operations 66,464 45,984 32,101 22,869 14,307 9,410
Operating margin 12.9% 11.4% 12.9% 11.6% 10.3% 10.1%
Net earnings before unusual items 39,636 27,362 19,597 13,621 7,684 3,918
Net earnings 37,237 27,362 19,597 19,240 7,684 3,918
F I N A N C I A L P O S I T I O NWorking capital $ 169,505 $ 147,039 $ 73,770 $ 69,693 $ 37,121 $ 32,439
Fixed assets 136,162 105,352 52,451 36,749 27,510 22,186
Other long-term assets 65,888 65,383 50,224 37,247 38,238 10,314
Total assets 481,074 423,519 236,063 181,151 134,292 83,855
Long-term debt 51,814 44,009 24,420 24,349 25,499 16,388
Shareholders’ equity 314,339 268,206 143,066 114,769 71,594 46,237
CA S H F LO WCash from operations $ 64,618 $ 50,659 $ 35,510 $ 18,335 $ 13,576 $ 8,469
Net share capital issued 2,740 95,330 7,975 25,141 16,806 24,138
Fixed assets purchased 54,898 57,393 19,938 14,111 8,672 5,974
Acquisitions — 22,021 13,658 — 26,451 —
Net issue (repayment) of long-term debt 7,805 17,037 72 (1,150) 9,027 (7,059)
P E R S H A R E DATA Basic earnings per share before unusual items $ 0.72 $ 0.52 $ 0.39 $ 0.30 $ 0.18 $ 0.14
Basic earnings per share 0.67 0.52 0.39 0.42 0.18 0.14
Book value per share 5.66 4.85 2.81 2.51 1.57 1.65
Price range–common shares 25.95–9.50 28.50–10.25 12.50–6.75 7.00–2.50 3.19–1.69 3.00–2.28
Basic weighted average shares outstanding (millions) 55.4 53.0 50.0 45.6 42.6 28.3
STAT I ST I C S A N D R AT I O SCurrent ratio 2.55:1 2.39:1 2.24:1 2.86:1 2.18:1 2.71:1
Long-term debt to equity 0.16:1 0.16:1 0.17:1 0.21:1 0.36:1 0.35:1
Return on average assets 14.7% 13.9% 15.4% 14.5% 13.1% 13.1%
Return on average equity 12.8% 13.3% 15.2% 20.6% 13.0% 12.5%
Number of employees, at March 31 2,416 2,524 1,491 1,174 952 710
1999 includes unusual items which reduced net earnings $2.4 million or $0.04 per share, basic.
1996 includes an unusual transaction gain which increased net earnings $5.6 million or $0.12 per share, basic.
1994 includes relocation costs which reduced net earnings $0.9 million or $0.03 per share, basic.
All numbers have been adjusted to reflect the impact of the November 1996 and November 1997 two-for-one stock splits.
40 A T S 1 9 9 9 A N N U A L R E P O R T
S I X-Y E A R F I N A N C I A L S U M M A RY ( i n t h o u s a n d s o f C a n a d i a n d o l l a r s e x c e p t p e r s h a r e d a t a a n d s t a t i s t i c s a n d r a t i o s )
R I C H A R D H . CA M P B E L L 1
President, Seacoast Consulting
R O B E R T A . F E R C H AT, F CA 1 , 2
Retired Chairman and Chief Executive Officer,
BCE Mobile Communications Inc.
R O N J . J U T R A S , CASecretary and Chief Financial Officer, ATS
R O B E R T W. L U BA , F CA 1 , 2 , 3
President, Luba Financial Inc.
L A W R E N C E G . TA P P 1 , 3
Dean, Richard Ivey School of Business,
University of Western Ontario
R O B E R T C . T I V Y 2 , 3
Corporate Director
K L A U S D . W O E R N E RPresident and Chief Executive Officer, ATS
L A W R E N C E G . TA P P 4
Non-Executive Chairman of the Board
K L A U S D . W O E R N E R 4
President and Chief Executive Officer
R O N J . J U T R A S 4
Secretary and Chief Financial Officer
B R U C E S E E L E Y 4
Vice-President, Precision Components Group
PA U L PAT T E R S O N 4
Director of Sales and Marketing
M I C H A E L CY B U LS K I 4
General Manager, Cambridge Systems Division
CA R L G A L LO WAY 4
Corporate Treasurer
V I N C E N T BA R B I SA NGeneral Manager,
ATS Michigan Sales & Service Inc.
G E R RY B O W E RGeneral Manager,
ATS Precision Components, Texas, Inc.
R I C H A R D CA R O N EVice-President, Accu-Fab Systems, Inc.
R O B E R T FA U L H A M M E RGeneral Manager, Winder Systems
J O S E P H F OXDirector of Strategic Marketing
M I L F R E D H A M M E R BA C H E RAssistant Director General,
Photowatt International S.A.
R O D H O L M Q U I STGeneral Manager,
Accu-Fab Systems California, Inc.
W I L L I A M J O H N S O NGeneral Manager, ATS Niagara Division
T H O M A S K O S I CGeneral Manager, Eco-Snow Systems, Inc.
J O H N L A W S O NPresident and General Manager,
ATS Informatic Systems Inc.
L I M C H I N H U IManaging Director,
AnA Mechatronics (S) Pte. Ltd.
S C OT T L I N D SAYManager, Advanced Engineering
K O N R A D M E I E RGeneral Manager,
ATS Winding & Assembly Technology
J O S E P H A . M O R E N OGeneral Manager,
ATS Ohio, Inc.
E D WA R D N I E W I N S K IGeneral Manager,
Centaur Thermal Systems Inc.
N E A L P I E R C E , J R .President, Accu-Fab Systems, Inc.
R O B E R T R A C H E T E RDirector, Machine Tool Division
B E R N D R H I E M E I E RATS Automation Tooling Systems GmbH
R U S S E L L S C H M I TDirector General, Photowatt International S.A.
S C OT T S C H U H L EGeneral Manager, ATS Southwest, Inc.
G R E G O RY S C H U LT ZDivision Manager, Machine Tool Division
J O H N S C OT TDirector, Quality Assurance
ST E WA R T W I E D E R S P R E C H E RGeneral Manager, ATS Carolina, Inc.
D R E W W I LS O NGeneral Manager, ATS Test Systems Inc.
M A R I LY N W O L F EManager, Human Resources
1 Member of the Audit and Finance Committee2 Member of the Human Resources Committee3 Member of the Corporate Governance and
Nominating Committee4 Corporate officer of the Company
B OA R D O F D I R E CTO R S O F F I C E R S A N D K E Y O P E R AT I N G M A N A G E M E N T
C O R P O R AT E H E A D Q UA R T E R S :ATS Automation Tooling Systems Inc.
250 Royal Oak Road
Box 32100 Preston Centre
Cambridge, Ontario
Canada N3H 5M2
Tel: (519) 653-6500
Fax: (519) 653-6533
Web site: www.atsautomation.com
STO C K E X C H A N G E L I ST I N GToronto Stock Exchange “ATA”
R E G I ST R A R A N D T R A N S F E R A G E N TMontreal Trust
151 Front Street West
8th Floor
Toronto, Ontario
M5J 2N1
Web site: www. faq.montrealtrust.com
Shareholder Services
Tel: (416) 981-9633
Fax: (416) 981-9507
Toll free: 1-800-663-9097
A U D I TO R SKPMG LLP
P R I N C I PA L BA N KThe Bank of Nova Scotia
A N N UA L S H A R E H O L D E R S ’ M E E T I N G Wednesday August 18, 1999
4:00 p.m.
Concordia Club
429 Ottawa Street South
Kitchener, Ontario
A D D I T I O N A L I N F O R M AT I O NContact Investor Relations at
ATS Corporate Headquarters.
Tel: (519) 653-6500
Fax: (519) 653-6533
E-mail: [email protected]
S H A R E H O L D E R S ’ I N F O R M AT I O N
PR
OD
UC
ED
BY
:FU
ND
AM
EN
TA
L C
OM
MU
NIC
AT
ION
S I
NC
.D
ES
IGN
:B
RY
AN
MIL
LS
GR
OU
PP
RIN
TE
D I
N C
AN
AD
A O
N R
EC
YC
LE
D P
AP
ER
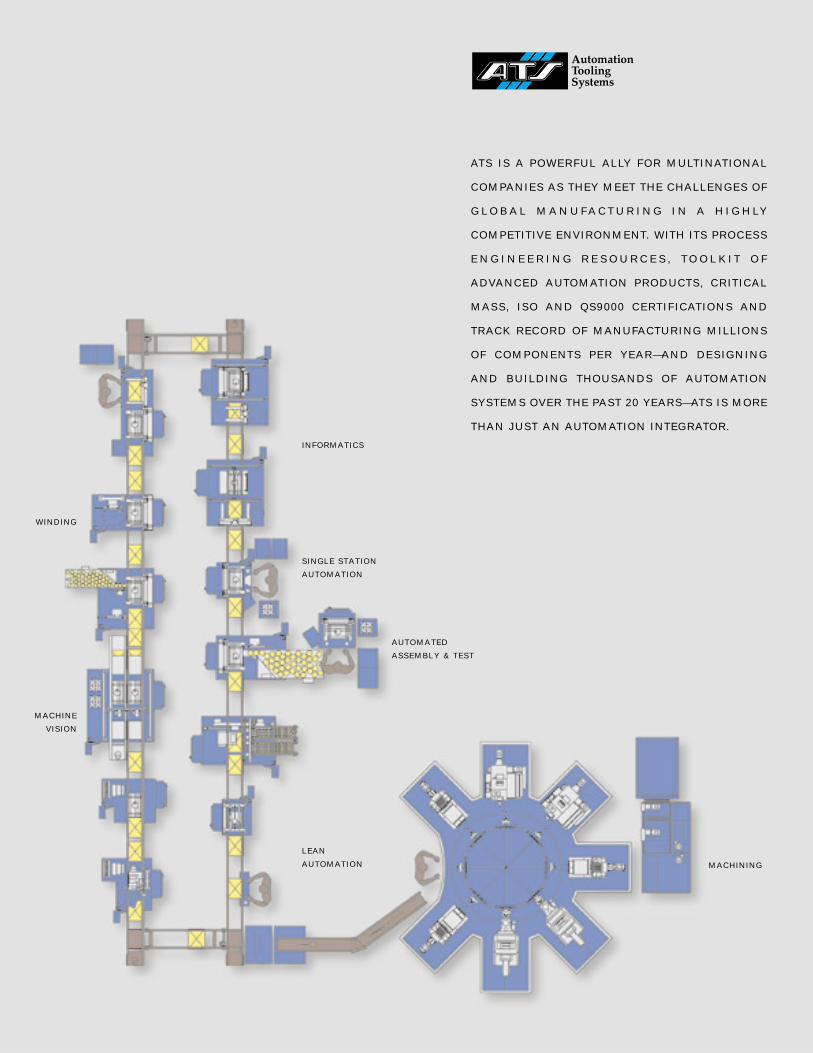
AT S I S A P O W E R F U L A L LY F O R M U LT I N AT I O N A L
C O M PA N I E S A S T H E Y M E E T T H E C H A L L E N G E S O F
G L O B A L M A N U F A C T U R I N G I N A H I G H L Y
C O M P E T I T I V E E N V I R O N M E N T. W I T H I T S P R O C E S S
E N G I N E E R I N G R E S O U R C E S , T O O L K I T O F
A D VA N C E D A U TO M AT I O N P R O D U CT S , C R I T I C A L
M A S S , I S O A N D Q S 9 0 0 0 C E R T I F I C AT I O N S A N D
T R A C K R E C O R D O F M A N U FA CT U R I N G M I L L I O N S
O F C O M P O N E N T S P E R Y E A R — A N D D E S I G N I N G
A N D B U I L D I N G T H O U S A N D S O F A U TO M AT I O N
S Y S T E M S O V E R T H E PA S T 2 0 Y E A R S — AT S I S M O R E
T H A N J U S T A N A U TO M AT I O N I N T E G R ATO R .
W I N D I N G
I N F O R M A T I C S
S I N G L E S T A T I O N
A U T O M A T I O N
A U T O M A T E D
A S S E M B L Y & T E S T
L E A N
A U T O M A T I O N M A C H I N I N G
M A C H I N E
V I S I O N