Embed Size (px)
Citation preview
ABAC ODI JOURNAL VISION.ACTION.OUTCOME. VOLUME 5(1) January- June 2018
158
http://www.assumptionjournal.au.edu/index.php/odijournal/index
A Model for CompetitiveService Level of LogisticsService Providers in
Thailand - Vietnam – China
Pisoot Thankdenchai
Doctoral Candidate, Logistics and Supply Chain Management
College of Logistics and Supply Chain, Sripatum University, Thailand
Tharinee Manisri, D.Eng. Assistant Professor, Logistics and Supply Chain Management
College of Logistics and Supply Chain , Sripatum University, Thailand
Subin Yurarach, Ph.D. Associate Professor,
Graduate College of Management, Sripatum University, Thailand
Abstract
The objectives of this research were to develop a causal relationship model for competitive
service level of logistics service providers in international transportationand investigate the
direct and indirect effects in international transport logistics of Thai, Vietnamese and Chinese
service providers. Samplings were 509 logistics service providers from Thailand, Vietnam, and
China, using purposive sample selection method. Questionnaires were analyzed by descriptive
statistics and Structural Equation Modeling (SEM), using Lisrel version 8.80. Findings were
the causal relationship model was fit to empirical data with the Chi-square (X2) = 72.75, df=
62, p = 0.165, GFI = 0.98 AGFI = 0.97, RMSEA = 0.018. The direct effects showed the
competitive Service Level (SVL) was affected byDominant Power on selection(DOM) with
coefficient value at 0.37, and also from Service Performance Unit (SPU) as 0.36. The
competitive Service Level (SVL) was affected indirectly by Dominant Power
onselection(DOM) at 0.11, followed by Strategic Sourcing Technique (SST) at
0.09respectively. Moreover, the variables valued the reliability in between 0.54 - 0.94. The
highest reliability wasfactors: Cost and Flexibility (Z1, Z3) which were equally at 0.94. For the
lowest reliability value was: Risk avoidance (Y4) valued at 0.54. For implementation and
recommendation in future researchto modify the degree of observed variables in Service
Performance Units (SPU) which may significant differently in a different policy and local
cultures in different countries.
Keywords: competitiveness, service level, logistics service provider
Introduction
Global economic pressure with a high competition required business firms to search
for more competitive advantages. Most edges of competitiveness in research were several
studies about developing strategic theories and practices. Organizational development relates
to firm’s process re-design to gain for more firm’s competitiveness. The process-bases (input-

ABAC ODI JOURNAL VISION.ACTION.OUTCOME. VOLUME 5(1) January- June 2018
159
process-output) were considered to examine the factorsthat affected competitiveness of the
service in internationaltransport business. The conceptual source was a technique that
identified the use of insource or outsource decision which support the organization’s
competitiveness and leads to a competitive firm, benchmarking with neighbor countries and
best practice. The decision made during supplier selection was also important at the middle-
stream if the decision was made due to price, people or policy focus. However, the latent of
service quality was also measured on its effect on customer’s satisfaction. The final outcome
at the downstream was the service level. This paper aims to investigate the influencing
variables by Strategic Sourcing Technique (SST), Dominant power in selection (DOM),
Service Performance Units (SPU) and the Competitive Service Level (SVL).
This research investigates the serviceability in developing the competitive service
level model in logistics transport business. This study enriches organizational re-design and
development for success and best practice towards logistics business competitiveness. The
ability in competitive advantages gained was the most essential key and highlight to conduct
a survey for the study.
The researcher investigated the competitiveness of logistics service providers in three
countries: Thailand, Vietnam, and China and examined the invariance of the model and its
generality.
Research Questions
1. What are keys driven for the international transport logistics service provider’s
competitiveness?
2. Which variables are the significant factors (direct and indirect effects) factors
influencing the service level competitiveness?
3. Is the model generally enough to be applicable for service providers in other
countries? (Case study: logistics service providers in Thailand, Vietnam, and
China).
Research Objectives
1. to find the most significant factors producing the highest impact on the level of
competitiveness in the international logistics transport business;
2. to investigate the direct effects and indirect effects of competitiveness variables of
logistics service providers in Thailand, Vietnam, and China;
3. to develop a causal model and investigate the model is invariance (case study:
Thailand, Vietnam, and China)
ABAC ODI JOURNAL VISION.ACTION.OUTCOME. VOLUME 5(1) January- June 2018
160
Research Scopes and Limitations
The researcher selected three countries in AEC such as Thailand, Vietnam, and China.
As a geographical constraint, the study ignored Singapore and Malaysia with a reason that
both of them are transshipment hubs and operated as carriers’ connection. The differences
between infrastructure bases, mega investments, and functional processes as a cross-docking
distinguish the general pier activities.
Lao PDR is a landlocked country. Cambodia is still in developing logistics
infrastructure on roads and highways. Therefore, the study will not include all the said
countries which a constraint in comparison without bias on measuring performance. Thailand
as a member of ASEAN (Association of Southeast Asian Nations) operates three main marine
ports which areBangkok port, Leam Chabang and ICD Lad-krabang as an inland port. Among
AEC members (THAI-AEC, 2015) Vietnam is also a member country which has three major
ports such as Hochiminh, Haiphong and Hanoi and they are closed to Thailand (where Lad-
krabang and Hanoi were inland ports for maritime service). Therefore, Vietnam could be the
best country in marine service to compare with Thailand. However, China is the biggest
player with the greatest volume of export/import activities and numbers of service providers
will be the best sample in benchmarking.
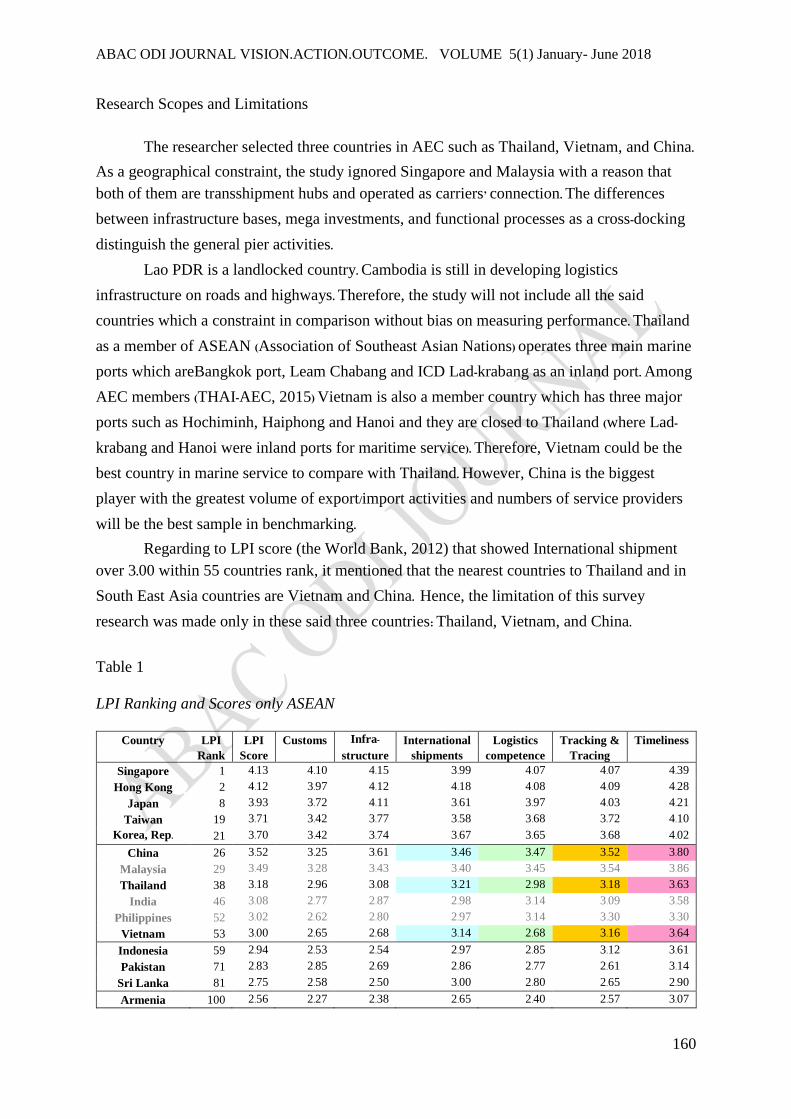
Regarding to LPI score (the World Bank, 2012) that showed International shipment
over 3.00 within 55 countries rank, it mentioned that the nearest countries to Thailand and in
South East Asia countries are Vietnam and China. Hence, the limitation of this survey
research was made only in these said three countries: Thailand, Vietnam, and China.
Table 1
LPI Ranking and Scores only ASEAN
Country LPI LPI Customs Infra- International Logistics Tracking & Timeliness
Rank Score structure shipments competence Tracing
Singapore 1 4.13 4.10 4.15 3.99 4.07 4.07 4.39
Hong Kong 2 4.12 3.97 4.12 4.18 4.08 4.09 4.28
Japan 8 3.93 3.72 4.11 3.61 3.97 4.03 4.21
Taiwan 19 3.71 3.42 3.77 3.58 3.68 3.72 4.10
Korea, Rep. 21 3.70 3.42 3.74 3.67 3.65 3.68 4.02
China 26 3.52 3.25 3.61 3.46 3.47 3.52 3.80
Malaysia 29 3.49 3.28 3.43 3.40 3.45 3.54 3.86
Thailand 38 3.18 2.96 3.08 3.21 2.98 3.18 3.63
India 46 3.08 2.77 2.87 2.98 3.14 3.09 3.58
Philippines 52 3.02 2.62 2.80 2.97 3.14 3.30 3.30
Vietnam 53 3.00 2.65 2.68 3.14 2.68 3.16 3.64
Indonesia 59 2.94 2.53 2.54 2.97 2.85 3.12 3.61
Pakistan 71 2.83 2.85 2.69 2.86 2.77 2.61 3.14
Sri Lanka 81 2.75 2.58 2.50 3.00 2.80 2.65 2.90
Armenia 100 2.56 2.27 2.38 2.65 2.40 2.57 3.07

ABAC ODI JOURNAL VISION.ACTION.OUTCOME. VOLUME 5(1) January- June 2018
161
Cambodia 101 2.56 2.30 2.20 2.61 2.50 2.77 2.95
Lao PDR 109 2.50 2.38 2.40 2.40 2.49 2.49 2.82
Myanmar 129 2.37 2.24 2.10 2.47 2.42 2.34 2.59
Nepal 151 2.04 2.20 1.87 1.86 2.12 1.95 2.21
Burundi 155 1.61 1.67 1.68 1.57 1.43 1.67 1.67
Definition of Terms
3 PL Third Party Logistics (LSP: Logistics Service Provider, Freight Brokers)
4 PL Fourth Party Logistics (integrated more in I.T. system or network
application control with customers than 3PL at shipper's premises site)
Co-load Outsourcing for cost and service giving by other operators to operate
Consolidation Full containers gather all LCL (partial) shipments as own make.
Dominant Power Dependence and Relationship commitment, included the Organization
Theme (Managerial), Corporate Theme (Middle); Function Operation
Theme (Staff)
Dominant 3P Collaboration of firm (Policy); Operational performance (Price); Relation
with trading partner (People)
Flexibility Service level by flexible time and lot Size
Freight Supplier The logistics provider who sells the freight rates cost (the first tier supplier
acts as master consolidator or second and third tier as co-loaders)
LCL Less than a Container Loaded, charge per unit of measurement or tonnage
MoB Make or Buy decisions (Make means by arrange own consolidation service;
Buy meansoutsource to co-loader).
Service Level Cost, mean delivery time and delivery time valiance (Cooper, 2007).
Service Perform assessment of business benefit delivered.
Sourcing Technique A purchasing method in single & multiple sources.
SPU model Service 5Rs dimensions on performance: Reliability, Rates, Resources,
Risk avoidance, Responsiveness.
TCO Total Cost of Ownership: purchasing cost to salvage value.
T/T Transit Time or Lead-time.
Research Framework
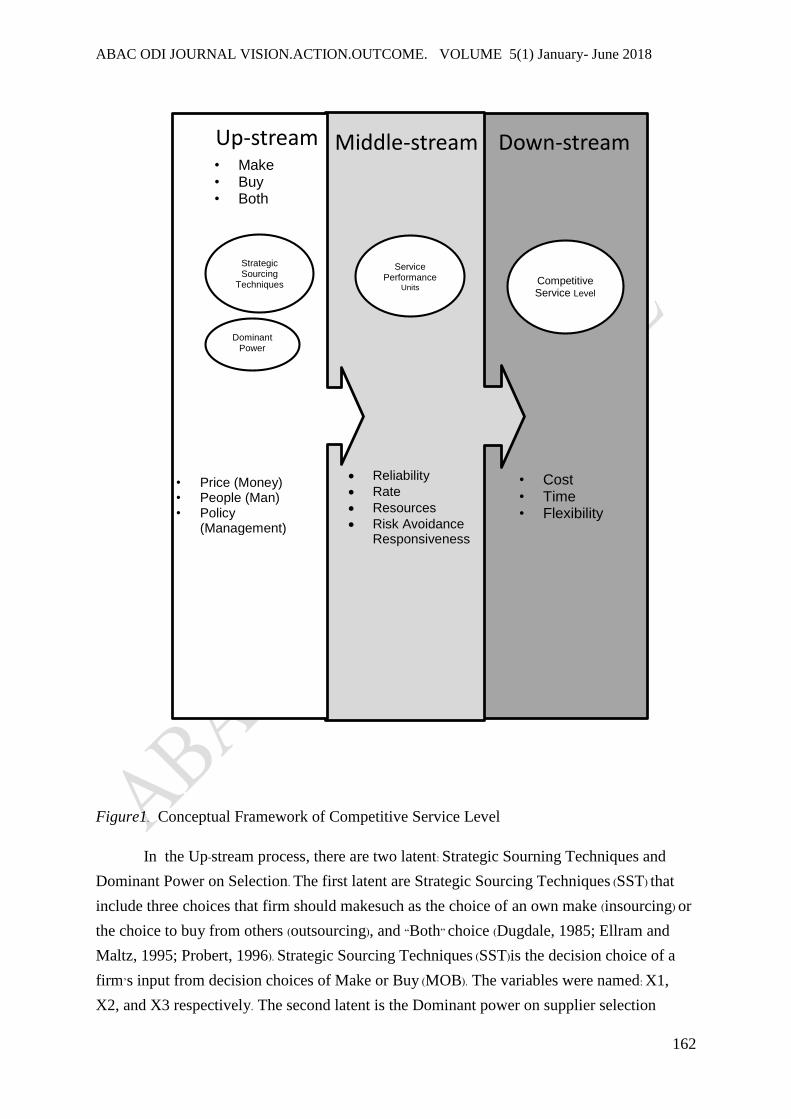
Figure 1 shows three processes; up-stream, middle-steam and down-stream and it has
latent variables such as Sourcing, Selection and Service Performance which affected to the
Service Level Competiveness.
ABAC ODI JOURNAL VISION.ACTION.OUTCOME. VOLUME 5(1) January- June 2018
162
Figure1. Conceptual Framework of Competitive Service Level
In the Up-stream process, there are two latent: Strategic Sourning Techniques and
Dominant Power on Selection. The first latent are Strategic Sourcing Techniques (SST) that
include three choices that firm should makesuch as the choice of an own make (insourcing) or
the choice to buy from others (outsourcing), and “Both” choice (Dugdale, 1985; Ellram and
Maltz, 1995; Probert, 1996). Strategic Sourcing Techniques (SST)is the decision choice of a
firm’s input from decision choices of Make or Buy (MOB). The variables were named: X1,
X2, and X3 respectively. The second latent is the Dominant power on supplier selection
Up-stream Middle-stream Down-stream
Strategic Sourcing
Techniques
Dominant Power
on
Service Performance
Units Competitive Service Level
• Make
• Buy
• Both
• Price (Money) • People (Man) • Policy
(Management)
Reliability
Rate
Resources
Risk Avoidance Responsiveness
• Cost • Time
• Flexibility

ABAC ODI JOURNAL VISION.ACTION.OUTCOME. VOLUME 5(1) January- June 2018
163
(DOM). In Dominant power on selection (DOM), firms make the selection of their
suppliers/partners based on price, people or policy. The variables were shown as X4, X5, and
X6 respectively.
The middle-stream process is an “operation process” during the operating services. It
has Service Performance Units (SPU) latent. SPU contains five aspects (5Rs): Reliability,
Rates, Resources, Risk avoidance, and Responsiveness. The variables were shown as Y1, Y2,
Y3, Y4 and Y5.
The down-stream process includes the dependent latent as Competitive Service Level
(SVL)that constructs three observed variables: Cost; Time; Flexibility (Ramsay and Wilson,
1990; Southwood, 1995; Spina, Campanella & Codeluppi, 2000; Vanichchinchai, 2012;
Yuttapong and Sataporn,2010). The dependent variables were showed as Z1, Z2, and Z3
respectively. Table 2 showed the latent and type of variables and meanings.
Table 2.
Latent and Variables’ names and meanings
Symbol Variables Name Type of Variable
SST Strategic Sourcing Technique Latent 1 (L1) X1 Make Observed Variable
X2 Buy Observed Variable
X3 Both Observed Variable
DOM Dominant Power on Selection Latent 2 (L2) X4 Focus on Price Observed Variable
X5 Focus on People Observed Variable
X6 Focus on Policy Observed Variable
SPU Service Performance Units Latent 3 (L3) Y1 Reliability Observed Variable
Y2 Rates Observed Variable
Y3 Resources Observed Variable
Y4 Risk Avoidance Observed Variable
Y5 Responsiveness Observed Variable
SVL Competitive Service Level Latent 4 (L4) Z1 Cost Observed Variable
Z2 Time Observed Variable
Z3 Flexibility Observed Variable
The is a total of four latent with 14 observed variables in this study. The research hypotheses
are as follows:
ABAC ODI JOURNAL VISION.ACTION.OUTCOME. VOLUME 5(1) January- June 2018
164
Hypothesis 1: Strategic Sourcing Technique has a direct relationship to Service
Performance Units.
Hypothesis 2: Strategic Sourcing Technique has a direct relationship to Competitive
Service Level.
Hypothesis 3: Strategic Sourcing Technique has an indirect relationship to
Competitive Service Level via Service Performance Units.
Hypothesis 4: Dominant Power on selection has a direct relationship to Service
Performance Units.
Hypothesis 5: Dominant Power on selection has a direct relationship to Competitive
Service Level.
Hypothesis 6: Dominant Power on selection has an indirect relationship to
Competitive Service Level via Service Performance Units.
Hypothesis 7: Service Performance Units has a direct relationship to Competitive
Service Level.
Review of Literature
Strategic Purchasing and Competitiveness
Dale and Cunningham (1983) stated that purchasing often has the most contact with
suppliers and can contribute with input on their quality, lead times and costs.
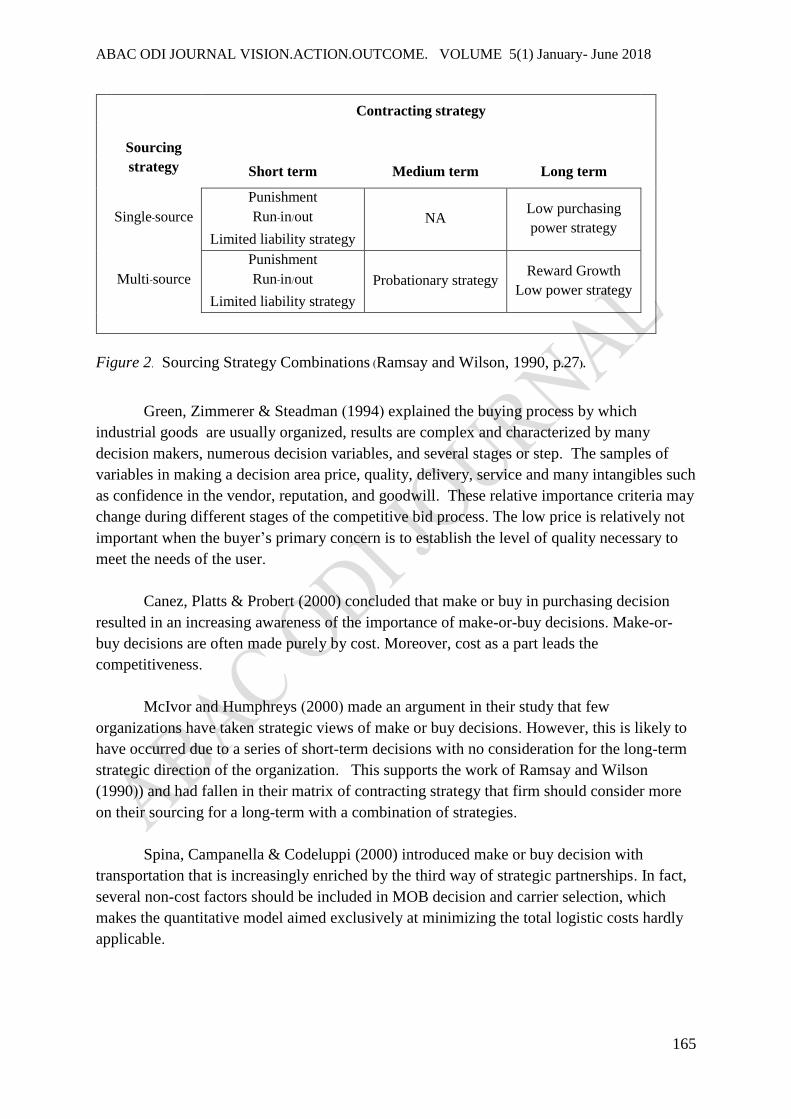
Ramsay and Wilson (1990) suggested that a buyer who has only one source of supply
for material or service had risky accusations of either incompetence or corruption. Today in
many market sectors, buyers who retain multi-sourcing practices are regarded as curiosities. In
the conclusions, they suggest that contrary to current practice where the combination of
single sourcing with long-term contracts is rapidly becoming the norm, companies with large
purchasing budgets would get benefit from concentrating their efforts on other strategy
combinations. With their further suggestion, a single sourcing with long-term contracts is best
regarded as a specific option for the small, weak purchasing department. Finally, their
design illustrated the six possible combinations of sourcing and contracting strategies on a
matrix as shown in Figure 2.
ABAC ODI JOURNAL VISION.ACTION.OUTCOME. VOLUME 5(1) January- June 2018
165
Contracting strategy
Sourcing
strategy
Short term Medium term Long term
Single-source
Punishment
Run-in/out
Limited liability strategy
NA Low purchasing
power strategy
Multi-source
Punishment
Run-in/out
Limited liability strategy
Probationary strategy Reward Growth
Low power strategy
Figure 2. Sourcing Strategy Combinations (Ramsay and Wilson, 1990, p.27).
Green, Zimmerer & Steadman (1994) explained the buying process by which
industrial goods are usually organized, results are complex and characterized by many
decision makers, numerous decision variables, and several stages or step. The samples of
variables in making a decision area price, quality, delivery, service and many intangibles such
as confidence in the vendor, reputation, and goodwill. These relative importance criteria may
change during different stages of the competitive bid process. The low price is relatively not
important when the buyer’s primary concern is to establish the level of quality necessary to
meet the needs of the user.
Canez, Platts & Probert (2000) concluded that make or buy in purchasing decision
resulted in an increasing awareness of the importance of make-or-buy decisions. Make-or-
buy decisions are often made purely by cost. Moreover, cost as a part leads the
competitiveness.
McIvor and Humphreys (2000) made an argument in their study that few
organizations have taken strategic views of make or buy decisions. However, this is likely to
have occurred due to a series of short-term decisions with no consideration for the long-term
strategic direction of the organization. This supports the work of Ramsay and Wilson
(1990)) and had fallen in their matrix of contracting strategy that firm should consider more
on their sourcing for a long-term with a combination of strategies.
Spina, Campanella & Codeluppi (2000) introduced make or buy decision with
transportation that is increasingly enriched by the third way of strategic partnerships. In fact,
several non-cost factors should be included in MOB decision and carrier selection, which
makes the quantitative model aimed exclusively at minimizing the total logistic costs hardly
applicable.
ABAC ODI JOURNAL VISION.ACTION.OUTCOME. VOLUME 5(1) January- June 2018
166
Baily et al. (2005)suggested that the competitive advantages available from
purchasing strategies was buyer focus on amix of resources; emphasize creative management
in resource utilization vis-à-vis competition.
De Boer, Gaytan & Arroyo (2006)) suspected and argued that many managers find
difficulty to transfer general frameworks for outsourcing into practical decision-making
action. For exampletaking the outsourcing of logistics activities, the purchasing of
comprehensive logistics services was increasingly becoming more complex.
Lysons and Farrington (2006)) stated that competitive advantage sought via lower
cost or inventories. They recommended one of the most popular portfolio approaches should
be the Boston Consulting Group (BCG) matrix. The strategies are to adopt all three strategic
organizational levels: corporate, business and functional/operational.
Handfield, Monczka, Giunipero & Patterson (2009) reviewed that the communication
linkage of many firms are now through co-locating supply management personnel directly at
operating locations.
Dale and Cunningham (1983) confirmed empirical findings state that companies
sometimes use quality as criteria for supplier selection.
Suggestions from Lambert et al. (as cited in Sankaran et al., 2002) prescribed a model
for partnership development. They synthesized out most three major elements: drivers,
facilitators, and management components. Hence, the supplier relationships after supplier
selection should able to guide the purchasing process and this followed the work of Sink &
Langley (as cited in Sankaran et al., 2002).
Holter et al. (2008) agreed with Grant (2005) that relationships between SME buyers
and LSP are building trust and commitment. It is possible that most SMEs are order takers
(who purchase with risk attachment) due to their limited purchasing power.
Zammori, Braglia & Frosolini (2009) identified that the main issues must be covered in the
agreement to fit the needs of both parties and to assure benefits on both sides. Partners must
focus on their core competencies and keep together the expertise of external partners.
Wilding and Juriado (2004) confirmed their survey results that most consumer goods
companies that admitted soft issues in performance measurement about cultural incompatibility
and poor communication lead to the failure of the 3PL partnership.
Thankdenchai and Pasawat (2015) mentioned in their work about the Nestlé’s impacts
and difficulties on the best practice. The possibilities on challenging the hardness in a
relationship with partners could be happened by the low price and standalone decision
without prior informed and sharing these were: - If a customer's behavior as shopping around

ABAC ODI JOURNAL VISION.ACTION.OUTCOME. VOLUME 5(1) January- June 2018
167
for the lowest price. Their supplier's selection, perception and strategy are only based on the
best lowest price to place the order. Nevertheless, the customers launch their in-house
promotion without prior notices. These two classic cases should be aware that it affects to
break the internal chain relationship among members’ partnership. The measurement of
“Trust” reflected the relationship among vendors. The review of related study synthesizes to
3P which relationship always affects in purchasing and selected supplier decision and most
favorites in the focus were affected by Price, People, or Policy. On the other hand, they can
be treated as 3M which are: Money, Man, or Management and these three focus factors were
mainly dominant power to encourage the relationship building and supplier selection.
Theoretical Research Concepts & Design
“Serviceability” the non-financial items: known as “Subjective” strategies were
divided into four domains of the study. Under systematic thinking, this research emphasized
more at the beginning of the input process (Figure 3).
The first domain is the upstream on the sourcing techniques (source of material & its
suppliers, the design was aimed to explore the service providers in purchasing behaviors with
procurement as fundamental. The sources of purchasing were divided into three sources of
Make or Buy: MBO strategies: Make (in-sourcing), Buy (outsourcing) , and both Multi-
methods (M&B).
The second domain highlighted the investigation of relationships during purchasing
decisions with dominant decisions. The company’s sources of suppliers were not included
since the beginning of servicing (Upstream supply chain).
The domain focused on types of the dominant power in relationships building with
selected sources (supplier relationship motivation at the final decision). A question on the
decision making before the purchase was the establishment of a relationship types and
sources of influence. The key factor in a relationship with partners whether had influenced by
a personal decision maker or organizational policy. This domain investigated on the most
powerful dominant factor in types and sources of relationships affected to the maker of
selected supplier decision.
The study of three stratified nations (Thailand, Vietnam, and China) on service
operators could benefit to understand their local practice and strategic trends. The
interpersonal skills in further relationship development may affect to gain lower cost. For an
instance, organizational relationship compared with friendship (a better personal
relationship). The Chinese supplier may give lowest price offer. As predicted (before going
to a proven test), the outcome result may be true, if such a buyer focus on price and on
building a personal relationship rather than organizational relations.

ABAC ODI JOURNAL VISION.ACTION.OUTCOME. VOLUME 5(1) January- June 2018
168
The third construct is the middle stream. The study framework designed and
discussed based on same direction congruent with the first and second domains as mediator
latents. The five dimensions of service performance, a five scale aspects (likely as Total
Quality Assurance: TQF) of service quality were examined.
The model was adopted from previous articles as Service Performance Units: SPU
(Thankdenchai, 2013) . The concept of PZB model from Parasuraman, or the five dimensions
of ServQual model was named "RATER" (Reliability, Assurance, Tangibility, Empathy, and
Responsiveness). The new modified model into the 5Rs with elimination off the driver
"Empathy", and employed "Rate" for monetary perspective into the model studied
replacement. Since several arguments were discussed on the definition and meaning of
Empathy, most were shown for the understanding of the customers' needs and regarded as
sympathetic understanding. Therefore, if s/he is a new client as a newcomer, e.g. a first time
purchasing or a tourist as a new walk-in customer, it was not able to learn what his /her
standard of requirements. The company could learn such needs from the past experiences
only with their existing customers.
The cost perception in a way of a price focus (which cost perceives had withdrawn
from the previous version of ServQual was brought back as “Rate” in quality price
perception of being cheap, reasonable or expensive.
“Assurance” was a constructed in the PZB model as warranty. According to the risk
management theory, most transporters have their transport insurance coverage. ExporterS
and importers purchase the cargo insurance. The responsibility for delivering goods depends
on the trading term agreement (Incoterms). The protection of goods during delivery with
insurance as risk management covered / while assurance was meant “Risk Avoidance”. This
included the warranty or certificate to ensure the qualities of products or services.
Tangibility is defined as the “Resources” ‘ which included all means of assets such
as own operating system, properties, staff, fleets, warehouse, tools and equipment, as well as
the operating system and I.T. network that related directly to the operating firm for service
performing.
The fourth domain construct is service level perceptions from many studies (Cooper,
Lambert and Pagh ,1997) ; Lambert and Pohlen (2001). They indicated that the service
performance in logistics and transport often includes the cost and time variance with rapidity
speeds or reliability in transport to build up firm’s performance and competitiveness. The
service level yielded into three dimensions as performance. This study applied cost, time and
flexibility in measured matrix.
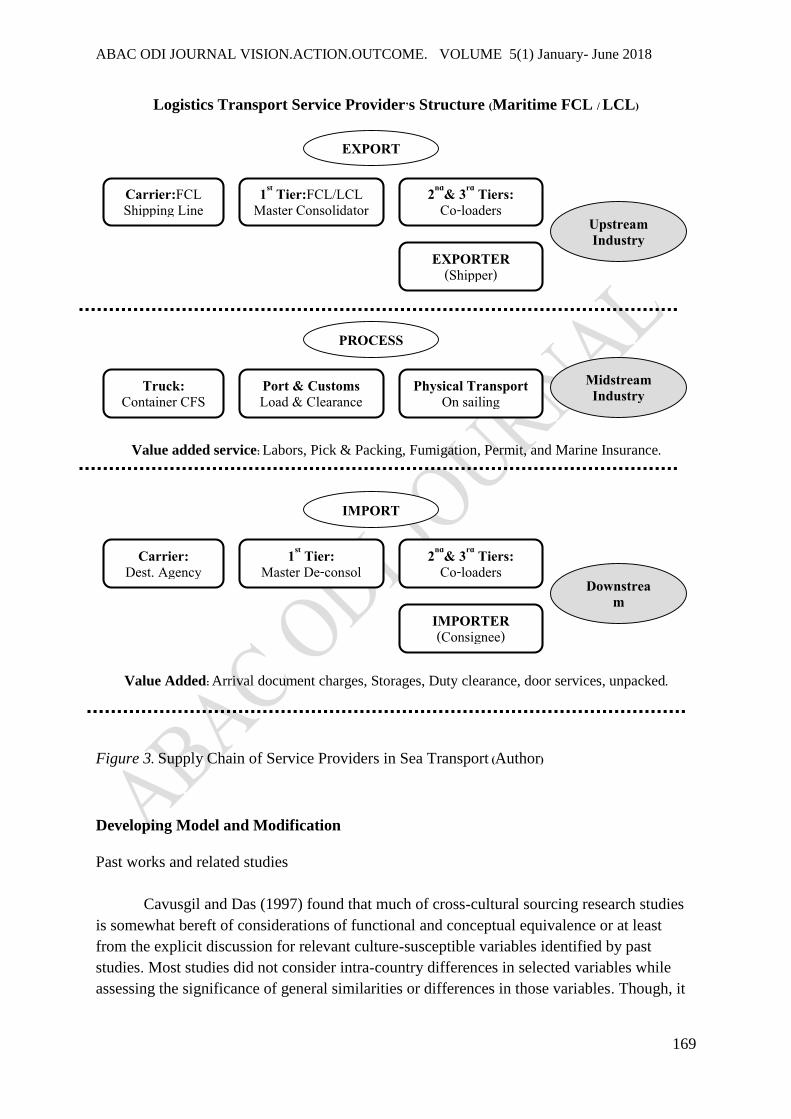
Figure 3 shows the activities with value added of service and tier in supply chain of
logistics transport service (Sea mode).
ABAC ODI JOURNAL VISION.ACTION.OUTCOME. VOLUME 5(1) January- June 2018
169
Logistics Transport Service Provider’s Structure (Maritime FCL / LCL)
Value added service: Labors, Pick & Packing, Fumigation, Permit, and Marine Insurance.
Value Added: Arrival document charges, Storages, Duty clearance, door services, unpacked.
Figure 3. Supply Chain of Service Providers in Sea Transport (Author)
Developing Model and Modification
Past works and related studies
Cavusgil and Das (1997) found that much of cross-cultural sourcing research studies
is somewhat bereft of considerations of functional and conceptual equivalence or at least
from the explicit discussion for relevant culture-susceptible variables identified by past
studies. Most studies did not consider intra-country differences in selected variables while
assessing the significance of general similarities or differences in those variables. Though, it
EXPORT
Carrier:FCL Shipping Line
1st Tier:FCL/LCL Master Consolidator
2nd& 3rd Tiers: Co-loaders
EXPORTER (Shipper)
PROCESS
Truck: Container CFS
Port & Customs Load & Clearance
Physical Transport On sailing
IMPORT
Carrier: Dest. Agency
1st Tier: Master De-consol
2nd& 3rd Tiers: Co-loaders
IMPORTER (Consignee)
Downstream
Industry
Midstream Industry
Upstream Industry

ABAC ODI JOURNAL VISION.ACTION.OUTCOME. VOLUME 5(1) January- June 2018
170
needed some measure of congruence on the relevance of the theory for that particular cultural
context before making a conclusion.
Giunipero and Monczka (1997) claimed that the different parts of the world from
which to source; commodity availability in various regions of the world; and the need to
understand currency fluctuations. Such approaches address operational issues associated with
global sourcing. This operational orientation does not meet the requirements of upper-level
executives whose questions concern how they should manage their international purchasing
efforts at their best.
Porter (as cited in Giunipero & Monczka, 1997) argued that while cost leadership and
differentiation are opposite ends of a continuum and a differentiator cannot ignore its cost
position and a cost leader cannot ignore differentiation.
Holter et al. (2008) recommended the need for measuring transport performance to
relate to a carriage service specification. The literature discussion had structured around four
themes: general transport purchasing; the SME aspect of transport purchasing differences
between purchasing the conventional transport services and 3PL services; and the application
of general purchasing tools for the carriage procurement.
However, they suggested that experienced internal barriers need to address the
external obstacles, otherwise these proved more difficult and less successful.
Lyons (2015) suggested that a well-known CSE (Core self-evaluation) in HR research
needs analysis assessment.
The study on non-financial items as ServQual based on maritime study claimed that
the PZB model needs to be modified. Vinh (2007) suggested to bring Service Quality into
sea transport to better understand service providers.
Scores, Scaling and Weighing
The past study reviewed the scales ratio for weighing differentiates for the level of
competitiveness and those who merely meet the break-even point. Yount (2006) showed 12
scales in his research design and simple statistical analysis. The five points Likert Scale, The
Thurstone’ s 11scales, The Q- Sort Scale, and The Semantic Differential were mainly used for
scoring recommendation to suit different purposes. Four consultants served as panel of
advisors, where two academics were familiar with the international forwarding industry and
lecturers in logistics and supply chain management, one academic statistician specialized in
education quality assurance and assessment research and one practitioner. Finally, all given
comments were concluded that developing method must be scaled equivalently for more than
ten levels to divide the capabilities into at least 3-4 categories.
Developing tools for scores rates followed the Likert’ s scale which consists of
statements that are all of equal weight (Yount, 2006). Table 3 illustratesThurstone’s 11 scales.

ABAC ODI JOURNAL VISION.ACTION.OUTCOME. VOLUME 5(1) January- June 2018
171
Table 3.
Scale Ranking: Sample of the Thurstone Scale
Indicators 11
scales Cum.
Mean/Cum
Meaning
Bad 1 0 0 Bankrupt
2 3 1.5 Worst
3 5 2.5 Crisis & Heavy loss
4 7 3.5 Continued loss
5 9 4.5 Loss & B/E Challenge
(Moderate) 6 11 5.5 Equally B/E & Loss Challenge
7 13 6.5 Profit - Competitive (today) (Good) 8 15 7.5 Profitability - Competitiveness (these days) 9 17 8.5 Profitability Advantage - Competitive Advantage (by week) (Excellent) 10 19 9.5 Profitability enables longer Compete - Being Sustainable (by month) Best Practice
11 21 10.5 Wealth Stage -long-term Compet = Sustainable Competitive Advantage (by year)
Source: Thankdenchai (2015)
The Thurstone attitude scales have a range of weighing from the highest to the lowest
(from 11 to 1 usually). The scores result from computing the average of the weights on
selected items. Thus, this study adopted the Thurstone 11 scales for scoring. Therefore,
previous calculation and pilot-tested were done with the results showed in work of
Thankdenchai (2015).
The scores of each scale have transformative value for every stage. Such a
value was interpreted from quantitative input data as a measurable objective into a qualitative
explanation subjectively. The moderate level represented a setting break-even point (x-bar)
by means of the group studied. When one’s revenue is lower than the break-even, such
company is challenged into facing loss stage. It was not essential to think further for its
competitiveness than how to secure back the business’s income. Recovery from a loss to
sufficient profit level might be considered. Alternatives to gain back the equivalent cost for
break even, higher income would be further related to any other activities besides its sales,
marketing, and promotions. For the recapitalization, re-injection from their stakeholders is
not included in this study.
Model Modification
SERVQUAL Model (PZB) Discussion
The delineation of SERVQUAL theories before modification as a useful model was
summarized and discussed. This section highlighted in delimitation; delineation and
elimination of drivers whether should or should not be applied the driver “Empathy”. These
were the emancipation and embankment on the model constructions.
Matear and Gray (1993) mentioned that the important criteria used for selected
suppliers in sea freight must include service efficiency, readiness in quality assurance and
risk recognition. These perceive the attributes emphasized on Assurance and Risk avoidance.
ABAC ODI JOURNAL VISION.ACTION.OUTCOME. VOLUME 5(1) January- June 2018
172
Min (1994); Whyte (1993) proposed the following variables: transportation time, risk
recovery, the flexibility of service charges, the understanding of the problems and the
willingness to help as main criteria for supplier selection. In their conclusion, risk perceives
replacement along with the empathy of service quality.
However, previous discussion was about Empathy in ServQual that will be suited
only with the old customer who existed and engaged in the service. However,it might not be
suitable with the newcomer because the newcomer is at the position of a potential stage of
being a client. Therefore, the empathy would not exist in any casesas the main reason to
desist the variable of Empathy out of the framework and re-functioned for a lower degree
dropped into Responsiveness as an item into “willingness to help” which had been proposed
by Whyte (1993).
This is congruent to the work of Imrie et al. (2000; 2002). The survey challenged the
validity of SERVQUAL, which had not employed “Empathy” into their studied dimensions,
but elaborately replaced by “politeness and courtesy; sincerity” as performance to response
the customers. The meaning of their study was its implication to avoid broadly elaborated
meanings of Empathyin the Asian context (Vinh, 2007).
Hence, the main dimension as Empathy was re-employed by price dimensions adopted
from its previous origin PZB model to bereplaced by “ Rate” : Monetary perceives either rate,
fees, wages, overtimes, and any about cash, benefits, profit earn in the form of a financial
variable perceives.
Measuring Model and Analyzed Data Application
Freight purchasing with decision making, relationships, and service quality affects
competitiveness. (Hunter, 1972; Whyte, 1993; Probert, 1996; Canez, Platts & Probert, 2000;
Fill and Visser, 2000; Gunasekaran et al., 2004; Chow, Choy and Lee, 2007; Cooper, 2007;
Holter, 2008; Mohamed and Jones, 2014). All were retrospectively ideal, variable, drivers
and gaps research to draw from subjectives to be objectives by weighing scales into a new
framework. The way to analysize the data from various variables into multilatent regressions
at the same time usually employed the SEM (Structural Equation Modelding) program for the
model measurement.
Another work on Quality Management Practices in Purchasing, QMPP framework
showed Information Systems Practice: IS with Purchasing Performance: PP offered by
Hemsworth, Rodriguez and Bidgood (2006) constructed their interested study in information
system and purchasing practice and employed LISREL to analyze the data and model
measurement (Figure 4).
ABAC ODI JOURNAL VISION.ACTION.OUTCOME. VOLUME 5(1) January- June 2018
173
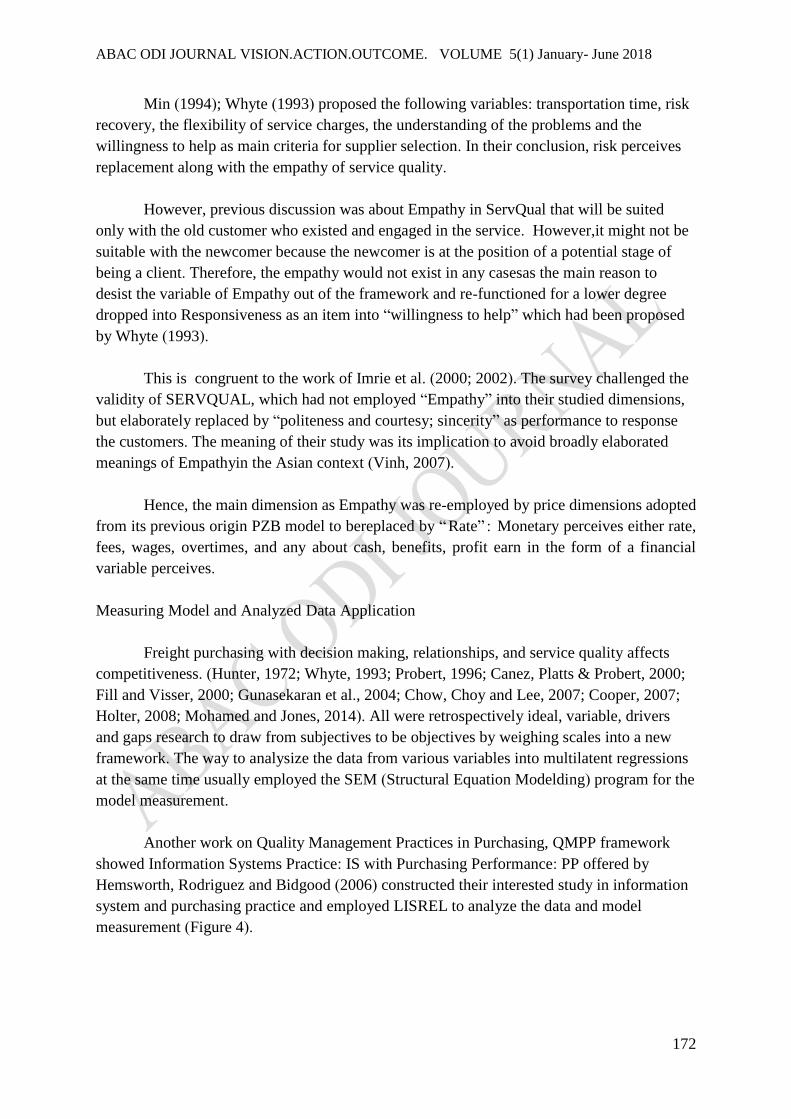
Figure 4. Theoretical Model of QMPP (Hemsworth et al.,2006).
Hemsworth et al. (2006) analyzed databy LISREL and showed the correlation of
Management commitment with Cross-functional 0.47, Personal Management 0.54, Supplier
Quality 0.38. The Cross-functional Coordination with Personal management was the highest
at 0.50 Personal management relationship with Supplier quality management at 0.64.
The Full model constructs as Quality management practice related to Information
Systems 0.60 and purchasing performance at 0.47.
For the Constrained model, the degree of freedom: df value results showed that the
highest three degrees of freedom were Personnel management with Supplier Quality at 90.52
and Full model as Purchasing performance at 71.67, Information Systemsat 63.47
respectively. They also claimed that the benchmarking as one of the variables in quality
management had no any significance to management commitment and unable to be computed
because such construct each had only three measurement variables.
However, researcher considered the above reasons differently. In fact, such
constructed structure of benchmarking should be an individually dependent variable than a
mixed variable. It could not confirm benchmarking constructs for the same management
commitment. Their study concentrated on measuring Information Systems Practices that
affected the Purchasing Performance. This causes a mistake in framework design process.
Their analyzed outcome showed that personnel management which this research
regarded as resources, and their information system would be measured only as track and
trace. Therefore, both will be included in this research as a part of measuring items.
The Output Competitiveness
Competitive Service Level

ABAC ODI JOURNAL VISION.ACTION.OUTCOME. VOLUME 5(1) January- June 2018
174
In competitiveness in transport verified by Cooper )2007(, the three main variance
that affect service levels are cost variance, time and reliability of delivery .Dugdale )1985 (
suggested most competitiveness was built through the insource and outsource decision.
Choy et al) .2003 (emphasized the selection appropriated suppliers who produce the
good price and good quality will lead competitiveness to the company. Lysons & Farrington
)2006 (indicated that supplier with competitive price, quality and lead times are simply found
in world class supplier attributes.
Ramsay and Wilson )1990 (suggested that a buyer has risk accusations of either
incompetence or corruption when he has only one single source of supply .Hence in this
study, the survey provides measuring items into three facets which were :cost, time, and
flexibility .The three main attributes constructed to congruent the three well-known price,
speed, and agility .
Cost in service level
Green, Zimmerer & Steadman )1994 (described that the low price is relatively
unimportant when the buyer is concerned with the level of quality to meet the customers,
while the low quality or high price cannot expect purely social efforts to win an order without
other competitive influences.
Dugdale )1985 (suggested to measure the cost in many aspects. In the alternative
aspect of marginal cost analysis, a computation is made of the variable costs involvedonly,
i.e .direct material, direct labor and variable overhead .Ellram and Maltz )1995 (found their
findings that most respondents with a straight price comparison would have led to the
rejection of the third-party alternative, even though outsourcing resulted in both initial and
long-term cost reductions .
Spina, Campanella & Codeluppi )2000 (confirmed that the cost competition plays a
dominant role, and it is almost impossible to create different quality of the products, and a
superior service level can ensure customers' loyalty.
Time in service level
Hemsworth et al) .2006 (offered Real-time and Quick which concentrated only on
these two categories constructs had a relationship in purchasing-related to firm's
commitment .Time is also an important variable, especiallyit is the most important either in
just-in-time or VMI implementation .Further reading was recommended for the essential of
critical time management in replenishment )Thankdenchaiand Pasawat, 2015.(
Flexibility in service level
Ramsay & Wilson )1990 (suggested that the flexibility accusation could be happened
by the disadvantage of single sourcing. Leenders et al) .2002 (proposed that companies
needed a supply chain that is flexible and responsiveto capitalize on the latest trends.

ABAC ODI JOURNAL VISION.ACTION.OUTCOME. VOLUME 5(1) January- June 2018
175
Southwood )1995 (defined Flexibility was the service can be adapted more easily than
in-house services to meet changing needs. Yuttapong and Sataporn )2010 (defined clearly for
Flexibility, and Replace ability was ability to switch the operation to another plan or process.
Coyle et al) .2011 (wrote “Flexibility ”that companies can use any combination of the
five transportation modes that are flexible for the best so it suits freight in the Intermodal
Transportation to facilitate global trade.
R and L Global )2015 (explained about the new thread of next shift of forwarder’s in
service obligation .Flexibility is another valuable trait of intermodal transportation .Flexibility
includes cost, obstacles, resources and time to switching.
Transport purchasing is not unique, but it presents unique challenges. Transport spans
several business functions and can have a vast business impact (Holter et al., 2008). Many
examples were where the dispatchers perform transport purchasing, the finance department,
the inventory manager or the operation workers. Whyte (1993); Holter et al. (2008)
emphasized the need for the increased professionalism of transport purchasers since there
were many providers and the market could be competitive. There are differences in service
quality but essentially the outcome of the service.
Nevertheless, all synchronized previous works with Rao and Yong (1994, p.
18) at the final proposed their drivers in the key factors interaction model. The same
conceptual of drivers constructed in similar interpreted meaning with SPU 5’Rs model:
Centrality/criticality (Resources); Risk liability and control (Risks avoidance); Cost/service
issues (Rates); Information services (Responsiveness); Market relationship (Reliability).
Finally, the framework of this study that was drawn for 7 Hypotheses was shown in Figure 5.
Figure 5. Conceptual framework
(Competitive) Service Level
Service Level Cost
Service Level Time
Service Level Flexibility
Insourcing
Outsourcing
Multi-methods
Strategic Sourcing
Technique Service
Performance Unit
Responsiveness
Price effects
People effects
Policy effects
Dominant Power in Selection
Risk Avoid. Resources Rates Reliability
H2 H1
H4 H5
H3 H6 H7

ABAC ODI JOURNAL VISION.ACTION.OUTCOME. VOLUME 5(1) January- June 2018
176
Research Methodology
The research survey was designed into the quantitative survey under Structural
Equation Model (SEM) investigations, analyzed by LISREL (Linear Structural Relationship) to
build the Causal Relationship model with seven hypotheses. the executives’ interview,
comments by the experts for the model and outcome results were done as qualitative survey.
Figure 6. .Diagram of Competitive Service Level
Population and Samples
Total 1,348 members were listed as a population in three countries as logistics service
providers in transport members lists (214, 396, and 738 members for Thailand, Vietnam, and
China respectively). Purposive selection sampling method was applied since only total 680 sets
of questionnaires were able to be distributed through their activated email addresses. Total 509
set of questionnaires were completely answered and returned back, therefore the response rate
was 74.85%.
Among the 509 sets of questionnaires that were received, 159 (31.24%) were from
transporters in Thailand, 157 (30.84%) from Vietnam, and 193 (37.92%) from the Chinese
forwarders. The investigation was made on 14 variables with the rules of thumb for minimum
20 samples per variables. Hence, the minimum requirement of sample size was 280. This study,
samples size for major model was N=509.
Research Tool
By using the questionnaire with 68 items as a research tools, qualitative method design
was applied by interviewing the focus group of managerial levels in transport logistics
business. The type of question wordings and intention to measure the correct perception of the
respondents were modified several times.
S
S
SS
D
Reliability
Rates
Resource
Risk avoid
Responsive
Cost
Time
Flexibility
MAKE
BUY
BOTH
Price
People
Policy
H1
H2 H3
H5
H4 H6 H7
ABAC ODI JOURNAL VISION.ACTION.OUTCOME. VOLUME 5(1) January- June 2018
177
Finally, total seven of The Item Objective Congruence (IOC) committees were the
experts in logistics, academicians, statistians. Practical supply chain experts were the
committees who developed and modified the research tool, and checked the conent validity and
congurancy was approved.The IOC scores valued in between 0.57-1.00, the final average
outcome validity reached 0.82 or 82 percentages. IOC scores were tested by KR-20 and KR-
21 methods. It was shown that there were no any significant differences from both methods, as
rtt (0.977), ρKR21 (0.971).Pre-test was conducted by sending XLS format to all prospects. The
60 samples were randomly used as first come first serve in response as the trial group, without the
priority to the nationalities of the respondents. Items were considered reliable that alpha
coefficients values were 0.841as the reliability result of the research tool.
Data Collection
Data collections were made during October 2015 to April 2016 via emails. Sampling
respondents were purposely selected only in the managerial levels or higher level to be
approachable by email addresses. E-questionnaires in spread-sheets were sent to service
providers.The survey partners provided the assistance in Vietnam and China to follow up with
the email responses in upcountry and via some phone calls.
Data Analysis
Data was analyzed in descriptive statistics such as frequency, percentages, means and
level of degrees. For the Structural Equation Modeling (SEM) was investigated by Lisrel
version 8.80
Findings
Respondents’ Profile
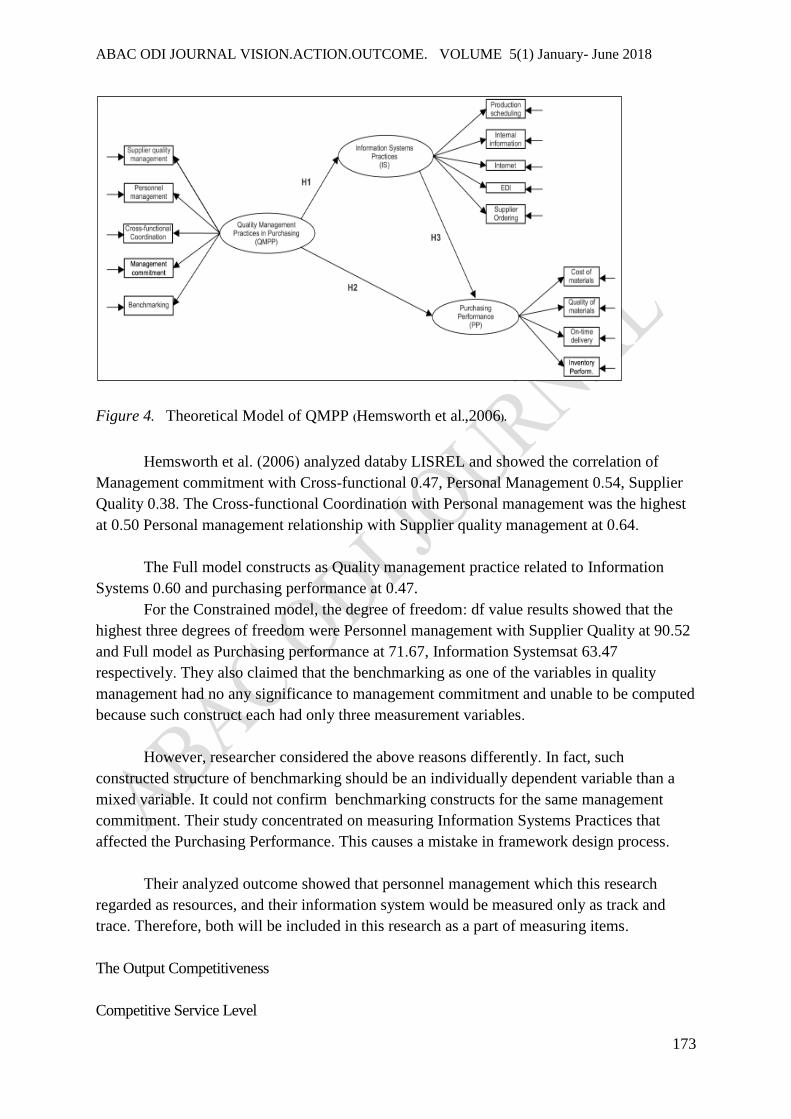
Total 509 respondents as shown in Table 4were divided into 3 countries and eight
main core businesses. Most respondents were 3PL (Sea), and they were from China,
Vietnam, and Thailand at 79.79%, 64.97%, and 62.89% respectively.
Table 4.
Respondent by Type of Business and by Countries
TYPE (N) Thailand Vietnam China Total TH (159) VN (157) CN (193)
3PL (Sea) 100 102 154 356 62.89% 64.97% 79.79%
Liner 28 6 7 41 17.61% 3.82% 3.63%
4PL 9 15 4 28 5.66% 9.55% 2.07%
3PL (Air) 10 4 13 27 6.29% 2.55% 6.74%
Custom 8 8 3 19 5.03% 5.10% 1.55%
Truck 2 10 7 19 1.26% 6.37% 3.63%
Other 1 10 1 15 0.63% 6.37% 0.52%
W/H 1 2 1 4 0.63% 1.27% 0.52%
(Total) 159 157 193 509 100% 100% 100%

ABAC ODI JOURNAL VISION.ACTION.OUTCOME. VOLUME 5(1) January- June 2018
178
Table 5 showed the frequency of sourcing as own make consolidation (Consol) or buy from
others (Co-load).
Table 5.
Strategic Sourcing (3 Ports)
SST Thailand Vietnam China Total TH (509) VN (509) CN (509) Total%
Consol 65 6 27 98 12.77% 1.18% 5.30% 19.25%
Co-load 37 38 103 178 7.27% 7.47% 20.24% 34.97%
Both 57 113 63 233 11.20% 22.20% 12.38% *45.78%
(All) 159 157 193 509 31.24% 30.84% 37.92% 100%
Outcomes from Table 5 showed the frequency and percentages as below.
Thailand: Most of them selected to Consol (Make own consolidation service),
followed by applied “Both” (Make and Buy) strategy. The strategy of “Co-load” (Buy only)
are approximately only 7% as same as Vietnam.
Vietnam: Most of them applied “Both” were the highest of all groups (22.20%), and
very less in “Consol” (1.18%).
China: Most of them applied “Co-load” (Buy only) (20.24%), and utilized “Both”
methods as half of the group of “Buy” only (12.38%).
Table 6 showed the frequency outcome of dominant decision on selection. The survey
was asked to the respondents to choose for who has most powerful to change the
respondent’s decision. As an instructor or advisor to guide or leads those to make a decision
for which suppliers must be selected. The choices were: making my own decision, by staff or
friend’s recommendation, by manager’s guidance, or by the firm’s policy.
Table 6.
Decision Making on Selection
DM.SELEC Thailand Vietnam China Total TH (509) VN (509) CN (509) Total%
My Own 58 42 48 148 *11.39% 8.25% 9.43% *29.08%
Staff/Friend 34 8 19 61 #6.68% 1.57% 3.73% 11.98%
Manager 28 75 68 171 5.50% *14.73% *13.36% **33.6%
Off. Policy 39 32 58 129 7.66% 6.29% *11.39% *25.34%
(All) 159 157 193 509 31.24% 30.84% 37.92% 100.00%

ABAC ODI JOURNAL VISION.ACTION.OUTCOME. VOLUME 5(1) January- June 2018
179
Table 6 showed the outcome in selected supplier and a relation dominated by whose
decisions or leads the decision making.
# OutcomeSSR:(Selection & Relationship)
Thailand: selection of the “Own decision” came first (11.39%) followed by “policy”
(7.66%), others were quite not much differences “policy”, “friends”, “manager” (7.66%,
6.68%, and 5.50%).
Vietnam: Selection of their “Manager” came first (14.73%) followed by “Own
decision” (8.25%) which was closer to “policy” (6.29%). And they were less to listen to their
“friends” same as China.
China: Selection of “Manager” came first (13.36%) and it was closer to “Policy”
instruction (11.39%).
The level of degrees criteria applied for results in Table 7.
1.00 – 1.50 = Very Low
1.51 – 2.50 = Low
2.51 – 3.50 = Moderate
3.51 – 4.50 = High
4.51 – 5.00 = Very High
Table 7. Level of Degree for Decision Making on Focus Factors
Mean ALL Level TH Level VN Level CN Level
3 Ports.MOB 2.27 Moderate 1.95 Low *2.68 Moderate 2.19 Low
DM.MOB 2.07 Low *2.33 Low 2.03 Low 1.89 Low
DM.Select 2.28 Low *2.55 Moderate 2.17 Low 2.15 Low
3P Focus ALL Level TH Level VN Level CN Level
Price 3.627 High 3.509 High 3.25 Moderate *4.03 High
People 3.552 High *3.736 High 3.41 Moderate 3.52 High
Policy 3.503 Moderate 3.352 Moderate *3.55 High 3.59 High
Table 7 shows the degree levels in strategic sourcing as Make or Buy techniques were
quite in low level. The focus on Dominant power as price, people, and policy were mostly
yield at high level. By country, Thailand concentrated on People focus, Vietnam
concentrated on Policy focus, but China led on Price focus.

ABAC ODI JOURNAL VISION.ACTION.OUTCOME. VOLUME 5(1) January- June 2018
180
Constructs & Model Reliability
Table 8 showed the factor loading scores for all the 14 constructed variables. The
result showed that the measured model of international transport service providers in
Thailand, Vietnam, and China were congruent to the exploratory research. The standardized
score yielded higher than 80%, factor loading scores: 0.52 to 0.97, with the p-value significant
<.01 (t> 2.58).
Table 8. Model Measurement – Validity & Reliability
Constructed
Factors
Factor Loading ** p <.01
t > 2.58 R2
Factor Scores
Regression b B SE
X1 0.63 0.91 (0.03) 25.19** 0.83 0.77
X2 0.60 0.82 (0.03) 21.73** 0.68 0.34
X3 0.52 0.76 (0.03) 19.29** 0.57 0.25
X4 0.69 0.89 (0.03) 25.57** 0.80 0.37
X5 0.73 0.89 (0.03) 25.40** 0.79 0.33
X6 0.75 0.92 (0.03) 26.86** 0.85 0.45
Y1 0.84 0.89 (0.00) - 0.79 0.30
Y2 0.81 0.90 (0.03) 27.62** 0.80 0.31
Y3 0.83 0.85 (0.04) 23.17** 0.72 0.33
Y4 0.63 0.63 (0.05) 13.86** 0.54 -0.20
Y5 0.84 0.86 (0.03) 25.63** 0.73 0.32
Z1 0.97 0.97 (0.00) - 0.94 0.41
Z2 0.90 0.87 (0.03) 31.65** 0.87 0.16
Z3 0.96 0.97 (0.02) 59.33** 0.94 0.40
Maximum Likelihood:(b: factor loading), (SE: Standard Error), (T); B (Completely Standardized
Solution);R2(Square Multiple Corr.) (B) >.05 = Factors are at high Convergent Validity
SEM Outcomes
The developing model for Competitive service level of logistics service providers in
Thailand, Vietnam, and China showed that the good of fitness indices were passed all criteria
as in Table 7 with the values: Chi-Square/df of 1.17, CFI =1, GFI =0.98, AGFI =0.97 and
RMSEA =0.018 (Figure 7).

ABAC ODI JOURNAL VISION.ACTION.OUTCOME. VOLUME 5(1) January- June 2018
181
Figure 7. Path Diagram for Competitive Service Level of Logistics Service Providers
Table 9. Model after modification indices
Goodness of Fit
Fit Index
Criteria Outcome
Index Values
Test Result
X2/df ‹ 2.00 1.17 Pass
CFI ≥ 0.95 1.00 Pass
GFI ≥ 0.95 0.98 Pass
AGFI ≥ 0.95 0.97 Pass
RMSEA ‹ 0.05 0.018 Pass
(2) Path Analysis for Total Effects, Direct and Indirect Effects.
Structural Equation Model: SEM was employed to investigate the Path co-efficient
for the service providers in logistics and transport competitiveness on the service level. The
outcome showed the Direct Effects (DE); Indirect Effects (IE), and Total Effects (TE). The
results were showed in Table 10.
The most impact path co-efficient was (TE: L2 to L4), the Dominant Power (DOM) to
the Competitive Service Level (SVL) as total effect = 0.48, by the direct effect (L2 to L4) =
0.37. These results congruent and support the similar outcome of the correlation matrix that
L2 had highest relationship to L4 at 0.77
Followed by direct effect of L3: Service Performance Units (SPU) to the Competitive
Service Level (SVL) as = 0.36.

ABAC ODI JOURNAL VISION.ACTION.OUTCOME. VOLUME 5(1) January- June 2018
182
Table10.
Path Co-efficient for Competitive Service Level of Logistics Service Providers (N=509)
Causal L1 L2 L3 Outcome TE IE DE TE IE DE TE IE DE
L3 0.26** - 0.26** 0.30** - 0.30** - - - (0.03) - (0.03) (0.03) - (0.03) - - - 7.42 - 7.42 8.70 - 8.70 - - -
L4 0.15** 0.09*** 0.06** 0.48*** 0.11*** 0.37*** 0.36** - 0.36*** (0.03) (0.02) (0.03) (0.03) (0.02) (0.03) (0.04) - (0.04) 4.77 5.52 1.82 14.23 6.24 11.26 8.20 - 8.20
Statistics Chi-Square = 72.75, df = 62, P = 0.1650, GFI = 0.98. AGFI = 0.97, SRMR = 0.017 Variables X X1 X2 X3 X4 X5 X6 Reliability (R2) 0.83 0.68 0.57 0.80 0.79 0.85 Variables Y Y1 Y2 Y3 Y4 Y5 Z1 Z2 Z3 Reliability (R2) 0.79 0.80 0.72 0.54 0.73 0.94 0.87 0.94 Variable (SEM) L3 L4 R Square (Reduced)) 0.50 0.61
Correlation Matrix ETA and KSI Construct Reliability & Avg.Variance
Extract LATENT L3 L4 L1 L2 Latent Construct c v L3 1.00 L1 MOB 0.8708 0.6931 L4 0.71 1.00 L2 DOM 0.9287 0.8127
L1 0.62 0.59 1.00 L3 SPU 0.9231 0.7091
L2 0.64 0.77 0.61 1.00 L4 SVL 0.9693 0.9135 Remarks *<.05 **<.01
c validity > 0.60, v extraction >.50
For the Indirect Effects, the most were also (L2 to L4) Dominant Power (DOM) to
Service Level (SVL) = 0.11, and followed by (L1 to L4) Strategic Sourcing Technique (SST)
to Service Level (SVL) at 0.09.
The Reliability of observed variables valued in between 0.54 - 0.94. The highest
reliabilities were factors: Cost and Flexibility (Z1, Z3) which were equally at 0.94. For the
lowest reliability value was: Risk avoidance (Y4) valued at 0.54.
The Squared Multiple Correlations (R2) found that the predicted co-efficient (R2) of
Service Performance Units (SPU) resulted as 0.50 or the SPU latent for the predictable
variance at 50 percentages. The predicted co-efficient (R2) of Competitive Service Level
(SVL)was 0.61 or this Latent variable was capable to predict variance in Service Level at 61
percentages.
Correlation Matrix of Latent variables showed that the correlation coefficient values
in between 0.59 to 0.77. The highest correlated values were factors: Dominant Power (DOM) and Competitive Service Level (SVL), followed by Service Performance Units (SPU) and
Competitive Service Level (SVL) at 0.71 respectively. For the lowest correlation factors were
SST and SVL which were Strategic Sourcing Technique and Competitive Service Level at
0.59.

ABAC ODI JOURNAL VISION.ACTION.OUTCOME. VOLUME 5(1) January- June 2018
183
Finally, the outcomes of total 7 hypotheses for direct and indirect effects were all
support the hypotheses’ alternatives (All rejected H0).
Hypothesis 1: L1 (SST) has a direct relationship to L3 (SPU)
Total effects = 0.26 (Direct Effect = 0.26)
Hypothesis 2: L1 (SST) has a direct relationship to L4 (SVL)
Total effects = 0.15 (Direct Effect = 0.06; indirect = 0.09)
Hypothesis 3: L1 (SST) has an indirect relationship to L4 (SVL) via L3 (SPU)
Total effects = 0.15 (Direct Effect = 0.06; Indirect effect = 0.09)
Hypothesis 4: L2 (DOM) has a direct relationship to L3 (SPU)
Total effects = 0.30 (Direct Effect = 0.30)
Hypothesis 5: L2 (DOM) has a direct relationship to L4 (SVL)
Total effects = 0.48 (Direct Effect = 0.37; indirect = 0.11)
Hypothesis 6: L2 (DOM) has an indirect relationship to L4 (SVL) via L3 (SPU)
Total effects = 0.48 (Direct Effect = 0.37; Indirect effect = 0.11)
Hypothesis 7: L3 (SPU) has a direct relationship to L4 (SVL)
Total effects = 0.36 (Direct Effect = 0.36)
Conclusions
For the major model (N =509), the reliability was arranged by the rank of construct
reliability values: the Competitive Service Level (SVL), the Dominant Power in selection
(Dom), the Service Performance Units (SPU), then the Strategic Sourcing Technique (SST)
or Latent 4, 2, 3, 1. Results were 0.9693, 0.9287, 0.9231, and 0.8708 respectively.
The highest values of factor loaded were equal as: Cost and Flexibility resulted as
0.97, followed by Policy (X6), and Make (X1) at 0.92 and 0.91 respectively. The lowest
factor loaded value was: Risk avoidance (Y4) with value 0.63.
Within the mediator, variables as the Service Performance Units (SPU), ranked by the
most value were Rates (R2) 0.90, Responsiveness (R5) 0.86, Reliability (R1) 0.89, Resources
(R3) 0.85, and Risk Avoidance (R4) 0.63 respectively. These results show the congruent for
Rates (R2) to the outcome of Cost (Z1) and secondary was Responsiveness (R5) which
supports the outcome of Flexibility (Z3).
Recommendations
The developing model examined invariance measurement in three countries, and the
variables, and model were congruent to the exploratory data. The outcomes were well fitted
and also supported to the past works, either related to lean or just in time strategy of
Andersson, R., Eriksson, H., and Torstensson, H. (2006). They mentioned that once the scale

ABAC ODI JOURNAL VISION.ACTION.OUTCOME. VOLUME 5(1) January- June 2018
184
efficiency can be maximized with highly dynamic conditions that cannot be dealt with; there
is no room for flexibility, focus on perfection, lean, particular market conditions at a certain
period of time. The lean concept destroys the flexibility, while the just-in-time engaged in
resources spending (trade off time by high-cost).
Another work of Vanichchinchai (2012, p.161, 167) investigated the firm’s supply
performance measurement by four sub-constructs: Cost (3 items), Flexibility (3 items),
Relationship (4 items) and Responsiveness (3 items). The final outcomes showed that the
most impact were Relationship (0.89), Responsiveness (0.85), Cost (0.80) and Flexibility
(0.73). In his study with six-point scales were applied to evaluate the employee involvement,
partnership management, and supply performance in the survey on automotive companies.
Regarding to these research findings, the results from the logistics companies as Dominant
power on selection was the highest impact, (the selected supplier focus), Cost (0.97), Time
(0.87), and Flexibility (0.97). Hence, this illustrated model is recommended for adaptable
firm’s development.
Implementation and Future Research
For Practitioners, Dominant powers on selection are the main key factor for both
selections on methods of strategic sourcing and selected focus on supplier selections. These
powers from price, people or policy caused the direct impact and effects to the different
outcomes which are: saving cost, best cost or high speed on service responsiveness,
flexibility to the team’s policy to achieve the higher customers’ satisfaction.
For Professionals, Dominant powers were engaged in selective process as intangible,
uncountable, and subjective. However , it later results as objective in form ofthe performance
of a throughput. The instruction and control leads by firm management’s decision.
Disciplines of staff or self-confident issue against manager’s instruction, caused a high-pay
manager is meaninglessif he could not control his subordinates. Any wrong or bias decision
making during in purchasing, own selecting prices or supplier), the developing throughput
which is looking for a better cost or better quality would be difficult and be hardness in
implementation.
For implementation and further research, it is recommended to identify and modify
the degree of Service Performance Units (SPU)’s observed variables for which important
degree may significant different in a different context or local cultures in policy and
practices.
Due to the differences most concerned on the sourcing behaviors whether Make or
Buy, the survey was done within Asian countries. The future research recommended
exploring the same model’s parameters on other zone which may differ in shades of cultures
and practices such as European service providers, the United States logistics companies, etc.
The design causal relationship model confirmed and passed the invariance test for its
generality (Appendix B-D) and model also endorsed by the experts in logistics service
business (Appendix E).

ABAC ODI JOURNAL VISION.ACTION.OUTCOME. VOLUME 5(1) January- June 2018
185
References
Andersson, R., Eriksson, H., & Torstensson, H. (2006).Similarities and differences between
TQM, six sigma and lean.The TQM Magazine,18(3), 282-296.
Baily, P., Farmer D., Jessop D., & Jones, D. (2005).Purchasing Principles & Management. (9th
ed.). The Chartered Institute of Purchasing, and Supply, NJ: Prentice Hall.
Buffa, F. P. (1986)..Inbound logistics: Analysing inbound consolidation opportunities. International Journal of Physical Distribution and Materials Management, 16(4), 3-32. Emerald Backfiles (2007). Retrieved from
http://www.emeraldinsight.com/doi/pdfplus/10.1108/eb014635
Canez, L. E., Platts, K. W., & Probert, D. R. (2000).Developing a framework for make-or-buy
decision.International Journal of Operations & Production Management, 20(11), 1313-1330.
Cavusgil, S. T., & Das, A. (1997).Methodology issues in cross-cultural sourcing research – A
primer. Marketing Intelligence and Planning, 15(5), 213–220.
Choy, K. L., Fan, K. K. H., & Lo, V. (2003).Development of an intelligent customer-supplier
relationship management system: The application of case-based reasoning. Industrial
Management & Data System, 103(4), 263.
Cooper, M. C., Lambert, D. M., & Pagh, J. D. (1997).Supply chain management: More than a
new name for logistics. International Journal of Logistics Management, 8(1), 1-13.
Cooper, M. (2007). Cost and delivery time implications of freight consolidation and
warehousing strategies. International Journal of Marketing & Logistics, 14(6), 47-67.
Coyle, J. J., Novack, R. A., Gibson, B. J., & Bardi, E. J. (2011). Transportation: A supply chain
perspective. (7th ed.). Mason, OH: South-Western Cengage.
Dale, B. G., & Cunningham, M. T. (1983). The importance of factors other than cost
considerations in make or buy decisions. International Journal of Operation,4(3), 43-54. Emerald Backfiles (2007). Retrieved from
http://www.emeraldinsight.com/doi/pdfplus/10.1108/eb054719
Boer, D. L., Gaytan, J., & Arroyo, P. (2006). A satisficing model of outsourcing.Supply Chain
Management:An International Journal, 11(5), 444–455.
Dugdale, H. (1985). Make or buy: Factors relevant to decision making. Profit planning – 21.Work Study., 18-25. Emerald Backfiles 2007. Retrieved from

ABAC ODI JOURNAL VISION.ACTION.OUTCOME. VOLUME 5(1) January- June 2018
186
Ellram, L. M. (1994). Total Cost of Ownership – An analysis approach for purchasing. International Journal of Physical Distribution & Logistics Management, 25(8), 4-23.
Ellram, L. M., & Maltz, A. B. (1995).The use of total cost of ownership concepts to model the
outsourcing decision.The International Journal Logistics Management, 6(2), 55-66.
Fill, C., & Visser, E. (2000). The outsourcing dilemma: A composite approach to the make or
buy decision. Management Decision, 38(1), 43-50.
Giunipero, L. C., & Monczka, R. M. (1997).Organizational approaches to managing
international sourcing. International Journal of Physical Distribution & Logistics
Management, 27 (5/6), 321-336.
Green, R. F., Zimmerer, T. W., & Steadman, M. E. (1994).The role of buyer sophistication in
competitive bidding.Journal of Business & Industrial Marketing, 9(1), 51-59.
Gunasekaran, A., Patel, C., & McGaughey, R. E. (2004).A framework for supply chain
performance measurement.International Journal Production Economics, 87, 333–347.
Handfield, R. B., Monczka R. M., Giunipero L. C., & Patterson J. L. (2009). Sourcing and supply
chain management. Boston, MA: South-western College.
Hemsworth, D., Sa´nchez-Rodrı´guez, C., & Bidgood, B. (2005).Determining the impact of
quality management practices and purchasing-related information systems on
purchasing performance: A structural model.The Journal of Enterprise Information
Management, 18(2), 169-194.
Holter, A. R., Grant, D. B., Ritchie, J., & Shaw, N. (2008).A framework for purchasing
transport services in small & medium size enterprises: Purchasing transport services. International Journal of Physical Distribution & Logistics Management, 38(1), 21-38.
Hunter, P. (1972). To own or lease—Which way for container operations? International
Journal of Physical Distribution, Emerald Backfiles 2007, 64-67. Retrieved from
http://www.emeraldinsight.com/doi/pdfplus/10.1108/eb038854
Lambert, D. M., & Pohlen, T. L. (2001).Supply chain metrics. The International Journal of
Logistics Management, 12(1), 1-19.
Leenders, M. R., Fearon, H. E., Flynn, A., & Johnson, P. F. (2002).Purchasing& Supply Chain
Management. (12th ed.). New York, NJ: McGraw-Hill Irwin.
Lyons, P. R. (2015). Core self-evaluation can help in making better recruitment and selection
choices. Human Resource Management International Digest, 23(3), 17-19.

ABAC ODI JOURNAL VISION.ACTION.OUTCOME. VOLUME 5(1) January- June 2018
187
Lysons, K., & Farrington, B. (2006). Purchasing& Supply Chain Management. (7th ed.). Pearson, New York, NJ: Prentice Hall.
Matear, S., & Gray, R. (1993).Factors influencing freight service choice for shippers and
freight suppliers. International Journal of Physical Distribution & Logistics
Management, 23(2), 25-35.
McIvor, R. T., & Humphreys, P. K. (2000). A Case-Based Reasoning approach to the make or
buy decision. Integrated Manufacturing Systems, 11(5), 295-310.
Min, H. (1994).International supplier selection: A multi-attribute utility approach. International
Journal of Logistics Management, 24(5), 24-33.
Mohamed, A. A., & Jones, T. (2014).Relationship between strategic management accounting
techniques and profitability – A proposed model.Measuring Business Excellence,
18(3), 1-22.
Parasuraman, A., Zeithaml, V., & Berry, L. (1985). A conceptual model of services quality and
its implication for future research. Journal of Marketing, 49(4), 41-50. Probert, D. R. (1996).The practical development of a make or buy strategy: The issue of
process positioning. Integrated Manufacturing Systems, 7(2), 44–51.
R+L Global. (2015). International Logistics.Retrieved from http://www.rlglobal.com/about /case-studies/international-logistics
Ramsay, J., & Wilson, I. (1990).Sourcing/Contracting strategy selection.Sourcing/Contracting
strategy.International Journal of Operations & Production Management, 10(8), 19-28.
Rao, K., &Young, R. R. (1994).Global supply chains: Factors influencing outsourcing of
logistics functions. International Journal of Physical Distribution & Logistics
Management, 24(6), 11-19.
Southwood, G. (1995). Outsourcing your information resources.Records Management Journal,
5(2), 101-113.
Spina, G., Campanella, N., & Codeluppi, G. (2000).Make vs buy vs partnership in distributing
commodities: A case study and methodology. Integrated Manufacturing System, 11(2),
112-120.
Thai, V. V. (2007). Service quality in maritime transport: Conceptual model and empirical
evidence. Asia Pacific Journal of Marketing and Logistics, 20(4), 493-518.
ABAC ODI JOURNAL VISION.ACTION.OUTCOME. VOLUME 5(1) January- June 2018
188
Thai-Aec. (2015). 10 countries in AEC. Retrieved from http://www.thai-aec.com
Thankdenchai, P. (2013). Service performance unit for logistics benefits measurement: A
conceptual framework of 5Rs model. In Yurarach (Ed.), Research and Innovations for
Sustainable Development2013.Proceedings of the 8th Conference of Sripatum
University (pp. 1358-1367). Bangkok, Thailand.
Thankdenchai, P. (2015). Relationship between strategic sourcing techniques and profitability
for competitiveness – A proposed model.In The BMIC2015 Business Management
International Conference: Moving towards Business and Economic Sustainability.
Conference proceedings of Faculty of management and tourism.Burapha University,
Chonburi, Thailand.Retrieved fromhttp://www.bbs.buu.ac.th/bmic2015
Thankdenchai, P., & Pasawat, P. (2015).Nestlé Thailand's best practice, a support idea on
support best practice VMI: An enabler of conceptual collaboration. AU GSB e-Journal,
8(1), 85-95. Retrieved from
http://www.assumptionjournal.au.edu/index.php/AU-GSB/article/view/1458
The World Bank. (2012). Connecting to compete 2012: The logistics performance index and its
indicators.In J. Arvis (Ed.), Trade Logistics in the Global Economy (pp. 1-56).NW,
Washington DC.
Vanichchinchai, A. (2012).The relationship between employee involvement, partnership
management & supply performance: Findings from a developing country.
International Journal of Productivity and Performance Management, 61(2), 157 – 172
Whyte, J. L. (1993). The freight transport market: Buyer-seller relationship and selection criteria.
International Journal of Physical Distribution & Logistics Management, 23(3), 29-37.
Wilding, R., & Juriado, R. (2004).Customer perceptions on logistics outsourcing in the
European consumer goods industry.International Journal of Physical Distribution &
Logistics Management, 34(8), 628-644.
Yount, R. (2006). 12developing scales, Research design and statistical analysis. In
Christian Ministry (Ed.),Research Methods (4th ed., pp. 1-12).Retrieved from
http://www.napce.org/documents/research-design-yount/12_scales_4th.pdf

ABAC ODI JOURNAL VISION.ACTION.OUTCOME. VOLUME 5(1) January- June 2018
189
Yuttapong, P., & Sataporn, A. (2010).Performance development method for the aviation
supply chain. In U. Laptanes (Ed.), The 2nd International Conference on Logistics and
Transport & the 1st International Conference on Business and Economics: Managing
Finance and Risk in Global Supply Chain: ICLT 2010, ICBE 2010 (pp. 1105-1113).
Queenstown, New Zealand.
Zammori, F., Braglia, M., & Frosolini, M. (2009).A standard agreement for vendor managed
inventory. Strategic Outsourcing: An International Journal, 2(2), 165-186.