Embed Size (px)
Citation preview
THIS REPORT CONTAINS ASSESSMENTS OF COMMODITY AND TRADE ISSUES MADE BY
USDA STAFF AND NOT NECESSARILY STATEMENTS OF OFFICIAL U.S. GOVERNMENT
POLICY
Date:
GAIN Report Number:
Approved By:
Prepared By:
Report Highlights:
TH2041 Sugar production will likely increase to 10-11 million tons in MY2011/12 and MY2012/13 in
anticipation of a bumper sugarcane crop driven by a government support program and attractive
returns. Sugar exports are forecast to continue their upward trend from 6.6 million tons in MY2010/11
to 9.0 million tons in MY2011/12 and 9.3 million tons in MY2012/13. Sugar consumption will likely
increase to 2.6 and 2.8 million tons in MY2011/12 and MY2012/1 in anticipation of a domestic
economic recovery.
Ponnarong Prasertsri Agricultural Specialist
Orestes Vasquez Agricultural Attaché
2012
Sugar Annual
Thailand
TH2041
4/12/2012
Required Report - public distribution
Executive Summary:
Sugar production will likely increase to 10-11 million tons in MY2011/12 and MY2012/13 in
anticipation of a bumper sugarcane crop of 100 - 105 million tons due to acreage expansion driven by a
government support program and attractive market returns.
Sugar mills are expected to increase from the existing 47 mills with a milling capacity of 0.9 million
tons of cane/day to 51 mills with a capacity of approximately 1.0 million tons/day in MY2012/13.
Consequently, sugar exports are forecast to increase to 9.0 million tons in MY2011/12, and continue the
upward trend to 9.3 million tons in MY2012/13 as three new mills start operating.
Domestic sugar consumption will likely increase around 8.0 percent to 2.6 and 2.8 million tons in
MY2011/12 and MY2012/13, respectively, in anticipation of domestic economic recovery from the
flood damage in 2011.
Commodities:
1 Production
MY2011/12 sugarcane production will likely increase to 100 million tons, up 5.0 percent from the
previous year, due to acreage expansion and average yield improvement. Farmers have shifted to
sugarcane production replacing tapioca driven by a government support program and attractive market
prices. The average yield increased to 12.4 tons/rai (77.3 tons/hectares), up approximately 2.0 percent
from the previous year, due to favorable weather conditions.
Meanwhile, the severe flooding in 2011, which affected nearly 10.0 million rai of agricultural land,
caused marginal damages to the sugarcane crop as most of it is cultivated upland. The damaged areas
are estimated at around 0.1 million rai (0.02 million hectares) which account for less than 1.0 percent of
total cultivated areas.
According to the official MY2011/12 crushing report by the Office of Cane and Sugar Board (OCBD)
issued on April 4, 2012, sugar mills have crushed around 93.0 million tons of sugarcane with a total
sugar production of 9.7 million tons since the season began on November 15, 2011. The average
extraction rate of sugarcane for sugar increased to 104.3 kg/ton of cane, up 2.9 percent from the
previous year. By the end of the crushing season in mid-May 2012, total sugar production will likely
increase to 10.4 million tons, up 7.2 percent from the previous year.
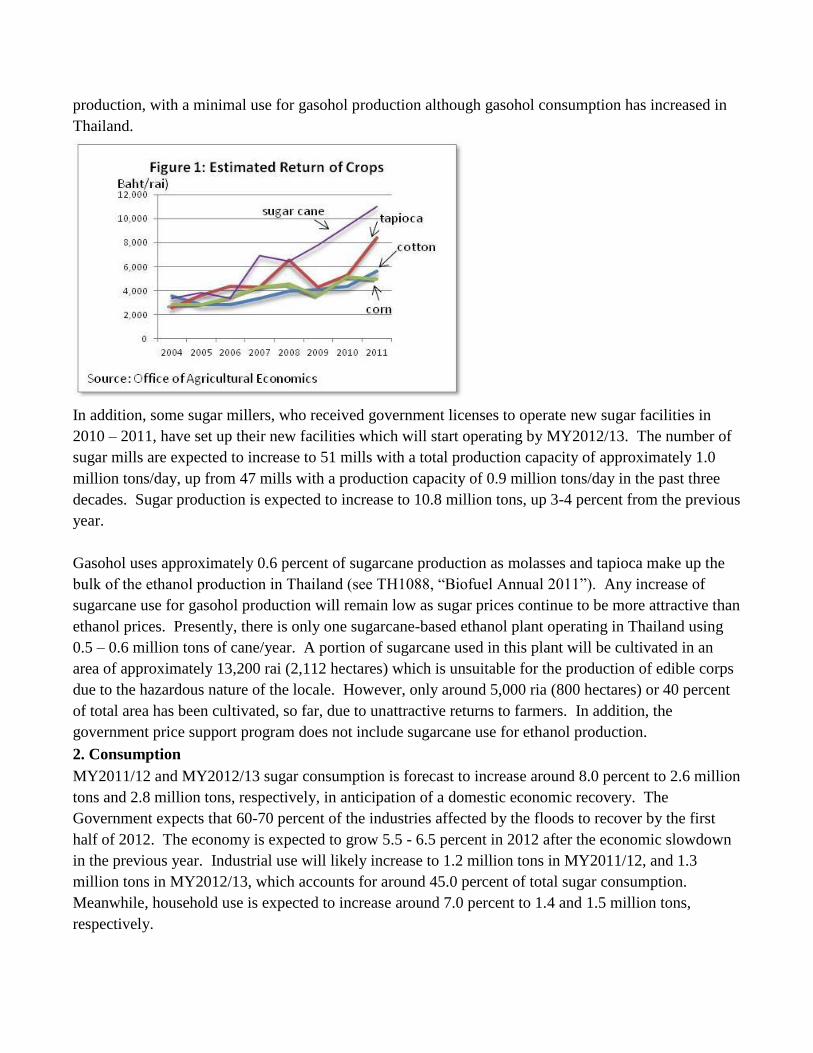
MY2012/13 sugarcane production is forecast to continue its upward trend to 105 million tons, up 4-5
percent from the previous year, in anticipation of acreage expansion. The cultivated areas will likely
increase to 8.4 million rai (1.3 million hectares) due to attractive returns, as compared to alternative
crops like tapioca and corn (Figure 1). Most of the sugarcane harvest will be primarily used for sugar
Sugar, Centrifugal
Sugar Cane for Centrifugal
production, with a minimal use for gasohol production although gasohol consumption has increased in
Thailand.
In addition, some sugar millers, who received government licenses to operate new sugar facilities in
2010 – 2011, have set up their new facilities which will start operating by MY2012/13. The number of
sugar mills are expected to increase to 51 mills with a total production capacity of approximately 1.0
million tons/day, up from 47 mills with a production capacity of 0.9 million tons/day in the past three
decades. Sugar production is expected to increase to 10.8 million tons, up 3-4 percent from the previous
year.
Gasohol uses approximately 0.6 percent of sugarcane production as molasses and tapioca make up the
bulk of the ethanol production in Thailand (see TH1088, “Biofuel Annual 2011”). Any increase of
sugarcane use for gasohol production will remain low as sugar prices continue to be more attractive than
ethanol prices. Presently, there is only one sugarcane-based ethanol plant operating in Thailand using
0.5 – 0.6 million tons of cane/year. A portion of sugarcane used in this plant will be cultivated in an
area of approximately 13,200 rai (2,112 hectares) which is unsuitable for the production of edible corps
due to the hazardous nature of the locale. However, only around 5,000 ria (800 hectares) or 40 percent
of total area has been cultivated, so far, due to unattractive returns to farmers. In addition, the
government price support program does not include sugarcane use for ethanol production.
2. Consumption
MY2011/12 and MY2012/13 sugar consumption is forecast to increase around 8.0 percent to 2.6 million
tons and 2.8 million tons, respectively, in anticipation of a domestic economic recovery. The
Government expects that 60-70 percent of the industries affected by the floods to recover by the first
half of 2012. The economy is expected to grow 5.5 - 6.5 percent in 2012 after the economic slowdown
in the previous year. Industrial use will likely increase to 1.2 million tons in MY2011/12, and 1.3
million tons in MY2012/13, which accounts for around 45.0 percent of total sugar consumption.
Meanwhile, household use is expected to increase around 7.0 percent to 1.4 and 1.5 million tons,
respectively.
MY2010/11 sugar consumption growth slowed down from around 10.0 percent in the previous year to
approximately 5-6 percent or 2.4 million tons as food and beverage manufacturers, which account for
around 70 percent of the total industrial use, were affected by the floods in the last quarter of 2011. The
flooding slowed down the economy, reducing GDP growth to 0.1 percent in 2011, as compared to 7.8
percent in the previous year. Industrial use increased around 5.0 percent from the previous year, as
compared to 18.0 percent in the previous year, due to the 0.1 percent contraction of industrial use in the
fourth quarter of 2011 from the same period of the previous year. Meanwhile, household use, which
accounts for 56.0 percent of total sugar consumption, increase to around 1.3 million tons, up 12.8
percent from the previous year. According to the Ministry of Public Health, per capita consumption of
sugar has tripled from the standard of 10.0 kg/year to around 30.0 kg/year over the past five years.
3. Trade
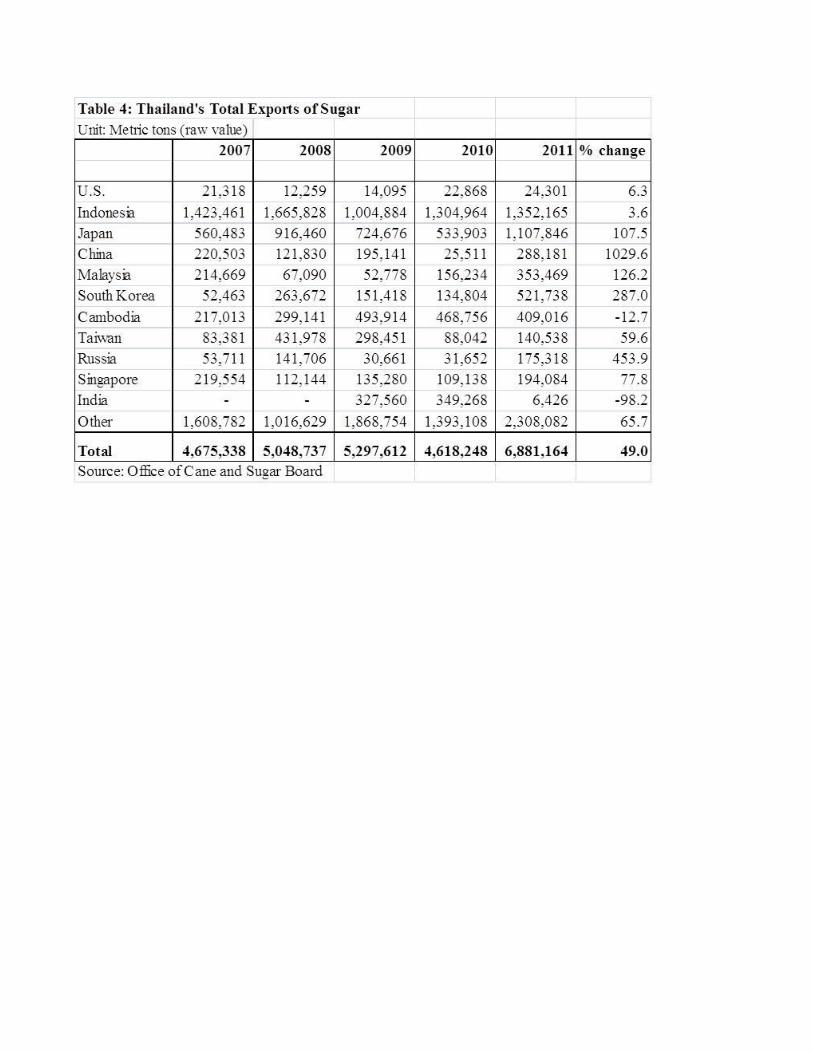
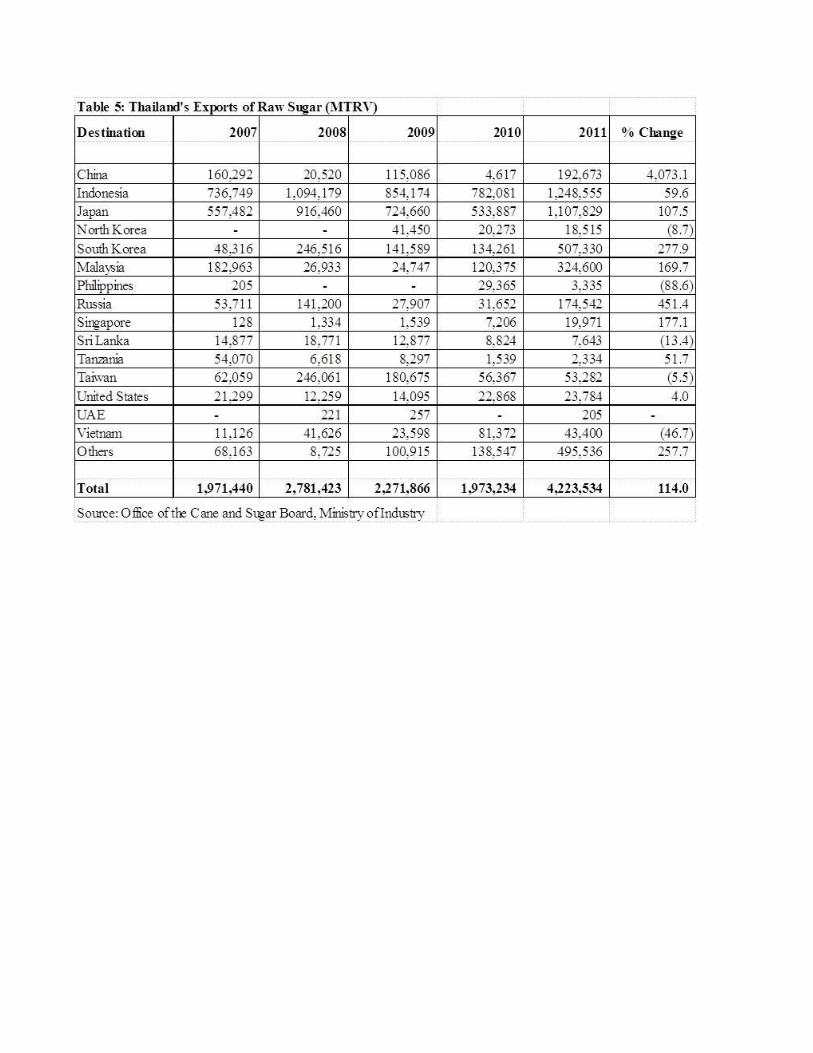
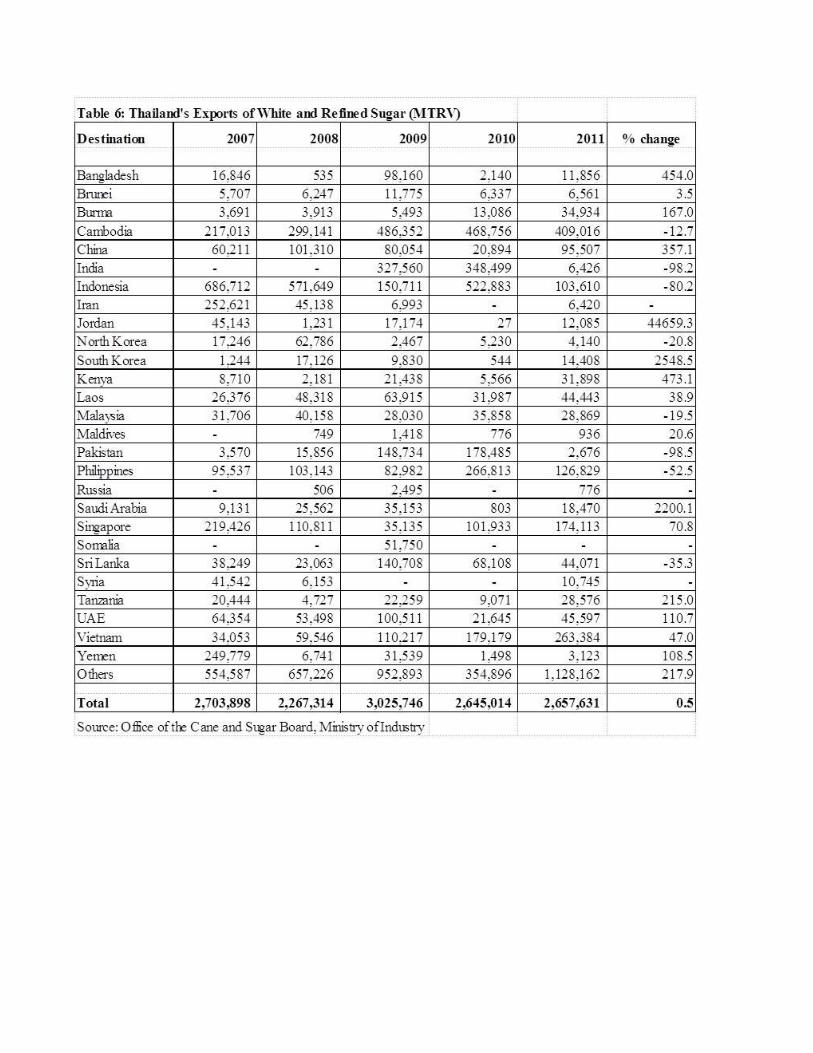
MY2010/11 sugar exports increased to 6.6 million tons, up 35.0 percent from the previous year, due to
large supplies of sugar from the bumper sugarcane crop. The increase was reflected in a surge of raw
sugar exports, which nearly doubled from the previous year, particularly to Japan, South Korea,
Malaysia, Russia, Indonesia, and China, due to limited supplies exportable supplies from Australia and
Brazil caused by unfavorable weather conditions. In addition, Thailand fulfilled the FY2011 U.S. tariff
quota (TRQ) of raw cane sugar of 14,743 tons, and an additional allocation and reallocation of 9,452
tons. Meanwhile, Thailand’s sugar imports increased to around 19,000 tons, far above its WTO TRQ
level of 13,760 tons , due to a sugar shortage panic resulting from rumors of tight supplies at the
beginning of the year.
MY2011/12 and MY2012/13 sugar exports will likely trend upward in anticipation of large supplies of
sugar from the acreage expansion of the sugarcane crop. Sugar exports are expected to increase to 9.0
million tons in MY2011/12, and around 9.3 million tons in MY2012/13. Raw sugar exports will likely
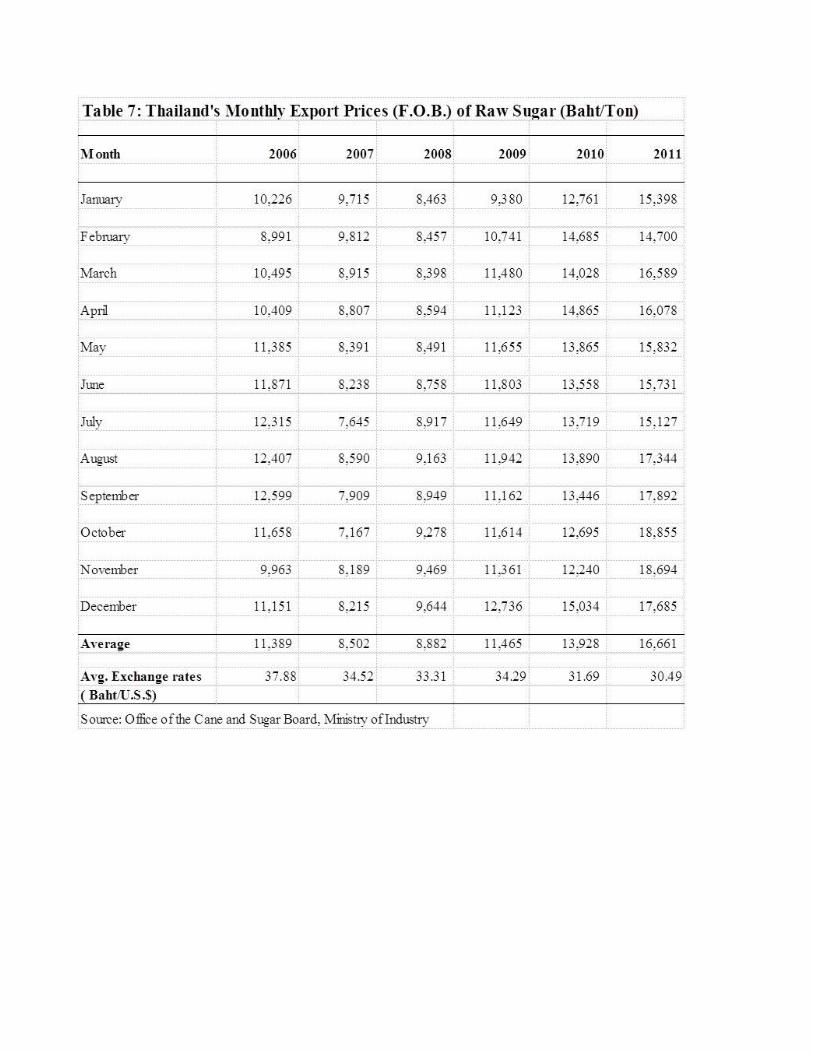
account for around 66.0 percent of total sugar exports. Presently, Thai sugar exporters have sold
forward contracts of around 80 - 90 percent of their MY2011/12 sugar production at around 25-26 U.S.
cent/lb which is 10-15 percent higher than the previous year’s price levels, driven by anticipated lower-
than-expected exportable supplies of Brazilian sugar due to drought. In addition, Thailand will be able
to fulfill the FY2012 U.S. TRQ of raw cane sugar of 15,027 tons and has offered to supply additional
100,000 tons if a quota reallocation or addition is implemented. Meanwhile, sugar imports in
MY2011/12 and MY2012/13 will likely decline to around 10,000 tons in due to a significant increase in
domestic supplies.
4. Stocks
MY2010/11 sugar stocks increased to around 3.0 million tons due to better-than-expected sugar
production amid the slowdown in consumption caused by the floods in the last quarter of 2011.
Meanwhile, sugar stocks will likely decline to 1.8 million tons in MY2011/12 and 0.6 million tons in
MY2012/13 in anticipation of an increase in sugar exports.
5. Policy
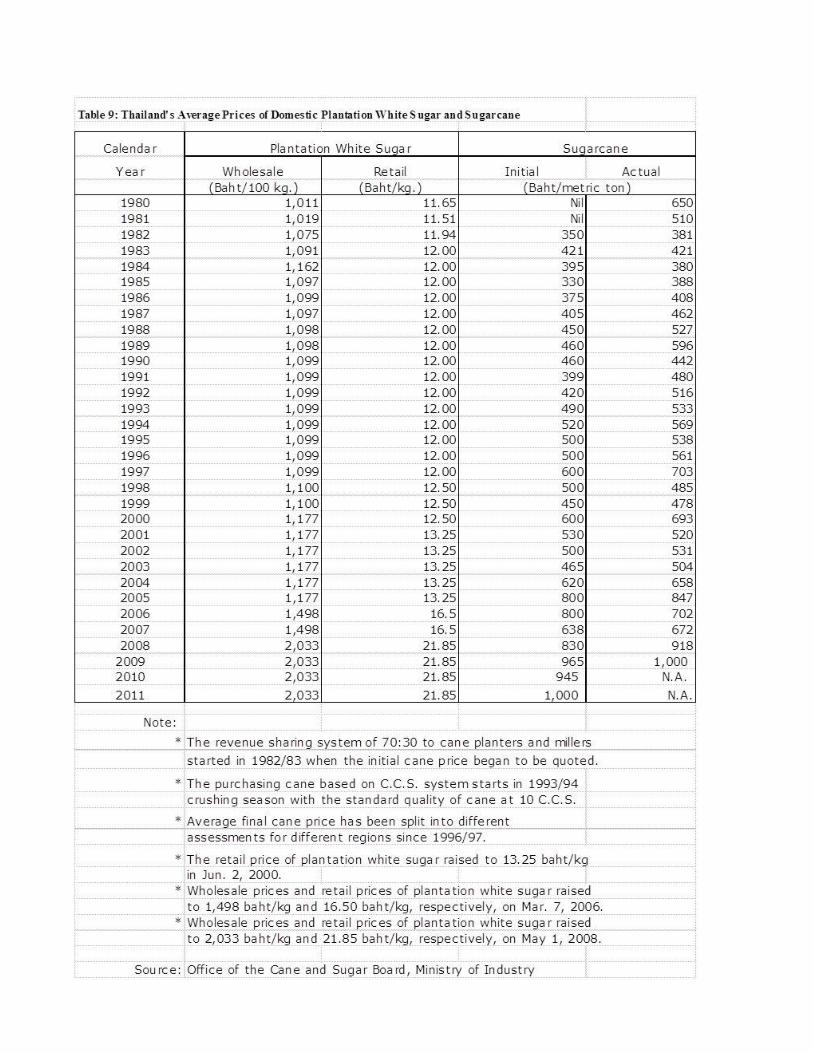
MY2011/12 sugarcane support prices were set at 1,000 baht/ton ($32.7/MT), up 5.8 percent from 945
baht/ton ($31.0/MT) in the previous year. In addition, on February 22, 2012 the cabinet approved the
direct payment of 154 baht/ton ($5/MT) for farmers. In total, farmers will receive 1,154 baht/ton
($37.8/MT), as compared to current market prices of 958 baht/ton ($31.4/MT). Consequently, the
Government will likely maintain its price control policy on sugar set on May 1, 2008 at 19 baht/kg ($29
cent/lb) for refined sugar, ex factory wholesale (excluding 7 percent Value Added Tax). The retail
prices (including the value-added tax) are set at 21.85 baht/kg ($33 cent/lb) for white sugar, and 22.85
baht/kg ($35 cent/lb) for refined sugar. The Government will use the revenue from the value-added tax
collected on domestic sales of sugar, for debt repayment to the Bank for Agriculture and Agricultural
Cooperative (BAAC) on costs incurred by the state-run Cane and Sugar Fund’s to fund the price support
program and the direct payment program.
On September 7, 2010, the Government approved 3.0 billion baht ($100 million) three-year soft loan for
cane growers to buy harvesters to improve their efficiency. Currently, farmers have applied for
approximately 2.0 billion baht ($66 million) of the loan. They have purchased both new and used cane
harvesters mainly from the US and Australia. The U.S. harvesters account for around half of the market
share. This will help increase harvest efficiency and overcome labor shortages especially as the
additional new sugar facilities will increase milling capacity from 0.9 million tons of cane/day to 1.0
million tons/day in MY2012/13. In addition, the government is considering the extension of the soft
loan program of 1.0 billion baht/year ($33 million) from 2012 onward for five years.
As for import policy, Thailand subjects imports of sugar to a WTO tariff-rate quota regime of a 65
percent tariff rate under a quota of 13,760 tons. Meanwhile, the out-of-quota tariff is 94 percent.
Appendix Tables
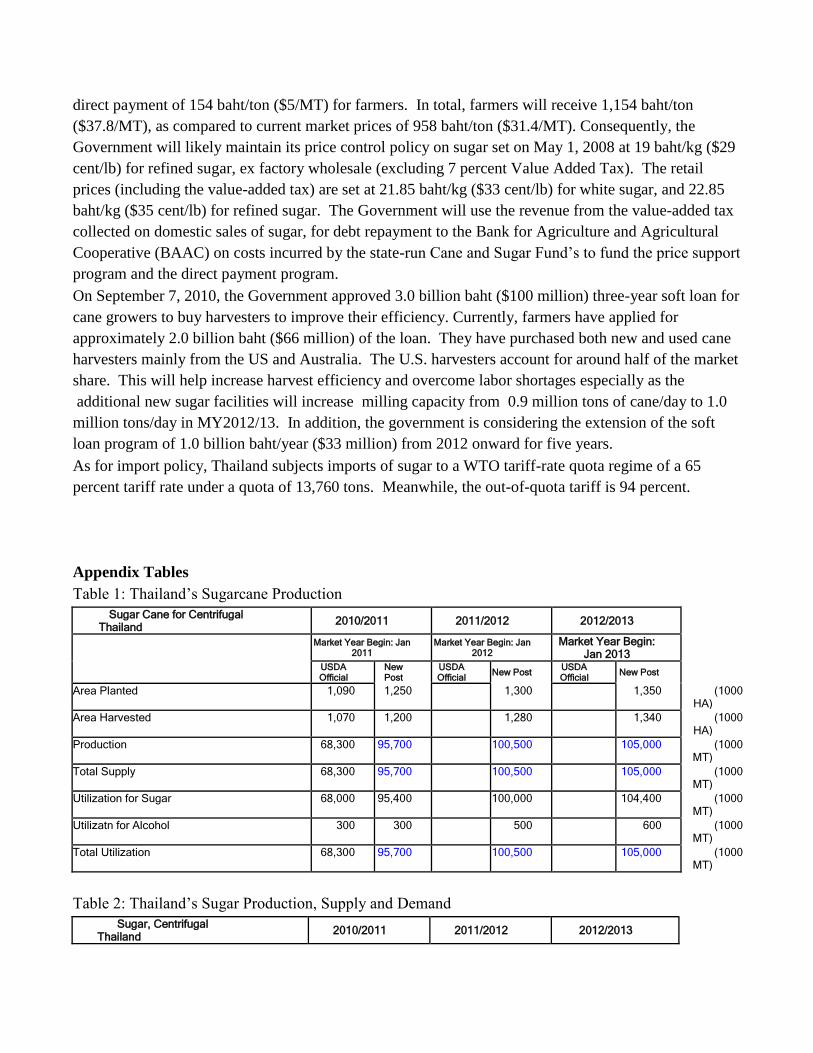
Table 1: Thailand’s Sugarcane Production
Sugar Cane for Centrifugal Thailand 2010/2011 2011/2012 2012/2013
Market Year Begin: Jan 2011
Market Year Begin: Jan 2012
Market Year Begin: Jan 2013
USDA Official
New Post
USDA Official New Post USDA
Official New Post
Area Planted 1,090 1,250 1,300 1,350 (1000 HA)
Area Harvested 1,070 1,200 1,280 1,340 (1000 HA)
Production 68,300 95,700 100,500 105,000 (1000 MT)
Total Supply 68,300 95,700 100,500 105,000 (1000 MT)
Utilization for Sugar 68,000 95,400 100,000 104,400 (1000 MT)
Utilizatn for Alcohol 300 300 500 600 (1000 MT)
Total Utilization 68,300 95,700 100,500 105,000 (1000 MT)
Table 2: Thailand’s Sugar Production, Supply and Demand
Sugar, Centrifugal Thailand 2010/2011 2011/2012 2012/2013
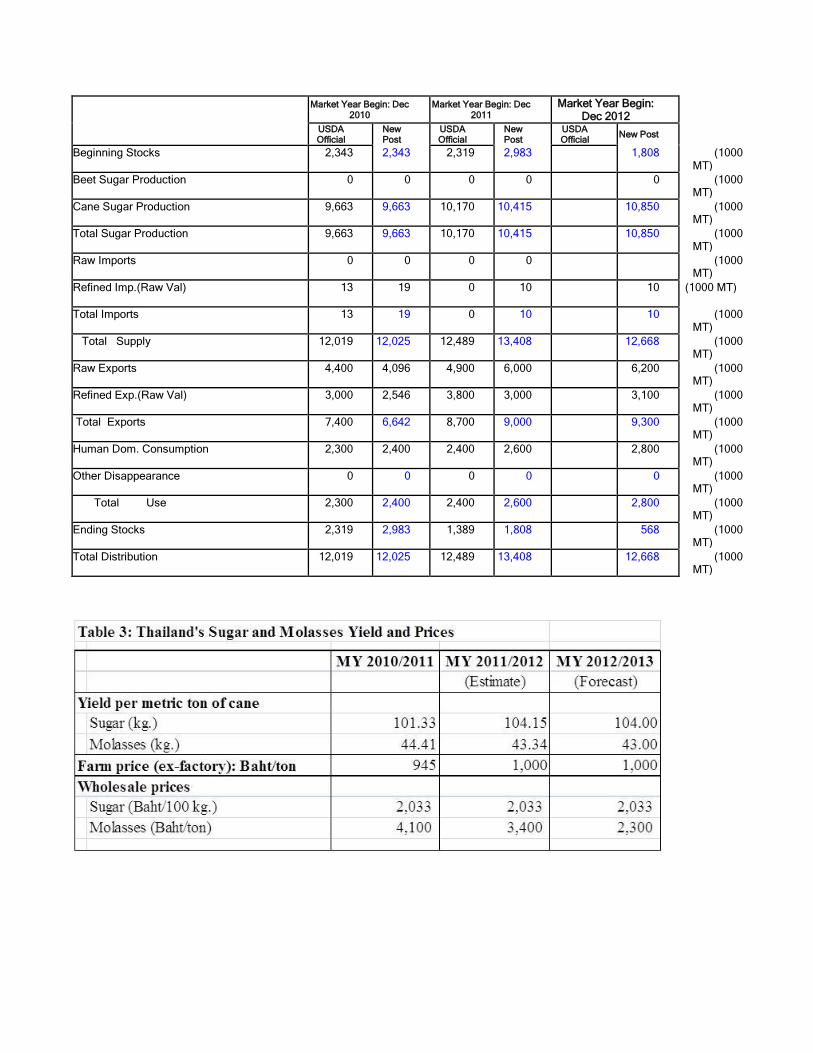
Market Year Begin: Dec 2010
Market Year Begin: Dec 2011
Market Year Begin: Dec 2012
USDA Official
New Post
USDA Official
New Post
USDA Official New Post
Beginning Stocks 2,343 2,343 2,319 2,983 1,808 (1000 MT)
Beet Sugar Production 0 0 0 0 0 (1000 MT)
Cane Sugar Production 9,663 9,663 10,170 10,415 10,850 (1000 MT)
Total Sugar Production 9,663 9,663 10,170 10,415 10,850 (1000 MT)
Raw Imports 0 0 0 0 (1000 MT)
Refined Imp.(Raw Val) 13 19 0 10 10 (1000 MT)
Total Imports 13 19 0 10 10 (1000 MT)
Total Supply 12,019 12,025 12,489 13,408 12,668 (1000 MT)
Raw Exports 4,400 4,096 4,900 6,000 6,200 (1000 MT)
Refined Exp.(Raw Val) 3,000 2,546 3,800 3,000 3,100 (1000 MT)
Total Exports 7,400 6,642 8,700 9,000 9,300 (1000 MT)
Human Dom. Consumption 2,300 2,400 2,400 2,600 2,800 (1000 MT)
Other Disappearance 0 0 0 0 0 (1000 MT)
Total Use 2,300 2,400 2,400 2,600 2,800 (1000 MT)
Ending Stocks 2,319 2,983 1,389 1,808 568 (1000 MT)
Total Distribution 12,019 12,025 12,489 13,408 12,668 (1000 MT)
End of report