Embed Size (px)
Citation preview
� �
� �
THAILANDHUMANDEVELOPMENTREPORT 2003

THAILAND HUMAN DEVELOPMENT REPORT 2003
THAILAND
HUMAN
DEVELOPMENT
REPORT 2003
United Nations Development Programme
THAILAND HUMAN DEVELOPMENT REPORT 2003
Copyright © 2003United Nations Development ProgrammeRajdamnern Nok AvenueBangkok 10200Thailand
Tel: (66-2) 2882130Fax: (66-2) 2800556E-mail: [email protected] site: www.undp.or.th
ISBN: 974-91116-5-6
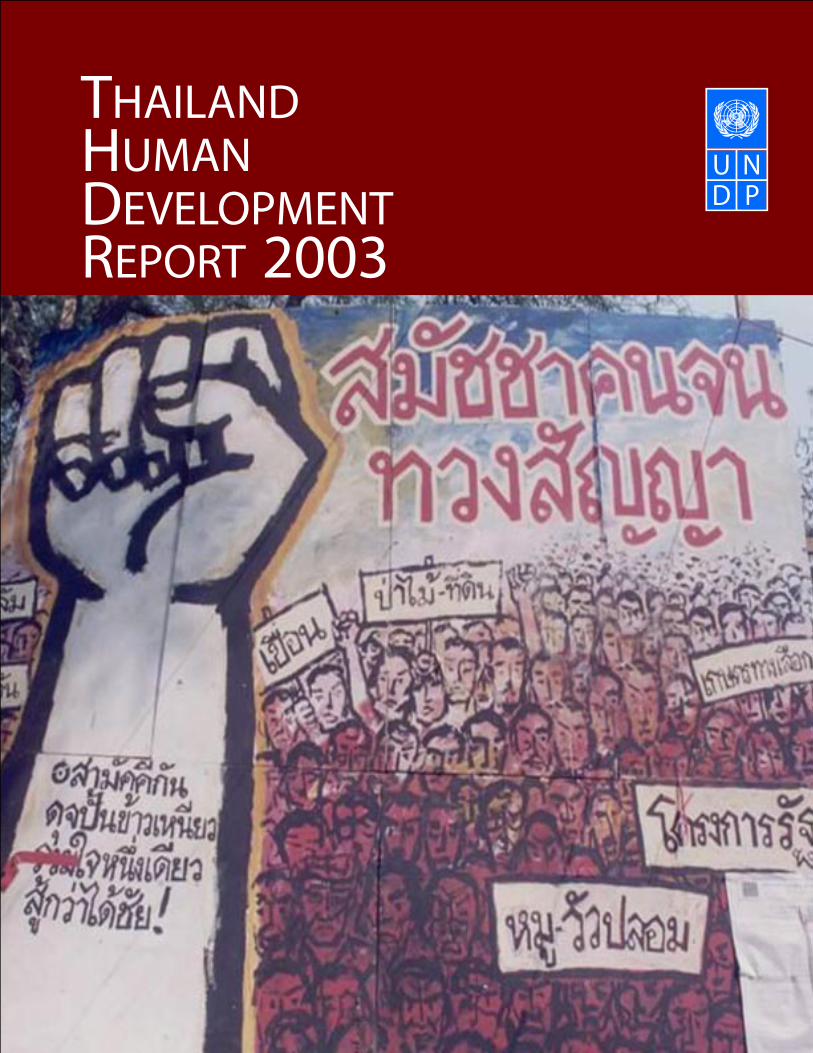
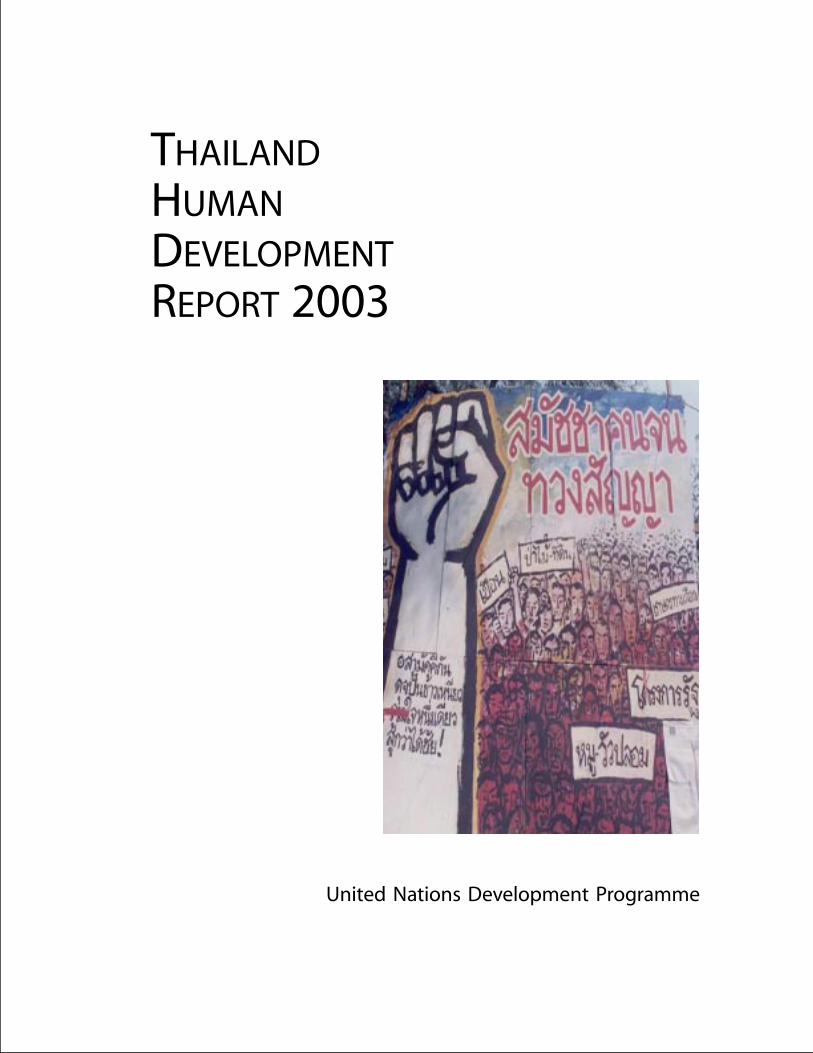
The cover photo shows a huge stage poster of the Assembly of the Poor (AOP)’s rally infront of the Government House that says “Assembly of the Poor follows up on the(Government’s) promises”. On the wrist is written “United like sticky rice, together asone for the victory”. The placards mention various problems and issues that AOP havecampaigned for or against, e.g. dams, forest-land, alternative agriculture, state’sprojects, fake pigs-cows.
Photo credit: Friends of the People (FOP)
ii
� �
� �
FOREWORD FROM THE PRIME MINISTER
His Excellency Thaksin ShinawatraPrime Minister of Thailand
It is my pleasure and honour to introduce the second UNDP National Human Develop-ment Report of Thailand.
At the beginning of the new millennium, all nations are eager to focus on povertyalleviation in its broadest sense, not just from an economic and technical perspective astended to be the case during most of the 20th century. UNDP’s focus on “humandevelopment” provides an excellent framework for this broader approach and matcheswell with Thailand’s own “people-centred approach” to development.
Globalization has tended to divert attention from this broader perspective, focusing toooften exclusively on economic growth and its attendant opportunities. While suchemployment creation is indispensable to poverty reduction, it is not sufficient in itself.Yes, it provides opportunities but it also threatens traditional values. As a result, localcommunities feel a compelling need to balance these global forces with greater controlover their lives, seeking inner strength through community empowerment.
In Thailand, itself engaged in a powerful process of democratization, this dialectic –between the global and the local – has been steadily growing, especially in the past twodecades. We understand the need to reconcile these sometimes-conflicting forces, andthe deeply felt need of people to assert their own interests and values. We know thatvalues and wisdom of all sorts exist in the Thai community and that these must beharnessed for the greater benefit of our society.
The challenge is how best to accomplish this and I believe that this report provides manyuseful insights. It is clear that community empowerment in Thailand means evolvingan entirely new enabling environment for rights and accountability, indeed, a whole newway of thinking. “The challenges of today’s problems, and tomorrow’s cannot be met withyesterday’s solutions, suitable as they may have been to yesterday’s problems.” This kind ofdevelopment is long-term work to which the Thai government is actively committed,inspired by His Majesty the King’s advice on self-reliance and sufficiency economy.
I have no doubt that many organizations will be moved and inspired by this particularReport. I believe it will assist understanding of the issue and create an opportunity for usall to support and promote community empowerment both as a means to, and as an endof human development.
(Thaksin Shinawatra)Prime Minister of Thailand
FOREWORD
iii
THAILAND HUMAN DEVELOPMENT REPORT 2003
PREFACE
Dr. Sippanondha Ketudat
Former Chairperson, the National Economic and Social Development BoardChairperson, Thailand Human Development Report 2003 Review Board
I was honoured and delighted to have the privilege of serving as Chairperson of theThailand Human Development Report for the second time.
Like all sequels, the challenge of the second issue is to be at least as good, if not better,than the first. The task is therefore not easier, but more difficult. But I must say that thedifficulty in producing this Report far exceeded my expectation.
This, I hope, says something about this Report. It is a product of much expectationexasperation, hard work, long-hours of debate, zigged-zagged and patchy progress,play-by-ear plans, several revisions, contention and compromise. In many ways, it reflectsthe state of play in community empowerment as well as other developments in Thailandright now.
As Chairperson of the Review Board, I shared the stewardship of this Report bynegotiating and balancing among different viewpoints, while ensuring that the Reportcan fairly represents community empowerment in Thailand.
As a Thai citizen who has served in the academic, public, private, and civil society sectors,I actively shared my ideas and experiences, and was heartened to observe that, whilethere were many points of divergence both at the philosophical and practical levels, somefundamentals have been unequivocally established, at least among the diverse groupsengaged in the drafting process.
Among these fundamentals is the general agreement that the changing complexities andneeds of our society far exceed the skills and capacity of any government, and that thesolutions often lie where the source of the problems were thought to lie – i.e. the people,especially rural communities.
These people, in spite of poverty and deprivation, have demonstrated that they have thecapacity to overcome adversities, especially structural and institutional barriers; to standon their own; to challenge the conventional practice with their local wisdom; and toextend a helping hand to their peers.
It is a revelation that is crucially important to the future of this country. It is my hope thatthe UNDP Report contributes to this empowering process by echoing different perceptions,ideas, stories, suggestions, and sharing them widely within and outside the country.
Finally, I hope that the Thailand Human Development Report 2003 will be read, discussed,challenged and enjoyed by all, including the communities – some of whom havecontributed their valuable time in making it possible.
Dr. Sippanondha Ketudat
iv
PREFACE FROM MR. J.K. ROBERT ENGLAND
PREFACE
Mr. J.K. Robert England
Resident Coordinator, United Nations System in ThailandResident Representative, United Nations Development Programme, Thailand
This is the second time that the UNDP is releasing a Thailand Human Development Report.This second Thailand Report joins a diverse family of such reports worldwide – prepared atthe national, sub-national and regional levels – which complement our global flagshippublication. Each such report seeks to throw light upon a particular dimension ofdevelopment, as seen from the vantage point of human – or people-centred-development.
UNDP has been supporting Thailand’s development efforts since 1955, almost fivedecades of close and productive partnership. As elsewhere, our work always has as itsprimary goal the promotion of sustainable human development of the sort that springsfrom national priorities and is shaped by the special circumstances and local needs ofThailand itself. We are fortunate in that Thailand is widely regarded as a remarkabledevelopment success story, and we hope our work has contributed in a modest way tothis success. Certainly, we ourselves have benefited immensely from the many lessonslearned through pioneering development initiatives undertaken by public, private, andcommunity organizations in this vibrant country.
Thailand is a fertile and exciting ground for community empowerment experiences, animportant dimension of the development process in many countries. In this country, thegovernment, the private sector, academia and the communities themselves have all beenactively involved in this dynamic process. They have variously engaged in studies andresearch, piloting exercises, comparing experiences, discovering best practices, learningand re-learning the meaning of community and community empowerment, documentingand sharing knowledge, institutionalizing changes to facilitate community empowerment.
It was for this reason that UNDP Thailand decided two years ago to make “communityempowerment” the focus of the second Thailand Human Development Report. In doingso, we decided to follow the cardinal rule of community empowerment: “the process is asimportant as the result”. The process of making a community empowerment reportshould also be empowering for the communities. Put another way, a report about thissubject would be hollow if it were not founded on the views and experiences ofcommunities themselves.
In the making of this Report, UNDP Thailand therefore provided a continuous forum foran active exchange of ideas and experiences. Contributors ranged from policy-makers,public officials, civil society leaders, academics, non-governmental development workers,and last but not least, community leaders from various regions.
It was a difficult, but very enriching experience. We were impressed by the diversity ofideas; the breath and depth of the debate; the spiritual and cultural underpinning ofthe Thai experience; and the passionate account of bitter but inspirational struggles forself-empowerment of community leaders over the last several decades. If the process ofpreparing this Report was an especially challenging experience, it was precisely becausethere is so much energy in the community empowerment sub-culture of Thailand.We hope this is captured in the Report itself.
v

THAILAND HUMAN DEVELOPMENT REPORT 2003
While so much has been accomplished in this area, the challenge is still formidable. One ofthe most important challenges is to negotiate between the force of globalization andlocalization, and to ensure that the communities have viable options and the capacity toexercise them in this increasingly globalized world. This should certainly not be seen asnecessarily in conflict: the communities themselves clearly wished to participate in andbenefit from the economic opportunities that globalization can foster. However, they donot wish their own culture and priorities to be swept aside in the process.
Another important challenge is that of decentralization. This dramatic shift in politicalpower in Thailand, hastened by and largely on course since the 1997 Constitution,represents another critical opportunity and challenge for community empowerment. Ifcarried out effectively, it will move the locus of decision-making as well as accountabilitycloser to the communities wherever possible, thus balancing the often impersonal forcesof globalization. However, such a change needs careful management and capacityenabling/building at the local level, if it is not to fall short of expectations and riskconsequent reversal.
But, I think the communities should be permitted to speak for themselves in this Report,and in the Kingdom. And I hope that this Report illuminates this dimension of develop-ment and contributes to a broad discussion on this score.
Mr. J.K. Robert England
Community empowerment through the making of theCommunity Empowerment Report
Community empowerment through the making of this Report took place through:
The participation of 4 community leaders not only in the preparation of Chapter 1 butalso in the regular meetings of the Review Board.
Community’s ownership of chapter 1 “The Communities’ View”. This chapter presentscommunity voices echoed through regional community forums, dialogues recorded andtranscribed and compiled by regional coordinators and advisors, and communities’ ownwritings.
Review of other chapters at the regional community forums.
Participation of 2 community leaders in editorial meetings.
The Report’s editing style that places the community’s view at the heart of the Report,and aligns other chapters around it.
vi
ACKNOWLEDGEMENTS
UNDP Thailand wishes to convey its profound gratitude to a number of individuals andinstitutions for making their valuable contribution to this Report.
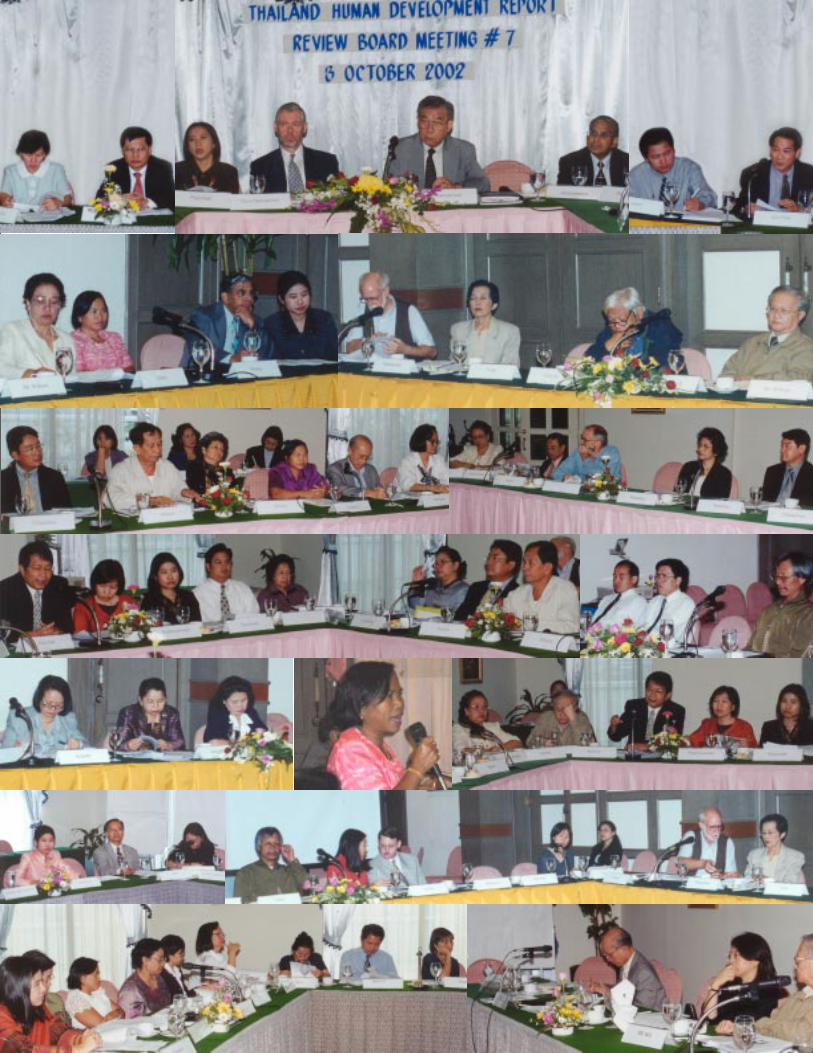
First and foremost, UNDP is indebted to Dr. Sippanondha Ketudat, Chairperson of theReview Board, who chaired 8 review board meetings, joined several consultative sessionsin Bangkok and upcountry, reviewed and provided valuable comments on the variousdrafts. Through his initiative and strong support, the drafting process became anempowering experience for all involved.
UNDP also wishes to thank NESDB for its interest and enthusiastic collaboration in thisexploration of community empowerment, as well as its engagement in the preparation ofthe Human Achievement Index (HAI) as a public policy instrument.
The Review Board itself was an active and engaged group of individuals and institutes.A full list of the Board’s membership follows these individual acknowledgements. At themeetings, the most prominent were the community representatives and their advisors,namely Khun Johni Odochao, Khun Jaidee Sawangarom, Khun Pranee Noanchan, Khun ViboonKhemchalerm, MR. Dr. Akin Rabibhadana, Dr. Chayan Vaddhanaphuti, Dr. Ken Kampe and KhunNisakorn Rabibhadana. This team was responsible for enriching the discussion by bringingstories, voices, poems, lyrics and songs from communities in the four regions to the Report,and the Review Board.
Among the most hard-working and hardest-hit were the contributors to the variouschapters and the draft translation namely Dr. Chartchai Na Chiangmai, Dr. KanittaKanjanarangsrinon and Khun Weeraboon Wisartsakul, Dr. Apichai Puntasen and Dr.Patamawadee Pochanukul Suzuki, Khun Sunantha Natenuj, and Dr. Chanida C. Bamford. Theyproduced draft after draft for review and comments, and endured the creative tensionswith grace and good spirit.
Efforts of various contributors would have gone to waste had it not been for the ingenuityof the principal editor – Dr. Chris Baker – who gave real meaning to the saying “the wholeis larger than the sum of its parts”. He was the main architect of the structure, style andanalysis of the report. Credit also goes to contributing editors, namely Dr. Jafar Javanand Dr. Apichai Puntasen, as well as Khun Pranee and Khun Jaidee – two communityrepresentatives who participated in the editorial meetings.
The Report also benefits considerably from top-notched expertise around the world.Prof. Robert Chambers gave valuable comments on the participatory drafting process.Dr. Charles Myers provided technical overview of the HAI. Mr. Marc-Andre Franche providedfeedbacks in the initial phase, while Ms. Saraswathi Memon, Ms. Sarah Burd-Sharps andMs. Cherie Hart volunteered comments to the near-final draft.
Last but not least, credit is due to many UNDP Thailand staff, who contributed to the process,including Khun Punnipa Ruangtorsak, Khun Walaitat Worakul, Dr. Ampai Harakunarak, KhunTongta Temboonkiat, Khun Sirisupa Kulthanan and Mr. Håkan Björkman. However, specialthanks should go to Mr. Alvaro Rodriguez who provided support and guidance throughoutand to Khun Parichart Siwaraksa, who not only contributed greatly to the substance of theReport but managed the process through 30 turbulent and argumentative months, duringwhich she never lost her cool or her belief in the value of the end product.
ACKNOWLEDGEMENTS vii
THAILAND HUMAN DEVELOPMENT REPORT 2003
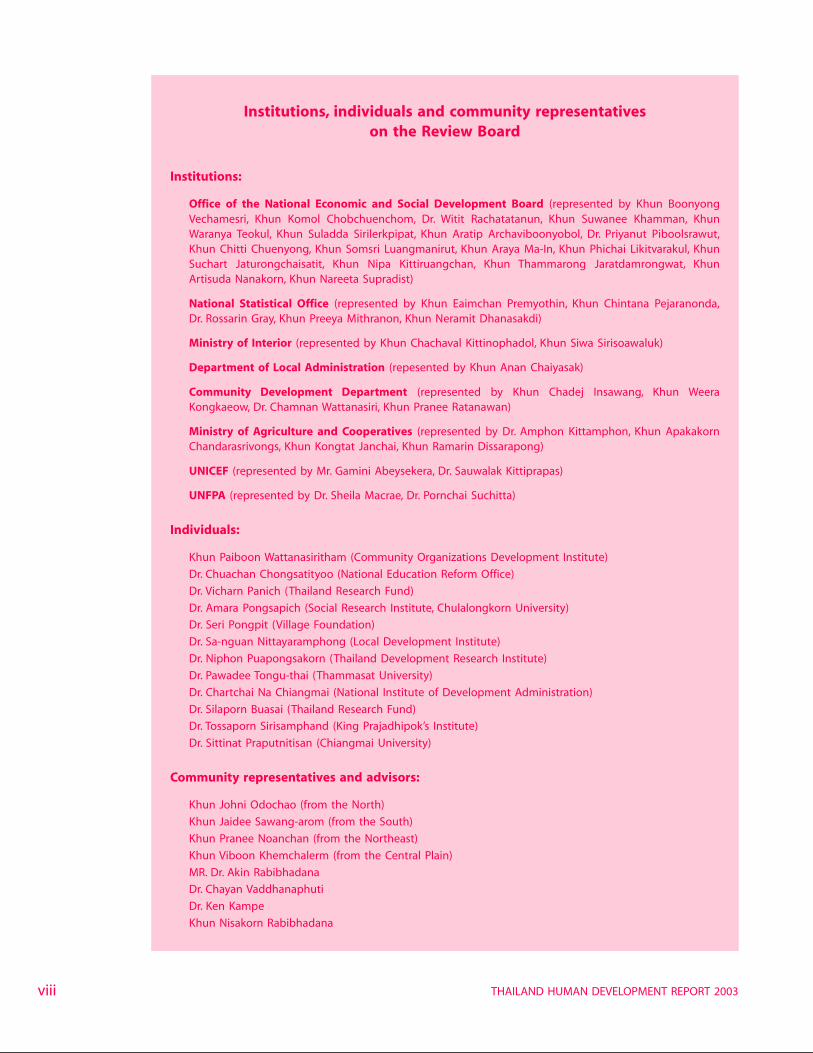
Institutions, individuals and community representativeson the Review Board
Institutions:
Office of the National Economic and Social Development Board (represented by Khun BoonyongVechamesri, Khun Komol Chobchuenchom, Dr. Witit Rachatatanun, Khun Suwanee Khamman, KhunWaranya Teokul, Khun Suladda Sirilerkpipat, Khun Aratip Archaviboonyobol, Dr. Priyanut Piboolsrawut,Khun Chitti Chuenyong, Khun Somsri Luangmanirut, Khun Araya Ma-In, Khun Phichai Likitvarakul, KhunSuchart Jaturongchaisatit, Khun Nipa Kittiruangchan, Khun Thammarong Jaratdamrongwat, KhunArtisuda Nanakorn, Khun Nareeta Supradist)
National Statistical Office (represented by Khun Eaimchan Premyothin, Khun Chintana Pejaranonda,Dr. Rossarin Gray, Khun Preeya Mithranon, Khun Neramit Dhanasakdi)
Ministry of Interior (represented by Khun Chachaval Kittinophadol, Khun Siwa Sirisoawaluk)
Department of Local Administration (repesented by Khun Anan Chaiyasak)
Community Development Department (represented by Khun Chadej Insawang, Khun WeeraKongkaeow, Dr. Chamnan Wattanasiri, Khun Pranee Ratanawan)
Ministry of Agriculture and Cooperatives (represented by Dr. Amphon Kittamphon, Khun ApakakornChandarasrivongs, Khun Kongtat Janchai, Khun Ramarin Dissarapong)
UNICEF (represented by Mr. Gamini Abeysekera, Dr. Sauwalak Kittiprapas)
UNFPA (represented by Dr. Sheila Macrae, Dr. Pornchai Suchitta)
Individuals:
Khun Paiboon Wattanasiritham (Community Organizations Development Institute)
Dr. Chuachan Chongsatityoo (National Education Reform Office)
Dr. Vicharn Panich (Thailand Research Fund)
Dr. Amara Pongsapich (Social Research Institute, Chulalongkorn University)
Dr. Seri Pongpit (Village Foundation)
Dr. Sa-nguan Nittayaramphong (Local Development Institute)
Dr. Niphon Puapongsakorn (Thailand Development Research Institute)
Dr. Pawadee Tongu-thai (Thammasat University)
Dr. Chartchai Na Chiangmai (National Institute of Development Administration)
Dr. Silaporn Buasai (Thailand Research Fund)
Dr. Tossaporn Sirisamphand (King Prajadhipok’s Institute)
Dr. Sittinat Praputnitisan (Chiangmai University)
Community representatives and advisors:
Khun Johni Odochao (from the North)
Khun Jaidee Sawang-arom (from the South)
Khun Pranee Noanchan (from the Northeast)
Khun Viboon Khemchalerm (from the Central Plain)
MR. Dr. Akin Rabibhadana
Dr. Chayan Vaddhanaphuti
Dr. Ken Kampe
Khun Nisakorn Rabibhadana
viii
ix
THAILAND HUMAN DEVELOPMENT REPORT 2003
OVERVIEW
THE POWER OF EMPOWERMENT
Human development is about improving people’s lives. It means more than increasingincomes or national wealth. It aims to expand the capability of people to live long,healthy and creative lives, to acquire knowledge, to have access to the resources neededfor a decent standard of living, and to enjoy dignity, self-respect, and the respect ofothers.
Many people in the world deserve better lives than they live today. Few would disagreewith that. But suppose we change the statement a little. Many people have the right tobetter lives than they live today. That’s a much more powerful idea. It’s the result ofjoining together the idea of human development and the commitment to human rights.As the Human Development Report 2000 stated: “Human rights express the bold idea that allpeople have claims to social arrangements that protect them from the worst abuses anddeprivations – and that secure the freedom for a life of dignity”. This approach makesdevelopment into a right which people can claim, rather than a gift bestowed by others.It’s an idea which empowers people to claim the right to development. That is why thethematic section of this Thailand Human Development Report is about empowerment.
There’s a second reason. We assume we know what a “better life” means – higherincome, greater security, better health, longer lives, fuller knowledge. The Human Deve-lopment Indices in Part II of this Report measure how well these goals are beingachieved. But in reality each person or each group of people has a perception of whata “better life” means. This perception may change over time. So the first step in
What is Community and What Communities?
Community is experience, feeling, relationships. It is not defined bygeography or by official rules. It is something which people feel theybelong to. It is a network of relationships. It can be big or small. It canchange over time. It can strengthen or decay.
Each community is unique. Some may be very egalitarian. Others not.Some may work by consensus. Others not. Some may be dominated by“influential” people. Others not. The variety is huge and defies generali-zation.
The community stories which appear in the following chapters come mostlyfrom villages and provincial towns. This reflects Thailand’s demography.The capital is the country’s only large city, and three-quarters of people livein the villages and provincial towns. But it is also a deliberate choice.There are also important urban communities but their characteristics, theirproblems, their organizational networks, and their relationships withgovernment are rather different. They deserve separate treatment. ThisReport focuses on the communities of the rural area and provincial towns.
empowerment is letting people determinetheir own development goals. Empower-ment is both a means and an end ofhuman development.
Part II of this Report contains maps andtables showing some key indicators ofhuman development in Thailand. TheHuman Achievement Index (HAI) is asummary of all these measures. It has astriking pattern. The provinces with thehighest scores are mostly grouped closeto the capital city of Bangkok. Those withthe lowest scores are mostly along theborders, at the farthest distance from thecapital. The pattern is far from exact anduniform. But it tells a story. In the past,power has been very centralized in thenational capital. The progress of humandevelopment has tended to reflect thepattern of power. The empowerment ofpeople is a way to reverse this trend.
Empowerment isboth a means and
an end of humandevelopment.
x
OVERVIEW
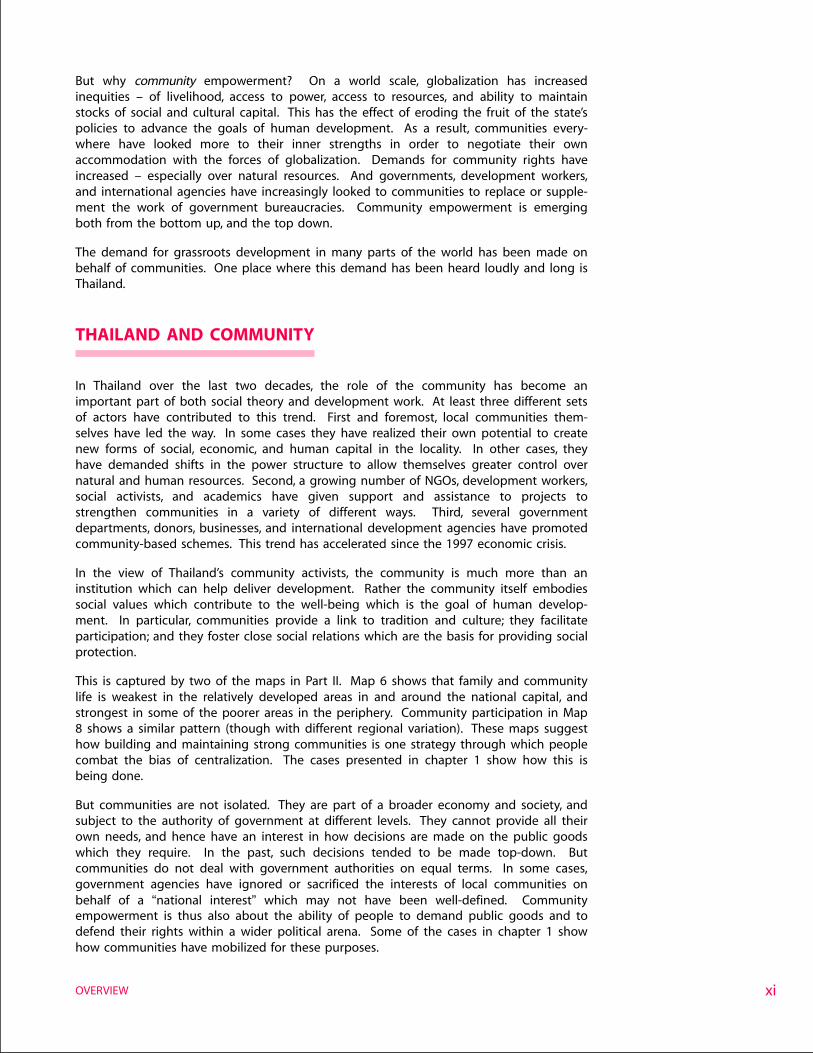
But why community empowerment? On a world scale, globalization has increasedinequities – of livelihood, access to power, access to resources, and ability to maintainstocks of social and cultural capital. This has the effect of eroding the fruit of the state’spolicies to advance the goals of human development. As a result, communities every-where have looked more to their inner strengths in order to negotiate their ownaccommodation with the forces of globalization. Demands for community rights haveincreased – especially over natural resources. And governments, development workers,and international agencies have increasingly looked to communities to replace or supple-ment the work of government bureaucracies. Community empowerment is emergingboth from the bottom up, and the top down.
The demand for grassroots development in many parts of the world has been made onbehalf of communities. One place where this demand has been heard loudly and long isThailand.
THAILAND AND COMMUNITY
In Thailand over the last two decades, the role of the community has become animportant part of both social theory and development work. At least three different setsof actors have contributed to this trend. First and foremost, local communities them-selves have led the way. In some cases they have realized their own potential to createnew forms of social, economic, and human capital in the locality. In other cases, theyhave demanded shifts in the power structure to allow themselves greater control overnatural and human resources. Second, a growing number of NGOs, development workers,social activists, and academics have given support and assistance to projects tostrengthen communities in a variety of different ways. Third, several governmentdepartments, donors, businesses, and international development agencies have promotedcommunity-based schemes. This trend has accelerated since the 1997 economic crisis.
In the view of Thailand’s community activists, the community is much more than aninstitution which can help deliver development. Rather the community itself embodiessocial values which contribute to the well-being which is the goal of human develop-ment. In particular, communities provide a link to tradition and culture; they facilitateparticipation; and they foster close social relations which are the basis for providing socialprotection.
This is captured by two of the maps in Part II. Map 6 shows that family and communitylife is weakest in the relatively developed areas in and around the national capital, andstrongest in some of the poorer areas in the periphery. Community participation in Map8 shows a similar pattern (though with different regional variation). These maps suggesthow building and maintaining strong communities is one strategy through which peoplecombat the bias of centralization. The cases presented in chapter 1 show how this isbeing done.
But communities are not isolated. They are part of a broader economy and society, andsubject to the authority of government at different levels. They cannot provide all theirown needs, and hence have an interest in how decisions are made on the public goodswhich they require. In the past, such decisions tended to be made top-down. Butcommunities do not deal with government authorities on equal terms. In some cases,government agencies have ignored or sacrificed the interests of local communities onbehalf of a “national interest” which may not have been well-defined. Communityempowerment is thus also about the ability of people to demand public goods and todefend their rights within a wider political arena. Some of the cases in chapter 1 showhow communities have mobilized for these purposes.
xi
THAILAND HUMAN DEVELOPMENT REPORT 2003
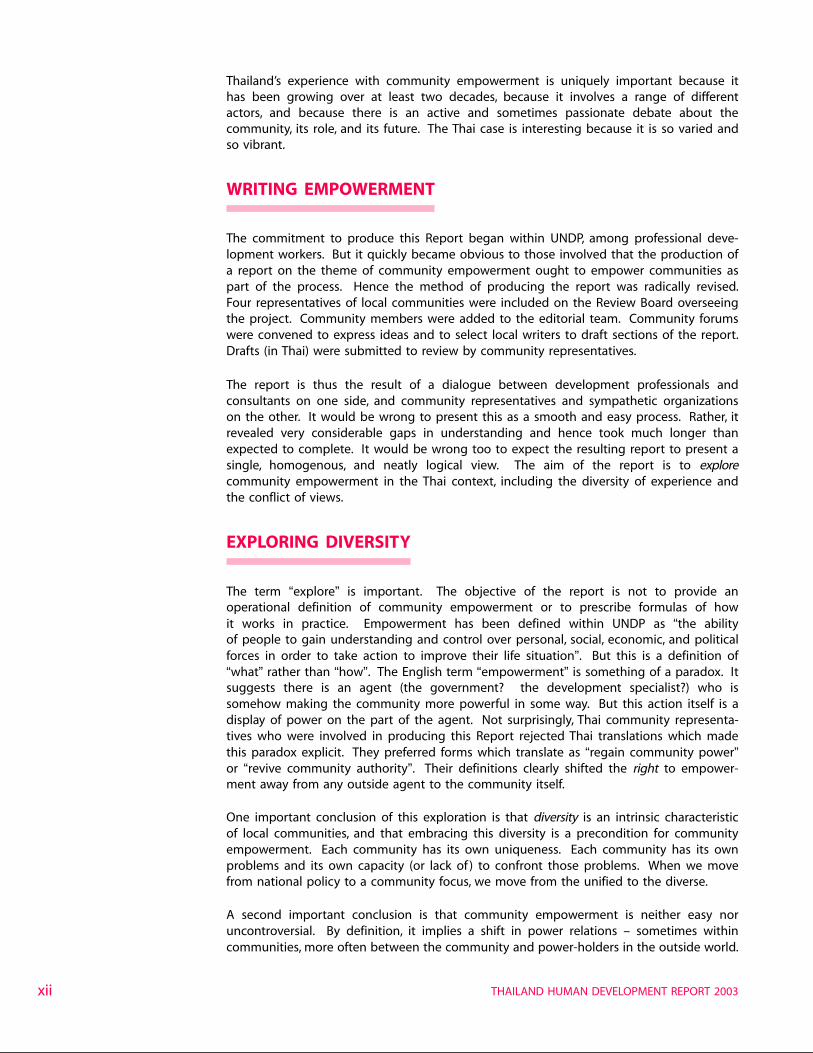
Thailand’s experience with community empowerment is uniquely important because ithas been growing over at least two decades, because it involves a range of differentactors, and because there is an active and sometimes passionate debate about thecommunity, its role, and its future. The Thai case is interesting because it is so varied andso vibrant.
WRITING EMPOWERMENT
The commitment to produce this Report began within UNDP, among professional deve-lopment workers. But it quickly became obvious to those involved that the production ofa report on the theme of community empowerment ought to empower communities aspart of the process. Hence the method of producing the report was radically revised.Four representatives of local communities were included on the Review Board overseeingthe project. Community members were added to the editorial team. Community forumswere convened to express ideas and to select local writers to draft sections of the report.Drafts (in Thai) were submitted to review by community representatives.
The report is thus the result of a dialogue between development professionals andconsultants on one side, and community representatives and sympathetic organizationson the other. It would be wrong to present this as a smooth and easy process. Rather, itrevealed very considerable gaps in understanding and hence took much longer thanexpected to complete. It would be wrong too to expect the resulting report to present asingle, homogenous, and neatly logical view. The aim of the report is to explorecommunity empowerment in the Thai context, including the diversity of experience andthe conflict of views.
EXPLORING DIVERSITY
The term “explore” is important. The objective of the report is not to provide anoperational definition of community empowerment or to prescribe formulas of howit works in practice. Empowerment has been defined within UNDP as “the abilityof people to gain understanding and control over personal, social, economic, and politicalforces in order to take action to improve their life situation”. But this is a definition of“what” rather than “how”. The English term “empowerment” is something of a paradox. Itsuggests there is an agent (the government? the development specialist?) who issomehow making the community more powerful in some way. But this action itself is adisplay of power on the part of the agent. Not surprisingly, Thai community representa-tives who were involved in producing this Report rejected Thai translations which madethis paradox explicit. They preferred forms which translate as “regain community power”or “revive community authority”. Their definitions clearly shifted the right to empower-ment away from any outside agent to the community itself.
One important conclusion of this exploration is that diversity is an intrinsic characteristicof local communities, and that embracing this diversity is a precondition for communityempowerment. Each community has its own uniqueness. Each community has its ownproblems and its own capacity (or lack of ) to confront those problems. When we movefrom national policy to a community focus, we move from the unified to the diverse.
A second important conclusion is that community empowerment is neither easy noruncontroversial. By definition, it implies a shift in power relations – sometimes withincommunities, more often between the community and power-holders in the outside world.
xii
OVERVIEW
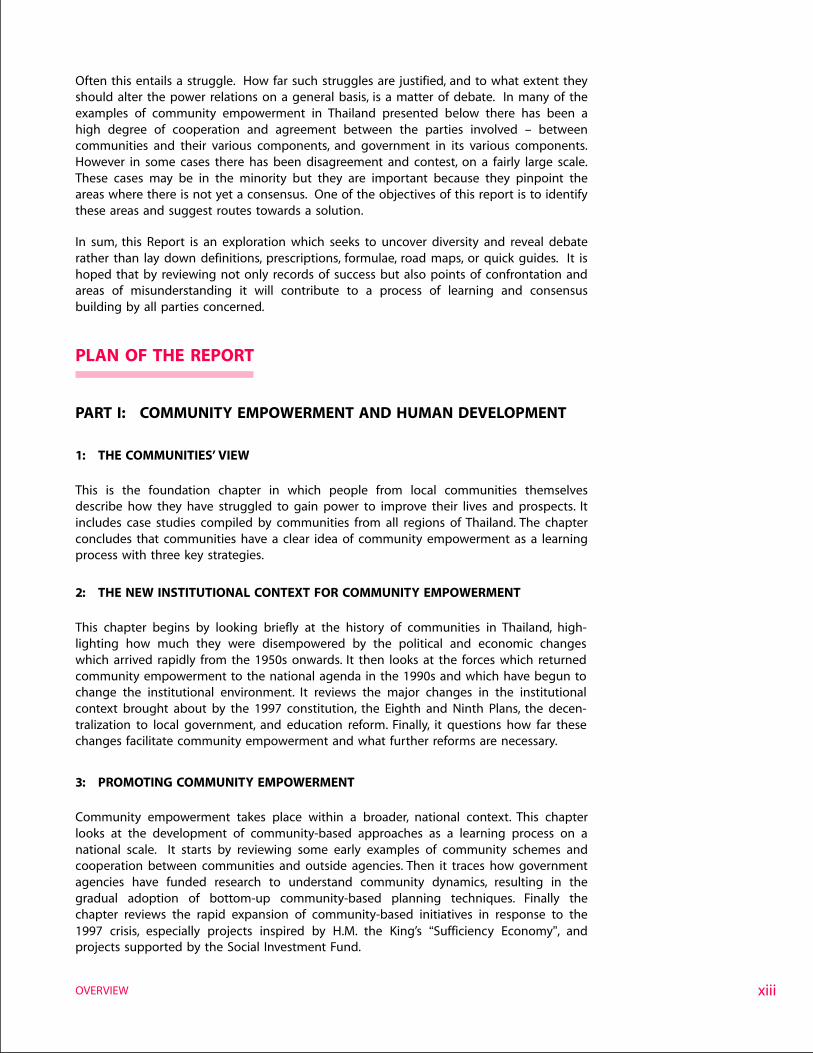
Often this entails a struggle. How far such struggles are justified, and to what extent theyshould alter the power relations on a general basis, is a matter of debate. In many of theexamples of community empowerment in Thailand presented below there has been ahigh degree of cooperation and agreement between the parties involved – betweencommunities and their various components, and government in its various components.However in some cases there has been disagreement and contest, on a fairly large scale.These cases may be in the minority but they are important because they pinpoint theareas where there is not yet a consensus. One of the objectives of this report is to identifythese areas and suggest routes towards a solution.
In sum, this Report is an exploration which seeks to uncover diversity and reveal debaterather than lay down definitions, prescriptions, formulae, road maps, or quick guides. It ishoped that by reviewing not only records of success but also points of confrontation andareas of misunderstanding it will contribute to a process of learning and consensusbuilding by all parties concerned.
PLAN OF THE REPORT
PART I: COMMUNITY EMPOWERMENT AND HUMAN DEVELOPMENT
1: THE COMMUNITIES’ VIEW
This is the foundation chapter in which people from local communities themselvesdescribe how they have struggled to gain power to improve their lives and prospects. Itincludes case studies compiled by communities from all regions of Thailand. The chapterconcludes that communities have a clear idea of community empowerment as a learningprocess with three key strategies.
2: THE NEW INSTITUTIONAL CONTEXT FOR COMMUNITY EMPOWERMENT
This chapter begins by looking briefly at the history of communities in Thailand, high-lighting how much they were disempowered by the political and economic changeswhich arrived rapidly from the 1950s onwards. It then looks at the forces which returnedcommunity empowerment to the national agenda in the 1990s and which have begun tochange the institutional environment. It reviews the major changes in the institutionalcontext brought about by the 1997 constitution, the Eighth and Ninth Plans, the decen-tralization to local government, and education reform. Finally, it questions how far thesechanges facilitate community empowerment and what further reforms are necessary.
3: PROMOTING COMMUNITY EMPOWERMENT
Community empowerment takes place within a broader, national context. This chapterlooks at the development of community-based approaches as a learning process on anational scale. It starts by reviewing some early examples of community schemes andcooperation between communities and outside agencies. Then it traces how governmentagencies have funded research to understand community dynamics, resulting in thegradual adoption of bottom-up community-based planning techniques. Finally thechapter reviews the rapid expansion of community-based initiatives in response to the1997 crisis, especially projects inspired by H.M. the King’s “Sufficiency Economy”, andprojects supported by the Social Investment Fund.
xiii
THAILAND HUMAN DEVELOPMENT REPORT 2003
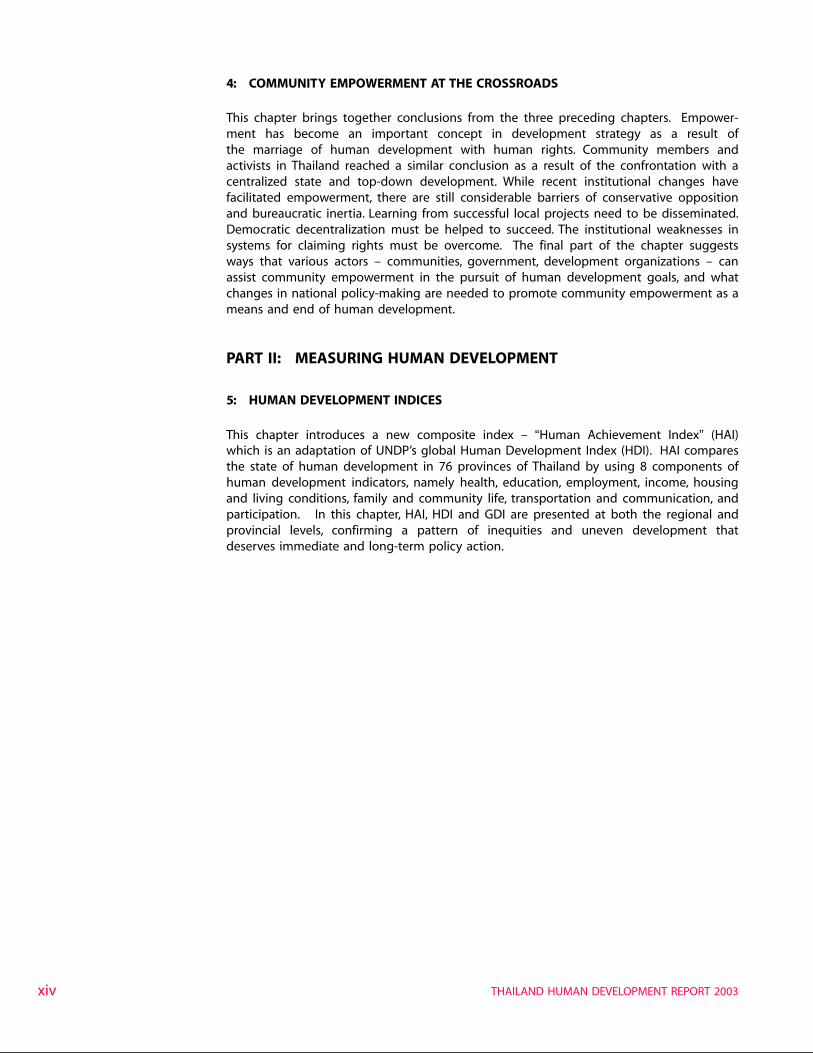
4: COMMUNITY EMPOWERMENT AT THE CROSSROADS
This chapter brings together conclusions from the three preceding chapters. Empower-ment has become an important concept in development strategy as a result ofthe marriage of human development with human rights. Community members andactivists in Thailand reached a similar conclusion as a result of the confrontation with acentralized state and top-down development. While recent institutional changes havefacilitated empowerment, there are still considerable barriers of conservative oppositionand bureaucratic inertia. Learning from successful local projects need to be disseminated.Democratic decentralization must be helped to succeed. The institutional weaknesses insystems for claiming rights must be overcome. The final part of the chapter suggestsways that various actors – communities, government, development organizations – canassist community empowerment in the pursuit of human development goals, and whatchanges in national policy-making are needed to promote community empowerment as ameans and end of human development.
PART II: MEASURING HUMAN DEVELOPMENT
5: HUMAN DEVELOPMENT INDICES
This chapter introduces a new composite index – “Human Achievement Index” (HAI)which is an adaptation of UNDP’s global Human Development Index (HDI). HAI comparesthe state of human development in 76 provinces of Thailand by using 8 components ofhuman development indicators, namely health, education, employment, income, housingand living conditions, family and community life, transportation and communication, andparticipation. In this chapter, HAI, HDI and GDI are presented at both the regional andprovincial levels, confirming a pattern of inequities and uneven development thatdeserves immediate and long-term policy action.
xiv
FOREWORD FROM THE PRIME MINISTER iii
PREFACE FROM DR. SIPPANONDHA KETUDAT iv
PREFACE FROM MR. J.K. ROBERT ENGLAND v
ACKNOWLEDGEMENTS vii
OVERVIEW x
PART I: COMMUNITY EMPOWERMENT AND HUMAN DEVELOPMENT
CHAPTER 1: The Communities’ view 3
Introduction: Writing this Chapter 3
Confronting Development in Thailand’s Ricebowl: Learning Self-Reliance 3
Community Learning: The Bank of Life Network 9
Negotiating Cooperation to Clean a River 11
Building Networks: The People Live, the Canal Lives 12
Rediscovering Local Knowledge in the Highlands 15
Expanding Social Space to Reclaim the Mun River 20
Conclusion: Strategies of Empowerment 25
CHAPTER 2: The new institutional context for communityempowerment 27
Centralization and Top-down Development 27
Community Histories and Institutional Change 29
The age of abundance 29
The coming of development 29
New ideas and organizations 30
Boom, crisis, and reform 31
Institutional Shifts I: The 1997 Constitution 36
New rights for the community 36
New directives for greater participation 37
New institutions for democracy 37
Institutional Shifts II: The Eighth and Ninth Plans 38
Eighth Plan: people-centred development 38
Ninth Plan: sufficiency economy 38
CONTENTS
CONTENTS xv
THAILAND HUMAN DEVELOPMENT REPORT 2003
CONTENTS
Institutional Shifts III: Democratic Decentralization 40
From centralization to contractors’ councils 40
Emergence of the TAO 40
Institutional Shifts IV: Education Reform 41
Critiquing the system 41
From critique to reform 41
Education reform and the community 42
Problems and Issues 42
The 1997 Constitution’s unfinished business 43
Ninth Plan: sufficiency economy vs. growth 44
Decentralization: patronage or participation? 44
Education reform: a long struggle? 45
Conclusion 46
CHAPTER 3: Promoting Community Empowerment 47
A Learning Process on a National Scale 47
Community Schemes for Empowerment 48
Savings and credit 48
Protecting the environment 48
Communities and Outside Agencies 49
Business and community 49
Community, NGO, international agencies and government 50
Understanding Community Empowerment 51
Researching the community 51
Learning and planning 52
Planning for Community Empowerment 53
New problem-solving paradigm 53
Exercises in community planning 53
Community-based Crisis Relief 56
“Sufficiency Economy” projects 56
Community participation 57
Social Investment Fund (SIF) 57
Thai Rak Thai government’s village projects 59
Conclusion 61
xvi
CONTENTS
CONTENTS
CHAPTER 4: Community Empowerment at the Crossroads 63
Why Empowerment? 63
Human development and human rights 63
Why Community? 64
Development and disempowerment 64
Civil society and community 65
Empowerment as a learning process 65
What is Empowerment? 66
1. Building their community power to solve problemsindependently 67
2. Building their community power to negotiate cooperationwith outside agencies 67
3. Building their community power and networks to claimand protect community rights 68
Enhancing Community Empowerment 69
1. Solving problems internally: accelerating learning fromexperience 69
2. Negotiating cooperation with outside agencies:making decentralization work 70
3. Claiming community rights: improving the institutions 72
Building an Enabling Environment for Community Empowerment 72
Maintaining the momentum of political reform 73
Ensuring the provision of public goods is responsive to people’s needs 74
Reforming the public sector for empowerment 74
Reforming education for empowerment 74
Putting judicial reform on the national agenda 75
Refocusing on poverty alleviation through empowerment 75
Tackling gender bias 75
Managing the environment 76
Managing globalization for empowerment 77
Concluding Remarks: Looking Ahead 77
Varieties of empowerment 77
Community and globalization 78
Empowerment as learning process 78
Community empowerment in social context 79
Opportunity and risk 79
xvii
THAILAND HUMAN DEVELOPMENT REPORT 2003
CONTENTS
PART II: MEASURING HUMAN DEVELOPMENT
CHAPTER 5: Human Development Indices 83
Introduction to Human Achievement Index (HAI) 83
HAI characteristics 84
HAI concept and structure 84
HAI methodology 84
Data sources 88
Gender disaggregated data 88
HAI’s eight indices 89
1. Health Index 89
2. Education Index 91
3. Employment Index 94
4. Income Index 96
5. Housing and Living Conditions Index 98
6. Family and Community Life Index 100
7. Transportation and Communication Index 102
8. Participation Index 104
Composite HAI 106
Human Development Index (HDI) 112
Gender-related Development Index (GDI) 112
A Regional overview: HAI, HDI, GDI 114
Conclusion 115
STATISTICAL ANNEX
Technical notes on HDI and GDI 119
Data sources 122
Data tables 126
xviii
COMMUNITY EMPOWERMENT AND
HUMAN DEVELOPMENT
P A R T I

THAILAND HUMAN DEVELOPMENT REPORT 20032
3
The strength of people and com-munities at the grassroots is thestrength of the nation.
– Wibun Khemchaloem
INTRODUCTION:WRITING THIS CHAPTER
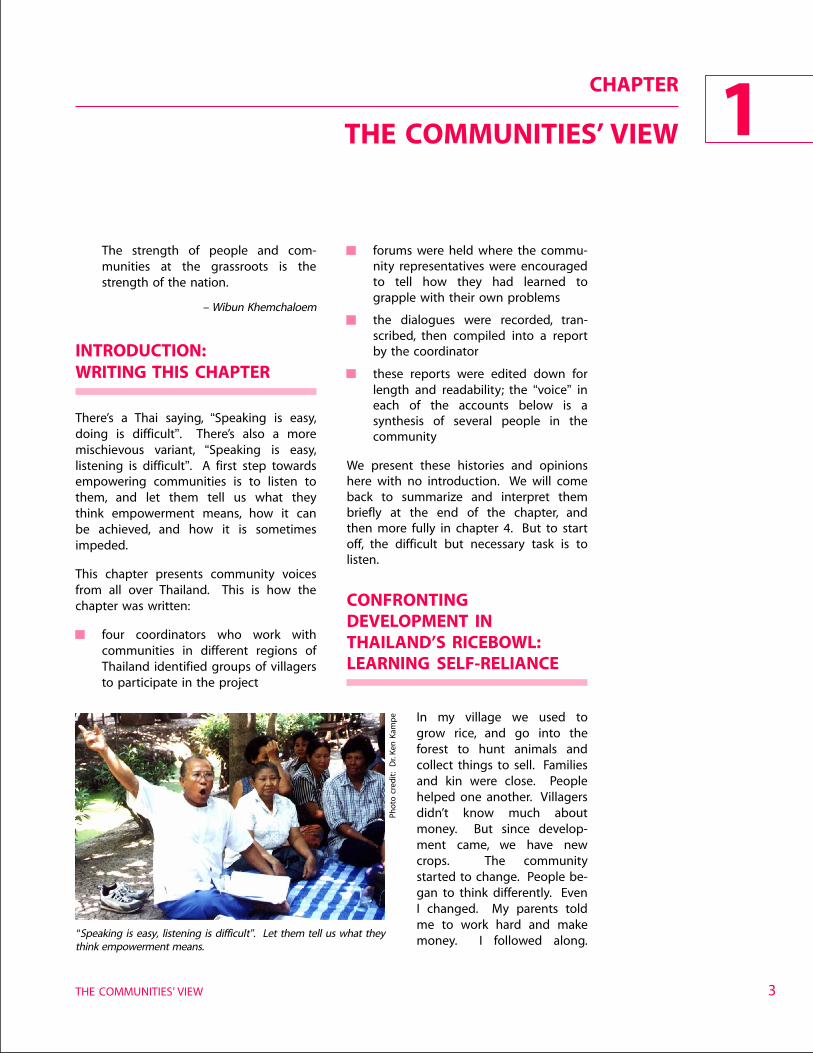
There’s a Thai saying, “Speaking is easy,doing is difficult”. There’s also a moremischievous variant, “Speaking is easy,listening is difficult”. A first step towardsempowering communities is to listen tothem, and let them tell us what theythink empowerment means, how it canbe achieved, and how it is sometimesimpeded.
This chapter presents community voicesfrom all over Thailand. This is how thechapter was written:
four coordinators who work withcommunities in different regions ofThailand identified groups of villagersto participate in the project
CHAPTER
THE COMMUNITIES’ VIEW 1
forums were held where the commu-nity representatives were encouragedto tell how they had learned tograpple with their own problems
the dialogues were recorded, tran-scribed, then compiled into a reportby the coordinator
these reports were edited down forlength and readability; the “voice” ineach of the accounts below is asynthesis of several people in thecommunity
We present these histories and opinionshere with no introduction. We will comeback to summarize and interpret thembriefly at the end of the chapter, andthen more fully in chapter 4. But to startoff, the difficult but necessary task is tolisten.
CONFRONTINGDEVELOPMENT INTHAILAND’S RICEBOWL:LEARNING SELF-RELIANCE
THE COMMUNITIES’ VIEW
“Speaking is easy, listening is difficult”. Let them tell us what theythink empowerment means.
In my village we used togrow rice, and go into theforest to hunt animals andcollect things to sell. Familiesand kin were close. Peoplehelped one another. Villagersdidn’t know much aboutmoney. But since develop-ment came, we have newcrops. The communitystarted to change. People be-gan to think differently. EvenI changed. My parents toldme to work hard and makemoney. I followed along.
Pho
to c
red
it:
Dr.
Ken
Kam
pe
THAILAND HUMAN DEVELOPMENT REPORT 20034
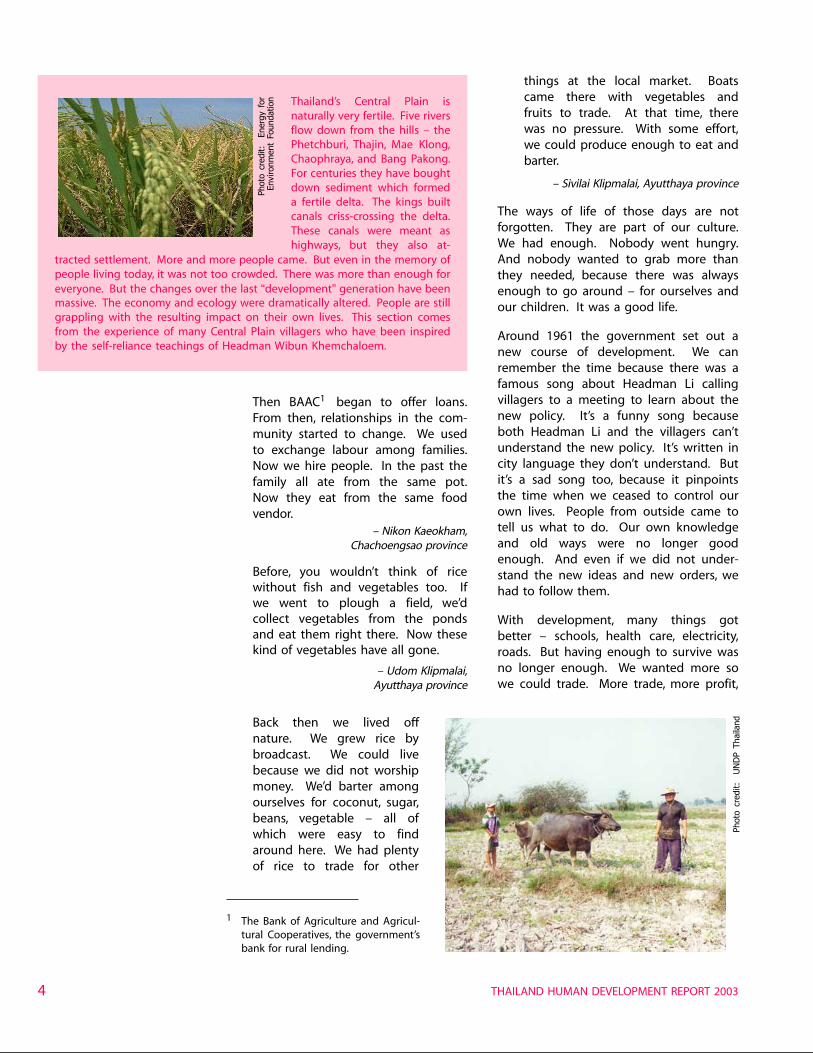
Thailand’s Central Plain isnaturally very fertile. Five riversflow down from the hills – thePhetchburi, Thajin, Mae Klong,Chaophraya, and Bang Pakong.For centuries they have boughtdown sediment which formeda fertile delta. The kings builtcanals criss-crossing the delta.These canals were meant ashighways, but they also at-
Then BAAC1 began to offer loans.From then, relationships in the com-munity started to change. We usedto exchange labour among families.Now we hire people. In the past thefamily all ate from the same pot.Now they eat from the same foodvendor.
– Nikon Kaeokham,Chachoengsao province
Before, you wouldn’t think of ricewithout fish and vegetables too. Ifwe went to plough a field, we’dcollect vegetables from the pondsand eat them right there. Now thesekind of vegetables have all gone.
– Udom Klipmalai,Ayutthaya province
tracted settlement. More and more people came. But even in the memory ofpeople living today, it was not too crowded. There was more than enough foreveryone. But the changes over the last “development” generation have beenmassive. The economy and ecology were dramatically altered. People are stillgrappling with the resulting impact on their own lives. This section comesfrom the experience of many Central Plain villagers who have been inspiredby the self-reliance teachings of Headman Wibun Khemchaloem.
things at the local market. Boatscame there with vegetables andfruits to trade. At that time, therewas no pressure. With some effort,we could produce enough to eat andbarter.
– Sivilai Klipmalai, Ayutthaya province
The ways of life of those days are notforgotten. They are part of our culture.We had enough. Nobody went hungry.And nobody wanted to grab more thanthey needed, because there was alwaysenough to go around – for ourselves andour children. It was a good life.
Around 1961 the government set out anew course of development. We canremember the time because there was afamous song about Headman Li callingvillagers to a meeting to learn about thenew policy. It’s a funny song becauseboth Headman Li and the villagers can’tunderstand the new policy. It’s written incity language they don’t understand. Butit’s a sad song too, because it pinpointsthe time when we ceased to control ourown lives. People from outside came totell us what to do. Our own knowledgeand old ways were no longer goodenough. And even if we did not under-stand the new ideas and new orders, wehad to follow them.
With development, many things gotbetter – schools, health care, electricity,roads. But having enough to survive wasno longer enough. We wanted more sowe could trade. More trade, more profit,
1 The Bank of Agriculture and Agricul-tural Cooperatives, the government’sbank for rural lending.
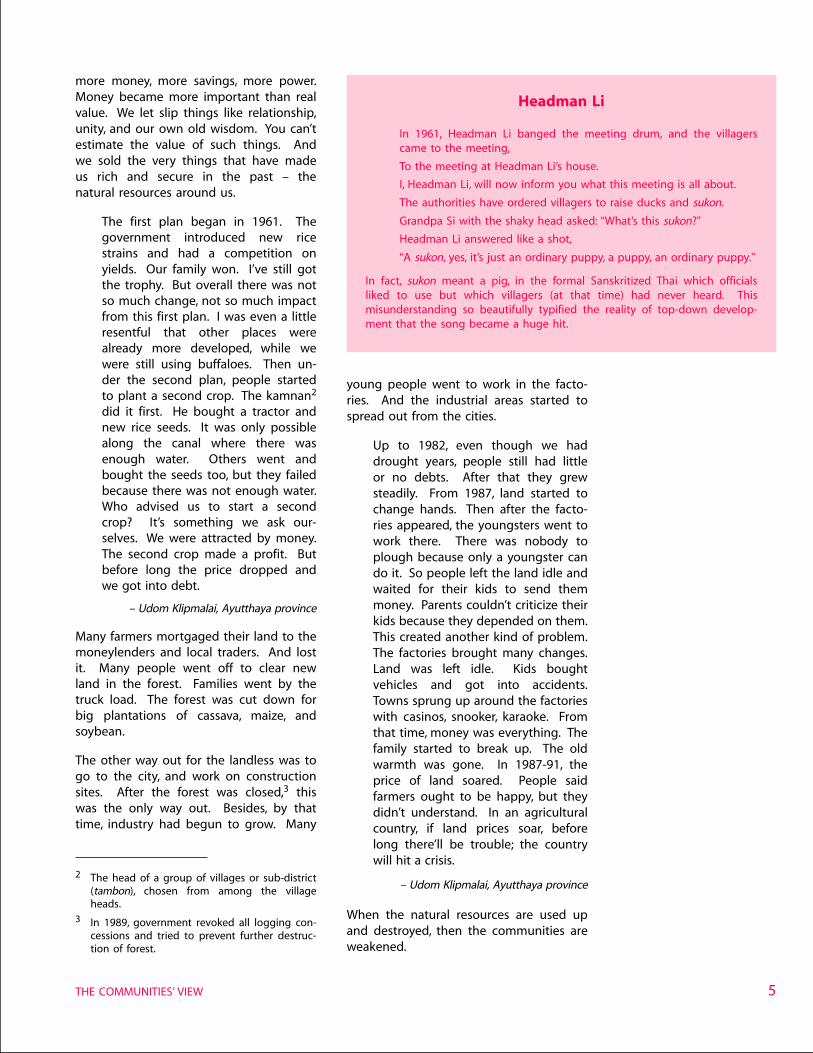
Back then we lived offnature. We grew rice bybroadcast. We could livebecause we did not worshipmoney. We’d barter amongourselves for coconut, sugar,beans, vegetable – all ofwhich were easy to findaround here. We had plentyof rice to trade for other
Phot
o cr
edit:
En
ergy
for
Envi
ronm
ent
Foun
datio
n
Phot
o cr
edit:
U
ND
P Th
aila
nd
5
more money, more savings, more power.Money became more important than realvalue. We let slip things like relationship,unity, and our own old wisdom. You can’testimate the value of such things. Andwe sold the very things that have madeus rich and secure in the past – thenatural resources around us.
The first plan began in 1961. Thegovernment introduced new ricestrains and had a competition onyields. Our family won. I’ve still gotthe trophy. But overall there was notso much change, not so much impactfrom this first plan. I was even a littleresentful that other places werealready more developed, while wewere still using buffaloes. Then un-der the second plan, people startedto plant a second crop. The kamnan2
did it first. He bought a tractor andnew rice seeds. It was only possiblealong the canal where there wasenough water. Others went andbought the seeds too, but they failedbecause there was not enough water.Who advised us to start a secondcrop? It’s something we ask our-selves. We were attracted by money.The second crop made a profit. Butbefore long the price dropped andwe got into debt.
– Udom Klipmalai, Ayutthaya province
Many farmers mortgaged their land to themoneylenders and local traders. And lostit. Many people went off to clear newland in the forest. Families went by thetruck load. The forest was cut down forbig plantations of cassava, maize, andsoybean.
The other way out for the landless was togo to the city, and work on constructionsites. After the forest was closed,3 thiswas the only way out. Besides, by thattime, industry had begun to grow. Many
2 The head of a group of villages or sub-district(tambon), chosen from among the villageheads.
3 In 1989, government revoked all logging con-cessions and tried to prevent further destruc-tion of forest.
young people went to work in the facto-ries. And the industrial areas started tospread out from the cities.
Up to 1982, even though we haddrought years, people still had littleor no debts. After that they grewsteadily. From 1987, land started tochange hands. Then after the facto-ries appeared, the youngsters went towork there. There was nobody toplough because only a youngster cando it. So people left the land idle andwaited for their kids to send themmoney. Parents couldn’t criticize theirkids because they depended on them.This created another kind of problem.The factories brought many changes.Land was left idle. Kids boughtvehicles and got into accidents.Towns sprung up around the factorieswith casinos, snooker, karaoke. Fromthat time, money was everything. Thefamily started to break up. The oldwarmth was gone. In 1987-91, theprice of land soared. People saidfarmers ought to be happy, but theydidn’t understand. In an agriculturalcountry, if land prices soar, beforelong there’ll be trouble; the countrywill hit a crisis.
– Udom Klipmalai, Ayutthaya province
When the natural resources are used upand destroyed, then the communities areweakened.
Headman Li
In 1961, Headman Li banged the meeting drum, and the villagerscame to the meeting,
To the meeting at Headman Li’s house.
I, Headman Li, will now inform you what this meeting is all about.
The authorities have ordered villagers to raise ducks and sukon.
Grandpa Si with the shaky head asked: “What’s this sukon?”
Headman Li answered like a shot,
“A sukon, yes, it’s just an ordinary puppy, a puppy, an ordinary puppy.”
In fact, sukon meant a pig, in the formal Sanskritized Thai which officialsliked to use but which villagers (at that time) had never heard. Thismisunderstanding so beautifully typified the reality of top-down develop-ment that the song became a huge hit.
THE COMMUNITIES’ VIEW
THAILAND HUMAN DEVELOPMENT REPORT 20036
Development made people lose theirconfidence in themselves. We’re told ourold ways and our old knowledge aren’tgood enough any more. The local wis-dom and the knowledge passed downfrom generation to generation are beingdestroyed. The knowledge of dharma4
which teaches us to rely on ourselves isalso being lost. The education systemactually helps destroy the old knowledge.Education has been designed to producepeople for industry. Learning has becomesomething that is bought and sold.Education is an investment and investorswant to get a return on their money.So people who go through schoolsjust end up like cogs in the industrialmachine – sometimes without even realiz-ing it.
Our capability is actually going downbecause our self-confidence is ebbingaway. In the end we won’t know any-thing. We have to start relearning thingsso we can strengthen our communities.We have to think how the communitycan regain its self-confidence to tackleproblems, and rely on itself rather thanwaiting for help and sympathy fromothers.
I didn’t come to this decision bychoice. I simply had nobody else torely on so I decided to rely on myself.
– Wibun Khemchaloem
Other farmers don’t need to waituntil they are in such dire straits asI was. They should act now. Self-reliance is easy to preach but difficultto do. But it’s worth the effort. Wehave to survive, but with dignity too.
The first stage is to make a plan.When we define the problems weface, we find some can be solvedwithin the family, but others can besolved only within the community asa whole.
The second stage is to look for theinformation we need for makingdecisions and reducing the risk offailure. For some information, weneed to look outside the community.We have to go looking for newinformation and be prepared to testand experiment. These are the mainareas to cover.
1. Rice is the staple of the regionso this has to be the starting point.We tend to think of rice as just rice.But there are over 30,000 differentstrains to choose, and over 2,000ways to use the plant, not onlythe cooked grain but the husk,bran, stalk, leaf, flower, and root.
4 Buddhist teachings.
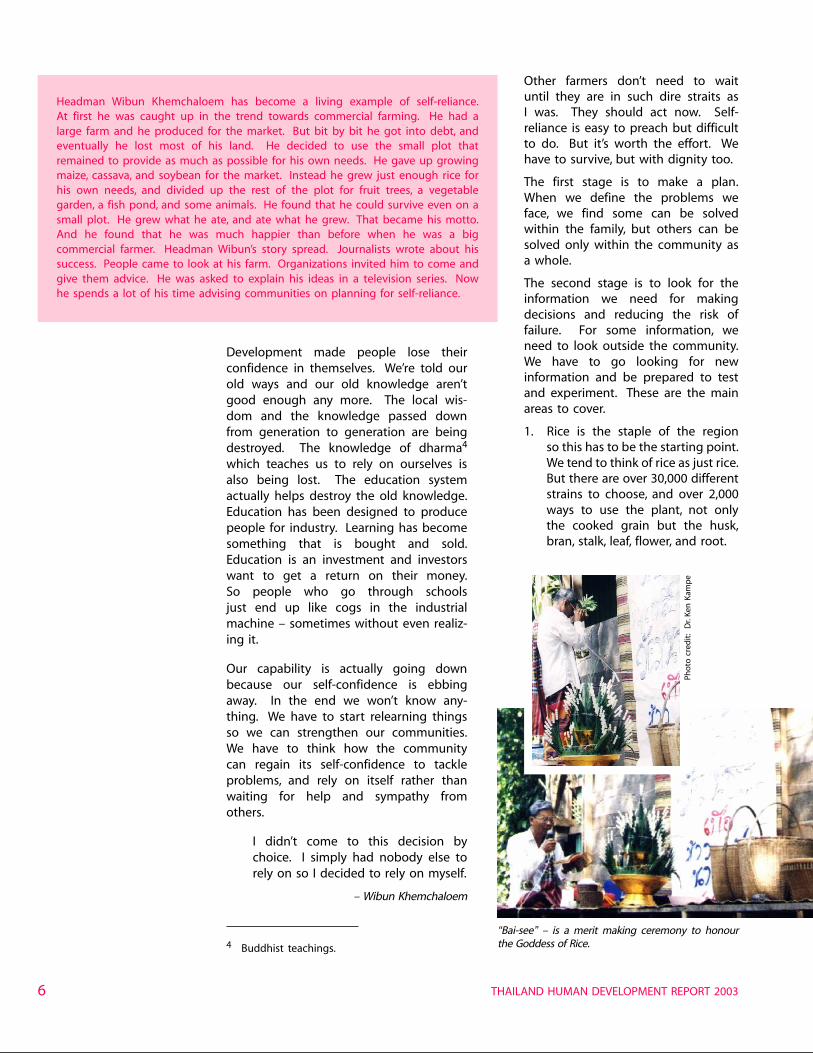
Headman Wibun Khemchaloem has become a living example of self-reliance.At first he was caught up in the trend towards commercial farming. He had alarge farm and he produced for the market. But bit by bit he got into debt, andeventually he lost most of his land. He decided to use the small plot thatremained to provide as much as possible for his own needs. He gave up growingmaize, cassava, and soybean for the market. Instead he grew just enough rice forhis own needs, and divided up the rest of the plot for fruit trees, a vegetablegarden, a fish pond, and some animals. He found that he could survive even on asmall plot. He grew what he ate, and ate what he grew. That became his motto.And he found that he was much happier than before when he was a bigcommercial farmer. Headman Wibun’s story spread. Journalists wrote about hissuccess. People came to look at his farm. Organizations invited him to come andgive them advice. He was asked to explain his ideas in a television series. Nowhe spends a lot of his time advising communities on planning for self-reliance.
“Bai-see” – is a merit making ceremony to honourthe Goddess of Rice.
Pho
to c
red
it:
Dr.
Ken
Kam
pe
7
year. As much as 72 per cent of theexpenses were inputs like fertilizer, chemi-cals, and gasoline that had to be boughtfrom outside the community. We knewthat raising the income would be difficult.We had to find another way.
The learning process began with the foun-dation of a savings fund. It was a way toget people to join together, exchangeknowledge, and understand one another’sproblems. After a year, villagers realizedthat one important problem was thatsome people did not have enough rice toeat and so had to devote some of theirtime to earning wages. The solution wasto set up a rice welfare fund. There’san old belief that you shouldn’t sell yourold stock of rice until the new crop isharvested. The villagers who kept to thisbelief had stocks which they put in thiswelfare fund.
Next was a scheme to preserve andmanage the community forest. We had torelearn old wisdom about the value offood and medicinal plants from the forest.Then we had a fish scheme – a ban onfishing during the breeding season – andnow the overall catch is much larger. Wehad to think up new customs. For in-stance, having a merit-making ceremonyfor fish that have been poisoned, andplanting twenty trees whenever a childis born. Also we made a point of usingorganic fertilizer, raising buffaloes toreduce production costs and restore theenvironmental balance, thinking up ways
2. Other food can come from manydifferent places. We can plantcrops. We can gather manythings from the forest, from theedges of the fields, from ponds.We can preserve foods in variousways.
3. Sickness is a fact of life. Someailments we should prepare tocope with on our own. Othersare more complex and we haveto organize ways to deal withthem at the community level.
4. We need tools and equipment,and a lot of these we can easilyfind from nature around us –fabrics, dyes, wood for tools andfurniture. Beyond these basics,we should develop our abilitiesto make things rather than sim-ply buying them.
5. The land is important. We needto understand natural ways toincrease its fertility so that wecan live in harmony with theland.
These are the basic principles. Oncethese are understood, the next stageis developing the communitythrough participation to create acommon learning process.
If a community can develop itscapacity to learn as a process with adefinite direction, then the commu-nity will recover the confidence todevelop its own strength and capa-bility. Bit by bit we can rebuild fromthe community, to the society of the
5 At the time of writing, US$ 1 is approximately42 Baht.
Central region, and then the na-tion. The strength of people andcommunities at the grassroots isthe strength of the nation.
– Wibun Khemchaloem
The villagers in Tha Kradan sub-district are an example of HeadmanWibun’s ideas in practice. Theystarted by making a survey whichshowed that the 168 households hadan average income from rice, maize,soybean, and sesame of 45,000 Baht5
a year, but expenses of 75,000 Baht a
THE COMMUNITIES’ VIEW
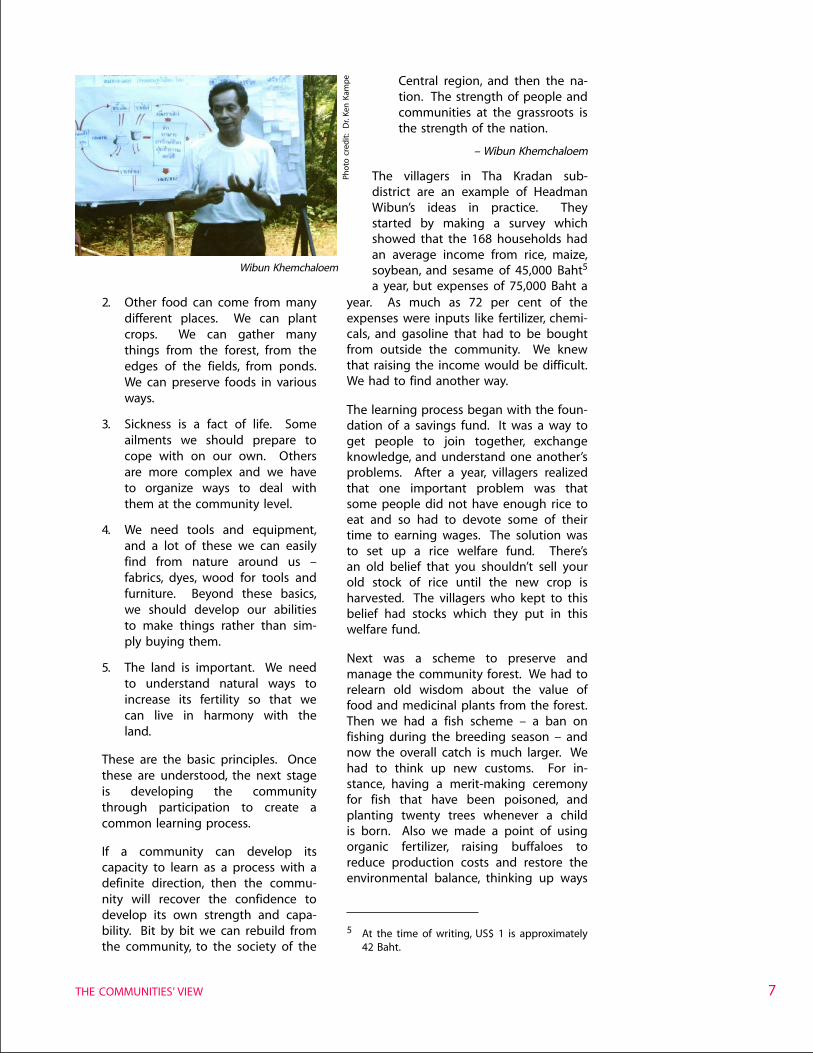
Wibun Khemchaloem
Pho
to c
red
it:
Dr.
Ken
Kam
pe
THAILAND HUMAN DEVELOPMENT REPORT 20038
to process and preserve agricultural pro-duce, and making things to replace itemspurchased from outside like detergent,shampoo, toothpaste, and drinking water.
In July 1996 I had the chance tostay at Headman Wibun’s place.We talked about many things. Headvised me to review my incomeand spending. So I started keepingaccounts. When I added things upafter one year, I understood why Iwas in debt. Our little family eatsthree times a day for 365 days a yearat 20 baht a time, which works out as21,990 baht for the year. How manyrai6 of maize do we have to grow topay for that? And we haven’t startedtalking about tobacco, alcohol, schoolfees, and other outgoings.
So I stopped growing maize, andplanted vegetables and trees. I greweverything I ate, and ate everything Igrew. With 40 to 50 rai of maize Icouldn’t stay out of debt, but withonly a little land we had enough toeat. At the beginning, my wife arguedagainst it, and so did the friends Iused to drink with. But when I grewpapaya, they came to buy them fromme. In 1997, I gave up drinking andsmoking and encouraged my friendsto form a group to think aboutdeveloping the village. We drew up aplan. We knew it had two possibleoutcomes – survive or die. But wealso knew that if we didn’t followa plan, there was only one possibleoutcome. So, no choice. The govern-ment has lots of projects for us to do.But it has never had a project to helpus think about what to do.
– Liam Butjantha,Chachoengsao province
A strong community does not arise justlike that. It starts from learning, fromanalysing ourselves so we understand thesource of our problems, so we realize thevalue and the wisdom of all sorts thatexists in the community. Then we canfine-tune that wisdom for today’s world
in order to solve very basic problems.Sustainable agriculture is the foundation.It provides enough to live. It must fit inwith the environment and resources whichare the common property of the com-munity. It should not harm our health butrather strengthen it. Once we haveenough for ourselves then we can thinkabout selling what’s left over. But weshould not be selling raw materials. Weshould find ways to develop products bysetting up family industries or communityindustries. We need to save up our owncapital so that we rely as little as possibleon outside capital. We should have ourown system of community welfare.
It starts from asking ourselves how wewant to manage our lives, and how wecan join together as a community orlocality. We have to learn and be creativeto make systems that are right for thecommunity.
I started discussing with friends andrelatives. At first nobody believedme because there was no concreteresult. Now it’s easier. A member ofour savings group had a motorcycleaccident. I went and paid the medi-cal bill from our welfare fund. Thatmade people believe that a young-ster like me could do things. Noneed to wait until the oboto7 getsset up. We’ve been waiting for agesalready. Our group just decided todo it. We’d make mistakes but wecould put them right. We have tofocus on the main problem: how tomake everyone self-reliant. We haveto eat every day but we don’t haveincome every day. So I realized wehad to build a secure foundation byfirst reducing expenses as much aspossible.
I once asked a waitress why sheworked in a restaurant. She said shedidn’t want to work in the fields. Shewas afraid of worms and centipedes.I thought of my own daughter. If we
6 A rai is 0.16 hectare.
7 Oboto is the Thai abbreviation for the Tambon(sub-district) Administrative Organization(TAO). This new level of local government isconsidered in chapter 2.
9
don’t know how to manage ourchildren, then they will turn out likethat. I can’t abandon farming be-cause it’s my livelihood. But we needto create the conditions which willallow us to survive. As a family andas a nation, we need to plan ahead.
I’ve come to realize the value of ournatural resources. I’m beginning tounderstand how to manage thingsand I’m not afraid of problems. Also,I’m not ashamed of having been abuffalo boy because now buffaloesare even more expensive than cars.Besides, they don’t need petrol orrepairs. Nature has taught me to besmart and strong. Otherwise Icouldn’t survive.
– Nikon Kaeokham,Chachoengsao province
Community empowerment starts withlearning and especially with learningabout ourselves. We have to look atourselves and our communities, researchthe origin of our problems, rediscover theold wisdom in the community. Revivinglocal wisdom is a way to start a learningprocess in the community, to trigger amovement for change towards self-reliance, survival with dignity, andindependent decision-making. The threebasics are people, natural resources, andwisdom or local knowledge. The threeaspects of the learning process are: know-ing how to know, knowing how to useexisting knowledge, and knowing how torelate with nature. Local knowledge fromthe past gives us the confidence that theavailable natural resources can supportour livelihood, build society, and preservelocal culture. With this confidence we canbegin to learn new things too. This iscommunity empowerment.
COMMUNITY LEARNING:THE BANK OF LIFE NETWORK
We didn’t have money, but hadeverything else. We bartered. Lateron, we had to sell, to take loans. Wewere all in debt, but did not knowwhat to do.
– U-taphao community member
We used to grow rice, vegetables, andfruit. We rarely used money. Each house-hold had two pigs, two cows, and nine orten chickens. We used to travel by canalto the market where we bartered ourbanana leaves, fish, sugar cane, sugar-palmnuts, pomelo, and orange for honey,shrimp paste, betel nuts, and other goods.Then development came. We abandonedthe canal and travelled by road. We aban-doned the rice fields and looked for jobsin the town. At the annual Chak Phra8
festival we used to carry the Buddhaimage along the canal by boat. By 1976,it went by road.
Villagers left the community. Prices wentup. Soon we had to take loans from locallenders, then from banks. We all haddebts, but did not know what to do.BAAC lent money, not knowledge. Peoplehere had never seen sums like 30,000baht. They mortgaged their land and gotguarantors. Smart people took advantageof others. A few got rich while othersbecame poor. The government waswrong in doing this.
8 A festival in which the Buddha image is takenout of the temple and paraded around thecommunity.
9 “Than” is a title of respect.
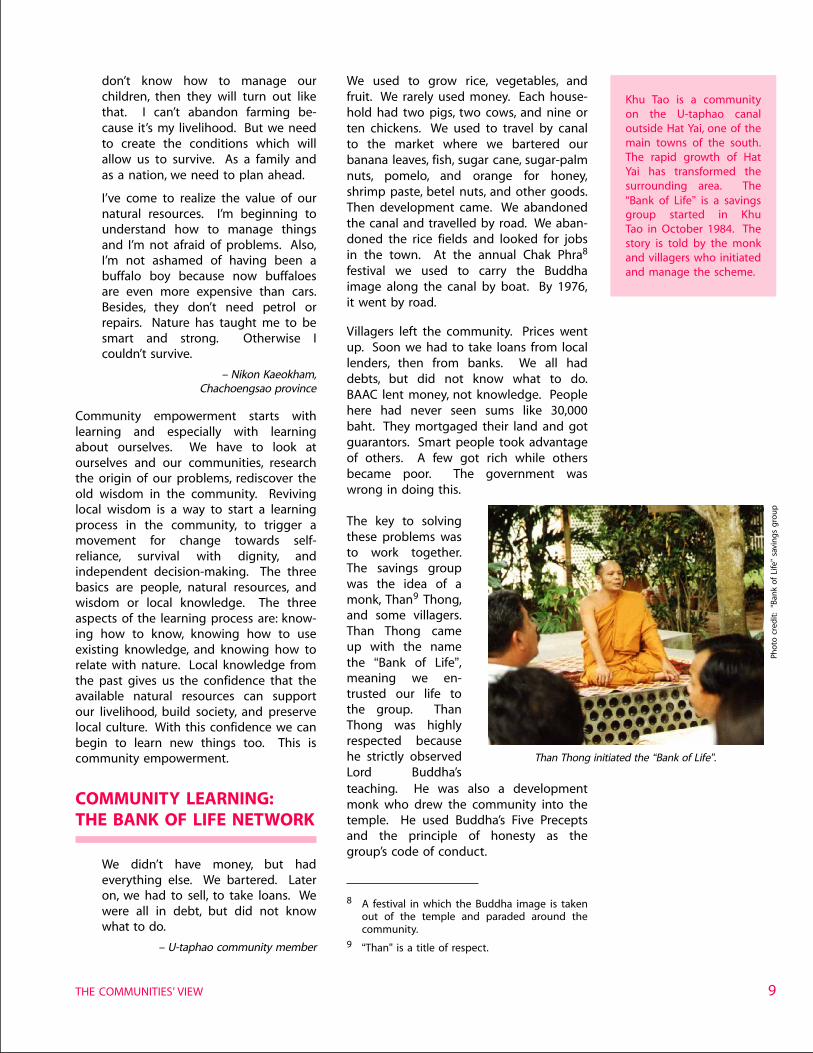
The key to solvingthese problems wasto work together.The savings groupwas the idea of amonk, Than9 Thong,and some villagers.Than Thong cameup with the namethe “Bank of Life”,meaning we en-trusted our life tothe group. ThanThong was highlyrespected becausehe strictly observedLord Buddha’steaching. He was also a developmentmonk who drew the community into thetemple. He used Buddha’s Five Preceptsand the principle of honesty as thegroup’s code of conduct.
Khu Tao is a communityon the U-taphao canaloutside Hat Yai, one of themain towns of the south.The rapid growth of HatYai has transformed thesurrounding area. The“Bank of Life” is a savingsgroup started in KhuTao in October 1984. Thestory is told by the monkand villagers who initiatedand manage the scheme.
THE COMMUNITIES’ VIEW
Than Thong initiated the “Bank of Life”.Ph
oto
cre
dit
: “B
ank
of
Life
” sa
vin
gs
gro
up
THAILAND HUMAN DEVELOPMENT REPORT 200310
At first, the group had eighteen members,each contributing one baht a day. Manypeople didn’t understand how this couldhelp people. But later others joined thegroup. Then there were suspicions thatThan Thong would hand the money overto the abbot. If the original eighteenhadn’t been patient, the group wouldnever have got this far. But now it’s asuccess.
So many people wanted to borrow thatthe funds were not enough. At first wedrew lots to decide who would get aloan. But all the members agreed thatwas not fair. Someone who really neededthe money might not get it. This wassolved by having all would-be borrowersdiscuss together and decide who neededthe money most. This system encouragespeople to care about one another and toshare problems. Members cannot takeout new loans until they repay old ones.Exemptions are made when schools openand the people need money for schoolfees. The key principle of the Bank of Lifeis sharing: “You know my problems and Iknow yours. So, we understand eachother”. Every member is equal, has oneshare, and pays the same amount eachday. If a small number of people held alot of shares, they could bully the others.
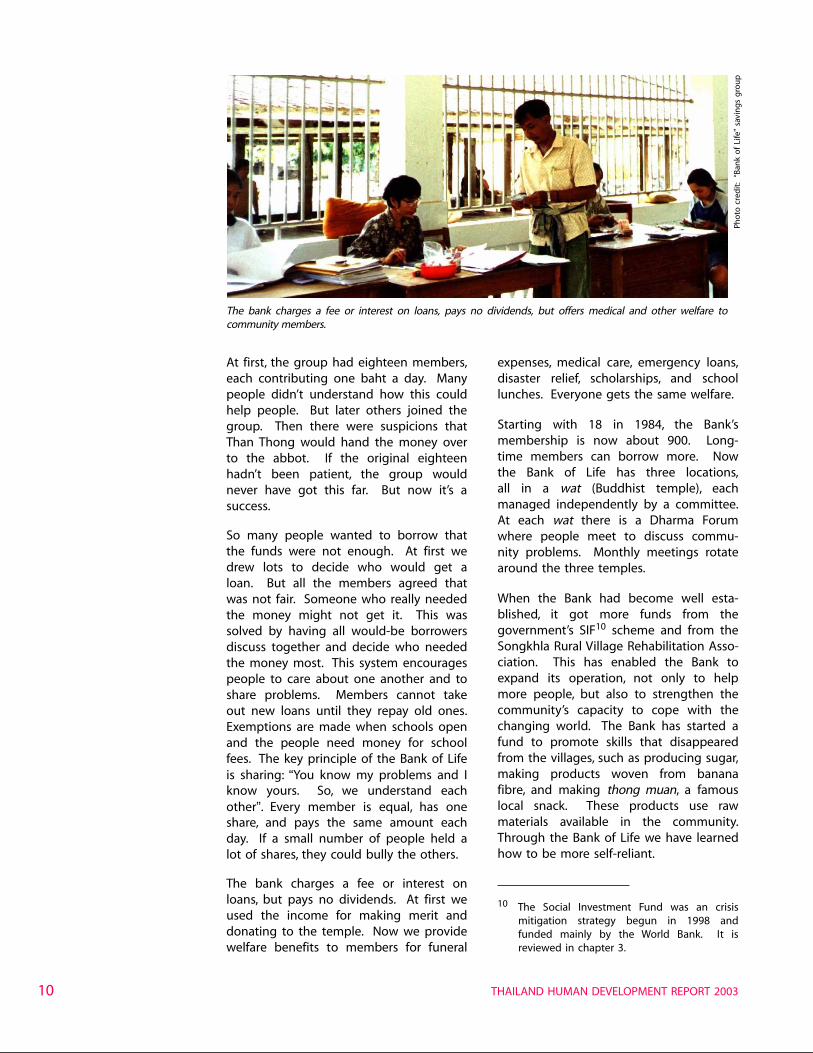
The bank charges a fee or interest onloans, but pays no dividends. At first weused the income for making merit anddonating to the temple. Now we providewelfare benefits to members for funeral
expenses, medical care, emergency loans,disaster relief, scholarships, and schoollunches. Everyone gets the same welfare.
Starting with 18 in 1984, the Bank’smembership is now about 900. Long-time members can borrow more. Nowthe Bank of Life has three locations,all in a wat (Buddhist temple), eachmanaged independently by a committee.At each wat there is a Dharma Forumwhere people meet to discuss commu-nity problems. Monthly meetings rotatearound the three temples.
When the Bank had become well esta-blished, it got more funds from thegovernment’s SIF10 scheme and from theSongkhla Rural Village Rehabilitation Asso-ciation. This has enabled the Bank toexpand its operation, not only to helpmore people, but also to strengthen thecommunity’s capacity to cope with thechanging world. The Bank has started afund to promote skills that disappearedfrom the villages, such as producing sugar,making products woven from bananafibre, and making thong muan, a famouslocal snack. These products use rawmaterials available in the community.Through the Bank of Life we have learnedhow to be more self-reliant.
The bank charges a fee or interest on loans, pays no dividends, but offers medical and other welfare tocommunity members.
10 The Social Investment Fund was an crisismitigation strategy begun in 1998 andfunded mainly by the World Bank. It isreviewed in chapter 3.
Pho
to c
red
it:
“Ban
k o
f Li
fe”
savi
ng
s g
rou
p
11
NEGOTIATING COOPERATIONTO CLEAN A RIVER
In the past, we just went to the canalbank and caught shrimp. Just likethat. No need even to go down intothe water and get wet.
– Fisherman,Samut Sakhon province
The Chaophraya and all the other riversare now so polluted you cannot use themfor drinking or washing. As for the fishand shellfish we used to eat, over 90per cent of the species have disappeared.Even the fish in the local markets allcome from fish farms. River fish are justmyths and dreams. Only the rich canafford them. As for the great biodiversityof this region, it’s just too sad.
This all came from the development ofindustry from the first plan11 onwards.Factories, big and small, are scatteredalong all five rivers. They spill waste andpollution into the rivers without thinking.The towns around the factories alsocreate garbage. Nature has to suffer eve-rything.
The pollution along the coastal stripis critical. The Thajin river is bad allyear long. The creeks leading to thecoast are black with filth, and no fish,prawns, or shellfish can survive. Thepolluted water comes from the facto-ries which release untreated wasteinto the river – power stations, semi-conductor plants, textile factories, andindustries of all sorts. It’s gettingworse. Every river is polluted, and sothe whole coastline is polluted.There’s a law about treating water,but the factories don’t follow it,and the officials don’t do their dutyhonestly. If there’s going to be aninspection, they warn in advance. Inshort, there’s corruption.
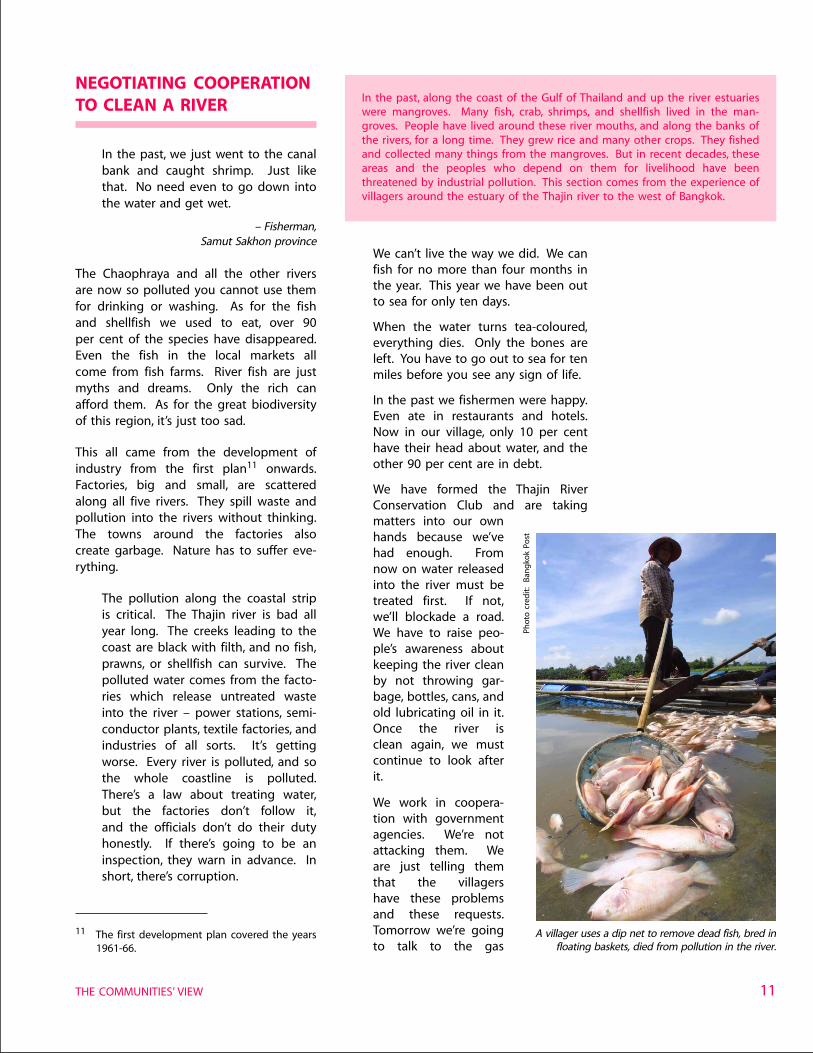
In the past, along the coast of the Gulf of Thailand and up the river estuarieswere mangroves. Many fish, crab, shrimps, and shellfish lived in the man-groves. People have lived around these river mouths, and along the banks ofthe rivers, for a long time. They grew rice and many other crops. They fishedand collected many things from the mangroves. But in recent decades, theseareas and the peoples who depend on them for livelihood have beenthreatened by industrial pollution. This section comes from the experience ofvillagers around the estuary of the Thajin river to the west of Bangkok.
We can’t live the way we did. We canfish for no more than four months inthe year. This year we have been outto sea for only ten days.
When the water turns tea-coloured,everything dies. Only the bones areleft. You have to go out to sea for tenmiles before you see any sign of life.
In the past we fishermen were happy.Even ate in restaurants and hotels.Now in our village, only 10 per centhave their head about water, and theother 90 per cent are in debt.
We have formed the Thajin RiverConservation Club and are taking
11 The first development plan covered the years1961-66.
A villager uses a dip net to remove dead fish, bred infloating baskets, died from pollution in the river.
matters into our ownhands because we’vehad enough. Fromnow on water releasedinto the river must betreated first. If not,we’ll blockade a road.We have to raise peo-ple’s awareness aboutkeeping the river cleanby not throwing gar-bage, bottles, cans, andold lubricating oil in it.Once the river isclean again, we mustcontinue to look afterit.
We work in coopera-tion with governmentagencies. We’re notattacking them. Weare just telling themthat the villagershave these problemsand these requests.Tomorrow we’re goingto talk to the gas
THE COMMUNITIES’ VIEW
Pho
to c
red
it:
Ban
gko
k Po
st
THAILAND HUMAN DEVELOPMENT REPORT 200312
factories. We’ll tell them we don’twant to cause them problems butrather to help them. We’ll ask themto prevent gas-impregnated waterpouring into the river when it rains.We’ll ask them how they treat thewater and what it contains. Thenwe’ll visit the acid factories and thedyeing works. But it starts withourselves. We’ve been collecting thewater hyacinth12 for four months andusing it to make fertilizer and foodfor wild boar and ostrich farms.
Solutions have to be effective. Wehave to find ways to monitor thedischarges. We’ve identified tenpoints along the river where wecheck the water. If the water is stillokay at the first point, then we go tothe second. If it is not okay at thesecond, then we pinpoint who is thecause of the problem. There aren’tmany factories between the twopoints. This sort of monitoring is theway to deal with people who are notenvironmentally conscious or whosimply break the law. We can tellthem: we know you’re doing it.
– Fisherman, Samut Sakhon province
BUILDING NETWORKS:THE PEOPLE LIVE,THE CANAL LIVES
The Samrong canal linksthe Songkhla lake, thelargest lake in the South,to the Gulf of Thailand.Five slum communities,including Kaoseng, settledalong its banks. Likemany slum communitiesthey had no rights toland, found it difficult toget public services, andfaced constant threat ofeviction. They were alsoaccused of polluting thecanal. Their lives changedwhen they realized thatthis accusation was notan unfair burden, but asource of power. 12 A fast-growing water plant
which tends to block waterways.
Samrong canal used to be clean andclear. Pollution started only ten yearsago. The communities along thecanal are not the only culprits. Thefactories are responsible too. But theblame gets put on the communities.
– Jaidee Sawang-arom
It used to be easy to catch black tigerprawns in the canal. The pollution beganin 1986 when factories discharged un-treated water into the canal. Now thereare no fish. The city people accuse us.We might be responsible for 20 per centof the problem, but no more. There aremany sources of pollution – factories,municipal drainage, lubricant oil, waterrunning off the street. Still, they put allthe blame on us because we are slumsquatters.
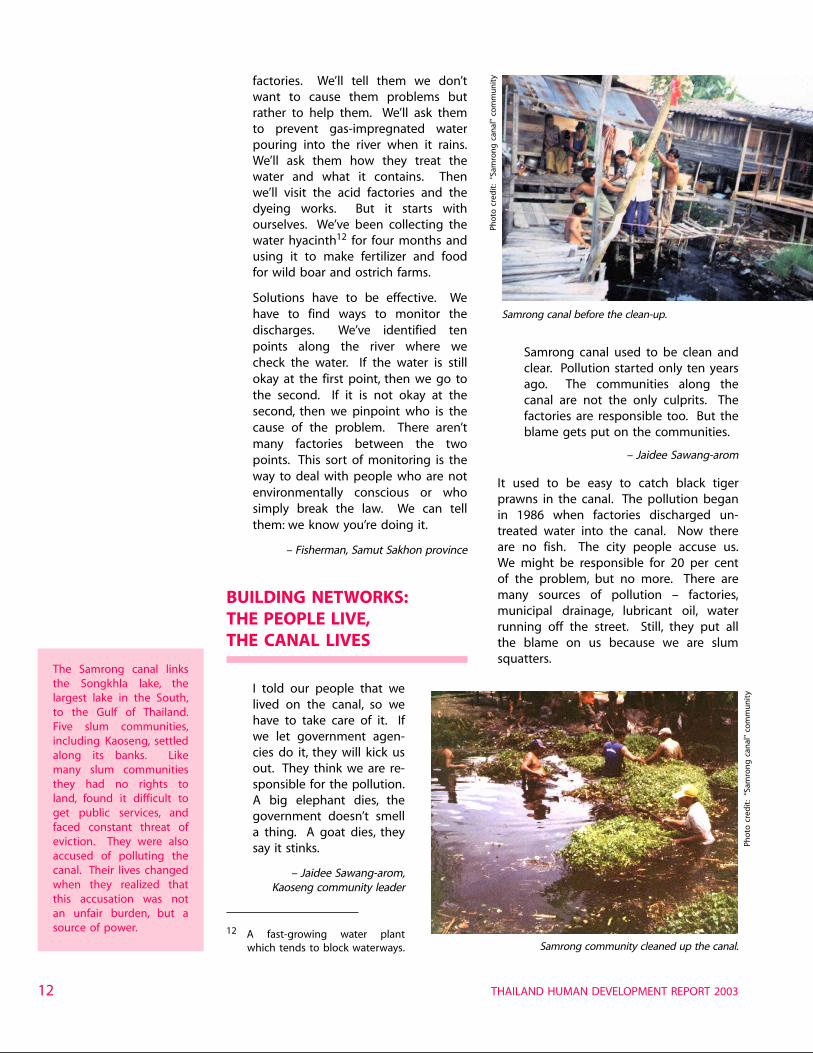
Samrong canal before the clean-up.
I told our people that welived on the canal, so wehave to take care of it. Ifwe let government agen-cies do it, they will kick usout. They think we are re-sponsible for the pollution.A big elephant dies, thegovernment doesn’t smella thing. A goat dies, theysay it stinks.
– Jaidee Sawang-arom,Kaoseng community leader
Samrong community cleaned up the canal.
Pho
to c
red
it:
“Sam
ron
g c
anal
” co
mm
un
ity
Pho
to c
red
it:
“Sam
ron
g c
anal
” co
mm
un
ity
13
City people look down on us. Theybelieve slum dwellers cause all sorts ofproblems – drugs, gambling, and crime.Some communities were ordered toleave, but they refused. Some have beenremoved to make way for commercialdevelopment. We are seen as an obstacle.If the land is vacant, it’s easier for theauthorities to develop the area. But webelieve that the people and the canal canlive together.
In the past, the government would tellthe slum communities what to do and wewould follow without question. Then theNGOs came and gave advice, especiallythe Housing Development Foundation.We had been deaf and blind for a longtime. So they were like eye-drops andear-drops. We began to see and hearbetter. We believed we could control ourown lives. The NGOs did not makedecisions for us; they were just our con-sultants. In the old days, we could neverhave done this. As soon as we gottogether, we were strong. Governmentagencies did not like us to be strongbecause they thought we would opposetheir ideas. That was wrong. In fact, com-ing together just made us smarter.
In 1990, we started by setting up asavings group to provide some security tothe communities that were always in dan-ger of eviction. It’s difficult to set upsavings groups in urban communities be-cause people come from different places.
But the authorities weren’t going to helpus, so we had to go it alone. Five groupsstarted by 1991, and now there are ten.They give loans to members and use theincome for health, education, housing, andother welfare.
The savings groups were just the start ofgetting together. Once we had thisorganization, other projects were easier.We started a Child Development Centrefor pre-school. This is important becauseslum kids easily get looked down onwhen they first go to school. We gotmoney from SIF to help the poor, elderly,abandoned children, and people with HIV/AIDS. We got money from the NationalHousing Authority to build walkways,piped water, electricity, and drainage butsomehow the budget was cancelled. Butwe got some money from elsewhere tobuild drains.
Mostly we dug the drains ourselves,but we also had to cross a municipalroad. We wrote to the municipalityto give us permission and to help uswith a back-hoe for two or threedays. We wrote twice but got noanswer. We went to see a councillorbut he said no back-hoe was avail-able. Then we went to see themayor. He was shocked. He had notbeen informed. He sent a back-hoeimmediately and we finished thework in three days.
– Kaoseng resident
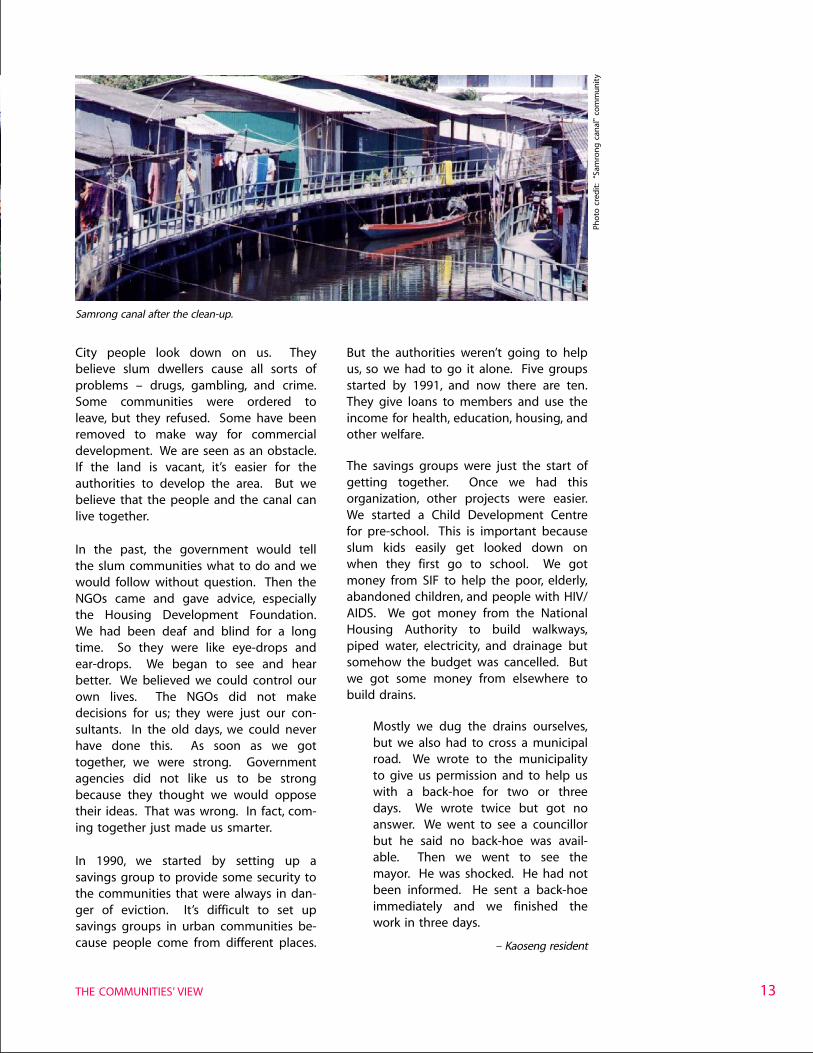
Samrong canal after the clean-up.
THE COMMUNITIES’ VIEW
Pho
to c
red
it:
“Sam
ron
g c
anal
” co
mm
un
ity
THAILAND HUMAN DEVELOPMENT REPORT 200314
The idea to clean up the canal came upin our savings group discussions. At firsteach community wanted just to developitself. But we wanted to show theauthorities we were not polluters. So weset up a joint task force. We planted treesalong the canal. We organized seminarsand invited the relevant officials. Weasked business people for help. Mostrefused but a few understood and stillsupport us. We asked NGOs for help.They found some boats to collect garbageout of the canal.
In the dry season, the canal got blockedby sandbar. The water went stagnantand garbage collects on the bar. Peopleblamed us for the garbage and pollution,but really it came from upstream.
Before the monsoon season, we gottogether to dig out the sand, otherwisethe houses along the canal would beflooded. We also cleared up the garbage.But next dry season, the canal wasblocked again, and the garbage and waterhyacinth piled up. Again we were thescapegoat. But in fact there was even afire in the canal because someonedischarged a lot of oil into it.
We discussed with our NGO friends howto prevent the pollution. We wrote aproposal requesting UN support to builda wooden fence along the banks of thecanal. We also came up with a schemeto stop the sandbar forming each year.While we were working on this, somepeople saw us from the bridge andnotified the municipality that we wereencroaching on the canal. The Governor13
ordered the arrest of the communityleaders.
But we did not let them arrest us. Wewent to see the Governor ourselves. Wetold him that we had good intentions.We had not consulted the authorities firstbecause they didn’t seem to care about
the canal. They never acknowledged thatfactories polluted the canal but alwaysblamed it on the people. Officials at theprovincial, district, and municipality officesaccepted bribes from the factories. Thefactories claimed they treated waste waterbefore discharging it. But treatment costsa lot of money. We took the Governor tosee where they discharged the water atnight. How could we prevent that? If wewere not careful, we might be gunneddown. We asked why the Governor didnot take any action. He told us that hehad talked to the factory owners butnothing happened.
Our discussion with the Governor wasfruitful. He offered to help us. We askedfor 10 million baht. The provincial officedrafted a project proposal on behalf ofthe people to dredge the canal anddevelop nearby communities. When thebudget was approved, we were veryhappy. At that time we thought theauthorities would take care of the facto-ries, and we would handle the garbageproblem. But then they told us to relo-cate 101 of our houses. We did notaccept that. We felt that if the canalcould live, so should the people.
We made a survey of all the housesalong the canal. This helped us use factsand figures to negotiate with the autho-rities. Our survey found that only forty-four houses needed to be shifted alittle. There was no need to relocatethem. In the end we agreed to movesome houses a bit to make room for adredger.
The Department of Social Welfare gaveus two boats to collect garbage. Noweach community looks after its ownsection. People upstream still throw theirgarbage in the canal but we have built abarricade to catch it and we clean thisoccasionally. Now the canal water isgreen and clear.
Government agencies began to under-stand us. The provincial clerk even saidhis work on the Samrong canal made himfamous and got him promoted to deputy
13 The Governor is the official head of aprovince’s administration, appointed by theMinistry of Interior.
15
governor in only one year. He admittedthat he used to think in a bureaucraticway. He thought the area should becleared of houses. Now he sees that heneeds cooperation from the canal people.After several years of working together,we think many government officials aregood. They’re not all bad.
Recently we had a ceremony to celebrateten years of the rehabilitation project.Many important people attended. But thecanal is still not as clean as it should be.Recently a TV programme showed thefactories illegally discharging waste. Wecannot stop them. Only the governmentcan. But it won’t.
We cannot look after the canal on ourown. The government and the people ofSongkhla need to see the importance.After all the canal doesn’t belong to thecommunities on its banks but to thepeople of Songkhla as a whole.
REDISCOVERING LOCALKNOWLEDGE IN THEHIGHLANDS
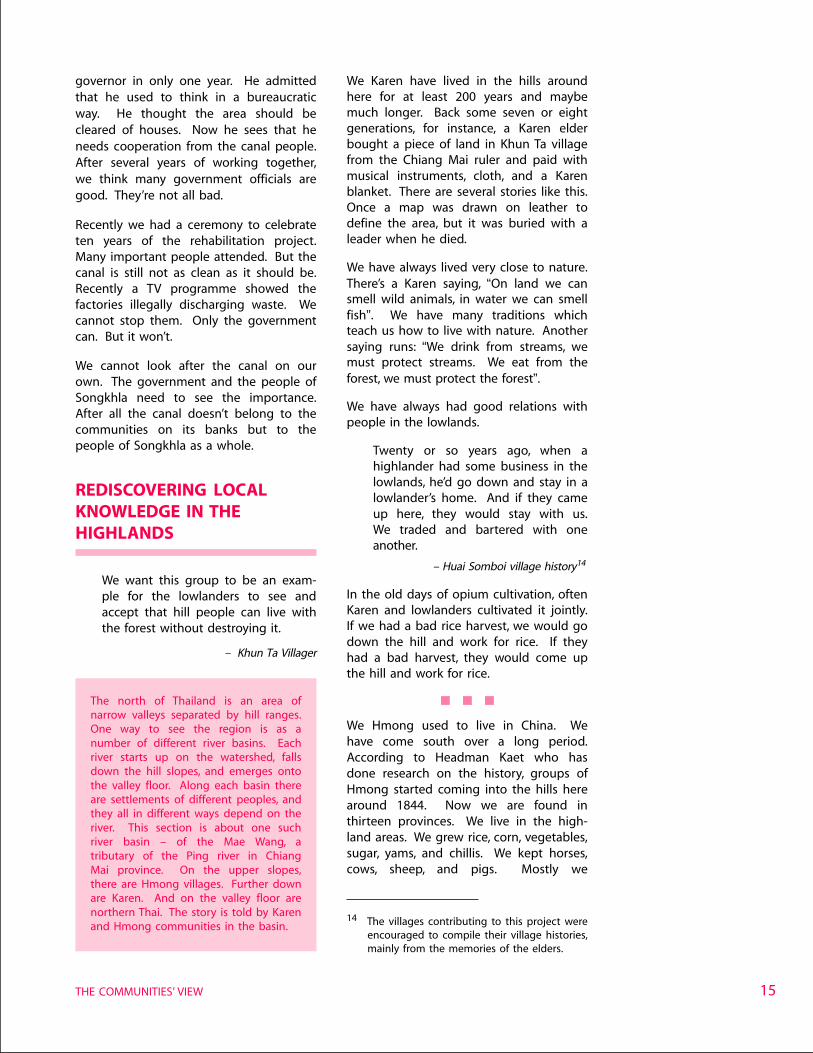
We want this group to be an exam-ple for the lowlanders to see andaccept that hill people can live withthe forest without destroying it.
– Khun Ta Villager
We Karen have lived in the hills aroundhere for at least 200 years and maybemuch longer. Back some seven or eightgenerations, for instance, a Karen elderbought a piece of land in Khun Ta villagefrom the Chiang Mai ruler and paid withmusical instruments, cloth, and a Karenblanket. There are several stories like this.Once a map was drawn on leather todefine the area, but it was buried with aleader when he died.
We have always lived very close to nature.There’s a Karen saying, “On land we cansmell wild animals, in water we can smellfish”. We have many traditions whichteach us how to live with nature. Anothersaying runs: “We drink from streams, wemust protect streams. We eat from theforest, we must protect the forest”.
We have always had good relations withpeople in the lowlands.
Twenty or so years ago, when ahighlander had some business in thelowlands, he’d go down and stay in alowlander’s home. And if they cameup here, they would stay with us.We traded and bartered with oneanother.
– Huai Somboi village history14
In the old days of opium cultivation, oftenKaren and lowlanders cultivated it jointly.If we had a bad rice harvest, we would godown the hill and work for rice. If theyhad a bad harvest, they would come upthe hill and work for rice.
We Hmong used to live in China. Wehave come south over a long period.According to Headman Kaet who hasdone research on the history, groups ofHmong started coming into the hills herearound 1844. Now we are found inthirteen provinces. We live in the high-land areas. We grew rice, corn, vegetables,sugar, yams, and chillis. We kept horses,cows, sheep, and pigs. Mostly we
The north of Thailand is an area ofnarrow valleys separated by hill ranges.One way to see the region is as anumber of different river basins. Eachriver starts up on the watershed, fallsdown the hill slopes, and emerges ontothe valley floor. Along each basin thereare settlements of different peoples, andthey all in different ways depend on theriver. This section is about one suchriver basin – of the Mae Wang, atributary of the Ping river in ChiangMai province. On the upper slopes,there are Hmong villages. Further downare Karen. And on the valley floor arenorthern Thai. The story is told by Karenand Hmong communities in the basin.
14 The villages contributing to this project wereencouraged to compile their village histories,mainly from the memories of the elders.
THE COMMUNITIES’ VIEW
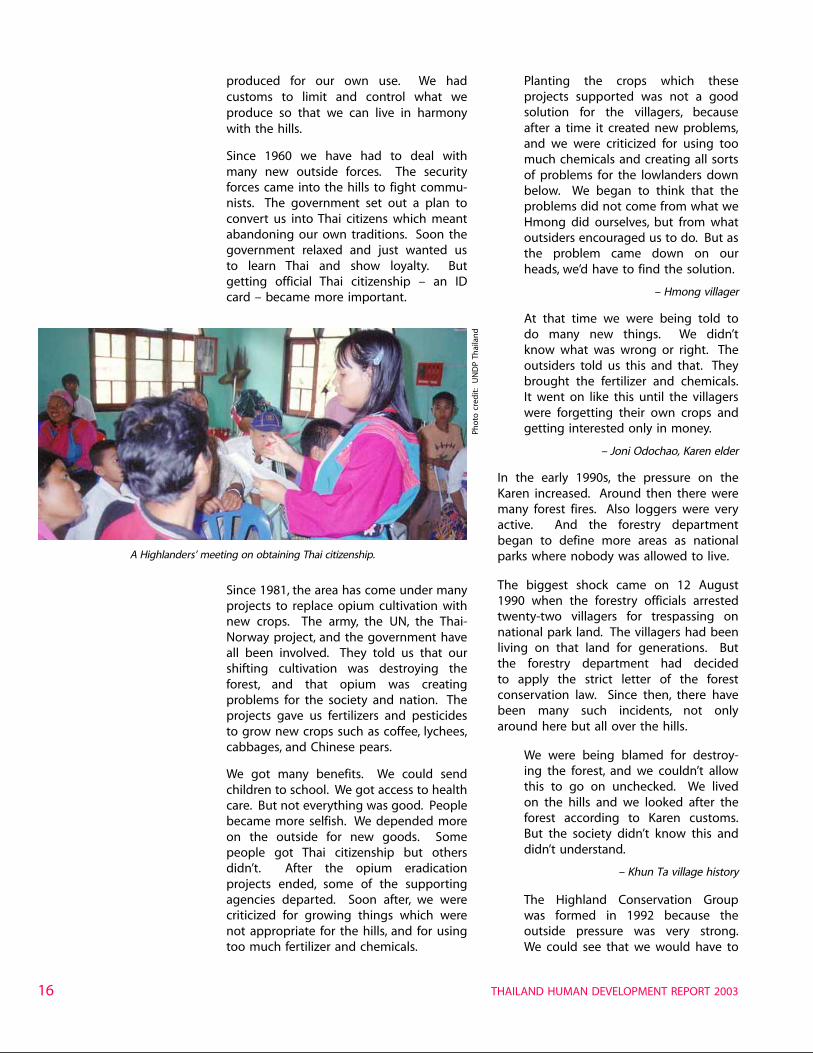
THAILAND HUMAN DEVELOPMENT REPORT 200316
produced for our own use. We hadcustoms to limit and control what weproduce so that we can live in harmonywith the hills.
Since 1960 we have had to deal withmany new outside forces. The securityforces came into the hills to fight commu-nists. The government set out a plan toconvert us into Thai citizens which meantabandoning our own traditions. Soon thegovernment relaxed and just wanted usto learn Thai and show loyalty. Butgetting official Thai citizenship – an IDcard – became more important.
Planting the crops which theseprojects supported was not a goodsolution for the villagers, becauseafter a time it created new problems,and we were criticized for using toomuch chemicals and creating all sortsof problems for the lowlanders downbelow. We began to think that theproblems did not come from what weHmong did ourselves, but from whatoutsiders encouraged us to do. But asthe problem came down on ourheads, we’d have to find the solution.
– Hmong villager
At that time we were being told todo many new things. We didn’tknow what was wrong or right. Theoutsiders told us this and that. Theybrought the fertilizer and chemicals.It went on like this until the villagerswere forgetting their own crops andgetting interested only in money.
– Joni Odochao, Karen elder
In the early 1990s, the pressure on theKaren increased. Around then there weremany forest fires. Also loggers were veryactive. And the forestry departmentbegan to define more areas as nationalparks where nobody was allowed to live.
The biggest shock came on 12 August1990 when the forestry officials arrestedtwenty-two villagers for trespassing onnational park land. The villagers had beenliving on that land for generations. Butthe forestry department had decidedto apply the strict letter of the forestconservation law. Since then, there havebeen many such incidents, not onlyaround here but all over the hills.
We were being blamed for destroy-ing the forest, and we couldn’t allowthis to go on unchecked. We livedon the hills and we looked after theforest according to Karen customs.But the society didn’t know this anddidn’t understand.
– Khun Ta village history
The Highland Conservation Groupwas formed in 1992 because theoutside pressure was very strong.We could see that we would have to
Since 1981, the area has come under manyprojects to replace opium cultivation withnew crops. The army, the UN, the Thai-Norway project, and the government haveall been involved. They told us that ourshifting cultivation was destroying theforest, and that opium was creatingproblems for the society and nation. Theprojects gave us fertilizers and pesticidesto grow new crops such as coffee, lychees,cabbages, and Chinese pears.
We got many benefits. We could sendchildren to school. We got access to healthcare. But not everything was good. Peoplebecame more selfish. We depended moreon the outside for new goods. Somepeople got Thai citizenship but othersdidn’t. After the opium eradicationprojects ended, some of the supportingagencies departed. Soon after, we werecriticized for growing things which werenot appropriate for the hills, and for usingtoo much fertilizer and chemicals.
A Highlanders’ meeting on obtaining Thai citizenship.
Pho
to c
red
it:
UN
DP
Thai
lan
d
17
protect ourselves. We would have tostop doing certain things which werejudged as too much. And we wouldhave to do more of the things whichwere seen as appropriate. That wasthe way to survive. So we formedthe group.
– Huai Somboi village history
The Karen leaders from all the villagesin the area, totalling 777 households, helda meeting to discuss various problems.This led to the establishment of theChomthong Highland Conservation Group.The first president was a village teacher.He invited many organizations to becomeadvisers to the group including the Re-gional Centre for Social Development atChiang Mai University. The Group createda travelling forum to explain the objec-tives to villages around the area.
The conservation group started in1992 on the encouragement ofTeacher Kam. It became more effec-tive after IMPECT15 donated fundsbecause it’s difficult to do anythingwithout some funds. In 1993 we hadmany activities including tree ordina-tion and local sports events. We gothousewives and children involved too.
– Khun Ta villager
We knew that we had the knowledge andtraditions to preserve the forest. But wewere no longer isolated. We were part ofa bigger society. Many people in thatsociety had been taught to believe thatwe were destroying the forests withopium, slash-and-burn, chemicals, andcabbages. Just having the knowledge topreserve the forest was no longer enough.We had to persuade others in society thatwe had that knowledge. And to do that,we had to pool our resources with otherKaren, other groups in the hills, and withour friends in the lowlands.
In addition to the other problems, in 1993there was a drought which caused moreforest fires, and problems with peopletaking oil and bark from pine trees for sale.A forum was held at Mae Manao templeincluding our own highland representa-tives, lowland leaders, the forestry depart-ment, other government organizations,and some NGOs. The forum decided thateach group should rehabilitate the forestin its own area. Then on 14 October 1993,Karen and Hmong met and formed theMae Wang River Basin Network.
We got together all the village headsin the Mae Wang basin. Before, theforestry officials used to give us train-ing about fire prevention and control.The villagers realized we couldorganize this ourselves. In 1992 or1993 we cut the first firebreak.
– Sewa Odochao
We Karen have always divided up theforest into different areas. The areas thatare crucial for collecting water are definedas conservation forest. Then there issacred forest which again must be pre-served. Then there are village woodlotswhich can be used for grazing and collect-ing forest products under strict rules.Then there is useable forest which can beused for cultivation under a rotation whichalways allows the forest to regenerate.
To help others to understand this classi-fication, we have now made maps, justlike those the government offices use. Wehave put up signs to mark different areas.We have made a model of the wholebasin with the different forest areasclearly marked, so outsiders can under-stand. We defined some areas as non-hunting areas to preserve the wildlife. Weplanted more trees in our conservationareas. We started cutting firebreaks. Inthe dry season we organized guards towatch for forest fires. We held villagemeetings and put up posters. And weheld ceremonies to ordain16 trees.
15 The Inter Mountain Peoples Education andCulture in Thailand Association was esta-blished in 1992 by elders of the Karen,Iumien, Hmong, Lisu, Lahu and Akha. Itsmain objective is to revitalise and applyindigenous knowledge in all areas of deve-lopment, including natural resource andbiodiversity management.
16 Traditionally every Thai man spends sometime in the Buddhist monkhood. At theordination ceremony, his head is shaved andhe puts on the distinctive ochre-colouredrobe of a monk.
THE COMMUNITIES’ VIEW
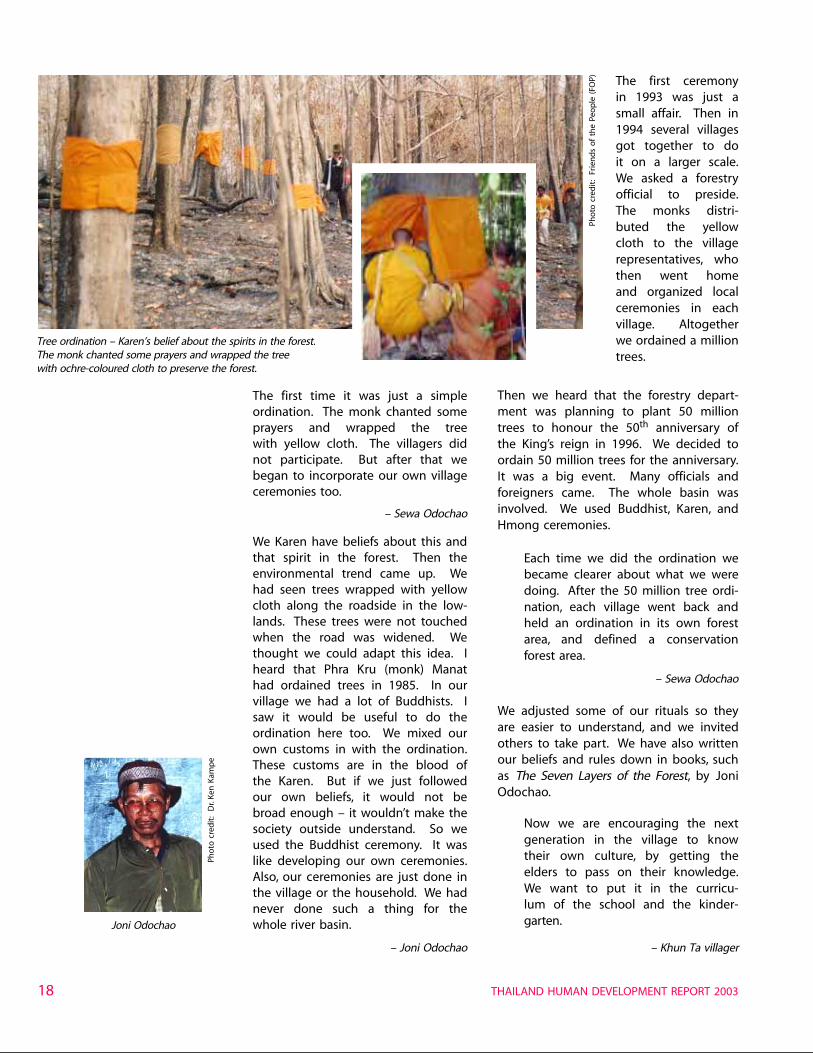
THAILAND HUMAN DEVELOPMENT REPORT 200318
The first time it was just a simpleordination. The monk chanted someprayers and wrapped the treewith yellow cloth. The villagers didnot participate. But after that webegan to incorporate our own villageceremonies too.
– Sewa Odochao
We Karen have beliefs about this andthat spirit in the forest. Then theenvironmental trend came up. Wehad seen trees wrapped with yellowcloth along the roadside in the low-lands. These trees were not touchedwhen the road was widened. Wethought we could adapt this idea. Iheard that Phra Kru (monk) Manathad ordained trees in 1985. In ourvillage we had a lot of Buddhists. Isaw it would be useful to do theordination here too. We mixed ourown customs in with the ordination.These customs are in the blood ofthe Karen. But if we just followedour own beliefs, it would not bebroad enough – it wouldn’t make thesociety outside understand. So weused the Buddhist ceremony. It waslike developing our own ceremonies.Also, our ceremonies are just done inthe village or the household. We hadnever done such a thing for thewhole river basin.
– Joni Odochao
Then we heard that the forestry depart-ment was planning to plant 50 milliontrees to honour the 50th anniversary ofthe King’s reign in 1996. We decided toordain 50 million trees for the anniversary.It was a big event. Many officials andforeigners came. The whole basin wasinvolved. We used Buddhist, Karen, andHmong ceremonies.
Each time we did the ordination webecame clearer about what we weredoing. After the 50 million tree ordi-nation, each village went back andheld an ordination in its own forestarea, and defined a conservationforest area.
– Sewa Odochao
We adjusted some of our rituals so theyare easier to understand, and we invitedothers to take part. We have also writtenour beliefs and rules down in books, suchas The Seven Layers of the Forest, by JoniOdochao.
Now we are encouraging the nextgeneration in the village to knowtheir own culture, by getting theelders to pass on their knowledge.We want to put it in the curricu-lum of the school and the kinder-garten.
– Khun Ta villager
The first ceremonyin 1993 was just asmall affair. Then in1994 several villagesgot together to doit on a larger scale.We asked a forestryofficial to preside.The monks distri-buted the yellowcloth to the villagerepresentatives, whothen went homeand organized localceremonies in eachvillage. Altogetherwe ordained a milliontrees.
Tree ordination – Karen’s belief about the spirits in the forest.The monk chanted some prayers and wrapped the treewith ochre-coloured cloth to preserve the forest.
Joni Odochao
Pho
to c
red
it:
Frie
nd
s o
f th
e Pe
op
le (
FOP)
Pho
to c
red
it:
Dr.
Ken
Kam
pe
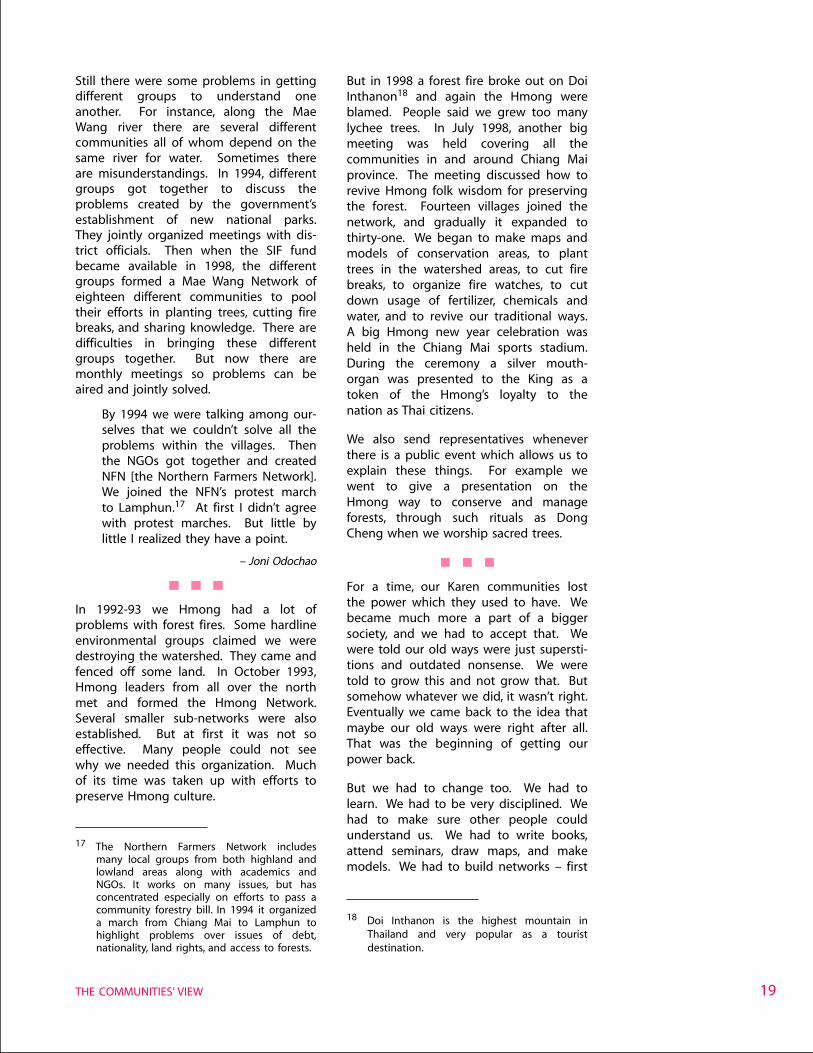
19
Still there were some problems in gettingdifferent groups to understand oneanother. For instance, along the MaeWang river there are several differentcommunities all of whom depend on thesame river for water. Sometimes thereare misunderstandings. In 1994, differentgroups got together to discuss theproblems created by the government’sestablishment of new national parks.They jointly organized meetings with dis-trict officials. Then when the SIF fundbecame available in 1998, the differentgroups formed a Mae Wang Network ofeighteen different communities to pooltheir efforts in planting trees, cutting firebreaks, and sharing knowledge. There aredifficulties in bringing these differentgroups together. But now there aremonthly meetings so problems can beaired and jointly solved.
By 1994 we were talking among our-selves that we couldn’t solve all theproblems within the villages. Thenthe NGOs got together and createdNFN [the Northern Farmers Network].We joined the NFN’s protest marchto Lamphun.17 At first I didn’t agreewith protest marches. But little bylittle I realized they have a point.
– Joni Odochao
In 1992-93 we Hmong had a lot ofproblems with forest fires. Some hardlineenvironmental groups claimed we weredestroying the watershed. They came andfenced off some land. In October 1993,Hmong leaders from all over the northmet and formed the Hmong Network.Several smaller sub-networks were alsoestablished. But at first it was not soeffective. Many people could not seewhy we needed this organization. Muchof its time was taken up with efforts topreserve Hmong culture.
But in 1998 a forest fire broke out on DoiInthanon18 and again the Hmong wereblamed. People said we grew too manylychee trees. In July 1998, another bigmeeting was held covering all thecommunities in and around Chiang Maiprovince. The meeting discussed how torevive Hmong folk wisdom for preservingthe forest. Fourteen villages joined thenetwork, and gradually it expanded tothirty-one. We began to make maps andmodels of conservation areas, to planttrees in the watershed areas, to cut firebreaks, to organize fire watches, to cutdown usage of fertilizer, chemicals andwater, and to revive our traditional ways.A big Hmong new year celebration washeld in the Chiang Mai sports stadium.During the ceremony a silver mouth-organ was presented to the King as atoken of the Hmong’s loyalty to thenation as Thai citizens.
We also send representatives wheneverthere is a public event which allows us toexplain these things. For example wewent to give a presentation on theHmong way to conserve and manageforests, through such rituals as DongCheng when we worship sacred trees.
For a time, our Karen communities lostthe power which they used to have. Webecame much more a part of a biggersociety, and we had to accept that. Wewere told our old ways were just supersti-tions and outdated nonsense. We weretold to grow this and not grow that. Butsomehow whatever we did, it wasn’t right.Eventually we came back to the idea thatmaybe our old ways were right after all.That was the beginning of getting ourpower back.
But we had to change too. We had tolearn. We had to be very disciplined. Wehad to make sure other people couldunderstand us. We had to write books,attend seminars, draw maps, and makemodels. We had to build networks – first
17 The Northern Farmers Network includesmany local groups from both highland andlowland areas along with academics andNGOs. It works on many issues, but hasconcentrated especially on efforts to pass acommunity forestry bill. In 1994 it organizeda march from Chiang Mai to Lamphun tohighlight problems over issues of debt,nationality, land rights, and access to forests.
18 Doi Inthanon is the highest mountain inThailand and very popular as a touristdestination.
THE COMMUNITIES’ VIEW
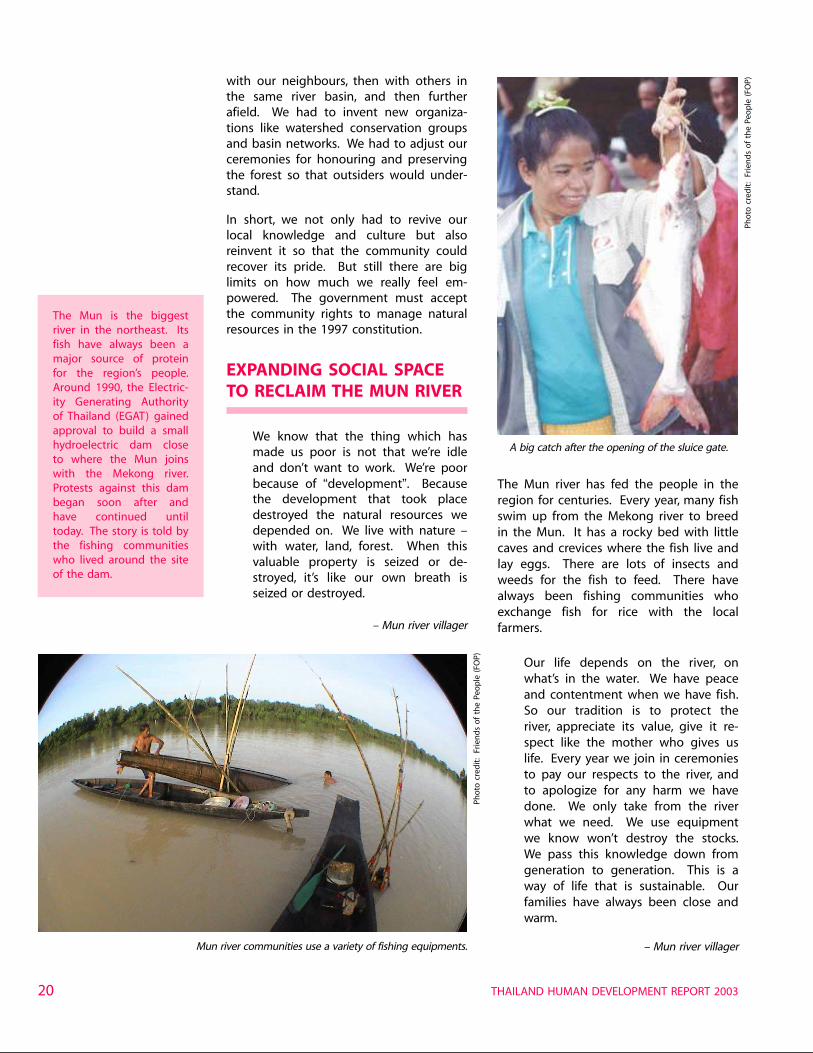
THAILAND HUMAN DEVELOPMENT REPORT 200320
with our neighbours, then with others inthe same river basin, and then furtherafield. We had to invent new organiza-tions like watershed conservation groupsand basin networks. We had to adjust ourceremonies for honouring and preservingthe forest so that outsiders would under-stand.
In short, we not only had to revive ourlocal knowledge and culture but alsoreinvent it so that the community couldrecover its pride. But still there are biglimits on how much we really feel em-powered. The government must acceptthe community rights to manage naturalresources in the 1997 constitution.
EXPANDING SOCIAL SPACETO RECLAIM THE MUN RIVER
We know that the thing which hasmade us poor is not that we’re idleand don’t want to work. We’re poorbecause of “development”. Becausethe development that took placedestroyed the natural resources wedepended on. We live with nature –with water, land, forest. When thisvaluable property is seized or de-stroyed, it’s like our own breath isseized or destroyed.
– Mun river villager
The Mun river has fed the people in theregion for centuries. Every year, many fishswim up from the Mekong river to breedin the Mun. It has a rocky bed with littlecaves and crevices where the fish live andlay eggs. There are lots of insects andweeds for the fish to feed. There havealways been fishing communities whoexchange fish for rice with the localfarmers.
Our life depends on the river, onwhat’s in the water. We have peaceand contentment when we have fish.So our tradition is to protect theriver, appreciate its value, give it re-spect like the mother who gives uslife. Every year we join in ceremoniesto pay our respects to the river, andto apologize for any harm we havedone. We only take from the riverwhat we need. We use equipmentwe know won’t destroy the stocks.We pass this knowledge down fromgeneration to generation. This is away of life that is sustainable. Ourfamilies have always been close andwarm.
– Mun river villager
The Mun is the biggestriver in the northeast. Itsfish have always been amajor source of proteinfor the region’s people.Around 1990, the Electric-ity Generating Authorityof Thailand (EGAT) gainedapproval to build a smallhydroelectric dam closeto where the Mun joinswith the Mekong river.Protests against this dambegan soon after andhave continued untiltoday. The story is told bythe fishing communitieswho lived around the siteof the dam.
Mun river communities use a variety of fishing equipments.
A big catch after the opening of the sluice gate.
Pho
to c
red
it:
Frie
nd
s o
f th
e Pe
op
le (
FOP)
Pho
to c
red
it:
Frie
nd
s o
f th
e Pe
op
le (
FOP)
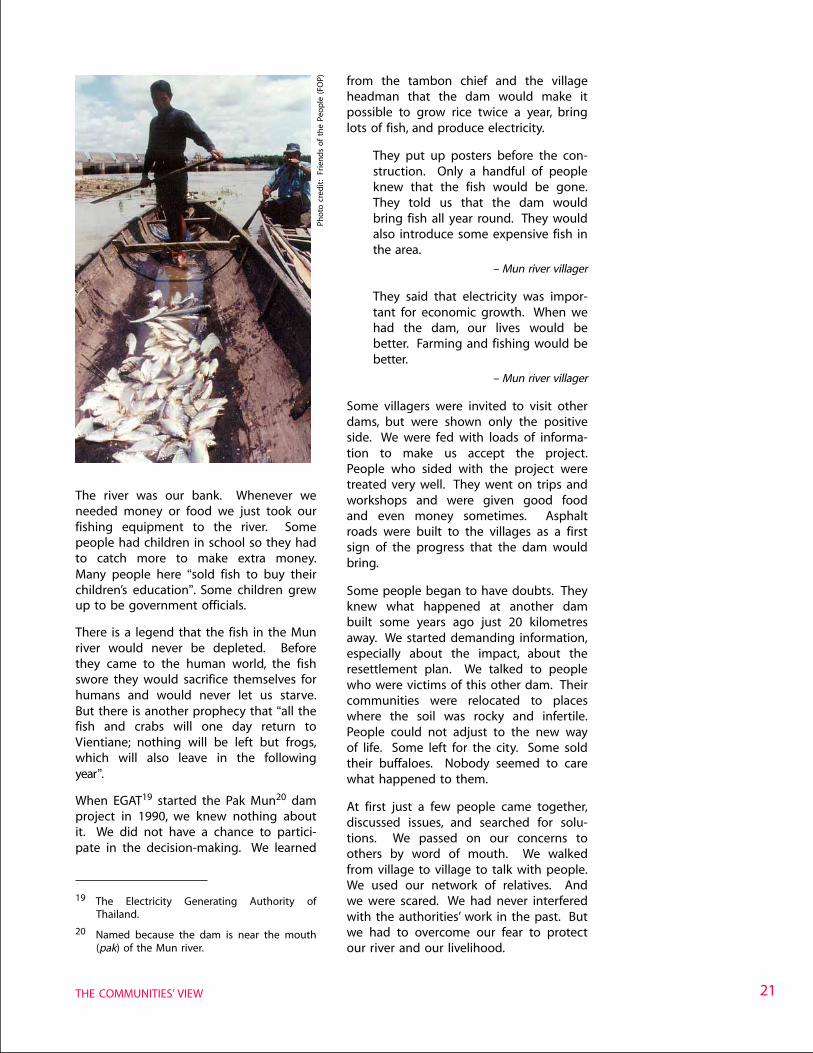
21
The river was our bank. Whenever weneeded money or food we just took ourfishing equipment to the river. Somepeople had children in school so they hadto catch more to make extra money.Many people here “sold fish to buy theirchildren’s education”. Some children grewup to be government officials.
There is a legend that the fish in the Munriver would never be depleted. Beforethey came to the human world, the fishswore they would sacrifice themselves forhumans and would never let us starve.But there is another prophecy that “all thefish and crabs will one day return toVientiane; nothing will be left but frogs,which will also leave in the followingyear”.
When EGAT19 started the Pak Mun20 damproject in 1990, we knew nothing aboutit. We did not have a chance to partici-pate in the decision-making. We learned
from the tambon chief and the villageheadman that the dam would make itpossible to grow rice twice a year, bringlots of fish, and produce electricity.
They put up posters before the con-struction. Only a handful of peopleknew that the fish would be gone.They told us that the dam wouldbring fish all year round. They wouldalso introduce some expensive fish inthe area.
– Mun river villager
They said that electricity was impor-tant for economic growth. When wehad the dam, our lives would bebetter. Farming and fishing would bebetter.
– Mun river villager
Some villagers were invited to visit otherdams, but were shown only the positiveside. We were fed with loads of informa-tion to make us accept the project.People who sided with the project weretreated very well. They went on trips andworkshops and were given good foodand even money sometimes. Asphaltroads were built to the villages as a firstsign of the progress that the dam wouldbring.
Some people began to have doubts. Theyknew what happened at another dambuilt some years ago just 20 kilometresaway. We started demanding information,especially about the impact, about theresettlement plan. We talked to peoplewho were victims of this other dam. Theircommunities were relocated to placeswhere the soil was rocky and infertile.People could not adjust to the new wayof life. Some left for the city. Some soldtheir buffaloes. Nobody seemed to carewhat happened to them.
At first just a few people came together,discussed issues, and searched for solu-tions. We passed on our concerns toothers by word of mouth. We walkedfrom village to village to talk with people.We used our network of relatives. Andwe were scared. We had never interferedwith the authorities’ work in the past. Butwe had to overcome our fear to protectour river and our livelihood.
19 The Electricity Generating Authority ofThailand.
20 Named because the dam is near the mouth(pak) of the Mun river.
THE COMMUNITIES’ VIEW
Pho
to c
red
it:
Frie
nd
s o
f th
e Pe
op
le (
FOP)
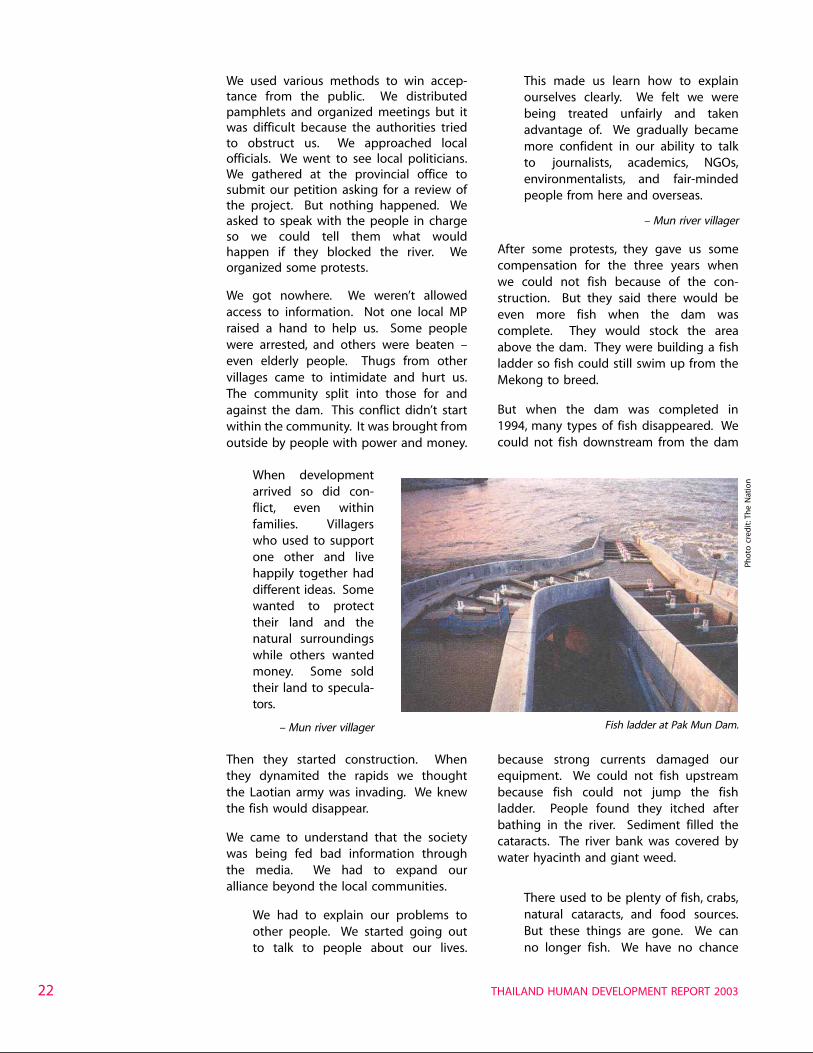
THAILAND HUMAN DEVELOPMENT REPORT 200322
We used various methods to win accep-tance from the public. We distributedpamphlets and organized meetings but itwas difficult because the authorities triedto obstruct us. We approached localofficials. We went to see local politicians.We gathered at the provincial office tosubmit our petition asking for a review ofthe project. But nothing happened. Weasked to speak with the people in chargeso we could tell them what wouldhappen if they blocked the river. Weorganized some protests.
We got nowhere. We weren’t allowedaccess to information. Not one local MPraised a hand to help us. Some peoplewere arrested, and others were beaten –even elderly people. Thugs from othervillages came to intimidate and hurt us.The community split into those for andagainst the dam. This conflict didn’t startwithin the community. It was brought fromoutside by people with power and money.
This made us learn how to explainourselves clearly. We felt we werebeing treated unfairly and takenadvantage of. We gradually becamemore confident in our ability to talkto journalists, academics, NGOs,environmentalists, and fair-mindedpeople from here and overseas.
– Mun river villager
After some protests, they gave us somecompensation for the three years whenwe could not fish because of the con-struction. But they said there would beeven more fish when the dam wascomplete. They would stock the areaabove the dam. They were building a fishladder so fish could still swim up from theMekong to breed.
But when the dam was completed in1994, many types of fish disappeared. Wecould not fish downstream from the dam
When developmentarrived so did con-flict, even withinfamilies. Villagerswho used to supportone other and livehappily together haddifferent ideas. Somewanted to protecttheir land and thenatural surroundingswhile others wantedmoney. Some soldtheir land to specula-tors.
– Mun river villager
Then they started construction. Whenthey dynamited the rapids we thoughtthe Laotian army was invading. We knewthe fish would disappear.
We came to understand that the societywas being fed bad information throughthe media. We had to expand ouralliance beyond the local communities.
We had to explain our problems toother people. We started going outto talk to people about our lives.
because strong currents damaged ourequipment. We could not fish upstreambecause fish could not jump the fishladder. People found they itched afterbathing in the river. Sediment filled thecataracts. The river bank was covered bywater hyacinth and giant weed.
There used to be plenty of fish, crabs,natural cataracts, and food sources.But these things are gone. We canno longer fish. We have no chance
Fish ladder at Pak Mun Dam.
Pho
to c
red
it: T
he
Nat
ion
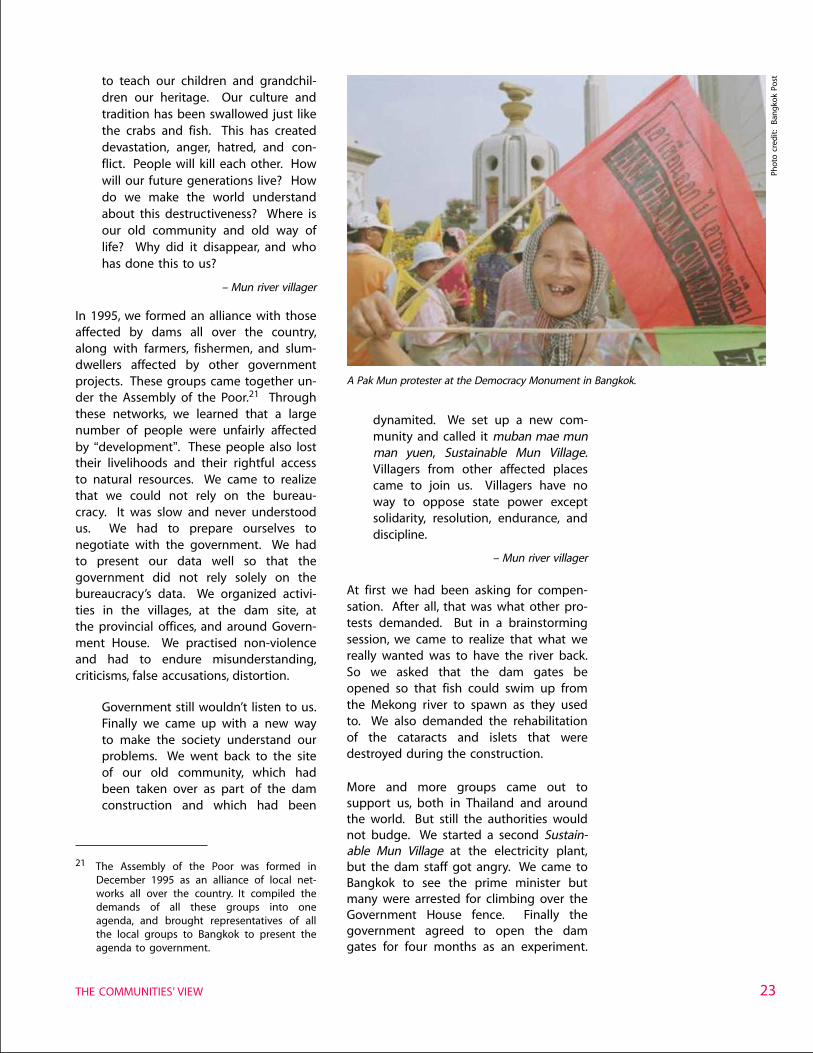
23
to teach our children and grandchil-dren our heritage. Our culture andtradition has been swallowed just likethe crabs and fish. This has createddevastation, anger, hatred, and con-flict. People will kill each other. Howwill our future generations live? Howdo we make the world understandabout this destructiveness? Where isour old community and old way oflife? Why did it disappear, and whohas done this to us?
– Mun river villager
In 1995, we formed an alliance with thoseaffected by dams all over the country,along with farmers, fishermen, and slum-dwellers affected by other governmentprojects. These groups came together un-der the Assembly of the Poor.21 Throughthese networks, we learned that a largenumber of people were unfairly affectedby “development”. These people also losttheir livelihoods and their rightful accessto natural resources. We came to realizethat we could not rely on the bureau-cracy. It was slow and never understoodus. We had to prepare ourselves tonegotiate with the government. We hadto present our data well so that thegovernment did not rely solely on thebureaucracy’s data. We organized activi-ties in the villages, at the dam site, atthe provincial offices, and around Govern-ment House. We practised non-violenceand had to endure misunderstanding,criticisms, false accusations, distortion.
Government still wouldn’t listen to us.Finally we came up with a new wayto make the society understand ourproblems. We went back to the siteof our old community, which hadbeen taken over as part of the damconstruction and which had been
dynamited. We set up a new com-munity and called it muban mae munman yuen, Sustainable Mun Village.Villagers from other affected placescame to join us. Villagers have noway to oppose state power exceptsolidarity, resolution, endurance, anddiscipline.
– Mun river villager
At first we had been asking for compen-sation. After all, that was what other pro-tests demanded. But in a brainstormingsession, we came to realize that what wereally wanted was to have the river back.So we asked that the dam gates beopened so that fish could swim up fromthe Mekong river to spawn as they usedto. We also demanded the rehabilitationof the cataracts and islets that weredestroyed during the construction.
More and more groups came out tosupport us, both in Thailand and aroundthe world. But still the authorities wouldnot budge. We started a second Sustain-able Mun Village at the electricity plant,but the dam staff got angry. We came toBangkok to see the prime minister butmany were arrested for climbing over theGovernment House fence. Finally thegovernment agreed to open the damgates for four months as an experiment.
21 The Assembly of the Poor was formed inDecember 1995 as an alliance of local net-works all over the country. It compiled thedemands of all these groups into oneagenda, and brought representatives of allthe local groups to Bangkok to present theagenda to government.
A Pak Mun protester at the Democracy Monument in Bangkok.
THE COMMUNITIES’ VIEW
Pho
to c
red
it:
Ban
gko
k Po
st
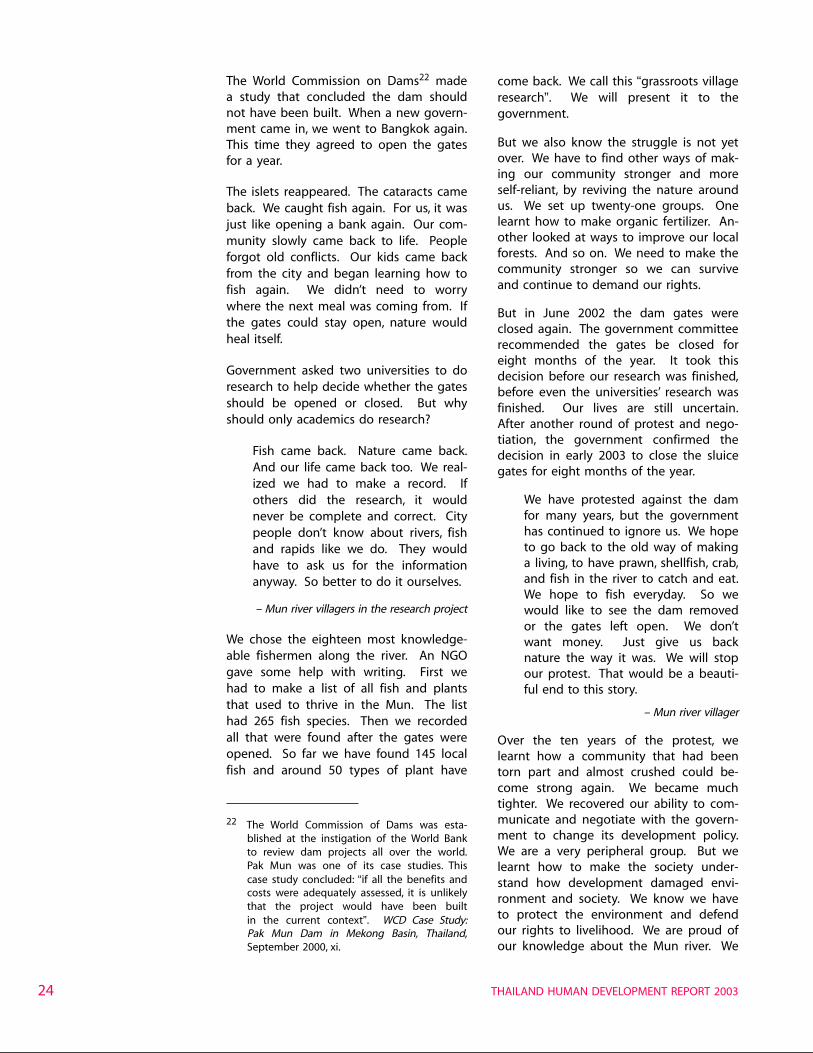
THAILAND HUMAN DEVELOPMENT REPORT 200324
The World Commission on Dams22 madea study that concluded the dam shouldnot have been built. When a new govern-ment came in, we went to Bangkok again.This time they agreed to open the gatesfor a year.
The islets reappeared. The cataracts cameback. We caught fish again. For us, it wasjust like opening a bank again. Our com-munity slowly came back to life. Peopleforgot old conflicts. Our kids came backfrom the city and began learning how tofish again. We didn’t need to worrywhere the next meal was coming from. Ifthe gates could stay open, nature wouldheal itself.
Government asked two universities to doresearch to help decide whether the gatesshould be opened or closed. But whyshould only academics do research?
Fish came back. Nature came back.And our life came back too. We real-ized we had to make a record. Ifothers did the research, it wouldnever be complete and correct. Citypeople don’t know about rivers, fishand rapids like we do. They wouldhave to ask us for the informationanyway. So better to do it ourselves.
– Mun river villagers in the research project
We chose the eighteen most knowledge-able fishermen along the river. An NGOgave some help with writing. First wehad to make a list of all fish and plantsthat used to thrive in the Mun. The listhad 265 fish species. Then we recordedall that were found after the gates wereopened. So far we have found 145 localfish and around 50 types of plant have
come back. We call this “grassroots villageresearch”. We will present it to thegovernment.
But we also know the struggle is not yetover. We have to find other ways of mak-ing our community stronger and moreself-reliant, by reviving the nature aroundus. We set up twenty-one groups. Onelearnt how to make organic fertilizer. An-other looked at ways to improve our localforests. And so on. We need to make thecommunity stronger so we can surviveand continue to demand our rights.
But in June 2002 the dam gates wereclosed again. The government committeerecommended the gates be closed foreight months of the year. It took thisdecision before our research was finished,before even the universities’ research wasfinished. Our lives are still uncertain.After another round of protest and nego-tiation, the government confirmed thedecision in early 2003 to close the sluicegates for eight months of the year.
We have protested against the damfor many years, but the governmenthas continued to ignore us. We hopeto go back to the old way of makinga living, to have prawn, shellfish, crab,and fish in the river to catch and eat.We hope to fish everyday. So wewould like to see the dam removedor the gates left open. We don’twant money. Just give us backnature the way it was. We will stopour protest. That would be a beauti-ful end to this story.
– Mun river villager
Over the ten years of the protest, welearnt how a community that had beentorn part and almost crushed could be-come strong again. We became muchtighter. We recovered our ability to com-municate and negotiate with the govern-ment to change its development policy.We are a very peripheral group. But welearnt how to make the society under-stand how development damaged envi-ronment and society. We know we haveto protect the environment and defendour rights to livelihood. We are proud ofour knowledge about the Mun river. We
22 The World Commission of Dams was esta-blished at the instigation of the World Bankto review dam projects all over the world.Pak Mun was one of its case studies. Thiscase study concluded: “if all the benefits andcosts were adequately assessed, it is unlikelythat the project would have been builtin the current context”. WCD Case Study:Pak Mun Dam in Mekong Basin, Thailand,September 2000, xi.
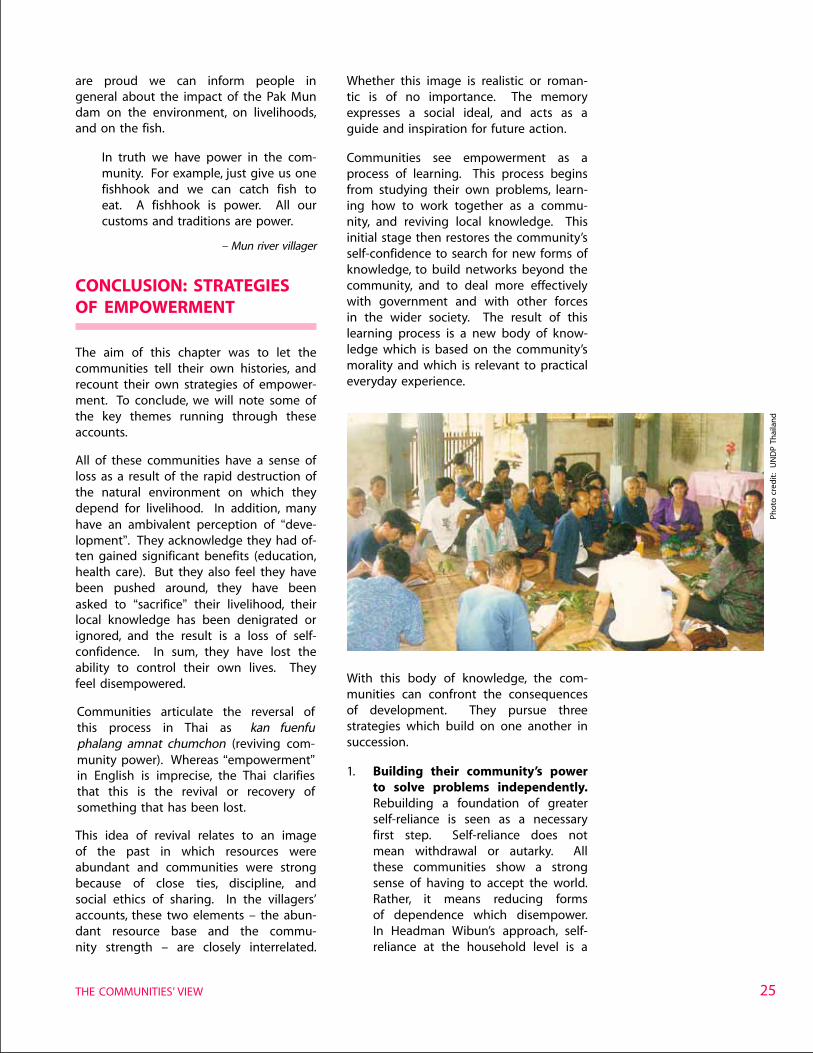
25
are proud we can inform people ingeneral about the impact of the Pak Mundam on the environment, on livelihoods,and on the fish.
In truth we have power in the com-munity. For example, just give us onefishhook and we can catch fish toeat. A fishhook is power. All ourcustoms and traditions are power.
– Mun river villager
CONCLUSION: STRATEGIESOF EMPOWERMENT
The aim of this chapter was to let thecommunities tell their own histories, andrecount their own strategies of empower-ment. To conclude, we will note some ofthe key themes running through theseaccounts.
All of these communities have a sense ofloss as a result of the rapid destruction ofthe natural environment on which theydepend for livelihood. In addition, manyhave an ambivalent perception of “deve-lopment”. They acknowledge they had of-ten gained significant benefits (education,health care). But they also feel they havebeen pushed around, they have beenasked to “sacrifice” their livelihood, theirlocal knowledge has been denigrated orignored, and the result is a loss of self-confidence. In sum, they have lost theability to control their own lives. Theyfeel disempowered.
Communities articulate the reversal ofthis process in Thai as kan fuenfuphalang amnat chumchon (reviving com-munity power). Whereas “empowerment”in English is imprecise, the Thai clarifiesthat this is the revival or recovery ofsomething that has been lost.
This idea of revival relates to an imageof the past in which resources wereabundant and communities were strongbecause of close ties, discipline, andsocial ethics of sharing. In the villagers’accounts, these two elements – the abun-dant resource base and the commu-nity strength – are closely interrelated.
Whether this image is realistic or roman-tic is of no importance. The memoryexpresses a social ideal, and acts as aguide and inspiration for future action.
Communities see empowerment as aprocess of learning. This process beginsfrom studying their own problems, learn-ing how to work together as a commu-nity, and reviving local knowledge. Thisinitial stage then restores the community’sself-confidence to search for new forms ofknowledge, to build networks beyond thecommunity, and to deal more effectivelywith government and with other forcesin the wider society. The result of thislearning process is a new body of know-ledge which is based on the community’smorality and which is relevant to practicaleveryday experience.
With this body of knowledge, the com-munities can confront the consequencesof development. They pursue threestrategies which build on one another insuccession.
1. Building their community’s powerto solve problems independently.Rebuilding a foundation of greaterself-reliance is seen as a necessaryfirst step. Self-reliance does notmean withdrawal or autarky. Allthese communities show a strongsense of having to accept the world.Rather, it means reducing formsof dependence which disempower.In Headman Wibun’s approach, self-reliance at the household level is a
THE COMMUNITIES’ VIEW
Pho
to c
red
it:
UN
DP
Thai
lan
d
THAILAND HUMAN DEVELOPMENT REPORT 200326
strategy to reduce the exposure torisk, debt, and other forms of de-pendence. The Bank of Life extendsthe same principle to the communitylevel by providing not only financialservices but also welfare and abase for other community projects.Greater self-reliance also means therecovery or re-valuation of localknowledge. The Karen and Hmongin the highlands resurrect theirknowledge of the forest in order toreduce their exposure to confusingand often flawed advice from out-side. Recovering local knowledge isalso the beginning of reviving theself-confidence to learn, adopt, andadapt.
2. Building their community power tonegotiate cooperation with outsideagencies. Communities negotiatewith government (and other centresof political and economic power) towin recognition, resources, and co-operation. To succeed in such nego-tiation, communities have to createsome social assets with which to bar-gain. The Samrong canal communi-ties reinvented themselves as anti-pollution agencies, not only to im-prove their immediate environment,but also to bargain with governmentfor rights to occupy the canal bank.Another key strategy for such nego-tiation is to expand networks amongneighbouring communities. TheKaren and Hmong in Mae Wangstarted by getting neighbouring com-munities together and then graduallyexpanded the range.
3. Building their community powerand networks to claim and protectcommunity rights. Communities’ability to maintain their livelihoodand way of life is limited by thepower of other social forces. To over-come these barriers, communitieshave learnt how to claim rights,particularly rights of access to naturalresources. To strengthen thoseclaims, they need the support ofothers. By building networks out-wards from the community to thebroader society, the communities can
kayai pun thi tang sangkhom (expandtheir space in the society), and try toovercome the disempowerment oftheir status as a minority or subordi-nate group. This is done in severalways. The Mae Wang hill communi-ties and the Pak Mun fishing commu-nities expanded their networks be-yond the immediate neighbourhoodto include similar communities else-where in the region and the nation.They tapped other resources inThailand’s growing civil society bymaking links with NGOs, sympatheticacademics, and media professionals.To do so, they had to acquire newskills, and had to be creative in theways they adjusted and representedtheir own knowledge and culture.The hill communities learnt howto reconceptualize their traditionalclaims on natural resources in themodern language of rights. Theyadapted their ceremonies honouringtrees to reflect modern environmen-tal concerns and couched them in aBuddhist idiom to appeal to thewider society. Through these strate-gies, these communities were able tomake public their claim of the rightto livelihood, the right to develop-ment.
Finally, it is worth noting something whichdoes not figure in these stories from thegrassroots. First, there is no sign of a“representative of the people”, of an MP orelected member of local government.Second, there is no reference to the useof legal process. On the basis of theseexamples, we would have to concludethat formal democracy and the legalsystem are not effective means of com-munity empowerment in a direct sense.23
In the next chapter, we place the commu-nities’ own view of their history into thewider context of the nation, and thenlook at how pressure from communities,their supporters, and other social forceshave begun to change the institutionalcontext.
23 The indirect importance of democratizationwill be considered in chapter 2.
27
The democracy we have today is aforum for those with power andprivilege, for the bankers and indus-trialists. It isn’t a forum for the smallfarmers, the slum-dwellers, thosewith AIDS, and all those many otherswho are socially disadvantaged anddeprived.
– Nithi Eiewsriwong24
The late 1990s saw a series of changesin the institutional context of Thaigovernment which have the potential torevolutionize the relations between stateand society. These institutional changeshave great importance for communityempowerment.
This chapter is divided into four sections.The first sketches the emergence of ahighly centralized state, and its adoptionof top-down development planning fromthe 1950s onwards. The second sectionsets the history of local communities,as related in chapter 1, within the largercontext of the nation’s social and eco-nomic change, and shows how a commu-nity voice contributed to the pressure forinstitutional change in the 1990s.
The third section examines four mainchanges in the institutional context whichhave taken place since the mid-1990sand which have relevance for communityempowerment: the “People’s Constitution”of 1997; the switch to “people-centred
development” in the Eighth and NinthEconomic and Social Development Plans;democratic decentralization; and educa-tion reform.
The fourth section discusses certain waysin which the potential of these reformshave not been realized. Although theenvironment for community empower-ment has changed significantly, there isstill a great degree of inertia or outrightopposition carried over from Thailand’sconservative traditions.
CENTRALIZATION ANDTOP-DOWN DEVELOPMENT
The institutional changes in the 1990sare remarkable because they represent aconcerted and broad challenge to thecentralized, top-down, and urban-biasedcharacter of Thai government over theprevious century.
The modern Thai state constructed at theturn of the twentieth century was highlycentralized. The basic administrativesystem was adopted from neighbouringcolonial territories, and remained un-changed even after similar systems hadbeen swept away by decolonizationelsewhere.25 The absolute monarchy wasconverted into a constitutional monarchyin 1932, but the administrative frame waslargely untouched. American academics
CHAPTER
THE NEW INSTITUTIONAL CONTEXT FORCOMMUNITY EMPOWERMENT
2
24 Nithi Eiewsriwong, Khon Jon and NayobuyKan Tam Hai Jon Kong Rath (The Poor andthe State’s Impoverishment Policy) ThailandDevelopment Support Committee, 2000.
25 Thailand was never formally colonized andhence experienced no popular movementagainst colonial rule and colonial rulingsystems.
The democracywe have today isa forum for thosewith power andprivilege, for thebankers andindustrialists.
– Nithi Eiewsriwong
THE NEW INSTITUTIONAL CONTEXT FOR COMMUNITY EMPOWERMENT
THAILAND HUMAN DEVELOPMENT REPORT 200328
in the 1960s invented the term “bureau-cratic polity” to describe Thailand’s official-dominated governmental system. Pres-sure for democratic parliaments wasblocked by the rise of military dictatorshipwhich continued into the Cold War era.Student protests in 1973-6 prepared theway for a gradual transition to parliamen-tary democracy in the 1980s. But therewas still no significant reform of thepublic services. In particular, observers ofrural administration in the 1990s claimedthat the “bureaucratic polity” was asstrong as ever in the provinces. Until veryrecently, the Thai state was both verycentralized and undemocratic. A paternalmentality is etched into the bureaucracy.
This centralized and bureaucratic systemadopted a top-down and urban-biasedapproach to economic development. Thefirst development plan was launched in1961. This plan and all its successors untilthe mid-1990s put the priority on eco-nomic growth achieved primarily throughthe development of industry and theurban economy under private enterprise.Government’s role was to develop thebasic infrastructure for growth – transport,energy, irrigation – and to encourageinvestors, domestic and foreign, throughpromotional packages, strategies to lowerwages, and efforts to boost investorconfidence. In their own terms, theseplans can be considered a signal success.Thailand achieved an average real growthrate of 7.5 per cent sustained overfour decades (1957-97). The averageper capita income multiplied seven times.The proportion classified below thepoverty line fell from 57 per cent (1962/3)to 6 per cent (1998). Thailand was trans-formed from one of the more backwardand agrarian countries of Eastern Asia intoa candidate for Newly IndustrializingCountry (NIC) status.
Through the 1960s and 1970s, against thebackground of the Indochinese conflictand internal insurgency, economic policy-making was also geared to national secu-rity. Economic growth and the creation ofa strong entrepreneurial class were seenas ways to preempt political conflict.Business organizations were formed toinfluence policy-making, especially the
“Big Three” – the Board of Trade, ThaiBankers Association, and Federation ofThai Industries. Businessmen also gaineda voice in the drafting of the five-yearplans. Military rulers and business leadersbecame linked in webs of political andeconomic influence. From the early1980s, businessmen dominated the parlia-ments and frequently commanded theeconomic ministries. Multinational com-panies, which entered Thailand in growingnumbers, added to the trend towardscentralization, urban bias, and businessdominance.
This concern with urban growth andnational security pushed other goals –such as participation, environmental pro-tection, and equity – to the sidelines. In1975, at the climax of the Indochinesewar, the government launched a plan tochannel money to the grassroots as a wayto stimulate the economy and spread thebenefits more widely. But once this crisispassed, government returned to top-downapproaches. In the 1980s, poverty eradi-cation became a more significant part ofthe planning agenda. The Fifth Plan(1982-86) included a poverty plan whichidentified the 12,555 poorest villages forspecial treatment inspired by the BasicNeeds approach. But such efforts werehandled by central agencies with littleconcession to participation.
Outside development agencies largelyconformed to this pattern of develop-ment. They concentrated on buildingthe capability of government agenciesand other centralized institutions. Theyshowed little enthusiasm for working withlocal groups or non-governmental organi-zations.
Development was growth-based, top-down, industry-led, and urban-biased. Thehigh rate of growth came at a consider-able cost, particularly in terms of thedestruction of the natural environment,relocation of people, neglect of agricul-ture, and widening of the gap betweenrich and poor. In the 1990s, demandsfor greater political openness and socialjustice challenged both the politicalframework and the direction of economicpolicy.
This concern withurban growth and
national securitypushed other goals –
such as participation,environmental
protection, andequity – to the
sidelines.
29
COMMUNITY HISTORIES ANDINSTITUTIONAL CHANGE
In many ways Thai communities areexactly like any other – groups of peoplewhich congregate for survival, defence,mutual aid, and other social benefits. Butin other ways they are the product oftheir special history. The communities’great sense of loss from the destructionof the natural environment, which figuresso prominently in the previous chapter, isbest understood in this historical context.Thai communities experienced an age ofgreat abundance and freedom which veryabruptly came to an end. The memory ofthat era, and the contrast with the era of“development”, has inspired a communityrole in a broader civil society movementwhich triggered institutional change inthe 1990s.
The age of abundance
Less than two centuries ago, most of thespace occupied by modern Thailand wasunpopulated. Most people were settlednear a few urban centres and bound byfeudal ties. Over the nineteenth centurythese feudal ties broke down, and a newlyfree peasantry expanded into large tractsof unoccupied land. Siam became anexporter of rice but farmers were onlyloosely connected to the market. Theyexploited the great abundance andbiodiversity of the environment. Theycontinued to use local knowledge andlocal technology. No outside force –government or merchant – intruded tochange production systems. Until themid-twentieth century, even in the mostadvanced central region, communities stillproduced primarily for their own use,and sold only the surplus. They boughtsome goods from the expanding market,but they also retained local crafts likeweaving. As the stories in chapter 1showed, this period of abundance andindependence lasted long enough toremain part of the cultural memory downto the present.
As a result of this frontier experience,most communities are very new. Manypeople moved to the new land frontier.Others migrated from neighbouring coun-tries voluntarily or forcibly because of war.Several millions came from China to settlein towns and villages. The land frontiercontinued to expand until the late 1980s.Over 80 per cent of rural communitieshave been founded in the past twogenerations. Urban communities are evennewer as the big movements from villageto city have taken place since 1980.
That means very few Thai communitieshave a long history in the same place.There is no strong concept of an “ances-tral village”. But that does not meancommunity is not important. Indeed, peo-ple usually move in community groups.They need to cooperate for defenceand survival. Communities are boundtogether by kin ties. In others, peoplesimply treat their neighbours as if theywere connected by blood. They havecultural techniques to define and bindpeople together – a central village pillar,village and ancestral spirits, annual festi-vals to redefine the community. Theseare highly portable. In the north, excep-tionally strong communities are builtaround the cooperation needed for irriga-tion. In the northeast, strong communi-ties are created by the sheer difficulties ofsurvival in a harsh environment.
The coming of development
The communities faced big changes fromthe 1950s onwards. Government enteredto develop agriculture for export. It pro-moted new technologies of seed, mecha-nization, and chemicals in place of localpractice. It advocated monocultures inplace of mixed farming. Villagers weremore tied to the market, and morevulnerable to its risks.
Local communities were much moresubject to government direction. Govern-ment set up new central offices todirect economic policy. The bureaucracymultiplied in size (from 75,000 in1944 to 250,000 in 1965). Officials wereposted to the villages and local towns.
THE NEW INSTITUTIONAL CONTEXT FOR COMMUNITY EMPOWERMENT
Thai communitiesexperienced an ageof great abundanceand freedom whichvery abruptly cameto an end.
THAILAND HUMAN DEVELOPMENT REPORT 200330
Communities were now subordinate to anew group of people whose differencefrom the villagers was symbolized by theiruniforms and their grand new offices.
The communities’ own knowledge wasdowngraded by new knowledge issuingfrom the government, from schools, andfrom radio and TV. Communities becamereceivers of knowledge.
This era of development coincided withthe Cold War and the fear that Maoistcommunism would infiltrate into Thaivillages. Government imposed a firm gripon rural society through police, militaryunits, and informal means. Local leadersand local organizations were oftencrushed. The era of dictatorship anddevelopment cultivated a new breed oflocal “godfathers” or “dark influences” –robber baron capitalists who used links tothe power elite to dominate new com-mercial opportunities, legal and illegal.
The results were very dramatic. Agricul-ture expanded rapidly. Populationboomed. The environment was radicallyaltered, especially by the destruction offorests and the pollution of waterways.Many villagers became more prosperous,but at the same time there was a risinglevel of risk. Debt increased. The landfrontier ran out. The income gapbetween rich and poor, the cultural gapbetween village and city, and the powergap between bureaucracy and commu-nity, all gaped wider.
New ideas and organizations
Reactions began in the 1970s andexpanded in the 1980s as the Cold Warsubsided, the extent of environmental andsocial damage became apparent, and aslocal people were emboldened to resist.
The first stirrings came around 1970.“Development” monks encouraged vil-lagers to organize for self-help. A leadingtechnocrat, Puey Ungphakorn, foundeda pioneering NGO dedicated to ruraluplift through self-reliance. Local activistsdebated whether development policyshould be changed by political activism(the “political economy approach”) orindependent grassroots work (the “com-munity culture approach”). Local protestsarose over debt, land tenure, and accessto water.
In 1973, students in the city rebelledagainst military rule. Some of the leadersforged alliances with the emerging ruralactivism. But in 1975-6, the army retookthe initiative, the student movementwas crushed, and several rural leaderswere shot. However, the student upsurgehad generated pressure for democracywhich gradually gained successes in the1980s. The decline of military dictatorshipopened up space for new forms ofpolitical action.
After the experience of 1973-6, manyactivists sought ways to change thedevelopment strategy without provokingviolent confrontation. They debated newapproaches to development, formedNGOs, and sought ways to mobilizepeople for change.
Community Thinking
Thinking about the role of the community in development practice beganin the late 1970s among pioneers of grassroots development work,especially Niphot Thianwihan. From his experience with hill communitiesand other peripheral groups, Niphot argued that development strategieswhich imposed change on villages were wrong-headed. Development,Niphot argued, should build on the culture, history, and ethics ofthe community itself. In the late 1980s a historian, Chatthip Nartsupha,reviewed writings by Niphot and others, and dubbed it the “communityculture” approach. His article, published in Thai and English, propelled theseideas into a wider debate.
Although the community approach was fiercely criticized by some forbeing romantic and backward-looking, its influence on developmentactivists grew. Several prominent figures contributed to the debate. SanehChamarik, an academic who retired from the university to run localdevelopment projects, argued that the community was important becauseit symbolized important human values of mutual assistance and ethicalconduct. Both Saneh and Prawase Wasi, a medical doctor involved withhealth NGOs, associated the community with values found in Buddhism –especially the restraint of greed. This Buddhist approach argued thatcommunities should pursue “sufficiency” and “self-reliance”.
In a different direction, Anan Ganjanaphan, an academic active on hillpeople’s issues, argued that the “community culture” approach was toopassive, and that self-reliance was impossible for many villagers becausethey lacked access to natural resources. He encouraged communities toadopt the idea of rights in order to defend or recover access to land, forests,and water. Others like Pitthaya Wongkun and Narong Petprasert promotedthe idea of “community businesses” designed to enhance the well-being ofthe community rather than simply make a profit.
31
Several of these activists seized on theidea of the community to serve as abasis for alternatives to the top-down anddestructive policy of development begunin the 1950s. They argued that develop-ment should begin from the communityupwards, should pay attention to localwisdom, and should respect local cultureand history in order to rebuild the com-munities’ self-confidence. These thinkerswere criticized for idealizing the com-munity and exaggerating its historicalimportance. Yet their ideas were powerfulin inspiring a generation of local leadersand NGO activists.
Boom, crisis, and reform
From the mid-1980s, the Thai economywent on a rollercoaster ride of boom andbust. For local communities, this was likea combination punch. First, the urbanboom downgraded the importance ofagriculture in the national economy,ripped millions of young people out ofthe local communities to work in factories,intensified the feelings of urban superio-rity and rural subordination, and widenedthe income gap. Then, the economic bustof 1997 threw thousands of migrants backon the support of the village economy,collapsed agricultural prices, and addedthree million people – mostly rural – tothe ranks of the poor.
These rollercoaster years totally changedthe nature of local communities, theirview of themselves, and their role in thenational polity.
The boom years accelerated the declineof the natural environment with conti-nued forest destruction and growingindustrial pollution. In addition, thebooming urban economy took increasingcontrol of natural resources such as landand water which the communities neededfor survival. Sometimes this was donethrough state power (dams, power plants).Sometimes this happened because ofurban entrepreneurs’ superior ability toexploit a loose regulatory environment
(land grabbing). The destruction of natu-ral resources and denial of access createda crisis for many communities, and animperative to find new forms of politicalaction.
The boom years also saw the growth of“money politics”. Local godfathers trans-formed themselves into representativesof the people. Businessmen dominatedparliament. The formal political systemwas useless for expressing communitydiscontent. Rural people were effectivelyexcluded from parliament which becamea clearing house for business deals. ManyMPs were businessmen directly involvedin the destruction or seizure of naturalresources. Communities sought alternateways to express their views and defendtheir livelihood. The number of localmovements multiplied. So did thenumber of NGOs.
In the late 1980s, the NGO movementdeveloped two streams. The first assistedpeople’s movements and coordinatednetworks and protests. Through the1990s, the number of rural protests greatlyexpanded. The major issues were debt,access to natural resources, and theimpact of government developmentprojects. Many new network organiza-tions were formed such as the NorthernFarmers Network, Association of SmallscaleFarmers of the Northeast, and Network ofCoastal Fishermen. The founding of theAssembly of the Poor (AOP) in December1995 was a landmark. The AOP was analliance of local communities with grie-vances over access to forest, the impact ofdams, and similar issues. Unlike mostfarmers’ protests, which generally aimedto obtain immediate temporary assistancefrom the government, the AOP organizeda sustained campaign calling for a long-term reform agenda. The AOP made aclear distinction between its constituents(the local communities) and its alliancepartners (NGOs and academics) in orderto parry accusations that NGOs andacademics were driving AOP’s agenda, notthe people themselves.
THE NEW INSTITUTIONAL CONTEXT FOR COMMUNITY EMPOWERMENT
The formal politicalsystem was uselessfor expressingcommunitydiscontent. Ruralpeople wereeffectively excludedfrom parliamentwhich became aclearing house forbusiness deals.
THAILAND HUMAN DEVELOPMENT REPORT 200332
The second stream of the NGO movementsought to influence government decision-making at the centre. Several establishedfigures lent weight to this stream ofthe NGO movement, such as Paiboon
Wattanasiritham who left a banking careerto head the Thai Rural ReconstructionMovement in 1988. Government re-sponded by setting up bipartite umbrellaorganizations and by gradually drawingsome NGOs into policy making. By theearly 1990s, these NGOs were gainingaccess to policy making in areas of health,education, poverty eradication, and com-munity development. At the same time,some senior technocrats became moreconcerned about the destruction of theenvironment, widening income gap, ne-glect of agriculture, and growing signs ofpolitical discontent. In the early 1990s,leadership of the planning agency passedfrom a keen advocate of urban growth toan enthusiast for rural uplift. The SeventhPlan (1992-96) tentatively began a shifttowards a more balanced strategy.
Although the two streams of NGOspursued different strategies, they cooper-ated and exchanged information. Impor-tantly, both streams – and particularlythose involved in policy-making –adopted the thinking that the local com-munity was the important unit for chang-ing policy-making from a top-down tobottom-up perspective. The discussion onthe meaning of the community becamemuch more complex. The importance ofthe community was now based not somuch on its history (true or false), butrather on its ability to symbolize valueswhich differed from urban capitalism,and its practical role as a basis for moreequitable policies. The community cultureapproach was recognized as too passive.Leading activists joined the communityidea together with human rights to makea powerful argument for communityrights – particularly over natural resources.Other thinkers gave the community ideamore weight by linking it with Buddhistvalues.
NGOs also allied with democracy activiststo campaign for constitutional reform.After a military coup and another bloodypro-democracy protest in 1991-2, thecombined strength of old and currentstudent activists, NGO organizations, andbusiness groups demanded a major
Buddhism, Economics,and Community
In the 1980s, the leading Buddhistscholar P. A. Payutto (Phra Thammapidok)wrote about a Buddhist approach toeconomics. The aim of economics, asof all human philosophizing, he argued,should be “well-being” leading tocontentment. Using Buddhist textsabout the importance of avoidinggreed and excess, he criticized theacquisitiveness built into the disciplineof economics. In Buddhist economics,he argued, “in contrast to the classicaleconomic equation of maximumconsumption leading to maximumsatisfaction, we have moderate or wiseconsumption, leading to well-being”.
From this Buddhist approach camethe importance of the concepts ofsufficiency and self-reliance. Sufficien-cy (pho yu pho kin) summarizes theBuddhist concept of moderation as anantidote to acquisitiveness, by assert-ing that well-being can be achieved bylimiting desires rather than expandingproduction. Self-reliance (phung toneng) expresses the freedom gained bythe lack of any dependence, bothmaterial and mental.
By the 1990s, several thinkers (includ-ing Payutto and Prawase Wasi) hadintegrated these concepts into thinkingabout the role of the community, byarguing that the community was thesocial unit within which these conceptscould be realized. An economicsprofessor, Apichai Puntasen, beganteaching a course on Buddhist eco-nomics, and published a large treatiseon the subject which thoroughlycriticized the mainstream discipline,expanded on Payutto’s use of textualreferences to give weight to conceptsof sufficiency and self-reliance, andoffered models of business enterprisedesigned for social gain rather thanprivate profit.
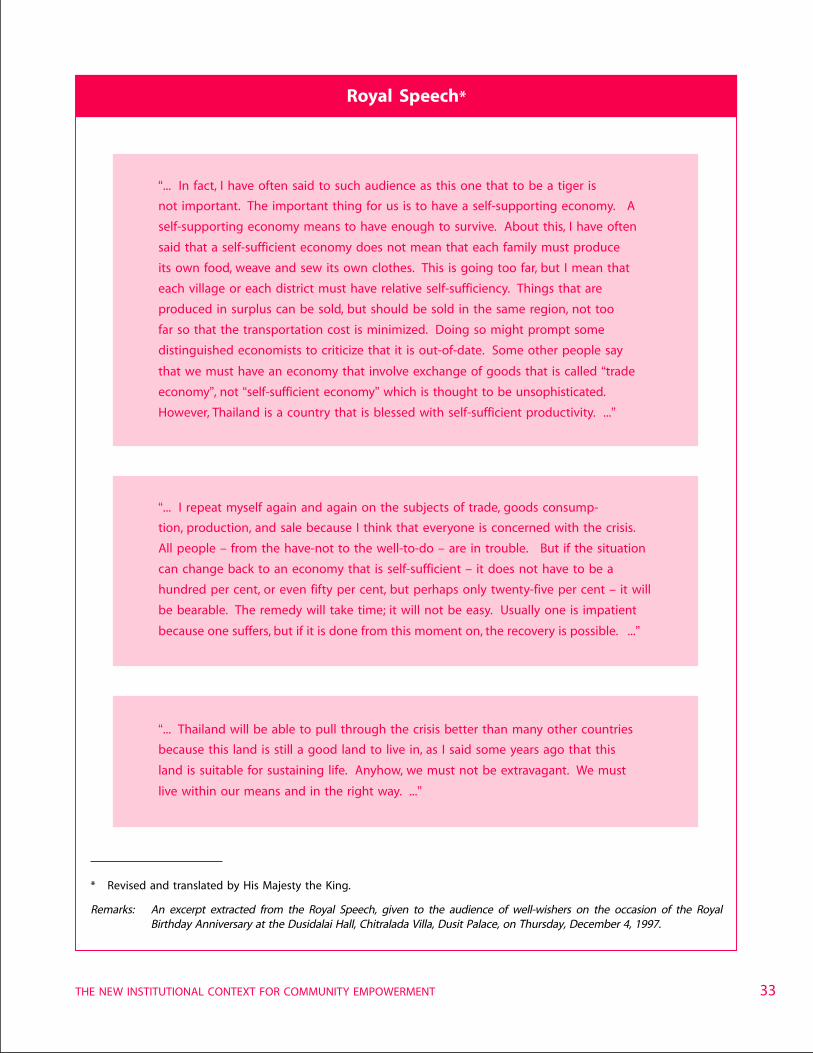
33
“... In fact, I have often said to such audience as this one that to be a tiger is
not important. The important thing for us is to have a self-supporting economy. A
self-supporting economy means to have enough to survive. About this, I have often
said that a self-sufficient economy does not mean that each family must produce
its own food, weave and sew its own clothes. This is going too far, but I mean that
each village or each district must have relative self-sufficiency. Things that are
produced in surplus can be sold, but should be sold in the same region, not too
far so that the transportation cost is minimized. Doing so might prompt some
distinguished economists to criticize that it is out-of-date. Some other people say
that we must have an economy that involve exchange of goods that is called “trade
economy”, not “self-sufficient economy” which is thought to be unsophisticated.
However, Thailand is a country that is blessed with self-sufficient productivity. ...”
THE NEW INSTITUTIONAL CONTEXT FOR COMMUNITY EMPOWERMENT
* Revised and translated by His Majesty the King.
Remarks: An excerpt extracted from the Royal Speech, given to the audience of well-wishers on the occasion of the RoyalBirthday Anniversary at the Dusidalai Hall, Chitralada Villa, Dusit Palace, on Thursday, December 4, 1997.
Royal Speech*
“... I repeat myself again and again on the subjects of trade, goods consump-
tion, production, and sale because I think that everyone is concerned with the crisis.
All people – from the have-not to the well-to-do – are in trouble. But if the situation
can change back to an economy that is self-sufficient – it does not have to be a
hundred per cent, or even fifty per cent, but perhaps only twenty-five per cent – it will
be bearable. The remedy will take time; it will not be easy. Usually one is impatient
because one suffers, but if it is done from this moment on, the recovery is possible. ...”
“... Thailand will be able to pull through the crisis better than many other countries
because this land is still a good land to live in, as I said some years ago that this
land is suitable for sustaining life. Anyhow, we must not be extravagant. We must
live within our means and in the right way. ...”
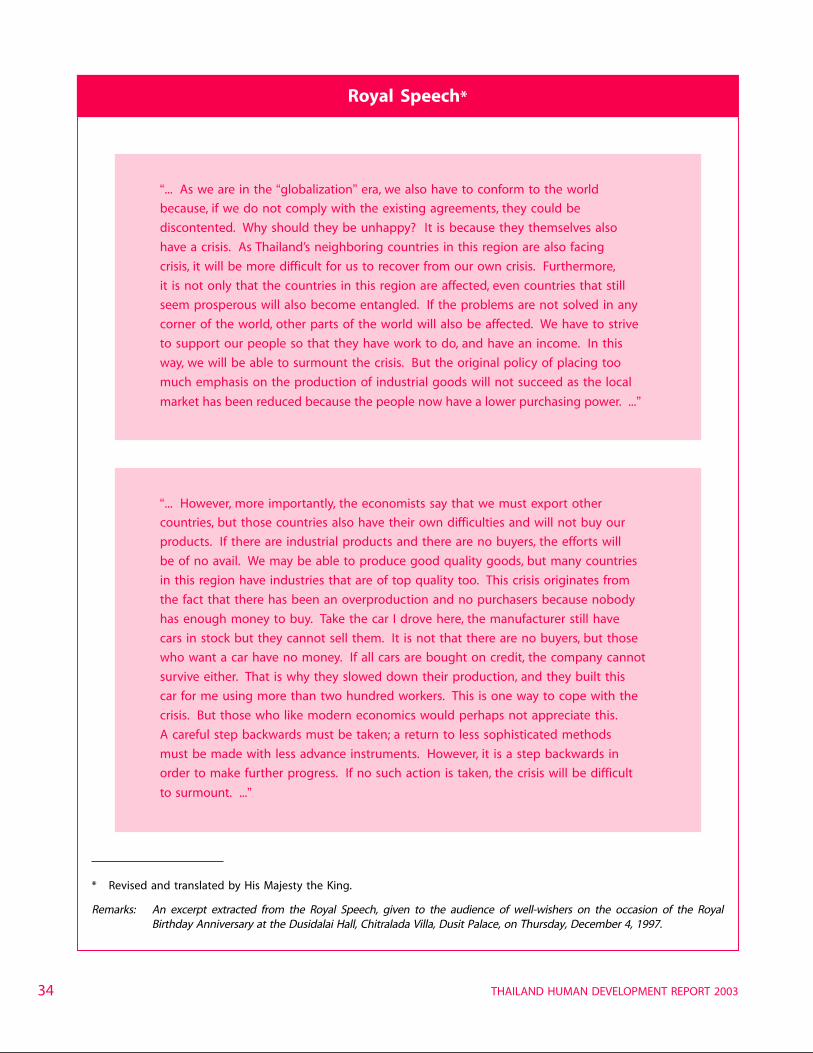
THAILAND HUMAN DEVELOPMENT REPORT 200334
“... As we are in the “globalization” era, we also have to conform to the world
because, if we do not comply with the existing agreements, they could be
discontented. Why should they be unhappy? It is because they themselves also
have a crisis. As Thailand’s neighboring countries in this region are also facing
crisis, it will be more difficult for us to recover from our own crisis. Furthermore,
it is not only that the countries in this region are affected, even countries that still
seem prosperous will also become entangled. If the problems are not solved in any
corner of the world, other parts of the world will also be affected. We have to strive
to support our people so that they have work to do, and have an income. In this
way, we will be able to surmount the crisis. But the original policy of placing too
much emphasis on the production of industrial goods will not succeed as the local
market has been reduced because the people now have a lower purchasing power. ...”
* Revised and translated by His Majesty the King.
Remarks: An excerpt extracted from the Royal Speech, given to the audience of well-wishers on the occasion of the RoyalBirthday Anniversary at the Dusidalai Hall, Chitralada Villa, Dusit Palace, on Thursday, December 4, 1997.
Royal Speech*
“... However, more importantly, the economists say that we must export other
countries, but those countries also have their own difficulties and will not buy our
products. If there are industrial products and there are no buyers, the efforts will
be of no avail. We may be able to produce good quality goods, but many countries
in this region have industries that are of top quality too. This crisis originates from
the fact that there has been an overproduction and no purchasers because nobody
has enough money to buy. Take the car I drove here, the manufacturer still have
cars in stock but they cannot sell them. It is not that there are no buyers, but those
who want a car have no money. If all cars are bought on credit, the company cannot
survive either. That is why they slowed down their production, and they built this
car for me using more than two hundred workers. This is one way to cope with the
crisis. But those who like modern economics would perhaps not appreciate this.
A careful step backwards must be taken; a return to less sophisticated methods
must be made with less advance instruments. However, it is a step backwards in
order to make further progress. If no such action is taken, the crisis will be difficult
to surmount. ...”
35
constitutional revision to move Thailandfinally beyond dictatorship. Communityadvocates played a part. A network of461 NGOs submitted a platform of recom-mendations to the constitutional draftingcommittee. This NGO lobby focused onfive areas: community’s rights of accessto and management of local naturalresources; rights of ethnic minorities topreserve their language and culture;government’s duty to pay equitablecompensation to those affected by deve-lopment projects; government’s duty topromote self-reliant agriculture; andgovernment’s duty to support alternativelocal approaches to education. The“People’s Constitution” was approved inOctober 1997.
The economic collapse of 1997 puncturedthe faith in the superiority and reliabilityof the urban economy, and refocusedattention on the countryside and the ruralcommunity which cushioned the socialshock. The King’s speech in December1997 (see box) highlighted ideas of suffi-ciency and self-reliance, which wereimportant parts of community thinking, asstrategies to survive the crisis. Debate onthe role of the community was thrust intothe mainstream. In devising anti-crisisprogrammes, government chose to relymore than ever before on local communi-ties, and often to by-pass its own adminis-trative channels (see chapter 3). Ideas ofcommunity empowerment gained much
Mainstreaming the Community
In the mid-1990s, community thinking moved from the NGOs and activists to the main-stream. Many people helped to achieve this shift. But one seemed to represent it in thepublic eye. Mo [doctor] Prawase had won the Magsaysay award26 for his work with healthNGOs in the 1970s. He wrote and spoke often on a modern Buddhist approach to life. Inthe late 1980s, he worked with the Local Development Institute which spearheaded thepressure to gain an NGO role in policy-making. He began to advocate a “holistic” approachto development which supplanted “growth” with a Buddhist concept of “well-being”achieved by developing “learning communities”. In the early 1990s, NESDB absorbed thisapproach into its plan-making. In 1994, Prawase publicly challenged the prime minister toinitiate reform of the constitution, and lobbied for the inclusion of community concerns. In1997, he blamed the economic crisis on the misguided approach to development, andspoke loudly and often on the need to mobilize “social energy” in order to rebuild a “moraleconomy” on the basis of learning communities.
26 Sometimes dubbed the “Asian Nobel Prize”,this award, named after a former presidentof the Philippines, is given in recognition ofoutstanding social contribution.
greater acceptance, not in all ministries,but certainly in several which had tomobilize rapidly to counter the socialimpact of the crisis.
In sum, over the 1990s the idea that thecommunity could serve as the basis forreversing the inequitable top-down deve-lopment strategy moved firmly into themainstream. The significance of the eco-nomic crisis was not that it stimulatedthinking along these lines. That had beendeveloping for some time. Rather, in thecrisis such thinking gained a much wideraudience among the urban middle class,and some government (and international)agencies adopted a community-basedstrategy in devising relief strategies.
By the early 1990s, the combined effortsof grassroots community protests, pro-democracy organizations, and sympathetictechnocrats had created powerful pres-sures for change in both the politicalframework and the orientation of deve-lopment policy. Over the late 1990s, thepressures forced four institutional shifts ofimportance for community empowerment.The first of these was the “People’s Consti-tution” promulgated in October 1997.
THE NEW INSTITUTIONAL CONTEXT FOR COMMUNITY EMPOWERMENT
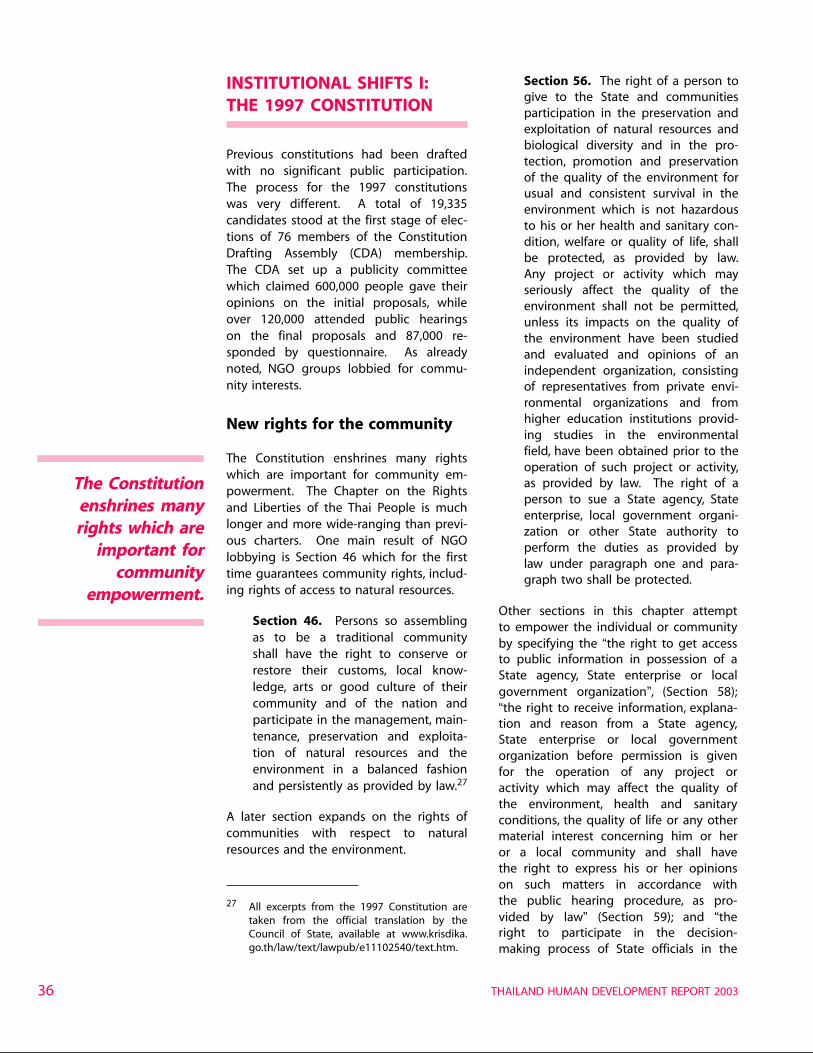
THAILAND HUMAN DEVELOPMENT REPORT 200336
INSTITUTIONAL SHIFTS I:THE 1997 CONSTITUTION
Previous constitutions had been draftedwith no significant public participation.The process for the 1997 constitutionswas very different. A total of 19,335candidates stood at the first stage of elec-tions of 76 members of the ConstitutionDrafting Assembly (CDA) membership.The CDA set up a publicity committeewhich claimed 600,000 people gave theiropinions on the initial proposals, whileover 120,000 attended public hearingson the final proposals and 87,000 re-sponded by questionnaire. As alreadynoted, NGO groups lobbied for commu-nity interests.
New rights for the community
The Constitution enshrines many rightswhich are important for community em-powerment. The Chapter on the Rightsand Liberties of the Thai People is muchlonger and more wide-ranging than previ-ous charters. One main result of NGOlobbying is Section 46 which for the firsttime guarantees community rights, includ-ing rights of access to natural resources.
Section 46. Persons so assemblingas to be a traditional communityshall have the right to conserve orrestore their customs, local know-ledge, arts or good culture of theircommunity and of the nation andparticipate in the management, main-tenance, preservation and exploita-tion of natural resources and theenvironment in a balanced fashionand persistently as provided by law.27
A later section expands on the rights ofcommunities with respect to naturalresources and the environment.
Section 56. The right of a person togive to the State and communitiesparticipation in the preservation andexploitation of natural resources andbiological diversity and in the pro-tection, promotion and preservationof the quality of the environment forusual and consistent survival in theenvironment which is not hazardousto his or her health and sanitary con-dition, welfare or quality of life, shallbe protected, as provided by law.Any project or activity which mayseriously affect the quality of theenvironment shall not be permitted,unless its impacts on the quality ofthe environment have been studiedand evaluated and opinions of anindependent organization, consistingof representatives from private envi-ronmental organizations and fromhigher education institutions provid-ing studies in the environmentalfield, have been obtained prior to theoperation of such project or activity,as provided by law. The right of aperson to sue a State agency, Stateenterprise, local government organi-zation or other State authority toperform the duties as provided bylaw under paragraph one and para-graph two shall be protected.
Other sections in this chapter attemptto empower the individual or communityby specifying the “the right to get accessto public information in possession of aState agency, State enterprise or localgovernment organization”, (Section 58);“the right to receive information, explana-tion and reason from a State agency,State enterprise or local governmentorganization before permission is givenfor the operation of any project oractivity which may affect the quality ofthe environment, health and sanitaryconditions, the quality of life or any othermaterial interest concerning him or heror a local community and shall havethe right to express his or her opinionson such matters in accordance withthe public hearing procedure, as pro-vided by law” (Section 59); and “theright to participate in the decision-making process of State officials in the
27 All excerpts from the 1997 Constitution aretaken from the official translation by theCouncil of State, available at www.krisdika.go.th/law/text/lawpub/e11102540/text.htm.
The Constitutionenshrines manyrights which are
important forcommunity
empowerment.
37
performance of administrative functionswhich affect or may affect his or herrights and liberties, as provided by law”(Section 60).
New directives for greaterparticipation
Equally innovative is the Chapter on“Directive Principles of Fundamental StatePolicies” which mandates the state tostrengthen local communities and pro-mote community participation in nationaldecision-making.
Section 76. The State shall promoteand encourage public participation inlaying down policies, making decisionon political issues, preparing eco-nomic, social and political develop-ment plans, and inspecting the exer-cise of State power at all levels.
Section 78. The State shall decen-tralize powers to localities for thepurpose of independence and self-determination of local affairs, developlocal economics, public utilities andfacilities systems and information in-frastructure in the locality thoroughlyand equally throughout the countryas well as develop into a large-sized local government organizationa province ready for such purpose,having regard to the will of thepeople in that province.
Section 79. The State shall promoteand encourage public participation inthe preservation, maintenance andbalanced exploitation of natural re-sources and biological diversity andin the promotion, maintenance andprotection of the quality of theenvironment in accordance with thepersistent development principle aswell as the control and eliminationof pollution affecting public health,sanitary conditions, welfare and qua-lity of life.
In addition this Chapter contained severaldirectives to alter the direction of nationaleconomic policy.
Section 83. The State shall imple-ment fair distribution of incomes.
Section 84. The State shall organizethe appropriate system of the hold-ing and use of land, provide sufficientwater resources for farmers and pro-tect the interests of farmers in theproduction and marketing of agricul-tural products to achieve maximumbenefits, and promote the assemblingof farmers with a view to layingdown agricultural plans and protect-ing their mutual interests.
Also, for the first time a Thai constitutionmentions human dignity.
Section 4. The human dignity, rightand liberty of the people shall beprotected.
New institutions for democracy
The Constitution also founds several newinstitutions designed to act as checks andbalances on the action of administratorsand politicians, and to strengthen theindividual or community in dealing withthe state. These include a strengthenedNational Counter Corruption Commission,new Constitutional Court, Ombudsman,and Administrative Courts which will hearcases against government bodies.
Amongst these new institutions, theConstitution established a National Eco-nomic and Social Council as a meansto increase participation in national deve-lopment planning and policy-formulation.The council is “charged with the duty togive advice and recommendations to theCouncil of Ministers on economic and so-cial problems” and specifically to reviewthe five-year plans. Members of theCouncil are nominated and selected fromdifferent sectors of society, includinglocal communities, in a representative andparticipatory manner. Even though thisCouncil has only an advisory functionand no real decision-making authority,its views and recommendations will bewidely disseminated to the governmentand public. The council thus has the
THE NEW INSTITUTIONAL CONTEXT FOR COMMUNITY EMPOWERMENT
THAILAND HUMAN DEVELOPMENT REPORT 200338
potential to serve as another channel bywhich the people can take part in thenational planning process.
More significant is the National HumanRights Commission (NHRC). Section 200of the Constitution prescribes widepowers:
(1) to examine and report the com-mission or omission of acts whichviolate human rights or which do notcomply with obligations under inter-national treaties to which Thailandis a party, and propose appropriateremedial measures; (2) to propose tothe National Assembly and the Coun-cil of Ministers policies and recom-mendations with regard to the revi-sion of laws, rules or regulations forthe purpose of promoting and pro-tecting human rights; (3) to promoteeducation, researches and the dis-semination of knowledge on humanrights; (4) to prepare an annual re-port for the appraisal of situations inthe sphere of human rights in thecountry.
The first president of the NHRC, selectedin 2000, is Saneh Chamarik, a senioracademic and long-time social activistwho has written extensively on thehuman impact of development and theimportance of the community. Before hisselection to the NHRC, he had launched alarge-scale project of research on issues ofhuman and community rights throughoutThailand. Many young activists partici-pated in the project which coveredlabour, slum-dwellers, hill peoples, smallfishermen, community control over forests,and gender. On his appointment, Sanehpredicted that the NHRC would have tobecome involved in “biodiversity issues,community rights and rights to traditionallifestyles and local wisdom”.
Finally, the Constitution for the first timeallows citizens to submit a bill for theconsideration of parliament. The bill mustbe supported by the signatures of 50,000eligible voters. The first such bill sub-mitted was a Community Forest Bill.
INSTITUTIONAL SHIFTS II:THE EIGHTH AND NINTHPLANS
Eighth Plan: people-centreddevelopment
The Eighth Plan (1997-2001) marked adramatic break from its predecessors,both in content and creation. The Na-tional Economic and Social DevelopmentBoard (NESDB) held nine regional semi-nars inviting local NGO leaders, develop-ment workers, academics, businessmen,community leaders, monks, and bureau-crats. The results were then summarizedin a tenth national seminar, compiled bythe NGO side into a People’s DevelopmentPlan, and refined by technocrats into thefinal version accepted in March 1996.
The Plan aimed to shift “from a growthorientation to people-centred develop-ment” through “measures to promote self-reliance in local communities and thecreation of relatively secure communityeconomies”. A chapter on “PromotingPopular Participation and Upgrading theCapabilities of Communities to Play ActiveRoles in Local Development” included pro-posals for training courses on communityleadership, tax and funding changes tocreate community budgets, promotion ofcommunity schools with appropriate cur-ricula, community management of naturalresources, funding to NGOs to devisecommunity-based social protection, andfiscal incentives for businesses to workwith communities.
However, the Eighth Plan was launchedinto the storm of the 1997 crisis. Much ofits ambition was blunted by the impera-tives of short-term crisis management.
Ninth Plan: sufficiencyeconomy
The Ninth Plan (2002-2006) was preparedafter a process of national consultation,though less extensive than its prede-cessor. The Plan retains the commitment
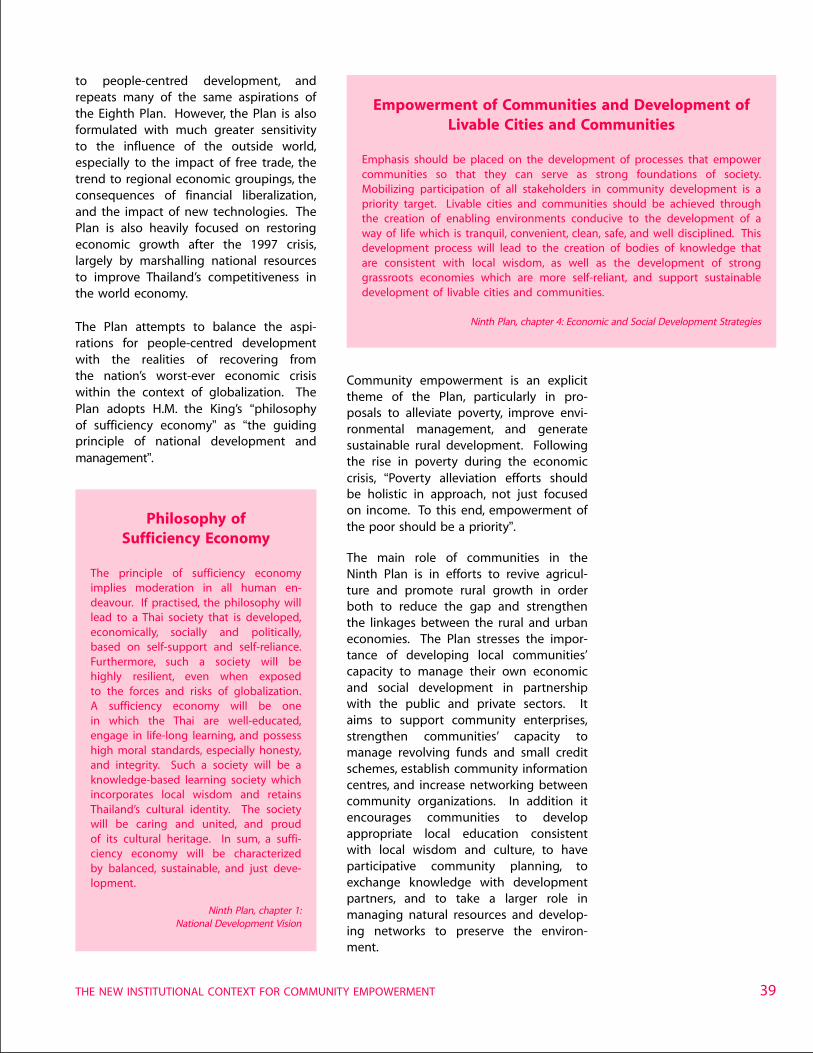
39
to people-centred development, andrepeats many of the same aspirations ofthe Eighth Plan. However, the Plan is alsoformulated with much greater sensitivityto the influence of the outside world,especially to the impact of free trade, thetrend to regional economic groupings, theconsequences of financial liberalization,and the impact of new technologies. ThePlan is also heavily focused on restoringeconomic growth after the 1997 crisis,largely by marshalling national resourcesto improve Thailand’s competitiveness inthe world economy.
The Plan attempts to balance the aspi-rations for people-centred developmentwith the realities of recovering fromthe nation’s worst-ever economic crisiswithin the context of globalization. ThePlan adopts H.M. the King’s “philosophyof sufficiency economy” as “the guidingprinciple of national development andmanagement”.
Philosophy ofSufficiency Economy
The principle of sufficiency economyimplies moderation in all human en-deavour. If practised, the philosophy willlead to a Thai society that is developed,economically, socially and politically,based on self-support and self-reliance.Furthermore, such a society will behighly resilient, even when exposedto the forces and risks of globalization.A sufficiency economy will be onein which the Thai are well-educated,engage in life-long learning, and possesshigh moral standards, especially honesty,and integrity. Such a society will be aknowledge-based learning society whichincorporates local wisdom and retainsThailand’s cultural identity. The societywill be caring and united, and proudof its cultural heritage. In sum, a suffi-ciency economy will be characterizedby balanced, sustainable, and just deve-lopment.
Ninth Plan, chapter 1:National Development Vision
Empowerment of Communities and Development ofLivable Cities and Communities
Emphasis should be placed on the development of processes that empowercommunities so that they can serve as strong foundations of society.Mobilizing participation of all stakeholders in community development is apriority target. Livable cities and communities should be achieved throughthe creation of enabling environments conducive to the development of away of life which is tranquil, convenient, clean, safe, and well disciplined. Thisdevelopment process will lead to the creation of bodies of knowledge thatare consistent with local wisdom, as well as the development of stronggrassroots economies which are more self-reliant, and support sustainabledevelopment of livable cities and communities.
Ninth Plan, chapter 4: Economic and Social Development Strategies
Community empowerment is an explicittheme of the Plan, particularly in pro-posals to alleviate poverty, improve envi-ronmental management, and generatesustainable rural development. Followingthe rise in poverty during the economiccrisis, “Poverty alleviation efforts shouldbe holistic in approach, not just focusedon income. To this end, empowerment ofthe poor should be a priority”.
The main role of communities in theNinth Plan is in efforts to revive agricul-ture and promote rural growth in orderboth to reduce the gap and strengthenthe linkages between the rural and urbaneconomies. The Plan stresses the impor-tance of developing local communities’capacity to manage their own economicand social development in partnershipwith the public and private sectors. Itaims to support community enterprises,strengthen communities’ capacity tomanage revolving funds and small creditschemes, establish community informationcentres, and increase networking betweencommunity organizations. In addition itencourages communities to developappropriate local education consistentwith local wisdom and culture, to haveparticipative community planning, toexchange knowledge with developmentpartners, and to take a larger role inmanaging natural resources and develop-ing networks to preserve the environ-ment.
THE NEW INSTITUTIONAL CONTEXT FOR COMMUNITY EMPOWERMENT
THAILAND HUMAN DEVELOPMENT REPORT 200340
INSTITUTIONAL SHIFTS III:DEMOCRATICDECENTRALIZATION
From centralization tocontractors’ councils
The administration of provincial Thailandhas been highly centralized. The Ministryof the Interior heads an administrativepyramid which extends down throughprovincial governors, district heads, sub-district (tambon) heads and village heads.Line ministries such as education, agricul-ture, and community development posttheir own officials in the provinces whoare coordinated and overseen by theprovincial governor.
Elected provincial councils were intro-duced in 1955. In theory they wereallotted wide-ranging powers over policy-making, supervision of the provincialadministration, and approval of thebudget. In reality they were not ableto challenge the provincial bureaucracy.Instead they became clearing houses forcontracts to build local infrastructure suchas roads, bridges, schools and governmentoffices. By one estimate, some 80 to 90per cent of all provincial councillors areconstruction contractors, and the councilsare often called “contractors’ councils”.28
Emergence of the TAO
Demands for decentralization increased inthe early 1990s, resulting in an Act passedin 1994. This Act made the tambon (sub-district) the main site for decentralization.At the time there were 7,159 tambon withan average population of around 8,000people. The act enabled tambon to betransformed into Tambon AdministrativeOrganizations (TAO or oboto in Thai)
with legal status, enhanced fund-raisingpowers, the right to make by-laws,and the duty to “develop the tamboneconomically, socially and culturally”.
Over the following years, most tambonwere upgraded. However the kamnan(sub-district head) and village headsremained ex-officio members of the TAOcouncils, with the kamnan as chairman.District officials still took a close super-visory role. The TAO seemed to be deve-loping as an extension of the localbureaucracy.
The 1997 Constitution demanded furtherchange. It included decentralizationamong the directive principles of statepolicies (Section 78), and prescribed theshape of further reform in some detail(Sections 282-290). In particular it en-trusted local government bodies withpowers of policy-making and fund-raising,allocated them duties to “conserve localarts, custom, knowledge or good culture”,directed them to protect the environmentand natural resources, and mandated thatall councillors in future be elected. Itmandated new legislation to implementthese principles, including the establish-ment of a committee to draw up andimplement a decentralization plan.
The legislation was passed in 1999, theimplementation committee established in2000, and its plans approved in 2001. Thegoal is to transfer power within four yearsto those local administrative bodies thatcan demonstrate their readiness, andwithin ten years to the remainder. Thekamnan and village heads lost their exofficio membership of the TAO councilsbetween 1999 and 2001. All TAO mem-bers are now elected by the same elec-torate as members of parliament (all over18). The term is four years. Each village(as officially defined) elects two TAOmembers, and each tambon consists onaverage of 9-10 villages. The share oflocal government’s revenue will rise to 20per cent in 2001 and 35 per cent in 2006.The plan also establishes a mechanism forgradually transferring 245 responsibilitiesfrom 50 departments in 11 ministries tothe local authorities.
28 This estimate was made in 1997 by thedirector of the division responsible for policyon PAOs, see Daniel Arghiros, Democracy,Development and Decentralization in Provin-cial Thailand, Richmond: Curzon, 2001, p. 24.
The share oflocal government’srevenue will rise to20 per cent in 2001
and 35 per centin 2006.
41
This is a dramatic change in the frame-work of local government. The TAOs areclose to the base of the governmentalstructure. They are now elective bodieswith considerable powers and significantbudgets. There are of course considerableproblems to be faced. But the potentialof this decentralization for communityempowerment is very significant.
INSTITUTIONAL SHIFTS IV:EDUCATION REFORM
Critiquing the system
Modern education spread rapidly beyondthe urban areas from the 1960s onwards.Almost everyone entered four years ofprimary education, and by the 1980salmost everybody had basic literacy. Asreported in the stories in chapter 1, com-munity members were ambivalent aboutthe result. Despite its obvious benefits,education was disempowering. It placedless emphasis on local knowledge andwisdom. It made communities passiverecipients of new knowledge. The sharpdivision between traditional knowledgeand modern education disrupted anylearning process within the community.
From the 1970s onwards, a broadercritique of the education system graduallyrose. Learning was by rote. Textbookswere standardized, narrow, and dogmatic.Administration was centralized. Educationwas stifled by bureaucracy. In sum, thesystem was a reflection of the eraof centralization and authoritarianism. Itneeded an overhaul. A reform plan wasdrafted in 1974, but there was no politicalwill to implement it.
Efforts to reform education were ineffec-tive until the boom which began in themid-1980s revealed the system’s basic in-adequacy. Thailand did not have enoughsecondary school graduates, enough engi-neers, enough research capacity, andenough creativity to keep up with thepace of economic growth. By the early1990s, these failures were widely seen
as a major constraint on future economicgrowth. In parallel, another critiquerelated the corruption, excessive consum-erism, selfish values, and poor businessethics which seemed to mushroom inthe boom, to the narrowness andmoral inadequacy of curriculum contentand pedagogical style. The bust, when itcame, was quickly read as proof of thesepropositions. The preamble of the 1999National Education Act positioned thelegislation as response to “economic,political, cultural and social crisis”.29
From critique to reform
The campaign for education reform ranin parallel with the campaign for con-stitutional reform and shared many ofits features. In 1994, an independentgroup of activists, including technocrats,educators, and businessmen, formed a“Commission on Thailand’s Education inthe Era of Globalization” with supportfrom a leading bank. The Commissionrecruited experts, held public consulta-tions, and drew up a framework of com-prehensive reform in the educationalsystem. It then lobbied for governmentto accept these proposals as basis for thereform enacted in 1999.
The activist group was overwhelminglyurban, but it included some prominentadvocates of community strength. Henceone principle of the Commission’s propos-als was that “the community must becapable of maintaining itself not only as astrong and dynamic unit of the economy,but a proud and lively part of the socialand cultural life of the country as well”.This would include the ability “to preserveand pass on to their future generationstheir cultural identity”.30
29 National Education Act of B.E. 2542 (1999),Office of the Education Commission, Officeof the Prime Minister, 1999, p. i.
30 Thai Education in the Era of Globalization:Vision of a Learning Society, A Synopsis ofthe Report of the Commission of Thailand’sEducation in the Era of Globalization:Towards National Progress and Security inthe Next Century, 1996.
THE NEW INSTITUTIONAL CONTEXT FOR COMMUNITY EMPOWERMENT
The sharp divisionbetween traditionalknowledge andmodern educationdisrupted anylearning processwithin the community.
THAILAND HUMAN DEVELOPMENT REPORT 200342
The 1999 Education Act aimed to achievefour main goals: to widen access toeducation; to change from rote learningto “child-centred” education; to improvequality standards; and to decentralizeadministration and control.
The Act widened access by extendingcompulsory schooling up to 9 years andfree schooling up to 12 years, as well asmaking more space for specialized formsof learning. It established child-centredlearning through a new curriculum, andretraining of teachers. It planned to up-grade quality by forming a professionalinstitute for teachers and educationofficials, and a new body to monitorperformance. It decentralized the admi-nistration by converting the Ministry ofEducation into a policy and planningbody, setting up local area boards, givingmore independence to schools, and en-couraging greater parent and communityparticipation. Together, these measuresamounted to a revolution in the educa-tion system.
Education reform andthe community
The reformers’ intention to bring localcommunities into a national learning pro-cess is enshrined in the Act’s section 29:
Educational institutions in coopera-tion with individuals, families, commu-nities, community organizations, localadministration organizations, privatepersons, private organizations, pro-fessional bodies, religious institutions,enterprises, and other social insti-tutions shall contribute to strengthen-ing the communities by encouraginglearning in the communities them-selves. Thus communities will becapable of providing education andtraining; searching for knowledge,data, and information; and be able tobenefit from local wisdom and othersources of learning for communitydevelopment in keeping with theirrequirements and needs; and identi-fication of ways of promoting ex-changes of development experienceamong communities.
On its final reading, the act was passedunanimously by both houses. An Educa-tion Reform Office and three sub-commis-sions were formed to restructure theministry, retrain teachers, redesign cur-ricula, revise financing, and guide thesupplementary enabling legislation.
PROBLEMS AND ISSUES
The changes over the past decade in boththe institutional context and the nationalagenda have been dramatic. The 1997Constitution is an ambitious attempt toremap the relations between state andsociety. The Constitution and the decen-tralization scheme have begun to changethe shape of government. The Eighth andNinth Plans have brought a new socialand cultural agenda into the planningprocess. The Education Act aspires to laythe human foundations for success in theage of globalization. The cycle of boomand bust has sensitized society to issuesof environmental damage, social justiceand community strength, preparing theway for pioneer attempts to strengthenrights, direct government policy, anddecentralize power.
Yet change is difficult. New administrativestructures threaten old power relationsand break old ricebowls. Planning forsocial change is easier than achieving it.Policies hatched in the heat of crisiscan easily be forgotten when conditionsease. Thailand’s traditions of centralizedgovernment, bureaucratic authority, andtop-down planning will not be quickly oreasily overthrown.
These four institutional changes haveenormous potential to support commu-nity empowerment. But they also havevery real limitations, mainly becausethe legacies of centralized government,top-down thinking, and paternalist atti-tudes are not easily removed. In thissection, we look at some of the problemsand complications in these four areas, andlay out some of the challenges whichcommunity empowerment will confront inthe future.
The changes overthe past decade in
both the institutionalcontext and the
national agendahave been dramatic.
43
The 1997 Constitution’sunfinished business
Chapter 3 of the Constitution establishesmany new rights for individuals and com-munities. However, in reality these existon paper only. There is as yet notradition in Thailand for using the judicialsystem to activate constitutional rights,though some attempts are currently be-ing made and such a tradition couldeventually emerge. Unlike past charters,the current Constitution goes beyond theguarantee of rights to stipulate that theserights and freedoms can be invokeddirectly in the courts to question actionsviolating the Constitution.31 But this re-quires a change of judicial practice whichwill not be quick. At present, the onlyreasonably firm way to substantiate suchrights is through legislation. Yet this, ofcourse, is time-consuming and difficult.
Section 46 is of great importance to com-munity empowerment as it enshrines theright of communities to “participate in themanagement, maintenance, preservation,and exploitation of natural resources andthe environment in a balanced fashionand persistently as provided by law”. Yetin reality, the modern state over the lastcentury has effectively appropriated rightsover most natural resources, often over-riding pre-existing community arrange-ments. Thailand’s legal system, based onthe Roman law tradition, has no avenuefor claiming customary rights. Moreoverthe state’s rights have been enshrinedin various bits of legislation such asthose which define the operations ofthe forestry and irrigation departments.Hence the phrase “as provided by law”appended to Section 46 annuls much ofthe Section’s force. This can only be recti-fied by legislation.
This is far from easy, as the experiencewith the Community Forestry Bill demon-strates. This bill provides a framework fordesignating areas as community forests
where management will be sharedbetween communities and officials understrict principles. The bill has been underdiscussion for over a decade but hasfaced considerable opposition, especiallyfrom the Forestry Department whichwould have to cede its exclusive controlover areas designated as communityforests. The bill was revived after theConstitution was passed and was the firstbill submitted to parliament under theConstitution’s provisions for a “people’sbill” backed by 50,000 signatures. As ofthe time of writing this report, the billhad reached the Senate where an amend-ment had, according to the bill’s draftersand supporters, undermined the legisla-tion’s purpose. A way is being sought toend this deadlock.
The Community Forestry Bill carries theweight of a fierce controversy over thefate of people who are living in areaswhich have been defined as nationalpark or protected watershed. Many ofthese people were settled before theareas were so defined, but proof is some-times difficult. The fate of these peopleinvolves complex questions over historicalrights, social equity, and environmentalmanagement. Other aspects of commu-nity management of natural resources –waterways, sea, underground – will beequally controversial.
Of similar importance for the validationof community rights is the question ofpublic hearings. The constitution en-shrines the right of people to express anopinion before the approval on anyproject which will affect the community“in accordance with the public hearingprocedure, as provided by law”. At presentthe government’s monitoring of envi-ronment issues is covered by theEnhancement and Conservation of theEnvironment Quality Act of 1992. It iswidely recognized that the intentions ofthis Act are good, but the implementationhas been ineffective. The legislation isbuilt around the “polluter pays” principle,but the courts have refused to acceptcases by quibbling over who is theaffected party when pollution occurs. Thelegislation also lays down procedures forenvironmental impact assessments (EIAs)
31 Vitit Muntarbhorn, Human Rights and HumanDevelopment: Thailand Country Study, UNDPOccasional Paper 36, 2000, p. 3.
THE NEW INSTITUTIONAL CONTEXT FOR COMMUNITY EMPOWERMENT
The CommunityForestry Bill carriesthe weight of afierce controversyover the fate ofpeople who areliving in areas whichhave been definedas national park orprotected watershed.
THAILAND HUMAN DEVELOPMENT REPORT 200344
but again these have fallen short of ex-pectations, mainly because they are com-missioned by the project proponents, notby an independent body. Further, the leg-islation does not mandate social impactassessment (SIA) and public participationin the impact assessment process.
In 1996, government introduced a PrimeMinister’s Office Regulation on PublicHearings. In the opinion of many, thisalso falls far short of an adequate lawon public hearings, and far short ofthe requirements of the Constitution.
Ninth Plan: sufficiencyeconomy vs. growth
While the Ninth Plan features people-centred development and communityempowerment, in practice the Plan placesgreat emphasis on a return to stabilityand economic growth. The main stra-tegies to achieve these objectives areto upgrade human resources, corporatecompetitiveness, and public administra-tion in order to make Thailand bothmore self-reliant and more successful in aglobalized world.
The role of the community is muchdiminished from the Eighth Plan. In effectit is more or less confined to rural deve-lopment. Given the emphasis on crisisrecovery, this is not surprising and may infact be realistic. However, the languageand tone of the Plan as a whole is areversion to more traditional style, notonly in its emphasis on economic growth,but also in its calls for discipline and unityin the task of recovery.
The scope and range of the Ninth Planis very ambitious. There is some risk thatimplementation will focus on measuresto restore growth, and neglect the aspira-tions towards community empowerment.
Decentralization:patronage or participation?
Project proponents still view an EIA as theway to approve a project, rather than amechanism for deciding whether or not aproject should be built in the first place.Even some government officials think thatway.... If we did it [the Enhancement andConservation of the Environment QualityAct] over, I would demand that publichearings be carried out at the beginningand according to an established procedure.
– Kasem Snidvongs, former Permanent Secretary,Ministry of Science, Technology and Environment
So-called public hear-ings have been calledon projects which havealready been approvedbut which face localopposition. Opponentshave perceived these asattempts to legitimizeprior decisions and haveeither refused coopera-tion or used the eventsas sites of protest.Hence the potential tointroduce a proper pro-cedure for public hear-ings as a way to nego-tiate among the rights
and aspirations of different parties isbeing damaged by the lack of adequatelegislation.
There is a special problem over projectswhich were designed before social andenvironmental conditions changed, andapproved before the new constitutionand new regulations came into force, buthave not yet been implemented. Oppo-nents of these projects argue that theprinciples enshrined in the Constitutionshould be applied to these projects,implying proper social and environmentalassessments and community participation.Proponents argue that approvals weremade under the laws operating at thetime, and that no review is needed.Projects of this nature (the Thai-Malaysiangas pipeline, Bo Nok and Hin Krut powerprojects, etc.) have occasioned some ofthe bitterest disputes of the past fiveyears. As yet, there is no mechanism, noframework, no principles for managingsuch issues.
As long as there is no completetransfer of management from centralgovernment mechanisms to local self-administration, true development maynot occur, and all roads will still leadto Government House as they alwaysdo.
– Dr. Kowit Puang-ngam,lecturer in community development,
Thammasat University
Are we getting “TAOs of the state” or“TAOs of the people”?
– Northeastern villager
45
The rapid rollout of decentralization hasled to a large number of concerns. Thechoice of the tambon, a relatively smallunit, theoretically increases the potentialfor effective community participation. Butwill such a small unit be able to find thenecessary managerial talent, escape con-tinued subordination to officialdom, evadecapture by powerful local interests, andachieve sufficient scale in areas such ashealth and education?
These concerns have already sparkedwide-ranging debate. Some critics sug-gest that the Ministry of the Interior istrying to retain bureaucratic supervisionover the TAOs. Shortly before the 1999act, it appointed a special officer to over-see each TAO. Provincial and district offi-cials instruct TAOs on government policieswhich the TAOs must implement. Effortshave been made to coopt TAO membersinto the culture of the bureaucracy.
Equally, some fear that the TAOs will becaptured by local “dark influences” orbecome clearing houses for local contrac-tors in the same way as the provincialcouncils.
Some go further and charge that thisdecentralization has been “designed tofail”. The choice of the tambon as thelevel for decentralization came aboutbecause of fierce opposition from theMinistry of the Interior to effective de-mocratization at the provincial level. Thetambon units may in many cases provetoo small both in terms of budget sizeand human resources.
While TAOs have found it easy to takeover the management of infrastructureprovision, it is not clear what they will dowith the budget expansion planned overcoming years. Education is flagged in theconstitution as a priority area, but teacherorganizations have expressed reservationsabout TAOs ability to manage local educa-tion.
How committed is the government toseeing the project through? The ThaksinCabinet inaugurated in 2001 launched apilot project of “CEO governors” in five
provinces. These governors have addi-tional powers, report directly to the primeminister’s office, and are supposed tocatalyse local development. This innova-tion appears to contradict the trend to-wards democratic decentralization. Withthe central government facing strongbudget constraints in the wake of theeconomic crisis, the increasing fund allo-cation to local government may wellcome under threat.
These concerns show that the next fiveyears will be critical for the success orfailure of the tambon-focused decentrali-zation scheme.
Environment and Participation
In 1999, a TAO in a mountainous and forested area of the north approved aconcession to a quarry company. Local people objected, formed a protestmovement, petitioned the TAO, and then demonstrated outside the provin-cial headquarters. They claimed:
the quarries were located in a watershed forest, and would affect bothdrinking water supplies and irrigation;
the quarries would disrupt popular tourist spots and religious places;
the TAO had not consulted people, not allowed participation in thedecision, and not acted transparently.
The TAO members were forced to resign. At new elections, members of theprotest group gained a majority. The new TAO held a public meeting,inviting the quarry company and relevant officials. Villagers found that theconcession agreement had false data (e.g., overestimating the distancebetween quarry and village as 5 rather than 2 kms), and that the conces-sion payment to the TAO had somehow been reduced by two-thirds. Afterthese revelations, local people took a close interest in the operation of theTAO, and particularly in its management of the environment so importantto the residents of a forest area. Meetings had to be moved to a biggerbuilding to accommodate observers.
– Case from a research study supportedby the National Counter Corruption Commission
Education reform: a longstruggle?
As with the other reforms, the aspirationsof the education reformers have runup against the realities of bureaucraticinertia, social conservatism, and politicalself-interest. The education reform is espe-cially vulnerable because it aims to change
THE NEW INSTITUTIONAL CONTEXT FOR COMMUNITY EMPOWERMENT
THAILAND HUMAN DEVELOPMENT REPORT 200346
the lives of a large and influential socialgroup – the teachers – and because ittries to disempower a well-entrenchedsection of the bureaucracy.
Teachers are respected and influentialfigures within local communities. For thatreason, they have long been recruitedinto the networks of elective politicians.In return for their political service, theycan demand repayment. Since passageof the National Education Act, 1999 someteachers have lobbied to adjust theimplementation. Ministers, who have tothink of their party’s political base, havebeen vulnerable to this lobby. The teach-ers have been particularly uncomfortableabout the new bodies to oversee quality,and about the switch from rote to child-centred learning.
Similarly, the education bureaucracy hasresisted the Act’s drastic decentralizationof education administration. It has triedto influence the supplementary legisla-tion, in particular to retain budgetarycontrol. It has tried to assimilate the newlocal boards with its existing structure of76 provincial offices, rather than establish-ing a new and more localized network of295 zones. Eventually, a compromise of175 zones was agreed.
These and many other issues are thesubject of debate and political wrangling.But from the angle of communities, thereis a further concern. The intention of thereform lobby to bridge the gap betweenlocal learning and school learning isclear, and Section 29 of the Act providesan enabling framework. But there is noinstitutional mechanism to ensure thisopportunity will be taken. In effect, itrequires a separate effort in each commu-nity. Many communities have innovated,even in advance of the Act. But it islikely that these efforts will be sporadicin the absence of any mechanism togeneralize them.
CONCLUSION
Our fate is in the hands of both theofficials and ourselves. But more inthe hands of officials.
– Villager in a community project
Community empowerment is difficult toimagine outside a context of democracy.Between the 1970s and 1990s, Thailandmade a transition from military dictator-ship to parliamentary democracy. Thiscreated the political space within whichactivists, NGOs, academics, and others pio-neered experiments in strengthening com-munities, and demanding more democraticapproaches to economic policy-making.
In the mid-1990s, these efforts achievedsufficient scale to drive through someimportant changes in the institutionalenvironment. Community rights werewritten into the 1997 constitution. Com-munity strengthening and participationfeatured prominently in the Eighth andNinth Plans. Decentralization legislationcreated democratic local government at alow level of the state pyramid. Reformsset out to improve the quality, accessibility,content and social relevance of education.
These changes have not taken place with-out reaction. The previous era of statecentralization and top-down developmenthas created many vested interests whichresist such changes. The institutionalchanges themselves are incomplete inmany ways. There is a serious risk that thereform trend will falter before thesenew institutions can be truly effective inaiding community empowerment. Thereare struggles to come.
We will return to consider ways tocontinue reform in the institutional con-text in chapter 4. But first we will lookmore closely at how in reality communityempowerment has developed from thebottom up over the past two decades.
Our fate is in thehands of both
the officials andourselves. But more
in the hands ofofficials.
– Villager in a community project
47
CHAPTER
PROMOTING COMMUNITY EMPOWERMENT 3
In the past when we wanted to saysomething, we were afraid. Nowwe’re not afraid.
– Villager on an education project
A LEARNING PROCESS ONA NATIONAL SCALE
Community empowerment is a learningprocess on a national scale. It cannot beconceived as something which happensonly within communities, or as part ofthe relations between communities andgovernment agencies. It is part of abroader change from dictatorship andcontrol to democracy and humanism.This change faces barriers in the form ofold institutions, entrenched mentalities,and vested interests. To be successful,community empowerment must com-mand understanding, acceptance, andsupport in the society at large. The pre-vious chapter showed how internationalchanges and domestic pressures com-bined to change the institutional environ-ment. This chapter looks at how thepractice of community empowermentdeveloped in very practical ways from thebottom-up as a learning process involvingthe communities themselves and outsideactors including NGOs and activists,businesses, research agencies, governmentdepartments, and international agencies.
The movement began from the efforts oflocal communities to develop innovativeways to grapple with problems thrown upby social and economic change. The firstsection of this chapter notes two of themost widespread and successful exam-ples: credit schemes and environmental
campaigns. Gradually outside agenciesbecame more involved in assisting,sponsoring, or initiating such projects.The second section of this chapter looksat key examples of cooperation betweencommunities and business organizations,and between communities, NGOs, inter-national agencies, and governmentbodies.
The possibility to accelerate this bottom-up movement depends on accumulatinglearning at both the local and nationallevels. This function was initially under-taken by NGOs and developmentagencies. The third section looks at how,from around 1990, government agenciesbegan to sponsor research aimed atboth understanding the community andpromoting its social and economic roles.By the late 1990s, these efforts hadresulted in a considerable body oflearning.
One important initial application of thislearning was in efforts to replace top-down methods of planning by bottom-upprocedures. The fourth section reviewsthe thinking behind these procedures,and their adoption by some governmentagencies.
The 1997 economic crisis increased theurgency to identify those most affectedby the crisis and deliver schemes of socialprotection and income generation. Thefifth section reviews how more govern-ment and development agencies lookedto communities to perform these roles.The most important of these was theSocial Investment Fund (SIF) which de-vised innovative methods to providefunds directly to community groups forprojects of building social capital.
PROMOTING COMMUNITY EMPOWERMENT
To be successful,communityempowermentmust commandunderstanding,acceptance, andsupport in thesociety at large.
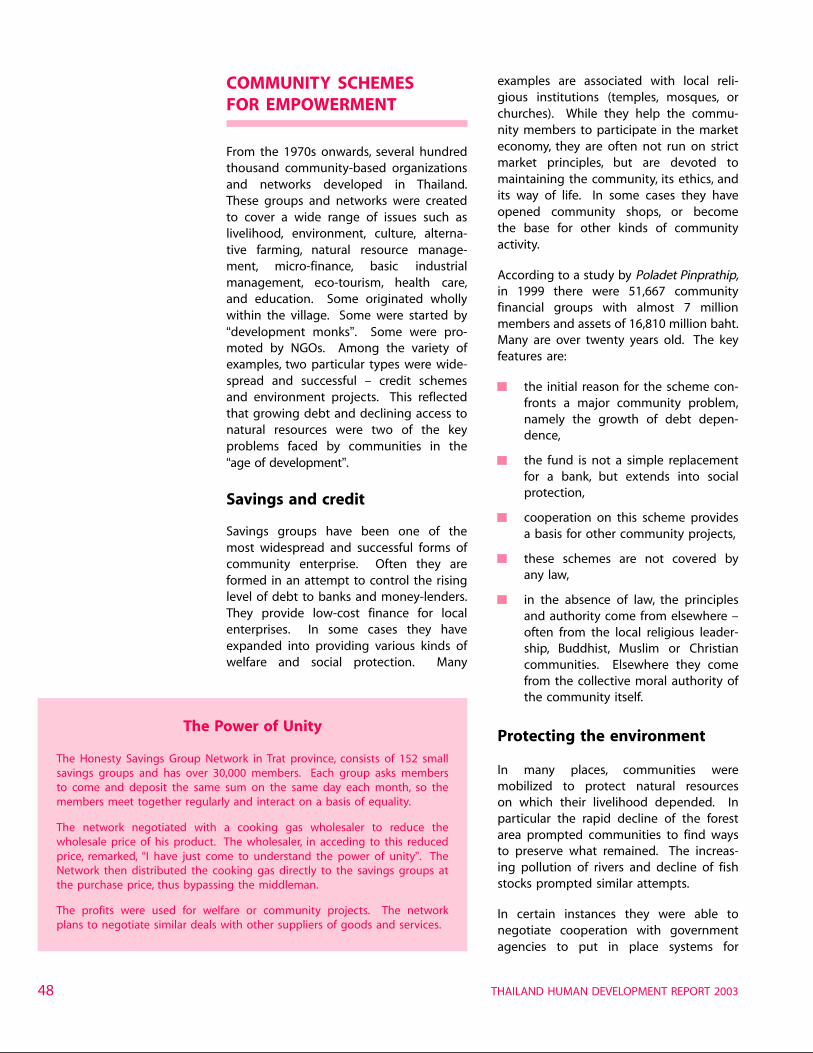
THAILAND HUMAN DEVELOPMENT REPORT 200348
COMMUNITY SCHEMESFOR EMPOWERMENT
From the 1970s onwards, several hundredthousand community-based organizationsand networks developed in Thailand.These groups and networks were createdto cover a wide range of issues such aslivelihood, environment, culture, alterna-tive farming, natural resource manage-ment, micro-finance, basic industrialmanagement, eco-tourism, health care,and education. Some originated whollywithin the village. Some were started by“development monks”. Some were pro-moted by NGOs. Among the variety ofexamples, two particular types were wide-spread and successful – credit schemesand environment projects. This reflectedthat growing debt and declining access tonatural resources were two of the keyproblems faced by communities in the“age of development”.
Savings and credit
Savings groups have been one of themost widespread and successful forms ofcommunity enterprise. Often they areformed in an attempt to control the risinglevel of debt to banks and money-lenders.They provide low-cost finance for localenterprises. In some cases they haveexpanded into providing various kinds ofwelfare and social protection. Many
examples are associated with local reli-gious institutions (temples, mosques, orchurches). While they help the commu-nity members to participate in the marketeconomy, they are often not run on strictmarket principles, but are devoted tomaintaining the community, its ethics, andits way of life. In some cases they haveopened community shops, or becomethe base for other kinds of communityactivity.
According to a study by Poladet Pinprathip,in 1999 there were 51,667 communityfinancial groups with almost 7 millionmembers and assets of 16,810 million baht.Many are over twenty years old. The keyfeatures are:
the initial reason for the scheme con-fronts a major community problem,namely the growth of debt depen-dence,
the fund is not a simple replacementfor a bank, but extends into socialprotection,
cooperation on this scheme providesa basis for other community projects,
these schemes are not covered byany law,
in the absence of law, the principlesand authority come from elsewhere –often from the local religious leader-ship, Buddhist, Muslim or Christiancommunities. Elsewhere they comefrom the collective moral authority ofthe community itself.
Protecting the environment
In many places, communities weremobilized to protect natural resourceson which their livelihood depended. Inparticular the rapid decline of the forestarea prompted communities to find waysto preserve what remained. The increas-ing pollution of rivers and decline of fishstocks prompted similar attempts.
In certain instances they were able tonegotiate cooperation with governmentagencies to put in place systems for
The Power of Unity
The Honesty Savings Group Network in Trat province, consists of 152 smallsavings groups and has over 30,000 members. Each group asks membersto come and deposit the same sum on the same day each month, so themembers meet together regularly and interact on a basis of equality.
The network negotiated with a cooking gas wholesaler to reduce thewholesale price of his product. The wholesaler, in acceding to this reducedprice, remarked, “I have just come to understand the power of unity”. TheNetwork then distributed the cooking gas directly to the savings groups atthe purchase price, thus bypassing the middleman.
The profits were used for welfare or community projects. The networkplans to negotiate similar deals with other suppliers of goods and services.
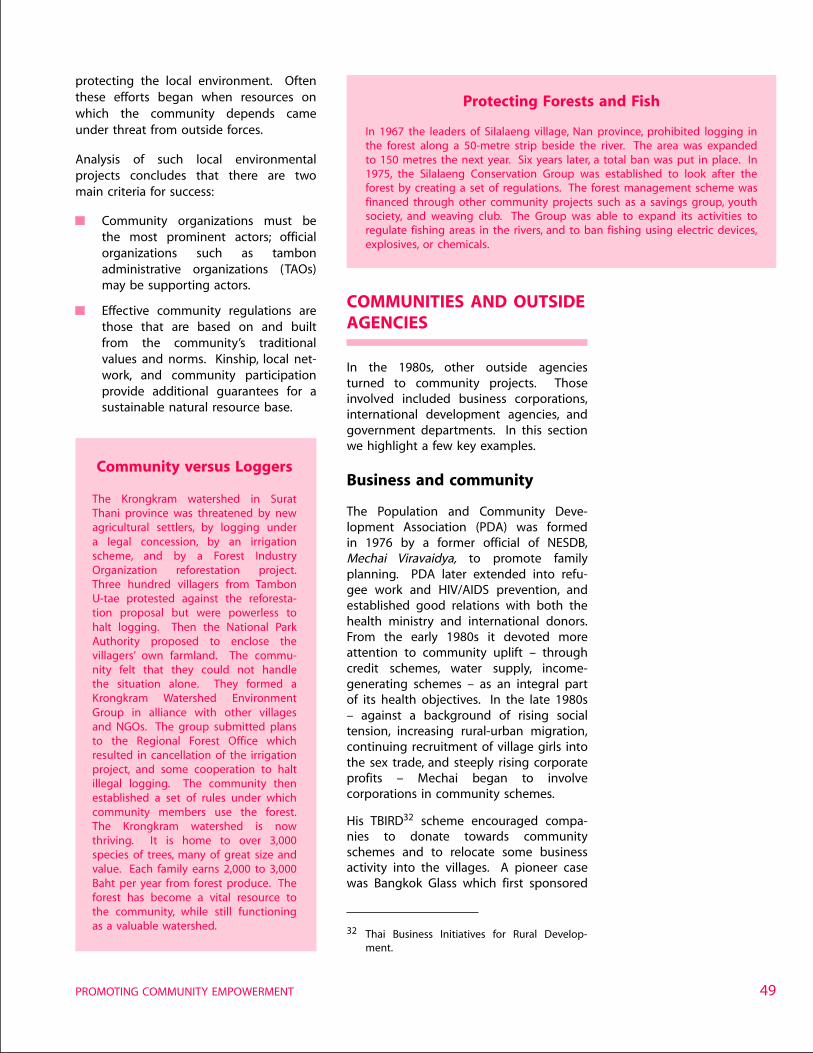
49
protecting the local environment. Oftenthese efforts began when resources onwhich the community depends cameunder threat from outside forces.
Analysis of such local environmentalprojects concludes that there are twomain criteria for success:
Community organizations must bethe most prominent actors; officialorganizations such as tambonadministrative organizations (TAOs)may be supporting actors.
Effective community regulations arethose that are based on and builtfrom the community’s traditionalvalues and norms. Kinship, local net-work, and community participationprovide additional guarantees for asustainable natural resource base.
COMMUNITIES AND OUTSIDEAGENCIES
In the 1980s, other outside agenciesturned to community projects. Thoseinvolved included business corporations,international development agencies, andgovernment departments. In this sectionwe highlight a few key examples.
Business and community
The Population and Community Deve-lopment Association (PDA) was formedin 1976 by a former official of NESDB,Mechai Viravaidya, to promote familyplanning. PDA later extended into refu-gee work and HIV/AIDS prevention, andestablished good relations with both thehealth ministry and international donors.From the early 1980s it devoted moreattention to community uplift – throughcredit schemes, water supply, income-generating schemes – as an integral partof its health objectives. In the late 1980s– against a background of rising socialtension, increasing rural-urban migration,continuing recruitment of village girls intothe sex trade, and steeply rising corporateprofits – Mechai began to involvecorporations in community schemes.
His TBIRD32 scheme encouraged compa-nies to donate towards communityschemes and to relocate some businessactivity into the villages. A pioneer casewas Bangkok Glass which first sponsored
Protecting Forests and Fish
In 1967 the leaders of Silalaeng village, Nan province, prohibited logging inthe forest along a 50-metre strip beside the river. The area was expandedto 150 metres the next year. Six years later, a total ban was put in place. In1975, the Silalaeng Conservation Group was established to look after theforest by creating a set of regulations. The forest management scheme wasfinanced through other community projects such as a savings group, youthsociety, and weaving club. The Group was able to expand its activities toregulate fishing areas in the rivers, and to ban fishing using electric devices,explosives, or chemicals.
Community versus Loggers
The Krongkram watershed in SuratThani province was threatened by newagricultural settlers, by logging undera legal concession, by an irrigationscheme, and by a Forest IndustryOrganization reforestation project.Three hundred villagers from TambonU-tae protested against the reforesta-tion proposal but were powerless tohalt logging. Then the National ParkAuthority proposed to enclose thevillagers’ own farmland. The commu-nity felt that they could not handlethe situation alone. They formed aKrongkram Watershed EnvironmentGroup in alliance with other villagesand NGOs. The group submitted plansto the Regional Forest Office whichresulted in cancellation of the irrigationproject, and some cooperation to haltillegal logging. The community thenestablished a set of rules under whichcommunity members use the forest.The Krongkram watershed is nowthriving. It is home to over 3,000species of trees, many of great size andvalue. Each family earns 2,000 to 3,000Baht per year from forest produce. Theforest has become a vital resource tothe community, while still functioningas a valuable watershed. 32 Thai Business Initiatives for Rural Develop-
ment.
PROMOTING COMMUNITY EMPOWERMENT
THAILAND HUMAN DEVELOPMENT REPORT 200350
community activities in a northeasternvillage, and later founded a small factorythere to make brushes to clean glassmoulds. Bata Shoes followed. The com-pany initially opened one village-basedfactory, and later added six others whichoperate as cooperatives selling their out-put to Bata. Another shoe manufacturercopied the same model. With thesesuccesses, PDA was able to gainassistance from the Ministry of Industry,support from international developmentagencies, and participation by over 130firms, Thai and multinational. Mechaipresented the scheme as a way to impartnew skills, raise incomes, reduce rural-urban migration, diminish the income gap,and offer companies a chance to partici-pate in community development.
A different strategy was pursued byBangchak, a state enterprise involved inoil refining. Bangchak promoted commu-nities in three ways. First, it encouragedcommunity groups to take up franchisesto start Bangchak gas stations as a way toincrease community income. Second, itopened a chain of stores inside urban gasstations which sold products produced bycommunity enterprises. Third, Bangchakdonated to NGOs, grassroots organi-zations, and public campaigns whichpromoted community causes. Executivesof the company presented Bangchak as amodel of socially responsible capitalism.
Community, NGO, internationalagencies and government
The HIV/AIDS pandemic afflicted Thailandfrom the late 1980s. Government re-sponded in the early 1990s, but at thetime knowledge about the condition waspoorly developed on a worldwide scale.Parts of rural northern Thailand wereespecially badly affected.
The first HIV/AIDS patient in Mae Chandistrict of Chiang Rai province wasidentified in 1988. Within the next threeyears, the district had the highest infec-tion rate in Thailand. The local hospitalwas swamped with cases.
The head of the hospital responded bymobilizing the community. A coordina-tion centre was founded, and the commu-
nity involved from the start in planning itsactivities. The regional health authoritiesbecame involved. So too did new NGOnetworks such as the Northern NGOCoalition on AIDS and the Network ofPeople Living with AIDS. Internationalagencies piled in with funding, training,and support for networking between thecommunity, government, and NGOs. Aus-tralia provided support for four years, andthen the European Commission took over.
The centre coordinated work betweenthe hospital, patients themselves, theirfamilies, NGOs, youth groups, and monksfrom the local temple. The monks visiteda Lopburi temple which was alreadyinvolved in HIV/AIDS care, and were giventraining by the hospital. Then they set upa day-care centre beside the temple,educated the community about the pan-demic through sermons at the templeand over local radio, served as counsellorsto patients, and used their expertise inherbal medicine to treat secondary infec-tions.
Patients formed self-help groups to raiseincome through handicraft production.NGOs helped to form youth groups whichspread education about AIDS preventionthrough the schools and through puppetdramas. Community meetings were heldto educate families about the pandemic,emphasize the need for compassion, easethe resistance to disclosure, and persuadefamilies to care for patients at home.
33 See www.hiv.development.org.
What makes Mae Chan special is that itis the first time in the history of theepidemic that so many sectors of acommunity have banded together tofight against HIV/AIDS.
– Lee-Nah Hsu,Manager of UNDP’s Southeast Asia
HIV and Development Project33
The Ministry of Health adopted the modelfor use elsewhere in Thailand. In 2000, aworkshop was held to disseminate theMae Chan model as “good practice” forthe Southeast Asian region.
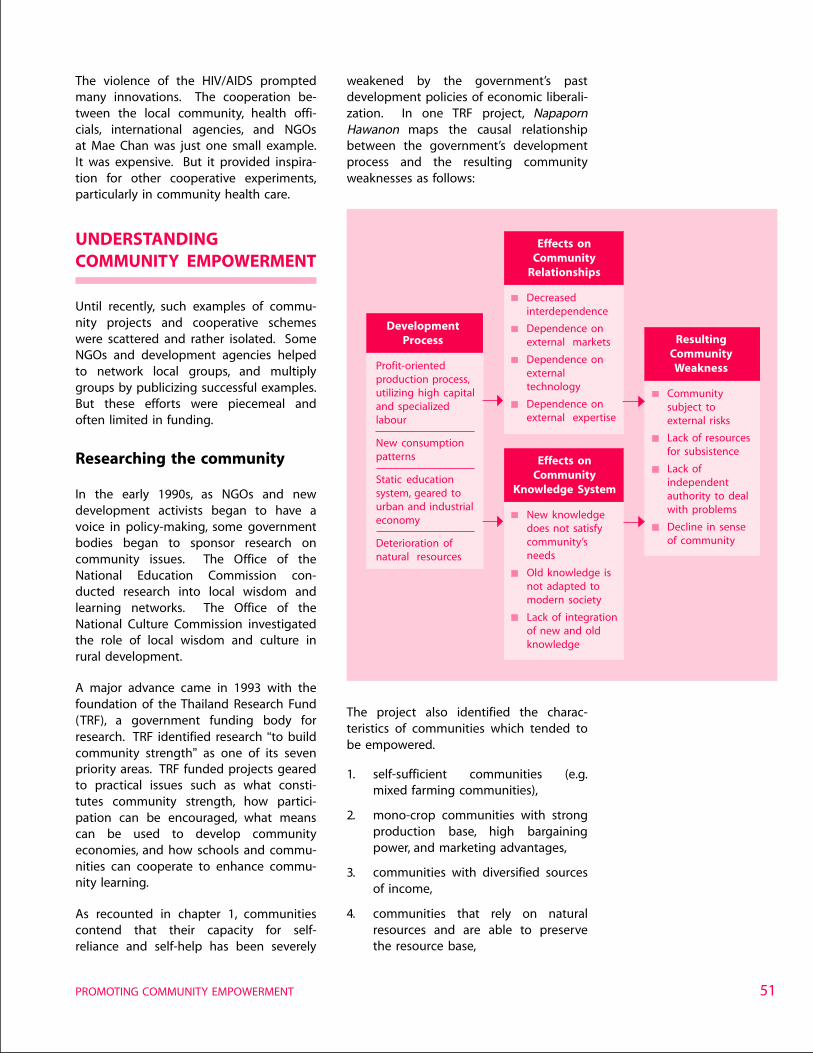
51
The violence of the HIV/AIDS promptedmany innovations. The cooperation be-tween the local community, health offi-cials, international agencies, and NGOsat Mae Chan was just one small example.It was expensive. But it provided inspira-tion for other cooperative experiments,particularly in community health care.
UNDERSTANDINGCOMMUNITY EMPOWERMENT
Until recently, such examples of commu-nity projects and cooperative schemeswere scattered and rather isolated. SomeNGOs and development agencies helpedto network local groups, and multiplygroups by publicizing successful examples.But these efforts were piecemeal andoften limited in funding.
Researching the community
In the early 1990s, as NGOs and newdevelopment activists began to have avoice in policy-making, some governmentbodies began to sponsor research oncommunity issues. The Office of theNational Education Commission con-ducted research into local wisdom andlearning networks. The Office of theNational Culture Commission investigatedthe role of local wisdom and culture inrural development.
A major advance came in 1993 with thefoundation of the Thailand Research Fund(TRF), a government funding body forresearch. TRF identified research “to buildcommunity strength” as one of its sevenpriority areas. TRF funded projects gearedto practical issues such as what consti-tutes community strength, how partici-pation can be encouraged, what meanscan be used to develop communityeconomies, and how schools and commu-nities can cooperate to enhance commu-nity learning.
As recounted in chapter 1, communitiescontend that their capacity for self-reliance and self-help has been severely
weakened by the government’s pastdevelopment policies of economic liberali-zation. In one TRF project, NapapornHawanon maps the causal relationshipbetween the government’s developmentprocess and the resulting communityweaknesses as follows:
Effects onCommunity
Relationships
Decreasedinterdependence
Dependence onexternal markets
Dependence onexternaltechnology
Dependence onexternal expertise
DevelopmentProcess
Profit-orientedproduction process,utilizing high capitaland specializedlabour
New consumptionpatterns
Static educationsystem, geared tourban and industrialeconomy
Deterioration ofnatural resources
ResultingCommunityWeakness
Communitysubject toexternal risks
Lack of resourcesfor subsistence
Lack ofindependentauthority to dealwith problems
Decline in senseof community
Effects onCommunity
Knowledge System
New knowledgedoes not satisfycommunity’sneeds
Old knowledge isnot adapted tomodern society
Lack of integrationof new and oldknowledge
The project also identified the charac-teristics of communities which tended tobe empowered.
1. self-sufficient communities (e.g.mixed farming communities),
2. mono-crop communities with strongproduction base, high bargainingpower, and marketing advantages,
3. communities with diversified sourcesof income,
4. communities that rely on naturalresources and are able to preservethe resource base,
PROMOTING COMMUNITY EMPOWERMENT
THAILAND HUMAN DEVELOPMENT REPORT 200352
5. communities that have a goodsavings and funding mechanism anddo not have to rely on external bank-ing and informal loan systems,
6. communities that are able tocultivate civic consciousness so thatmembers live peacefully and lookafter one another,
7. poor communities that successfullyimprove their conditions due toexternal intervention, e.g. develop-ment projects,
8. communities which are affected byindustrial expansion but can adjust totake advantage of the dual economy,
9. politically strong communities inwhich members participate activelyin local affairs and are able toadvocate their demands to localgovernments.
Napaporn summarized the learningsfrom the research sponsored by TRFon community empowerment as follows.
Community empowerment policiesshould recognize that there arevarious ways and means to achievecommunity empowerment, and alloweach community to choose the mostappropriate option.
Local wisdom is valuable, butcommunities also have to learn newknowledge such as business manage-ment, production, and marketingtechniques. Communities have tolearn to apply both sets of know-ledge. Research and educationinstitutions should facilitate theintegration of knowledge for thecommunities.
Many communities are adjustingthemselves to the commercialeconomy. Capital accumulation isimportant and communities can mo-bilize funds within specific occupa-tional groups, or through communityenterprises and savings groups.Policy to support community capitali-zation should take account of thisdiversity.
The community learning process isanother important component. Com-munities should be able to managetheir own database and assess theirown strength. A general guidelinecan be developed, and externalfacilitators provided for this purpose.
These conclusions show that a commu-nity’s strength is a function of how wellit can deal with the outside forces ofgovernment and market, and this in turndepends on the community’s body ofknowledge, ability to cooperate, andaccess to natural resources.
Learning and planning
This research clarifies that communityempowerment must be conceived as alearning process, which has two parts.First, communities must retain or recovertheir own knowledge and their con-fidence that this knowledge has value.However, on its own this is not enoughfor them to deal effectively with the out-side world and its constant and rapidchange. Second, communities must alsodevelop the capacity to import andabsorb new knowledge from outside.There are many examples of communitieswhich have created their own knowledgesystem by integrating old and new know-ledge, prompted by the desire to surviveand prosper. Some communities are ableto find ways to function successfully inthe modern economy, while at the sametime practising local methods to conservethe natural environment and maintainingthe social and cultural practices whichgive the community strength and value.Such communities are able to survive andcontinuously build their own stock ofsocial capital.
Community empowerment is a conti-nuous learning process. The communitieslearn how to cope with risk, how to seek,preserve, and capture the resourcesnecessary for subsistence, how to copewith problems, and how to create a senseof community awareness. This processinvolves problem-solving, decision-making,development of human skills, and acapacity to plan and implement.
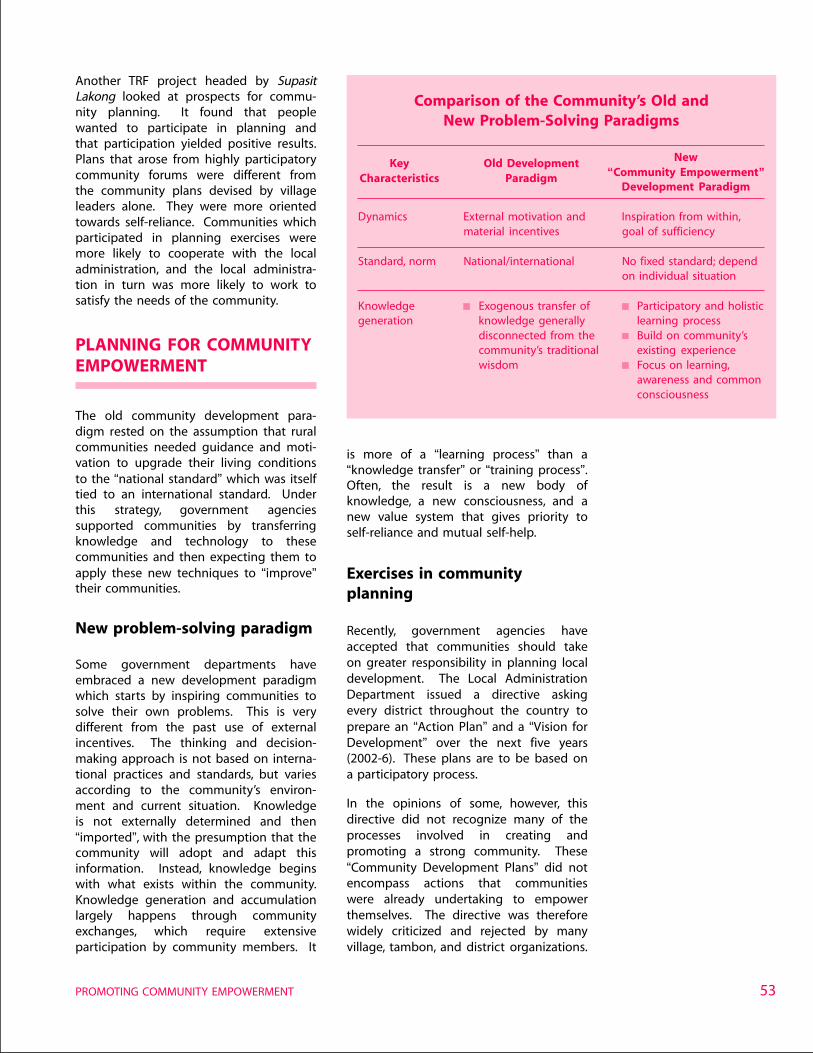
53
Another TRF project headed by SupasitLakong looked at prospects for commu-nity planning. It found that peoplewanted to participate in planning andthat participation yielded positive results.Plans that arose from highly participatorycommunity forums were different fromthe community plans devised by villageleaders alone. They were more orientedtowards self-reliance. Communities whichparticipated in planning exercises weremore likely to cooperate with the localadministration, and the local administra-tion in turn was more likely to work tosatisfy the needs of the community.
PLANNING FOR COMMUNITYEMPOWERMENT
The old community development para-digm rested on the assumption that ruralcommunities needed guidance and moti-vation to upgrade their living conditionsto the “national standard” which was itselftied to an international standard. Underthis strategy, government agenciessupported communities by transferringknowledge and technology to thesecommunities and then expecting them toapply these new techniques to “improve”their communities.
New problem-solving paradigm
Some government departments haveembraced a new development paradigmwhich starts by inspiring communities tosolve their own problems. This is verydifferent from the past use of externalincentives. The thinking and decision-making approach is not based on interna-tional practices and standards, but variesaccording to the community’s environ-ment and current situation. Knowledgeis not externally determined and then“imported”, with the presumption that thecommunity will adopt and adapt thisinformation. Instead, knowledge beginswith what exists within the community.Knowledge generation and accumulationlargely happens through communityexchanges, which require extensiveparticipation by community members. It
is more of a “learning process” than a“knowledge transfer” or “training process”.Often, the result is a new body ofknowledge, a new consciousness, and anew value system that gives priority toself-reliance and mutual self-help.
Exercises in communityplanning
Recently, government agencies haveaccepted that communities should takeon greater responsibility in planning localdevelopment. The Local AdministrationDepartment issued a directive askingevery district throughout the country toprepare an “Action Plan” and a “Vision forDevelopment” over the next five years(2002-6). These plans are to be based ona participatory process.
In the opinions of some, however, thisdirective did not recognize many of theprocesses involved in creating andpromoting a strong community. These“Community Development Plans” did notencompass actions that communitieswere already undertaking to empowerthemselves. The directive was thereforewidely criticized and rejected by manyvillage, tambon, and district organizations.
Comparison of the Community’s Old andNew Problem-Solving Paradigms
Key Old Development New
Characteristics Paradigm “Community Empowerment”Development Paradigm
Dynamics External motivation and Inspiration from within,material incentives goal of sufficiency
Standard, norm National/international No fixed standard; dependon individual situation
Knowledge Exogenous transfer of Participatory and holisticgeneration knowledge generally learning process
disconnected from the Build on community’scommunity’s traditional existing experiencewisdom Focus on learning,
awareness and commonconsciousness
PROMOTING COMMUNITY EMPOWERMENT
THAILAND HUMAN DEVELOPMENT REPORT 200354
Those “Community Development Plans”that were drafted under the directiveoften did not truly reflect the mobilizationof people’s power that enhances com-munity development. They were merely achecklist of the community’s problemsand needs.
In contrast, some government agencieshave been able to work more successfullywith communities by providing technical,advisory, and financial support. Onecase in point is the “Project for Increas-ing Capacity for Sustainable Agriculture”undertaken by the Ministry of Agricultureand Cooperatives in collaboration withagricultural community networks fromover 120 tambon in 21 provinces, withbudgetary support from UNDP. In thisproject, “community master plans” aredeveloped based on the principle of self-reliance. Communities plan to utilize theirown potential, in addition to learningfrom other communities within thenetwork. The public sector and NGOsparticipate in this learning process byproviding support in those areas wherethe community needs assistance. Theprocess of developing such communityplans involves six stages.
Arena 1: Brainstorming. “Examine theproblem and start with the things wealready have. Dream of things weare capable of doing and graduallywork towards that dream in a steadymanner.” Community representativesfrom every village of the tambon jointogether to consider their past ex-periences, the results of developmentprojects in rural communities, andtheir visions concerning sustainabledevelopment.
Arena 2: Information Collection. “If weare to start solving our problemsusing the tools already at hand, usinglocal resources and knowledge withinthe community, how should webegin?” This arena aims to gain anunderstanding of communal valuesand awareness; it attempts to in-crease self-reliance, interdependence,and the search for local potential.
Upon leaving Arena 2, village volun-teers begin the process of findinginformation about the community,such as information concerning thevillage’s history, leaders, debts, culture,local know-how, and resources.
Arena 3: Information Exchange. In thisarena, the village’s history, values andunique identity is related, and thevillagers learn about the “goodthings” that they have within theircommunity. They find out what skillsand expertise different communitymembers possess. They becomeaware of the changes that haveimpacted their lives as well as theproblems facing them. Such informa-tion not only triggers a sense of love,affection, and loyalty to one’scommunity, but it also encouragesvillagers to ponder how they can re-main together and solve communalproblems, rather than going theirseparate ways.
Arena 4: Analysis of Options. Here iswhere villagers study all optionsarising both from the ideas of thecommunity itself and from the expe-riences of other communities thathave successfully dealt with similarproblems. Study tours are conductedto visit model communities, stimulat-ing new and innovative ideas, whichcan supplement the community’sbody of knowledge. New contactsand friendships are also made withinthe larger community network.
Arena 5: Creating Plans. “What can wedo to have enough to live on and tohave a sustainable income for raisingour families?” In this arena, problemsparticular to each family are ex-panded to represent the commonconcerns of the people in the com-munity. The ideas conceived and theknowledge acquired in the previousarenas is used to create plans forsolving the community’s problemsin a viable way that will providebenefits to all the villagers. The com-munity master plan begins to take
“Examine theproblem and start
with the thingswe already have.
Dream of things weare capable of doing
and gradually worktowards that dream
in a steady manner.”
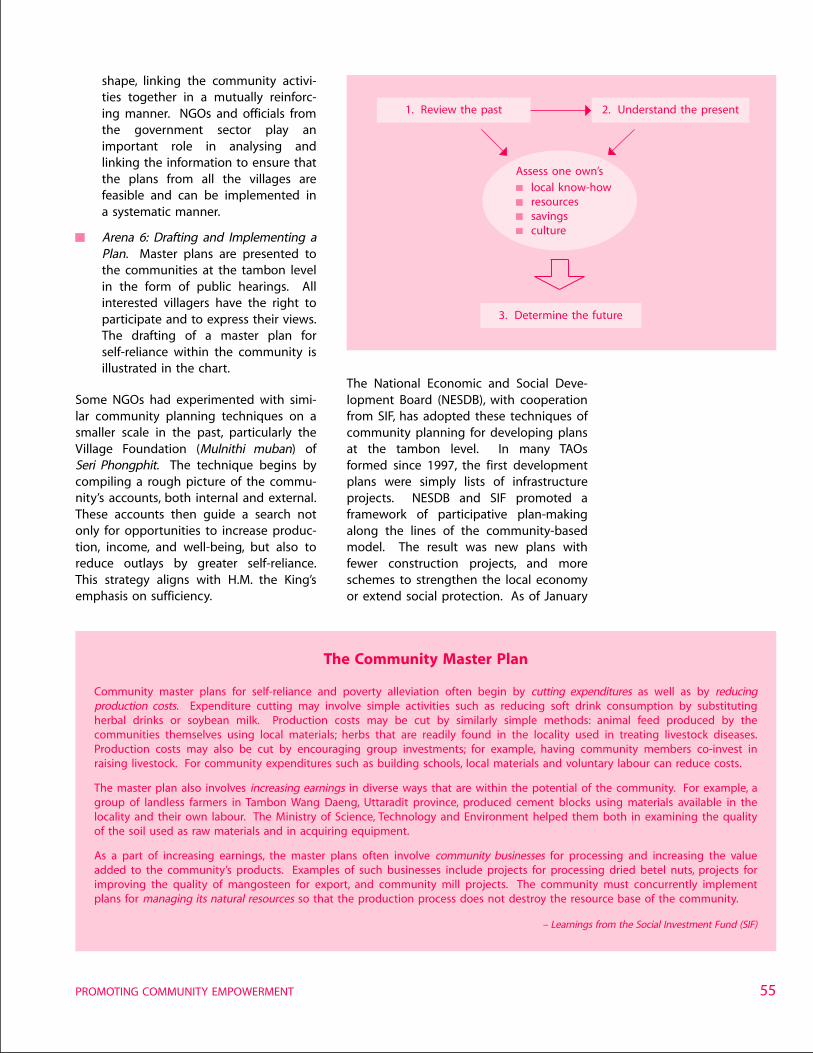
55
shape, linking the community activi-ties together in a mutually reinforc-ing manner. NGOs and officials fromthe government sector play animportant role in analysing andlinking the information to ensure thatthe plans from all the villages arefeasible and can be implemented ina systematic manner.
Arena 6: Drafting and Implementing aPlan. Master plans are presented tothe communities at the tambon levelin the form of public hearings. Allinterested villagers have the right toparticipate and to express their views.The drafting of a master plan forself-reliance within the community isillustrated in the chart.
Some NGOs had experimented with simi-lar community planning techniques on asmaller scale in the past, particularly theVillage Foundation (Mulnithi muban) ofSeri Phongphit. The technique begins bycompiling a rough picture of the commu-nity’s accounts, both internal and external.These accounts then guide a search notonly for opportunities to increase produc-tion, income, and well-being, but also toreduce outlays by greater self-reliance.This strategy aligns with H.M. the King’semphasis on sufficiency.
Assess one own’s
local know-howresourcessavingsculture
1. Review the past 2. Understand the present
3. Determine the future
The Community Master Plan
Community master plans for self-reliance and poverty alleviation often begin by cutting expenditures as well as by reducingproduction costs. Expenditure cutting may involve simple activities such as reducing soft drink consumption by substitutingherbal drinks or soybean milk. Production costs may be cut by similarly simple methods: animal feed produced by thecommunities themselves using local materials; herbs that are readily found in the locality used in treating livestock diseases.Production costs may also be cut by encouraging group investments; for example, having community members co-invest inraising livestock. For community expenditures such as building schools, local materials and voluntary labour can reduce costs.
The master plan also involves increasing earnings in diverse ways that are within the potential of the community. For example, agroup of landless farmers in Tambon Wang Daeng, Uttaradit province, produced cement blocks using materials available in thelocality and their own labour. The Ministry of Science, Technology and Environment helped them both in examining the qualityof the soil used as raw materials and in acquiring equipment.
As a part of increasing earnings, the master plans often involve community businesses for processing and increasing the valueadded to the community’s products. Examples of such businesses include projects for processing dried betel nuts, projects forimproving the quality of mangosteen for export, and community mill projects. The community must concurrently implementplans for managing its natural resources so that the production process does not destroy the resource base of the community.
– Learnings from the Social Investment Fund (SIF)
The National Economic and Social Deve-lopment Board (NESDB), with cooperationfrom SIF, has adopted these techniques ofcommunity planning for developing plansat the tambon level. In many TAOsformed since 1997, the first developmentplans were simply lists of infrastructureprojects. NESDB and SIF promoted aframework of participative plan-makingalong the lines of the community-basedmodel. The result was new plans withfewer construction projects, and moreschemes to strengthen the local economyor extend social protection. As of January
PROMOTING COMMUNITY EMPOWERMENT
THAILAND HUMAN DEVELOPMENT REPORT 200356
2002, the “Self-Reliance Community Mas-ter Plan” has been applied to over 1,700tambon.
From the experience of those involved inthese experiments in community plan-ning, certain characteristics are critical tosuccess:
Data must be updated and the learn-ing process must be continuous.
Implementation must be continuous.
There must be regular meetings forthe exchange of problems, informa-tion, and experiences.
There must be cooperation amongmembers of the public and privatesectors and the villagers.
Members of the younger generationmust be recruited to participate inthe plan in order to ensure futurecontinuity.
COMMUNITY-BASEDCRISIS RELIEF
The 1997 economic crisis placed the com-munity at the centre of efforts to alleviatethe social impact of the downturn, and tofind ways to recover. The crisis increasedthe acceptance among government de-partments and other development agen-cies of the importance of communityempowerment.
At the outset of the 1997 crisis, govern-ment and the IMF envisaged a relativelymild crisis, confined mainly within theurban economy. By early 1998, however,it was realized that the crisis would bedeep and far-reaching. The World Bankwarned: “economic and social structuresare under strain, and decades of unparal-leled social progress are under threat....The poor are being severely hurt. Wide-spread economic hardships are tearing atthe fabric of society”. The IMF supportedplans for a “social safety net”.
The speed with which the crisis drovemore people into poverty emphasized theweakness of schemes of social protection.The attempts to create a “social safety
Not the Documentbut the Process
“People don’t understandwhat community plans arebecause they are used tothe idea of plans that takethe shape of a thickvolume of papers. I am notlooking for a pile of docu-ments. I don’t want plansthat are based on expertiseoutside the communities.”
– Anek Nakabutra, Director of SIF
net” which could accurately identify andeffectively assist those impacted by thecrisis proved to be very difficult. The poorare often almost invisible and very diffi-cult to reach from the national capital.However, recent innovative research hasshown that communities are well awareof who the poor are and what kinds ofassistance they need.
Experienced Thai observers warned that,on past experience, the impact of thecrisis would fall heavily on rural society.Community activists took the opportunityto urge government to base its crisis reliefstrategies on support for local communi-ties. Some government projects adoptedthis localized approach.
“Sufficiency Economy”projects
H.M. the King’s royal initiative on theSufficiency Economy aimed to combat theimpact of the crisis in the short term, andto alleviate poverty in the longer term, bytwo associated strategies.
Self-reliance: Community self-reliancecan be demonstrated in several ways:replacement of external productionmaterials with local ones, use of localexperts instead of external experts,use of local wisdom to create in-come-generating activities instead ofadopting new and unfamiliar tech-niques, reliance on local sources offunds instead of external borrowing,community self-management in lieuof reliance on external support,hands-on and take-charge actionsinstead of waiting for governmentassistance, as well as more emphasison building social capital along witheconomic capital.
Sufficiency: Communities regard suffi-ciency as the key poverty reductionstrategy. They opt to produce com-modities that are readily marketable.They focus on reducing expensesrather than increasing income. Inaddition, communities ensure thatthere is adequate production forhousehold consumption.
57
The Ministry of Interior adopted the stra-tegy of a Sufficiency Economy and gavesupport to 50,093 vocational groups with531,989 members, 3,425 community busi-ness groups, 11,247 self-reliant groups,1,833 groups creating new designs andimproved packaging, and 359 groupsreceiving certification for their productionstandards.
One major strand of the Ministry of Inte-rior’s strategy, also supported by otheragencies and the private sector, wasto develop and upgrade communitybusinesses such as small community ricemills, rubber-processing plants, noodlefactories, food and beverage making,small petrol stations, and communityshops. Assistance and advice was givento upgrade the quality of products, toreduce production costs, to create newdesigns, to improve packaging, and toplan marketing strategies.
Community participation
The Community Development Depart-ment expanded the scope of communityparticipation in the Tambon DevelopmentProject and the Poverty AlleviationProject. In the past, only members ofvillage committees were involved insubmitting projects to seek funds fromthe Tambon Development Project, andapproving loan requests from the PovertyAlleviation Project for poor peopleseeking investment loans. Proceduresfor both projects were changed so thatforums involving all the stakeholders inthe community have an opportunityto take part in the decision-makingprocess.
The Eighth Plan had championed theconcept of partnership building andnetworking among public offices andprivate organizations. This had resultedin the formation of “civic assemblies” insome provinces to debate strategies oflocal development. In this context, theNational Social Policy Committee (NSPC)was founded in 1998 to recommendstrategies to help people cope with thesocial impact of the crisis. It was the firstnational committee where representa-
tives from the private sector and civilsociety outnumbered bureaucrats. Itidentified community empowerment notonly as an important way to mitigatethe social and economic impact of thecrisis, but also as a key social reformstrategy.
By 1999 it was evident that governmentagencies had difficulty in identifyingand targeting those most affected by thecrisis. NSPC drew up the CommunityEmpowerment Response to Crisis ActionPlan (CERCAP) designed to enhance thecommunity capacity to help with identifi-cation and targeting. It helped improvethe community’s ability to identify solu-tions to their problems. With a minimalbudget, CERCAP facilitated communitycivic assembly processes and bottom-upplanning. It also helped mainstreamcommunity plans into the government’sregular programs.
The Rural Development Fund (RDF) wasexpanded to provide credit directly tocommunity-based organizations. In 1999,2,722 community-based organizationsbenefited from RDF loans totalling 831million Baht. In 2001, the governmentmerged the RDF and the Urban Deve-lopment Fund to establish the Commu-nity Organizations’ Development Institute(CODI), which supports community em-powerment on a continuous basis. CODIis an autonomous public organizationwith a nationwide community organiza-tion network and total funding of Baht2,700 million.
Social Investment Fund (SIF)
The largest crisis relief measure wasinitiated by the World Bank and the JapanBank for International Cooperation. In ini-tial debate on this project, representativesof Thai civil society urged “Don’t givemoney to the government and bureaucra-cies” as it would result only in leakageand delay. The agencies in fact decidedto channel part of the funding throughgovernment offices (mainly into employ-ment generation schemes), but to channelthe major part directly to community-based projects. This included a RegionalUrban Development Fund (RUDF) of $30
PROMOTING COMMUNITY EMPOWERMENT
THAILAND HUMAN DEVELOPMENT REPORT 200358
million for loans to municipal govern-ments, and the Social Investment Fund of$120 million for grants to communityorganizations.
The Social Investment Fund (SIF) wasmanaged through a new Social FundOffice (SOFO) placed under the Govern-ment Savings Bank (GSB), headed byPaiboon Wattanasiritham, the formerbanker turned community activist. Theprimary objective of SIF was defined as:
Transforming the economic crisis intoan opportunity for social reform atthe urban and rural grassroots levels.This reform should start with the so-cial capital that is inherent in eachlocality and join forces with them toassist in the development of theirlearning processes and the streng-thening of their capabilities in orderto empower those communities tobe self-reliant in the long run.
The objectives also included “Streng-thening the rural economic base by em-phasizing economic self-reliance as a newalternative for Thai society” and “Streng-thening the society through the establish-
ment of civil society networks”. Themanagement of the fund was placedunder a 16-member board includingacademics, NGO workers, officials, and sixcommunity representatives. Project pro-posals were solicited directly from “com-munity organizations”, roughly interpretedto mean any grouping which had existedfor one year. Funding was disperseddirectly to community organizationsthrough the GSB. Monitoring and evalua-tion were carried out by academics.
From 1998 to early 2002, SIF supportedover 7,200 projects with total funds of4,100 million baht. Half the funding waschannelled to projects for immediatewelfare. The remainder was distributedover a broad range of projects to buildsocial capital. The number of beneficiaries(according to the application forms) wasover 12 million. It was the first time alarge sum of public resources was trans-ferred to support community-led initia-tives where the funds were directlymanaged by grassroots organizations.
A full evaluation of the impact of SIFfunding is not yet available. But SOFOhas compiled reviews of learnings fromthe process.34
The project started slowly because manyNGOs were reluctant to cooperate in aproject funded by the World Bank, andbecause the World Bank was so worriedabout corruption and leakage that itimposed strict working guidelines undercentral control. Eventually however, theSIF executive persuaded the World Bankto allow the work of screening andmonitoring projects to be decentralizedto eleven regions; and eventually NGOworkers understood that the scheme wasvaluable and accepted that the immediatemanagement was controlled by the Thaiboard not the World Bank. The SIF boardwas then able to establish regionaland provincial committees manned by“doctors, lawyers, social activists, business-
34 SOFO, 999 Days of Learning: Social InvestmentFund, February 2002; and 37 Months of SocialInvestment Fund Operations: Volume I, Develop-ment of the Social Investment Fund, April 2002.
The Objectives of the Social Investment Fund
To encourage social reform through the decentralization of authority toinclude community participation in development;
To strengthen the capacity-building of local communities and localorganizations, especially in decision-making and management to beself-reliant in the long run;
To promote local self-reliant economic systems;
To promote multi-party partnership between the government and thepeople;
To stimulate local participation in social development including thepromotion of civil societies and the concept of good governance;
To support investment in community assets such as necessary socialand economic infrastructure to communities through the developmentof human, social and natural resource capital.
The SOFO will thus combine short-term objectives of employment, incomegeneration and social welfare with the long-term objective of strengtheninglocal management capacity through participatory decision-making atthe community level. While addressing short-term social and economicproblems, a long-term objective of this program is to use the process ofallocating funds as a means to strengthen local community capacities.
59
persons, religious and spiritual leaders,community leaders, journalists, teachersand professors” which screened, appraised,and monitored projects. The incidence ofcorruption was low and was managed bylocal consultation.
The main problems then lay in workingwith the old power structure:
Local and national politiciansschemed to gain access to the funds.
Officials in central agencies endorsedthe scheme, but local officials did notnecessarily follow central directives.
Local officials often questioned thelegitimacy of the SIF scheme, or sawit as a rival to their own work. “Manyofficials were keen to work for thepublic benefit, but they ran upagainst the fact the bureaucracy isnot used to working with others.”
Some SIF volunteers were equallyreluctant about working with officials.
SIF pioneered a new method of fundingcommunity projects resulting in signifi-cant learnings both for the communitiesthemselves and for the civil societyorganizations involved. “The process ofapplying for SIF is already a learningprocess that is a part of communitycapacity building” (Ammar Siamwalla,chairman of SIF). Communities had tocome together and learn how to write aproject proposal. NGOs helped. “It reallystirred things up”, reported one villagerinvolved. The SOFO report lists some ofthe indirect benefits as follows:
Learning about the rights andresponsibilities of the individual andof government organizations to thecommunity.
Learning about community powerin self development and communitydevelopment.
Participation in every stage of theimplementation process resulting in asense of ownership and the desire tomaintain the activity or structure thatwas created.
Emergence of the process of identi-fication and application of socialcapital that in some cases is personalexpertise that will soon be lost.
The direct benefits are difficult to quantifysince the funding mostly went intoprojects to build social capital which isdifficult to measure. However, thoseinvolved in SIF identified certain projectsas of special interest:
Projects to build child-care centreswhere SIF imposed conditions toensure community participation insuch things as funding teacher costs,providing lunches.
Projects of immediate social welfarewhich involved people in thecommunity devising ways to assistchildren, the elderly, the sick, andthose affected by HIV/AIDS. In somecases SIF pioneered ways to fundsocial protection in a self-reliant wayfrom the profits of community busi-nesses and credit schemes.
After two years, SIF adopted thetechnique of participative communityplanning, and in retrospect wouldhave institutionalized this from thevery beginning.
The volunteer bodies formed to screenapplications subsequently took on othertasks, such as participating in consulta-tions on the Ninth Plan. The CommunityOrganizations’ Development Institute triedto build on the momentum of SIF. It setup a network of community-level activiststo develop regional plans, and to providehelp to weaker communities in their deal-ings with government and other agencies.
Thai Rak Thai government’svillage projects
In January 2001, a new government cameto power headed by the Thai Rak Thaiparty of Thaksin Shinawatra. The partysucceeded at the elections in partbecause of an innovative appeal to voterson a platform of popular measures: debtrelief for farmers, a million-baht revolvingfund for each village, and a 30-baht-per-visit health care scheme. The party wona near-majority at the polls, and built a
PROMOTING COMMUNITY EMPOWERMENT
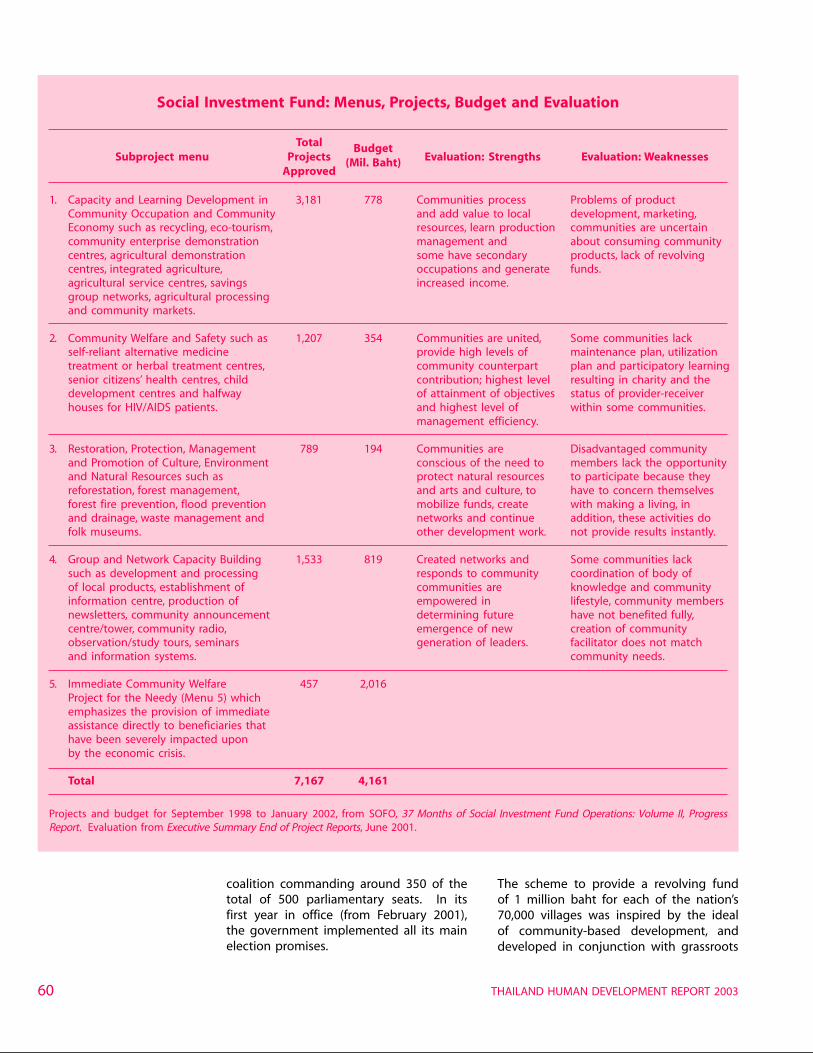
THAILAND HUMAN DEVELOPMENT REPORT 200360
1. Capacity and Learning Development inCommunity Occupation and CommunityEconomy such as recycling, eco-tourism,community enterprise demonstrationcentres, agricultural demonstrationcentres, integrated agriculture,agricultural service centres, savingsgroup networks, agricultural processingand community markets.
2. Community Welfare and Safety such asself-reliant alternative medicinetreatment or herbal treatment centres,senior citizens’ health centres, childdevelopment centres and halfwayhouses for HIV/AIDS patients.
3. Restoration, Protection, Managementand Promotion of Culture, Environmentand Natural Resources such asreforestation, forest management,forest fire prevention, flood preventionand drainage, waste management andfolk museums.
4. Group and Network Capacity Buildingsuch as development and processingof local products, establishment ofinformation centre, production ofnewsletters, community announcementcentre/tower, community radio,observation/study tours, seminarsand information systems.
5. Immediate Community WelfareProject for the Needy (Menu 5) whichemphasizes the provision of immediateassistance directly to beneficiaries thathave been severely impacted uponby the economic crisis.
Total
3,181 778
1,207 354
789 194
1,533 819
457 2,016
7,167 4,161
Communities processand add value to localresources, learn productionmanagement andsome have secondaryoccupations and generateincreased income.
Communities are united,provide high levels ofcommunity counterpartcontribution; highest levelof attainment of objectivesand highest level ofmanagement efficiency.
Communities areconscious of the need toprotect natural resourcesand arts and culture, tomobilize funds, createnetworks and continueother development work.
Created networks andresponds to communitycommunities areempowered indetermining futureemergence of newgeneration of leaders.
Problems of productdevelopment, marketing,communities are uncertainabout consuming communityproducts, lack of revolvingfunds.
Some communities lackmaintenance plan, utilizationplan and participatory learningresulting in charity and thestatus of provider-receiverwithin some communities.
Disadvantaged communitymembers lack the opportunityto participate because theyhave to concern themselveswith making a living, inaddition, these activities donot provide results instantly.
Some communities lackcoordination of body ofknowledge and communitylifestyle, community membershave not benefited fully,creation of communityfacilitator does not matchcommunity needs.
Projects and budget for September 1998 to January 2002, from SOFO, 37 Months of Social Investment Fund Operations: Volume II, ProgressReport. Evaluation from Executive Summary End of Project Reports, June 2001.
Social Investment Fund: Menus, Projects, Budget and Evaluation
Total BudgetSubproject menu Projects (Mil. Baht) Evaluation: Strengths Evaluation: Weaknesses
Approved
coalition commanding around 350 of thetotal of 500 parliamentary seats. In itsfirst year in office (from February 2001),the government implemented all its mainelection promises.
The scheme to provide a revolving fundof 1 million baht for each of the nation’s70,000 villages was inspired by the idealof community-based development, anddeveloped in conjunction with grassroots
61
NGOs. The new government alsolaunched a People’s Bank by creating anew window for small loans from theGovernment Savings Bank, and launcheda scheme of “one tambon, one product”based on the model from Oita prefecturein Japan. The village fund was launchedand distributed to most of the nation’svillages in 2001.
Like SIF, the village fund is managed andallocated by a village committee, not agovernment entity. Unlike SIF, however,there is no emphasis on building socialcapital or providing social welfare. Thesame one million sum is provided to eachvillage, irrespective of size or need. Thesum is a loan (as a revolving fund), nota grant. The government monitors therepayment record, but has less interest inthe process whereby the fund is allocated,or the results achieved.
These schemes have become bothpopular and controversial, for severalreasons. First, the objectives seem to bemixed. The prime minister, ThaksinShinawatra, has explained that theschemes are intended to “solve theproblem of poverty of the majority” and“reduce the socio-economic gaps be-tween the poor and the well-to-do, and,especially between the rural and urbansectors”. This is needed “to ensure socialcohesion and political stability, which willenable economic recovery and growth”. Inaddition he has said that the plans areattempts “to encourage Thais to be moreentrepreneurial”.
Second, the schemes are also part of anattempt at fiscal stimulus. Hence somefear that disbursing the money quicklymay be more important than ensuring itis well spent.
Third, some believe that the large sums ofmoney being given to villages may tearthe community apart. The practice ofeasy handouts by the government couldjeopardize the community’s financial self-discipline and thereby weaken the com-munity’s self-reliance. One grassrootsorganizer noted that it commonly tookfive years for a village credit fund toaccumulate assets of one million baht –
with the managers and members learningby the process – but with the newscheme a million baht appears in an in-stant. Another commented that this wasjust another temptation to debt, whicheventually forced villagers to migrate insearch of work. Another complained thatthe scheme was unsystematic, and failedto learn from SIF.
These schemes are promoted by agovernment with a dominating parliamen-tary majority. The amount involved in thegovernment’s village projects surpassesany previous attempt to provide fundingfor local community projects and hencehas the potential to have an enormousimpact. As yet there is no publicly avail-able independent evaluation (except ofthe repayment). But the launching ofthese schemes has created a new facetin the debate on the true meaning ofcommunity empowerment.
CONCLUSION
Community empowerment is a learningprocess on a national scale. The motiveforce must come from within commu-nities themselves. But success requiresunderstanding and acceptance by govern-ment and civil society.
Among the many community groupswhich had emerged by the 1990s, largelyunder their own steam, two types standout. The first are savings and creditgroups. The second are groups trying tomanage the local environment. These re-flect the two main problems facing localcommunities in the midst of rapid eco-nomic and social change, namely thevulnerability to debt, and the importanceof the community’s natural resources.Groups formed to confront these twoissues often served as the basis for othercommunity projects, including socialprotection, health care, and education.
Some experiments in cooperationbetween communities and outside actorsemerged from the 1980s onwards. Com-panies sponsored income-enhancingprojects. Donor agencies began to chan-nel funds direct to community groups.
PROMOTING COMMUNITY EMPOWERMENT
The amountinvolved in thegovernment’s villageprojects surpassesany previousattempt to providefunding for localcommunity projectsand hence has thepotential to have anenormous impact.
THAILAND HUMAN DEVELOPMENT REPORT 200362
The HIV/AIDS pandemic prompted apioneer example in coordination betweengovernment agency, community, andNGOs.
The broader social effort to understandcommunity empowerment took a majorstep forward in the early 1990s whenofficially sponsored research agencies set
out to understand the community andpromote its strength. A key finding oftheir research is that community em-powerment is not a technique or admi-nistrative structure but a learning processthat blends old and new knowledge, iscontinuous, goes through many stages,and may involve struggle.
This insight was applied through bottom-up planning techniques which aimedto facilitate and accelerate the learningprocess, and eventually to institutionalizeit within the community. The firstreaction of some participants in theseexercises was the admission that they hadforgotten how to learn.
The 1997 crisis led many agencies toadopt community-based strategies. Thecrisis context in particular enabled somecivil society leaders and a large numberof volunteer activists to experimentwith community-based attempts to buildsocial capital under the SIF scheme. Thisexperiment showed the huge potentialfor community action. It also revealedsome of the remaining barriers. Someofficials perceived it as a threat to theirauthority and their role. This reaction isanother reminder that community em-powerment is a learning process involvingthe whole society.
Over the past decade, the movementtowards community empowerment inThailand has progressed from twodirections. On the one hand, there hasbeen a rapid increase in community-ledinitiatives. On the other hand, somegovernment and other outside agencieshave become positive and pro-activeabout the need to promote communityempowerment in order to stimulateeconomic growth, build social capital, andenhance well-being. The marriage ofthese two forces has enormous potential.At this stage the process of communityempowerment is more important thanthe specific outcomes. This is a transi-tional stage in which new techniques andnew forms of government-communitycooperation are being developed whosefull potential will only be realized in thefuture.
The Community and the Rest
A debate which has raged among community theorists from the 1970s tothe present revolves around the relations between the community andother social actors – particularly government, the business sector, and theurban middle class. This debate has sharpened with the recent proliferationof community-based schemes, backed by organizations (government, WorldBank) with significant funding.
At one end of the spectrum are schemes designed to integrate commu-nities with the urban economy. Often these schemes are designed topromote entrepreneurship, and come with strong financial backing.
The Thaksin government schemes represent this end of the spectrum. Sodo several schemes launched by corporations and NGOs to involve localcommunities with specific business operations. The TBIRD scheme, forexample, links local community businesses to multinational companiesas subcontractors. The Bangchak oil refinery encourages communities tooperate gas stations on franchise, and sells community products through itsstore network.
Critics from the other end of the spectrum argue that such schemes do nottruly strengthen communities but rather make them dependent. Theyargue that the promotion of entrepreneurship and urban values threatensthe intrinsic community values which are worth preserving. They believethat community empowerment must emerge bottom-up, not from showersof money.
Activists like Seri Phongphit and Phittaya Wongkun are sceptical of businesspatronage of community schemes because they see no concrete basis ofcommon interest over the long term. They are sceptical also of governmentfinancial patronage as it contradicts the principles of sufficiency andself-reliance. Instead they advocate networking to increase communities’strength in bargaining with the urban economy and the government.
Community rights advocates like Saneh Chamarik and Anan Ganjanaphanagree with the need for local strength, but also believe that claims forcommunity rights provide a stronger basis for communities to bargain froma position of moral strength.
Activists like Prawase Wasi stand at the mid-point of the spectrum. Theyargue that political reality (the dominance of the urban economy andsociety) means communities must gain the political support of the urbanmiddle class and of government. Prawase also constantly urges businessand the middle class to recognize the value of local communities (“Don’t letus think that they are enemies like communists, we must think in terms ofallies.”), and has advocated various “partnership” schemes to institutionalizethe linkage.
63
People like us need endurance. Weneed to build a model community soothers can understand and follow. Weknow if we understand one another,care for one another, work for oneanother, and have discipline in ouractions, then we will get justice.
– Mun river villager
Thailand is now at a crossroads. As thecountry moves beyond the crisis, thenational agenda has begun to shift again.The prospect of renewed growth hasredefined national priorities. The changesin the institutional framework now face aprocess of review in which arguments forminor improvements became confusedwith movements for serious weakening ofthe new Constitution. The Constitutionand crisis have ushered in a new govern-ment with an explicit commitment to“think new, act new”. Much is now fluid.The extent to which community empo-werment will guide and assist develop-ment will be determined by decisionsmade over the next few years.
In this synthesis chapter, we first widenthe scope and place the concept of com-munity empowerment in its internationalcontext, historical context, and theoreticalcontext in debates on development. Wethen look at the different interpretationsof community empowerment in Thailandand show that, while there is a great dealof disagreement on detail, the various in-terpretations fit within a single framework– moreover, this framework comes fromthe communities themselves. On this ba-sis we suggest what can be done in termsof public policy to develop communityempowerment in Thailand as a strategy tofurther the goals of human development.
CHAPTER
COMMUNITY EMPOWERMENTAT THE CROSSROADS
4
WHY EMPOWERMENT?
Human development is about more thanincome. It is about widening people’schoices to lead lives they value. Thismeans expanding the capabilities of peo-ple to live long, healthy and creative lives,to acquire knowledge, to have access tothe resources needed for a decent stan-dard of living, and to enjoy dignity, self-respect, and the respect of others. Poli-cies in support of human developmentgoals try to create an environment inwhich these capabilities can be enhanced.
The globalizing trends of recent decadeshave made these goals both more impor-tant and more difficult to attain. Thewealth of the world has increased rapidly,but the division between rich and poor,powerful and powerless, protected andunprotected, knowledge-rich and know-ledge-deprived have become wider andoften more rigid. At the same time,globalizing trends have changed the waysin which these human development goalsmust be pursued. While reports on thedecline of the nation-state may be exag-gerated, there has been growing acknow-ledgement of the role of other actors –unofficial, local, international – in the taskof human development.
Human development andhuman rights
UNDP has long been committed toa participative, bottom-up approach tohuman development. However, UNDPresponded to the new conditions of theglobalization era with an important inno-vation – realizing the powerful synergies
COMMUNITY EMPOWERMENT AT THE CROSSROADS
THAILAND HUMAN DEVELOPMENT REPORT 200364
between human development and humanrights. This shift of thinking is the back-ground to the importance of empower-ment. A human rights-based approach tohuman development is not only aboutexpanding people’s choices and capabili-ties but about the empowerment of peopleto decide how this should be achieved.
Rights lend moral legitimacy to humandevelopment goals, and bring in legal toolsas means to achieve them. Claims to rightsare ways powerless and marginal groupscan enlarge their political space. Develop-ment becomes a right not a gift – includ-ing the right to food, the right to goodhealth, the right to housing, the right toeducation, the right of access to the meansof livelihood, the right to have rights, andthe right not to be poor. Governmentsmay respond that there are barriers tomeeting certain claims to rights becauseof lack of resources, conflicting claims, orinstitutional constraints. But the languageof rights sets up a dialogue over how andwhen such barriers may be overcome.
In sum, empowerment is a primary stra-tegy to achieve the human developmentgoals of poverty alleviation, equity, partici-pation, and sustainable development.
WHY COMMUNITY?
Community activists in Thailand arrived atthe same conclusion in response to thesame international context but with somecultural influences that are quite distinc-tive.
The background lies in the developmentera that stretched from the 1960s tothe 1990s. By the post-war era, the cen-tralized nation-state created in the colo-nial era was under the control of militarydictators with strong external backing.Power was highly centralized and civilsociety suppressed. Through top-downdevelopment policies geared to industri-alization, this powerful state achievedexceptionally high rates of growth, butwith considerable costs including growinginequality of income and various entitle-ments; disruption of local communities;environmental destruction; and persistentpoverty among certain groups.
Developmentand disempowerment
The local communities’ view of this“age of development” is highly specific. Ithighlights how environmental destructionaffected their way of life. It stressesthat “development” brought both materialgains but also disempowerment. This ishow this view was expressed by thecommunities contributing to this Report:
In the past, villagers’ livelihood de-pended on resources of land, water,forest. They accumulated knowledgeof using resources by experiment andpractice. They valued coexistencewith nature and with their com-munity neighbours. They producedprimarily for themselves. They over-came insecurity by mutual sympathyand sharing. These values wereexpressed and reinforced by customsand ceremonies. The memory of thispast remains an ideal which shapesaspirations for the future.
For the villagers, development hadtwo sides. On the one hand, govern-ment provided social and economicinfrastructure, new social services,agricultural support, credit, education,and access to information. In somerespects, life changed for the better.But on the other hand, developmentalso made agriculture more subjectto the market and its risks, and morereliant on imported inputs of tech-nology, capital, and knowledge whichthe villagers do not control. Manyfell into debt, lost land, and had tomigrate to the city. Besides, the cityenclosed more natural resources tosupport the urban economy (such asfor power generation) and destroyedothers (such as through pollution).Villagers were often asked to “sacri-fice” their access to resources fordevelopment in which they did notparticipate or benefit. They lost thepower, the foundation of values, andthe knowledge base to manage theirown lives.
– From the conclusion agreed among thecommunity contributors to chapter 1
The localcommunities’
view of this “age ofdevelopment” is
highly specific.It highlights how
environmentaldestruction affected
their way of life.It stresses that“development”
brought bothmaterial gains
but alsodisempowerment.
65
Civil society and community
From the mid-1970s, the collapse of exter-nal support for dictatorship and thegradual emergence of civil society begana trend towards formal democratization.But with the overhang from the feudaland dictatorial past, this democracywas highly exclusionary. Paternalism wasetched into the mentality of the bureau-cracy. Businessmen nurtured under theurban-biased development policy domi-nated the parliamentary system by ex-ploiting the power of money. In response,excluded groups adopted a “people’spolitics” of protest and negotiation, andbegan to seek “direct democracy”.
In the emerging civil society oppositionto both centralized power and top-downdevelopment policy, the idea of thecommunity played an important role. Thecommunity was upheld as both a re-pository of values different from thoseintrinsic to industrialization, and a founda-tion for opposing or neutralizing centra-lized power. This thinking began amonggrassroots development workers, was thenprocessed by academics and intellectuals,who handed back concepts and strategiesto grassroots activists. By the 1980s, therewas a “language” of community thinkingwhich facilitated debate across villagers,development workers, and intellectuals.By the 1990s, advocates were able topush this language and its concepts intothe halls of policy-making.
By the time of the 1997 Asian crisis, thecommunity idea in Thailand had theweight, complexity, depth, and sophistica-tion which comes from a generation ofdebate and practice. The crisis moved itfurther into the mainstream. Advocatestook the opportunity to blame the crisison past development policy and topresent community strategy as an alter-native. Government and internationalagencies grasped onto community em-powerment as a means to deliver socialprotection against the impact of the crisis.A wide-ranging debate on self-streng-thening took on some of the languageand perspective of community thinking.Concepts of “sufficiency” and “self-reliance”were adapted to national-level policy andwritten into the five-year plans.
Inside the community
This Report pays little attention to divisions and inequalities within commu-nities. Partly that is because local variety defies generalization. But there isalso a reason based on Thailand’s political economy.
In many societies, the divisions within rural communities arise from differen-tial access to land – the classic rural society of landlord, tenant, and landlesslabourer. But Thailand’s rural society developed very differently because ofthe existence of an open land frontier. Until very recently, most householdshad access to land. When the land-man ratio started to deteriorate fromthe 1970s, urban growth drew much of the excess population off to thecity. Still today, around 87 per cent of all holdings are owned and only 13per cent rented. Many of the rentals are inside a family, and others areabsentees. Rural Thailand is a society of smallholders. It is hard to find avillage in Thailand dominated by the house of the big landlord. But, inrecent decades, the ranks of landless and land-poor have increased.
Power in Thai rural society derives not from landholding as much as fromconnections to bureaucracy and capital. In local vocabulary this is termeditthiphon, influence, a different word from the phalang and amnat in“empowerment” because it is seen as a very different force. People insidethe community draw on this influence. But its origins are outside thecommunity. Combating this influence is part of community empowerment.
Before the crisis, growing civil societypressure was bringing changes in state-society relations and development policyorientation. Over the late 1990s, thispressure resulted in a substantial shift inthe institutional context of developmentpolicy-making, namely a new Constitutionenshrining new rights, a commitment topeople-centred development planning, aprogramme of decentralization to localgovernment, and an ambitious overhaulof the education system. In the urgencyto cushion the social impact of the crisis,government departments and interna-tional agencies launched bold experi-ments to build social capital throughcommunity projects.
Empowerment as a learningprocess
The Thai version of community empo-werment has been created in the sameinternational context as the internationalagenda, and hence they have manysimilarities in concept, though greatdifferences in the form of expression. TheThai community advocates make thewhole approach revolve around “learning
COMMUNITY EMPOWERMENT AT THE CROSSROADS
THAILAND HUMAN DEVELOPMENT REPORT 200366
communities”. In essence this is the sameas the Human Development concept of“expanding capabilities”. In the 1990s, theThai advocates explicitly adopted thelanguage of human rights because theyunderstood its capacity to empower.
To empower themselves again, com-munities need to remake a learningprocess. This begins with mobilizingthe human resources of wisdom andleadership in the community to jointogether to identify and confrontproblems. The next stage is to re-cover local knowledge about usingresources in an ethical and sustain-able way. This knowledge may haveto be adjusted and publicized so thatthe wider society understands andappreciates its meaning. The com-munity may have to build networksoutward from the community inorder to gain space in the society,and secure access to the resourcesneeded for livelihood and well-being.The community will gain the confi-dence and ability to learn fromoutside in ways which expand ratherthan destroy local capabilities.
– From the conclusion agreed among thecommunity contributors to chapter 1
For many communities, the focus of theirproblems is the deterioration or loss ofthe natural resources which were the ba-sis of their livelihood. The strength of thecommunity is inseparably bound up withaccess to natural resources.
WHAT IS EMPOWERMENT?
The English word “power” combines twodifferent meanings. The first is the powerwhich is intrinsic to something, such asthe power of a fuel. The second is theauthority to command, such as the powerof a government office or law. Thisambiguity is repeated in many otherlanguages, including Thai. The first mean-ing is expressed by phalang which is usedin such contexts as “electric power”. Thesecond meaning is expressed by amnatwhich is used in such contexts as “to seize
The rapid deterioration ofnatural resources and thelimited results of attemptsat revival have impactedon the quality of life andwell-being of the people,and have weakened thefoundations of the society.
– Ninth Plan summary(Thai version), chapter 3
power”. Often the two words are usedtogether as phalang amnat. This was theform which the communities contributingto this project chose in the translation of“empowerment”. This acknowledges thatcommunity empowerment is not onlyabout mobilizing internal resources, butalso about confronting external powerrelations. One of the community repre-sentatives on this project commented:“Power (amnat) belongs to us; it doesn’tcome from the government”.
The community representatives whocontributed to this project summarizedtheir approach to community empower-ment as three strategies:
1. Building their community power tosolve problems independently. Centralplain farmers developed “sufficiency”systems of farming to escape theinsecurity of market-oriented agricul-ture. The U-taphao communitiesdeveloped the Bank of Life, not onlyto provide appropriate credit, but tofund social protection and tocultivate virtues such as sharing andsympathy.
2. Building their community power tonegotiate cooperation with outsideagencies. Samrong canal communi-ties became anti-pollution activists –not only cleaning up the canal butgathering data on the sources ofpollution – in order to negotiate withstate agencies and business groupsto accept and support their right ofresidence.
3. Building their community power andnetworks to claim and protect com-munity rights. Communities in thenorthern highlands and along theMun river lost access to the resourcesbasic to their livelihood. To reclaimrights of access, they built networksof support in the society and beyondby reviving their local knowledge inmanaging resources, and findingways to make other groups under-stand and support their claims.
– From the conclusion agreed among thecommunity contributors to chapter 1
67
Importantly, the community representa-tives see these three strategies as succes-sive stages of a single approach. Let usnow look at each of these three strategiesin more detail.
1. Building their communitypower to solve problemsindependently
In the past it was difficult to mobilizeour own resources. Now it’s not.
– Community leader
I’ve seen how they do it on their own.So I’ve left them alone... they’re doingfine on their own.
– Community Development Officer
UNDP has defined empowerment as “theability of people to gain understandingand control over personal, social, eco-nomic and political forces in order to takeaction to improve their life situations”.Outside agencies (NGOs, government of-fices, private sector, international agencies)can encourage, guide and facilitate theprocess, but essentially it is internal to thecommunity. It begins with consciousnessof the problems and the possibility ofsolution. It requires a learning process toanalyse the problems, to revive relevantlocal wisdom, and to seek new know-ledge. It moves then to the mobilizationof social resources, and participativedecision-making. The process, as well asthe result, is empowering.
This model corresponds closely to theexample of the Bank of Life described inchapter 1. It is worth noting that thisexample of local micro-credit has beenrepeated – successfully – many times allover Thailand in the last two decades. SIFprojects, and the current government’svillage funds, are based on similar princi-ples. Empowerment of this sort cannotbe prescribed. It has to be learnt frompractice.
2. Building their communitypower to negotiatecooperation with outsideagencies
This is an extension of the first strategywith the addition of government andother outside agencies as actors involvedin both negotiating the solution andachieving the outcome. Outside agenciesmay provide budget funds, administrativeresources, specialized knowledge, orauthority to achieve the outcome. Com-munities have to learn how to deal withthese outside agencies, and how toincrease the assets they can bring to thenegotiation. This may involve a furtherprocess of learning, and some building ofnetworks with other groups in a similarsituation, or with NGOs and other allies.
Some departments of government haveresponded to this approach with enthu-siasm. This is the model underlyingthe experiments in community planningdescribed in chapter 3.
However, the example of the Samrongcanal communities adds an extra element.The Samrong communities began from asituation of disempowerment. They hadno rights of residence and they wereblamed for pollution of the canal. Theywere able to overcome these disabilitiesby cleaning up the canal, by identifyingthe sources of the pollution, and bycreating a network of support among thevarious communities and some outsideallies (NGOs, local business). The outcomewas successful for all: the government’stask was eased, the canal was cleanedup, the communities were not evicted.The communities created a situation inwhich they could make a claim for theright to residence and the right toassistance from government. This exam-ple involves power not only as intrinsicpower (phalang) but also as authority(amnat). It introduces questions of rightsand the negotiation of claims to rightswhich are more prominent in the thirdstrategy.
COMMUNITY EMPOWERMENT AT THE CROSSROADS
THAILAND HUMAN DEVELOPMENT REPORT 200368
3. Building their communitypower and networks toclaim and protectcommunity rights
Communities may be unable to solvetheir own problems for various reasonsincluding: lack of access to the resourcesneeded; blockage by powerful groups;bureaucratic opposition or inertia.
Phalang (intrinsic power) comes upagainst amnat (authority). This is wherethe language of rights comes into play.Rights are claims on other people – ongovernment, on neighbours, on society asa whole. The Mae Wang hill peoples andMun river fishing communities were un-able to achieve their goals of defendingtheir livelihood and retaining their way oflife because they did not have the powerand resources to resist official agencies.They had to learn how to express theirgoals in terms of claims to rights. Theyhad to create the social space in whichthose claims could be heard and under-stood by learning how to explain theirproblem to others, creatively adapting
their local cultural practice, building wide-ranging networks of support, and beingpersistent.
The language of rights is importantbecause it sets up the framework forachieving a solution. Not all claims torights will be met. A claim may conflictwith the rights of other peoples. It mayimpose too high a cost on the society asa whole. It may be impossible to fulfilbecause the resources required are notyet available, or have been depleted.Equally the claim may be just, reasonable,and attainable, but is being blocked byvested interests or inertia. The languageof rights defines the problem and makesit possible to negotiate a solution whichis just for all parties concerned.
But the solution requires an institutionalmechanism in which claims to rights –and especially conflicting claims – can benegotiated. In essence, this is the func-tion of the central institutions of ademocracy – representative assembliesand legal systems. However, such institu-tions hardly figured at all in the commu-nities’ accounts of problem-solving andempowerment in chapter 1. Thai commu-nities perceive parliament as dominatedby business people and business con-cerns. As in many countries, the poor findit difficult to gain access to legal systems.Community participants in this projectperceived law as “something whichbelongs to the state”.
The failure of these key democraticinstitutions – elective representation andjudicial process – to work for communitiesis the major impediment to communityempowerment in Thailand.
These disabilities shape the way commu-nities currently attempt to negotiate theirrights. In the histories in chapter 1, com-munities made their claims for rights bybuilding social support and petitioninggovernment. They first went to local offi-cials, and finally worked their way right upto the prime minister. In their ownaccounts, they presented themselves asluk (children) asking for the considerationof pho (father). They still feel obliged tocouch these appeals in the language and
Access to Justice
Judicial systems can also be undermined, providing little protection toordinary people, especially poor people. Judicial systems are often inacces-sible. They use official language that many people cannot speak or write.And too often they are open to bribes.35
In a national survey conducted on behalf of Thailand’s Civil Service Commis-sion in 2000, almost a third of those involved in a court case over theprevious two years had been solicited for a bribe. The total amount of suchpayments was estimated at over 3 billion baht a year. Delay in judgementsand lack of objective decisions were given as the two main reasons forrejecting legal process as a means to settle a dispute.36
We are not clever at politics and we don’t know about law.
– Community participant in this project
35 UNDP, Human Development Report 2002, p. 66.
36 Pasuk Phongpaichit et. al., Corruption in thePublic Sector in Thailand: Perceptions andExperience of Households, report submittedto the Civil Service Commission, PoliticalEconomy Centre, Chulalongkorn University,2000.
Our idea of struggle isthat farmers need to jointogether to have power.The network across sevenprovinces in the Northwas created so that wehave bargaining power.
– Somchai Sirichai
69
style of paternalism. In the Mun rivercase, the issue was projected right up tothe international level with the involve-ment of the World Council of Dams.Whatever the wrong or right of the MaeWang and Mun river cases, the accountshighlight the weakness of institutions tonegotiate claims to rights.
This weakness imposes a special respon-sibility on government to undertake thedifficult task of listening. Elective democ-racy and judicial process do not functionwell in a society where paternalistictraditions remain strong. Official agenciesmust cultivate the ability to listen.
This weakness of institutions also de-mands reform. Both these cases con-cerned access to natural resources. Assuch they were representative of a largenumber of other cases in Thailand overthe past decade. There have been at-tempts to strengthen the institutionalframework for managing natural re-sources. The Enhancement and Conserva-tion of the Environment Quality Act 1992imposed stricter conditions on the per-formance of environmental impact assess-ments (EIAs). A Prime Minister’s Officeregulation of 1996 introduced a proce-dure for public hearings. Section 46 ofthe 1997 Constitution defines the com-munity’s right to participate in decisionson natural resources. The CommunityForestry Bill attempts to substantiatethese rights in one critical area.
But these institutional initiatives haveproblems. A sequence of contentiousprojects has led to widespread concernthat the environment act should be re-viewed. There has yet to be an effectivepublic hearing. The Community ForestryBill is still blocked by controversy. Therights defined in the Constitution cannotyet be substantiated in reality. Severalprojects were approved under old rulesbut not yet implemented, and there is nomechanism to review these projects inthe light of changed conditions.
This remaining weakness in the institu-tional framework for adjudicating claimsof rights of access to natural resources isthe root of many lingering social conflicts.
ENHANCING COMMUNITYEMPOWERMENT
What can be done to enhance communityempowerment? Thailand now has a greatdeal of experience. Unofficial agencieshave promoted community empower-ment projects for at least two decades.Government bodies have become increas-ingly enthusiastic in recent years. The1997 crisis witnessed a wave of expe-riments. The task now is to build onthe learnings of that experience, and toborrow learnings from elsewhere. In thistask, there are roles for government, civilsociety organizations, development agen-cies, and the communities themselves. Insketching the tasks, we shall retain thethree-level approach identified by thecommunities themselves.
1. Solving problems internally:accelerating learning fromexperience
There has been a great deal of experi-mentation with local schemes. The tasknow is to extract the practical learningsfrom these experiments, and find betterways to disseminate them. There isalready considerable activity of this sort,undertaken by both government agenciesand NGOs. But the effort could be greatlyexpanded.
The Social Investment Fund (SIF) schemehas been the largest-ever attempt tofund communities to enhance social capi-tal in Thailand. The learnings about suchmatters as project types, reasons for suc-cess and failure, management systems,and so forth are considerable.
SIF’s internal evaluation emphasizes fiveareas where the learnings from theproject should be carried forward toother schemes: 1) SIF has learned a lotabout budget management, transparency,verification, and horizontal relations; 2)community learning has to be gradualand additive with new inputs at appro-priate stages; 3) participative exercises in
COMMUNITY EMPOWERMENT AT THE CROSSROADS
Elective democracyand judicial processdo not function wellin a society wherepaternalistictraditions remainstrong. Officialagencies mustcultivate the abilityto listen.
THAILAND HUMAN DEVELOPMENT REPORT 200370
community planning are effective indefining problems and setting out theroutes to practical solutions; 4) SIF hascreated many new assets of social capitalwhich need to be catalogued andmanaged; 5) some organization shouldcontinue the task of promoting com-munity strength and social capital withappropriate funding, and proper pro-cedures for evaluation.37
SIF personnel tried to pass their ex-perience onto the new government’smillion-baht village fund, especially theimportance of beginning from a commu-nity planning exercise. But the planningwould take time which would conflictwith one aim of the new scheme – todeliver a rapid fiscal stimulus. Besides, theSIF approach to planning stresses self-reliance, while the million-baht schemeleans towards increasing production andstrengthening village linkages with theurban economy. By the time this reportis published, the SIF project will haveended.
There are several ways in which govern-ment and international agencies canhelp the internal learning process withincommunities by networking informationand experience.
The Thailand Research Fund hassponsored a great volume of re-search on community issues. Thepractical learnings need to be ex-tracted from TRF’s considerable bodyof research, compiled in an accessibleform, and widely distributed.
Among specific local initiatives,one of the most successful andwidespread has been communitysavings schemes or micro-credit. Thelearnings should be similarly com-piled and disseminated in a “how to”form. The same approach may beapplied to other schemes.
The Social Fund Office (SOFO) whichoversees SIF has begun to cataloguethe learnings from SIF in a series ofaccessible booklets.38 This effortneeds to be extended, and the book-lets widely distributed.
The Community Organizations’ Deve-lopment Institute has taken steps tomaintain the momentum of SIF, byencouraging networking and mutualassistance among community leaders.This deserves support.
The experience of SIF has impli-cations for development agencies.Providing funding directly to com-munities can be more efficient andcost-effective than working throughgovernment agencies. The SIF expe-rience offers considerable learning onhow such support can be adminis-tered and monitored. Developmentagencies who believe in communityempowerment should begin by lis-tening to communities rather thanrelying on government agencies andother intermediaries.
2. Negotiating cooperationwith outside agencies:making decentralizationwork
38 SOFO has three series: Knowledge for theCommunity (Chut khwam ru pue chumchon),Learnings from the Community (Chut botrianjak chumchon), and Social Management(Chut kan jat kan thang sangkhom). Eachbooklet is around 40 pages with the empha-sis on practical examples and illustrations.
In fact, far from strengthening localdemocracy, decentralization can actuallyreinforce the power and influence oflocal elites.... Decentralization helpspoor people most when local politics aredemocratic, with strong structures andopen participatory practices. Only ifaccompanied by strong support tocommunity groups can decentralizationempower ordinary people.
– Human Development Report 2002, p. 67-8
37 Adapted from 37 Months of Social FundOperations: Volume I, Development of theSocial Investment Fund, April 2002, p. 33.
Providingfunding directly to
communities can bemore efficient andcost-effective than
working throughgovernment
agencies.
71
The most important arena for empower-ing communities to work effectively incooperation with government is in decen-tralized and democratic local government.
Thailand has selected the tambon as thelevel for democratic decentralization. Theselection of such a relatively small unit(average population c. 8,000) has theadvantage that communities may becomeclosely involved. But it also has the riskthat the Tambon Administrative Organi-zation (TAO) may become ineffectivebecause of weak management resources,ease of capture by sectional local inter-ests, or subordination to the bureaucracy.
These risks are well understood andwidely discussed. The government hasestablished programmes of training.There are already projects launchedto research the performance of TAOsand expose shortcomings. However, asdemocratic decentralization is a very newdeparture in the context of the Thaigovernmental system, conditions are likelyto change very rapidly, and the learningprocess will take some time. This pointsto the need for continuous monitoring,and a readiness to adjust the system toreflect changing realities.
Enhancing the TAOs’ potential to em-power communities will depend on somebasic principles.
Maintain the commitment to make theTAOs work. Early studies on TAO per-formance have already revealed con-siderable problems. However, theseproblems should not become anexcuse to diminish the momentum ofdecentralization, including the trans-fer of budget and responsibilities.
Encourage participation to avoidcapture by sectional or bureaucraticinterests. Early studies show thatmany TAOs, like the PAOs beforethem, have been captured by con-tractors. Also, local officials some-times try to guide the TAOs ex-cessively, and to discourage localparticipation. If these trends persist,communities may see the TAOs as
just another example of old forms ofinfluence, and lose faith in theircapacity to respond to local needs.The solution is greater participation.Research shows TAOs work betterin areas where people are alreadyorganized for communal action.Building communal activity (savingsgroups etc.), totally separate from theTAOs, is one way to make the TAOsmore effective.
Guide TAOs into policy areas which willimpact on the poor. Communities willbe keen to participate if the TAO’swork impacts on them directly in apositive way. Many TAO membersare uncertain how to utilize theirgrowing budgets beyond the infra-structure provision which has hither-to been the focus of local govern-ment. TAOs must be guided toundertake pro-poor policies.
Guide TAOs to be active in manage-ment of local resources. Managementof natural resources is a vital issueeverywhere, and a great opportunityfor TAOs to serve community needsand hence increase communityparticipation.
Extend community planning andintegrate with TAOs. The experimentsin community planning techniquehave been successful in encouragingparticipation. This is an importantmethod to integrate TAOs with thelocal communities.
To achieve these principles will needa great effort to a) research andmonitor the actual performance ofTAOs; b) disseminate the practicallearnings; and c) foster communityactivity. To be most effective, thesetasks should be undertaken outsidethe government framework. This isan opportunity for internationalagencies to work with local civilsociety organizations.
Democratic decentralization is aworldwide trend. There is a greatdeal of practical learning accumulat-ing about the process, its problems,
COMMUNITY EMPOWERMENT AT THE CROSSROADS
Research showsTAOs work betterin areas wherepeople are alreadyorganized forcommunal action.
THAILAND HUMAN DEVELOPMENT REPORT 200372
and how to overcome them.Thailand must continually tap thislearning in order to increase itschance of achieving success in thishistoric shift in administration.
Perhaps the most common requestfrom communities participating inthis project was simply that govern-ment should listen more, and paygreater respect to opinions, demands,and expertise that comes from thegrassroots.
3. Claiming community rights:improving the institutions
Pass a law on public hearings so thatpublic hearings following best inter-national practice will be requiredbefore decisions on all majorprojects.
Reform the Enhancement and Con-servation of the Environment QualityAct 1992 so that EIAs will help toimplement the principles of Sections56 and 79 of the Constitution.Include and highlight the significanceof social impact assessments (SIAs)and public participation in impactassessment. Create an independentbody to improve the check-and-balance of the assessment process.Move beyond compensation pay-ments as the way to manage theimpact on communities.
Pass the Community Forestry Bill.Similar legislation to implementSection 56 will be needed to coverother natural resources such aswaterways, land, and coastal sea.
There are many projects such asdams and power plants which havebeen planned and partially or fullyapproved in the past when con-ditions – legal, environmental, andsocial – were very different. Disputeshave arisen over the implementationof some such projects. Some mecha-nism is needed to manage thesedisputes. This mechanism shouldapproach these disputes using aframework of rights. Acknowledgingthe rights of various parties to articu-late and claim their rights sets up thepossibility of open and transparentnegotiation. The National HumanRights Commission can play a role indefining appropriate procedures.
BUILDING AN ENABLINGENVIRONMENT FORCOMMUNITY EMPOWERMENT
Community empowerment, as chapter3 argued, is a learning process on anational scale. It will only advance withina national environment which is enabl-ing and conducive. Thailand’s democratic
In the past we were made to think thatthe poor were the nation’s leftover jumble,its stumbling point. This thinking is abarrier to understanding how to createpolicies to help the poor. Quite the otherway round, we should understand that thepoor are the nation. Eradicating poverty iseradicating the real enemy of the nation,and is more important than “nationalwealth” which concentrates in a handful ofpeople.
– Nithi Eiewsriwong, Historian and Social Critic39
39 Nithi Eiewsriwong, Khon Jon and NayobuyKan Tam Hai Jon Kong Rath (The Poor andthe State’s Impoverishment Policy) ThailandDevelopment Support Committee, 2000,p. 124.
Communities have learnthow to claim rights todefend their livelihoodand way of life. This isa fact of life. It is anoutcome of the growingworldwide interest inrights issues over thepast decade, and thestrengthening of Thai-land’s civil society.
Because of its history,Thailand is weak oninstitutions to negotiaterights. This is not unu-
sual. Many developing countries havesimilar weakness. Moreover, Thailand hasa strong positive trend towards democra-tization which is the first prerequisite forany changes to strengthen the institu-tional framework. The 1997 Constitutionhas put the major principles in place. Thetask now is implementation. But this hasto overcome barriers of opposition, inertia,and knowledge deficits.
The first task is to complete the unfinishedbusiness of the Constitution, particularlywhere it deals with the rights of accessto natural resources which are of criticalimportance to local communities.
73
advances over the past two decades werea necessary precondition to the progressmade so far. The future potential issimilarly framed by the extent to whichthe current momentum of reform can bemaintained.
Over recent years, Thailand has launchedon a wide-ranging process of reform. Themovement for constitutional change inthe early 1990s, the search for solutions tothe 1997 economic crisis, and the “thinknew, act new” commitment of the newgovernment elected in 2001 have beguna wide range of reforms covering budget-ing, public service, education, health, andmuch else. The commitment to reform isimpressive. But there is a problem offinding the human resources to plan andimplement such an agenda. There areconflicting views over the priorities ofdifferent projects. And there is a veryreal risk of “reform fatigue” among policymakers and among the population as awhole.
The extent to which community em-powerment can progress and can contri-bute to the goals of human developmentdepend on other reforms creating an ena-bling environment and specific synergiesin many areas. Some of the key areas areconsidered below.
Maintaining the momentumof political reform
The recent elections and change ingovernment affirm the flexibility of Thai-land’s democratic system. The appearancefor the first time of parties fighting elec-tions on a platform of popular measuresincluding commitment to fight povertyand schemes of social protection are apositive sign.
Yet communities feel that Thailand’sparliamentary democracy represents theinterests of the rich much better thanthose of the poor. There are many socialand cultural reasons for exclusion, andthese have their own momentum ofchange. But there is also one very precisebarrier.
According to Section 107 (3), acandidate for election to the Houseof Representatives must have “gra-duated with not lower than a Bach-elor’s degree or its equivalent”. Thisrule excludes around 90 per cent ofthe total adult population; over 95per cent of the people in rural areas,and over 99 per cent in the agricul-tural sector. It should be consideredwhether this is an appropriate rulefor a democratic country.
Political reform means more than adjust-ments to the parliamentary structure. Theprospects for community empowermentare also affected by such things as theaccess to information and the free opera-tion of the media. Communities haveoften complained about the difficulty ofgaining access to information aboutprojects which directly affect their livesand livelihoods (see the cases of Samrongand Pak Mun in chapter 1).
Section 58 of the Constitution confers theright of access to information. The OfficialInformation Act of 1997 provides themachinery for enforcing this right. Butthe Act was passed prior to the Constitu-tion, and some feel that it fails to reflectthe Constitution’s spirit.
The Official Information Commissioncharged with implementation of theAct is not an independent body, likeothers mandated by the Constitution,but comes under the Prime Minister’sOffice and is vulnerable to executivecontrol. Government should considerrevising the Act and making thisimportant body independent.
Both individuals and media have madeenthusiastic use of the Information Act.Many official agencies have respondedpositively. But full realization of theconcept of “freedom of information” re-quires changes in the systems and cultureof official bodies. The Official InformationCommission charged with implementationmust work steadily to ensure that themomentum is maintained.
COMMUNITY EMPOWERMENT AT THE CROSSROADS
THAILAND HUMAN DEVELOPMENT REPORT 200374
Ensuring the provision ofpublic goods is responsive topeople’s needs
The 1997 Constitution introduced manynew systems through which popularvoices can penetrate into the halls ofpolicy-making. The National Economicand Social Council is “charged with theduty to give advice and recommendationsto the Council of Ministers on economicand social problems” (Section 89). TheNational Human Rights Commission hasthe duty “to propose to the NationalAssembly and the Council of Ministerspolicies and recommendations with re-gard to the revision of laws, rules or regu-lations for the purpose of promoting andprotecting human rights” (Section 200).Section 170 has provision for the submis-sion of “People’s Bills” to parliament.
These and other measures increase thenumber of ways in which communitiesand civil society organizations can influ-ence the provision of public goods whichcannot be created by the communitiesthemselves. However, the effectiveness ofthese channels still depends on howresponsive governments and governmentagencies are to them. The Constitutionhas attempted to multiply the channelsthrough which a popular voice can beheard, and this concept it not alwayseasy for those in power to understandand accept. It would be a pity, forinstance, if the reaction to the submissionof “People’s Bills” were to be a turfwar waged to defend the prerogatives ofparliament and the Council of State.
Over the long term, governmenthas to develop better capacity forlistening to popular demands forpublic goods, and responding appro-priately.
Reforming the public sectorfor empowerment
After a long period of inconclusive debateand persistent delay, Thailand has finallycommitted to reforms of the public sector.
The government has laid out a major planof reorganization. The Civil Service Com-mission has proposed many reforms inpractices and procedures. Many officeshave adopted a new service mentality.
This is just a beginning. The initial phasewill mostly affect the overall structure andespecially the upper ranks of the publicservices. The prospects for communityempowerment, however, depend a greatdeal on the responsiveness, effectiveness,and accountability of the lower levels ofthe bureaucracy.
Maintain the commitment to publicsector reform long enough to com-plete the task, and ensure that idealsof responsiveness, effectiveness, andaccountability guide the reform.
Reforming education forempowerment
After many years of debate, Thailand in1999 passed the National Education Act.This Act increases access to education,initiates mechanisms to improve quality,decentralizes management, and changesthe pedagogical approach to child-centred learning.
This is an ambitious reform which facesconsiderable opposition, not least amongsome of the teachers and educationofficials whose lives and careers will bedirectly affected. But the success of thisreform is crucial for the future of Thailandas a whole, as well as for the progress ofcommunity empowerment.
Maintain the commitment to educa-tion reform, especially reform of thecurriculum and of the pedagogicalstyle to create an educational systemappropriate for a flourishing andsophisticated democracy.
Extend support to community educa-tion projects which aspire to bridgethe gap between local wisdom andlearning, and the national educationsystem.
The prospectsfor communityempowerment,
however, depend agreat deal on the
responsiveness,effectiveness, and
accountability of thelower levels of the
bureaucracy.
75
Putting judicial reform onthe national agenda
The judiciary has not yet figured pro-minently in Thailand’s agenda of reform.This is understandable given the empha-sis to date on political reform, decentrali-zation, education, health, and the reorien-tation of development policy. However,there are good reasons to bring judicialreform more firmly onto the agenda.
In Thailand there is a very strongimpression that the police and the courtstend to reinforce the existing powerstructure, and offer little opportunity tochallenge its injustices. In the historiesrecounted in chapter 1, judicial processnever worked in favour of the commu-nities’ efforts to empower themselves,and sometimes worked against them.Innovative legislation such as the 1992Enhancement and Conservation of theEnvironment Quality Act has failed tolive up to expectations because of thejudiciary’s failure to uphold the spirit ofthe legislation.
The new Constitution, with its emphasison rights, increases the importance of thejudicial system as a means to make suchrights effective. For Thailand’s commu-nities, there are special concerns over thecourts’ attitude towards customary rightswhich are not codified in statute.
Judicial reform is a mammothsubject. It will be vital to the successof community empowerment in thelong run that the subject is tackledbefore too long.
Refocusing on povertyalleviation throughempowerment
Until the economic crisis of 1997, Thailandhad an impressive record in reducing theproportion of the population below thepoverty line. The crisis reversed this trendand increased the number of poor bythree million people. This reversal forceda rethink about poverty alleviationpolicies both within international agencies
and within Thailand. The World Bankidentified empowerment as a majorstrategy for poverty alleviation. Researchin Thailand showed that the increase inpoverty during the crisis was almostwholly in the rural areas. It also revealedthe existence of “persistent poverty”among certain groups even at times ofhigh economic growth. These findingsemphasised the need for new methodsto identify the poor, and for new strate-gies – including empowerment – to tacklepersistent poverty.
The NESDB has reinstated poverty alle-viation as a major focus of its effortsunder the Ninth Plan, and has placed anemphasis on developing poverty allevia-tion strategies based on communityempowerment experiences.40
Plans to tackle poverty must absorbthe considerable learnings fromprojects of community empowermentover recent years. They must addressnot only income poverty but thebroader definition of poverty which isheld by the communities themselvesand which broadly coincides with theHuman Development approach.
Poverty policies should endeavour tobuild on the investments in socialcapital and community strengthmade during the crisis. They mustrecognize the importance of im-proving access to land and othernatural resources as a key strategy ofpoverty alleviation.
Tackling gender bias
Gender bias is one of the most basicforms of disempowerment. In Thailandover recent years, trends in gender biashave been mixed. On the one hand,women improved their access to educa-tion at all levels. On the other hand, thechange and instability of the economyincreased pressures on women in their
COMMUNITY EMPOWERMENT AT THE CROSSROADS
For Thailand’scommunities, thereare special concernsover the courts’attitude towardscustomary rightswhich are notcodified in statute.
40 Office of the National Economic and SocialDevelopment Board, “Yuthasat Kae Kai PanhaKham Yak Jon” (Poverty Alleviation Strategies),June 2002.
THAILAND HUMAN DEVELOPMENT REPORT 200376
dual roles as provider and nurturer.Moreover, the systematic disempower-ment of women in the formal politicalsystem – as shown by the gender ratiosin parliament, senior bureaucracy, and theTAOs – has scarcely changed. The 1997Constitution has boldly stated that “Menand women shall enjoy equal rights”, butgender bias is still built into many lawsand institutions.
Community empowerment can con-tribute to gender equity by im-proving women’s access to credit,income-earning opportunities, andsocial protection within the boundsof the local community. But this willdepend on women gaining a voice incommunity management, both withinthe official structure of the TAOs, andin more informal gatherings.
Above the locality, there are stillimportant gender issues in the areasof family law, safety in the workplace,and access to technical and voca-tional training.
Managing the environment
As stressed many times through this re-port, the deterioration of the environmentis a major force in the disempowermentof local communities. The shortcomingsof the 1992 Enhancement and Conserva-tion of the Environment Quality Act arenow well understood, and reform of thisimportant legislation is now overdue. Butmuch more than legislation is needed totackle Thailand’s environmental problems.
The relationship between poverty, em-powerment, and the environment is com-plex and subtle. In some cases poor peo-ple become the agents of environmentaldestruction because they have nothing toexploit but themselves and nature. But inother cases, poor people are the mostsensitive monitors of environmental de-cline, and the most committed propo-nents of environmental defence. Asshown in chapter 1, the fishing communi-ties were the fiercest defenders of theMun river against the destruction neededfor a dam project of questionable utility.Similarly, all along Thailand’s coasts,small-scale fishermen have protestedagainst the destruction of the marine en-vironment by commercial fishing interestswhich blatantly defy the law. In theseand similar cases, the poor protest be-cause they are the most vulnerable toenvironmental decline.
The challenge for policy makers isto embrace popular movementswhich defend natural resources sothat poverty alleviation and environ-mental defence work in synergy.
The Ninth Plan rightly identifies thatThailand’s environmental problemsmust be tackled under the headingof good governance. It stresses that“existing mechanisms for naturalresources and the environmentalmanagement should be adjusted toemphasize local participation”. Com-munity empowerment should beboth a means and end of goodenvironmental governance.
Government agencies must be morevigilant in enforcing existing laws suchas pollution controls on industries.
Decentralization and Gender
Women in Thailand have considerable power – in the family, in businesses,in the local community. Yet in anything connected with political power,they suffer from discrimination and exclusion. They are not only under-represented in parliament (45 out of 500 MPs) and the higher bureaucracy,they are even rare among the ranks of the top political commentators.However, in NGOs, protest groups, and civil society organizations in general,women play a prominent role.
Daniel Arghiros, who made a detailed study of Thailand’s electoral system,observed that the contractors and local officials who were the chief agentsand beneficiaries of electoral manipulation were exclusively male. Heargued that one way to lessen the capture of TAOs by old power centresmight be to reserve a large number of seats for women.41 Women’s groupslobbied for reservation but failed.
In India, panchayat local government bodies were reformed in 1992-3,reserving one-third of seats for women and giving proportional representa-tion to marginalized groups. In two of the poorest states literacy ratesincreased 20 per cent over the next decade.42
41 Daniel Arghiros, Democracy, Development andDecentralization in Provincial Thailand, Rich-mond: Curzon, 2001, p. 250.
42 UNDP, Human Development Report 2002, p.74-5.
77
Managing globalizationfor empowerment
Globalization presents both challengesand opportunities. The opportunities willonly accrue to countries who activelymanage the processes of globalization.These benefits include more jobs andmore trade. In the past, Thailand – andother East Asian countries – benefitedgreatly by engaging more with the globaleconomy.
The 1997 economic crisis revealed manydownside vulnerabilities. In responding tothe 1997 economic crisis, the Thai govern-ment has taken a much more active rolein managing the country’s engagementwith globalization, as a passive role courtsthe risk of disempowerment at manylevels.
But managing the country’s engagementalso means grasping the opportunities.The Doha trade negotiations showed amuch greater concern for the needs ofdeveloping countries than previous traderounds. Future talks will scrutinize eco-nomic policies in developed countriesthat adversely affect the developingworld. Forces pushing for this needsupport. In particular, the whole topic ofagrarian trade and government subsidy isnow open for debate on a world scale.The importance for Thailand and espe-cially for Thailand’s poor cannot be under-estimated. Thailand has more peopledependent on agriculture, and lowerlevels of agrarian subsidy, than mostcountries. Changes in crop prices are oneof the most sensitive forces affecting thenumbers in poverty.
Many of the issues which fall heaviest onthe poor – climate change, pollution,crime, human trafficking, corruption – aretransnational or global issues. The issues,priorities, and solutions are increasinglybeing defined at the global level. Beingleft out will mean being disempowered.
One reason people feel uneasy aboutglobalization is because they feel power-less before it. Partly that is because
governments often engage with interna-tional institutions without involving thewider society in the debate and the deci-sions. They sign international treaties andconventions without public consultation.In the last decade, NGOs have becomemore vigilant on these matters. Butgovernment needs to take the initiative tobring these matters to public debate, sothat civil society can review trade-offs andhelp shape global public policy. After allcommunities in Thailand are part of amuch larger global community. Theyhave much to offer as well as much togain.
An aggressive approach to theforthcoming negotiations on agrariantrade and subsidies is one way toempower the poor.
Thailand must be an active partici-pant in supporting and shaping theglobal efforts to grapple with issuessuch as climate change, pollution,crime and human trafficking.
Government should make greaterefforts to encourage public debateon issues arising between govern-ment and international institutions.
CONCLUDING REMARKS:LOOKING AHEAD
Varieties of empowerment
There are many, many different viewson community empowerment – what itmeans, how it is done, what it achieves.This should not be cause for surprise ordisappointment. To begin with, communi-ties themselves are very different, onefrom another. Next, empowerment is arather ambiguous term with connotationsof internal strength as well as externalauthority. Finally, there are many differentviews on the economic, social, and politi-cal ideals that community empowermentmight help achieve. In particular, there isa fundamental division among communityactivists between those who believe thatcommunities must learn how to become
COMMUNITY EMPOWERMENT AT THE CROSSROADS
One reason peoplefeel uneasy aboutglobalization isbecause they feelpowerless before it.Partly that is becausegovernments oftenengage withinternationalinstitutions withoutinvolving the widersociety in the debateand the decisions.
THAILAND HUMAN DEVELOPMENT REPORT 200378
more commercial in order to survive inthe globalizing world, and those whofeel that it is precisely the communities’agrarian economy and distinctive moralitywhich are valuable and need to bepreserved.
The first step towards empowermentis recognizing this variety of real-worldsituations and opinion, and acknowledg-ing the right of communities to determinetheir own very varied futures.
Community and globalization
Both at an international level and withinThailand itself, the importance of thecommunity has risen in reaction to thegrowing force of globalization. Whilethere are many different views amongcommunity members and community ad-vocates on the relationship between com-munity and globalization, there are few ifany who believe that the communitycould or should be isolated totally fromthe forces of globalization. Rather, thereis a general consensus that communitiesneed to erect some barriers against out-side forces in order to strengthen theirinternal resources and hence be betterequipped to deal with the outside world.There is then varied debate over thenature and height of the barriers, thepriorities for internal strengthening,and the strategies for re-engaging withthe outside world. But the basic idea –barriers to permit self-strengthening –commands sufficient consensus that itwas adopted as a national agenda inresponse to the 1997 economic crisis.
Empowerment as learningprocess
This Report has tried to reflect the manydifferent voices and the many differentexperiments in community empower-ment.
The important insight of the communitieswhich contributed to this project isthat community empowerment is alearning process which has successive
steps: learning how to realize their poten-tial as a community; learning how tonegotiate cooperation with governmentand other outside agencies; learning howto claim rights within the society.
This chapter has argued that thisthree-level learning process provides aframework for understanding communityempowerment. It has identified threepriorities for promoting community em-powerment corresponding to these threelevels:
networking the learnings from themany experiments and experiencesof community projects of recentyears,
making decentralization work forthe communities by maintaining themomentum of change, fosteringparticipation, and improving manage-ment,
strengthening procedures and institu-tions for negotiating claims to rights,particularly rights over natural re-sources, by changes in the 1992environment act and other legislationto implement the spirit of the 1997Constitution.
The insight that community empower-ment is a learning process indicates thatthe main contribution of other actors incommunity empowerment is to assistthat process – by providing information,by accelerating the exchange of informa-tion among communities, by breakingdown barriers to learning, and by support-ing legitimate claims for rights.
Donor agencies which believe incommunity empowerment must lookmore to the communities, rather thanofficial agencies, as sources of infor-mation and targets for funding.
The insight that community empower-ment is a matter of rights helps us tounderstand that the other main contri-bution of other actors is to help buildsystems and institutions through whichclaims to rights can be negotiated in afair and transparent way.
The insightthat community
empowerment is amatter of rights helps
us to understandthat the other main
contribution of otheractors is to help
build systems andinstitutions through
which claims to rightscan be negotiated
in a fair andtransparent way.
79
Community empowermentin social context
Community empowerment takes placewithin a larger social context. This chap-ter has identified several areas of reformand policy-making which are importantfor community empowerment and humandevelopment:
maintaining the momentum ofpolitical reform including the fullimplementation of the freedom ofinformation,
ensuring the provision of publicgoods is responsive to people’sneeds, in particular through utilizingnew channels such as the NationalEconomic and Social Council, theNational Human Rights Commission,and the submission of “People’s Bills”,
reforming the public sector rightdown to the lower levels whoseresponsiveness is critical for the suc-cess of community empowerment,
sustaining the intention of theNational Education Act 1999 to over-haul the education system, withparticular attention to curriculumchange and pedagogical style,
bringing judicial reform more firmlyonto the national agenda so thejudicial system may become more
effective for enforcing rights, particu-larly those of the poor,
refocusing economic policy onalleviating poverty in all its forms,and building on the learnings fromcommunity empowerment projectsto devise specific plans,
tackling gender bias, particularlywithin the local power structureswhich are rising in importance,
managing the environment so thatpoverty alleviation and environ-mental improvement work in synergy,
managing globalization for empower-ment, particularly through an aggres-sive approach to WTO negotiationson agrarian trade.
Opportunity and risk
Thailand is now emerging both from theeconomic crisis and from a period of ex-traordinary soul-searching and debate.There is a very wide acceptance of theview that community empowerment is astrategy to achieve human developmentwhich reflects people’s real needs, whichis sustainable, and which achieves na-tional objectives of social justice, peace,and unity. The problems facing commu-nity empowerment are considerable –problems of understanding, opposition,and inertia. But the potential gains arelarge, and the risks are small.
Communities have no wish to reject modernity, oppose globalization, and cling to the past.But they want the power to determine the direction of development based on their ownbody of knowledge, their own values, the principle of sustainable balance between manand nature, and the community’s rights to manage resources.
– From the conclusion agreed among the community contributors to chapter 1
COMMUNITY EMPOWERMENT AT THE CROSSROADS

THAILAND HUMAN DEVELOPMENT REPORT 200380
81
MEASURING HUMAN DEVELOPMENT
P A R T I I

THAILAND HUMAN DEVELOPMENT REPORT 200382
83
INTRODUCTION TO HUMANACHIEVEMENT INDEX (HAI)
Human development indices have playeda vital role in establishing UNDP’s con-tribution to the debate and advancementof human development worldwide. Expe-riences confirm that indices that captureprogress and disparity in human deve-lopment among countries, regions, andgroups, serve as an excellent stimulantand provide a good forum for policyadvocacy and public participation at boththe global and national levels.
This Report, although focusing on com-munity empowerment, does not attemptto develop community empowermentindices. Several government agencies andresearch institutes are producing goodresults on that front. In any case, nation-wide community-level data collection anddata analysis is an enormous task whichis beyond the scope of this Report. Thischapter will therefore present someexamples of such effort and devote thelatter part of the chapter to continuingthe work on the “Index of HumanDeprivation – IHD”, a composite indexintroduced by the First Thailand HumanDevelopment Report.
With provincial ranking and maps, the IHDclearly depicts the progress and disparityin human development situations of all76 provinces. IHD received enthusiasticsupport from the government, develop-ment institutions, and the academia. Itwas the first time that a composite indexwas developed to assess an overallhuman development situation and thefirst time that provincial-level data con-cerning human development was used inan integrated and comprehensive manner.IHD has important policy implications and
CHAPTER
HUMAN DEVELOPMENT INDICES 5
HUMAN DEVELOPMENT INDICES
a potential to become a useful policyanalysis instrument. Further improvementand refinement of IHD becomes animportant task of the Second ThailandHuman Development Report.
From the Index of Human Deprivation (IHD)to the Human Achievement Index (HAI)
The IHD has 8 components – health, education, employment, income, hous-ing and environment, transport and communication, consumer’s goods, plusa women index. Within 8 components, there are 48 indicators. For eachindicator, provinces are divided into three groups – those that performabove the median are assigned a penalty score of 0, those in the worstquartile a penalty score of 1, and those in between a penalty score of 0.5.Each indicator weighs equally within the component, and each componentweighs equally within the composite index. The result is the IHD thathighlights overall and specific deprivation at the provincial level.
The IHD shows that people in the lower Chao Phraya Basin are the mostwell-off, and those living in the border areas are most deprived. Living inBangkok Metropolis does not guarantee a good life as Bangkok fails toachieve a top ten ranking. Singburi, a small province situated in the middleof the country’s rice bowl, is recorded as having the best human develop-ment condition.
On technical aspects, it should be noted that the IHD methodology treatsall the scores above the median equally and focuses on the lowestand second quartiles because IHD is meant to highlight deprivation, notexcellence. With this focus, IHD cannot capture differences among theabove-the-median provinces. It penalizes poor performance but does notrecognize or award excellence. Provinces that perform well on IHD arethose that manage to stay above average on all indicators, but may not beexceptional on any one.
When the NESDB-UNDP task force commenced a review of the IHD withparticipation from various agencies, no leaf was left unturned. While thenew index retains some of the key characteristics of the IHD, it featuresseveral major changes including its name.
Some indicators are omitted, namely indicators that are relevant to onlya few provinces, those that are considered irrelevant to the socio-economicsituation of the country, those that do not express disparity amongprovinces and those without updated data. New additions are indicatorsthat reflect the new social development.
In addition, HAI features different components, and a new methodologythat should be more useful for policy decisions.
THAILAND HUMAN DEVELOPMENT REPORT 200384
The result is a new composite index –the “Human Achievement Index – HAI” .HAI aims to reflect the rate of change inhuman development in 76 provincesrather than zeroing in on basic depriva-tion. Hence, this index is in line with thestate of human development in Thailandtoday, as the country has become a mid-dle income, medium human developmentcountry. This, however, does not meanthat deprivation no longer exists, or that itis no longer a legitimate concern. HAIcan reflect stagnation or slow progress indeprived areas, but it allows room formore advancing provinces to show theirstride.
HAI CHARACTERISTICS
In general, HAI has the following charac-teristics.
Multidimensionality. The index capturesthe multidimensional character of humandevelopment and seeks to express insystematic ways as many of these dimen-sions as possible.
Policy relevance. The index suggests policyimplications and can serve to supportinformed decision-making on strategiesand programmes aimed at addressinginequalities.
Spatial disaggregation. The index seeks tomap uneven progress; it disaggregatesthe nation’s regions, which are too broadin character and too few in numbers toserve as the focus for policy purpose,to the provincial level which can be astrategic point of convergence betweennationally-driven policies, and local initia-tives.
Temporal comparison. By measuring pro-gress against an established “goal post” ,the index can assess whether humandevelopment situation in a selectedprovince improves or regresses over time.
Transparency and replicability. Themethodology used for the construction ofthe index is simple and replicable, thusfacilitating others to undertake compara-ble exercises.
HAI CONCEPT ANDSTRUCTURE
HAI is composed of 8 essential phases/components in a human lifecycle – start-ing with the first essential thing thateveryone must have on the first day ofhis/her life – health, followed by the nextimportant step for every child – education.After schooling, one is expected to get ajob, to secure enough income, to have adecent housing and living conditions. Thena person moves beyond him/herself tohave a quality family and community life,to maintain contacts and communicationwith others, and last but not least, toparticipate as member of a society. Tosum up, the 8 components are:
Health
Education
Employment
Income
Housing and living conditions
Family and community life
Transportation and communication
Participation.
Under these components are 40 indica-tors as shown in Table 1.
HAI METHODOLOGY
The HDI methodology, used in the UNDPglobal Human Development Reports, isused to calculate HAI. For each indicator,the following calculation is used for eachof the provinces:
Actual value – Minimum value
Maximum value – Minimum value
The minimum and maximum values areset for each indicator to serve as “goalpost” which covers a range that canaccommodate all possible values for thatindicator in the next ten years. The goalpost set for each indicator is shown inTable 1.
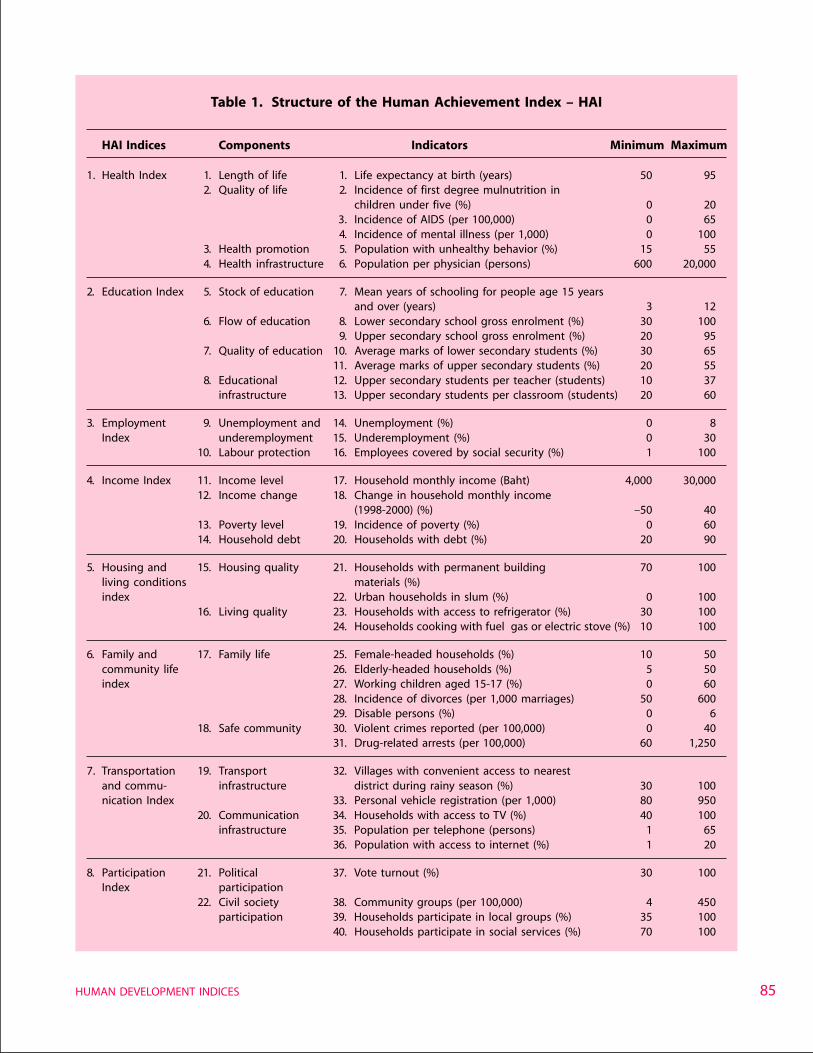
85HUMAN DEVELOPMENT INDICES
Table 1. Structure of the Human Achievement Index – HAI
HAI Indices Components Indicators Minimum Maximum
1. Health Index 1. Length of life 1. Life expectancy at birth (years) 50 952. Quality of life 2. Incidence of first degree mulnutrition in
children under five (%) 0 203. Incidence of AIDS (per 100,000) 0 654. Incidence of mental illness (per 1,000) 0 100
3. Health promotion 5. Population with unhealthy behavior (%) 15 554. Health infrastructure 6. Population per physician (persons) 600 20,000
2. Education Index 5. Stock of education 7. Mean years of schooling for people age 15 yearsand over (years) 3 12
6. Flow of education 8. Lower secondary school gross enrolment (%) 30 1009. Upper secondary school gross enrolment (%) 20 95
7. Quality of education 10. Average marks of lower secondary students (%) 30 6511. Average marks of upper secondary students (%) 20 55
8. Educational 12. Upper secondary students per teacher (students) 10 37infrastructure 13. Upper secondary students per classroom (students) 20 60
3. Employment 9. Unemployment and 14. Unemployment (%) 0 8Index underemployment 15. Underemployment (%) 0 30
10. Labour protection 16. Employees covered by social security (%) 1 100
4. Income Index 11. Income level 17. Household monthly income (Baht) 4,000 30,00012. Income change 18. Change in household monthly income
(1998-2000) (%) –50 4013. Poverty level 19. Incidence of poverty (%) 0 6014. Household debt 20. Households with debt (%) 20 90
5. Housing and 15. Housing quality 21. Households with permanent building 70 100living conditions materials (%)index 22. Urban households in slum (%) 0 100
16. Living quality 23. Households with access to refrigerator (%) 30 10024. Households cooking with fuel gas or electric stove (%) 10 100
6. Family and 17. Family life 25. Female-headed households (%) 10 50community life 26. Elderly-headed households (%) 5 50index 27. Working children aged 15-17 (%) 0 60
28. Incidence of divorces (per 1,000 marriages) 50 60029. Disable persons (%) 0 6
18. Safe community 30. Violent crimes reported (per 100,000) 0 4031. Drug-related arrests (per 100,000) 60 1,250
7. Transportation 19. Transport 32. Villages with convenient access to nearestand commu- infrastructure district during rainy season (%) 30 100nication Index 33. Personal vehicle registration (per 1,000) 80 950
20. Communication 34. Households with access to TV (%) 40 100infrastructure 35. Population per telephone (persons) 1 65
36. Population with access to internet (%) 1 20
8. Participation 21. Political 37. Vote turnout (%) 30 100Index participation
22. Civil society 38. Community groups (per 100,000) 4 450participation 39. Households participate in local groups (%) 35 100
40. Households participate in social services (%) 70 100
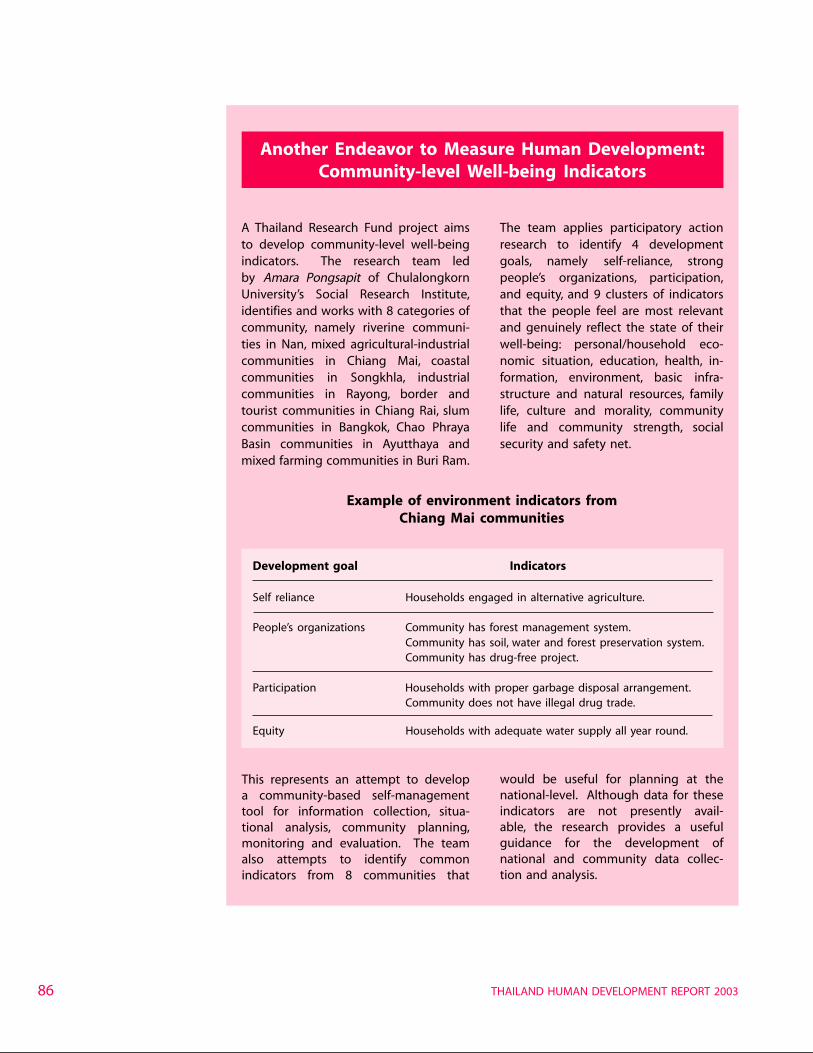
THAILAND HUMAN DEVELOPMENT REPORT 200386
A Thailand Research Fund project aimsto develop community-level well-beingindicators. The research team ledby Amara Pongsapit of ChulalongkornUniversity’s Social Research Institute,identifies and works with 8 categories ofcommunity, namely riverine communi-ties in Nan, mixed agricultural-industrialcommunities in Chiang Mai, coastalcommunities in Songkhla, industrialcommunities in Rayong, border andtourist communities in Chiang Rai, slumcommunities in Bangkok, Chao PhrayaBasin communities in Ayutthaya andmixed farming communities in Buri Ram.
Example of environment indicators fromChiang Mai communities
Development goal Indicators
Self reliance Households engaged in alternative agriculture.
People’s organizations Community has forest management system.Community has soil, water and forest preservation system.Community has drug-free project.
Participation Households with proper garbage disposal arrangement.Community does not have illegal drug trade.
Equity Households with adequate water supply all year round.
The team applies participatory actionresearch to identify 4 developmentgoals, namely self-reliance, strongpeople’s organizations, participation,and equity, and 9 clusters of indicatorsthat the people feel are most relevantand genuinely reflect the state of theirwell-being: personal/household eco-nomic situation, education, health, in-formation, environment, basic infra-structure and natural resources, familylife, culture and morality, communitylife and community strength, socialsecurity and safety net.
Another Endeavor to Measure Human Development:Community-level Well-being Indicators
This represents an attempt to developa community-based self-managementtool for information collection, situa-tional analysis, community planning,monitoring and evaluation. The teamalso attempts to identify commonindicators from 8 communities that
would be useful for planning at thenational-level. Although data for theseindicators are not presently avail-able, the research provides a usefulguidance for the development ofnational and community data collec-tion and analysis.
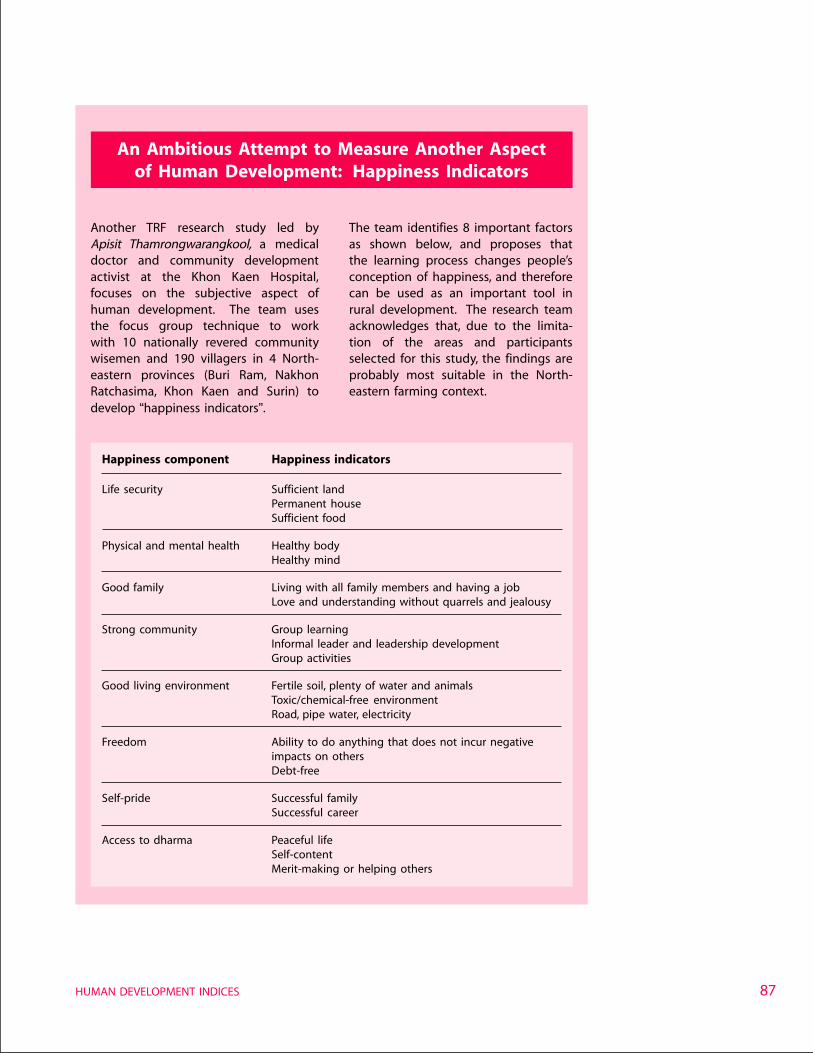
87HUMAN DEVELOPMENT INDICES
Another TRF research study led byApisit Thamrongwarangkool, a medicaldoctor and community developmentactivist at the Khon Kaen Hospital,focuses on the subjective aspect ofhuman development. The team usesthe focus group technique to workwith 10 nationally revered communitywisemen and 190 villagers in 4 North-eastern provinces (Buri Ram, NakhonRatchasima, Khon Kaen and Surin) todevelop “happiness indicators”.
Happiness component Happiness indicators
Life security Sufficient landPermanent houseSufficient food
Physical and mental health Healthy bodyHealthy mind
Good family Living with all family members and having a jobLove and understanding without quarrels and jealousy
Strong community Group learningInformal leader and leadership developmentGroup activities
Good living environment Fertile soil, plenty of water and animalsToxic/chemical-free environmentRoad, pipe water, electricity
Freedom Ability to do anything that does not incur negativeimpacts on othersDebt-free
Self-pride Successful familySuccessful career
Access to dharma Peaceful lifeSelf-contentMerit-making or helping others
The team identifies 8 important factorsas shown below, and proposes thatthe learning process changes people’sconception of happiness, and thereforecan be used as an important tool inrural development. The research teamacknowledges that, due to the limita-tion of the areas and participantsselected for this study, the findings areprobably most suitable in the North-eastern farming context.
An Ambitious Attempt to Measure Another Aspectof Human Development: Happiness Indicators
THAILAND HUMAN DEVELOPMENT REPORT 200388
For some indicators, i.e. unemployment,divorce incidence, the data reflects a“negation in human development”. Hence,HAI uses the inverse value (1-calculatedvalue) to show the degree of progress.
For example, the 3.4% unemployment ratein Bangkok Metropolis is calculated to bea 0.3256 index score for unemployment,which is expressed as 1 – 0.3256 = 0.6744index score for employment.
HAI does not divide the provinces intopredetermined groups. It allows 76 pro-vinces to fall into varying positions, hencethere can be as many as 76 positions oneach indicator. The variation at the highand low ends are captured and treated inthe same manner. As a consequence, avery good performance on one indicatorcan offset a very poor performance onanother.
Weighting is not applied at any level ofthe calculation. Hence, the health indexis an expression of an average of all 6indicators within the health index. Like-wise, all 8 indices carry equal weight incalculating the composite HAI.
In many ways, the real value and validityof the HAI comes from the use of the 8individual components. There is moreanalytic and diagnostic value in lookingat variations in the health component orthe education component alone than inaveraging each with all the others. Policypriorities and choices are clear for eachcomponent, but not for the combinedindex. And averaging of averages acrosssuch diverse measures means that theoverall ranking of the provinces must beunderstood as indicative of levels ofoverall development, not definitive.
DATA SOURCES
Data is the most formidable challenge.Data used to calculate HAI must havenational coverage with provincial disag-gregation. Several indicators are aban-doned because provincial data is notavailable, not reliable, or is systematicallybiased.
HAI uses secondary data that do notentail labourious data processing. This isto ensure both the economy and thesustainability of the index.
HAI data is from a) national samplesurveys, e.g., socioeconomic survey, labourforce survey, health and welfare survey;b) registration systems, e.g., divorce in-cidence, personal vehicle registration;and c) administrative records, e.g., schoolenrolment, persons per physician, malnu-trition in children under five, etc.
Data collection for these surveys is con-ducted in varying years. Some surveysare conducted every two or five years.Most registration systems and administra-tion records are updated every year. Asmall portion of data used in this study isfrom five-year surveys, and this is datathat does not change rapidly.
Not all data collected are available inreadily accessible format. Some are down-loaded from web sites, some are keptas internal databases, some have to becalculated from various databases, someare in ASCII files. These databases aremade available by responsible agencies,or through the National Statistical Officeor the Office of the National Economicand Social Development Board. The datatables in the annex are processed andcalculated from these databases.
GENDER DISAGGREGATEDDATA
The “Women index” is one of IHD’s eightindices. It compares human developmentsituations of women across provinces andis therefore not a “gender index”. HAIdoes not have a similar component. Thisis a trade-off to avoid the problem ofdouble-counting.
Although HAI was originally plannedto be a gender-disaggregated index, datawas an insurmountable problem. Someof the HAI indicators use household-leveldata that does not allow for genderdisaggregation. Nonetheless, efforts aremade to obtain gender-disaggregateddata when relevant and possible. Thisdata is presented in the data tables.
89HUMAN DEVELOPMENT INDICES
HAI’S EIGHT INDICES
1. Health Index
Health is the first and foremost consti-tuent of people’s well-being. The healthindex is composed of:
length and quality of life (life expec-tancy and first-degree malnutrition inchildren under five),
physical and mental illness (AIDSincidence, mental illness),
health promotion (unhealthy beha-viour, namely smoking and/or alcoholconsumption),
access to health service (persons perphysician).
By and large, the health index is com-posed of indicators that are commonlyused to indicate a general health situa-tion. It also reflects a shift towards a newhealth care approach – health promotion.However, relevant data is not available,with the exception of smoking and alco-hol consumption.
The health index ranges from 0.506 to0.815. The following map shows the dis-tribution of all provinces in five groupsaccording to their health index scores,with green representing best performanceand red representing worst performance.
Map 1 shows that health conditions varyacross the country. Chachoengsao hasthe highest achievement in the overallhealth index, followed by BangkokMetropolis and other provinces in theBangkok vicinity, e.g., Samut Sakon, SamutPrakan, Samut Songkram, Nonthaburi.Other high performers are Songkhla, ChonBuri and Uttaradit. In general, healthsituations in the Central Plain, the West,and the East are better than the rest ofthe country.
Northeastern provinces are the worstperformers with less access to healthservices and a relatively high incidence offirst-degree malnutrition among children.
Noteworthy among poor performers isRayong – the industrial hub in the EasternSeaboard where AIDS and unhealthybehaviours are jeopardizing public health.Phuket, despite its high standard of living,is among the bottom fives for cigaretteand alcohol consumption, and mentalhealth.
Individual indicators also tell interestingstories.
Life expectancy is relatively highestin southern provinces, while lowest inthe North.
Malnutrition is still a problem inremote areas in Mae Hong Son andNan, and some poverty-stricken lowernortheastern provinces.
NRDC-2C and Basic Minimum Needs (BMN) Indicators
National Rural Development Committee – 2C is a set of rural developmentindicators that use village census. It was developed in 1984, went througha series of piloting and testing, and was undertaken biannually since 1990.About 40 indicators cover the aspects of (1) infrastructure, (2) production,income and employment, (3) public health, (4) consumption and agriculturalwater, (5) education and culture, (6) natural resources and environment.
The continuity of the available census data makes the NRDC-2C database aunique instrument for measuring changes and trends in Thailand’s ruralsocio-economic infrastructure. NESDB and the Community DevelopmentDepartment have used these indicators to classify and target villagesthat have relatively poorer development in order to initiate special ruraldevelopment projects. NRDC-2C data covers only rural areas and theindicators are designed to reflect the welfare and needs of Thailand’s ruralcommunities.
Since 1985, under the umbrella of the National Rural DevelopmentCommittee, the household-level Basic Minimum Needs (BMN) indicatorswere developed and household data was collected every year. BMN hasapproximately 40 indicators, divided into 9 groups – (1) nutrition, (2) hous-ing, (3) education and health, (4) family safety, (5) income, (6) familyplanning, (7) participation, (8) culture and religion, (9) environment.
After every five-year national plan cycle, the benchmark for each indicator isadjusted to reflect the new national socio-economic development targets.The BMN indicators are then used to monitor and evaluate the Plan’sdevelopment results.
After serving as key rural development instruments for over a decade,the NRDC-2C and the BMN indicators are being reviewed toreflect the national development strategy to integrate “rural” and “urban”development.
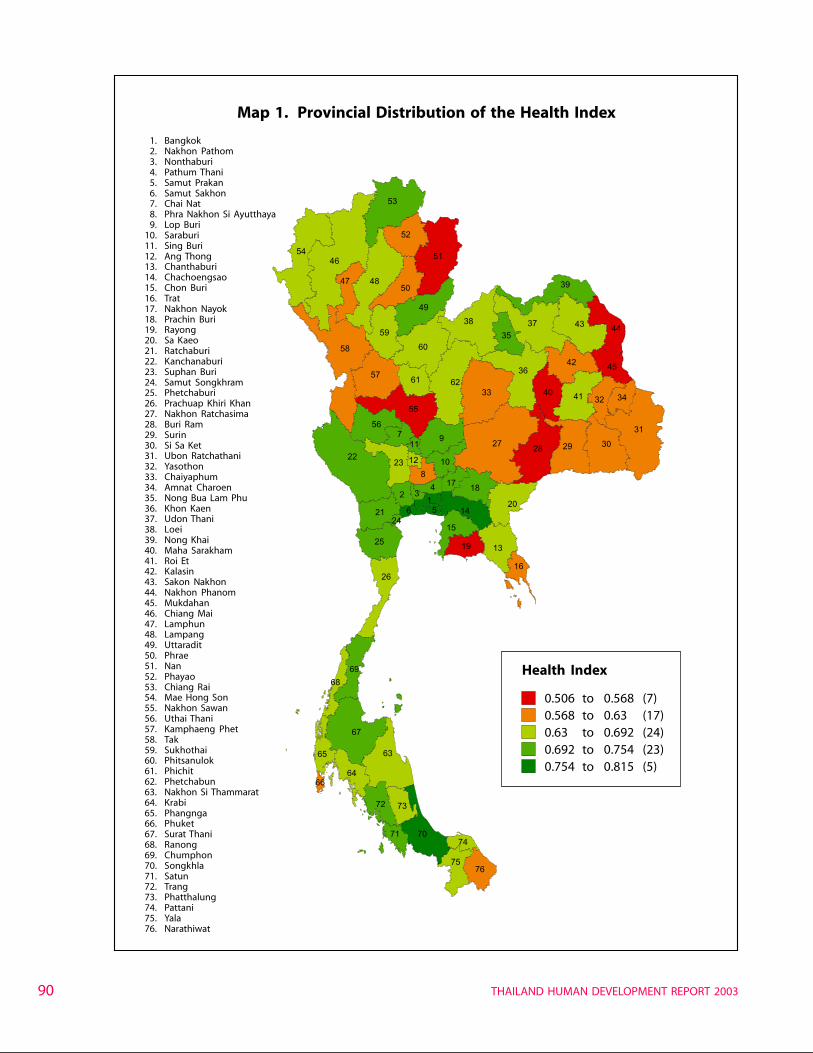
THAILAND HUMAN DEVELOPMENT REPORT 200390
1. Bangkok2. Nakhon Pathom3. Nonthaburi4. Pathum Thani5. Samut Prakan6. Samut Sakhon7. Chai Nat8. Phra Nakhon Si Ayutthaya9. Lop Buri
10. Saraburi11. Sing Buri12. Ang Thong13. Chanthaburi14. Chachoengsao15. Chon Buri16. Trat17. Nakhon Nayok18. Prachin Buri19. Rayong20. Sa Kaeo21. Ratchaburi22. Kanchanaburi23. Suphan Buri24. Samut Songkhram25. Phetchaburi26. Prachuap Khiri Khan27. Nakhon Ratchasima28. Buri Ram29. Surin30. Si Sa Ket31. Ubon Ratchathani32. Yasothon33. Chaiyaphum34. Amnat Charoen35. Nong Bua Lam Phu36. Khon Kaen37. Udon Thani38. Loei39. Nong Khai40. Maha Sarakham41. Roi Et42. Kalasin43. Sakon Nakhon44. Nakhon Phanom45. Mukdahan46. Chiang Mai47. Lamphun48. Lampang49. Uttaradit50. Phrae51. Nan52. Phayao53. Chiang Rai54. Mae Hong Son55. Nakhon Sawan56. Uthai Thani57. Kamphaeng Phet58. Tak59. Sukhothai60. Phitsanulok61. Phichit62. Phetchabun63. Nakhon Si Thammarat64. Krabi65. Phangnga66. Phuket67. Surat Thani68. Ranong69. Chumphon70. Songkhla71. Satun72. Trang73. Phatthalung74. Pattani75. Yala76. Narathiwat
Map 1. Provincial Distribution of the Health Index
Health Index
0.506 to 0.568 (7)0.568 to 0.63 (17)0.63 to 0.692 (24)0.692 to 0.754 (23)0.754 to 0.815 (5)
60
39
36
35
65
70
75
71
81012
11
134 17
55
515
53
44
31
32
1619
26
58
4647 50
54
28
64
22
4257
13
14
7
33
69
72
2
27
63
76
51
18
74
73
61
25
62
66
40 41
68
21
9
48
38
30
43
246
59
23
67
29
3749
56
52
45
20
34
91HUMAN DEVELOPMENT INDICES
The AIDS epidemic has moved fromnorthern provinces to the industrialareas where there is a large concen-tration of workers who migrate fromvarious parts of the country, e.g.,Rayong, Pathum Thani, Lampang.Also notable are provinces on theeastern border, i.e. Chanthaburi andTrat.
There is no discernable pattern ofdistribution for mental illness andunhealthy behaviour. High incidenceis found in both well-to-do and poorprovinces, and across regions.
Something stays the same – BangkokMetropolis has the highest concen-tration of physicians per population.The ratio is 24 times that of the mostdeprived province – Si Sa Ket.
2. Education Index
Education helps people obtain other skills,and enables people to function effectivelyin a society. The education index is com-prised of:
stock of education (mean years ofschooling),
flow of education (lower and uppersecondary gross enrolment),
educational achievement (lower andupper secondary students’ perfor-mance in national test),
educational infrastructure (upper sec-ondary students per teacher, uppersecondary students per classroom).
The indicators reflect the philosophy ofthe National Education Act 1999 thatemphasizes both the quantity and qualityof education. Since the national meanyears of schooling is 7.3 years, andprimary education has been compulsoryfor quite some time, the education indexfocuses on secondary education, whichhas become a top national agenda. (Now,compulsory education is 9 years.)
The education index ranges from 0.383to 0.649. Apart from a few exceptionalcases, education is relatively equitableacross the country. Most outstandingprovinces are Chon Buri in the East,Phuket in the South, Lamphun, Lampangand Chiang Mai in the North, NakhonPathom and Phra Nakhon Si Ayutthaya inthe Central Plain.
Table 2. Five Best and Worst Performers on Health Indicators
Life expectancy 1st degree AIDS Mental Unhealthy Populationat birth malnutrition in incidence illness behaviour per physician(years) children under 5 (%) (per 100,000) (per 1,000) (%) (persons)
Top 5 provinces
Nonthaburi 79.8 Ratchaburi 0.0 Nonthaburi 0.0 Phayao 3.5 Samut BangkokSongkhram 23.7 Metropolis 793
Narathiwat 78.7 Chiang Rai 0.0 Chachoengsao 0.0 Trang 3.6 Loei 24.5 Chon Buri 1,876Nakhon Si Nong Bua Phattalung 0.0 Krabi 3.6 Uttaradit 24.6 Chiang Mai 2,082
Thammarat 78.7 Lam Phu 0.8Pattani 77.6 Samut Prakan 1.0 Ubon Ratchathani 0.1 Chanthaburi 4.2 Songkhla 24.7 Phuket 2,103Ranong 77.1 Nonthaburi 1.6 Nakhon Phanom 0.4 Nakhon Pathom 4.9 Samut Sakon 24.8 Pathum Thani 2,261
Bottom 5 provinces
Phrae 65.2 Amnat Charoen 13.3 Lampang 24.7 Phuket 49.3 Rayong 47.4 Nong BuaLam Phu 13,731
Lamphun 65.1 Buri Ram 13.4 Pathum Thani 25.0 Nonthaburi 49.4 Phitsanulok 50.5 Chaiyaphum 13,759Chiang Mai 62.9 Khon Kaen 13.9 Trat 36.6 Ubon Ratchathani 54.9 Phuket 51.6 Kalasin 14,261Phayao 61.7 Nan 15.2 Chanthaburi 39.5 Nakhon Phanom 62.5 Maha Salakam 51.8 Phetchabun 14,629Chiang Rai 61.6 Mae Hong Son 15.9 Rayong 51.3 Nakhon Sawan 74.5 Mukdahan 55.8 Si Sa Ket 19,007
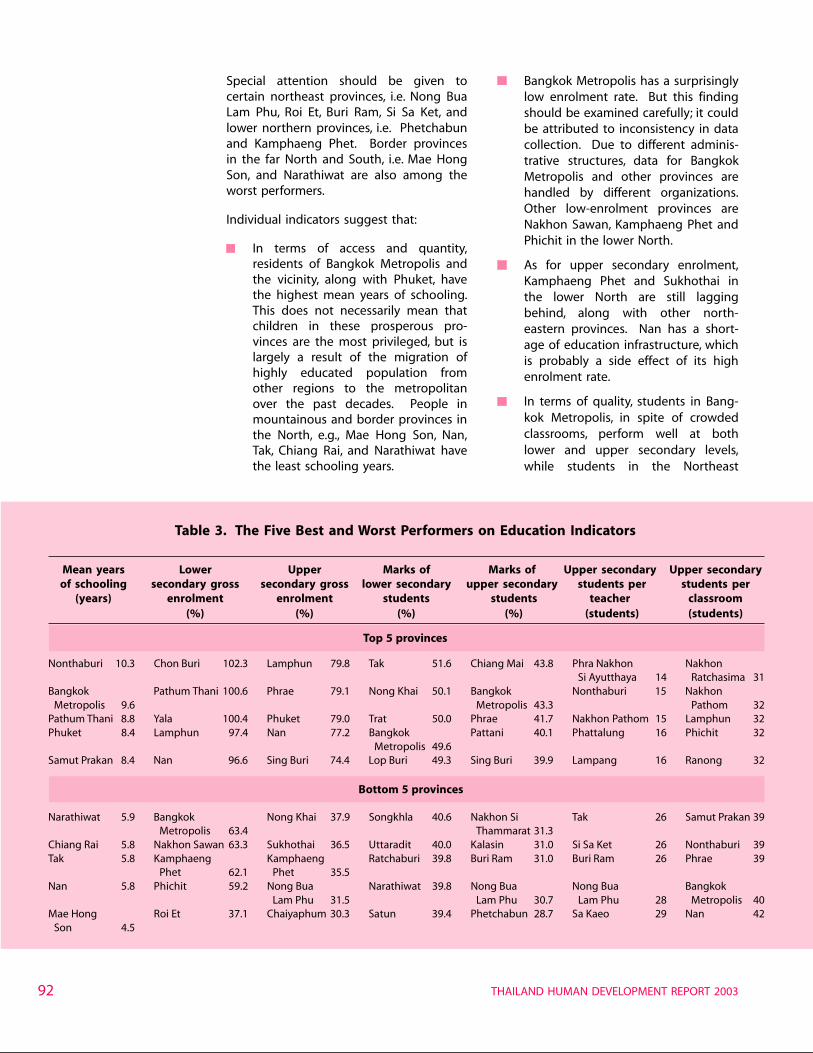
THAILAND HUMAN DEVELOPMENT REPORT 200392
Special attention should be given tocertain northeast provinces, i.e. Nong BuaLam Phu, Roi Et, Buri Ram, Si Sa Ket, andlower northern provinces, i.e. Phetchabunand Kamphaeng Phet. Border provincesin the far North and South, i.e. Mae HongSon, and Narathiwat are also among theworst performers.
Individual indicators suggest that:
In terms of access and quantity,residents of Bangkok Metropolis andthe vicinity, along with Phuket, havethe highest mean years of schooling.This does not necessarily mean thatchildren in these prosperous pro-vinces are the most privileged, but islargely a result of the migration ofhighly educated population fromother regions to the metropolitanover the past decades. People inmountainous and border provinces inthe North, e.g., Mae Hong Son, Nan,Tak, Chiang Rai, and Narathiwat havethe least schooling years.
Bangkok Metropolis has a surprisinglylow enrolment rate. But this findingshould be examined carefully; it couldbe attributed to inconsistency in datacollection. Due to different adminis-trative structures, data for BangkokMetropolis and other provinces arehandled by different organizations.Other low-enrolment provinces areNakhon Sawan, Kamphaeng Phet andPhichit in the lower North.
As for upper secondary enrolment,Kamphaeng Phet and Sukhothai inthe lower North are still laggingbehind, along with other north-eastern provinces. Nan has a short-age of education infrastructure, whichis probably a side effect of its highenrolment rate.
In terms of quality, students in Bang-kok Metropolis, in spite of crowdedclassrooms, perform well at bothlower and upper secondary levels,while students in the Northeast
Table 3. The Five Best and Worst Performers on Education Indicators
Mean years Lower Upper Marks of Marks of Upper secondary Upper secondaryof schooling secondary gross secondary gross lower secondary upper secondary students per students per
(years) enrolment enrolment students students teacher classroom(%) (%) (%) (%) (students) (students)
Top 5 provinces
Nonthaburi 10.3 Chon Buri 102.3 Lamphun 79.8 Tak 51.6 Chiang Mai 43.8 Phra Nakhon NakhonSi Ayutthaya 14 Ratchasima 31
Bangkok Pathum Thani 100.6 Phrae 79.1 Nong Khai 50.1 Bangkok Nonthaburi 15 NakhonMetropolis 9.6 Metropolis 43.3 Pathom 32
Pathum Thani 8.8 Yala 100.4 Phuket 79.0 Trat 50.0 Phrae 41.7 Nakhon Pathom 15 Lamphun 32Phuket 8.4 Lamphun 97.4 Nan 77.2 Bangkok Pattani 40.1 Phattalung 16 Phichit 32
Metropolis 49.6Samut Prakan 8.4 Nan 96.6 Sing Buri 74.4 Lop Buri 49.3 Sing Buri 39.9 Lampang 16 Ranong 32
Bottom 5 provinces
Narathiwat 5.9 Bangkok Nong Khai 37.9 Songkhla 40.6 Nakhon Si Tak 26 Samut Prakan 39Metropolis 63.4 Thammarat 31.3
Chiang Rai 5.8 Nakhon Sawan 63.3 Sukhothai 36.5 Uttaradit 40.0 Kalasin 31.0 Si Sa Ket 26 Nonthaburi 39Tak 5.8 Kamphaeng Kamphaeng Ratchaburi 39.8 Buri Ram 31.0 Buri Ram 26 Phrae 39
Phet 62.1 Phet 35.5Nan 5.8 Phichit 59.2 Nong Bua Narathiwat 39.8 Nong Bua Nong Bua Bangkok
Lam Phu 31.5 Lam Phu 30.7 Lam Phu 28 Metropolis 40Mae Hong Roi Et 37.1 Chaiyaphum 30.3 Satun 39.4 Phetchabun 28.7 Sa Kaeo 29 Nan 42
Son 4.5
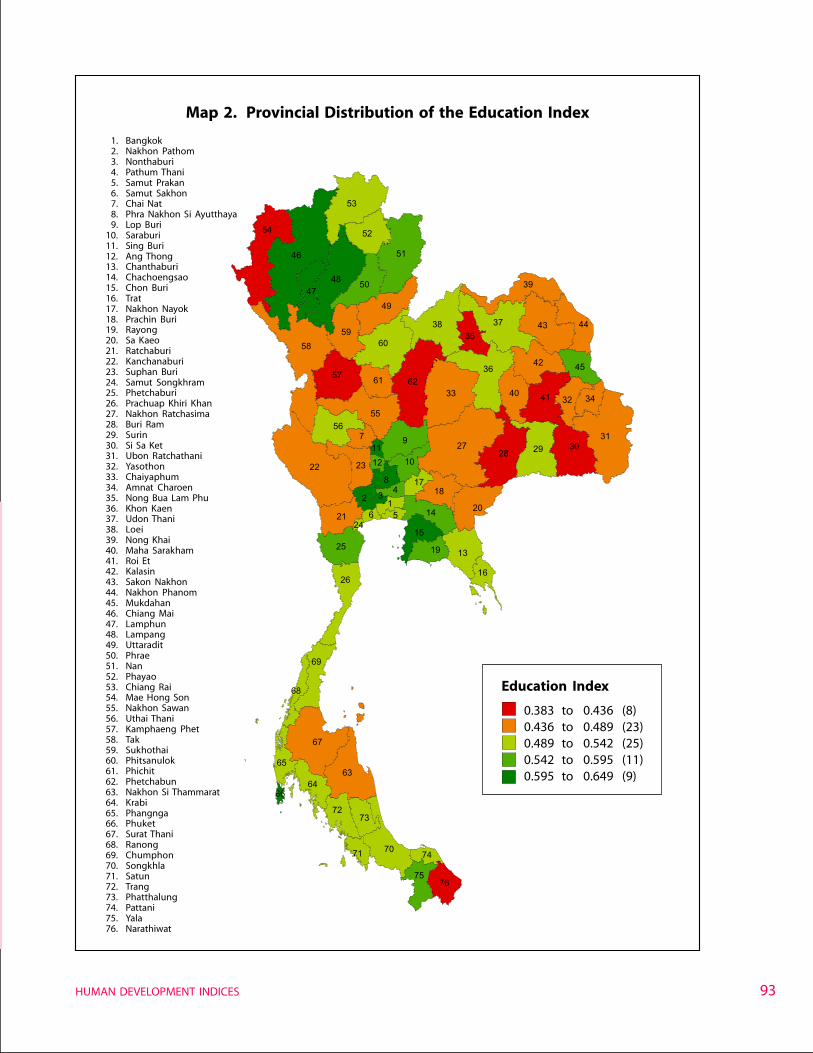
93HUMAN DEVELOPMENT INDICES
1. Bangkok2. Nakhon Pathom3. Nonthaburi4. Pathum Thani5. Samut Prakan6. Samut Sakhon7. Chai Nat8. Phra Nakhon Si Ayutthaya9. Lop Buri
10. Saraburi11. Sing Buri12. Ang Thong13. Chanthaburi14. Chachoengsao15. Chon Buri16. Trat17. Nakhon Nayok18. Prachin Buri19. Rayong20. Sa Kaeo21. Ratchaburi22. Kanchanaburi23. Suphan Buri24. Samut Songkhram25. Phetchaburi26. Prachuap Khiri Khan27. Nakhon Ratchasima28. Buri Ram29. Surin30. Si Sa Ket31. Ubon Ratchathani32. Yasothon33. Chaiyaphum34. Amnat Charoen35. Nong Bua Lam Phu36. Khon Kaen37. Udon Thani38. Loei39. Nong Khai40. Maha Sarakham41. Roi Et42. Kalasin43. Sakon Nakhon44. Nakhon Phanom45. Mukdahan46. Chiang Mai47. Lamphun48. Lampang49. Uttaradit50. Phrae51. Nan52. Phayao53. Chiang Rai54. Mae Hong Son55. Nakhon Sawan56. Uthai Thani57. Kamphaeng Phet58. Tak59. Sukhothai60. Phitsanulok61. Phichit62. Phetchabun63. Nakhon Si Thammarat64. Krabi65. Phangnga66. Phuket67. Surat Thani68. Ranong69. Chumphon70. Songkhla71. Satun72. Trang73. Phatthalung74. Pattani75. Yala76. Narathiwat
Map 2. Provincial Distribution of the Education Index
Education Index
0.383 to 0.436 (8)0.436 to 0.489 (23)0.489 to 0.542 (25)0.542 to 0.595 (11)0.595 to 0.649 (9)
43
39
31
32
28 29
6236
3538
50
53
52
46
54
58
22
6563
72
75
70
69
26 16
1514
19
15
55
11
84
12
64
4257
13
7
33
172
44
27
3
76
51
18
74
73
61
60
25
66
40 41
68
21
9
4847
30
71
246
10
59
23
67
3749
56
45
20
34
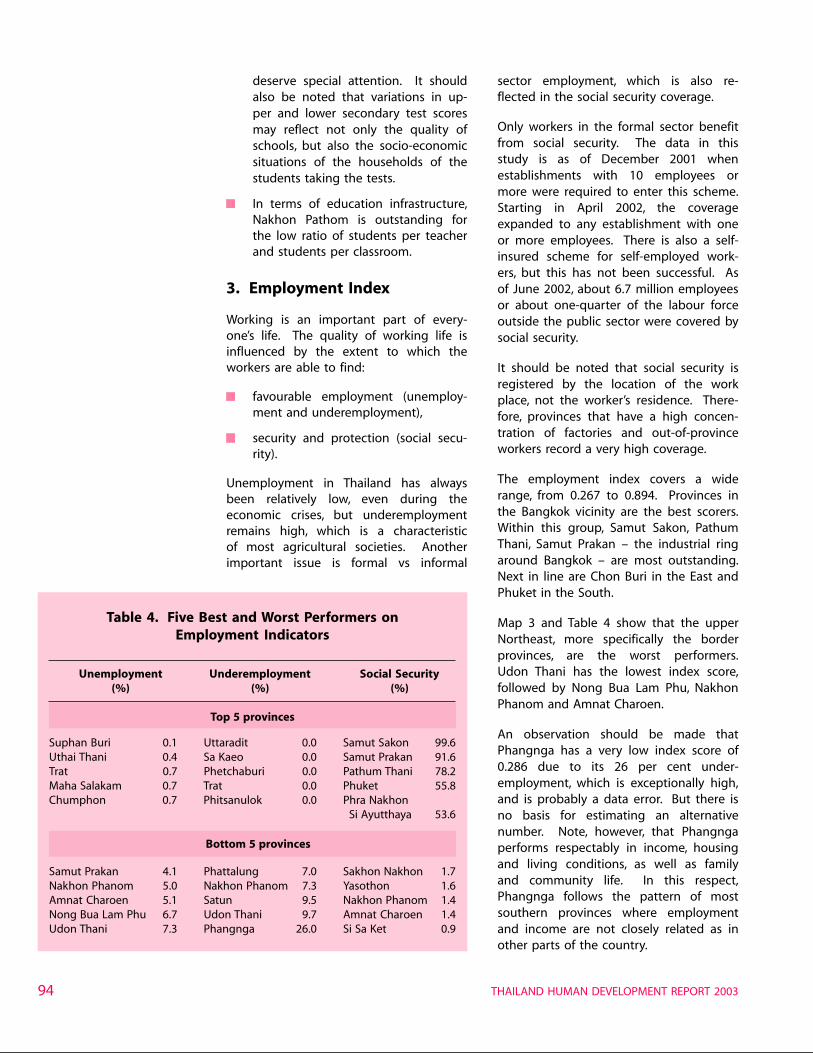
THAILAND HUMAN DEVELOPMENT REPORT 200394
deserve special attention. It shouldalso be noted that variations in up-per and lower secondary test scoresmay reflect not only the quality ofschools, but also the socio-economicsituations of the households of thestudents taking the tests.
In terms of education infrastructure,Nakhon Pathom is outstanding forthe low ratio of students per teacherand students per classroom.
3. Employment Index
Working is an important part of every-one’s life. The quality of working life isinfluenced by the extent to which theworkers are able to find:
favourable employment (unemploy-ment and underemployment),
security and protection (social secu-rity).
Unemployment in Thailand has alwaysbeen relatively low, even during theeconomic crises, but underemploymentremains high, which is a characteristicof most agricultural societies. Anotherimportant issue is formal vs informal
sector employment, which is also re-flected in the social security coverage.
Only workers in the formal sector benefitfrom social security. The data in thisstudy is as of December 2001 whenestablishments with 10 employees ormore were required to enter this scheme.Starting in April 2002, the coverageexpanded to any establishment with oneor more employees. There is also a self-insured scheme for self-employed work-ers, but this has not been successful. Asof June 2002, about 6.7 million employeesor about one-quarter of the labour forceoutside the public sector were covered bysocial security.
It should be noted that social security isregistered by the location of the workplace, not the worker’s residence. There-fore, provinces that have a high concen-tration of factories and out-of-provinceworkers record a very high coverage.
The employment index covers a widerange, from 0.267 to 0.894. Provinces inthe Bangkok vicinity are the best scorers.Within this group, Samut Sakon, PathumThani, Samut Prakan – the industrial ringaround Bangkok – are most outstanding.Next in line are Chon Buri in the East andPhuket in the South.
Map 3 and Table 4 show that the upperNortheast, more specifically the borderprovinces, are the worst performers.Udon Thani has the lowest index score,followed by Nong Bua Lam Phu, NakhonPhanom and Amnat Charoen.
An observation should be made thatPhangnga has a very low index score of0.286 due to its 26 per cent under-employment, which is exceptionally high,and is probably a data error. But there isno basis for estimating an alternativenumber. Note, however, that Phangngaperforms respectably in income, housingand living conditions, as well as familyand community life. In this respect,Phangnga follows the pattern of mostsouthern provinces where employmentand income are not closely related as inother parts of the country.
Table 4. Five Best and Worst Performers onEmployment Indicators
Unemployment Underemployment Social Security(%) (%) (%)
Top 5 provinces
Suphan Buri 0.1 Uttaradit 0.0 Samut Sakon 99.6Uthai Thani 0.4 Sa Kaeo 0.0 Samut Prakan 91.6Trat 0.7 Phetchaburi 0.0 Pathum Thani 78.2Maha Salakam 0.7 Trat 0.0 Phuket 55.8Chumphon 0.7 Phitsanulok 0.0 Phra Nakhon
Si Ayutthaya 53.6
Bottom 5 provinces
Samut Prakan 4.1 Phattalung 7.0 Sakhon Nakhon 1.7Nakhon Phanom 5.0 Nakhon Phanom 7.3 Yasothon 1.6Amnat Charoen 5.1 Satun 9.5 Nakhon Phanom 1.4Nong Bua Lam Phu 6.7 Udon Thani 9.7 Amnat Charoen 1.4Udon Thani 7.3 Phangnga 26.0 Si Sa Ket 0.9

95HUMAN DEVELOPMENT INDICES
1. Bangkok2. Nakhon Pathom3. Nonthaburi4. Pathum Thani5. Samut Prakan6. Samut Sakhon7. Chai Nat8. Phra Nakhon Si Ayutthaya9. Lop Buri
10. Saraburi11. Sing Buri12. Ang Thong13. Chanthaburi14. Chachoengsao15. Chon Buri16. Trat17. Nakhon Nayok18. Prachin Buri19. Rayong20. Sa Kaeo21. Ratchaburi22. Kanchanaburi23. Suphan Buri24. Samut Songkhram25. Phetchaburi26. Prachuap Khiri Khan27. Nakhon Ratchasima28. Buri Ram29. Surin30. Si Sa Ket31. Ubon Ratchathani32. Yasothon33. Chaiyaphum34. Amnat Charoen35. Nong Bua Lam Phu36. Khon Kaen37. Udon Thani38. Loei39. Nong Khai40. Maha Sarakham41. Roi Et42. Kalasin43. Sakon Nakhon44. Nakhon Phanom45. Mukdahan46. Chiang Mai47. Lamphun48. Lampang49. Uttaradit50. Phrae51. Nan52. Phayao53. Chiang Rai54. Mae Hong Son55. Nakhon Sawan56. Uthai Thani57. Kamphaeng Phet58. Tak59. Sukhothai60. Phitsanulok61. Phichit62. Phetchabun63. Nakhon Si Thammarat64. Krabi65. Phangnga66. Phuket67. Surat Thani68. Ranong69. Chumphon70. Songkhla71. Satun72. Trang73. Phatthalung74. Pattani75. Yala76. Narathiwat
Map 3. Provincial Distribution of the Employment Index
Employment Index
0.267 to 0.392 (5)0.392 to 0.517 (11)0.517 to 0.642 (37)0.642 to 0.767 (18)0.767 to 0.894 (5)
46 54
35 38
55
62
16
28 29
69
65
75 70
63
26
32
50
36
11 8 12
4 5 1 15
58
53
39
64
22
42 57
13
14
7
33
72
17 2
44
27
3
76
51
18
74
73
61
60
25
66
40 41
68
19
21
9
48 47
30
43
71
24 6
10
59
23
67
37 49
56 31
52
45
20
34
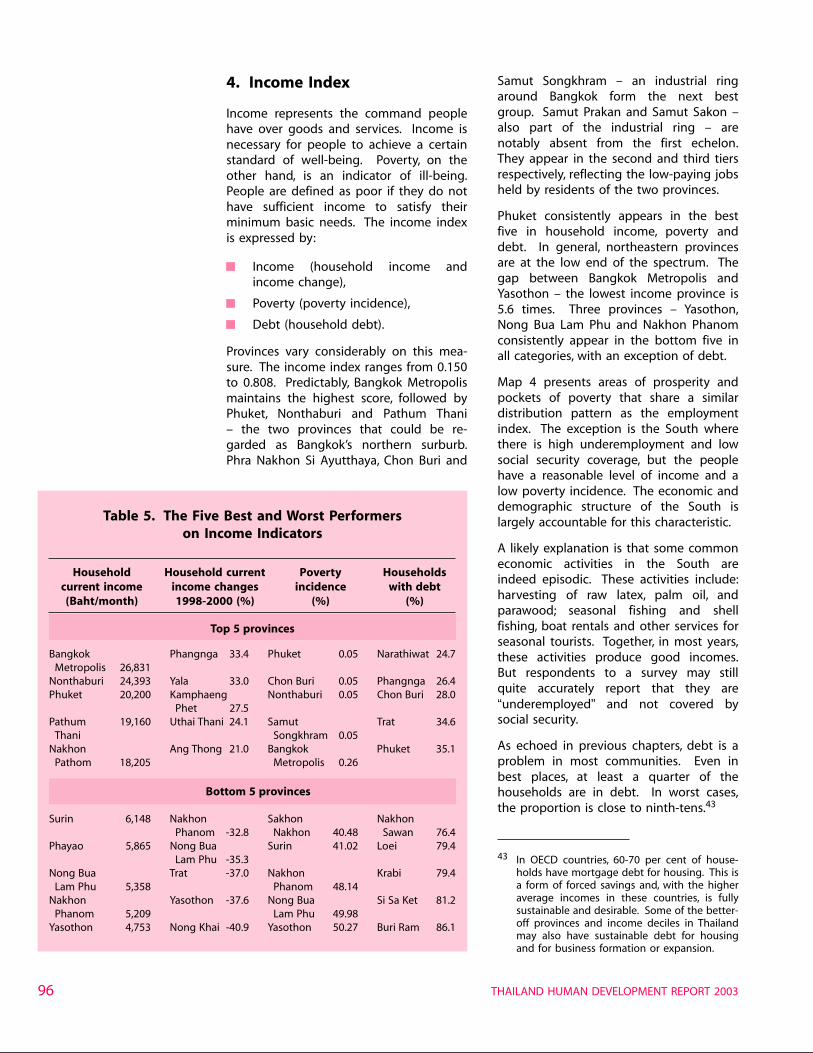
THAILAND HUMAN DEVELOPMENT REPORT 200396
4. Income Index
Income represents the command peoplehave over goods and services. Income isnecessary for people to achieve a certainstandard of well-being. Poverty, on theother hand, is an indicator of ill-being.People are defined as poor if they do nothave sufficient income to satisfy theirminimum basic needs. The income indexis expressed by:
Income (household income andincome change),
Poverty (poverty incidence),
Debt (household debt).
Provinces vary considerably on this mea-sure. The income index ranges from 0.150to 0.808. Predictably, Bangkok Metropolismaintains the highest score, followed byPhuket, Nonthaburi and Pathum Thani– the two provinces that could be re-garded as Bangkok’s northern surburb.Phra Nakhon Si Ayutthaya, Chon Buri and
Samut Songkhram – an industrial ringaround Bangkok form the next bestgroup. Samut Prakan and Samut Sakon –also part of the industrial ring – arenotably absent from the first echelon.They appear in the second and third tiersrespectively, reflecting the low-paying jobsheld by residents of the two provinces.
Phuket consistently appears in the bestfive in household income, poverty anddebt. In general, northeastern provincesare at the low end of the spectrum. Thegap between Bangkok Metropolis andYasothon – the lowest income province is5.6 times. Three provinces – Yasothon,Nong Bua Lam Phu and Nakhon Phanomconsistently appear in the bottom five inall categories, with an exception of debt.
Map 4 presents areas of prosperity andpockets of poverty that share a similardistribution pattern as the employmentindex. The exception is the South wherethere is high underemployment and lowsocial security coverage, but the peoplehave a reasonable level of income and alow poverty incidence. The economic anddemographic structure of the South islargely accountable for this characteristic.
A likely explanation is that some commoneconomic activities in the South areindeed episodic. These activities include:harvesting of raw latex, palm oil, andparawood; seasonal fishing and shellfishing, boat rentals and other services forseasonal tourists. Together, in most years,these activities produce good incomes.But respondents to a survey may stillquite accurately report that they are“underemployed” and not covered bysocial security.
As echoed in previous chapters, debt is aproblem in most communities. Even inbest places, at least a quarter of thehouseholds are in debt. In worst cases,the proportion is close to ninth-tens.43
Table 5. The Five Best and Worst Performerson Income Indicators
Household Household current Poverty Householdscurrent income income changes incidence with debt(Baht/month) 1998-2000 (%) (%) (%)
Top 5 provinces
Bangkok Phangnga 33.4 Phuket 0.05 Narathiwat 24.7Metropolis 26,831
Nonthaburi 24,393 Yala 33.0 Chon Buri 0.05 Phangnga 26.4Phuket 20,200 Kamphaeng Nonthaburi 0.05 Chon Buri 28.0
Phet 27.5Pathum 19,160 Uthai Thani 24.1 Samut Trat 34.6
Thani Songkhram 0.05Nakhon Ang Thong 21.0 Bangkok Phuket 35.1
Pathom 18,205 Metropolis 0.26
Bottom 5 provinces
Surin 6,148 Nakhon Sakhon NakhonPhanom -32.8 Nakhon 40.48 Sawan 76.4
Phayao 5,865 Nong Bua Surin 41.02 Loei 79.4Lam Phu -35.3
Nong Bua Trat -37.0 Nakhon Krabi 79.4Lam Phu 5,358 Phanom 48.14
Nakhon Yasothon -37.6 Nong Bua Si Sa Ket 81.2Phanom 5,209 Lam Phu 49.98
Yasothon 4,753 Nong Khai -40.9 Yasothon 50.27 Buri Ram 86.1
43 In OECD countries, 60-70 per cent of house-holds have mortgage debt for housing. This isa form of forced savings and, with the higheraverage incomes in these countries, is fullysustainable and desirable. Some of the better-off provinces and income deciles in Thailandmay also have sustainable debt for housingand for business formation or expansion.
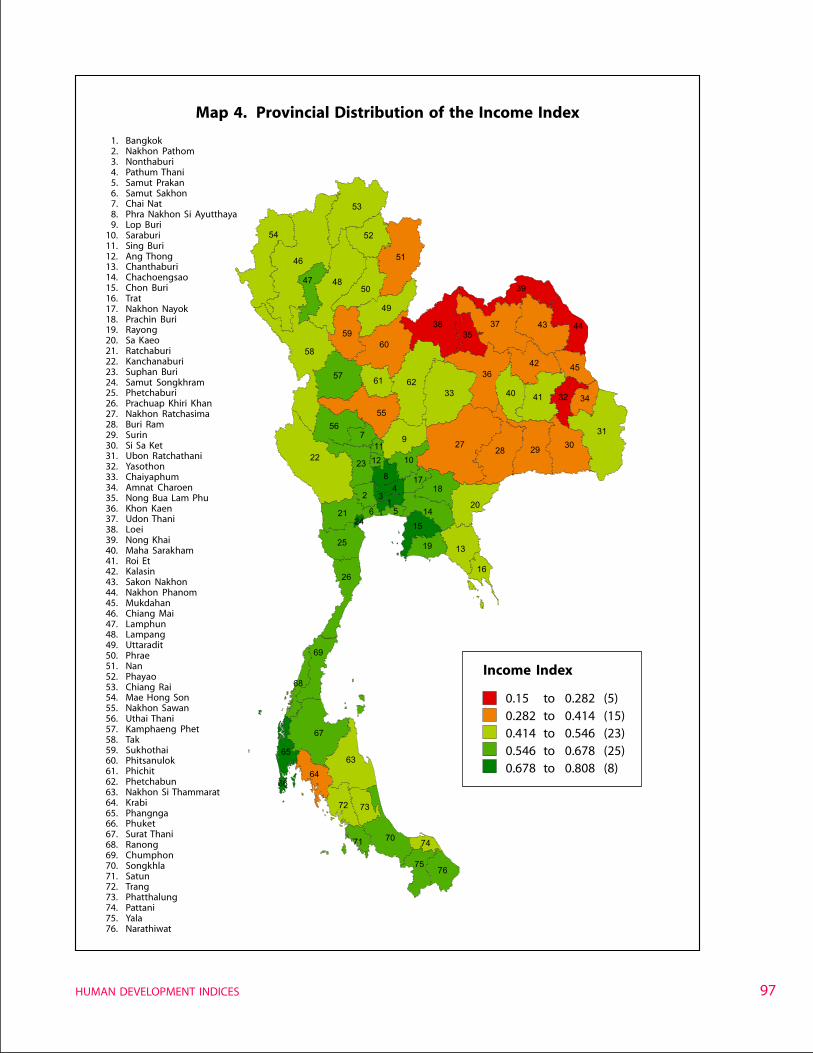
97HUMAN DEVELOPMENT INDICES
1. Bangkok2. Nakhon Pathom3. Nonthaburi4. Pathum Thani5. Samut Prakan6. Samut Sakhon7. Chai Nat8. Phra Nakhon Si Ayutthaya9. Lop Buri
10. Saraburi11. Sing Buri12. Ang Thong13. Chanthaburi14. Chachoengsao15. Chon Buri16. Trat17. Nakhon Nayok18. Prachin Buri19. Rayong20. Sa Kaeo21. Ratchaburi22. Kanchanaburi23. Suphan Buri24. Samut Songkhram25. Phetchaburi26. Prachuap Khiri Khan27. Nakhon Ratchasima28. Buri Ram29. Surin30. Si Sa Ket31. Ubon Ratchathani32. Yasothon33. Chaiyaphum34. Amnat Charoen35. Nong Bua Lam Phu36. Khon Kaen37. Udon Thani38. Loei39. Nong Khai40. Maha Sarakham41. Roi Et42. Kalasin43. Sakon Nakhon44. Nakhon Phanom45. Mukdahan46. Chiang Mai47. Lamphun48. Lampang49. Uttaradit50. Phrae51. Nan52. Phayao53. Chiang Rai54. Mae Hong Son55. Nakhon Sawan56. Uthai Thani57. Kamphaeng Phet58. Tak59. Sukhothai60. Phitsanulok61. Phichit62. Phetchabun63. Nakhon Si Thammarat64. Krabi65. Phangnga66. Phuket67. Surat Thani68. Ranong69. Chumphon70. Songkhla71. Satun72. Trang73. Phatthalung74. Pattani75. Yala76. Narathiwat
Map 4. Provincial Distribution of the Income Index
Income Index
0.15 to 0.282 (5)0.282 to 0.414 (15)0.414 to 0.546 (23)0.546 to 0.678 (25)0.678 to 0.808 (8)
812
4135
11
15
56
62
60
3241
31
4647
54
3538
55
16
28 29
69
65
75
70
63
26
50
36
58
53
39
64
22
4257
13
14
7
33
72
172
44
27
76
51
18
74
73
61
25
66
40
68
19
21
9
48
30
43
71
246
10
59
23
67
3749
52
45
20
34
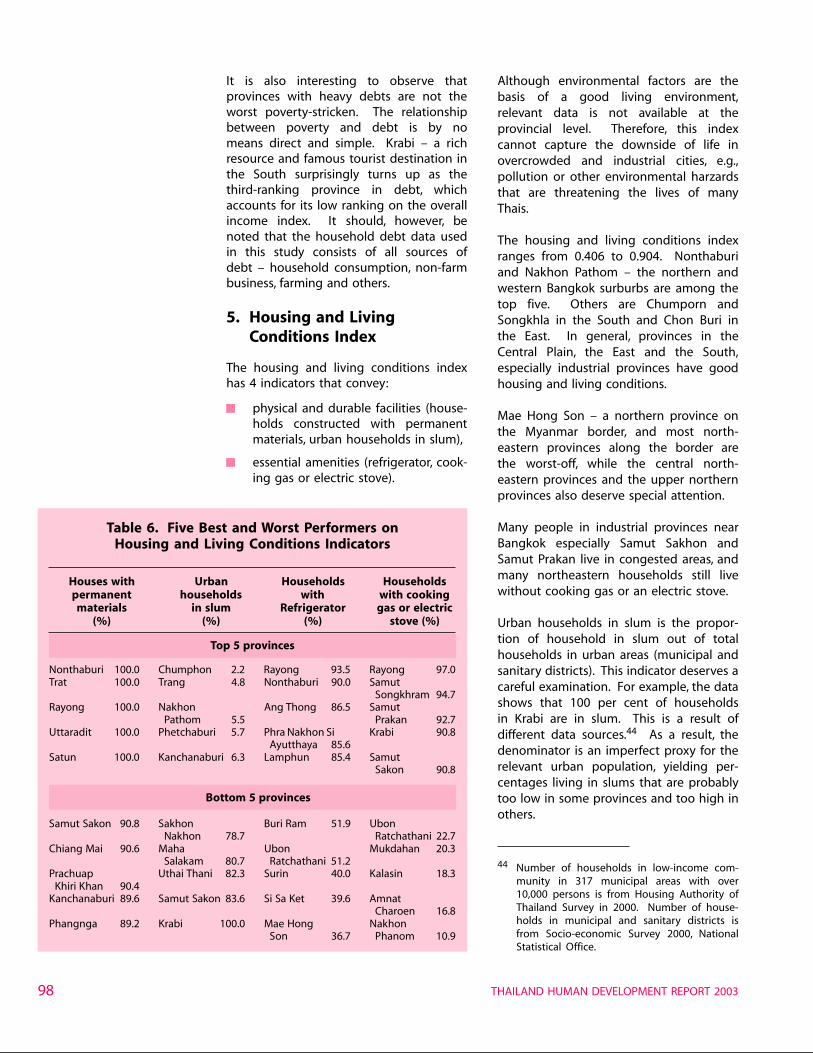
THAILAND HUMAN DEVELOPMENT REPORT 200398
Although environmental factors are thebasis of a good living environment,relevant data is not available at theprovincial level. Therefore, this indexcannot capture the downside of life inovercrowded and industrial cities, e.g.,pollution or other environmental harzardsthat are threatening the lives of manyThais.
The housing and living conditions indexranges from 0.406 to 0.904. Nonthaburiand Nakhon Pathom – the northern andwestern Bangkok surburbs are among thetop five. Others are Chumporn andSongkhla in the South and Chon Buri inthe East. In general, provinces in theCentral Plain, the East and the South,especially industrial provinces have goodhousing and living conditions.
Mae Hong Son – a northern province onthe Myanmar border, and most north-eastern provinces along the border arethe worst-off, while the central north-eastern provinces and the upper northernprovinces also deserve special attention.
Many people in industrial provinces nearBangkok especially Samut Sakhon andSamut Prakan live in congested areas, andmany northeastern households still livewithout cooking gas or an electric stove.
Urban households in slum is the propor-tion of household in slum out of totalhouseholds in urban areas (municipal andsanitary districts). This indicator deserves acareful examination. For example, the datashows that 100 per cent of householdsin Krabi are in slum. This is a result ofdifferent data sources.44 As a result, thedenominator is an imperfect proxy for therelevant urban population, yielding per-centages living in slums that are probablytoo low in some provinces and too high inothers.
Table 6. Five Best and Worst Performers onHousing and Living Conditions Indicators
Houses with Urban Households Householdspermanent households with with cookingmaterials in slum Refrigerator gas or electric
(%) (%) (%) stove (%)
Top 5 provinces
Nonthaburi 100.0 Chumphon 2.2 Rayong 93.5 Rayong 97.0Trat 100.0 Trang 4.8 Nonthaburi 90.0 Samut
Songkhram 94.7Rayong 100.0 Nakhon Ang Thong 86.5 Samut
Pathom 5.5 Prakan 92.7Uttaradit 100.0 Phetchaburi 5.7 Phra Nakhon Si Krabi 90.8
Ayutthaya 85.6Satun 100.0 Kanchanaburi 6.3 Lamphun 85.4 Samut
Sakon 90.8
Bottom 5 provinces
Samut Sakon 90.8 Sakhon Buri Ram 51.9 UbonNakhon 78.7 Ratchathani 22.7
Chiang Mai 90.6 Maha Ubon Mukdahan 20.3Salakam 80.7 Ratchathani 51.2
Prachuap Uthai Thani 82.3 Surin 40.0 Kalasin 18.3Khiri Khan 90.4
Kanchanaburi 89.6 Samut Sakon 83.6 Si Sa Ket 39.6 AmnatCharoen 16.8
Phangnga 89.2 Krabi 100.0 Mae Hong NakhonSon 36.7 Phanom 10.9
44 Number of households in low-income com-munity in 317 municipal areas with over10,000 persons is from Housing Authority ofThailand Survey in 2000. Number of house-holds in municipal and sanitary districts isfrom Socio-economic Survey 2000, NationalStatistical Office.
It is also interesting to observe thatprovinces with heavy debts are not theworst poverty-stricken. The relationshipbetween poverty and debt is by nomeans direct and simple. Krabi – a richresource and famous tourist destination inthe South surprisingly turns up as thethird-ranking province in debt, whichaccounts for its low ranking on the overallincome index. It should, however, benoted that the household debt data usedin this study consists of all sources ofdebt – household consumption, non-farmbusiness, farming and others.
5. Housing and LivingConditions Index
The housing and living conditions indexhas 4 indicators that convey:
physical and durable facilities (house-holds constructed with permanentmaterials, urban households in slum),
essential amenities (refrigerator, cook-ing gas or electric stove).
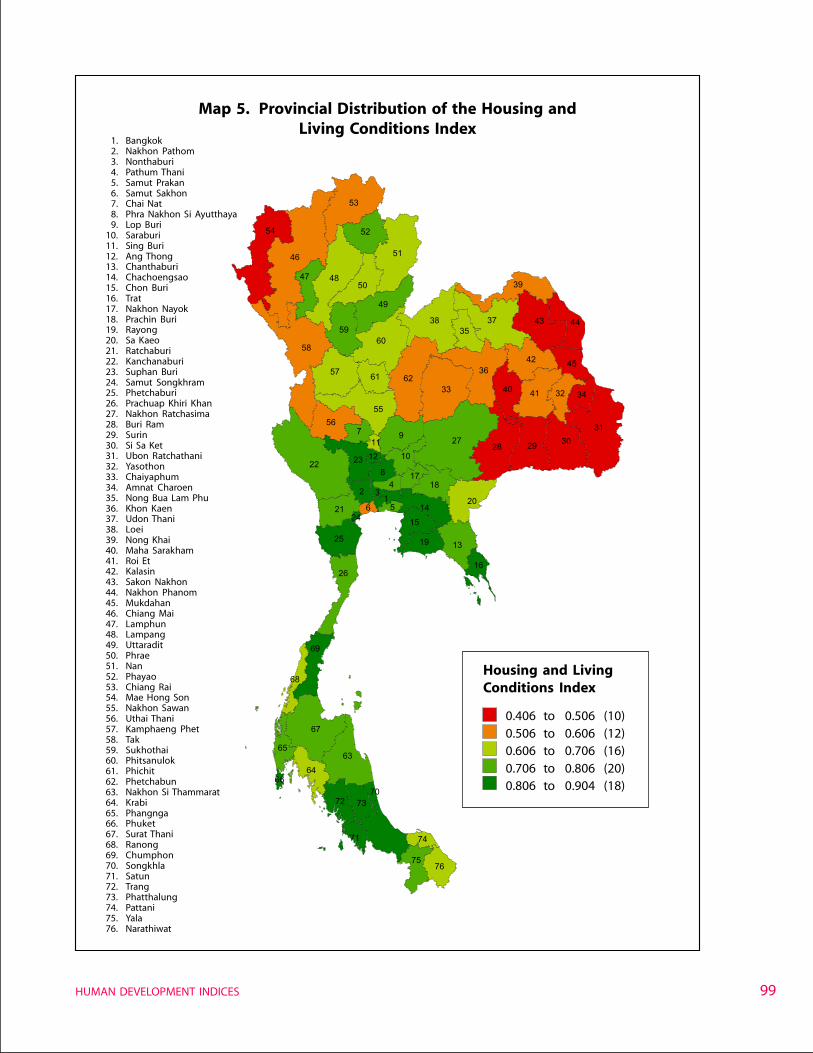
99HUMAN DEVELOPMENT INDICES
1. Bangkok2. Nakhon Pathom3. Nonthaburi4. Pathum Thani5. Samut Prakan6. Samut Sakhon7. Chai Nat8. Phra Nakhon Si Ayutthaya9. Lop Buri
10. Saraburi11. Sing Buri12. Ang Thong13. Chanthaburi14. Chachoengsao15. Chon Buri16. Trat17. Nakhon Nayok18. Prachin Buri19. Rayong20. Sa Kaeo21. Ratchaburi22. Kanchanaburi23. Suphan Buri24. Samut Songkhram25. Phetchaburi26. Prachuap Khiri Khan27. Nakhon Ratchasima28. Buri Ram29. Surin30. Si Sa Ket31. Ubon Ratchathani32. Yasothon33. Chaiyaphum34. Amnat Charoen35. Nong Bua Lam Phu36. Khon Kaen37. Udon Thani38. Loei39. Nong Khai40. Maha Sarakham41. Roi Et42. Kalasin43. Sakon Nakhon44. Nakhon Phanom45. Mukdahan46. Chiang Mai47. Lamphun48. Lampang49. Uttaradit50. Phrae51. Nan52. Phayao53. Chiang Rai54. Mae Hong Son55. Nakhon Sawan56. Uthai Thani57. Kamphaeng Phet58. Tak59. Sukhothai60. Phitsanulok61. Phichit62. Phetchabun63. Nakhon Si Thammarat64. Krabi65. Phangnga66. Phuket67. Surat Thani68. Ranong69. Chumphon70. Songkhla71. Satun72. Trang73. Phatthalung74. Pattani75. Yala76. Narathiwat
Map 5. Provincial Distribution of the Housing andLiving Conditions Index
Housing and LivingConditions Index
0.406 to 0.506 (10)0.506 to 0.606 (12)0.606 to 0.706 (16)0.706 to 0.806 (20)0.806 to 0.904 (18)
56
22
75
70
63
812
4135
11
15
62
60
3241
31
4647
54
3538
55
16
28 29
69
65
26
50
36
58
53
39
64
4257
13
14
7
33
72
172
44
27
76
51
18
74
73
61
25
66
40
68
19
21
9
48
30
43
71
246
10
59
23
67
3749
52
45
20
34
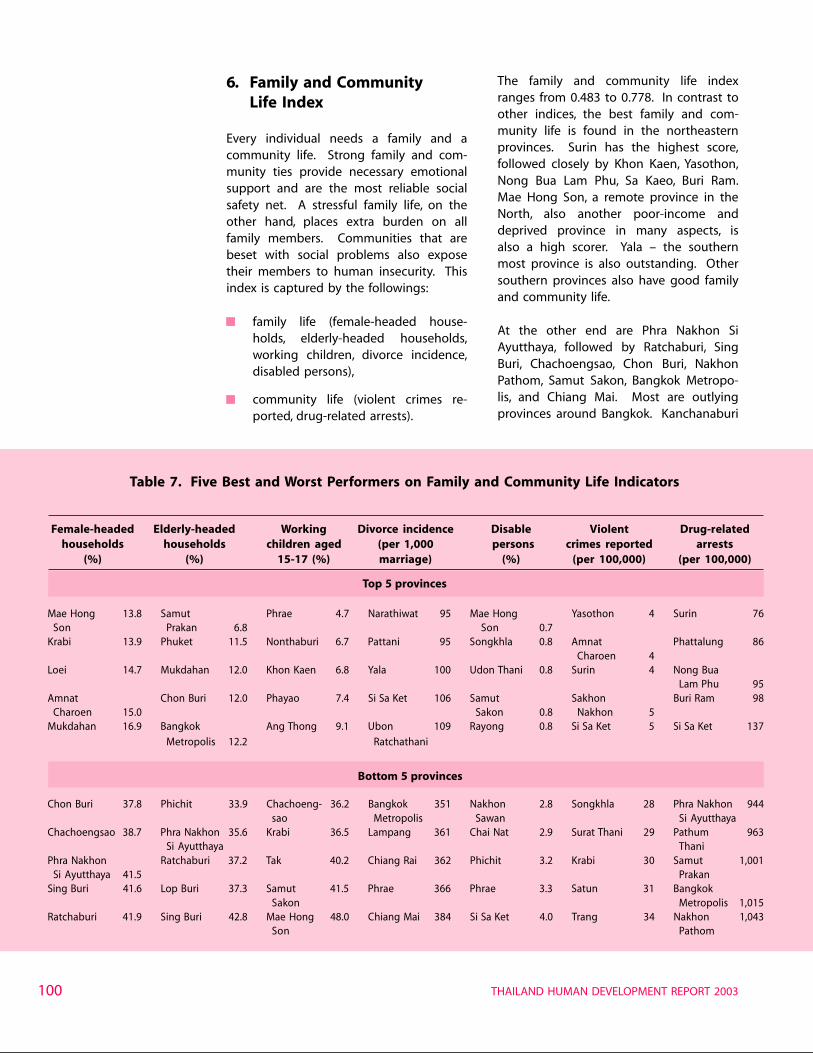
THAILAND HUMAN DEVELOPMENT REPORT 2003100
6. Family and CommunityLife Index
Every individual needs a family and acommunity life. Strong family and com-munity ties provide necessary emotionalsupport and are the most reliable socialsafety net. A stressful family life, on theother hand, places extra burden on allfamily members. Communities that arebeset with social problems also exposetheir members to human insecurity. Thisindex is captured by the followings:
family life (female-headed house-holds, elderly-headed households,working children, divorce incidence,disabled persons),
community life (violent crimes re-ported, drug-related arrests).
The family and community life indexranges from 0.483 to 0.778. In contrast toother indices, the best family and com-munity life is found in the northeasternprovinces. Surin has the highest score,followed closely by Khon Kaen, Yasothon,Nong Bua Lam Phu, Sa Kaeo, Buri Ram.Mae Hong Son, a remote province in theNorth, also another poor-income anddeprived province in many aspects, isalso a high scorer. Yala – the southernmost province is also outstanding. Othersouthern provinces also have good familyand community life.
At the other end are Phra Nakhon SiAyutthaya, followed by Ratchaburi, SingBuri, Chachoengsao, Chon Buri, NakhonPathom, Samut Sakon, Bangkok Metropo-lis, and Chiang Mai. Most are outlyingprovinces around Bangkok. Kanchanaburi
Table 7. Five Best and Worst Performers on Family and Community Life Indicators
Female-headed Elderly-headed Working Divorce incidence Disable Violent Drug-relatedhouseholds households children aged (per 1,000 persons crimes reported arrests
(%) (%) 15-17 (%) marriage) (%) (per 100,000) (per 100,000)
Top 5 provinces
Mae Hong 13.8 Samut Phrae 4.7 Narathiwat 95 Mae Hong Yasothon 4 Surin 76Son Prakan 6.8 Son 0.7
Krabi 13.9 Phuket 11.5 Nonthaburi 6.7 Pattani 95 Songkhla 0.8 Amnat Phattalung 86Charoen 4
Loei 14.7 Mukdahan 12.0 Khon Kaen 6.8 Yala 100 Udon Thani 0.8 Surin 4 Nong BuaLam Phu 95
Amnat Chon Buri 12.0 Phayao 7.4 Si Sa Ket 106 Samut Sakhon Buri Ram 98Charoen 15.0 Sakon 0.8 Nakhon 5
Mukdahan 16.9 Bangkok Ang Thong 9.1 Ubon 109 Rayong 0.8 Si Sa Ket 5 Si Sa Ket 137
Metropolis 12.2 Ratchathani
Bottom 5 provinces
Chon Buri 37.8 Phichit 33.9 Chachoeng- 36.2 Bangkok 351 Nakhon 2.8 Songkhla 28 Phra Nakhon 944sao Metropolis Sawan Si Ayutthaya
Chachoengsao 38.7 Phra Nakhon 35.6 Krabi 36.5 Lampang 361 Chai Nat 2.9 Surat Thani 29 Pathum 963Si Ayutthaya Thani
Phra Nakhon Ratchaburi 37.2 Tak 40.2 Chiang Rai 362 Phichit 3.2 Krabi 30 Samut 1,001Si Ayutthaya 41.5 Prakan
Sing Buri 41.6 Lop Buri 37.3 Samut 41.5 Phrae 366 Phrae 3.3 Satun 31 BangkokSakon Metropolis 1,015
Ratchaburi 41.9 Sing Buri 42.8 Mae Hong 48.0 Chiang Mai 384 Si Sa Ket 4.0 Trang 34 Nakhon 1,043Son Pathom
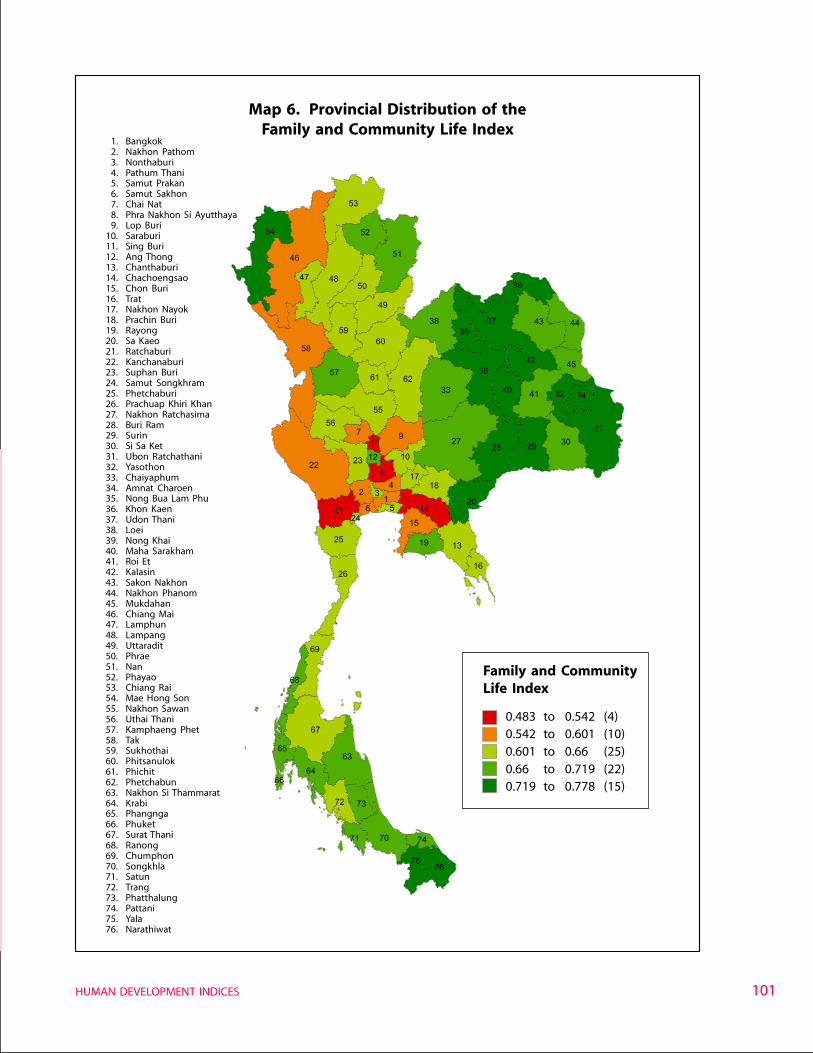
101HUMAN DEVELOPMENT INDICES
1. Bangkok2. Nakhon Pathom3. Nonthaburi4. Pathum Thani5. Samut Prakan6. Samut Sakhon7. Chai Nat8. Phra Nakhon Si Ayutthaya9. Lop Buri
10. Saraburi11. Sing Buri12. Ang Thong13. Chanthaburi14. Chachoengsao15. Chon Buri16. Trat17. Nakhon Nayok18. Prachin Buri19. Rayong20. Sa Kaeo21. Ratchaburi22. Kanchanaburi23. Suphan Buri24. Samut Songkhram25. Phetchaburi26. Prachuap Khiri Khan27. Nakhon Ratchasima28. Buri Ram29. Surin30. Si Sa Ket31. Ubon Ratchathani32. Yasothon33. Chaiyaphum34. Amnat Charoen35. Nong Bua Lam Phu36. Khon Kaen37. Udon Thani38. Loei39. Nong Khai40. Maha Sarakham41. Roi Et42. Kalasin43. Sakon Nakhon44. Nakhon Phanom45. Mukdahan46. Chiang Mai47. Lamphun48. Lampang49. Uttaradit50. Phrae51. Nan52. Phayao53. Chiang Rai54. Mae Hong Son55. Nakhon Sawan56. Uthai Thani57. Kamphaeng Phet58. Tak59. Sukhothai60. Phitsanulok61. Phichit62. Phetchabun63. Nakhon Si Thammarat64. Krabi65. Phangnga66. Phuket67. Surat Thani68. Ranong69. Chumphon70. Songkhla71. Satun72. Trang73. Phatthalung74. Pattani75. Yala76. Narathiwat
Map 6. Provincial Distribution of theFamily and Community Life Index
Family and CommunityLife Index
0.483 to 0.542 (4)0.542 to 0.601 (10)0.601 to 0.66 (25)0.66 to 0.719 (22)0.719 to 0.778 (15)
75
70
63
56
22 812
4135
11
15
62
60
3241
31
4647
54
3538
55
16
28 29
69
65
26
50
36
58
53
39
64
4257
13
14
7
33
72
172
44
27
76
51
18
74
73
61
25
66
40
68
19
21
9
48
30
43
71
246
10
59
23
67
3749
52
45
20
34
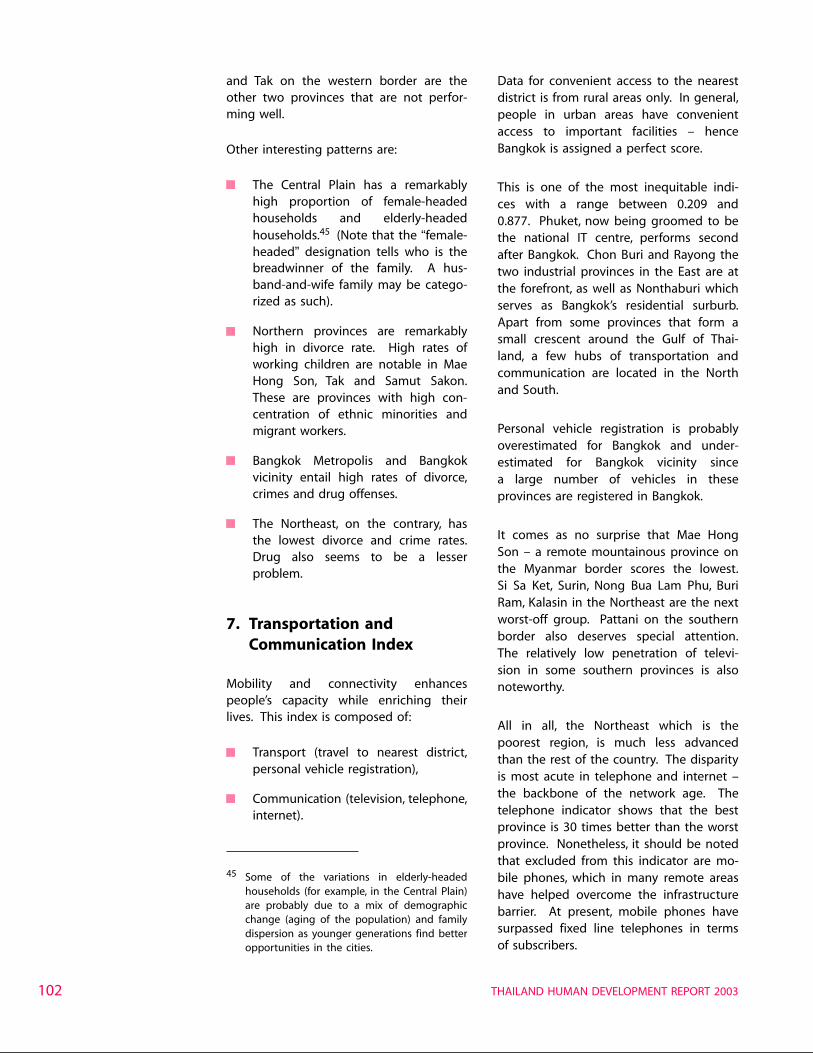
THAILAND HUMAN DEVELOPMENT REPORT 2003102
and Tak on the western border are theother two provinces that are not perfor-ming well.
Other interesting patterns are:
The Central Plain has a remarkablyhigh proportion of female-headedhouseholds and elderly-headedhouseholds.45 (Note that the “female-headed” designation tells who is thebreadwinner of the family. A hus-band-and-wife family may be catego-rized as such).
Northern provinces are remarkablyhigh in divorce rate. High rates ofworking children are notable in MaeHong Son, Tak and Samut Sakon.These are provinces with high con-centration of ethnic minorities andmigrant workers.
Bangkok Metropolis and Bangkokvicinity entail high rates of divorce,crimes and drug offenses.
The Northeast, on the contrary, hasthe lowest divorce and crime rates.Drug also seems to be a lesserproblem.
7. Transportation andCommunication Index
Mobility and connectivity enhancespeople’s capacity while enriching theirlives. This index is composed of:
Transport (travel to nearest district,personal vehicle registration),
Communication (television, telephone,internet).
Data for convenient access to the nearestdistrict is from rural areas only. In general,people in urban areas have convenientaccess to important facilities – henceBangkok is assigned a perfect score.
This is one of the most inequitable indi-ces with a range between 0.209 and0.877. Phuket, now being groomed to bethe national IT centre, performs secondafter Bangkok. Chon Buri and Rayong thetwo industrial provinces in the East are atthe forefront, as well as Nonthaburi whichserves as Bangkok’s residential surburb.Apart from some provinces that form asmall crescent around the Gulf of Thai-land, a few hubs of transportation andcommunication are located in the Northand South.
Personal vehicle registration is probablyoverestimated for Bangkok and under-estimated for Bangkok vicinity sincea large number of vehicles in theseprovinces are registered in Bangkok.
It comes as no surprise that Mae HongSon – a remote mountainous province onthe Myanmar border scores the lowest.Si Sa Ket, Surin, Nong Bua Lam Phu, BuriRam, Kalasin in the Northeast are the nextworst-off group. Pattani on the southernborder also deserves special attention.The relatively low penetration of televi-sion in some southern provinces is alsonoteworthy.
All in all, the Northeast which is thepoorest region, is much less advancedthan the rest of the country. The disparityis most acute in telephone and internet –the backbone of the network age. Thetelephone indicator shows that the bestprovince is 30 times better than the worstprovince. Nonetheless, it should be notedthat excluded from this indicator are mo-bile phones, which in many remote areashave helped overcome the infrastructurebarrier. At present, mobile phones havesurpassed fixed line telephones in termsof subscribers.
45 Some of the variations in elderly-headedhouseholds (for example, in the Central Plain)are probably due to a mix of demographicchange (aging of the population) and familydispersion as younger generations find betteropportunities in the cities.
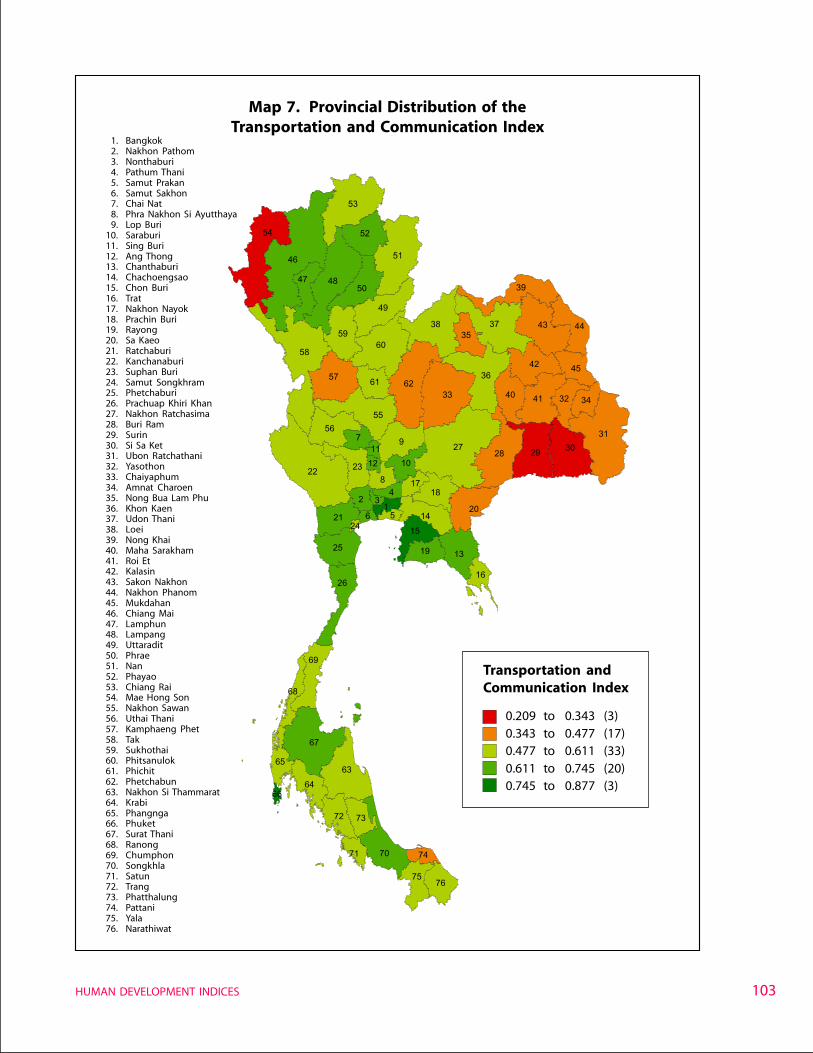
103HUMAN DEVELOPMENT INDICES
1. Bangkok2. Nakhon Pathom3. Nonthaburi4. Pathum Thani5. Samut Prakan6. Samut Sakhon7. Chai Nat8. Phra Nakhon Si Ayutthaya9. Lop Buri
10. Saraburi11. Sing Buri12. Ang Thong13. Chanthaburi14. Chachoengsao15. Chon Buri16. Trat17. Nakhon Nayok18. Prachin Buri19. Rayong20. Sa Kaeo21. Ratchaburi22. Kanchanaburi23. Suphan Buri24. Samut Songkhram25. Phetchaburi26. Prachuap Khiri Khan27. Nakhon Ratchasima28. Buri Ram29. Surin30. Si Sa Ket31. Ubon Ratchathani32. Yasothon33. Chaiyaphum34. Amnat Charoen35. Nong Bua Lam Phu36. Khon Kaen37. Udon Thani38. Loei39. Nong Khai40. Maha Sarakham41. Roi Et42. Kalasin43. Sakon Nakhon44. Nakhon Phanom45. Mukdahan46. Chiang Mai47. Lamphun48. Lampang49. Uttaradit50. Phrae51. Nan52. Phayao53. Chiang Rai54. Mae Hong Son55. Nakhon Sawan56. Uthai Thani57. Kamphaeng Phet58. Tak59. Sukhothai60. Phitsanulok61. Phichit62. Phetchabun63. Nakhon Si Thammarat64. Krabi65. Phangnga66. Phuket67. Surat Thani68. Ranong69. Chumphon70. Songkhla71. Satun72. Trang73. Phatthalung74. Pattani75. Yala76. Narathiwat
Map 7. Provincial Distribution of theTransportation and Communication Index
Transportation andCommunication Index
0.209 to 0.343 (3)0.343 to 0.477 (17)0.477 to 0.611 (33)0.611 to 0.745 (20)0.745 to 0.877 (3)
75
70
63
56
22 812
4135
11
15
62
60
3241
31
4647
54
3538
55
16
28 29
69
65
26
50
36
58
53
39
64
4257
13
14
7
33
72
172
44
27
76
51
18
74
73
61
25
66
40
68
19
21
9
48
30
43
71
246
10
59
23
67
3749
52
45
20
34
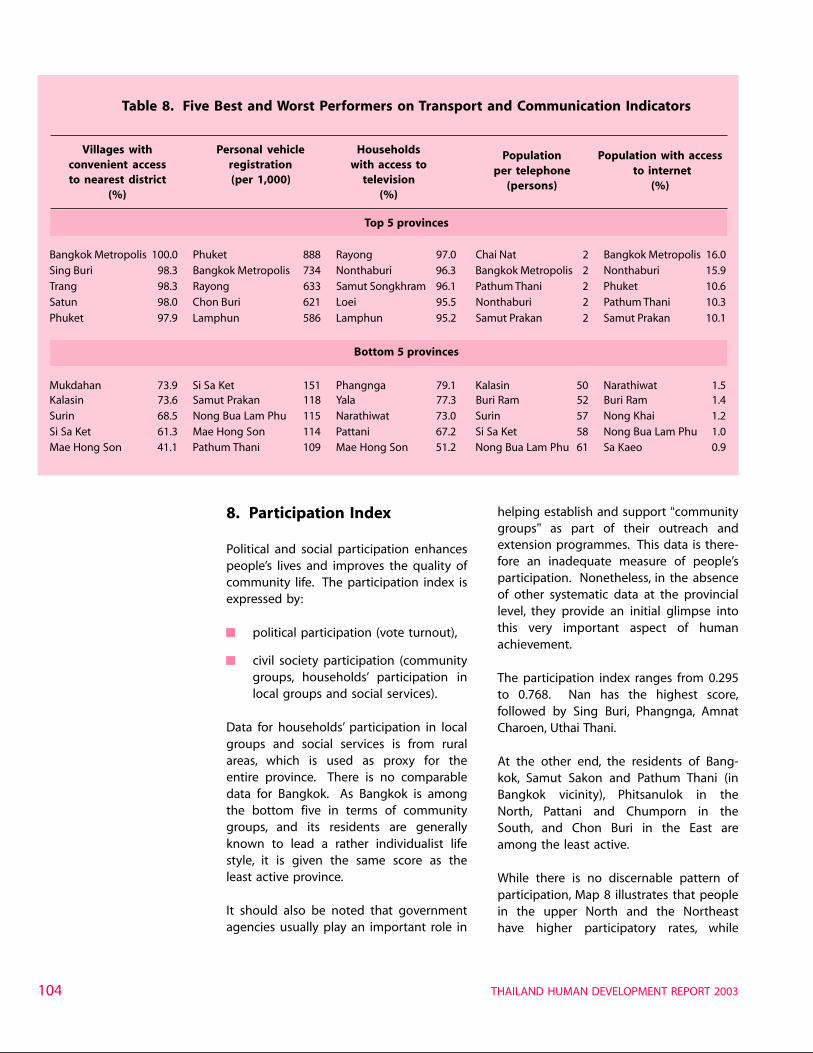
THAILAND HUMAN DEVELOPMENT REPORT 2003104
8. Participation Index
Political and social participation enhancespeople’s lives and improves the quality ofcommunity life. The participation index isexpressed by:
political participation (vote turnout),
civil society participation (communitygroups, households’ participation inlocal groups and social services).
Data for households’ participation in localgroups and social services is from ruralareas, which is used as proxy for theentire province. There is no comparabledata for Bangkok. As Bangkok is amongthe bottom five in terms of communitygroups, and its residents are generallyknown to lead a rather individualist lifestyle, it is given the same score as theleast active province.
It should also be noted that governmentagencies usually play an important role in
helping establish and support “communitygroups” as part of their outreach andextension programmes. This data is there-fore an inadequate measure of people’sparticipation. Nonetheless, in the absenceof other systematic data at the provinciallevel, they provide an initial glimpse intothis very important aspect of humanachievement.
The participation index ranges from 0.295to 0.768. Nan has the highest score,followed by Sing Buri, Phangnga, AmnatCharoen, Uthai Thani.
At the other end, the residents of Bang-kok, Samut Sakon and Pathum Thani (inBangkok vicinity), Phitsanulok in theNorth, Pattani and Chumporn in theSouth, and Chon Buri in the East areamong the least active.
While there is no discernable pattern ofparticipation, Map 8 illustrates that peoplein the upper North and the Northeasthave higher participatory rates, while
Table 8. Five Best and Worst Performers on Transport and Communication Indicators
Villages with Personal vehicle Households Population Population with accessconvenient access registration with access to per telephone to internetto nearest district (per 1,000) television (persons) (%)
(%) (%)
Top 5 provinces
Bangkok Metropolis 100.0 Phuket 888 Rayong 97.0 Chai Nat 2 Bangkok Metropolis 16.0Sing Buri 98.3 Bangkok Metropolis 734 Nonthaburi 96.3 Bangkok Metropolis 2 Nonthaburi 15.9Trang 98.3 Rayong 633 Samut Songkhram 96.1 Pathum Thani 2 Phuket 10.6Satun 98.0 Chon Buri 621 Loei 95.5 Nonthaburi 2 Pathum Thani 10.3
Phuket 97.9 Lamphun 586 Lamphun 95.2 Samut Prakan 2 Samut Prakan 10.1
Bottom 5 provinces
Mukdahan 73.9 Si Sa Ket 151 Phangnga 79.1 Kalasin 50 Narathiwat 1.5Kalasin 73.6 Samut Prakan 118 Yala 77.3 Buri Ram 52 Buri Ram 1.4Surin 68.5 Nong Bua Lam Phu 115 Narathiwat 73.0 Surin 57 Nong Khai 1.2Si Sa Ket 61.3 Mae Hong Son 114 Pattani 67.2 Si Sa Ket 58 Nong Bua Lam Phu 1.0Mae Hong Son 41.1 Pathum Thani 109 Mae Hong Son 51.2 Nong Bua Lam Phu 61 Sa Kaeo 0.9
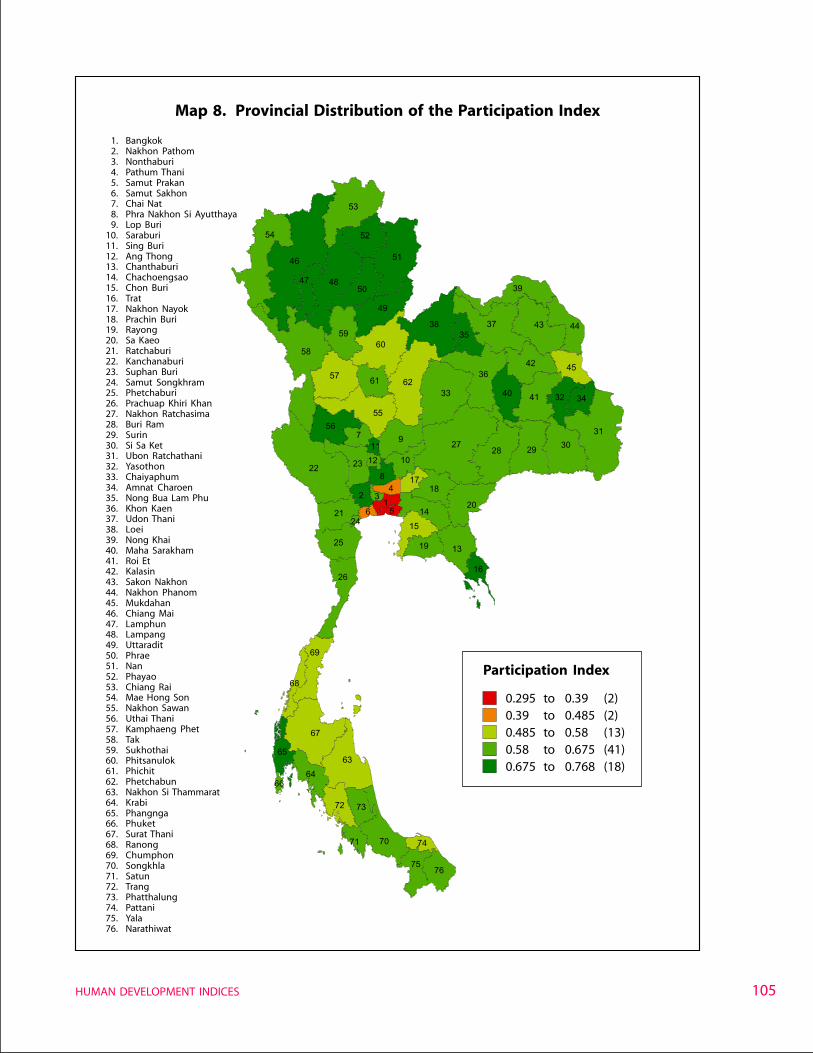
105HUMAN DEVELOPMENT INDICES
1. Bangkok2. Nakhon Pathom3. Nonthaburi4. Pathum Thani5. Samut Prakan6. Samut Sakhon7. Chai Nat8. Phra Nakhon Si Ayutthaya9. Lop Buri
10. Saraburi11. Sing Buri12. Ang Thong13. Chanthaburi14. Chachoengsao15. Chon Buri16. Trat17. Nakhon Nayok18. Prachin Buri19. Rayong20. Sa Kaeo21. Ratchaburi22. Kanchanaburi23. Suphan Buri24. Samut Songkhram25. Phetchaburi26. Prachuap Khiri Khan27. Nakhon Ratchasima28. Buri Ram29. Surin30. Si Sa Ket31. Ubon Ratchathani32. Yasothon33. Chaiyaphum34. Amnat Charoen35. Nong Bua Lam Phu36. Khon Kaen37. Udon Thani38. Loei39. Nong Khai40. Maha Sarakham41. Roi Et42. Kalasin43. Sakon Nakhon44. Nakhon Phanom45. Mukdahan46. Chiang Mai47. Lamphun48. Lampang49. Uttaradit50. Phrae51. Nan52. Phayao53. Chiang Rai54. Mae Hong Son55. Nakhon Sawan56. Uthai Thani57. Kamphaeng Phet58. Tak59. Sukhothai60. Phitsanulok61. Phichit62. Phetchabun63. Nakhon Si Thammarat64. Krabi65. Phangnga66. Phuket67. Surat Thani68. Ranong69. Chumphon70. Songkhla71. Satun72. Trang73. Phatthalung74. Pattani75. Yala76. Narathiwat
Map 8. Provincial Distribution of the Participation Index
Participation Index
0.295 to 0.39 (2)0.39 to 0.485 (2)0.485 to 0.58 (13)0.58 to 0.675 (41)0.675 to 0.768 (18)
75
70
63
56
22 812
4135
11
15
62
60
3241
31
4647
54
3538
55
16
28 29
69
65
26
50
36
58
53
39
64
4257
13
14
7
33
72
172
44
27
76
51
18
74
73
61
25
66
40
68
19
21
9
48
30
43
71
246
10
59
23
67
3749
52
45
20
34
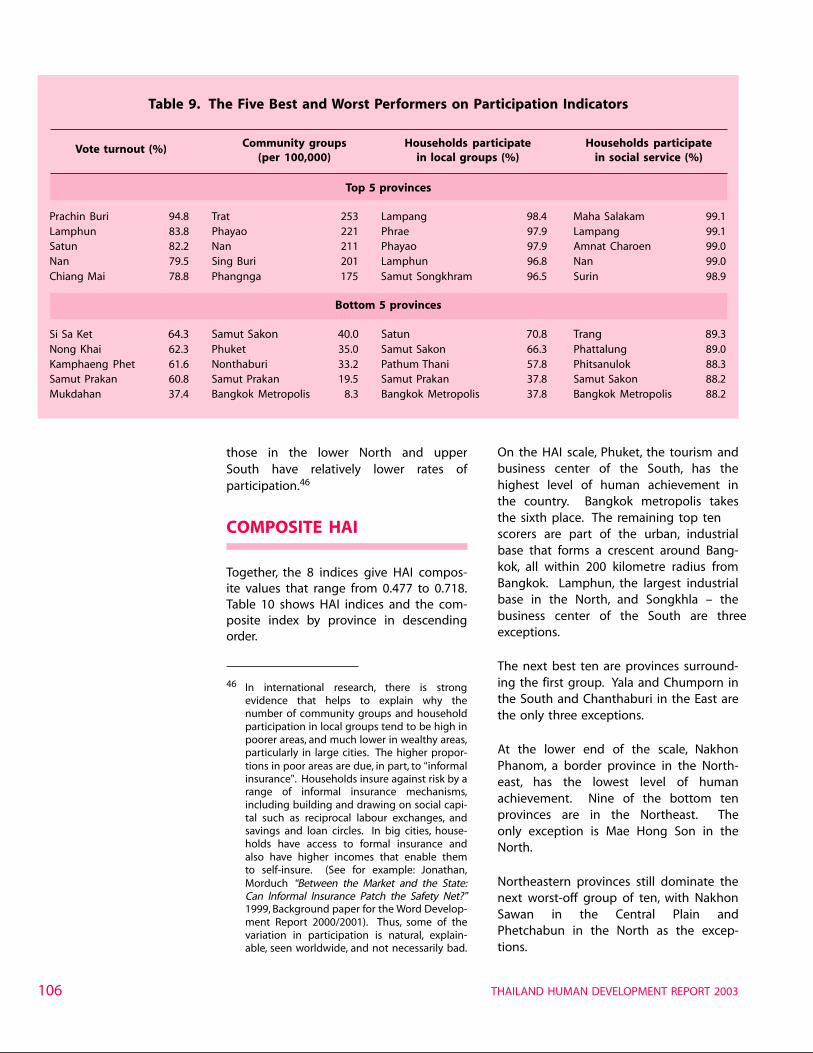
THAILAND HUMAN DEVELOPMENT REPORT 2003106
46 In international research, there is strongevidence that helps to explain why thenumber of community groups and householdparticipation in local groups tend to be high inpoorer areas, and much lower in wealthy areas,particularly in large cities. The higher propor-tions in poor areas are due, in part, to “informalinsurance”. Households insure against risk by arange of informal insurance mechanisms,including building and drawing on social capi-tal such as reciprocal labour exchanges, andsavings and loan circles. In big cities, house-holds have access to formal insurance andalso have higher incomes that enable themto self-insure. (See for example: Jonathan,Morduch “Between the Market and the State:Can Informal Insurance Patch the Safety Net?”1999, Background paper for the Word Develop-ment Report 2000/2001). Thus, some of thevariation in participation is natural, explain-able, seen worldwide, and not necessarily bad.
those in the lower North and upperSouth have relatively lower rates ofparticipation.46
COMPOSITE HAI
Together, the 8 indices give HAI compos-ite values that range from 0.477 to 0.718.Table 10 shows HAI indices and the com-posite index by province in descendingorder.
On the HAI scale, Phuket, the tourism andbusiness center of the South, has thehighest level of human achievement inthe country. Bangkok metropolis takesthe sixth place. The remaining top tenscorers are part of the urban, industrialbase that forms a crescent around Bang-kok, all within 200 kilometre radius fromBangkok. Lamphun, the largest industrialbase in the North, and Songkhla – thebusiness center of the South are threeexceptions.
The next best ten are provinces surround-ing the first group. Yala and Chumporn inthe South and Chanthaburi in the East arethe only three exceptions.
At the lower end of the scale, NakhonPhanom, a border province in the North-east, has the lowest level of humanachievement. Nine of the bottom tenprovinces are in the Northeast. Theonly exception is Mae Hong Son in theNorth.
Northeastern provinces still dominate thenext worst-off group of ten, with NakhonSawan in the Central Plain andPhetchabun in the North as the excep-tions.
Table 9. The Five Best and Worst Performers on Participation Indicators
Vote turnout (%) Community groups Households participate Households participate(per 100,000) in local groups (%) in social service (%)
Top 5 provinces
Prachin Buri 94.8 Trat 253 Lampang 98.4 Maha Salakam 99.1Lamphun 83.8 Phayao 221 Phrae 97.9 Lampang 99.1Satun 82.2 Nan 211 Phayao 97.9 Amnat Charoen 99.0Nan 79.5 Sing Buri 201 Lamphun 96.8 Nan 99.0Chiang Mai 78.8 Phangnga 175 Samut Songkhram 96.5 Surin 98.9
Bottom 5 provinces
Si Sa Ket 64.3 Samut Sakon 40.0 Satun 70.8 Trang 89.3Nong Khai 62.3 Phuket 35.0 Samut Sakon 66.3 Phattalung 89.0Kamphaeng Phet 61.6 Nonthaburi 33.2 Pathum Thani 57.8 Phitsanulok 88.3Samut Prakan 60.8 Samut Prakan 19.5 Samut Prakan 37.8 Samut Sakon 88.2Mukdahan 37.4 Bangkok Metropolis 8.3 Bangkok Metropolis 37.8 Bangkok Metropolis 88.2
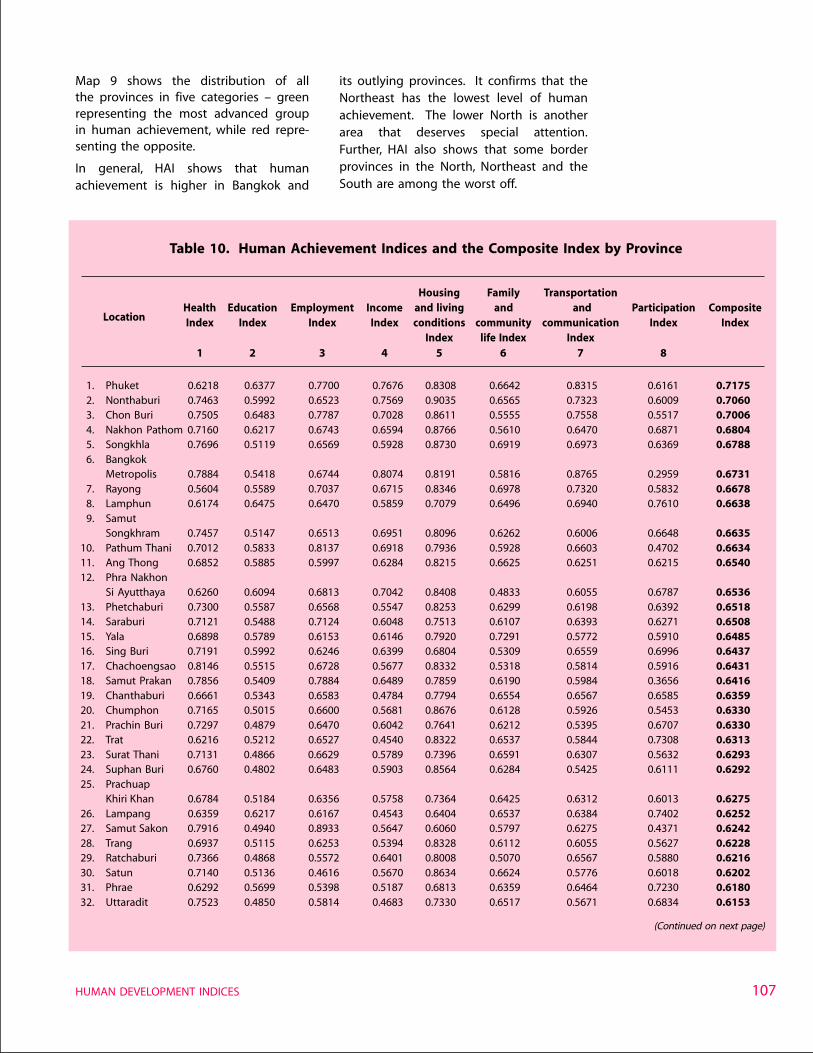
107
Map 9 shows the distribution of allthe provinces in five categories – greenrepresenting the most advanced groupin human achievement, while red repre-senting the opposite.
In general, HAI shows that humanachievement is higher in Bangkok and
its outlying provinces. It confirms that theNortheast has the lowest level of humanachievement. The lower North is anotherarea that deserves special attention.Further, HAI also shows that some borderprovinces in the North, Northeast and theSouth are among the worst off.
Table 10. Human Achievement Indices and the Composite Index by Province
Housing Family TransportationHealth Education Employment Income and living and and Participation Composite
Location Index Index Index Index conditions community communication Index IndexIndex life Index Index
1 2 3 4 5 6 7 8
1. Phuket 0.6218 0.6377 0.7700 0.7676 0.8308 0.6642 0.8315 0.6161 0.71752. Nonthaburi 0.7463 0.5992 0.6523 0.7569 0.9035 0.6565 0.7323 0.6009 0.70603. Chon Buri 0.7505 0.6483 0.7787 0.7028 0.8611 0.5555 0.7558 0.5517 0.70064. Nakhon Pathom 0.7160 0.6217 0.6743 0.6594 0.8766 0.5610 0.6470 0.6871 0.68045. Songkhla 0.7696 0.5119 0.6569 0.5928 0.8730 0.6919 0.6973 0.6369 0.67886. Bangkok
Metropolis 0.7884 0.5418 0.6744 0.8074 0.8191 0.5816 0.8765 0.2959 0.67317. Rayong 0.5604 0.5589 0.7037 0.6715 0.8346 0.6978 0.7320 0.5832 0.66788. Lamphun 0.6174 0.6475 0.6470 0.5859 0.7079 0.6496 0.6940 0.7610 0.66389. Samut
Songkhram 0.7457 0.5147 0.6513 0.6951 0.8096 0.6262 0.6006 0.6648 0.663510. Pathum Thani 0.7012 0.5833 0.8137 0.6918 0.7936 0.5928 0.6603 0.4702 0.663411. Ang Thong 0.6852 0.5885 0.5997 0.6284 0.8215 0.6625 0.6251 0.6215 0.654012. Phra Nakhon
Si Ayutthaya 0.6260 0.6094 0.6813 0.7042 0.8408 0.4833 0.6055 0.6787 0.653613. Phetchaburi 0.7300 0.5587 0.6568 0.5547 0.8253 0.6299 0.6198 0.6392 0.651814. Saraburi 0.7121 0.5488 0.7124 0.6048 0.7513 0.6107 0.6393 0.6271 0.650815. Yala 0.6898 0.5789 0.6153 0.6146 0.7920 0.7291 0.5772 0.5910 0.648516. Sing Buri 0.7191 0.5992 0.6246 0.6399 0.6804 0.5309 0.6559 0.6996 0.643717. Chachoengsao 0.8146 0.5515 0.6728 0.5677 0.8332 0.5318 0.5814 0.5916 0.643118. Samut Prakan 0.7856 0.5409 0.7884 0.6489 0.7859 0.6190 0.5984 0.3656 0.641619. Chanthaburi 0.6661 0.5343 0.6583 0.4784 0.7794 0.6554 0.6567 0.6585 0.635920. Chumphon 0.7165 0.5015 0.6600 0.5681 0.8676 0.6128 0.5926 0.5453 0.633021. Prachin Buri 0.7297 0.4879 0.6470 0.6042 0.7641 0.6212 0.5395 0.6707 0.633022. Trat 0.6216 0.5212 0.6527 0.4540 0.8322 0.6537 0.5844 0.7308 0.631323. Surat Thani 0.7131 0.4866 0.6629 0.5789 0.7396 0.6591 0.6307 0.5632 0.629324. Suphan Buri 0.6760 0.4802 0.6483 0.5903 0.8564 0.6284 0.5425 0.6111 0.629225. Prachuap
Khiri Khan 0.6784 0.5184 0.6356 0.5758 0.7364 0.6425 0.6312 0.6013 0.627526. Lampang 0.6359 0.6217 0.6167 0.4543 0.6404 0.6537 0.6384 0.7402 0.625227. Samut Sakon 0.7916 0.4940 0.8933 0.5647 0.6060 0.5797 0.6275 0.4371 0.624228. Trang 0.6937 0.5115 0.6253 0.5394 0.8328 0.6112 0.6055 0.5627 0.622829. Ratchaburi 0.7366 0.4868 0.5572 0.6401 0.8008 0.5070 0.6567 0.5880 0.621630. Satun 0.7140 0.5136 0.4616 0.5670 0.8634 0.6624 0.5776 0.6018 0.620231. Phrae 0.6292 0.5699 0.5398 0.5187 0.6813 0.6359 0.6464 0.7230 0.618032. Uttaradit 0.7523 0.4850 0.5814 0.4683 0.7330 0.6517 0.5671 0.6834 0.6153
(Continued on next page)
HUMAN DEVELOPMENT INDICES
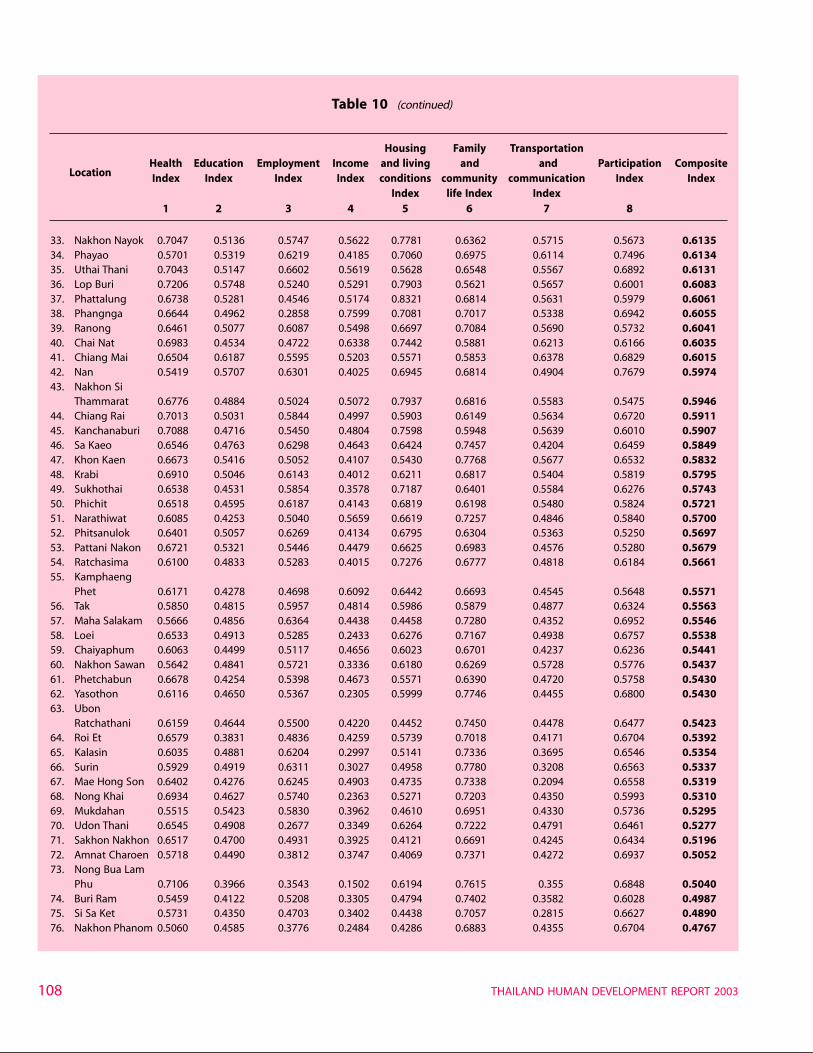
THAILAND HUMAN DEVELOPMENT REPORT 2003108
Table 10 (continued)
Housing Family TransportationHealth Education Employment Income and living and and Participation Composite
Location Index Index Index Index conditions community communication Index IndexIndex life Index Index
1 2 3 4 5 6 7 8
33. Nakhon Nayok 0.7047 0.5136 0.5747 0.5622 0.7781 0.6362 0.5715 0.5673 0.613534. Phayao 0.5701 0.5319 0.6219 0.4185 0.7060 0.6975 0.6114 0.7496 0.613435. Uthai Thani 0.7043 0.5147 0.6602 0.5619 0.5628 0.6548 0.5567 0.6892 0.613136. Lop Buri 0.7206 0.5748 0.5240 0.5291 0.7903 0.5621 0.5657 0.6001 0.608337. Phattalung 0.6738 0.5281 0.4546 0.5174 0.8321 0.6814 0.5631 0.5979 0.606138. Phangnga 0.6644 0.4962 0.2858 0.7599 0.7081 0.7017 0.5338 0.6942 0.605539. Ranong 0.6461 0.5077 0.6087 0.5498 0.6697 0.7084 0.5690 0.5732 0.604140. Chai Nat 0.6983 0.4534 0.4722 0.6338 0.7442 0.5881 0.6213 0.6166 0.603541. Chiang Mai 0.6504 0.6187 0.5595 0.5203 0.5571 0.5853 0.6378 0.6829 0.601542. Nan 0.5419 0.5707 0.6301 0.4025 0.6945 0.6814 0.4904 0.7679 0.597443. Nakhon Si
Thammarat 0.6776 0.4884 0.5024 0.5072 0.7937 0.6816 0.5583 0.5475 0.594644. Chiang Rai 0.7013 0.5031 0.5844 0.4997 0.5903 0.6149 0.5634 0.6720 0.591145. Kanchanaburi 0.7088 0.4716 0.5450 0.4804 0.7598 0.5948 0.5639 0.6010 0.590746. Sa Kaeo 0.6546 0.4763 0.6298 0.4643 0.6424 0.7457 0.4204 0.6459 0.584947. Khon Kaen 0.6673 0.5416 0.5052 0.4107 0.5430 0.7768 0.5677 0.6532 0.583248. Krabi 0.6910 0.5046 0.6143 0.4012 0.6211 0.6817 0.5404 0.5819 0.579549. Sukhothai 0.6538 0.4531 0.5854 0.3578 0.7187 0.6401 0.5584 0.6276 0.574350. Phichit 0.6518 0.4595 0.6187 0.4143 0.6819 0.6198 0.5480 0.5824 0.572151. Narathiwat 0.6085 0.4253 0.5040 0.5659 0.6619 0.7257 0.4846 0.5840 0.570052. Phitsanulok 0.6401 0.5057 0.6269 0.4134 0.6795 0.6304 0.5363 0.5250 0.569753. Pattani Nakon 0.6721 0.5321 0.5446 0.4479 0.6625 0.6983 0.4576 0.5280 0.567954. Ratchasima 0.6100 0.4833 0.5283 0.4015 0.7276 0.6777 0.4818 0.6184 0.566155. Kamphaeng
Phet 0.6171 0.4278 0.4698 0.6092 0.6442 0.6693 0.4545 0.5648 0.557156. Tak 0.5850 0.4815 0.5957 0.4814 0.5986 0.5879 0.4877 0.6324 0.556357. Maha Salakam 0.5666 0.4856 0.6364 0.4438 0.4458 0.7280 0.4352 0.6952 0.554658. Loei 0.6533 0.4913 0.5285 0.2433 0.6276 0.7167 0.4938 0.6757 0.553859. Chaiyaphum 0.6063 0.4499 0.5117 0.4656 0.6023 0.6701 0.4237 0.6236 0.544160. Nakhon Sawan 0.5642 0.4841 0.5721 0.3336 0.6180 0.6269 0.5728 0.5776 0.543761. Phetchabun 0.6678 0.4254 0.5398 0.4673 0.5571 0.6390 0.4720 0.5758 0.543062. Yasothon 0.6116 0.4650 0.5367 0.2305 0.5999 0.7746 0.4455 0.6800 0.543063. Ubon
Ratchathani 0.6159 0.4644 0.5500 0.4220 0.4452 0.7450 0.4478 0.6477 0.542364. Roi Et 0.6579 0.3831 0.4836 0.4259 0.5739 0.7018 0.4171 0.6704 0.539265. Kalasin 0.6035 0.4881 0.6204 0.2997 0.5141 0.7336 0.3695 0.6546 0.535466. Surin 0.5929 0.4919 0.6311 0.3027 0.4958 0.7780 0.3208 0.6563 0.533767. Mae Hong Son 0.6402 0.4276 0.6245 0.4903 0.4735 0.7338 0.2094 0.6558 0.531968. Nong Khai 0.6934 0.4627 0.5740 0.2363 0.5271 0.7203 0.4350 0.5993 0.531069. Mukdahan 0.5515 0.5423 0.5830 0.3962 0.4610 0.6951 0.4330 0.5736 0.529570. Udon Thani 0.6545 0.4908 0.2677 0.3349 0.6264 0.7222 0.4791 0.6461 0.527771. Sakhon Nakhon 0.6517 0.4700 0.4931 0.3925 0.4121 0.6691 0.4245 0.6434 0.519672. Amnat Charoen 0.5718 0.4490 0.3812 0.3747 0.4069 0.7371 0.4272 0.6937 0.505273. Nong Bua Lam
Phu 0.7106 0.3966 0.3543 0.1502 0.6194 0.7615 0.355 0.6848 0.504074. Buri Ram 0.5459 0.4122 0.5208 0.3305 0.4794 0.7402 0.3582 0.6028 0.498775. Si Sa Ket 0.5731 0.4350 0.4703 0.3402 0.4438 0.7057 0.2815 0.6627 0.489076. Nakhon Phanom 0.5060 0.4585 0.3776 0.2484 0.4286 0.6883 0.4355 0.6704 0.4767
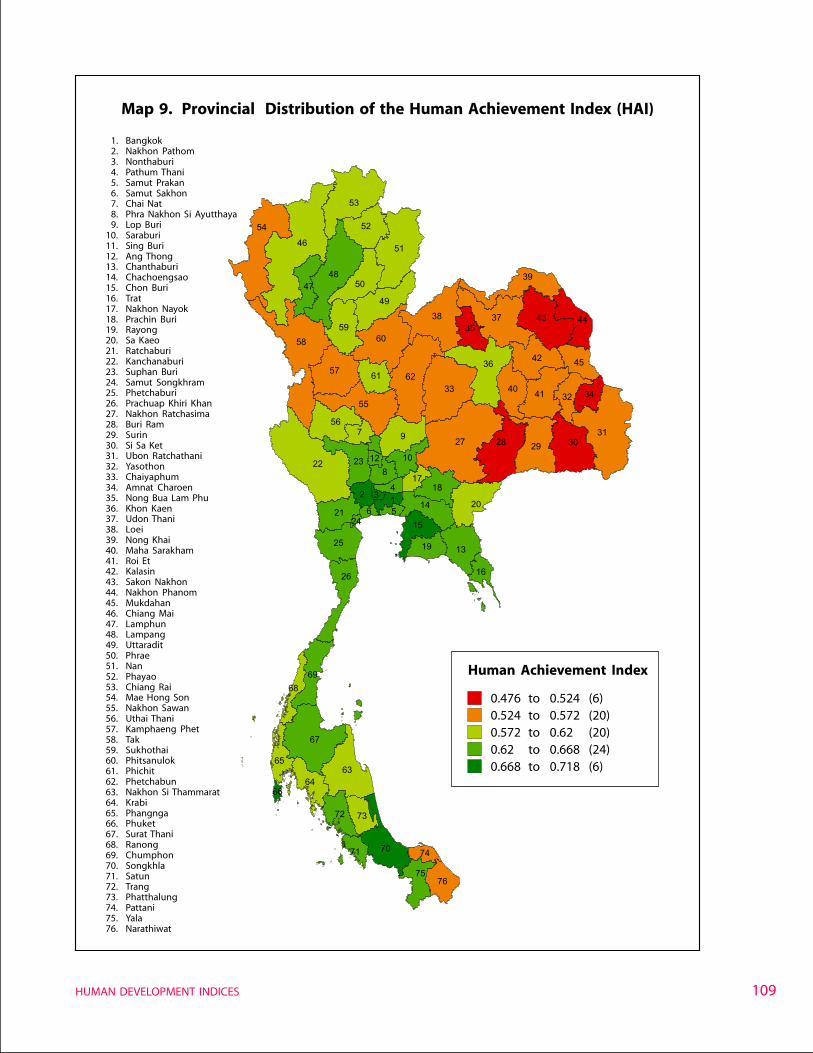
109
1. Bangkok2. Nakhon Pathom3. Nonthaburi4. Pathum Thani5. Samut Prakan6. Samut Sakhon7. Chai Nat8. Phra Nakhon Si Ayutthaya9. Lop Buri
10. Saraburi11. Sing Buri12. Ang Thong13. Chanthaburi14. Chachoengsao15. Chon Buri16. Trat17. Nakhon Nayok18. Prachin Buri19. Rayong20. Sa Kaeo21. Ratchaburi22. Kanchanaburi23. Suphan Buri24. Samut Songkhram25. Phetchaburi26. Prachuap Khiri Khan27. Nakhon Ratchasima28. Buri Ram29. Surin30. Si Sa Ket31. Ubon Ratchathani32. Yasothon33. Chaiyaphum34. Amnat Charoen35. Nong Bua Lam Phu36. Khon Kaen37. Udon Thani38. Loei39. Nong Khai40. Maha Sarakham41. Roi Et42. Kalasin43. Sakon Nakhon44. Nakhon Phanom45. Mukdahan46. Chiang Mai47. Lamphun48. Lampang49. Uttaradit50. Phrae51. Nan52. Phayao53. Chiang Rai54. Mae Hong Son55. Nakhon Sawan56. Uthai Thani57. Kamphaeng Phet58. Tak59. Sukhothai60. Phitsanulok61. Phichit62. Phetchabun63. Nakhon Si Thammarat64. Krabi65. Phangnga66. Phuket67. Surat Thani68. Ranong69. Chumphon70. Songkhla71. Satun72. Trang73. Phatthalung74. Pattani75. Yala76. Narathiwat
Map 9. Provincial Distribution of the Human Achievement Index (HAI)
Human Achievement Index
0.476 to 0.524 (6)0.524 to 0.572 (20)0.572 to 0.62 (20)0.62 to 0.668 (24)0.668 to 0.718 (6)
39
43
3241
35
36
51514
22
65
75
70
26
63
143
812
16
58
55
29
62
50
38
5446
64
4257
13
7
33
69
53
72
172
44
27
76
51
28
18
74
73
61
60
25
66
40
68
19
21
9
4847
30
71
246
10
59
23
67
3749
5631
52
45
20
34
HUMAN DEVELOPMENT INDICES
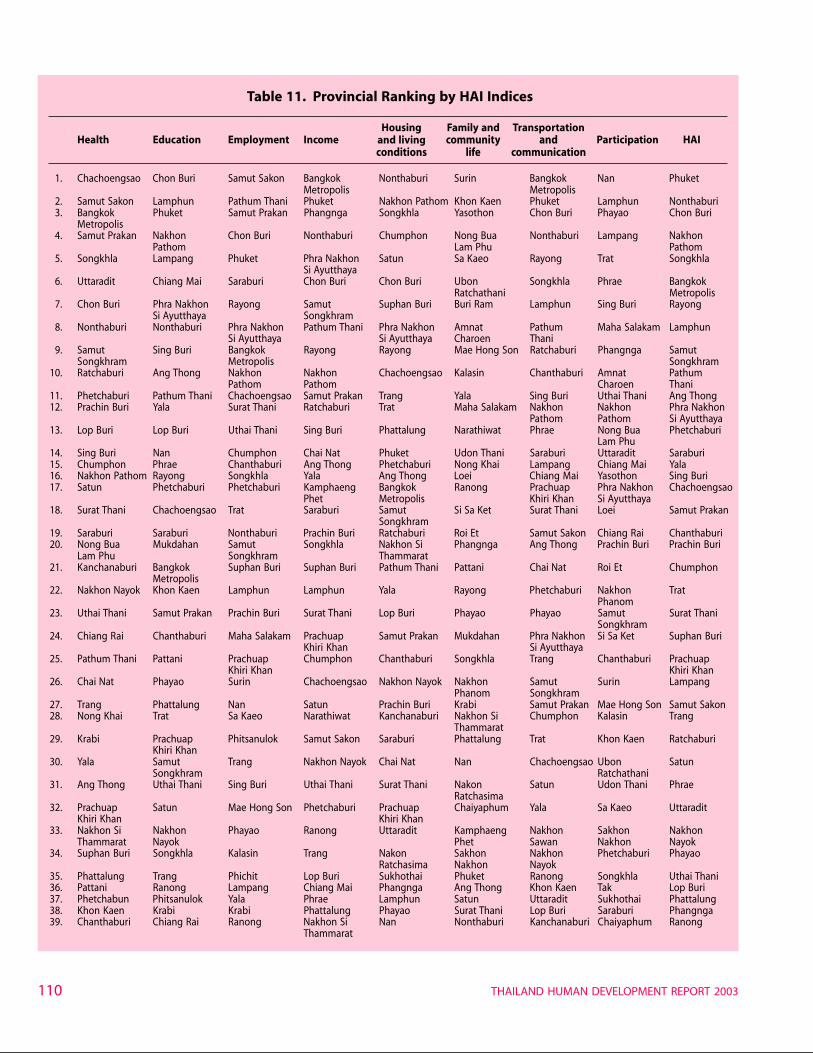
THAILAND HUMAN DEVELOPMENT REPORT 2003110
Table 11. Provincial Ranking by HAI Indices
Health Education Employment IncomeHousing Family and Transportation
Participation HAIand living community andconditions life communication
1. Chachoengsao Chon Buri Samut Sakon Bangkok Nonthaburi Surin Bangkok Nan PhuketMetropolis Metropolis
2. Samut Sakon Lamphun Pathum Thani Phuket Nakhon Pathom Khon Kaen Phuket Lamphun Nonthaburi3. Bangkok Phuket Samut Prakan Phangnga Songkhla Yasothon Chon Buri Phayao Chon Buri
Metropolis4. Samut Prakan Nakhon Chon Buri Nonthaburi Chumphon Nong Bua Nonthaburi Lampang Nakhon
Pathom Lam Phu Pathom5. Songkhla Lampang Phuket Phra Nakhon Satun Sa Kaeo Rayong Trat Songkhla
Si Ayutthaya6. Uttaradit Chiang Mai Saraburi Chon Buri Chon Buri Ubon Songkhla Phrae Bangkok
Ratchathani Metropolis7. Chon Buri Phra Nakhon Rayong Samut Suphan Buri Buri Ram Lamphun Sing Buri Rayong
Si Ayutthaya Songkhram8. Nonthaburi Nonthaburi Phra Nakhon Pathum Thani Phra Nakhon Amnat Pathum Maha Salakam Lamphun
Si Ayutthaya Si Ayutthaya Charoen Thani9. Samut Sing Buri Bangkok Rayong Rayong Mae Hong Son Ratchaburi Phangnga Samut
Songkhram Metropolis Songkhram10. Ratchaburi Ang Thong Nakhon Nakhon Chachoengsao Kalasin Chanthaburi Amnat Pathum
Pathom Pathom Charoen Thani11. Phetchaburi Pathum Thani Chachoengsao Samut Prakan Trang Yala Sing Buri Uthai Thani Ang Thong12. Prachin Buri Yala Surat Thani Ratchaburi Trat Maha Salakam Nakhon Nakhon Phra Nakhon
Pathom Pathom Si Ayutthaya13. Lop Buri Lop Buri Uthai Thani Sing Buri Phattalung Narathiwat Phrae Nong Bua Phetchaburi
Lam Phu14. Sing Buri Nan Chumphon Chai Nat Phuket Udon Thani Saraburi Uttaradit Saraburi15. Chumphon Phrae Chanthaburi Ang Thong Phetchaburi Nong Khai Lampang Chiang Mai Yala16. Nakhon Pathom Rayong Songkhla Yala Ang Thong Loei Chiang Mai Yasothon Sing Buri17. Satun Phetchaburi Phetchaburi Kamphaeng Bangkok Ranong Prachuap Phra Nakhon Chachoengsao
Phet Metropolis Khiri Khan Si Ayutthaya18. Surat Thani Chachoengsao Trat Saraburi Samut Si Sa Ket Surat Thani Loei Samut Prakan
Songkhram19. Saraburi Saraburi Nonthaburi Prachin Buri Ratchaburi Roi Et Samut Sakon Chiang Rai Chanthaburi20. Nong Bua Mukdahan Samut Songkhla Nakhon Si Phangnga Ang Thong Prachin Buri Prachin Buri
Lam Phu Songkhram Thammarat21. Kanchanaburi Bangkok Suphan Buri Suphan Buri Pathum Thani Pattani Chai Nat Roi Et Chumphon
Metropolis22. Nakhon Nayok Khon Kaen Lamphun Lamphun Yala Rayong Phetchaburi Nakhon Trat
Phanom23. Uthai Thani Samut Prakan Prachin Buri Surat Thani Lop Buri Phayao Phayao Samut Surat Thani
Songkhram24. Chiang Rai Chanthaburi Maha Salakam Prachuap Samut Prakan Mukdahan Phra Nakhon Si Sa Ket Suphan Buri
Khiri Khan Si Ayutthaya25. Pathum Thani Pattani Prachuap Chumphon Chanthaburi Songkhla Trang Chanthaburi Prachuap
Khiri Khan Khiri Khan26. Chai Nat Phayao Surin Chachoengsao Nakhon Nayok Nakhon Samut Surin Lampang
Phanom Songkhram27. Trang Phattalung Nan Satun Prachin Buri Krabi Samut Prakan Mae Hong Son Samut Sakon28. Nong Khai Trat Sa Kaeo Narathiwat Kanchanaburi Nakhon Si Chumphon Kalasin Trang
Thammarat29. Krabi Prachuap Phitsanulok Samut Sakon Saraburi Phattalung Trat Khon Kaen Ratchaburi
Khiri Khan30. Yala Samut Trang Nakhon Nayok Chai Nat Nan Chachoengsao Ubon Satun
Songkhram Ratchathani31. Ang Thong Uthai Thani Sing Buri Uthai Thani Surat Thani Nakon Satun Udon Thani Phrae
Ratchasima32. Prachuap Satun Mae Hong Son Phetchaburi Prachuap Chaiyaphum Yala Sa Kaeo Uttaradit
Khiri Khan Khiri Khan33. Nakhon Si Nakhon Phayao Ranong Uttaradit Kamphaeng Nakhon Sakhon Nakhon
Thammarat Nayok Phet Sawan Nakhon Nayok34. Suphan Buri Songkhla Kalasin Trang Nakon Sakhon Nakhon Phetchaburi Phayao
Ratchasima Nakhon Nayok35. Phattalung Trang Phichit Lop Buri Sukhothai Phuket Ranong Songkhla Uthai Thani36. Pattani Ranong Lampang Chiang Mai Phangnga Ang Thong Khon Kaen Tak Lop Buri37. Phetchabun Phitsanulok Yala Phrae Lamphun Satun Uttaradit Sukhothai Phattalung38. Khon Kaen Krabi Krabi Phattalung Phayao Surat Thani Lop Buri Saraburi Phangnga39. Chanthaburi Chiang Rai Ranong Nakhon Si Nan Nonthaburi Kanchanaburi Chaiyaphum Ranong
Thammarat
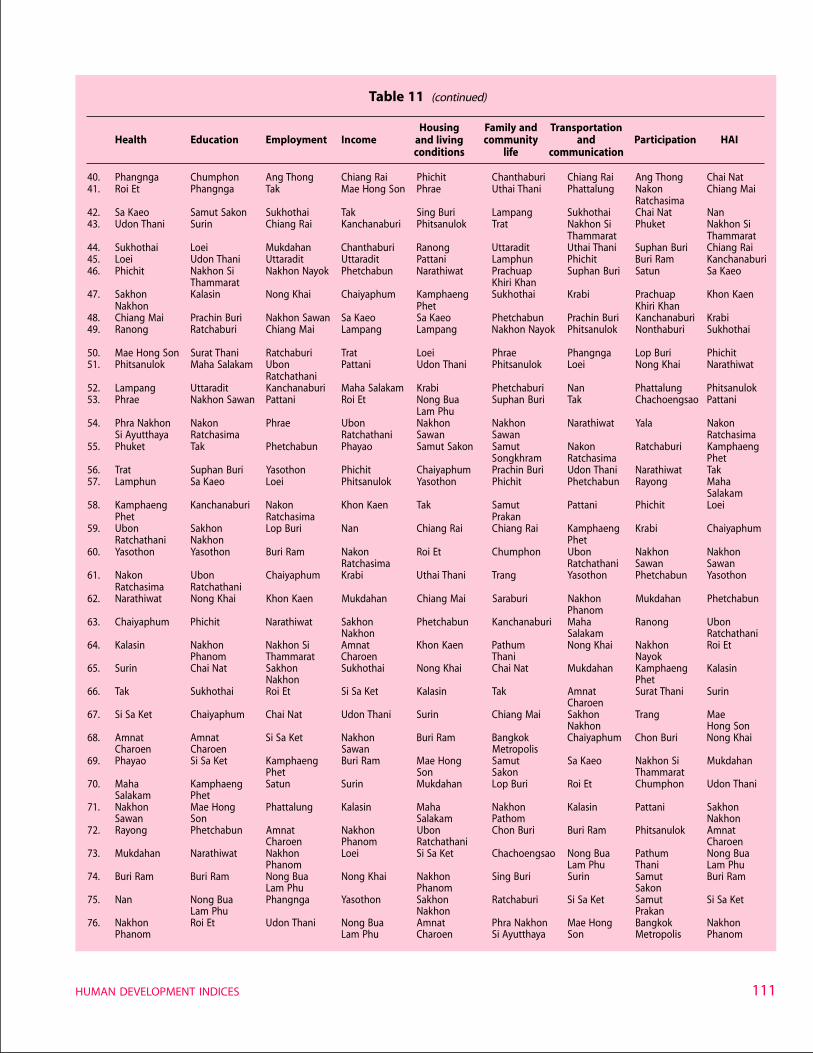
111HUMAN DEVELOPMENT INDICES
Table 11 (continued)
Health Education Employment IncomeHousing Family and Transportation
Participation HAIand living community andconditions life communication
40. Phangnga Chumphon Ang Thong Chiang Rai Phichit Chanthaburi Chiang Rai Ang Thong Chai Nat41. Roi Et Phangnga Tak Mae Hong Son Phrae Uthai Thani Phattalung Nakon Chiang Mai
Ratchasima42. Sa Kaeo Samut Sakon Sukhothai Tak Sing Buri Lampang Sukhothai Chai Nat Nan43. Udon Thani Surin Chiang Rai Kanchanaburi Phitsanulok Trat Nakhon Si Phuket Nakhon Si
Thammarat Thammarat44. Sukhothai Loei Mukdahan Chanthaburi Ranong Uttaradit Uthai Thani Suphan Buri Chiang Rai45. Loei Udon Thani Uttaradit Uttaradit Pattani Lamphun Phichit Buri Ram Kanchanaburi46. Phichit Nakhon Si Nakhon Nayok Phetchabun Narathiwat Prachuap Suphan Buri Satun Sa Kaeo
Thammarat Khiri Khan47. Sakhon Kalasin Nong Khai Chaiyaphum Kamphaeng Sukhothai Krabi Prachuap Khon Kaen
Nakhon Phet Khiri Khan48. Chiang Mai Prachin Buri Nakhon Sawan Sa Kaeo Sa Kaeo Phetchabun Prachin Buri Kanchanaburi Krabi49. Ranong Ratchaburi Chiang Mai Lampang Lampang Nakhon Nayok Phitsanulok Nonthaburi Sukhothai
50. Mae Hong Son Surat Thani Ratchaburi Trat Loei Phrae Phangnga Lop Buri Phichit51. Phitsanulok Maha Salakam Ubon Pattani Udon Thani Phitsanulok Loei Nong Khai Narathiwat
Ratchathani52. Lampang Uttaradit Kanchanaburi Maha Salakam Krabi Phetchaburi Nan Phattalung Phitsanulok53. Phrae Nakhon Sawan Pattani Roi Et Nong Bua Suphan Buri Tak Chachoengsao Pattani
Lam Phu54. Phra Nakhon Nakon Phrae Ubon Nakhon Nakhon Narathiwat Yala Nakon
Si Ayutthaya Ratchasima Ratchathani Sawan Sawan Ratchasima55. Phuket Tak Phetchabun Phayao Samut Sakon Samut Nakon Ratchaburi Kamphaeng
Songkhram Ratchasima Phet56. Trat Suphan Buri Yasothon Phichit Chaiyaphum Prachin Buri Udon Thani Narathiwat Tak57. Lamphun Sa Kaeo Loei Phitsanulok Yasothon Phichit Phetchabun Rayong Maha
Salakam58. Kamphaeng Kanchanaburi Nakon Khon Kaen Tak Samut Pattani Phichit Loei
Phet Ratchasima Prakan59. Ubon Sakhon Lop Buri Nan Chiang Rai Chiang Rai Kamphaeng Krabi Chaiyaphum
Ratchathani Nakhon Phet60. Yasothon Yasothon Buri Ram Nakon Roi Et Chumphon Ubon Nakhon Nakhon
Ratchasima Ratchathani Sawan Sawan61. Nakon Ubon Chaiyaphum Krabi Uthai Thani Trang Yasothon Phetchabun Yasothon
Ratchasima Ratchathani62. Narathiwat Nong Khai Khon Kaen Mukdahan Chiang Mai Saraburi Nakhon Mukdahan Phetchabun
Phanom63. Chaiyaphum Phichit Narathiwat Sakhon Phetchabun Kanchanaburi Maha Ranong Ubon
Nakhon Salakam Ratchathani64. Kalasin Nakhon Nakhon Si Amnat Khon Kaen Pathum Nong Khai Nakhon Roi Et
Phanom Thammarat Charoen Thani Nayok65. Surin Chai Nat Sakhon Sukhothai Nong Khai Chai Nat Mukdahan Kamphaeng Kalasin
Nakhon Phet66. Tak Sukhothai Roi Et Si Sa Ket Kalasin Tak Amnat Surat Thani Surin
Charoen67. Si Sa Ket Chaiyaphum Chai Nat Udon Thani Surin Chiang Mai Sakhon Trang Mae
Nakhon Hong Son68. Amnat Amnat Si Sa Ket Nakhon Buri Ram Bangkok Chaiyaphum Chon Buri Nong Khai
Charoen Charoen Sawan Metropolis69. Phayao Si Sa Ket Kamphaeng Buri Ram Mae Hong Samut Sa Kaeo Nakhon Si Mukdahan
Phet Son Sakon Thammarat70. Maha Kamphaeng Satun Surin Mukdahan Lop Buri Roi Et Chumphon Udon Thani
Salakam Phet71. Nakhon Mae Hong Phattalung Kalasin Maha Nakhon Kalasin Pattani Sakhon
Sawan Son Salakam Pathom Nakhon72. Rayong Phetchabun Amnat Nakhon Ubon Chon Buri Buri Ram Phitsanulok Amnat
Charoen Phanom Ratchathani Charoen73. Mukdahan Narathiwat Nakhon Loei Si Sa Ket Chachoengsao Nong Bua Pathum Nong Bua
Phanom Lam Phu Thani Lam Phu74. Buri Ram Buri Ram Nong Bua Nong Khai Nakhon Sing Buri Surin Samut Buri Ram
Lam Phu Phanom Sakon75. Nan Nong Bua Phangnga Yasothon Sakhon Ratchaburi Si Sa Ket Samut Si Sa Ket
Lam Phu Nakhon Prakan76. Nakhon Roi Et Udon Thani Nong Bua Amnat Phra Nakhon Mae Hong Bangkok Nakhon
Phanom Lam Phu Charoen Si Ayutthaya Son Metropolis Phanom
THAILAND HUMAN DEVELOPMENT REPORT 2003112
HUMAN DEVELOPMENTINDEX (HDI)
While HAI is locally developed for assess-ing progress in human development inThailand, HDI is UNDP’s key human deve-lopment index and has been used andrecognized worldwide to compare humandevelopment progress among countriessince 1990. It has also been used at sub-national level in many countries. In thefollowing section, this Report will attemptto use HDI to capture human develop-ment situations at the provincial level inThailand.
HDI is based on three indicators: (i) lengthof life, as measured by life expectancyat birth, (ii) educational attainment, asmeasured by the adult literacy rate47 andthe combined gross primary, secondaryand tertiary enrolment ratio;48 and (iii)standard of living, as measured by GDPper capita (US$ PPP).49
Table 12 presents HDI scores and ranks byprovince. Rayong – the center of theEastern Seaboard has the highest HDIscore. Rayong’s GPP per capita almostdoubles that of Chon Buri. Phuket fallsslightly from 1st rank on HAI to 5th placeon the HDI. Similar pattern is notedfor several industrial cities, e.g., NakornPathom, Songkhla, Samut Songkhram,Lamphun, Ang Thong, and some touristcities, e.g., Phetchaburi, Nakorn Nayok,Chiang Mai, Chiang Rai, and Phuket. Onepossible explanation is that the use of
47 Adult literacy rate for population aged 14 to50 from BMN data in 2000. BMN data coversonly rural areas. Bangkok Metropolis literacyrate data is therefore not available. In thiscalculation, Bangkok vicinity literacy rate isused as proxy for Bangkok Metropolis literacyrate.
48 In this calculation, tertiary enrolment isdropped as most students enrol in univer-sities/colleges in large cities, and someprovinces do not have any tertiary institution.
49 This calculation uses gross provincial product(GPP) per capita and does not convert itto US$PPP as it is for the purpose of intra-country, not inter-country comparison.
GPP, which records income from businessestablishments by their place of registra-tion, not their physical location, could pro-duce such result in cases that a numberof the larger factories and hotels havetheir headquarters or business units regis-tered in Bangkok. There are, however,several other factors at work that accountfor the gaps between HAI and HDI thatcannot be categorically explained.
On the contrary, some provinces performconsiderably better on HDI than HAI.Three southern most provinces, for exam-ple, constitute a case of large discrepancy.When comparing HAI with HDI, Satunmoves from 30th to 14th place, Narathiwatfrom 51st to 25th, and Pattani from 53rd to19th. No single explanation can accountfor this. The difference is a result of acombination of factors, largely due to theuse of different indices and indicators.
This highlights the fact that decisionsregarding the structure of compositeindex, the selection of relevant indicesand indicators are most crucial; theyshould mirror both the subjective normsand objective standards of human deve-lopment of the society.
GENDER-RELATEDDEVELOPMENT INDEX (GDI)
GDI measures progress in human deve-lopment using the same variables as theHDI, but takes account of inequality inachievement between women and men.In this Report, GDI is based on the avail-able gender disaggregated data, namelylife expectancy, combined primary, sec-ondary enrolment ratio,50 and GPP percapita.
GDI represents the HDI adjusted forgender inequality. GDI gives some indica-tion of how basic human capabilities aredistributed between women and men. IfGDI equals HDI, it means that there is nogender bias between women and men.The greater the gender disparity inhuman development, the lower the GDI is
50 No gender disaggregated data for adultliteracy rate.
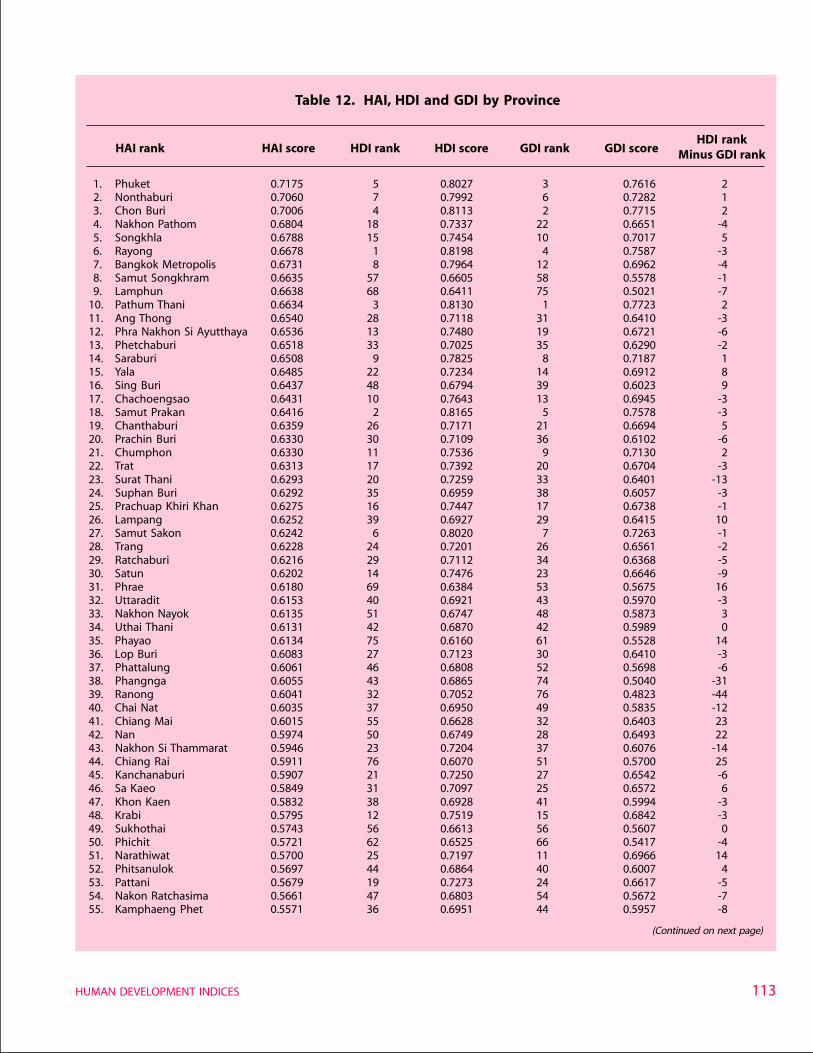
113
Table 12. HAI, HDI and GDI by Province
HDI rank HAI rank HAI score HDI rank HDI score GDI rank GDI score Minus GDI rank
1. Phuket 0.7175 5 0.8027 3 0.7616 22. Nonthaburi 0.7060 7 0.7992 6 0.7282 13. Chon Buri 0.7006 4 0.8113 2 0.7715 24. Nakhon Pathom 0.6804 18 0.7337 22 0.6651 -45. Songkhla 0.6788 15 0.7454 10 0.7017 56. Rayong 0.6678 1 0.8198 4 0.7587 -37. Bangkok Metropolis 0.6731 8 0.7964 12 0.6962 -48. Samut Songkhram 0.6635 57 0.6605 58 0.5578 -19. Lamphun 0.6638 68 0.6411 75 0.5021 -7
10. Pathum Thani 0.6634 3 0.8130 1 0.7723 211. Ang Thong 0.6540 28 0.7118 31 0.6410 -312. Phra Nakhon Si Ayutthaya 0.6536 13 0.7480 19 0.6721 -613. Phetchaburi 0.6518 33 0.7025 35 0.6290 -214. Saraburi 0.6508 9 0.7825 8 0.7187 115. Yala 0.6485 22 0.7234 14 0.6912 816. Sing Buri 0.6437 48 0.6794 39 0.6023 917. Chachoengsao 0.6431 10 0.7643 13 0.6945 -318. Samut Prakan 0.6416 2 0.8165 5 0.7578 -319. Chanthaburi 0.6359 26 0.7171 21 0.6694 520. Prachin Buri 0.6330 30 0.7109 36 0.6102 -621. Chumphon 0.6330 11 0.7536 9 0.7130 222. Trat 0.6313 17 0.7392 20 0.6704 -323. Surat Thani 0.6293 20 0.7259 33 0.6401 -1324. Suphan Buri 0.6292 35 0.6959 38 0.6057 -325. Prachuap Khiri Khan 0.6275 16 0.7447 17 0.6738 -126. Lampang 0.6252 39 0.6927 29 0.6415 1027. Samut Sakon 0.6242 6 0.8020 7 0.7263 -128. Trang 0.6228 24 0.7201 26 0.6561 -229. Ratchaburi 0.6216 29 0.7112 34 0.6368 -530. Satun 0.6202 14 0.7476 23 0.6646 -931. Phrae 0.6180 69 0.6384 53 0.5675 1632. Uttaradit 0.6153 40 0.6921 43 0.5970 -333. Nakhon Nayok 0.6135 51 0.6747 48 0.5873 334. Uthai Thani 0.6131 42 0.6870 42 0.5989 035. Phayao 0.6134 75 0.6160 61 0.5528 1436. Lop Buri 0.6083 27 0.7123 30 0.6410 -337. Phattalung 0.6061 46 0.6808 52 0.5698 -638. Phangnga 0.6055 43 0.6865 74 0.5040 -3139. Ranong 0.6041 32 0.7052 76 0.4823 -4440. Chai Nat 0.6035 37 0.6950 49 0.5835 -1241. Chiang Mai 0.6015 55 0.6628 32 0.6403 2342. Nan 0.5974 50 0.6749 28 0.6493 2243. Nakhon Si Thammarat 0.5946 23 0.7204 37 0.6076 -1444. Chiang Rai 0.5911 76 0.6070 51 0.5700 2545. Kanchanaburi 0.5907 21 0.7250 27 0.6542 -646. Sa Kaeo 0.5849 31 0.7097 25 0.6572 647. Khon Kaen 0.5832 38 0.6928 41 0.5994 -348. Krabi 0.5795 12 0.7519 15 0.6842 -349. Sukhothai 0.5743 56 0.6613 56 0.5607 050. Phichit 0.5721 62 0.6525 66 0.5417 -451. Narathiwat 0.5700 25 0.7197 11 0.6966 1452. Phitsanulok 0.5697 44 0.6864 40 0.6007 453. Pattani 0.5679 19 0.7273 24 0.6617 -554. Nakon Ratchasima 0.5661 47 0.6803 54 0.5672 -755. Kamphaeng Phet 0.5571 36 0.6951 44 0.5957 -8
(Continued on next page)
HUMAN DEVELOPMENT INDICES
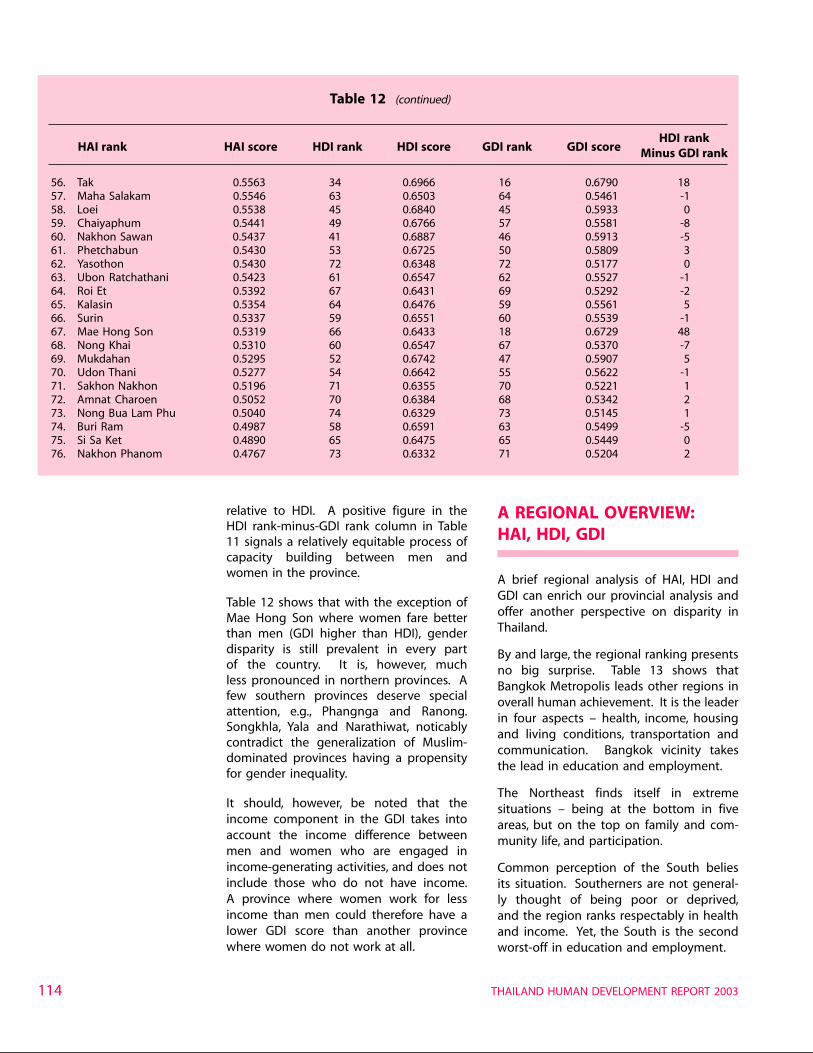
THAILAND HUMAN DEVELOPMENT REPORT 2003114
relative to HDI. A positive figure in theHDI rank-minus-GDI rank column in Table11 signals a relatively equitable process ofcapacity building between men andwomen in the province.
Table 12 shows that with the exception ofMae Hong Son where women fare betterthan men (GDI higher than HDI), genderdisparity is still prevalent in every partof the country. It is, however, muchless pronounced in northern provinces. Afew southern provinces deserve specialattention, e.g., Phangnga and Ranong.Songkhla, Yala and Narathiwat, noticablycontradict the generalization of Muslim-dominated provinces having a propensityfor gender inequality.
It should, however, be noted that theincome component in the GDI takes intoaccount the income difference betweenmen and women who are engaged inincome-generating activities, and does notinclude those who do not have income.A province where women work for lessincome than men could therefore have alower GDI score than another provincewhere women do not work at all.
A REGIONAL OVERVIEW:HAI, HDI, GDI
A brief regional analysis of HAI, HDI andGDI can enrich our provincial analysis andoffer another perspective on disparity inThailand.
By and large, the regional ranking presentsno big surprise. Table 13 shows thatBangkok Metropolis leads other regions inoverall human achievement. It is the leaderin four aspects – health, income, housingand living conditions, transportation andcommunication. Bangkok vicinity takesthe lead in education and employment.
The Northeast finds itself in extremesituations – being at the bottom in fiveareas, but on the top on family and com-munity life, and participation.
Common perception of the South beliesits situation. Southerners are not general-ly thought of being poor or deprived,and the region ranks respectably in healthand income. Yet, the South is the secondworst-off in education and employment.
Table 12 (continued)
HDI rank HAI rank HAI score HDI rank HDI score GDI rank GDI score Minus GDI rank
56. Tak 0.5563 34 0.6966 16 0.6790 1857. Maha Salakam 0.5546 63 0.6503 64 0.5461 -158. Loei 0.5538 45 0.6840 45 0.5933 059. Chaiyaphum 0.5441 49 0.6766 57 0.5581 -860. Nakhon Sawan 0.5437 41 0.6887 46 0.5913 -561. Phetchabun 0.5430 53 0.6725 50 0.5809 362. Yasothon 0.5430 72 0.6348 72 0.5177 063. Ubon Ratchathani 0.5423 61 0.6547 62 0.5527 -164. Roi Et 0.5392 67 0.6431 69 0.5292 -265. Kalasin 0.5354 64 0.6476 59 0.5561 566. Surin 0.5337 59 0.6551 60 0.5539 -167. Mae Hong Son 0.5319 66 0.6433 18 0.6729 4868. Nong Khai 0.5310 60 0.6547 67 0.5370 -769. Mukdahan 0.5295 52 0.6742 47 0.5907 570. Udon Thani 0.5277 54 0.6642 55 0.5622 -171. Sakhon Nakhon 0.5196 71 0.6355 70 0.5221 172. Amnat Charoen 0.5052 70 0.6384 68 0.5342 273. Nong Bua Lam Phu 0.5040 74 0.6329 73 0.5145 174. Buri Ram 0.4987 58 0.6591 63 0.5499 -575. Si Sa Ket 0.4890 65 0.6475 65 0.5449 076. Nakhon Phanom 0.4767 73 0.6332 71 0.5204 2
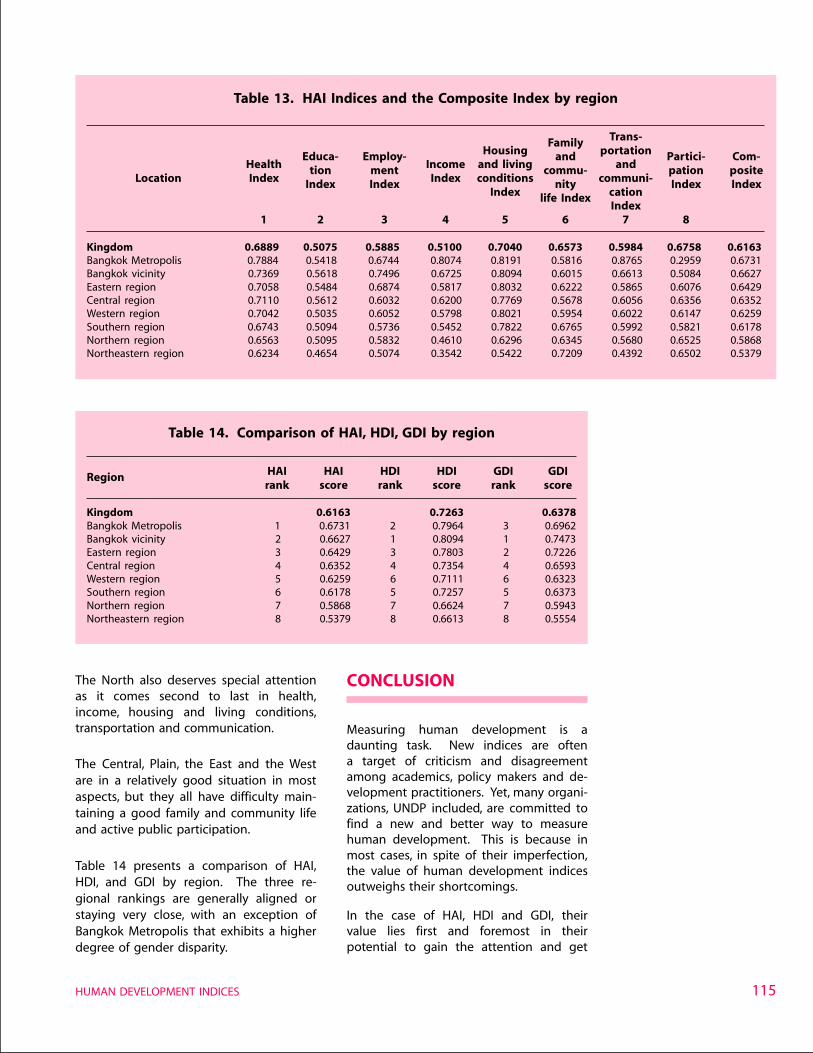
115
The North also deserves special attentionas it comes second to last in health,income, housing and living conditions,transportation and communication.
The Central, Plain, the East and the Westare in a relatively good situation in mostaspects, but they all have difficulty main-taining a good family and community lifeand active public participation.
Table 14 presents a comparison of HAI,HDI, and GDI by region. The three re-gional rankings are generally aligned orstaying very close, with an exception ofBangkok Metropolis that exhibits a higherdegree of gender disparity.
CONCLUSION
Measuring human development is adaunting task. New indices are oftena target of criticism and disagreementamong academics, policy makers and de-velopment practitioners. Yet, many organi-zations, UNDP included, are committed tofind a new and better way to measurehuman development. This is because inmost cases, in spite of their imperfection,the value of human development indicesoutweighs their shortcomings.
In the case of HAI, HDI and GDI, theirvalue lies first and foremost in theirpotential to gain the attention and get
Table 13. HAI Indices and the Composite Index by region
Family Trans-
Educa- Employ- Housing and portation Partici- Com-Health tion ment Income and living commu- and pation posite
Location Index Index Index Index conditions nity communi- Index IndexIndex life Index cation
Index1 2 3 4 5 6 7 8
Kingdom 0.6889 0.5075 0.5885 0.5100 0.7040 0.6573 0.5984 0.6758 0.6163Bangkok Metropolis 0.7884 0.5418 0.6744 0.8074 0.8191 0.5816 0.8765 0.2959 0.6731Bangkok vicinity 0.7369 0.5618 0.7496 0.6725 0.8094 0.6015 0.6613 0.5084 0.6627Eastern region 0.7058 0.5484 0.6874 0.5817 0.8032 0.6222 0.5865 0.6076 0.6429Central region 0.7110 0.5612 0.6032 0.6200 0.7769 0.5678 0.6056 0.6356 0.6352Western region 0.7042 0.5035 0.6052 0.5798 0.8021 0.5954 0.6022 0.6147 0.6259Southern region 0.6743 0.5094 0.5736 0.5452 0.7822 0.6765 0.5992 0.5821 0.6178Northern region 0.6563 0.5095 0.5832 0.4610 0.6296 0.6345 0.5680 0.6525 0.5868Northeastern region 0.6234 0.4654 0.5074 0.3542 0.5422 0.7209 0.4392 0.6502 0.5379
Table 14. Comparison of HAI, HDI, GDI by region
Region HAI HAI HDI HDI GDI GDIrank score rank score rank score
Kingdom 0.6163 0.7263 0.6378Bangkok Metropolis 1 0.6731 2 0.7964 3 0.6962Bangkok vicinity 2 0.6627 1 0.8094 1 0.7473Eastern region 3 0.6429 3 0.7803 2 0.7226Central region 4 0.6352 4 0.7354 4 0.6593Western region 5 0.6259 6 0.7111 6 0.6323Southern region 6 0.6178 5 0.7257 5 0.6373Northern region 7 0.5868 7 0.6624 7 0.5943Northeastern region 8 0.5379 8 0.6613 8 0.5554
HUMAN DEVELOPMENT INDICES
THAILAND HUMAN DEVELOPMENT REPORT 2003116
the policy makers and the people tothink, discuss and debate “human deve-lopment” in concrete and meaningfulterms. The regional and provincial datathat supports the 40 indicators, 8 HAIindices and the composite index canserve as an important basis for publicawareness, problem identification, andpolicy decisions at national and locallevels.
It is hoped that the provincial and regionalHAI, HDI and GDI presented in this Reporthas constituted a good start for an on-going process in which the indices and thecomposite index will be improved bothwith better data and better methodologies.This process will provide an enabling envi-ronment and valuable support to policymakers and the public in their pursuit ofhuman development in the years to come.
117
S TAT I S T I C A L A N N E X

THAILAND HUMAN DEVELOPMENT REPORT 2003118
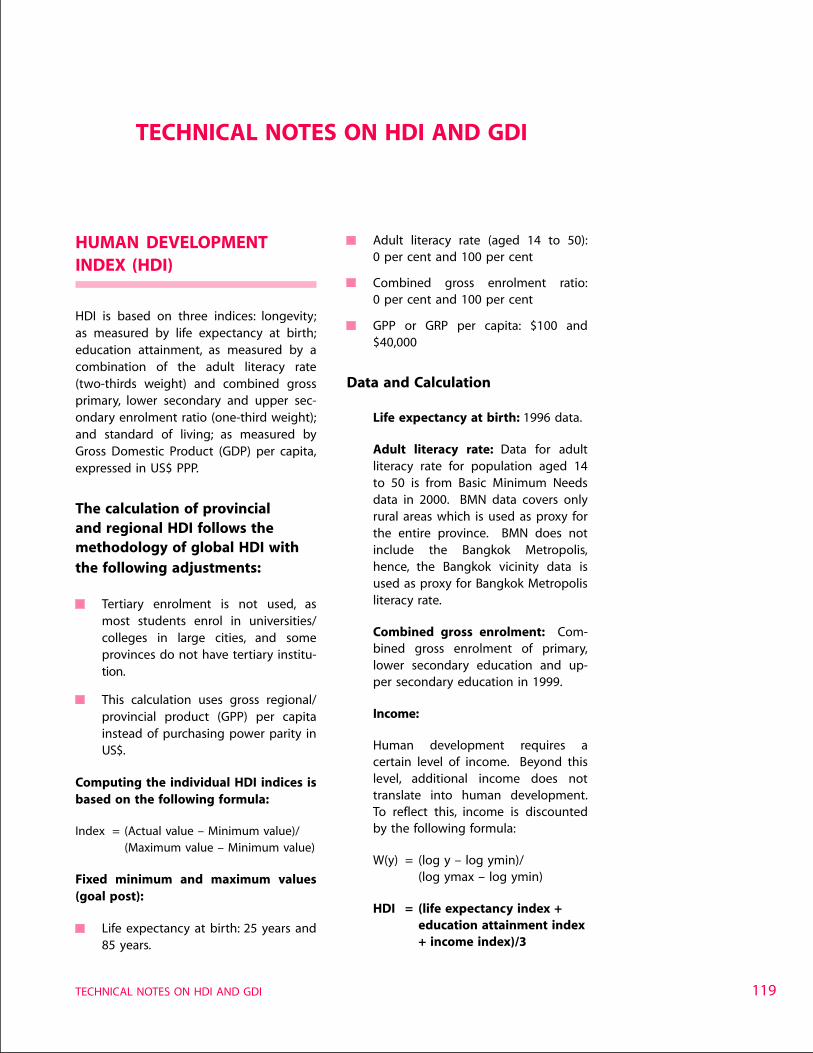
119TECHNICAL NOTES ON HDI AND GDI
HUMAN DEVELOPMENTINDEX (HDI)
HDI is based on three indices: longevity;as measured by life expectancy at birth;education attainment, as measured by acombination of the adult literacy rate(two-thirds weight) and combined grossprimary, lower secondary and upper sec-ondary enrolment ratio (one-third weight);and standard of living; as measured byGross Domestic Product (GDP) per capita,expressed in US$ PPP.
The calculation of provincialand regional HDI follows themethodology of global HDI withthe following adjustments:
Tertiary enrolment is not used, asmost students enrol in universities/colleges in large cities, and someprovinces do not have tertiary institu-tion.
This calculation uses gross regional/provincial product (GPP) per capitainstead of purchasing power parity inUS$.
Computing the individual HDI indices isbased on the following formula:
Index = (Actual value – Minimum value)/(Maximum value – Minimum value)
Fixed minimum and maximum values(goal post):
Life expectancy at birth: 25 years and85 years.
Adult literacy rate (aged 14 to 50):0 per cent and 100 per cent
Combined gross enrolment ratio:0 per cent and 100 per cent
GPP or GRP per capita: $100 and$40,000
Data and Calculation
Life expectancy at birth: 1996 data.
Adult literacy rate: Data for adultliteracy rate for population aged 14to 50 is from Basic Minimum Needsdata in 2000. BMN data covers onlyrural areas which is used as proxy forthe entire province. BMN does notinclude the Bangkok Metropolis,hence, the Bangkok vicinity data isused as proxy for Bangkok Metropolisliteracy rate.
Combined gross enrolment: Com-bined gross enrolment of primary,lower secondary education and up-per secondary education in 1999.
Income:
Human development requires acertain level of income. Beyond thislevel, additional income does nottranslate into human development.To reflect this, income is discountedby the following formula:
W(y) = (log y – log ymin)/(log ymax – log ymin)
HDI = (life expectancy index +education attainment index+ income index)/3
TECHNICAL NOTES ON HDI AND GDI
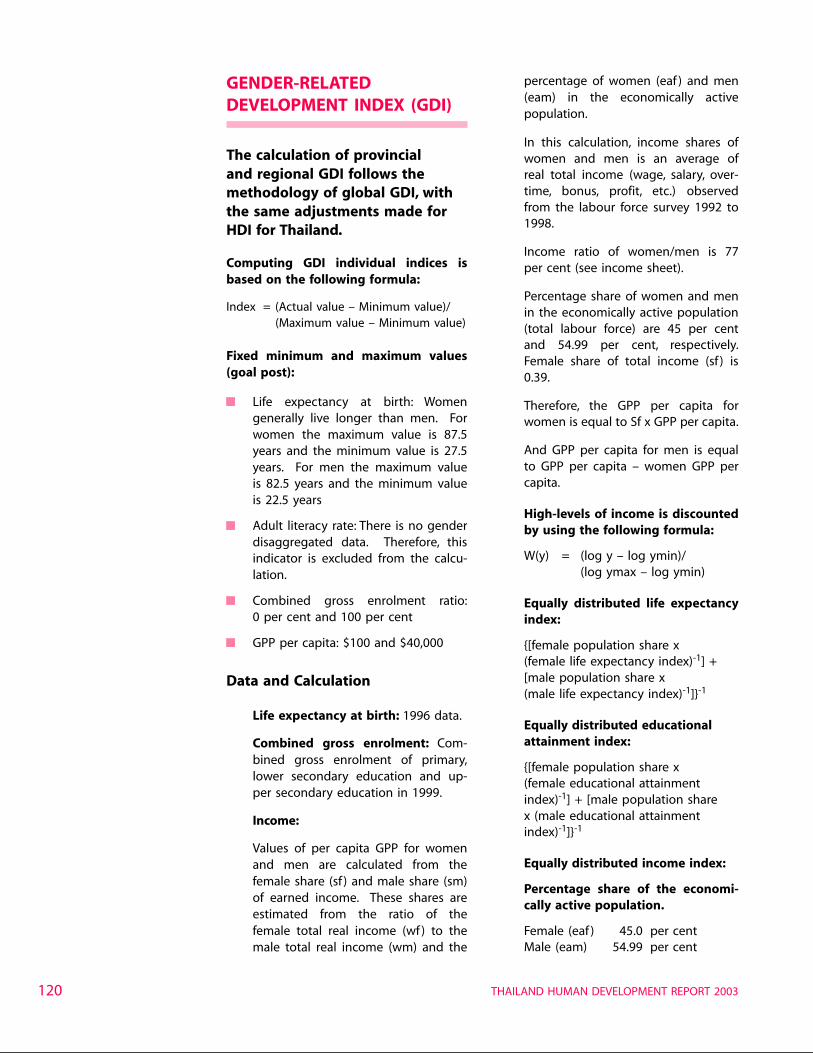
THAILAND HUMAN DEVELOPMENT REPORT 2003120
GENDER-RELATEDDEVELOPMENT INDEX (GDI)
The calculation of provincialand regional GDI follows themethodology of global GDI, withthe same adjustments made forHDI for Thailand.
Computing GDI individual indices isbased on the following formula:
Index = (Actual value – Minimum value)/(Maximum value – Minimum value)
Fixed minimum and maximum values(goal post):
Life expectancy at birth: Womengenerally live longer than men. Forwomen the maximum value is 87.5years and the minimum value is 27.5years. For men the maximum valueis 82.5 years and the minimum valueis 22.5 years
Adult literacy rate: There is no genderdisaggregated data. Therefore, thisindicator is excluded from the calcu-lation.
Combined gross enrolment ratio:0 per cent and 100 per cent
GPP per capita: $100 and $40,000
Data and Calculation
Life expectancy at birth: 1996 data.
Combined gross enrolment: Com-bined gross enrolment of primary,lower secondary education and up-per secondary education in 1999.
Income:
Values of per capita GPP for womenand men are calculated from thefemale share (sf ) and male share (sm)of earned income. These shares areestimated from the ratio of thefemale total real income (wf ) to themale total real income (wm) and the
percentage of women (eaf ) and men(eam) in the economically activepopulation.
In this calculation, income shares ofwomen and men is an average ofreal total income (wage, salary, over-time, bonus, profit, etc.) observedfrom the labour force survey 1992 to1998.
Income ratio of women/men is 77per cent (see income sheet).
Percentage share of women and menin the economically active population(total labour force) are 45 per centand 54.99 per cent, respectively.Female share of total income (sf ) is0.39.
Therefore, the GPP per capita forwomen is equal to Sf x GPP per capita.
And GPP per capita for men is equalto GPP per capita – women GPP percapita.
High-levels of income is discountedby using the following formula:
W(y) = (log y – log ymin)/(log ymax – log ymin)
Equally distributed life expectancyindex:
{[female population share x(female life expectancy index)-1] +[male population share x(male life expectancy index)-1]}-1
Equally distributed educationalattainment index:
{[female population share x(female educational attainmentindex)-1] + [male population sharex (male educational attainmentindex)-1]}-1
Equally distributed income index:
Percentage share of the economi-cally active population.
Female (eaf ) 45.0 per centMale (eam) 54.99 per cent
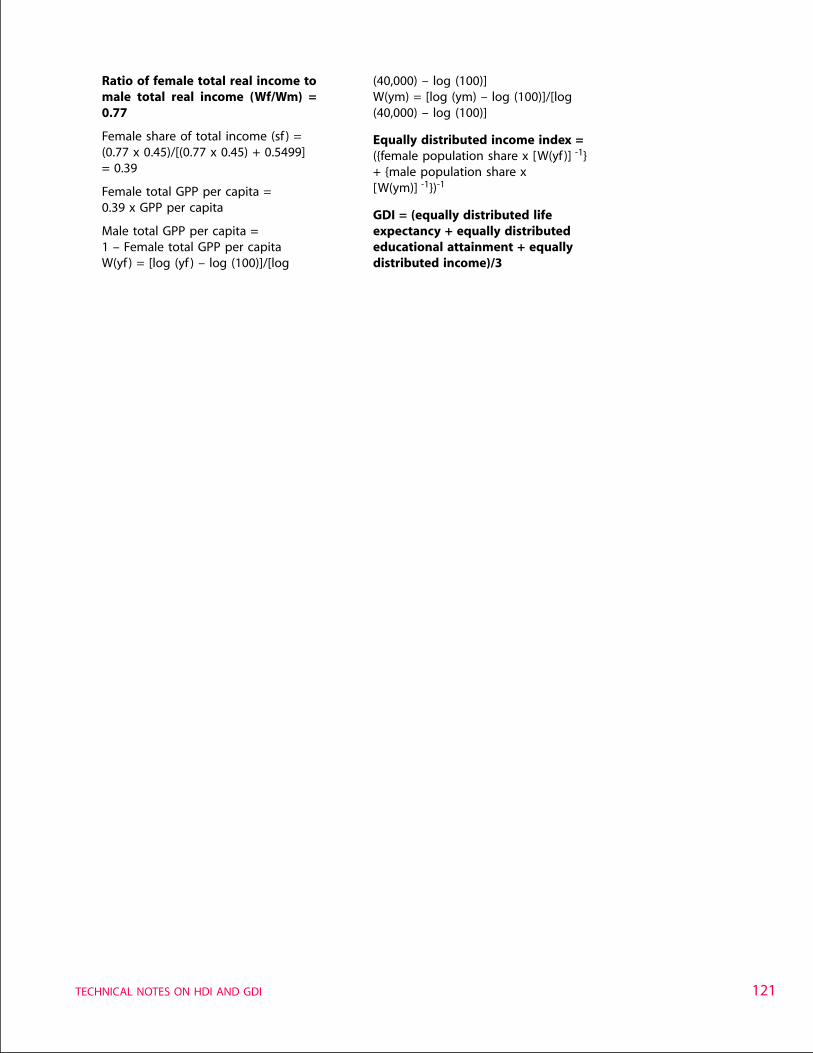
121TECHNICAL NOTES ON HDI AND GDI
Ratio of female total real income tomale total real income (Wf/Wm) =0.77
Female share of total income (sf ) =(0.77 x 0.45)/[(0.77 x 0.45) + 0.5499]= 0.39
Female total GPP per capita =0.39 x GPP per capita
Male total GPP per capita =1 – Female total GPP per capitaW(yf ) = [log (yf ) – log (100)]/[log
(40,000) – log (100)]W(ym) = [log (ym) – log (100)]/[log(40,000) – log (100)]
Equally distributed income index =({female population share x [W(yf )] -1}+ {male population share x[W(ym)] -1})-1
GDI = (equally distributed lifeexpectancy + equally distributededucational attainment + equallydistributed income)/3
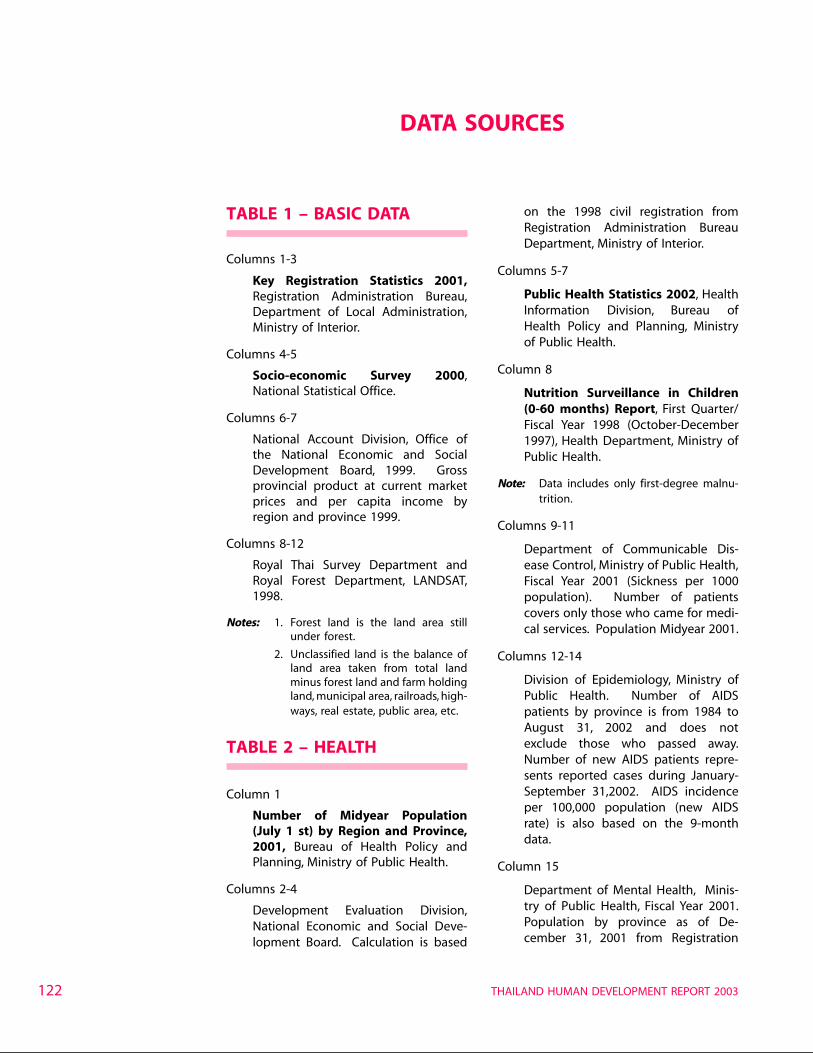
THAILAND HUMAN DEVELOPMENT REPORT 2003122
TABLE 1 – BASIC DATA
Columns 1-3
Key Registration Statistics 2001,Registration Administration Bureau,Department of Local Administration,Ministry of Interior.
Columns 4-5
Socio-economic Survey 2000,National Statistical Office.
Columns 6-7
National Account Division, Office ofthe National Economic and SocialDevelopment Board, 1999. Grossprovincial product at current marketprices and per capita income byregion and province 1999.
Columns 8-12
Royal Thai Survey Department andRoyal Forest Department, LANDSAT,1998.
Notes: 1. Forest land is the land area stillunder forest.
2. Unclassified land is the balance ofland area taken from total landminus forest land and farm holdingland, municipal area, railroads, high-ways, real estate, public area, etc.
TABLE 2 – HEALTH
Column 1
Number of Midyear Population(July 1 st) by Region and Province,2001, Bureau of Health Policy andPlanning, Ministry of Public Health.
Columns 2-4
Development Evaluation Division,National Economic and Social Deve-lopment Board. Calculation is based
on the 1998 civil registration fromRegistration Administration BureauDepartment, Ministry of Interior.
Columns 5-7
Public Health Statistics 2002, HealthInformation Division, Bureau ofHealth Policy and Planning, Ministryof Public Health.
Column 8
Nutrition Surveillance in Children(0-60 months) Report, First Quarter/Fiscal Year 1998 (October-December1997), Health Department, Ministry ofPublic Health.
Note: Data includes only first-degree malnu-trition.
Columns 9-11
Department of Communicable Dis-ease Control, Ministry of Public Health,Fiscal Year 2001 (Sickness per 1000population). Number of patientscovers only those who came for medi-cal services. Population Midyear 2001.
Columns 12-14
Division of Epidemiology, Ministry ofPublic Health. Number of AIDSpatients by province is from 1984 toAugust 31, 2002 and does notexclude those who passed away.Number of new AIDS patients repre-sents reported cases during January-September 31,2002. AIDS incidenceper 100,000 population (new AIDSrate) is also based on the 9-monthdata.
Column 15
Department of Mental Health, Minis-try of Public Health, Fiscal Year 2001.Population by province as of De-cember 31, 2001 from Registration
DATA SOURCES
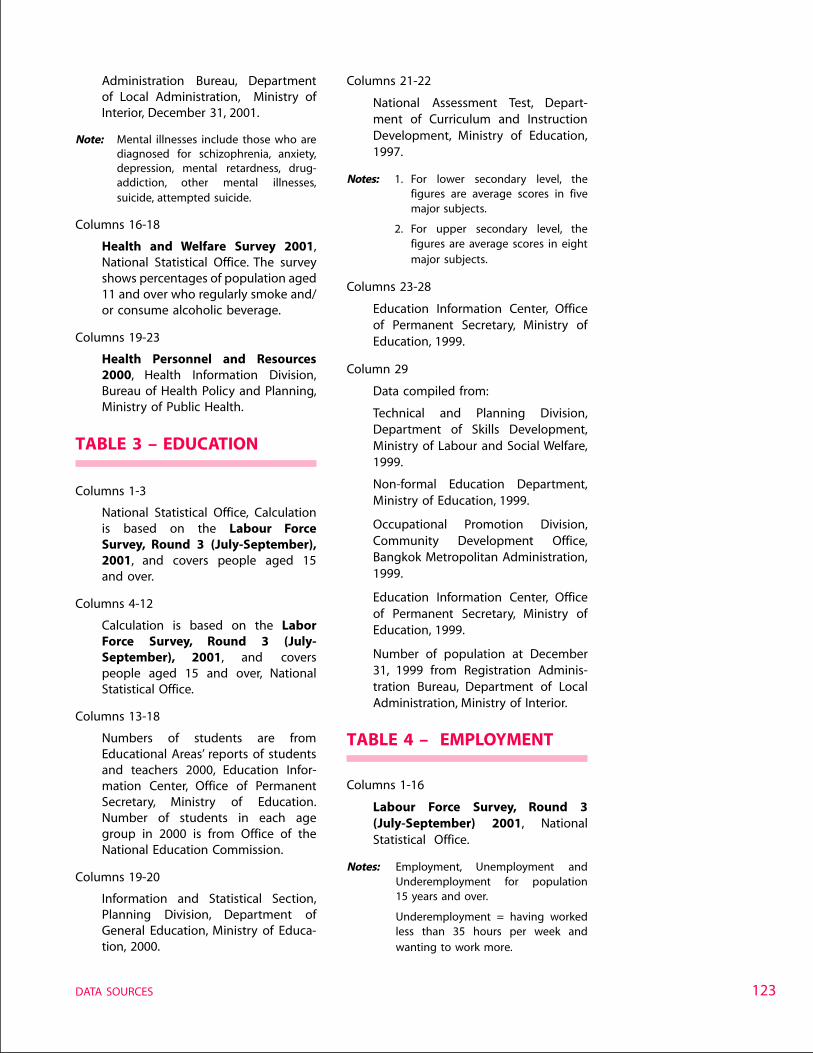
123
Administration Bureau, Departmentof Local Administration, Ministry ofInterior, December 31, 2001.
Note: Mental illnesses include those who arediagnosed for schizophrenia, anxiety,depression, mental retardness, drug-addiction, other mental illnesses,suicide, attempted suicide.
Columns 16-18
Health and Welfare Survey 2001,National Statistical Office. The surveyshows percentages of population aged11 and over who regularly smoke and/or consume alcoholic beverage.
Columns 19-23
Health Personnel and Resources2000, Health Information Division,Bureau of Health Policy and Planning,Ministry of Public Health.
TABLE 3 – EDUCATION
Columns 1-3
National Statistical Office, Calculationis based on the Labour ForceSurvey, Round 3 (July-September),2001, and covers people aged 15and over.
Columns 4-12
Calculation is based on the LaborForce Survey, Round 3 (July-September), 2001, and coverspeople aged 15 and over, NationalStatistical Office.
Columns 13-18
Numbers of students are fromEducational Areas’ reports of studentsand teachers 2000, Education Infor-mation Center, Office of PermanentSecretary, Ministry of Education.Number of students in each agegroup in 2000 is from Office of theNational Education Commission.
Columns 19-20
Information and Statistical Section,Planning Division, Department ofGeneral Education, Ministry of Educa-tion, 2000.
Columns 21-22
National Assessment Test, Depart-ment of Curriculum and InstructionDevelopment, Ministry of Education,1997.
Notes: 1. For lower secondary level, thefigures are average scores in fivemajor subjects.
2. For upper secondary level, thefigures are average scores in eightmajor subjects.
Columns 23-28
Education Information Center, Officeof Permanent Secretary, Ministry ofEducation, 1999.
Column 29
Data compiled from:
Technical and Planning Division,Department of Skills Development,Ministry of Labour and Social Welfare,1999.
Non-formal Education Department,Ministry of Education, 1999.
Occupational Promotion Division,Community Development Office,Bangkok Metropolitan Administration,1999.
Education Information Center, Officeof Permanent Secretary, Ministry ofEducation, 1999.
Number of population at December31, 1999 from Registration Adminis-tration Bureau, Department of LocalAdministration, Ministry of Interior.
TABLE 4 – EMPLOYMENT
Columns 1-16
Labour Force Survey, Round 3(July-September) 2001, NationalStatistical Office.
Notes: Employment, Unemployment andUnderemployment for population15 years and over.
Underemployment = having workedless than 35 hours per week andwanting to work more.
DATA SOURCES
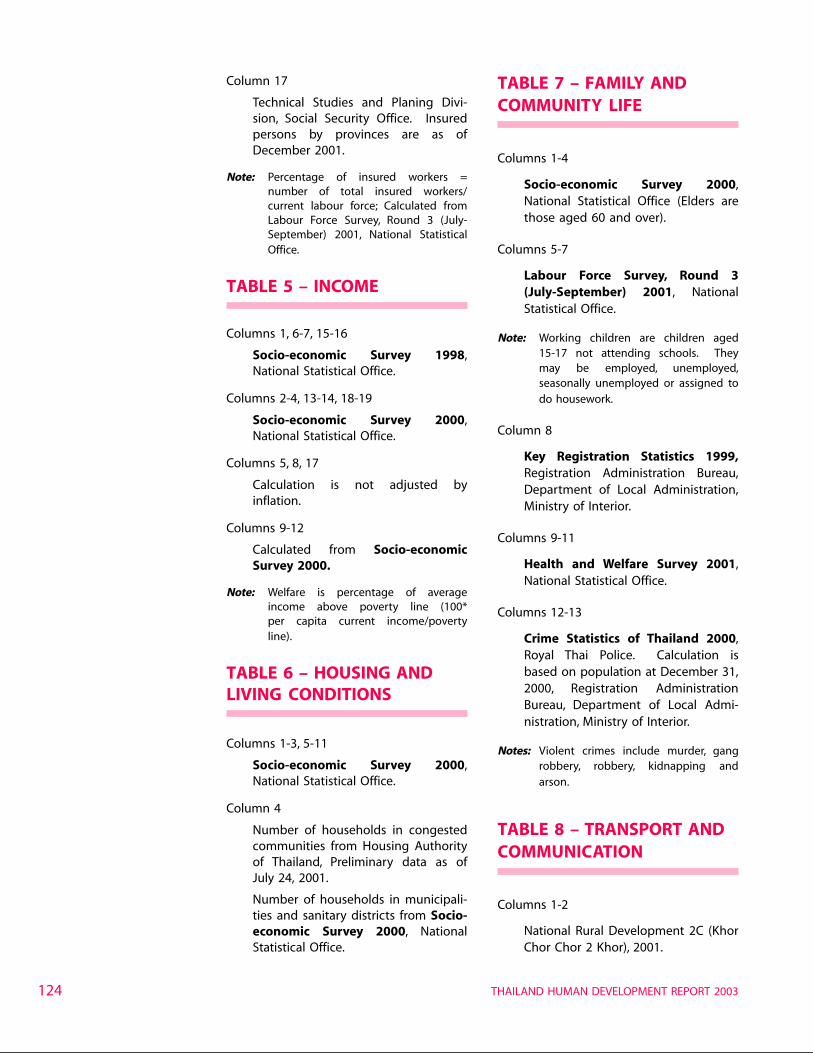
THAILAND HUMAN DEVELOPMENT REPORT 2003124
Column 17
Technical Studies and Planing Divi-sion, Social Security Office. Insuredpersons by provinces are as ofDecember 2001.
Note: Percentage of insured workers =number of total insured workers/current labour force; Calculated fromLabour Force Survey, Round 3 (July-September) 2001, National StatisticalOffice.
TABLE 5 – INCOME
Columns 1, 6-7, 15-16
Socio-economic Survey 1998,National Statistical Office.
Columns 2-4, 13-14, 18-19
Socio-economic Survey 2000,National Statistical Office.
Columns 5, 8, 17
Calculation is not adjusted byinflation.
Columns 9-12
Calculated from Socio-economicSurvey 2000.
Note: Welfare is percentage of averageincome above poverty line (100*per capita current income/povertyline).
TABLE 6 – HOUSING ANDLIVING CONDITIONS
Columns 1-3, 5-11
Socio-economic Survey 2000,National Statistical Office.
Column 4
Number of households in congestedcommunities from Housing Authorityof Thailand, Preliminary data as ofJuly 24, 2001.
Number of households in municipali-ties and sanitary districts from Socio-economic Survey 2000, NationalStatistical Office.
TABLE 7 – FAMILY ANDCOMMUNITY LIFE
Columns 1-4
Socio-economic Survey 2000,National Statistical Office (Elders arethose aged 60 and over).
Columns 5-7
Labour Force Survey, Round 3(July-September) 2001, NationalStatistical Office.
Note: Working children are children aged15-17 not attending schools. Theymay be employed, unemployed,seasonally unemployed or assigned todo housework.
Column 8
Key Registration Statistics 1999,Registration Administration Bureau,Department of Local Administration,Ministry of Interior.
Columns 9-11
Health and Welfare Survey 2001,National Statistical Office.
Columns 12-13
Crime Statistics of Thailand 2000,Royal Thai Police. Calculation isbased on population at December 31,2000, Registration AdministrationBureau, Department of Local Admi-nistration, Ministry of Interior.
Notes: Violent crimes include murder, gangrobbery, robbery, kidnapping andarson.
TABLE 8 – TRANSPORT ANDCOMMUNICATION
Columns 1-2
National Rural Development 2C (KhorChor Chor 2 Khor), 2001.
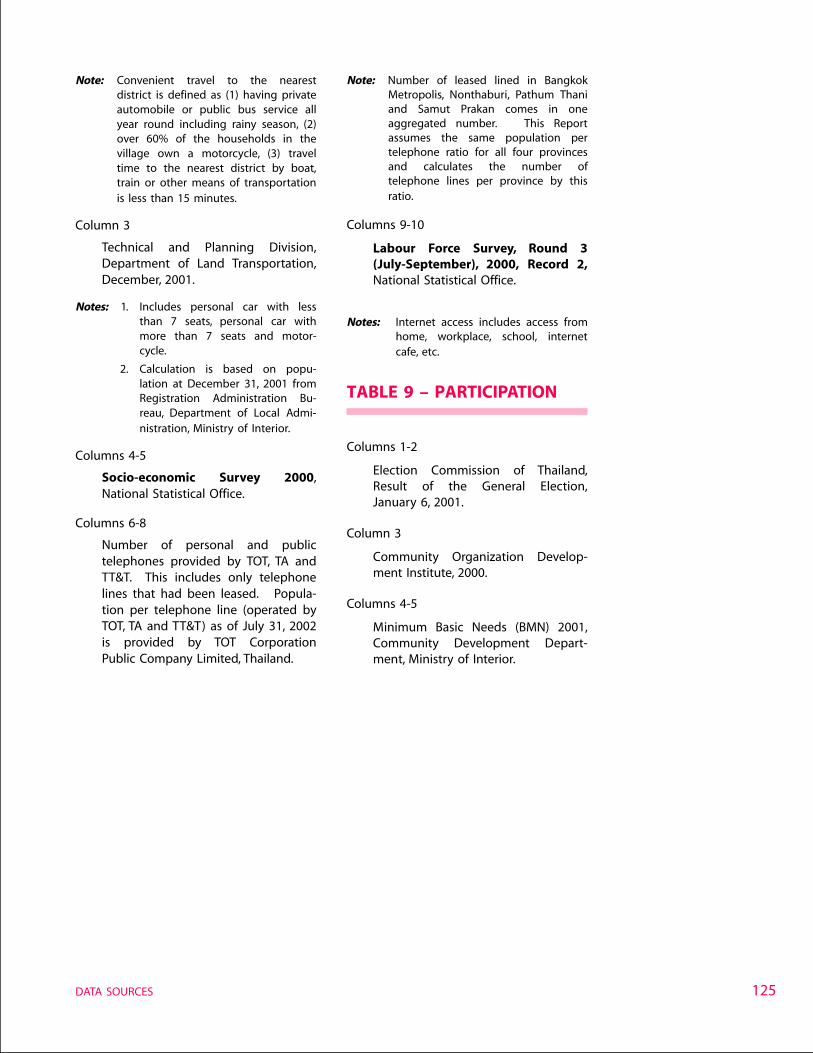
125
Note: Convenient travel to the nearestdistrict is defined as (1) having privateautomobile or public bus service allyear round including rainy season, (2)over 60% of the households in thevillage own a motorcycle, (3) traveltime to the nearest district by boat,train or other means of transportationis less than 15 minutes.
Column 3
Technical and Planning Division,Department of Land Transportation,December, 2001.
Notes: 1. Includes personal car with lessthan 7 seats, personal car withmore than 7 seats and motor-cycle.
2. Calculation is based on popu-lation at December 31, 2001 fromRegistration Administration Bu-reau, Department of Local Admi-nistration, Ministry of Interior.
Columns 4-5
Socio-economic Survey 2000,National Statistical Office.
Columns 6-8
Number of personal and publictelephones provided by TOT, TA andTT&T. This includes only telephonelines that had been leased. Popula-tion per telephone line (operated byTOT, TA and TT&T) as of July 31, 2002is provided by TOT CorporationPublic Company Limited, Thailand.
DATA SOURCES
Note: Number of leased lined in BangkokMetropolis, Nonthaburi, Pathum Thaniand Samut Prakan comes in oneaggregated number. This Reportassumes the same population pertelephone ratio for all four provincesand calculates the number oftelephone lines per province by thisratio.
Columns 9-10
Labour Force Survey, Round 3(July-September), 2000, Record 2,National Statistical Office.
Notes: Internet access includes access fromhome, workplace, school, internetcafe, etc.
TABLE 9 – PARTICIPATION
Columns 1-2
Election Commission of Thailand,Result of the General Election,January 6, 2001.
Column 3
Community Organization Develop-ment Institute, 2000.
Columns 4-5
Minimum Basic Needs (BMN) 2001,Community Development Depart-ment, Ministry of Interior.
DATA TABLES
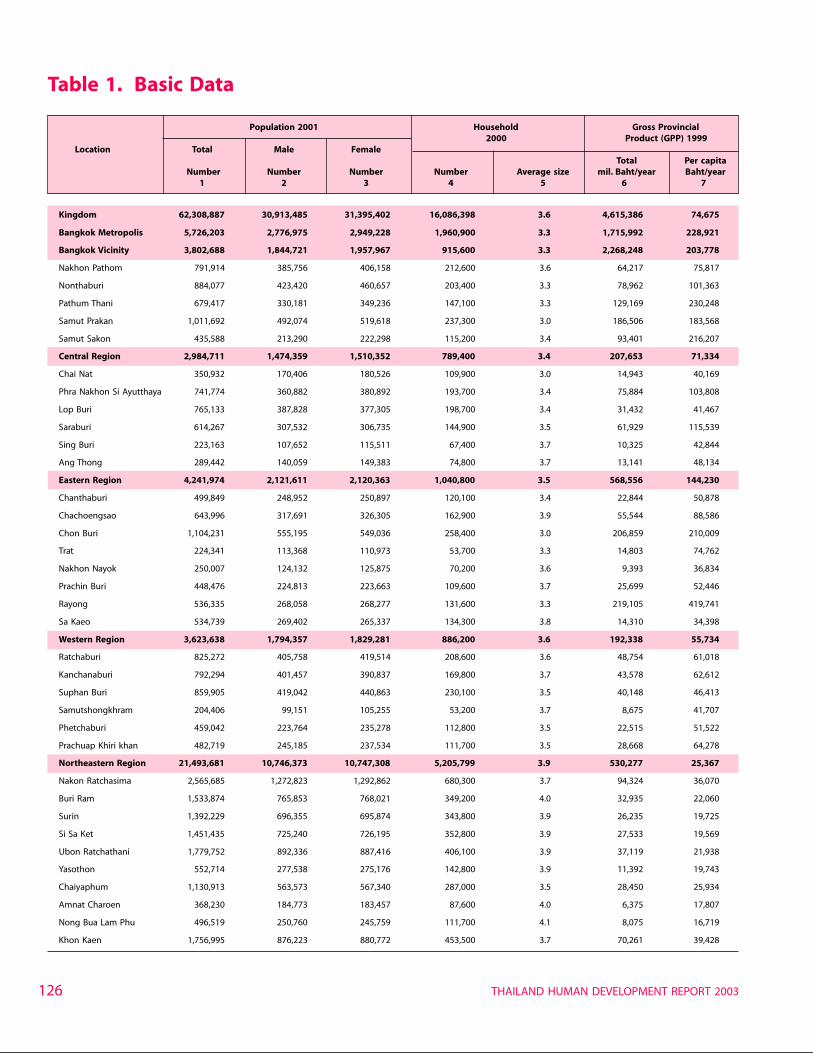
THAILAND HUMAN DEVELOPMENT REPORT 2003126
Table 1. Basic Data
Population 2001 Household Gross Provincial 2000 Product (GPP) 1999
Location Total Male FemaleTotal Per capita
Number Number Number Number Average size mil. Baht/year Baht/year1 2 3 4 5 6 7
Kingdom 62,308,887 30,913,485 31,395,402 16,086,398 3.6 4,615,386 74,675
Bangkok Metropolis 5,726,203 2,776,975 2,949,228 1,960,900 3.3 1,715,992 228,921
Bangkok Vicinity 3,802,688 1,844,721 1,957,967 915,600 3.3 2,268,248 203,778
Nakhon Pathom 791,914 385,756 406,158 212,600 3.6 64,217 75,817
Nonthaburi 884,077 423,420 460,657 203,400 3.3 78,962 101,363
Pathum Thani 679,417 330,181 349,236 147,100 3.3 129,169 230,248
Samut Prakan 1,011,692 492,074 519,618 237,300 3.0 186,506 183,568
Samut Sakon 435,588 213,290 222,298 115,200 3.4 93,401 216,207
Central Region 2,984,711 1,474,359 1,510,352 789,400 3.4 207,653 71,334
Chai Nat 350,932 170,406 180,526 109,900 3.0 14,943 40,169
Phra Nakhon Si Ayutthaya 741,774 360,882 380,892 193,700 3.4 75,884 103,808
Lop Buri 765,133 387,828 377,305 198,700 3.4 31,432 41,467
Saraburi 614,267 307,532 306,735 144,900 3.5 61,929 115,539
Sing Buri 223,163 107,652 115,511 67,400 3.7 10,325 42,844
Ang Thong 289,442 140,059 149,383 74,800 3.7 13,141 48,134
Eastern Region 4,241,974 2,121,611 2,120,363 1,040,800 3.5 568,556 144,230
Chanthaburi 499,849 248,952 250,897 120,100 3.4 22,844 50,878
Chachoengsao 643,996 317,691 326,305 162,900 3.9 55,544 88,586
Chon Buri 1,104,231 555,195 549,036 258,400 3.0 206,859 210,009
Trat 224,341 113,368 110,973 53,700 3.3 14,803 74,762
Nakhon Nayok 250,007 124,132 125,875 70,200 3.6 9,393 36,834
Prachin Buri 448,476 224,813 223,663 109,600 3.7 25,699 52,446
Rayong 536,335 268,058 268,277 131,600 3.3 219,105 419,741
Sa Kaeo 534,739 269,402 265,337 134,300 3.8 14,310 34,398
Western Region 3,623,638 1,794,357 1,829,281 886,200 3.6 192,338 55,734
Ratchaburi 825,272 405,758 419,514 208,600 3.6 48,754 61,018
Kanchanaburi 792,294 401,457 390,837 169,800 3.7 43,578 62,612
Suphan Buri 859,905 419,042 440,863 230,100 3.5 40,148 46,413
Samutshongkhram 204,406 99,151 105,255 53,200 3.7 8,675 41,707
Phetchaburi 459,042 223,764 235,278 112,800 3.5 22,515 51,522
Prachuap Khiri khan 482,719 245,185 237,534 111,700 3.5 28,668 64,278
Northeastern Region 21,493,681 10,746,373 10,747,308 5,205,799 3.9 530,277 25,367
Nakon Ratchasima 2,565,685 1,272,823 1,292,862 680,300 3.7 94,324 36,070
Buri Ram 1,533,874 765,853 768,021 349,200 4.0 32,935 22,060
Surin 1,392,229 696,355 695,874 343,800 3.9 26,235 19,725
Si Sa Ket 1,451,435 725,240 726,195 352,800 3.9 27,533 19,569
Ubon Ratchathani 1,779,752 892,336 887,416 406,100 3.9 37,119 21,938
Yasothon 552,714 277,538 275,176 142,800 3.9 11,392 19,743
Chaiyaphum 1,130,913 563,573 567,340 287,000 3.5 28,450 25,934
Amnat Charoen 368,230 184,773 183,457 87,600 4.0 6,375 17,807
Nong Bua Lam Phu 496,519 250,760 245,759 111,700 4.1 8,075 16,719
Khon Kaen 1,756,995 876,223 880,772 453,500 3.7 70,261 39,428
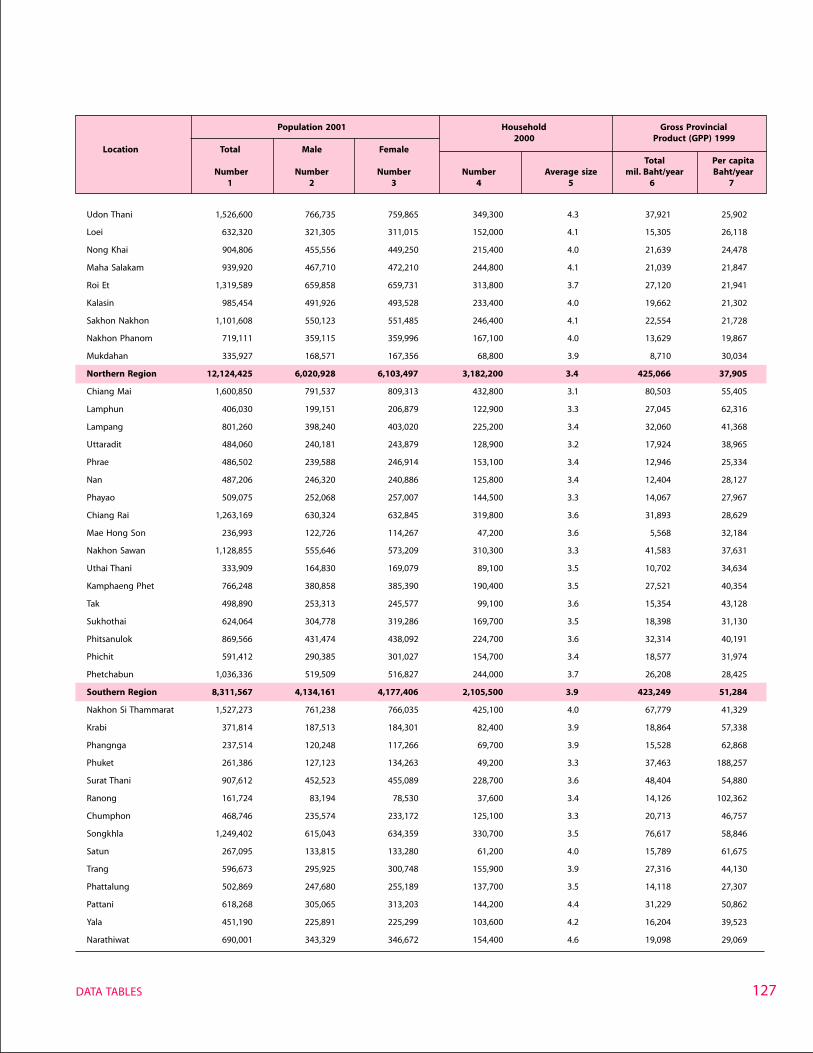
127DATA TABLES
Table 1 Basic Data (Continued)
Population 2001 Household Gross Provincial 2000 Product (GPP) 1999
Location Total Male FemaleTotal Per capita
Number Number Number Number Average size mil. Baht/year Baht/year1 2 3 4 5 6 7
Udon Thani 1,526,600 766,735 759,865 349,300 4.3 37,921 25,902
Loei 632,320 321,305 311,015 152,000 4.1 15,305 26,118
Nong Khai 904,806 455,556 449,250 215,400 4.0 21,639 24,478
Maha Salakam 939,920 467,710 472,210 244,800 4.1 21,039 21,847
Roi Et 1,319,589 659,858 659,731 313,800 3.7 27,120 21,941
Kalasin 985,454 491,926 493,528 233,400 4.0 19,662 21,302
Sakhon Nakhon 1,101,608 550,123 551,485 246,400 4.1 22,554 21,728
Nakhon Phanom 719,111 359,115 359,996 167,100 4.0 13,629 19,867
Mukdahan 335,927 168,571 167,356 68,800 3.9 8,710 30,034
Northern Region 12,124,425 6,020,928 6,103,497 3,182,200 3.4 425,066 37,905
Chiang Mai 1,600,850 791,537 809,313 432,800 3.1 80,503 55,405
Lamphun 406,030 199,151 206,879 122,900 3.3 27,045 62,316
Lampang 801,260 398,240 403,020 225,200 3.4 32,060 41,368
Uttaradit 484,060 240,181 243,879 128,900 3.2 17,924 38,965
Phrae 486,502 239,588 246,914 153,100 3.4 12,946 25,334
Nan 487,206 246,320 240,886 125,800 3.4 12,404 28,127
Phayao 509,075 252,068 257,007 144,500 3.3 14,067 27,967
Chiang Rai 1,263,169 630,324 632,845 319,800 3.6 31,893 28,629
Mae Hong Son 236,993 122,726 114,267 47,200 3.6 5,568 32,184
Nakhon Sawan 1,128,855 555,646 573,209 310,300 3.3 41,583 37,631
Uthai Thani 333,909 164,830 169,079 89,100 3.5 10,702 34,634
Kamphaeng Phet 766,248 380,858 385,390 190,400 3.5 27,521 40,354
Tak 498,890 253,313 245,577 99,100 3.6 15,354 43,128
Sukhothai 624,064 304,778 319,286 169,700 3.5 18,398 31,130
Phitsanulok 869,566 431,474 438,092 224,700 3.6 32,314 40,191
Phichit 591,412 290,385 301,027 154,700 3.4 18,577 31,974
Phetchabun 1,036,336 519,509 516,827 244,000 3.7 26,208 28,425
Southern Region 8,311,567 4,134,161 4,177,406 2,105,500 3.9 423,249 51,284
Nakhon Si Thammarat 1,527,273 761,238 766,035 425,100 4.0 67,779 41,329
Krabi 371,814 187,513 184,301 82,400 3.9 18,864 57,338
Phangnga 237,514 120,248 117,266 69,700 3.9 15,528 62,868
Phuket 261,386 127,123 134,263 49,200 3.3 37,463 188,257
Surat Thani 907,612 452,523 455,089 228,700 3.6 48,404 54,880
Ranong 161,724 83,194 78,530 37,600 3.4 14,126 102,362
Chumphon 468,746 235,574 233,172 125,100 3.3 20,713 46,757
Songkhla 1,249,402 615,043 634,359 330,700 3.5 76,617 58,846
Satun 267,095 133,815 133,280 61,200 4.0 15,789 61,675
Trang 596,673 295,925 300,748 155,900 3.9 27,316 44,130
Phattalung 502,869 247,680 255,189 137,700 3.5 14,118 27,307
Pattani 618,268 305,065 313,203 144,200 4.4 31,229 50,862
Yala 451,190 225,891 225,299 103,600 4.2 16,204 39,523
Narathiwat 690,001 343,329 346,672 154,400 4.6 19,098 29,069
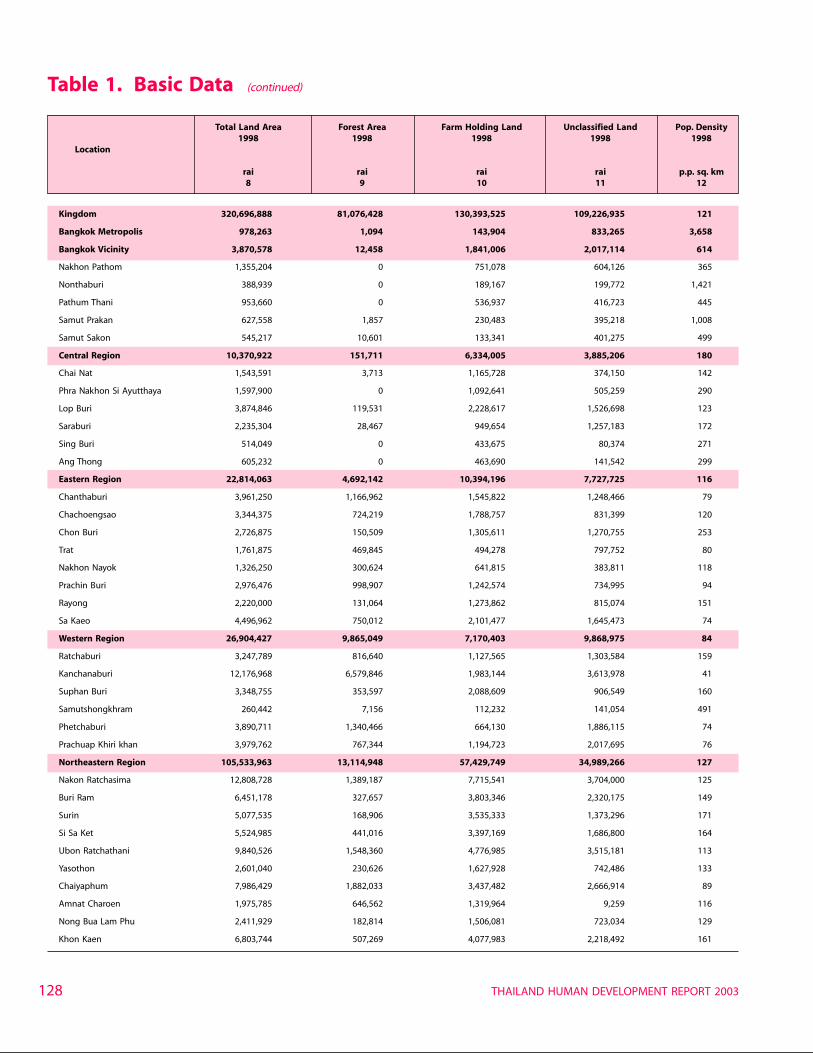
THAILAND HUMAN DEVELOPMENT REPORT 2003128
Table 1. Basic Data (continued)
Total Land Area Forest Area Farm Holding Land Unclassified Land Pop. Density1998 1998 1998 1998 1998
Location
rai rai rai rai p.p. sq. km8 9 10 11 12
Kingdom 320,696,888 81,076,428 130,393,525 109,226,935 121
Bangkok Metropolis 978,263 1,094 143,904 833,265 3,658
Bangkok Vicinity 3,870,578 12,458 1,841,006 2,017,114 614
Nakhon Pathom 1,355,204 0 751,078 604,126 365
Nonthaburi 388,939 0 189,167 199,772 1,421
Pathum Thani 953,660 0 536,937 416,723 445
Samut Prakan 627,558 1,857 230,483 395,218 1,008
Samut Sakon 545,217 10,601 133,341 401,275 499
Central Region 10,370,922 151,711 6,334,005 3,885,206 180
Chai Nat 1,543,591 3,713 1,165,728 374,150 142
Phra Nakhon Si Ayutthaya 1,597,900 0 1,092,641 505,259 290
Lop Buri 3,874,846 119,531 2,228,617 1,526,698 123
Saraburi 2,235,304 28,467 949,654 1,257,183 172
Sing Buri 514,049 0 433,675 80,374 271
Ang Thong 605,232 0 463,690 141,542 299
Eastern Region 22,814,063 4,692,142 10,394,196 7,727,725 116
Chanthaburi 3,961,250 1,166,962 1,545,822 1,248,466 79
Chachoengsao 3,344,375 724,219 1,788,757 831,399 120
Chon Buri 2,726,875 150,509 1,305,611 1,270,755 253
Trat 1,761,875 469,845 494,278 797,752 80
Nakhon Nayok 1,326,250 300,624 641,815 383,811 118
Prachin Buri 2,976,476 998,907 1,242,574 734,995 94
Rayong 2,220,000 131,064 1,273,862 815,074 151
Sa Kaeo 4,496,962 750,012 2,101,477 1,645,473 74
Western Region 26,904,427 9,865,049 7,170,403 9,868,975 84
Ratchaburi 3,247,789 816,640 1,127,565 1,303,584 159
Kanchanaburi 12,176,968 6,579,846 1,983,144 3,613,978 41
Suphan Buri 3,348,755 353,597 2,088,609 906,549 160
Samutshongkhram 260,442 7,156 112,232 141,054 491
Phetchaburi 3,890,711 1,340,466 664,130 1,886,115 74
Prachuap Khiri khan 3,979,762 767,344 1,194,723 2,017,695 76
Northeastern Region 105,533,963 13,114,948 57,429,749 34,989,266 127
Nakon Ratchasima 12,808,728 1,389,187 7,715,541 3,704,000 125
Buri Ram 6,451,178 327,657 3,803,346 2,320,175 149
Surin 5,077,535 168,906 3,535,333 1,373,296 171
Si Sa Ket 5,524,985 441,016 3,397,169 1,686,800 164
Ubon Ratchathani 9,840,526 1,548,360 4,776,985 3,515,181 113
Yasothon 2,601,040 230,626 1,627,928 742,486 133
Chaiyaphum 7,986,429 1,882,033 3,437,482 2,666,914 89
Amnat Charoen 1,975,785 646,562 1,319,964 9,259 116
Nong Bua Lam Phu 2,411,929 182,814 1,506,081 723,034 129
Khon Kaen 6,803,744 507,269 4,077,983 2,218,492 161
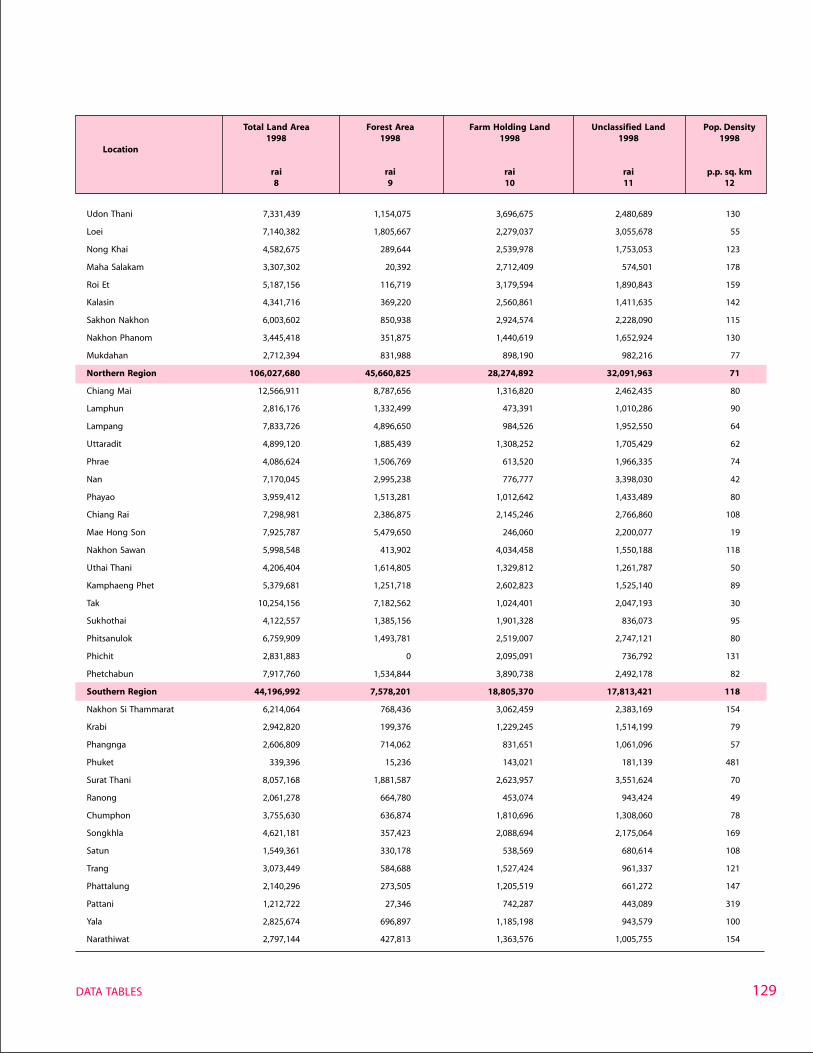
129DATA TABLES
Udon Thani 7,331,439 1,154,075 3,696,675 2,480,689 130
Loei 7,140,382 1,805,667 2,279,037 3,055,678 55
Nong Khai 4,582,675 289,644 2,539,978 1,753,053 123
Maha Salakam 3,307,302 20,392 2,712,409 574,501 178
Roi Et 5,187,156 116,719 3,179,594 1,890,843 159
Kalasin 4,341,716 369,220 2,560,861 1,411,635 142
Sakhon Nakhon 6,003,602 850,938 2,924,574 2,228,090 115
Nakhon Phanom 3,445,418 351,875 1,440,619 1,652,924 130
Mukdahan 2,712,394 831,988 898,190 982,216 77
Northern Region 106,027,680 45,660,825 28,274,892 32,091,963 71
Chiang Mai 12,566,911 8,787,656 1,316,820 2,462,435 80
Lamphun 2,816,176 1,332,499 473,391 1,010,286 90
Lampang 7,833,726 4,896,650 984,526 1,952,550 64
Uttaradit 4,899,120 1,885,439 1,308,252 1,705,429 62
Phrae 4,086,624 1,506,769 613,520 1,966,335 74
Nan 7,170,045 2,995,238 776,777 3,398,030 42
Phayao 3,959,412 1,513,281 1,012,642 1,433,489 80
Chiang Rai 7,298,981 2,386,875 2,145,246 2,766,860 108
Mae Hong Son 7,925,787 5,479,650 246,060 2,200,077 19
Nakhon Sawan 5,998,548 413,902 4,034,458 1,550,188 118
Uthai Thani 4,206,404 1,614,805 1,329,812 1,261,787 50
Kamphaeng Phet 5,379,681 1,251,718 2,602,823 1,525,140 89
Tak 10,254,156 7,182,562 1,024,401 2,047,193 30
Sukhothai 4,122,557 1,385,156 1,901,328 836,073 95
Phitsanulok 6,759,909 1,493,781 2,519,007 2,747,121 80
Phichit 2,831,883 0 2,095,091 736,792 131
Phetchabun 7,917,760 1,534,844 3,890,738 2,492,178 82
Southern Region 44,196,992 7,578,201 18,805,370 17,813,421 118
Nakhon Si Thammarat 6,214,064 768,436 3,062,459 2,383,169 154
Krabi 2,942,820 199,376 1,229,245 1,514,199 79
Phangnga 2,606,809 714,062 831,651 1,061,096 57
Phuket 339,396 15,236 143,021 181,139 481
Surat Thani 8,057,168 1,881,587 2,623,957 3,551,624 70
Ranong 2,061,278 664,780 453,074 943,424 49
Chumphon 3,755,630 636,874 1,810,696 1,308,060 78
Songkhla 4,621,181 357,423 2,088,694 2,175,064 169
Satun 1,549,361 330,178 538,569 680,614 108
Trang 3,073,449 584,688 1,527,424 961,337 121
Phattalung 2,140,296 273,505 1,205,519 661,272 147
Pattani 1,212,722 27,346 742,287 443,089 319
Yala 2,825,674 696,897 1,185,198 943,579 100
Narathiwat 2,797,144 427,813 1,363,576 1,005,755 154
Table 1 Basic Data
Total Land Area Forest Area Farm Holding Land Unclassified Land Pop. Density1998 1998 1998 1998 1998
Location
rai rai rai rai p.p. sq. km8 9 10 11 12
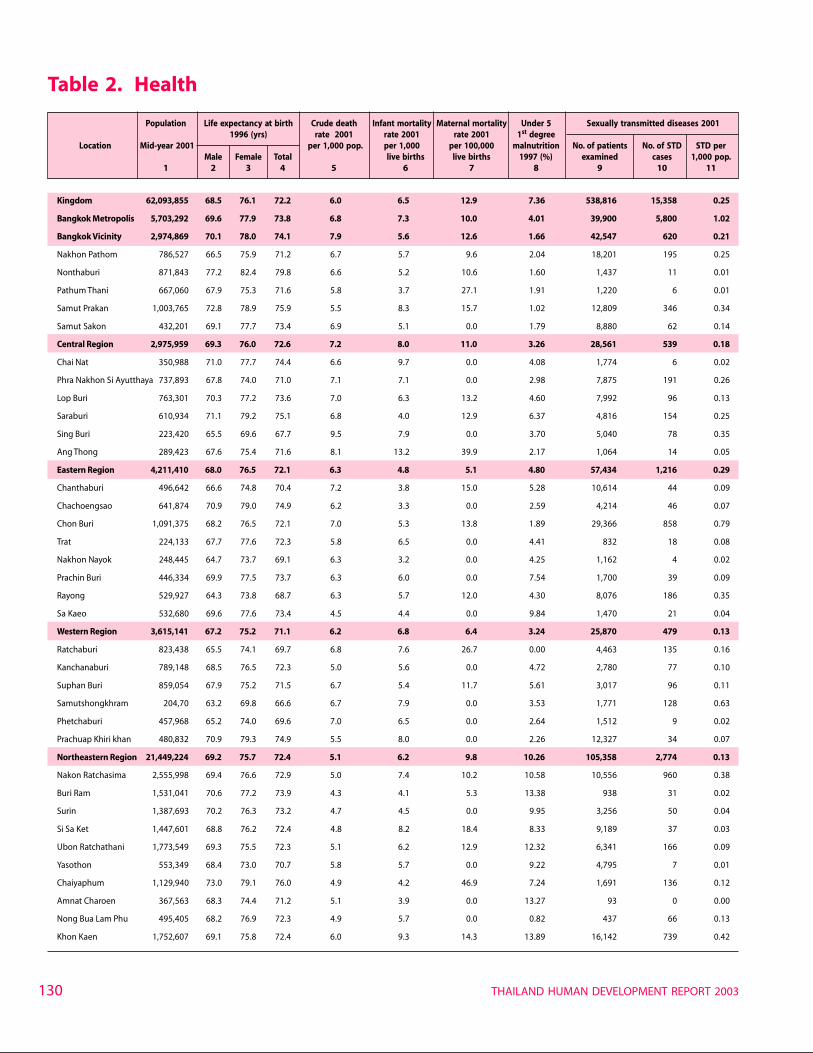
THAILAND HUMAN DEVELOPMENT REPORT 2003130
Table 2. Health
Population Life expectancy at birth Crude death Infant mortality Maternal mortality Under 5 Sexually transmitted diseases 20011996 (yrs) rate 2001 rate 2001 rate 2001 1st degree
Location Mid-year 2001 per 1,000 pop. per 1,000 per 100,000 malnutrition No. of patients No. of STD STD perMale Female Total live births live births 1997 (%) examined cases 1,000 pop.
1 2 3 4 5 6 7 8 9 10 11
Kingdom 62,093,855 68.5 76.1 72.2 6.0 6.5 12.9 7.36 538,816 15,358 0.25
Bangkok Metropolis 5,703,292 69.6 77.9 73.8 6.8 7.3 10.0 4.01 39,900 5,800 1.02
Bangkok Vicinity 2,974,869 70.1 78.0 74.1 7.9 5.6 12.6 1.66 42,547 620 0.21
Nakhon Pathom 786,527 66.5 75.9 71.2 6.7 5.7 9.6 2.04 18,201 195 0.25
Nonthaburi 871,843 77.2 82.4 79.8 6.6 5.2 10.6 1.60 1,437 11 0.01
Pathum Thani 667,060 67.9 75.3 71.6 5.8 3.7 27.1 1.91 1,220 6 0.01
Samut Prakan 1,003,765 72.8 78.9 75.9 5.5 8.3 15.7 1.02 12,809 346 0.34
Samut Sakon 432,201 69.1 77.7 73.4 6.9 5.1 0.0 1.79 8,880 62 0.14
Central Region 2,975,959 69.3 76.0 72.6 7.2 8.0 11.0 3.26 28,561 539 0.18
Chai Nat 350,988 71.0 77.7 74.4 6.6 9.7 0.0 4.08 1,774 6 0.02
Phra Nakhon Si Ayutthaya 737,893 67.8 74.0 71.0 7.1 7.1 0.0 2.98 7,875 191 0.26
Lop Buri 763,301 70.3 77.2 73.6 7.0 6.3 13.2 4.60 7,992 96 0.13
Saraburi 610,934 71.1 79.2 75.1 6.8 4.0 12.9 6.37 4,816 154 0.25
Sing Buri 223,420 65.5 69.6 67.7 9.5 7.9 0.0 3.70 5,040 78 0.35
Ang Thong 289,423 67.6 75.4 71.6 8.1 13.2 39.9 2.17 1,064 14 0.05
Eastern Region 4,211,410 68.0 76.5 72.1 6.3 4.8 5.1 4.80 57,434 1,216 0.29
Chanthaburi 496,642 66.6 74.8 70.4 7.2 3.8 15.0 5.28 10,614 44 0.09
Chachoengsao 641,874 70.9 79.0 74.9 6.2 3.3 0.0 2.59 4,214 46 0.07
Chon Buri 1,091,375 68.2 76.5 72.1 7.0 5.3 13.8 1.89 29,366 858 0.79
Trat 224,133 67.7 77.6 72.3 5.8 6.5 0.0 4.41 832 18 0.08
Nakhon Nayok 248,445 64.7 73.7 69.1 6.3 3.2 0.0 4.25 1,162 4 0.02
Prachin Buri 446,334 69.9 77.5 73.7 6.3 6.0 0.0 7.54 1,700 39 0.09
Rayong 529,927 64.3 73.8 68.7 6.3 5.7 12.0 4.30 8,076 186 0.35
Sa Kaeo 532,680 69.6 77.6 73.4 4.5 4.4 0.0 9.84 1,470 21 0.04
Western Region 3,615,141 67.2 75.2 71.1 6.2 6.8 6.4 3.24 25,870 479 0.13
Ratchaburi 823,438 65.5 74.1 69.7 6.8 7.6 26.7 0.00 4,463 135 0.16
Kanchanaburi 789,148 68.5 76.5 72.3 5.0 5.6 0.0 4.72 2,780 77 0.10
Suphan Buri 859,054 67.9 75.2 71.5 6.7 5.4 11.7 5.61 3,017 96 0.11
Samutshongkhram 204,70 63.2 69.8 66.6 6.7 7.9 0.0 3.53 1,771 128 0.63
Phetchaburi 457,968 65.2 74.0 69.6 7.0 6.5 0.0 2.64 1,512 9 0.02
Prachuap Khiri khan 480,832 70.9 79.3 74.9 5.5 8.0 0.0 2.26 12,327 34 0.07
Northeastern Region 21,449,224 69.2 75.7 72.4 5.1 6.2 9.8 10.26 105,358 2,774 0.13
Nakon Ratchasima 2,555,998 69.4 76.6 72.9 5.0 7.4 10.2 10.58 10,556 960 0.38
Buri Ram 1,531,041 70.6 77.2 73.9 4.3 4.1 5.3 13.38 938 31 0.02
Surin 1,387,693 70.2 76.3 73.2 4.7 4.5 0.0 9.95 3,256 50 0.04
Si Sa Ket 1,447,601 68.8 76.2 72.4 4.8 8.2 18.4 8.33 9,189 37 0.03
Ubon Ratchathani 1,773,549 69.3 75.5 72.3 5.1 6.2 12.9 12.32 6,341 166 0.09
Yasothon 553,349 68.4 73.0 70.7 5.8 5.7 0.0 9.22 4,795 7 0.01
Chaiyaphum 1,129,940 73.0 79.1 76.0 4.9 4.2 46.9 7.24 1,691 136 0.12
Amnat Charoen 367,563 68.3 74.4 71.2 5.1 3.9 0.0 13.27 93 0 0.00
Nong Bua Lam Phu 495,405 68.2 76.9 72.3 4.9 5.7 0.0 0.82 437 66 0.13
Khon Kaen 1,752,607 69.1 75.8 72.4 6.0 9.3 14.3 13.89 16,142 739 0.42
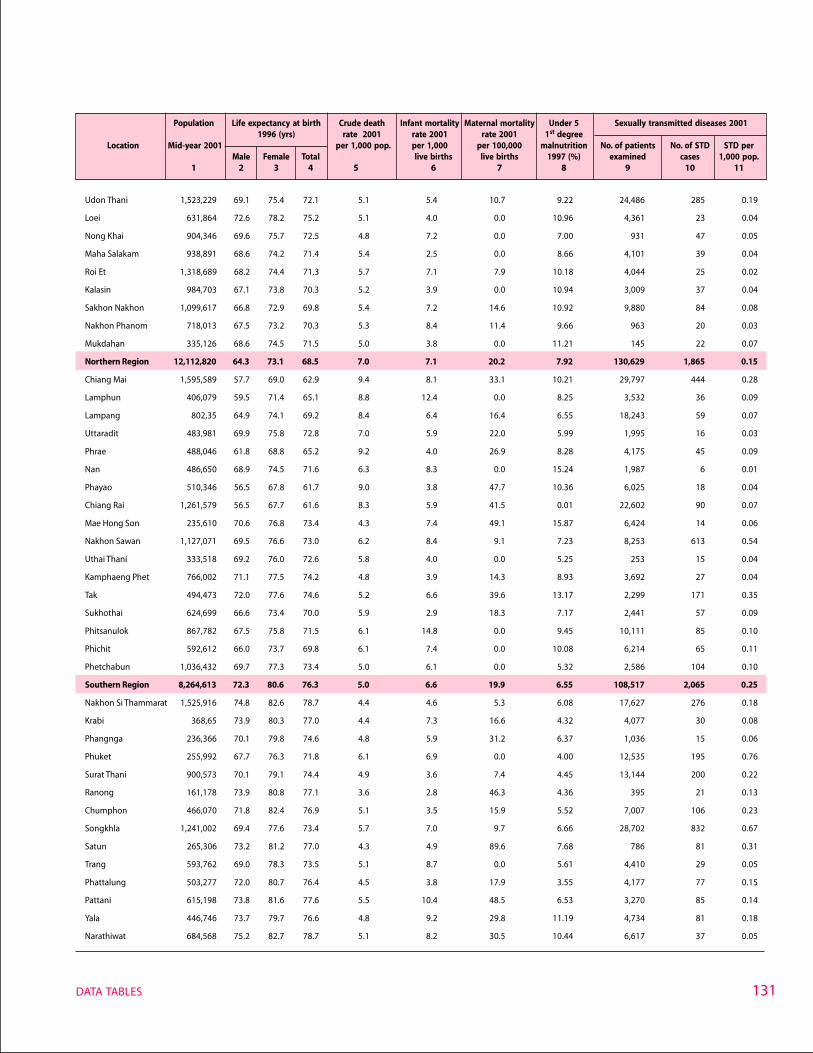
131DATA TABLES
Udon Thani 1,523,229 69.1 75.4 72.1 5.1 5.4 10.7 9.22 24,486 285 0.19
Loei 631,864 72.6 78.2 75.2 5.1 4.0 0.0 10.96 4,361 23 0.04
Nong Khai 904,346 69.6 75.7 72.5 4.8 7.2 0.0 7.00 931 47 0.05
Maha Salakam 938,891 68.6 74.2 71.4 5.4 2.5 0.0 8.66 4,101 39 0.04
Roi Et 1,318,689 68.2 74.4 71.3 5.7 7.1 7.9 10.18 4,044 25 0.02
Kalasin 984,703 67.1 73.8 70.3 5.2 3.9 0.0 10.94 3,009 37 0.04
Sakhon Nakhon 1,099,617 66.8 72.9 69.8 5.4 7.2 14.6 10.92 9,880 84 0.08
Nakhon Phanom 718,013 67.5 73.2 70.3 5.3 8.4 11.4 9.66 963 20 0.03
Mukdahan 335,126 68.6 74.5 71.5 5.0 3.8 0.0 11.21 145 22 0.07
Northern Region 12,112,820 64.3 73.1 68.5 7.0 7.1 20.2 7.92 130,629 1,865 0.15
Chiang Mai 1,595,589 57.7 69.0 62.9 9.4 8.1 33.1 10.21 29,797 444 0.28
Lamphun 406,079 59.5 71.4 65.1 8.8 12.4 0.0 8.25 3,532 36 0.09
Lampang 802,35 64.9 74.1 69.2 8.4 6.4 16.4 6.55 18,243 59 0.07
Uttaradit 483,981 69.9 75.8 72.8 7.0 5.9 22.0 5.99 1,995 16 0.03
Phrae 488,046 61.8 68.8 65.2 9.2 4.0 26.9 8.28 4,175 45 0.09
Nan 486,650 68.9 74.5 71.6 6.3 8.3 0.0 15.24 1,987 6 0.01
Phayao 510,346 56.5 67.8 61.7 9.0 3.8 47.7 10.36 6,025 18 0.04
Chiang Rai 1,261,579 56.5 67.7 61.6 8.3 5.9 41.5 0.01 22,602 90 0.07
Mae Hong Son 235,610 70.6 76.8 73.4 4.3 7.4 49.1 15.87 6,424 14 0.06
Nakhon Sawan 1,127,071 69.5 76.6 73.0 6.2 8.4 9.1 7.23 8,253 613 0.54
Uthai Thani 333,518 69.2 76.0 72.6 5.8 4.0 0.0 5.25 253 15 0.04
Kamphaeng Phet 766,002 71.1 77.5 74.2 4.8 3.9 14.3 8.93 3,692 27 0.04
Tak 494,473 72.0 77.6 74.6 5.2 6.6 39.6 13.17 2,299 171 0.35
Sukhothai 624,699 66.6 73.4 70.0 5.9 2.9 18.3 7.17 2,441 57 0.09
Phitsanulok 867,782 67.5 75.8 71.5 6.1 14.8 0.0 9.45 10,111 85 0.10
Phichit 592,612 66.0 73.7 69.8 6.1 7.4 0.0 10.08 6,214 65 0.11
Phetchabun 1,036,432 69.7 77.3 73.4 5.0 6.1 0.0 5.32 2,586 104 0.10
Southern Region 8,264,613 72.3 80.6 76.3 5.0 6.6 19.9 6.55 108,517 2,065 0.25
Nakhon Si Thammarat 1,525,916 74.8 82.6 78.7 4.4 4.6 5.3 6.08 17,627 276 0.18
Krabi 368,65 73.9 80.3 77.0 4.4 7.3 16.6 4.32 4,077 30 0.08
Phangnga 236,366 70.1 79.8 74.6 4.8 5.9 31.2 6.37 1,036 15 0.06
Phuket 255,992 67.7 76.3 71.8 6.1 6.9 0.0 4.00 12,535 195 0.76
Surat Thani 900,573 70.1 79.1 74.4 4.9 3.6 7.4 4.45 13,144 200 0.22
Ranong 161,178 73.9 80.8 77.1 3.6 2.8 46.3 4.36 395 21 0.13
Chumphon 466,070 71.8 82.4 76.9 5.1 3.5 15.9 5.52 7,007 106 0.23
Songkhla 1,241,002 69.4 77.6 73.4 5.7 7.0 9.7 6.66 28,702 832 0.67
Satun 265,306 73.2 81.2 77.0 4.3 4.9 89.6 7.68 786 81 0.31
Trang 593,762 69.0 78.3 73.5 5.1 8.7 0.0 5.61 4,410 29 0.05
Phattalung 503,277 72.0 80.7 76.4 4.5 3.8 17.9 3.55 4,177 77 0.15
Pattani 615,198 73.8 81.6 77.6 5.5 10.4 48.5 6.53 3,270 85 0.14
Yala 446,746 73.7 79.7 76.6 4.8 9.2 29.8 11.19 4,734 81 0.18
Narathiwat 684,568 75.2 82.7 78.7 5.1 8.2 30.5 10.44 6,617 37 0.05
Table 2 Health (Continued)
Population Life expectancy at birth Crude death Infant mortality Maternal mortality Under 5 Sexually transmitted diseases 20011996 (yrs) rate 2001 rate 2001 rate 2001 1st degree
Location Mid-year 2001 per 1,000 pop. per 1,000 per 100,000 malnutrition No. of patients No. of STD STD perMale Female Total live births live births 1997 (%) examined cases 1,000 pop.
1 2 3 4 5 6 7 8 9 10 11
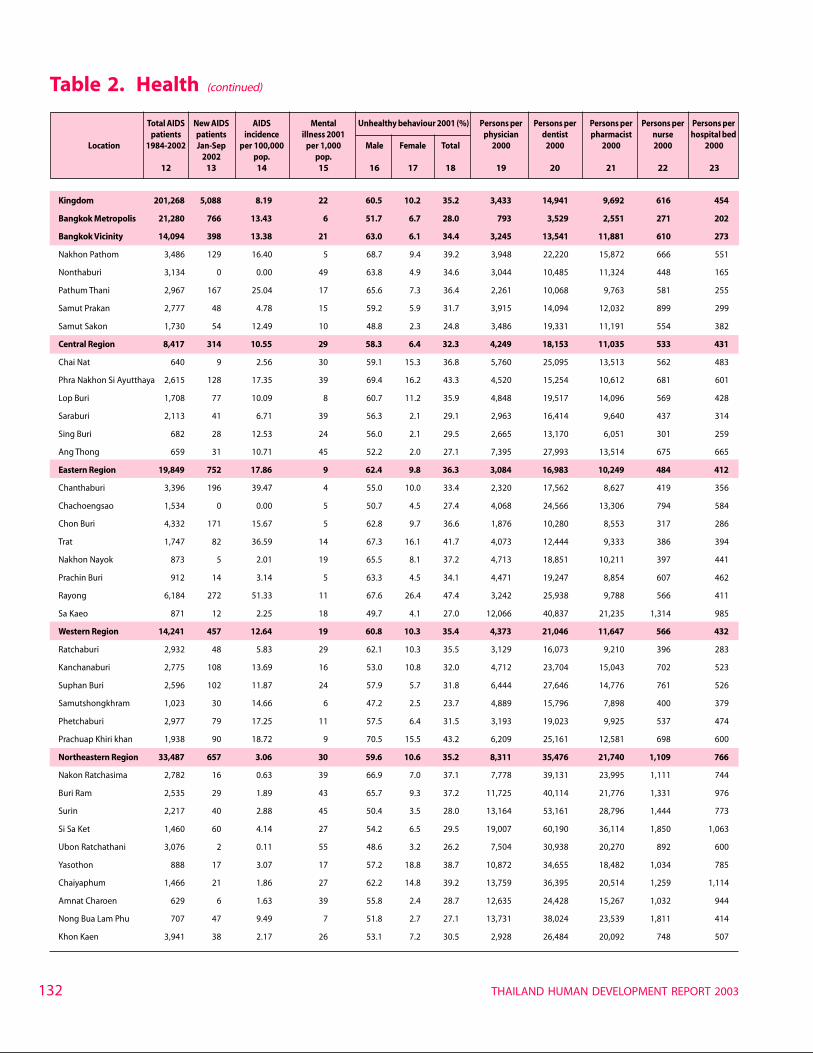
THAILAND HUMAN DEVELOPMENT REPORT 2003132
Table 2. Health (continued)
Total AIDS New AIDS AIDS Mental Unhealthy behaviour 2001 (%) Persons per Persons per Persons per Persons per Persons perpatients patients incidence illness 2001 physician dentist pharmacist nurse hospital bed
Location 1984-2002 Jan-Sep per 100,000 per 1,000 Male Female Total 2000 2000 2000 2000 20002002 pop. pop.
12 13 14 15 16 17 18 19 20 21 22 23
Kingdom 201,268 5,088 8.19 22 60.5 10.2 35.2 3,433 14,941 9,692 616 454
Bangkok Metropolis 21,280 766 13.43 6 51.7 6.7 28.0 793 3,529 2,551 271 202
Bangkok Vicinity 14,094 398 13.38 21 63.0 6.1 34.4 3,245 13,541 11,881 610 273
Nakhon Pathom 3,486 129 16.40 5 68.7 9.4 39.2 3,948 22,220 15,872 666 551
Nonthaburi 3,134 0 0.00 49 63.8 4.9 34.6 3,044 10,485 11,324 448 165
Pathum Thani 2,967 167 25.04 17 65.6 7.3 36.4 2,261 10,068 9,763 581 255
Samut Prakan 2,777 48 4.78 15 59.2 5.9 31.7 3,915 14,094 12,032 899 299
Samut Sakon 1,730 54 12.49 10 48.8 2.3 24.8 3,486 19,331 11,191 554 382
Central Region 8,417 314 10.55 29 58.3 6.4 32.3 4,249 18,153 11,035 533 431
Chai Nat 640 9 2.56 30 59.1 15.3 36.8 5,760 25,095 13,513 562 483
Phra Nakhon Si Ayutthaya 2,615 128 17.35 39 69.4 16.2 43.3 4,520 15,254 10,612 681 601
Lop Buri 1,708 77 10.09 8 60.7 11.2 35.9 4,848 19,517 14,096 569 428
Saraburi 2,113 41 6.71 39 56.3 2.1 29.1 2,963 16,414 9,640 437 314
Sing Buri 682 28 12.53 24 56.0 2.1 29.5 2,665 13,170 6,051 301 259
Ang Thong 659 31 10.71 45 52.2 2.0 27.1 7,395 27,993 13,514 675 665
Eastern Region 19,849 752 17.86 9 62.4 9.8 36.3 3,084 16,983 10,249 484 412
Chanthaburi 3,396 196 39.47 4 55.0 10.0 33.4 2,320 17,562 8,627 419 356
Chachoengsao 1,534 0 0.00 5 50.7 4.5 27.4 4,068 24,566 13,306 794 584
Chon Buri 4,332 171 15.67 5 62.8 9.7 36.6 1,876 10,280 8,553 317 286
Trat 1,747 82 36.59 14 67.3 16.1 41.7 4,073 12,444 9,333 386 394
Nakhon Nayok 873 5 2.01 19 65.5 8.1 37.2 4,713 18,851 10,211 397 441
Prachin Buri 912 14 3.14 5 63.3 4.5 34.1 4,471 19,247 8,854 607 462
Rayong 6,184 272 51.33 11 67.6 26.4 47.4 3,242 25,938 9,788 566 411
Sa Kaeo 871 12 2.25 18 49.7 4.1 27.0 12,066 40,837 21,235 1,314 985
Western Region 14,241 457 12.64 19 60.8 10.3 35.4 4,373 21,046 11,647 566 432
Ratchaburi 2,932 48 5.83 29 62.1 10.3 35.5 3,129 16,073 9,210 396 283
Kanchanaburi 2,775 108 13.69 16 53.0 10.8 32.0 4,712 23,704 15,043 702 523
Suphan Buri 2,596 102 11.87 24 57.9 5.7 31.8 6,444 27,646 14,776 761 526
Samutshongkhram 1,023 30 14.66 6 47.2 2.5 23.7 4,889 15,796 7,898 400 379
Phetchaburi 2,977 79 17.25 11 57.5 6.4 31.5 3,193 19,023 9,925 537 474
Prachuap Khiri khan 1,938 90 18.72 9 70.5 15.5 43.2 6,209 25,161 12,581 698 600
Northeastern Region 33,487 657 3.06 30 59.6 10.6 35.2 8,311 35,476 21,740 1,109 766
Nakon Ratchasima 2,782 16 0.63 39 66.9 7.0 37.1 7,778 39,131 23,995 1,111 744
Buri Ram 2,535 29 1.89 43 65.7 9.3 37.2 11,725 40,114 21,776 1,331 976
Surin 2,217 40 2.88 45 50.4 3.5 28.0 13,164 53,161 28,796 1,444 773
Si Sa Ket 1,460 60 4.14 27 54.2 6.5 29.5 19,007 60,190 36,114 1,850 1,063
Ubon Ratchathani 3,076 2 0.11 55 48.6 3.2 26.2 7,504 30,938 20,270 892 600
Yasothon 888 17 3.07 17 57.2 18.8 38.7 10,872 34,655 18,482 1,034 785
Chaiyaphum 1,466 21 1.86 27 62.2 14.8 39.2 13,759 36,395 20,514 1,259 1,114
Amnat Charoen 629 6 1.63 39 55.8 2.4 28.7 12,635 24,428 15,267 1,032 944
Nong Bua Lam Phu 707 47 9.49 7 51.8 2.7 27.1 13,731 38,024 23,539 1,811 414
Khon Kaen 3,941 38 2.17 26 53.1 7.2 30.5 2,928 26,484 20,092 748 507
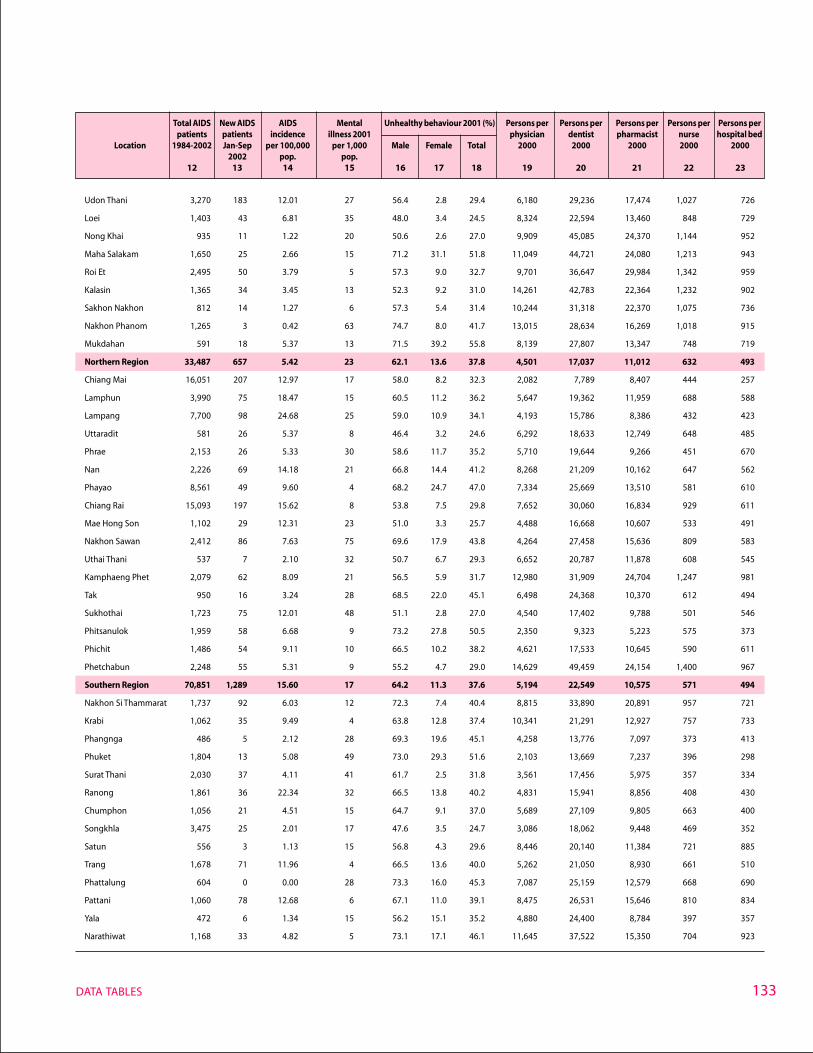
133DATA TABLES
Udon Thani 3,270 183 12.01 27 56.4 2.8 29.4 6,180 29,236 17,474 1,027 726
Loei 1,403 43 6.81 35 48.0 3.4 24.5 8,324 22,594 13,460 848 729
Nong Khai 935 11 1.22 20 50.6 2.6 27.0 9,909 45,085 24,370 1,144 952
Maha Salakam 1,650 25 2.66 15 71.2 31.1 51.8 11,049 44,721 24,080 1,213 943
Roi Et 2,495 50 3.79 5 57.3 9.0 32.7 9,701 36,647 29,984 1,342 959
Kalasin 1,365 34 3.45 13 52.3 9.2 31.0 14,261 42,783 22,364 1,232 902
Sakhon Nakhon 812 14 1.27 6 57.3 5.4 31.4 10,244 31,318 22,370 1,075 736
Nakhon Phanom 1,265 3 0.42 63 74.7 8.0 41.7 13,015 28,634 16,269 1,018 915
Mukdahan 591 18 5.37 13 71.5 39.2 55.8 8,139 27,807 13,347 748 719
Northern Region 33,487 657 5.42 23 62.1 13.6 37.8 4,501 17,037 11,012 632 493
Chiang Mai 16,051 207 12.97 17 58.0 8.2 32.3 2,082 7,789 8,407 444 257
Lamphun 3,990 75 18.47 15 60.5 11.2 36.2 5,647 19,362 11,959 688 588
Lampang 7,700 98 24.68 25 59.0 10.9 34.1 4,193 15,786 8,386 432 423
Uttaradit 581 26 5.37 8 46.4 3.2 24.6 6,292 18,633 12,749 648 485
Phrae 2,153 26 5.33 30 58.6 11.7 35.2 5,710 19,644 9,266 451 670
Nan 2,226 69 14.18 21 66.8 14.4 41.2 8,268 21,209 10,162 647 562
Phayao 8,561 49 9.60 4 68.2 24.7 47.0 7,334 25,669 13,510 581 610
Chiang Rai 15,093 197 15.62 8 53.8 7.5 29.8 7,652 30,060 16,834 929 611
Mae Hong Son 1,102 29 12.31 23 51.0 3.3 25.7 4,488 16,668 10,607 533 491
Nakhon Sawan 2,412 86 7.63 75 69.6 17.9 43.8 4,264 27,458 15,636 809 583
Uthai Thani 537 7 2.10 32 50.7 6.7 29.3 6,652 20,787 11,878 608 545
Kamphaeng Phet 2,079 62 8.09 21 56.5 5.9 31.7 12,980 31,909 24,704 1,247 981
Tak 950 16 3.24 28 68.5 22.0 45.1 6,498 24,368 10,370 612 494
Sukhothai 1,723 75 12.01 48 51.1 2.8 27.0 4,540 17,402 9,788 501 546
Phitsanulok 1,959 58 6.68 9 73.2 27.8 50.5 2,350 9,323 5,223 575 373
Phichit 1,486 54 9.11 10 66.5 10.2 38.2 4,621 17,533 10,645 590 611
Phetchabun 2,248 55 5.31 9 55.2 4.7 29.0 14,629 49,459 24,154 1,400 967
Southern Region 70,851 1,289 15.60 17 64.2 11.3 37.6 5,194 22,549 10,575 571 494
Nakhon Si Thammarat 1,737 92 6.03 12 72.3 7.4 40.4 8,815 33,890 20,891 957 721
Krabi 1,062 35 9.49 4 63.8 12.8 37.4 10,341 21,291 12,927 757 733
Phangnga 486 5 2.12 28 69.3 19.6 45.1 4,258 13,776 7,097 373 413
Phuket 1,804 13 5.08 49 73.0 29.3 51.6 2,103 13,669 7,237 396 298
Surat Thani 2,030 37 4.11 41 61.7 2.5 31.8 3,561 17,456 5,975 357 334
Ranong 1,861 36 22.34 32 66.5 13.8 40.2 4,831 15,941 8,856 408 430
Chumphon 1,056 21 4.51 15 64.7 9.1 37.0 5,689 27,109 9,805 663 400
Songkhla 3,475 25 2.01 17 47.6 3.5 24.7 3,086 18,062 9,448 469 352
Satun 556 3 1.13 15 56.8 4.3 29.6 8,446 20,140 11,384 721 885
Trang 1,678 71 11.96 4 66.5 13.6 40.0 5,262 21,050 8,930 661 510
Phattalung 604 0 0.00 28 73.3 16.0 45.3 7,087 25,159 12,579 668 690
Pattani 1,060 78 12.68 6 67.1 11.0 39.1 8,475 26,531 15,646 810 834
Yala 472 6 1.34 15 56.2 15.1 35.2 4,880 24,400 8,784 397 357
Narathiwat 1,168 33 4.82 5 73.1 17.1 46.1 11,645 37,522 15,350 704 923
Table 2 Health (Continued)
Total AIDS New AIDS AIDS Mental Unhealthy behaviour 2001 (%) Persons per Persons per Persons per Persons per Persons perpatients patients incidence illness 2001 physician dentist pharmacist nurse hospital bed
Location 1984-2002 Jan-Sep per 100,000 per 1,000 Male Female Total 2000 2000 2000 2000 20002002 pop. pop.
12 13 14 15 16 17 18 19 20 21 22 23
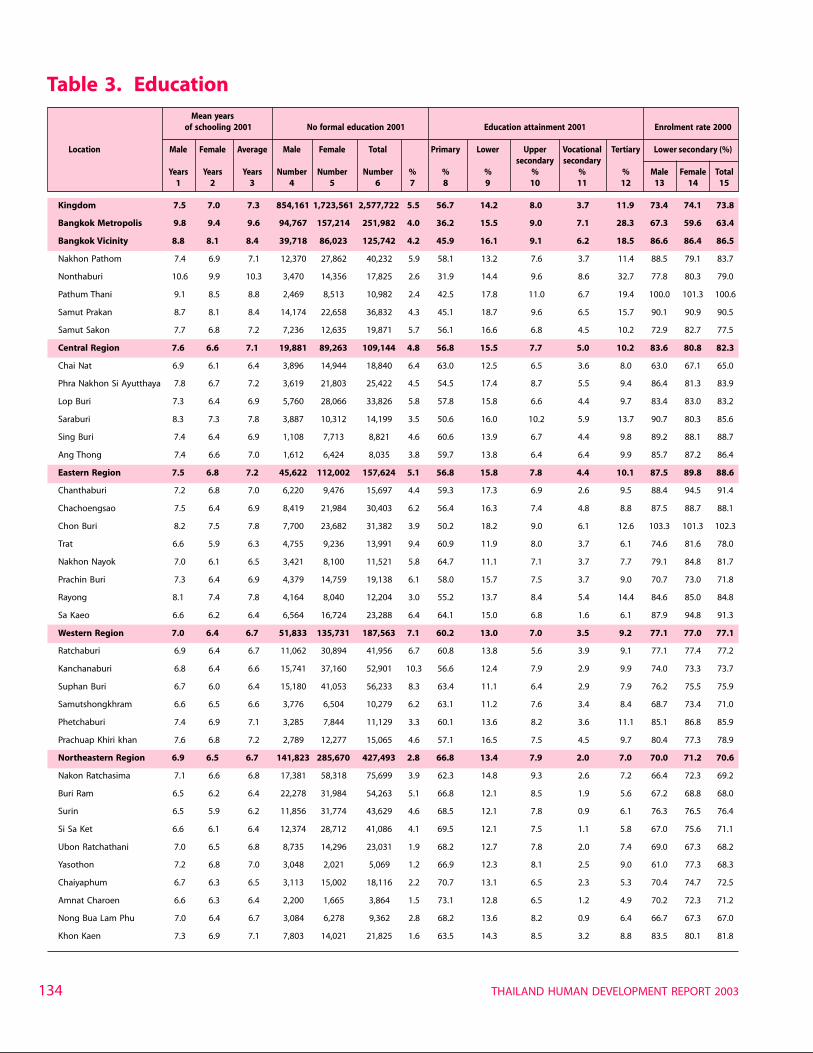
THAILAND HUMAN DEVELOPMENT REPORT 2003134
Table 3. EducationMean years
of schooling 2001 No formal education 2001 Education attainment 2001 Enrolment rate 2000
Location Male Female Average Male Female Total Primary Lower Upper Vocational Tertiary Lower secondary (%)secondary secondary
Years Years Years Number Number Number % % % % % % Male Female Total1 2 3 4 5 6 7 8 9 10 11 12 13 14 15
Kingdom 7.5 7.0 7.3 854,161 1,723,561 2,577,722 5.5 56.7 14.2 8.0 3.7 11.9 73.4 74.1 73.8
Bangkok Metropolis 9.8 9.4 9.6 94,767 157,214 251,982 4.0 36.2 15.5 9.0 7.1 28.3 67.3 59.6 63.4
Bangkok Vicinity 8.8 8.1 8.4 39,718 86,023 125,742 4.2 45.9 16.1 9.1 6.2 18.5 86.6 86.4 86.5
Nakhon Pathom 7.4 6.9 7.1 12,370 27,862 40,232 5.9 58.1 13.2 7.6 3.7 11.4 88.5 79.1 83.7
Nonthaburi 10.6 9.9 10.3 3,470 14,356 17,825 2.6 31.9 14.4 9.6 8.6 32.7 77.8 80.3 79.0
Pathum Thani 9.1 8.5 8.8 2,469 8,513 10,982 2.4 42.5 17.8 11.0 6.7 19.4 100.0 101.3 100.6
Samut Prakan 8.7 8.1 8.4 14,174 22,658 36,832 4.3 45.1 18.7 9.6 6.5 15.7 90.1 90.9 90.5
Samut Sakon 7.7 6.8 7.2 7,236 12,635 19,871 5.7 56.1 16.6 6.8 4.5 10.2 72.9 82.7 77.5
Central Region 7.6 6.6 7.1 19,881 89,263 109,144 4.8 56.8 15.5 7.7 5.0 10.2 83.6 80.8 82.3
Chai Nat 6.9 6.1 6.4 3,896 14,944 18,840 6.4 63.0 12.5 6.5 3.6 8.0 63.0 67.1 65.0
Phra Nakhon Si Ayutthaya 7.8 6.7 7.2 3,619 21,803 25,422 4.5 54.5 17.4 8.7 5.5 9.4 86.4 81.3 83.9
Lop Buri 7.3 6.4 6.9 5,760 28,066 33,826 5.8 57.8 15.8 6.6 4.4 9.7 83.4 83.0 83.2
Saraburi 8.3 7.3 7.8 3,887 10,312 14,199 3.5 50.6 16.0 10.2 5.9 13.7 90.7 80.3 85.6
Sing Buri 7.4 6.4 6.9 1,108 7,713 8,821 4.6 60.6 13.9 6.7 4.4 9.8 89.2 88.1 88.7
Ang Thong 7.4 6.6 7.0 1,612 6,424 8,035 3.8 59.7 13.8 6.4 6.4 9.9 85.7 87.2 86.4
Eastern Region 7.5 6.8 7.2 45,622 112,002 157,624 5.1 56.8 15.8 7.8 4.4 10.1 87.5 89.8 88.6
Chanthaburi 7.2 6.8 7.0 6,220 9,476 15,697 4.4 59.3 17.3 6.9 2.6 9.5 88.4 94.5 91.4
Chachoengsao 7.5 6.4 6.9 8,419 21,984 30,403 6.2 56.4 16.3 7.4 4.8 8.8 87.5 88.7 88.1
Chon Buri 8.2 7.5 7.8 7,700 23,682 31,382 3.9 50.2 18.2 9.0 6.1 12.6 103.3 101.3 102.3
Trat 6.6 5.9 6.3 4,755 9,236 13,991 9.4 60.9 11.9 8.0 3.7 6.1 74.6 81.6 78.0
Nakhon Nayok 7.0 6.1 6.5 3,421 8,100 11,521 5.8 64.7 11.1 7.1 3.7 7.7 79.1 84.8 81.7
Prachin Buri 7.3 6.4 6.9 4,379 14,759 19,138 6.1 58.0 15.7 7.5 3.7 9.0 70.7 73.0 71.8
Rayong 8.1 7.4 7.8 4,164 8,040 12,204 3.0 55.2 13.7 8.4 5.4 14.4 84.6 85.0 84.8
Sa Kaeo 6.6 6.2 6.4 6,564 16,724 23,288 6.4 64.1 15.0 6.8 1.6 6.1 87.9 94.8 91.3
Western Region 7.0 6.4 6.7 51,833 135,731 187,563 7.1 60.2 13.0 7.0 3.5 9.2 77.1 77.0 77.1
Ratchaburi 6.9 6.4 6.7 11,062 30,894 41,956 6.7 60.8 13.8 5.6 3.9 9.1 77.1 77.4 77.2
Kanchanaburi 6.8 6.4 6.6 15,741 37,160 52,901 10.3 56.6 12.4 7.9 2.9 9.9 74.0 73.3 73.7
Suphan Buri 6.7 6.0 6.4 15,180 41,053 56,233 8.3 63.4 11.1 6.4 2.9 7.9 76.2 75.5 75.9
Samutshongkhram 6.6 6.5 6.6 3,776 6,504 10,279 6.2 63.1 11.2 7.6 3.4 8.4 68.7 73.4 71.0
Phetchaburi 7.4 6.9 7.1 3,285 7,844 11,129 3.3 60.1 13.6 8.2 3.6 11.1 85.1 86.8 85.9
Prachuap Khiri khan 7.6 6.8 7.2 2,789 12,277 15,065 4.6 57.1 16.5 7.5 4.5 9.7 80.4 77.3 78.9
Northeastern Region 6.9 6.5 6.7 141,823 285,670 427,493 2.8 66.8 13.4 7.9 2.0 7.0 70.0 71.2 70.6
Nakon Ratchasima 7.1 6.6 6.8 17,381 58,318 75,699 3.9 62.3 14.8 9.3 2.6 7.2 66.4 72.3 69.2
Buri Ram 6.5 6.2 6.4 22,278 31,984 54,263 5.1 66.8 12.1 8.5 1.9 5.6 67.2 68.8 68.0
Surin 6.5 5.9 6.2 11,856 31,774 43,629 4.6 68.5 12.1 7.8 0.9 6.1 76.3 76.5 76.4
Si Sa Ket 6.6 6.1 6.4 12,374 28,712 41,086 4.1 69.5 12.1 7.5 1.1 5.8 67.0 75.6 71.1
Ubon Ratchathani 7.0 6.5 6.8 8,735 14,296 23,031 1.9 68.2 12.7 7.8 2.0 7.4 69.0 67.3 68.2
Yasothon 7.2 6.8 7.0 3,048 2,021 5,069 1.2 66.9 12.3 8.1 2.5 9.0 61.0 77.3 68.3
Chaiyaphum 6.7 6.3 6.5 3,113 15,002 18,116 2.2 70.7 13.1 6.5 2.3 5.3 70.4 74.7 72.5
Amnat Charoen 6.6 6.3 6.4 2,200 1,665 3,864 1.5 73.1 12.8 6.5 1.2 4.9 70.2 72.3 71.2
Nong Bua Lam Phu 7.0 6.4 6.7 3,084 6,278 9,362 2.8 68.2 13.6 8.2 0.9 6.4 66.7 67.3 67.0
Khon Kaen 7.3 6.9 7.1 7,803 14,021 21,825 1.6 63.5 14.3 8.5 3.2 8.8 83.5 80.1 81.8
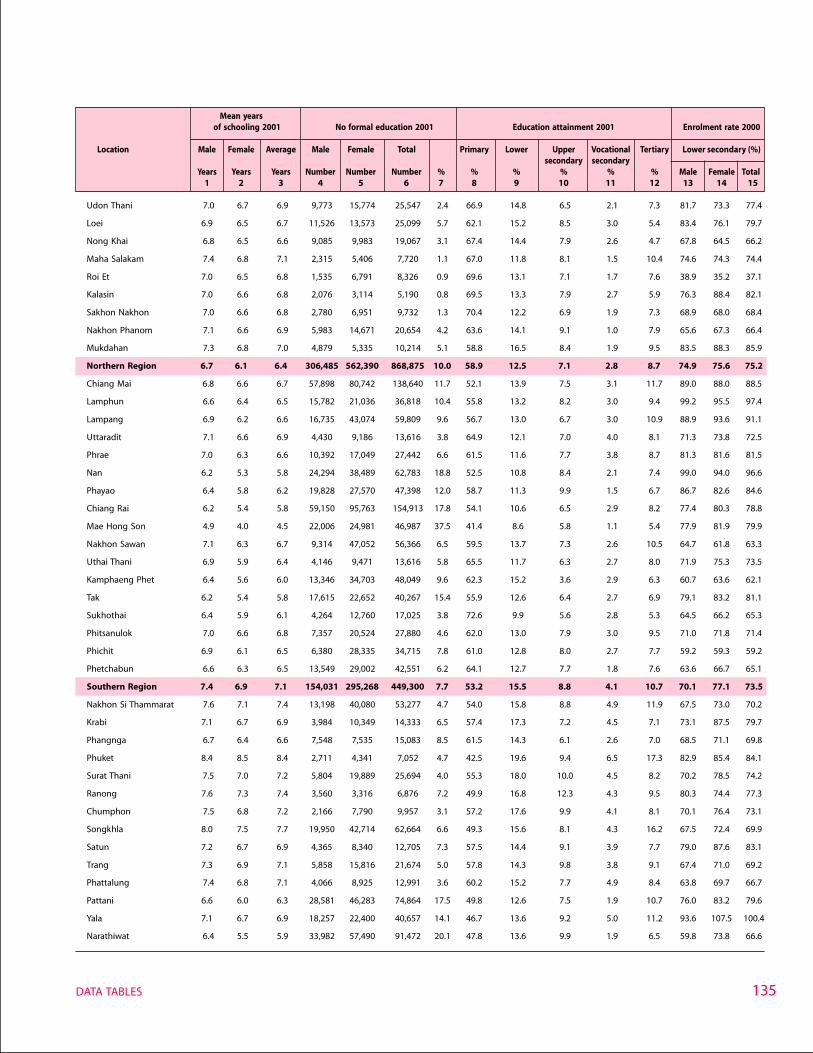
135DATA TABLES
Udon Thani 7.0 6.7 6.9 9,773 15,774 25,547 2.4 66.9 14.8 6.5 2.1 7.3 81.7 73.3 77.4
Loei 6.9 6.5 6.7 11,526 13,573 25,099 5.7 62.1 15.2 8.5 3.0 5.4 83.4 76.1 79.7
Nong Khai 6.8 6.5 6.6 9,085 9,983 19,067 3.1 67.4 14.4 7.9 2.6 4.7 67.8 64.5 66.2
Maha Salakam 7.4 6.8 7.1 2,315 5,406 7,720 1.1 67.0 11.8 8.1 1.5 10.4 74.6 74.3 74.4
Roi Et 7.0 6.5 6.8 1,535 6,791 8,326 0.9 69.6 13.1 7.1 1.7 7.6 38.9 35.2 37.1
Kalasin 7.0 6.6 6.8 2,076 3,114 5,190 0.8 69.5 13.3 7.9 2.7 5.9 76.3 88.4 82.1
Sakhon Nakhon 7.0 6.6 6.8 2,780 6,951 9,732 1.3 70.4 12.2 6.9 1.9 7.3 68.9 68.0 68.4
Nakhon Phanom 7.1 6.6 6.9 5,983 14,671 20,654 4.2 63.6 14.1 9.1 1.0 7.9 65.6 67.3 66.4
Mukdahan 7.3 6.8 7.0 4,879 5,335 10,214 5.1 58.8 16.5 8.4 1.9 9.5 83.5 88.3 85.9
Northern Region 6.7 6.1 6.4 306,485 562,390 868,875 10.0 58.9 12.5 7.1 2.8 8.7 74.9 75.6 75.2
Chiang Mai 6.8 6.6 6.7 57,898 80,742 138,640 11.7 52.1 13.9 7.5 3.1 11.7 89.0 88.0 88.5
Lamphun 6.6 6.4 6.5 15,782 21,036 36,818 10.4 55.8 13.2 8.2 3.0 9.4 99.2 95.5 97.4
Lampang 6.9 6.2 6.6 16,735 43,074 59,809 9.6 56.7 13.0 6.7 3.0 10.9 88.9 93.6 91.1
Uttaradit 7.1 6.6 6.9 4,430 9,186 13,616 3.8 64.9 12.1 7.0 4.0 8.1 71.3 73.8 72.5
Phrae 7.0 6.3 6.6 10,392 17,049 27,442 6.6 61.5 11.6 7.7 3.8 8.7 81.3 81.6 81.5
Nan 6.2 5.3 5.8 24,294 38,489 62,783 18.8 52.5 10.8 8.4 2.1 7.4 99.0 94.0 96.6
Phayao 6.4 5.8 6.2 19,828 27,570 47,398 12.0 58.7 11.3 9.9 1.5 6.7 86.7 82.6 84.6
Chiang Rai 6.2 5.4 5.8 59,150 95,763 154,913 17.8 54.1 10.6 6.5 2.9 8.2 77.4 80.3 78.8
Mae Hong Son 4.9 4.0 4.5 22,006 24,981 46,987 37.5 41.4 8.6 5.8 1.1 5.4 77.9 81.9 79.9
Nakhon Sawan 7.1 6.3 6.7 9,314 47,052 56,366 6.5 59.5 13.7 7.3 2.6 10.5 64.7 61.8 63.3
Uthai Thani 6.9 5.9 6.4 4,146 9,471 13,616 5.8 65.5 11.7 6.3 2.7 8.0 71.9 75.3 73.5
Kamphaeng Phet 6.4 5.6 6.0 13,346 34,703 48,049 9.6 62.3 15.2 3.6 2.9 6.3 60.7 63.6 62.1
Tak 6.2 5.4 5.8 17,615 22,652 40,267 15.4 55.9 12.6 6.4 2.7 6.9 79.1 83.2 81.1
Sukhothai 6.4 5.9 6.1 4,264 12,760 17,025 3.8 72.6 9.9 5.6 2.8 5.3 64.5 66.2 65.3
Phitsanulok 7.0 6.6 6.8 7,357 20,524 27,880 4.6 62.0 13.0 7.9 3.0 9.5 71.0 71.8 71.4
Phichit 6.9 6.1 6.5 6,380 28,335 34,715 7.8 61.0 12.8 8.0 2.7 7.7 59.2 59.3 59.2
Phetchabun 6.6 6.3 6.5 13,549 29,002 42,551 6.2 64.1 12.7 7.7 1.8 7.6 63.6 66.7 65.1
Southern Region 7.4 6.9 7.1 154,031 295,268 449,300 7.7 53.2 15.5 8.8 4.1 10.7 70.1 77.1 73.5
Nakhon Si Thammarat 7.6 7.1 7.4 13,198 40,080 53,277 4.7 54.0 15.8 8.8 4.9 11.9 67.5 73.0 70.2
Krabi 7.1 6.7 6.9 3,984 10,349 14,333 6.5 57.4 17.3 7.2 4.5 7.1 73.1 87.5 79.7
Phangnga 6.7 6.4 6.6 7,548 7,535 15,083 8.5 61.5 14.3 6.1 2.6 7.0 68.5 71.1 69.8
Phuket 8.4 8.5 8.4 2,711 4,341 7,052 4.7 42.5 19.6 9.4 6.5 17.3 82.9 85.4 84.1
Surat Thani 7.5 7.0 7.2 5,804 19,889 25,694 4.0 55.3 18.0 10.0 4.5 8.2 70.2 78.5 74.2
Ranong 7.6 7.3 7.4 3,560 3,316 6,876 7.2 49.9 16.8 12.3 4.3 9.5 80.3 74.4 77.3
Chumphon 7.5 6.8 7.2 2,166 7,790 9,957 3.1 57.2 17.6 9.9 4.1 8.1 70.1 76.4 73.1
Songkhla 8.0 7.5 7.7 19,950 42,714 62,664 6.6 49.3 15.6 8.1 4.3 16.2 67.5 72.4 69.9
Satun 7.2 6.7 6.9 4,365 8,340 12,705 7.3 57.5 14.4 9.1 3.9 7.7 79.0 87.6 83.1
Trang 7.3 6.9 7.1 5,858 15,816 21,674 5.0 57.8 14.3 9.8 3.8 9.1 67.4 71.0 69.2
Phattalung 7.4 6.8 7.1 4,066 8,925 12,991 3.6 60.2 15.2 7.7 4.9 8.4 63.8 69.7 66.7
Pattani 6.6 6.0 6.3 28,581 46,283 74,864 17.5 49.8 12.6 7.5 1.9 10.7 76.0 83.2 79.6
Yala 7.1 6.7 6.9 18,257 22,400 40,657 14.1 46.7 13.6 9.2 5.0 11.2 93.6 107.5 100.4
Narathiwat 6.4 5.5 5.9 33,982 57,490 91,472 20.1 47.8 13.6 9.9 1.9 6.5 59.8 73.8 66.6
Table 3 Education (Continued)
Mean yearsof schooling 2001 No formal education 2001 Education attainment 2001 Enrolment rate 2000
Location Male Female Average Male Female Total Primary Lower Upper Vocational Tertiary Lower secondary (%)secondary secondary
Years Years Years Number Number Number % % % % % % Male Female Total1 2 3 4 5 6 7 8 9 10 11 12 13 14 15
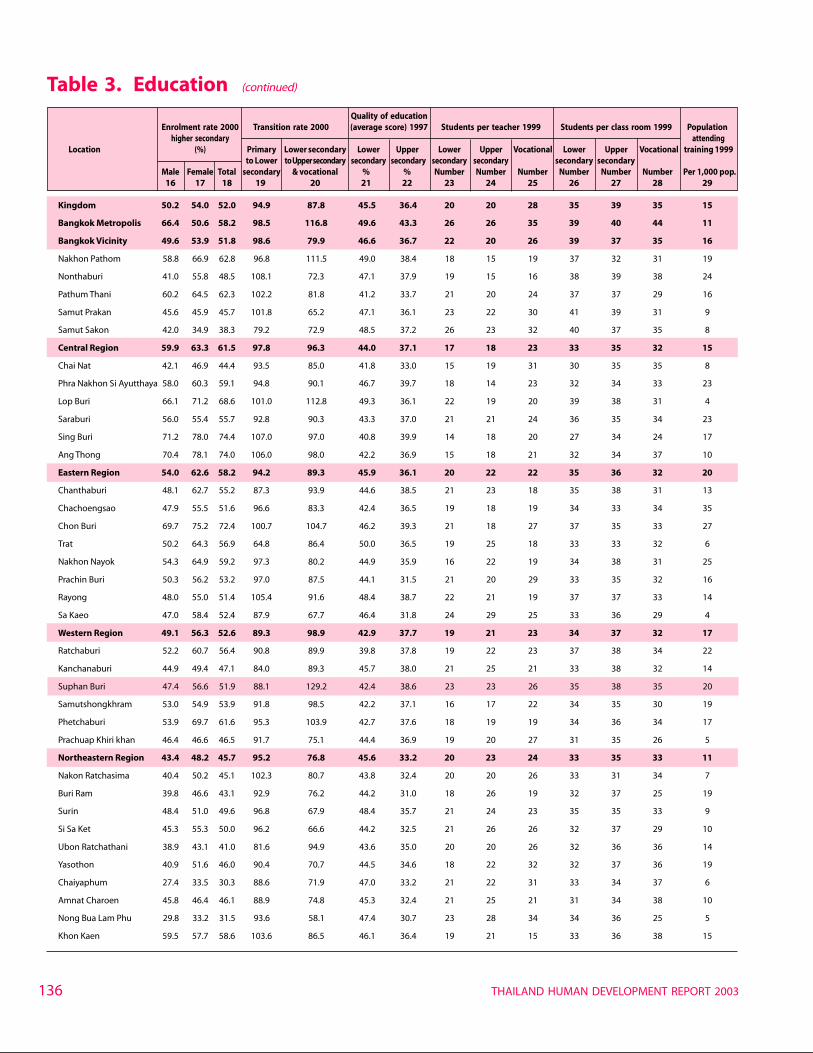
THAILAND HUMAN DEVELOPMENT REPORT 2003136
Table 3. Education (continued)
Quality of educationEnrolment rate 2000 Transition rate 2000 (average score) 1997 Students per teacher 1999 Students per class room 1999 Population
higher secondary attendingLocation (%) Primary Lower secondary Lower Upper Lower Upper Vocational Lower Upper Vocational training 1999
to Lower to Upper secondary secondary secondary secondary secondary secondary secondaryMale Female Total secondary & vocational % % Number Number Number Number Number Number Per 1,000 pop.
16 17 18 19 20 21 22 23 24 25 26 27 28 29
Kingdom 50.2 54.0 52.0 94.9 87.8 45.5 36.4 20 20 28 35 39 35 15
Bangkok Metropolis 66.4 50.6 58.2 98.5 116.8 49.6 43.3 26 26 35 39 40 44 11
Bangkok Vicinity 49.6 53.9 51.8 98.6 79.9 46.6 36.7 22 20 26 39 37 35 16
Nakhon Pathom 58.8 66.9 62.8 96.8 111.5 49.0 38.4 18 15 19 37 32 31 19
Nonthaburi 41.0 55.8 48.5 108.1 72.3 47.1 37.9 19 15 16 38 39 38 24
Pathum Thani 60.2 64.5 62.3 102.2 81.8 41.2 33.7 21 20 24 37 37 29 16
Samut Prakan 45.6 45.9 45.7 101.8 65.2 47.1 36.1 23 22 30 41 39 31 9
Samut Sakon 42.0 34.9 38.3 79.2 72.9 48.5 37.2 26 23 32 40 37 35 8
Central Region 59.9 63.3 61.5 97.8 96.3 44.0 37.1 17 18 23 33 35 32 15
Chai Nat 42.1 46.9 44.4 93.5 85.0 41.8 33.0 15 19 31 30 35 35 8
Phra Nakhon Si Ayutthaya 58.0 60.3 59.1 94.8 90.1 46.7 39.7 18 14 23 32 34 33 23
Lop Buri 66.1 71.2 68.6 101.0 112.8 49.3 36.1 22 19 20 39 38 31 4
Saraburi 56.0 55.4 55.7 92.8 90.3 43.3 37.0 21 21 24 36 35 34 23
Sing Buri 71.2 78.0 74.4 107.0 97.0 40.8 39.9 14 18 20 27 34 24 17
Ang Thong 70.4 78.1 74.0 106.0 98.0 42.2 36.9 15 18 21 32 34 37 10
Eastern Region 54.0 62.6 58.2 94.2 89.3 45.9 36.1 20 22 22 35 36 32 20
Chanthaburi 48.1 62.7 55.2 87.3 93.9 44.6 38.5 21 23 18 35 38 31 13
Chachoengsao 47.9 55.5 51.6 96.6 83.3 42.4 36.5 19 18 19 34 33 34 35
Chon Buri 69.7 75.2 72.4 100.7 104.7 46.2 39.3 21 18 27 37 35 33 27
Trat 50.2 64.3 56.9 64.8 86.4 50.0 36.5 19 25 18 33 33 32 6
Nakhon Nayok 54.3 64.9 59.2 97.3 80.2 44.9 35.9 16 22 19 34 38 31 25
Prachin Buri 50.3 56.2 53.2 97.0 87.5 44.1 31.5 21 20 29 33 35 32 16
Rayong 48.0 55.0 51.4 105.4 91.6 48.4 38.7 22 21 19 37 37 33 14
Sa Kaeo 47.0 58.4 52.4 87.9 67.7 46.4 31.8 24 29 25 33 36 29 4
Western Region 49.1 56.3 52.6 89.3 98.9 42.9 37.7 19 21 23 34 37 32 17
Ratchaburi 52.2 60.7 56.4 90.8 89.9 39.8 37.8 19 22 23 37 38 34 22
Kanchanaburi 44.9 49.4 47.1 84.0 89.3 45.7 38.0 21 25 21 33 38 32 14
Suphan Buri 47.4 56.6 51.9 88.1 129.2 42.4 38.6 23 23 26 35 38 35 20
Samutshongkhram 53.0 54.9 53.9 91.8 98.5 42.2 37.1 16 17 22 34 35 30 19
Phetchaburi 53.9 69.7 61.6 95.3 103.9 42.7 37.6 18 19 19 34 36 34 17
Prachuap Khiri khan 46.4 46.6 46.5 91.7 75.1 44.4 36.9 19 20 27 31 35 26 5
Northeastern Region 43.4 48.2 45.7 95.2 76.8 45.6 33.2 20 23 24 33 35 33 11
Nakon Ratchasima 40.4 50.2 45.1 102.3 80.7 43.8 32.4 20 20 26 33 31 34 7
Buri Ram 39.8 46.6 43.1 92.9 76.2 44.2 31.0 18 26 19 32 37 25 19
Surin 48.4 51.0 49.6 96.8 67.9 48.4 35.7 21 24 23 35 35 33 9
Si Sa Ket 45.3 55.3 50.0 96.2 66.6 44.2 32.5 21 26 26 32 37 29 10
Ubon Ratchathani 38.9 43.1 41.0 81.6 94.9 43.6 35.0 20 20 26 32 36 36 14
Yasothon 40.9 51.6 46.0 90.4 70.7 44.5 34.6 18 22 32 32 37 36 19
Chaiyaphum 27.4 33.5 30.3 88.6 71.9 47.0 33.2 21 22 31 33 34 37 6
Amnat Charoen 45.8 46.4 46.1 88.9 74.8 45.3 32.4 21 25 21 31 34 38 10
Nong Bua Lam Phu 29.8 33.2 31.5 93.6 58.1 47.4 30.7 23 28 34 34 36 25 5
Khon Kaen 59.5 57.7 58.6 103.6 86.5 46.1 36.4 19 21 15 33 36 38 15
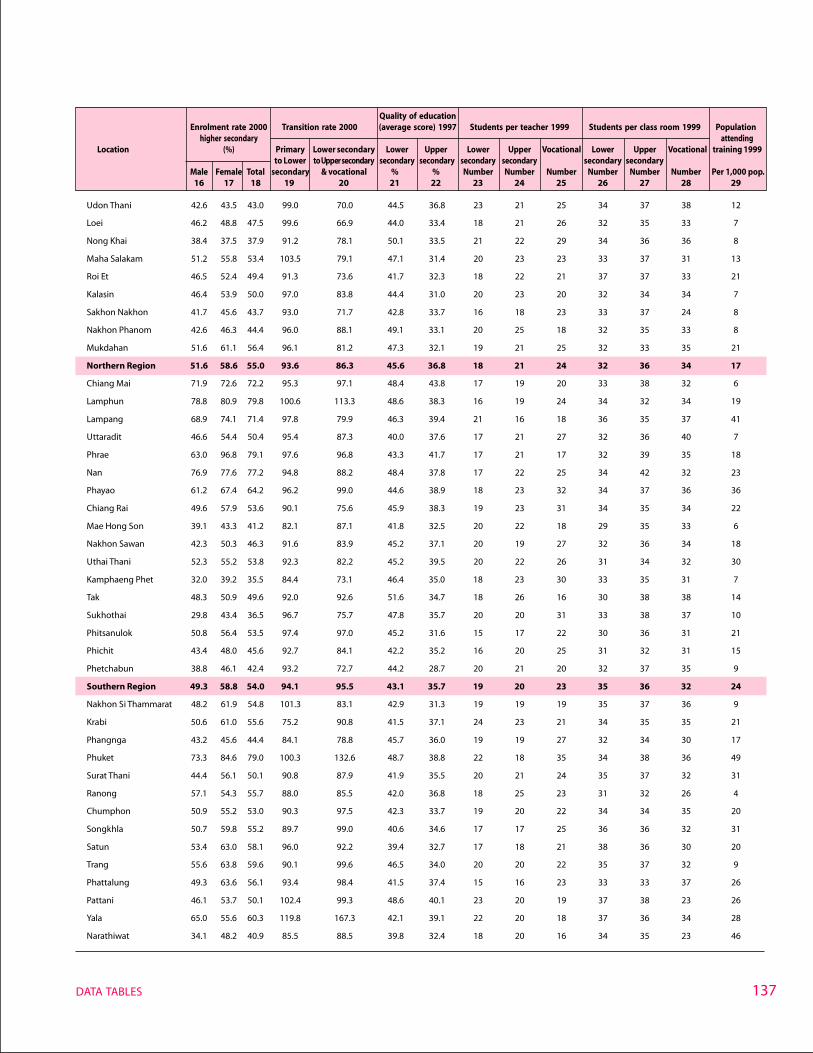
137DATA TABLES
Udon Thani 42.6 43.5 43.0 99.0 70.0 44.5 36.8 23 21 25 34 37 38 12
Loei 46.2 48.8 47.5 99.6 66.9 44.0 33.4 18 21 26 32 35 33 7
Nong Khai 38.4 37.5 37.9 91.2 78.1 50.1 33.5 21 22 29 34 36 36 8
Maha Salakam 51.2 55.8 53.4 103.5 79.1 47.1 31.4 20 23 23 33 37 31 13
Roi Et 46.5 52.4 49.4 91.3 73.6 41.7 32.3 18 22 21 37 37 33 21
Kalasin 46.4 53.9 50.0 97.0 83.8 44.4 31.0 20 23 20 32 34 34 7
Sakhon Nakhon 41.7 45.6 43.7 93.0 71.7 42.8 33.7 16 18 23 33 37 24 8
Nakhon Phanom 42.6 46.3 44.4 96.0 88.1 49.1 33.1 20 25 18 32 35 33 8
Mukdahan 51.6 61.1 56.4 96.1 81.2 47.3 32.1 19 21 25 32 33 35 21
Northern Region 51.6 58.6 55.0 93.6 86.3 45.6 36.8 18 21 24 32 36 34 17
Chiang Mai 71.9 72.6 72.2 95.3 97.1 48.4 43.8 17 19 20 33 38 32 6
Lamphun 78.8 80.9 79.8 100.6 113.3 48.6 38.3 16 19 24 34 32 34 19
Lampang 68.9 74.1 71.4 97.8 79.9 46.3 39.4 21 16 18 36 35 37 41
Uttaradit 46.6 54.4 50.4 95.4 87.3 40.0 37.6 17 21 27 32 36 40 7
Phrae 63.0 96.8 79.1 97.6 96.8 43.3 41.7 17 21 17 32 39 35 18
Nan 76.9 77.6 77.2 94.8 88.2 48.4 37.8 17 22 25 34 42 32 23
Phayao 61.2 67.4 64.2 96.2 99.0 44.6 38.9 18 23 32 34 37 36 36
Chiang Rai 49.6 57.9 53.6 90.1 75.6 45.9 38.3 19 23 31 34 35 34 22
Mae Hong Son 39.1 43.3 41.2 82.1 87.1 41.8 32.5 20 22 18 29 35 33 6
Nakhon Sawan 42.3 50.3 46.3 91.6 83.9 45.2 37.1 20 19 27 32 36 34 18
Uthai Thani 52.3 55.2 53.8 92.3 82.2 45.2 39.5 20 22 26 31 34 32 30
Kamphaeng Phet 32.0 39.2 35.5 84.4 73.1 46.4 35.0 18 23 30 33 35 31 7
Tak 48.3 50.9 49.6 92.0 92.6 51.6 34.7 18 26 16 30 38 38 14
Sukhothai 29.8 43.4 36.5 96.7 75.7 47.8 35.7 20 20 31 33 38 37 10
Phitsanulok 50.8 56.4 53.5 97.4 97.0 45.2 31.6 15 17 22 30 36 31 21
Phichit 43.4 48.0 45.6 92.7 84.1 42.2 35.2 16 20 25 31 32 31 15
Phetchabun 38.8 46.1 42.4 93.2 72.7 44.2 28.7 20 21 20 32 37 35 9
Southern Region 49.3 58.8 54.0 94.1 95.5 43.1 35.7 19 20 23 35 36 32 24
Nakhon Si Thammarat 48.2 61.9 54.8 101.3 83.1 42.9 31.3 19 19 19 35 37 36 9
Krabi 50.6 61.0 55.6 75.2 90.8 41.5 37.1 24 23 21 34 35 35 21
Phangnga 43.2 45.6 44.4 84.1 78.8 45.7 36.0 19 19 27 32 34 30 17
Phuket 73.3 84.6 79.0 100.3 132.6 48.7 38.8 22 18 35 34 38 36 49
Surat Thani 44.4 56.1 50.1 90.8 87.9 41.9 35.5 20 21 24 35 37 32 31
Ranong 57.1 54.3 55.7 88.0 85.5 42.0 36.8 18 25 23 31 32 26 4
Chumphon 50.9 55.2 53.0 90.3 97.5 42.3 33.7 19 20 22 34 34 35 20
Songkhla 50.7 59.8 55.2 89.7 99.0 40.6 34.6 17 17 25 36 36 32 31
Satun 53.4 63.0 58.1 96.0 92.2 39.4 32.7 17 18 21 38 36 30 20
Trang 55.6 63.8 59.6 90.1 99.6 46.5 34.0 20 20 22 35 37 32 9
Phattalung 49.3 63.6 56.1 93.4 98.4 41.5 37.4 15 16 23 33 33 37 26
Pattani 46.1 53.7 50.1 102.4 99.3 48.6 40.1 23 20 19 37 38 23 26
Yala 65.0 55.6 60.3 119.8 167.3 42.1 39.1 22 20 18 37 36 34 28
Narathiwat 34.1 48.2 40.9 85.5 88.5 39.8 32.4 18 20 16 34 35 23 46
Table 3 EducationQuality of education
Enrolment rate 2000 Transition rate 2000 (average score) 1997 Students per teacher 1999 Students per class room 1999 Populationhigher secondary attending
Location (%) Primary Lower secondary Lower Upper Lower Upper Vocational Lower Upper Vocational training 1999to Lower to Upper secondary secondary secondary secondary secondary secondary secondary
Male Female Total secondary & vocational % % Number Number Number Number Number Number Per 1,000 pop.16 17 18 19 20 21 22 23 24 25 26 27 28 29
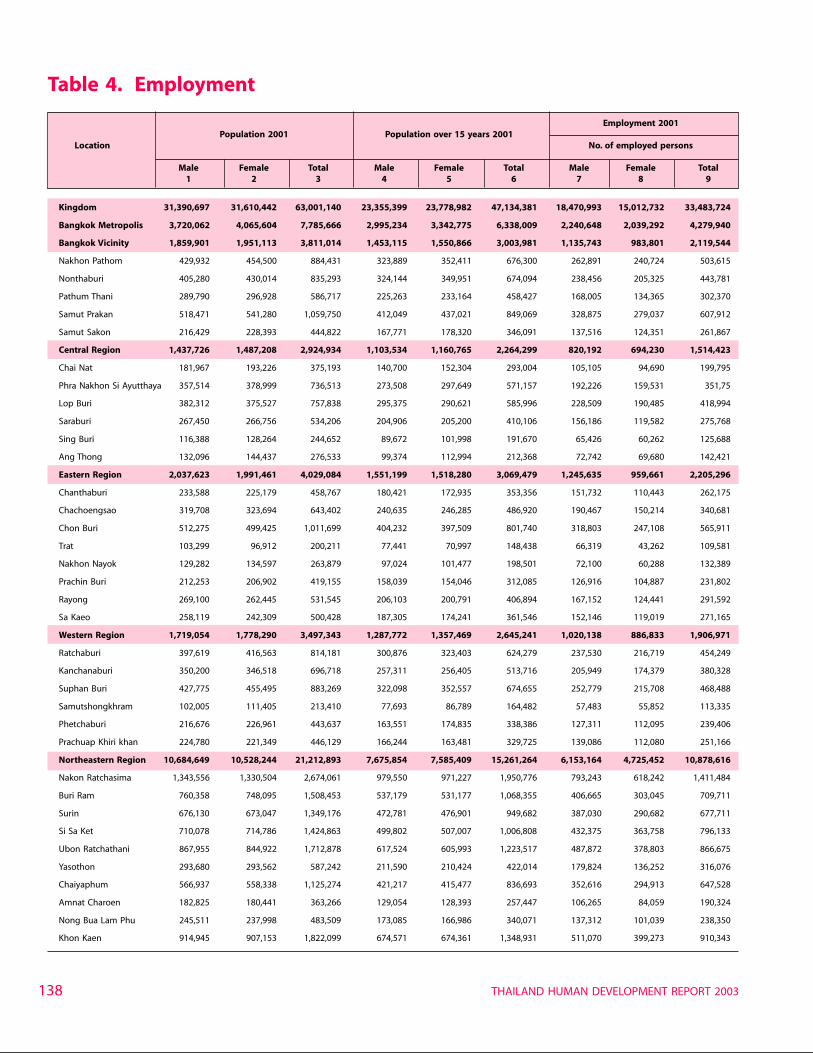
THAILAND HUMAN DEVELOPMENT REPORT 2003138
Table 4. Employment
Employment 2001Population 2001 Population over 15 years 2001
Location No. of employed persons
Male Female Total Male Female Total Male Female Total1 2 3 4 5 6 7 8 9
Kingdom 31,390,697 31,610,442 63,001,140 23,355,399 23,778,982 47,134,381 18,470,993 15,012,732 33,483,724
Bangkok Metropolis 3,720,062 4,065,604 7,785,666 2,995,234 3,342,775 6,338,009 2,240,648 2,039,292 4,279,940
Bangkok Vicinity 1,859,901 1,951,113 3,811,014 1,453,115 1,550,866 3,003,981 1,135,743 983,801 2,119,544
Nakhon Pathom 429,932 454,500 884,431 323,889 352,411 676,300 262,891 240,724 503,615
Nonthaburi 405,280 430,014 835,293 324,144 349,951 674,094 238,456 205,325 443,781
Pathum Thani 289,790 296,928 586,717 225,263 233,164 458,427 168,005 134,365 302,370
Samut Prakan 518,471 541,280 1,059,750 412,049 437,021 849,069 328,875 279,037 607,912
Samut Sakon 216,429 228,393 444,822 167,771 178,320 346,091 137,516 124,351 261,867
Central Region 1,437,726 1,487,208 2,924,934 1,103,534 1,160,765 2,264,299 820,192 694,230 1,514,423
Chai Nat 181,967 193,226 375,193 140,700 152,304 293,004 105,105 94,690 199,795
Phra Nakhon Si Ayutthaya 357,514 378,999 736,513 273,508 297,649 571,157 192,226 159,531 351,75
Lop Buri 382,312 375,527 757,838 295,375 290,621 585,996 228,509 190,485 418,994
Saraburi 267,450 266,756 534,206 204,906 205,200 410,106 156,186 119,582 275,768
Sing Buri 116,388 128,264 244,652 89,672 101,998 191,670 65,426 60,262 125,688
Ang Thong 132,096 144,437 276,533 99,374 112,994 212,368 72,742 69,680 142,421
Eastern Region 2,037,623 1,991,461 4,029,084 1,551,199 1,518,280 3,069,479 1,245,635 959,661 2,205,296
Chanthaburi 233,588 225,179 458,767 180,421 172,935 353,356 151,732 110,443 262,175
Chachoengsao 319,708 323,694 643,402 240,635 246,285 486,920 190,467 150,214 340,681
Chon Buri 512,275 499,425 1,011,699 404,232 397,509 801,740 318,803 247,108 565,911
Trat 103,299 96,912 200,211 77,441 70,997 148,438 66,319 43,262 109,581
Nakhon Nayok 129,282 134,597 263,879 97,024 101,477 198,501 72,100 60,288 132,389
Prachin Buri 212,253 206,902 419,155 158,039 154,046 312,085 126,916 104,887 231,802
Rayong 269,100 262,445 531,545 206,103 200,791 406,894 167,152 124,441 291,592
Sa Kaeo 258,119 242,309 500,428 187,305 174,241 361,546 152,146 119,019 271,165
Western Region 1,719,054 1,778,290 3,497,343 1,287,772 1,357,469 2,645,241 1,020,138 886,833 1,906,971
Ratchaburi 397,619 416,563 814,181 300,876 323,403 624,279 237,530 216,719 454,249
Kanchanaburi 350,200 346,518 696,718 257,311 256,405 513,716 205,949 174,379 380,328
Suphan Buri 427,775 455,495 883,269 322,098 352,557 674,655 252,779 215,708 468,488
Samutshongkhram 102,005 111,405 213,410 77,693 86,789 164,482 57,483 55,852 113,335
Phetchaburi 216,676 226,961 443,637 163,551 174,835 338,386 127,311 112,095 239,406
Prachuap Khiri khan 224,780 221,349 446,129 166,244 163,481 329,725 139,086 112,080 251,166
Northeastern Region 10,684,649 10,528,244 21,212,893 7,675,854 7,585,409 15,261,264 6,153,164 4,725,452 10,878,616
Nakon Ratchasima 1,343,556 1,330,504 2,674,061 979,550 971,227 1,950,776 793,243 618,242 1,411,484
Buri Ram 760,358 748,095 1,508,453 537,179 531,177 1,068,355 406,665 303,045 709,711
Surin 676,130 673,047 1,349,176 472,781 476,901 949,682 387,030 290,682 677,711
Si Sa Ket 710,078 714,786 1,424,863 499,802 507,007 1,006,808 432,375 363,758 796,133
Ubon Ratchathani 867,955 844,922 1,712,878 617,524 605,993 1,223,517 487,872 378,803 866,675
Yasothon 293,680 293,562 587,242 211,590 210,424 422,014 179,824 136,252 316,076
Chaiyaphum 566,937 558,338 1,125,274 421,217 415,477 836,693 352,616 294,913 647,528
Amnat Charoen 182,825 180,441 363,266 129,054 128,393 257,447 106,265 84,059 190,324
Nong Bua Lam Phu 245,511 237,998 483,509 173,085 166,986 340,071 137,312 101,039 238,350
Khon Kaen 914,945 907,153 1,822,099 674,571 674,361 1,348,931 511,070 399,273 910,343
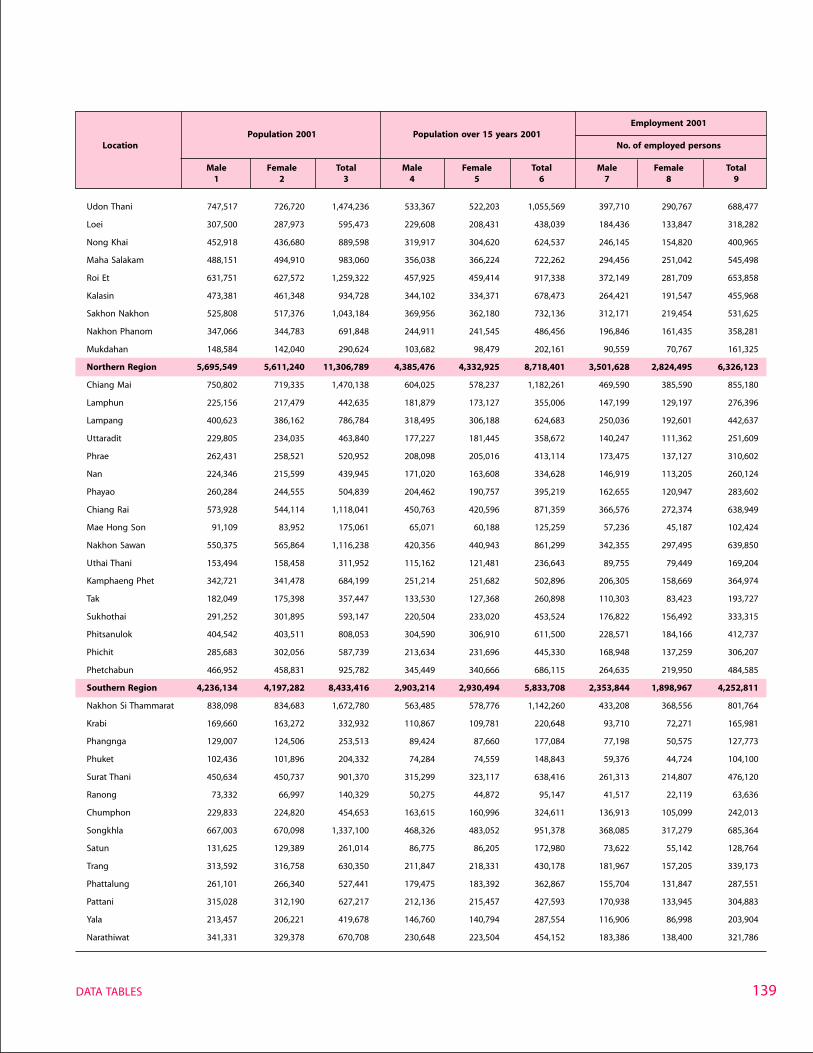
139DATA TABLES
Udon Thani 747,517 726,720 1,474,236 533,367 522,203 1,055,569 397,710 290,767 688,477
Loei 307,500 287,973 595,473 229,608 208,431 438,039 184,436 133,847 318,282
Nong Khai 452,918 436,680 889,598 319,917 304,620 624,537 246,145 154,820 400,965
Maha Salakam 488,151 494,910 983,060 356,038 366,224 722,262 294,456 251,042 545,498
Roi Et 631,751 627,572 1,259,322 457,925 459,414 917,338 372,149 281,709 653,858
Kalasin 473,381 461,348 934,728 344,102 334,371 678,473 264,421 191,547 455,968
Sakhon Nakhon 525,808 517,376 1,043,184 369,956 362,180 732,136 312,171 219,454 531,625
Nakhon Phanom 347,066 344,783 691,848 244,911 241,545 486,456 196,846 161,435 358,281
Mukdahan 148,584 142,040 290,624 103,682 98,479 202,161 90,559 70,767 161,325
Northern Region 5,695,549 5,611,240 11,306,789 4,385,476 4,332,925 8,718,401 3,501,628 2,824,495 6,326,123
Chiang Mai 750,802 719,335 1,470,138 604,025 578,237 1,182,261 469,590 385,590 855,180
Lamphun 225,156 217,479 442,635 181,879 173,127 355,006 147,199 129,197 276,396
Lampang 400,623 386,162 786,784 318,495 306,188 624,683 250,036 192,601 442,637
Uttaradit 229,805 234,035 463,840 177,227 181,445 358,672 140,247 111,362 251,609
Phrae 262,431 258,521 520,952 208,098 205,016 413,114 173,475 137,127 310,602
Nan 224,346 215,599 439,945 171,020 163,608 334,628 146,919 113,205 260,124
Phayao 260,284 244,555 504,839 204,462 190,757 395,219 162,655 120,947 283,602
Chiang Rai 573,928 544,114 1,118,041 450,763 420,596 871,359 366,576 272,374 638,949
Mae Hong Son 91,109 83,952 175,061 65,071 60,188 125,259 57,236 45,187 102,424
Nakhon Sawan 550,375 565,864 1,116,238 420,356 440,943 861,299 342,355 297,495 639,850
Uthai Thani 153,494 158,458 311,952 115,162 121,481 236,643 89,755 79,449 169,204
Kamphaeng Phet 342,721 341,478 684,199 251,214 251,682 502,896 206,305 158,669 364,974
Tak 182,049 175,398 357,447 133,530 127,368 260,898 110,303 83,423 193,727
Sukhothai 291,252 301,895 593,147 220,504 233,020 453,524 176,822 156,492 333,315
Phitsanulok 404,542 403,511 808,053 304,590 306,910 611,500 228,571 184,166 412,737
Phichit 285,683 302,056 587,739 213,634 231,696 445,330 168,948 137,259 306,207
Phetchabun 466,952 458,831 925,782 345,449 340,666 686,115 264,635 219,950 484,585
Southern Region 4,236,134 4,197,282 8,433,416 2,903,214 2,930,494 5,833,708 2,353,844 1,898,967 4,252,811
Nakhon Si Thammarat 838,098 834,683 1,672,780 563,485 578,776 1,142,260 433,208 368,556 801,764
Krabi 169,660 163,272 332,932 110,867 109,781 220,648 93,710 72,271 165,981
Phangnga 129,007 124,506 253,513 89,424 87,660 177,084 77,198 50,575 127,773
Phuket 102,436 101,896 204,332 74,284 74,559 148,843 59,376 44,724 104,100
Surat Thani 450,634 450,737 901,370 315,299 323,117 638,416 261,313 214,807 476,120
Ranong 73,332 66,997 140,329 50,275 44,872 95,147 41,517 22,119 63,636
Chumphon 229,833 224,820 454,653 163,615 160,996 324,611 136,913 105,099 242,013
Songkhla 667,003 670,098 1,337,100 468,326 483,052 951,378 368,085 317,279 685,364
Satun 131,625 129,389 261,014 86,775 86,205 172,980 73,622 55,142 128,764
Trang 313,592 316,758 630,350 211,847 218,331 430,178 181,967 157,205 339,173
Phattalung 261,101 266,340 527,441 179,475 183,392 362,867 155,704 131,847 287,551
Pattani 315,028 312,190 627,217 212,136 215,457 427,593 170,938 133,945 304,883
Yala 213,457 206,221 419,678 146,760 140,794 287,554 116,906 86,998 203,904
Narathiwat 341,331 329,378 670,708 230,648 223,504 454,152 183,386 138,400 321,786
Table 4 Employment (Continued)
Employment 2001Population 2001 Population over 15 years 2001
Location No. of employed persons
Male Female Total Male Female Total Male Female Total1 2 3 4 5 6 7 8 9
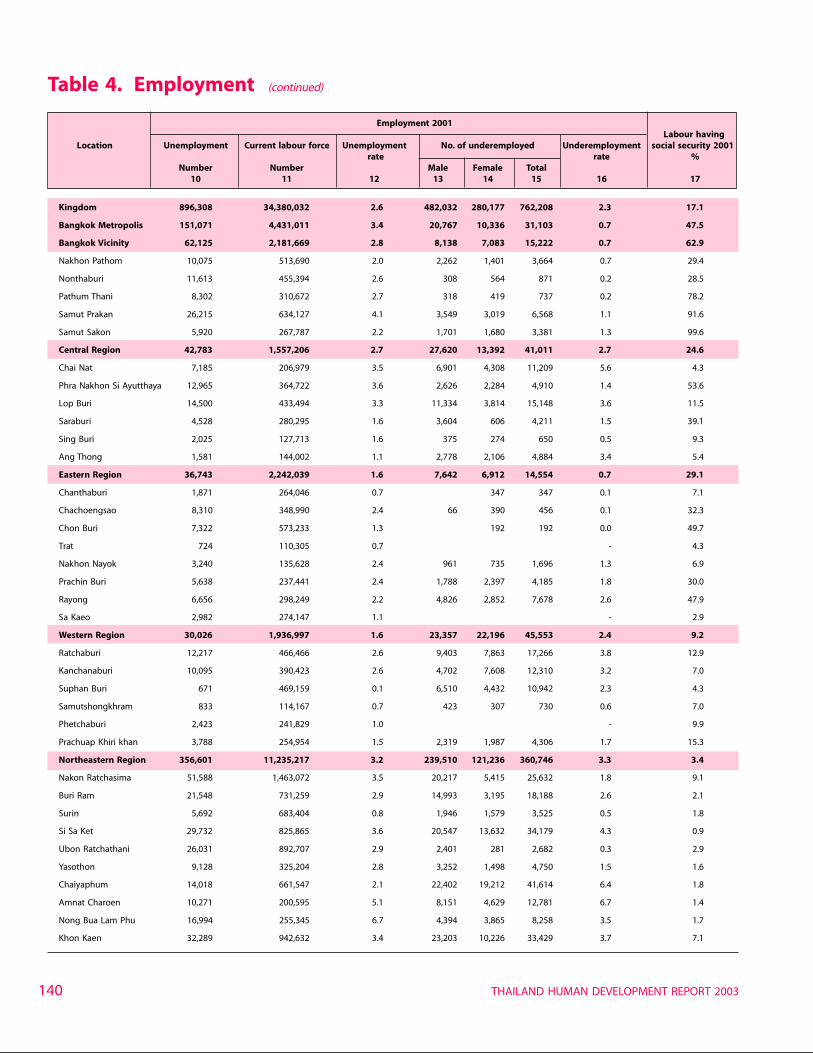
THAILAND HUMAN DEVELOPMENT REPORT 2003140
Table 4. Employment (continued)
Employment 2001Labour having
Location Unemployment Current labour force Unemployment No. of underemployed Underemployment social security 2001 rate rate %
Number Number Male Female Total10 11 12 13 14 15 16 17
Kingdom 896,308 34,380,032 2.6 482,032 280,177 762,208 2.3 17.1
Bangkok Metropolis 151,071 4,431,011 3.4 20,767 10,336 31,103 0.7 47.5
Bangkok Vicinity 62,125 2,181,669 2.8 8,138 7,083 15,222 0.7 62.9
Nakhon Pathom 10,075 513,690 2.0 2,262 1,401 3,664 0.7 29.4
Nonthaburi 11,613 455,394 2.6 308 564 871 0.2 28.5
Pathum Thani 8,302 310,672 2.7 318 419 737 0.2 78.2
Samut Prakan 26,215 634,127 4.1 3,549 3,019 6,568 1.1 91.6
Samut Sakon 5,920 267,787 2.2 1,701 1,680 3,381 1.3 99.6
Central Region 42,783 1,557,206 2.7 27,620 13,392 41,011 2.7 24.6
Chai Nat 7,185 206,979 3.5 6,901 4,308 11,209 5.6 4.3
Phra Nakhon Si Ayutthaya 12,965 364,722 3.6 2,626 2,284 4,910 1.4 53.6
Lop Buri 14,500 433,494 3.3 11,334 3,814 15,148 3.6 11.5
Saraburi 4,528 280,295 1.6 3,604 606 4,211 1.5 39.1
Sing Buri 2,025 127,713 1.6 375 274 650 0.5 9.3
Ang Thong 1,581 144,002 1.1 2,778 2,106 4,884 3.4 5.4
Eastern Region 36,743 2,242,039 1.6 7,642 6,912 14,554 0.7 29.1
Chanthaburi 1,871 264,046 0.7 347 347 0.1 7.1
Chachoengsao 8,310 348,990 2.4 66 390 456 0.1 32.3
Chon Buri 7,322 573,233 1.3 192 192 0.0 49.7
Trat 724 110,305 0.7 - 4.3
Nakhon Nayok 3,240 135,628 2.4 961 735 1,696 1.3 6.9
Prachin Buri 5,638 237,441 2.4 1,788 2,397 4,185 1.8 30.0
Rayong 6,656 298,249 2.2 4,826 2,852 7,678 2.6 47.9
Sa Kaeo 2,982 274,147 1.1 - 2.9
Western Region 30,026 1,936,997 1.6 23,357 22,196 45,553 2.4 9.2
Ratchaburi 12,217 466,466 2.6 9,403 7,863 17,266 3.8 12.9
Kanchanaburi 10,095 390,423 2.6 4,702 7,608 12,310 3.2 7.0
Suphan Buri 671 469,159 0.1 6,510 4,432 10,942 2.3 4.3
Samutshongkhram 833 114,167 0.7 423 307 730 0.6 7.0
Phetchaburi 2,423 241,829 1.0 - 9.9
Prachuap Khiri khan 3,788 254,954 1.5 2,319 1,987 4,306 1.7 15.3
Northeastern Region 356,601 11,235,217 3.2 239,510 121,236 360,746 3.3 3.4
Nakon Ratchasima 51,588 1,463,072 3.5 20,217 5,415 25,632 1.8 9.1
Buri Ram 21,548 731,259 2.9 14,993 3,195 18,188 2.6 2.1
Surin 5,692 683,404 0.8 1,946 1,579 3,525 0.5 1.8
Si Sa Ket 29,732 825,865 3.6 20,547 13,632 34,179 4.3 0.9
Ubon Ratchathani 26,031 892,707 2.9 2,401 281 2,682 0.3 2.9
Yasothon 9,128 325,204 2.8 3,252 1,498 4,750 1.5 1.6
Chaiyaphum 14,018 661,547 2.1 22,402 19,212 41,614 6.4 1.8
Amnat Charoen 10,271 200,595 5.1 8,151 4,629 12,781 6.7 1.4
Nong Bua Lam Phu 16,994 255,345 6.7 4,394 3,865 8,258 3.5 1.7
Khon Kaen 32,289 942,632 3.4 23,203 10,226 33,429 3.7 7.1
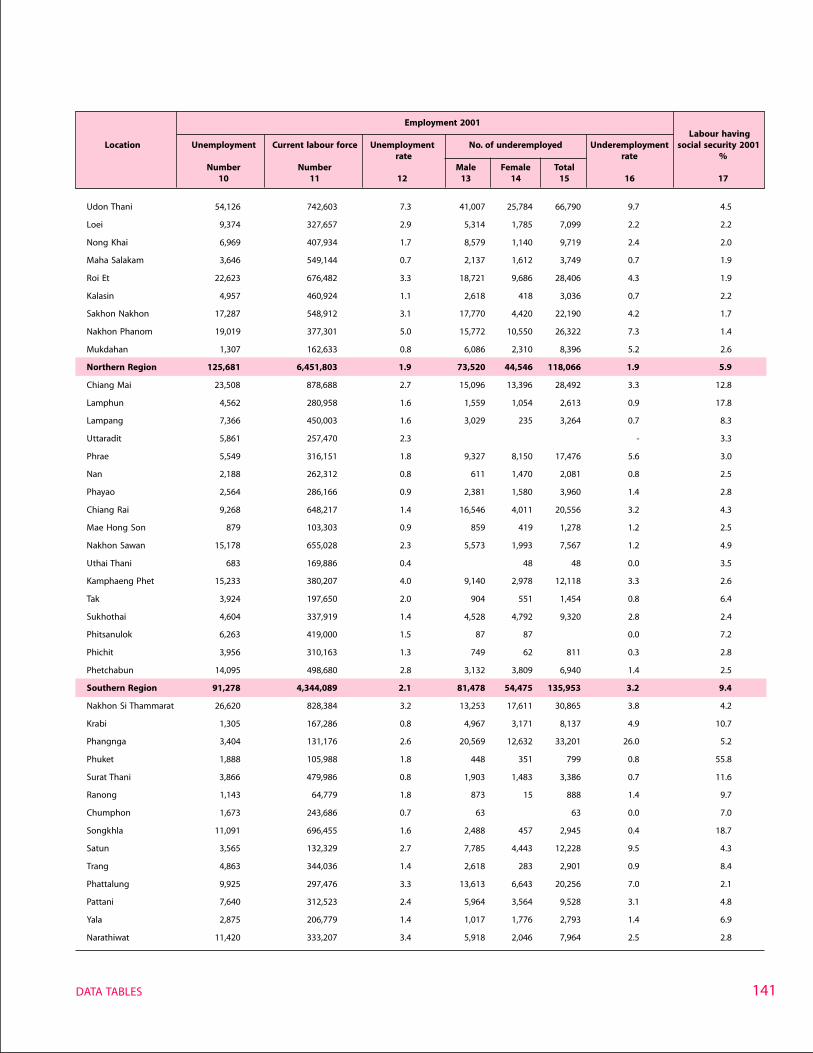
141DATA TABLES
Udon Thani 54,126 742,603 7.3 41,007 25,784 66,790 9.7 4.5
Loei 9,374 327,657 2.9 5,314 1,785 7,099 2.2 2.2
Nong Khai 6,969 407,934 1.7 8,579 1,140 9,719 2.4 2.0
Maha Salakam 3,646 549,144 0.7 2,137 1,612 3,749 0.7 1.9
Roi Et 22,623 676,482 3.3 18,721 9,686 28,406 4.3 1.9
Kalasin 4,957 460,924 1.1 2,618 418 3,036 0.7 2.2
Sakhon Nakhon 17,287 548,912 3.1 17,770 4,420 22,190 4.2 1.7
Nakhon Phanom 19,019 377,301 5.0 15,772 10,550 26,322 7.3 1.4
Mukdahan 1,307 162,633 0.8 6,086 2,310 8,396 5.2 2.6
Northern Region 125,681 6,451,803 1.9 73,520 44,546 118,066 1.9 5.9
Chiang Mai 23,508 878,688 2.7 15,096 13,396 28,492 3.3 12.8
Lamphun 4,562 280,958 1.6 1,559 1,054 2,613 0.9 17.8
Lampang 7,366 450,003 1.6 3,029 235 3,264 0.7 8.3
Uttaradit 5,861 257,470 2.3 - 3.3
Phrae 5,549 316,151 1.8 9,327 8,150 17,476 5.6 3.0
Nan 2,188 262,312 0.8 611 1,470 2,081 0.8 2.5
Phayao 2,564 286,166 0.9 2,381 1,580 3,960 1.4 2.8
Chiang Rai 9,268 648,217 1.4 16,546 4,011 20,556 3.2 4.3
Mae Hong Son 879 103,303 0.9 859 419 1,278 1.2 2.5
Nakhon Sawan 15,178 655,028 2.3 5,573 1,993 7,567 1.2 4.9
Uthai Thani 683 169,886 0.4 48 48 0.0 3.5
Kamphaeng Phet 15,233 380,207 4.0 9,140 2,978 12,118 3.3 2.6
Tak 3,924 197,650 2.0 904 551 1,454 0.8 6.4
Sukhothai 4,604 337,919 1.4 4,528 4,792 9,320 2.8 2.4
Phitsanulok 6,263 419,000 1.5 87 87 0.0 7.2
Phichit 3,956 310,163 1.3 749 62 811 0.3 2.8
Phetchabun 14,095 498,680 2.8 3,132 3,809 6,940 1.4 2.5
Southern Region 91,278 4,344,089 2.1 81,478 54,475 135,953 3.2 9.4
Nakhon Si Thammarat 26,620 828,384 3.2 13,253 17,611 30,865 3.8 4.2
Krabi 1,305 167,286 0.8 4,967 3,171 8,137 4.9 10.7
Phangnga 3,404 131,176 2.6 20,569 12,632 33,201 26.0 5.2
Phuket 1,888 105,988 1.8 448 351 799 0.8 55.8
Surat Thani 3,866 479,986 0.8 1,903 1,483 3,386 0.7 11.6
Ranong 1,143 64,779 1.8 873 15 888 1.4 9.7
Chumphon 1,673 243,686 0.7 63 63 0.0 7.0
Songkhla 11,091 696,455 1.6 2,488 457 2,945 0.4 18.7
Satun 3,565 132,329 2.7 7,785 4,443 12,228 9.5 4.3
Trang 4,863 344,036 1.4 2,618 283 2,901 0.9 8.4
Phattalung 9,925 297,476 3.3 13,613 6,643 20,256 7.0 2.1
Pattani 7,640 312,523 2.4 5,964 3,564 9,528 3.1 4.8
Yala 2,875 206,779 1.4 1,017 1,776 2,793 1.4 6.9
Narathiwat 11,420 333,207 3.4 5,918 2,046 7,964 2.5 2.8
Table 4 Employment
Employment 2001Labour having
Location Unemployment Current labour force Unemployment No. of underemployed Underemployment social security 2001 rate rate %
Number Number Male Female Total10 11 12 13 14 15 16 17
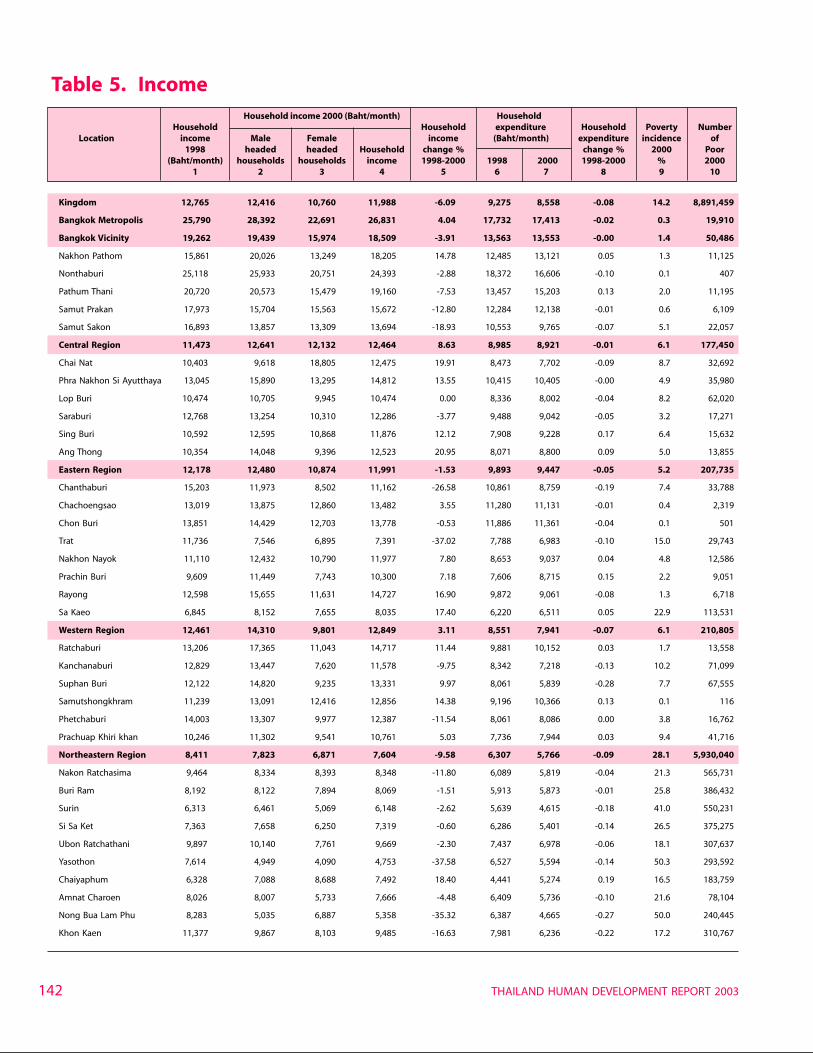
THAILAND HUMAN DEVELOPMENT REPORT 2003142
Table 5. IncomeHousehold income 2000 (Baht/month) Household
Household Household expenditure Household Poverty NumberLocation income Male Female income (Baht/month) expenditure incidence of
1998 headed headed Household change % change % 2000 Poor(Baht/month) households households income 1998-2000 1998 2000 1998-2000 % 2000
1 2 3 4 5 6 7 8 9 10
Kingdom 12,765 12,416 10,760 11,988 -6.09 9,275 8,558 -0.08 14.2 8,891,459
Bangkok Metropolis 25,790 28,392 22,691 26,831 4.04 17,732 17,413 -0.02 0.3 19,910
Bangkok Vicinity 19,262 19,439 15,974 18,509 -3.91 13,563 13,553 -0.00 1.4 50,486
Nakhon Pathom 15,861 20,026 13,249 18,205 14.78 12,485 13,121 0.05 1.3 11,125
Nonthaburi 25,118 25,933 20,751 24,393 -2.88 18,372 16,606 -0.10 0.1 407
Pathum Thani 20,720 20,573 15,479 19,160 -7.53 13,457 15,203 0.13 2.0 11,195
Samut Prakan 17,973 15,704 15,563 15,672 -12.80 12,284 12,138 -0.01 0.6 6,109
Samut Sakon 16,893 13,857 13,309 13,694 -18.93 10,553 9,765 -0.07 5.1 22,057
Central Region 11,473 12,641 12,132 12,464 8.63 8,985 8,921 -0.01 6.1 177,450
Chai Nat 10,403 9,618 18,805 12,475 19.91 8,473 7,702 -0.09 8.7 32,692
Phra Nakhon Si Ayutthaya 13,045 15,890 13,295 14,812 13.55 10,415 10,405 -0.00 4.9 35,980
Lop Buri 10,474 10,705 9,945 10,474 0.00 8,336 8,002 -0.04 8.2 62,020
Saraburi 12,768 13,254 10,310 12,286 -3.77 9,488 9,042 -0.05 3.2 17,271
Sing Buri 10,592 12,595 10,868 11,876 12.12 7,908 9,228 0.17 6.4 15,632
Ang Thong 10,354 14,048 9,396 12,523 20.95 8,071 8,800 0.09 5.0 13,855
Eastern Region 12,178 12,480 10,874 11,991 -1.53 9,893 9,447 -0.05 5.2 207,735
Chanthaburi 15,203 11,973 8,502 11,162 -26.58 10,861 8,759 -0.19 7.4 33,788
Chachoengsao 13,019 13,875 12,860 13,482 3.55 11,280 11,131 -0.01 0.4 2,319
Chon Buri 13,851 14,429 12,703 13,778 -0.53 11,886 11,361 -0.04 0.1 501
Trat 11,736 7,546 6,895 7,391 -37.02 7,788 6,983 -0.10 15.0 29,743
Nakhon Nayok 11,110 12,432 10,790 11,977 7.80 8,653 9,037 0.04 4.8 12,586
Prachin Buri 9,609 11,449 7,743 10,300 7.18 7,606 8,715 0.15 2.2 9,051
Rayong 12,598 15,655 11,631 14,727 16.90 9,872 9,061 -0.08 1.3 6,718
Sa Kaeo 6,845 8,152 7,655 8,035 17.40 6,220 6,511 0.05 22.9 113,531
Western Region 12,461 14,310 9,801 12,849 3.11 8,551 7,941 -0.07 6.1 210,805
Ratchaburi 13,206 17,365 11,043 14,717 11.44 9,881 10,152 0.03 1.7 13,558
Kanchanaburi 12,829 13,447 7,620 11,578 -9.75 8,342 7,218 -0.13 10.2 71,099
Suphan Buri 12,122 14,820 9,235 13,331 9.97 8,061 5,839 -0.28 7.7 67,555
Samutshongkhram 11,239 13,091 12,416 12,856 14.38 9,196 10,366 0.13 0.1 116
Phetchaburi 14,003 13,307 9,977 12,387 -11.54 8,061 8,086 0.00 3.8 16,762
Prachuap Khiri khan 10,246 11,302 9,541 10,761 5.03 7,736 7,944 0.03 9.4 41,716
Northeastern Region 8,411 7,823 6,871 7,604 -9.58 6,307 5,766 -0.09 28.1 5,930,040
Nakon Ratchasima 9,464 8,334 8,393 8,348 -11.80 6,089 5,819 -0.04 21.3 565,731
Buri Ram 8,192 8,122 7,894 8,069 -1.51 5,913 5,873 -0.01 25.8 386,432
Surin 6,313 6,461 5,069 6,148 -2.62 5,639 4,615 -0.18 41.0 550,231
Si Sa Ket 7,363 7,658 6,250 7,319 -0.60 6,286 5,401 -0.14 26.5 375,275
Ubon Ratchathani 9,897 10,140 7,761 9,669 -2.30 7,437 6,978 -0.06 18.1 307,637
Yasothon 7,614 4,949 4,090 4,753 -37.58 6,527 5,594 -0.14 50.3 293,592
Chaiyaphum 6,328 7,088 8,688 7,492 18.40 4,441 5,274 0.19 16.5 183,759
Amnat Charoen 8,026 8,007 5,733 7,666 -4.48 6,409 5,736 -0.10 21.6 78,104
Nong Bua Lam Phu 8,283 5,035 6,887 5,358 -35.32 6,387 4,665 -0.27 50.0 240,445
Khon Kaen 11,377 9,867 8,103 9,485 -16.63 7,981 6,236 -0.22 17.2 310,767
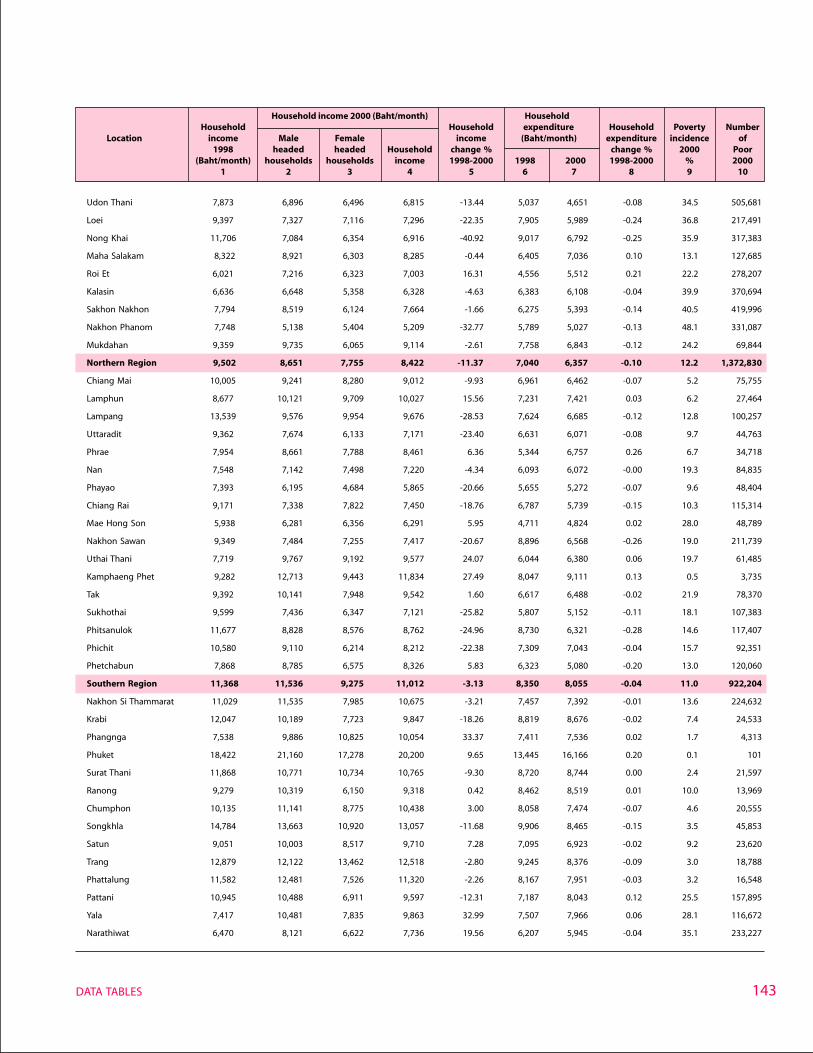
143DATA TABLES
Udon Thani 7,873 6,896 6,496 6,815 -13.44 5,037 4,651 -0.08 34.5 505,681
Loei 9,397 7,327 7,116 7,296 -22.35 7,905 5,989 -0.24 36.8 217,491
Nong Khai 11,706 7,084 6,354 6,916 -40.92 9,017 6,792 -0.25 35.9 317,383
Maha Salakam 8,322 8,921 6,303 8,285 -0.44 6,405 7,036 0.10 13.1 127,685
Roi Et 6,021 7,216 6,323 7,003 16.31 4,556 5,512 0.21 22.2 278,207
Kalasin 6,636 6,648 5,358 6,328 -4.63 6,383 6,108 -0.04 39.9 370,694
Sakhon Nakhon 7,794 8,519 6,124 7,664 -1.66 6,275 5,393 -0.14 40.5 419,996
Nakhon Phanom 7,748 5,138 5,404 5,209 -32.77 5,789 5,027 -0.13 48.1 331,087
Mukdahan 9,359 9,735 6,065 9,114 -2.61 7,758 6,843 -0.12 24.2 69,844
Northern Region 9,502 8,651 7,755 8,422 -11.37 7,040 6,357 -0.10 12.2 1,372,830
Chiang Mai 10,005 9,241 8,280 9,012 -9.93 6,961 6,462 -0.07 5.2 75,755
Lamphun 8,677 10,121 9,709 10,027 15.56 7,231 7,421 0.03 6.2 27,464
Lampang 13,539 9,576 9,954 9,676 -28.53 7,624 6,685 -0.12 12.8 100,257
Uttaradit 9,362 7,674 6,133 7,171 -23.40 6,631 6,071 -0.08 9.7 44,763
Phrae 7,954 8,661 7,788 8,461 6.36 5,344 6,757 0.26 6.7 34,718
Nan 7,548 7,142 7,498 7,220 -4.34 6,093 6,072 -0.00 19.3 84,835
Phayao 7,393 6,195 4,684 5,865 -20.66 5,655 5,272 -0.07 9.6 48,404
Chiang Rai 9,171 7,338 7,822 7,450 -18.76 6,787 5,739 -0.15 10.3 115,314
Mae Hong Son 5,938 6,281 6,356 6,291 5.95 4,711 4,824 0.02 28.0 48,789
Nakhon Sawan 9,349 7,484 7,255 7,417 -20.67 8,896 6,568 -0.26 19.0 211,739
Uthai Thani 7,719 9,767 9,192 9,577 24.07 6,044 6,380 0.06 19.7 61,485
Kamphaeng Phet 9,282 12,713 9,443 11,834 27.49 8,047 9,111 0.13 0.5 3,735
Tak 9,392 10,141 7,948 9,542 1.60 6,617 6,488 -0.02 21.9 78,370
Sukhothai 9,599 7,436 6,347 7,121 -25.82 5,807 5,152 -0.11 18.1 107,383
Phitsanulok 11,677 8,828 8,576 8,762 -24.96 8,730 6,321 -0.28 14.6 117,407
Phichit 10,580 9,110 6,214 8,212 -22.38 7,309 7,043 -0.04 15.7 92,351
Phetchabun 7,868 8,785 6,575 8,326 5.83 6,323 5,080 -0.20 13.0 120,060
Southern Region 11,368 11,536 9,275 11,012 -3.13 8,350 8,055 -0.04 11.0 922,204
Nakhon Si Thammarat 11,029 11,535 7,985 10,675 -3.21 7,457 7,392 -0.01 13.6 224,632
Krabi 12,047 10,189 7,723 9,847 -18.26 8,819 8,676 -0.02 7.4 24,533
Phangnga 7,538 9,886 10,825 10,054 33.37 7,411 7,536 0.02 1.7 4,313
Phuket 18,422 21,160 17,278 20,200 9.65 13,445 16,166 0.20 0.1 101
Surat Thani 11,868 10,771 10,734 10,765 -9.30 8,720 8,744 0.00 2.4 21,597
Ranong 9,279 10,319 6,150 9,318 0.42 8,462 8,519 0.01 10.0 13,969
Chumphon 10,135 11,141 8,775 10,438 3.00 8,058 7,474 -0.07 4.6 20,555
Songkhla 14,784 13,663 10,920 13,057 -11.68 9,906 8,465 -0.15 3.5 45,853
Satun 9,051 10,003 8,517 9,710 7.28 7,095 6,923 -0.02 9.2 23,620
Trang 12,879 12,122 13,462 12,518 -2.80 9,245 8,376 -0.09 3.0 18,788
Phattalung 11,582 12,481 7,526 11,320 -2.26 8,167 7,951 -0.03 3.2 16,548
Pattani 10,945 10,488 6,911 9,597 -12.31 7,187 8,043 0.12 25.5 157,895
Yala 7,417 10,481 7,835 9,863 32.99 7,507 7,966 0.06 28.1 116,672
Narathiwat 6,470 8,121 6,622 7,736 19.56 6,207 5,945 -0.04 35.1 233,227
Table 5 Income (Continued)
Household income 2000 (Baht/month) HouseholdHousehold Household expenditure Household Poverty Number
Location income Male Female income (Baht/month) expenditure incidence of1998 headed headed Household change % change % 2000 Poor
(Baht/month) households households income 1998-2000 1998 2000 1998-2000 % 20001 2 3 4 5 6 7 8 9 10
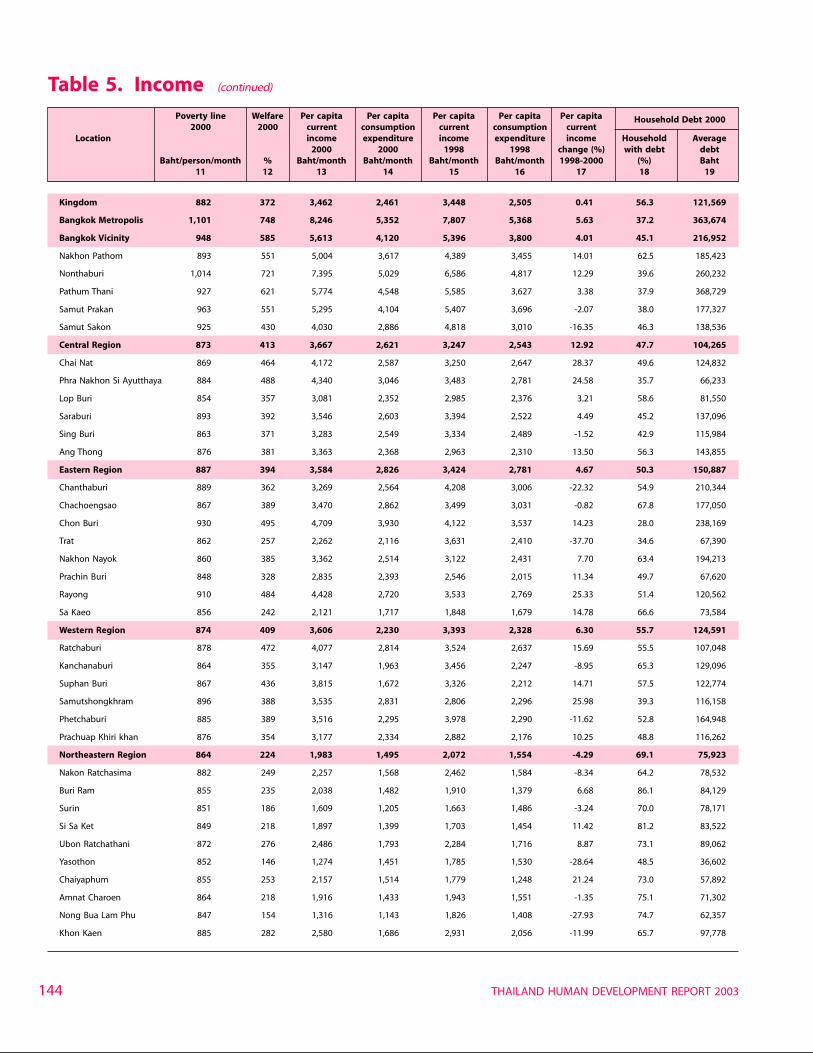
THAILAND HUMAN DEVELOPMENT REPORT 2003144
Table 5. Income (continued)
Poverty line Welfare Per capita Per capita Per capita Per capita Per capita Household Debt 20002000 2000 current consumption current consumption current
Location income expenditure income expenditure income Household Average2000 2000 1998 1998 change (%) with debt debt
Baht/person/month % Baht/month Baht/month Baht/month Baht/month 1998-2000 (%) Baht11 12 13 14 15 16 17 18 19
Kingdom 882 372 3,462 2,461 3,448 2,505 0.41 56.3 121,569
Bangkok Metropolis 1,101 748 8,246 5,352 7,807 5,368 5.63 37.2 363,674
Bangkok Vicinity 948 585 5,613 4,120 5,396 3,800 4.01 45.1 216,952
Nakhon Pathom 893 551 5,004 3,617 4,389 3,455 14.01 62.5 185,423
Nonthaburi 1,014 721 7,395 5,029 6,586 4,817 12.29 39.6 260,232
Pathum Thani 927 621 5,774 4,548 5,585 3,627 3.38 37.9 368,729
Samut Prakan 963 551 5,295 4,104 5,407 3,696 -2.07 38.0 177,327
Samut Sakon 925 430 4,030 2,886 4,818 3,010 -16.35 46.3 138,536
Central Region 873 413 3,667 2,621 3,247 2,543 12.92 47.7 104,265
Chai Nat 869 464 4,172 2,587 3,250 2,647 28.37 49.6 124,832
Phra Nakhon Si Ayutthaya 884 488 4,340 3,046 3,483 2,781 24.58 35.7 66,233
Lop Buri 854 357 3,081 2,352 2,985 2,376 3.21 58.6 81,550
Saraburi 893 392 3,546 2,603 3,394 2,522 4.49 45.2 137,096
Sing Buri 863 371 3,283 2,549 3,334 2,489 -1.52 42.9 115,984
Ang Thong 876 381 3,363 2,368 2,963 2,310 13.50 56.3 143,855
Eastern Region 887 394 3,584 2,826 3,424 2,781 4.67 50.3 150,887
Chanthaburi 889 362 3,269 2,564 4,208 3,006 -22.32 54.9 210,344
Chachoengsao 867 389 3,470 2,862 3,499 3,031 -0.82 67.8 177,050
Chon Buri 930 495 4,709 3,930 4,122 3,537 14.23 28.0 238,169
Trat 862 257 2,262 2,116 3,631 2,410 -37.70 34.6 67,390
Nakhon Nayok 860 385 3,362 2,514 3,122 2,431 7.70 63.4 194,213
Prachin Buri 848 328 2,835 2,393 2,546 2,015 11.34 49.7 67,620
Rayong 910 484 4,428 2,720 3,533 2,769 25.33 51.4 120,562
Sa Kaeo 856 242 2,121 1,717 1,848 1,679 14.78 66.6 73,584
Western Region 874 409 3,606 2,230 3,393 2,328 6.30 55.7 124,591
Ratchaburi 878 472 4,077 2,814 3,524 2,637 15.69 55.5 107,048
Kanchanaburi 864 355 3,147 1,963 3,456 2,247 -8.95 65.3 129,096
Suphan Buri 867 436 3,815 1,672 3,326 2,212 14.71 57.5 122,774
Samutshongkhram 896 388 3,535 2,831 2,806 2,296 25.98 39.3 116,158
Phetchaburi 885 389 3,516 2,295 3,978 2,290 -11.62 52.8 164,948
Prachuap Khiri khan 876 354 3,177 2,334 2,882 2,176 10.25 48.8 116,262
Northeastern Region 864 224 1,983 1,495 2,072 1,554 -4.29 69.1 75,923
Nakon Ratchasima 882 249 2,257 1,568 2,462 1,584 -8.34 64.2 78,532
Buri Ram 855 235 2,038 1,482 1,910 1,379 6.68 86.1 84,129
Surin 851 186 1,609 1,205 1,663 1,486 -3.24 70.0 78,171
Si Sa Ket 849 218 1,897 1,399 1,703 1,454 11.42 81.2 83,522
Ubon Ratchathani 872 276 2,486 1,793 2,284 1,716 8.87 73.1 89,062
Yasothon 852 146 1,274 1,451 1,785 1,530 -28.64 48.5 36,602
Chaiyaphum 855 253 2,157 1,514 1,779 1,248 21.24 73.0 57,892
Amnat Charoen 864 218 1,916 1,433 1,943 1,551 -1.35 75.1 71,302
Nong Bua Lam Phu 847 154 1,316 1,143 1,826 1,408 -27.93 74.7 62,357
Khon Kaen 885 282 2,580 1,686 2,931 2,056 -11.99 65.7 97,778
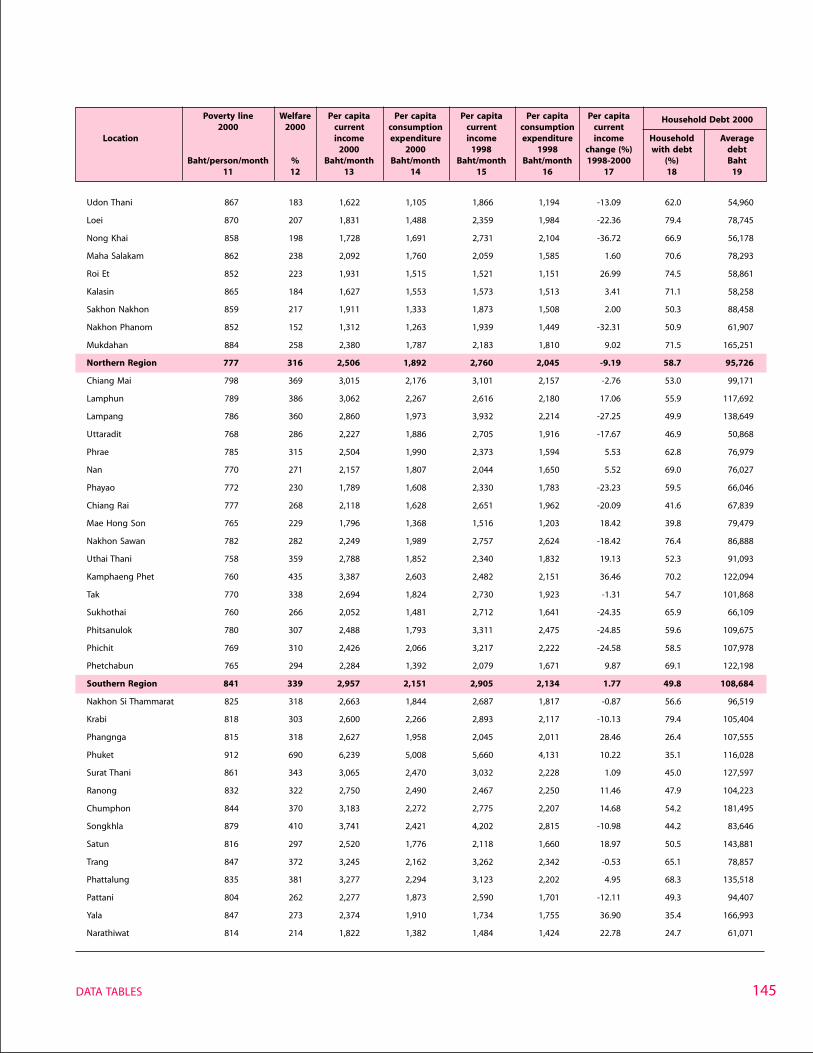
145DATA TABLES
Udon Thani 867 183 1,622 1,105 1,866 1,194 -13.09 62.0 54,960
Loei 870 207 1,831 1,488 2,359 1,984 -22.36 79.4 78,745
Nong Khai 858 198 1,728 1,691 2,731 2,104 -36.72 66.9 56,178
Maha Salakam 862 238 2,092 1,760 2,059 1,585 1.60 70.6 78,293
Roi Et 852 223 1,931 1,515 1,521 1,151 26.99 74.5 58,861
Kalasin 865 184 1,627 1,553 1,573 1,513 3.41 71.1 58,258
Sakhon Nakhon 859 217 1,911 1,333 1,873 1,508 2.00 50.3 88,458
Nakhon Phanom 852 152 1,312 1,263 1,939 1,449 -32.31 50.9 61,907
Mukdahan 884 258 2,380 1,787 2,183 1,810 9.02 71.5 165,251
Northern Region 777 316 2,506 1,892 2,760 2,045 -9.19 58.7 95,726
Chiang Mai 798 369 3,015 2,176 3,101 2,157 -2.76 53.0 99,171
Lamphun 789 386 3,062 2,267 2,616 2,180 17.06 55.9 117,692
Lampang 786 360 2,860 1,973 3,932 2,214 -27.25 49.9 138,649
Uttaradit 768 286 2,227 1,886 2,705 1,916 -17.67 46.9 50,868
Phrae 785 315 2,504 1,990 2,373 1,594 5.53 62.8 76,979
Nan 770 271 2,157 1,807 2,044 1,650 5.52 69.0 76,027
Phayao 772 230 1,789 1,608 2,330 1,783 -23.23 59.5 66,046
Chiang Rai 777 268 2,118 1,628 2,651 1,962 -20.09 41.6 67,839
Mae Hong Son 765 229 1,796 1,368 1,516 1,203 18.42 39.8 79,479
Nakhon Sawan 782 282 2,249 1,989 2,757 2,624 -18.42 76.4 86,888
Uthai Thani 758 359 2,788 1,852 2,340 1,832 19.13 52.3 91,093
Kamphaeng Phet 760 435 3,387 2,603 2,482 2,151 36.46 70.2 122,094
Tak 770 338 2,694 1,824 2,730 1,923 -1.31 54.7 101,868
Sukhothai 760 266 2,052 1,481 2,712 1,641 -24.35 65.9 66,109
Phitsanulok 780 307 2,488 1,793 3,311 2,475 -24.85 59.6 109,675
Phichit 769 310 2,426 2,066 3,217 2,222 -24.58 58.5 107,978
Phetchabun 765 294 2,284 1,392 2,079 1,671 9.87 69.1 122,198
Southern Region 841 339 2,957 2,151 2,905 2,134 1.77 49.8 108,684
Nakhon Si Thammarat 825 318 2,663 1,844 2,687 1,817 -0.87 56.6 96,519
Krabi 818 303 2,600 2,266 2,893 2,117 -10.13 79.4 105,404
Phangnga 815 318 2,627 1,958 2,045 2,011 28.46 26.4 107,555
Phuket 912 690 6,239 5,008 5,660 4,131 10.22 35.1 116,028
Surat Thani 861 343 3,065 2,470 3,032 2,228 1.09 45.0 127,597
Ranong 832 322 2,750 2,490 2,467 2,250 11.46 47.9 104,223
Chumphon 844 370 3,183 2,272 2,775 2,207 14.68 54.2 181,495
Songkhla 879 410 3,741 2,421 4,202 2,815 -10.98 44.2 83,646
Satun 816 297 2,520 1,776 2,118 1,660 18.97 50.5 143,881
Trang 847 372 3,245 2,162 3,262 2,342 -0.53 65.1 78,857
Phattalung 835 381 3,277 2,294 3,123 2,202 4.95 68.3 135,518
Pattani 804 262 2,277 1,873 2,590 1,701 -12.11 49.3 94,407
Yala 847 273 2,374 1,910 1,734 1,755 36.90 35.4 166,993
Narathiwat 814 214 1,822 1,382 1,484 1,424 22.78 24.7 61,071
Table 5 Income (Continued)
Poverty line Welfare Per capita Per capita Per capita Per capita Per capita Household Debt 20002000 2000 current consumption current consumption current
Location income expenditure income expenditure income Household Average2000 2000 1998 1998 change (%) with debt debt
Baht/person/month % Baht/month Baht/month Baht/month Baht/month 1998-2000 (%) Baht11 12 13 14 15 16 17 18 19
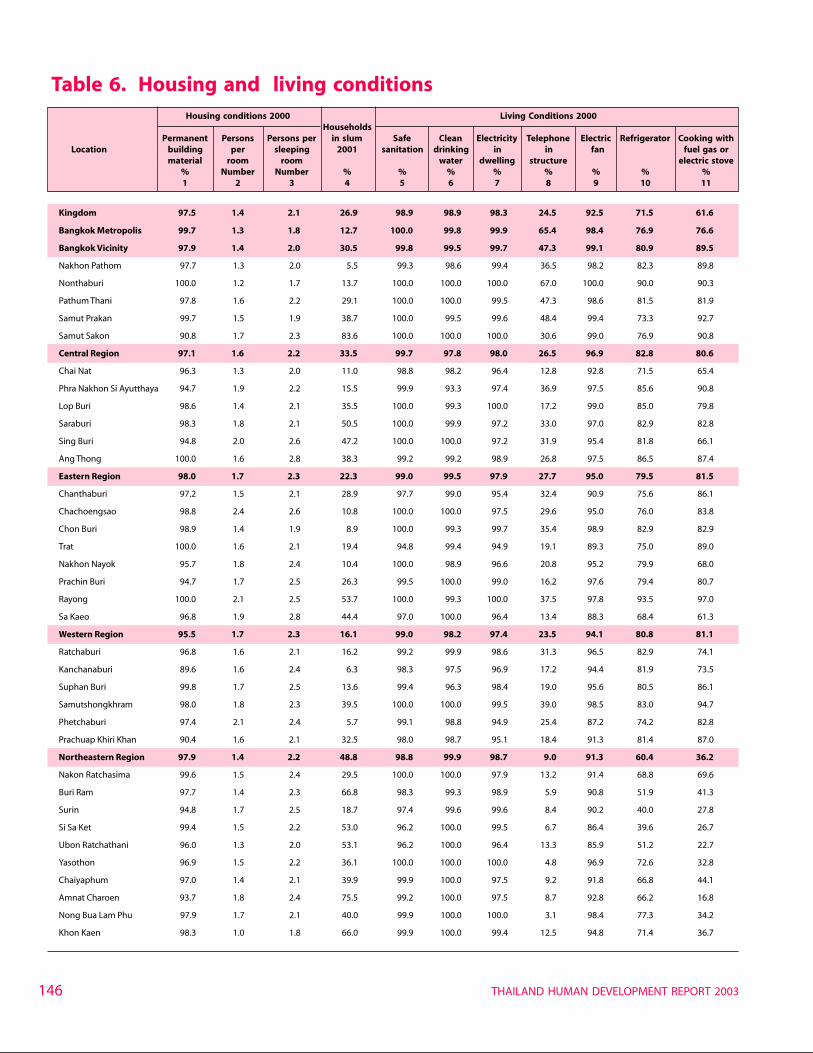
THAILAND HUMAN DEVELOPMENT REPORT 2003146
Table 6. Housing and living conditionsHousing conditions 2000 Living Conditions 2000
HouseholdsPermanent Persons Persons per in slum Safe Clean Electricity Telephone Electric Refrigerator Cooking with
Location building per sleeping 2001 sanitation drinking in in fan fuel gas ormaterial room room water dwelling structure electric stove
% Number Number % % % % % % % %1 2 3 4 5 6 7 8 9 10 11
Kingdom 97.5 1.4 2.1 26.9 98.9 98.9 98.3 24.5 92.5 71.5 61.6
Bangkok Metropolis 99.7 1.3 1.8 12.7 100.0 99.8 99.9 65.4 98.4 76.9 76.6
Bangkok Vicinity 97.9 1.4 2.0 30.5 99.8 99.5 99.7 47.3 99.1 80.9 89.5
Nakhon Pathom 97.7 1.3 2.0 5.5 99.3 98.6 99.4 36.5 98.2 82.3 89.8
Nonthaburi 100.0 1.2 1.7 13.7 100.0 100.0 100.0 67.0 100.0 90.0 90.3
Pathum Thani 97.8 1.6 2.2 29.1 100.0 100.0 99.5 47.3 98.6 81.5 81.9
Samut Prakan 99.7 1.5 1.9 38.7 100.0 99.5 99.6 48.4 99.4 73.3 92.7
Samut Sakon 90.8 1.7 2.3 83.6 100.0 100.0 100.0 30.6 99.0 76.9 90.8
Central Region 97.1 1.6 2.2 33.5 99.7 97.8 98.0 26.5 96.9 82.8 80.6
Chai Nat 96.3 1.3 2.0 11.0 98.8 98.2 96.4 12.8 92.8 71.5 65.4
Phra Nakhon Si Ayutthaya 94.7 1.9 2.2 15.5 99.9 93.3 97.4 36.9 97.5 85.6 90.8
Lop Buri 98.6 1.4 2.1 35.5 100.0 99.3 100.0 17.2 99.0 85.0 79.8
Saraburi 98.3 1.8 2.1 50.5 100.0 99.9 97.2 33.0 97.0 82.9 82.8
Sing Buri 94.8 2.0 2.6 47.2 100.0 100.0 97.2 31.9 95.4 81.8 66.1
Ang Thong 100.0 1.6 2.8 38.3 99.2 99.2 98.9 26.8 97.5 86.5 87.4
Eastern Region 98.0 1.7 2.3 22.3 99.0 99.5 97.9 27.7 95.0 79.5 81.5
Chanthaburi 97.2 1.5 2.1 28.9 97.7 99.0 95.4 32.4 90.9 75.6 86.1
Chachoengsao 98.8 2.4 2.6 10.8 100.0 100.0 97.5 29.6 95.0 76.0 83.8
Chon Buri 98.9 1.4 1.9 8.9 100.0 99.3 99.7 35.4 98.9 82.9 82.9
Trat 100.0 1.6 2.1 19.4 94.8 99.4 94.9 19.1 89.3 75.0 89.0
Nakhon Nayok 95.7 1.8 2.4 10.4 100.0 98.9 96.6 20.8 95.2 79.9 68.0
Prachin Buri 94.7 1.7 2.5 26.3 99.5 100.0 99.0 16.2 97.6 79.4 80.7
Rayong 100.0 2.1 2.5 53.7 100.0 99.3 100.0 37.5 97.8 93.5 97.0
Sa Kaeo 96.8 1.9 2.8 44.4 97.0 100.0 96.4 13.4 88.3 68.4 61.3
Western Region 95.5 1.7 2.3 16.1 99.0 98.2 97.4 23.5 94.1 80.8 81.1
Ratchaburi 96.8 1.6 2.1 16.2 99.2 99.9 98.6 31.3 96.5 82.9 74.1
Kanchanaburi 89.6 1.6 2.4 6.3 98.3 97.5 96.9 17.2 94.4 81.9 73.5
Suphan Buri 99.8 1.7 2.5 13.6 99.4 96.3 98.4 19.0 95.6 80.5 86.1
Samutshongkhram 98.0 1.8 2.3 39.5 100.0 100.0 99.5 39.0 98.5 83.0 94.7
Phetchaburi 97.4 2.1 2.4 5.7 99.1 98.8 94.9 25.4 87.2 74.2 82.8
Prachuap Khiri Khan 90.4 1.6 2.1 32.5 98.0 98.7 95.1 18.4 91.3 81.4 87.0
Northeastern Region 97.9 1.4 2.2 48.8 98.8 99.9 98.7 9.0 91.3 60.4 36.2
Nakon Ratchasima 99.6 1.5 2.4 29.5 100.0 100.0 97.9 13.2 91.4 68.8 69.6
Buri Ram 97.7 1.4 2.3 66.8 98.3 99.3 98.9 5.9 90.8 51.9 41.3
Surin 94.8 1.7 2.5 18.7 97.4 99.6 99.6 8.4 90.2 40.0 27.8
Si Sa Ket 99.4 1.5 2.2 53.0 96.2 100.0 99.5 6.7 86.4 39.6 26.7
Ubon Ratchathani 96.0 1.3 2.0 53.1 96.2 100.0 96.4 13.3 85.9 51.2 22.7
Yasothon 96.9 1.5 2.2 36.1 100.0 100.0 100.0 4.8 96.9 72.6 32.8
Chaiyaphum 97.0 1.4 2.1 39.9 99.9 100.0 97.5 9.2 91.8 66.8 44.1
Amnat Charoen 93.7 1.8 2.4 75.5 99.2 100.0 97.5 8.7 92.8 66.2 16.8
Nong Bua Lam Phu 97.9 1.7 2.1 40.0 99.9 100.0 100.0 3.1 98.4 77.3 34.2
Khon Kaen 98.3 1.0 1.8 66.0 99.9 100.0 99.4 12.5 94.8 71.4 36.7
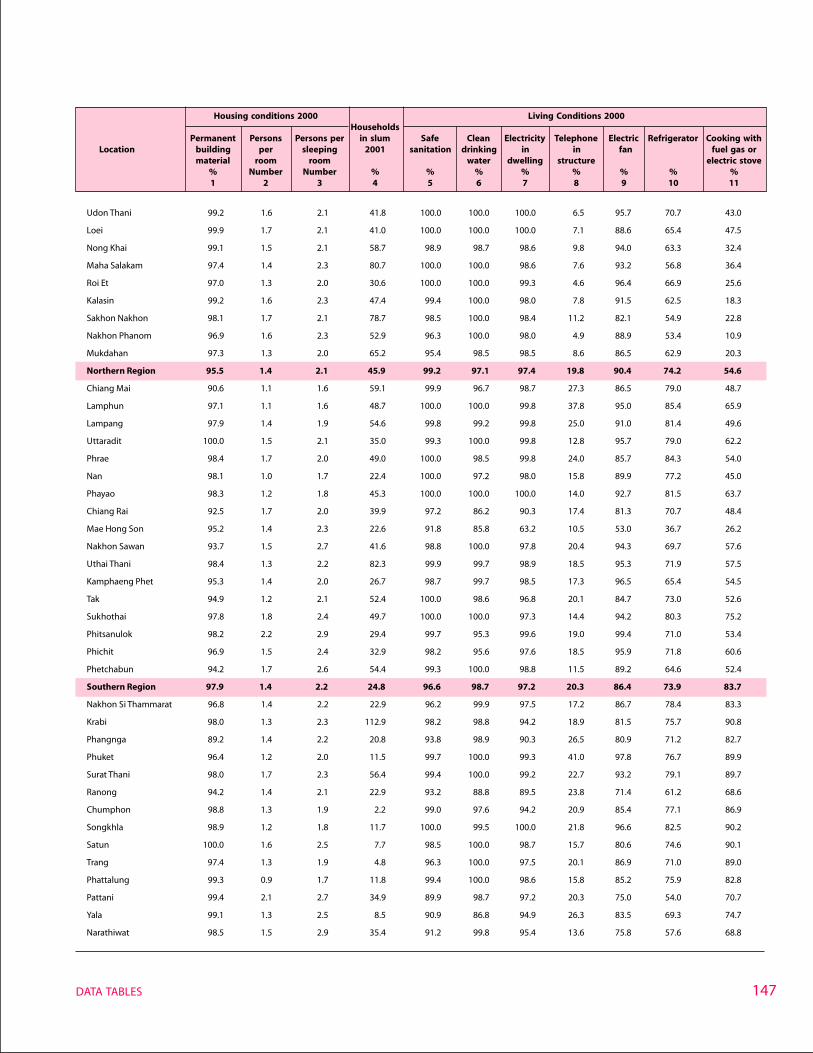
147DATA TABLES
Udon Thani 99.2 1.6 2.1 41.8 100.0 100.0 100.0 6.5 95.7 70.7 43.0
Loei 99.9 1.7 2.1 41.0 100.0 100.0 100.0 7.1 88.6 65.4 47.5
Nong Khai 99.1 1.5 2.1 58.7 98.9 98.7 98.6 9.8 94.0 63.3 32.4
Maha Salakam 97.4 1.4 2.3 80.7 100.0 100.0 98.6 7.6 93.2 56.8 36.4
Roi Et 97.0 1.3 2.0 30.6 100.0 100.0 99.3 4.6 96.4 66.9 25.6
Kalasin 99.2 1.6 2.3 47.4 99.4 100.0 98.0 7.8 91.5 62.5 18.3
Sakhon Nakhon 98.1 1.7 2.1 78.7 98.5 100.0 98.4 11.2 82.1 54.9 22.8
Nakhon Phanom 96.9 1.6 2.3 52.9 96.3 100.0 98.0 4.9 88.9 53.4 10.9
Mukdahan 97.3 1.3 2.0 65.2 95.4 98.5 98.5 8.6 86.5 62.9 20.3
Northern Region 95.5 1.4 2.1 45.9 99.2 97.1 97.4 19.8 90.4 74.2 54.6
Chiang Mai 90.6 1.1 1.6 59.1 99.9 96.7 98.7 27.3 86.5 79.0 48.7
Lamphun 97.1 1.1 1.6 48.7 100.0 100.0 99.8 37.8 95.0 85.4 65.9
Lampang 97.9 1.4 1.9 54.6 99.8 99.2 99.8 25.0 91.0 81.4 49.6
Uttaradit 100.0 1.5 2.1 35.0 99.3 100.0 99.8 12.8 95.7 79.0 62.2
Phrae 98.4 1.7 2.0 49.0 100.0 98.5 99.8 24.0 85.7 84.3 54.0
Nan 98.1 1.0 1.7 22.4 100.0 97.2 98.0 15.8 89.9 77.2 45.0
Phayao 98.3 1.2 1.8 45.3 100.0 100.0 100.0 14.0 92.7 81.5 63.7
Chiang Rai 92.5 1.7 2.0 39.9 97.2 86.2 90.3 17.4 81.3 70.7 48.4
Mae Hong Son 95.2 1.4 2.3 22.6 91.8 85.8 63.2 10.5 53.0 36.7 26.2
Nakhon Sawan 93.7 1.5 2.7 41.6 98.8 100.0 97.8 20.4 94.3 69.7 57.6
Uthai Thani 98.4 1.3 2.2 82.3 99.9 99.7 98.9 18.5 95.3 71.9 57.5
Kamphaeng Phet 95.3 1.4 2.0 26.7 98.7 99.7 98.5 17.3 96.5 65.4 54.5
Tak 94.9 1.2 2.1 52.4 100.0 98.6 96.8 20.1 84.7 73.0 52.6
Sukhothai 97.8 1.8 2.4 49.7 100.0 100.0 97.3 14.4 94.2 80.3 75.2
Phitsanulok 98.2 2.2 2.9 29.4 99.7 95.3 99.6 19.0 99.4 71.0 53.4
Phichit 96.9 1.5 2.4 32.9 98.2 95.6 97.6 18.5 95.9 71.8 60.6
Phetchabun 94.2 1.7 2.6 54.4 99.3 100.0 98.8 11.5 89.2 64.6 52.4
Southern Region 97.9 1.4 2.2 24.8 96.6 98.7 97.2 20.3 86.4 73.9 83.7
Nakhon Si Thammarat 96.8 1.4 2.2 22.9 96.2 99.9 97.5 17.2 86.7 78.4 83.3
Krabi 98.0 1.3 2.3 112.9 98.2 98.8 94.2 18.9 81.5 75.7 90.8
Phangnga 89.2 1.4 2.2 20.8 93.8 98.9 90.3 26.5 80.9 71.2 82.7
Phuket 96.4 1.2 2.0 11.5 99.7 100.0 99.3 41.0 97.8 76.7 89.9
Surat Thani 98.0 1.7 2.3 56.4 99.4 100.0 99.2 22.7 93.2 79.1 89.7
Ranong 94.2 1.4 2.1 22.9 93.2 88.8 89.5 23.8 71.4 61.2 68.6
Chumphon 98.8 1.3 1.9 2.2 99.0 97.6 94.2 20.9 85.4 77.1 86.9
Songkhla 98.9 1.2 1.8 11.7 100.0 99.5 100.0 21.8 96.6 82.5 90.2
Satun 100.0 1.6 2.5 7.7 98.5 100.0 98.7 15.7 80.6 74.6 90.1
Trang 97.4 1.3 1.9 4.8 96.3 100.0 97.5 20.1 86.9 71.0 89.0
Phattalung 99.3 0.9 1.7 11.8 99.4 100.0 98.6 15.8 85.2 75.9 82.8
Pattani 99.4 2.1 2.7 34.9 89.9 98.7 97.2 20.3 75.0 54.0 70.7
Yala 99.1 1.3 2.5 8.5 90.9 86.8 94.9 26.3 83.5 69.3 74.7
Narathiwat 98.5 1.5 2.9 35.4 91.2 99.8 95.4 13.6 75.8 57.6 68.8
Table 6 Housing and living conditionsHousing conditions 2000 Living Conditions 2000
HouseholdsPermanent Persons Persons per in slum Safe Clean Electricity Telephone Electric Refrigerator Cooking with
Location building per sleeping 2001 sanitation drinking in in fan fuel gas ormaterial room room water dwelling structure electric stove
% Number Number % % % % % % % %1 2 3 4 5 6 7 8 9 10 11
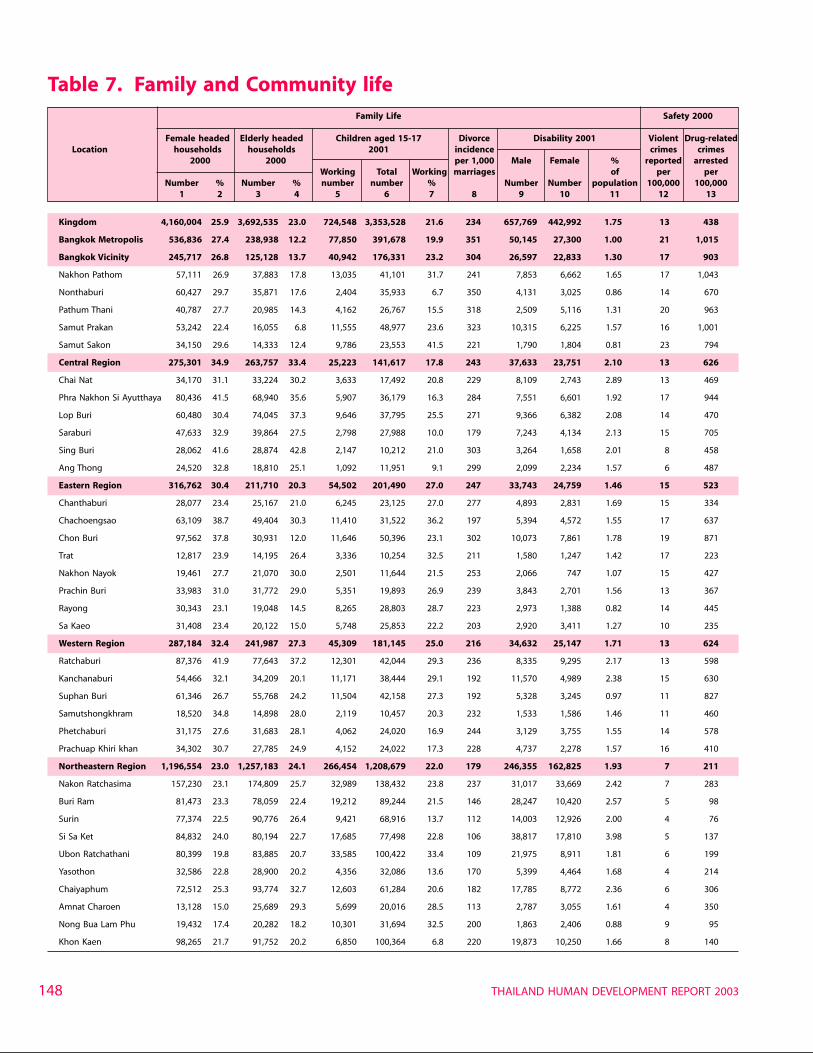
THAILAND HUMAN DEVELOPMENT REPORT 2003148
Table 7. Family and Community lifeFamily Life Safety 2000
Female headed Elderly headed Children aged 15-17 Divorce Disability 2001 Violent Drug-relatedLocation households households 2001 incidence crimes crimes
2000 2000 per 1,000 Male Female % reported arrestedWorking Total Working marriages of per per
Number % Number % number number % Number Number population 100,000 100,0001 2 3 4 5 6 7 8 9 10 11 12 13
Kingdom 4,160,004 25.9 3,692,535 23.0 724,548 3,353,528 21.6 234 657,769 442,992 1.75 13 438
Bangkok Metropolis 536,836 27.4 238,938 12.2 77,850 391,678 19.9 351 50,145 27,300 1.00 21 1,015
Bangkok Vicinity 245,717 26.8 125,128 13.7 40,942 176,331 23.2 304 26,597 22,833 1.30 17 903
Nakhon Pathom 57,111 26.9 37,883 17.8 13,035 41,101 31.7 241 7,853 6,662 1.65 17 1,043
Nonthaburi 60,427 29.7 35,871 17.6 2,404 35,933 6.7 350 4,131 3,025 0.86 14 670
Pathum Thani 40,787 27.7 20,985 14.3 4,162 26,767 15.5 318 2,509 5,116 1.31 20 963
Samut Prakan 53,242 22.4 16,055 6.8 11,555 48,977 23.6 323 10,315 6,225 1.57 16 1,001
Samut Sakon 34,150 29.6 14,333 12.4 9,786 23,553 41.5 221 1,790 1,804 0.81 23 794
Central Region 275,301 34.9 263,757 33.4 25,223 141,617 17.8 243 37,633 23,751 2.10 13 626
Chai Nat 34,170 31.1 33,224 30.2 3,633 17,492 20.8 229 8,109 2,743 2.89 13 469
Phra Nakhon Si Ayutthaya 80,436 41.5 68,940 35.6 5,907 36,179 16.3 284 7,551 6,601 1.92 17 944
Lop Buri 60,480 30.4 74,045 37.3 9,646 37,795 25.5 271 9,366 6,382 2.08 14 470
Saraburi 47,633 32.9 39,864 27.5 2,798 27,988 10.0 179 7,243 4,134 2.13 15 705
Sing Buri 28,062 41.6 28,874 42.8 2,147 10,212 21.0 303 3,264 1,658 2.01 8 458
Ang Thong 24,520 32.8 18,810 25.1 1,092 11,951 9.1 299 2,099 2,234 1.57 6 487
Eastern Region 316,762 30.4 211,710 20.3 54,502 201,490 27.0 247 33,743 24,759 1.46 15 523
Chanthaburi 28,077 23.4 25,167 21.0 6,245 23,125 27.0 277 4,893 2,831 1.69 15 334
Chachoengsao 63,109 38.7 49,404 30.3 11,410 31,522 36.2 197 5,394 4,572 1.55 17 637
Chon Buri 97,562 37.8 30,931 12.0 11,646 50,396 23.1 302 10,073 7,861 1.78 19 871
Trat 12,817 23.9 14,195 26.4 3,336 10,254 32.5 211 1,580 1,247 1.42 17 223
Nakhon Nayok 19,461 27.7 21,070 30.0 2,501 11,644 21.5 253 2,066 747 1.07 15 427
Prachin Buri 33,983 31.0 31,772 29.0 5,351 19,893 26.9 239 3,843 2,701 1.56 13 367
Rayong 30,343 23.1 19,048 14.5 8,265 28,803 28.7 223 2,973 1,388 0.82 14 445
Sa Kaeo 31,408 23.4 20,122 15.0 5,748 25,853 22.2 203 2,920 3,411 1.27 10 235
Western Region 287,184 32.4 241,987 27.3 45,309 181,145 25.0 216 34,632 25,147 1.71 13 624
Ratchaburi 87,376 41.9 77,643 37.2 12,301 42,044 29.3 236 8,335 9,295 2.17 13 598
Kanchanaburi 54,466 32.1 34,209 20.1 11,171 38,444 29.1 192 11,570 4,989 2.38 15 630
Suphan Buri 61,346 26.7 55,768 24.2 11,504 42,158 27.3 192 5,328 3,245 0.97 11 827
Samutshongkhram 18,520 34.8 14,898 28.0 2,119 10,457 20.3 232 1,533 1,586 1.46 11 460
Phetchaburi 31,175 27.6 31,683 28.1 4,062 24,020 16.9 244 3,129 3,755 1.55 14 578
Prachuap Khiri khan 34,302 30.7 27,785 24.9 4,152 24,022 17.3 228 4,737 2,278 1.57 16 410
Northeastern Region 1,196,554 23.0 1,257,183 24.1 266,454 1,208,679 22.0 179 246,355 162,825 1.93 7 211
Nakon Ratchasima 157,230 23.1 174,809 25.7 32,989 138,432 23.8 237 31,017 33,669 2.42 7 283
Buri Ram 81,473 23.3 78,059 22.4 19,212 89,244 21.5 146 28,247 10,420 2.57 5 98
Surin 77,374 22.5 90,776 26.4 9,421 68,916 13.7 112 14,003 12,926 2.00 4 76
Si Sa Ket 84,832 24.0 80,194 22.7 17,685 77,498 22.8 106 38,817 17,810 3.98 5 137
Ubon Ratchathani 80,399 19.8 83,885 20.7 33,585 100,422 33.4 109 21,975 8,911 1.81 6 199
Yasothon 32,586 22.8 28,900 20.2 4,356 32,086 13.6 170 5,399 4,464 1.68 4 214
Chaiyaphum 72,512 25.3 93,774 32.7 12,603 61,284 20.6 182 17,785 8,772 2.36 6 306
Amnat Charoen 13,128 15.0 25,689 29.3 5,699 20,016 28.5 113 2,787 3,055 1.61 4 350
Nong Bua Lam Phu 19,432 17.4 20,282 18.2 10,301 31,694 32.5 200 1,863 2,406 0.88 9 95
Khon Kaen 98,265 21.7 91,752 20.2 6,850 100,364 6.8 220 19,873 10,250 1.66 8 140
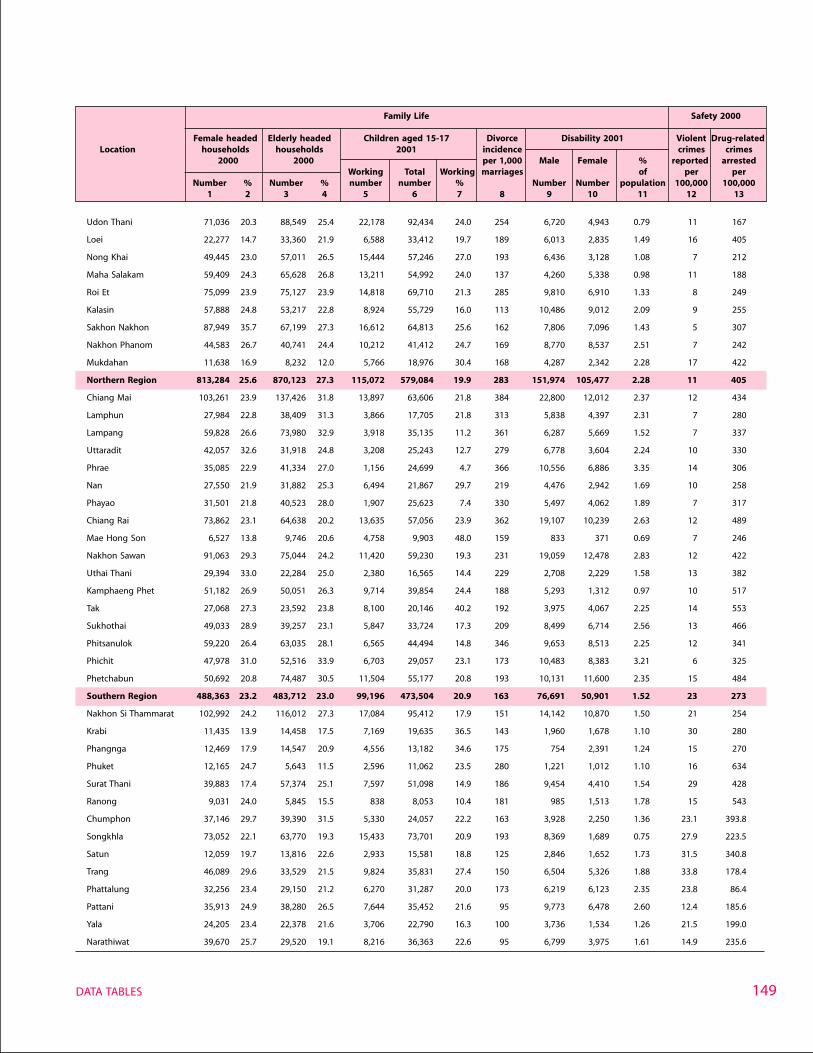
149DATA TABLES
Udon Thani 71,036 20.3 88,549 25.4 22,178 92,434 24.0 254 6,720 4,943 0.79 11 167
Loei 22,277 14.7 33,360 21.9 6,588 33,412 19.7 189 6,013 2,835 1.49 16 405
Nong Khai 49,445 23.0 57,011 26.5 15,444 57,246 27.0 193 6,436 3,128 1.08 7 212
Maha Salakam 59,409 24.3 65,628 26.8 13,211 54,992 24.0 137 4,260 5,338 0.98 11 188
Roi Et 75,099 23.9 75,127 23.9 14,818 69,710 21.3 285 9,810 6,910 1.33 8 249
Kalasin 57,888 24.8 53,217 22.8 8,924 55,729 16.0 113 10,486 9,012 2.09 9 255
Sakhon Nakhon 87,949 35.7 67,199 27.3 16,612 64,813 25.6 162 7,806 7,096 1.43 5 307
Nakhon Phanom 44,583 26.7 40,741 24.4 10,212 41,412 24.7 169 8,770 8,537 2.51 7 242
Mukdahan 11,638 16.9 8,232 12.0 5,766 18,976 30.4 168 4,287 2,342 2.28 17 422
Northern Region 813,284 25.6 870,123 27.3 115,072 579,084 19.9 283 151,974 105,477 2.28 11 405
Chiang Mai 103,261 23.9 137,426 31.8 13,897 63,606 21.8 384 22,800 12,012 2.37 12 434
Lamphun 27,984 22.8 38,409 31.3 3,866 17,705 21.8 313 5,838 4,397 2.31 7 280
Lampang 59,828 26.6 73,980 32.9 3,918 35,135 11.2 361 6,287 5,669 1.52 7 337
Uttaradit 42,057 32.6 31,918 24.8 3,208 25,243 12.7 279 6,778 3,604 2.24 10 330
Phrae 35,085 22.9 41,334 27.0 1,156 24,699 4.7 366 10,556 6,886 3.35 14 306
Nan 27,550 21.9 31,882 25.3 6,494 21,867 29.7 219 4,476 2,942 1.69 10 258
Phayao 31,501 21.8 40,523 28.0 1,907 25,623 7.4 330 5,497 4,062 1.89 7 317
Chiang Rai 73,862 23.1 64,638 20.2 13,635 57,056 23.9 362 19,107 10,239 2.63 12 489
Mae Hong Son 6,527 13.8 9,746 20.6 4,758 9,903 48.0 159 833 371 0.69 7 246
Nakhon Sawan 91,063 29.3 75,044 24.2 11,420 59,230 19.3 231 19,059 12,478 2.83 12 422
Uthai Thani 29,394 33.0 22,284 25.0 2,380 16,565 14.4 229 2,708 2,229 1.58 13 382
Kamphaeng Phet 51,182 26.9 50,051 26.3 9,714 39,854 24.4 188 5,293 1,312 0.97 10 517
Tak 27,068 27.3 23,592 23.8 8,100 20,146 40.2 192 3,975 4,067 2.25 14 553
Sukhothai 49,033 28.9 39,257 23.1 5,847 33,724 17.3 209 8,499 6,714 2.56 13 466
Phitsanulok 59,220 26.4 63,035 28.1 6,565 44,494 14.8 346 9,653 8,513 2.25 12 341
Phichit 47,978 31.0 52,516 33.9 6,703 29,057 23.1 173 10,483 8,383 3.21 6 325
Phetchabun 50,692 20.8 74,487 30.5 11,504 55,177 20.8 193 10,131 11,600 2.35 15 484
Southern Region 488,363 23.2 483,712 23.0 99,196 473,504 20.9 163 76,691 50,901 1.52 23 273
Nakhon Si Thammarat 102,992 24.2 116,012 27.3 17,084 95,412 17.9 151 14,142 10,870 1.50 21 254
Krabi 11,435 13.9 14,458 17.5 7,169 19,635 36.5 143 1,960 1,678 1.10 30 280
Phangnga 12,469 17.9 14,547 20.9 4,556 13,182 34.6 175 754 2,391 1.24 15 270
Phuket 12,165 24.7 5,643 11.5 2,596 11,062 23.5 280 1,221 1,012 1.10 16 634
Surat Thani 39,883 17.4 57,374 25.1 7,597 51,098 14.9 186 9,454 4,410 1.54 29 428
Ranong 9,031 24.0 5,845 15.5 838 8,053 10.4 181 985 1,513 1.78 15 543
Chumphon 37,146 29.7 39,390 31.5 5,330 24,057 22.2 163 3,928 2,250 1.36 23.1 393.8
Songkhla 73,052 22.1 63,770 19.3 15,433 73,701 20.9 193 8,369 1,689 0.75 27.9 223.5
Satun 12,059 19.7 13,816 22.6 2,933 15,581 18.8 125 2,846 1,652 1.73 31.5 340.8
Trang 46,089 29.6 33,529 21.5 9,824 35,831 27.4 150 6,504 5,326 1.88 33.8 178.4
Phattalung 32,256 23.4 29,150 21.2 6,270 31,287 20.0 173 6,219 6,123 2.35 23.8 86.4
Pattani 35,913 24.9 38,280 26.5 7,644 35,452 21.6 95 9,773 6,478 2.60 12.4 185.6
Yala 24,205 23.4 22,378 21.6 3,706 22,790 16.3 100 3,736 1,534 1.26 21.5 199.0
Narathiwat 39,670 25.7 29,520 19.1 8,216 36,363 22.6 95 6,799 3,975 1.61 14.9 235.6
Table 7 Familiy and Community lifeFamily Life Safety 2000
Female headed Elderly headed Children aged 15-17 Divorce Disability 2001 Violent Drug-relatedLocation households households 2001 incidence crimes crimes
2000 2000 per 1,000 Male Female % reported arrestedWorking Total Working marriages of per per
Number % Number % number number % Number Number population 100,000 100,0001 2 3 4 5 6 7 8 9 10 11 12 13
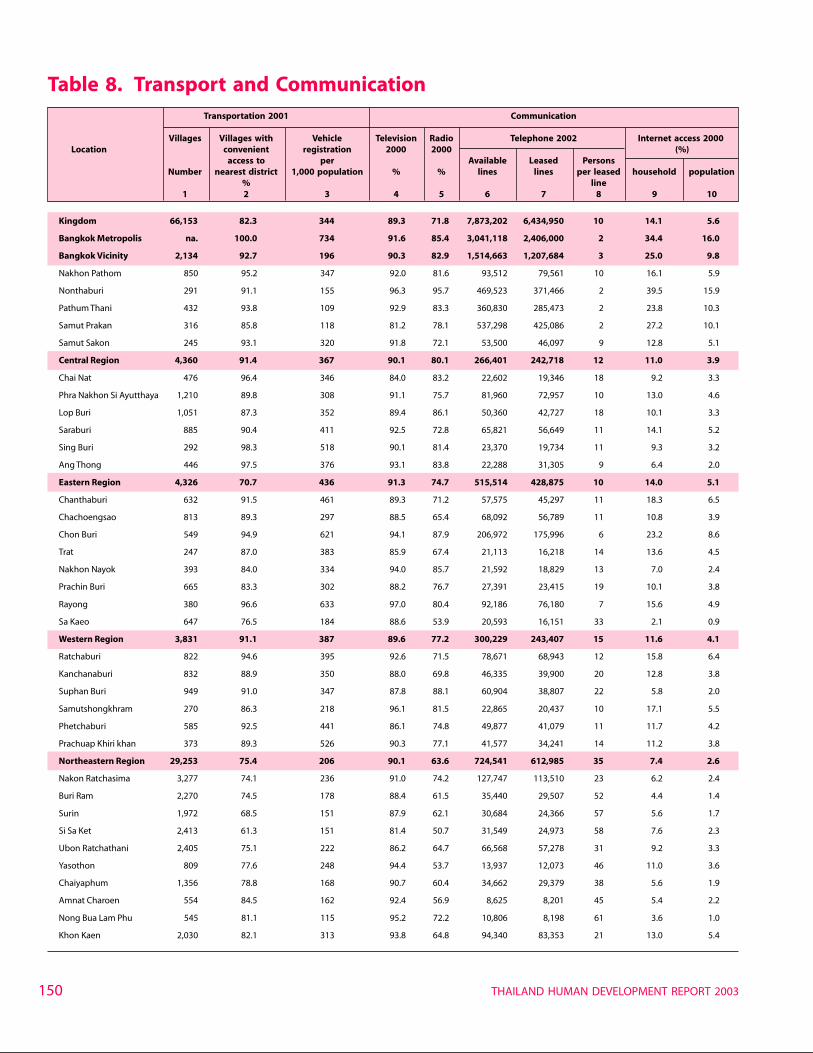
THAILAND HUMAN DEVELOPMENT REPORT 2003150
Table 8. Transport and CommunicationTransportation 2001 Communication
Villages Villages with Vehicle Television Radio Telephone 2002 Internet access 2000Location convenient registration 2000 2000 (%)
access to per Available Leased PersonsNumber nearest district 1,000 population % % lines lines per leased household population
% line1 2 3 4 5 6 7 8 9 10
Kingdom 66,153 82.3 344 89.3 71.8 7,873,202 6,434,950 10 14.1 5.6
Bangkok Metropolis na. 100.0 734 91.6 85.4 3,041,118 2,406,000 2 34.4 16.0
Bangkok Vicinity 2,134 92.7 196 90.3 82.9 1,514,663 1,207,684 3 25.0 9.8
Nakhon Pathom 850 95.2 347 92.0 81.6 93,512 79,561 10 16.1 5.9
Nonthaburi 291 91.1 155 96.3 95.7 469,523 371,466 2 39.5 15.9
Pathum Thani 432 93.8 109 92.9 83.3 360,830 285,473 2 23.8 10.3
Samut Prakan 316 85.8 118 81.2 78.1 537,298 425,086 2 27.2 10.1
Samut Sakon 245 93.1 320 91.8 72.1 53,500 46,097 9 12.8 5.1
Central Region 4,360 91.4 367 90.1 80.1 266,401 242,718 12 11.0 3.9
Chai Nat 476 96.4 346 84.0 83.2 22,602 19,346 18 9.2 3.3
Phra Nakhon Si Ayutthaya 1,210 89.8 308 91.1 75.7 81,960 72,957 10 13.0 4.6
Lop Buri 1,051 87.3 352 89.4 86.1 50,360 42,727 18 10.1 3.3
Saraburi 885 90.4 411 92.5 72.8 65,821 56,649 11 14.1 5.2
Sing Buri 292 98.3 518 90.1 81.4 23,370 19,734 11 9.3 3.2
Ang Thong 446 97.5 376 93.1 83.8 22,288 31,305 9 6.4 2.0
Eastern Region 4,326 70.7 436 91.3 74.7 515,514 428,875 10 14.0 5.1
Chanthaburi 632 91.5 461 89.3 71.2 57,575 45,297 11 18.3 6.5
Chachoengsao 813 89.3 297 88.5 65.4 68,092 56,789 11 10.8 3.9
Chon Buri 549 94.9 621 94.1 87.9 206,972 175,996 6 23.2 8.6
Trat 247 87.0 383 85.9 67.4 21,113 16,218 14 13.6 4.5
Nakhon Nayok 393 84.0 334 94.0 85.7 21,592 18,829 13 7.0 2.4
Prachin Buri 665 83.3 302 88.2 76.7 27,391 23,415 19 10.1 3.8
Rayong 380 96.6 633 97.0 80.4 92,186 76,180 7 15.6 4.9
Sa Kaeo 647 76.5 184 88.6 53.9 20,593 16,151 33 2.1 0.9
Western Region 3,831 91.1 387 89.6 77.2 300,229 243,407 15 11.6 4.1
Ratchaburi 822 94.6 395 92.6 71.5 78,671 68,943 12 15.8 6.4
Kanchanaburi 832 88.9 350 88.0 69.8 46,335 39,900 20 12.8 3.8
Suphan Buri 949 91.0 347 87.8 88.1 60,904 38,807 22 5.8 2.0
Samutshongkhram 270 86.3 218 96.1 81.5 22,865 20,437 10 17.1 5.5
Phetchaburi 585 92.5 441 86.1 74.8 49,877 41,079 11 11.7 4.2
Prachuap Khiri khan 373 89.3 526 90.3 77.1 41,577 34,241 14 11.2 3.8
Northeastern Region 29,253 75.4 206 90.1 63.6 724,541 612,985 35 7.4 2.6
Nakon Ratchasima 3,277 74.1 236 91.0 74.2 127,747 113,510 23 6.2 2.4
Buri Ram 2,270 74.5 178 88.4 61.5 35,440 29,507 52 4.4 1.4
Surin 1,972 68.5 151 87.9 62.1 30,684 24,366 57 5.6 1.7
Si Sa Ket 2,413 61.3 151 81.4 50.7 31,549 24,973 58 7.6 2.3
Ubon Ratchathani 2,405 75.1 222 86.2 64.7 66,568 57,278 31 9.2 3.3
Yasothon 809 77.6 248 94.4 53.7 13,937 12,073 46 11.0 3.6
Chaiyaphum 1,356 78.8 168 90.7 60.4 34,662 29,379 38 5.6 1.9
Amnat Charoen 554 84.5 162 92.4 56.9 8,625 8,201 45 5.4 2.2
Nong Bua Lam Phu 545 81.1 115 95.2 72.2 10,806 8,198 61 3.6 1.0
Khon Kaen 2,030 82.1 313 93.8 64.8 94,340 83,353 21 13.0 5.4
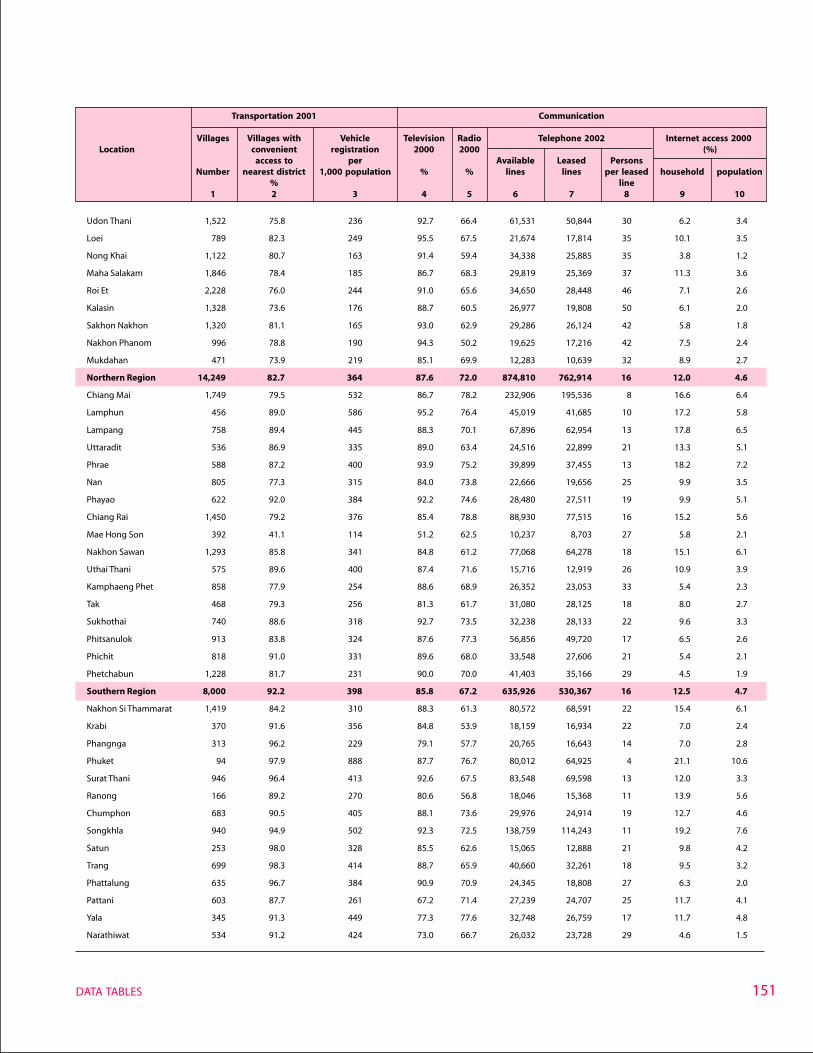
151DATA TABLES
Udon Thani 1,522 75.8 236 92.7 66.4 61,531 50,844 30 6.2 3.4
Loei 789 82.3 249 95.5 67.5 21,674 17,814 35 10.1 3.5
Nong Khai 1,122 80.7 163 91.4 59.4 34,338 25,885 35 3.8 1.2
Maha Salakam 1,846 78.4 185 86.7 68.3 29,819 25,369 37 11.3 3.6
Roi Et 2,228 76.0 244 91.0 65.6 34,650 28,448 46 7.1 2.6
Kalasin 1,328 73.6 176 88.7 60.5 26,977 19,808 50 6.1 2.0
Sakhon Nakhon 1,320 81.1 165 93.0 62.9 29,286 26,124 42 5.8 1.8
Nakhon Phanom 996 78.8 190 94.3 50.2 19,625 17,216 42 7.5 2.4
Mukdahan 471 73.9 219 85.1 69.9 12,283 10,639 32 8.9 2.7
Northern Region 14,249 82.7 364 87.6 72.0 874,810 762,914 16 12.0 4.6
Chiang Mai 1,749 79.5 532 86.7 78.2 232,906 195,536 8 16.6 6.4
Lamphun 456 89.0 586 95.2 76.4 45,019 41,685 10 17.2 5.8
Lampang 758 89.4 445 88.3 70.1 67,896 62,954 13 17.8 6.5
Uttaradit 536 86.9 335 89.0 63.4 24,516 22,899 21 13.3 5.1
Phrae 588 87.2 400 93.9 75.2 39,899 37,455 13 18.2 7.2
Nan 805 77.3 315 84.0 73.8 22,666 19,656 25 9.9 3.5
Phayao 622 92.0 384 92.2 74.6 28,480 27,511 19 9.9 5.1
Chiang Rai 1,450 79.2 376 85.4 78.8 88,930 77,515 16 15.2 5.6
Mae Hong Son 392 41.1 114 51.2 62.5 10,237 8,703 27 5.8 2.1
Nakhon Sawan 1,293 85.8 341 84.8 61.2 77,068 64,278 18 15.1 6.1
Uthai Thani 575 89.6 400 87.4 71.6 15,716 12,919 26 10.9 3.9
Kamphaeng Phet 858 77.9 254 88.6 68.9 26,352 23,053 33 5.4 2.3
Tak 468 79.3 256 81.3 61.7 31,080 28,125 18 8.0 2.7
Sukhothai 740 88.6 318 92.7 73.5 32,238 28,133 22 9.6 3.3
Phitsanulok 913 83.8 324 87.6 77.3 56,856 49,720 17 6.5 2.6
Phichit 818 91.0 331 89.6 68.0 33,548 27,606 21 5.4 2.1
Phetchabun 1,228 81.7 231 90.0 70.0 41,403 35,166 29 4.5 1.9
Southern Region 8,000 92.2 398 85.8 67.2 635,926 530,367 16 12.5 4.7
Nakhon Si Thammarat 1,419 84.2 310 88.3 61.3 80,572 68,591 22 15.4 6.1
Krabi 370 91.6 356 84.8 53.9 18,159 16,934 22 7.0 2.4
Phangnga 313 96.2 229 79.1 57.7 20,765 16,643 14 7.0 2.8
Phuket 94 97.9 888 87.7 76.7 80,012 64,925 4 21.1 10.6
Surat Thani 946 96.4 413 92.6 67.5 83,548 69,598 13 12.0 3.3
Ranong 166 89.2 270 80.6 56.8 18,046 15,368 11 13.9 5.6
Chumphon 683 90.5 405 88.1 73.6 29,976 24,914 19 12.7 4.6
Songkhla 940 94.9 502 92.3 72.5 138,759 114,243 11 19.2 7.6
Satun 253 98.0 328 85.5 62.6 15,065 12,888 21 9.8 4.2
Trang 699 98.3 414 88.7 65.9 40,660 32,261 18 9.5 3.2
Phattalung 635 96.7 384 90.9 70.9 24,345 18,808 27 6.3 2.0
Pattani 603 87.7 261 67.2 71.4 27,239 24,707 25 11.7 4.1
Yala 345 91.3 449 77.3 77.6 32,748 26,759 17 11.7 4.8
Narathiwat 534 91.2 424 73.0 66.7 26,032 23,728 29 4.6 1.5
Table 8 Transport and CommunicationTransportation 2001 Communication
Villages Villages with Vehicle Television Radio Telephone 2002 Internet access 2000Location convenient registration 2000 2000 (%)
access to per Available Leased PersonsNumber nearest district 1,000 population % % lines lines per leased household population
% line1 2 3 4 5 6 7 8 9 10
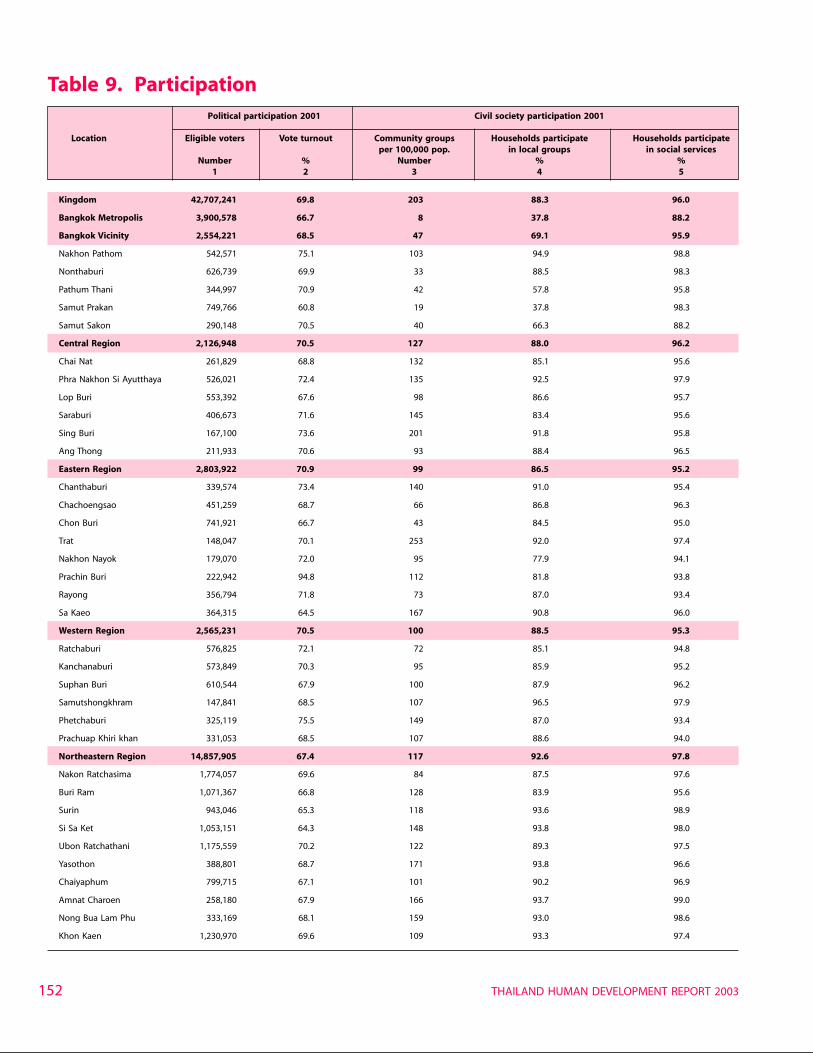
THAILAND HUMAN DEVELOPMENT REPORT 2003152
Table 9. ParticipationPolitical participation 2001 Civil society participation 2001
Location Eligible voters Vote turnout Community groups Households participate Households participateper 100,000 pop. in local groups in social services
Number % Number % %1 2 3 4 5
Kingdom 42,707,241 69.8 203 88.3 96.0
Bangkok Metropolis 3,900,578 66.7 8 37.8 88.2
Bangkok Vicinity 2,554,221 68.5 47 69.1 95.9
Nakhon Pathom 542,571 75.1 103 94.9 98.8
Nonthaburi 626,739 69.9 33 88.5 98.3
Pathum Thani 344,997 70.9 42 57.8 95.8
Samut Prakan 749,766 60.8 19 37.8 98.3
Samut Sakon 290,148 70.5 40 66.3 88.2
Central Region 2,126,948 70.5 127 88.0 96.2
Chai Nat 261,829 68.8 132 85.1 95.6
Phra Nakhon Si Ayutthaya 526,021 72.4 135 92.5 97.9
Lop Buri 553,392 67.6 98 86.6 95.7
Saraburi 406,673 71.6 145 83.4 95.6
Sing Buri 167,100 73.6 201 91.8 95.8
Ang Thong 211,933 70.6 93 88.4 96.5
Eastern Region 2,803,922 70.9 99 86.5 95.2
Chanthaburi 339,574 73.4 140 91.0 95.4
Chachoengsao 451,259 68.7 66 86.8 96.3
Chon Buri 741,921 66.7 43 84.5 95.0
Trat 148,047 70.1 253 92.0 97.4
Nakhon Nayok 179,070 72.0 95 77.9 94.1
Prachin Buri 222,942 94.8 112 81.8 93.8
Rayong 356,794 71.8 73 87.0 93.4
Sa Kaeo 364,315 64.5 167 90.8 96.0
Western Region 2,565,231 70.5 100 88.5 95.3
Ratchaburi 576,825 72.1 72 85.1 94.8
Kanchanaburi 573,849 70.3 95 85.9 95.2
Suphan Buri 610,544 67.9 100 87.9 96.2
Samutshongkhram 147,841 68.5 107 96.5 97.9
Phetchaburi 325,119 75.5 149 87.0 93.4
Prachuap Khiri khan 331,053 68.5 107 88.6 94.0
Northeastern Region 14,857,905 67.4 117 92.6 97.8
Nakon Ratchasima 1,774,057 69.6 84 87.5 97.6
Buri Ram 1,071,367 66.8 128 83.9 95.6
Surin 943,046 65.3 118 93.6 98.9
Si Sa Ket 1,053,151 64.3 148 93.8 98.0
Ubon Ratchathani 1,175,559 70.2 122 89.3 97.5
Yasothon 388,801 68.7 171 93.8 96.6
Chaiyaphum 799,715 67.1 101 90.2 96.9
Amnat Charoen 258,180 67.9 166 93.7 99.0
Nong Bua Lam Phu 333,169 68.1 159 93.0 98.6
Khon Kaen 1,230,970 69.6 109 93.3 97.4
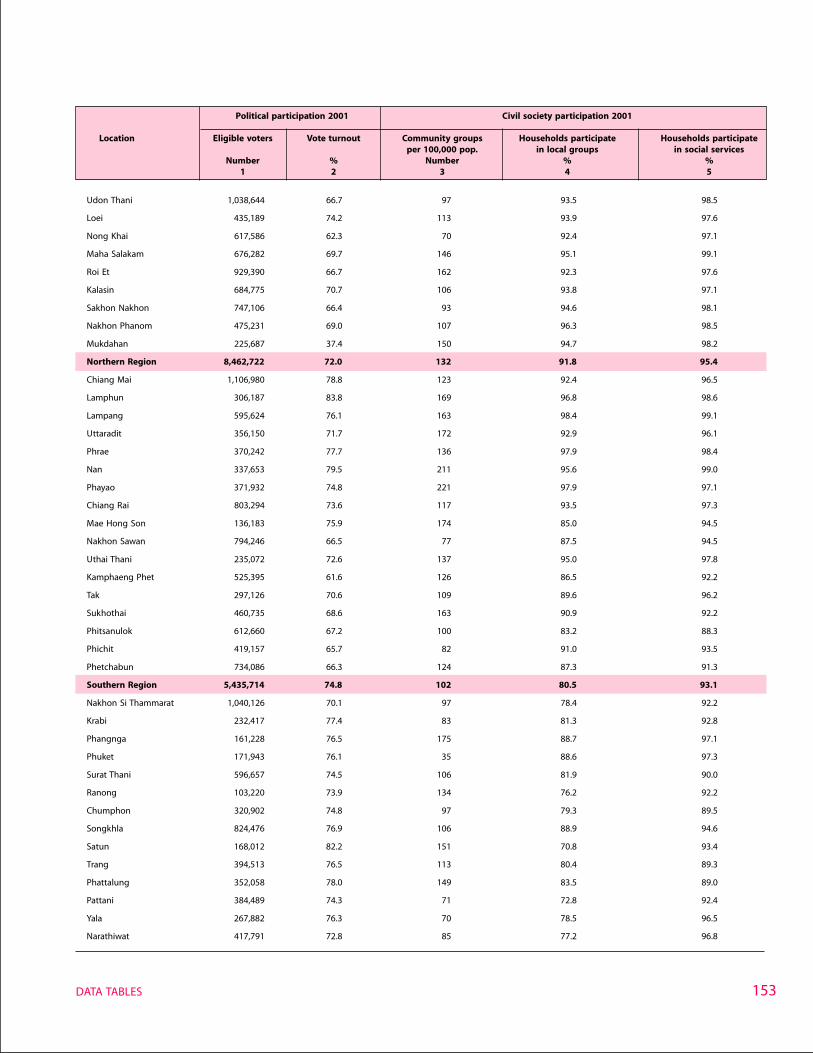
153DATA TABLES
Udon Thani 1,038,644 66.7 97 93.5 98.5
Loei 435,189 74.2 113 93.9 97.6
Nong Khai 617,586 62.3 70 92.4 97.1
Maha Salakam 676,282 69.7 146 95.1 99.1
Roi Et 929,390 66.7 162 92.3 97.6
Kalasin 684,775 70.7 106 93.8 97.1
Sakhon Nakhon 747,106 66.4 93 94.6 98.1
Nakhon Phanom 475,231 69.0 107 96.3 98.5
Mukdahan 225,687 37.4 150 94.7 98.2
Northern Region 8,462,722 72.0 132 91.8 95.4
Chiang Mai 1,106,980 78.8 123 92.4 96.5
Lamphun 306,187 83.8 169 96.8 98.6
Lampang 595,624 76.1 163 98.4 99.1
Uttaradit 356,150 71.7 172 92.9 96.1
Phrae 370,242 77.7 136 97.9 98.4
Nan 337,653 79.5 211 95.6 99.0
Phayao 371,932 74.8 221 97.9 97.1
Chiang Rai 803,294 73.6 117 93.5 97.3
Mae Hong Son 136,183 75.9 174 85.0 94.5
Nakhon Sawan 794,246 66.5 77 87.5 94.5
Uthai Thani 235,072 72.6 137 95.0 97.8
Kamphaeng Phet 525,395 61.6 126 86.5 92.2
Tak 297,126 70.6 109 89.6 96.2
Sukhothai 460,735 68.6 163 90.9 92.2
Phitsanulok 612,660 67.2 100 83.2 88.3
Phichit 419,157 65.7 82 91.0 93.5
Phetchabun 734,086 66.3 124 87.3 91.3
Southern Region 5,435,714 74.8 102 80.5 93.1
Nakhon Si Thammarat 1,040,126 70.1 97 78.4 92.2
Krabi 232,417 77.4 83 81.3 92.8
Phangnga 161,228 76.5 175 88.7 97.1
Phuket 171,943 76.1 35 88.6 97.3
Surat Thani 596,657 74.5 106 81.9 90.0
Ranong 103,220 73.9 134 76.2 92.2
Chumphon 320,902 74.8 97 79.3 89.5
Songkhla 824,476 76.9 106 88.9 94.6
Satun 168,012 82.2 151 70.8 93.4
Trang 394,513 76.5 113 80.4 89.3
Phattalung 352,058 78.0 149 83.5 89.0
Pattani 384,489 74.3 71 72.8 92.4
Yala 267,882 76.3 70 78.5 96.5
Narathiwat 417,791 72.8 85 77.2 96.8
Table 9 ParticipationPolitical participation 2001 Civil society participation 2001
Location Eligible voters Vote turnout Community groups Households participate Households participateper 100,000 pop. in local groups in social services
Number % Number % %1 2 3 4 5

THAILAND HUMAN DEVELOPMENT REPORT 2003154
United Nations Development ProgrammeUnited Nations Building, 12th FloorRajdamnern Nok AvenueBangkok 10200, ThailandTel: (66-2) 2881234Fax: (66-2) 2800556
E-mail: [email protected] site: http://www.undp.or.th
� �
� �


![EUROPEAN CONVENTION ON HUMAN RIGHTS ACT 2003€¦ · [No. 20.] European Convention on Human [2003.] Rights Act 2003. S.5 Notice of proceedings under Act. Amendment of Human Rights](https://img.pdfslide.us/doc/110x75/604c08682b9dbc5190483602/european-convention-on-human-rights-act-2003-no-20-european-convention-on-human.jpg)