Embed Size (px)
Citation preview

Thailand experiences on healthier logo implementation
Visith Chavasit Institute of Nutrition, Mahidol University, Thailand

2
Simplified Logo
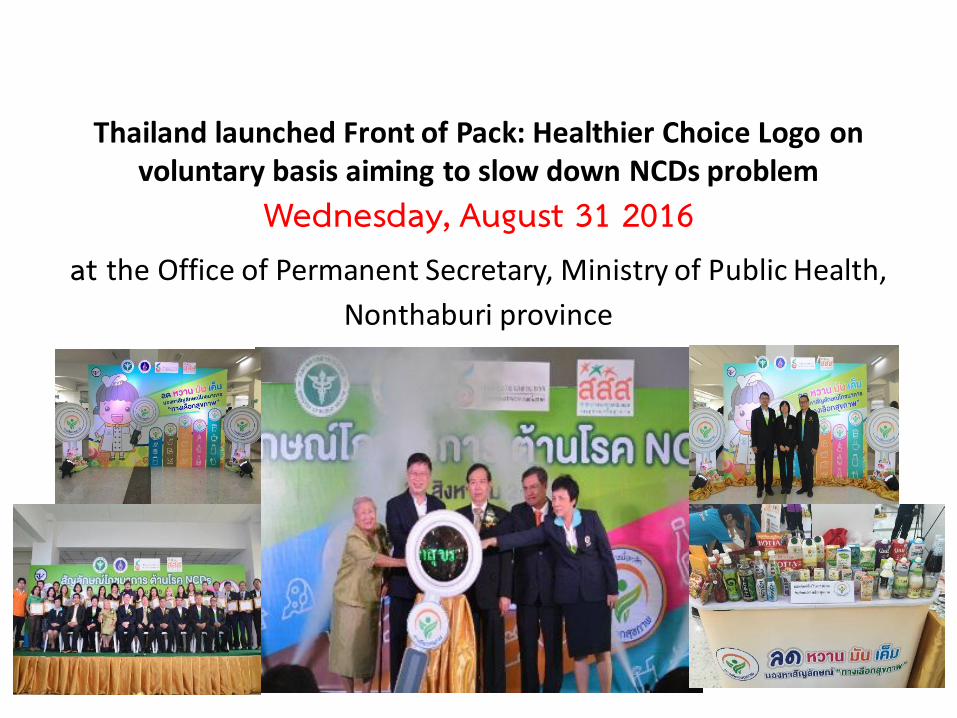
Thailand launched Front of Pack: Healthier Choice Logo on voluntary basis aiming to slow down NCDs problem
Wednesday, August 31 2016 at the Office of Permanent Secretary, Ministry of Public Health,
Nonthaburi province

Management Model of Thai Nutrition Symbol
Nutrition
Promotion Foundation
The National Food
Committee
Public hearing
Scientific committee
Public
campaign &
Symbol promotion
Private sectors
Driven
Committee
- management authority
on issuing the logo - monitoring
Thailand FDA
Sub-Committee of
Developing and Promoting
the Use of Simplified Nutrition Symbol
Budgets for logo promotion and management were supported by Thai Health
Promotion Fund.
MoPH
Notification No. 373
Food group & Criteria
Health Situation and Problems
Cooperation
Announcement

Criteria Establishment Academic working group
↓ Scientific Committee
↓ Public Hearing
↓ Approved by the Planning Committee
on Strategic Frame work for Food Management (SFFM) in Thailand of the
National Food Committee ↓
Declaration in the Food and Drug Administration’s Notification

Example of information
Used for:
• Establishing criteria
• Discussing in the scientific committee
• Discussing in the public hearing
• Reporting to the subcommittee of
the National Food Committee
• Declaring in the FDA notification

7
Product group Criteria
Total Fat g/100g
Fiber g/100g
Sugar g/100g
Sodium mg/100g
HCS Bread (loaf), breadcrumbs, Flat breads (pita, wraps), pizza crust
≤5 ≥3 - ≤450
Choice
All types of bread or substitutes for bread with the exception of
breakfast cereals. E.g.: wheat bread, wholemeal bread, crisp breads,
knäckerbrod, croissants, rye bread, speciality rolls, and crackers
- ≥4 ≤6 ≤450
EU Bread, rusks, rice, noodles, pasta, polenta
- ≥3 ≤5 ≤500
Bread ≤5** ≥3** ≤6* ≤450**
Bread Access: http://www.azhariahkamin.com/wp-content/uploads/2015/11/sliced-bread.jpg
Table 1 Nutrition Criteria for Bread

1.00
2.00
3.00
4.00
5.00
6.00
7.00
8.00
9.00
10.00
11.00
12.00
13.00
14.00
15.00
1 2 3 4 5 6 7 8 91011121314151617181920212223242526272829303132333435363738394041424344454647484950515253545556
Total Fat g/100g
Sample HCS Total Fat ≤5 g/100g Mean = 5.78 g
g
8
Bread Sample n=56
Range 1.75 -14.40 g
Mean 5.78 g
Median 5.45 g
Figure 1 Amount of Total Fat in Bread (g/100g)
24/56 Products (42%)
29/56 Products (52%)
Reduced 13 %

0.001.002.003.004.005.006.007.008.009.00
10.0011.0012.0013.0014.0015.0016.00
1 2 3 4 5 6 7 8 91011121314151617181920212223242526272829303132333435363738394041424344454647484950515253545556
Fiber g/100g
Sample HCS Fiber ≥3 g/100g
Choice Fiber ≥4 g/100g EU Fiber ≥5 g/100g
Mean = 2.37 g
g
9
Bread
Figure 2 Amount of Fiber in Bread (g/100g)
Sample n=56
Range 0.00 – 16.00 g
Mean 2.37 g
Median 2.00 g
11/56 Products (20%)
19/56 Products (34%) 21/56
Products (38%) Increased 27
%
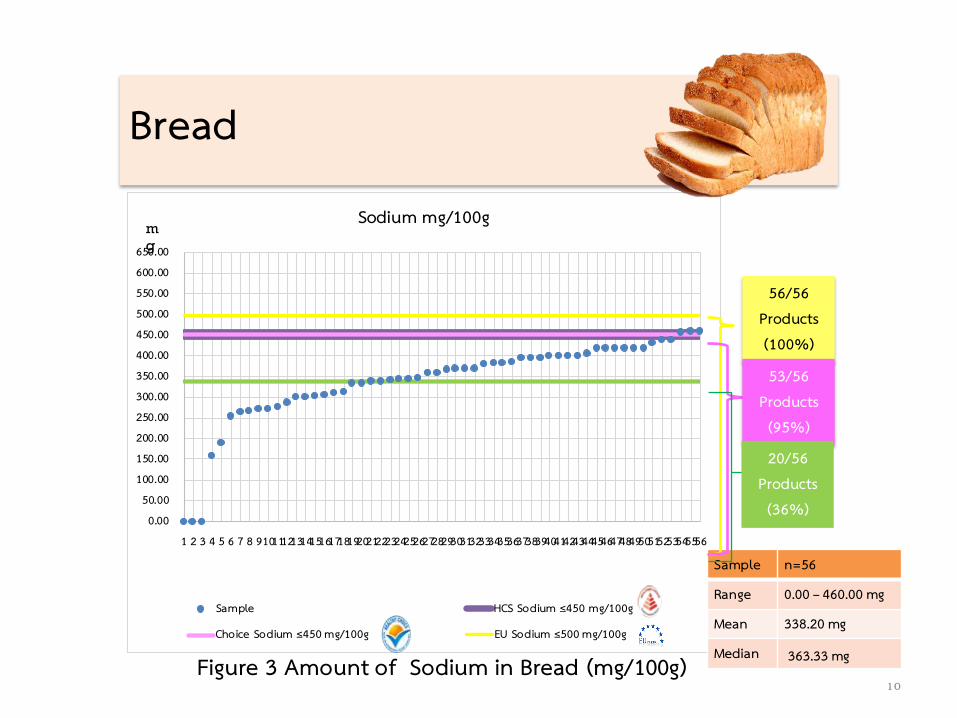
0.0050.00
100.00150.00200.00250.00300.00350.00400.00450.00500.00550.00600.00650.00
1 2 3 4 5 6 7 8 91011121314151617181920212223242526272829303132333435363738394041424344454647484950515253545556
Sodium mg/100g
Sample HCS Sodium ≤450 mg/100g
Choice Sodium ≤450 mg/100g EU Sodium ≤500 mg/100g
10
Bread
Figure 3 Amount of Sodium in Bread (mg/100g)
Sample n=56
Range 0.00 – 460.00 mg
Mean 338.20 mg
Median 363.33 mg
56/56 Products (100%)
53/56 Products (95%)
20/56 Products (36%)
mg

0.001.002.003.004.005.006.007.008.009.00
10.0011.0012.0013.0014.0015.0016.0017.0018.0019.0020.00
1 2 3 4 5 6 7 8 9101112131415161718192021222324252627282930313233343536373839404142434445464748495051525354555657
Sugar g/100g
Sample Choice Sugar ≤6 g/100g
EU Sugar ≤5 g/100g Mean = 6.74 g
g
11
Bread
Figure 4 Amount of Total Sugar in Bread (g/100g)
Sample n=56
Range 0.00 – 19.20 g
Mean 6.74 g
Median 5.04 g
28/56 Products (50%)
35/56 Products (63%)
36/56 Products (64%)
Reduced 11%

12
Bread
Total Products = 56

Food category with Healthier logo in 2019
9. BREAD

In 2020
+ Breakfast Cereals
+ Bakery Products
Totally 11 food categories 32 criteria
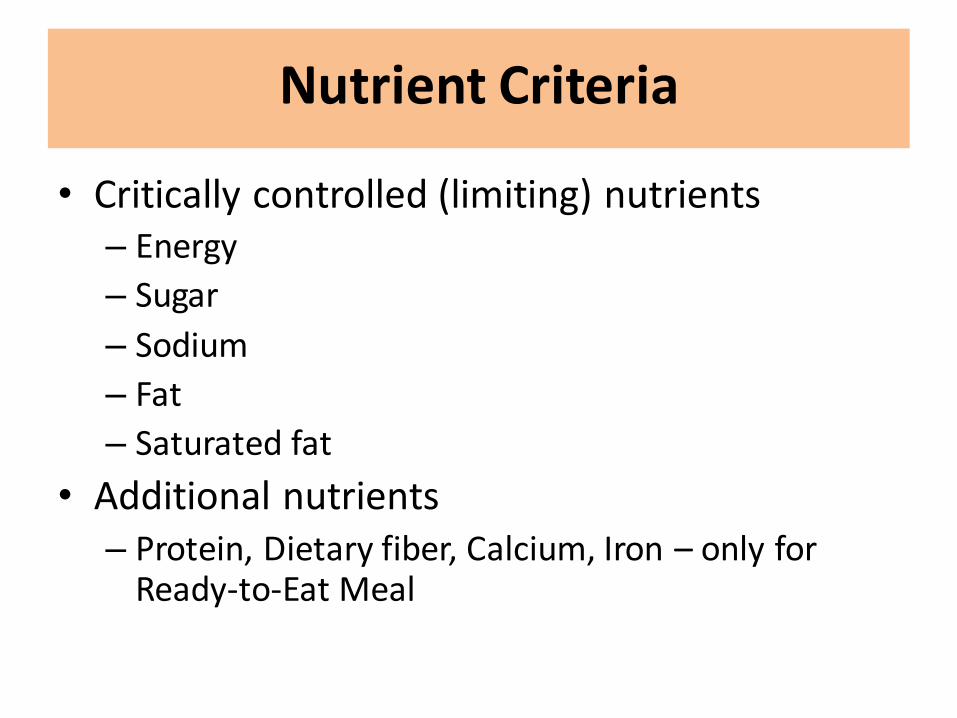
Nutrient Criteria
• Critically controlled (limiting) nutrients – Energy
– Sugar
– Sodium
– Fat
– Saturated fat
• Additional nutrients – Protein, Dietary fiber, Calcium, Iron – only for
Ready-to-Eat Meal

Number of companies that apply and pass the healthier logo
Totally 329 companies
(Until November, 2020)
• Ready to eat 9 companies • Beverages 234 companies • Seasonings 28 companies • Dairy products 23 companies • Instant foods 25 companies • Snacks 24 companies
• Ice cream 10 companies • Fat and oil 3 companies • Bread 2 companies • Breakfast cereal 4 companies • Bakery products 1 company
Note: one company may produce more than 1 product

Food category Number of certified
products (N)
Number of certified products sold in the
market (N)
Ready-to-eat meal 31 24 (77%)
Beverage 1,433 641 (45%)
Seasoning sauce 50 26 (52%)
Dairy product 163 79 (48%)
Instant food 150 84 (56%)
Snack 79 31 (40%)
Ice cream 95 56 (59%)
Fat and oil 5 2 (40%)
Bread 4 4 (100%)
Breakfast Cereals 6 0
Bakery Product 1 0
2,017
947 (47%)
Data on Nov 30, 2020

Data on Nov 30, 2020
127 290 507 552 541 72
177 259 274 165 127
417
924
1476
2017
72
249
508
782 947
0
200
400
600
800
1000
1200
1400
1600
1800
2000
2200Nu
mbe
r of p
rodu
cts
Number of certified products (N)
Number of certified products sold in the market (N)
Cumulative number of certified products (N)
Cumulative Number of certified products sold in the market (N)
N = 2,017 P. (after withdrawal 85 products).
N = 947 P. (after withdrawal 48 products).
2016 2017 2018 2019 2020
Numbers of certified and marketed products with healthier logo

Post-marketing Monitoring
Sampling 10% of the products for
limiting nutrient analyses
Non-performed
Warning
Problem solving Problem solving
Continue marketing Logo Withdrawal
No Action Legal Action
False Labeling
Pass No-Pass


Updated Na & Potassium Intakes in Thais
Estimated dietary sodium intake in Thailand: A nation-wide population survey with 24-hour urine collections.
By Worawon Chailimpamontree et. al. December, 2020
Na intake: 3,636 mg/day
Urinary K: 1,221 mg/day
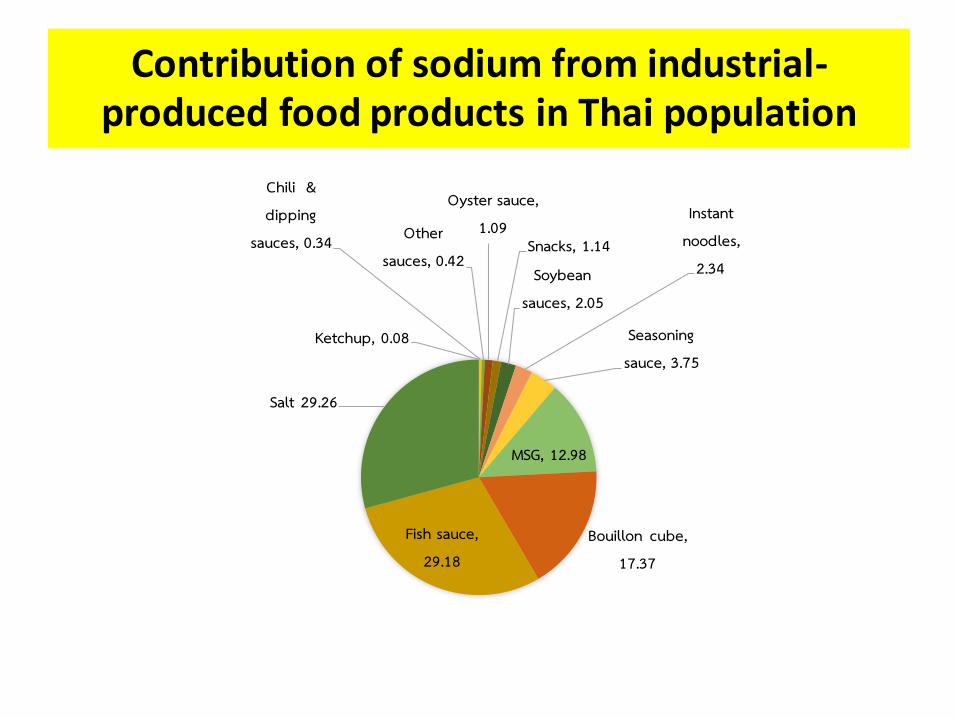
Ketchup, 0.08
Chili & dipping
sauces, 0.34 Other sauces, 0.42
Oyster sauce, 1.09
Snacks, 1.14 Soybean
sauces, 2.05
Instant noodles,
2.34
Seasoning sauce, 3.75
MSG, 12.98
Bouillon cube, 17.37
Fish sauce, 29.18
Salt 29.26
Contribution of sodium from industrial-produced food products in Thai population
Data on Nov 30, 2020
127 290 507 552 541 72
177 259 274 165 127
417
924
1476
2017
72
249
508
782 947
0
200
400
600
800
1000
1200
1400
1600
1800
2000
2200
ค.ศ. 2016 ค.ศ. 2017 ค.ศ. 2018 ค.ศ. 2019 ค.ศ. 2020
Num
ber o
f pro
duct
s
Number of certified products (N)
Number of certified products sold in the market (N)
Cumulative number of certified products (N)
Cumulative Number of certified products sold in the market (N)
N = 2,017 P. Cancel certification 85 P.
N = 947 P. Cancel certification 48 P.
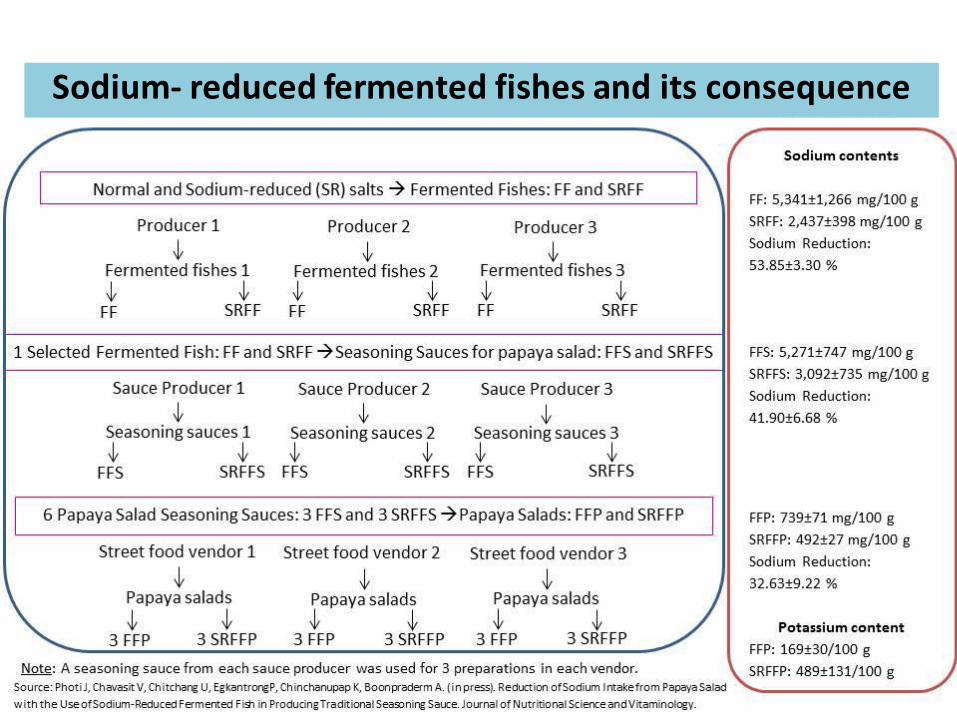
Sodium- reduced fermented fishes and its consequence

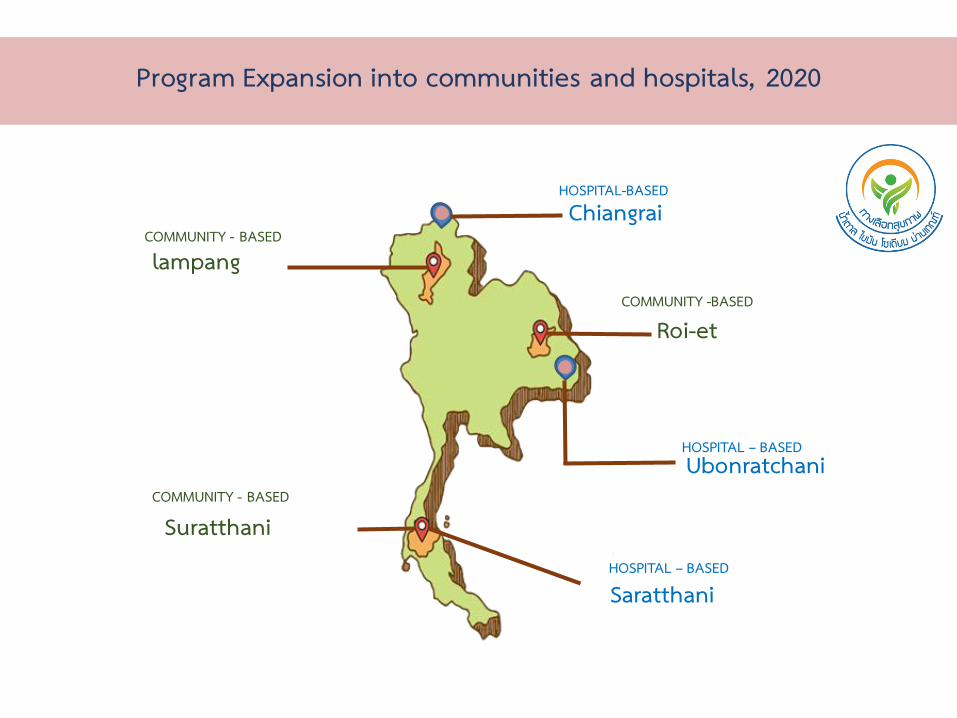
Program Expansion into communities and hospitals, 2020
lampang
Suratthani
Roi-et
COMMUNITY - BASED
COMMUNITY - BASED
COMMUNITY -BASED
Chiangrai
Ubonratchani
Saratthani
HOSPITAL-BASED
HOSPITAL – BASED
HOSPITAL – BASED

Communication Strategies ; Healthier choice National Policy : Street Food Good Health

Communication Strategies ; Healthier Community Healthier Community 1. Healthier Street Food – Suratthani province

ปั
Night Market at Suratthani province, October 2020

Communication Strategies ; Healthier Community Healthier Community 2. Healthier KIDS/ Healthier Shops at school and community in Roi-et province

Communication Strategies ; Healthier Community Healthier Community Healthier Noodles – Lampang province

Lampang province
• 30 Noodle shops


• Contribution of sugar from industrial food products in Thais
• Get on-line survey on changes in recognition and use of healthier logo of consumer during the past 5 years and after (Mintel)
• Percentage and market share of products with healthier logo within each food category during the past 5 years and after (Mintel and Nielsen)
• More criteria for industrial food products (partly upon requested) as well as ready-to-eat salads and cut fruits.
• Expand more criteria for food ingredients especially for cooking and seasonings.
• Healthier restaurant and street foods with cost evaluations
• Healthier hospital foods
• Monitoring the changes in contents of limiting nutrients and potassium in reformulated ready-to-eat foods
• Logo promotion through franchise coffee shops, restaurants and street foods.
• Mutual recognition of the Healthier logos among the ASEAN countries.

Communication Strategies ; Healthier choice Healthier CAFÉ 15,000 shops

Working area: Local Market, Supermarket, Food festival, Fairs, School, etc.
Target group: More than 10,000,000 people/year
Government : Thai FDA, Dept. of Health
Private Sector Academic Sector
Communication Strategies of Healthier Logo

Communication Strategies of Healthier Logo 1. Offline 2. Online marketing 3. On ground Event

Communication Strategies ; Healthier choice Offline : TV Newspapers and magazines

Communication Strategies of Healthier Logo Online marketing

Communication Strategies of Healthier Logo On –ground PR-kit
- Village Health Volunteer
- Junior FDA

Communication Strategies of Healthier Logo ADs on public Bus Thai FDA

Communication Strategies of Healthier Logo Support from supermarkets: Shelf talker, House brand, In-store testing

Communication Strategies of Healthier Logo New year’s basket of Healthier products
Thai FDA

Communication Strategies of Healthier Logo By Food Industries

Communication Strategies of Healthier Logo By Food Industries

Communication Strategies of Healthier Logo By Food Industries

Communication Strategies of Healthier Logo By Food Industries


Balanced Lifestyle
Energy Diet Emotion

Monitoring and Evaluation of Healthier Logo
49
Number of food products with healthier logo
available in the market
Consumer
communication
Change in buying behavior of the population Use of the logo as a sale point
Reduction of undesirable nutrient intakes
INPUTS EXPECTED IMPACTS


![futuris in thailand in thailand...Copyright © Futuris Automotive All Rights Reserved The Futuris logo is a registered trademark [9] 0 10,000 20,000 30,000 40,000 50,000 60,000 70,000](https://img.pdfslide.us/doc/110x75/5fbb07b491f3f817527838a2/futuris-in-thailand-in-thailand-copyright-futuris-automotive-all-rights-reserved.jpg)