Embed Size (px)
Citation preview

2007-2009 DIRECTORY OF THE THAI PULP AND PAPER INDUSTRIES ASSOCIATION
8
Executive Summary
Thai Pulp and Paper Industry in 2006 : In 2006, total short fiber pulp production equaled 1.1 million tons with a total utilization rate of 99%.
Total pulp consumption was 1.3 million tons, an increase of 6% from the previous year. It was estimated that
total pulp consumption will grow to 1.7 million tons by the year 2011. As Thailand is a net importer of long
fiber pulp, total pulp imports equaled 409,000 tons, whereas total pulp exports equaled 211,000 tons.
The total capacity of the paper and board industry in 2006 was 5.2 million tons. The production of
kraft paper held the major portion of the industry with a total capacity of 62%, followed by printing & writing
paper, paperboard, tissue paper and newsprint.
Total industry production increased by 14% with total production equaling 4.3 million tons.
The industry utilization rate in 2006 was 84% the same as in 2005.
In 2006, the consumption of paper and board was 3.5 million tons, an improvement of 12%. In large
part, the increase came from higher consumption volume of paperboard, printing & writing paper and tissue
paper. Paper consumption per capita in 2006 was 56 kg. and the paper and board consumption rate is
expected to reach 77 kg. by 2011.
The total import volume of paper and board in 2006 was 639,000 tons, a 3% drop from the previous
year, which occurred mainly from a 25% drop in newsprint paper imports and a 13% drop in printing &
writing paper imports. The amount of imported paperboard, however, increased by 255% in 2006.
The export of paper and board grew by 14% from the previous year. The total export volume was
1,071,000 tons. Kraft paper made up 50% of the industry exports; it was followed by printing & writing paper
and tissue paper, respectively. The industryûs main export destinations were South Korea, Taiwan, China, and
Southeast Asian countries.
Thai Pulp and Paper Industry : Facts and
Figures
51-01-100_008-034_V.indd 851-01-100_008-034_V.indd 8 1/30/08 2:35:22 PM1/30/08 2:35:22 PM
9
2007-2009 DIRECTORY OF THE THAI PULP AND PAPER INDUSTRIES ASSOCIATION
The Thai economy in 2007 is expected to grow by 4.0›4.5%. This expected growth has been mainly
driven by the countryûs export of goods and services. In addition, the global trend of environmental
awareness has been forecasted to improve the consumption rate of the industry, which has been almost
100% recyclable. Therefore, it is estimated that the demand for Thai paper and board will grow by 5% from
an estimated 3.7 million tons in 2007 to 4.8 million tons by the year 2011.
The industry recovery rate for recovered paper in 2006 was 49%, up 2% from 2005. Total
consumption was 2.8 million tons; it was provided for by a domestic collection of 1.7 million tons and
importations. Recovered paper consumption is estimated to grow by 5% in 2007, parallel with the growth
of kraft paper consumption.
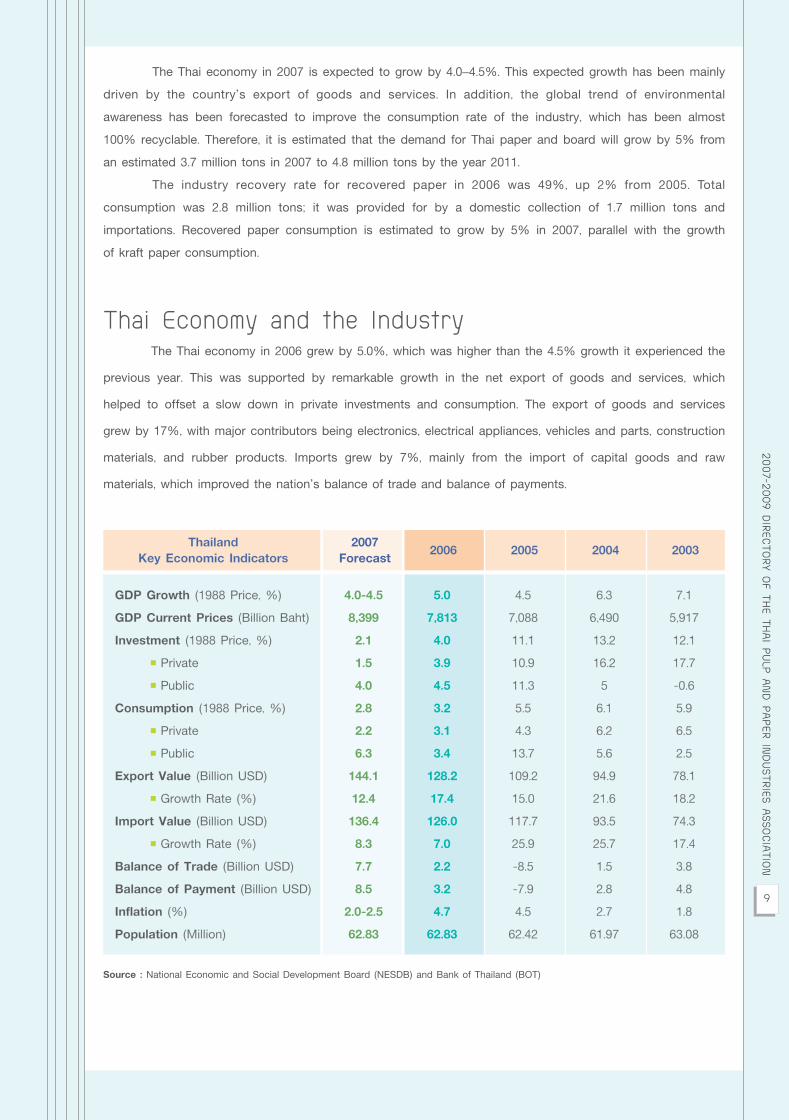
Thai Economy and the Industry The Thai economy in 2006 grew by 5.0%, which was higher than the 4.5% growth it experienced the
previous year. This was supported by remarkable growth in the net export of goods and services, which
helped to offset a slow down in private investments and consumption. The export of goods and services
grew by 17%, with major contributors being electronics, electrical appliances, vehicles and parts, construction
materials, and rubber products. Imports grew by 7%, mainly from the import of capital goods and raw
materials, which improved the nationûs balance of trade and balance of payments.
GDP Growth (1988 Price, %) 4.0-4.5 5.0 4.5 6.3 7.1
GDP Current Prices (Billion Baht) 8,399 7,813 7,088 6,490 5,917
Investment (1988 Price, %) 2.1 4.0 11.1 13.2 12.1
Private 1.5 3.9 10.9 16.2 17.7
Public 4.0 4.5 11.3 5 -0.6
Consumption (1988 Price, %) 2.8 3.2 5.5 6.1 5.9
Private 2.2 3.1 4.3 6.2 6.5
Public 6.3 3.4 13.7 5.6 2.5
Export Value (Billion USD) 144.1 128.2 109.2 94.9 78.1
Growth Rate (%) 12.4 17.4 15.0 21.6 18.2
Import Value (Billion USD) 136.4 126.0 117.7 93.5 74.3
Growth Rate (%) 8.3 7.0 25.9 25.7 17.4
Balance of Trade (Billion USD) 7.7 2.2 -8.5 1.5 3.8
Balance of Payment (Billion USD) 8.5 3.2 -7.9 2.8 4.8
Inflation (%) 2.0-2.5 4.7 4.5 2.7 1.8
Population (Million) 62.83 62.83 62.42 61.97 63.08
Thailand 2007 2006 2005 2004 2003
Key Economic Indicators Forecast
Source : National Economic and Social Development Board (NESDB) and Bank of Thailand (BOT)
51-01-100_008-034_V.indd 951-01-100_008-034_V.indd 9 1/30/08 2:35:23 PM1/30/08 2:35:23 PM

2007-2009 DIRECTORY OF THE THAI PULP AND PAPER INDUSTRIES ASSOCIATION
10
2006 Country Statement and Trend of Thai Pulp and Paper Industry
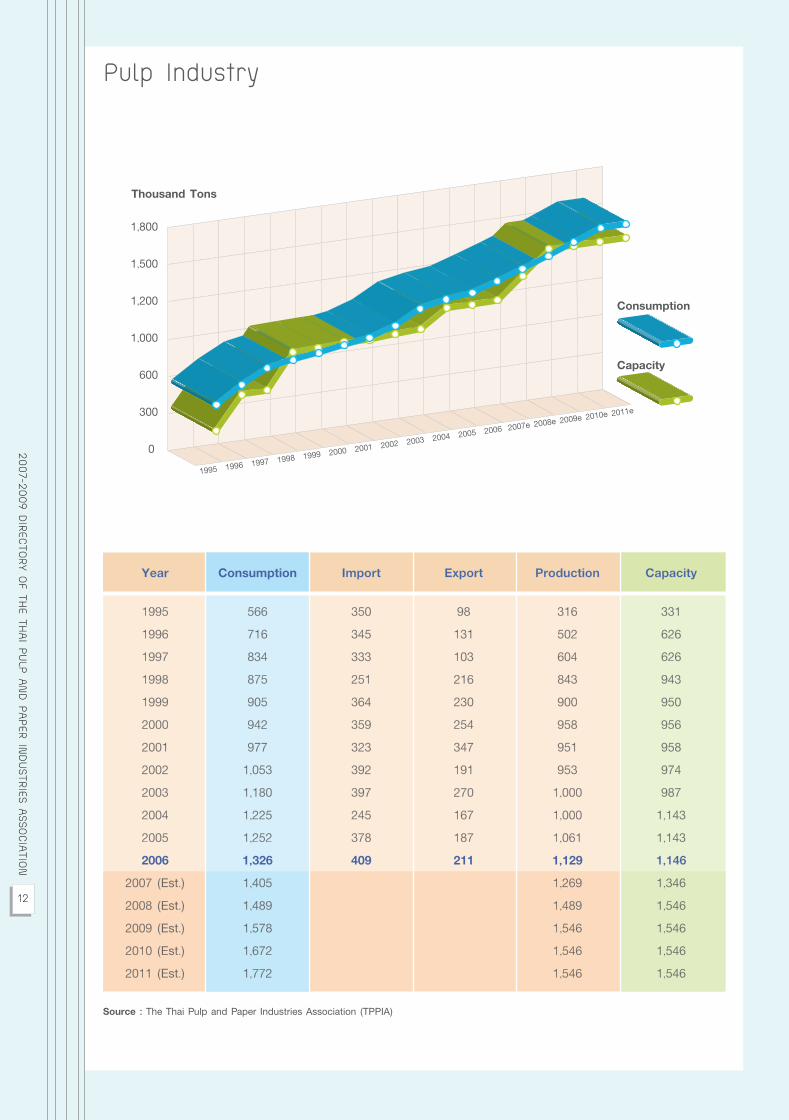
Pulp Industry • Capacity In 2006 total pulp capacity was 1.1 million tons, the same as in 2005. Detail information of the total
capacities of Thailandûs six pulp manufacturers are presented in the table below.
• Production In 2006, total pulp production was 1.1 million tons, a 6% growth from the previous year. Meanwhile,
the utilization rate rose to 99%, up 6% from the previous year, because the industry enjoyed unusually high
prices for short fiber pulp. These higher prices were as a result of a growing preference for short fiber pulp
(over the long fiber grade) in order to reduce costs. Thus, there was an increased demand for short fiber
grades.
The Thai economyûs trade balance in 2006 enjoyed a surplus of 2.2 billion USD, compared to a
deficit of 8.5 billion USD in 2005. This lead to a current account registered surplus of 3.2 billion USD in 2006,
a marked improvement over the 7.9 billion USD deficit posted in 2005.
The economyûs trade surplus was partially created by a remarkable increase in the export of
electronic products such as computers, integrated circuits, and air conditioners. This upwards trade balance
helped to boost the usage of paper containers--especially the use of kraft paper for outer containers and
paperboard for inner boxes and the industryûs annual consumption rate.
* Former The Siam Pulp and Paper ** Started up in October 2004
1. Advance Agro 515 Eucalyptus
2. Phoenix Pulp & Paper 235 Eucalyptus, Bamboo, Leucaena
3. Panjapol Pulp Industry 110 Eucalyptus
4. SCG Paper * 100 Eucalyptus, CTMP
5. Siam Cellulose 86 Eucalyptus
6. Environment Pulp and Paper ** 100 Bagasse
Total 1,146
Manufacturer
Capacity Grade
(Thousand Tons)
51-01-100_008-034_V.indd 1051-01-100_008-034_V.indd 10 1/30/08 2:35:23 PM1/30/08 2:35:23 PM

11
2007-2009 DIRECTORY OF THE THAI PULP AND PAPER INDUSTRIES ASSOCIATION
• Consumption Domestic pulp consumption rose by 6% from the previous year to 1.3 million tons. Since local
manufacturers only produced short fiber grades of pulp, 1,129,000 tons of short fiber grade pulp were
produced within the country, and only long fiber grades of pulp were imported. The slow growth of pulp
demand, however, was the result of the trend to substitute virgin pulp with recycled pulp that enabled
manufacturers to be more cost efficient and environmentally friendly.
• Pulp Import – Export
Total imported pulp rose by 8% in 2006 to 409,000 tons, of which 372,000 tons were long fiber pulp
and 37,000 tons were short fiber pulp. In 2006 imported long fiber pulp increased by 9% from the prior year
due to unusually lower prices that resulted from the capacity expansion of pulp producers in Europe.
The United States, Canada, Sweden, Australia, and South Africa were the major pulp exporters to Thailand.
In 2006, Thailand exported 211,000 tons of short fiber pulp, an amount which grew by 13% from the
previous year. Thailandûs major pulp export markets were China, Indonesia, the Philippines and Singapore.
• Pulp Demand and Capacity Trends Domestic pulp consumption is estimated to grow by 6% per year in line with the growth of the
paper industry. This growth is estimated to result in the demand for pulp reaching a level of 1.4 million tons
in 2007.
Unit : Thousand Tons
Estimated
Year 2004 2005 2006
2007 2008 2009 2010 2011
Consumption
Short Fiber 862 914 895 949 1,006 1,066 1,130 1,198
Long Fiber 363 338 431 456 483 512 542 474
Total 1,225 1,252 1,326 1,405 1,489 1,578 1,672 1,672
Capacity
Short Fiber 1,143 1,143 1,146 1,346 1,546 1,546 1,546 1,546
Long Fiber - - - - - - - -
Total 1,143 1,143 1,146 1,346 1,546 1,546 1,546 1,546
Production
Short Fiber 1,000 1,061 1,129 1,269 1,489 1,546 1,546 1,546
Long Fiber - - - - - - - -
Total 1,000 1,061 1,129 1,269 1,489 1,546 1,546 1,546
Surplus (Shortage)
Short Fiber 138 148 234 320 483 480 416 348
Long Fiber (363) (338) (431) (456) (483) (512) (542) (474)
Source : The Thai Pulp and Paper Industries Association (TPPIA)
51-01-100_008-034_V.indd 1151-01-100_008-034_V.indd 11 1/30/08 2:35:23 PM1/30/08 2:35:23 PM
2007-2009 DIRECTORY OF THE THAI PULP AND PAPER INDUSTRIES ASSOCIATION
12
Pulp Industry
Consumption
Capacity
1995 1996 1997 1998 1999 2000 2001 2002 2003 2004 2005 2006 2007e 2008e 2009e 2010e 2011e
0
300
1,000
600
1,200
1,500
1,800
Thousand Tons
Source : The Thai Pulp and Paper Industries Association (TPPIA)
Year Consumption Import Export Production Capacity
1995 566 350 98 316 331
1996 716 345 131 502 626
1997 834 333 103 604 626
1998 875 251 216 843 943
1999 905 364 230 900 950
2000 942 359 254 958 956
2001 977 323 347 951 958
2002 1,053 392 191 953 974
2003 1,180 397 270 1,000 987
2004 1,225 245 167 1,000 1,143
2005 1,252 378 187 1,061 1,143
2006 1,326 409 211 1,129 1,146
2007 (Est.) 1,405 1,269 1,346
2008 (Est.) 1,489 1,489 1,546
2009 (Est.) 1,578 1,546 1,546
2010 (Est.) 1,672 1,546 1,546
2011 (Est.) 1,772 1,546 1,546
51-01-100_008-034_V.indd 1251-01-100_008-034_V.indd 12 1/30/08 2:35:24 PM1/30/08 2:35:24 PM

13
2007-2009 DIRECTORY OF THE THAI PULP AND PAPER INDUSTRIES ASSOCIATION
Recovered Paper :
• Local recovered paper collection In 2006, the total volume of recovered paper in Thailand was 1.7 million tons. This rise of 18% from
the previous year was due to better waste management and environmental awareness. The industry recovery
rate was 49%, up 2% from the year before.
• Consumption Recovered paper consumption was 2.8 million tons, which was an increase of 8% from the year
2005. According to the industry, awareness of the environment, in accordance with the rising cost of energy
and the capacity expansion of local paper manufacturers, motivated the use of recycled pulp and led to the
trend toward higher recovered paper consumption.
• Recovered Paper Import - Export The importation of recovered paper in 2006 was 1,050,000 tons, an 11% rise from the previous year.
Old Corrugated Carton (OCC) accounted for the largest portion of imported grade at 69% of total imports,
while mixed waste and old newspapers accounted for 20% and 10%, respectively. Main export countries of
recovered paper to Thailand were the United States, Japan and Singapore.
• Recovered Paper Demand and Collection Trends Recovered paper consumption is anticipated to increase by 6% per year along with the projected
growth of the paper industry. It is estimated that the countryûs recovery rate will improve significantly in the
near future. The global trend of environmental awareness is motivating the industry to utilize more recycled
materials. This will inevitably affect Thai manufacturers, especially with regard to international trade as
oversea customers will increasingly demand environmentally-friendly products and certifications.
This increasing trend will definitely enhance the industryûs usage of recycled materials.
In addition, the Thailand Institute of Packaging Management for Sustainable Environment (TIPMSE),
which received its initial funding from packaging material manufacturers in Thailand, was established to
reduce used packaging materials from municipal garbage. The TIPMSEûs main purpose is to trim down used
packaging materials in municipal waste from 4.3 million tons per year to 2.7 million tons. This would produce
a 30% decrease in the amount of used packaging materials in public waste to a level of 19% by the year
2010. Several pilot projects at local universities and communities have been implemented to turn waste into
money. They have been shown to be successful and are in the process of being implemented broadly in
support of the TIPMSEûs mission.
These types of initiatives coupled with the growing global concern for the environment will boost up
local collection rates for recycling materials such as paper, plastics, glass and metals and thereby enable a
continual rise in the industryûs recovery rate.
51-01-100_008-034_V.indd 1351-01-100_008-034_V.indd 13 2/2/08 4:25:44 PM2/2/08 4:25:44 PM

2007-2009 DIRECTORY OF THE THAI PULP AND PAPER INDUSTRIES ASSOCIATION
14
Recovered Paper Industry
1995 1996 1997 1998 1999 2000 2001 2002 2003 2004 2005 2006 2007e 2008e 2009e 2010e 2011e
0
40%
20%
60%
100%
80%
120%
140%
160%
0
500
1,000
1,500
2,000
2,500
3,000
3,500
4,000
Thousand Tons
Consumption
Recovery Rate
Collected
Source : The Thai Pulp and Paper Industries Association (TPPIA) Remarks : Recovery Rate = Recovered Paper Collected / Paper and Board Consumption
Year Consumption Import Export Collection Recovery Rate
1995 1,458 607 0 851 40%
1996 1,515 582 0 933 42%
1997 1,642 622 0 1,021 49%
1998 1,630 725 0 905 55%
1999 1,802 935 2 868 45%
2000 1,728 952 0 776 36%
2001 1,765 947 1 819 36%
2002 1,875 879 3 998 40%
2003 2,149 1,099 3 1,053 40%
2004 2,370 941 6 1,275 44%
2005 2,562 946 15 1,461 47%
2006 2,758 1,050 14 1,721 49%
2007 (Est.) 2,950 50%
2008 (Est.) 3,156 50%
2009 (Est.) 3,376 50%
2010 (Est.) 3,612 51%
2011 (Est.) 3,864 52%
51-01-100_008-034_V.indd 1451-01-100_008-034_V.indd 14 1/30/08 2:35:24 PM1/30/08 2:35:24 PM

15
2007-2009 DIRECTORY OF THE THAI PULP AND PAPER INDUSTRIES ASSOCIATION
Paper and Board Industry
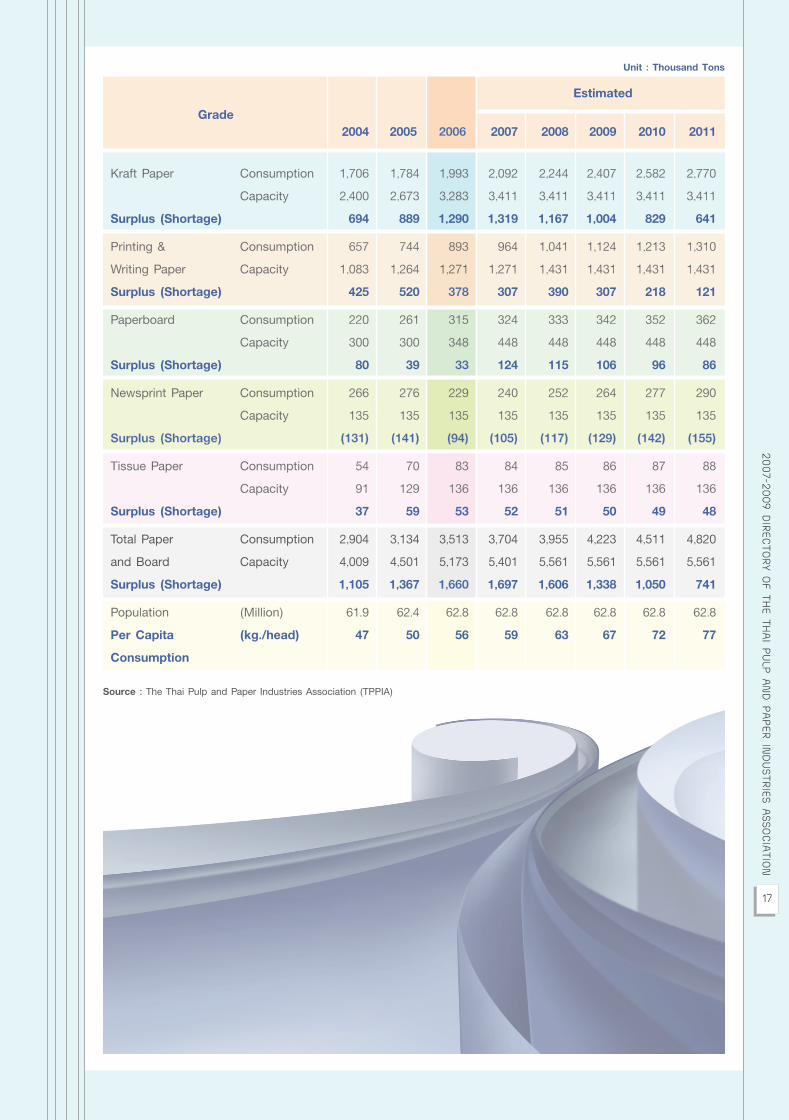
• Capacity The total capacity of the paper and board industry was approximately 5.2 million tons, improve 15%
from the year 2005. Additional capacity mainly came from a kraft paper and tissue paper expansion project
and a de-bottlenecking program aimed at easing the production of printing & writing paper.
Kraft paper continued to hold the largest portion of the industry with total capacity of 62%, followed
by printing & writing paper at 25%, paperboard at 7% and both newsprint paper and tissue paper at 3%
respectively.
• Production Paper production in 2006 soared to 4.3 million tons, a 20% increase from the 2005 total of 3.8
million tons. This mainly resulted from the high national growth of exports.
Kraft paper production volume totaled 2.6 million tons, a rise of 16% from the year before.
Its utilization rate of 80% was 5% lower than that of the previous year. Printing & writing paper production
equaled 1.2 million tons with a utilization rate of 96%, up 12% from 2005. The utilization rate of newsprint
paper was 96%, and the rate for tissue paper was 87%. At 96%, the utilization rate for newsprint dropped
1% from the previous year. In 2006, the utilization rate of the paper and board industry was 84%, the same
as posted in 2005.
Kraft Paper 80%
Printing & Writing Paper 96%
Paperboard 69%
Newsprint Paper 96%
Tissue Paper 87%
Total Paper and Board 84%
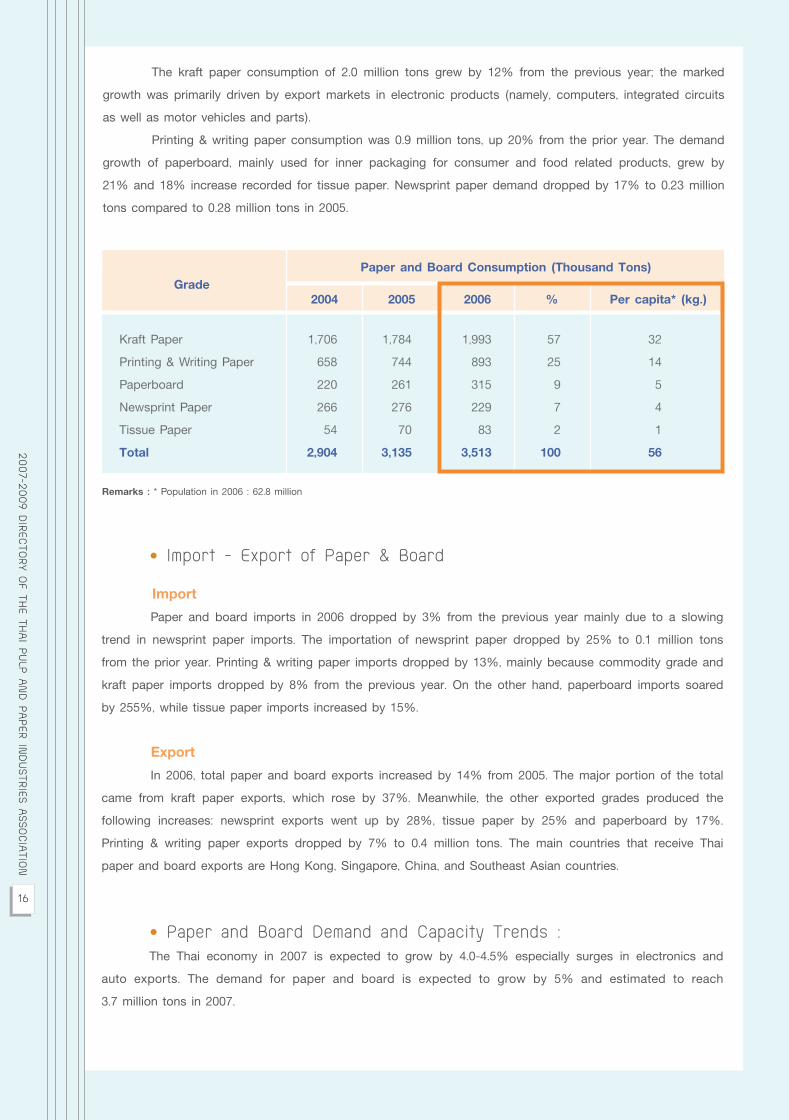
• Consumption In 2006, total paper and board consumption was 3.5 million tons, an increase of 12% from 2005.
In large part the increase resulted from the higher consumption of paperboard, printing & writing paper and
tissue paper. Paper and board consumption per capita was 56 kg., compared to 50 kg. in 2005. Growth is
projected to continue and per capita consumption has been estimated to reach 77 kg. in 2011.
Unit : kg. 2003 2004 2005 2006
Per Capita Consumption 42 47 50 56
Utilization Rate GRADE
51-01-100_008-034_V.indd 1551-01-100_008-034_V.indd 15 1/30/08 2:35:24 PM1/30/08 2:35:24 PM
2007-2009 DIRECTORY OF THE THAI PULP AND PAPER INDUSTRIES ASSOCIATION
16
• Import - Export of Paper & Board Import
Paper and board imports in 2006 dropped by 3% from the previous year mainly due to a slowing
trend in newsprint paper imports. The importation of newsprint paper dropped by 25% to 0.1 million tons
from the prior year. Printing & writing paper imports dropped by 13%, mainly because commodity grade and
kraft paper imports dropped by 8% from the previous year. On the other hand, paperboard imports soared
by 255%, while tissue paper imports increased by 15%.
Export
In 2006, total paper and board exports increased by 14% from 2005. The major portion of the total
came from kraft paper exports, which rose by 37%. Meanwhile, the other exported grades produced the
following increases: newsprint exports went up by 28%, tissue paper by 25% and paperboard by 17%.
Printing & writing paper exports dropped by 7% to 0.4 million tons. The main countries that receive Thai
paper and board exports are Hong Kong, Singapore, China, and Southeast Asian countries.
• Paper and Board Demand and Capacity Trends : The Thai economy in 2007 is expected to grow by 4.0-4.5% especially surges in electronics and
auto exports. The demand for paper and board is expected to grow by 5% and estimated to reach
3.7 million tons in 2007.
The kraft paper consumption of 2.0 million tons grew by 12% from the previous year; the marked
growth was primarily driven by export markets in electronic products (namely, computers, integrated circuits
as well as motor vehicles and parts).
Printing & writing paper consumption was 0.9 million tons, up 20% from the prior year. The demand
growth of paperboard, mainly used for inner packaging for consumer and food related products, grew by
21% and 18% increase recorded for tissue paper. Newsprint paper demand dropped by 17% to 0.23 million
tons compared to 0.28 million tons in 2005.
Remarks : * Population in 2006 : 62.8 million
Kraft Paper 1,706 1,784 1,993 57 32
Printing & Writing Paper 658 744 893 25 14
Paperboard 220 261 315 9 5
Newsprint Paper 266 276 229 7 4
Tissue Paper 54 70 83 2 1
Total 2,904 3,135 3,513 100 56
Paper and Board Consumption (Thousand Tons)
Grade
2004 2005 2006 % Per capita* (kg.)
51-01-100_008-034_V.indd 1651-01-100_008-034_V.indd 16 1/30/08 2:35:24 PM1/30/08 2:35:24 PM
17
2007-2009 DIRECTORY OF THE THAI PULP AND PAPER INDUSTRIES ASSOCIATION
Kraft Paper Consumption 1,706 1,784 1,993 2,092 2,244 2,407 2,582 2,770
Capacity 2,400 2,673 3,283 3,411 3,411 3,411 3,411 3,411
Surplus (Shortage) 694 889 1,290 1,319 1,167 1,004 829 641
Printing & Consumption 657 744 893 964 1,041 1,124 1,213 1,310
Writing Paper Capacity 1,083 1,264 1,271 1,271 1,431 1,431 1,431 1,431
Surplus (Shortage) 425 520 378 307 390 307 218 121
Paperboard Consumption 220 261 315 324 333 342 352 362
Capacity 300 300 348 448 448 448 448 448
Surplus (Shortage) 80 39 33 124 115 106 96 86
Newsprint Paper Consumption 266 276 229 240 252 264 277 290
Capacity 135 135 135 135 135 135 135 135
Surplus (Shortage) (131) (141) (94) (105) (117) (129) (142) (155)
Tissue Paper Consumption 54 70 83 84 85 86 87 88
Capacity 91 129 136 136 136 136 136 136
Surplus (Shortage) 37 59 53 52 51 50 49 48
Total Paper Consumption 2,904 3,134 3,513 3,704 3,955 4,223 4,511 4,820
and Board Capacity 4,009 4,501 5,173 5,401 5,561 5,561 5,561 5,561
Surplus (Shortage) 1,105 1,367 1,660 1,697 1,606 1,338 1,050 741
Population (Million) 61.9 62.4 62.8 62.8 62.8 62.8 62.8 62.8
Per Capita (kg./head) 47 50 56 59 63 67 72 77
Consumption
Estimated
Unit : Thousand Tons
2004 2005 2006 2007 2008 2009 2010 2011
Grade
Source : The Thai Pulp and Paper Industries Association (TPPIA)
51-01-100_008-034_V.indd 1751-01-100_008-034_V.indd 17 1/30/08 2:35:24 PM1/30/08 2:35:24 PM

2007-2009 DIRECTORY OF THE THAI PULP AND PAPER INDUSTRIES ASSOCIATION
18
Total Paper and Board Industry
Capacity
Consumption
1995 1996 1997 1998 1999 2000 2001 2002 2003 2004 2005 2006 2007e 2008e 2009e 2010e 2011e
0
1,000
3,000
2,000
4,000
5,000
6,000
Thousand Tons
Year Consumption Import Export Production Capacity
1995 2,131 519 240 1,930 2,325
1996 2,230 469 204 1,994 2,700
1997 2,077 379 513 2,274 3,177
1998 1,651 209 908 2,340 3,336
1999 1,919 346 960 2,581 3,472
2000 2,139 420 772 2,605 3,633
2001 2,261 393 767 2,692 3,684
2002 2,471 462 683 2,814 3,695
2003 2,651 514 748 3,261 3,951
2004 2,904 557 796 3,607 4,009
2005 3,134 657 942 3,795 4,501
2006 3,513 639 1,071 4,325 5,173
2007 (Est.) 3,704 5,401
2008 (Est.) 3,955 5,561
2009 (Est.) 4,223 5,561
2010 (Est.) 4,511 5,561
2011 (Est.) 4,820 5,561
Source : The Thai Pulp and Paper Industries Association (TPPIA)
51-01-100_008-034_V.indd 1851-01-100_008-034_V.indd 18 1/30/08 2:35:33 PM1/30/08 2:35:33 PM