Embed Size (px)
Citation preview

© 2017 SCSglobalServices.com
Declaration Owner
Sloan Valve Company
10500 Seymour Avenue, Franklin Park, IL 60131
P: 847.671.4300 / 800.982.5839 · www.sloan.com
Product
Sloan Sensor Diaphragm Flushometers
Functional Unit
Sensor operated diaphragm flushometers are intended for use with
toilet or urinal fixtures as the dispensing unit for the water supplied.
These fixtures are primarily installed in the commercial environment
including commercial buildings, airports, stadiums, healthcare,
hospitality sectors, etc. The functional unit is defined as “10 years of
use of a flush valve (or flushometer) for toilets and urinals in an
average US commercial environment”. The lifespan of 10 years is an
industry accepted average lifetime that is based on the economic
lifespan of a product. However, the flushometer lifespan may well
greatly exceed 10 years with proper maintenance.
The scope of this EPD is Cradle-to-Grave.
EPD Number and Period of Validity
SCS-EPD-04676
EPD Valid October 2, 2017 through October 1, 2022
Product Category Rule
Part A: LCA Calculation Rules and Report Requirements v2017;
Sustainable Minds (January 2017).
Part B: Product Group Definition | Commercial Flushometer Valves
Product Group v3.0; Sustainable Minds (December 13, 2016).
Program Operator
SCS Global Services
2000 Powell Street, Ste. 600, Emeryville, CA 94608
+1.510.452.8000 | www.SCSglobalServices.com
Environmental Product Declaration Sloan® Sensor Flushometers
Environmental Product Declaration Sloan® Sensor Flushometers
………………………………………………………………………………………………..……………………………………………………………………………………………………………………………
1
© 2017 SCSglobalServices.com
Table of Contents
Product and Company Information….………………………………………………………………………………………………………………………...cover
Product ...................................................................................................................................................................................................... 2
Product Description ................................................................................................................................................................................ 2
Material Resources ................................................................................................................................................................................. 3
Additional Environmental Information ............................................................................................................................................... 4
Life Cycle Assessment Overview .......................................................................................................................................................... 4
Process Flow Diagram ............................................................................................................................................................................ 8
Life Cycle Impact Assessment .............................................................................................................................................................. 9
Additional Environmental Parameters .............................................................................................................................................10
Supporting Technical Information .....................................................................................................................................................13
References ..............................................................................................................................................................................................15
Disclaimers: This Environmental Product Declaration (EPD) conforms to ISO 14025, 14040, ISO 14044, and ISO 21930.
Scope of Results Reported: The PCR requirements limit the scope of the LCA metrics such that the results exclude environmental and social
performance benchmarks and thresholds, and exclude impacts from the depletion of natural resources, land use ecological impacts, ocean
impacts related to greenhouse gas emissions, risks from hazardous wastes and impacts linked to hazardous chemical emissions.
Accuracy of Results: Due to PCR constraints, this EPD provides estimations of potential impacts that are inherently limited in terms of accuracy.
Comparability: The PCR this EPD was based on was not written to support comparative assertions. EPDs based on different PCRs, or different
calculation models, may not be comparable. When attempting to compare EPDs or life cycle impacts of products from different companies, the
user should be aware of the uncertainty in the final results, due to and not limited to, the practitioner’s assumptions, the source of the data used
in the study, and the specifics of the product modeled.
PCR review, was conducted by Part B PCR review conducted by the SM TAB,
Approved Date: October 2, 2017 – End Date: October 1, 2022
Independent verification of the declaration and data, according to
ISO 14025:2006 and ISO 21930:2007 ☐ internal external
Third party verifier
Tom Gloria, PhD, Industrial Ecology Consultants

Environmental Product Declaration Sloan® Sensor Flushometers
………………………………………………………………………………………………..……………………………………………………………………………………………………………………………
2
© 2017 SCSglobalServices.com
PRODUCT
The following sensor flushometers are represented by this EPD:
SLOAN Sensor Flushometers
Water Closets Urinals
Model # Flush Volume Model # Flush Volume
ECOS 8111-1.6/1.1* (1.28 gpf / 4.8 Lpf) ECOS 8186-0.125 (0.125 gpf/ 0.5 Lpf)
ECOS 8111-1.1 (1.11 gpf / 4.2 Lpf) ECOS 8186-0.125 L (0.125 gpf/ 0.5 Lpf)
ECOS 8111-1.28 (1.28 gpf / 4.8 Lpf) ECOS 8186-0.25 (0.25 gpf/ 1.0 Lpf)
G2 OPTIMA PLUS 8111-1.28 (1.28 gpf / 4.8 Lpf) ECOS 8186-0.5 (0.5 gpf/ 1.9 Lpf)
G2 OPTIMA PLUS 8113-1.28 (1.28 gpf / 4.8 Lpf) ECOS 8186-0.5 L (0.5 gpf/ 1.9 Lpf)
G2 OPTIMA PLUS 8115-1.28 (1.28 gpf / 4.8 Lpf) G2 OPTIMA PLUS 8186-0.5 (0.5 gpf/ 1.9 Lpf)
G2 OPTIMA PLUS 8116-1.28 (1.28 gpf / 4.8 Lpf) G2 OPTIMA PLUS 8186-0.5 E (0.5 gpf/ 1.9 Lpf)
SOLIS 8111-1.1 (1.11 gpf / 4.2 Lpf) SLOAN 8186-0.125 (0.125 gpf/ 0.5 Lpf)
SLOAN 8111-1.28 (1.28 gpf / 4.8 Lpf) SLOAN 8186-0.5 (0.5 gpf/ 1.9 Lpf)
SOLIS 8111-1.28 SINGLE FLUSH (1.28 gpf / 4.8 Lpf) SLOAN 8186-0.5 DFB (0.5 gpf/ 1.9 Lpf)
SOLIS 8111-1.6/1.1 DUAL FLUSH* (1.28 gpf / 4.8 Lpf) SOLIS 8186-0.125 SINGLE FLUSH (0.125 gpf/ 0.5 Lpf)
SOLIS 8113-1.6 /1.1 DUAL FLUSH* (1.28 gpf / 4.8 Lpf) SOLIS 8186-0.25 SINGLE FLUSH (0.25 gpf/ 1.0 Lpf)
SOLIS 8115-1.6 /1.1 DUAL FLUSH* (1.28 gpf / 4.8 Lpf) SOLIS 8186-0.5 SINGLE FLUSH (0.5 gpf/ 1.9 Lpf)
*Dual flush flushometer, with 1.6 gpf/ 6.1 Lpf (regular flush) and 1.1 gpf/ 4.2 Lpf (reduced flush) options.
PRODUCT DESCRIPTION
Sensor flushometers are precision metering valves designed to deliver a preset volume of water to a sanitary fixture (i.e.,
toilets and urinals). These are automatic flushometers with the following features:
ECOS
▪ Automatically activates by means of an infrared sensor with multi-focused lobular sensing fields
▪ Automatically initiates a 1.1 gpf or 1.6 gpf flush based on how long use remains in sensor range
▪ Buttons on top of the flush valve enable manual flushing with a standard or reduced flush at restroom visitor’s
discretion
▪ Fixed metering bypass and no external volume adjustment to ensure water conservation
G2
▪ Automatically operates by means of an infrared sensor with multiple-focused lobular sensing fields for high and low
target detection
▪ User friendly, three-second flush delay and Courtesy Flush® override button
▪ Adjustable tailpiece
▪ Available in low consumption (1.6 gpf/6.0 Lpf), water saver (3.5 gpf/13.2 Lpf), and high efficiency (1.28 gpf/4.8 Lpf)
models
Environmental Product Declaration Sloan® Sensor Flushometers
………………………………………………………………………………………………..……………………………………………………………………………………………………………………………
3
© 2017 SCSglobalServices.com
SOLIS
▪ Automatically operates by means of an infrared sensor with multiple-focused lobular sensing fields for high and low
target detection
▪ User friendly, three-second flush delay and Courtesy Flush® override button
▪ Adjustable tailpiece
▪ Available in low consumption (1.6 gpf/6.0 Lpf), water saver (3.5 gpf/13.2 Lpf), and high efficiency (1.28 gpf/4.8 Lpf)
models
SLOAN
▪ Flush volumes start as low as 1.6 gpf/6.0 Lpf
▪ Water conservation is aided by the ADA-compliant, non-hold-open handle, which prevents toilet from exceeding
intended flush volume
▪ Flush accuracy is controlled by CID™ technology, also enhancing water efficiency
▪ Integrity of the product is maintained with the vandal-resistant stop cap
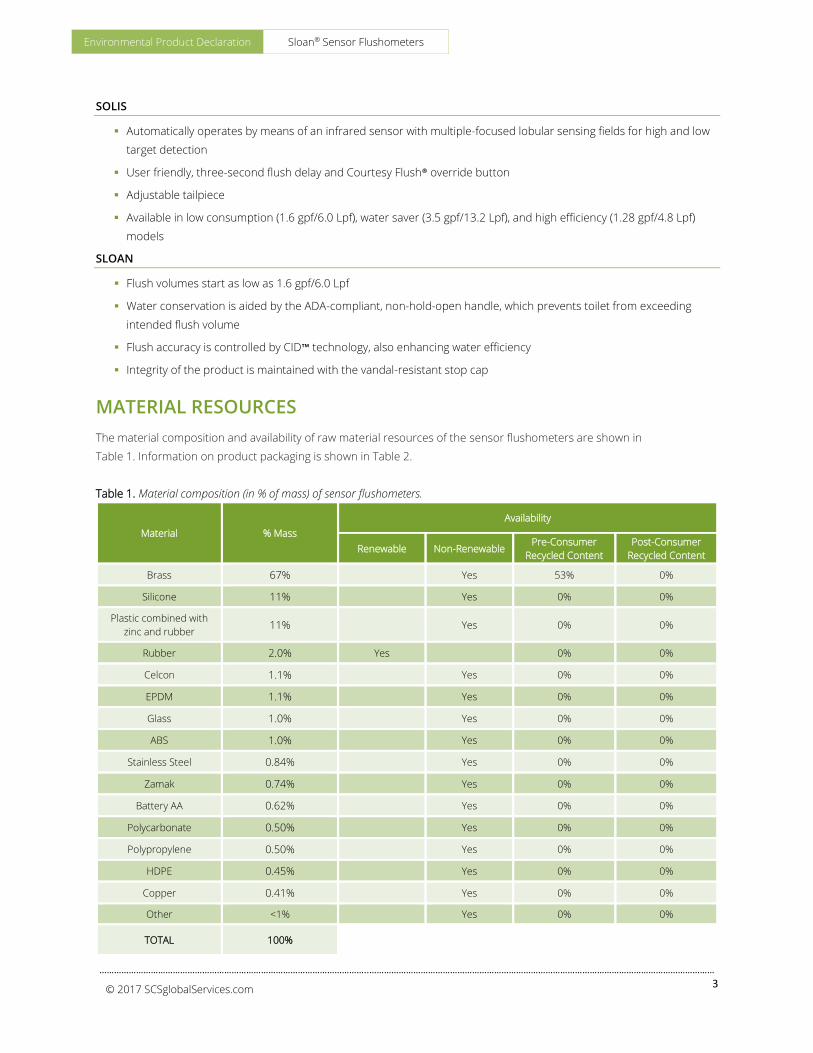
MATERIAL RESOURCES
The material composition and availability of raw material resources of the sensor flushometers are shown in
Table 1. Information on product packaging is shown in Table 2.
Table 1. Material composition (in % of mass) of sensor flushometers.
Material % Mass
Availability
Renewable Non-Renewable Pre-Consumer
Recycled Content
Post-Consumer
Recycled Content
Brass 67% Yes 53% 0%
Silicone 11% Yes 0% 0%
Plastic combined with
zinc and rubber 11% Yes 0% 0%
Rubber 2.0% Yes 0% 0%
Celcon 1.1% Yes 0% 0%
EPDM 1.1% Yes 0% 0%
Glass 1.0% Yes 0% 0%
ABS 1.0% Yes 0% 0%
Stainless Steel 0.84% Yes 0% 0%
Zamak 0.74% Yes 0% 0%
Battery AA 0.62% Yes 0% 0%
Polycarbonate 0.50% Yes 0% 0%
Polypropylene 0.50% Yes 0% 0%
HDPE 0.45% Yes 0% 0%
Copper 0.41% Yes 0% 0%
Other <1% Yes 0% 0%
TOTAL 100%

Environmental Product Declaration Sloan® Sensor Flushometers
………………………………………………………………………………………………..……………………………………………………………………………………………………………………………
4
© 2017 SCSglobalServices.com
Table 2. Material composition (in % of mass) of packaging for sensor flushometers.
Material % Mass
Availability
Renewable Non-Renewable Pre-Consumer
Recycled Content
Post-Consumer
Recycled Content
Cardboard 90% Yes 0% 30%
Paper pulp 8.2% Yes 0% 0%
HDPE 0.54% Yes 0% 0%
Paper with printing ink 0.52% Yes Yes 0% 0%
Post-consumer paper
with soy ink 0.26% Yes 0% 0%
TOTAL 100%
ADDITIONAL ENVIRONMENTAL INFORMATION
The sensor flushometer line continues the legacy of Sloan’s Royal flushometers. Our SOLIS, ECOS and Sloan sensor
flushometers all start in Boston at our West Newton facility. The sensor is assembled and tested by a skilled workforce and
shipped to Chicago were it is mated with the valve portion of the product. All Sloan flushometers are built in the USA by
our workforce with an average employment of over 19 years.
All of our flushometers are made from highly recycled materials, and have become the benchmark for quality, performance
and sustainability in the commercial plumbing industry. The brass casting alloy is created from 99% recycled sources such
as an old car part, boat propeller or old plumbing materials. Sloan utilizes reclaimed brass as a way to preserve the
environment by reducing or eliminating the need to mine virgin material from the earth. A large portion of the flushometer
is also recyclable. This means that after the effective life of the product, often the life of the building itself, Sloan
flushometers can be recycled and turned into new products.
All the sensor flushometers within this EPD are also Watersense labeled. Developed in 2006 the EPA WaterSense program
was created to certify water using products that are more than 20% more efficient than the baseline without sacrificing
performance.
Sloan is a proud member of the United States Green Building Council (USGBC) and through the use of the Leadership in
Energy and Environmental Design (LEED) Green Building Rating System, Sloan recognizes and validates the importance of
best-in-class building strategies and practices of high performing green buildings. Sloan’s flushometers within this EPD can
be used to help achieve water efficiency goals as well as gaining USGBC LEED v4 Materials and Resources points and/or
complying with CAL Green and other building codes.
LIFE CYCLE ASSESSMENT OVERVIEW
The system boundary is cradle-to-grave and includes resource extraction and processing, product manufacture and
assembly, distribution/transport, use and maintenance, and end-of-life. The diagram below illustrates the life cycle stages
included in this EPD.
Environmental Product Declaration Sloan® Sensor Flushometers
………………………………………………………………………………………………..……………………………………………………………………………………………………………………………
5
© 2017 SCSglobalServices.com
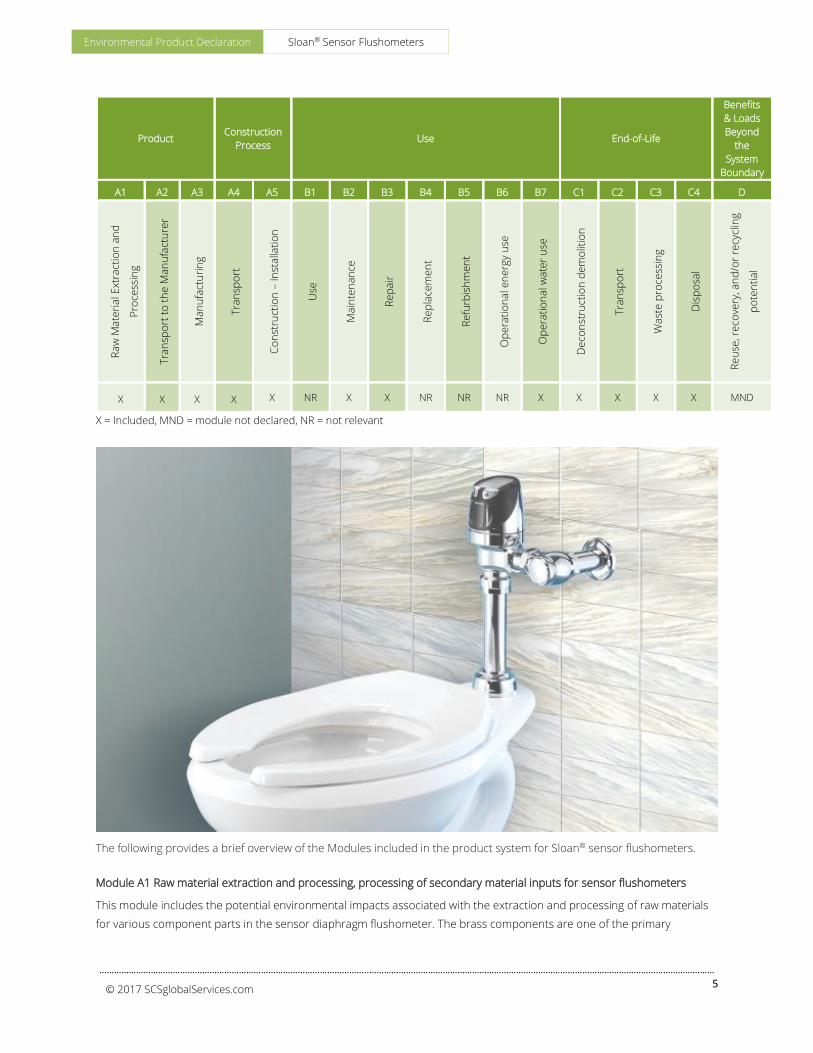
Product Construction
Process Use End-of-Life
Benefits
& Loads
Beyond
the
System
Boundary
A1 A2 A3 A4 A5 B1 B2 B3 B4 B5 B6 B7 C1 C2 C3 C4 D
Ra
w M
ate
ria
l Ext
ract
ion
an
d
Pro
cess
ing
Tra
nsp
ort
to
th
e M
an
ufa
ctu
rer
Ma
nu
fact
uri
ng
Tra
nsp
ort
Co
nst
ruct
ion
– In
sta
llati
on
Use
Ma
inte
na
nce
Re
pa
ir
Re
pla
cem
en
t
Re
furb
ish
me
nt
Op
era
tio
na
l en
erg
y u
se
Op
era
tio
na
l wa
ter
use
De
con
stru
ctio
n d
em
olit
ion
Tra
nsp
ort
Wa
ste
pro
cess
ing
Dis
po
sal
Re
use
, re
cove
ry, a
nd
/or
recy
clin
g
po
ten
tia
l
X X X X X NR X X NR NR NR X X X X X MND
X = Included, MND = module not declared, NR = not relevant
The following provides a brief overview of the Modules included in the product system for Sloan® sensor flushometers.
Module A1 Raw material extraction and processing, processing of secondary material inputs for sensor flushometers
This module includes the potential environmental impacts associated with the extraction and processing of raw materials
for various component parts in the sensor diaphragm flushometer. The brass components are one of the primary
Environmental Product Declaration Sloan® Sensor Flushometers
………………………………………………………………………………………………..……………………………………………………………………………………………………………………………
6
© 2017 SCSglobalServices.com
materials, comprising of at least 67% of the flushometer product composition. The impacts from the following processes
were considered for brass component processing:
Brass Ingot Production from Scrap Metal
A large proportion of raw material for brass components are sourced in the form of brass ingots from a U.S. based
secondary smelter and scrap metal refiner. Scrap metal is sorted into grades depending on the purity and the scrap is
subsequently melted down into molten brass in gas-fired rotary furnace and poured into molds to produce brass ingots.
The brass ingots are then transported to the U.S. based sand casting facility for further processing.
Sand Casting of Brass Components
The brass ingots are sand cast depending on the design specification of the component parts in the flushometers.
Module A2: Transportation
This module includes transportation of the sand cast brass components to the Chicago based Sloan manufacturing facility.
This also includes the transportation of all other components (such as plastics, stainless steel, synthetic rubber, etc.) from
the suppliers to the facility, as well as the components for the sensor module to the facility in West Newton,
Massachusetts.
Module A3: Manufacture of Sensor flushometer
The brass component parts are polished and plated at the Chicago based manufacturing facility. The sensor module is
manufactured at the West Newton based facility and subsequently transported to the Chicago facility. Sensor flushometer
products are then assembled and packaged.
Module A4: Transportation & Delivery to the site
This module includes the impacts associated with transportation of finished sensor flushometers to the U.S. based
distribution center and the subsequent delivery to the installation site.
Module A5: Construction & Installation
The installation of sensor flushometers is performed with hand tools and does not require any ancillary material input. This
module considers the impacts associated with waste processing and disposal of product packaging waste generated
during the installation process.
Module B1: Normal use of the product
This module includes environmental impacts arising through normal anticipated use of the product. This module is not
applicable because the anticipated use of the flushometer is accounted for in Module B7: Operational water use.
Module B2: Maintenance
This module considers the impacts associated with cleaning and maintenance of the product over a 10-year period. Typical
cleaning involves wiping the flushometer with a damp cloth. For a more thorough cleaning, the manufacturer recommends
using a mild soap diluted in water. For the EPD, cleaning of the flushometer is assumed to occur each week for a period of
10 years. Additionally, waste processing and disposal related to these maintenance activities are included in this module.
Module B3: Repair
This module includes any anticipated repair events during the reference service of the flushometers. Some parts of the
sensor flushometer require replacement up to two times over a 10 year period. This module considers the impacts
associated with the production and transportation of components required for product maintenance.

Environmental Product Declaration Sloan® Sensor Flushometers
………………………………………………………………………………………………..……………………………………………………………………………………………………………………………
7
© 2017 SCSglobalServices.com
Module B4-B5: Replacement and refurbishment
These modules include anticipated replacement or refurbishment events during the reference service life associated with
replacing a whole product (Module B4) and restoration of parts to a condition in which the products can perform its
required function (Module B5). These modules are not applicable to sensor flushometers as these products are not
expected to be replaced as a whole product over a 10 year period. The replacement of certain worn out parts are
considered as repair in Module B3.
Module B6: Operational Energy Use
This module is not applicable because the sensor flushometer is battery operated and/or equipped with a solar panel to
capture and store power. There is no primary energy consumption associated with these products.
Module B7: Operational Water Use
This module includes water use during the operation of the product, together with its associated environmental aspects
and impacts considering the life cycle of water which includes production, delivery, and wastewater treatment. Impacts
were calculated depending on the water use (gallons per flush) specifications of sensor flushometers.
Module C1-C4: End-of-Life The end-of-life stage of the product starts when it is replaced, dismantled or deconstructed
from the building. Impacts for deconstruction and dismantling processes were not modeled in the LCA as it is a manual
process with hand tools, and does not require any energy input for removal of the product. The impacts associated with
transportation of waste materials to processing facilities, waste processing of material components and waste disposal of
the product are included in these modules.

Environmental Product Declaration Sloan® Sensor Flushometers
………………………………………………………………………………………………..……………………………………………………………………………………………………………………………
8
© 2017 SCSglobalServices.com
PROCESS FLOW DIAGRAM
The diagram below is a representation of the most significant contributions to the production for sensor flushometers. The
following life cycle stages are included: production (Modules A1-A3); construction & installation (Module A4-A5); product use
(Modules B1-B7); and end-of-life (Modules C1-C4).
Environmental Product Declaration Sloan® Sensor Flushometers
………………………………………………………………………………………………..……………………………………………………………………………………………………………………………
9
© 2017 SCSglobalServices.com
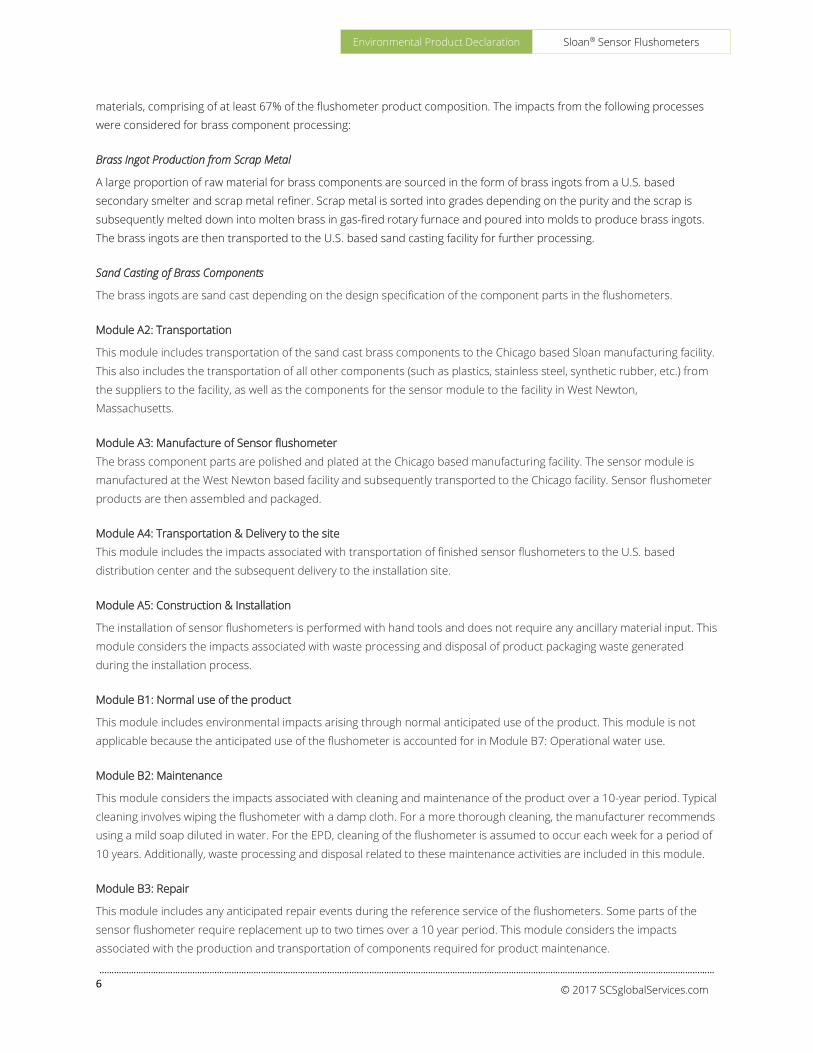
LIFE CYCLE IMPACT ASSESSMENT
Life cycle impact assessment is the process of converting the life cycle inventory results into a representation of potential
environmental and human health impacts. For example, emissions of carbon dioxide, methane, and nitrous oxide
(inventory data) together contribute to climate change (impact assessment). The impact assessment for the EPD is
conducted in accordance with the requirements of the Product Category Rule (PCR). Impact category indicators were
estimated using TRACI v2.1 characterization method, including Global Warming Potential (100 year time horizon),
Acidification Potential, Eutrophication Potential, Smog formation, Ozone Depletion Potential, and Fossil Fuel Depletion
Potential.
Table 3. Results for 10 years of use of a sensor flushometer.
Impact
Category
Production Construction &
Installation Use End-of-Life
Ra
w M
ate
ria
l Ext
ract
ion
/
Pro
cess
ing
Tra
nsp
ort
to
th
e
Ma
nu
fact
ure
r
Ma
nu
fact
uri
ng
Tra
nsp
ort
ati
on
Inst
alla
tio
n
Ma
inte
na
nce
Re
pa
ir
Op
era
tio
na
l Wa
ter
Use
De
mo
litio
n
Tra
nsp
ort
ati
on
Wa
ste
Pro
cess
ing
Dis
po
sal
A1 A2 A3 A4 A5 B2 B3 B7 C1 C2 C3 C4
Ecological Indicators
Acidification
(kg SO2 eq) 0.84 5.7x10⁻³ 3.6x10⁻² 1.5x10⁻² 5.5x10⁻⁴ 2.3x10⁻³ 9.3x10⁻²
Se
e T
ab
le 4
0.0 8.8x10⁻⁴ 2.0x10⁻³ 5.4x10⁻⁴
Eutrophication
(kg N eq) 1.4 9.0x10⁻⁴ 2.3x10⁻² 3.7x10⁻³ 2.5x10⁻³ 4.5x10⁻³ 5.4x10⁻² 0.0 1.2x10⁻⁴ 1.6x10⁻³ 2.0x10⁻²
Global Warming
(kg CO2 eq) 36 0.72 7.5 3.3 0.47 0.82 17 0.0 0.15 0.51 1.6
Ozone Depletion
(kg CFC-11 eq) 3.0x10⁻⁶ 1.3x10⁻⁷ 3.6x10⁻⁷ 6.1x10⁻⁷ 1.5x10⁻⁸ 2.6x10⁻⁸ 1.4x10⁻⁶ 0.0 2.8x10⁻⁸ 2.4x10⁻⁸ 9.2x10⁻⁹
Human Health Indicators
Smog
(kg O3 eq) 3.8 0.11 0.33 0.36 1.3x10⁻² 2.6x10⁻² 0.94
Se
e T
ab
le 4
0.0 2.4x10⁻² 2.3x10⁻² 8.8x10⁻³
Resource Depletion
Fossil Fuel
Depletion
(MJ surplus)
56 1.5 6.7 7.2 0.17 0.22 35
Se
e T
ab
le 4
0.0 0.33 0.35 0.11
The operational use phase (Module B7) considers the volume of water required per flush, the embedded energy required for
water supply and flushometer operation, distribution and wastewater treatment, and the number of flushes over a 10-year period.
The volume required per flush (expressed in terms of gallons per flush) varies depending on the design specification of the sensor
flushometers for toilet and urinal fixtures.

Environmental Product Declaration Sloan® Sensor Flushometers
………………………………………………………………………………………………..……………………………………………………………………………………………………………………………
10
© 2017 SCSglobalServices.com
Table 4. Results for Module B7: Operational Water Use scenarios for toilet fixtures (51 flushes per day over 10 year period) and
urinal fixtures (18 flushes per day over 10 year period).
Impact Category
USE SCENARIO FOR B7: Operational Water Use
TOILET FIXTURES
(51 flushes per day over 10 years)
URINAL FIXTURES
(18 flushes per day over 10 years)
1.1 gpf 1.28 gpf 0.125 gpf 0.25 gpf 0.5 gpf
Ecological Indicators
Acidification
(kg SO2 eq) 1.3 1.5 5.1x10⁻² 0.10 0.23
Eutrophication
(kg N eq) 2.8 3.2 0.11 0.22 0.50
Global Warming
(kg CO2 eq) 340 400 14 28 62
Ozone Depletion
(kg CFC-11 eq) 2.9x10⁻⁵ 3.3x10⁻⁵ 1.1x10⁻⁶ 2.3x10⁻⁶ 5.1x10⁻⁶
Human Health Indicators
Smog
(kg O3 eq) 8.8 10 0.35 0.70 1.6
Resource Depletion
Fossil Fuel Depletion
(MJ surplus) 260 300 10 21 47
ADDITIONAL ENVIRONMENTAL PARAMETERS
ISO 21930 requires that several parameters be reported in the EPD, including resource use, waste categories and
output flows, and other environmental information. The results for these parameters are shown in Table 5 and
Table 6.

Environmental Product Declaration Sloan® Sensor Flushometers
………………………………………………………………………………………………..……………………………………………………………………………………………………………………………
11
© 2017 SCSglobalServices.com
Table 5. Results for 10 years of use of a sensor flushometer by module. Results representing energy flows are calculated using
lower heating (i.e., net calorific) values.
Impact
Category
Production Construction &
Installation Use End-of-Life
Ra
w M
ate
ria
l
Ext
ract
ion
/
Pro
cess
ing
Tra
nsp
ort
to
th
e
Ma
nu
fact
ure
r
Ma
nu
fact
uri
ng
Tra
nsp
ort
ati
on
Inst
alla
tio
n
Ma
inte
na
nce
Re
pa
ir
Op
era
tio
na
l
Wa
ter
Use
De
mo
litio
n
Tra
nsp
ort
ati
on
Wa
ste
Pro
cess
ing
Dis
po
sal
A1 A2 A3 A4 A5 B2 B3 B7 C1 C2 C3 C4
Non-
hazardous
waste
disposed
(kg)
12 0.41 0.75 2.4 0.33 6.4x10⁻² 5.8
Se
e T
ab
le 6
0.0 9.4x10⁻³ 0.12 2.7
Hazardous
waste
disposed
(kg)
3.4x10⁻³ 6.4x10⁻⁶ 1.3x10⁻⁴ 3.0x10⁻⁵ 5.4x10⁻⁷ 4.3x10⁻⁶ 3.1x10⁻⁴ 0.0 7.5x10⁻⁷ 1.1x10⁻² 2.7x10⁻⁶
Radioactive
waste disposed
(kg)
2.8x10⁻⁴ 1.2x10⁻⁵ 4.6x10⁻⁵ 5.7x10⁻⁵ 1.4x10⁻⁶ 1.3x10⁻⁶ 1.4x10⁻⁴ 0.0 2.6x10⁻⁶ 1.9x10⁻⁶ 8.5x10⁻⁷
Primary Energy
Demand, Non-
Renewable
(MJ)
570 12 100 53 1.3 3.8 320 0.0 2.3 3.7 1.0
Primary Energy
Demand,
Renewable
(MJ)
40 0.16 21 0.64 1.3x10⁻² 6.2 7.6 0.0 9.9x10⁻³ 0.37 5.2x10⁻²
Water Use
(m3) 1.6 9.2x10⁻³ 0.23 3.7x10⁻² 1.0x10⁻³ 7.8x10⁻² 0.48 0.0 7.9x10⁻⁴ 1.3x10⁻² 3.2x10⁻³
Table 6. Results for scenarios for Module B7: Operational Water Use scenarios for toilet fixtures (51 flushes per day over 10 year
period) and urinal fixtures (18 flushes per day over 10 year period). Results representing energy flows are calculated using lower
heating (i.e., net calorific) values.
Impact Category
USE SCENARIO FOR B7: Operational Water Use
TOILET FIXTURES
(51 flushes per day over 10 years)
URINAL FIXTURES
(18 flushes per day over 10 years)
1.1 gpf 1.28 gpf 0.125 gpf 0.25 gpf 0.5 gpf
Non-hazardous waste
disposed
(kg)
11 13 0.45 0.91 2.0
Hazardous waste disposed
(kg) 9.7x10⁻³ 1.1x10⁻² 3.9x10⁻⁴ 7.8x10⁻⁴ 1.7x10⁻³
Radioactive
waste disposed
(kg)
3.4x10⁻³ 4.0x10⁻³ 1.4x10⁻⁴ 2.8x10⁻⁴ 6.2x10⁻⁴
Primary Energy Demand, Non-
Renewable
(MJ)
5,600 6,600 230 450 1,000
Primary Energy Demand,
Renewable
(MJ)
300 350 12 24 54
Water Use
(m3) 25 29 1.0 2.0 4.4
Environmental Product Declaration Sloan® Sensor Flushometers
………………………………………………………………………………………………..……………………………………………………………………………………………………………………………
12
© 2017 SCSglobalServices.com
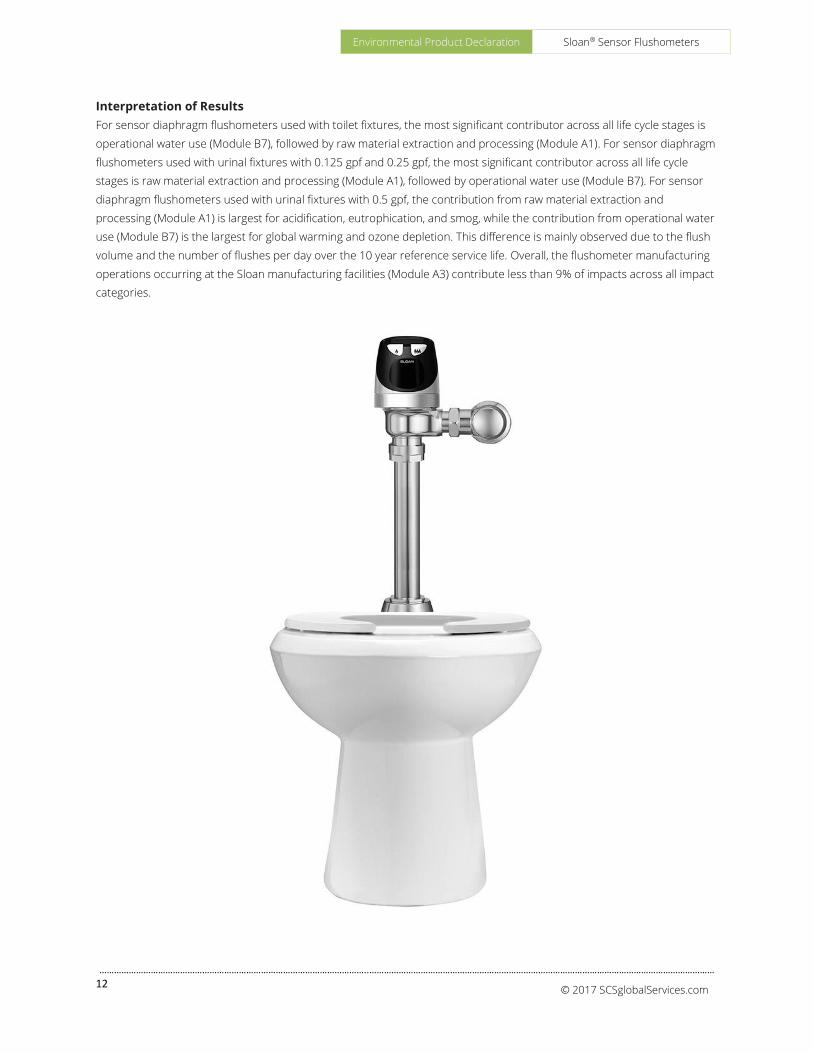
Interpretation of Results
For sensor diaphragm flushometers used with toilet fixtures, the most significant contributor across all life cycle stages is
operational water use (Module B7), followed by raw material extraction and processing (Module A1). For sensor diaphragm
flushometers used with urinal fixtures with 0.125 gpf and 0.25 gpf, the most significant contributor across all life cycle
stages is raw material extraction and processing (Module A1), followed by operational water use (Module B7). For sensor
diaphragm flushometers used with urinal fixtures with 0.5 gpf, the contribution from raw material extraction and
processing (Module A1) is largest for acidification, eutrophication, and smog, while the contribution from operational water
use (Module B7) is the largest for global warming and ozone depletion. This difference is mainly observed due to the flush
volume and the number of flushes per day over the 10 year reference service life. Overall, the flushometer manufacturing
operations occurring at the Sloan manufacturing facilities (Module A3) contribute less than 9% of impacts across all impact
categories.
Environmental Product Declaration Sloan® Sensor Flushometers
………………………………………………………………………………………………..……………………………………………………………………………………………………………………………
13
© 2017 SCSglobalServices.com
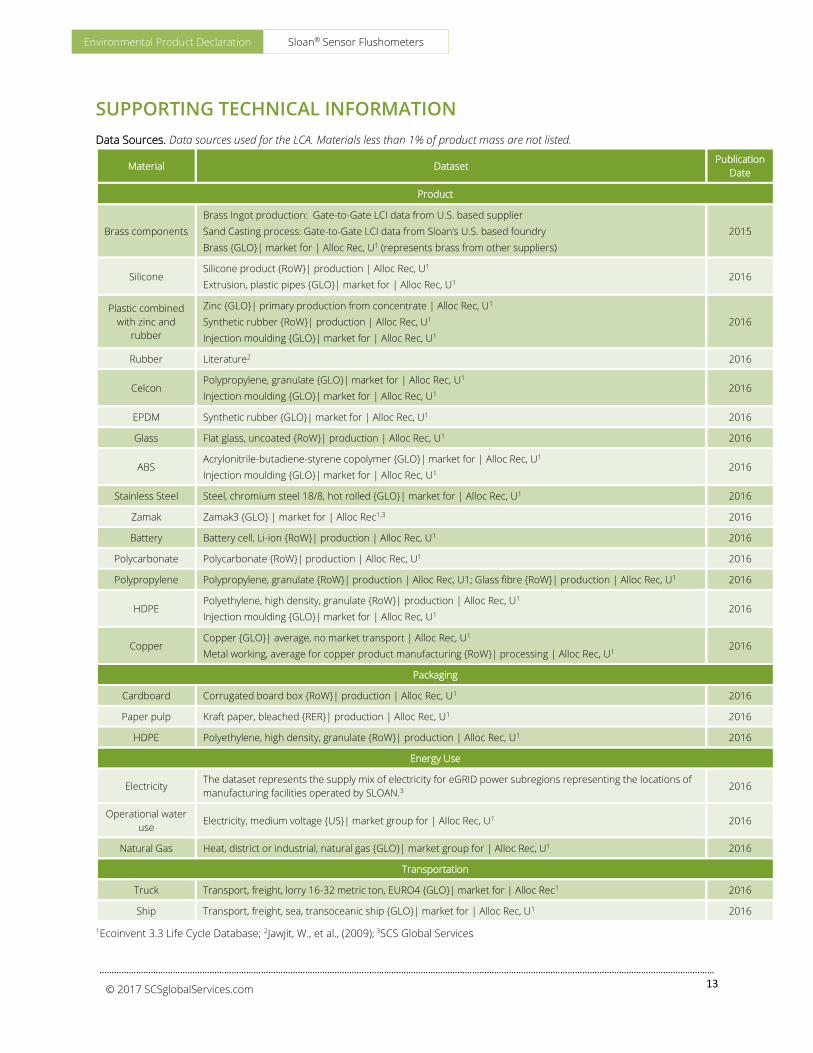
SUPPORTING TECHNICAL INFORMATION
Data Sources. Data sources used for the LCA. Materials less than 1% of product mass are not listed.
Material Dataset Publication
Date
Product
Brass components
Brass Ingot production: Gate-to-Gate LCI data from U.S. based supplier
Sand Casting process: Gate-to-Gate LCI data from Sloan’s U.S. based foundry
Brass {GLO}| market for | Alloc Rec, U1 (represents brass from other suppliers)
2015
Silicone Silicone product {RoW}| production | Alloc Rec, U1
Extrusion, plastic pipes {GLO}| market for | Alloc Rec, U1 2016
Plastic combined
with zinc and
rubber
Zinc {GLO}| primary production from concentrate | Alloc Rec, U1
Synthetic rubber {RoW}| production | Alloc Rec, U1
Injection moulding {GLO}| market for | Alloc Rec, U1
2016
Rubber Literature2 2016
Celcon Polypropylene, granulate {GLO}| market for | Alloc Rec, U1
Injection moulding {GLO}| market for | Alloc Rec, U1 2016
EPDM Synthetic rubber {GLO}| market for | Alloc Rec, U1 2016
Glass Flat glass, uncoated {RoW}| production | Alloc Rec, U1 2016
ABS Acrylonitrile-butadiene-styrene copolymer {GLO}| market for | Alloc Rec, U1
Injection moulding {GLO}| market for | Alloc Rec, U1 2016
Stainless Steel Steel, chromium steel 18/8, hot rolled {GLO}| market for | Alloc Rec, U1 2016
Zamak Zamak3 {GLO} | market for | Alloc Rec1,3 2016
Battery Battery cell, Li-ion {RoW}| production | Alloc Rec, U1 2016
Polycarbonate Polycarbonate {RoW}| production | Alloc Rec, U1 2016
Polypropylene Polypropylene, granulate {RoW}| production | Alloc Rec, U1; Glass fibre {RoW}| production | Alloc Rec, U1 2016
HDPE Polyethylene, high density, granulate {RoW}| production | Alloc Rec, U1
Injection moulding {GLO}| market for | Alloc Rec, U1 2016
Copper Copper {GLO}| average, no market transport | Alloc Rec, U1
Metal working, average for copper product manufacturing {RoW}| processing | Alloc Rec, U1 2016
Packaging
Cardboard Corrugated board box {RoW}| production | Alloc Rec, U1 2016
Paper pulp Kraft paper, bleached {RER}| production | Alloc Rec, U1 2016
HDPE Polyethylene, high density, granulate {RoW}| production | Alloc Rec, U1 2016
Energy Use
Electricity The dataset represents the supply mix of electricity for eGRID power subregions representing the locations of
manufacturing facilities operated by SLOAN.3 2016
Operational water
use Electricity, medium voltage {US}| market group for | Alloc Rec, U1 2016
Natural Gas Heat, district or industrial, natural gas {GLO}| market group for | Alloc Rec, U1 2016
Transportation
Truck Transport, freight, lorry 16-32 metric ton, EURO4 {GLO}| market for | Alloc Rec1 2016
Ship Transport, freight, sea, transoceanic ship {GLO}| market for | Alloc Rec, U1 2016
1Ecoinvent 3.3 Life Cycle Database; 2Jawjit, W., et al., (2009); 3SCS Global Services

Environmental Product Declaration Sloan® Sensor Flushometers
………………………………………………………………………………………………..……………………………………………………………………………………………………………………………
14
© 2017 SCSglobalServices.com
Data Quality
Data Quality Parameter Data Quality Discussion
Time-Related Coverage:
Age of data and the minimum length
of time over which data is collected
Manufacturer provided primary data on product manufacturing for U.S. based Sloan facilities
based on annual production for 2015 and 2016, respectively. Primary data for intermediate
processing of secondary brass components, including brass ingot production, and sand
casting operations, were provided by a supplier and the Sloan foundry respectively, based on
annual production for 2015. Representative datasets (secondary data) used for upstream and
background processes are generally less than 10 years old from original publication, but
almost all have been updated in the last two years.
Geographical Coverage:
Geographical area from which data
for unit processes is collected to
satisfy the goal of the study
The data used in the analysis is considered to be of high quality and provide the best possible
representation available with current data. Primary data for upstream operations of
secondary brass component production were provided by the supplier. Datasets used in the
assessment are representative of the US, Global, and “Rest-of-World” (average for all countries
in the world with uncertainty adjusted). Datasets chosen are considered sufficiently similar to
actual processes and are of good data quality.
Technology Coverage:
Specific technology or technology mix
Data are representative of the actual technologies used for processing, transportation, and
manufacturing operations. Data was collected for all key processes including flushometer
production and assembly, polishing and plating, packaging and secondary brass ingot
production.
Precision:
Measure of the variability of the data
values for each data expressed
Precision of results are not quantified due to a lack of data. Data collected for operations were
typically averaged for one or more years and over multiple operations, which is expected to
reduce the variability of results.
Completeness:
Percentage of flow that is measured
or estimated
The LCA model included all known mass and energy flows for production of sensor diaphragm
flushometers. No known processes or activities contributing to more than 1% of the total
environmental impact for each indicator are excluded.
Representativeness:
Qualitative assessment of the degree
to which the data set reflects the true
population of interest
Overall, data used in the assessment represent actual processes for production of sensor
diaphragm flushometers. Primary data is used to model upstream manufacture of secondary
brass components, which is one of the primary materials in the flushometer. Data is
considered to be representative of the actual technologies used for flushometer production.
Consistency:
Qualitative assessment of whether
the study methodology is applied
uniformly to the various components
of the analysis
The consistency of the assessment is considered to be high. Data sources of similar quality
and age are used, with a bias towards Ecoinvent data.
Reproducibility:
Qualitative assessment of the extent
to which information about the
methodology and data values would
allow an independent practitioner to
reproduce the results reported in the
study
Based on the description of data and assumptions used, this assessment would be
reproducible by other practitioners. All assumptions, models, and data sources are
documented.
Sources of the Data:
Description of all primary and
secondary data sources
Data representing energy use at the manufacturer’s facilities represent an annual average.
Primary data were available for all key processes across the supply chain including
flushometer production and assembly, packaging, transportation and secondary brass
component production for sensor diaphragm flushometers. LCI datasets from Ecoinvent were
used to model all unit processes.
Uncertainty of the Information:
Uncertainty related to data, models,
and assumptions
Uncertainty related to the product materials and packaging is low. Data for upstream
operations relied upon use of actual processes and technologies used for production of
primary raw material components (brass components). These datasets are considered to be
representative as primary data was collected from the Sloan production facilities. Uncertainty
related to the impact assessment methods used in the study is relatively high. The impact
assessment method required by the PCR includes impact potentials, which lack
characterization of providing and receiving environments or tipping points.

Environmental Product Declaration Sloan® Sensor Flushometers
………………………………………………………………………………………………..……………………………………………………………………………………………………………………………
15
© 2017 SCSglobalServices.com
REFERENCES
1. Ecoinvent Centre (2016) Ecoinvent data from v3.3. Swiss Center for Life Cycle Inventories, Dubendorf, 2016,
http://www.ecoinvent.org
2. SM Transparency Report Framework: Part A: LCA Calculation Rules and Background Report Requirements version
2017. Part B: Product Group Definition – Commercial Flush Valves. December 2016.
3. ISO 14025: 2006 Environmental labels and declarations – Type III environmental declarations – Principles and
Procedures.
4. ISO 14040: 2006 Environmental Management – Life cycle assessment – Principles and framework.
5. ISO 14044: 2006 Environmental Management – Life cycle assessment – Requirements and Guidelines.
6. ISO 21930: 2007 Sustainability in building construction – Environmental declaration of building products.
7. Jawjit,W., et al., Greenhouse gas emissions from rubber industry in Thailand, J Clean Prod (2010),
doi:10.1016/j.jclepro.2009.12.003
8. LEEDv4 Reference Guide. Indoor Water Use Reduction credit calculation. U.S. Green Building Council. 2013.
9. Life Cycle Assessment of Sensor Diaphragm Flushometer. Prepared for Sloan Valve Company. SCS Global
Services. September 2017.
10. SCS Type III Environmental Declaration Program: Program Operator Manual v8.0. April 2017. SCS Global Services.
11. SimaPro software (version 8.3): https://www.pre-sustainability.com/simapro
12. Tool for the Reduction and Assessment of Chemical and Other Environmental Impacts (TRACI). Version 2.1. US
Environmental Production Agency.
13. US EPA. Advancing Sustainable Materials Management: 2013 Fact Sheet. Assessing Trends in Material Generation,
Recycling and Disposal in the United States. June 2015.
14. US EPA. WARM Model Transportation Research - Draft. Memorandum from ICF Consulting to United States
Environmental Protection Agency. September 7, 2004.
http://epa.gov/epawaste/conserve/tools/warm/SWMGHGreport.html#background.

© 2017 SCSglobalServices.com
SCS Global Services
2000 Powell Street, Ste. 600, Emeryville, CA 94608 USA
Main +1.50.452.8000 | fax +1.510.452.8001
For more information contact:
Sloan Valve Company
10500 Seymour Avenue, Franklin Park, IL 60131
P: 847.671.4300 | 800.982.5839 | www.sloan.com