Embed Size (px)
Citation preview

Published in: D. Kaplan (Ed.). (2004). Th e Sage handbook of quantitative methodology for the social sciences (pp. 391–408). Th ousand Oaks, CA: Sage.© 2004 Sage Publications.
Th e Null Ritual What You Always Wanted to Know About Signifi cance Testing but Were Afraid to Ask
Gerd Gigerenzer, Stefan Krauss, and Oliver Vitouch1
No scientifi c worker has a fi xed level of signifi cance at which from year to year, and in all circumstances, he rejects hypotheses; he rather gives his mind to each particular case in the light of his evidence and his ideas. (Ronald A. Fisher, 1956, p. 42)
It is tempting, if the only tool you have is a hammer, to treat everything as if it were a nail.(A. H. Maslow, 1966, pp. 15–16)
One of us once had a student who ran an experiment for his thesis. Let us call him Pogo. Pogo had an experimental group and a control group and found that the means of both groups were exactly the same. He believed it would be unscientifi c to simply state this result; he was anxious to do a signifi cance test. Th e result of the test was that the two means did not diff er signifi cantly, which Pogo reported in his thesis.
In 1962, Jacob Cohen reported that the experiments published in a major psychology journal had, on average, only a 50 : 50 chance of detecting a medium-sized eff ect if there was one. Th at is, the statistical power was as low as 50%. Th is result was widely cited, but did it change researchers’ practice? Sedlmeier and Gigerenzer (1989) checked the studies in the same journal, 24 years later, a time period that should allow for change. Yet only 2 out of 64 researchers mentioned power, and it was never estimated. Unnoticed, the average power had decreased (researchers now used alpha adjustment, which shrinks power). Th us, if there had been an eff ect of a medium size, the researchers would have had a better chance of fi nding it by throwing a coin rather than conducting their experiments. When we checked the years 2000 to 2002, with some 220 empirical articles, we fi nally found 9 researchers who computed the power of their tests. Forty years after Cohen, there is a fi rst sign of change.
Editors of major journals such as A. W. Melton (1962) made null hypothesis testing a neces-sary condition for the acceptance of papers and made small p-values the hallmark of excellent experimentation. Th e Skinnerians found themselves forced to start a new journal, the Journal of the Experimental Analysis of Behavior, to publish their kind of experiments (Skinner, 1984, p. 138). Similarly, one reason for launching the Journal of Mathematical Psychology was to escape the edi-tors’ pressure to routinely perform null hypothesis testing. One of its founders, R. D. Luce (1988), called this practice a “wrongheaded view about what constituted scientifi c progress” and “mind-less hypothesis testing in lieu of doing good research: measuring eff ects, constructing substantive theories of some depth, and developing probability models and statistical procedures suited to these theories” (p. 582).
1 Author’s note: We are grateful to David Kaplan and Stanley Mulaik for helpful comments and to Katharina Petrasch for her support with journal analyses.
GG_Null_2004.indd 1 12.04.2007 10:29:09 Uhr

2 The Null Ritual
Th e student, the researchers, and the editors had engaged in a statistical ritual rather than sta-tistical thinking. Pogo believed that one always ought to perform a null hypothesis test, without exception. Th e researchers did not notice how small their statistical power was, nor did they seem to care: Power is not part of the null ritual that dominates experimental psychology. Th e essence of the ritual is the following:(1) Set up a statistical null hypothesis of “no mean difference” or “zero correlation.” Don’t specify
the predictions of your research hypothesis or of any alternative substantive hypotheses.(2) Use 5% as a convention for rejecting the null. If significant, accept your research hypothesis.(3) Always perform this procedure.Th e null ritual has sophisticated aspects we will not cover here, such as alpha adjustment and ANOVA procedures, but these do not change its essence. Typically, it is presented without naming its originators, as statistics per se. Some suggest that it was authorized by the eminent statistician Sir Ronald A. Fisher, owing to the emphasis on null hypothesis testing (not to be confused with the null ritual) in his 1935 book. However, Fisher would have rejected all three ingredients of this procedure. First, null does not refer to a zero mean diff erence or correlation but to the hypothesis to be “nullifi ed,” which could postulate a correlation of .3, for instance. Second, as the epigram illustrates, by 1956, Fisher thought that using a routine 5% level of signifi cance indicated lack of statistical thinking. Th ird, for Fisher, null hypothesis testing was the most primitive type in a hier-archy of statistical analyses and should be used only for problems about which we have very little knowledge or none at all (Gigerenzer et al., 1989, chap. 3). Statistics off ers a toolbox of methods, not just a single hammer. In many (if not most) cases, descriptive statistics and exploratory data analysis are all one needs. As we will see soon, the null ritual originated neither from Fisher nor from any other renowned statistician and does not exist in statistics proper. It was instead fabricated in the minds of statistical textbook writers in psychology and education.
Rituals seem to be indispensable for the self-defi nition of social groups and for transitions in life, and there is nothing wrong about them. However, they should be the subject rather than the procedure of social sciences. Elements of social rituals include (a) the repetition of the same action, (b) a focus on special numbers or colors, (c) fears about serious sanctions for rule violations, and (d) wishful thinking and delusions that virtually eliminate critical thinking (Dulaney & Fiske, 1994). Th e null ritual has each of these four characteristics: a repetitive sequence, a fi xation on the 5% level, fear of sanctions by editors or advisers, and wishful thinking about the outcome (the p-value) combined with a lack of courage to ask questions.
Pogo’s counterpart in this chapter is a curious student who wants to understand the ritual rather than mindlessly perform it. She has the courage to raise questions that seem naive at fi rst glance and that others do not care or dare to ask.
Question 1: What Does a Signifi cant Result Mean?
What a simple question! Who would not know the answer? After all, psychology students spend months sitting through statistics courses, learning about null hypothesis tests (signifi cance tests) and their featured product, the p-value. Just to be sure, consider the following problem (Haller & Krauss, 2002; Oakes, 1986):
Suppose you have a treatment that you suspect may alter performance on a certain task. You compare the means of your control and experimental groups (say, 20 subjects in each sample). Furthermore, suppose you use a simple independent means t-test and your result is signifi cant (t = 2.7, df = 18, p = .01). Please mark each of the statements below as “true” or “false.” False means that the statement does not follow logically from the above premises. Also note that several or none of the statements may be correct.
GG_Null_2004.indd 2 12.04.2007 10:29:11 Uhr

Gerd Gigerenzer, Stefan Krauss, and Oliver Vitouch 3
(1) You have absolutely disproved the null hypothesis (i.e., there is no difference between the population means). ® True False ®(2) You have found the probability of the null hypothesis being true. ® True False ®(3) You have absolutely proved your experimental hypothesis (that there is a difference between the population means). ® True False ®(4) You can deduce the probability of the experimental hypothesis being true. ® True False ®(5) You know, if you decide to reject the null hypothesis, the probability that you are making the wrong decision. ® True False ®(6) You have a reliable experimental finding in the sense that if, hypothetically, the experiment were repeated a great number of times, you would obtain a significant result on 99% of occasions. ® True False ®Which statements are true? If you want to avoid the I-knew-it-all-along feeling, please answer the six questions yourself before continuing to read. When you are done, consider what a p-value actually is: A p-value is the probability of the observed data (or of more extreme data points), given that the null hypothesis H
0 is true, defi ned in symbols as p(D |H
0).Th is defi nition can be rephrased
in a more technical form by introducing the statistical model underlying the analysis (Gigerenzer et al., 1989, chap. 3). Let us now see which of the six answers are correct:
Statements 1 and 3: Statement 1 is easily detected as being false. A signifi cance test can never disprove the null hypothesis. Signifi cance tests provide probabilities, not defi nite proofs. For the same reason, Statement 3, which implies that a signifi cant result could prove the experimental hy-pothesis, is false. Statements 1 and 3 are instances of the illusion of certainty (Gigerenzer, 2002).
Statements 2 and 4: Recall that a p-value is a probability of data, not of a hypothesis. Despite wishful thinking, p(D |H
0) is not the same as p(H
0 |D), and a signifi cance test does not and cannot
provide a probability for a hypothesis. One cannot conclude from a p-value that a hypothesis has a probability of 1 (Statements 1 and 3) or that it has any other probability (Statements 2 and 4). Th erefore, Statements 2 and 4 are false. Th e statistical toolbox, of course, contains tools that al-low estimating probabilities of hypotheses, such as Bayesian statistics (see below). However, null hypothesis testing does not.
Statement 5: Th e “probability that you are making the wrong decision” is again a probability of a hypothesis. Th is is because if one rejects the null hypothesis, the only possibility of making a wrong decision is if the null hypothesis is true. In other words, a closer look at Statement 5 reveals that it is about the probability that you will make the wrong decision, that is, that H
0 is true. Th us,
it makes essentially the same claim as Statement 2 does, and both are incorrectStatement 6: Statement 6 amounts to the replication fallacy. Recall that a p-value is the prob-
ability of the observed data (or of more extreme data points), given that the null hypothesis is true. Statement 6, however, is about the probability of “signifi cant” data per se, not about the probability of data if the null hypothesis were true. Th e error in Statement 6 is that p = 1% is taken to imply that such signifi cant data would reappear in 99% of the repetitions. Statement 6 could be made only if one knew that the null hypothesis was true. In formal terms, p(D |H
0) is confused with 1 – p(D).
Th e replication fallacy is shared by many, including the editors of top journals. For instance, the former editor of the Journal of Experimental Psychology, A. W. Melton (1962), wrote in his edito-rial, “Th e level of signifi cance measures the confi dence that the results of the experiment would be repeatable under the conditions described” (p. 553). A nice fantasy, but false.
To sum up, all six statements are incorrect. Note that all six err in the same direction of wishful thinking: Th ey overestimate what one can conclude from a p-value.
GG_Null_2004.indd 3 12.04.2007 10:29:12 Uhr

4 The Null Ritual
Students’ and Teachers’ Delusions
We posed the question with the six multiple-choice answers to 44 students of psychology, 39 lectur-ers and professors of psychology, and 30 statistics teachers, who included professors of psychology, lecturers, and teaching assistants. All students had successfully passed one or more statistics courses in which signifi cance testing was taught. Furthermore, each of the teachers confi rmed that he or she taught null hypothesis testing. To get a quasi-representative sample, we drew the participants from six German universities (Haller & Krauss, 2002).
How many students and teachers noticed that all of the statements were wrong? As Figure 1 shows, none of the students did. Every student endorsed one or more of the illusions about the meaning of a p-value. One might think that these students lack the right genes for statistical thinking and are stubbornly resistant to education. A glance at the performance of their teachers, however, indicates that wishful thinking might not be entirely their fault. Ninety percent of the professors and lecturers also had illusions, a proportion almost as high as among their students. Most surprisingly, 80% of the statistics teachers shared illusions with their students. Th us, the students’ errors might be a direct consequence of their teachers’ wishful thinking. Note that one does not need to be a brilliant mathematician to answer the question, “What does a signifi cant result mean?” One only needs to understand that a p-value is the probability of the data (or more extreme data), given that the H
0 is true.
If students “inherited” the illusions from their teachers, where did the teachers acquire them? Th e illusions were right there in the fi rst textbooks introducing psychologists to null hypothesis testing more than 60 years ago. Guilford’s Fundamental Statistics in Psychology and Education, fi rst published in 1942, was probably the most widely read textbook in the 1940s and 1950s. Guilford suggested that hypothesis testing would reveal the probability that the null hypothesis is true. “If the result comes out one way, the hypothesis is probably correct, if it comes out another way, the hypothesis is probably wrong.” (p. 156) Guilford’s logic was not consistently misleading but wavered back and forth between correct and incorrect statements, as well as ambiguous ones that can be read like Rorschach inkblots. He used phrases such as “we obtained directly the probabilities that the null hypothesis was plausible” and “the probability of extreme deviations from chance” interchangeably for referring to the same thing: the level of signifi cance. Guilford is no exception. He marked the beginning of a genre of statistical texts that vacillate between the researchers’ desire for probabilities of hypotheses and what signifi cance testing can actually provide. Early authors promoting the illusion that the level of signifi cance would specify the probability of hypothesis include Anastasi (1958, p. 11), Ferguson (1959, p. 133), and Lindquist (1940, p. 14). But the belief has persisted over decades: for instance, in Miller and Buckhout (1973; statistical appendix by Brown, p. 523), Nunally (1975, pp. 194–196), and in the examples collected by Bakan (1966), Pollard and Richardson (1987), Gigerenzer (1993), Nickerson (2000), and Mulaik, Raju, and Harshman (1997).
Which of the illusions were most often endorsed, and which relatively seldom? Table 1 shows that Statements 1 and 3 were most frequently detected as being false. Th ese claim certainty rather than probability. Still, up to a third of the students and an embarrassing 10% to 15% of the group of teachers held this illusion of certainty. Statements 4, 5, and 6 lead the hit list of the most widespread illusions. Th ese errors are about equally prominent in all groups, a collective fantasy that seems to travel by cultural transmission from teacher to student. Th e last column shows that these three illusions were also prevalent among British academic psychologists who answered the same question (Oakes, 1986). Just as in the case of statistical power cited in the introduction, in which little learning was observed after 24 years, knowledge about what a signifi cant result means
GG_Null_2004.indd 4 12.04.2007 10:29:12 Uhr

Gerd Gigerenzer, Stefan Krauss, and Oliver Vitouch 5
does not seem to have improved since Oakes. Yet a persistent blind spot for power and a lack of comprehension of signifi cance are consistent with the null ritual.
Statements 2 and 4, which put forward the same type of error, were given diff erent endorse-ments. When a statement concerns the probability of the experimental hypothesis, it is much more accepted by students and teachers as a valid conclusion than one that concerns the probability of the null hypothesis. Th e same pattern can be seen for British psychologists (see Table 1). Why are re-searchers and students more likely to believe that the level of signifi cance determines the probability of H
1 rather than that of H
0? A possible reason is that the researchers’ focus is on the experimental
hypothesis H1 and that the desire to fi nd the probability of H
1 drives the phenomenon.
Did the students produce more illusions than their teachers? Surprisingly, the diff erence was only slight. On average, students endorsed 2.5 illusions, their professors and lecturers who did not teach statistics approved of 2.0 illusions, and those who taught signifi cance testing endorsed 1.9 illusions.
Could it be that these collective illusions are specifi c to German psychologists and students? No, the evidence points to a global phenomenon. As mentioned above, Oakes (1986) reported that 97% of British academic psychologists produced at least one illusion. Using a similar test question, Falk and Greenbaum (1995) found comparable results for Israeli students, despite having taken measures for debiasing students. Falk and Greenbaum had explicitly added the right alternative (“None of the statements is correct”), whereas we had merely pointed out that more than one or none of the statements might be correct. As a further measure, they had made their students read Bakan’s (1966) classic article, which explicitly warns against wrong conclusions. Nevertheless, only 13% of their participants opted for the right alternative. Falk and Greenbaum concluded that “unless strong measures in teaching statistics are taken, the chances of overcoming this misconcep-tion appear low at present” (p. 93). Warning and reading by itself does not seem to foster much insight. So what to do?
0
40
80
Psychologystudents(n = 44)
Per
cent
100
60
Professors& lecturers
not teachingstatistics(n = 39)
20
Professors& lecturersteachingstatistics(n = 30)
Note. The percentage refer to the participants ineach group who endorsed one or more of the sixfalse statements (based on Haller & Krauss, 2002).
Figure 1. Th e Amount of Delusions About the Meaning of “p = .01”.
GG_Null_2004.indd 5 12.04.2007 10:29:12 Uhr

6 The Null Ritual
Question 2: How Can Students Get Rid of Illusions?
Th e collective illusions about the meaning of a signifi cant result are embarrassing to our profession. Th is state of aff airs is particularly painful because psychologists—unlike natural scientists—heav-ily use signifi cance testing yet do not understand what its product, the p-value, means. Is there a cure?
Yes. Th e cure is to open the statistical toolbox. In statistical textbooks written by psychologists and educational researchers, signifi cance testing is typically presented as if it were an all-purpose tool. In statistics proper, however, an entire toolbox exists, of which null hypothesis testing is only one tool among many. As a therapy, even a small glance into the contents of the toolbox can be suf-fi cient. One quick way to overcome some of the illusions is to introduce students to Bayes’ rule.
Bayes’ rule deals with the probability of hypotheses, and by introducing it alongside null hy-pothesis testing, one can easily see what the strengths and limits of each tool are. Unfortunately, Bayes’ rule is rarely mentioned in statistical textbooks for psychologists. Hays (1963) had a chapter on Bayesian statistics in the second edition of his widely read textbook but dropped it in the sub-sequent editions. As he explained to one of us (GG) he dropped the chapter upon pressure from his publisher to produce a statistical cookbook that did not hint at the existence of alternative tools for statistical inference. Furthermore, he believed that many researchers are not interested in statistical thinking in the fi rst place but solely in getting their papers published (Gigerenzer, 2000).Here is a short comparative look at two tools:(1) Null hypothesis testing computes the probability p(D |H
0). The form of conditional prob-
abilities makes it clear that with null hypothesis testing, (a) only statements concerning the probability of data D can be obtained, and (b) the null hypothesis H
0 functions as the refer-
ence point for the conditional statement. In other words, any correct answer to the question of what a significant result means must include the conditional phrase “… given H
0 is true” or an
equivalent expression.
Table 1Percentages of False Answers (i.e., Statements Marked as True)
in the Th ree Groups of Figure 1
Germany 2000United Kingdom
1986
Statement (abbreviated)Psychologystudents
Professors and lec-turers: not teaching
statistics
Professors and lecturers:
teaching statisticsProfessors and
lecturers
1. H0 is absolutely disproved 34 15 10 1
2. Probability of H0 is found 32 26 17 36
3. H1 is absolutely proved 20 13 10 6
4. Probability of H1 is found 59 33 33 66
5. Probability of wrong decision 68 67 73 866. Probability of replication 41 49 37 60
Note. For comparison, the results of Oakes’ (1986) study with academic psychologists in the United Kingdom are shown in the right column.
GG_Null_2004.indd 6 12.04.2007 10:29:12 Uhr

Gerd Gigerenzer, Stefan Krauss, and Oliver Vitouch 7
(2) Bayes’ rule computes the probability p(H1 |D). In the simple case of two hypotheses, H
1 and
H2, which are mutually exclusive and exhaustive, Bayes’ rule is the following:
p(H1|D) =p(H1)p(D|H1)
p(H1)p(D|H1) + p(H2)p(D|H2).
For instance, consider HIV screening for people who are in no known risk group (Gigerenzer, 2002). In this population, the a priori probability p(H
1) of being infected by HIV is about 1 in
10,000, or .0001. Th e probability p(D |H1) that the test is positive (D) if the person is infected is
.999, and the probability p(D |H2) that the test is positive if the person is not infected is .0001. What
is the probability p(H1|D) that a person with a positive HIV test actually has the virus? Inserting
these values into Bayes’ rule results in p(H1|D) = .5. Unlike null hypothesis testing, Bayes’ rule can
actually provide a probability of a hypothesis.Now let us approach the same problem with null hypothesis testing. Th e null is that the person
is not infected. Th e observation is a positive test, and the probability of a positive test given that the null is true is p = .0001, which is the exact level of signifi cance. Th erefore, the null hypothesis of no infection is rejected with high confi dence, and the alternative hypothesis that the person is infected is accepted. However, as the Bayesian calculation showed, given a positive test, the prob-ability of a HIV infection is only .5. HIV screening illustrates how one can reach quite diff erent conclusions with null hypothesis testing or Bayes’ rule. It also clarifi es some of the possibilities and limits of both tools. Th e single most important limit of null hypothesis testing is that there is only one statistical hypothesis—the null, which does not allow for comparative hypotheses testing. Bayes’ rule, in contrast, compares the probabilities of the data under two (or more) hypotheses and also uses prior probability information. Only when one knows extremely little about a topic (so that one cannot even specify the predictions of competing hypotheses) might a null hypothesis test be appropriate.
A student who has understood the fact that the products of null hypothesis testing and Bayes’ rule are p(D |H
0) and p(H
1|D), respectively, will note that the Statements 1 through 5 are all about
probabilities of hypotheses and therefore cannot be answered with signifi cance testing. Statement 6, in contrast, is about the probability of further signifi cant results, that is, about probabilities of data rather than hypotheses. Th at this statement is wrong can be seen from the fact that it does not include the conditional phrase “… if H
0 is true.”
Note that the above two-step course does not require in-depth instruction in Bayesian statistics (see Edwards, Lindman, & Savage, 1963; Howson & Urbach, 1989). Th is minimal course can be readily extended to a few more tools, for instance, by adding Neyman-Pearson testing, which computes the likelihood ratio p(D |H
1)/p(D |H
2). Psychologists know Neyman-Pearson testing in
the form of signal detection theory, a cognitive theory that has been inspired by the statistical tool (Gigerenzer & Murray, 1987). Th e products of the three tools can be easily compared:(a) p(D |H
0) is obtained from null hypothesis testing.
(b) p(D |H1)/p(D |H
2) is obtained from Neyman-Pearson hypotheses testing.
(c) p(H1|D) is obtained by Bayes’ rule.
For null hypothesis testing, only the likelihood p(D |H0) matters; for Neyman-Pearson, the likeli-
hood ratio matters; and for Bayes, the posterior probability matters. By opening the statistical toolbox and comparing tools, one can easily understand what each tool delivers and what it does not. For the next question, the fundamental diff erence between null hypothesis testing and other statistical tools such as Bayes’ rule and Neyman-Pearson testing is that in null hypothesis testing, only one hypothesis—the null—is precisely stated. With this technique, one is not able to compare
GG_Null_2004.indd 7 12.04.2007 10:29:12 Uhr

8 The Null Ritual
two or more hypotheses in a symmetric or “fair” way and might draw wrong conclusions from the data.
Question 3: Can the Null Ritual Hurt?
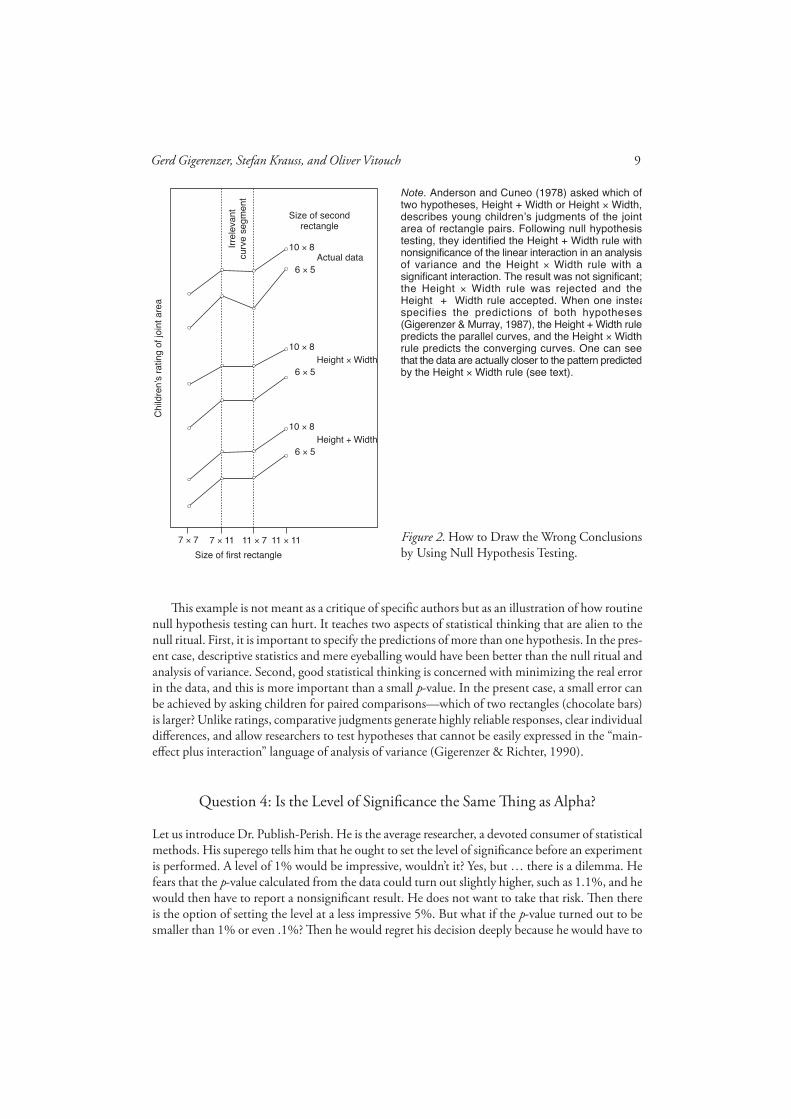
But it’s just a little ritual. It may be a bit silly, but it can’t hurt, can it? Yes, it can. Consider a study in which the authors had two precisely formulated hypotheses, but instead of specifying the pre-dictions of both hypotheses for their experimental design, they performed the null ritual. Th e question was how young children judge the area of rectangles, and the two hypotheses were the following: Children add height plus width, or children multiply height times width (Anderson & Cuneo, 1978). In one experiment, 5- to 6-year-old children rated the joint area of two rectangles (not an easy task). Th e reason for having them rate the area of two rectangles rather than one was to disentangle the integration rule (adding vs. multiplying) from the response function (linear vs. logarithmic). Suffi ce to say that the idea for the experiment was ingenious. Th e Height + Width rule was identifi ed with the null hypothesis of no linear interaction in a two-factorial analysis of variance. Th e prediction of the second hypothesis, the Height × Width rule, was never specifi ed, as it never is with null hypothesis testing. Th e authors found that the “curves are nearly parallel and the interaction did not approach signifi cance, F(4, 56) = 1.20” (p. 352). Th ey concluded that this and similar results would support the Height + Width rule and disconfi rm the multiplying rule. In Anderson’s (1981) words, “Five-year-olds judge area of rectangles by an adding, Height + Width rule” (p. 33).
Testing a null, however, is a weak argument if one has some ideas about the subject matter, as Anderson and Cuneo (1978) did. So let us derive the actual predictions of both of their hypotheses for their experimental design (for details, see Gigerenzer & Murray, 1987). Figure 2 shows the prediction of the Height + Width rule and that of the Height × Width rule. Th ere were eight pairs of rectangles, shown by the two curves. Note that the middle segment (the parallel lines) does not diff erentiate between the two hypotheses, as the left and the right segments do. Th us, only these two segments are relevant. Here, the Height + Width rule predicts parallel curves, whereas the Height × Width rule predicts converging curves (from left to right). One can see that the data (top panel) actually show the pattern predicted by the multiplying rule and that the curves converge even more than predicted. If either of the two hypotheses is supported by the data, then it is the multiplying rule (this was supported by subsequent experimental research in which the predictions of half a dozen hypotheses were tested; see Gigerenzer & Richter, 1990). Nevertheless, the null ritual misled the researchers into concluding that the data would support the Height + Width rule.
Why was the considerable deviation from the prediction of the Height + Width rule not statis-tically signifi cant? One reason was the large amount of error in the data: Asking young children to rate the joint area of two rectangles produced highly unreliable responses. Th is contributed to the low power of the statistical tests, which was consistently below 10% (Gigerenzer & Richter, 1990)! Th at is, the experiments were set up so that the chance of accepting the Height × Width rule if it is true was less than 1 in 10.
But doesn’t the alternative hypothesis always predict a signifi cant result? As Figure 2 illustrates, this is not the case. Even if the data had coincided exactly with the prediction of the multiplying rule, the result would not have been signifi cant (because the even larger deviation of the actual data was not signifi cant either). In general, a hypothesis predicts a value or a curve but not signifi cance or nonsignifi cance. Th e latter is the joint product of several factors that have little to do with the hypothesis, including the number of participants, the error in the data, and the statistical power.
GG_Null_2004.indd 8 12.04.2007 10:29:12 Uhr
Gerd Gigerenzer, Stefan Krauss, and Oliver Vitouch 9
Th is example is not meant as a critique of specifi c authors but as an illustration of how routine null hypothesis testing can hurt. It teaches two aspects of statistical thinking that are alien to the null ritual. First, it is important to specify the predictions of more than one hypothesis. In the pres-ent case, descriptive statistics and mere eyeballing would have been better than the null ritual and analysis of variance. Second, good statistical thinking is concerned with minimizing the real error in the data, and this is more important than a small p-value. In the present case, a small error can be achieved by asking children for paired comparisons—which of two rectangles (chocolate bars) is larger? Unlike ratings, comparative judgments generate highly reliable responses, clear individual diff erences, and allow researchers to test hypotheses that cannot be easily expressed in the “main-eff ect plus interaction” language of analysis of variance (Gigerenzer & Richter, 1990).
Question 4: Is the Level of Signifi cance the Same Th ing as Alpha?
Let us introduce Dr. Publish-Perish. He is the average researcher, a devoted consumer of statistical methods. His superego tells him that he ought to set the level of signifi cance before an experiment is performed. A level of 1% would be impressive, wouldn’t it? Yes, but … there is a dilemma. He fears that the p-value calculated from the data could turn out slightly higher, such as 1.1%, and he would then have to report a nonsignifi cant result. He does not want to take that risk. Th en there is the option of setting the level at a less impressive 5%. But what if the p-value turned out to be smaller than 1% or even .1%? Th en he would regret his decision deeply because he would have to
Size of secondrectangle
Chi
ldre
n’s
ratin
g of
join
t are
a
10 × 8
6 × 5
10 × 8
6 × 5
10 × 8
6 × 5
Actual data
Height × Width
Height + Width
7 × 7 7 × 11 11 × 7 11 × 11
Irre
leva
ntcu
rve
segm
ent
Size of first rectangle
Note. Anderson and Cuneo (1978) asked which oftwo hypotheses, Height + Width or Height × Width,describes young children’s judgments of the jointarea of rectangle pairs. Following null hypothesistesting, they identified the Height + Width rule withnonsignificance of the linear interaction in an analysisof variance and the Height × Width rule with asignificant interaction. The result was not significant;the Height × Width rule was rejected and theHeight�+�Width rule accepted. When one insteaspecifies the predictions of both hypotheses(Gigerenzer & Murray, 1987), the Height + Width rulepredicts the parallel curves, and the Height × Widthrule predicts the converging curves. One can seethat the data are actually closer to the pattern predictedby the Height × Width rule (see text).
Figure 2. How to Draw the Wrong Conclusionsby Using Null Hypothesis Testing.
GG_Null_2004.indd 9 12.04.2007 10:29:13 Uhr

10 The Null Ritual
report this result as p < .05. He does not like that either. So he thinks the only choice left is to cheat a little and disobey his superego. He waits until he has seen the data, rounds the p-value up to the next conventional level, and reports that the result is signifi cant at p < .001, .01, or .05, whatever is next. Th at smells of deception, and his superego leaves him with feelings of guilt. But what should he do when everyone else seems to play this little cheating game?
Dr. Publish-Perish does not know that his moral dilemma is caused by a mere confusion, a product of textbook writers who failed to distinguish the three main interpretations of the level of signifi cance and mixed them all up.
Interpretation 1: Mere Convention
So far, we have mentioned only in passing the statisticians who have created and shaped the ideas we are talking about. Similarly, most statistical textbooks for psychology and education are generally mute about these eminent people and their ideas, which is remarkable for a fi eld where authors are cited compulsively, and no shortage of competing theories exists.
Th e fi rst person to introduce is Sir Ronald A. Fisher (1890–1962), one of the most infl uen-tial statisticians ever, who also made fi rst-rate contributions to genetics and was knighted for his achievements. Fisher spent most of his career at University College, London, where he held the chair of eugenics. His publications include three books on statistics. For psychology, the most infl uential of these was the second one, The Design of Experiments, fi rst published in 1935. In the Design, Fisher suggested that we think of the level of signifi cance as a convention: “It is usual and convenient for experimenters to take 5 per cent as a standard level of signifi cance, in the sense that they are prepared to ignore all results which fail to reach this standard” (p. 13). Fisher’s assertion that 5% (in some cases, 1%) is a convention to be adopted by all experimenters and in all experi-ments, whereas nonsignifi cant results are to be ignored, became part of the null ritual. For instance, the 1974 Publication Manual of the American Psychological Association instructed experimenters to make mechanical decisions using a conventional level of signifi cance:
Caution: Do not infer trends from data that fail by a small margin to meet the usual levels of signifi cance. Such results are best interpreted as caused by chance and are best reported as such. Treat the result section like an income tax return. Take what’s coming to you, but no more. (p. 19; this passage was deleted in the 3rd edition [American Psychological Association, 1983])
In a recent defense of what he calls NHSTP (null hypothesis signifi cance testing procedure), Chow (1998) still proclaims that null hypothesis tests should be interpreted mechanically, using the con-ventional 5% level of signifi cance. Th is view reminds us of a maxim regarding the critical ratio, the predecessor of the signifi cance level: “A critical ratio of three, or no Ph.D.”
Interpretation 2: Alpha
Th e second eminent person we would like to introduce is the Polish mathematician Jerzy Neyman, who worked with Egon S. Pearson (the son of Karl Pearson) at University College in London and later, when the tensions between Fisher and himself grew too heated, moved to Berkeley, California. Neyman and Pearson criticized Fisher’s null hypothesis testing for several reasons, including that no alternative hypothesis is specifi ed, which in turn does not allow computation of the probability β of wrongly rejecting the alternative hypothesis (Type II error) or of the power of the test (1 – β) (Gigerenzer et al., 1989, chap. 3). In Neyman-Pearson theory, the meaning of a level of signifi cance
GG_Null_2004.indd 10 12.04.2007 10:29:13 Uhr

Gerd Gigerenzer, Stefan Krauss, and Oliver Vitouch 11
such as 3% is the following: If the hypothesis H1 is correct, and the experiment is repeated many
times, the experimenter will wrongly reject H1 in 3% of the cases. Rejecting the hypothesis H
1 if it
is correct is called a Type I error, and the probability of rejecting H1 if it is correct is called alpha (α).
Neyman and Pearson insisted that one must specify the level of signifi cance before the experiment to be able to interpret it as α. Th e same holds for β, which is the rate of rejecting the alternative hypothesis H
2 if it is correct (Type II error). Here we get the second classical interpretation of the
level of signifi cance: the error rate α, which is determined before the experiment, albeit not by mere convention but by cost-benefi t calculations that strike a balance between α, β, and sample size n (Cohen, 1994).
Interpretation 3: Th e Exact Level of Signifi cance
Fisher had second thoughts about his proposal of a conventional level and stated these most clearly in the mid-1950s. In his last book, Statistical Methods and Scientifi c Inference (1956, p. 42), Fisher rejected the use of a conventional level of signifi cance and ridiculed this practice as “absurdly aca-demic” (see epigram). Fisher’s primary target, however, was the interpretation of the level of signifi -cance as α, which he rejected as unscientifi c. In science, Fisher argued, unlike in industrial quality control, one does not repeat the same experiment again and again, as is assumed in Neyman and Pearson’s interpretation of the level of signifi cance as an error rate in the long run. What researchers should do instead, according to Fisher’s second thoughts, is publish the exact level of signifi cance, say, p = .02 (not p < .05), and communicate this result to their fellow researchers.Th us, the phrase level of signifi cance has three meanings:(1) the conventional level of significance, a common standard for all researchers (early Fisher);(2) the α level, that is, the relative frequency of wrongly rejecting a hypothesis in the long run if it is
true, to be decided jointly with β and the sample size before the experiment and independently of the data (Neyman & Pearson);
(3) the exact level of significance, calculated from the data after the experiment (late Fisher).Th e basic diff erence is this: For Fisher, the exact level of signifi cance is a property of the data, that is, a relation between a body of data and a theory; for Neyman and Pearson, α is a property of the test, not of the data. Level of signifi cance and α are not the same thing. Th e practical consequences are straightforward:
(1) Conventional level: You specify only one statistical hypothesis, the null. You always use the 5% level and report whether the result is signifi cant or not; that is, you report p < .05 or p > .05, just like in the null ritual. If the result is signifi cant, you reject the null; otherwise, you do not draw any conclusion. Th ere is no way to confi rm the null hypothesis. Th e decision is asymmetric.
(2) Alpha level: You specify two statistical hypotheses, H1 and H
2, to be able to calculate the
desired balance between α, β, and the sample size n. If the result is signifi cant (i.e., if it falls within the alpha region), the decision is to reject H
1 and to act as if H
2 were true; otherwise, the decision
is to reject H2 and to act as if H
1 were true. (We ignore here, for simplicity, the option of a region
of indecision.) For instance, if α = β = .10, then it does not matter whether the exact level of sig-nifi cance is .06 or .001. Th e level of signifi cance has no infl uence on α. Unlike in null hypothesis testing with a conventional level, the decision is symmetric.
(3) Exact level of signifi cance: You calculate the exact level of signifi cance from the data. You report, say, p = .051 or p = .048. You do not use statements of the type “p < .05” but report the exact (or rounded) value. Th ere is no decision involved. You communicate information; you do not make yes-no decisions.
GG_Null_2004.indd 11 12.04.2007 10:29:13 Uhr

12 The Null Ritual
Th ese three interpretations of the level of signifi cance are confl ated in most textbooks used in psychology and education. Th is confusion is a direct consequence of the sour fact that these text-books do not teach the toolbox and competing statistical theories but instead only one apparently monolithic form of “statistics”—a mishmash that does not exist in statistics proper (Gigerenzer, 1993, 2000).
Now let us go back to Dr. Publish-Perish and his moral confl ict. His superego demands that he specify the level of signifi cance before the experiment. We now understand that this doctrine is part of the Neyman-Pearson theory. His ego personifi es Fisher’s theory of calculating the exact level of signifi cance from the data but is confl ated with Fisher’s earlier idea of making a yes-no decision based on a conventional level of signifi cance. Th e confl ict between his superego and his ego is the source of his guilt feelings, but he does not know that. Never having heard that there are diff erent theories, he has a vague feeling of shame for doing something wrong. Dr. Publish-Perish does not follow any of the three diff erent conceptions. Unknowingly, he tries to satisfy all of them and ends up presenting an exact level of signifi cance as if it were an alpha level, yet fi rst rounding it up to one of the conventional levels of signifi cance, p < .05, p < .01, or p < .001. Th e result is not α, nor an exact level of signifi cance, nor a conventional level. It is an emotional and intellectual confusion.
Question 5: What Emotional Structure Sustains the Null Ritual?
Dr. Publish-Perish is likely to share some of the illusions demonstrated in the fi rst section. Recall that most of these illusions involve the confusion of the level of signifi cance with the probability of a hypothesis. Yet every person of average intelligence can understand the diff erence between p(D |H) and p(H |D), suggesting that the issue is not an intellectual but a social and emotional one. Following Gigerenzer (1993; see also Acree, 1978), we will continue to use the Freudian language of unconscious confl icts as an analogy to analyze why intelligent people surrender to statistical rituals rather than engage in statistical thinking.
Th e Neyman-Pearson theory serves as the superego of Dr. Publish-Perish’s statistical thinking, demanding in advance the specifi cation of precise alternative hypotheses, signifi cance levels, and power to calculate the sample size necessary, as well as teaching the doctrine of repeated random sampling (Neyman, 1950, 1957). Moreover, the frequentist superego forbids the interpretation of levels of signifi cance as the degree of confi dence that a particular hypothesis is true or false. Hypothesis testing, in its view, is about decision making (i.e., acting as if a hypothesis were true or false) but not about epistemic statements (i.e., believing in a hypothesis).
Th e Fisherian theory of signifi cance testing functions as the ego. Th e ego gets things done in the laboratory and papers published. Th e ego determines the level of signifi cance after the experiment, and it does not specify power or calculate the sample size necessary. Th e ego avoids precise predic-tions from its research hypothesis and instead claims support for it by rejecting a null hypothesis. Th e ego makes abundant epistemic statements about particular results and hypotheses. But it is left with feelings of guilt and shame for having violated the rules.
Th e Bayesian posterior probabilities form the id of this hybrid logic. Th ese probabilities of hypotheses are censored by both the frequentist superego and the pragmatic ego. However, they are exactly what the Bayesian id wants, and it gets its way by wishful thinking and blocking the intellect from understanding what a level of signifi cance really is.
Th e Freudian analogy (see Figure 3) illustrates the unconscious confl icts in the minds of the average student, researcher, and editor and provides a way to understanding why many psycholo-gists cling to null hypothesis testing like a ritual and why they do not seem to want to understand
GG_Null_2004.indd 12 12.04.2007 10:29:13 Uhr

Gerd Gigerenzer, Stefan Krauss, and Oliver Vitouch 13
what they easily could. Th e analogy brings the anxiety and guilt, the compulsive behavior, and the intellectual blindness associated with the hybrid logic into the foreground. It is as if the raging personal and intellectual confl icts between Fisher and Neyman and Pearson, as well as between these frequentists and the Bayesians, were projected into an “intra-psychic” confl ict in the minds of researchers. In Freudian theory, ritual is a way of resolving unconscious confl ict.
Textbook writers, in turn, have tried to resolve the conscious confl ict between statisticians by collective silence. You will rarely fi nd a textbook for psychologists that points out even a few issues in the heated debate about what is good hypotheses testing, which is covered in detail in Gigerenzer et al. (1989, chaps. 3, 6). Th e textbook method of denial includes omitting the names of the parents of the various ideas—that is, Fisher, Neyman, and Pearson—except in connection with trivialities such as an acknowledgment for permission to reproduce tables. One of the few exceptions is Hays (1963), who mentioned in one sentence in the second edition that statistical theory made cumulative progress from Fisher to Neyman and Pearson, although he did not hint at their diff ering ideas or confl icts. In the third edition, however, this sentence was deleted, and Hays fell back to common standards. When one of us (GG) asked him why he deleted this sentence, he gave the same reason as for having removed the chapter on Bayesian statistics: Th e publisher wanted a single-recipe cookbook, not names of statisticians whose theories might confl ict. Th e fear seems to be that a statistical toolbox would not sell as well as one truth or one hammer.
Many textbook writers in psychology continue to spread confusion about statistical theories, even after they have learned otherwise. For instance, in response to Gigerenzer (1993), Chow (1998) acknowledges that diff erent logics of statistical inference exist. But a few lines later, he falls back into the “it’s-all-the-same” fable when he asserts, “To K. Pearson, R. Fisher, J. Neyman, and E. S. Pearson, NHSTP was what the empirical research was all about” (p. xi). Calling the heroes of the past to justify the null ritual (to which NHSTP seems to amount) is bewildering. Each of these statisticians would have rejected NHSTP. Neyman and Pearson spent their careers arguing against null hypothesis testing, against a magical 5% level, and for the concept of Type II error (which Chow declares not germane to NHSTP). Chow’s confusion is not an exception. NHSTP is the symptom of the unconscious confl ict illustrated in Figure 3. Laying open the confl icts between major approaches rather than denying them would be a fi rst step to understanding the underlying issues, a prerequisite for statistical thinking.
The Unconscious Conflict
Superego(Neyman-Pearson)
Two or more hypotheses; alpha and beta determinedbefore the experiment; compute sample size; no
statements about the truth of hypotheses …
Ego(Fisher)
Null hypothesis only; significance level computedafter the experiment; beta ignored; sample size byrule of thumb; gets papers published but left with
feelings of guilt
Id(Bayes)
Desire for probabilities of hypotheses
Figure 3. A Freudian Analogy for the Unconscious Confl icts in the Minds of Researchers.
GG_Null_2004.indd 13 12.04.2007 10:29:13 Uhr
14 The Null Ritual
Question 6: Who Keeps Psychologists Performing the Null Ritual?
Ask graduate students, and they likely point to their advisers. Th e students do not want problems with their thesis. When we meet them again as post-docs, the answer is that they need a job. After getting their fi rst job, they still feel restricted because there is a tenure decision in a couple of years. When they are safe as associate or full professors, it is still not their fault because they believe the editors of the major journals will not publish their papers without the null ritual. Th ere is always someone else to blame, rather than one’s own lack of having the courage to know. But fears about punishment for rule violations are not entirely unfounded. For instance, Melton (1962) insisted on the null ritual and also made it clear in his editorial that he wants to see p < .01, not just p < .05. Th e reasons he gave were two of the illusions listed in Question 1. He misleadingly asserted that the lower the p-value, the higher the confi dence that the alternative hypothesis is true and the higher the probability that a replication will fi nd a signifi cant result. Nothing beyond p-values is mentioned in the editorial: Precise hypotheses, good descriptive statistics, confi dence intervals, eff ect sizes, and power do not appear in his statement about good research. Th us, the null ritual seems to be enforced by editors.
Th e story of a recent editor, however, reveals that the truth is not as simple as that. In his “On the Tyranny of Hypothesis Testing in the Social Sciences,” Geoff rey Loftus (1991) reviewed The Empire of Chance (Gigerenzer et al., 1989), which presented one of the fi rst analyses of how psychologists mishmashed ideas of Fisher and also Neyman and Pearson into one hybrid logic. When Loftus (1993) became the editor of Memory & Cognition, he made it clear in his editorial that he did not want authors to submit papers in which p-, t-, or F-values are mindlessly being calculated and reported. Rather, he asked researchers to keep it simple and report fi gures with error bars, following the proverb that “a picture is worth more than a thousand p-values.” We admire Loftus for having had the courage to take this step. Years after, one of us (GG) asked Loftus about the success of his crusade against thoughtless signifi cance testing. Loftus bitterly complained that most researchers actually refused the opportunity to escape the ritual. Even when he asked in his editorial letter to get rid of dozens of p-values, the authors insisted on keeping them in. Th ere is something deeply engrained in the minds of many researchers that makes them repeat the same action over and over again.
Question 7: How Can We Advance Statistical Th inking?
There is no single recipe for promoting statistical thinking, but there are several good heu-ristics. We sketch a few of these, which the readers can use to construct their own program or curriculum.
Hypotheses Is in the Plural
If there is one single severe problem with the null ritual, then it is the fact that hypothesis is in the singular. Hypotheses testing should always be competitive; that is, the predictions of several hypoth-eses should be specifi ed. Figure 2 gives an example of how the predictions of two hypotheses can be specifi ed graphically. Rieskamp and Hoff rage (1999), for instance, test eight competing hypotheses about how people predict the profi t of companies, and Gigerenzer and Hoff rage (1995) test the predictions of six cognitive strategies in problem solving. One advantage of multiple hypotheses is
GG_Null_2004.indd 14 12.04.2007 10:29:13 Uhr

Gerd Gigerenzer, Stefan Krauss, and Oliver Vitouch 15
the analysis of individual diff erences: For instance, one can show that people systematically follow diff erent problem-solving strategies.
Minimize the True Error
Statistical thinking does not simply involve measuring the error and inserting the value into the denominator of the t-ratio. Good statistical thinking is about how to minimize the real error. By real error, we refer to the true variability of measurements or observations, not the variance divided by the square root of the number of observations. W. S. Gosset, who published the t-test in 1908 under the pseudonym “Student” wrote, “Obviously the important thing … is to have a low real error, not to have a ‘signifi cant’ result at a particular station. Th e latter seems to me to be nearly valueless in itself ” (quoted in Pearson, 1939, p. 247). Methods of minimizing the real error include proper choice of task (e.g., paired comparison instead of rating) (see Gigerenzer & Richter, 1990), proper choice of experimental environment (e.g., testing participants individually rather than in large classrooms), proper motivation (e.g., by performance-contingent payment rather than fl at sums), instructions that are unambiguous rather than vague, and the avoidance of unnecessary deception of participants about the purpose of the experiment, which can lead to second-guessing and increased variability of responses (Hertwig & Ortmann, 2001).
Th ink of a Toolbox, Not of a Hammer
Recall that the problem of inductive inference has no single best solution—it has many good solutions. Statistical thinking involves analyzing the problem at hand and then selecting the best tool in the statistical toolbox or even constructing such a tool. No tool is best for all problems. For instance, there is no single best method of representing a central tendency: Whether to report the mean, the median, the mode, or all three of these needs to be decided by the problem at hand. Th e toolbox includes, among others, descriptive statistics, methods of exploratory data analysis, confi dence intervals, Fisher’s null hypothesis testing, Neyman-Pearson hypotheses testing, Wald’s sequential analysis, and Bayesian statistics.
Th e concept of a toolbox has an important consequence for teaching statistics. Stop teaching the null ritual or what is called NHSTP (see, e.g., Chow, 1998; Harlow, 1997). Teach statistics in the plural: the major statistical tools together with good examples of problems they can solve. For in-stance, the logic of Fisher’s (1956) null hypothesis testing can easily be made clear in three steps:(1) Set up a statistical null hypothesis. The null need not be a nil hypothesis (zero difference).(2) Report the exact level of significance (e.g., p = .011 or .051). Do not use a conventional 5%
level (e.g., p < .05), and do not talk about accepting or rejecting hypotheses.(3) Use this procedure only if you know very little about the problem at hand.Note that Fisher’s null hypothesis testing is, at each step, unlike the null ritual (see introduction). One can see that statistical power has no place in Fisher’s framework—one needs a specifi ed alterna-tive hypothesis to compute power. In the same way, one can explain the logic of Neyman-Pearson hypotheses testing, which we illustrate for the case of two hypotheses and a binary decision criterion as follows:(1) Set up two statistical hypotheses, H
1 and H
2, and decide about α, β, and sample size before the
experiment, based on subjective cost-benefit considerations. These define a rejection region for each hypothesis.
GG_Null_2004.indd 15 12.04.2007 10:29:13 Uhr

16 The Null Ritual
(2) If the data falls into the rejection region of H1, accept H
2; otherwise, accept H
1. Note that accepting
a hypothesis does not imply that you believe in it; it only means that you act as if it were true.(3) The usefulness of the procedure is limited to situations in which you have a disjunction of
hypotheses (e.g., either μ = 8 or μ = 10 is true) and in which the scientific context can provide the utilities that enter the choice of α and β.
A typical application of Neyman-Pearson testing is in quality control. Imagine a manufacturer of metal plates that are used in medical instruments. She considers a mean diameter of 8 mm (H
1) as
optimal and 10 mm (H2) as dangerous to the patients and hence unacceptable. From past experi-
ence, she knows that the random fl uctuations of diameters are approximately normally distributed and that the standard deviations do not depend on the mean. Th is allows her to determine the sampling distributions of the mean for both hypotheses. She considers accepting H
1 while H
2 is
true (Type II error) to be the most serious error because it may cause harm to patients and to the fi rm’s reputation. She sets its probability as β = 0.1% and α = 10%. Now she calculates the required sample size n of plates that must be sampled every day to test the quality of the production. When she accepts H
2, she acts as if there were a malfunction and stops production, but this does not mean
that she believes that H2 is true. She knows that she must expect a false alarm in 1 out of 10 days
in which there is no malfunction (Gigerenzer et al., 1989, chap. 3).Th e basic logic of other statistical tools can be taught in the same way, and examples for their
usefulness and limits can be provided.
Know and Show Your Data
Descriptive statistics and exploratory data analysis are typically more informative than the null ritual, specifi cally in the presence of multiple hypotheses. For instance, the plot of the three curves shown in Figure 2 is more informative than the result of the analysis of variance that the data do not deviate signifi cantly from the predictions of the null. Showing in addition the individual data points around the means of the data curve, or at least the error bars, would be even more informative. Similarly, a scatter plot showing the data points is more informative than a correlation coeffi cient, for each scatter plot corresponds to one correlation, whereas a correlation of .5, for example, cor-responds to many and strikingly diff erent scatter plots. Wilkinson and the Task Force on Statistical Inference (1999) give examples for informative graphs.
Keep It Simple
A statistical analysis should be transparent to its author and the readership. Each statistical method consists of a sequence of mathematical operations, and to understand what the end product (factor scores, regression weights, nonsignifi cant interactions) means, one needs to check the meaning of each operation at each step. Transparency allows the reader to follow each step and to understand or criticize the analysis. Th e best vehicle for transparency is simplicity. If a point can be made by a simple analysis, such as plotting the means and standard deviations, one should stick with it rather than using a less transparent method, such as factor analysis or path analysis. Th e purpose of a statistical analysis is not to impress others with a complex method they do not fully understand. We have witnessed painful talks whereby the audience actually insisted on clarifi cation, only to learn that the author did not understand his fancy method either. Never use a statistical method that is not entirely transparent to you.
GG_Null_2004.indd 16 12.04.2007 10:29:14 Uhr

Gerd Gigerenzer, Stefan Krauss, and Oliver Vitouch 17
p-Values Want Company
If you wish to report a p-value, remember that it conveys very limited information. Th us, report p-values together with information about eff ect sizes, or power, or confi dence intervals. Recall that the null hypothesis that defi nes the p-value need not be a nil hypothesis (e.g., zero diff erence); any hypothesis can be a null, and many diff erent nulls can be tested simultaneously (e.g., Gigerenzer & Richter, 1990).
Question 8: How Can We Have More Fun With Statistics?
Many students experience statistics as dry, dull, and dreary. It certainly need not be; real-world examples (as in Gigerenzer, 2002) can make statistical thinking exciting. Here are several other ways of turning students into statistics addicts, or at least of making them think. Th e fi rst heuristic is to draw a red thread from the past to the present. We understand the aspirations and fears of a person better if we know his or her history. Knowing the history of a statistical concept can create a similar feeling of intimacy.
Connecting to the Past
Th e fi rst test of a null hypothesis was by John Arbuthnot in 1710. His aim was to give an empirical proof of divine providence, that is, of an active God. Arbuthnot observed that “the external ac-cidents to which males are subject (who must seek their food with danger) do make a great havock of them, and that this loss exceeds far that of the other sex” (p. 188). To repair this loss, he argued, God brings forth more males than females, year after year. He tested this hypothesis of divine purpose against the null hypothesis of mere chance, using 82 years of birth records in London. In every year, the number of male births was larger than that of female births. Arbuthnot calculated the “expectation” of these data if the hypothesis of blind chance were true. In modern terms, the probability of these data if the null hypothesis were true was
p(D |H0) = (1/2)82.
Because this probability was so small, he concluded that it is divine providence, not chance, that rules:
Scholium. From hence it follows, that Polygamy is contrary to the Law of Nature and Justice, and to the Propagation of the human Race; for where Males and Females are in equal number, if one Man takes Twenty Wifes, Nineteen Men must live in Celibacy, which is repugnant to the Design of Nature; nor is it probable that Twenty Women will be so well impregnated by one Man as by Twenty. (qtd. in Gigerenzer & Murray, 1987, pp. 4–5)
Arbuthnot’s proof of God highlights the limitations of null hypothesis testing. Th e research hy-pothesis (God’s divine intervention) is not stated in statistical terms. Nor is a substantial alternative hypothesis stated in statistical terms (e.g., 3% of female newborns are abandoned immediately after birth). Only the null hypothesis (“chance”) is stated in statistical terms—a nil hypothesis. A result that is unlikely if the null were true (a low p-value) is taken as “proof” of the unspecifi ed research hypothesis.
Arbuthnot’s test was soon forgotten. Th e specifi c techniques of null hypothesis testing, such as the t-test (devised by Gosset in 1908) or the F-test (F for Fisher, e.g., in analysis of variance), were
GG_Null_2004.indd 17 12.04.2007 10:29:14 Uhr

18 The Null Ritual
fi rst applied in the context of agriculture. Th e examples in Fisher’s fi rst book on statistics (1925) smelled of manure, potatoes, and pigs. In his second book (1935), Fisher had cleaned out this odor, as well as much of the mathematics, so that social scientists could bond with the new statistics. Th e fi rst applications of these tests in psychology were mostly in parapsychology and education.
A striking change in research practice, which was named the inference revolution in psychology (Gigerenzer & Murray, 1987), happened from approximately 1940 to 1955 in the United States. It led to the institutionalization of the null ritual as the method of scientifi c inference in university curricula, textbooks, and the editorials of major journals. Before 1940, null hypothesis testing using analysis of variance or the t-test was practically nonexistent: Rucci and Tweney (1980) found a total of only 17 articles published from 1934 to 1940 that used it. By the early 1950s, half of the psychology departments in leading U.S. universities had made inferential statistics a graduate program requirement (Rucci & Tweney, 1980). By 1955, more than 80% of the empirical articles in four leading journals used null hypothesis testing (Sterling, 1959). Today, the fi gure is close to 100%. Despite decades of critique of the null ritual, it is still practiced and defended by the ma-jority of psychologists. For instance, it is often argued that if we can strip routine null hypothesis testing of the mental confusion associated with it, something of limited but important use is left: “deciding whether or not research data can be explained in terms of chance infl uences” (Chow, 1998, p. 188). We are back to Arbuthnot: Th e focus is on chance; to test substantive alternative hypotheses is not an issue. Arbuthnot, it should be said to his defense, was a step ahead—he did not recommend his procedure as a routine.
Materials to connect with the past can be drawn from two seminal books by Stephen Stigler (1986, 1999). His writing is so clear and entertaining that it feels as though one had grown up with statistical thinking. Danziger (1987), Gigerenzer (1987, 2000), and Gigerenzer et al. (1989) tell the story of the institutionalization of the null ritual in psychology.
Controversies and Polemics
Statistics has plenty of controversies. Th ese stories of confl ict can provide highly motivating material for students, who learn that—unlike in their textbooks—statistics is about real people and their struggles with ideas and with one another. Because of Fisher’s remarkable talent for polemics, his writings can serve as a starting point. Here are a few highlights.
Fisher once congratulated the Reverend Th omas Bayes for his insight to withhold his treatise from publication (it was published posthumously in 1763/1963). Why did Fisher say that? Bayes’ rule presupposes the availability of a prior probability distribution over the possible hypotheses, and Fisher insisted that such a distribution is only meaningful when it can be verifi ed by sampling from a population. Such distributional data are available in the case of HIV testing (see Question 2) but obviously uncommon for scientifi c hypotheses. Fisher believed that the Bayesians are wrong in assuming that all uncertainties can be expressed in terms of probabilities (see Gigerenzer et al., 1989, pp. 92–93).
Bayes’ rule and subjective probabilities were not the only target for Fisher. He branded Neyman’s position as “childish” and “horrifying [for] the intellectual freedom of the west.” Indeed, he likened Neyman to
Russians [who] are made familiar with the ideal that research in pure science can and should be geared to technological performance, in the comprehensive organized eff ort of a fi ve-year plan for the nation … [whereas] in the U.S. also the great importance of organized technology has I think made it easy to confuse the process appropriate for drawing correct conclusions, with those aimed rather at, let us say, speeding production, or saving money. (Fisher, 1955, p. 70)
GG_Null_2004.indd 18 12.04.2007 10:29:14 Uhr

Gerd Gigerenzer, Stefan Krauss, and Oliver Vitouch 19
Why did Fisher link the Neyman-Pearson theory to Stalin’s 5-year plans? Why did Fisher also compare them to the Americans, who confuse the process of gaining knowledge with speeding up production and saving money? It is probably not an accident that Neyman was born in Russia and, at the time of Fisher’s comment, had moved to the United States. What Fisher believed was that cost-benefi t calculations, Type I error rates, Type II error rates, and accept-reject decisions had nothing to do with gaining knowledge but instead with technology and making money, as in qual-ity control in industry. Researchers do not accept or reject hypotheses; rather, they communicate the exact level of signifi cance to fellow researchers, so that others can freely make up their minds. In Fisher’s eyes, free communication was a sign of the freedom of the West, whereas being told a decision was a sign of communism. For him, the concepts of α, β, and power (1 – β) have nothing to do with testing scientifi c hypotheses.
Th ey are defi ned as long-run frequencies of errors in repeated experiments, whereas in science, there are no experiments repeated again and again.
Fisher (1956) drew a bold line between his null hypothesis tests and Neyman-Pearson’s tests, which he ridiculed as originating from “the phantasy of circles [i.e., mathematicians] rather remote from scientifi c research” (p. 100). Neyman, for his part, responded that some of Fisher’s tests “are in a mathematically specifi able sense ‘worse than useless’” (Hacking, 1965, p. 99). What did Neyman have in mind with this verdict? Neyman had estimated the power of some of Fisher’s tests, including the famous Lady-tea-tasting experiment in Fisher (1935), and found that the power was sometimes smaller than α.
Polemics can motivate students to ask questions and to understand the competing ideas un-derlying the tools in the toolbox. For useful material, see Fisher (1955, 1956), Gigerenzer (1993), Gigerenzer et al. (1989, chap. 3), Hacking (1965), and Neyman (1950).
Playing Detective
Aside from motivating examples, history, and polemics, a further way to engage students is to challenge them to fi nd the errors of others. For instance, assign your students the task of looking up the section on the logic of hypothesis testing in textbooks for statistics in psychology and check-ing for wishful thinking, as in Table 1. Table 2 shows the result for a widely read textbook whose author, as usual, did not spell out the diff erences between Fisher, Neyman and Pearson, and the Bayesians but mixed them all up. Th e price for this was confusion and wishful thinking about the omnipotence of the level of signifi cance. Table 2 shows quotes from three pages of the textbook, in which the author tries to explain to the reader what a level of signifi cance means. For instance, the fi rst three assertions are unintelligible or plainly wrong and suggest that a level of signifi cance would provide information about the probability of hypotheses, and the fourth amounts to the replication fallacy.
Over the years, textbooks writers in psychology have learned to avoid obvious errors but still continue to teach the null ritual. For instance, the 16th edition of a very infl uential textbook, Gerrig and Zimbardo’s (2002) Psychology and Life, contains sections on “inferential statistics” and “becoming a wise consumer of statistics” (pp. 37–46), which are pure guidelines for the null ritual. Th e ritual is portrayed as statistics per se and named the “backbone of psychological research” (p. 46). Our detective student will fi nd that the names of Fisher, Bayes, Neyman, and Pearson are not mentioned, nor are concepts such as power, eff ect size, or confi dence intervals. She may also stumble upon the prevailing oracular language: “Inferential statistics indicate the probability that the particular sample of scores obtained are actually related to whatever you are attempting to
GG_Null_2004.indd 19 12.04.2007 10:29:14 Uhr

20 The Null Ritual
measure or whether they could have occurred by chance” (p. 44). Yet in the midst of unintelligible and nonsensical explanations such as these appear moments of deep insight: “Statistics can also be used poorly or deceptively, misleading those who do not understand them” (p. 46).
Question 9: What if Th ere Were No Signifi cance Tests?
Th is question has been asked in a series of articles in Harlow, Mulaik, and Steiger (1997) and in similar debates, which are summarized in the superb review by Nickerson (2000). However, there are actually two diff erent questions: What if there were no null hypothesis testing (signifi cance testing), as advocated by Fisher? What if there were no null ritual (or NHSTP)?
If eminent psychologists have anything in common, it is their distaste for mindless null hypoth-esis testing—which contrasts with the taste of the masses. You will not catch Jean Piaget testing a null hypothesis. Piaget worked out his logical theory of cognitive development, Wolfgang Köhler the Gestalt laws of perception, I. P. Pavlov the principles of classical conditioning, B. F. Skinner those of operant conditioning, and Sir Frederick Bartlett his theory of remembering and sche-mata—all without rejecting a null hypothesis. Moreover, F. Bartlett, R. Duncan Luce, Herbert A. Simon, B. F. Skinner, and S. S. Stevens explicitly protested in their writings against the null ritual (Gigerenzer, 1987, 1993; Gigerenzer & Murray, 1987).
So what if there were no null ritual or NHST? Nothing would be lost, except confusion, anxiety, and a platform for lazy theoretical thinking. Much could be gained, such as knowledge about diff erent statistical tools, training in statistical thinking, and a motivation to deduce precise predictions from one’s hypotheses. Should we ban the null ritual? Certainly—it is a matter of intellectual integrity. Every researcher should have the courage not to surrender to the ritual, and every editor, textbook writer, and adviser should feel obliged to promote statistical thinking and reject mindless rituals.
What if there were no null hypothesis testing, as advocated by Fisher? Not much would be lost, except in situations in which we know very little, where a p-value by itself can contribute something. Note that this question is a diff erent one: Fisher’s null hypothesis testing is one tool in the statistical
Table 2What Does “Signifi cant at the 5 % Level” Mean?
• “If the probability is low, the null hypothesis is improbable”• “Th e improbability of observed results being due to error”• “Th e probability that an observed diff erence is real”• “Th e statistical confi dence … with odds of 95 out of 100 that the observed diff erence will hold up in investigations”• Degree to which experimental results are taken “seriously”• “Th e danger of accepting a statistical result as real when it is actually due only to error’’• Degree of “faith [that] can be placed in the reality of the fi nding”• “Th e investigator can have 95 percent confi dence that the sample mean actually diff ers from the population mean”• “All of these are diff erent ways to say the same thing”
Note. Within three pages of text, the author of a widely read textbook explained to the reader that “level of signifi cance” means all of the above (Nunally, 1975, pp. 194–196). Smart students will be confused, but they may misattribute their confusion to their own lack of understanding.
Source: Nunally (1975).
GG_Null_2004.indd 20 12.04.2007 10:29:14 Uhr

Gerd Gigerenzer, Stefan Krauss, and Oliver Vitouch 21
toolbox, not a ritual. Should we ban null hypothesis testing? No, there is no reason to do so; it is just one small tool among many. What we need is to educate the next generation to dare to think and free themselves from compulsive hand-washing, anxiety, and feelings of guilt.
ReferencesAcree, M. C. (1978). Theories of statistical inference in psychological research: A historicocritical study. Ann Arbor, MI:
University Microfi lms International. (University Microfi lms No. H790 H7000)American Psychological Association. (1974). Publication manual. Baltimore, MD: Garamond/Pridemark.American Psychological Association. (1983). Publication manual (3rd ed.). Baltimore, MD: Garamond/
Pridemark.Anastasi, A. (1958). Differential psychology (3rd ed.). New York: Macmillan.Anderson, N. H. (1981). Foundations of information integration theory. New York: Academic Press.Anderson, N. H., & Cuneo, D. (1978). Th e height + width rule in children’s judgments of quantity. Journal of
Experimental Psychology: General, 107, 335–378.Arbuthnot, J. (1710). An argument for Divine Providence, taken from the constant regularity observ’d in the births
of both sexes. Philosophical Transactions of the Royal Society, 27, 186–190.Bakan, D. (1966). Th e test of signifi cance in psychological research. Psychological Bulletin, 66, 423–437.Bayes, T. (1963). An essay towards solving a problem in the doctrine of chances. In W. E. Deming (Ed.), Two papers
by Bayes. New York: Hafner. (Original work published 1763)Chow, S. L. (1998). Précis of “Statistical signifi cance: Rationale, validity, and utility.” Behavioral and Brain Sciences,
21, 169–239.Cohen, J. (1962). Th e statistical power of abnormal-social psychological research: A review. Journal of Abnormal
and Social Psychology, 65, 145–153.Cohen, J. (1994). Th e earth is round (p < .05). American Psychologist, 49, 997–1003.Danziger, K. (1987). Statistical methods and the historical development of research practice in American psychol-
ogy. In L. Krüger, G. Gigerenzer, & M. S. Morgan (Eds.), The probabilistic revolution: Vol. 2. Ideas in the sciences (pp. 35–47). Cambridge, MA: MIT Press.
Dulaney, S., & Fiske, A. P. ( 1994). Cultural rituals and obsessive-compulsive disorder: Is there a common psycho-logical mechanism? Ethos, 22, 243–283.
Edwards, W., Lindman, H., & Savage, L. J. (1963). Bayesian statistical inference for psychological research. Psycho-logical Review, 70, 193–242.
Falk, R., & Greenbaum, C. W. (1995). Signifi cance tests die hard. Theory & Psychology, 5, 75–98.Ferguson, L. (1959). Statistical analysis in psychology and education. New York: McGraw-Hill.Fisher, R. A. (1925). Statistical methods for research workers. Edinburgh, UK: Oliver & Boyd.Fisher, R. A. (1935). The design of experiments. Edinburgh, UK: Oliver & Boyd.Fisher, R. A. (1955). Statistical methods and scientifi c induction. Journal of the Royal Statistical Society, 17 (Series
B), 69–77.Fisher, R. A. (1956). Statistical methods and scientifi c inference. Edinburgh, UK: Oliver & Boyd.Gerrig, R. J., & Zimbardo, P. G. (2002). Psychology and life (16th ed.). Boston: Allyn & Bacon.Gigerenzer, G. (1987). Probabilistic thinking and the fi ght against subjectivity. In L. Krüger, G. Gigerenzer, & M.
Morgan (Eds.), The probabilistic revolution: Vol. II. Ideas in the sciences (pp. 11–33). Cambridge, MA: MIT Press.
Gigerenzer, G. (1993). Th e superego, the ego, and the id in statistical reasoning. In G. Keren & C. Lewis (Eds.), A handbook for data analysis in the behavioral sciences: Methodological issues (pp. 311–339). Hillsdale, NJ: Erlbaum.
Gigerenzer, G. (2000). Adaptive thinking: Rationality in the real world. New York: Oxford University Press.Gigerenzer, G. (2002). Calculated risks: How to know when numbers deceive you. New York: Simon & Schuster.Gigerenzer, G. (2003). Reckoning with risk: Learning to live with uncertainty. London: Penguin.Gigerenzer, G., & Hoff rage, U. (1995). How to improve Bayesian reasoning without instruction: Frequency formats.
Psychological Review, 102, 684–704.Gigerenzer, G., & Murray, D. J. (1987). Cognition as intuitive statistics. Hillsdale, NJ: Erlbaum.Gigerenzer, G., & Richter, H. R. (1990). Context eff ects and their interaction with development: Area judgments.
Cognitive Development, 5, 235–264.Gigerenzer, G., Swijtink, Z., Porter, T., Daston, L., Beatty, J., & Krüger, L. (1989). The empire of chance: How prob-
ability changed science and every day life. Cambridge, UK: Cambridge University Press.“Student” [W. S. Gosset] (1908). Th e probable error of a mean. Biometrika, 6, 1–25.
GG_Null_2004.indd 21 12.04.2007 10:29:14 Uhr

22 The Null Ritual
Guilford, J. P. (1942). Fundamental statistics in psychology and education. New York: McGraw-Hill. Hacking, I. (1965). Logic of statistical inference. Cambridge, UK: Cambridge University Press.Haller, H., & Krauss, S. (2002). Misinterpretations of signifi cance: A problem students share with their teachers?
Methods of Psychological Research—Online [Online serial], 7 (1), 1–20. Retrieved June 10, 2003, from www.mpr-online.de
Harlow, L. L. (1997). Signifi cance testing: Introduction and overview. In L. L. Harlow, S. A. Mulaik, & J. H. Steiger (Eds.), What if there were no signifi cance tests? (pp. 1–17). Mahwah, NJ: Erlbaum.
Harlow, L. L., Mulaik, S. A., & Steiger, J. H. (Eds.). (1997). What if there were no signifi cance tests? Mahwah, NJ: Erlbaum.
Hays, W. L. (1963). Statistics for psychologists (2nd ed.). New York: Holt, Rinehart & Winston. Hertwig, R., & Ortmann, A. (2001). Experimental practices in economics: A methodological challenge for psycholo-
gists? Behavioral and Brain Sciences, 24, 383–403. Howson, C., & Urbach, P. (1989). Scientifi c reasoning: The Bayesian approach. La Salle, IL: Open Court.Lindquist, E. F. (1940). Statistical analysis in educational research. Boston: Houghton Miffl in. Loftus, G. R. (1991). On the tyranny of hypothesis testing in the social sciences. Contemporary Psychology, 36,
102–105. Loftus, G. R. (1993). Editorial comment. Memory & Cognition, 21, 1–3. Luce, R. D. (1988). Th e tools-to-theory hypothesis: Review of G. Gigerenzer and D. J. Murray, “Cognition as
intuitive statistics.” Contemporary Psychology, 33, 582–583. Maslow, A. H. (1966). The psychology of science. New York: Harper & Row. Melton, A. W. (1962). Editorial. Journal of Experimental Psychology, 64, 553–557. Miller, G. A., &. Buckhout, R. (1973). Psychology: The science of mental life. New York: Harper & Row. Mulaik, S. A., Raju, N. S., & Harshman, R. A. (1997). Th ere is a time and a place for signifi cance testing.
In L. L. Harlow, S. A. Mulaik, & J. H. Steiger (Eds.), What if there were no signifi cance tests? (pp. 65–115). Mahwah, NJ: Erlbaum.
Neyman, J. (1950). First course in probability and statistics. New York: Holt. Neyman, J. (1957). Inductive behavior as a basic concept of philosophy of science. International Statistical Review,
25, 7–22. Nickerson, R. S. (2000). Null hypothesis signifi cance testing: A review of an old and continuing controversy.
Psychological Methods, 5, 241–301. Nunally, J. C. (1975). Introduction to statistics for psychology and education. New York: McGraw-Hill. Oakes, M. (1986). Statistical inference: A commentary for the social and behavioral sciences. Chichester, UK: Wiley. Pearson, E. S. (1939). “Student” as statistician. Biometrika, 30, 210–250. Pollard, P., & Richardson, J. T. E. (1987). On the probability of making Type I errors. Psychological Bulletin, 102,
159–163. Rieskamp, J., & Hoff rage, U. (1999). When do people use simple heuristics and how can we tell? In G. Gigerenzer,
P. M. Todd, & the ABC Research Group, Simple heuristics that make us smart (pp. 141–167). New York: Oxford University Press.
Rucci, A. J., & Tweney, R. D. (1980). Analysis of variance and the “second discipline” of scientifi c psychology: A historical account. Psychological Bulletin, 87, 166–184.
Sedlmeier, P., & Gigerenzer, G. (1989). Do studies of statistical power have an eff ect on the power of studies? Psychological Bulletin, 105, 309–316.
Skinner, B. F. (1984). A matter of consequences. New York: New York University Press. Sterling, R. D. (1959). Publication decisions and their possible eff ects on inferences drawn from tests of signifi -
cance—or vice versa. Journal of the American Statistical Association, 54, 30–34. Stigler, S. M. (1986). The history of statistics: The measurement of uncertainty before 1900. Cambridge, MA: Belknap
Press of Harvard University Press. Stigler, S. M. (1999). Statistics on the table: The history of statistical concepts and methods. Cambridge, MA: Harvard
University Press. Wilkinson, L., & the Task Force on Statistical Inference. (1999). Statistical methods in psychology journals: Guide-
lines and explanations. American Psychologist, 54, 594–604.
GG_Null_2004.indd 22 12.04.2007 10:29:14 Uhr