Embed Size (px)
Citation preview
December 2014 MODERN CASTING | 17
48th Census of World Casting Production
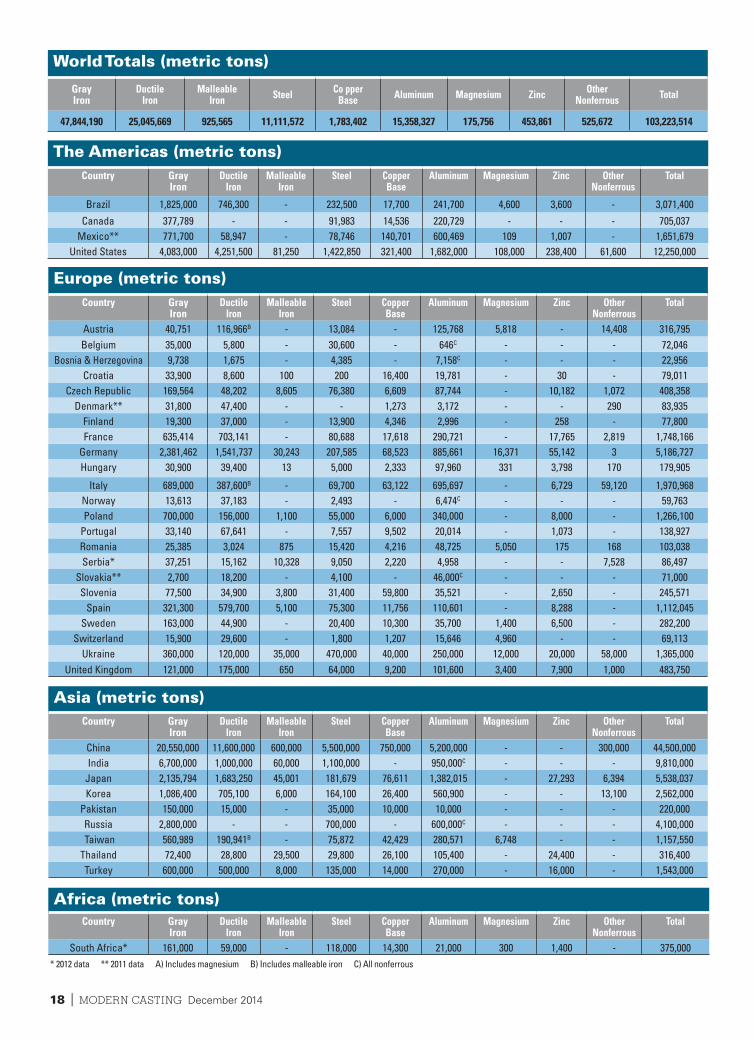
Worldwide casting production continued to grow in 2013, up more than 3.4 million metric tons, an increase of 3.4% in comparison to 2012.
In 2013, global production increased to more than 103 million metric tons, an increase of 3.4% when compared to the previous year, according to this year’s MODERN CAST-ING Census of World Casting
Production. The 103.2 million metric tons of metal castings produced in 2013 represents an increase of 3.43 million
tons. This rate of growth is a slight bump up from 2012’s 2.4% boost.
Of the 31 countries that provided data for the past two years, 18 reported a contraction in annual volumes when comparing 2013 to 2012. Poland increased its production by 22.1%, with gains across the board in terms of alloys. On the red side of the ledger, Pakistan saw the largest decline in production,
with its metalcasting industry con-tracting by 18.8%. Among the top-10 countries in total output, Brazil had the highest boost in 2013 with an increase of 7.4% in production. The rebound came a year after South America’s only entry in the global survey saw a 16.9% decrease in total production.
China increased its total production by two million metric tons to a total of
Steady Growth in Global Output
a modern casting staff report
18 | MODERN CASTING December 2014
Europe (metric tons)Country Gray
IronDuctile
IronMalleable
IronSteel Copper
BaseAluminum Magnesium Zinc Other
NonferrousTotal
Austria 40,751 116,966B - 13,084 - 125,768 5,818 - 14,408 316,795Belgium 35,000 5,800 - 30,600 - 646C - - - 72,046
Bosnia & Herzegovina 9,738 1,675 - 4,385 - 7,158C - - - 22,956Croatia 33,900 8,600 100 200 16,400 19,781 - 30 - 79,011
Czech Republic 169,564 48,202 8,605 76,380 6,609 87,744 - 10,182 1,072 408,358Denmark** 31,800 47,400 - - 1,273 3,172 - - 290 83,935
Finland 19,300 37,000 - 13,900 4,346 2,996 - 258 - 77,800France 635,414 703,141 - 80,688 17,618 290,721 - 17,765 2,819 1,748,166
Germany 2,381,462 1,541,737 30,243 207,585 68,523 885,661 16,371 55,142 3 5,186,727Hungary 30,900 39,400 13 5,000 2,333 97,960 331 3,798 170 179,905
Italy 689,000 387,600B - 69,700 63,122 695,697 - 6,729 59,120 1,970,968Norway 13,613 37,183 - 2,493 - 6,474C - - - 59,763Poland 700,000 156,000 1,100 55,000 6,000 340,000 - 8,000 - 1,266,100
Portugal 33,140 67,641 - 7,557 9,502 20,014 - 1,073 - 138,927Romania 25,385 3,024 875 15,420 4,216 48,725 5,050 175 168 103,038Serbia* 37,251 15,162 10,328 9,050 2,220 4,958 - - 7,528 86,497
Slovakia** 2,700 18,200 - 4,100 - 46,000C - - - 71,000Slovenia 77,500 34,900 3,800 31,400 59,800 35,521 - 2,650 - 245,571
Spain 321,300 579,700 5,100 75,300 11,756 110,601 - 8,288 - 1,112,045Sweden 163,000 44,900 - 20,400 10,300 35,700 1,400 6,500 - 282,200
Switzerland 15,900 29,600 - 1,800 1,207 15,646 4,960 - - 69,113Ukraine 360,000 120,000 35,000 470,000 40,000 250,000 12,000 20,000 58,000 1,365,000
United Kingdom 121,000 175,000 650 64,000 9,200 101,600 3,400 7,900 1,000 483,750
Asia (metric tons)Country Gray
IronDuctile
IronMalleable
IronSteel Copper
BaseAluminum Magnesium Zinc Other
NonferrousTotal
China 20,550,000 11,600,000 600,000 5,500,000 750,000 5,200,000 - - 300,000 44,500,000India 6,700,000 1,000,000 60,000 1,100,000 - 950,000C - - - 9,810,000
Japan 2,135,794 1,683,250 45,001 181,679 76,611 1,382,015 - 27,293 6,394 5,538,037Korea 1,086,400 705,100 6,000 164,100 26,400 560,900 - - 13,100 2,562,000
Pakistan 150,000 15,000 - 35,000 10,000 10,000 - - - 220,000Russia 2,800,000 - - 700,000 - 600,000C - - - 4,100,000 Taiwan 560,989 190,941B - 75,872 42,429 280,571 6,748 - - 1,157,550Thailand 72,400 28,800 29,500 29,800 26,100 105,400 - 24,400 - 316,400Turkey 600,000 500,000 8,000 135,000 14,000 270,000 - 16,000 - 1,543,000
Africa (metric tons)Country Gray
IronDuctile
IronMalleable
IronSteel Copper
BaseAluminum Magnesium Zinc Other
NonferrousTotal
South Africa* 161,000 59,000 - 118,000 14,300 21,000 300 1,400 - 375,000
The Americas (metric tons)Country Gray
IronDuctile
IronMalleable
IronSteel Copper
BaseAluminum Magnesium Zinc Other
NonferrousTotal
Brazil 1,825,000 746,300 - 232,500 17,700 241,700 4,600 3,600 - 3,071,400
Canada 377,789 - - 91,983 14,536 220,729 - - - 705,037Mexico** 771,700 58,947 - 78,746 140,701 600,469 109 1,007 - 1,651,679
United States 4,083,000 4,251,500 81,250 1,422,850 321,400 1,682,000 108,000 238,400 61,600 12,250,000
* 2012 data ** 2011 data A) Includes magnesium B) Includes malleable iron C) All nonferrous
World Totals (metric tons)
GrayIron
DuctileIron
MalleableIron Steel Co pper
Base Aluminum Magnesium Zinc OtherNonferrous Total
47,844,190 25,045,669 925,565 11,111,572 1,783,402 15,358,327 175,756 453,861 525,672 103,223,514
December 2014 MODERN CASTING | 19
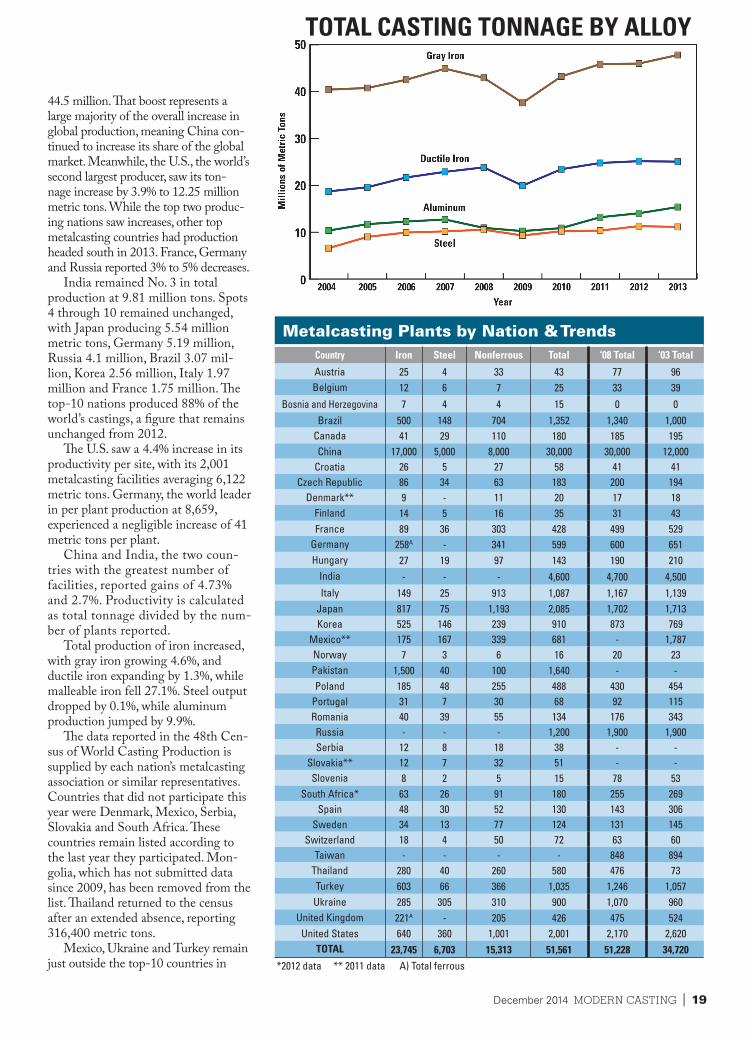
44.5 million. That boost represents a large majority of the overall increase in global production, meaning China con-tinued to increase its share of the global market. Meanwhile, the U.S., the world’s second largest producer, saw its ton-nage increase by 3.9% to 12.25 million metric tons. While the top two produc-ing nations saw increases, other top metalcasting countries had production headed south in 2013. France, Germany and Russia reported 3% to 5% decreases.
India remained No. 3 in total production at 9.81 million tons. Spots 4 through 10 remained unchanged, with Japan producing 5.54 million metric tons, Germany 5.19 million, Russia 4.1 million, Brazil 3.07 mil-lion, Korea 2.56 million, Italy 1.97 million and France 1.75 million. The top-10 nations produced 88% of the world’s castings, a figure that remains unchanged from 2012.
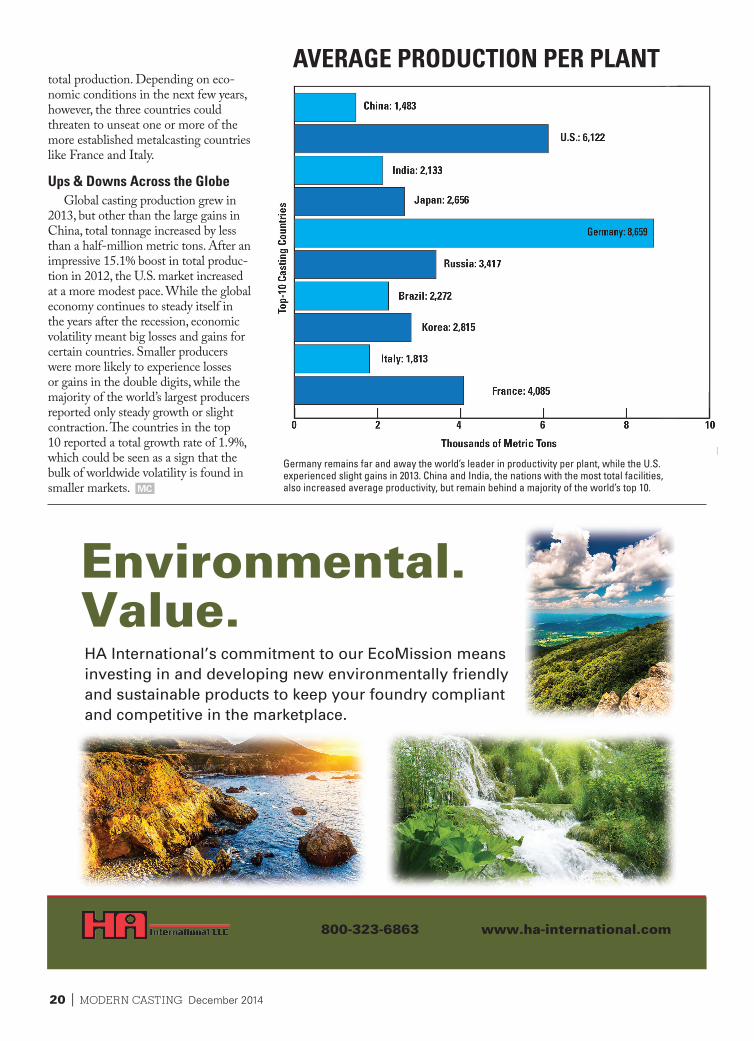
The U.S. saw a 4.4% increase in its productivity per site, with its 2,001 metalcasting facilities averaging 6,122 metric tons. Germany, the world leader in per plant production at 8,659, experienced a negligible increase of 41 metric tons per plant.
China and India, the two coun-tries with the greatest number of facilities, reported gains of 4.73% and 2.7%. Productivity is calculated as total tonnage divided by the num-ber of plants reported.
Total production of iron increased, with gray iron growing 4.6%, and ductile iron expanding by 1.3%, while malleable iron fell 27.1%. Steel output dropped by 0.1%, while aluminum production jumped by 9.9%.
The data reported in the 48th Cen-sus of World Casting Production is supplied by each nation’s metalcasting association or similar representatives. Countries that did not participate this year were Denmark, Mexico, Serbia, Slovakia and South Africa. These countries remain listed according to the last year they participated. Mon-golia, which has not submitted data since 2009, has been removed from the list. Thailand returned to the census after an extended absence, reporting 316,400 metric tons.
Mexico, Ukraine and Turkey remain just outside the top-10 countries in
Metalcasting Plants by Nation & TrendsCountry Iron Steel Nonferrous Total ‘08 Total ‘03 Total
Austria 25 4 33 43 77 96Belgium 12 6 7 25 33 39
Bosnia and Herzegovina 7 4 4 15 0 0Brazil 500 148 704 1,352 1,340 1,000
Canada 41 29 110 180 185 195China 17,000 5,000 8,000 30,000 30,000 12,000
Croatia 26 5 27 58 41 41Czech Republic 86 34 63 183 200 194
Denmark** 9 - 11 20 17 18Finland 14 5 16 35 31 43France 89 36 303 428 499 529
Germany 258A - 341 599 600 651Hungary 27 19 97 143 190 210
India - - - 4,600 4,700 4,500Italy 149 25 913 1,087 1,167 1,139
Japan 817 75 1,193 2,085 1,702 1,713Korea 525 146 239 910 873 769
Mexico** 175 167 339 681 - 1,787Norway 7 3 6 16 20 23Pakistan 1,500 40 100 1,640 - -Poland 185 48 255 488 430 454
Portugal 31 7 30 68 92 115Romania 40 39 55 134 176 343Russia - - - 1,200 1,900 1,900Serbia 12 8 18 38 - -
Slovakia** 12 7 32 51 - -Slovenia 8 2 5 15 78 53
South Africa* 63 26 91 180 255 269Spain 48 30 52 130 143 306
Sweden 34 13 77 124 131 145Switzerland 18 4 50 72 63 60
Taiwan - - - - 848 894Thailand 280 40 260 580 476 73Turkey 603 66 366 1,035 1,246 1,057
Ukraine 285 305 310 900 1,070 960United Kingdom 221A - 205 426 475 524
United States 640 360 1,001 2,001 2,170 2,620TOTAL 23,745 6,703 15,313 51,561 51,228 34,720
*2012 data ** 2011 data A) Total ferrous
TOTAL CASTING TONNAGE BY ALLOY
20 | MODERN CASTING December 2014
800-323-6863 www.ha-international.com
Environmental. Value.HA International’s commitment to our EcoMission means investing in and developing new environmentally friendly and sustainable products to keep your foundry compliant and competitive in the marketplace.
AVERAGE PRODUCTION PER PLANT
Germany remains far and away the world’s leader in productivity per plant, while the U.S. experienced slight gains in 2013. China and India, the nations with the most total facilities, also increased average productivity, but remain behind a majority of the world’s top 10.
total production. Depending on eco-nomic conditions in the next few years, however, the three countries could threaten to unseat one or more of the more established metalcasting countries like France and Italy.
Ups & Downs Across the GlobeGlobal casting production grew in
2013, but other than the large gains in China, total tonnage increased by less than a half-million metric tons. After an impressive 15.1% boost in total produc-tion in 2012, the U.S. market increased at a more modest pace. While the global economy continues to steady itself in the years after the recession, economic volatility meant big losses and gains for certain countries. Smaller producers were more likely to experience losses or gains in the double digits, while the majority of the world’s largest producers reported only steady growth or slight contraction. The countries in the top 10 reported a total growth rate of 1.9%, which could be seen as a sign that the bulk of worldwide volatility is found in smaller markets.
December 2014 MODERN CASTING | 21
Casting Shipments (value in ‘000s of U.S. dollars)Country Gray Iron Ductile Iron Malleable Iron Steel All Nonferrous Total
Austria 581,250A - - - 1,095,000 1,676,250Brazil 6,420,000 - - 1,430,000 3,750,000 11,600,000China - - - - - 89,700,000
Finland 48,777 108,232 112,583 110,078 379,670France 3,877,500A - - - 3,341,250 7,218,750
Germany 7,548,875 - - 1,548,375 6,383,000 15,480,250Hungary 232,500A - - - 355,000 600,000
Italy 3,125,000A - - - 4,937,500 8,062,500Japan 3,824,000 4,197,000 177,000 1,166,000 10,002,000 19,366,000
Norway 63,750 132,500 - 42,500 55,000 293,750Portugal 61,375 126,125 - 59,750 - 247,250
Spain 2,160,000A - - - 937,500 3,097,500Thailand 105,096 51,096 52,822 57,677 374,000 640,691Turkey 887,500 875,000 40,000 437,500 1,775,000 4,015,000
Ukraine 1,116,000 440,000 138,000 1,700,000 1,790,000 5,184,000United States 5,300,000 7,193,000 163,000 4,295,000 18,106,000 35,057,000
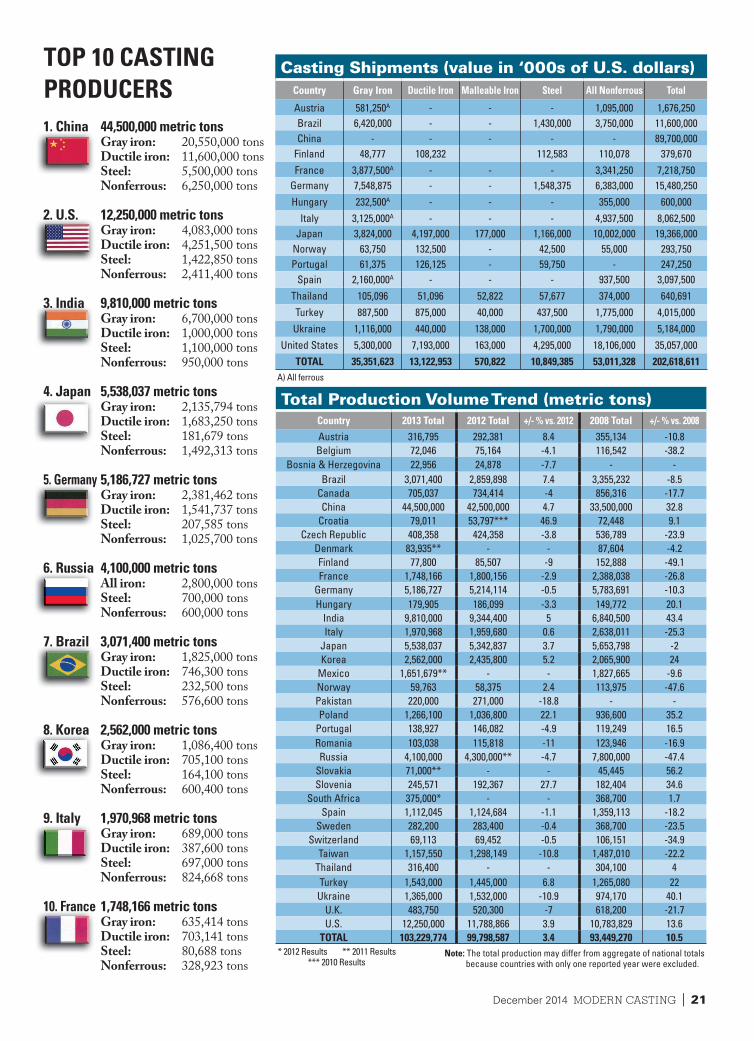
TOTAL 35,351,623 13,122,953 570,822 10,849,385 53,011,328 202,618,611 A) All ferrous
TOP 10 CASTING PRODUCERS
Total Production Volume Trend (metric tons)Country 2013 Total 2012 Total +/- % vs. 2012 2008 Total +/- % vs. 2008Austria 316,795 292,381 8.4 355,134 -10.8Belgium 72,046 75,164 -4.1 116,542 -38.2
Bosnia & Herzegovina 22,956 24,878 -7.7 - -Brazil 3,071,400 2,859,898 7.4 3,355,232 -8.5
Canada 705,037 734,414 -4 856,316 -17.7China 44,500,000 42,500,000 4.7 33,500,000 32.8
Croatia 79,011 53,797*** 46.9 72,448 9.1Czech Republic 408,358 424,358 -3.8 536,789 -23.9
Denmark 83,935** - - 87,604 -4.2Finland 77,800 85,507 -9 152,888 -49.1France 1,748,166 1,800,156 -2.9 2,388,038 -26.8
Germany 5,186,727 5,214,114 -0.5 5,783,691 -10.3Hungary 179,905 186,099 -3.3 149,772 20.1
India 9,810,000 9,344,400 5 6,840,500 43.4Italy 1,970,968 1,959,680 0.6 2,638,011 -25.3
Japan 5,538,037 5,342,837 3.7 5,653,798 -2Korea 2,562,000 2,435,800 5.2 2,065,900 24
Mexico 1,651,679** - - 1,827,665 -9.6Norway 59,763 58,375 2.4 113,975 -47.6Pakistan 220,000 271,000 -18.8 - -Poland 1,266,100 1,036,800 22.1 936,600 35.2
Portugal 138,927 146,082 -4.9 119,249 16.5Romania 103,038 115,818 -11 123,946 -16.9Russia 4,100,000 4,300,000** -4.7 7,800,000 -47.4
Slovakia 71,000** - - 45,445 56.2Slovenia 245,571 192,367 27.7 182,404 34.6
South Africa 375,000* - - 368,700 1.7Spain 1,112,045 1,124,684 -1.1 1,359,113 -18.2
Sweden 282,200 283,400 -0.4 368,700 -23.5Switzerland 69,113 69,452 -0.5 106,151 -34.9
Taiwan 1,157,550 1,298,149 -10.8 1,487,010 -22.2Thailand 316,400 - - 304,100 4Turkey 1,543,000 1,445,000 6.8 1,265,080 22
Ukraine 1,365,000 1,532,000 -10.9 974,170 40.1U.K. 483,750 520,300 -7 618,200 -21.7U.S. 12,250,000 11,788,866 3.9 10,783,829 13.6
TOTAL 103,229,774 99,798,587 3.4 93,449,270 10.5 * 2012 Results ** 2011 Results *** 2010 Results
Note: The total production may differ from aggregate of national totals because countries with only one reported year were excluded.
1. China 44,500,000 metric tons Gray iron: 20,550,000 tons
Ductile iron: 11,600,000 tons Steel: 5,500,000 tons Nonferrous: 6,250,000 tons
2. U.S. 12,250,000 metric tons Gray iron: 4,083,000 tons
Ductile iron: 4,251,500 tons Steel: 1,422,850 tons Nonferrous: 2,411,400 tons
3. India 9,810,000 metric tons Gray iron: 6,700,000 tons
Ductile iron: 1,000,000 tons Steel: 1,100,000 tons Nonferrous: 950,000 tons
4. Japan 5,538,037 metric tons Gray iron: 2,135,794 tons
Ductile iron: 1,683,250 tons Steel: 181,679 tons Nonferrous: 1,492,313 tons
5. Germany 5,186,727 metric tons Gray iron: 2,381,462 tons
Ductile iron: 1,541,737 tons Steel: 207,585 tons Nonferrous: 1,025,700 tons
6. Russia 4,100,000 metric tons All iron: 2,800,000 tons
Steel: 700,000 tons Nonferrous: 600,000 tons
7. Brazil 3,071,400 metric tons Gray iron: 1,825,000 tons
Ductile iron: 746,300 tons Steel: 232,500 tons Nonferrous: 576,600 tons
8. Korea 2,562,000 metric tons Gray iron: 1,086,400 tons
Ductile iron: 705,100 tons Steel: 164,100 tons Nonferrous: 600,400 tons
9. Italy 1,970,968 metric tons Gray iron: 689,000 tons
Ductile iron: 387,600 tons Steel: 697,000 tons Nonferrous: 824,668 tons
10. France 1,748,166 metric tons Gray iron: 635,414 tons
Ductile iron: 703,141 tons Steel: 80,688 tons Nonferrous: 328,923 tons