Embed Size (px)
Citation preview

6th SEMESTER B.COM
CALICUT UNIVERSITY
BUSINESS RESEARCH METHODS
2017 ADMISSION
Prepared by
SAFEER PARAYIL,
(Assistant professors)
Department of commerce & management
CPA College of Global of Studies, Puthanathani

BCM5B08 BUSINESS RESEARCH METHODS
Lectures Hours per week: 4, Credit – 4
Internal: 20, External: 80, Examination 2.5 Hours
Objectives:
To enable students for acquiring basic knowledge in business research methods and to
develop basic skills in them to conduct survey researches and case studies.
Module I
Business Research: – Definition and significance - Features of business research – The
research process – Variable - Proposition - Types of research – Exploratory and causal
research –Theoretical and empirical research - Basic and applied research - Descriptive
research - Phases of business research – Research Hypothesis – Characteristics – Research in
an evolutionary perspective – Role of theory in research - Theory building - Induction and
Deduction Theory. (10 Hours, 15 marks)
Module II
Research Design – Definition – Types of research design – Exploratory and causal research
design - Descriptive and experimental design – Types of experimental design – Validity of
findings – Internal and external validity – Variables in research – Measurement and scaling –
Different scales –Construction of instrument - Validity and reliability of instrument
(15 Hours, 15 marks)
Module III
Data Collection: - Types of data – Primary Vs secondary data – Methods of primary data
collection – Survey Vs observation – Experiments – Construction of questionnaire and
instrument – Validation of questionnaire – Sampling plan – Sample size – Sampling methods
- Determinants of optimal sample size – Sampling techniques – Probability Vs non probability sampling methods. (15 Hours, 20 marks)
Module IV
Data Processing: Processing stages - Editing - Coding and data entry – Validity of data –
Qualitative Vs quantitative data analysis – Frequency table - Contingency table - Graphs - Measures
of central tendency and index number – Testing of Hypothesis - Bivariate and multi variate
statistical techniques – Factor analysis – Discriminate analysis- Cluster analysis – Interpretation.
(15 Hours, 20 marks)
Module V
Research Report: Different types – Contents of report – Need of
executive summary – Cauterization – Contents of chapter - Report writing
stages – The role of audience – Readability – Comprehension – Tone – Final proof – Report
format – Title of the report – Ethics in research – Subjectivity and objectivity in research.
(09 Hours, 10 marks)

Reference Books:
1. Donald R.Cooper and Pamela S, Schindler: Business Research Methods.
Latest Edition,
Irwin McGraw- Hill International Editions, New Delhi.
2. John Adams, Hafiz T.A. Khan Robert Raeside, David white: Research Methods
for Graduate Business and Social Science Students, Response Books. New Delhi-
110044.
3. Neresh K. Malhotra: Marketing Research, Latest edition. Pearson Education.
4. William G. Zikmund, Business Research Methods, Thomson
5. Wilkinson T.S. and Bhandarkar P.L.: Methodology and Techniques of Social
Research, Himalaya.
6. S N Murthy &. U Bhojanna: Business Research Methods, Excel Books, New Delhi.
7. Jan Brace: Questionnaire Design, Kogan Page India
8. Michael V.P. Research Methodology in Management, Himalaya.
9. Dipak kumar Bhattacharyya. Research Methodology. Excel Books, New Delhi.
10. R. Paneerselvan: Research Methodology, Prentice-Hall of India
11. Ajai S Gaur & Sanjaya S Gaur: Statistical Methods for Practice &. Research,
Response Books, New Delhi.
12. Kultar Singh: Quantitative Social Research Methods. Response Books, New Delhi.
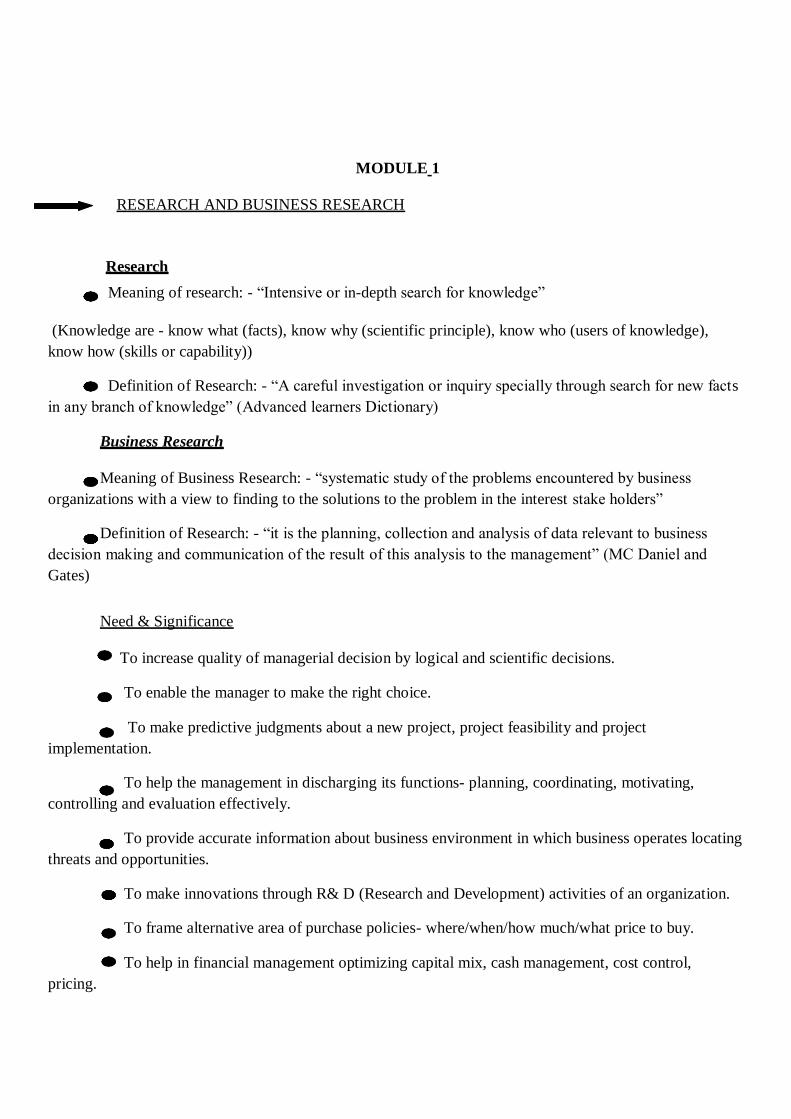
MODULE 1
RESEARCH AND BUSINESS RESEARCH
Research
Meaning of research: - “Intensive or in-depth search for knowledge”
(Knowledge are - know what (facts), know why (scientific principle), know who (users of knowledge),
know how (skills or capability))
Definition of Research: - “A careful investigation or inquiry specially through search for new facts
in any branch of knowledge” (Advanced learners Dictionary)
Business Research
Meaning of Business Research: - “systematic study of the problems encountered by business
organizations with a view to finding to the solutions to the problem in the interest stake holders”
Definition of Research: - “it is the planning, collection and analysis of data relevant to business
decision making and communication of the result of this analysis to the management” (MC Daniel and
Gates)
Need & Significance
To increase quality of managerial decision by logical and scientific decisions.
To enable the manager to make the right choice.
To make predictive judgments about a new project, project feasibility and project
implementation.
To help the management in discharging its functions- planning, coordinating, motivating,
controlling and evaluation effectively.
To provide accurate information about business environment in which business operates locating
threats and opportunities.
To make innovations through R& D (Research and Development) activities of an organization.
To frame alternative area of purchase policies- where/when/how much/what price to buy.
To help in financial management optimizing capital mix, cash management, cost control,
pricing.

To help in human resource area- personnel policies, job design, job analysis etc.
Features
Business research is:
Step/process/stages oriented - collection, analysis and interpretation of data.
Objective oriented
Interdisciplinary- research involves use of tools of different social sciences like psychology,
economics, sociology, mathematics etc.
Extensive use of internet
Demand driven
Flexible
Empowerment of managers.
Use of both primary and secondary data.
Customer oriented –research focuses more on customer and his influence.
Time bound
Systematic – Pre designed steps are adopted for research.
Dynamic - approach of rapid changes.
Types of Business Research (10 types)
(1) Basic research - also called pure research, fundamental research –it is concerned with generalization
and the formulation of theory/theory based/expansion of knowledge/designing and constructing new
theories instead of irrelevant old ones/ it may not have immediate commercial value/foundation for
applied research/
Example: - e= mc2
(2) Applied research – also called practical research, action research-it is the finding solution to the
current problem/need based/high practical relevance/ integrates previous theories/contribute new
theories
Example: - application of e= mc2 in energy formation.
(3) Exploratory research- it is the initial work any investigation by discovering new facts, things, ideas,
and getting insight into unexplored area of a particular topic. /carried out before formulating hypothesis.
Pag
e2
Example: - some initial research or inquiry is conducted by a company before setting up its new outlet
in other area.
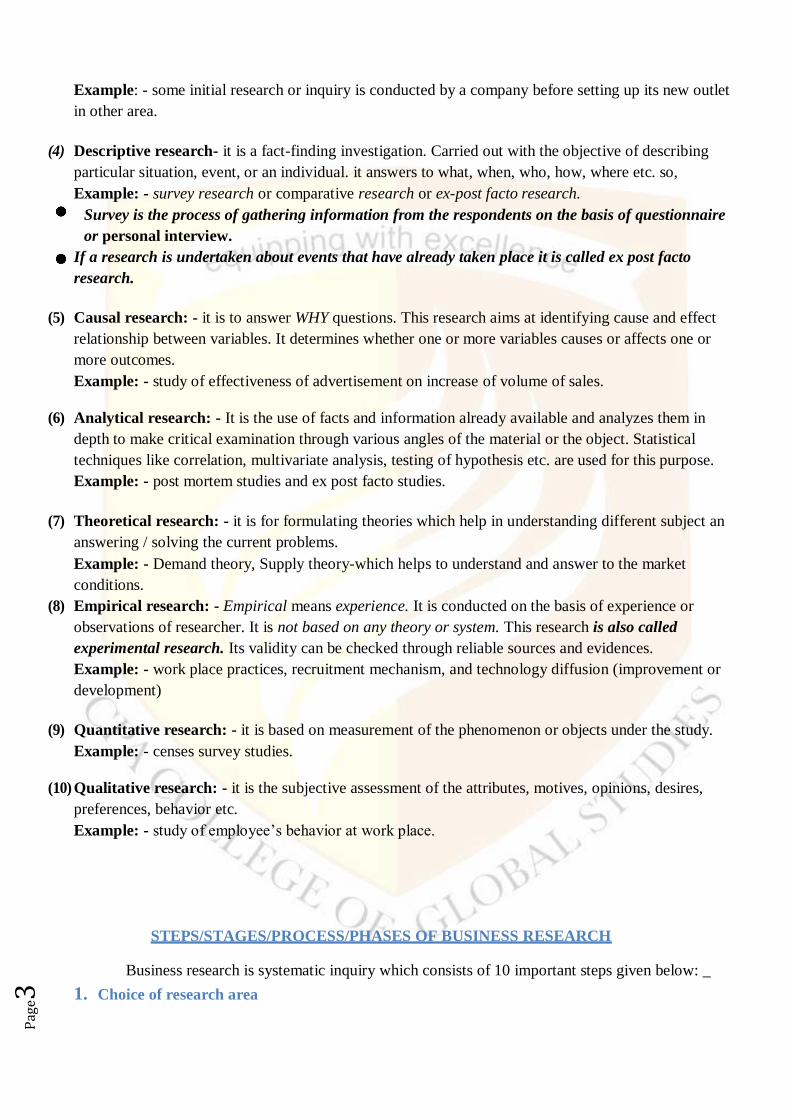
(4) Descriptive research- it is a fact-finding investigation. Carried out with the objective of describing
particular situation, event, or an individual. it answers to what, when, who, how, where etc. so,
Example: - survey research or comparative research or ex-post facto research.
Survey is the process of gathering information from the respondents on the basis of questionnaire
or personal interview.
If a research is undertaken about events that have already taken place it is called ex post facto
research.
(5) Causal research: - it is to answer WHY questions. This research aims at identifying cause and effect
relationship between variables. It determines whether one or more variables causes or affects one or
more outcomes.
Example: - study of effectiveness of advertisement on increase of volume of sales.
(6) Analytical research: - It is the use of facts and information already available and analyzes them in
depth to make critical examination through various angles of the material or the object. Statistical
techniques like correlation, multivariate analysis, testing of hypothesis etc. are used for this purpose.
Example: - post mortem studies and ex post facto studies.
(7) Theoretical research: - it is for formulating theories which help in understanding different subject an
answering / solving the current problems.
Example: - Demand theory, Supply theory-which helps to understand and answer to the market
conditions.
(8) Empirical research: - Empirical means experience. It is conducted on the basis of experience or
observations of researcher. It is not based on any theory or system. This research is also called
experimental research. Its validity can be checked through reliable sources and evidences.
Example: - work place practices, recruitment mechanism, and technology diffusion (improvement or
development)
(9) Quantitative research: - it is based on measurement of the phenomenon or objects under the study.
Example: - censes survey studies.
(10) Qualitative research: - it is the subjective assessment of the attributes, motives, opinions, desires,
preferences, behavior etc.
Example: - study of employee’s behavior at work place.
STEPS/STAGES/PROCESS/PHASES OF BUSINESS RESEARCH
Business research is systematic inquiry which consists of 10 important steps given below: _
1. Choice of research area
Pag
e3

- Researcher must discover exact problem area which demands solution to conduct his research on
it, considering all factors influencing the selection of problem.
2. Review of related literature (RRL)
- Refer all available sources of information and wide literatures relating to the selected problem.
3. Formulation of research question (Problem definition)
- The recognition or existence of a problem motivates research. Unless three is a problem to be
solved, the investigation cannot proceed. So, the PROBLEM sets the goal or direction of
research. Example: - world economic depression due to COVID’19 is a research problem which
demands an inquiry to recover and solve the crisis.
4. Formulation of hypothesis.
- A hypothesis is specific statement of prediction for an observable phenomenon and it is
formulated for empirical testing. Hypothesis is a tentative solution /explanation//a
guess/assumption /statement to the problem facing the researcher. Hypothesis may or may not
real solution or finding to the problem.
Example: - students from IIMs are placed faster than other B schools.
5. Developing research design
- Research design is also known as Research outline, Research plan, and Research blue print. It
is the plan, structure and strategy of the investigation designed to obtain answers to research
questions. The research design contains everything the investigator will do from the beginning to
the end of the research work.
- The research design specifically contains information about-
The sampling design- includes sampling unit, sample size, sampling method.
Data collection design- includes methods of data collection (observation, interview, and
questionnaire)
Instrument design- design of data collection tools like questionnaire, schedule, attitude scale
etc.
6. Collection of data –
After designing blue print, data are collected on the basis of this design by using different data
collection methods.
7. Data processing and analysis.
- Data processing is done with editing, coding, classifying and tabulating the data.
- Analysis of tabulated data is done using statistical techniques like averages (mean, median,
mode), percentages, trend analysis, correlation and regression techniques.
- Testing of hypothesis is also done in this stage.
8. Interpretation of data.
- It is done with the intention of seeking explanation for the research result on the basis of existing
theories.
9. Formulating conclusions and preparing the report.
- Prepare here research report for presenting before interested parties.
10. Replicate or copy the study for generalizations.
Generalization is made to build a new theory. Such generalization come up with better explanation
and new theories for existing phenomenon
Pag
e4

PROBLEM DEFINITION
Existence or recognition of problem motivates research, without a problem research cannot be
preceded. A well-defined problem will yield fruitful result.
A Problem is defined “some difficulty experienced by the researcher in the theoretical or practical
situation. Solving this difficulty is the task of research.”
The Problem is expressed in interrogative form (question form) eg:- why BCom degree course
more popular than other UG courses?
STEPS OF PROBLEM DEFINITION
Six steps: -
1. Ascertain the research -consumer’s objective.
(Research- consumer is the researcher or group of researchers who have something to know or
achieve)
2. Understand the background of the problem.
(Find out the very root of the problem from who raised it first)
3. Isolate and identity the problem.
(It is the narrowing down the problem to the specific research questions, like distinguishing Wheat
from Chaff)
4. Determine the unit of analysis
(Units are the samples from whom data are collected)
5. Determine the relevant/key variable relating to the problem
(Variables should clearly be identified and narrated to suit the techniques of research)
6. State the research objective
(It is the steps of formulation of research objective. Once the objective is stated, the entire
research activity will be geared to achieving those objectives.
IMPORTANT TERMS USED IN BUSINESS RESEARCH: -
VARIABLES (Dictionary meaning-changing or changeable)
A variable is anything that can change in its quantity or value.
Variable is an attribute on which thing vary or change.
Example: - sales, profits, etc.
CONSTANTS (Dictionary meaning fixed or not changeable)
A Constant is anything that cannot change in its quantity or value.
Example: - phone number, names of things and individual
ATTRIBUTES
An attribute is a specific value on a variable.
Pag
e5

Example: - 1. The attribute of variable GENDER is MALE or FEMALE.
2. The attributes of variable AGREEMENT is SA (strongly agree)/A/ NEUTRAL/D/SD.
PROPOSITIONS
Propositions serve to bring together the concept of the theory.
HYPOTHESIS
A hypothesis is specific statement of prediction for an observable phenomenon and it is formulated
for empirical testing. Hypothesis is a tentative solution /explanation//a guess/assumption /statement to the
problem facing the researcher. Hypothesis may or may not real solution or finding to the problem.
Example: - students from IIMs are placed faster than other B schools.
THEORY
It is an explanation of observed regularity which satisfies the logic of performance.
TYPES OF VARIABLES
1. DEPENDENT VARIABLES- It is cause or influencing variable.
2. INDEPENDENT VARIABLES –It is effect or influenced variable.
Example: -
Increase in poverty leads to Increase in crimes- here the variable increase in poverty is
Independent variable and increase in the crime is dependent variable.
3. INTERVANING VARIABLES- it is a positive and associating variable between dependent
and independent variable. Example; market orientation and organizational performance are
dependent and independent variables respectively, but Employees attitude accelerates high
the performance.
4. MODERATING VARIABLES- it is altering or modifying variable the relationship of
dependent and independent variables. Example; increase in daily wage and increase in
consumption of liquor are dependent and independent variables respectively. but it modifies
gender variable i.e.; only this case is only in the MEN.
RESEARCH IN EVOLUTI0NARY PERSPECTIVE
The term Evolution means Unfolding. It narrates how things changes. The research roles for these
changes.
Research outcome /knowledge is acquired through four ways –
1. Direct understanding (observation)
Pag
e6

2. Though sounds
3. Hypothetical understanding (assumptions)
4. Historical understanding.
All of these opens versatile horizons of research explorations.
ROLE OF THEORY IN
RESEARCH THEORY
- It is an explanation of observed regularity which satisfies the logic of performance.
Research and theory dependent each other- “any curiosity” leads to enquiry of “cause and
effect relationship” which leads to “theory”. It stands for the test of research.
THEORY BUILDING
- Any statement cannot be accepted without empirical or logical verification.
- After the analysis of the data (empirical verification), we have to draw broad conclusions
and generalizations. This process is known as theory building. It is inductive in nature.
INDUCTIVE APPROACH and DEDUCTIVE APPROACH
INDUCTIVE APPROACH
- It is the process of reasoning whereby we arrive from PARTICULAR facts at GENERALISATION
- I.e.; from particular observations or instances to a general rule or principle/theory.
- Example: - It is observed that “a number of cases that when price increases, less is purchased”, so
we reach in a conclusion or generalization of DEMAND THEORY that “when Price increases
Demand decreases”.
DEDUCTIVE APPROACH
- It is the process of reasoning whereby we arrive from GENERALISATION at PARTICULAR facts.
- Ie; from a general rule or principle/theory to particular observations or instances
Pag
e7
Theory Confirmation Observations Hypothes

MODULE 2
RESEARCH DESIGN-MEANING AND DEFINITION
Research design is a plan, structure and strategy of investigation proposed to be undertaken.
Pauline v Young defines – “it is the logical and systematic planning and directing piece of research.
It consist of making a series decisions with respect to what, why, where, when, who, how of the
research.
Research Design is also known as outline, research plan, research blue print
RESEARCH DESIGN-FEATURES
1. Research project’s blue print.
2. Frame work for data collection and analysis.
3. Plan of action of research work- from inception to preparation of research report.
4. Outline and scheme of the operation of variables
5. Strategy of collecting and analyzing the data.
6. Estimate of research project-time and cost
RESEARCH DESIGN- NEED
1. As a blue print for research study
2. Enables to channel energies in a specific
3. Stops unnecessary directions and tangents.
4. Answer to various research questions
COMPONENTS OF RESEARCH DESIGN
1. Need for the study
2. Literature review
3. Statement of the problem
4. Research objectives
5. Formulation of hypothesis
6. Operational definitions
7. Scope of the study
8. Sources of the data
9. Methods of data collection
10. Tools and techniques of data collection
11. Sampling design
12. Data analysis
13. Presentation of the result of the study
14. Time estimates

15. Financial budgets
16. Administration of the enquiry
TYPES OF RESEARCH DESIGN
Three types:-
1. Exploratory Research Design- It is the plans or blue print to conduct exploratory
research. Exploratory research means discovery of new facts, things, forms or ideas.
2. Descriptive Research Design- This design is for describing what is going on or what exist
about the problem. Here researcher suggests solutions to the problems, and the data can be
used for predictions about various phenomenon.
3. Causal Research Design- It is designed to looks at cause and effect relationship. It is
designed to determine whether one or more variables causes or effects one or more
outcome variables.
EXPLORATORY RESEARCH –MEANING
Exploratory research means discovery of new facts, things, forms or ideas.
EXPLORATORY RESEARCH –FEATURES
1. Flexible
2. No use structured form for data collection
3. No experimentation
4. Low cost
5. Wide exploration of views
6. Interactive and open ended.
7. Theoretical base to a hypothesis.
EXPLORATORY RESEARCH –METHODS
Four methods:-
1. Experience survey method- here the experiences of people in a particular
field, are studied by establishing rapport with them.
2. Secondary data analysis- already published or unpublished data, literatures are studied.
Secondary data may be :-

1. Internal (data within the organization itself)
2. External (data from outside secondary sources)
1. Case study – It is a thorough investigative study of all the aspects relating to a
situation, an event, happening, an organization, a system, a cultural entity or a
community.
Case histories, insight or in-depth studies are conducted in the case study.
2. Pilot study by focus group interview- It is interview with several people or groups
on a specific topic. There will be a facilitator/moderator, and members of the group
CASE STUDY METHOD
It is a thorough investigative study of all the aspects relating to a situation, an event,
happening, an Organization, a system, a cultural entity or a community.
Case histories, insight or in-depth studies are conducted in the case study
CASE STUDY METHOD- FEATURES
1. Study of a social unit in its entirety.
2. Contact with specific field
3. The subject of the study is recognized as a unit
4. Time consuming
5. Study of insight stimulating examples
CASE STUDY- SOURCES
1. Personal documents
2. Life history
3. Additional sources – books, magazines, literature and previous studies,
government documents, communications.
PILOT STUDY BY FOCUS GROUP
It is interview with several people or groups on a specific topic. There will be a
Facilitator/moderator, and members of the group

PILOT STUDY BY FOCUS GROUP- FEATURES
1. Form of group interview
2. Moderator will guide the session
3. There will be several participants.
4. Emphasizes on specific theme or topic for in depth study.
5. Participants are interviewed in an unstructured way.
HOW TO CONDUCT PILOT STUDY BY FOCUS GROUP – BEGINNING STEPS
1. Tape recording and transcription.
2. Decide the number of groups to be contacted
3. Decide the size of group ( number of members in each group)
4. Decide the level of moderator involvement
5. Select participants.
6. Asking questions
TYPES/CLASSES OF FOCUS GROUP
1. Two way focus group- under this , one group will listen ,other group will
react
2. Dual moderator group- one moderator conduct the discussion smoothly,
another asks specific questions.
3. Dueling moderator focus group – two moderator stand on against sides , to
discuss pros and cons
4. Respondent moderator groups – moderator select one participant as
temporary moderator.
DESCRIPTIVE RESEARCH DESIGN
This design is for describing what is going on or what exist about the problem. Here
researcher suggests solutions to the problems, and the data can beused for predictions
about various phenomenon.
DESCRIPTIVE RESEARCH DESIGN –STEPS
1. Formulating research questions
2. Selecting relevant sites and subjects
3. Collection of relevant data
4. Interpretation of data
5. Writing up findings/ conclusions
CAUSAL RESEARCH DESIGN/EXPERIMENTAL RESEARCH DESIGN
It is designed to looks at cause and effect relationship. It is designed to determine
whether one or more variables causes or effects one or more outcome variables.
COMPONENTS OF CAUSAL RESEARCH DESIGN
1. The research problem
2. The research question
3. The program(cause)
4. The units
5. The outcomes (effect)
6. The design
EXPERIMENTAL METHOD
It is based on experiments
It is observing the effect on a dependent variable of the
manipulation of an independent variable.
EXPERIMENTAL METHOD – FEATURES
1. Isolation of factors or controlled observations
2. It can be repeated under similar conditions(replicated one)
3. Quantitative measurement of results.
4. Cause and effect relationship determination precisely

MODULE 3
Data Collection:
Data collection is the process of gathering and measuring information on targeted variables in an
established system, which then enables one to answer relevant questions and evaluate outcomes
Types of Data:
1. Primary data
2. Secondary data
Primary Data.
Primary data is data that is collected by a researcher from first-hand sources, using methods like surveys, interviews, or experiments.
Secondary Data:
Secondary data refers to data that is collected by someone other than the user. Common sources of
secondary data for social science include censuses, information collected by government departments,
organizational records and data that was originally collected for other research purposes
Documentary Source
Sometimes described as life stories because they are the accounts of the lives of individuals, families, or
other social groups. They include diaries, letters, memoirs, photographs, even shopping lists and random
jottings
Classification
1. Individual document
2. Public document
Individual Document
1. Life history
2. Diary
3. Letters
4. Memories
Public Document
1. Published records
2. News papers
3. Journals and magazines
4. Public records and statistics

5. Historical document
Merits of secondary data
1. Saving of time
2. Accessibility
3. Saving of money
Quantitative methods
Quantitative methods emphasize objective measurements and the statistical, mathematical, or numerical
analysis of data collected through polls, questionnaires, and surveys, or by manipulating pre-existing
statistical data using computational techniques
Qualitative methods
Qualitative research relies on unstructured and non-numerical data. The data include field notes written by
the researcher during the course of his or her observation, interviews and questionnaires
Methods of collecting primary data
1. Observation
2. Experimentation
3. Simulation
4. Interview
5. Use of telephone
6. Panel method
7. Mail survey
8. Projective techniques
9. Sociometry
10. Focus group discussion
11. Content analysis
Observation
Observation is the active acquisition of information from a primary source. In living beings, observation
employs the senses. In science, observation can also involve the perception and recording of data via the
use of scientific instruments
Survey
A survey is a list of questions aimed at extracting specific data from a particular group of people.
Surveys may be conducted by phone, mail, via the internet, and sometimes face-to-face on busy street
corners or in malls
1. Cross sectional survey
Collects data to make inferences about a population of interest (universe) at one point in time
2. Longitudinal survey
A longitudinal study is a research design that involves repeated observations of the same variables
over short or long periods of time
Methods of survey
1. Census method
2. Sample method

Census method
A statistical investigation in which the data are collected for each and every element/unit of the population
Sample survey
A sample survey is conducted to determine attitudes of individuals in a population toward a particular
subject.
Mail survey
Mail surveys are a quantitative marketing research data collection method in which respondent’s complete
questionnaires on paper and return them via the mail
Experimental methods
An independent variable is manipulated and the dependent variable is measured; any extraneous variables are controlled. An advantage is that experiments should be objective
Interview
An interview is essentially a structured conversation where one participant asks question and the other
provides answers
Process of interview
1. Preparation
2. Introduction
3. Developing relationship
4. Carrying the interview
5. Recording the interview
6. Closing the interview
Preparation
Some preplanning and preparation is required to carry on an interview
Introduction
As the respondents are concerned interviewer is stranger. So he will be properly introduced to the
respondents
Developing relationship
Before starting the interview a good relationship to be developed with the respondents
Carrying the interview
After establishing a friendly relationship questions are asked from the interview schedule
Recording the interview
Noting of information should be done in the schedule under respective question. Tap records can be used

to note the respondent
Closing the interview
After the interview close the interview by saying thanks with a smile to respondent
Types of interview
The Telephone Interview Often companies request an initial telephone interview before inviting you in
for a face to face meeting in order to get a better understanding of the type of candidate you are.
The Face-to-Face Interview This can be a meeting between you and one member of staff or even two
members.
The Panel Interview These interviews involve a number of people sitting as a panel with one as
chairperson. This type of interview is popular within the public sector.
The Group Interview Several candidates are present at this type of interview. You will be asked to
interact with each other by usually a group discussion. You might even be given a task to do as a team, so
make sure you speak up and give your opinion.
The Sequential Interview These are several interviews in turn with a different interviewer each time.
Usually, each interviewer asks questions to test different sets of competencies. However, if you are asked
the same questions, just make sure you answer each one as fully as the previous time.
The Lunch / Dinner Interview This type of interview gives the employer a chance to assess your
communication and interpersonal skills as well as your table manners.
Competency Based Interviews These are structured to reflect the competencies the employer is seeking
for the particular job.
Formal / Informal Interviews Some interviews may be very formal; others may be very informal and
seem like just a chat about your interests. However, it is important to remember that you are still being
assessed, and topics should be friendly and clean!
Portfolio Based Interviews In the design / digital or communications industry it is likely that you will be
asked to take your portfolio along or show it online..
Questionnaire: A questionnaire is a research instrument consisting of a series of questions for the
purpose of gathering information from respondents
Questionnaire Design Process
1. Specify the Information Needed: The first and the foremost step in designing the questionnaire is to

specify the information needed from the respondents such that the objective of the survey is fulfilled. The
researcher must completely review the components of the problem, particularly the hypothesis, research
questions, and the information needed.
2. Define the Target Respondent: At the very outset, the researcher must identify the target respondent
from whom the information is to be collected. The questions must be designed keeping in mind the type
of respondents under study.
3. Specify the type of Interviewing Method: The next step is to identify the way in which the respondents
are reached. In personal interviews, the respondent is presented with a questionnaire and interacts face-to-
face with the interviewer.
4. Determine the Content of Individual Questions: Once the information needed is specified and the
interviewing methods are determined, the next step is to decide the content of the question. The researcher
must decide on what should be included in the question such that it contributes to the information needed
or serve some specific purpose.
5. Overcome Respondent’s Inability and Unwillingness to Answer: The researcher should not presume
that the respondent can provide accurate responses to all the questions. He must attempt to overcome the
respondent’s inability to answer.
6. Decide on the Question Structure: The researcher must decide on the structure of questions to be
included in the questionnaire. The question can be structured or unstructured.
7. Determine the Question Wording: The desired question content and structure must be translated
into words which are easily understood by the respondents.
8. Determine the Order of Questions: At this step, the researcher must decide the sequence in which the
questions are to be asked. The opening questions are crucial in establishing respondent’s involvement
and rapport, and therefore, these questions must be interesting, non-threatening and easy.
9. Identify the Form and Layout: The format, positioning and spacing of questions has a significant effect
on the results. The layout of a questionnaire is specifically important for the self-administered
questionnaires.

10. Reproduction of Questionnaire: Here, we talk about the appearance of the questionnaire, i.e. the quality
of paper on which the questionnaire is either written or printed.
11. Pretesting: Pretesting means tests the questionnaires on a few selected respondents or a small sample of
actual respondents with a purpose of improving the questionnaire by identifying and eliminating the
potential problems.
Thus, the questionnaire design is a multistage process that requires the researcher’s attention to many
details.
Sample Design
A sampling design specifies for every possible sample its probability of being drawn
Steps in Sample Design
1. Define the population
2. State the sampling frame
3. Identify the sampling unit
4. State sampling methods
5. Determine the sample size
6. Spell out the sampling plan
7. Select the sample
Types of Sampling
1. Stratified sampling
2. Cluster sampling
3. Multi stages cluster sampling
MODULE 4
DATA PROCESSING
Data processing is a set of methods that are used to input, retrieve, verify, store, organize, analyze or interpret a set of data. Data processing enables information to be automatically extracted from data
PROCESSING STAGES
1. Editing
2. Coding
3. Classification
4. Tabulation
EDITING
Data editing is defined as the process involving the review and adjustment of collected survey data. The
purpose is to control the quality of the collected data. Data editing can be performed manually, with the
assistance of a computer or a combination of both
CODING
Data coding is the process of driving codes from the observed data. In qualitative research the data is either obtained from observations, interviews or from questionnaires. The purpose of data coding is to bring out the
essence and meaning of the data that respondents have provided
CLASSIFICATION
Data classification is the process of sorting and categorizing data into various types, forms or any other
distinct class. Data classification enables the separation and classification of data according to data set
requirements for various business or personal objectives
TYPES OF CLASSIFICATION
1. Qualitative classification (on the basis some attribute)
2. Geographical classification (on the basis of area)
3. Chronological classification (on the basis of time )
4. Quantitative classification (on the basis of quantity)
CLASSIFICATION ACCORDING TO CLASS INTERVAL
1. Exclusive type class intervals
When the lower limit is included, but the upper limit is excluded, then it is an exclusive class interval
Example

100-200
200-300
300-400
400-500
500-600.
2. Inclusive type class intervals
When the lower and the upper class limit is included, then it is an inclusive class interval
Example
101-200
201-300
301-400
401-500
501-600
601-700
TABULATION
Tabulation is a systematic & logical presentation of numeric data in rows and columns to facilitate
comparison and statistical analysis
OBJECTIVE OF TABULATION
1. To Simplify the Complex Data
2. To Bring Out Essential Features of the Data
3. To Facilitate Comparison
4. To Facilitate Statistical Analysis
5. Saving of Space
DATA ENTRY
Data entry is the process of transcribing information into an electronic medium such as a computer or
other electronic device. It can either be performed manually or automatically by using a machine or
computer
QUANTITATIVE RESEARCH
Quantitative research is the process of collecting and analyzing numerical data. It can be used to find patterns
and averages, make predictions, test causal relationships, and generalize results to wider populations

QUALITATIVE RESEARCH
Qualitative research involves collecting and analyzing non-numerical data
APPROACHES TO QUALITATIVE ANALYSIS
1. Deductive approach
2. Inductive approach
DEDUCTIVE APPROACH
A deductive approach is concerned with “developing a hypothesis (or hypotheses) based on existing theory
INDUCTIVE APPROACH
“Involves the search for pattern from observation and the development of explanations – theories
COMMON DESCRIPTIVE TECHNIQUES
1. Percentages
2. Measure of central tendency
3. Index numbers
PERCENTAGES
A percentage is a way of expressing a number as a fraction of 100
FREQUENCY TABLE
A frequency table is a method of organizing raw data in a compact form by displaying a series of scores in
ascending or descending order
Types of graph
1. Charts or line graphs
2. Bar charts
3. Circle charts
4. Pictograms

CHARTS OR LINE GRAPHS
A line graph (also known as a line plot or line chart) is a graph which uses lines to connect individual data
points that display quantitative values over a specified time interval
HISTOGRAM
A histogram is a graphical display of data using bars of different heights

BAR CHART
A bar chart or bar graph is a chart or graph that presents categorical data with rectangular bars with heights or
lengths proportional to the values that they represent.
PIE CHART
A pie chart (or a circle chart) is a circular statistical graphic, which is divided into slices to illustrate numerical proportion
LORENZ CURVE
A Lorenz curve is a graphical representation of income inequality or wealth inequality developed by
American economist Max Lorenz in 1905. The graph plots percentiles of the population on the horizontal axis according to income or wealth

OGIVE CURVE
The Ogive is a graph of a cumulative distribution, which explains data values on the horizontal plane axis
and either the cumulative relative frequencies,
PICTOGRAMS
A pictogram is a chart that uses pictures to represent data. Pictograms are set out in the same way as bar
charts, but instead of bars they use columns of pictures to show the numbers involved.
ANALYSIS AND INTERPRETATION OF DATA
1. Descriptive analysis
2. Inferential analysis
Descriptive analysis
A descriptive statistic is a summary statistic that quantitatively describes or summarizes features from a
collection of information, while descriptive statistics is the process of using and analysing those statistics

Inferential analysis
It is concerned with testing of hypothesis and significance. it is also related with estimation of unknown
population parameters
MEASURE OF CENTRAL TENDENCY
1. Mean
2. Median
3. Mode
4. Geometric mean
5. Harmonic mean
MEAN
It is the sum of a collection of numbers divided by the count of numbers in the collection
MEDIAN
The median is the middle number in a sorted, ascending or descending, list of numbers and can be more
descriptive of that data set than the average
MODE
The number which appears most often in a set of numbers
GEOMETRIC MEAN
the geometric mean is a mean or average, which indicates the central tendency or typical value of a set of
numbers by using the product of their values
HARMONIC MEAN
it is the reciprocal of values of various items in the variable
RANGE
The Range is the difference between the lowest and highest values.
Mean deviation
HYPOTHESIS
It is an assumption or some assumption to be proved or disapproved
Examples
The mean height of students is 65 inches
Characteristics of hypothesis
The hypothesis should be clear and precise to consider it to be reliable.
If the hypothesis is a relational hypothesis, then it should be stating the relationship between
variables.
The hypothesis must be specific and should have scope for conducting more tests.
The way of explanation of the hypothesis must be very simple and it should also be understood
that the simplicity of the hypothesis is not related to its significance.
Types of hypothesis
Simple hypothesis
Complex hypothesis
Directional hypothesis
Non-directional hypothesis
Null hypothesis
Associative and casual hypothesis
DATA INTERPRETATION
Data interpretation is the process of reviewing data through some predefined processes which will help
assign some meaning to the data and arrive at a relevant conclusion. It involves taking the result
of data analysis

MODULE 5
Research Report
Research reports are recorded data prepared by researchers or statisticians after analyzing
information gathered by conducting organized research, typically in the form of surveys or
qualitative methods.
Types Of Report
1. Oral report
2. The written report
3. Technical report
Format Of a Research Report

1. Letter of Transmittal
The letter of transmittal introduces the reader to the report and includes acknowledgements
normally not mentioned in the report itself. Your instructor may request that this letter include
other material, such as information concerning the distribution of report copies, and the level
of effort by team members.
2. Front Matter
The front matter includes a title page, a table of contents, a list of tables, and a list of figures.
3. Abstract
The abstract is a condensation of the subject matter. It gives a quantitative summary of your
procedure, results, and conclusions. In the Research Report, the abstract gives numerical values
for important variables and results.
4. Introduction
The introduction to the research report prepares readers by summarizing the following aspects
of the project:
Purpose or Objective: What were you trying to achieve?
The introduction includes a clear statement of the problem or the question addressed by the
research.
Justification: Why was this project undertaken?
Research is conducted in response to a need. The introduction explains that need and the significance
of the report’s findings.
History: What work has been done in the past that relates to this project?
The introduction gives context to the research by citing previous work in the field. That previous
work may include theories, definitions, procedures, results, and conclusions. All references are cited.
Scope and Limitations: How do you define and justify the scope?
Strong introductions shape or qualify their readers’ expectations by explaining what the
research covers, and what it does not cover. The discussion of the scope may overlap with that
of the history, so that readers can understand how this work builds on or challenges another
research.
Overview: What is your approach to the problem?
Introductions often conclude with a brief outline of the approach.

5. Theory
The theory section answers the questions: What are the theoretical foundations of the
experiment? What trends did you expect from the experiment based on that theory?
This section sets out the theory supporting the experiment and discusses the expected trends
based on previous work, which is correctly cited. It prepares readers for the Results section
below by showing the equations used to analyze the results.
6. Apparatus
The apparatus section answers the questions: What equipment/materials/instruments were
used? Did the authors make modifications or contribute any new designs? If so, what were
they?
This section should enable another researcher to reconstruct the experimental apparatus. The text
briefly describes the apparatus, identifies the important details of that apparatus, and shows how
the apparatus was set up. The text refers to drawings or schematics which include critical
dimensions. Modifications in both apparatus and setup are noted.
7. Procedure
The procedure section answers the questions: What tests were run? How were data
collected? What were the critical or difficult procedures?
This section describes the experimental procedure in sufficient detail so that another researcher could
duplicate the experiment. The text focuses on the most critical or difficult steps. Detailed procedures,
if needed, are enumerated and placed in the appendix.
8. Results
The results section answers the questions: What data were collected? How were the data
analyzed? What conclusions were drawn from the analysis?
The results section is a discussion that links your data analysis to your conclusions. It develops
conclusions with reference to the figures, graphs, and tables of your analysis. This section should
be organized with the most significant results first, followed by less important results. Relevant
errors in measurement are also discussed.
Note that the depth and detail of this section will vary according to your experiment and your
instructor’s preferences.
9. Conclusions/Recommendations
The conclusions and recommendations section answers the questions: What were the most
important conclusions developed from in the Results? What recommendations do you give,
based on those conclusions?
The results section has already stated the conclusions, but they are buried in the
discussion. This final section re-presents them so they are accessible to readers.
The recommendations give an outline of actions that should be taken as a result of the conclusions.
These recommendations should be a direct result of the experimental work. They should also be
supported by the Results discussion. This section does not introduce new material.

10. Appendices
The appendices of the Research Report generally include the following items:
o · Figures and graphs not discussed in the body of the report. These are presented in the sequence
in which they are mentioned in the report, but they should be numbered according to their actual order in the report.
o · Tabular results. These should also be presented in sequence.
o · Lengthy theoretical arguments, if any
o · Appropriate calibration curves if any
o · Raw data in tabular form
o · Sample calculations, with units
o · A discussion of safety considerations, including hazards associated with the experiment.
o · Other assignments specified by your instructor.
Report Writing Stages
Stage One: Understanding the report brief
This first stage is the most important. You need to be confident that you understand the purpose of
your report as described in your report brief or instructions. Consider who the report is for and
why it is being written. Check that you understand all the instructions or requirements, and ask
your tutor if anything is unclear.
Stage Two: Gathering and selecting information
Once you are clear about the purpose of your report, you need to begin to gather relevant
information. Your information may come from a variety of sources, but how much information
you will need will depend on how much detail is required in the report. You may want to begin
by reading relevant literature to widen your understanding of the topic or issue before you go on
to look at other forms of information such as questionnaires, surveys etc. As you read and gather
information you need to assess its relevance to your report and select accordingly. Keep
referring to your report brief to help you decide what relevant information is.

Stage Three: Organizing your material
Once you have gathered information you need to decide what will be included and in what
sequence it should be presented. Begin by grouping together points that are related. These may
form sections or chapters. Remember to keep referring to the report brief and be prepared to cut
any information that is not directly relevant to the report. Choose an order for your material that is
logical and easy to follow.
Stage Four: Analyzing your material
Before you begin to write your first draft of the report, take time to consider and make notes on the
points you will make using the facts and evidence you have gathered. What conclusions can be
drawn from the material? What are the limitations or flaws in the evidence? Do certain pieces of
evidence conflict with one another? It is not enough to simply present the information you have
gathered; you must relate it to the problem or issue described in the report brief.
Stage Five: Writing the report
Having organized your material into appropriate sections and headings you can begin to write the
first draft of your report. You may find it easier to write the summary and contents page at the end
when you know exactly what will be included. Aim for a writing style that is direct and precise.
Avoid waffle and make your points clearly and concisely. Chapters, sections and even individual
paragraphs should be written with a clear structure. The structure described below can be adapted
and applied to chapters, sections and even paragraphs.
Introduce the main idea of the chapter/section/paragraph
Explain and expand the idea, defining any key terms.
Present relevant evidence to support your point(s).
Comment on each piece of evidence showing how it relates to your point(s).
Conclude your chapter/section/paragraph by either showing its significance to
the report as a whole or making a link to the next chapter/section/paragraph.

35
Stage Six: Reviewing and redrafting
Ideally, you should leave time to take a break before you review your first draft. Be
prepared to rearrange or rewrite sections in the light of your review. Try to read the draft
from the perspective of the reader. Is it easy to follow with a clear structure that makes
sense? Are the points concisely but clearly explained and supported by relevant evidence?
Writing on a word processor makes it easier to rewrite and rearrange sections or
paragraphs in your first draft. If you write your first draft by hand, try writing each section
on a separate piece of paper to make redrafting easier.
Stage Seven: Presentation
Once you are satisfied with the content and structure of your redrafted report, you can turn
your attention to the presentation. Check that the wording of each
chapter/section/subheading is clear and accurate. Check that you have adhered to the
instructions in your report brief regarding format and presentation. Check for consistency
in numbering of chapters, sections and appendices. Make sure that all your sources are
acknowledged and correctly referenced. You will need to proof read your report for errors
of spelling or grammar. If time allows, proof read more than once. Errors in presentation or
expression create a poor impression and can make the report difficult to read.
Objectivity is personal neutrality; it allows the facts to speak for themselves and not be
influenced by the personal values and biases of the researcher
Subjectivity is judgment based on individual personal impressions and feelings and
opinions rather than external facts