Embed Size (px)
Citation preview
The Journal of Clinical Investigation R e s e a R c h a R t i c l e
5 4 2 4 jci.org Volume 124 Number 12 December 2014
IntroductionType 2 diabetes mellitus (T2DM) is rising in incidence worldwide and constitutes a major public health burden (1). T2DM is charac-terized by hyperglycemia and is caused by progressive peripheral insulin resistance and deficient insulin secretion from pancreatic β cells. Adipose tissue macrophages (ATMs) are considered crucial players that link obesity with insulin resistance and T2DM (2, 3). This is underscored by the fact that proinflammatory cytokines secreted from ATMs induce insulin resistance by a number of dif-ferent mechanisms (4, 5). In line with these observations, several studies that target ATMs to attenuate the secretion of proinflam-matory cytokines have shown beneficial effects with respect to insulin resistance (6, 7). Over the last years, several G protein–coupled receptors (GPCRs) have emerged as critical regulators of ATM function (8–14), rendering them highly attractive as targets for drug development.
G protein–coupled bile acid receptor 1 (GPBAR1; also known as GPR131, and referred to herein as TGR5) is a bile acid–respon-sive (BA-responsive) GPCR that, upon activation, triggers cAMP-mediated downstream signaling. TGR5 is widely distributed and coordinates a large spectrum of biological processes, including bile homeostasis (15–19), gallbladder relaxation (20, 21), intestinal motility (22–24), and BA-induced itch and analgesia (25). Emerg-ing evidence indicates that activation of the receptor confers protection against diet-induced diabesity via different cell-based mechanisms. TGR5 improves energy metabolism and glucose homeostasis via processes involving local thyroid hormone activa-
tion and glucagon-like peptide–1 (GLP-1) secretion (26, 27). The contribution of TGR5 in GLP-1–induced insulin secretion is fur-ther underscored by the finding that BA sequestrants boost GLP-1 secretion in a TGR5-dependent manner (28, 29). Enhanced TGR5 signaling is also associated with reduced liver steatosis (26) and improved pancreatic β cell function (26, 30).
TGR5 is also expressed in cells of the hematopoietic system, such as monocytes and macrophages, and confers potent antiin-flammatory properties in vitro and in vivo (31–36). Recent work from our laboratory revealed that the immune-suppressive actions of TGR5 in macrophages contribute to the prevention of the athero-sclerotic process (34). Because chronic, low-grade inflammation is a hallmark not only of atherosclerosis, but also of obesity and T2DM, we speculated that the immune-regulatory functions of TGR5 may also affect some of the metabolic abnormalities acquired during the onset of obesity and obesity-induced insulin resistance.
In the current study, we investigated the properties of mac-rophage TGR5 in the context of adipose tissue inflammation and associated diabesity. We found that Tgr5-deficient bone marrow chimeric mice (referred to herein as Tgr5bm–/– mice) and myeloid cell–specific Tgr5-knockout mice (LysM-Cre Tgr5fl/fl mice) with diet-induced obesity developed insulin resistance along with exacerbated inflammation in adipose tissue. Using these genet-ic models, we demonstrated that deletion of TGR5 in macro-phages was associated with increased chemokine expression and migration, which was partly caused by impaired activation of AKT–mTOR complex 1 (AKT-mTORC1) and translation of the liver inhibitory protein (LIP) isoform of the transcription factor CCAAT/enhancer binding protein β (C/EBPβ). The unanticipated link between TGR5 and the AKT-mTOR-LIP axis highlights a new mechanism in macrophages that contributes to the antidiabetic effects of TGR5 activators.
The bile acid–responsive G protein–coupled receptor TGR5 is involved in several metabolic processes, and recent studies suggest that TGR5 activation may promote pathways that are protective against diet-induced diabetes. Here, we investigated the role of macrophage-specific TGR5 signaling in protecting adipose tissue from inflammation and associated insulin resistance. Examination of adipose tissue from obese mice lacking macrophage Tgr5 revealed enhanced inflammation, increased chemokine expression, and higher macrophage numbers compared with control obese animals. Moreover, macrophage-specific deletion of Tgr5 exacerbated insulin resistance in obese animals. Conversely, pharmacological activation of TGR5 markedly decreased LPS-induced chemokine expression in primary macrophages. This reduction was mediated by AKT-dependent activation of mTOR complex 1, which in turn induced the differential translation of the dominant-negative C/EBPβ isoform, liver inhibitory protein (LIP). Overall, these studies reveal a signaling pathway downstream of TGR5 that modulates chemokine expression in response to high-fat diet and suggest that targeting this pathway has the potential to be therapeutically exploited for prevention of chronic inflammatory diseases and type 2 diabetes mellitus.
TGR5 reduces macrophage migration through mTOR-induced C/EBPβ differential translationAlessia Perino,1 Thijs Willem Hendrik Pols,1,2 Mitsunori Nomura,1 Sokrates Stein,1 Roberto Pellicciari,3 and Kristina Schoonjans1
1Metabolic Signaling, Institute of Bioengineering, School of Life Sciences, Ecole Polytechnique Fédérale de Lausanne, Lausanne, Switzerland. 2Department of Medical Biochemistry,
Academic Medical Center, University of Amsterdam, Amsterdam, The Netherlands. 3Dipartimento di Chimica e Tecnologia del Farmaco, University of Perugia, Perugia, Italy.
Conflict of interest: Roberto Pellicciari is cofounder and head of medicinal chemistry at Intercept Pharmaceuticals.Submitted: March 25, 2014; Accepted: September 30, 2014.Reference information: J Clin Invest. 2014;124(12):5424–5436. doi:10.1172/JCI76289.
The Journal of Clinical Investigation R e s e a R c h a R t i c l e
5 4 2 5jci.org Volume 124 Number 12 December 2014
of leukocyte TGR5 in glucose homeostasis and insulin responsive-ness. We performed bone marrow transplantations to generate chimeric C57BL/6J mice carrying bone marrow of either Tgr5 WT or Tgr5-knockout mice (referred to herein as Tgr5bm+/+ and Tgr5bm–/– mice, respectively). Genotyping of the Tgr5 allele in circulating
ResultsTgr5bm–/– mice display worsened high-fat diet–induced insulin resis-tance. Earlier studies have shown that TGR5 protects against glu-cose intolerance and insulin resistance induced by high-fat diet (HFD) (26). In the current study, we set out to determine the role
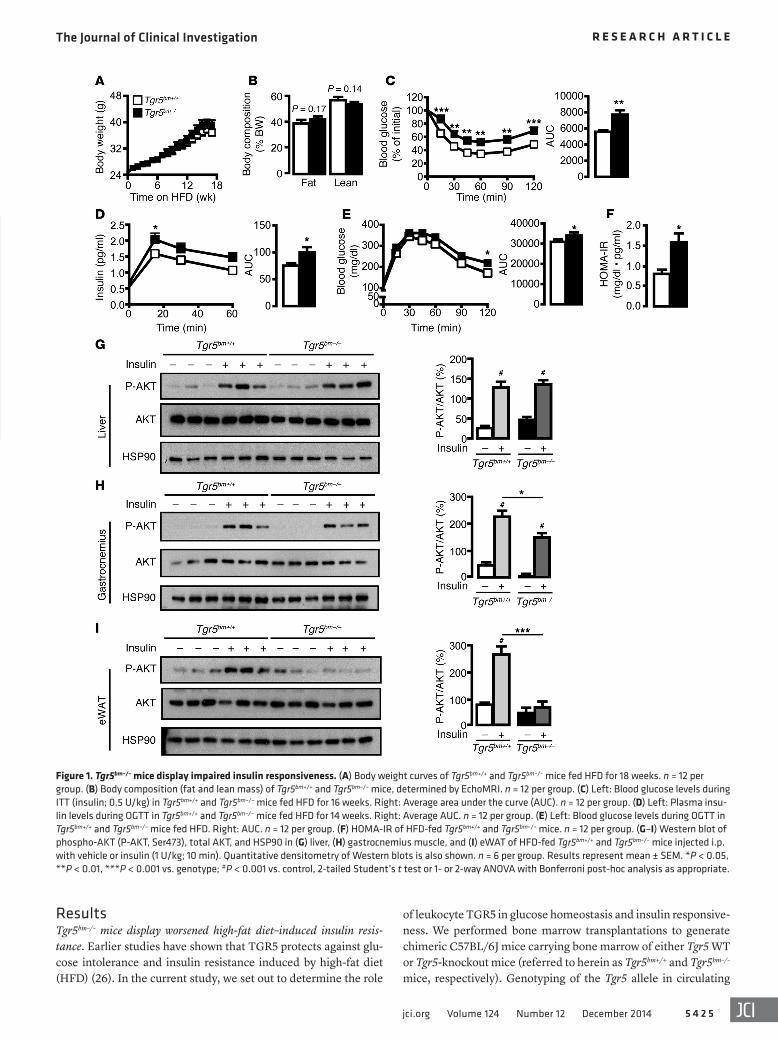
Figure 1. Tgr5bm–/– mice display impaired insulin responsiveness. (A) Body weight curves of Tgr5bm+/+ and Tgr5bm–/– mice fed HFD for 18 weeks. n = 12 per group. (B) Body composition (fat and lean mass) of Tgr5bm+/+ and Tgr5bm–/– mice, determined by EchoMRI. n = 12 per group. (C) Left: Blood glucose levels during ITT (insulin; 0.5 U/kg) in Tgr5bm+/+ and Tgr5bm–/– mice fed HFD for 16 weeks. Right: Average area under the curve (AUC). n = 12 per group. (D) Left: Plasma insu-lin levels during OGTT in Tgr5bm+/+ and Tgr5bm–/– mice fed HFD for 14 weeks. Right: Average AUC. n = 12 per group. (E) Left: Blood glucose levels during OGTT in Tgr5bm+/+ and Tgr5bm–/– mice fed HFD. Right: AUC. n = 12 per group. (F) HOMA-IR of HFD-fed Tgr5bm+/+ and Tgr5bm–/– mice. n = 12 per group. (G–I) Western blot of phospho-AKT (P-AKT, Ser473), total AKT, and HSP90 in (G) liver, (H) gastrocnemius muscle, and (I) eWAT of HFD-fed Tgr5bm+/+ and Tgr5bm–/– mice injected i.p. with vehicle or insulin (1 U/kg; 10 min). Quantitative densitometry of Western blots is also shown. n = 6 per group. Results represent mean ± SEM. *P < 0.05, **P < 0.01, ***P < 0.001 vs. genotype; #P < 0.001 vs. control, 2-tailed Student’s t test or 1- or 2-way ANOVA with Bonferroni post-hoc analysis as appropriate.
The Journal of Clinical Investigation R e s e a R c h a R t i c l e
5 4 2 6 jci.org Volume 124 Number 12 December 2014
Tgr5bm+/+ mice (Figure 1F), pointing to increased insulin resistance in mice lacking leukocyte TGR5.
To further assess the role of leukocyte TGR5 in modulating insulin responsiveness, we determined insulin-stimulated AKT phosphorylation in a panel of insulin-responsive target tissues of Tgr5bm+/+ and Tgr5bm–/– mice fed HFD. While AKT phosphorylation was similarly induced by insulin in Tgr5bm+/+ and Tgr5bm–/– liver, a moderate decrease in AKT activation was observed in Tgr5bm–/– gastrocnemius muscle (Figure 1, G and H). However, insulin-stim-ulated AKT phosphorylation was robustly decreased in the epidid-ymal fat pads of Tgr5bm–/– versus Tgr5bm+/+ mice (Figure 1I). These data indicate that TGR5 deficiency in leukocytes predominantly reduces insulin responsiveness in adipose tissue.
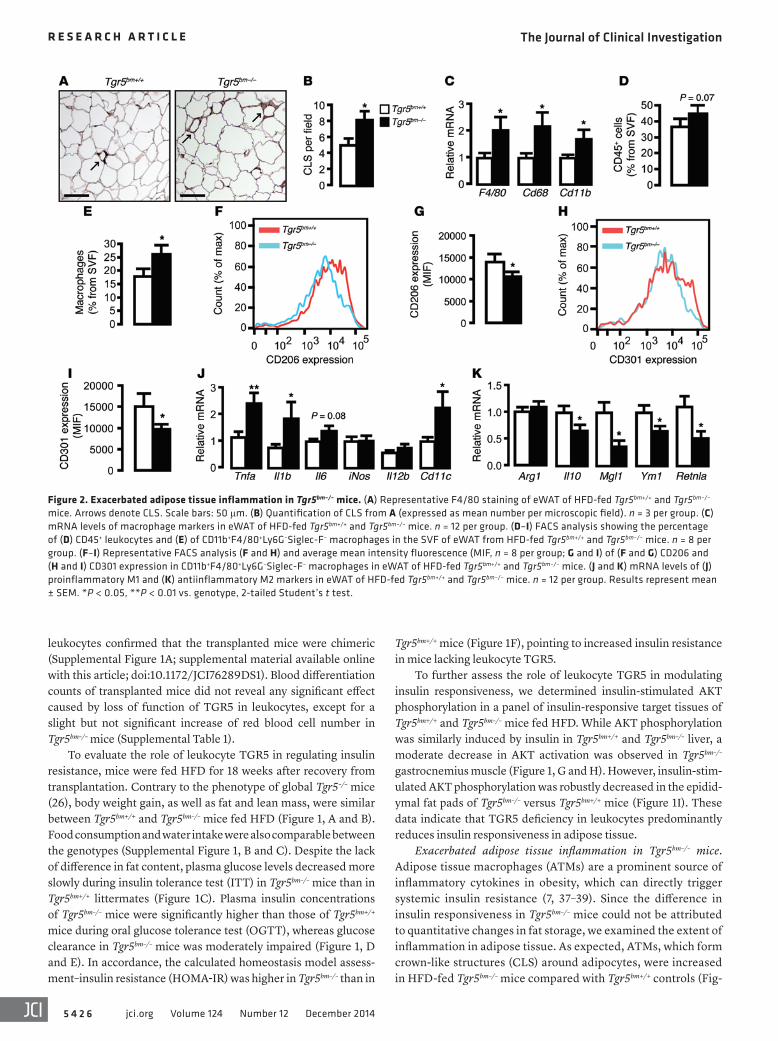
Exacerbated adipose tissue inflammation in Tgr5bm–/– mice. Adipose tissue macrophages (ATMs) are a prominent source of inflammatory cytokines in obesity, which can directly trigger systemic insulin resistance (7, 37–39). Since the difference in insulin responsiveness in Tgr5bm–/– mice could not be attributed to quantitative changes in fat storage, we examined the extent of inflammation in adipose tissue. As expected, ATMs, which form crown-like structures (CLS) around adipocytes, were increased in HFD-fed Tgr5bm–/– mice compared with Tgr5bm+/+ controls (Fig-
leukocytes confirmed that the transplanted mice were chimeric (Supplemental Figure 1A; supplemental material available online with this article; doi:10.1172/JCI76289DS1). Blood differentiation counts of transplanted mice did not reveal any significant effect caused by loss of function of TGR5 in leukocytes, except for a slight but not significant increase of red blood cell number in Tgr5bm–/– mice (Supplemental Table 1).
To evaluate the role of leukocyte TGR5 in regulating insulin resistance, mice were fed HFD for 18 weeks after recovery from transplantation. Contrary to the phenotype of global Tgr5–/– mice (26), body weight gain, as well as fat and lean mass, were similar between Tgr5bm+/+ and Tgr5bm–/– mice fed HFD (Figure 1, A and B). Food consumption and water intake were also comparable between the genotypes (Supplemental Figure 1, B and C). Despite the lack of difference in fat content, plasma glucose levels decreased more slowly during insulin tolerance test (ITT) in Tgr5bm–/– mice than in Tgr5bm+/+ littermates (Figure 1C). Plasma insulin concentrations of Tgr5bm–/– mice were significantly higher than those of Tgr5bm+/+ mice during oral glucose tolerance test (OGTT), whereas glucose clearance in Tgr5bm–/– mice was moderately impaired (Figure 1, D and E). In accordance, the calculated homeostasis model assess-ment–insulin resistance (HOMA-IR) was higher in Tgr5bm–/– than in
Figure 2. Exacerbated adipose tissue inflammation in Tgr5bm–/– mice. (A) Representative F4/80 staining of eWAT of HFD-fed Tgr5bm+/+ and Tgr5bm–/– mice. Arrows denote CLS. Scale bars: 50 μm. (B) Quantification of CLS from A (expressed as mean number per microscopic field). n = 3 per group. (C) mRNA levels of macrophage markers in eWAT of HFD-fed Tgr5bm+/+ and Tgr5bm–/– mice. n = 12 per group. (D–I) FACS analysis showing the percentage of (D) CD45+ leukocytes and (E) of CD11b+F4/80+Ly6G–Siglec-F– macrophages in the SVF of eWAT from HFD-fed Tgr5bm+/+ and Tgr5bm–/– mice. n = 8 per group. (F–I) Representative FACS analysis (F and H) and average mean intensity fluorescence (MIF, n = 8 per group; G and I) of (F and G) CD206 and (H and I) CD301 expression in CD11b+F4/80+Ly6G–Siglec-F– macrophages in eWAT of HFD-fed Tgr5bm+/+ and Tgr5bm–/– mice. (J and K) mRNA levels of (J) proinflammatory M1 and (K) antiinflammatory M2 markers in eWAT of HFD-fed Tgr5bm+/+ and Tgr5bm–/– mice. n = 12 per group. Results represent mean ± SEM. *P < 0.05, **P < 0.01 vs. genotype, 2-tailed Student’s t test.
The Journal of Clinical Investigation R e s e a R c h a R t i c l e
5 4 2 7jci.org Volume 124 Number 12 December 2014
significantly induced in the adipose tissue of Tgr5bm–/– mice (Figure 2C). Given the mild reduction in insulin sensitivity of Tgr5bm–/– muscle (Figure 1H), we also tested the expression of the macrophage marker genes in gastrocnemius derived from
ure 2, A and B). In line with these data, mRNA expression levels of the macrophage marker genes EGF-like module containing, mucin-like, hormone receptor-like sequence 1 (Emr1; hereafter F4/80), Cd68, and integrin αM (Itgam; hereafter Cd11b) were
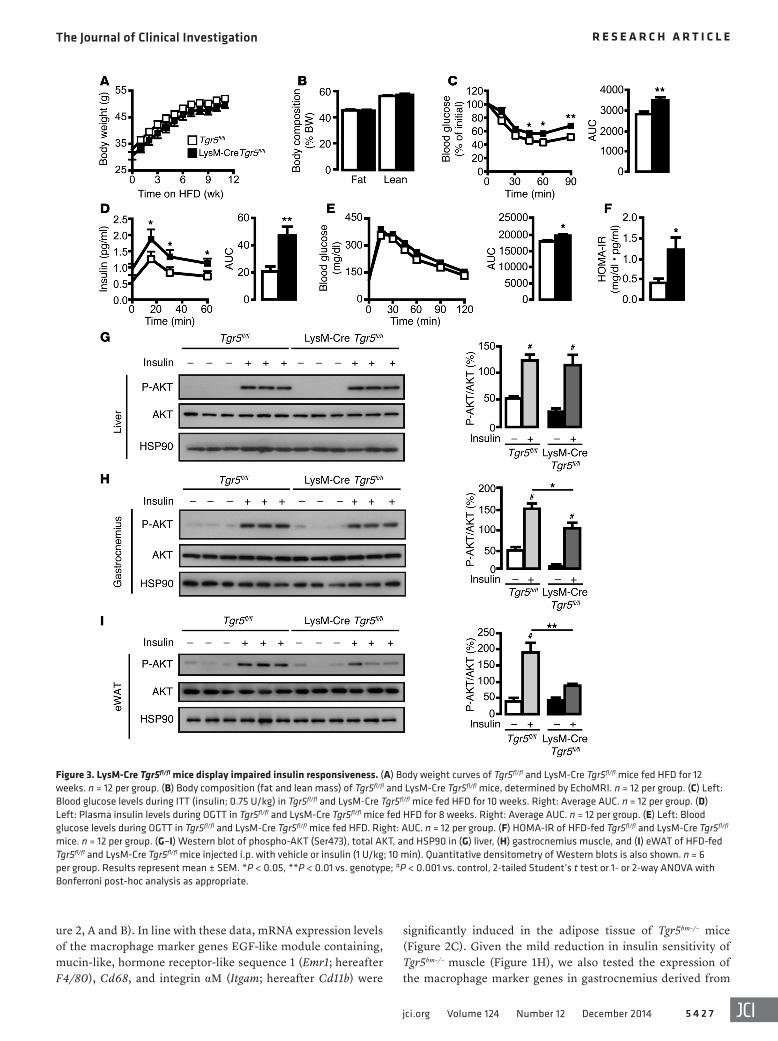
Figure 3. LysM-Cre Tgr5fl/fl mice display impaired insulin responsiveness. (A) Body weight curves of Tgr5fl/fl and LysM-Cre Tgr5fl/fl mice fed HFD for 12 weeks. n = 12 per group. (B) Body composition (fat and lean mass) of Tgr5fl/fl and LysM-Cre Tgr5fl/fl mice, determined by EchoMRI. n = 12 per group. (C) Left: Blood glucose levels during ITT (insulin; 0.75 U/kg) in Tgr5fl/fl and LysM-Cre Tgr5fl/fl mice fed HFD for 10 weeks. Right: Average AUC. n = 12 per group. (D) Left: Plasma insulin levels during OGTT in Tgr5fl/fl and LysM-Cre Tgr5fl/fl mice fed HFD for 8 weeks. Right: Average AUC. n = 12 per group. (E) Left: Blood glucose levels during OGTT in Tgr5fl/fl and LysM-Cre Tgr5fl/fl mice fed HFD. Right: AUC. n = 12 per group. (F) HOMA-IR of HFD-fed Tgr5fl/fl and LysM-Cre Tgr5fl/fl mice. n = 12 per group. (G–I) Western blot of phospho-AKT (Ser473), total AKT, and HSP90 in (G) liver, (H) gastrocnemius muscle, and (I) eWAT of HFD-fed Tgr5fl/fl and LysM-Cre Tgr5fl/fl mice injected i.p. with vehicle or insulin (1 U/kg; 10 min). Quantitative densitometry of Western blots is also shown. n = 6 per group. Results represent mean ± SEM. *P < 0.05, **P < 0.01 vs. genotype; #P < 0.001 vs. control, 2-tailed Student’s t test or 1- or 2-way ANOVA with Bonferroni post-hoc analysis as appropriate.
The Journal of Clinical Investigation R e s e a R c h a R t i c l e
5 4 2 8 jci.org Volume 124 Number 12 December 2014
that leukocyte Tgr5 deficiency is associated with an increase of proinflammatory M1 ATMs upon HFD feeding.
LysM-Cre Tgr5fl/fl mice display increased HFD-induced insulin resistance. To confirm the contribution of macrophage TGR5 in the context of insulin resistance, we selectively deleted Tgr5 in macrophages by generating mice that express Cre under the con-trol of the myeloid cell–specific M lysozyme promoter (referred to herein as LysM-Cre Tgr5fl/fl mice; Supplemental Figure 3A and ref. 42). After 12 weeks of HFD feeding, LysM-Cre Tgr5fl/fl and control Tgr5fl/fl mice did not display any difference in body weight or com-position (Figure 3, A and B). In agreement with the phenotype of the chimeric Tgr5bm–/– mice (Figure 1), ITT results in HFD-fed LysM-Cre Tgr5fl/fl mice were suggestive of increased insulin resis-tance (Figure 3C). In further accord with our findings in Tgr5bm–/– mice, plasma insulin concentrations were significantly higher during OGTT, while glucose clearance was only moderately impaired (Figure 3, D and E). This resulted in a higher HOMA-IR in LysM-Cre Tgr5fl/fl mice (Figure 3F), indicative of worsened insulin resistance in mice lacking macrophage TGR5. The differ-ence in insulin resistance was highly dependent on HFD feeding, since chow diet–fed LysM-Cre Tgr5fl/fl mice did not display any dif-ference in ITT, insulin levels, or OGTT compared with controls (Supplemental Figure 3, B–D).
To further confirm the role of macrophage TGR5 in modu-lating insulin responsiveness, we determined insulin-stimulated AKT phosphorylation in liver, muscle, and fat of HFD-fed Tgr5fl/fl and LysM-Cre Tgr5fl/fl mice. Whereas AKT phosphorylation was induced by insulin to a similar extent in Tgr5fl/fl and LysM-Cre Tgr5fl/fl liver, a slight decrease in AKT activation was observed in LysM-Cre Tgr5fl/fl gastrocnemius (Figure 3, G and H). However, insulin-stimulated AKT phosphorylation was significantly decreased in the epididymal white adipose tissue (eWAT) of LysM-Cre Tgr5fl/fl compared with Tgr5fl/fl mice (Figure 3I). These data indicate that Tgr5 deficiency in macrophages predominantly reduces insulin responsiveness in adipose tissue.
Tgr5bm–/– and Tgr5bm+/+ mice; however, no difference was found between the genotypes (Supplemental Figure 2A).
We then performed FACS analysis on stromal vascular frac-tion (SVF) cells isolated from adipose tissue of Tgr5bm–/– and Tgr5bm+/+ mice. A trend toward higher leukocyte numbers (CD45+ cells) in the SVF of Tgr5bm–/– mice was observed (Figure 2D). In line with our previous findings, however, the number of ATMs, identified as F4/80+CD11b+Siglec-F–Ly6G– cells, was markedly increased in the adipose tissue of Tgr5bm–/– mice (Figure 2E). Given the primordial role of alternative M2 activation in the protection against insulin resistance (40, 41), we assessed M1/M2 polariza-tion of ATMs by evaluating the expression of 2 established M2 markers in macrophages, CD206 and CD301 (41). Expression of both was significantly reduced in macrophages isolated from Tgr5bm–/– mice (Figure 2, F–I).
To determine the underlying cause of the imbalance between M1 and M2 ATMs in Tgr5bm–/– mice, we next assessed the extent of inflammation in adipose tissue by analyzing several proinflammato-ry (M1) and antiinflammatory (M2) genes (Figure 2, J and K). Expres-sion of TNF-α (Tnfa), IL-1β (Il1b), and integrin αX (Itgax; hereafter Cd11c) was significantly increased in the adipose tissue of HFD-fed Tgr5bm–/– mice, whereas IL-6 (Il6), nitric oxide synthase 2, inducible (Nos2; hereafter iNos), and IL-12B (Il12b; also known as Il12) were unchanged or showed only a trend toward increase (Figure 2J).
Consistent with the FACS analysis of CD206 and CD301 (Figure 2, F–I), gene expression of M2 markers, such as IL-10 (Il10), C-type lectin domain family 10, member A (Clec10a; here-after Mgl1), chitinase 3-like 3 (Chi3l3; hereafter Ym1) and resistin-like α (Retnla; also known as Fizz1) was significantly attenuated in adipose tissue of Tgr5bm–/– mice, whereas arginase 1 (Arg1), an M2 signature gene, was not changed (Figure 2K). In contrast to our findings in adipose tissue, M1 and M2 markers were not dif-ferentially expressed in gastrocnemius derived from Tgr5bm–/– and Tgr5bm+/+ mice, except for a slight increase in Il6 mRNA (Supple-mental Figure 2, B and C). Taken together, these results indicate
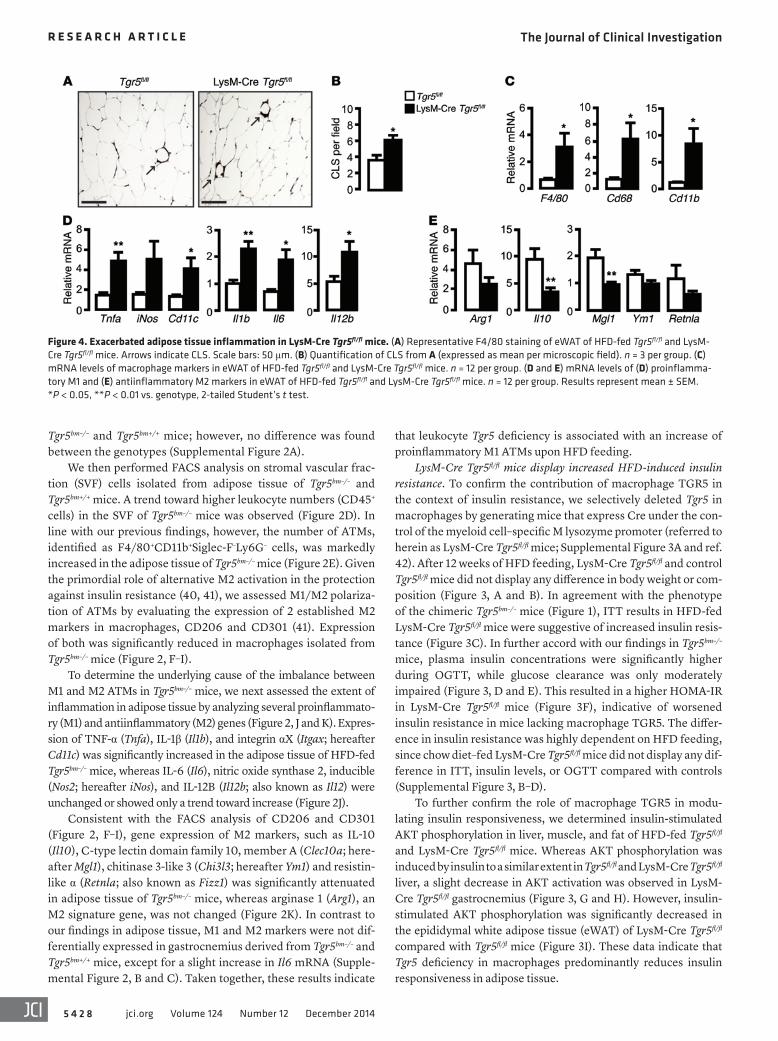
Figure 4. Exacerbated adipose tissue inflammation in LysM-Cre Tgr5fl/fl mice. (A) Representative F4/80 staining of eWAT of HFD-fed Tgr5fl/fl and LysM-Cre Tgr5fl/fl mice. Arrows indicate CLS. Scale bars: 50 μm. (B) Quantification of CLS from A (expressed as mean per microscopic field). n = 3 per group. (C) mRNA levels of macrophage markers in eWAT of HFD-fed Tgr5fl/fl and LysM-Cre Tgr5fl/fl mice. n = 12 per group. (D and E) mRNA levels of (D) proinflamma-tory M1 and (E) antiinflammatory M2 markers in eWAT of HFD-fed Tgr5fl/fl and LysM-Cre Tgr5fl/fl mice. n = 12 per group. Results represent mean ± SEM. *P < 0.05, **P < 0.01 vs. genotype, 2-tailed Student’s t test.
The Journal of Clinical Investigation R e s e a R c h a R t i c l e
5 4 2 9jci.org Volume 124 Number 12 December 2014
Exacerbated adipose tissue inflammation in LysM-Cre Tgr5fl/fl mice. Like the chimeric Tgr5bm–/– mice, LysM-Cre Tgr5fl/fl mice also displayed more ATMs than their HFD-fed control littermates, as implied by the increased incidence of CLS (Figure 4, A and B). In line with these data, mRNA expression levels of the macrophage marker genes F4/80, Cd68, and Cd11b were significantly induced in adipose tissue of LysM-Cre Tgr5fl/fl mice fed HFD, but not chow diet (Figure 4C and Supplemental Figure 3E).
To assess whether the imbalance between M1 and M2 ATMs was also present in LysM-Cre Tgr5fl/fl eWAT, we analyzed the extent of inflammation in this tissue. Expression of the M1 markers Tnfa, Cd11c, Il1b, Il6, and Il12b was significantly increased in eWAT of LysM-Cre Tgr5fl/fl mice fed HFD, whereas iNos only showed a trend toward increase (Figure 4D). On the other hand, gene expression of M2 markers, such as Il10 and Mgl1, was significantly attenuated in LysM-Cre Tgr5fl/fl eWAT, while Arg1, Ym1, and Retnla trended toward a decrease (Figure 4E). Taken together, these results indi-cate that macrophage TGR5 deficiency is characterized by an increase of proinflammatory M1 ATMs upon HFD feeding.
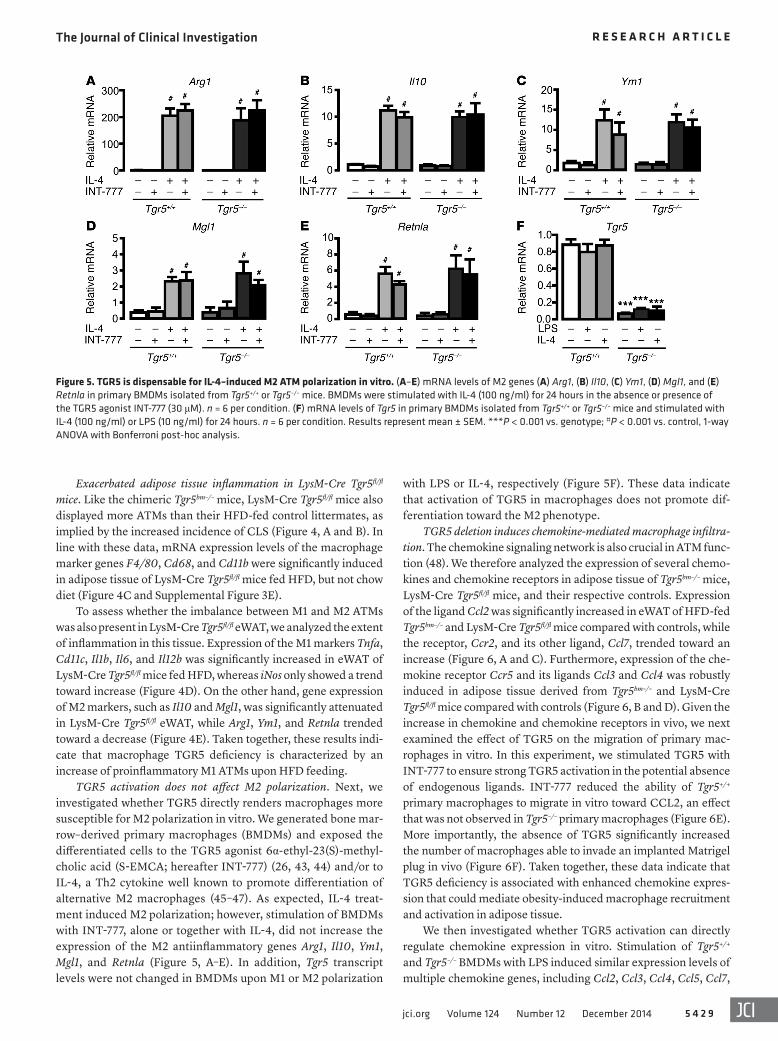
TGR5 activation does not affect M2 polarization. Next, we investigated whether TGR5 directly renders macrophages more susceptible for M2 polarization in vitro. We generated bone mar-row–derived primary macrophages (BMDMs) and exposed the differentiated cells to the TGR5 agonist 6α-ethyl-23(S)-methyl-cholic acid (S-EMCA; hereafter INT-777) (26, 43, 44) and/or to IL-4, a Th2 cytokine well known to promote differentiation of alternative M2 macrophages (45–47). As expected, IL-4 treat-ment induced M2 polarization; however, stimulation of BMDMs with INT-777, alone or together with IL-4, did not increase the expression of the M2 antiinflammatory genes Arg1, Il10, Ym1, Mgl1, and Retnla (Figure 5, A–E). In addition, Tgr5 transcript levels were not changed in BMDMs upon M1 or M2 polarization
with LPS or IL-4, respectively (Figure 5F). These data indicate that activation of TGR5 in macrophages does not promote dif-ferentiation toward the M2 phenotype.
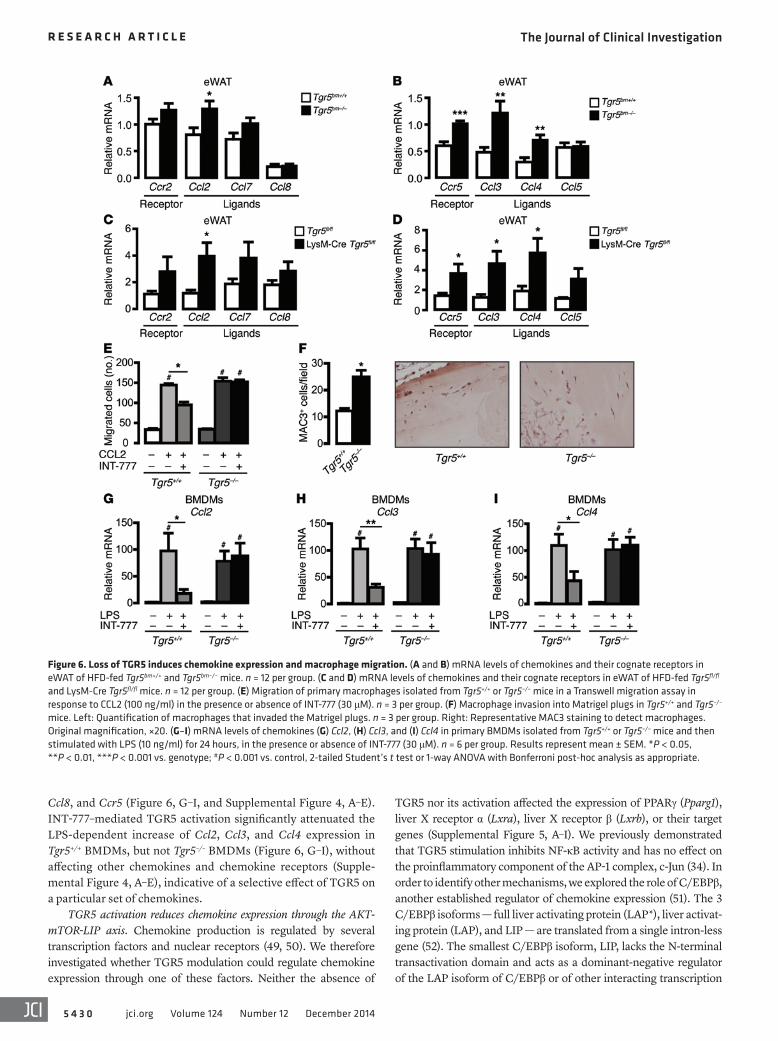
TGR5 deletion induces chemokine-mediated macrophage infiltra-tion. The chemokine signaling network is also crucial in ATM func-tion (48). We therefore analyzed the expression of several chemo-kines and chemokine receptors in adipose tissue of Tgr5bm–/– mice, LysM-Cre Tgr5fl/fl mice, and their respective controls. Expression of the ligand Ccl2 was significantly increased in eWAT of HFD-fed Tgr5bm–/– and LysM-Cre Tgr5fl/fl mice compared with controls, while the receptor, Ccr2, and its other ligand, Ccl7, trended toward an increase (Figure 6, A and C). Furthermore, expression of the che-mokine receptor Ccr5 and its ligands Ccl3 and Ccl4 was robustly induced in adipose tissue derived from Tgr5bm–/– and LysM-Cre Tgr5fl/fl mice compared with controls (Figure 6, B and D). Given the increase in chemokine and chemokine receptors in vivo, we next examined the effect of TGR5 on the migration of primary mac-rophages in vitro. In this experiment, we stimulated TGR5 with INT-777 to ensure strong TGR5 activation in the potential absence of endogenous ligands. INT-777 reduced the ability of Tgr5+/+ primary macrophages to migrate in vitro toward CCL2, an effect that was not observed in Tgr5–/– primary macrophages (Figure 6E). More importantly, the absence of TGR5 significantly increased the number of macrophages able to invade an implanted Matrigel plug in vivo (Figure 6F). Taken together, these data indicate that TGR5 deficiency is associated with enhanced chemokine expres-sion that could mediate obesity-induced macrophage recruitment and activation in adipose tissue.
We then investigated whether TGR5 activation can directly regulate chemokine expression in vitro. Stimulation of Tgr5+/+ and Tgr5–/– BMDMs with LPS induced similar expression levels of multiple chemokine genes, including Ccl2, Ccl3, Ccl4, Ccl5, Ccl7,
Figure 5. TGR5 is dispensable for IL-4–induced M2 ATM polarization in vitro. (A–E) mRNA levels of M2 genes (A) Arg1, (B) Il10, (C) Ym1, (D) Mgl1, and (E) Retnla in primary BMDMs isolated from Tgr5+/+ or Tgr5–/– mice. BMDMs were stimulated with IL-4 (100 ng/ml) for 24 hours in the absence or presence of the TGR5 agonist INT-777 (30 μM). n = 6 per condition. (F) mRNA levels of Tgr5 in primary BMDMs isolated from Tgr5+/+ or Tgr5–/– mice and stimulated with IL-4 (100 ng/ml) or LPS (10 ng/ml) for 24 hours. n = 6 per condition. Results represent mean ± SEM. ***P < 0.001 vs. genotype; #P < 0.001 vs. control, 1-way ANOVA with Bonferroni post-hoc analysis.
The Journal of Clinical Investigation R e s e a R c h a R t i c l e
5 4 3 0 jci.org Volume 124 Number 12 December 2014
Ccl8, and Ccr5 (Figure 6, G–I, and Supplemental Figure 4, A–E). INT-777–mediated TGR5 activation significantly attenuated the LPS-dependent increase of Ccl2, Ccl3, and Ccl4 expression in Tgr5+/+ BMDMs, but not Tgr5–/– BMDMs (Figure 6, G–I), without affecting other chemokines and chemokine receptors (Supple-mental Figure 4, A–E), indicative of a selective effect of TGR5 on a particular set of chemokines.
TGR5 activation reduces chemokine expression through the AKT-mTOR-LIP axis. Chemokine production is regulated by several transcription factors and nuclear receptors (49, 50). We therefore investigated whether TGR5 modulation could regulate chemokine expression through one of these factors. Neither the absence of
TGR5 nor its activation affected the expression of PPARγ (Pparg1), liver X receptor α (Lxra), liver X receptor β (Lxrb), or their target genes (Supplemental Figure 5, A–I). We previously demonstrated that TGR5 stimulation inhibits NF-κB activity and has no effect on the proinflammatory component of the AP-1 complex, c-Jun (34). In order to identify other mechanisms, we explored the role of C/EBPβ, another established regulator of chemokine expression (51). The 3 C/EBPβ isoforms — full liver activating protein (LAP*), liver activat-ing protein (LAP), and LIP — are translated from a single intron-less gene (52). The smallest C/EBPβ isoform, LIP, lacks the N-terminal transactivation domain and acts as a dominant-negative regulator of the LAP isoform of C/EBPβ or of other interacting transcription
Figure 6. Loss of TGR5 induces chemokine expression and macrophage migration. (A and B) mRNA levels of chemokines and their cognate receptors in eWAT of HFD-fed Tgr5bm+/+ and Tgr5bm–/– mice. n = 12 per group. (C and D) mRNA levels of chemokines and their cognate receptors in eWAT of HFD-fed Tgr5fl/fl and LysM-Cre Tgr5fl/fl mice. n = 12 per group. (E) Migration of primary macrophages isolated from Tgr5+/+ or Tgr5–/– mice in a Transwell migration assay in response to CCL2 (100 ng/ml) in the presence or absence of INT-777 (30 μM). n = 3 per group. (F) Macrophage invasion into Matrigel plugs in Tgr5+/+ and Tgr5–/– mice. Left: Quantification of macrophages that invaded the Matrigel plugs. n = 3 per group. Right: Representative MAC3 staining to detect macrophages. Original magnification, ×20. (G–I) mRNA levels of chemokines (G) Ccl2, (H) Ccl3, and (I) Ccl4 in primary BMDMs isolated from Tgr5+/+ or Tgr5–/– mice and then stimulated with LPS (10 ng/ml) for 24 hours, in the presence or absence of INT-777 (30 μM). n = 6 per group. Results represent mean ± SEM. *P < 0.05, **P < 0.01, ***P < 0.001 vs. genotype; #P < 0.001 vs. control, 2-tailed Student’s t test or 1-way ANOVA with Bonferroni post-hoc analysis as appropriate.
The Journal of Clinical Investigation R e s e a R c h a R t i c l e
5 4 3 1jci.org Volume 124 Number 12 December 2014
Control of LIP expression is mediated by differential ini-tiation of protein translation through the activity of eukaryotic translation initiation factors (eIFs) (54). Previous studies have shown that mTOR enhances the level of accessible eIF-4E (57), thereby increasing the expression of the truncated C/EBPβ iso-form LIP in an upstream ORF–dependent (uORF-dependent) manner (54). In light of this mechanism, we sought to determine whether TGR5-dependent activation of the mTOR pathway could be responsible for the increase in LIP in our model. Stimu-
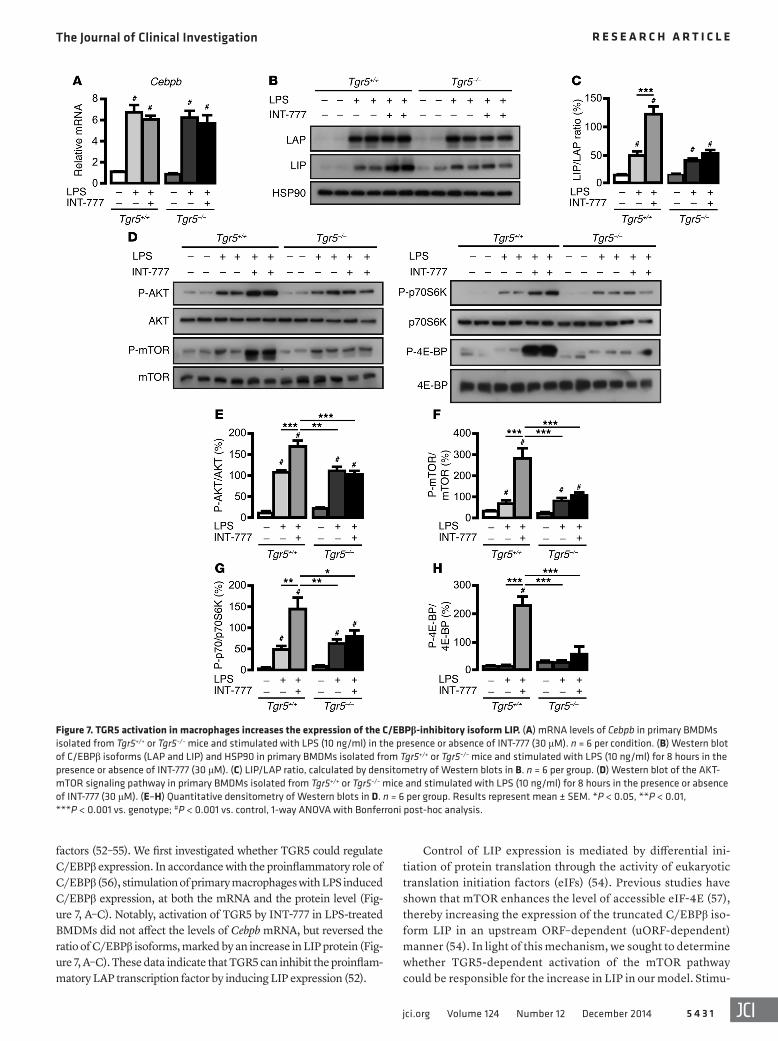
factors (52–55). We first investigated whether TGR5 could regulate C/EBPβ expression. In accordance with the proinflammatory role of C/EBPβ (56), stimulation of primary macrophages with LPS induced C/EBPβ expression, at both the mRNA and the protein level (Fig-ure 7, A–C). Notably, activation of TGR5 by INT-777 in LPS-treated BMDMs did not affect the levels of Cebpb mRNA, but reversed the ratio of C/EBPβ isoforms, marked by an increase in LIP protein (Fig-ure 7, A–C). These data indicate that TGR5 can inhibit the proinflam-matory LAP transcription factor by inducing LIP expression (52).
Figure 7. TGR5 activation in macrophages increases the expression of the C/EBPβ-inhibitory isoform LIP. (A) mRNA levels of Cebpb in primary BMDMs isolated from Tgr5+/+ or Tgr5–/– mice and stimulated with LPS (10 ng/ml) in the presence or absence of INT-777 (30 μM). n = 6 per condition. (B) Western blot of C/EBPβ isoforms (LAP and LIP) and HSP90 in primary BMDMs isolated from Tgr5+/+ or Tgr5–/– mice and stimulated with LPS (10 ng/ml) for 8 hours in the presence or absence of INT-777 (30 μM). (C) LIP/LAP ratio, calculated by densitometry of Western blots in B. n = 6 per group. (D) Western blot of the AKT-mTOR signaling pathway in primary BMDMs isolated from Tgr5+/+ or Tgr5–/– mice and stimulated with LPS (10 ng/ml) for 8 hours in the presence or absence of INT-777 (30 μM). (E–H) Quantitative densitometry of Western blots in D. n = 6 per group. Results represent mean ± SEM. *P < 0.05, **P < 0.01, ***P < 0.001 vs. genotype; #P < 0.001 vs. control, 1-way ANOVA with Bonferroni post-hoc analysis.
The Journal of Clinical Investigation R e s e a R c h a R t i c l e
5 4 3 2 jci.org Volume 124 Number 12 December 2014
modulates chemokine expression via a mechanism involving AKT-mTOR–dependent induction of LIP expression.
DiscussionHere, we showed that specific deletion of TGR5 in mouse mac-rophages exacerbates HFD-induced insulin resistance without affecting body weight and adipose mass. We found that adipose tissue of Tgr5bm–/– and LysM-Cre Tgr5fl/fl mice is characterized by increased infiltration of proinflammatory M1 ATMs and enhanced expression of chemokines. Furthermore, we demonstrated that TGR5 activation reduces chemokine expression in macrophages via mTOR-dependent upregulation of the C/EBPβ isoform LIP and decreases ATM infiltration, thereby ameliorating obesity-induced insulin resistance.
Several lines of evidence point to an important role of ATMs in the development of systemic insulin resistance and glucose intoler-ance and in the progression of the metabolic syndrome (5, 39, 63). In the setting of obesity, proinflammatory cytokines and chemokines,
lation of BMDMs with LPS induced the AKT-mTOR pathway to a similar extent in both Tgr5+/+ and Tgr5–/– cells (Figure 7, D–H). Interestingly, coexposure of LPS and INT-777 further increased the phosphorylation of AKT, mTOR, and p70S6K — and, more importantly, induced the hyperphosphorylation of 4E-BP — in Tgr5+/+ BMDMs, but not Tgr5–/– BMDMs (Figure 7, D–H). Inhibi-tion of mTORC1 with rapamycin blocked the INT-777–mediated increase in LIP translation (Figure 8, A and B), which indicates that TGR5 stimulation increases LIP protein levels in a mTOR-dependent manner.
C/EBPβ binding sites have been identified in the promoter regions of multiple proinflammatory genes, including Ccl2 (58–60), Ccl3, and Ccl4 (61, 62). Accordingly, inhibition of mTORC1 with rapamycin reversed the INT-777–mediated decrease of Ccl2, Ccl3, and Ccl4 expression in Tgr5+/+ BMDMs, but not Tgr5–/– BMDMs (Figure 8, C–E), which indicates that reduction of che-mokines by TGR5 activation is critically dependent on mTOR signaling. Taken together, these results demonstrate that TGR5
Figure 8. TGR5 activation in macrophages reduces chemokine gene expression in a mTOR-dependent manner. (A) Western blot of C/EBPβ isoforms (LAP and LIP) and HSP90 in primary BMDMs isolated from Tgr5+/+ or Tgr5–/– mice and stimulated with LPS (10 ng/ml) for 8 hours in the presence or absence of INT-777 (30 μM) and the mTORC1 inhibitor rapamycin (10 nM). (B) LIP/LAP ratio, calculated by densitometry of Western blots in A. n = 6 per condition. (C–E) mRNA levels of chemokines (C) Ccl2, (D) Ccl3, and (E) Ccl4 in primary BMDMs isolated from Tgr5+/+ or Tgr5–/– mice and stimulated with LPS (10 ng/ml) for 8 hours in the presence or absence of INT-777 (30 M) and rapamycin (10 nM). n = 6 per group. Results represent mean ± SEM. *P < 0.05, **P < 0.01 vs. genotype; #P < 0.001 vs. control, 1-way ANOVA with Bonferroni post-hoc analysis.
The Journal of Clinical Investigation R e s e a R c h a R t i c l e
5 4 3 3jci.org Volume 124 Number 12 December 2014
contribute to the glucose-lowering actions of TGR5 (88), including stimulation of energy expenditure (27), secretion of the incretin GLP-1 (26, 28, 29, 89) and direct stimulation of insulin secretion from isolated pancreatic islets (30). Our present findings dem-onstrated that TGR5 activation can alter ATM function, thereby improving insulin action. These data indicate that the role of TGR5 in glucose homeostasis involves multiple tissues and processes.
In conclusion, we have elucidated a novel multicomponent TGR5-AKT-mTOR signaling pathway that induces differential translation of the C/EBPβ isoform LIP in macrophages. This axis links TGR5 tightly with obesity-induced insulin resistance through modulation of chemokine expression and ATM function. TGR5 activation in macrophages may hence be a promising approach to prevent insulin resistance and treat T2DM and associated inflam-matory and metabolic disorders.
MethodsAnimals. Mice were housed with ad libitum access to water and food and kept under a 12-hour dark/12-hour light cycle. The whole-body Tgr5–/– mouse model has been described previously (26). Tgr5fl/fl mice were crossed with Lysozyme M–Cre mice (Jackson Laboratories) and then further intercrossed to generate macrophage-specific Tgr5 knock-out (LysM-Cre Tgr5fl/fl) and control Tgr5fl/fl mice on a pure C57BL/6J background. 8-week-old mice were fed either chow diet or HFD (D12492; Research Diet) for 12 weeks. To generate bone marrow chi-meras, 10-week-old male C57BL/6J recipient mice were subjected to 2 exposures of total body X irradiation of 4.25 Gy (RS2000 Irradiator; Rad Source), after NK cell depletion by monoclonal PK136 antibody injection. Tgr5+/+ or Tgr5–/– littermates aged 4–6 weeks were used as bone marrow donors. After 4 weeks of recovery, which included treat-ment with Baytril (Bayer) and Dafalgan (Bristol-Myers Squibb), the Tgr5bm+/+ and Tgr5bm–/– mice were fed HFD (D12492; Research Diet), then sacrificed 18 weeks after initiation of diet. Tgr5 deletion in the leu-kocytes was confirmed using the primers 5′-AGAGCCAAGAGGGA-CAATCC-3′ and 5′-TGGGTGAGTGGAGTCTTCCT-3′.
Mouse phenotyping. Mouse body weight was assessed weekly. Food and water intake were measured manually over a 24-hour peri-od. Body composition was analyzed by noninvasive monitoring of fat and lean masses using EchoMRI (Echo Medical Systems), as previ-ously described (90).
ITT was performed by measuring blood glucose following i.p. injection of insulin (0.5–0.75 U/kg) after a 5-hour fast. Blood glucose was determined by ACCU-CHEK glucose meters (Roche).
OGTT was performed by measuring blood glucose following oral administration of glucose (2 g/kg) after overnight fasting. Blood glu-cose was determined by ACCU-CHEK glucose meters (Roche), and plasma insulin levels were measured by specific ELISA kits (Crystal Chem), following the manufacturer’s instructions.
To assess changes in insulin sensitivity, HOMA-IR (91) was calcu-lated as (fasting plasma glucose × fasting serum insulin)/58.32.
Western blotting. For insulin-stimulated phospho-AKT analysis, mice were fasted overnight, and liver, gastrocnemius, and eWAT were collected 10 minutes after i.p. injection of insulin (1 U/kg) and snap frozen in liquid nitrogen.
Tissues and cells were lysed using RIPA buffer (50 mM Tris-HCl pH 7.4, 150 mM NaCl, 1% NP-40, 0.5% Na-deoxycholate, 0.1% SDS, 2 mM EDTA, and 50 mM NaF) supplemented with 1 mM PMSF and pro-
markers of M1 macrophages, recruit additional macrophages to the adipose tissue, thus reinforcing tissue inflammation and insulin resistance via a multitude of mechanisms (37, 64–66). Knockout mouse studies have shown that CCR2 and its ligand CCL2 are pivot-al in triggering obesity-induced insulin resistance and are required for accumulation of inflammatory macrophages in fat (67–70). CCL2 was also shown to increase macrophage content via ATM pro-liferation, in addition to its effect on blood monocyte recruitment (71). We observed that Ccl2 expression, together with that of other chemokines and their receptors, was increased in the fat of HFD-fed mice lacking macrophage TGR5. This could be partially explained by the higher macrophage number in this tissue, together with a direct effect of TGR5 activation on Ccl2, Ccl3, and Ccl4 in primary macrophages. We therefore propose that the reduced expression of Ccl2, Ccl3, and Ccl4 subsequent to TGR5 activation attenuates ATM accumulation and enhances insulin sensitivity.
Our finding of impaired induction of the negative C/EBPβ isoform LIP provides an explanation for the elevated chemokine expression in Tgr5–/– macrophages and Tgr5bm–/– and LysM-Cre Tgr5fl/fl adipose tissue. We demonstrated that the TGR5-medi-ated selective increase in LIP was achieved through alternative translation triggered by enhanced AKT-mTOR signaling. Indeed, mTOR signaling affects the activity of the translation initiation factor eIF-4E, which is involved in C/EBPβ isoform switching (54, 72). Inhibition of mTOR/mTORC1 by rapamycin shifted the C/EBPβ isoform ratio in favor of LAP. The importance of this mTOR-dependent switch in C/EBPβ isoform translation has been previously demonstrated in osteoblast and osteoclast dif-ferentiation (73, 74), bone formation (75), cancer progression (53, 76, 77), liver regeneration (78), and inflammation (79). Although C/EBPβ-null mice have been generated to address the function of C/EBPβ in vivo (80), those mice lack both LIP and LAP iso-forms, and are hence not appropriate to dissect the specific func-tion of each isoform. Selective deletion of the dominant-negative isoform LIP has been achieved by generating a mouse line defi-cient for the C/EBPβ uORF initiation codon that fails to initiate LIP translation (C/EBPβΔuORF mice) (81). In this mouse line, lack of LIP expression exacerbates the induction of C/EBPβ target genes in a model of partial hepatectomy–induced inflammation. Together, these results suggest that TGR5-mediated LIP induc-tion contributes to the suppression of inflammatory markers that are normally boosted by other transcription factors, including the LAP isoform of C/EBPβ. As the b-ZIP domain of LAP has been reported to interact with the Rel homology domain of NF-κB and to enhance NF-κB–dependent transcription (82–85), the domi-nant-negative C/EBPβ isoform LIP could also blunt NF-κB acti-vation and further decrease the inflammatory response. Several studies demonstrate that TGR5 activation inhibits NF-κB signal-ing through pleiotropic mechanisms, including IκBα, CREB, and c-Fos phosphorylation (32, 34, 36). Our present data add modula-tion of LIP translation to the means by which TGR5 could reduce the inflammatory actions of NF-κB.
Based on our findings, we propose that macrophage TGR5 con-tributes to the systemic insulin-sensitizing effects of BAs. BAs are well-characterized endogenous TGR5 ligands (44) that are robustly induced in human plasma after a glucose challenge (86) and corre-late with enhanced insulin sensitivity (26, 87). Several mechanisms
The Journal of Clinical Investigation R e s e a R c h a R t i c l e
5 4 3 4 jci.org Volume 124 Number 12 December 2014
herent cells were collected, seeded at 105 cells/ml in bacteriological plates, and grown for 7 days. Differentiated BMDMs were stimulated with LPS (10 ng/ml) or with IL-4 (100 ng/ml) for 8–24 hours in the presence or absence of the TGR5 agonist INT-777 (30 μM) and/or the mTOR inhibitor rapamycin (10 nM; Sigma-Aldrich).
In vitro chemotaxis assay. Primary macrophages (200,000 cells/well), pretreated with 30 μM INT-777 for 24 hours, were loaded into the upper portion of a 6.5-mm Transwell with 8.0-μm Pore Polycar-bonate Membrane Insert (Corning); DMEM with CCL2 (100 ng/ml) was placed in the lower chamber. After 6 hours of migration, cells were fixed in Shandon Formal Fixx (Thermo Scientific). Cells were then stained with DAPI and counted.
Matrigel plug assay. In total, 700 μl growth factor–reduced Matrigel, with 200 ng/ml basic fibroblast growth factor (Invitrogen) and 60 U/ml heparin (Sigma-Aldrich) added, was injected s.c. into Tgr5+/+ and Tgr5–/– mice. After 7 days, the Matrigel plug was removed, fixed in Shandon Formal Fixx (Thermo Scientific), and processed for immunohisto-chemistry using a MAC3 antibody (BD Biosciences — Pharmingen).
Statistics. Prism software (GraphPad) was used for statistical analy-sis. All results were expressed as mean ± SEM. P values were calculated by 2-tailed Student’s t test or 1- or 2-way ANOVA with Bonferroni post-hoc analysis as appropriate. For analysis between genotypes, a P value less than 0.05 was considered significant; for analysis compared with control, P values less than 0.001 (extremely significant) are indicated.
Study approval. All animal experiments were carried out accord-ing to national Swiss and EU ethical guidelines and were approved by the local animal experimentation committee of the Canton de Vaud (license no. 2614).
AcknowledgmentsWe thank Sabrina Bichet, Thibaud Clerc, Norman Moullan, and the Center of Phenogenomics (UDP) for technical assistance. We acknowledge Mark Pruzanski and Luciano Adorini for provid-ing INT-777. This work was funded by the Swiss National Science Foundation (SNSF; grant no. 310030_143748) and the Ecole Poly-technique Fédérale de Lausanne. A. Perino is supported by a long-term fellowship from EMBO (ALTF 959-2012). T.W.H. Pols is sup-ported by a long-term fellowship from the Federation of European Biochemical Societies (FEBS) and the Netherlands Organization of Scientific Research (NWO VENI; grant no. 016.136.083).
Address correspondence to: Kristina Schoonjans, Ecole Poly-technique Fédérale de Lausanne, SV IBI1, Station 15, CH-1015 Lausanne, Switzerland. Phone: 41216931891; E-mail: [email protected].
tease and phosphatase inhibitor cocktails (Roche). Lysates were incu-bated on ice and cleared by centrifugation at 18,500 g for 15 minutes at 4°C. Protein concentration was determined by the Lowry method, and samples were analyzed for immunoblotting using standard pro-cedures. Antibodies against phospho-AKT (Ser473) (Cell Signaling), AKT (Cell Signaling), phospho-mTOR (Ser2448) (Cell Signaling), mTOR (Cell Signaling), phospho-p70S6K (Thr389) (Cell Signaling), p70S6K (Cell Signaling), phospho-4E-BP1 (Thr37/46) (Cell Signal-ing), 4E-BP1 (Cell Signaling), C/EBPβ (Santa Cruz Biotechnology), and HSP90 (BD Biosciences) were used for Western blot analysis.
Histology and immunostaining. H&E staining was performed as described previously (92). Antibodies against F4/80 (Abcam) were used for immunohistochemistry to detect macrophages. F4/80 stain-ing was visualized using HRP-conjugated goat anti-rat IgG antibodies (Jackson) and DAB substrate (Sigma-Aldrich). Microphotographs were taken on wide-field microscopes (Olympus) with a CCD camera. Aver-age adipocyte size was quantified by measuring a total of 150 adipo-cytes in the eWAT using ImageJ.
qRT-PCR. RNA was isolated from tissues and cells using TRI Reagent (Ambion), after which cDNA was synthesized (Qiagen). Real-time qRT-PCR was performed using SYBR green (Roche) in the Light-cycler 480 II (Roche). All mRNA expression levels were corrected for expression of the housekeeping gene 36B4 or β2-microglobulin.
FACS analysis. Epididymal fat pads were weighed, rinsed in phos-phate-buffered saline and minced in HBSS. Tissue suspensions were treat-ed with collagenase (Sigma-Aldrich) at a final concentration of 1 mg/ml for 80 minutes at 37°C with shaking. The cell suspensions were filtered through a 70-μm filter and centrifuged at 300 g for 5 minutes. Stromal vascular cells were incubated in staining buffer (HBSS plus 25 mM HEPES) containing antibodies to block the Fc receptor (Fc γ RIIb/CD16-2; derived from hybridoma 2.4G2) and stained with a combination of the following antibodies: PE-Cy5.5–labeled CD45 (EBioscience), FITC-labeled Ly6G (MACS), BV421-labeled Siglec-F (BD Horizon), PE-Cy7–labeled CD11b (EBioscience), PE-labeled CD301 (BioLegend), PE-labeled CD206 (Biolegend), APC-labeled F4/80 (Ebioscience). FACS analysis was performed on a Cyan analyzer (Beckman Coulter), and FlowJo software was used for data analysis.
Derivation of macrophages and stimulation. BMDMs were isolated from the femurs and tibias of sibling 8- to 10-week-old Tgr5+/+ and Tgr5–/– mice. Cells were plated on bacteriological plastic plates in mac-rophage growth medium consisting of RPMI-1640 (Invitrogen), 1 mM sodium pyruvate (Invitrogen), 1× nonessential amino acids (Invitro-gen), 5 mM penicillin/streptomycin (Invitrogen), and 10% heat-inac-tivated fetal bovine serum (GE Healthcare) supplemented with 10% L-cell-conditioned medium as a source of CSF-1. After 1 day, nonad-
1. Nolan CJ, Damm P, Prentki M. Type 2 diabe-tes across generations: from pathophysiol-ogy to prevention and management. Lancet. 2011;378(9786):169–181.
2. Aouadi M, et al. Gene silencing in adipose tissue macrophages regulates whole-body metabo-lism in obese mice. Proc Natl Acad Sci U S A. 2013;110(20):8278–8283.
3. Weisberg SP, et al. Obesity is associated with macrophage accumulation in adipose tissue. J Clin Invest. 2003;112(12):1796–1808.
4. Odegaard JI, Chawla A. Pleiotropic actions of
insulin resistance and inflammation in metabolic homeostasis. Science. 2013;339(6116):172–177.
5. Olefsky JM, Glass CK. Macrophages, inflamma-tion, and insulin resistance. Annu Rev Physiol. 2010;72:219–246.
6. Johnson AM, Olefsky JM. The origins and drivers of insulin resistance. Cell. 2013;152(4):673–684.
7. Osborn O, Olefsky JM. The cellular and signaling networks linking the immune system and metab-olism in disease. Nat Med. 2012;18(3):363–374.
8. Kennedy A, Webb CD, Hill AA, Gruen ML, Jackson LG, Hasty AH. Loss of CCR5 results in glucose
intolerance in diet-induced obese mice. Am J Physiol Endocrinol Metab. 2013;305(7):E897–E906.
9. Lim J, et al. C5aR and C3aR antagonists each inhibit diet-induced obesity, metabolic dysfunc-tion, and adipocyte and macrophage signaling. FASEB J. 2013;27(2):822–831.
10. Macia L, et al. Neuropeptide y1 receptor in immune cells regulates inflammation and insulin resistance associated with diet-induced obesity. Diabetes. 2012;61(12):3228–3238.
11. Oh DY, et al. GPR120 is an omega-3 fatty acid receptor mediating potent anti-inflam-
The Journal of Clinical Investigation R e s e a R c h a R t i c l e
5 4 3 5jci.org Volume 124 Number 12 December 2014
matory and insulin-sensitizing effects. Cell. 2010;142(5):687–698.
12. Osborn O, et al. G protein-coupled recep-tor 21 deletion improves insulin sensitiv-ity in diet-induced obese mice. J Clin Invest. 2012;122(7):2444–2453.
13. Phieler J, et al. The complement anaphylatoxin C5a receptor contributes to obese adipose tissue inflammation and insulin resistance. J Immunol. 2013;191(8):4367–4374.
14. Poursharifi P, et al. C5L2 and C5aR interaction in adipocytes and macrophages: insights into adi-poimmunology. Cell Signal. 2013;25(4):910–918.
15. Hov JR, et al. Mutational characterization of the bile acid receptor TGR5 in primary sclerosing cholangitis. PLoS One. 2010;5(8):e12403.
16. Keitel V, Cupisti K, Ullmer C, Knoefel WT, Kubitz R, Haussinger D. The membrane-bound bile acid receptor TGR5 is localized in the epi-thelium of human gallbladders. Hepatology. 2009;50(3):861–870.
17. Masyuk AI, et al. Ciliary subcellular localization of TGR5 determines the cholangiocyte functional response to bile acid signaling. Am J Physiol Gastro-intest Liver Physiol. 2013;304(11):G1013–G1024.
18. Pean N, et al. The receptor TGR5 protects the liver from bile acid overload during liver regener-ation in mice. Hepatology. 2013;58(4):1451–1460.
19. Vassileva G, et al. Targeted deletion of Gpbar1 protects mice from cholesterol gallstone forma-tion. Biochem J. 2006;398(3):423–430.
20. Lavoie B, et al. Hydrophobic bile salts inhibit gallbladder smooth muscle function via stimula-tion of GPBAR1 receptors and activation of KATP channels. J Physiol. 2010;588(pt 17):3295–3305.
21. Li T, et al. The G protein-coupled bile acid recep-tor, TGR5, stimulates gallbladder filling. Mol Endocrinol. 2011;25(6):1066–1071.
22. Alemi F, et al. The receptor TGR5 mediates the prokinetic actions of intestinal bile acids and is required for normal defecation in mice. Gastroen-terology. 2013;144(1):145–154.
23. Poole DP, et al. Expression and function of the bile acid receptor GpBAR1 (TGR5) in the murine enteric nervous system. Neurogastroenterol Motil. 2010;22(7):814–825.
24. Ward JB, Mroz MS, Keely SJ. The bile acid recep-tor, TGR5, regulates basal and cholinergic-induced secretory responses in rat colon. Neuro-gastroenterol Motil. 2013;25(8):708–711.
25. Alemi F, et al. The TGR5 receptor mediates bile acid-induced itch and analgesia. J Clin Invest. 2013;123(4):1513–1530.
26. Thomas C, et al. TGR5-mediated bile acid sens-ing controls glucose homeostasis. Cell Metab. 2009;10(3):167–177.
27. Watanabe M, et al. Bile acids induce energy expenditure by promoting intracel-lular thyroid hormone activation. Nature. 2006;439(7075):484–489.
28. Harach T, et al. TGR5 potentiates GLP-1 secre-tion in response to anionic exchange resins. Sci Rep. 2012;2:430.
29. Potthoff MJ, et al. Colesevelam suppresses hepat-ic glycogenolysis by TGR5-mediated induction of GLP-1 action in DIO mice. Am J Physiol Gastro-intest Liver Physiol. 2013;304(4):G371–G380.
30. Kumar DP, et al. Activation of transmembrane
bile acid receptor TGR5 stimulates insulin secre-tion in pancreatic beta cells. Biochem Biophys Res Commun. 2012;427(3):600–605.
31. Cipriani S, et al. The bile acid receptor GPBAR-1 (TGR5) modulates integrity of intestinal barrier and immune response to experimental colitis. PLoS One. 2011;6(10):e25637.
32. Haselow K, et al. Bile acids PKA-dependently induce a switch of the IL-10/IL-12 ratio and reduce proinflammatory capability of human macro-phages. J Leukoc Biol. 2013;94(6):1253–1264.
33. Kawamata Y, et al. A G protein-coupled recep-tor responsive to bile acids. J Biol Chem. 2003;278(11):9435–9440.
34. Pols TW, et al. TGR5 activation inhibits athero-sclerosis by reducing macrophage inflammation and lipid loading. Cell Metab. 2011;14(6):747–757.
35. Wang YD, Chen WD, Yu D, Forman BM, Huang W. The G-protein-coupled bile acid receptor, Gpbar1 (TGR5), negatively regulates hepatic inflammatory response through antagonizing nuclear factor kappa light-chain enhancer of activated B cells (NF-κB) in mice. Hepatology. 2011;54(4):1421–1432.
36. Yoneno K, et al. TGR5 signalling inhibits the production of pro-inflammatory cytokines by in vitro differentiated inflammatory and intestinal macrophages in Crohn’s disease. Immunology. 2013;139(1):19–29.
37. Chawla A, Nguyen KD, Goh YP. Macrophage-mediated inflammation in metabolic disease. Nat Rev Immunol. 2011;11(11):738–749.
38. Chmelar J, Chung KJ, Chavakis T. The role of innate immune cells in obese adipose tissue inflammation and development of insulin resis-tance. Thromb Haemost. 2013;109(3):399–406.
39. Lumeng CN, Saltiel AR. Inflammatory links between obesity and metabolic disease. J Clin Invest. 2011;121(6):2111–2117.
40. Han MS, et al. JNK expression by macrophages promotes obesity-induced insulin resistance and inflammation. Science. 2013;339(6116):218–222.
41. Wynn TA, Chawla A, Pollard JW. Macrophage biology in development, homeostasis and dis-ease. Nature. 2013;496(7446):445–455.
42. Clausen BE, Burkhardt C, Reith W, Renkawitz R, Forster I. Conditional gene targeting in mac-rophages and granulocytes using LysMcre mice. Transgenic Res. 1999;8(4):265–277.
43. Pellicciari R, et al. Discovery of 6α-ethyl-23(S)-methylcholic acid (S-EMCA, INT-777) as a potent and selective agonist for the TGR5 recep-tor, a novel target for diabesity. J Med Chem. 2009;52(24):7958–7961.
44. Sato H, et al. Novel potent and selective bile acid derivatives as TGR5 agonists: biological screening, structure-activity relationships, and molecular modeling studies. J Med Chem. 2008;51(6):1831–1841.
45. Doherty TM, Kastelein R, Menon S, Andrade S, Coffman RL. Modulation of murine macrophage function by IL-13. J Immunol. 1993;151(12):7151–7160.
46. Doyle AG, et al. Interleukin-13 alters the acti-vation state of murine macrophages in vitro: comparison with interleukin-4 and interferon-gamma. Eur J Immunol. 1994;24(6):1441–1445.
47. Stein M, Keshav S, Harris N, Gordon S. Interleu-
kin 4 potently enhances murine macrophage mannose receptor activity: a marker of alterna-tive immunologic macrophage activation. J Exp Med. 1992;176(1):287–292.
48. Mantovani A, Sica A, Sozzani S, Allavena P, Vec-chi A, Locati M. The chemokine system in diverse forms of macrophage activation and polarization. Trends Immunol. 2004;25(12):677–686.
49. Donath MY, Shoelson SE. Type 2 diabetes as an inflammatory disease. Nat Rev Immunol. 2011;11(2):98–107.
50. Ogawa S, et al. Molecular determinants of cross-talk between nuclear receptors and toll-like receptors. Cell. 2005;122(5):707–721.
51. Poli V. The role of C/EBP isoforms in the control of inflammatory and native immunity functions. J Biol Chem. 1998;273(45):29279–29282.
52. Descombes P, Schibler U. A liver-enriched tran-scriptional activator protein, LAP, and a tran-scriptional inhibitory protein, LIP, are translated from the same mRNA. Cell. 1991;67(3):569–579.
53. Arnal-Estape A, et al. HER2 silences tumor suppression in breast cancer cells by switching expression of C/EBPss isoforms. Cancer Res. 2010;70(23):9927–9936.
54. Calkhoven CF, Muller C, Leutz A. Translational control of C/EBPα and C/EBPβ isoform expres-sion. Genes Dev. 2000;14(15):1920–1932.
55. Dey S, Savant S, Teske BF, Hatzoglou M, Calk-hoven CF, Wek RC. Transcriptional repression of ATF4 gene by CCAAT/enhancer-binding protein beta (C/EBPβ) differentially regu-lates integrated stress response. J Biol Chem. 2012;287(26):21936–21949.
56. Bradley MN, Zhou L, Smale ST. C/EBPβ regula-tion in lipopolysaccharide-stimulated macro-phages. Mol Cell Biol. 2003;23(14):4841–4858.
57. Lawrence JC Jr, Abraham RT. PHAS/4E-BPs as regulators of mRNA translation and cell prolif-eration. Trends Biochem Sci. 1997;22(9):345–349.
58. Spooner CJ, Guo X, Johnson PF, Schwartz RC. Differential roles of C/EBPβ regulatory domains in specifying MCP-1 and IL-6 transcription. Mol Immunol. 2007;44(6):1384–1392.
59. Spooner CJ, et al. C/EBPβ serine 64, a phospho-acceptor site, has a critical role in LPS-induced IL-6 and MCP-1 transcription. Cytokine. 2007;37(2):119–127.
60. Hu HM, et al. The C/EBP bZIP domain can mediate lipopolysaccharide induction of the pro-inflammatory cytokines interleukin-6 and mono-cyte chemoattractant protein-1. J Biol Chem. 2000;275(21):16373–16381.
61. Cloutier A, Guindi C, Larivee P, Dubois CM, Amrani A, McDonald PP. Inflammatory cyto-kine production by human neutrophils involves C/EBP transcription factors. J Immunol. 2009;182(1):563–571.
62. Zhang Z, Bryan JL, DeLassus E, Chang LW, Liao W, Sandell LJ. CCAAT/enhancer-binding protein β and NF-κB mediate high level expression of chemokine genes CCL3 and CCL4 by human chondrocytes in response to IL-1β. J Biol Chem. 2010;285(43):33092–33103.
63. Gregor MF, Hotamisligil GS. Inflammatory mechanisms in obesity. Annu Rev Immunol. 2011;29:415–445.
64. Glass CK, Olefsky JM. Inflammation and lipid
The Journal of Clinical Investigation R e s e a R c h a R t i c l e
5 4 3 6 jci.org Volume 124 Number 12 December 2014
signaling in the etiology of insulin resistance. Cell Metab. 2012;15(5):635–645.
65. Lumeng CN, Deyoung SM, Bodzin JL, Saltiel AR. Increased inflammatory properties of adipose tissue macrophages recruited during diet-induced obesity. Diabetes. 2007;56(1):16–23.
66. Odegaard JI, et al. Macrophage-specific PPARgamma controls alternative activa-tion and improves insulin resistance. Nature. 2007;447(7148):1116–1120.
67. Kanda H, et al. MCP-1 contributes to macrophage infiltration into adipose tissue, insulin resistance, and hepatic steatosis in obesity. J Clin Invest. 2006;116(6):1494–1505.
68. Nio Y, et al. Monocyte chemoattractant protein-1 (MCP-1) deficiency enhances alternatively activated M2 macrophages and ameliorates insulin resistance and fatty liver in lipoatrophic diabetic A-ZIP transgenic mice. Diabetologia. 2012;55(12):3350–3358.
69. Tamura Y, et al. Inhibition of CCR2 amelio-rates insulin resistance and hepatic steatosis in db/db mice. Arterioscler Thromb Vasc Biol. 2008;28(12):2195–2201.
70. Weisberg SP, et al. CCR2 modulates inflamma-tory and metabolic effects of high-fat feeding. J Clin Invest. 2006;116(1):115–124.
71. Amano SU, et al. Local proliferation of macrophages contributes to obesity-associated adipose tissue inflammation. Cell Metab. 2014;19(1):162–171.
72. Xiong W, Hsieh CC, Kurtz AJ, Rabek JP, Papa-constantinou J. Regulation of CCAAT/enhancer-binding protein-β isoform synthesis by alterna-tive translational initiation at multiple AUG start sites. Nucleic Acids Res. 2001;29(14):3087–3098.
73. Smink JJ, Begay V, Schoenmaker T, Sterneck E, de Vries TJ, Leutz A. Transcription factor C/EBPβ isoform ratio regulates osteoclastogenesis through MafB. EMBO J. 2009;28(12):1769–1781.
74. Hata K, et al. A CCAAT/enhancer binding protein beta isoform, liver-enriched inhibitory protein,
regulates commitment of osteoblasts and adipo-cytes. Mol Cell Biol. 2005;25(5):1971–1979.
75. Harrison JR, et al. Col1a1 promoter-targeted expression of p20 CCAAT enhancer-binding protein beta (C/EBPβ), a truncated C/EBPβ iso-form, causes osteopenia in transgenic mice. J Biol Chem. 2005;280(9):8117–8124.
76. Zahnow CA, Cardiff RD, Laucirica R, Medina D, Rosen JM. A role for CCAAT/enhancer binding protein β-liver-enriched inhibitory protein in mammary epithelial cell proliferation. Cancer Res. 2001;61(1):261–269.
77. Smink JJ, Tunn PU, Leutz A. Rapamycin inhibits osteoclast formation in giant cell tumor of bone through the C/EBPβ-MafB axis. J Mol Med (Berl). 2012;90(1):25–30.
78. Luedde T, et al. C/EBPβ isoforms LIP and LAP modulate progression of the cell cycle in the regenerating mouse liver. Hepatology. 2004;40(2):356–365.
79. Rahman SM, et al. CCAAT/enhancer-binding protein beta (C/EBPβ) expression regulates dietary-induced inflammation in macro-phages and adipose tissue in mice. J Biol Chem. 2012;287(41):34349–34360.
80. Wang L, et al. Increased insulin receptor substrate-1 and enhanced skeletal muscle insulin sensitivity in mice lacking CCAAT/enhancer-binding protein β. J Biol Chem. 2000;275(19):14173–14181.
81. Wethmar K, et al. C/EBPbetaDeltauORF mice--a genetic model for uORF-mediated translational control in mammals. Genes Dev. 2010;24(1):15–20.
82. Dooher JE, Paz-Priel I, Houng S, Baldwin AS Jr, Friedman AD. C/EBPα, C/EBPα oncoproteins, or C/EBPβ preferentially bind NF-kappaB p50 compared with p65, focusing therapeutic target-ing on the C/EBP:p50 interaction. Mol Cancer Res. 2011;9(10):1395–1405.
83. LeClair KP, Blanar MA, Sharp PA. The p50
subunit of NF-κB associates with the NF-IL6 transcription factor. Proc Natl Acad Sci U S A. 1992;89(17):8145–8149.
84. Matsusaka T, et al. Transcription factors NF-IL6 and NF-κB synergistically activate transcrip-tion of the inflammatory cytokines, interleukin 6 and interleukin 8. Proc Natl Acad Sci U S A. 1993;90(21):10193–10197.
85. Stein B, Cogswell PC, Baldwin AS Jr. Functional and physical associations between NF-κB and C/EBP family members: a Rel domain-bZIP inter-action. Mol Cell Biol. 1993;13(7):3964–3974.
86. Shaham O, et al. Metabolic profiling of the human response to a glucose challenge reveals distinct axes of insulin sensitivity. Mol Syst Biol. 2008;4:214.
87. Pols TW, Noriega LG, Nomura M, Auwerx J, Schoonjans K. The bile acid membrane recep-tor TGR5: a valuable metabolic target. Dig Dis. 2011;29(1):37–44.
88. Pols TW, Noriega LG, Nomura M, Auwerx J, Schoonjans K. The bile acid membrane receptor TGR5 as an emerging target in metabolism and inflammation. J Hepatol. 2011;54(6):1263–1272.
89. Katsuma S, Hirasawa A, Tsujimoto G. Bile acids promote glucagon-like peptide-1 secretion through TGR5 in a murine enteroendocrine cell line STC-1. Biochem Biophys Res Commun. 2005;329(1):386–390.
90. Argmann CA, Champy MF, Auwerx J. Evalua-tion of energy homeostasis. Curr Protoc Mol Biol. 2006;Chapter 29:Unit 29B.1.
91. Matthews DR, Hosker JP, Rudenski AS, Naylor BA, Treacher DF, Turner RC. Homeostasis model assessment: insulin resistance and β-cell function from fasting plasma glucose and insulin concentrations in man. Diabetologia. 1985;28(7):412–419.
92. Mark M, et al. Histopathology in mouse metabolic investigations. Curr Protoc Mol Biol. 2007;Chapter 29:Unit 29B.4.


![mTOR signaling in kidney diseases...Sep 03, 2020 · The mTOR pathway regulates cell growth, proliferation, survival and metabolism [4]. Dysregulation of mTOR signaling disrupts renal](https://img.pdfslide.us/doc/110x75/608faa7a471c847b5d397b8c/mtor-signaling-in-kidney-diseases-sep-03-2020-the-mtor-pathway-regulates.jpg)