Embed Size (px)
Citation preview

TFEIP 2012, Bern
Tinus Pulles
Outline
Present day reporting and available EFs
Measurements of HM contents in fuels
The contribution from lube oils
Copare our estimates with the countries’ estimates
Tinus Pulles
TFEIP 2012, Bern
May 14, 20122
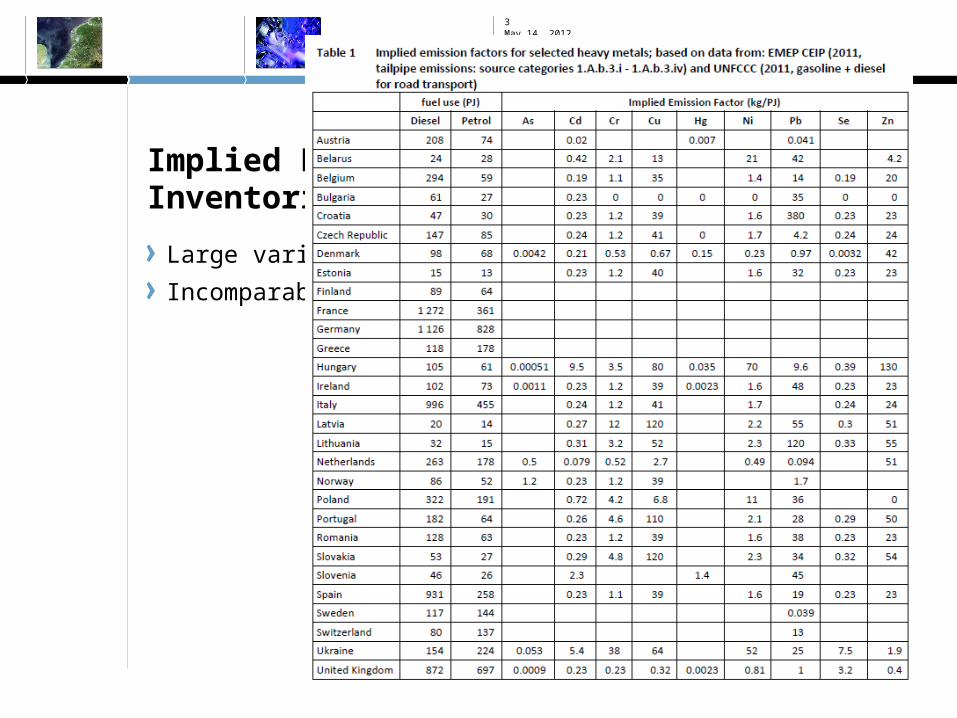
Implied Emission Factors in National Inventories
Large variation
Incomparable?
Tinus Pulles
TFEIP 2012, Bern
May 14, 20123
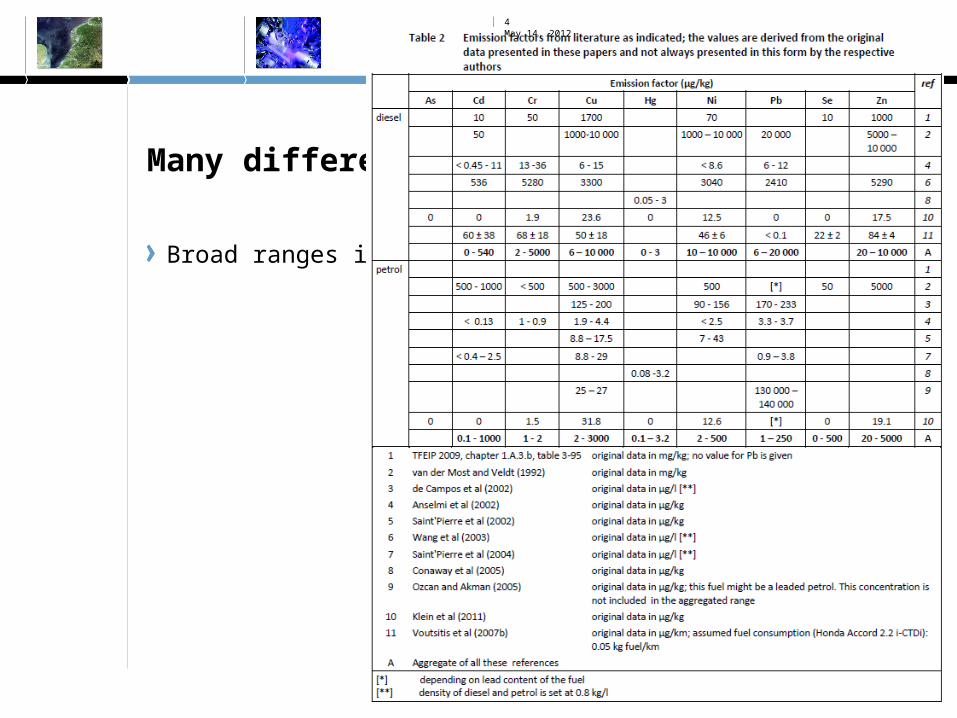
Many different EFs fly around
Broad ranges in EFs as published in the literature
Tinus Pulles
TFEIP 2012, Bern
May 14, 20124
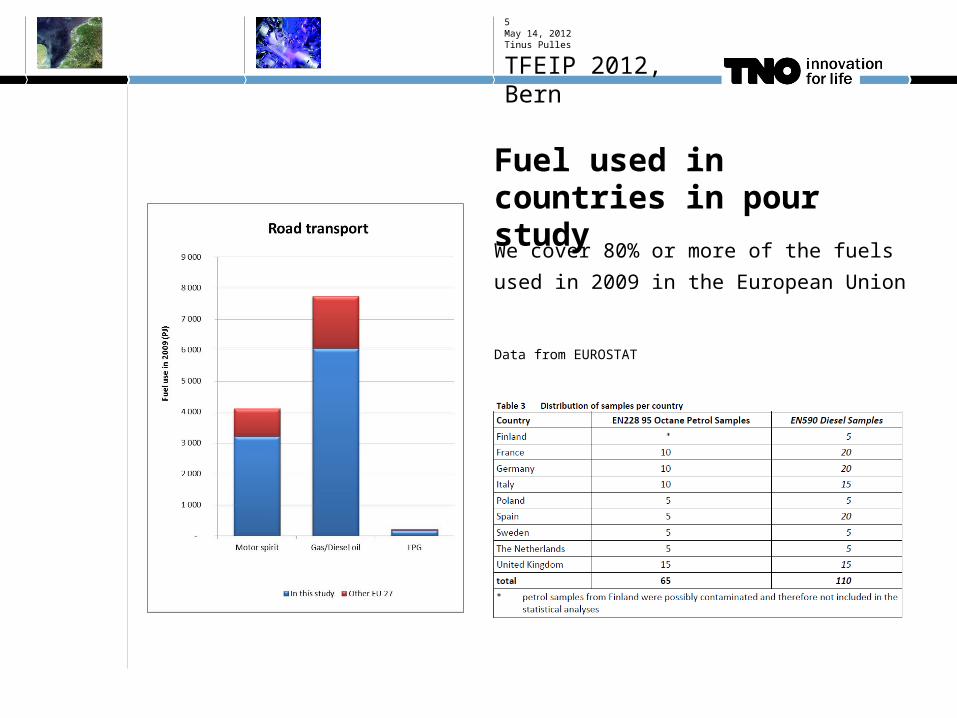
Fuel used in countries in pour study
We cover 80% or more of the fuels
used in 2009 in the European Union
Data from EUROSTAT
Tinus Pulles
TFEIP 2012, Bern
May 14, 20125
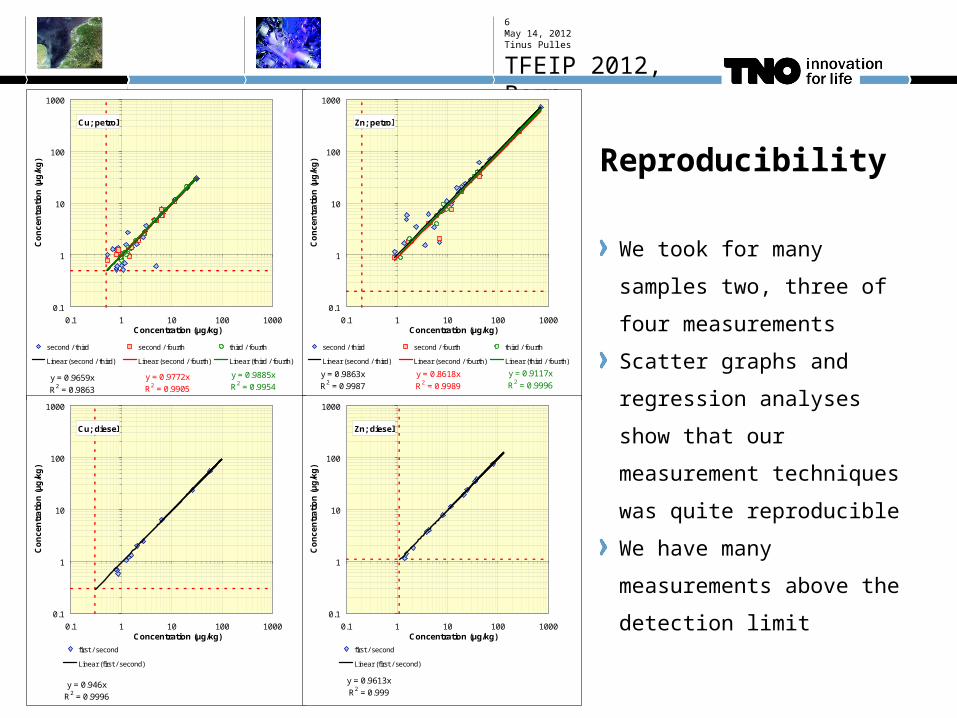
Reproducibility
We took for many samples
two, three of four
measurements
Scatter graphs and regression
analyses show that our
measurement techniques was
quite reproducible
We have many measurements
above the detection limit
May 14, 2012Tinus Pulles
TFEIP 2012, Bern
6
Cu; petrol
y = 0.9659x
R2 = 0.9863
y = 0.9772x
R2 = 0.9905
y = 0.9885x
R2 = 0.9954
0.1
1
10
100
1000
0.1 1 10 100 1000Concentration (µg/kg)
Co
nce
ntr
atio
n (
µg
/kg
)
second / third second / fourth third / fourth
Linear (second / third) Linear (second / fourth) Linear (third / fourth)
Zn; petrol
y = 0.9863x
R2 = 0.9987
y = 0.8618x
R2 = 0.9989
y = 0.9117x
R2 = 0.9996
0.1
1
10
100
1000
0.1 1 10 100 1000Concentration (µg/kg)
Co
nce
ntr
atio
n (
µg
/kg
)
second / third second / fourth third / fourth
Linear (second / third) Linear (second / fourth) Linear (third / fourth)
Cu; diesel
y = 0.946x
R2 = 0.9996
0.1
1
10
100
1000
0.1 1 10 100 1000Concentration (µg/kg)
Co
nce
ntr
atio
n (
µg
/kg
)
first / second
Linear (first / second)
Zn; diesel
y = 0.9613x
R2 = 0.999
0.1
1
10
100
1000
0.1 1 10 100 1000Concentration (µg/kg)
Co
nce
ntr
atio
n (
µg
/kg
)
first / second
Linear (first / second)
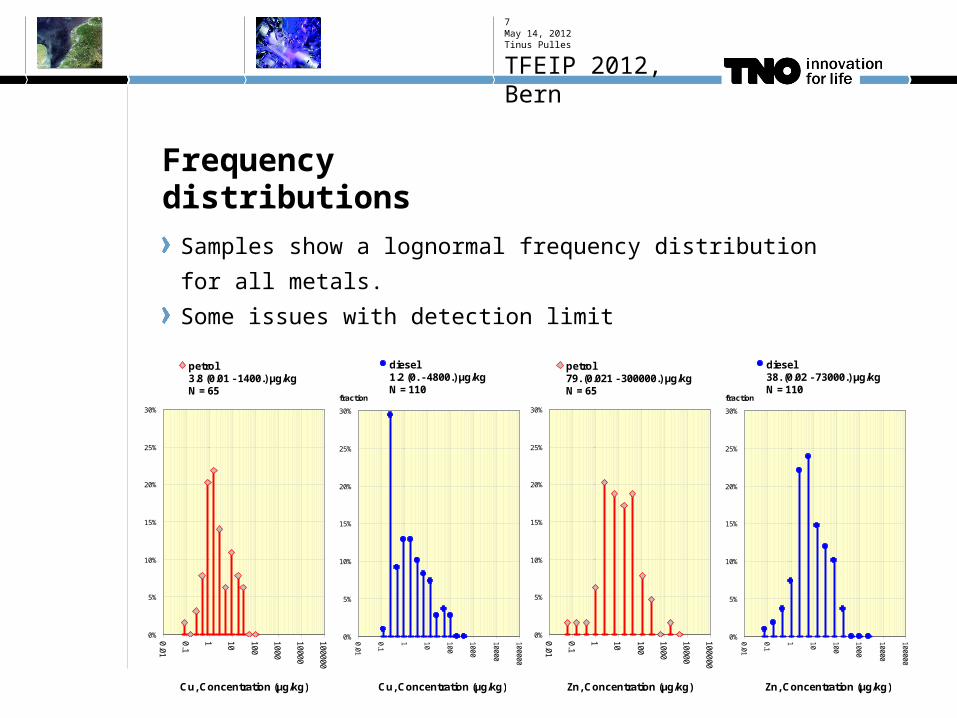
Frequency distributions
Samples show a lognormal frequency distribution for all metals.
Some issues with detection limit
May 14, 2012Tinus Pulles
TFEIP 2012, Bern
7
0%
5%
10%
15%
20%
25%
30%
0.01
0.1
1 10 100
1000
10000
100000
Cu, Concentration (µg/kg)
fraction
diesel1.2 (0. - 4800.) µg/kgN = 110
0%
5%
10%
15%
20%
25%
30%
0.01
0.1
1 10 100
1000
10000
100000
Cu, Concentration (µg/kg)
petrol3.8 (0.01 - 1400.) µg/kgN = 65
0%
5%
10%
15%
20%
25%
30%
0.01
0.1
1 10 100
1000
10000
100000
Zn, Concentration (µg/kg)
fraction
diesel38. (0.02 - 73000.) µg/kgN = 110
0%
5%
10%
15%
20%
25%
30%0.01
0.1
1 10 100
1000
10000
100000
Zn, Concentration (µg/kg)
petrol79. (0.021 - 300000.) µg/kgN = 65
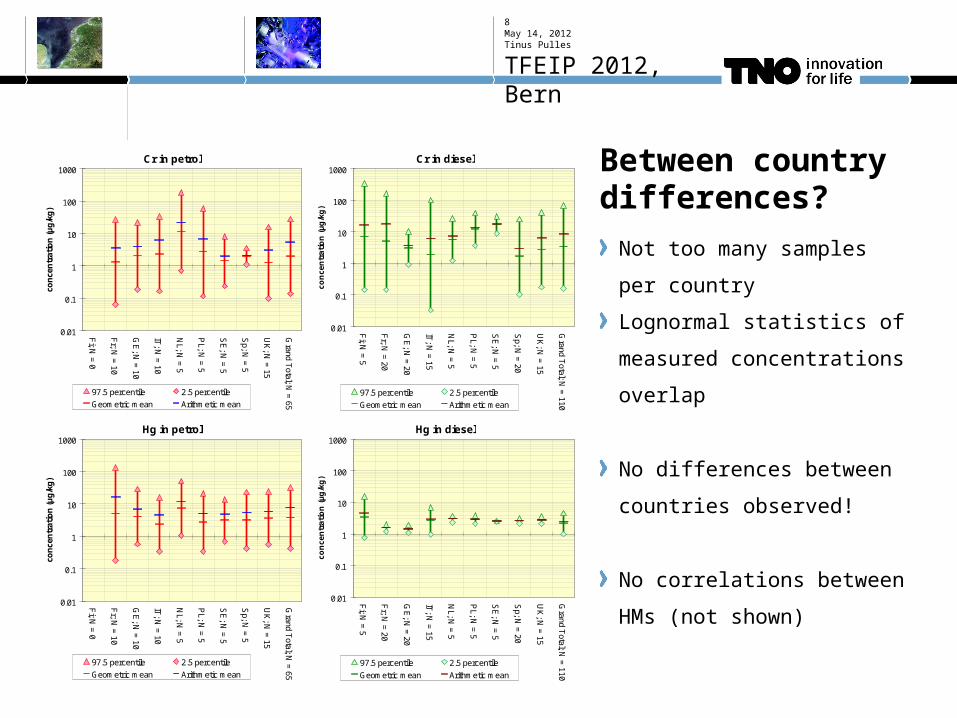
Between country differences?
Not too many samples per
country
Lognormal statistics of
measured concentrations
overlap
No differences between
countries observed!
No correlations between HMs
(not shown)
May 14, 2012Tinus Pulles
TFEIP 2012, Bern
8
Cr in petrol
0.01
0.1
1
10
100
1000
Fi; N
= 0
Fr; N
= 10
GE
; N =
10
IT; N
= 10
NL; N
= 5
PL; N
= 5
SE
; N =
5
Sp; N
= 5
UK
; N =
15
Grand T
otal; N =
65
con
cen
trat
ion
(µ
g/k
g)
97.5 percentile 2.5 percentile
Geometric mean Arithmetic mean
Cr in diesel
0.01
0.1
1
10
100
1000
Fi; N
= 5
Fr; N
= 20
GE
; N =
20
IT; N
= 15
NL; N
= 5
PL; N
= 5
SE
; N =
5
Sp; N
= 20
UK
; N =
15
Grand T
otal; N =
110
co
nc
en
tra
tio
n (
µg
/kg
)
97.5 percentile 2.5 percentile
Geometric mean Arithmetic mean
Hg in petrol
0.01
0.1
1
10
100
1000
Fi; N
= 0
Fr; N
= 10
GE
; N =
10
IT; N
= 10
NL; N
= 5
PL; N
= 5
SE
; N =
5
Sp; N
= 5
UK
; N =
15
Grand T
otal; N =
65
con
cen
trat
ion
(µ
g/k
g)
97.5 percentile 2.5 percentile
Geometric mean Arithmetic mean
Hg in diesel
0.01
0.1
1
10
100
1000
Fi; N
= 5
Fr; N
= 20
GE
; N =
20
IT; N
= 15
NL; N
= 5
PL; N
= 5
SE
; N =
5
Sp; N
= 20
UK
; N =
15
Grand T
otal; N =
110
co
nc
en
tra
tio
n (
µg
/kg
)
97.5 percentile 2.5 percentile
Geometric mean Arithmetic mean
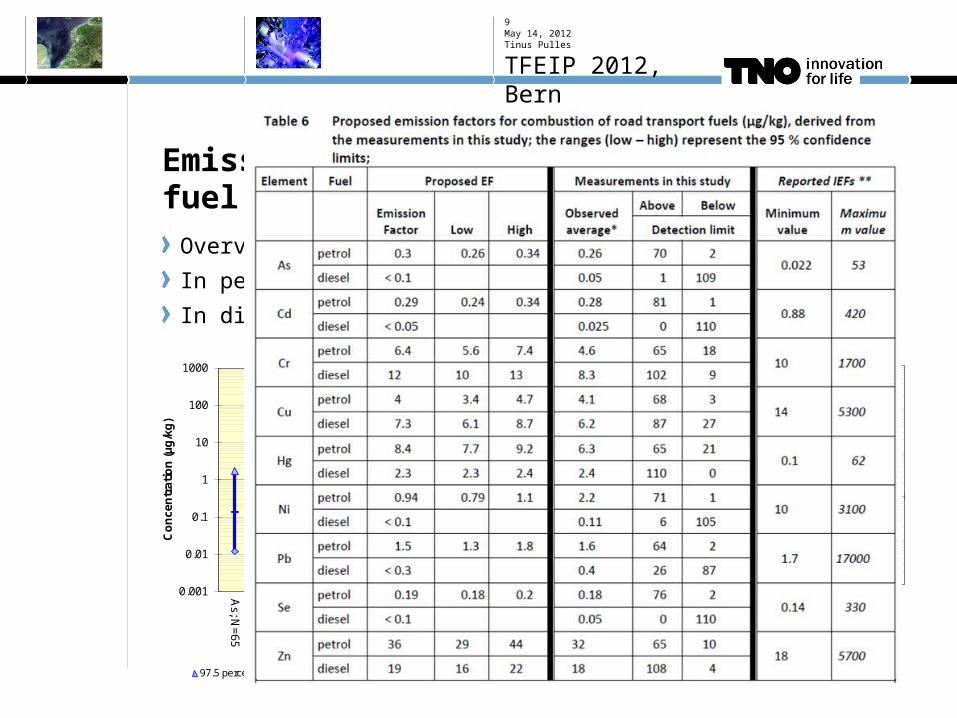
Emission factors from fuel
Overview of HM contents of fuels
In petrol all HMs are observed
In diesel AS, CD and SE are below detection limit
May 14, 2012Tinus Pulles
TFEIP 2012, Bern
9
0.001
0.01
0.1
1
10
100
1000
As; N
=65
Cd; N
=65
Cr; N
=6
5
Cu; N
=65
Hg; N
=65
Ni; N
=65
Pb; N
=65
Se; N
=65
Zn; N
=65
Co
nce
ntr
atio
n (
µg
/kg
)
petrol
97.5 percentile 2.5 percentile Geometric mean
0.01
0.1
1
10
100
1000A
s; N=
110
Cd
; N=
110
Cr; N
=11
0
Cu
; N=
110
Hg
; N=
110
Ni; N
=11
0
Pb; N
=11
0
Se; N
=11
0
Zn
; N=
110
diesel
97.5 percentile 2.5 percentile Geometric mean
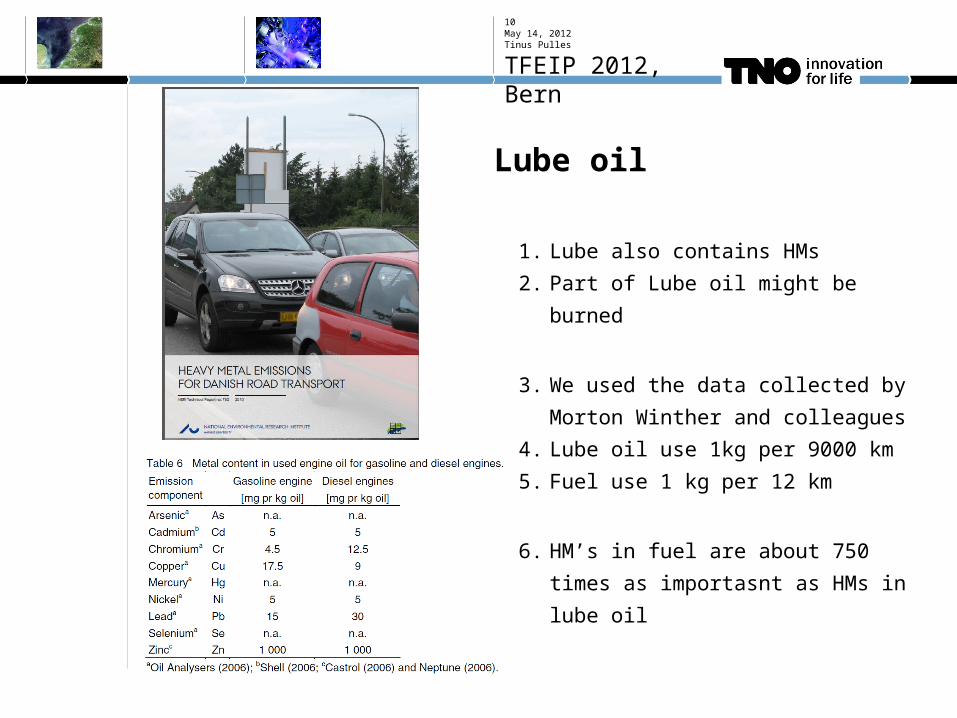
Lube oil
1. Lube also contains HMs
2. Part of Lube oil might be burned
3. We used the data collected by
Morton Winther and colleagues
4. Lube oil use 1kg per 9000 km
5. Fuel use 1 kg per 12 km
6. HM’s in fuel are about 750 times
as importasnt as HMs in lube oil
May 14, 2012Tinus Pulles
TFEIP 2012, Bern
10
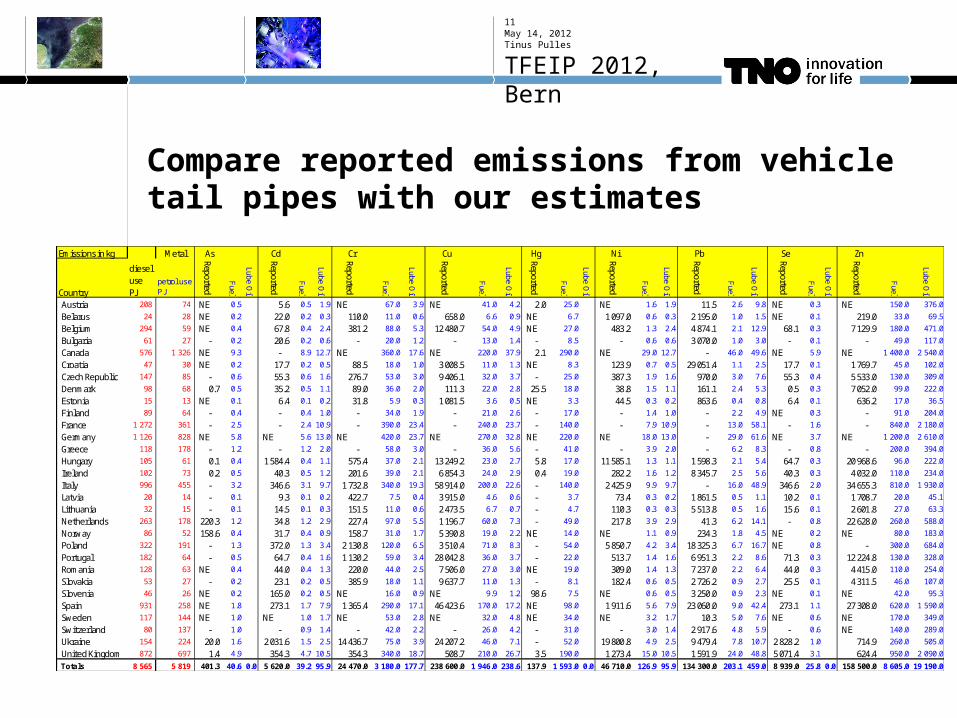
Compare reported emissions from vehicle tail pipes with our estimates
Emissions in kg Metal As Cd Cr Cu Hg Ni Pb Se Zn
Country
diesel usePJ
petrol usePJ
Reported
Fuel
Lube Oil
Reported
Fuel
Lube Oil
Reported
Fuel
Lube Oil
Reported
Fuel
Lube Oil
Reported
Fuel
Lube Oil
Reported
Fuel
Lube Oil
Reported
Fuel
Lube Oil
Reported
Fuel
Lube Oil
Reported
Fuel
Lube Oil
Austria 208 74 NE 0.5 5.6 0.5 1.9 NE 67.0 3.9 NE 41.0 4.2 2.0 25.0 NE 1.6 1.9 11.5 2.6 9.8 NE 0.3 NE 150.0 376.0
Belarus 24 28 NE 0.2 22.0 0.2 0.3 110.0 11.0 0.6 658.0 6.6 0.9 NE 6.7 1 097.0 0.6 0.3 2 195.0 1.0 1.5 NE 0.1 219.0 33.0 69.5
Belgium 294 59 NE 0.4 67.8 0.4 2.4 381.2 88.0 5.3 12 480.7 54.0 4.9 NE 27.0 483.2 1.3 2.4 4 874.1 2.1 12.9 68.1 0.3 7 129.9 180.0 471.0
Bulgaria 61 27 - 0.2 20.6 0.2 0.6 - 20.0 1.2 - 13.0 1.4 - 8.5 - 0.6 0.6 3 070.0 1.0 3.0 - 0.1 - 49.0 117.0
Canada 576 1 326 NE 9.3 - 8.9 12.7 NE 360.0 17.6 NE 220.0 37.9 2.1 290.0 NE 29.0 12.7 - 46.0 49.6 NE 5.9 NE 1 400.0 2 540.0
Croatia 47 30 NE 0.2 17.7 0.2 0.5 88.5 18.0 1.0 3 008.5 11.0 1.3 NE 8.3 123.9 0.7 0.5 29 051.4 1.1 2.5 17.7 0.1 1 769.7 45.0 102.0
Czech Republic 147 85 - 0.6 55.3 0.6 1.6 276.7 53.0 3.0 9 406.1 32.0 3.7 - 25.0 387.3 1.9 1.6 970.0 3.0 7.6 55.3 0.4 5 533.0 130.0 309.0
Denmark 98 68 0.7 0.5 35.2 0.5 1.1 89.0 36.0 2.0 111.3 22.0 2.8 25.5 18.0 38.8 1.5 1.1 161.1 2.4 5.3 0.5 0.3 7 052.0 99.0 222.0
Estonia 15 13 NE 0.1 6.4 0.1 0.2 31.8 5.9 0.3 1 081.5 3.6 0.5 NE 3.3 44.5 0.3 0.2 863.6 0.4 0.8 6.4 0.1 636.2 17.0 36.5
Finland 89 64 - 0.4 - 0.4 1.0 - 34.0 1.9 - 21.0 2.6 - 17.0 - 1.4 1.0 - 2.2 4.9 NE 0.3 - 91.0 204.0
France 1 272 361 - 2.5 - 2.4 10.9 - 390.0 23.4 - 240.0 23.7 - 140.0 - 7.9 10.9 - 13.0 58.1 - 1.6 - 840.0 2 180.0
Germany 1 126 828 NE 5.8 NE 5.6 13.0 NE 420.0 23.7 NE 270.0 32.8 NE 220.0 NE 18.0 13.0 - 29.0 61.6 NE 3.7 NE 1 200.0 2 610.0
Greece 118 178 - 1.2 - 1.2 2.0 - 58.0 3.0 - 36.0 5.6 - 41.0 - 3.9 2.0 - 6.2 8.3 - 0.8 - 200.0 394.0
Hungary 105 61 0.1 0.4 1 584.4 0.4 1.1 575.4 37.0 2.1 13 249.2 23.0 2.7 5.8 17.0 11 585.1 1.3 1.1 1 598.3 2.1 5.4 64.7 0.3 20 968.6 96.0 222.0
Ireland 102 73 0.2 0.5 40.3 0.5 1.2 201.6 39.0 2.1 6 854.3 24.0 2.9 0.4 19.0 282.2 1.6 1.2 8 345.7 2.5 5.6 40.3 0.3 4 032.0 110.0 234.0
Italy 996 455 - 3.2 346.6 3.1 9.7 1 732.8 340.0 19.3 58 914.0 200.0 22.6 - 140.0 2 425.9 9.9 9.7 - 16.0 48.9 346.6 2.0 34 655.3 810.0 1 930.0
Latvia 20 14 - 0.1 9.3 0.1 0.2 422.7 7.5 0.4 3 915.0 4.6 0.6 - 3.7 73.4 0.3 0.2 1 861.5 0.5 1.1 10.2 0.1 1 708.7 20.0 45.1
Lithuania 32 15 - 0.1 14.5 0.1 0.3 151.5 11.0 0.6 2 473.5 6.7 0.7 - 4.7 110.3 0.3 0.3 5 513.8 0.5 1.6 15.6 0.1 2 601.8 27.0 63.3
Netherlands 263 178 220.3 1.2 34.8 1.2 2.9 227.4 97.0 5.5 1 196.7 60.0 7.3 - 49.0 217.8 3.9 2.9 41.3 6.2 14.1 - 0.8 22 628.0 260.0 588.0
Norway 86 52 158.6 0.4 31.7 0.4 0.9 158.7 31.0 1.7 5 390.8 19.0 2.2 NE 14.0 NE 1.1 0.9 234.3 1.8 4.5 NE 0.2 NE 80.0 183.0
Poland 322 191 - 1.3 372.0 1.3 3.4 2 130.8 120.0 6.5 3 510.4 71.0 8.3 - 54.0 5 850.7 4.2 3.4 18 325.3 6.7 16.7 NE 0.8 - 300.0 684.0
Portugal 182 64 - 0.5 64.7 0.4 1.6 1 130.2 59.0 3.4 28 042.8 36.0 3.7 - 22.0 513.7 1.4 1.6 6 951.3 2.2 8.6 71.3 0.3 12 224.8 130.0 328.0
Romania 128 63 NE 0.4 44.0 0.4 1.3 220.0 44.0 2.5 7 506.0 27.0 3.0 NE 19.0 309.0 1.4 1.3 7 237.0 2.2 6.4 44.0 0.3 4 415.0 110.0 254.0
Slovakia 53 27 - 0.2 23.1 0.2 0.5 385.9 18.0 1.1 9 637.7 11.0 1.3 - 8.1 182.4 0.6 0.5 2 726.2 0.9 2.7 25.5 0.1 4 311.5 46.0 107.0
Slovenia 46 26 NE 0.2 165.0 0.2 0.5 NE 16.0 0.9 NE 9.9 1.2 98.6 7.5 NE 0.6 0.5 3 250.0 0.9 2.3 NE 0.1 NE 42.0 95.3
Spain 931 258 NE 1.8 273.1 1.7 7.9 1 365.4 290.0 17.1 46 423.6 170.0 17.2 NE 98.0 1 911.6 5.6 7.9 23 060.0 9.0 42.4 273.1 1.1 27 308.0 620.0 1 590.0
Sweden 117 144 NE 1.0 NE 1.0 1.7 NE 53.0 2.8 NE 32.0 4.8 NE 34.0 NE 3.2 1.7 10.3 5.0 7.6 NE 0.6 NE 170.0 349.0
Switzerland 80 137 - 1.0 - 0.9 1.4 - 42.0 2.2 - 26.0 4.2 - 31.0 - 3.0 1.4 2 917.6 4.8 5.9 - 0.6 NE 140.0 289.0
Ukraine 154 224 20.0 1.6 2 031.6 1.5 2.5 14 436.7 75.0 3.9 24 207.2 46.0 7.1 - 52.0 19 800.8 4.9 2.5 9 479.4 7.8 10.7 2 828.2 1.0 714.9 260.0 505.0
United Kingdom 872 697 1.4 4.9 354.3 4.7 10.5 354.3 340.0 18.7 508.7 210.0 26.7 3.5 190.0 1 273.4 15.0 10.5 1 591.9 24.0 48.8 5 071.4 3.1 624.4 950.0 2 090.0
Totals 8 565 5 819 401.3 40.6 0.0 5 620.0 39.2 95.9 24 470.0 3 180.0 177.7 238 600.0 1 946.0 238.6 137.9 1 593.0 0.0 46 710.0 126.9 95.9 134 300.0 203.1 459.0 8 939.0 25.8 0.0 158 500.0 8 605.0 19 190.0
May 14, 2012Tinus Pulles
TFEIP 2012, Bern
11
Conclusions
Heavy metals have been measured in petrol and diesel on the market
in Europe and EFs have been derived
HM concentrations vary over a broad range, but are in the ppb
range (a few 17 tenths of a ppb to a few hundred ppb for all metals)
No differences between countries detected
The fuel based emission factors as derived in this study are compared
with those related to lubricant use as published by Winther and Slentø
(2010). For most HMs studied here, this would lead to an two to
fourfold increase of the tailpipe emissions as derived from the fuel
concentrations.
Many countries overestimate HM emisisons from vehicles’ tail pipes
May 14, 2012Tinus Pulles
TFEIP 2012, Bern
12