Embed Size (px)
Citation preview

Portland State University Portland State University
PDXScholar PDXScholar
Engineering and Technology Management Faculty Publications and Presentations Engineering and Technology Management
1-1-2004
TFDEA: A New Approach for Technology Forecasting TFDEA: A New Approach for Technology Forecasting
of New Product Development Targets of New Product Development Targets
Lane Inman
Timothy R. Anderson Portland State University, [email protected]
Follow this and additional works at: https://pdxscholar.library.pdx.edu/etm_fac
Part of the Engineering Commons
Let us know how access to this document benefits you.
Citation Details Citation Details Inman, L. and Anderson, T., TFDEA: A New Approach for Technology Forecasting of New Product Development Targets. Portland International Conference on Management of Engineering and Technology (PICMET 04)
This Conference Proceeding is brought to you for free and open access. It has been accepted for inclusion in Engineering and Technology Management Faculty Publications and Presentations by an authorized administrator of PDXScholar. Please contact us if we can make this document more accessible: [email protected].

TFDEA: A New Approach for Technology Forecasting of New Product Development Targets
Lane Inman,Veritas, Inc.
Tim AndersonPortland State University

Presentation FlowIntroduction
Application
TFDEA
Tech. Forecasting
Conclusions
DEA
Introduction
TFDEA
DEAIntroduction
Application
TFDEA
TPC-C
Tech. Forecasting
DEAState of the Art
General Practice
Example
General Practice

Introduction● GAP1: Current quantitative technology
forecasting techniques do not handle variable trade-offs.
● GAP2: Current DEA tools do not handle single occurrence DMUs with variable time periods.
Introduction
Application
TFDEA
Tech. Forecasting
Conclusions
DEA
Introduction
TFDEA
DEA

Research Objectives● Methodology:
– Develop a methodology for technology forecasting which provides a robust means to measure the SOA and its progress by extending current temporal DEA to allow for DMUs which are introduced only once at irregular intervals.
● Application:– Apply the methodology to a straight forward real
world application.
Introduction
Application
TFDEA
Tech. Forecasting
Conclusions
DEA
Introduction
TFDEA
DEA

Technology Forecasting
● What is technology forecasting?– “to predict the future characteristics of a
useful machine”
● What's a machine?– Not only physical devices, but tools,
techniques and procedures that provide some function to an end-user.
J. P. Martino, "Technological Forecasting for the Chemical Process Industries," Chemical Engineering, pp. 54-62, 1971.
Introduction
Application
TFDEA
Tech. Forecasting
Conclusions
DEA
Introduction
TFDEA
DEA

Product
What is technology?
Structure Function
Technology
*Knight '74
Introduction
Application
TFDEA
Tech. Forecasting
Conclusions
DEA
Introduction
TFDEA
DEA
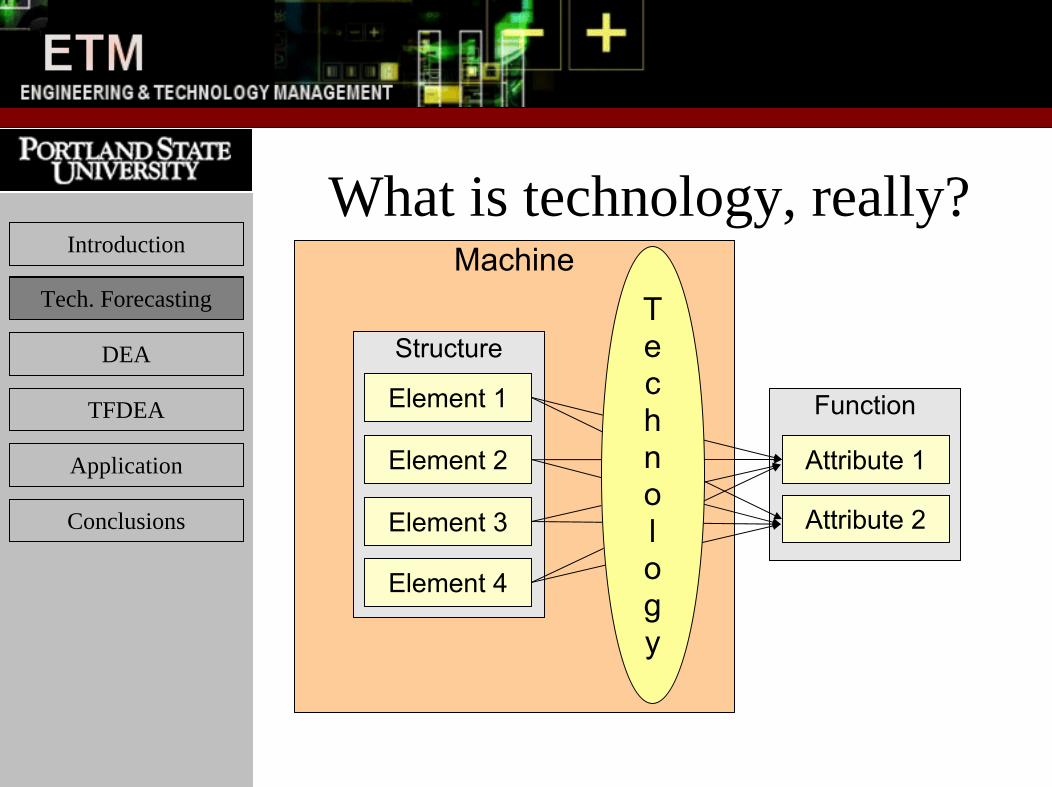
Machine
What is technology, really?
Structure
Function
Attribute 2
Attribute 1
Element 4
Element 3
Element 2
Element 1
Technology
Introduction
Application
TFDEA
Tech. Forecasting
Conclusions
DEA
Introduction
TFDEA
DEA

How is it currently done?
Monitoring
Scenarios
Modellingand
Simulation
ExpertOpinion
Extrapolation
Understanding
Definition Exploration RefinementIntroduction
Application
TFDEA
Tech. Forecasting
Conclusions
DEA
Introduction
TFDEA
DEA

What are the challenges?● It is difficult to assign a single attribute to
the measurement of a technology.● Typically only addresses a technological
approach not a single technology.
Introduction
Application
TFDEA
Tech. Forecasting
Conclusions
DEA
Introduction
TFDEA
DEA

How are these challengesaddressed?
● State Of the Art (SOA)“The best implemented technology as
reflected by the physical and performance characteristics actually achieved during the time period in question”
–Dodson, TFSC 1 1970
Introduction
Application
TFDEA
Tech. Forecasting
Conclusions
DEA
Introduction
TFDEA
DEA

How can SOA be used?● Given that technology is never better than
State-of-the-Art, an index may be used to measure relative to the SOA.
● Over time a products technology index will change – tracking that change will allow for future predictions.
Introduction
Application
TFDEA
Tech. Forecasting
Conclusions
DEA
Introduction
TFDEA
DEA

What is the SOA?
Cha
ract
eris
tic #
2
Characteristic #1
Increasing State
of the Art
t1 t2
Technology Approach #1
Technology Approach #2
Introduction
Application
TFDEA
Tech. Forecasting
Conclusions
DEA
Introduction
TFDEA
DEA

SOA
Where does SOA fit?
Monitoring
Scenarios
Modelingand
Simulation
ExpertOpinion
Extrapolation
Understanding
Definition Exploration RefinementIntroduction
Application
TFDEA
Tech. Forecasting
Conclusions
DEA
Introduction
TFDEA
DEA

Steps to Forecast SOA
Provide OperationalDefinition
Specify Surface
General FormDevelop
TechniqueChooseModel
Develop Prospective Advances
T. J. Gordon and T. R. Munson, "A Proposed Convention for Measuring the State ofArt of Products or Processes," Technological Forecasting and Social Change, vol. 2pp. 1-26, 1981.
Introduction
Application
TFDEA
Tech. Forecasting
Conclusions
DEA
Introduction
TFDEA
DEA

What does DEA measure?
Inputs Outputs
Technology
Introduction
Applications
TFDEA
Tech. Forecasting
Conclusions
DEA
Introduction
TFDEA
DEA

Steps For DEA
Decide Purpose
Define DMU
DetermineI/O
ChooseDEA
Model
PerformAnalysis
ExamineResults
ImproveModel
CollectData
Introduction
Applications
TFDEA
Tech. Forecasting
Conclusions
DEA
Introduction
TFDEA
DEA

Data Envelopment Analysis
A
D
(Frontier)t
Inputs
Outputs
C
G
HF
B
Introduction
Applications
TFDEA
Tech. Forecasting
Conclusions
DEA
Introduction
TFDEA
DEA ● Builds an efficiency envelope relative to its peers (extreme-point method)

Product
How do they go together?
Structure
Function
Attribute 2
Attribute 1
Element 4
Element 3
Element 2
Element 1
Technology
Input Output
Introduction
Applications
TFDEA
Tech. Forecasting
Conclusions
DEA
Introduction
TFDEA
DEA

How do they fit together?Introduction
Application
TFDEA
Tech. Forecasting
Conclusions
Introduction
TFDEA
DEA
Gap: Do not address the “best”available technology.
Attr: DEA is an extreme point method.
Gap: General forms do not take intoaccount the dynamic nature oftrade-off surfaces.
Gap: Current methods are limited toa single output.
Gap: Current methods require independent attributes.
Attr: DMUs are independently rated against peers which are explicitly identified by DEA.
Attr: DEA does not require attributeindependence.
Attr: DEA can handle multiple inputsand outputs simultaneously.

How do they fit together?Measuring SOA TFDEATraditional DEA
DecidePurpose
Define a DMU
DetermineI/O Model
ChooseModel
CollectData
Examine Results
Perform Analysis
Specify OperationalDefinition of SOA
Specify ParameterSelection
Guidelines
DevelopProspective
SOAAdvances
(GAP)
Develop Technique to Represent
Surface
Determine Scope
of Forecast
Define a Product
Define SOA Characteristics
Determine SpecificModel
Collect Data
Examine Results
AnalyzeTech. Progress
ImproveModel
Improve Model
Introduction
Application
TFDEA
Tech. Forecasting
Conclusions
DEA
Introduction
TFDEA
DEA

RDBMS
Example - RDBMS
Total Cost OfOwnership
OLTP
TECHtpm-C
Structure(INPUT)
Function(OUTPUT)
Introduction
Application
TFDEA
Tech. Forecasting
Conclusions
DEA
Introduction
TFDEA
DEA

TPC Data
Product NameYear
ReleasedTotal
Cost($)Perf.
(tpmCA Unisys Aquanta QR/6 c/s 1997 297392 7407B ALR Revolution 6X6 (1MB L2) c/s 1997 463821 13089C Compaq ProLiant 3000 6/450-512 1 1998 176042 6290D Unisys Aquanta QR/2V Server 1998 424297 19118E Compaq Proliant 3000-6/600-1P 1999 160643 8050F Compaq Proliant ML570 2000 201717 20207G Dell PowerEdge 6450 2000 334936 31231H Unisys e-@action Enterprise Server 2000 797935 61390
Introduction
Application
TFDEA
Tech. Forecasting
Conclusions
DEA
Introduction
TFDEA
DEA
Source: Transaction Processing Council (TPC) www.tpc.org

Identification of the SOAIntroduction
Application
TFDEA
Tech. Forecasting
Conclusions
DEA
Introduction
TFDEA
DEA

Mapping Progress
B'
A'
x
x
Introduction
Application
TFDEA
Tech. Forecasting
Conclusions
DEA
Introduction
TFDEA
DEA

How do we represent it?● Use the determined earlier:
t t 0
yrt t yr
0 r 1 m
● Translation: new outputs can be multiplied by the old outputs
Introduction
Application
TFDEA
Tech. Forecasting
Conclusions
DEA
Introduction
TFDEA
DEA

Forecasting the FutureIntroduction
Application
TFDEA
Tech. Forecasting
Conclusions
DEA
Introduction
TFDEA
DEA

Forecasting the FutureIntroduction
Application
TFDEA
Tech. Forecasting
Conclusions
DEA
Introduction
TFDEA
DEA

Forecasting the FutureIntroduction
Application
TFDEA
Tech. Forecasting
Conclusions
DEA
Introduction
TFDEA
DEA

Applications:Introduction
Application
TFDEA
Tech. Forecasting
Conclusions
DEA
Introduction
TFDEA
DEA

TPC ResultsOutput-Oriented TFDEA
Predicted Range 541 42.77%ROC Predicts Lower Bound Only 220 17.39%ROC Predicts Upper Bound Only 241 19.05%ROC Did not Predict SOA 263 20.79%Total 1265 100.00%
IO-OO Output-Oriented TFDEAPredicted Range 797 63.00%ROC Predicts Lower Bound Only 130 10.27%ROC Predicts Upper Bound Only 338 26.71%ROC Did not Predict SOA 0 0.00%Total 1265 100.00%
Introduction
Applications
TFDEA
Tech. Forecasting
Conclusions
DEA
Introduction
TFDEA
DEA

TPC Results
Product
Date
Available lower upper StatusIBM eServer xSeries 365 4P c/s 2004-03-31 1.23 1.30 Low HP Integrity Superdome 2004-04-14 0.95 1.02 TargetHP rx8620 2004-04-15 1.04 1.07 Low Unisys ES7000 Aries 420 Enterprise Server 2004-04-20 1.20 1.24 Low HP Integrity rx5670 Cluster 64P 2004-04-30 0.82 0.89 RISKPRIMEPOWER 2500 2004-04-30 1.64 1.77 Low IBM eServer pSeries 690 Model 7040-681 2004-08-16 1.08 1.21 Low IBM eServer Xseries 445 8P c/s 2004-08-31 1.44 1.59 Low
*HP Integrity made its debut – but it usedRedHat Linux for its Operating System.
Introduction
Applications
TFDEA
Tech. Forecasting
Conclusions
DEA
Introduction
TFDEA
DEA

TPC - Conclusions● Method provides a good estimate of
future trends.● IO-OO offers additional insight.● Still prone to disruptive technologies
Introduction
Applications
TFDEA
Tech. Forecasting
Conclusions
DEA
Introduction
TFDEA
DEA