Embed Size (px)
Citation preview

TEXTURED JERSEY LANKA PLCCondensed Interim Financial StatementsThird Quarter Ended 31 December 2013

TEXTURED JERSEY LANKA PLC
Chairman's Review
Sgd
Bill Lam
Chairman
Textured Jersey Lanka PLC (TJL) recorded net profit of Rs. 805mn for the nine month period ended 31st December 2013, up 16.0% year on year supported by strong
growth in turnover. Net profit for the quarter ended 31st December 2013 (3Q FY2013/14) was Rs. 301mn, representing a decline of 17.4% year on year, compared to the
above average corresponding quarter last year. 3Q results in the previous year were significantly above average due to benefits from lower yarn prices, depreciation of the
Sri Lankan rupee and a reversal in stock provisions.
During the quarter under review, TJL continued to record higher sales volumes as compared to the previous year. This resulted in sales for 3Q FY2013/14 reaching Rs.
3.4bn, 16.7% higher than that of last year, placing the FY2013/14 nine month period cumulative sales figure at Rs. 9.5bn, up 19.7% year on year.
TJL’s gross profit for the nine month period ended 31st December 2013 was at Rs. 1.1bn, a healthy 15.0% increase over the corresponding period last year. The reported
gross margin for 3Q FY2013/14 slid to 10.6% due to an increase in outsourced business. While outsourced business generates incremental value, it impacts the overall
profit margin due to a lower level of in-house value addition. The gross margin excluding outsourced business is 11.9%, which is on par with the FY2012/13 average gross
margin of 11.6%. It must be noted that due to one off gains from lower yarn prices, depreciation in the Sri Lankan rupee and reversal in stock provisions, gross margin in
3Q last year experienced a temporary spike to 15.7%.
Continuous enforcement of strict cost controls enabled TJL to maintain its 3Q FY2013/14 distribution and administrative expenses at Rs. 19mn and Rs. 82mn, respectively,
the same level as the corresponding quarter last year. The cumulative operating profit for the nine months ended 31st December 2013 was Rs. 766mn, an increase of
14.7% year over year.
Owing to a near debt-free balance sheet and a healthy cash position throughout the period, TJL was able to record Rs. 22mn in net finance income for 3Q FY2013/14,
representing a substantial 95.1% growth year on year. As at 31st December 2013, the company had no borrowings and a strong cash position of Rs. 2.3bn.
TJL recorded a net profit of Rs. 301mn for 3Q FY2013/14, down 17.4% year over year. Net profit for the nine month period ended 31st December 2013 remained strong at
Rs. 805mn, up 16.0% compared to the corresponding period last year. TJL’s order book for the fourth quarter remains healthy and the management is confident of
surpassing last year’s bottom line milestone of Rs. 1.0bn, despite the above average performance last year.
TJL management has kicked off a few key strategic initiatives in order to enter the next phase of growth. The capacity expansion and modernization project is currently
underway and is expected to be completed in March 2014. The initiative is aimed at increasing capacity by 10-12%, which will enable TJL to reduce its outsourced orders
and improve margins, as well as take on new customer orders which are currently refused due to capacity constraints. In addition, the construction of TJL’s multi-fuel
boiler plant is progressing with amendments to timelines compared to the original plan. The plant is expected to reduce TJL’s energy cost substantially when
commissioned and reduce dependency on the national grid.
TJL entered into a Technical Service and Management Agreement with Ocean India Private Ltd, a knit fabric manufacturer located in India. This arrangement is expected to
provide TJL with knowledge and experience in regional markets. Given the above factors, TJL management remains confident of maintaining growth and delivering value
to shareholders on a continuous basis.
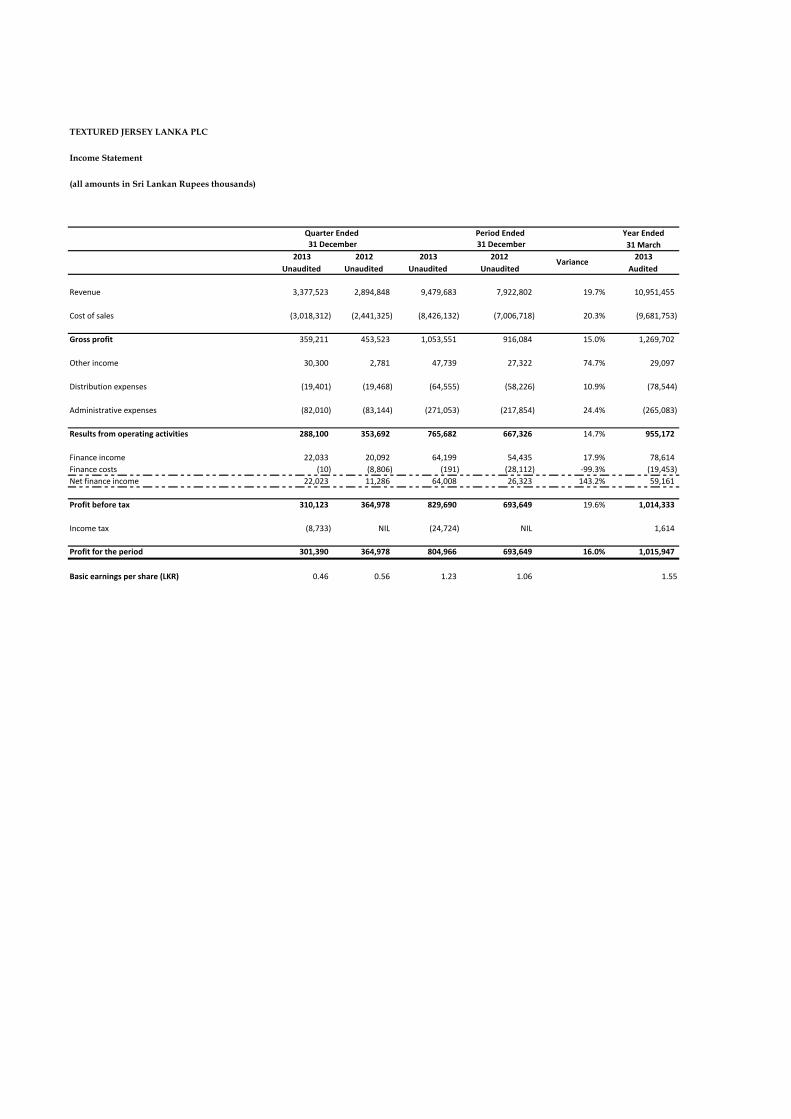
TEXTURED JERSEY LANKA PLC
Income Statement
(all amounts in Sri Lankan Rupees thousands)
Year Ended
31 March
2013 2012 2013 2012 2013
Unaudited Unaudited Unaudited Unaudited Audited
Revenue 3,377,523 2,894,848 9,479,683 7,922,802 19.7% 10,951,455
Cost of sales (3,018,312) (2,441,325) (8,426,132) (7,006,718) 20.3% (9,681,753)
Gross profit 359,211 453,523 1,053,551 916,084 15.0% 1,269,702
Other income 30,300 2,781 47,739 27,322 74.7% 29,097
Distribution expenses (19,401) (19,468) (64,555) (58,226) 10.9% (78,544)
Administrative expenses (82,010) (83,144) (271,053) (217,854) 24.4% (265,083)
Results from operating activities 288,100 353,692 765,682 667,326 14.7% 955,172
Finance income 22,033 20,092 64,199 54,435 17.9% 78,614
Finance costs (10) (8,806) (191) (28,112) -99.3% (19,453)
Net finance income 22,023 11,286 64,008 26,323 143.2% 59,161
Profit before tax 310,123 364,978 829,690 693,649 19.6% 1,014,333
Income tax (8,733) NIL (24,724) NIL 1,614
Profit for the period 301,390 364,978 804,966 693,649 16.0% 1,015,947
Basic earnings per share (LKR) 0.46 0.56 1.23 1.06 1.55
Period Ended
31 December
Variance
Quarter Ended
31 December

TEXTURED JERSEY LANKA PLC
Statement of Comprehensive Income
(all amounts in Sri Lankan Rupees thousands)
Year Ended
31 March
2013 2012 2013 2012 2013
Unaudited Unaudited Unaudited Unaudited Audited
Profit for the period 301,390 364,978 804,966 693,649 16.0% 1,015,947
Other comprehensive income
Actuarial gain on retirement benefit obligations NIL NIL NIL NIL 802
Currency translation differences (137,991) (203,001) 139,774 (158,805) -188.0% (82,364)
Total other comprehensive income for the period (137,991) (203,001) 139,774 (158,805) -188.0% (81,562)
Total comprehensive income for the period 163,399 161,977 944,740 534,844 76.6% 934,385
31 December
Quarter Ended
Variance
Period Ended
31 December

TEXTURED JERSEY LANKA PLC
Statement of Financial Position
(all amounts in Sri Lankan Rupees thousands)
As at
31 March
2013
Audited
ASSETS
Non - current assets
Property, plant & equipment 2,228,956 2,310,891 2,288,643
Capital work-in-progress 216,369 9,808 67,758
Intangible assets 43,517 44,368 41,082
Lease rentals paid in advance 92,588 93,003 93,396
2,581,431 2,458,070 2,490,879
Current assets
Inventories 1,686,304 1,545,826 1,795,172
Trade and other receivables 1,407,438 1,093,021 1,382,736
Cash and cash equivalents 2,338,227 2,008,104 2,196,949
5,431,969 4,646,951 5,374,857
Total assets 8,013,400 7,105,021 7,865,736
EQUITY AND LIABILITIES
Capital and reserves
Stated capital 2,797,229 2,797,229 2,797,229
Exchange equalisation reserve 1,048,745 832,530 908,971
Retained earnings 2,469,136 2,153,273 2,044,071
6,315,110 5,783,032 5,750,271
Non - current liabilities
Borrowings NIL NIL NIL
Deferred tax liabilities 93,989 70,912 67,678
Retirement benefit obligations 69,786 61,462 55,154
163,775 132,374 122,832
Current liabilities
Trade and other payables 1,519,825 1,136,167 1,632,736
Borrowings NIL NIL NIL
Bank overdrafts 14,690 53,448 359,897
1,534,515 1,189,615 1,992,633
Total liabilities 1,698,290 1,321,989 2,115,465
Total equity and liabilities 8,013,400 7,105,021 7,865,736
Net assets per share (LKR) 9.64 8.83 8.78
I certify that financial statements comply with the requirements of the Companies Act No. 07 of 2007.
Sgd
Salman Nishtar
Chief Financial Officer
The Board of Directors is responsible for the preparation and presentation of these financial statements.
Sgd Sgd
Ashroff Omar Hasitha Premarathne
Director Director
Date
2012 Unaudited
31 December
As at
2013 Unaudited

TEXTURED JERSEY LANKA PLC
Statement of Changes In Equity
(all amounts in Sri Lankan Rupees thousands)
Balance as at 1 April 2012 2,797,229 991,335 1,695,425 5,483,989
Profit for the year NIL NIL 1,015,947 1,015,947
Other comprehensive income NIL (82,364) 802 (81,562)
Total comprehensive income NIL (82,364) 1,016,749 934,385
Transactions with owners
Final dividend paid - 2011/12 NIL NIL (235,801) (235,801)
Interim dividend paid - 2012/13 NIL NIL (432,302) (432,302)
Balance as at 31 March 2013 2,797,229 908,971 2,044,071 5,750,271
Balance as at 1 April 2013 2,797,229 908,971 2,044,071 5,750,271
Profit for the period NIL NIL 804,966 804,966
Other comprehensive income NIL 139,774 NIL 139,774
Total comprehensive income NIL 139,774 804,966 944,740
Transactions with owners
Final dividend paid - 2012/13 NIL NIL (379,901) (379,901)
Balance as at 31 December 2013 2,797,229 1,048,745 2,469,136 6,315,110
Balance as at 1 April 2012 2,797,229 991,335 1,695,425 5,483,989
Profit for the period NIL NIL 693,649 693,649
Other comprehensive income NIL (158,805) NIL (158,805)
Total comprehensive income NIL (158,805) 693,649 534,844
Transactions with owners
Final dividend paid - 2011/12 NIL NIL (235,801) (235,801)
Balance as at 31 December 2012 2,797,229 832,530 2,153,273 5,783,032
Total
Exchange
equalisation
reserve
Retained earningsStated capital
Quarter Ended 31 December
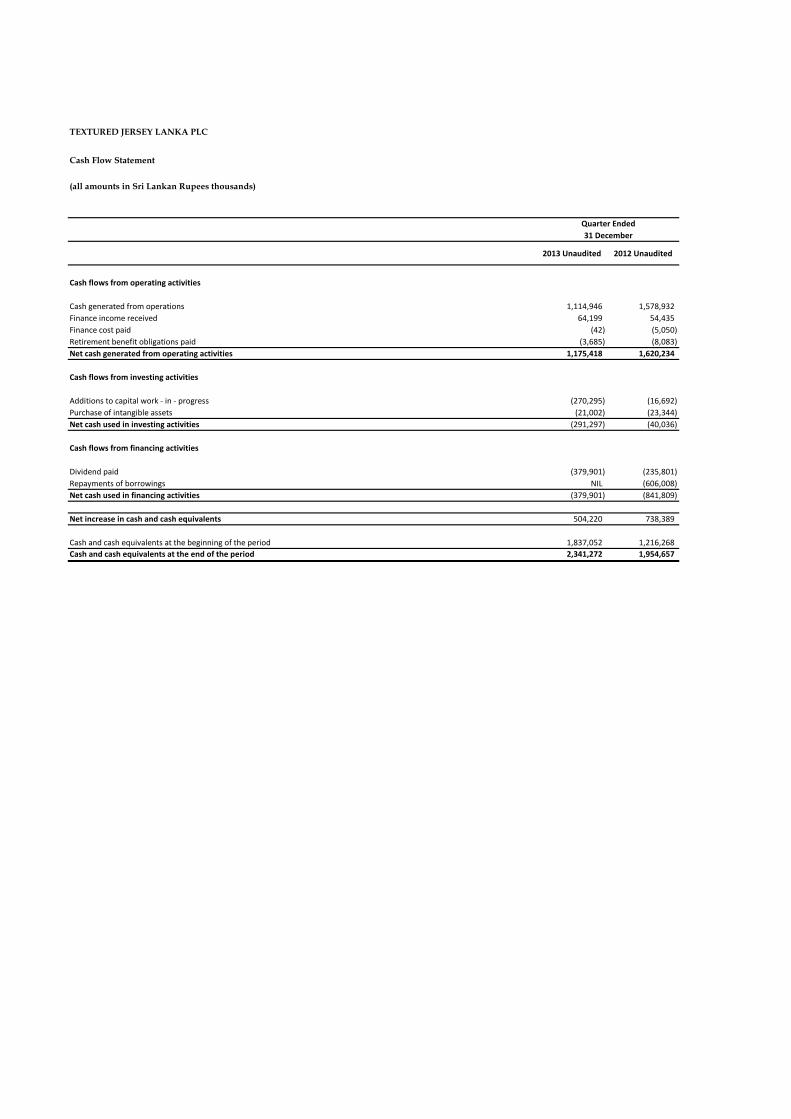
TEXTURED JERSEY LANKA PLC
Cash Flow Statement
(all amounts in Sri Lankan Rupees thousands)
2013 Unaudited 2012 Unaudited
Cash flows from operating activities
Cash generated from operations 1,114,946 1,578,932
Finance income received 64,199 54,435
Finance cost paid (42) (5,050)
Retirement benefit obligations paid (3,685) (8,083)
Net cash generated from operating activities 1,175,418 1,620,234
Cash flows from investing activities
Additions to capital work - in - progress (270,295) (16,692)
Purchase of intangible assets (21,002) (23,344)
Net cash used in investing activities (291,297) (40,036)
Cash flows from financing activities
Dividend paid (379,901) (235,801)
Repayments of borrowings NIL (606,008)
Net cash used in financing activities (379,901) (841,809)
Net increase in cash and cash equivalents 504,220 738,389
Cash and cash equivalents at the beginning of the period 1,837,052 1,216,268
Cash and cash equivalents at the end of the period 2,341,272 1,954,657
Quarter Ended
31 December

TEXTURED JERSEY LANKA PLC
Notes to the Financial Statements
1. Corporate Information
2. Condensed Interim Financial Statements
3. Approval of Financial Statements
4. Basis of Preparation
5. Accounting Policies
6. Contingencies, Capital and Other Commitments
7. Events after the Reporting Period
Statements.
8. Key Ratios of the Company
2013 2012
Profitability Ratios
Net Profit Margin 8.49% 8.76%
Asset to Turnover 1.58 1.49
Debt : Equity 0.00 0.01
Return on Assets (ROA) 13.52% 12.71%
Return on Equity (ROE) 17.79% 16.42%
Investor Ratios
Earnings per Share (EPS) - LKR 1.23 1.06
Net Book Value per Share - LKR 9.64 8.83
Price / Earnings Ratio (PE Ratio) 9.28 6.30
Price to Book Value Ratio (PBV Ratio) 1.58 1.01
(PE and PBV Ratios are based on a market price of LKR 15.20 per share closed 31 December 2013)
9. Number of shares representing the entity's Stated Capital - 655,002,440 Shares
10. Directors' Interest in Shares of the Company
No. of Shares
Hasitha Premaratne 40,000 -
The financial statements for the period ended 31 December 2013, includes “the Company” referring to Textured Jersey Lanka PLC .
Textured Jersey Lanka PLC is a public limited company incorporated and domiciled in Sri Lanka and listed on the Colombo Stock Exchange. The address of its registered
office is Block D8 - D14, C V Gooneratne Seethawaka International Industrial Park, Avissawella.
The Company has also presented the statement of comprehensive income and the statement of financial position in United State Dollars (USD) since the functional
currency of the enterprise is USD.
The condensed interim financial statements of the Company for the 9 months ended 31 December 2013 were authorised for issue by the Board of Directors on 24 January
2014.
31 December
Period Ended
The condensed interim financial statements of the Company have been prepared in accordance with Sri Lanka Accounting Standard - LKAS 34 Interim Financial Reporting .
The condensed interim financial statements should be read in conjunction with the annual financial statements for the year ended 31 March 2013.
The condensed interim financial statements have been prepared on a historical cost basis.
The accounting policies adopted are consistent with those of the previous financial year.
There has been no significant change in the nature of the contingencies and other commitments, which were disclosed in the annual report for the year ended 31 March
2013.
No circumstances have arisen since the Statement of Financial Position date which would require adjustment to or disclosure in the Financial

TEXTURED JERSEY LANKA PLC
Notes to the Financial Statements
11. Market Price per Share
Highest (LKR) Lowest (LKR)
Quarter ended 31 December 2013 16.10 14.40
Last traded price (on 31 December 2013) 15.20
12. Public Shareholding 196,000,000 shares - 29.92%
13. List of the 20 Largest Shareholders
No. of Shares
PACIFIC TEXTURED JERSEY HOLDINGS LTD 262,001,464 40.00%
BRANDIX LANKA LTD 197,000,976 30.08%
Y S H I SILVA 15,956,500 2.44%
EMPLOYEES PROVIDENT FUND 13,813,200 2.11%
MELSTACORP LIMITED 12,622,428 1.93%
J B COCOSHELL (PVT) LTD 10,172,846 1.55%
MAS CAPITAL (PRIVATE) LIMITED 5,466,322 0.83%
NUWARA ELIYA PROPERTY DEVELOPERS (PVT) LTD 5,187,900 0.79%
MCBRIDGE BLUE (PRIVATE) LIMITED 5,150,700 0.79%
CITI BANKNY S/A FORWARD SELECT EM DIVIDEND FUND 4,999,998 0.76%
SEYLAN BANK PLC/ARC CAPITAL (PVT) LTD 4,993,391 0.76%
PICTET & CIE 3,694,100 0.56%
HSBC INTL NOM LTD - BP2S SINGAPORE - BNP PARIBAS BANK AND TRUST CAYMAN LIMITED AS 3,282,032 0.50%
- TRUSTEE FOR HARVEST FUNDS
FERGASAM GARMENT INDUSTRIES (PVT) LTD. 2,811,100 0.43%
TIMEX GARMENTS (PVT) LTD 2,791,100 0.43%
PERICEYL (PRIVATE ) LIMITED A/C NO. 03 2,694,100 0.41%
D P PIERIS 2,081,400 0.32%
SOUTH ASIAN INVESTMENT (PVT) LTD 2,054,565 0.31%
MCSEN RANGE (PRIVATE) LIMITED 2,031,400 0.31%
NAWALOKA PILING (PRIVATE) LIMITED 2,031,400 0.31%
J D N KEKULAWALA 2,031,400 0.31%
DEE INVESTMENTS (PVT) LTD 1,996,799 0.30%
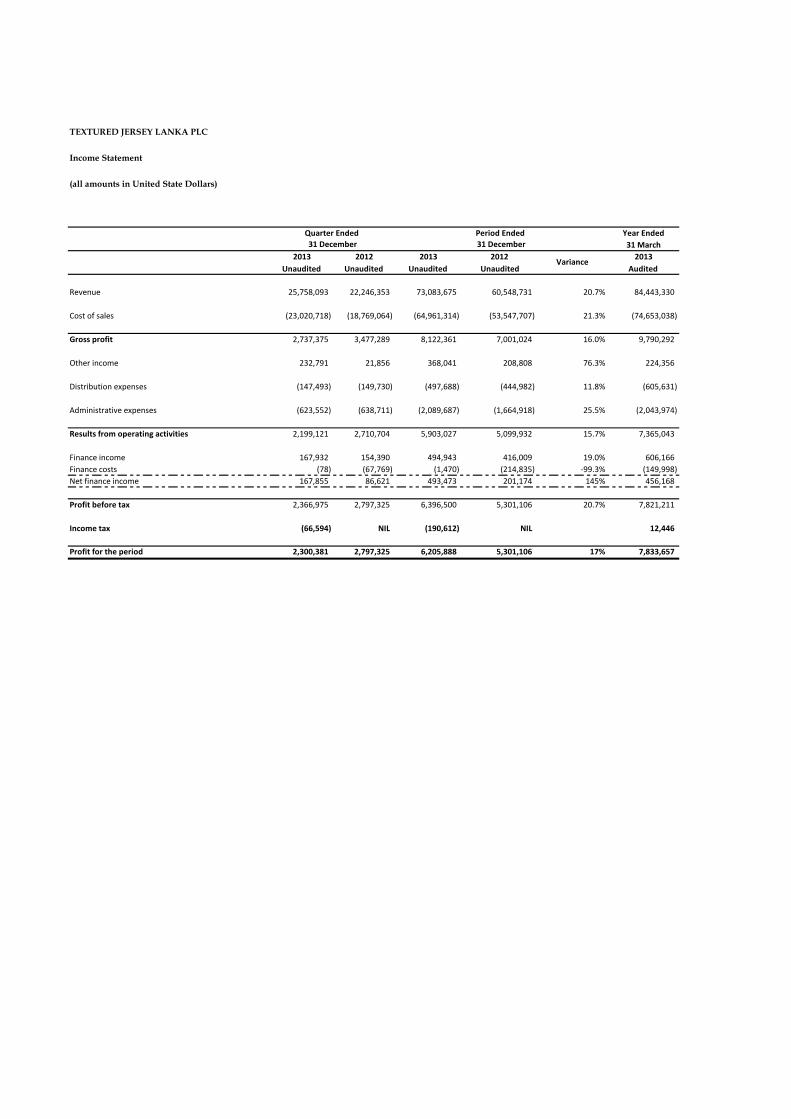
TEXTURED JERSEY LANKA PLC
Income Statement
(all amounts in United State Dollars)
Year Ended
31 March
2013 2012 2013 2012 2013
Unaudited Unaudited Unaudited Unaudited Audited
Revenue 25,758,093 22,246,353 73,083,675 60,548,731 20.7% 84,443,330
Cost of sales (23,020,718) (18,769,064) (64,961,314) (53,547,707) 21.3% (74,653,038)
Gross profit 2,737,375 3,477,289 8,122,361 7,001,024 16.0% 9,790,292
Other income 232,791 21,856 368,041 208,808 76.3% 224,356
Distribution expenses (147,493) (149,730) (497,688) (444,982) 11.8% (605,631)
Administrative expenses (623,552) (638,711) (2,089,687) (1,664,918) 25.5% (2,043,974)
Results from operating activities 2,199,121 2,710,704 5,903,027 5,099,932 15.7% 7,365,043
Finance income 167,932 154,390 494,943 416,009 19.0% 606,166
Finance costs (78) (67,769) (1,470) (214,835) -99.3% (149,998)
Net finance income 167,855 86,621 493,473 201,174 145% 456,168
Profit before tax 2,366,975 2,797,325 6,396,500 5,301,106 20.7% 7,821,211
Income tax (66,594) NIL (190,612) NIL 12,446
Profit for the period 2,300,381 2,797,325 6,205,888 5,301,106 17% 7,833,657
Quarter Ended Period Ended
Variance
31 December 31 December
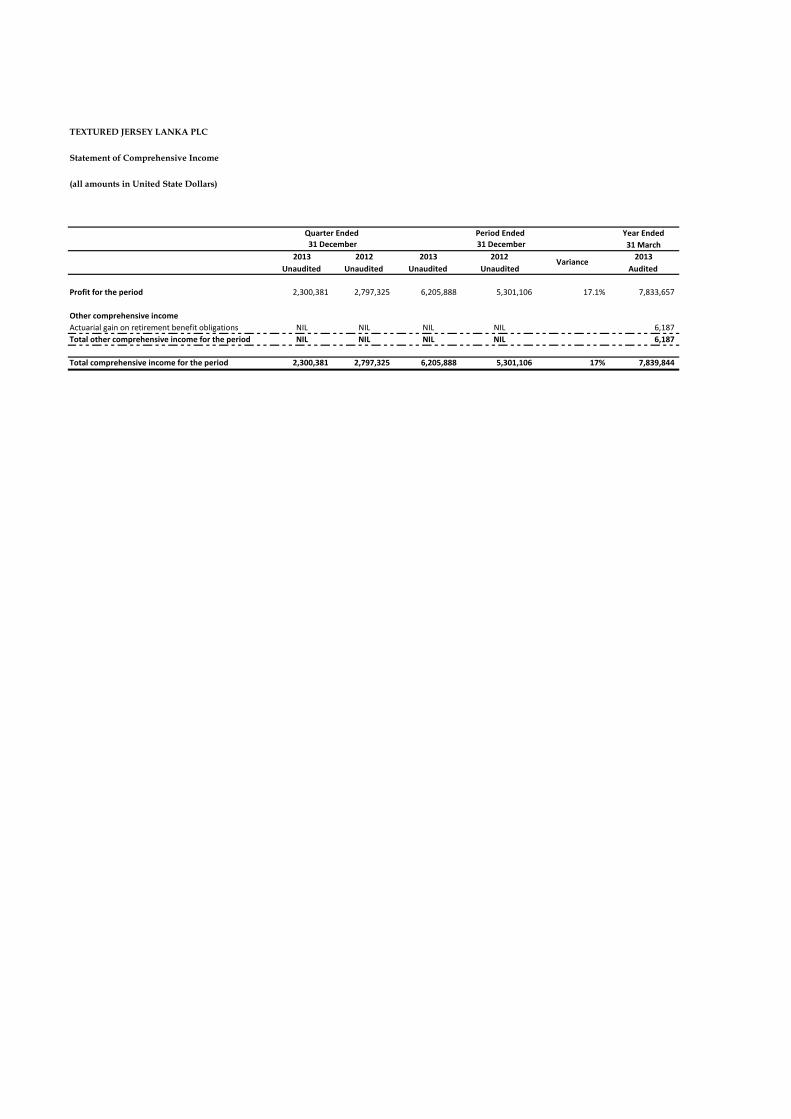
TEXTURED JERSEY LANKA PLC
Statement of Comprehensive Income
(all amounts in United State Dollars)
Year Ended
31 March
2013 2012 2013 2012 2013
Unaudited Unaudited Unaudited Unaudited Audited
Profit for the period 2,300,381 2,797,325 6,205,888 5,301,106 17.1% 7,833,657
Other comprehensive income
Actuarial gain on retirement benefit obligations NIL NIL NIL NIL 6,187
Total other comprehensive income for the period NIL NIL NIL NIL 6,187
Total comprehensive income for the period 2,300,381 2,797,325 6,205,888 5,301,106 17% 7,839,844
Variance
Quarter Ended Period Ended
31 December 31 December

TEXTURED JERSEY LANKA PLC
Statement of Financial Position
(all amounts in United State Dollars)
As at
31 March
2013
Audited
ASSETS
Non - current assets
Property, plant & equipment 17,184,152 18,484,168 18,057,781
Capital work-in-progress 1,668,100 78,449 534,624
Intangible assets 335,494 354,892 324,147
Lease rentals paid in advance 713,811 743,904 736,905
19,901,557 19,661,413 19,653,457
Current assets
Inventories 13,000,570 12,364,630 14,164,212
Trade and other receivables 10,850,653 8,742,773 10,910,017
Cash and cash equivalents 18,026,577 16,062,262 17,334,301
41,877,800 37,169,665 42,408,530
Total assets 61,779,357 56,831,078 62,061,987
EQUITY AND LIABILITIES
Capital and reserves
Stated capital 28,624,940 28,624,940 28,624,940
Retained earnings 20,061,431 17,631,916 16,745,669
48,686,371 46,256,856 45,370,609
Non - current liabilities
Borrowings NIL NIL NIL
Deferred tax liabilities 724,606 567,203 533,994
Retirement benefit obligations 538,019 491,618 435,175
1,262,625 1,058,821 969,169
Current liabilities
Trade and other payables 11,717,110 9,087,884 12,882,560
Borrowings NIL NIL NIL
Bank overdrafts 113,251 427,517 2,839,649
11,830,361 9,515,401 15,722,209
Total liabilities 13,092,986 10,574,222 16,691,378
Total equity and liabilities 61,779,357 56,831,078 62,061,987
I certify that financial statements comply with the requirements of the Companies Act No. 07 of 2007.
Sgd
Salman Nishtar
Chief Financial Officer
The Board of Directors is responsible for the preparation and presentation of these financial statements.
Sgd Sgd
Ashroff Omar Hasitha Premarathne
Director Director
Date
2013 Unaudited 2012 Unaudited
As at
31 December