Embed Size (px)
Citation preview
Table of Contents
UNITED STATESSECURITIES AND EXCHANGE COMMISSION
Washington, D.C. 20549
Form 10-Q (Mark One)[ X ] QUARTERLY REPORT PURSUANT TO SECTION 13 OR 15 (d) OF THE SECURITIES EXCHANGE ACT OF 1934
For the quarterly period ended March 30, 2019
OR
[ ] TRANSITION REPORT PURSUANT TO SECTION 13 OR 15(d) OF THE SECURITIES EXCHANGE ACT OF 1934
For the transition period from to .
Commission File Number 1-5480
Textron Inc.(Exact name of registrant as specified in its charter)
Delaware
05-0315468(State or other jurisdiction of incorporation or organization)
(I.R.S. Employer Identification No.)
40 Westminster Street, Providence, RI
02903(Address of principal executive offices)
(Zip code)
(401) 421-2800(Registrant’s telephone number, including area code)
Indicate by check mark whether the registrant (1) has filed all reports required to be filed by Section 13 or 15(d) of the Securities Exchange Act of 1934 during the preceding 12months (or for such shorter period that the registrant was required to file such reports), and (2) has been subject to such filing requirements for the past 90 days. Yes ü No Indicate by check mark whether the registrant has submitted electronically every Interactive Data File required to be submitted pursuant to Rule 405 of Regulation S-T during thepreceding 12 months (or for such shorter period that the registrant was required to submit such files). Yes ü No Indicate by check mark whether the registrant is a large accelerated filer, an accelerated filer, a non-accelerated filer, smaller reporting company, or an emerging growthcompany. See definitions of “large accelerated filer,” “accelerated filer,” “smaller reporting company” and “emerging growth company” in Rule 12b-2 of the Exchange Act(Check one):
Large accelerated filer [ ü] Accelerated filer [ ] Non-accelerated filer [ ]
Smaller reporting company [ ] Emerging growth company [ ] If an emerging growth company, indicate by check mark if the registrant has elected not to use the extended transition period for complying with any new or revised financialaccounting standards provided pursuant to Section 13(a) of the Exchange Act. [ ] Indicate by check mark whether the registrant is a shell company (as defined in Rule 12b-2 of the Exchange Act). Yes No ü As of April 12, 2019, there were 232,762,261 shares of common stock outstanding.
Table of Contents
TEXTRON INC.Index to Form 10-Q
For the Quarterly Period Ended March 30, 2019
Page PART I. FINANCIAL INFORMATION
Item 1. Financial Statements
Consolidated Statements of Operations (Unaudited) 3
Consolidated Statements of Comprehensive Income (Unaudited) 4
Consolidated Balance Sheets (Unaudited) 5
Consolidated Statements of Cash Flows (Unaudited) 6
Notes to the Consolidated Financial Statements (Unaudited)
Note 1. Basis of Presentation 8Note 2. Summary of Significant Accounting Policies Update 8Note 3. Accounts Receivable and Finance Receivables 9Note 4. Inventories 10Note 5. Other Assets 10Note 6. Warranty Liability 11Note 7. Leases 11Note 8. Derivative Instruments and Fair Value Measurements 12Note 9. Shareholders’ Equity 13Note 10. Segment Information 14Note 11. Revenues 15Note 12. Share-Based Compensation 16Note 13. Retirement Plans 17Note 14. Income Taxes 17Note 15. Commitments and Contingencies 18
Item 2. Management’s Discussion and Analysis of Financial Condition and Results of Operations 19 Item 3. Quantitative and Qualitative Disclosures about Market Risk 27 Item 4. Controls and Procedures 28 PART II. OTHER INFORMATION
Item 2. Unregistered Sales of Equity Securities and Use of Proceeds 28 Item 5. Other Information 29 Item 6. Exhibits 30
Signatures 30
2

Table of Contents
PART I. FINANCIAL INFORMATION Item 1. Financial Statements
TEXTRON INC. Consolidated Statements of Operations (Unaudited)
Three Months Ended
(In millions, except per share amounts)
March 30, 2019
March 31, 2018
Revenues
Manufacturing revenues
$ 3,092 $ 3,280Finance revenues
17
16Total revenues
3,109
3,296Costs, expenses and other
Cost of sales
2,577
2,729Selling and administrative expense
307
327Interest expense
42
41Non-service components of pension and post-retirement income, net
(29)
(19)Total costs, expenses and other
2,897
3,078Income before income taxes
212
218Income tax expense
33
29Net income
$ 179 $ 189Earnings per share
Basic
$ 0.76 $ 0.73Diluted
$ 0.76 $ 0.72 See Notes to the Consolidated Financial Statements.
3
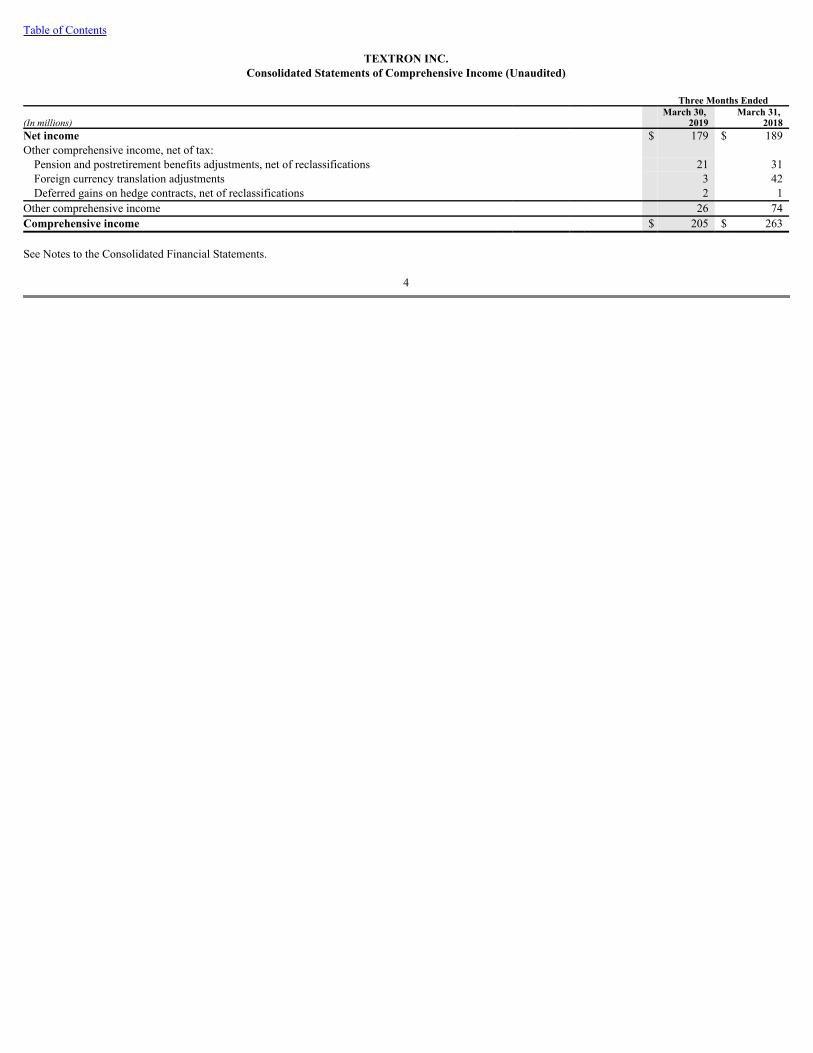
Table of Contents
TEXTRON INC.Consolidated Statements of Comprehensive Income (Unaudited)
Three Months Ended
(In millions)
March 30, 2019
March 31, 2018
Net income
$ 179 $ 189Other comprehensive income, net of tax:
Pension and postretirement benefits adjustments, net of reclassifications
21
31Foreign currency translation adjustments
3
42Deferred gains on hedge contracts, net of reclassifications
2
1Other comprehensive income
26
74Comprehensive income
$ 205 $ 263 See Notes to the Consolidated Financial Statements.
4
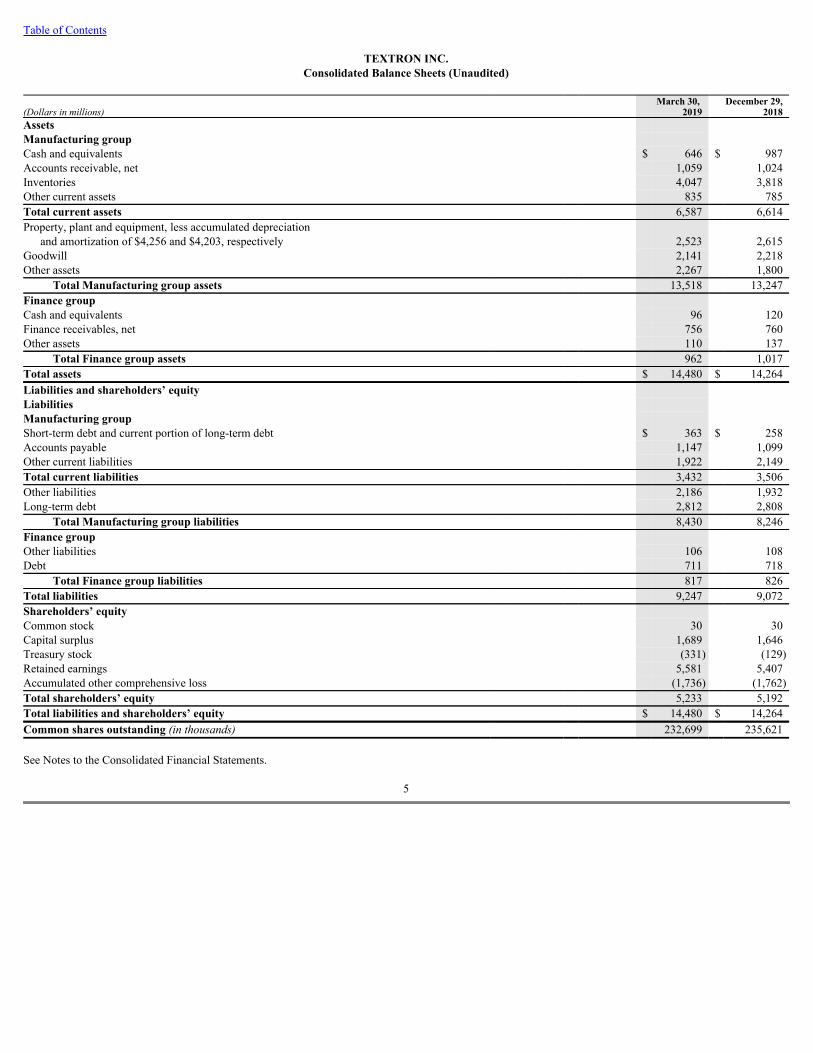
Table of Contents
TEXTRON INC.Consolidated Balance Sheets (Unaudited)
(Dollars in millions)
March 30, 2019
December 29,2018
Assets
Manufacturing group
Cash and equivalents
$ 646 $ 987Accounts receivable, net
1,059
1,024Inventories
4,047
3,818Other current assets
835
785Total current assets
6,587
6,614Property, plant and equipment, less accumulated depreciation
and amortization of $4,256 and $4,203, respectively
2,523
2,615Goodwill
2,141
2,218Other assets
2,267
1,800Total Manufacturing group assets
13,518
13,247Finance group
Cash and equivalents
96
120Finance receivables, net
756
760Other assets
110
137Total Finance group assets
962
1,017Total assets
$ 14,480 $ 14,264Liabilities and shareholders’ equity
Liabilities
Manufacturing group
Short-term debt and current portion of long-term debt
$ 363 $ 258Accounts payable
1,147
1,099Other current liabilities
1,922
2,149Total current liabilities
3,432
3,506Other liabilities
2,186
1,932Long-term debt
2,812
2,808Total Manufacturing group liabilities
8,430
8,246Finance group
Other liabilities
106
108Debt
711
718Total Finance group liabilities
817
826Total liabilities
9,247
9,072Shareholders’ equity
Common stock
30
30Capital surplus
1,689
1,646Treasury stock
(331)
(129)Retained earnings
5,581
5,407Accumulated other comprehensive loss
(1,736)
(1,762)Total shareholders’ equity
5,233
5,192Total liabilities and shareholders’ equity
$ 14,480 $ 14,264Common shares outstanding (in thousands)
232,699
235,621 See Notes to the Consolidated Financial Statements.
5

Table of Contents
TEXTRON INC.Consolidated Statements of Cash Flows (Unaudited)
For the Three Months Ended March 30, 2019 and March 31, 2018, respectively
Consolidated(In millions)
2019
2018Cash flows from operating activities
Net income
$ 179 $ 189Adjustments to reconcile net income to net cash
used in operating activities:
Non-cash items:
Depreciation and amortization
102
105Deferred income taxes
15
2Other, net
33
32Changes in assets and liabilities:
Accounts receivable, net
(33)
63Inventories
(215)
(128)Other assets
(31)
(119)Accounts payable
47
15Other liabilities
(288)
(263)Income taxes, net
(7)
9Pension, net
(14)
(2)Captive finance receivables, net
(1)
15Other operating activities, net
(3)
(3)Net cash used in operating activities
(216)
(85)Cash flows from investing activities
Capital expenditures
(59)
(77)Net proceeds from corporate-owned life insurance policies
2
58Finance receivables repaid
12
16Other investing activities, net
3
9Net cash provided by (used in) investing activities
(42)
6Cash flows from financing activities
Increase in short-term debt
100
2Principal payments on long-term debt and nonrecourse debt
(19)
(19)Purchases of Textron common stock
(202)
(344)Dividends paid
(5)
(5)Other financing activities, net
10
8Net cash used in financing activities
(116)
(358)Effect of exchange rate changes on cash and equivalents
9
11Net decrease in cash and equivalents
(365)
(426)Cash and equivalents at beginning of period
1,107
1,262Cash and equivalents at end of period
$ 742 $ 836 See Notes to the Consolidated Financial Statements.
6
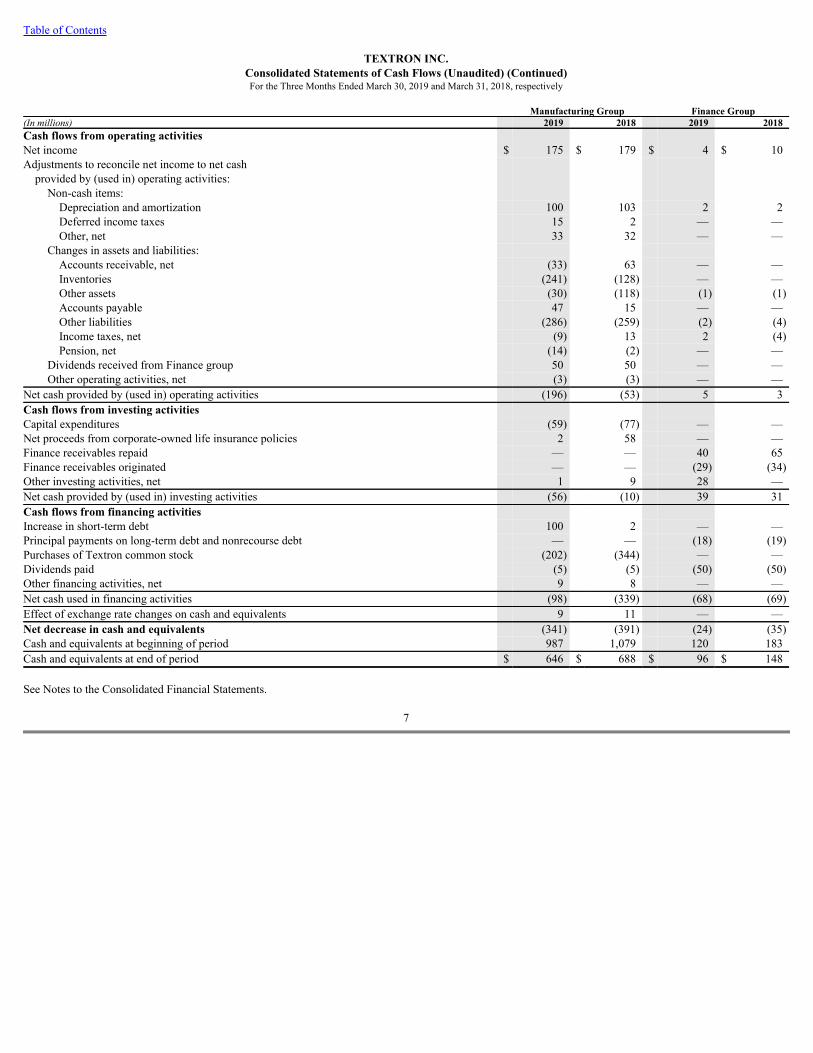
Table of Contents
TEXTRON INC.Consolidated Statements of Cash Flows (Unaudited) (Continued)For the Three Months Ended March 30, 2019 and March 31, 2018, respectively
Manufacturing Group
Finance Group(In millions)
2019
2018
2019
2018Cash flows from operating activities
Net income $ 175 $ 179 $ 4 $ 10Adjustments to reconcile net income to net cash provided by (used in) operating activities:
Non-cash items:
Depreciation and amortization
100
103
2
2Deferred income taxes
15
2
—
—Other, net
33
32
—
—Changes in assets and liabilities:
Accounts receivable, net
(33)
63
—
—Inventories
(241)
(128)
—
—Other assets
(30)
(118)
(1)
(1)Accounts payable
47
15
—
—Other liabilities
(286)
(259)
(2)
(4)Income taxes, net
(9)
13
2
(4)Pension, net
(14)
(2)
—
—Dividends received from Finance group
50
50
—
—Other operating activities, net
(3)
(3)
—
—Net cash provided by (used in) operating activities
(196)
(53)
5
3Cash flows from investing activities
Capital expenditures
(59)
(77)
—
—Net proceeds from corporate-owned life insurance policies
2
58
—
—Finance receivables repaid
—
—
40
65Finance receivables originated
—
—
(29)
(34)Other investing activities, net
1
9
28
—Net cash provided by (used in) investing activities
(56)
(10)
39
31Cash flows from financing activities
Increase in short-term debt
100
2
—
—Principal payments on long-term debt and nonrecourse debt
—
—
(18)
(19)Purchases of Textron common stock
(202)
(344)
—
—Dividends paid
(5)
(5)
(50)
(50)Other financing activities, net
9
8
—
—Net cash used in financing activities
(98)
(339)
(68)
(69)Effect of exchange rate changes on cash and equivalents
9
11
—
—Net decrease in cash and equivalents
(341)
(391)
(24)
(35)Cash and equivalents at beginning of period
987
1,079
120
183Cash and equivalents at end of period $ 646 $ 688 $ 96 $ 148 See Notes to the Consolidated Financial Statements.
7

Table of Contents
TEXTRON INC.Notes to the Consolidated Financial Statements (Unaudited)
Note 1. Basis of Presentation Our Consolidated Financial Statements include the accounts of Textron Inc. (Textron) and its majority-owned subsidiaries. We have prepared these unauditedconsolidated financial statements in accordance with accounting principles generally accepted in the U.S. for interim financial information. Accordingly, theseinterim financial statements do not include all of the information and footnotes required by accounting principles generally accepted in the U.S. for completefinancial statements. The consolidated interim financial statements included in this quarterly report should be read in conjunction with the consolidated financialstatements included in our Annual Report on Form 10-K for the year ended December 29, 2018. In the opinion of management, the interim financial statementsreflect all adjustments (consisting only of normal recurring adjustments) that are necessary for the fair presentation of our consolidated financial position, results ofoperations and cash flows for the interim periods presented. The results of operations for the interim periods are not necessarily indicative of the results to beexpected for the full year. Our financings are conducted through two separate borrowing groups. The Manufacturing group consists of Textron consolidated with its majority-ownedsubsidiaries that operate in the Textron Aviation, Bell, Textron Systems and Industrial segments. The Finance group, which also is the Finance segment, consists ofTextron Financial Corporation and its consolidated subsidiaries. We designed this framework to enhance our borrowing power by separating the Finance group.Our Manufacturing group operations include the development, production and delivery of tangible goods and services, while our Finance group provides financialservices. Due to the fundamental differences between each borrowing group’s activities, investors, rating agencies and analysts use different measures to evaluateeach group’s performance. To support those evaluations, we present balance sheet and cash flow information for each borrowing group within the ConsolidatedFinancial Statements. All significant intercompany transactions are eliminated from the Consolidated Financial Statements, including retail financing activities forinventory sold by our Manufacturing group and financed by our Finance group. Use of EstimatesWe prepare our financial statements in conformity with generally accepted accounting principles, which require us to make estimates and assumptions that affectthe amounts reported in the financial statements. Actual results could differ from those estimates. Our estimates and assumptions are reviewed periodically, andthe effects of changes, if any, are reflected in the Consolidated Statements of Operations in the period that they are determined. Contract EstimatesFor contracts where revenue is recognized over time, we recognize changes in estimated contract revenues, costs and profits using the cumulative catch-up methodof accounting. This method recognizes the cumulative effect of changes on current and prior periods with the impact of the change from inception-to-date recordedin the current period. Anticipated losses on contracts are recognized in full in the period in which the losses become probable and estimable. In the first quarter of 2019 and 2018, our cumulative catch-up adjustments increased revenue and segment profit by $31 million and $40 million, respectively, andnet income by $23 million and $30 million, respectively ($0.10 and $0.12 per diluted share, respectively). In the first quarter of 2019 and 2018, gross favorableadjustments totaled $53 million and $56 million, respectively, and the gross unfavorable adjustments totaled $22 million and $16 million, respectively. Note 2. Summary of Significant Accounting Policies Update At the beginning of 2019, we adopted Accounting Standards Update (ASU) No. 2016-02, Leases (ASC 842), which requires lessees to recognize all leases with aterm greater than 12 months on the balance sheet as right-of-use assets and lease liabilities . Upon adoption, the most significant impact was the recognition of $307million in right-of-use assets and lease liabilities for operating leases, while our accounting for finance leases remained unchanged. We applied the provisions ofthis standard to our existing leases at the adoption date using a retrospective transition method and have not adjusted comparative periods. The cumulativetransition adjustment to retained earnings was not significant and the adoption had no impact on our earnings or cash flows . We elected the practical expedientspermitted under the transition guidance, which allowed us to carryforward the historical lease classification and to apply hindsight when evaluating options within acontract, resulting in the extension of the lease term for certain of our existing leases.
8
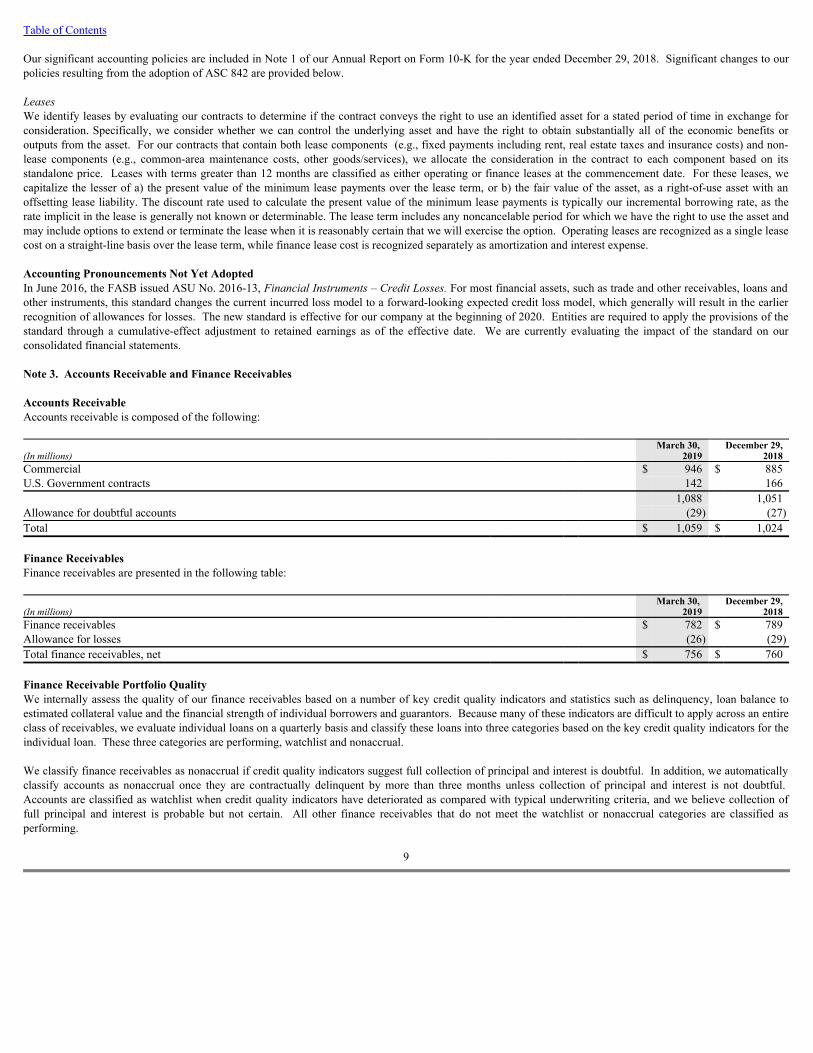
Table of Contents Our significant accounting policies are included in Note 1 of our Annual Report on Form 10-K for the year ended December 29, 2018. Significant changes to ourpolicies resulting from the adoption of ASC 842 are provided below. LeasesWe identify leases by evaluating our contracts to determine if the contract conveys the right to use an identified asset for a stated period of time in exchange forconsideration. Specifically, we consider whether we can control the underlying asset and have the right to obtain substantially all of the economic benefits oroutputs from the asset. For our contracts that contain both lease components (e.g., fixed payments including rent, real estate taxes and insurance costs) and non-lease components (e.g., common-area maintenance costs, other goods/services), we allocate the consideration in the contract to each component based on itsstandalone price. Leases with terms greater than 12 months are classified as either operating or finance leases at the commencement date. For these leases, wecapitalize the lesser of a) the present value of the minimum lease payments over the lease term, or b) the fair value of the asset, as a right-of-use asset with anoffsetting lease liability. The discount rate used to calculate the present value of the minimum lease payments is typically our incremental borrowing rate, as therate implicit in the lease is generally not known or determinable. The lease term includes any noncancelable period for which we have the right to use the asset andmay include options to extend or terminate the lease when it is reasonably certain that we will exercise the option. Operating leases are recognized as a single leasecost on a straight-line basis over the lease term, while finance lease cost is recognized separately as amortization and interest expense. Accounting Pronouncements Not Yet AdoptedIn June 2016, the FASB issued ASU No. 2016-13, Financial Instruments – Credit Losses. For most financial assets, such as trade and other receivables, loans andother instruments, this standard changes the current incurred loss model to a forward-looking expected credit loss model, which generally will result in the earlierrecognition of allowances for losses. The new standard is effective for our company at the beginning of 2020. Entities are required to apply the provisions of thestandard through a cumulative-effect adjustment to retained earnings as of the effective date. We are currently evaluating the impact of the standard on ourconsolidated financial statements. Note 3. Accounts Receivable and Finance Receivables Accounts ReceivableAccounts receivable is composed of the following:
(In millions)
March 30, 2019
December 29,2018
Commercial
$ 946 $ 885U.S. Government contracts
142
166
1,088
1,051Allowance for doubtful accounts
(29)
(27)Total
$ 1,059 $ 1,024 Finance ReceivablesFinance receivables are presented in the following table:
(In millions)
March 30, 2019
December 29,2018
Finance receivables
$ 782 $ 789Allowance for losses
(26)
(29)Total finance receivables, net
$ 756 $ 760 Finance Receivable Portfolio QualityWe internally assess the quality of our finance receivables based on a number of key credit quality indicators and statistics such as delinquency, loan balance toestimated collateral value and the financial strength of individual borrowers and guarantors. Because many of these indicators are difficult to apply across an entireclass of receivables, we evaluate individual loans on a quarterly basis and classify these loans into three categories based on the key credit quality indicators for theindividual loan. These three categories are performing, watchlist and nonaccrual. We classify finance receivables as nonaccrual if credit quality indicators suggest full collection of principal and interest is doubtful. In addition, we automaticallyclassify accounts as nonaccrual once they are contractually delinquent by more than three months unless collection of principal and interest is not doubtful. Accounts are classified as watchlist when credit quality indicators have deteriorated as compared with typical underwriting criteria, and we believe collection offull principal and interest is probable but not certain. All other finance receivables that do not meet the watchlist or nonaccrual categories are classified asperforming.
9

Table of Contents We measure delinquency based on the contractual payment terms of our finance receivables. In determining the delinquency aging category of an account, any/allprincipal and interest received is applied to the most past-due principal and/or interest amounts due. If a significant portion of the contractually due payment isdelinquent, the entire finance receivable balance is reported in accordance with the most past-due delinquency aging category. Finance receivables categorized based on the credit quality indicators and by the delinquency aging category are summarized as follows:
(Dollars in millions)
March 30, 2019
December 29,2018
Performing $ 708 $ 704Watchlist
43
45Nonaccrual
31
40Nonaccrual as a percentage of finance receivables
3.96%
5.07%Less than 31 days past due $ 691 $ 71931-60 days past due
70
5661-90 days past due
17
5Over 90 days past due
4
960+ days contractual delinquency as a percentage of finance receivables
2.69%
1.77% On a quarterly basis, we evaluate individual larger balance accounts for impairment. A finance receivable is considered impaired when it is probable that we will beunable to collect all amounts due according to the contractual terms of the loan agreement based on our review of the credit quality indicators described above.Impaired finance receivables include both nonaccrual accounts and accounts for which full collection of principal and interest remains probable, but the account’soriginal terms have been, or are expected to be, significantly modified. If the modification specifies an interest rate equal to or greater than a market rate for afinance receivable with comparable risk, the account is not considered impaired in years subsequent to the modification. A summary of finance receivables and the allowance for losses , based on the results of our impairment evaluation, is provided below. The finance receivablesincluded in this table specifically exclude leveraged leases in accordance with U.S. generally accepted accounting principles.
(In millions)
March 30, 2019
December 29,2018
Finance receivables evaluated collectively $ 650 $ 630Finance receivables evaluated individually
31
58Allowance for losses based on collective evaluation
24
24Allowance for losses based on individual evaluation
2
5Impaired finance receivables with no related allowance for losses $ 21 $ 43Impaired finance receivables with related allowance for losses
10
15Unpaid principal balance on impaired finance receivables
40
67Average recorded investment of impaired finance receivables
44
61 Note 4. Inventories Inventories are composed of the following:
(In millions)
March 30, 2019
December 29,2018
Finished goods $ 1,739 $ 1,662Work in process
1,518
1,356Raw materials and components
790
800Total $ 4,047 $ 3,818 Note 5. Other Assets On April 1, 2019, Textron Systems’ TRU Simulation + Training Inc. contributed assets associated with its training business into FlightSafety Textron AviationTraining LLC, a company formed by FlightSafety International Inc. and TRU to provide training solutions for Textron Aviation’s business and general aviationaircraft. Our 30% investment in this newly formed company will be accounted for under the equity method of accounting. The assets of the training business metthe criteria to be classified as held for sale at March 30, 2019 and were reclassified to Other assets in the Consolidated Balance Sheets at their net carrying value of$145 million, primarily property, plant and equipment of $64 million and allocated goodwill of $77 million.
10
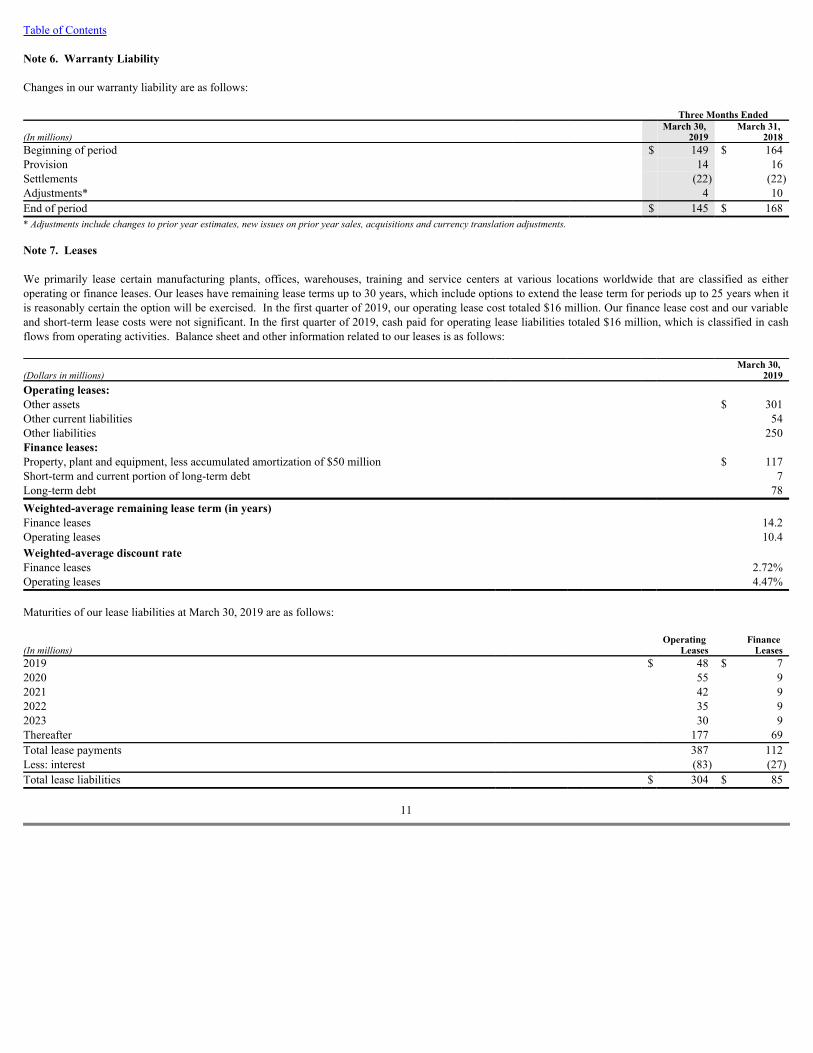
Table of Contents Note 6. Warranty Liability Changes in our warranty liability are as follows:
Three Months Ended
(In millions)
March 30, 2019
March 31, 2018
Beginning of period
$ 149 $ 164Provision
14
16Settlements
(22)
(22)Adjustments*
4
10End of period
$ 145 $ 168* Adjustments include changes to prior year estimates, new issues on prior year sales, acquisitions and currency translation adjustments. Note 7. Leases We primarily lease certain manufacturing plants, offices, warehouses, training and service centers at various locations worldwide that are classified as eitheroperating or finance leases. Our leases have remaining lease terms up to 30 years, which include options to extend the lease term for periods up to 25 years when itis reasonably certain the option will be exercised. In the first quarter of 2019, our operating lease cost totaled $16 million. Our finance lease cost and our variableand short-term lease costs were not significant. In the first quarter of 2019, cash paid for operating lease liabilities totaled $16 million, which is classified in cashflows from operating activities. Balance sheet and other information related to our leases is as follows:
(Dollars in millions)
March 30, 2019
Operating leases:
Other assets
$ 301Other current liabilities
54Other liabilities
250Finance leases:
Property, plant and equipment, less accumulated amortization of $50 million
$ 117Short-term and current portion of long-term debt
7Long-term debt
78Weighted-average remaining lease term (in years)
Finance leases
14.2Operating leases
10.4Weighted-average discount rate
Finance leases
2.72%Operating leases
4.47% Maturities of our lease liabilities at March 30, 2019 are as follows:
(In millions)
Operating Leases
Finance Leases
2019
$ 48 $ 72020
55
92021
42
92022
35
92023
30
9Thereafter
177
69Total lease payments
387
112Less: interest
(83)
(27)Total lease liabilities
$ 304 $ 85
11

Table of Contents Note 8. Derivative Instruments and Fair Value Measurements We measure fair value at the price that would be received to sell an asset or paid to transfer a liability in an orderly transaction between market participants at themeasurement date. We prioritize the assumptions that market participants would use in pricing the asset or liability into a three-tier fair value hierarchy. This fairvalue hierarchy gives the highest priority (Level 1) to quoted prices in active markets for identical assets or liabilities and the lowest priority (Level 3) tounobservable inputs in which little or no market data exist, requiring companies to develop their own assumptions. Observable inputs that do not meet the criteriaof Level 1, which include quoted prices for similar assets or liabilities in active markets or quoted prices for identical assets and liabilities in markets that are notactive, are categorized as Level 2. Level 3 inputs are those that reflect our estimates about the assumptions market participants would use in pricing the asset orliability based on the best information available in the circumstances. Valuation techniques for assets and liabilities measured using Level 3 inputs may includemethodologies such as the market approach, the income approach or the cost approach and may use unobservable inputs such as projections, estimates andmanagement’s interpretation of current market data. These unobservable inputs are utilized only to the extent that observable inputs are not available or costeffective to obtain. Assets and Liabilities Recorded at Fair Value on a Recurring BasisWe manufacture and sell our products in a number of countries throughout the world, and, therefore, we are exposed to movements in foreign currency exchangerates. We primarily utilize foreign currency exchange contracts with maturities of no more than three years to manage this volatility. These contracts qualify ascash flow hedges and are intended to offset the effect of exchange rate fluctuations on forecasted sales, inventory purchases and overhead expenses. Net gains andlosses recognized in earnings and Accumulated other comprehensive loss on cash flow hedges, including gains and losses related to hedge ineffectiveness, were notsignificant in the periods presented. Our foreign currency exchange contracts are measured at fair value using the market method valuation technique. The inputs to this technique utilize currentforeign currency exchange forward market rates published by third-party leading financial news and data providers. These are observable data that represent therates that the financial institution uses for contracts entered into at that date; however, they are not based on actual transactions so they are classified as Level 2. AtMarch 30, 2019 and December 29, 2018, we had foreign currency exchange contracts with notional amounts upon which the contracts were based of $489 millionand $379 million, respectively. At March 30, 2019, the fair value amounts of our foreign currency exchange contracts were a $4 million asset and a $7 millionliability. At December 29, 2018, the fair value amounts of our foreign currency exchange contracts were a $2 million asset and a $10 million liability. We hedge our net investment position in certain major currencies and generate foreign currency interest payments that offset other transactional exposures in thesecurrencies. To accomplish this, we borrow directly in the foreign currency and designate a portion of the debt as a hedge of the net investment. We record changesin the fair value of these contracts in other comprehensive income to the extent they are effective as cash flow hedges. Currency effects on the effective portion ofthese hedges, which are reflected in the foreign currency translation adjustments within Accumulated other comprehensive loss, were not significant in the periodspresented. Assets and Liabilities Not Recorded at Fair ValueThe carrying value and estimated fair value of our financial instruments that are not reflected in the financial statements at fair value are as follows:
March 30, 2019
December 29, 2018
(In millions)
Carrying Value
Estimated Fair Value
Carrying Value
Estimated Fair Value
Manufacturing group
Debt, excluding leases $ (3,105) $ (3,135) $ (2,996) $ (2,971)Finance group
Finance receivables, excluding leases
579
610
582
584Debt
(711)
(645)
(718)
(640) Fair value for the Manufacturing group debt is determined using market observable data for similar transactions (Level 2). The fair value for the Finance groupdebt was determined primarily based on discounted cash flow analyses using observable market inputs from debt with similar duration, subordination and creditdefault expectations (Level 2). Fair value estimates for finance receivables were determined based on internally developed discounted cash flow models primarilyutilizing significant unobservable inputs (Level 3), which include estimates of the rate of return, financing cost, capital structure and/or discount rate expectationsof current market participants combined with estimated loan cash flows based on credit losses, payment rates and expectations of borrowers’ ability to makepayments on a timely basis.
12
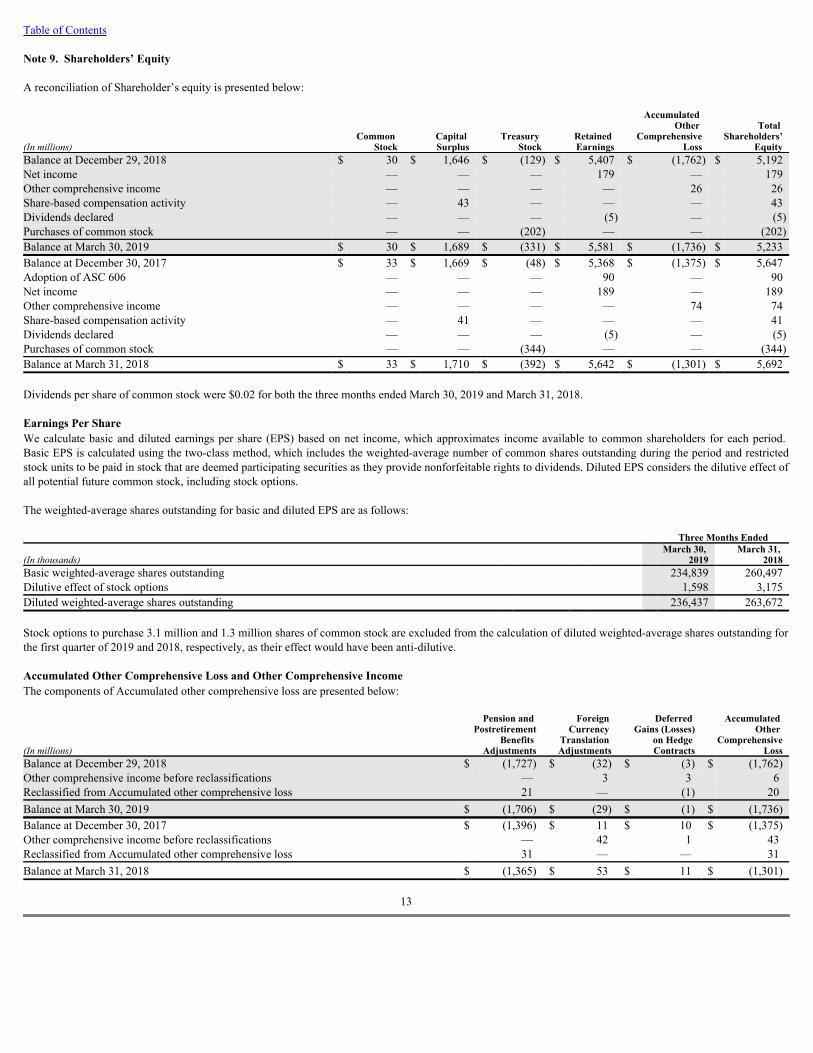
Table of Contents Note 9. Shareholders’ Equity A reconciliation of Shareholder’s equity is presented below:
(In millions)
Common Stock
Capital Surplus
Treasury Stock
Retained Earnings
Accumulated Other
ComprehensiveLoss
Total Shareholders’
EquityBalance at December 29, 2018 $ 30 $ 1,646 $ (129) $ 5,407 $ (1,762) $ 5,192Net income
—
—
—
179
—
179Other comprehensive income
—
—
—
—
26
26Share-based compensation activity
—
43
—
—
—
43Dividends declared
—
—
—
(5)
—
(5)Purchases of common stock
—
—
(202)
—
—
(202)Balance at March 30, 2019 $ 30 $ 1,689 $ (331) $ 5,581 $ (1,736) $ 5,233Balance at December 30, 2017 $ 33 $ 1,669 $ (48) $ 5,368 $ (1,375) $ 5,647Adoption of ASC 606
—
—
—
90
—
90Net income
—
—
—
189
—
189Other comprehensive income
—
—
—
—
74
74Share-based compensation activity
—
41
—
—
—
41Dividends declared
—
—
—
(5)
—
(5)Purchases of common stock
—
—
(344)
—
—
(344)Balance at March 31, 2018 $ 33 $ 1,710 $ (392) $ 5,642 $ (1,301) $ 5,692 Dividends per share of common stock were $0.02 for both the three months ended March 30, 2019 and March 31, 2018. Earnings Per ShareWe calculate basic and diluted earnings per share (EPS) based on net income, which approximates income available to common shareholders for each period. Basic EPS is calculated using the two-class method, which includes the weighted-average number of common shares outstanding during the period and restrictedstock units to be paid in stock that are deemed participating securities as they provide nonforfeitable rights to dividends. Diluted EPS considers the dilutive effect ofall potential future common stock, including stock options. The weighted-average shares outstanding for basic and diluted EPS are as follows:
Three Months Ended
(In thousands)
March 30, 2019
March 31, 2018
Basic weighted-average shares outstanding
234,839
260,497Dilutive effect of stock options
1,598
3,175Diluted weighted-average shares outstanding
236,437
263,672 Stock options to purchase 3.1 million and 1.3 million shares of common stock are excluded from the calculation of diluted weighted-average shares outstanding forthe first quarter of 2019 and 2018, respectively, as their effect would have been anti-dilutive. Accumulated Other Comprehensive Loss and Other Comprehensive IncomeThe components of Accumulated other comprehensive loss are presented below:
(In millions)
Pension and Postretirement
Benefits Adjustments
Foreign Currency
Translation Adjustments
Deferred Gains (Losses)
on Hedge Contracts
Accumulated Other
ComprehensiveLoss
Balance at December 29, 2018 $ (1,727) $ (32) $ (3) $ (1,762)Other comprehensive income before reclassifications
—
3
3
6Reclassified from Accumulated other comprehensive loss
21
—
(1)
20Balance at March 30, 2019 $ (1,706) $ (29) $ (1) $ (1,736)Balance at December 30, 2017 $ (1,396) $ 11 $ 10 $ (1,375)Other comprehensive income before reclassifications
—
42
1
43Reclassified from Accumulated other comprehensive loss
31
—
—
31Balance at March 31, 2018 $ (1,365) $ 53 $ 11 $ (1,301)
13
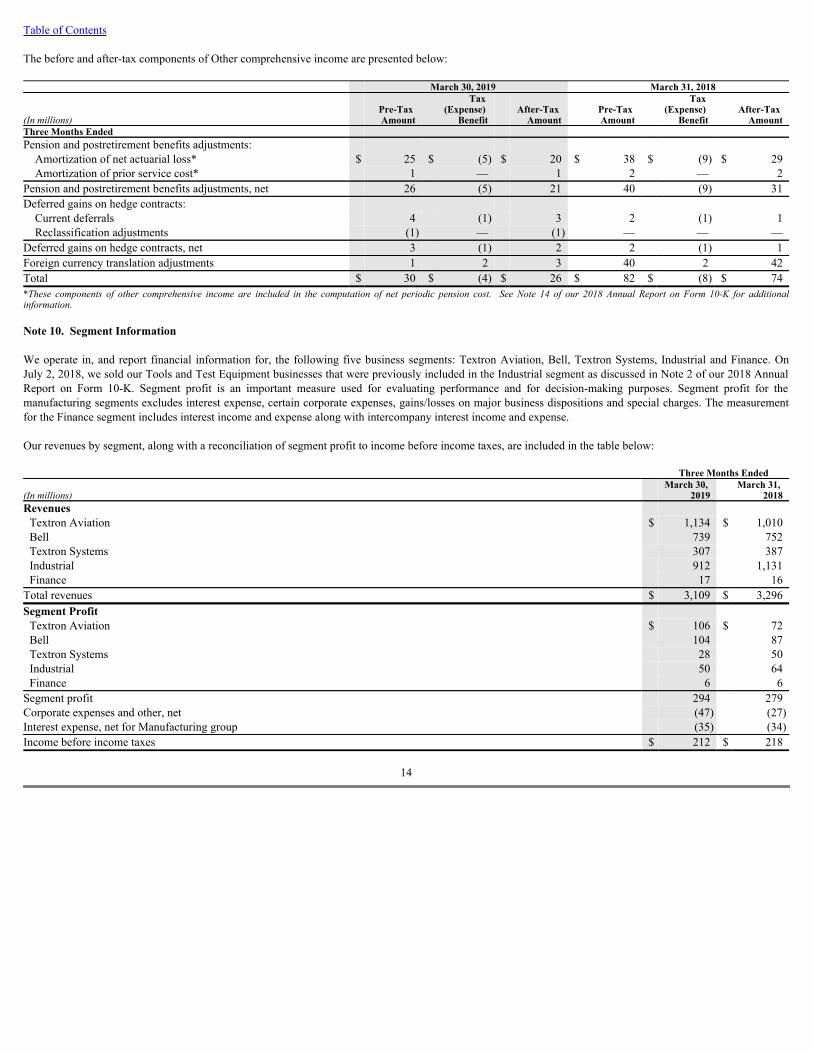
Table of Contents The before and after-tax components of Other comprehensive income are presented below:
March 30, 2019
March 31, 2018
(In millions)
Pre-Tax Amount
Tax (Expense)
Benefit
After-Tax Amount
Pre-Tax Amount
Tax (Expense)
Benefit
After-Tax Amount
Three Months Ended
Pension and postretirement benefits adjustments:
Amortization of net actuarial loss* $ 25 $ (5) $ 20 $ 38 $ (9) $ 29Amortization of prior service cost*
1
—
1
2
—
2Pension and postretirement benefits adjustments, net
26
(5)
21
40
(9)
31Deferred gains on hedge contracts:
Current deferrals
4
(1)
3
2
(1)
1Reclassification adjustments
(1)
—
(1)
—
—
—Deferred gains on hedge contracts, net
3
(1)
2
2
(1)
1Foreign currency translation adjustments
1
2
3
40
2
42Total $ 30 $ (4) $ 26 $ 82 $ (8) $ 74*These components of other comprehensive income are included in the computation of net periodic pension cost. See Note 14 of our 2018 Annual Report on Form 10-K for additionalinformation. Note 10. Segment Information We operate in, and report financial information for, the following five business segments: Textron Aviation, Bell, Textron Systems, Industrial and Finance. OnJuly 2, 2018, we sold our Tools and Test Equipment businesses that were previously included in the Industrial segment as discussed in Note 2 of our 2018 AnnualReport on Form 10-K. Segment profit is an important measure used for evaluating performance and for decision-making purposes. Segment profit for themanufacturing segments excludes interest expense, certain corporate expenses, gains/losses on major business dispositions and special charges. The measurementfor the Finance segment includes interest income and expense along with intercompany interest income and expense. Our revenues by segment, along with a reconciliation of segment profit to income before income taxes, are included in the table below:
Three Months Ended
(In millions)
March 30, 2019
March 31, 2018
Revenues
Textron Aviation $ 1,134 $ 1,010Bell
739
752Textron Systems
307
387Industrial
912
1,131Finance
17
16Total revenues $ 3,109 $ 3,296Segment Profit
Textron Aviation $ 106 $ 72Bell
104
87Textron Systems
28
50Industrial
50
64Finance
6
6Segment profit
294
279Corporate expenses and other, net
(47)
(27)Interest expense, net for Manufacturing group
(35)
(34)Income before income taxes $ 212 $ 218
14
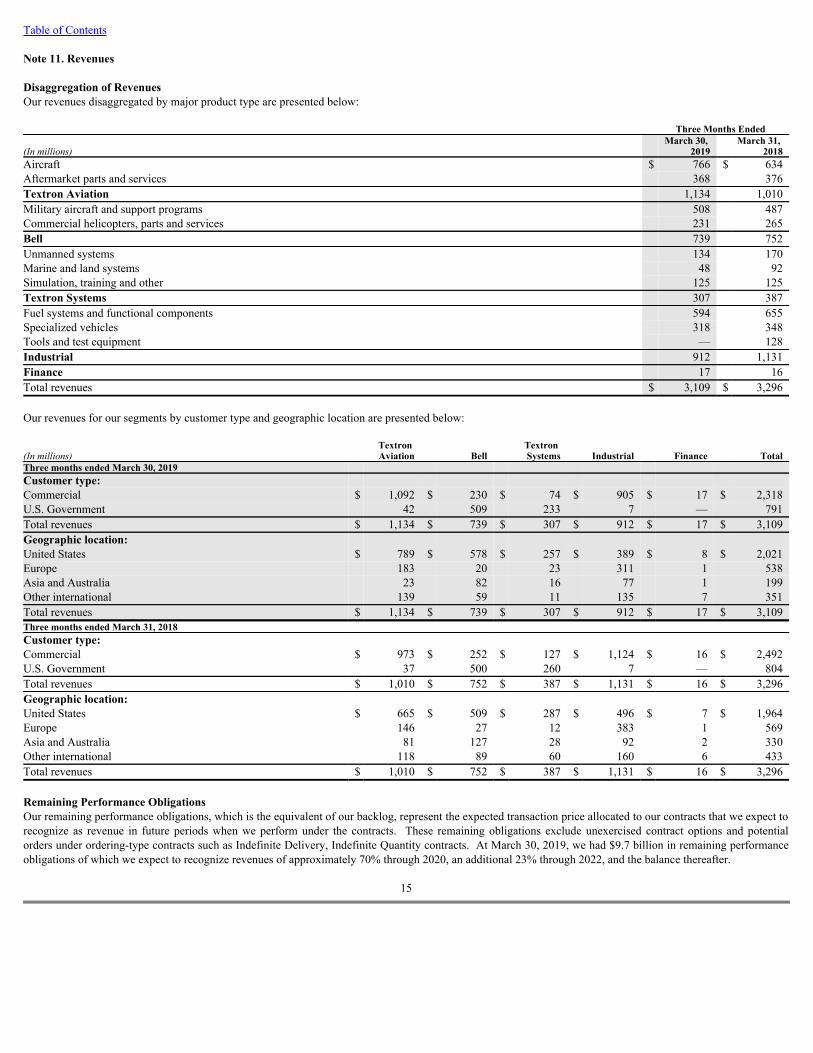
Table of Contents Note 11. Revenues Disaggregation of RevenuesOur revenues disaggregated by major product type are presented below:
Three Months Ended
(In millions)
March 30, 2019
March 31, 2018
Aircraft $ 766 $ 634Aftermarket parts and services
368
376Textron Aviation
1,134
1,010Military aircraft and support programs
508
487Commercial helicopters, parts and services
231
265Bell
739
752Unmanned systems
134
170Marine and land systems
48
92Simulation, training and other
125
125Textron Systems
307
387Fuel systems and functional components
594
655Specialized vehicles
318
348Tools and test equipment
—
128Industrial
912
1,131Finance
17
16Total revenues $ 3,109 $ 3,296 Our revenues for our segments by customer type and geographic location are presented below:
(In millions)
Textron Aviation
Bell
Textron Systems
Industrial
Finance
TotalThree months ended March 30, 2019
Customer type:
Commercial $ 1,092 $ 230 $ 74 $ 905 $ 17 $ 2,318U.S. Government
42
509
233
7
—
791Total revenues $ 1,134 $ 739 $ 307 $ 912 $ 17 $ 3,109Geographic location:
United States $ 789 $ 578 $ 257 $ 389 $ 8 $ 2,021Europe
183
20
23
311
1
538Asia and Australia
23
82
16
77
1
199Other international
139
59
11
135
7
351Total revenues $ 1,134 $ 739 $ 307 $ 912 $ 17 $ 3,109Three months ended March 31, 2018
Customer type:
Commercial $ 973 $ 252 $ 127 $ 1,124 $ 16 $ 2,492U.S. Government
37
500
260
7
—
804Total revenues $ 1,010 $ 752 $ 387 $ 1,131 $ 16 $ 3,296Geographic location:
United States $ 665 $ 509 $ 287 $ 496 $ 7 $ 1,964Europe
146
27
12
383
1
569Asia and Australia
81
127
28
92
2
330Other international
118
89
60
160
6
433Total revenues $ 1,010 $ 752 $ 387 $ 1,131 $ 16 $ 3,296 Remaining Performance ObligationsOur remaining performance obligations, which is the equivalent of our backlog, represent the expected transaction price allocated to our contracts that we expect torecognize as revenue in future periods when we perform under the contracts. These remaining obligations exclude unexercised contract options and potentialorders under ordering-type contracts such as Indefinite Delivery, Indefinite Quantity contracts. At March 30, 2019, we had $9.7 billion in remaining performanceobligations of which we expect to recognize revenues of approximately 70% through 2020, an additional 23% through 2022, and the balance thereafter.
15
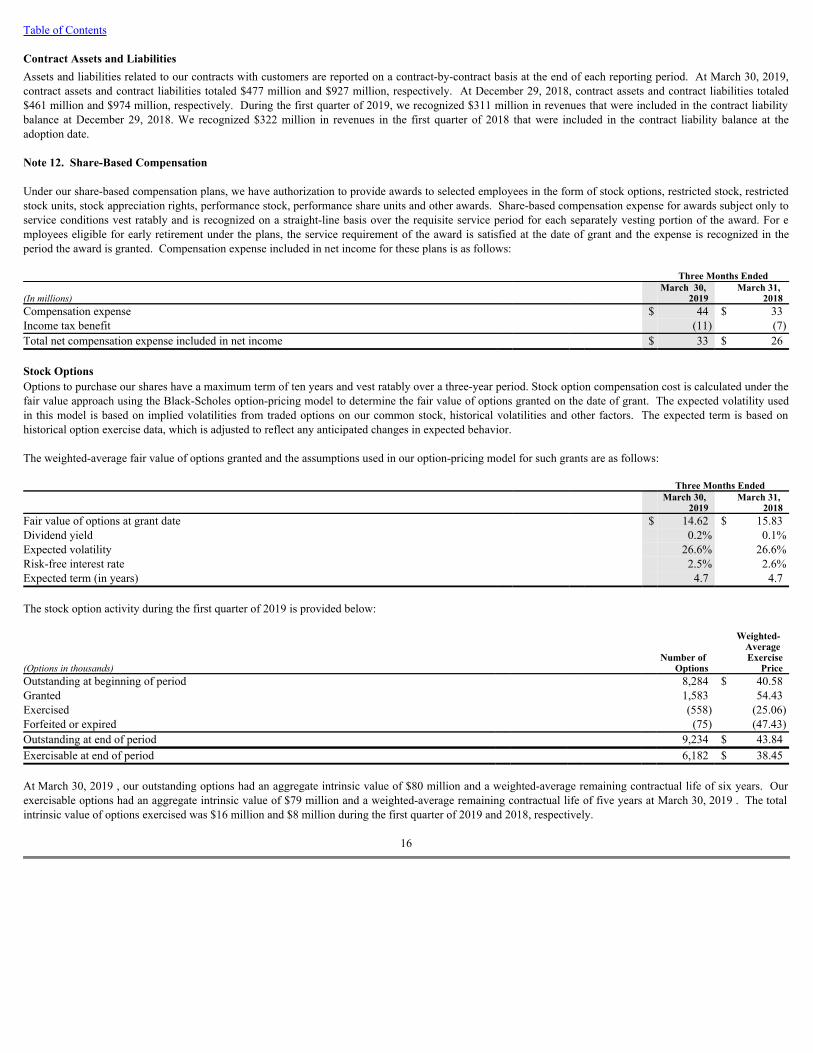
Table of Contents Contract Assets and LiabilitiesAssets and liabilities related to our contracts with customers are reported on a contract-by-contract basis at the end of each reporting period. At March 30, 2019,contract assets and contract liabilities totaled $477 million and $927 million, respectively. At December 29, 2018, contract assets and contract liabilities totaled$461 million and $974 million, respectively. During the first quarter of 2019, we recognized $311 million in revenues that were included in the contract liabilitybalance at December 29, 2018. We recognized $322 million in revenues in the first quarter of 2018 that were included in the contract liability balance at theadoption date. Note 12. Share-Based Compensation Under our share-based compensation plans, we have authorization to provide awards to selected employees in the form of stock options, restricted stock, restrictedstock units, stock appreciation rights, performance stock, performance share units and other awards. Share-based compensation expense for awards subject only toservice conditions vest ratably and is recognized on a straight-line basis over the requisite service period for each separately vesting portion of the award. For employees eligible for early retirement under the plans, the service requirement of the award is satisfied at the date of grant and the expense is recognized in theperiod the award is granted. Compensation expense included in net income for these plans is as follows:
Three Months Ended
(In millions)
March 30, 2019
March 31, 2018
Compensation expense
$ 44 $ 33Income tax benefit
(11)
(7)Total net compensation expense included in net income
$ 33 $ 26 Stock OptionsOptions to purchase our shares have a maximum term of ten years and vest ratably over a three-year period. Stock option compensation cost is calculated under thefair value approach using the Black-Scholes option-pricing model to determine the fair value of options granted on the date of grant. The expected volatility usedin this model is based on implied volatilities from traded options on our common stock, historical volatilities and other factors. The expected term is based onhistorical option exercise data, which is adjusted to reflect any anticipated changes in expected behavior. The weighted-average fair value of options granted and the assumptions used in our option-pricing model for such grants are as follows:
Three Months Ended
March 30, 2019
March 31, 2018
Fair value of options at grant date
$ 14.62 $ 15.83Dividend yield
0.2%
0.1%Expected volatility
26.6%
26.6%Risk-free interest rate
2.5%
2.6%Expected term (in years)
4.7
4.7 The stock option activity during the first quarter of 2019 is provided below:
(Options in thousands)
Number of Options
Weighted- Average Exercise
PriceOutstanding at beginning of period
8,284 $ 40.58Granted
1,583
54.43Exercised
(558)
(25.06)Forfeited or expired
(75)
(47.43)Outstanding at end of period
9,234 $ 43.84Exercisable at end of period
6,182 $ 38.45 At March 30, 2019 , our outstanding options had an aggregate intrinsic value of $80 million and a weighted-average remaining contractual life of six years. Ourexercisable options had an aggregate intrinsic value of $79 million and a weighted-average remaining contractual life of five years at March 30, 2019 . The totalintrinsic value of options exercised was $16 million and $8 million during the first quarter of 2019 and 2018, respectively.
16
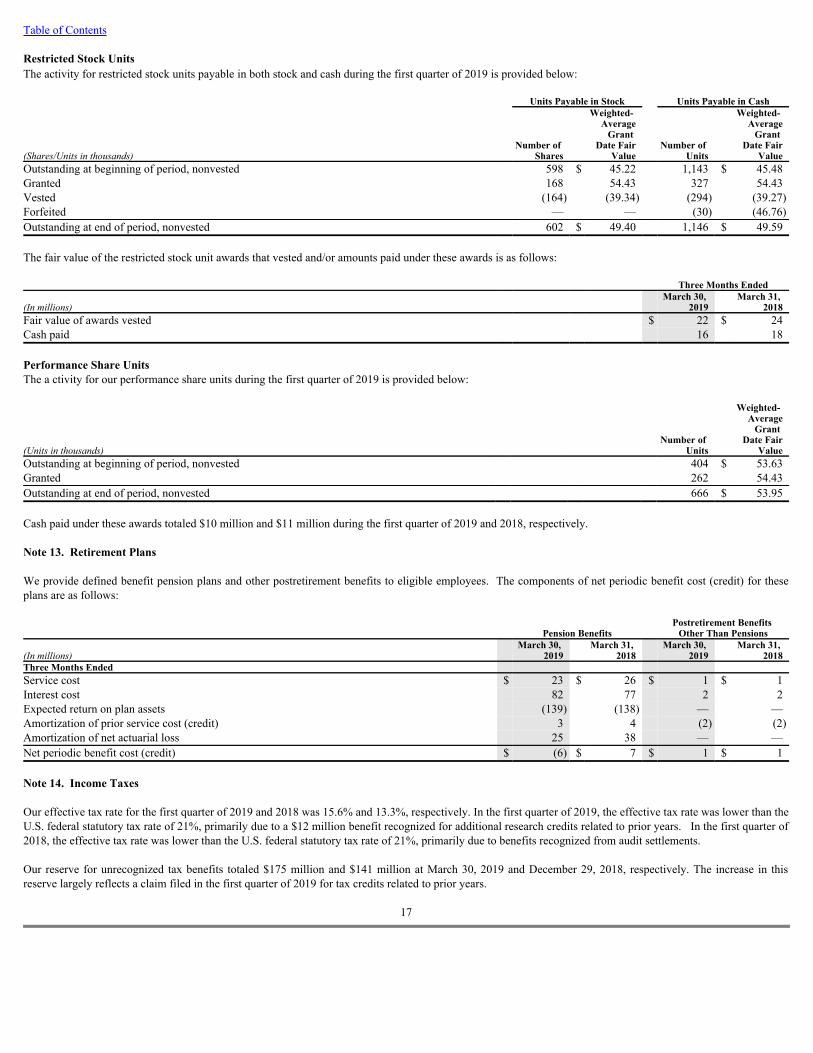
Table of Contents Restricted Stock UnitsThe activity for restricted stock units payable in both stock and cash during the first quarter of 2019 is provided below:
Units Payable in Stock
Units Payable in Cash
(Shares/Units in thousands)
Number of Shares
Weighted- Average
Grant Date Fair
Value
Number of Units
Weighted- Average
Grant Date Fair
ValueOutstanding at beginning of period, nonvested
598 $ 45.22
1,143 $ 45.48Granted
168
54.43
327
54.43Vested
(164)
(39.34)
(294)
(39.27)Forfeited
—
—
(30)
(46.76)Outstanding at end of period, nonvested
602 $ 49.40
1,146 $ 49.59 The fair value of the restricted stock unit awards that vested and/or amounts paid under these awards is as follows:
Three Months Ended
(In millions)
March 30, 2019
March 31, 2018
Fair value of awards vested
$ 22 $ 24Cash paid
16
18 Performance Share UnitsThe a ctivity for our performance share units during the first quarter of 2019 is provided below:
(Units in thousands)
Number of Units
Weighted- Average
Grant Date Fair
ValueOutstanding at beginning of period, nonvested
404 $ 53.63Granted
262
54.43Outstanding at end of period, nonvested
666 $ 53.95 Cash paid under these awards totaled $10 million and $11 million during the first quarter of 2019 and 2018, respectively. Note 13. Retirement Plans We provide defined benefit pension plans and other postretirement benefits to eligible employees. The components of net periodic benefit cost (credit) for theseplans are as follows:
Pension Benefits
Postretirement Benefits Other Than Pensions
(In millions)
March 30, 2019
March 31, 2018
March 30, 2019
March 31, 2018
Three Months Ended
Service cost $ 23 $ 26 $ 1 $ 1Interest cost
82
77
2
2Expected return on plan assets
(139)
(138)
—
—Amortization of prior service cost (credit)
3
4
(2)
(2)Amortization of net actuarial loss
25
38
—
—Net periodic benefit cost (credit) $ (6) $ 7 $ 1 $ 1 Note 14. Income Taxes Our effective tax rate for the first quarter of 2019 and 2018 was 15.6% and 13.3%, respectively. In the first quarter of 2019, the effective tax rate was lower than theU.S. federal statutory tax rate of 21%, primarily due to a $12 million benefit recognized for additional research credits related to prior years. In the first quarter of2018, the effective tax rate was lower than the U.S. federal statutory tax rate of 21%, primarily due to benefits recognized from audit settlements. Our reserve for unrecognized tax benefits totaled $175 million and $141 million at March 30, 2019 and December 29, 2018, respectively. The increase in thisreserve largely reflects a claim filed in the first quarter of 2019 for tax credits related to prior years.
17

Table of Contents Note 15. Commitments and Contingencies We are subject to legal proceedings and other claims arising out of the conduct of our business, including proceedings and claims relating to commercial andfinancial transactions; government contracts; alleged lack of compliance with applicable laws and regulations; production partners; product liability; patent andtrademark infringement; employment disputes; and environmental, safety and health matters. Some of these legal proceedings and claims seek damages, fines orpenalties in substantial amounts or remediation of environmental contamination. As a government contractor, we are subject to audits, reviews and investigations todetermine whether our operations are being conducted in accordance with applicable regulatory requirements. Under federal government procurement regulations,certain claims brought by the U.S. Government could result in our suspension or debarment from U.S. Government contracting for a period of time. On the basis ofinformation presently available, we do not believe that existing proceedings and claims will have a material effect on our financial position or results of operations.
18
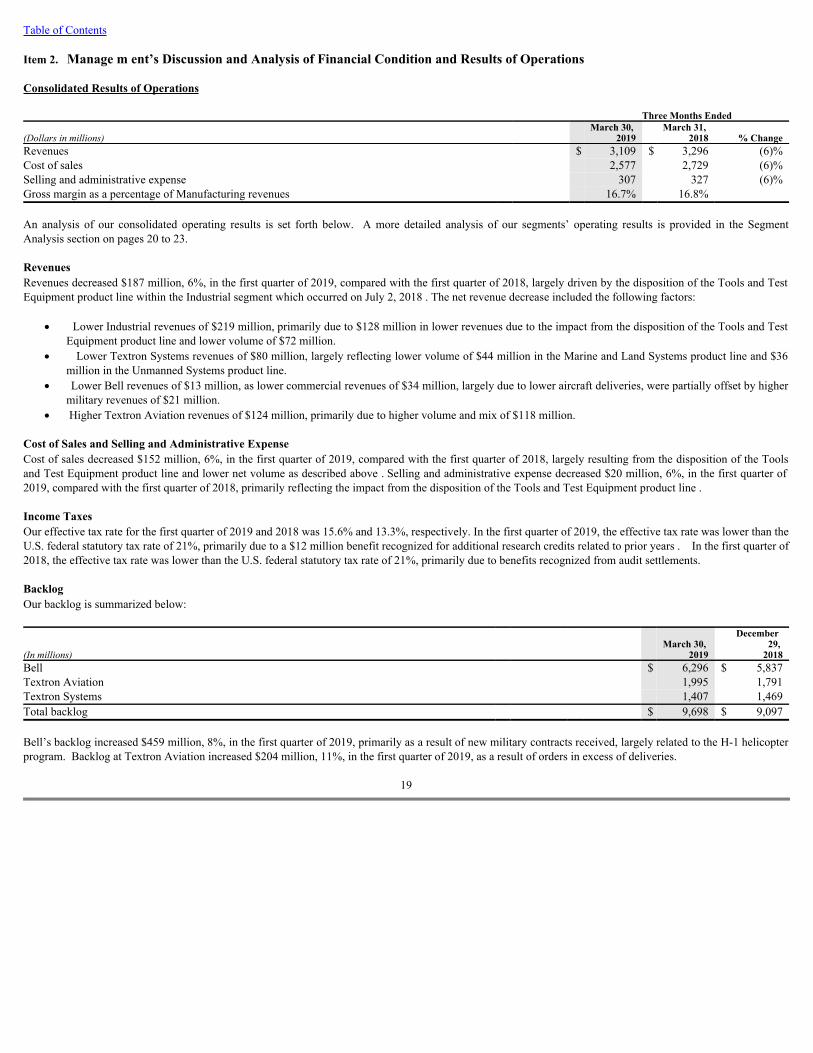
Table of Contents Item 2. Manage m ent’s Discussion and Analysis of Financial Condition and Results of Operations Consolidated Results of Operations
Three Months Ended
(Dollars in millions)
March 30, 2019
March 31, 2018
% ChangeRevenues
$ 3,109 $ 3,296
(6)%Cost of sales
2,577
2,729
(6)%Selling and administrative expense
307
327
(6)%Gross margin as a percentage of Manufacturing revenues
16.7%
16.8%
An analysis of our consolidated operating results is set forth below. A more detailed analysis of our segments’ operating results is provided in the SegmentAnalysis section on pages 20 to 23. RevenuesRevenues decreased $187 million, 6%, in the first quarter of 2019, compared with the first quarter of 2018, largely driven by the disposition of the Tools and TestEquipment product line within the Industrial segment which occurred on July 2, 2018 . The net revenue decrease included the following factors:
· Lower Industrial revenues of $219 million, primarily due to $128 million in lower revenues due to the impact from the disposition of the Tools and TestEquipment product line and lower volume of $72 million.
· Lower Textron Systems revenues of $80 million, largely reflecting lower volume of $44 million in the Marine and Land Systems product line and $36million in the Unmanned Systems product line.
· Lower Bell revenues of $13 million, as lower commercial revenues of $34 million, largely due to lower aircraft deliveries, were partially offset by highermilitary revenues of $21 million.
· Higher Textron Aviation revenues of $124 million, primarily due to higher volume and mix of $118 million. Cost of Sales and Selling and Administrative ExpenseCost of sales decreased $152 million, 6%, in the first quarter of 2019, compared with the first quarter of 2018, largely resulting from the disposition of the Toolsand Test Equipment product line and lower net volume as described above . Selling and administrative expense decreased $20 million, 6%, in the first quarter of2019, compared with the first quarter of 2018, primarily reflecting the impact from the disposition of the Tools and Test Equipment product line . Income TaxesOur effective tax rate for the first quarter of 2019 and 2018 was 15.6% and 13.3%, respectively. In the first quarter of 2019, the effective tax rate was lower than theU.S. federal statutory tax rate of 21%, primarily due to a $12 million benefit recognized for additional research credits related to prior years . In the first quarter of2018, the effective tax rate was lower than the U.S. federal statutory tax rate of 21%, primarily due to benefits recognized from audit settlements. BacklogOur backlog is summarized below:
(In millions)
March 30, 2019
December 29,
2018Bell
$ 6,296 $ 5,837Textron Aviation
1,995
1,791Textron Systems
1,407
1,469Total backlog
$ 9,698 $ 9,097 Bell’s backlog increased $459 million, 8%, in the first quarter of 2019, primarily as a result of new military contracts received, largely related to the H-1 helicopterprogram. Backlog at Textron Aviation increased $204 million, 11%, in the first quarter of 2019, as a result of orders in excess of deliveries.
19
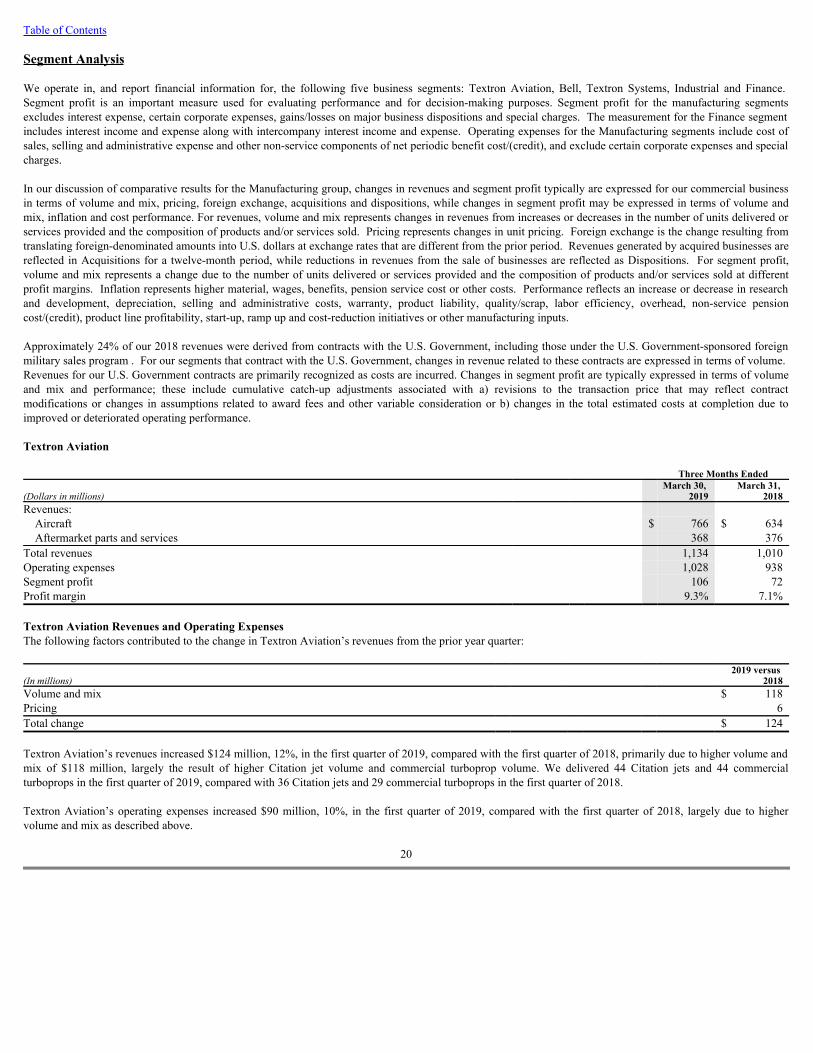
Table of Contents Segment Analysis We operate in, and report financial information for, the following five business segments: Textron Aviation, Bell, Textron Systems, Industrial and Finance. Segment profit is an important measure used for evaluating performance and for decision-making purposes. Segment profit for the manufacturing segmentsexcludes interest expense, certain corporate expenses, gains/losses on major business dispositions and special charges. The measurement for the Finance segmentincludes interest income and expense along with intercompany interest income and expense. Operating expenses for the Manufacturing segments include cost ofsales, selling and administrative expense and other non-service components of net periodic benefit cost/(credit), and exclude certain corporate expenses and specialcharges. In our discussion of comparative results for the Manufacturing group, changes in revenues and segment profit typically are expressed for our commercial businessin terms of volume and mix, pricing, foreign exchange, acquisitions and dispositions, while changes in segment profit may be expressed in terms of volume andmix, inflation and cost performance. For revenues, volume and mix represents changes in revenues from increases or decreases in the number of units delivered orservices provided and the composition of products and/or services sold. Pricing represents changes in unit pricing. Foreign exchange is the change resulting fromtranslating foreign-denominated amounts into U.S. dollars at exchange rates that are different from the prior period. Revenues generated by acquired businesses arereflected in Acquisitions for a twelve-month period, while reductions in revenues from the sale of businesses are reflected as Dispositions. For segment profit,volume and mix represents a change due to the number of units delivered or services provided and the composition of products and/or services sold at differentprofit margins. Inflation represents higher material, wages, benefits, pension service cost or other costs. Performance reflects an increase or decrease in researchand development, depreciation, selling and administrative costs, warranty, product liability, quality/scrap, labor efficiency, overhead, non-service pensioncost/(credit), product line profitability, start-up, ramp up and cost-reduction initiatives or other manufacturing inputs. Approximately 24% of our 2018 revenues were derived from contracts with the U.S. Government, including those under the U.S. Government-sponsored foreignmilitary sales program . For our segments that contract with the U.S. Government, changes in revenue related to these contracts are expressed in terms of volume. Revenues for our U.S. Government contracts are primarily recognized as costs are incurred. Changes in segment profit are typically expressed in terms of volumeand mix and performance; these include cumulative catch-up adjustments associated with a) revisions to the transaction price that may reflect contractmodifications or changes in assumptions related to award fees and other variable consideration or b) changes in the total estimated costs at completion due toimproved or deteriorated operating performance. Textron Aviation
Three Months Ended
(Dollars in millions)
March 30, 2019
March 31, 2018
Revenues:
Aircraft
$ 766 $ 634Aftermarket parts and services
368
376Total revenues
1,134
1,010Operating expenses
1,028
938Segment profit
106
72Profit margin
9.3%
7.1% Textron Aviation Revenues and Operating ExpensesThe following factors contributed to the change in Textron Aviation’s revenues from the prior year quarter:
(In millions)
2019 versus 2018
Volume and mix
$ 118Pricing
6Total change
$ 124 Textron Aviation’s revenues increased $124 million, 12%, in the first quarter of 2019, compared with the first quarter of 2018, primarily due to higher volume andmix of $118 million, largely the result of higher Citation jet volume and commercial turboprop volume. We delivered 44 Citation jets and 44 commercialturboprops in the first quarter of 2019, compared with 36 Citation jets and 29 commercial turboprops in the first quarter of 2018. Textron Aviation’s operating expenses increased $90 million, 10%, in the first quarter of 2019, compared with the first quarter of 2018, largely due to highervolume and mix as described above.
20
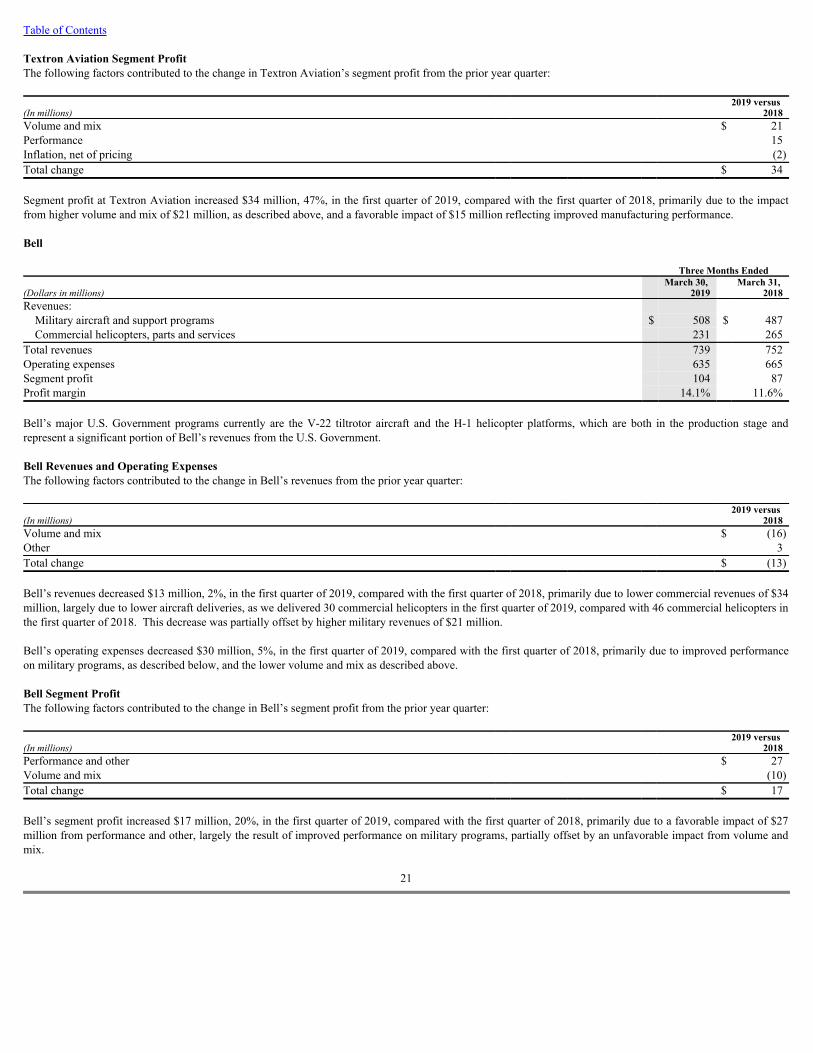
Table of Contents Textron Aviation Segment ProfitThe following factors contributed to the change in Textron Aviation’s segment profit from the prior year quarter:
(In millions)
2019 versus 2018
Volume and mix
$ 21Performance
15Inflation, net of pricing
(2)Total change
$ 34 Segment profit at Textron Aviation increased $34 million, 47%, in the first quarter of 2019, compared with the first quarter of 2018, primarily due to the impactfrom higher volume and mix of $21 million, as described above, and a favorable impact of $15 million reflecting improved manufacturing performance. Bell
Three Months Ended
(Dollars in millions)
March 30, 2019
March 31, 2018
Revenues:
Military aircraft and support programs $ 508 $ 487Commercial helicopters, parts and services
231
265Total revenues
739
752Operating expenses
635
665Segment profit
104
87Profit margin
14.1%
11.6% Bell’s major U.S. Government programs currently are the V-22 tiltrotor aircraft and the H-1 helicopter platforms, which are both in the production stage andrepresent a significant portion of Bell’s revenues from the U.S. Government. Bell Revenues and Operating ExpensesThe following factors contributed to the change in Bell’s revenues from the prior year quarter:
(In millions)
2019 versus 2018
Volume and mix
$ (16)Other
3Total change
$ (13) Bell’s revenues decreased $13 million, 2%, in the first quarter of 2019, compared with the first quarter of 2018, primarily due to lower commercial revenues of $34million, largely due to lower aircraft deliveries, as we delivered 30 commercial helicopters in the first quarter of 2019, compared with 46 commercial helicopters inthe first quarter of 2018. This decrease was partially offset by higher military revenues of $21 million. Bell’s operating expenses decreased $30 million, 5%, in the first quarter of 2019, compared with the first quarter of 2018, primarily due to improved performanceon military programs, as described below, and the lower volume and mix as described above. Bell Segment ProfitThe following factors contributed to the change in Bell’s segment profit from the prior year quarter:
(In millions)
2019 versus 2018
Performance and other
$ 27Volume and mix
(10)Total change
$ 17 Bell’s segment profit increased $17 million, 20%, in the first quarter of 2019, compared with the first quarter of 2018, primarily due to a favorable impact of $27million from performance and other, largely the result of improved performance on military programs, partially offset by an unfavorable impact from volume andmix.
21
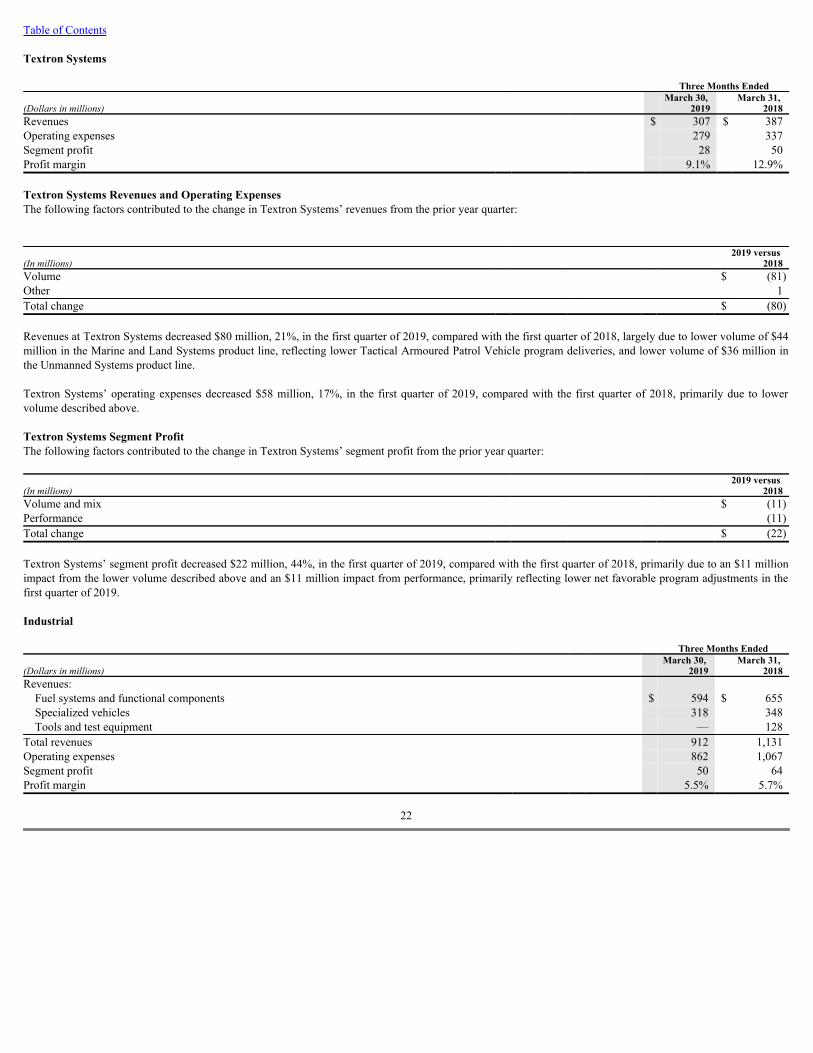
Table of Contents Textron Systems
Three Months Ended
(Dollars in millions)
March 30, 2019
March 31, 2018
Revenues
$ 307 $ 387Operating expenses
279
337Segment profit
28
50Profit margin
9.1%
12.9% Textron Systems Revenues and Operating ExpensesThe following factors contributed to the change in Textron Systems’ revenues from the prior year quarter:
(In millions)
2019 versus 2018
Volume
$ (81)Other
1Total change
$ (80) Revenues at Textron Systems decreased $80 million, 21%, in the first quarter of 2019, compared with the first quarter of 2018, largely due to lower volume of $44million in the Marine and Land Systems product line, reflecting lower Tactical Armoured Patrol Vehicle program deliveries, and lower volume of $36 million inthe Unmanned Systems product line. Textron Systems’ operating expenses decreased $58 million, 17%, in the first quarter of 2019, compared with the first quarter of 2018, primarily due to lowervolume described above. Textron Systems Segment ProfitThe following factors contributed to the change in Textron Systems’ segment profit from the prior year quarter:
(In millions)
2019 versus 2018
Volume and mix
$ (11)Performance
(11)Total change
$ (22) Textron Systems’ segment profit decreased $22 million, 44%, in the first quarter of 2019, compared with the first quarter of 2018, primarily due to an $11 millionimpact from the lower volume described above and an $11 million impact from performance, primarily reflecting lower net favorable program adjustments in thefirst quarter of 2019. Industrial
Three Months Ended
(Dollars in millions)
March 30, 2019
March 31, 2018
Revenues:
Fuel systems and functional components
$ 594 $ 655Specialized vehicles
318
348Tools and test equipment
—
128Total revenues
912
1,131Operating expenses
862
1,067Segment profit
50
64Profit margin
5.5%
5.7%
22
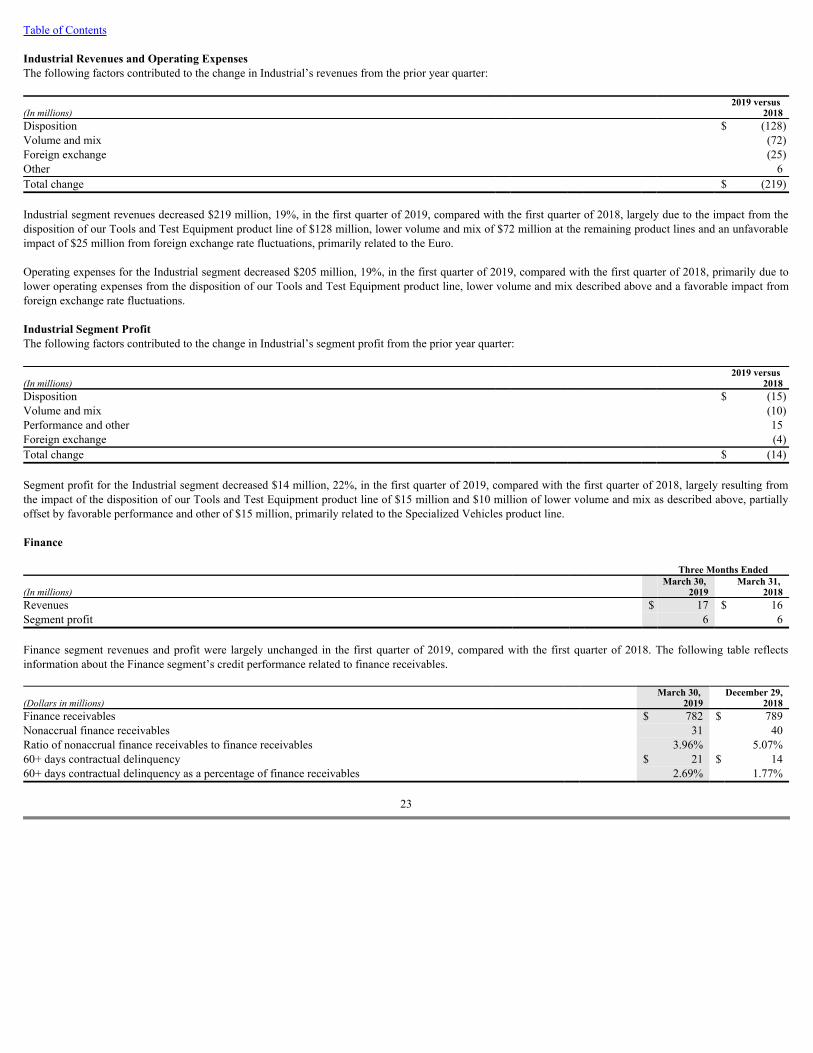
Table of Contents Industrial Revenues and Operating ExpensesThe following factors contributed to the change in Industrial’s revenues from the prior year quarter:
(In millions)
2019 versus 2018
Disposition
$ (128)Volume and mix
(72)Foreign exchange
(25)Other
6Total change
$ (219) Industrial segment revenues decreased $219 million, 19%, in the first quarter of 2019, compared with the first quarter of 2018, largely due to the impact from thedisposition of our Tools and Test Equipment product line of $128 million, lower volume and mix of $72 million at the remaining product lines and an unfavorableimpact of $25 million from foreign exchange rate fluctuations, primarily related to the Euro. Operating expenses for the Industrial segment decreased $205 million, 19%, in the first quarter of 2019, compared with the first quarter of 2018, primarily due tolower operating expenses from the disposition of our Tools and Test Equipment product line, lower volume and mix described above and a favorable impact fromforeign exchange rate fluctuations. Industrial Segment ProfitThe following factors contributed to the change in Industrial’s segment profit from the prior year quarter:
(In millions)
2019 versus 2018
Disposition
$ (15)Volume and mix
(10)Performance and other
15Foreign exchange
(4)Total change
$ (14) Segment profit for the Industrial segment decreased $14 million, 22%, in the first quarter of 2019, compared with the first quarter of 2018, largely resulting fromthe impact of the disposition of our Tools and Test Equipment product line of $15 million and $10 million of lower volume and mix as described above, partiallyoffset by favorable performance and other of $15 million, primarily related to the Specialized Vehicles product line. Finance
Three Months Ended
(In millions)
March 30, 2019
March 31, 2018
Revenues
$ 17 $ 16Segment profit
6
6 Finance segment revenues and profit were largely unchanged in the first quarter of 2019, compared with the first quarter of 2018. The following table reflectsinformation about the Finance segment’s credit performance related to finance receivables.
(Dollars in millions)
March 30, 2019
December 29,2018
Finance receivables
$ 782 $ 789Nonaccrual finance receivables
31
40Ratio of nonaccrual finance receivables to finance receivables
3.96%
5.07%60+ days contractual delinquency
$ 21 $ 1460+ days contractual delinquency as a percentage of finance receivables
2.69%
1.77%
23
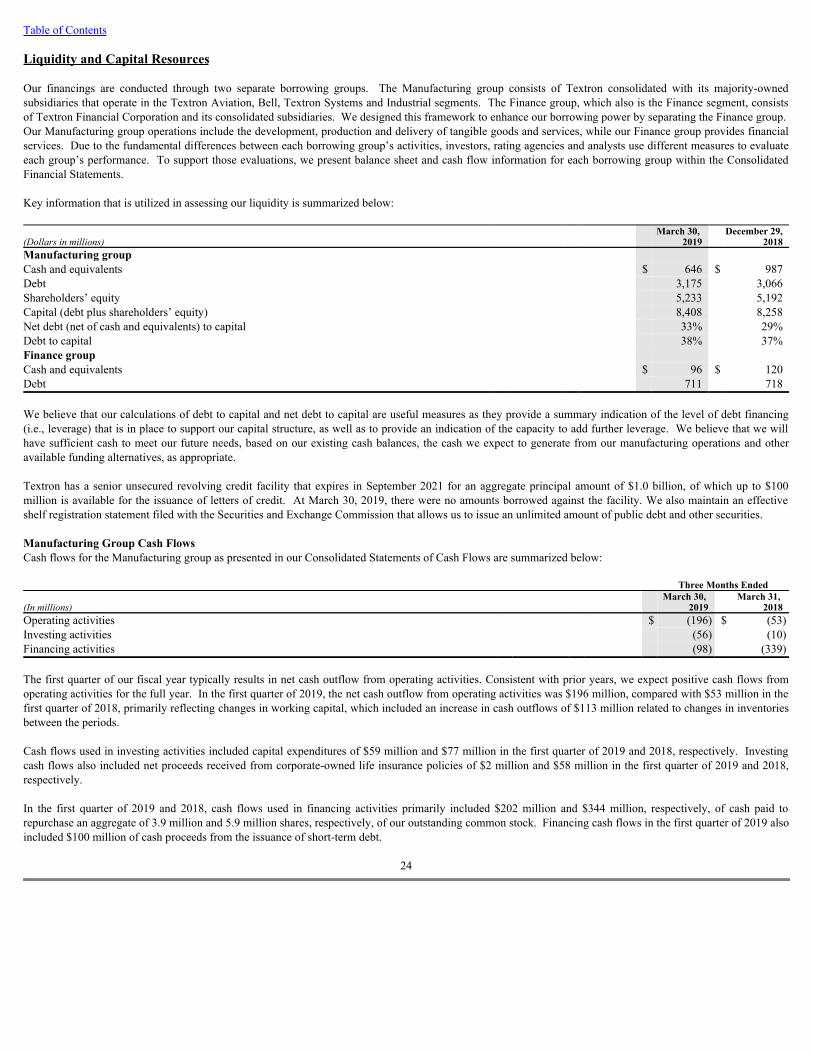
Table of Contents Liquidity and Capital Resources Our financings are conducted through two separate borrowing groups. The Manufacturing group consists of Textron consolidated with its majority-ownedsubsidiaries that operate in the Textron Aviation, Bell, Textron Systems and Industrial segments. The Finance group, which also is the Finance segment, consistsof Textron Financial Corporation and its consolidated subsidiaries. We designed this framework to enhance our borrowing power by separating the Finance group. Our Manufacturing group operations include the development, production and delivery of tangible goods and services, while our Finance group provides financialservices. Due to the fundamental differences between each borrowing group’s activities, investors, rating agencies and analysts use different measures to evaluateeach group’s performance. To support those evaluations, we present balance sheet and cash flow information for each borrowing group within the ConsolidatedFinancial Statements. Key information that is utilized in assessing our liquidity is summarized below:
(Dollars in millions)
March 30, 2019
December 29,2018
Manufacturing group
Cash and equivalents
$ 646 $ 987Debt
3,175
3,066Shareholders’ equity
5,233
5,192Capital (debt plus shareholders’ equity)
8,408
8,258Net debt (net of cash and equivalents) to capital
33%
29%Debt to capital
38%
37%Finance group
Cash and equivalents
$ 96 $ 120Debt
711
718 We believe that our calculations of debt to capital and net debt to capital are useful measures as they provide a summary indication of the level of debt financing(i.e., leverage) that is in place to support our capital structure, as well as to provide an indication of the capacity to add further leverage. We believe that we willhave sufficient cash to meet our future needs, based on our existing cash balances, the cash we expect to generate from our manufacturing operations and otheravailable funding alternatives, as appropriate. Textron has a senior unsecured revolving credit facility that expires in September 2021 for an aggregate principal amount of $1.0 billion, of which up to $100million is available for the issuance of letters of credit. At March 30, 2019, there were no amounts borrowed against the facility. We also maintain an effectiveshelf registration statement filed with the Securities and Exchange Commission that allows us to issue an unlimited amount of public debt and other securities. Manufacturing Group Cash FlowsCash flows for the Manufacturing group as presented in our Consolidated Statements of Cash Flows are summarized below:
Three Months Ended
(In millions)
March 30, 2019
March 31, 2018
Operating activities
$ (196) $ (53)Investing activities
(56)
(10)Financing activities
(98)
(339) The first quarter of our fiscal year typically results in net cash outflow from operating activities. Consistent with prior years, we expect positive cash flows fromoperating activities for the full year. In the first quarter of 2019, the net cash outflow from operating activities was $196 million, compared with $53 million in thefirst quarter of 2018, primarily reflecting changes in working capital, which included an increase in cash outflows of $113 million related to changes in inventoriesbetween the periods. Cash flows used in investing activities included capital expenditures of $59 million and $77 million in the first quarter of 2019 and 2018, respectively. Investingcash flows also included net proceeds received from corporate-owned life insurance policies of $2 million and $58 million in the first quarter of 2019 and 2018,respectively. In the first quarter of 2019 and 2018, cash flows used in financing activities primarily included $202 million and $344 million, respectively, of cash paid torepurchase an aggregate of 3.9 million and 5.9 million shares, respectively, of our outstanding common stock. Financing cash flows in the first quarter of 2019 alsoincluded $100 million of cash proceeds from the issuance of short-term debt.
24
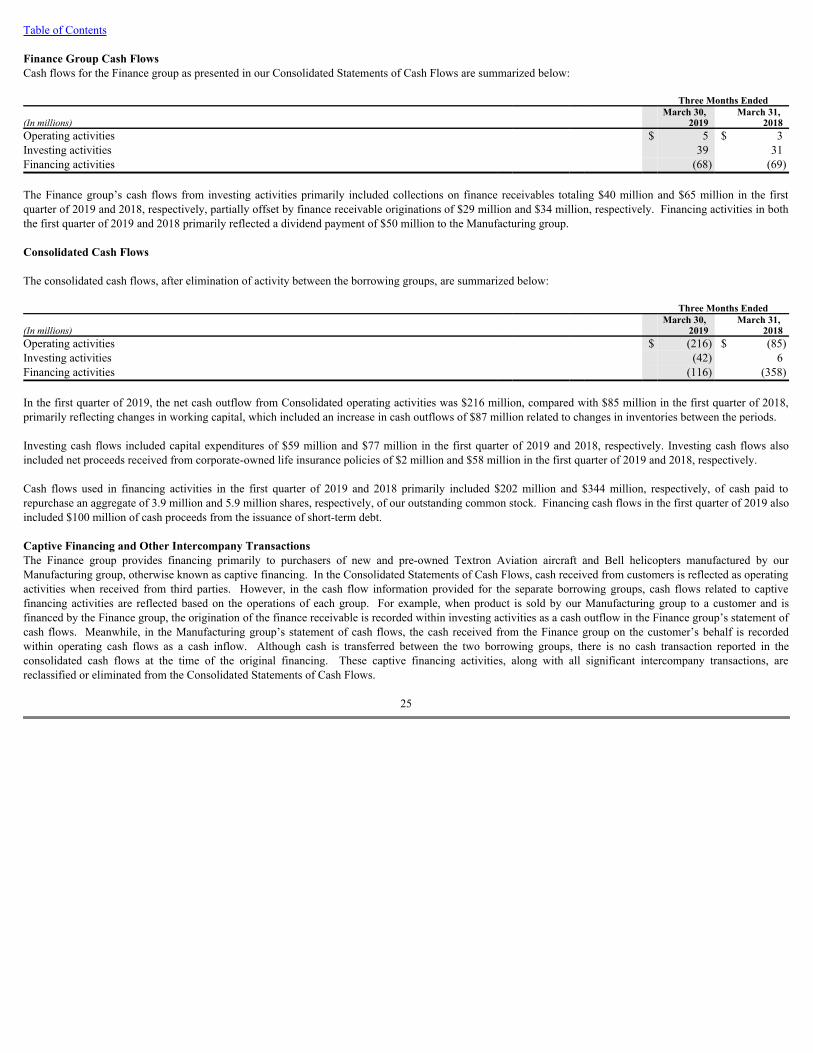
Table of Contents Finance Group Cash FlowsCash flows for the Finance group as presented in our Consolidated Statements of Cash Flows are summarized below:
Three Months Ended
(In millions)
March 30, 2019
March 31, 2018
Operating activities
$ 5 $ 3Investing activities
39
31Financing activities
(68)
(69) The Finance group’s cash flows from investing activities primarily included collections on finance receivables totaling $40 million and $65 million in the firstquarter of 2019 and 2018, respectively, partially offset by finance receivable originations of $29 million and $34 million, respectively. Financing activities in boththe first quarter of 2019 and 2018 primarily reflected a dividend payment of $50 million to the Manufacturing group. Consolidated Cash Flows The consolidated cash flows, after elimination of activity between the borrowing groups, are summarized below:
Three Months Ended
(In millions)
March 30, 2019
March 31, 2018
Operating activities
$ (216) $ (85)Investing activities
(42)
6Financing activities
(116)
(358) In the first quarter of 2019, the net cash outflow from Consolidated operating activities was $216 million, compared with $85 million in the first quarter of 2018,primarily reflecting changes in working capital, which included an increase in cash outflows of $87 million related to changes in inventories between the periods. Investing cash flows included capital expenditures of $59 million and $77 million in the first quarter of 2019 and 2018, respectively. Investing cash flows alsoincluded net proceeds received from corporate-owned life insurance policies of $2 million and $58 million in the first quarter of 2019 and 2018, respectively. Cash flows used in financing activities in the first quarter of 2019 and 2018 primarily included $202 million and $344 million, respectively, of cash paid torepurchase an aggregate of 3.9 million and 5.9 million shares, respectively, of our outstanding common stock. Financing cash flows in the first quarter of 2019 alsoincluded $100 million of cash proceeds from the issuance of short-term debt. Captive Financing and Other Intercompany TransactionsThe Finance group provides financing primarily to purchasers of new and pre-owned Textron Aviation aircraft and Bell helicopters manufactured by ourManufacturing group, otherwise known as captive financing. In the Consolidated Statements of Cash Flows, cash received from customers is reflected as operatingactivities when received from third parties. However, in the cash flow information provided for the separate borrowing groups, cash flows related to captivefinancing activities are reflected based on the operations of each group. For example, when product is sold by our Manufacturing group to a customer and isfinanced by the Finance group, the origination of the finance receivable is recorded within investing activities as a cash outflow in the Finance group’s statement ofcash flows. Meanwhile, in the Manufacturing group’s statement of cash flows, the cash received from the Finance group on the customer’s behalf is recordedwithin operating cash flows as a cash inflow. Although cash is transferred between the two borrowing groups, there is no cash transaction reported in theconsolidated cash flows at the time of the original financing. These captive financing activities, along with all significant intercompany transactions, arereclassified or eliminated from the Consolidated Statements of Cash Flows.
25
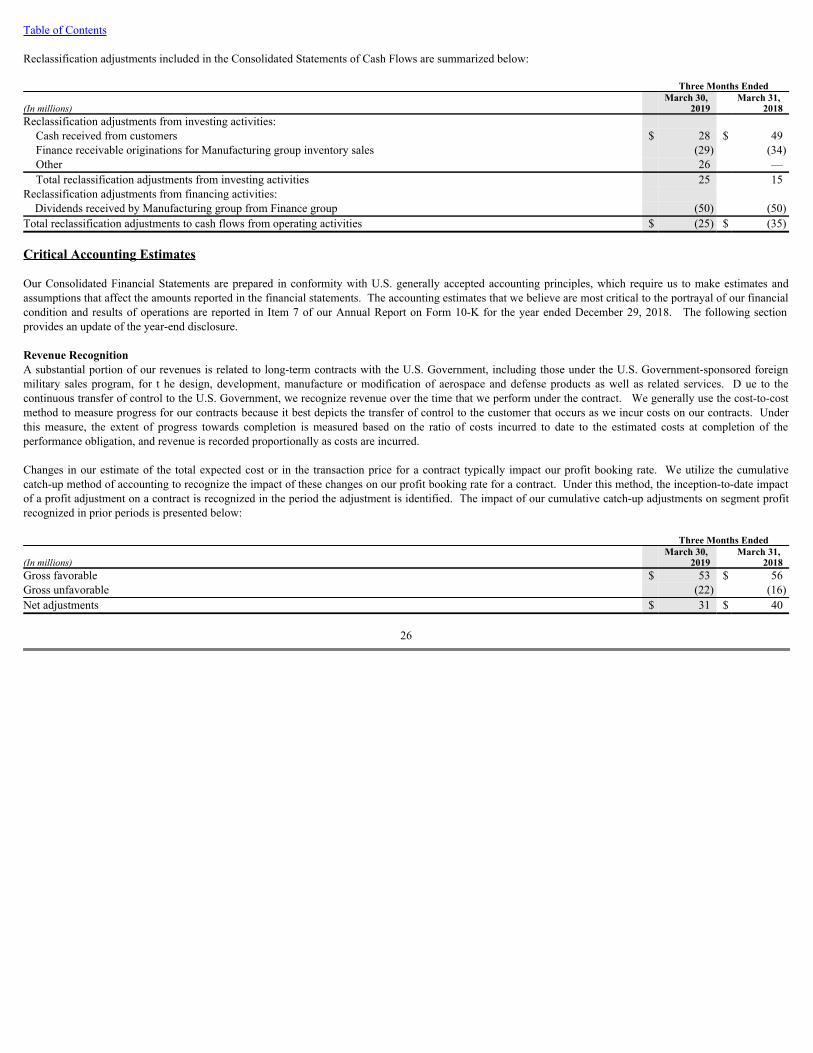
Table of Contents Reclassification adjustments included in the Consolidated Statements of Cash Flows are summarized below:
Three Months Ended
(In millions)
March 30, 2019
March 31, 2018
Reclassification adjustments from investing activities:
Cash received from customers $ 28 $ 49Finance receivable originations for Manufacturing group inventory sales
(29)
(34)Other
26
—Total reclassification adjustments from investing activities
25
15Reclassification adjustments from financing activities:
Dividends received by Manufacturing group from Finance group
(50)
(50)Total reclassification adjustments to cash flows from operating activities $ (25) $ (35) Critical Accounting Estimates Our Consolidated Financial Statements are prepared in conformity with U.S. generally accepted accounting principles, which require us to make estimates andassumptions that affect the amounts reported in the financial statements. The accounting estimates that we believe are most critical to the portrayal of our financialcondition and results of operations are reported in Item 7 of our Annual Report on Form 10-K for the year ended December 29, 2018. The following sectionprovides an update of the year-end disclosure. Revenue RecognitionA substantial portion of our revenues is related to long-term contracts with the U.S. Government, including those under the U.S. Government-sponsored foreignmilitary sales program, for t he design, development, manufacture or modification of aerospace and defense products as well as related services. D ue to thecontinuous transfer of control to the U.S. Government, we recognize revenue over the time that we perform under the contract. We generally use the cost-to-costmethod to measure progress for our contracts because it best depicts the transfer of control to the customer that occurs as we incur costs on our contracts. Underthis measure, the extent of progress towards completion is measured based on the ratio of costs incurred to date to the estimated costs at completion of theperformance obligation, and revenue is recorded proportionally as costs are incurred. Changes in our estimate of the total expected cost or in the transaction price for a contract typically impact our profit booking rate. We utilize the cumulativecatch-up method of accounting to recognize the impact of these changes on our profit booking rate for a contract. Under this method, the inception-to-date impactof a profit adjustment on a contract is recognized in the period the adjustment is identified. The impact of our cumulative catch-up adjustments on segment profitrecognized in prior periods is presented below:
Three Months Ended
(In millions)
March 30, 2019
March 31, 2018
Gross favorable $ 53 $ 56Gross unfavorable
(22)
(16)Net adjustments $ 31 $ 40
26

Table of Contents Forward-Looking InformationCertain statements in this Quarterly Report on Form 10-Q and other oral and written statements made by us from time to time are “forward-looking statements”within the meaning of the Private Securities Litigation Reform Act of 1995. These forward-looking statements, which may describe strategies, goals, outlook orother non-historical matters, or project revenues, income, returns or other financial measures, often include words such as “believe,” “expect,” “anticipate,”“intend,” “plan,” “estimate,” “guidance,” “project,” “target,” “potential,” “will,” “should,” “could,” “likely” or “may” and similar expressions intended to identifyforward-looking statements. These statements are only predictions and involve known and unknown risks, uncertainties, and other factors that may cause our actualresults to differ materially from those expressed or implied by such forward-looking statements. Given these uncertainties, you should not place undue reliance onthese forward-looking statements. Forward-looking statements speak only as of the date on which they are made, and we undertake no obligation to update orrevise any forward-looking statements. In addition to those factors described in our 2018 Annual Report on Form 10-K under “Risk Factors,” among the factorsthat could cause actual results to differ materially from past and projected future results are the following:
· Interruptions in the U.S. Government’s ability to fund its activities and/or pay its obligations;· Changing priorities or reductions in the U.S. Government defense budget, including those related to military operations in foreign countries;· Our ability to perform as anticipated and to control costs under contracts with the U.S. Government;· The U.S. Government’s ability to unilaterally modify or terminate its contracts with us for the U.S. Government’s convenience or for our failure to
perform, to change applicable procurement and accounting policies, or, under certain circumstances, to withhold payment or suspend or debar us as acontractor eligible to receive future contract awards;
· Changes in foreign military funding priorities or budget constraints and determinations, or changes in government regulations or policies on the exportand import of military and commercial products;
· Volatility in the global economy or changes in worldwide political conditions that adversely impact demand for our products;· Volatility in interest rates or foreign exchange rates;· Risks related to our international business, including establishing and maintaining facilities in locations around the world and relying on joint venture
partners, subcontractors, suppliers, representatives, consultants and other business partners in connection with international business, including inemerging market countries;
· Our Finance segment’s ability to maintain portfolio credit quality or to realize full value of receivables;· Performance issues with key suppliers or subcontractors;· Legislative or regulatory actions, both domestic and foreign, impacting our operations or demand for our products;· Our ability to control costs and successfully implement various cost-reduction activities;· The efficacy of research and development investments to develop new products or unanticipated expenses in connection with the launching of significant
new products or programs;· The timing of our new product launches or certifications of our new aircraft products;· Our ability to keep pace with our competitors in the introduction of new products and upgrades with features and technologies desired by our customers;· Pension plan assumptions and future contributions;· Demand softness or volatility in the markets in which we do business;· Cybersecurity threats, including the potential misappropriation of assets or sensitive information, corruption of data or operational disruption;· Difficulty or unanticipated expenses in connection with integrating acquired businesses;· The risk that acquisitions do not perform as planned, including, for example, the risk that acquired businesses will not achieve revenues and profit
projections; and· The impact of changes in tax legislation.
Item 3. Quantitative and Qualitative Disclosures About Market Risk There has been no significant change in our exposure to market risk during the fiscal quarter ended March 30, 2019. For discussion of our exposure to market risk,refer to Item 7A. Quantitative and Qualitative Disclosures about Market Risk contained in Textron’s 2018 Annual Report on Form 10-K.
27
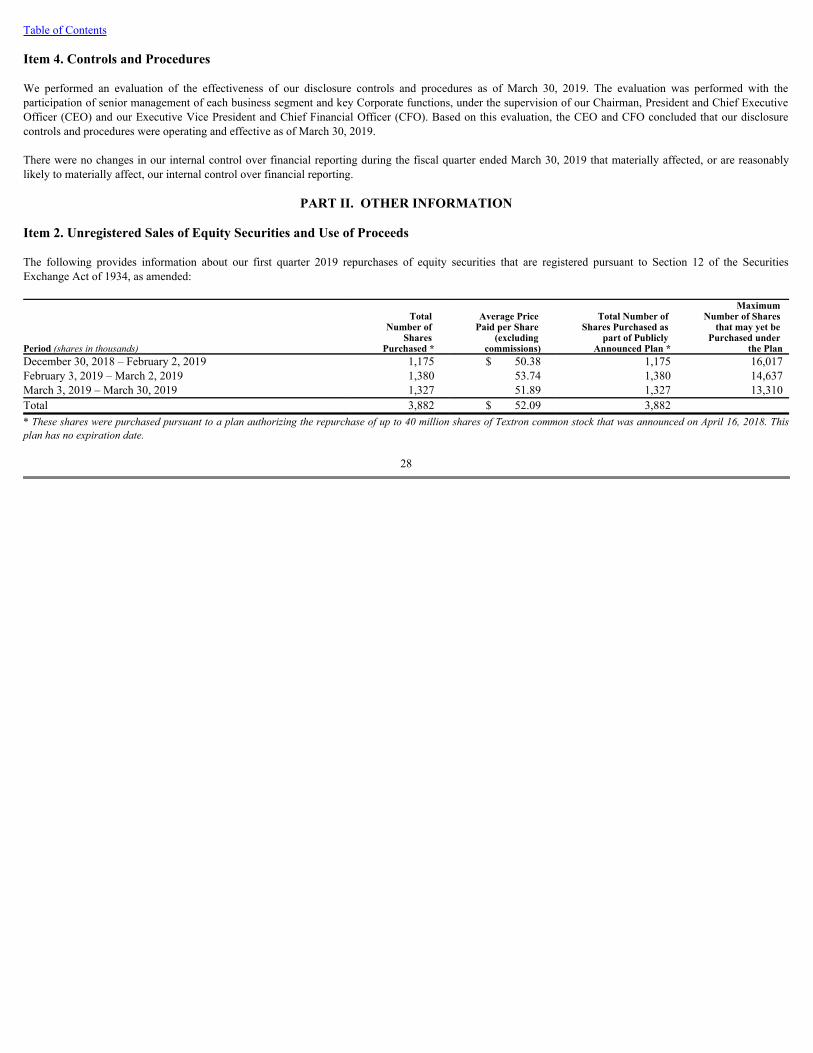
Table of Contents Item 4. Controls and Procedures We performed an evaluation of the effectiveness of our disclosure controls and procedures as of March 30, 2019. The evaluation was performed with theparticipation of senior management of each business segment and key Corporate functions, under the supervision of our Chairman, President and Chief ExecutiveOfficer (CEO) and our Executive Vice President and Chief Financial Officer (CFO). Based on this evaluation, the CEO and CFO concluded that our disclosurecontrols and procedures were operating and effective as of March 30, 2019. There were no changes in our internal control over financial reporting during the fiscal quarter ended March 30, 2019 that materially affected, or are reasonablylikely to materially affect, our internal control over financial reporting.
PART II. OTHER INFORMATION Item 2. Unregistered Sales of Equity Securities and Use of Proceeds The following provides information about our first quarter 2019 repurchases of equity securities that are registered pursuant to Section 12 of the SecuritiesExchange Act of 1934, as amended:
Period (shares in thousands)
Total Number of
Shares Purchased *
Average Price Paid per Share
(excluding commissions)
Total Number of Shares Purchased as
part of Publicly Announced Plan *
Maximum Number of Shares
that may yet be Purchased under
the PlanDecember 30, 2018 – February 2, 2019
1,175
$ 50.38
1,175
16,017February 3, 2019 – March 2, 2019
1,380
53.74
1,380
14,637March 3, 2019 – March 30, 2019
1,327
51.89
1,327
13,310Total
3,882
$ 52.09
3,882
* These shares were purchased pursuant to a plan authorizing the repurchase of up to 40 million shares of Textron common stock that was announced on April 16, 2018. Thisplan has no expiration date.
28
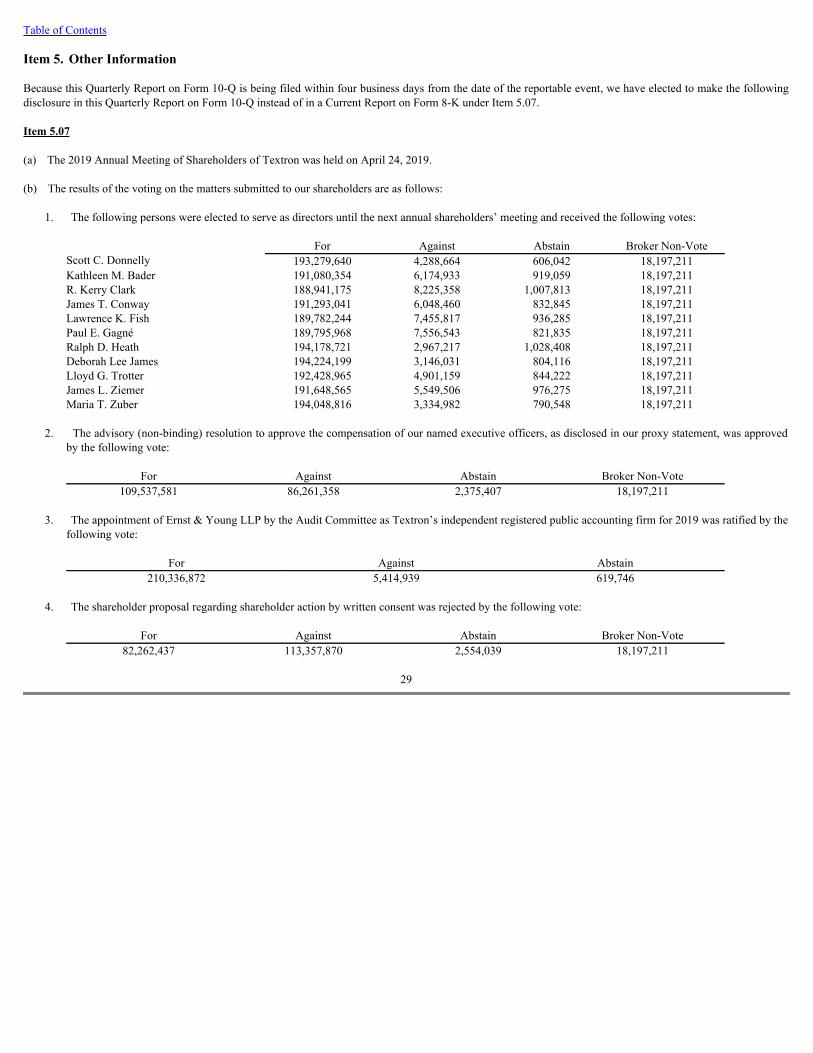
Table of Contents Item 5. Other Information Because this Quarterly Report on Form 10-Q is being filed within four business days from the date of the reportable event, we have elected to make the followingdisclosure in this Quarterly Report on Form 10-Q instead of in a Current Report on Form 8-K under Item 5.07. Item 5.07 (a) The 2019 Annual Meeting of Shareholders of Textron was held on April 24, 2019. (b) The results of the voting on the matters submitted to our shareholders are as follows:
1. The following persons were elected to serve as directors until the next annual shareholders’ meeting and received the following votes:
For Against Abstain Broker Non-VoteScott C. Donnelly 193,279,640 4,288,664 606,042 18,197,211Kathleen M. Bader 191,080,354 6,174,933 919,059 18,197,211R. Kerry Clark 188,941,175 8,225,358 1,007,813 18,197,211James T. Conway 191,293,041 6,048,460 832,845 18,197,211Lawrence K. Fish 189,782,244 7,455,817 936,285 18,197,211Paul E. Gagné 189,795,968 7,556,543 821,835 18,197,211Ralph D. Heath 194,178,721 2,967,217 1,028,408 18,197,211Deborah Lee James 194,224,199 3,146,031 804,116 18,197,211Lloyd G. Trotter 192,428,965 4,901,159 844,222 18,197,211James L. Ziemer 191,648,565 5,549,506 976,275 18,197,211Maria T. Zuber 194,048,816 3,334,982 790,548 18,197,211
2. The advisory (non-binding) resolution to approve the compensation of our named executive officers, as disclosed in our proxy statement, was approved
by the following vote:
For Against Abstain Broker Non-Vote109,537,581 86,261,358 2,375,407 18,197,211
3. The appointment of Ernst & Young LLP by the Audit Committee as Textron’s independent registered public accounting firm for 2019 was ratified by the
following vote:
For Against Abstain210,336,872 5,414,939 619,746
4. The shareholder proposal regarding shareholder action by written consent was rejected by the following vote:
For Against Abstain Broker Non-Vote
82,262,437 113,357,870 2,554,039 18,197,211
29
Table of Contents Item 6.
Exhibits 31.1
Certification of Chief Executive Officer Pursuant to Section 302 of the Sarbanes-Oxley Act of 2002 31.2
Certification of Chief Financial Officer Pursuant to Section 302 of the Sarbanes-Oxley Act of 2002 32.1
Certification of Chief Executive Officer Pursuant to 18 U.S.C. 1350, as adopted pursuant to Section 906 of the Sarbanes-Oxley Act of 2002 32.2
Certification of Chief Financial Officer Pursuant to 18 U.S.C. 1350, as adopted pursuant to Section 906 of the Sarbanes-Oxley Act of 2002 101
The following materials from Textron Inc.’s Quarterly Report on Form 10-Q for the quarterly period ended March 30, 2019, formatted in XBRL(eXtensible Business Reporting Language): (i) the Consolidated Statements of Operations, (ii) the Consolidated Statements of ComprehensiveIncome, (iii) the Consolidated Balance Sheets, (iv) the Consolidated Statements of Cash Flows and (v) the Notes to the Consolidated FinancialStatements.
Signatures Pursuant to the requirements of the Securities Exchange Act of 1934, the registrant has duly caused this report to be signed on its behalf by the undersignedthereunto duly authorized.
TEXTRON INC. Date: April 24, 2019
/s/ Mark S. BamfordMark S. Bamford Vice President and Corporate Controller (principal accounting officer)
30
Exhibit 31.1
Certification of Chief Executive Officer Pursuant to Section 302 of the Sarbanes-Oxley Act of 2002 I, Scott C. Donnelly, Chairman, President and Chief Executive Officer of Textron Inc. certify that: 1. I have reviewed this quarterly report on Form 10-Q of Textron Inc.; 2. Based on my knowledge, this report does not contain any untrue statement of a material fact or omit to state a material fact necessary to make the
statements made, in light of the circumstances under which such statements were made, not misleading with respect to the period covered by this report; 3. Based on my knowledge, the financial statements, and other financial information included in this report, fairly present in all material respects the financial
condition, results of operations and cash flows of the registrant as of, and for, the periods presented in this report; 4. The registrant’s other certifying officer and I are responsible for establishing and maintaining disclosure controls and procedures (as defined in Exchange
Act Rules 13a-15(e) and 15d-15(e)) and internal control over financial reporting (as defined in Exchange Act Rules 13a-15(f) and 15d-15(f)) for the registrantand have:
a) designed such disclosure controls and procedures, or caused such disclosure controls and procedures to be designed under our supervision, to ensure
that material information relating to the registrant, including its consolidated subsidiaries, is made known to us by others within those entities, particularlyduring the period in which this report is being prepared;
b) designed such internal control over financial reporting, or caused such internal control over financial reporting to be designed under our supervision, to
provide reasonable assurance regarding the reliability of financial reporting and the preparation of financial statements for external purposes inaccordance with generally accepted accounting principles;
c) evaluated the effectiveness of the registrant’s disclosure controls and procedures and presented in this report our conclusions about the effectiveness of
the disclosure controls and procedures, as of the end of the period covered by this report based on such evaluation; and
d) disclosed in this report any change in the registrant’s internal control over financial reporting that occurred during the registrant’s most recent fiscalquarter that has materially affected, or is reasonably likely to materially affect, the registrant’s internal control over financial reporting; and
5. The registrant’s other certifying officer and I have disclosed, based on our most recent evaluation of internal control over financial reporting, to the
registrant’s auditors and the audit committee of the registrant’s board of directors (or persons performing the equivalent functions):
a) all significant deficiencies and material weaknesses in the design or operation of internal control over financial reporting which are reasonably likely toadversely affect the registrant’s ability to record, process, summarize and report financial information; and
b) any fraud, whether or not material, that involves management or other employees who have a significant role in the registrant’s internal control over
financial reporting. Date: April 24, 2019
/s/ Scott C. Donnelly
Scott C. Donnelly Chairman, President and Chief Executive Officer
Exhibit 31.2
Certification of Chief Financial Officer Pursuant to Section 302 of the Sarbanes-Oxley Act of 2002 I, Frank T. Connor, Executive Vice President and Chief Financial Officer of Textron Inc. certify that: 1. I have reviewed this quarterly report on Form 10-Q of Textron Inc.; 2. Based on my knowledge, this report does not contain any untrue statement of a material fact or omit to state a material fact necessary to make the
statements made, in light of the circumstances under which such statements were made, not misleading with respect to the period covered by this report; 3. Based on my knowledge, the financial statements, and other financial information included in this report, fairly present in all material respects the financial
condition, results of operations and cash flows of the registrant as of, and for, the periods presented in this report; 4. The registrant’s other certifying officer and I are responsible for establishing and maintaining disclosure controls and procedures (as defined in Exchange
Act Rules 13a-15(e) and 15d-15(e)) and internal control over financial reporting (as defined in Exchange Act Rules 13a-15(f) and 15d-15(f)) for the registrantand have:
a) designed such disclosure controls and procedures, or caused such disclosure controls and procedures to be designed under our supervision, to ensure
that material information relating to the registrant, including its consolidated subsidiaries, is made known to us by others within those entities, particularlyduring the period in which this report is being prepared;
b) designed such internal control over financial reporting, or caused such internal control over financial reporting to be designed under our supervision, to
provide reasonable assurance regarding the reliability of financial reporting and the preparation of financial statements for external purposes inaccordance with generally accepted accounting principles;
c) evaluated the effectiveness of the registrant’s disclosure controls and procedures and presented in this report our conclusions about the effectiveness of
the disclosure controls and procedures, as of the end of the period covered by this report based on such evaluation; and
d) disclosed in this report any change in the registrant’s internal control over financial reporting that occurred during the registrant’s most recent fiscalquarter that has materially affected, or is reasonably likely to materially affect, the registrant’s internal control over financial reporting; and
5. The registrant’s other certifying officer and I have disclosed, based on our most recent evaluation of internal control over financial reporting, to the
registrant’s auditors and the audit committee of the registrant’s board of directors (or persons performing the equivalent functions):
a) all significant deficiencies and material weaknesses in the design or operation of internal control over financial reporting which are reasonably likely toadversely affect the registrant’s ability to record, process, summarize and report financial information; and
b) any fraud, whether or not material, that involves management or other employees who have a significant role in the registrant’s internal control over
financial reporting. Date: April 24, 2019
/s/ Frank T. Connor
Frank T. Connor Executive Vice President and Chief Financial Officer
Exhibit 32.1
TEXTRON INC.
CERTIFICATION PURSUANT TO18 U.S.C. SECTION 1350,
AS ADOPTED PURSUANT TOSECTION 906 OF THE SARBANES-OXLEY ACT OF 2002
In connection with the Quarterly Report of Textron Inc. (the “Company”) on Form 10-Q for the period ended March 30, 2019 as filed with the Securities andExchange Commission on the date hereof (the “Report”), I, Scott C. Donnelly, Chairman, President and Chief Executive Officer of the Company, certify, pursuantto 18 U.S.C. Section 1350, as adopted pursuant to Section 906 of the Sarbanes-Oxley Act of 2002, that to my knowledge:
(1) The Report fully complies with the requirements of section 13(a) or 15(d) of the Securities Exchange Act of 1934; and (2) The information contained in the Report fairly presents, in all material respects, the financial condition and results of operations of the Company.
Date: April 24, 2019
/s/ Scott C. Donnelly
Scott C. Donnelly
Chairman, President and Chief Executive Officer
Exhibit 32.2
TEXTRON INC.
CERTIFICATION PURSUANT TO18 U.S.C. SECTION 1350,
AS ADOPTED PURSUANT TOSECTION 906 OF THE SARBANES-OXLEY ACT OF 2002
In connection with the Quarterly Report of Textron Inc. (the “Company”) on Form 10-Q for the period ended March 30, 2019 as filed with the Securities andExchange Commission on the date hereof (the “Report”), I, Frank T. Connor, Executive Vice President and Chief Financial Officer of the Company, certify,pursuant to 18 U.S.C. Section 1350, as adopted pursuant to Section 906 of the Sarbanes-Oxley Act of 2002, that to my knowledge:
(1) The Report fully complies with the requirements of section 13(a) or 15(d) of the Securities Exchange Act of 1934; and (2) The information contained in the Report fairly presents, in all material respects, the financial condition and results of operations of the Company.
Date: April 24, 2019
/s/ Frank T. Connor
Frank T. Connor
Executive Vice President and Chief Financial Officer


![[Confidential] Textron - PatentStatus Demo](https://img.pdfslide.us/doc/110x75/55c32f35bb61ebd4488b4682/confidential-textron-patentstatus-demo.jpg)