Embed Size (px)
Citation preview
For updated information, please visit www.ibef.org December 2017
TEXTILES AND
APPAREL
Table of Content
Advantage India…………………..….………4
Market Overview …………….………..…….6
Recent Trends and Strategies…….……..18
Growth Drivers…………………….....…....21
Case Studies……….……….......…………36
Industry Organisations……….….......…...40
Porters Five Forces Framework………….17
Executive Summary……………….….……..3
Opportunities.....…………………………...33
Useful Information……….……….......…...42
For updated information, please visit www.ibef.org Textiles and Apparels 3
EXECUTIVE SUMMARY
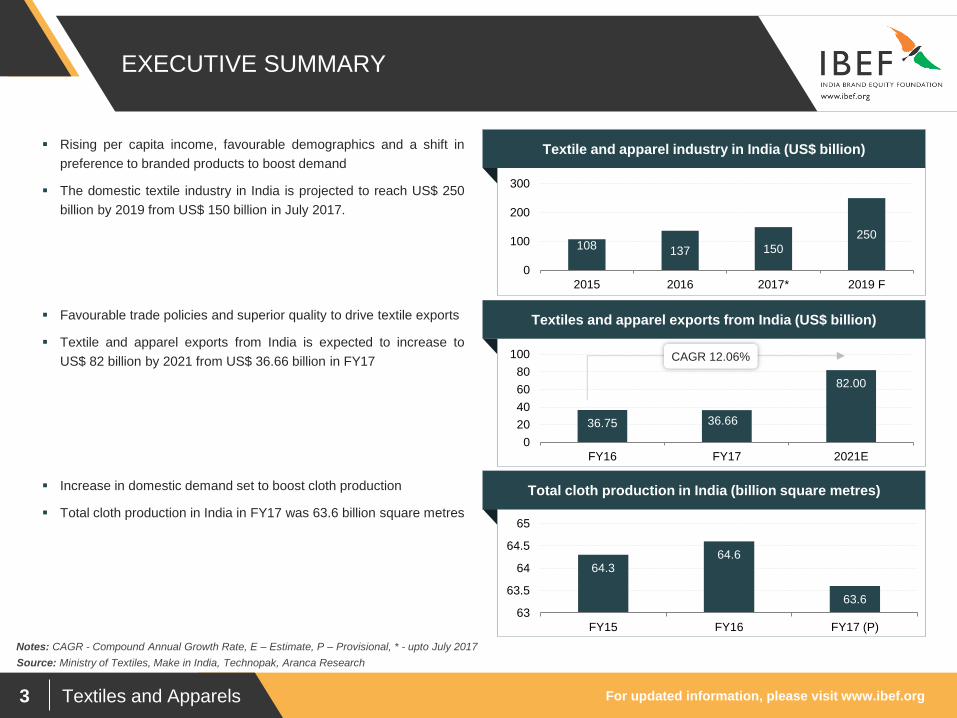
Textiles and apparel exports from India (US$ billion)
36.75 36.66
82.00
0
20
40
60
80
100
FY16 FY17 2021E
CAGR 12.06%
Total cloth production in India (billion square metres)
64.3 64.6
63.6 63
63.5
64
64.5
65
FY15 FY16 FY17 (P)
Textile and apparel industry in India (US$ billion)
Source: Ministry of Textiles, Make in India, Technopak, Aranca Research
Notes: CAGR - Compound Annual Growth Rate, E – Estimate, P – Provisional, * - upto July 2017
108 137 150
250
0
100
200
300
2015 2016 2017* 2019 F
Rising per capita income, favourable demographics and a shift in
preference to branded products to boost demand
The domestic textile industry in India is projected to reach US$ 250
billion by 2019 from US$ 150 billion in July 2017.
Favourable trade policies and superior quality to drive textile exports
Textile and apparel exports from India is expected to increase to
US$ 82 billion by 2021 from US$ 36.66 billion in FY17
Increase in domestic demand set to boost cloth production
Total cloth production in India in FY17 was 63.6 billion square metres
Textiles and Apparels
ADVANTAGE INDIA
For updated information, please visit www.ibef.org Textiles and Apparels 5
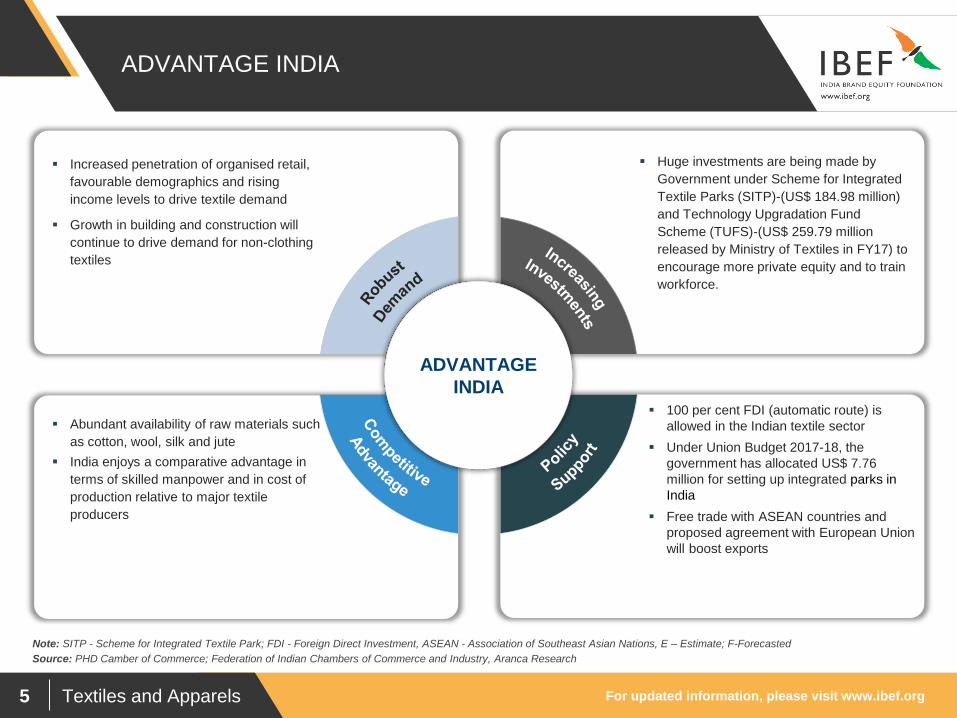
ADVANTAGE INDIA
Increased penetration of organised retail,
favourable demographics and rising
income levels to drive textile demand
Growth in building and construction will
continue to drive demand for non-clothing
textiles
Huge investments are being made by
Government under Scheme for Integrated
Textile Parks (SITP)-(US$ 184.98 million)
and Technology Upgradation Fund
Scheme (TUFS)-(US$ 259.79 million
released by Ministry of Textiles in FY17) to
encourage more private equity and to train
workforce.
Abundant availability of raw materials such
as cotton, wool, silk and jute
India enjoys a comparative advantage in
terms of skilled manpower and in cost of
production relative to major textile
producers
100 per cent FDI (automatic route) is
allowed in the Indian textile sector
Under Union Budget 2017-18, the
government has allocated US$ 7.76
million for setting up integrated parks in
India
Free trade with ASEAN countries and
proposed agreement with European Union
will boost exports
ADVANTAGE
INDIA
Source: PHD Camber of Commerce; Federation of Indian Chambers of Commerce and Industry, Aranca Research
Note: SITP - Scheme for Integrated Textile Park; FDI - Foreign Direct Investment, ASEAN - Association of Southeast Asian Nations, E – Estimate; F-Forecasted
Textiles and Apparels
MARKET
OVERVIEW
For updated information, please visit www.ibef.org Textiles and Apparels 7
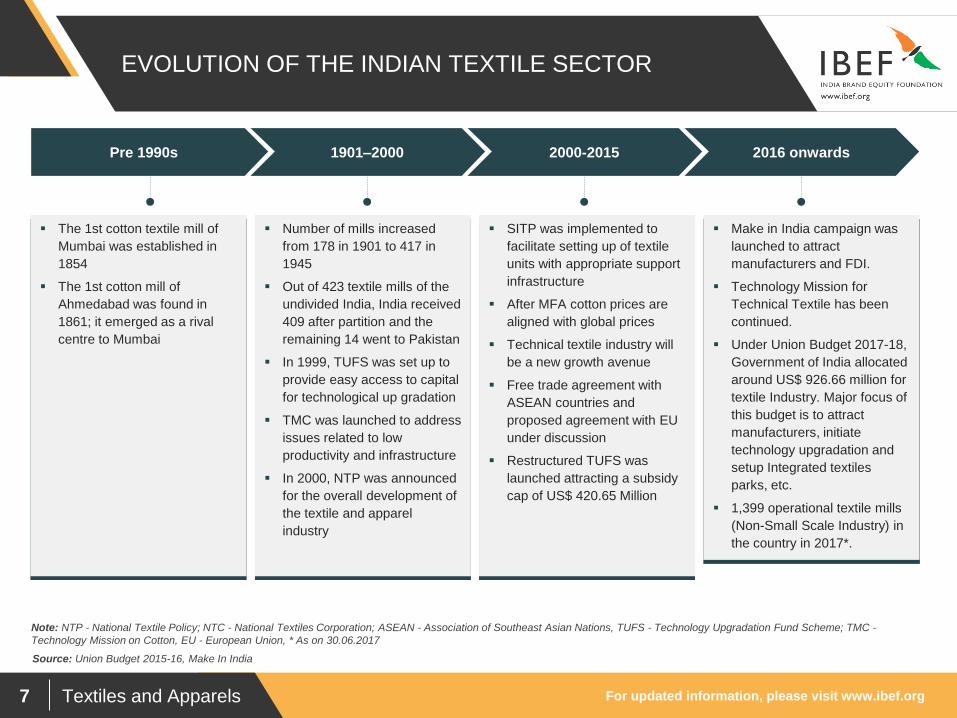
EVOLUTION OF THE INDIAN TEXTILE SECTOR
Source: Union Budget 2015-16, Make In India
Pre 1990s 1901–2000 2000-2015 2016 onwards
The 1st cotton textile mill of
Mumbai was established in
1854
The 1st cotton mill of
Ahmedabad was found in
1861; it emerged as a rival
centre to Mumbai
Number of mills increased
from 178 in 1901 to 417 in
1945
Out of 423 textile mills of the
undivided India, India received
409 after partition and the
remaining 14 went to Pakistan
In 1999, TUFS was set up to
provide easy access to capital
for technological up gradation
TMC was launched to address
issues related to low
productivity and infrastructure
In 2000, NTP was announced
for the overall development of
the textile and apparel
industry
SITP was implemented to
facilitate setting up of textile
units with appropriate support
infrastructure
After MFA cotton prices are
aligned with global prices
Technical textile industry will
be a new growth avenue
Free trade agreement with
ASEAN countries and
proposed agreement with EU
under discussion
Restructured TUFS was
launched attracting a subsidy
cap of US$ 420.65 Million
Make in India campaign was
launched to attract
manufacturers and FDI.
Technology Mission for
Technical Textile has been
continued.
Under Union Budget 2017-18,
Government of India allocated
around US$ 926.66 million for
textile Industry. Major focus of
this budget is to attract
manufacturers, initiate
technology upgradation and
setup Integrated textiles
parks, etc.
1,399 operational textile mills
(Non-Small Scale Industry) in
the country in 2017*.
Note: NTP - National Textile Policy; NTC - National Textiles Corporation; ASEAN - Association of Southeast Asian Nations, TUFS - Technology Upgradation Fund Scheme; TMC -
Technology Mission on Cotton, EU - European Union, * As on 30.06.2017
For updated information, please visit www.ibef.org Textiles and Apparels 8
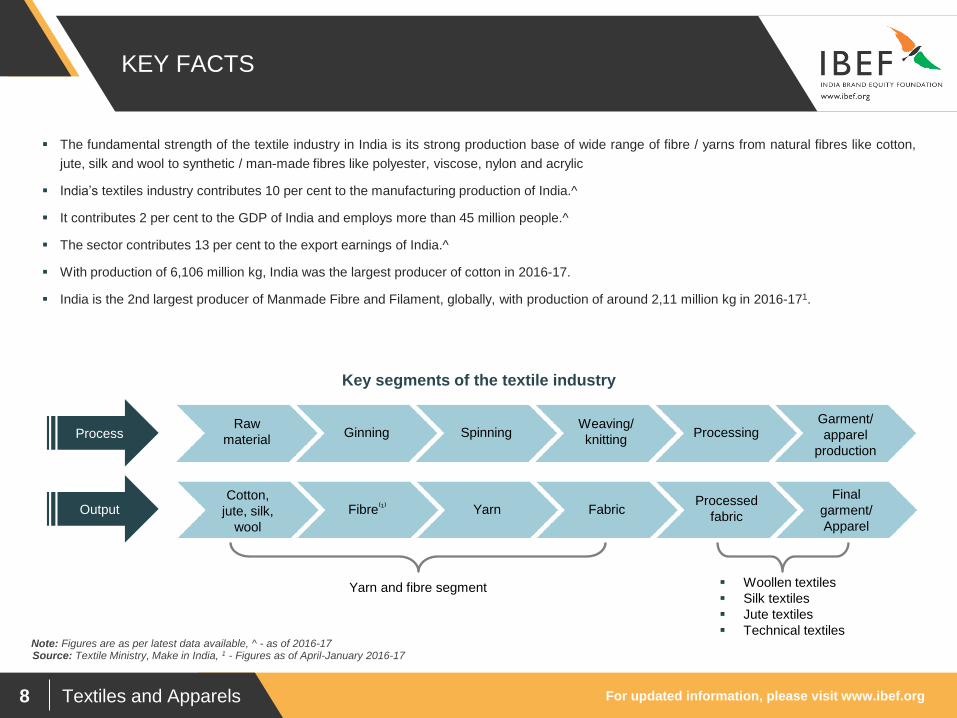
KEY FACTS
Source: Textile Ministry, Make in India, 1 - Figures as of April-January 2016-17
The fundamental strength of the textile industry in India is its strong production base of wide range of fibre / yarns from natural fibres like cotton,
jute, silk and wool to synthetic / man-made fibres like polyester, viscose, nylon and acrylic
India’s textiles industry contributes 10 per cent to the manufacturing production of India.^
It contributes 2 per cent to the GDP of India and employs more than 45 million people.^
The sector contributes 13 per cent to the export earnings of India.^
With production of 6,106 million kg, India was the largest producer of cotton in 2016-17.
India is the 2nd largest producer of Manmade Fibre and Filament, globally, with production of around 2,11 million kg in 2016-171.
Note: Figures are as per latest data available, ^ - as of 2016-17
Process Raw
material Ginning Spinning Processing
Garment/
apparel
production
Output Cotton,
jute, silk,
wool
Fibre⁽¹⁾ Yarn Fabric Processed
fabric
Final
garment/
Apparel
Woollen textiles
Silk textiles
Jute textiles
Technical textiles
Yarn and fibre segment
Weaving/
knitting
Key segments of the textile industry
For updated information, please visit www.ibef.org Textiles and Apparels 9
THE SECTOR HAS BEEN POSTING STRONG GROWTH
OVER THE YEARS
70
78
89
99
10
8.5
13
7
15
0
25
0
0
50
100
150
200
250
300
2009 2010 2011 2014 2015 2016 2017* 2019F
Source: Technopak, Make in India, News articles, Ministry of Textiles, Aranca Research
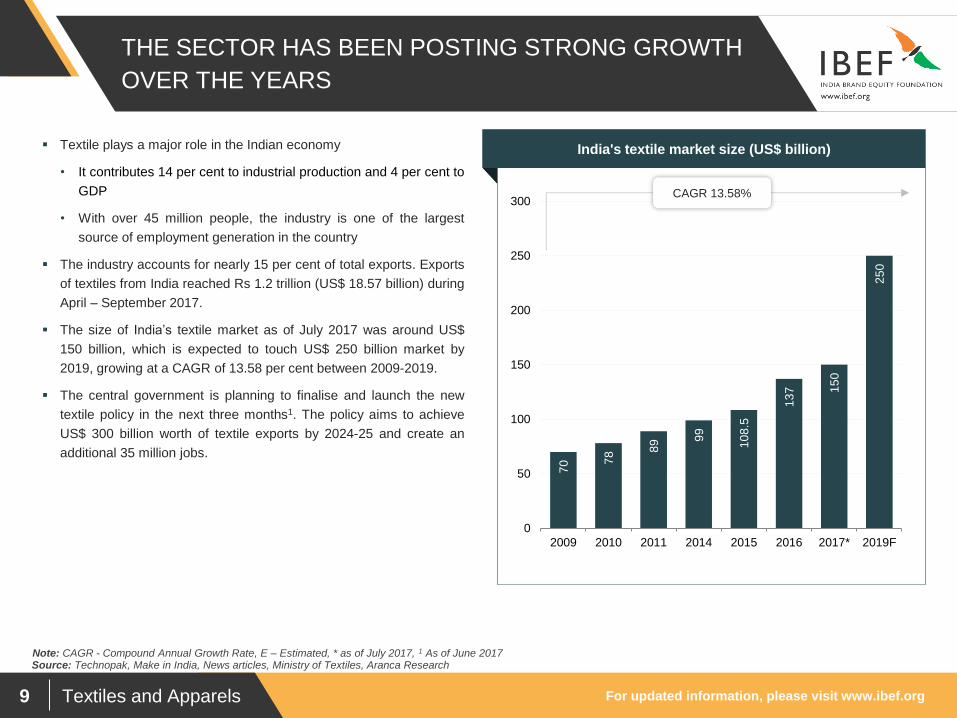
Textile plays a major role in the Indian economy
• It contributes 14 per cent to industrial production and 4 per cent to
GDP
• With over 45 million people, the industry is one of the largest
source of employment generation in the country
The industry accounts for nearly 15 per cent of total exports. Exports
of textiles from India reached Rs 1.2 trillion (US$ 18.57 billion) during
April – September 2017.
The size of India’s textile market as of July 2017 was around US$
150 billion, which is expected to touch US$ 250 billion market by
2019, growing at a CAGR of 13.58 per cent between 2009-2019.
The central government is planning to finalise and launch the new
textile policy in the next three months1. The policy aims to achieve
US$ 300 billion worth of textile exports by 2024-25 and create an
additional 35 million jobs.
Visakhapatnam port traffic (million tonnes) India's textile market size (US$ billion)
CAGR 13.58%
Note: CAGR - Compound Annual Growth Rate, E – Estimated, * as of July 2017, 1 As of June 2017
For updated information, please visit www.ibef.org Textiles and Apparels 10
COTTON PRODUCTION OVER THE PAST FEW YEARS
HAS BEEN VOLATILE
28
30
.7
29
30
.5 3
3.9
35
.3
35
.6
39
.8
38
.6
33
.8
35
.1
0
5
10
15
20
25
30
35
40
45
FY07 FY08 FY09 FY10 FY11 FY12 FY13 FY14 FY15 FY16 FY17
Source: The Cotton Corporation of India Ltd, Aranca Research, BusinessLine
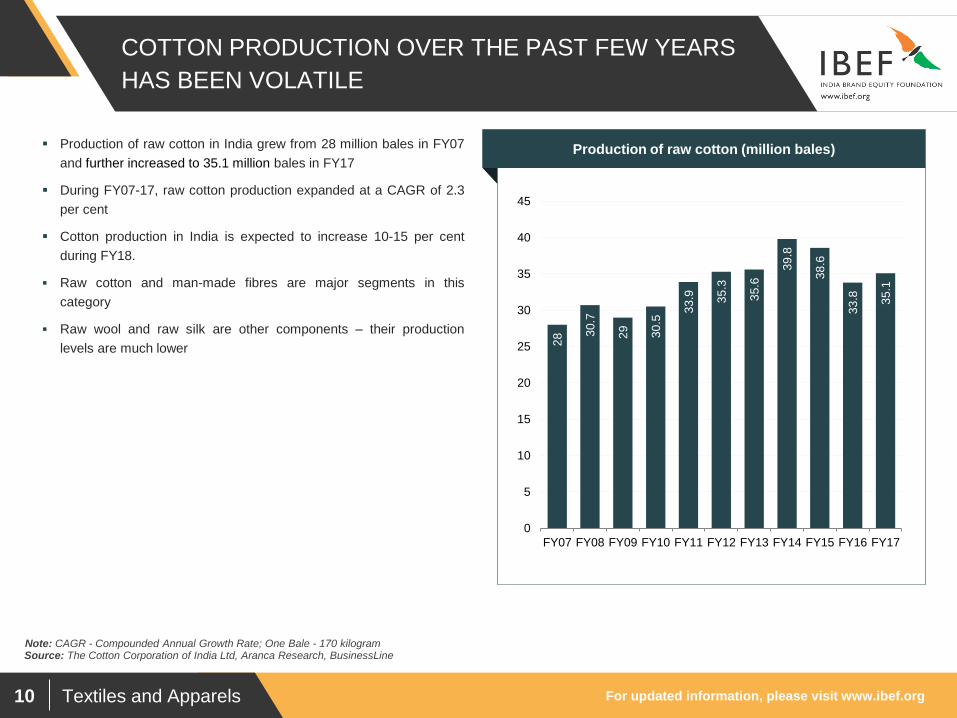
Production of raw cotton in India grew from 28 million bales in FY07
and further increased to 35.1 million bales in FY17
During FY07-17, raw cotton production expanded at a CAGR of 2.3
per cent
Cotton production in India is expected to increase 10-15 per cent
during FY18.
Raw cotton and man-made fibres are major segments in this
category
Raw wool and raw silk are other components – their production
levels are much lower
Visakhapatnam port traffic (million tonnes) Production of raw cotton (million bales)
Note: CAGR - Compounded Annual Growth Rate; One Bale - 170 kilogram
For updated information, please visit www.ibef.org Textiles and Apparels 11
PRODUCTION OF MAN-MADE FIBRE HAS BEEN
RISING
1.1
40
1.2
40
1.0
70
1.2
70
1.2
90
1.2
30
1.2
60
1.3
10
1.3
40
1.3
47
1.3
64
0.4
55
0.000
0.200
0.400
0.600
0.800
1.000
1.200
1.400
1.600
Source: Ministry of Textiles
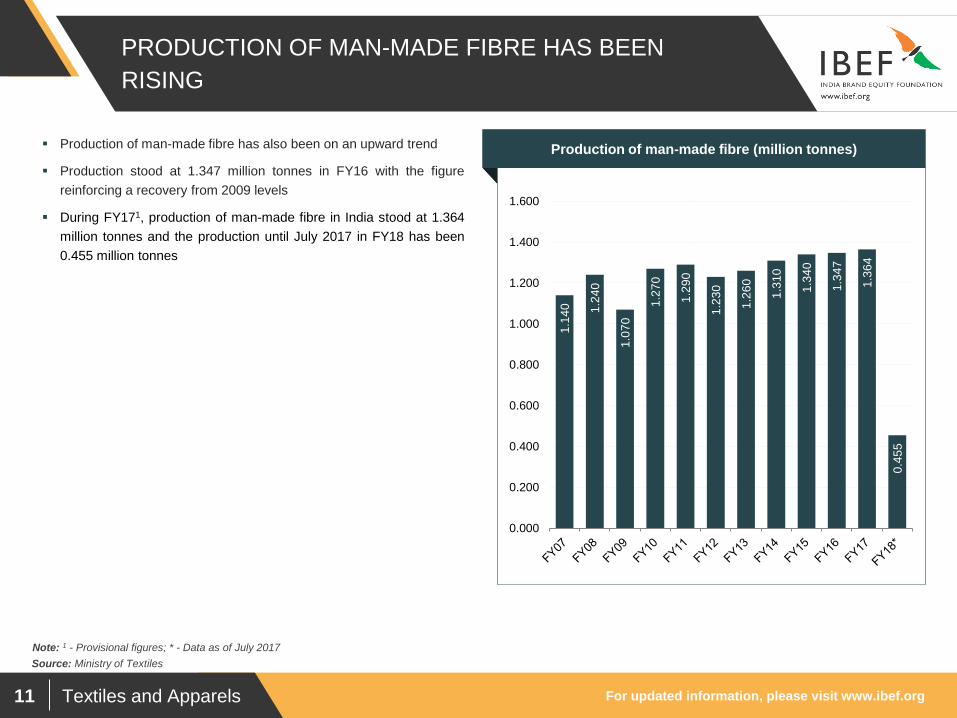
Production of man-made fibre has also been on an upward trend
Production stood at 1.347 million tonnes in FY16 with the figure
reinforcing a recovery from 2009 levels
During FY171, production of man-made fibre in India stood at 1.364
million tonnes and the production until July 2017 in FY18 has been
0.455 million tonnes
Visakhapatnam port traffic (million tonnes) Production of man-made fibre (million tonnes)
Note: 1 - Provisional figures; * - Data as of July 2017
For updated information, please visit www.ibef.org Textiles and Apparels 12
COTTON IS THE MAJOR SEGMENT IN YARN AND
FABRIC … (1/2)
4,7
12
4,3
72
4,8
67
5,3
09
5,4
88
5,6
65
5,6
62
1,8
84
0
1,000
2,000
3,000
4,000
5,000
6,000
FY11 FY12 FY13 FY14 FY15 FY16 FY17 FY18*
Source: Ministry of Textiles
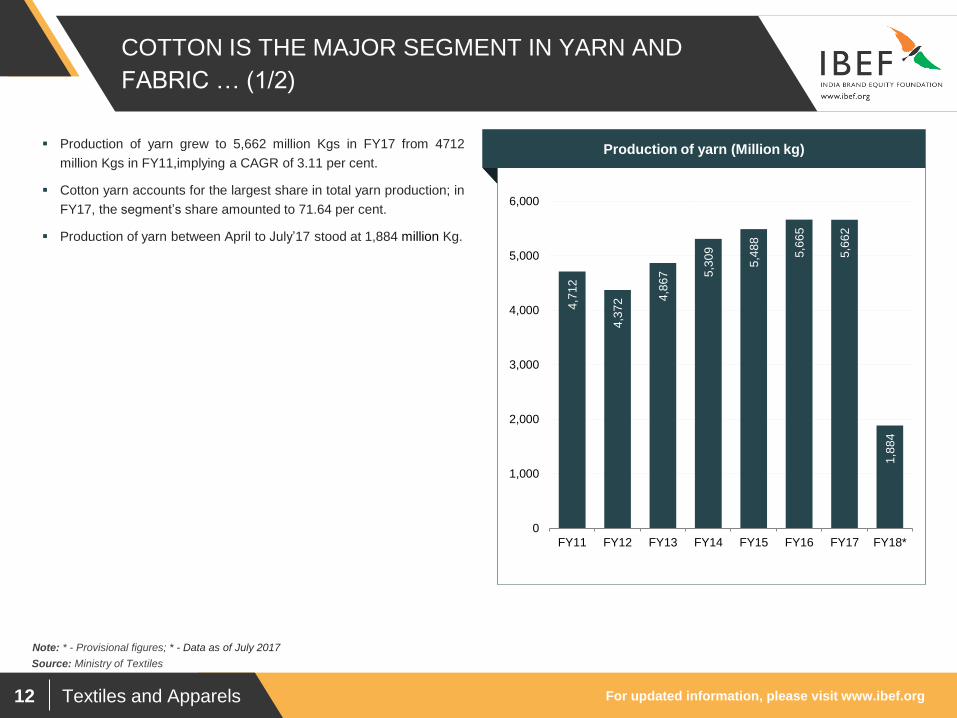
Production of yarn grew to 5,662 million Kgs in FY17 from 4712
million Kgs in FY11,implying a CAGR of 3.11 per cent.
Cotton yarn accounts for the largest share in total yarn production; in
FY17, the segment’s share amounted to 71.64 per cent.
Production of yarn between April to July’17 stood at 1,884 million Kg.
Visakhapatnam port traffic (million tonnes) Production of yarn (Million kg)
Note: * - Provisional figures; * - Data as of July 2017
For updated information, please visit www.ibef.org Textiles and Apparels 13
COTTON IS THE MAJOR SEGMENT IN YARN AND
FABRIC … (2/2)
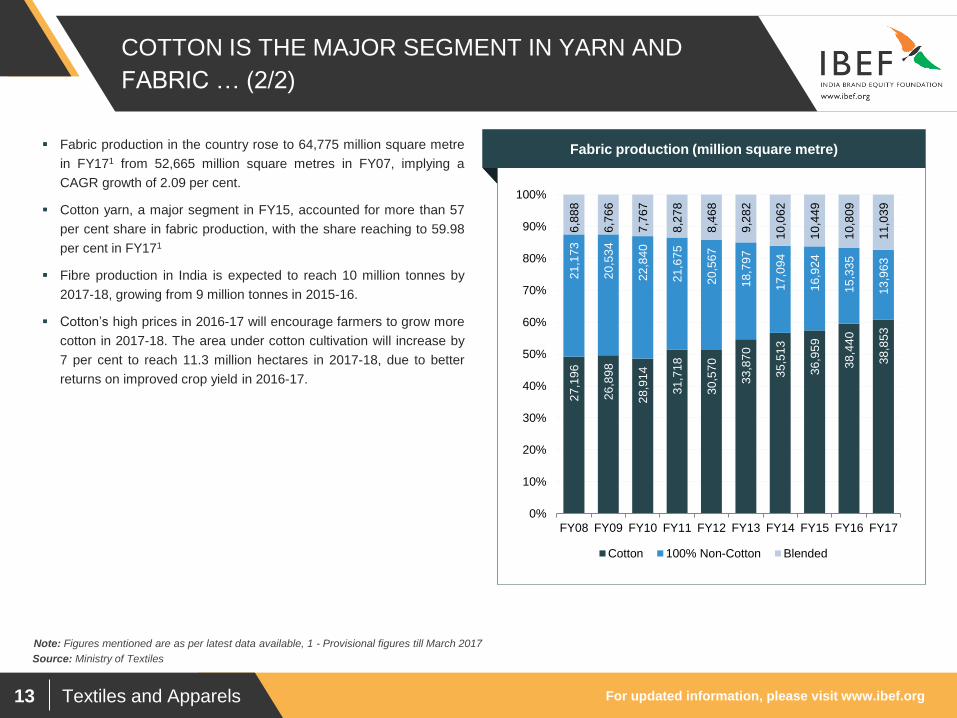
Fabric production in the country rose to 64,775 million square metre
in FY171 from 52,665 million square metres in FY07, implying a
CAGR growth of 2.09 per cent.
Cotton yarn, a major segment in FY15, accounted for more than 57
per cent share in fabric production, with the share reaching to 59.98
per cent in FY171
Fibre production in India is expected to reach 10 million tonnes by
2017-18, growing from 9 million tonnes in 2015-16.
Cotton’s high prices in 2016-17 will encourage farmers to grow more
cotton in 2017-18. The area under cotton cultivation will increase by
7 per cent to reach 11.3 million hectares in 2017-18, due to better
returns on improved crop yield in 2016-17.
Visakhapatnam port traffic (million tonnes) Fabric production (million square metre)
27
,19
6
26
,89
8
28
,91
4
31
,71
8
30
,57
0
33
,87
0
35
,51
3
36
,95
9
38
,44
0
38
,85
3
21
,17
3
20
,53
4
22
,84
0
21
,67
5
20
,56
7
18
,79
7
17
,09
4
16
,92
4
15
,33
5
13
,96
3
6,8
88
6,7
66
7,7
67
8,2
78
8,4
68
9,2
82
10
,06
2
10
,44
9
10
,80
9
11
,03
9
0%
10%
20%
30%
40%
50%
60%
70%
80%
90%
100%
FY08 FY09 FY10 FY11 FY12 FY13 FY14 FY15 FY16 FY17
Cotton 100% Non-Cotton Blended
Source: Ministry of Textiles
Note: Figures mentioned are as per latest data available, 1 - Provisional figures till March 2017
For updated information, please visit www.ibef.org Textiles and Apparels 14
EXPORTS HAVE POSTED STRONG GROWTH OVER
THE YEARS
17
.60
19
.10
22
.10
21
.20
22
.40
27
.80
33
.30
33
.05
37
.57
37
.66
36
.75
36
.63
2.7
0
2.8
0
3.3
0
3.5
0
3.4
0
4.2
0
5.2
0
5.4
0
5.3
0
6.0
1
5.8
5
6.0
4
0.00
5.00
10.00
15.00
20.00
25.00
30.00
35.00
40.00
FY
06
FY
07
FY
08
FY
09
FY
10
FY
11
FY
12
FY
13
FY
14
FY
15
FY
16
FY
17
Exports Imports
Source: Ministry of Textiles, Budget 2015
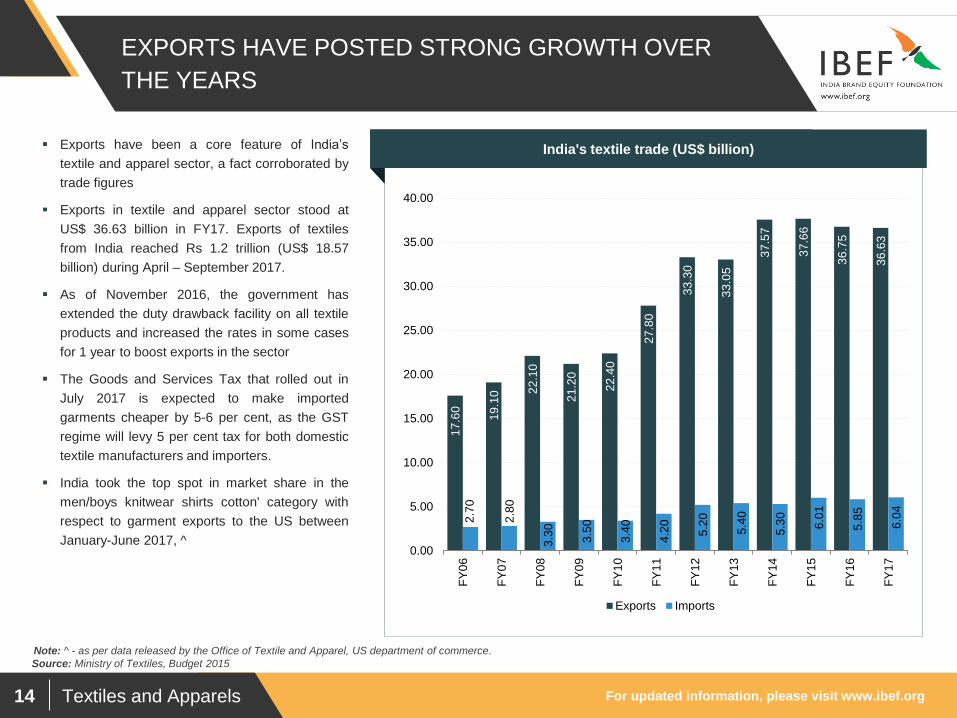
Exports have been a core feature of India’s
textile and apparel sector, a fact corroborated by
trade figures
Exports in textile and apparel sector stood at
US$ 36.63 billion in FY17. Exports of textiles
from India reached Rs 1.2 trillion (US$ 18.57
billion) during April – September 2017.
As of November 2016, the government has
extended the duty drawback facility on all textile
products and increased the rates in some cases
for 1 year to boost exports in the sector
The Goods and Services Tax that rolled out in
July 2017 is expected to make imported
garments cheaper by 5-6 per cent, as the GST
regime will levy 5 per cent tax for both domestic
textile manufacturers and importers.
India took the top spot in market share in the
men/boys knitwear shirts cotton' category with
respect to garment exports to the US between
January-June 2017, ^
Visakhapatnam port traffic (million tonnes) India's textile trade (US$ billion)
Note: ^ - as per data released by the Office of Textile and Apparel, US department of commerce.
For updated information, please visit www.ibef.org Textiles and Apparels 15
READYMADE GARMENTS AND COTTON TEXTILES
DOMINATE EXPORTS
Note: Others include coir and coir manufacturers and jute Source: Ministry of Textiles, Aranca Research, Office of the Textile Commissioner , Government of India
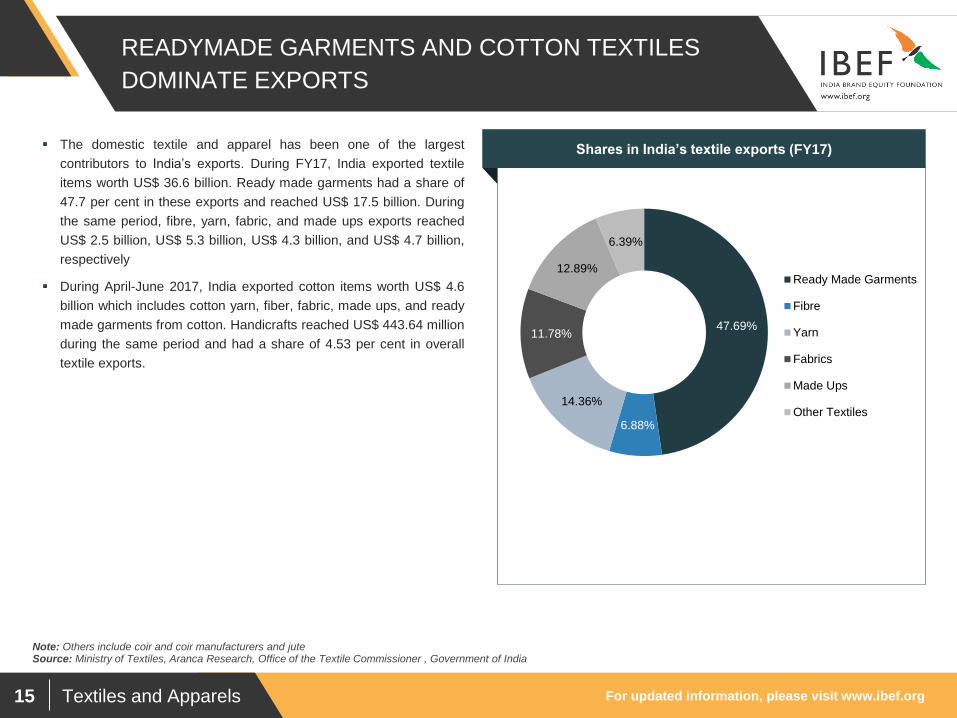
Visakhapatnam port traffic (million tonnes) Shares in India’s textile exports (FY17) The domestic textile and apparel has been one of the largest
contributors to India’s exports. During FY17, India exported textile
items worth US$ 36.6 billion. Ready made garments had a share of
47.7 per cent in these exports and reached US$ 17.5 billion. During
the same period, fibre, yarn, fabric, and made ups exports reached
US$ 2.5 billion, US$ 5.3 billion, US$ 4.3 billion, and US$ 4.7 billion,
respectively
During April-June 2017, India exported cotton items worth US$ 4.6
billion which includes cotton yarn, fiber, fabric, made ups, and ready
made garments from cotton. Handicrafts reached US$ 443.64 million
during the same period and had a share of 4.53 per cent in overall
textile exports.
47.69%
6.88%
14.36%
11.78%
12.89%
6.39%
Ready Made Garments
Fibre
Yarn
Fabrics
Made Ups
Other Textiles
For updated information, please visit www.ibef.org Textiles and Apparels 16
KEY PLAYERS IN THE INDUSTRY
Source: Annual Reports, Aranca Research
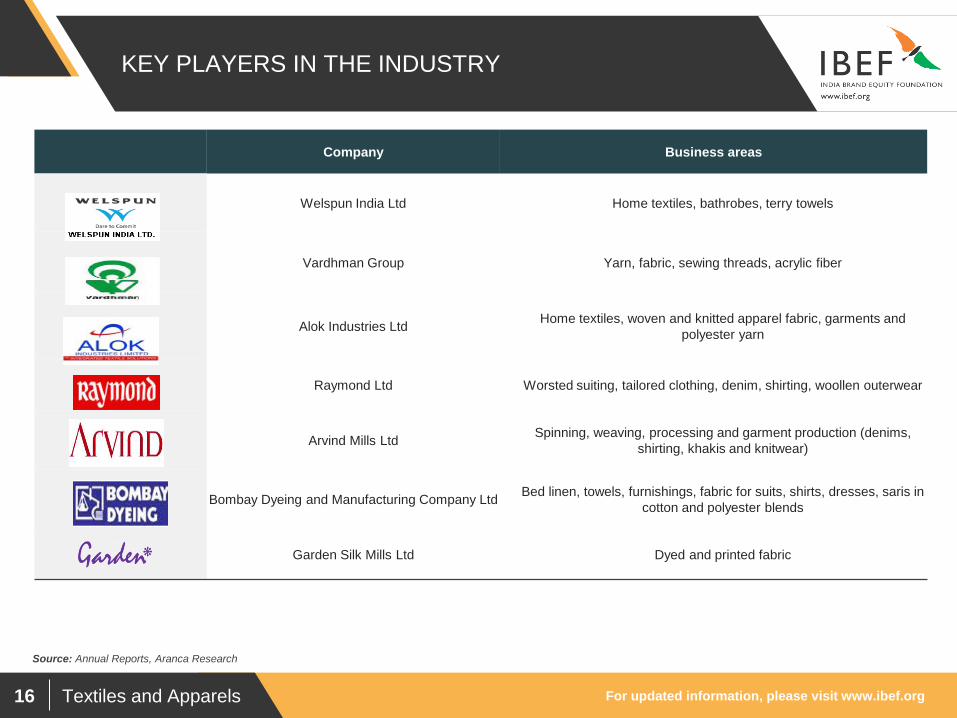
Company Business areas
Welspun India Ltd Home textiles, bathrobes, terry towels
Vardhman Group Yarn, fabric, sewing threads, acrylic fiber
Alok Industries Ltd Home textiles, woven and knitted apparel fabric, garments and
polyester yarn
Raymond Ltd Worsted suiting, tailored clothing, denim, shirting, woollen outerwear
Arvind Mills Ltd Spinning, weaving, processing and garment production (denims,
shirting, khakis and knitwear)
Bombay Dyeing and Manufacturing Company Ltd Bed linen, towels, furnishings, fabric for suits, shirts, dresses, saris in
cotton and polyester blends
Garden Silk Mills Ltd Dyed and printed fabric
For updated information, please visit www.ibef.org Textiles and Apparels 17
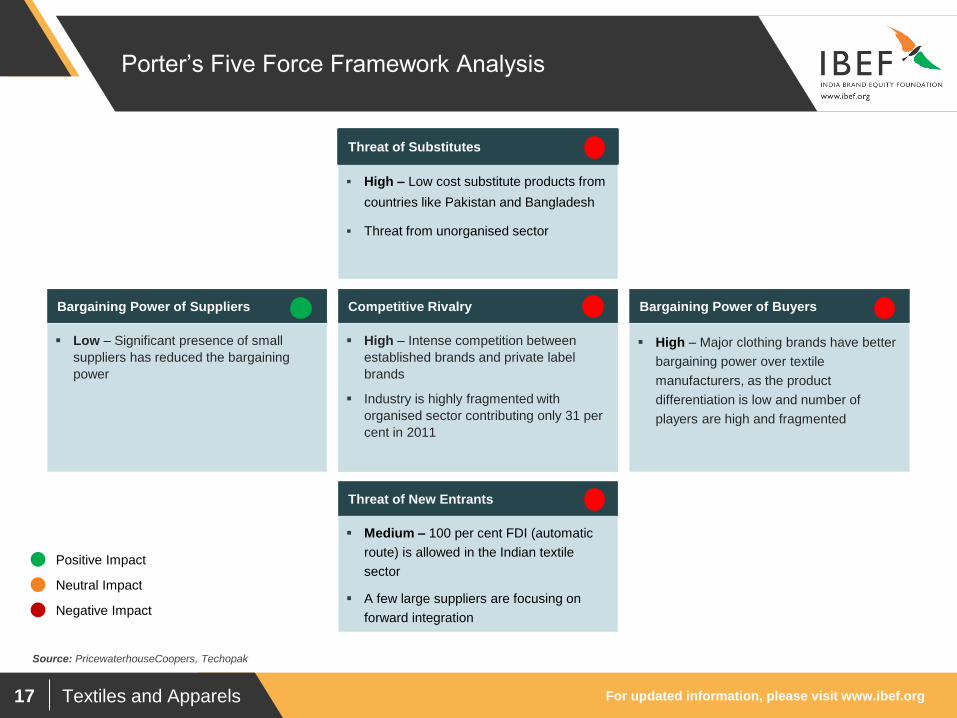
Porter’s Five Force Framework Analysis
Low – Significant presence of small
suppliers has reduced the bargaining
power
Bargaining Power of Suppliers
High – Low cost substitute products from
countries like Pakistan and Bangladesh
Threat from unorganised sector
Threat of Substitutes
High – Intense competition between
established brands and private label
brands
Industry is highly fragmented with
organised sector contributing only 31 per
cent in 2011
Competitive Rivalry
Medium – 100 per cent FDI (automatic
route) is allowed in the Indian textile
sector
A few large suppliers are focusing on
forward integration
Threat of New Entrants
High – Major clothing brands have better
bargaining power over textile
manufacturers, as the product
differentiation is low and number of
players are high and fragmented
Bargaining Power of Buyers
Positive Impact
Neutral Impact
Negative Impact
Source: PricewaterhouseCoopers, Techopak
Textiles and Apparels
RECENT TRENDS
AND STRATEGIES
For updated information, please visit www.ibef.org Textiles and Apparels 19
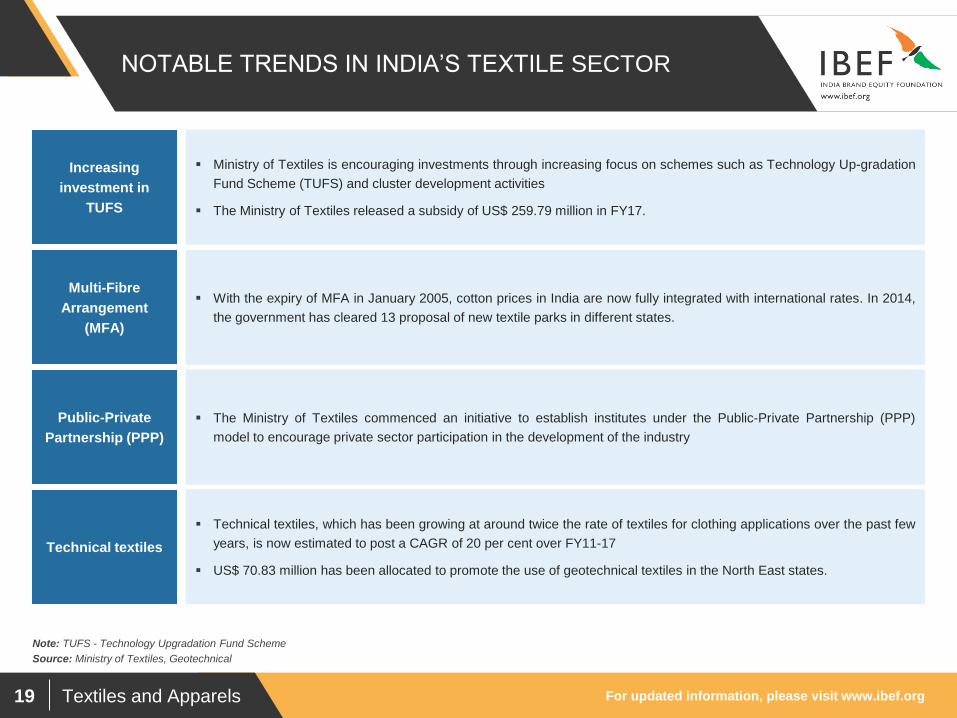
NOTABLE TRENDS IN INDIA’S TEXTILE SECTOR
Source: Ministry of Textiles, Geotechnical
Note: TUFS - Technology Upgradation Fund Scheme
Ministry of Textiles is encouraging investments through increasing focus on schemes such as Technology Up-gradation
Fund Scheme (TUFS) and cluster development activities
The Ministry of Textiles released a subsidy of US$ 259.79 million in FY17.
Increasing
investment in
TUFS
Multi-Fibre
Arrangement
(MFA)
Public-Private
Partnership (PPP)
Technical textiles
With the expiry of MFA in January 2005, cotton prices in India are now fully integrated with international rates. In 2014,
the government has cleared 13 proposal of new textile parks in different states.
The Ministry of Textiles commenced an initiative to establish institutes under the Public-Private Partnership (PPP)
model to encourage private sector participation in the development of the industry
Technical textiles, which has been growing at around twice the rate of textiles for clothing applications over the past few
years, is now estimated to post a CAGR of 20 per cent over FY11-17
US$ 70.83 million has been allocated to promote the use of geotechnical textiles in the North East states.
For updated information, please visit www.ibef.org Textiles and Apparels 20
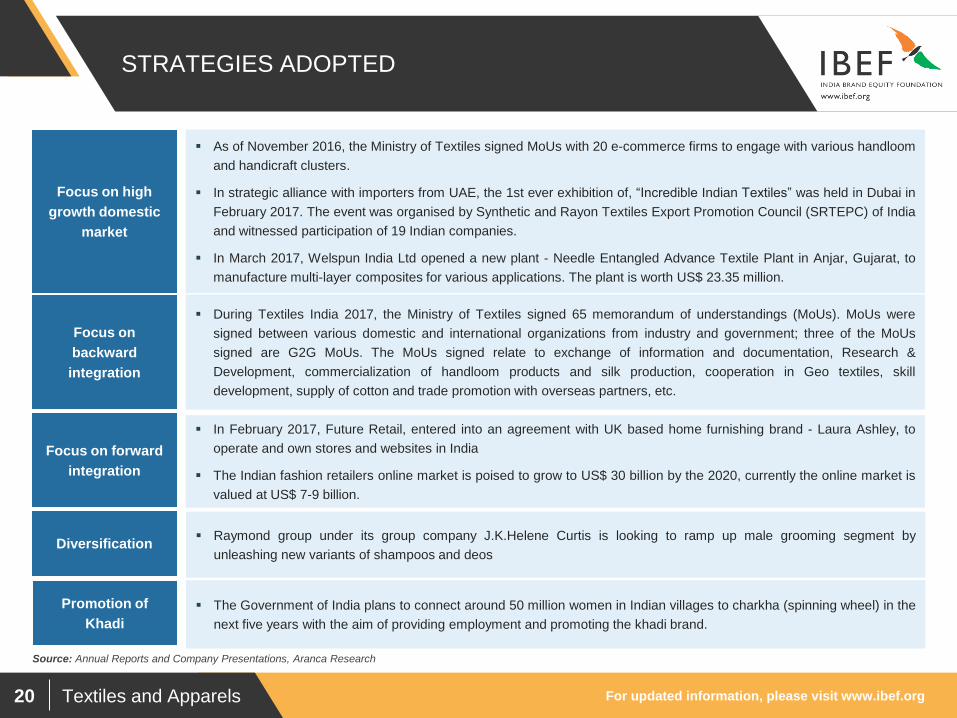
STRATEGIES ADOPTED
Source: Annual Reports and Company Presentations, Aranca Research
As of November 2016, the Ministry of Textiles signed MoUs with 20 e-commerce firms to engage with various handloom
and handicraft clusters.
In strategic alliance with importers from UAE, the 1st ever exhibition of, “Incredible Indian Textiles” was held in Dubai in
February 2017. The event was organised by Synthetic and Rayon Textiles Export Promotion Council (SRTEPC) of India
and witnessed participation of 19 Indian companies.
In March 2017, Welspun India Ltd opened a new plant - Needle Entangled Advance Textile Plant in Anjar, Gujarat, to
manufacture multi-layer composites for various applications. The plant is worth US$ 23.35 million.
Focus on high
growth domestic
market
Focus on forward
integration
Diversification
In February 2017, Future Retail, entered into an agreement with UK based home furnishing brand - Laura Ashley, to
operate and own stores and websites in India
The Indian fashion retailers online market is poised to grow to US$ 30 billion by the 2020, currently the online market is
valued at US$ 7-9 billion.
Raymond group under its group company J.K.Helene Curtis is looking to ramp up male grooming segment by
unleashing new variants of shampoos and deos
Focus on
backward
integration
During Textiles India 2017, the Ministry of Textiles signed 65 memorandum of understandings (MoUs). MoUs were
signed between various domestic and international organizations from industry and government; three of the MoUs
signed are G2G MoUs. The MoUs signed relate to exchange of information and documentation, Research &
Development, commercialization of handloom products and silk production, cooperation in Geo textiles, skill
development, supply of cotton and trade promotion with overseas partners, etc.
Promotion of
Khadi
The Government of India plans to connect around 50 million women in Indian villages to charkha (spinning wheel) in the
next five years with the aim of providing employment and promoting the khadi brand.

Textiles and Apparels
GROWTH DRIVERS
For updated information, please visit www.ibef.org Textiles and Apparels 22
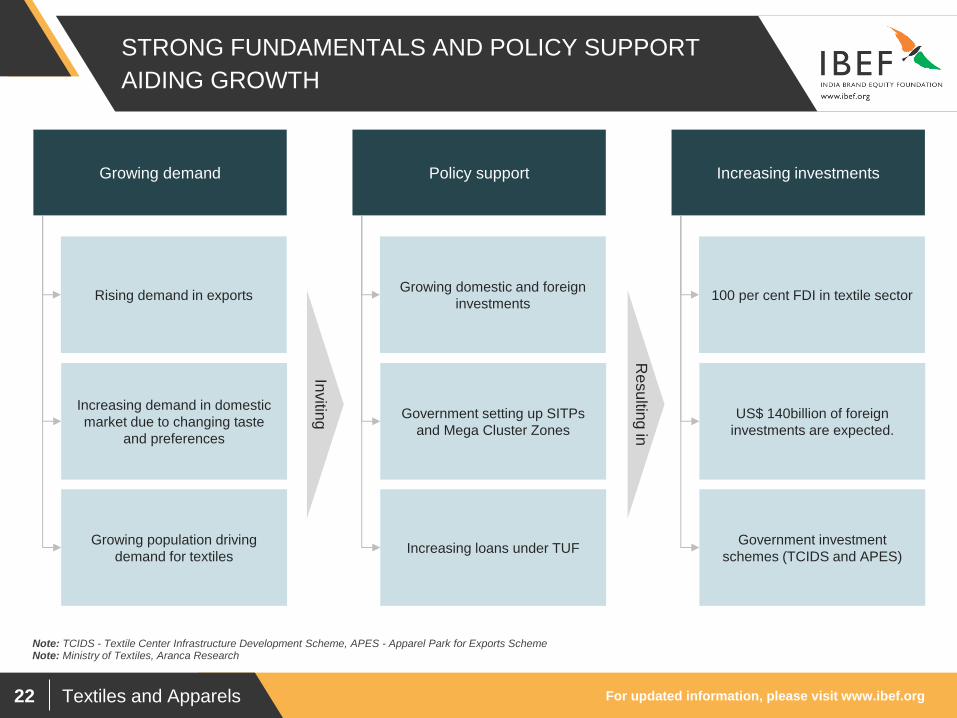
STRONG FUNDAMENTALS AND POLICY SUPPORT
AIDING GROWTH
Note: TCIDS - Textile Center Infrastructure Development Scheme, APES - Apparel Park for Exports Scheme Note: Ministry of Textiles, Aranca Research
Rising demand in exports
Increasing demand in domestic
market due to changing taste
and preferences
Growing population driving
demand for textiles
Growing demand
Growing domestic and foreign
investments
Government setting up SITPs
and Mega Cluster Zones
Increasing loans under TUF
Policy support
100 per cent FDI in textile sector
US$ 140billion of foreign
investments are expected.
Government investment
schemes (TCIDS and APES)
Increasing investments
Invitin
g
Resu
lting in
For updated information, please visit www.ibef.org Textiles and Apparels 23
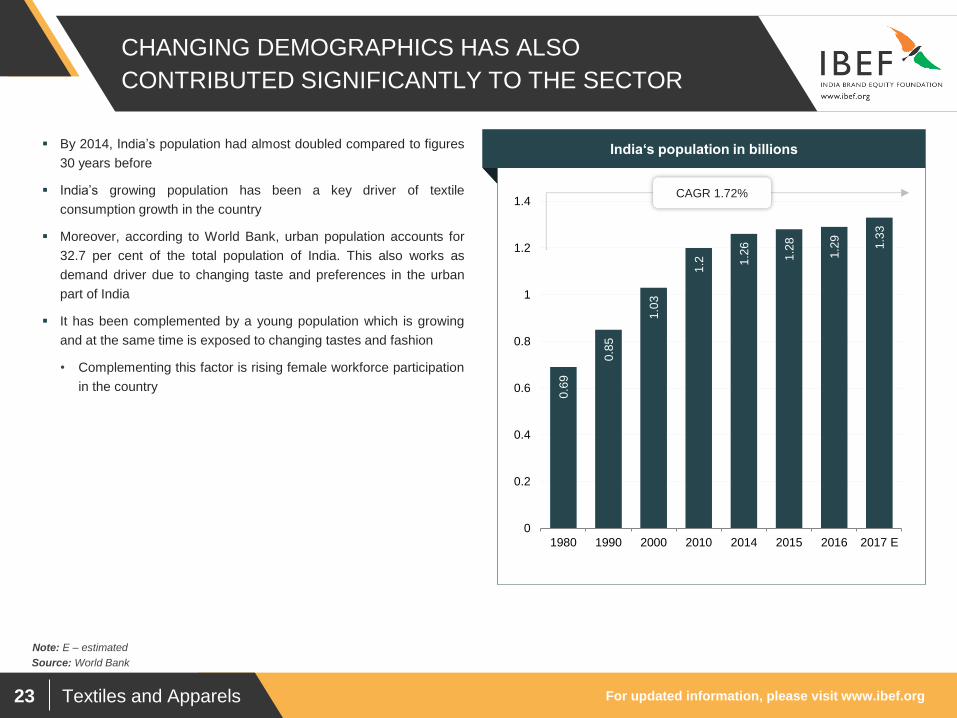
CHANGING DEMOGRAPHICS HAS ALSO
CONTRIBUTED SIGNIFICANTLY TO THE SECTOR
0.6
9
0.8
5
1.0
3
1.2
1.2
6
1.2
8
1.2
9
1.3
3
0
0.2
0.4
0.6
0.8
1
1.2
1.4
1980 1990 2000 2010 2014 2015 2016 2017 E
Source: World Bank
By 2014, India’s population had almost doubled compared to figures
30 years before
India’s growing population has been a key driver of textile
consumption growth in the country
Moreover, according to World Bank, urban population accounts for
32.7 per cent of the total population of India. This also works as
demand driver due to changing taste and preferences in the urban
part of India
It has been complemented by a young population which is growing
and at the same time is exposed to changing tastes and fashion
• Complementing this factor is rising female workforce participation
in the country
Visakhapatnam port traffic (million tonnes) India‘s population in billions
CAGR 1.72%
Note: E – estimated
For updated information, please visit www.ibef.org Textiles and Apparels 24
94
5.9
0
1,0
58
.00
1,1
79
.30
1,2
88
.60
1,4
03
.00
1,5
38
.50
-2.00%
-1.00%
0.00%
1.00%
2.00%
3.00%
4.00%
5.00%
6.00%
7.00%
8.00%
9.00%
-
200.00
400.00
600.00
800.00
1,000.00
1,200.00
1,400.00
1,600.00
1,800.00
FY
12
FY
13
FY
14
FY
15
FY
16
FY
17
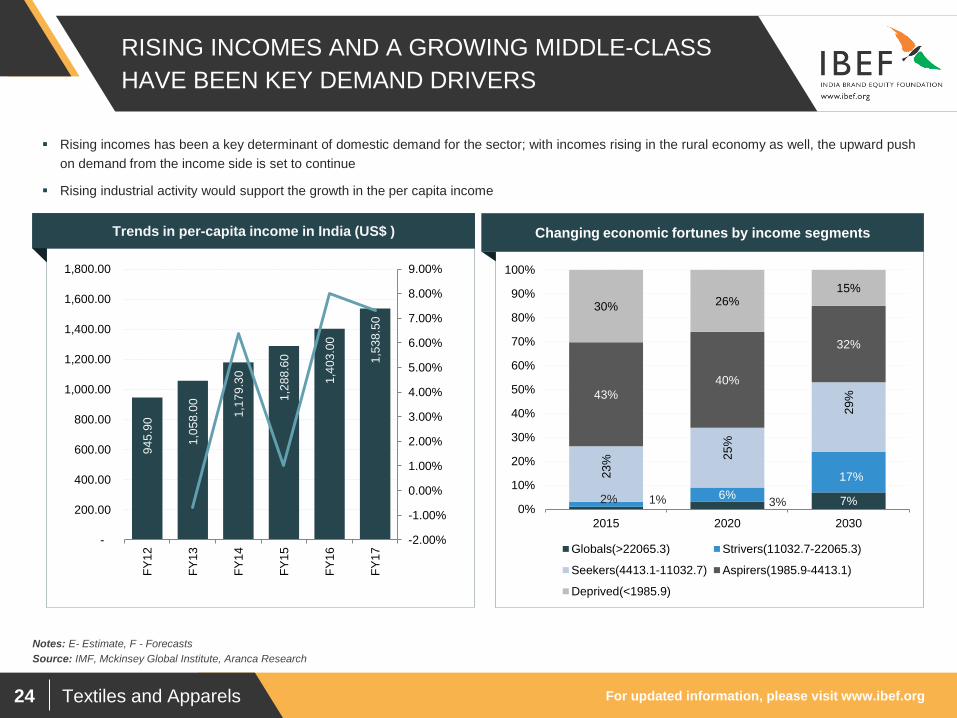
RISING INCOMES AND A GROWING MIDDLE-CLASS
HAVE BEEN KEY DEMAND DRIVERS
Source: IMF, Mckinsey Global Institute, Aranca Research
Notes: E- Estimate, F - Forecasts
Visakhapatnam port traffic (million tonnes) Trends in per-capita income in India (US$ )
Rising incomes has been a key determinant of domestic demand for the sector; with incomes rising in the rural economy as well, the upward push
on demand from the income side is set to continue
Rising industrial activity would support the growth in the per capita income
Changing economic fortunes by income segments
1% 3% 7% 2% 6%
17% 23
% 25
%
29
%
43%
40%
32%
30% 26% 15%
0%
10%
20%
30%
40%
50%
60%
70%
80%
90%
100%
2015 2020 2030
Globals(>22065.3) Strivers(11032.7-22065.3)
Seekers(4413.1-11032.7) Aspirers(1985.9-4413.1)
Deprived(<1985.9)
For updated information, please visit www.ibef.org Textiles and Apparels 25
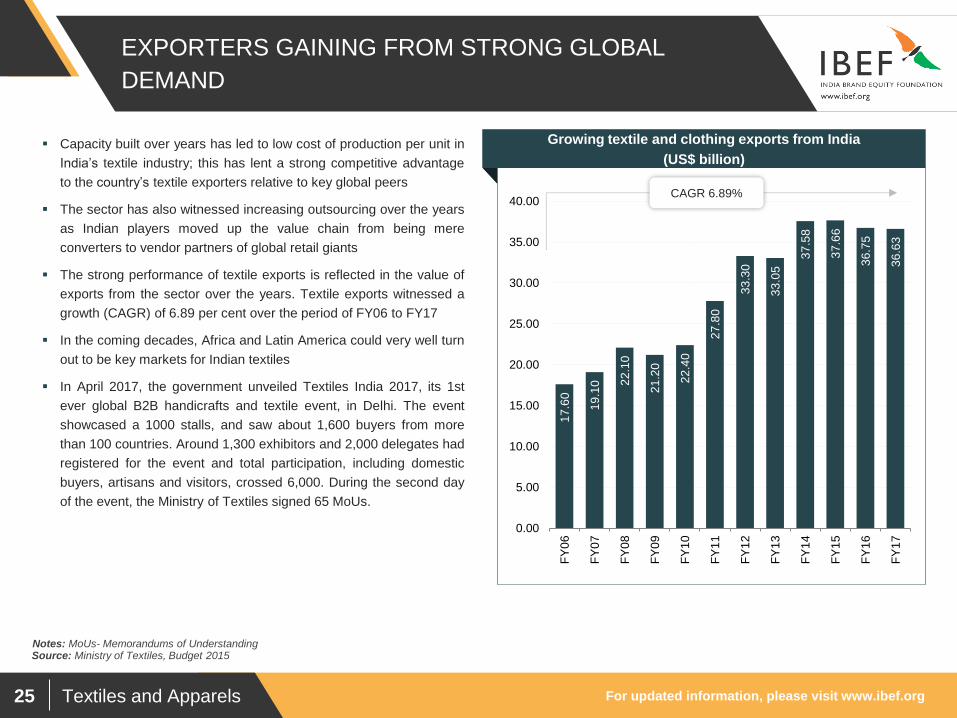
EXPORTERS GAINING FROM STRONG GLOBAL
DEMAND
17
.60
19
.10
22
.10
21
.20
22
.40
27
.80
33
.30
33
.05
37
.58
37
.66
36
.75
36
.63
0.00
5.00
10.00
15.00
20.00
25.00
30.00
35.00
40.00
FY
06
FY
07
FY
08
FY
09
FY
10
FY
11
FY
12
FY
13
FY
14
FY
15
FY
16
FY
17
Source: Ministry of Textiles, Budget 2015
Capacity built over years has led to low cost of production per unit in
India’s textile industry; this has lent a strong competitive advantage
to the country’s textile exporters relative to key global peers
The sector has also witnessed increasing outsourcing over the years
as Indian players moved up the value chain from being mere
converters to vendor partners of global retail giants
The strong performance of textile exports is reflected in the value of
exports from the sector over the years. Textile exports witnessed a
growth (CAGR) of 6.89 per cent over the period of FY06 to FY17
In the coming decades, Africa and Latin America could very well turn
out to be key markets for Indian textiles
In April 2017, the government unveiled Textiles India 2017, its 1st
ever global B2B handicrafts and textile event, in Delhi. The event
showcased a 1000 stalls, and saw about 1,600 buyers from more
than 100 countries. Around 1,300 exhibitors and 2,000 delegates had
registered for the event and total participation, including domestic
buyers, artisans and visitors, crossed 6,000. During the second day
of the event, the Ministry of Textiles signed 65 MoUs.
Visakhapatnam port traffic (million tonnes) Growing textile and clothing exports from India
(US$ billion)
CAGR 6.89%
Notes: MoUs- Memorandums of Understanding
For updated information, please visit www.ibef.org Textiles and Apparels 26
TECHNICAL TEXTILE INDUSTRY – A NEW ARENA OF
GROWTH
17
.28
32
0
5
10
15
20
25
30
35
FY
18E
FY
23E
Source: Chamber of Commerce, Indian Technical Textile Association, Aranca Research
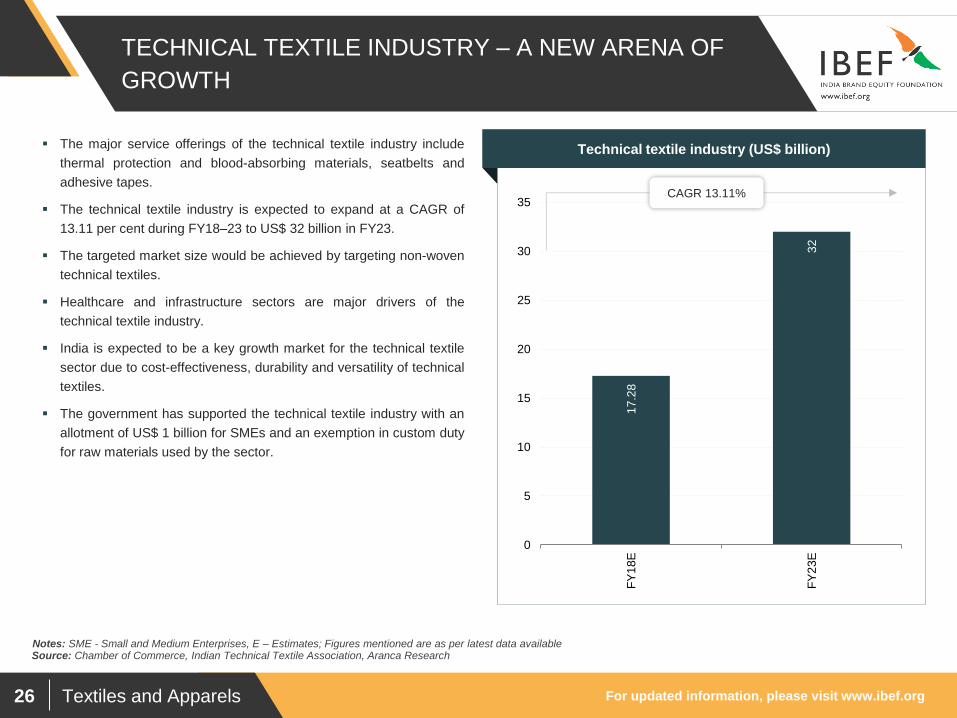
The major service offerings of the technical textile industry include
thermal protection and blood-absorbing materials, seatbelts and
adhesive tapes.
The technical textile industry is expected to expand at a CAGR of
13.11 per cent during FY18–23 to US$ 32 billion in FY23.
The targeted market size would be achieved by targeting non-woven
technical textiles.
Healthcare and infrastructure sectors are major drivers of the
technical textile industry.
India is expected to be a key growth market for the technical textile
sector due to cost-effectiveness, durability and versatility of technical
textiles.
The government has supported the technical textile industry with an
allotment of US$ 1 billion for SMEs and an exemption in custom duty
for raw materials used by the sector.
Visakhapatnam port traffic (million tonnes) Technical textile industry (US$ billion)
CAGR 13.11%
Notes: SME - Small and Medium Enterprises, E – Estimates; Figures mentioned are as per latest data available
For updated information, please visit www.ibef.org Textiles and Apparels 27
HOME TEXTILE INDUSTRY – GAINING ON DEMAND
FOR EXPORTS
4.7
5.5
8.2
0
0
1
2
3
4
5
6
7
8
9
201
4
201
6E
202
1E
Source: Ministry of Textiles, Welspun Presentation, Technopak, Aranca Research
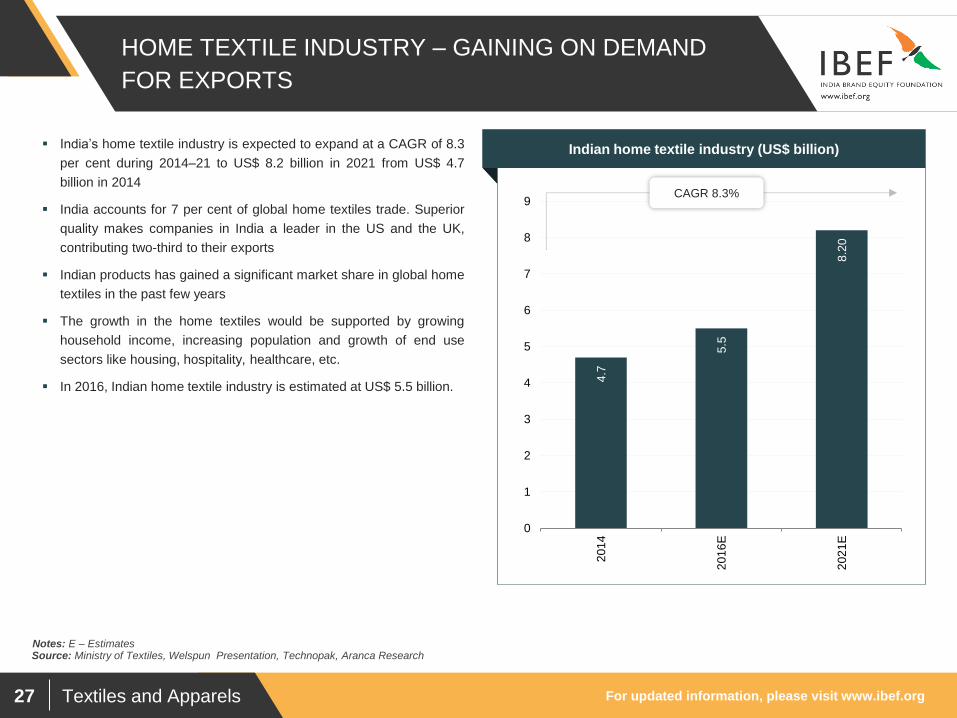
India’s home textile industry is expected to expand at a CAGR of 8.3
per cent during 2014–21 to US$ 8.2 billion in 2021 from US$ 4.7
billion in 2014
India accounts for 7 per cent of global home textiles trade. Superior
quality makes companies in India a leader in the US and the UK,
contributing two-third to their exports
Indian products has gained a significant market share in global home
textiles in the past few years
The growth in the home textiles would be supported by growing
household income, increasing population and growth of end use
sectors like housing, hospitality, healthcare, etc.
In 2016, Indian home textile industry is estimated at US$ 5.5 billion.
Visakhapatnam port traffic (million tonnes) Indian home textile industry (US$ billion)
CAGR 8.3%
Notes: E – Estimates
For updated information, please visit www.ibef.org Textiles and Apparels 28
POLICY SUPPORT HAS BEEN A KEY INGREDIENT TO
GROWTH
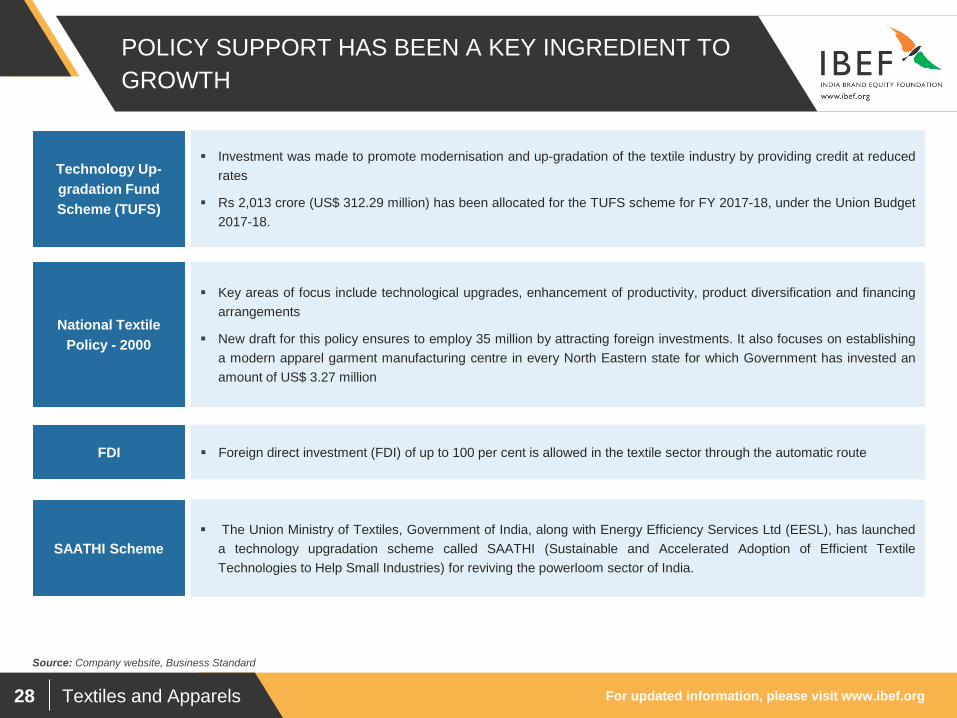
Investment was made to promote modernisation and up-gradation of the textile industry by providing credit at reduced
rates
Rs 2,013 crore (US$ 312.29 million) has been allocated for the TUFS scheme for FY 2017-18, under the Union Budget
2017-18.
Technology Up-
gradation Fund
Scheme (TUFS)
Key areas of focus include technological upgrades, enhancement of productivity, product diversification and financing
arrangements
New draft for this policy ensures to employ 35 million by attracting foreign investments. It also focuses on establishing
a modern apparel garment manufacturing centre in every North Eastern state for which Government has invested an
amount of US$ 3.27 million
National Textile
Policy - 2000
Foreign direct investment (FDI) of up to 100 per cent is allowed in the textile sector through the automatic route FDI
Source: Company website, Business Standard
The Union Ministry of Textiles, Government of India, along with Energy Efficiency Services Ltd (EESL), has launched
a technology upgradation scheme called SAATHI (Sustainable and Accelerated Adoption of Efficient Textile
Technologies to Help Small Industries) for reviving the powerloom sector of India.
SAATHI Scheme
For updated information, please visit www.ibef.org Textiles and Apparels 29
TEXTILE SEZs IN INDIA
Source: SEZ India invest.com, Aranca Research
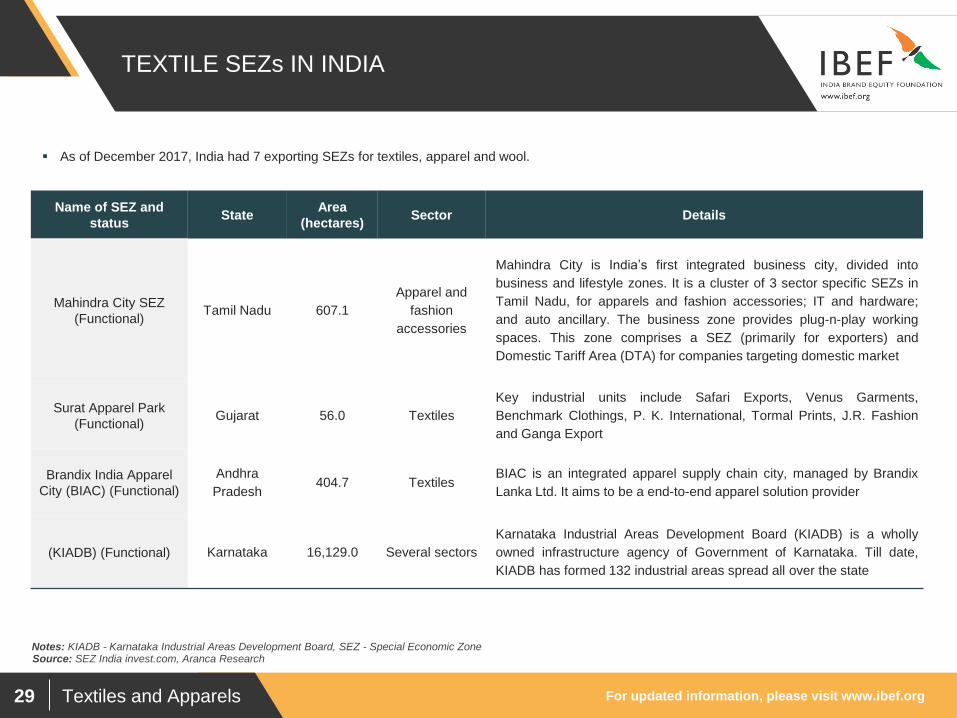
Name of SEZ and
status State
Area
(hectares) Sector Details
Mahindra City SEZ
(Functional) Tamil Nadu 607.1
Apparel and
fashion
accessories
Mahindra City is India’s first integrated business city, divided into
business and lifestyle zones. It is a cluster of 3 sector specific SEZs in
Tamil Nadu, for apparels and fashion accessories; IT and hardware;
and auto ancillary. The business zone provides plug-n-play working
spaces. This zone comprises a SEZ (primarily for exporters) and
Domestic Tariff Area (DTA) for companies targeting domestic market
Surat Apparel Park
(Functional) Gujarat 56.0 Textiles
Key industrial units include Safari Exports, Venus Garments,
Benchmark Clothings, P. K. International, Tormal Prints, J.R. Fashion
and Ganga Export
Brandix India Apparel
City (BIAC) (Functional)
Andhra
Pradesh 404.7 Textiles
BIAC is an integrated apparel supply chain city, managed by Brandix
Lanka Ltd. It aims to be a end-to-end apparel solution provider
(KIADB) (Functional) Karnataka 16,129.0 Several sectors
Karnataka Industrial Areas Development Board (KIADB) is a wholly
owned infrastructure agency of Government of Karnataka. Till date,
KIADB has formed 132 industrial areas spread all over the state
As of December 2017, India had 7 exporting SEZs for textiles, apparel and wool.
Notes: KIADB - Karnataka Industrial Areas Development Board, SEZ - Special Economic Zone
For updated information, please visit www.ibef.org Textiles and Apparels 30
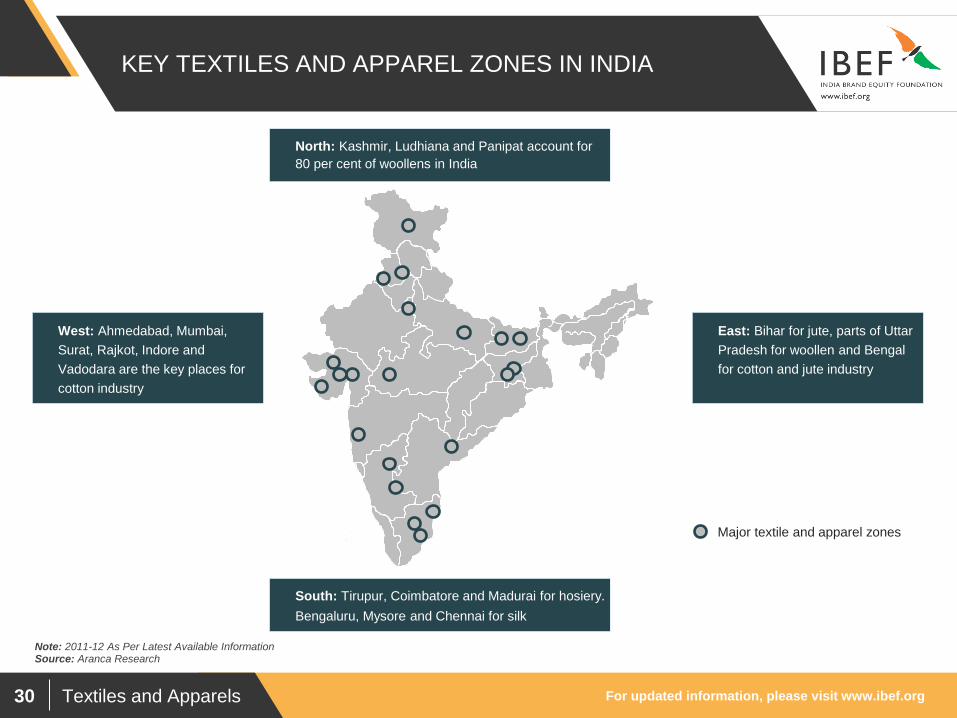
KEY TEXTILES AND APPAREL ZONES IN INDIA
North: Kashmir, Ludhiana and Panipat account for
80 per cent of woollens in India
West: Ahmedabad, Mumbai,
Surat, Rajkot, Indore and
Vadodara are the key places for
cotton industry
East: Bihar for jute, parts of Uttar
Pradesh for woollen and Bengal
for cotton and jute industry
Note: 2011-12 As Per Latest Available Information
South: Tirupur, Coimbatore and Madurai for hosiery.
Bengaluru, Mysore and Chennai for silk
Source: Aranca Research
Major textile and apparel zones
For updated information, please visit www.ibef.org Textiles and Apparels 31
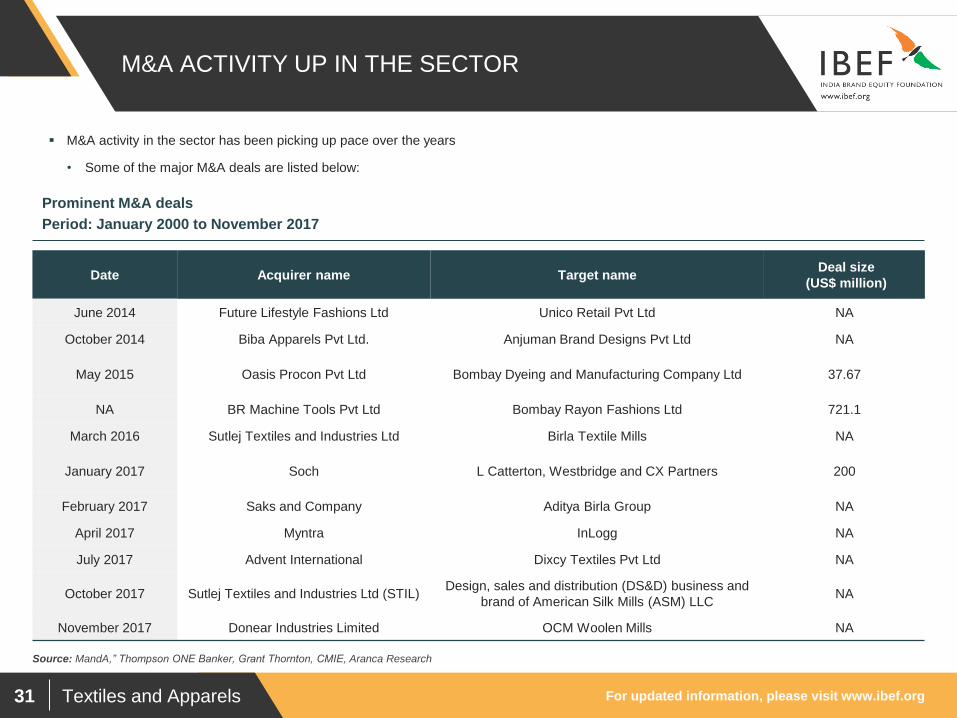
M&A ACTIVITY UP IN THE SECTOR
Prominent M&A deals
Period: January 2000 to November 2017
Source: MandA,” Thompson ONE Banker, Grant Thornton, CMIE, Aranca Research
Date Acquirer name Target name Deal size
(US$ million)
June 2014 Future Lifestyle Fashions Ltd Unico Retail Pvt Ltd NA
October 2014 Biba Apparels Pvt Ltd. Anjuman Brand Designs Pvt Ltd NA
May 2015 Oasis Procon Pvt Ltd Bombay Dyeing and Manufacturing Company Ltd 37.67
NA BR Machine Tools Pvt Ltd Bombay Rayon Fashions Ltd 721.1
March 2016 Sutlej Textiles and Industries Ltd Birla Textile Mills NA
January 2017 Soch L Catterton, Westbridge and CX Partners 200
February 2017 Saks and Company Aditya Birla Group NA
April 2017 Myntra InLogg NA
July 2017 Advent International Dixcy Textiles Pvt Ltd NA
October 2017 Sutlej Textiles and Industries Ltd (STIL) Design, sales and distribution (DS&D) business and
brand of American Silk Mills (ASM) LLC NA
November 2017 Donear Industries Limited OCM Woolen Mills NA
M&A activity in the sector has been picking up pace over the years
• Some of the major M&A deals are listed below:
For updated information, please visit www.ibef.org Textiles and Apparels 32
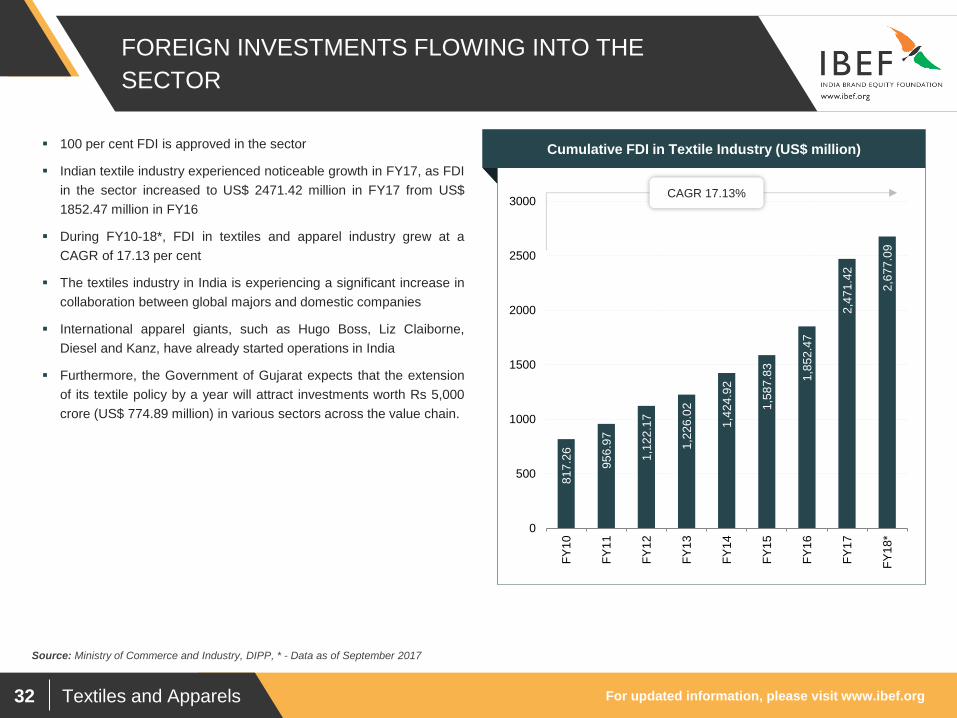
FOREIGN INVESTMENTS FLOWING INTO THE
SECTOR
81
7.2
6
95
6.9
7
1,1
22
.17
1,2
26
.02
1,4
24
.92
1,5
87
.83
1,8
52
.47
2,4
71
.42
2,6
77
.09
0
500
1000
1500
2000
2500
3000
FY
10
FY
11
FY
12
FY
13
FY
14
FY
15
FY
16
FY
17
FY
18*
Source: Ministry of Commerce and Industry, DIPP, * - Data as of September 2017
100 per cent FDI is approved in the sector
Indian textile industry experienced noticeable growth in FY17, as FDI
in the sector increased to US$ 2471.42 million in FY17 from US$
1852.47 million in FY16
During FY10-18*, FDI in textiles and apparel industry grew at a
CAGR of 17.13 per cent
The textiles industry in India is experiencing a significant increase in
collaboration between global majors and domestic companies
International apparel giants, such as Hugo Boss, Liz Claiborne,
Diesel and Kanz, have already started operations in India
Furthermore, the Government of Gujarat expects that the extension
of its textile policy by a year will attract investments worth Rs 5,000
crore (US$ 774.89 million) in various sectors across the value chain.
Visakhapatnam port traffic (million tonnes) Cumulative FDI in Textile Industry (US$ million)
CAGR 17.13%
Textiles and Apparels
OPPORTUNITIES
For updated information, please visit www.ibef.org Textiles and Apparels 34
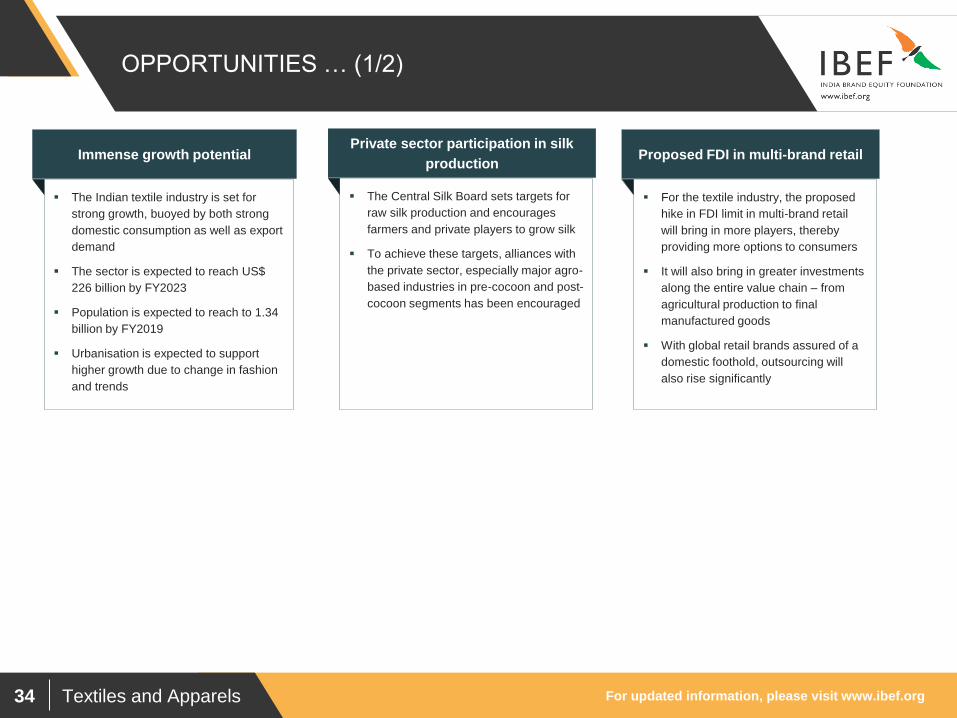
OPPORTUNITIES … (1/2)
The Indian textile industry is set for
strong growth, buoyed by both strong
domestic consumption as well as export
demand
The sector is expected to reach US$
226 billion by FY2023
Population is expected to reach to 1.34
billion by FY2019
Urbanisation is expected to support
higher growth due to change in fashion
and trends
Immense growth potential
The Central Silk Board sets targets for
raw silk production and encourages
farmers and private players to grow silk
To achieve these targets, alliances with
the private sector, especially major agro-
based industries in pre-cocoon and post-
cocoon segments has been encouraged
Private sector participation in silk
production
For the textile industry, the proposed
hike in FDI limit in multi-brand retail
will bring in more players, thereby
providing more options to consumers
It will also bring in greater investments
along the entire value chain – from
agricultural production to final
manufactured goods
With global retail brands assured of a
domestic foothold, outsourcing will
also rise significantly
Proposed FDI in multi-brand retail
For updated information, please visit www.ibef.org Textiles and Apparels 35
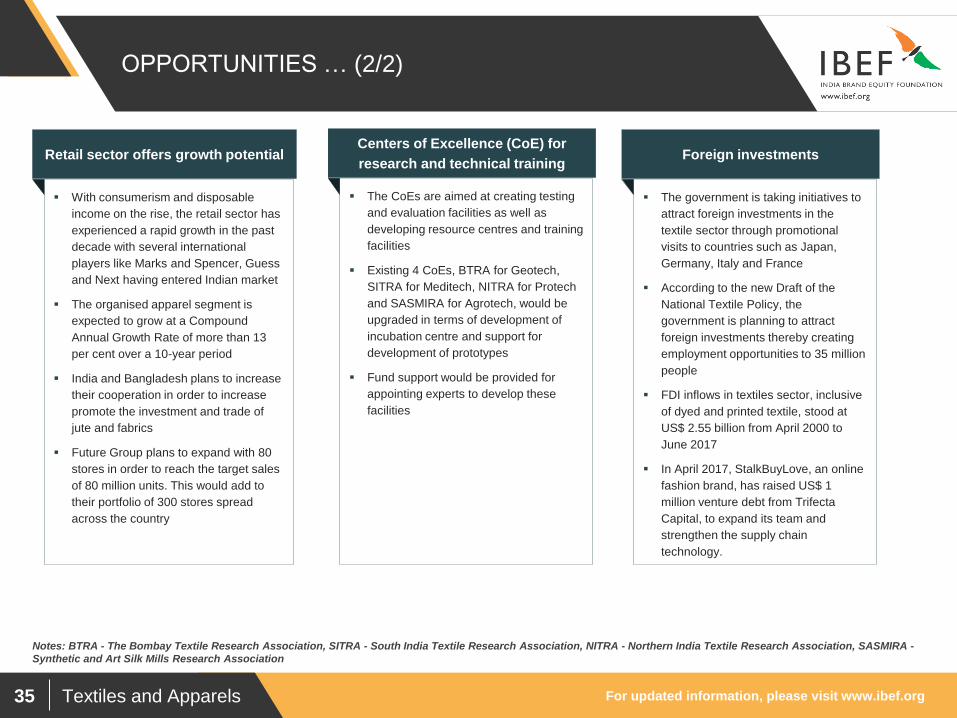
OPPORTUNITIES … (2/2)
With consumerism and disposable
income on the rise, the retail sector has
experienced a rapid growth in the past
decade with several international
players like Marks and Spencer, Guess
and Next having entered Indian market
The organised apparel segment is
expected to grow at a Compound
Annual Growth Rate of more than 13
per cent over a 10-year period
India and Bangladesh plans to increase
their cooperation in order to increase
promote the investment and trade of
jute and fabrics
Future Group plans to expand with 80
stores in order to reach the target sales
of 80 million units. This would add to
their portfolio of 300 stores spread
across the country
Retail sector offers growth potential
The CoEs are aimed at creating testing
and evaluation facilities as well as
developing resource centres and training
facilities
Existing 4 CoEs, BTRA for Geotech,
SITRA for Meditech, NITRA for Protech
and SASMIRA for Agrotech, would be
upgraded in terms of development of
incubation centre and support for
development of prototypes
Fund support would be provided for
appointing experts to develop these
facilities
Centers of Excellence (CoE) for
research and technical training
The government is taking initiatives to
attract foreign investments in the
textile sector through promotional
visits to countries such as Japan,
Germany, Italy and France
According to the new Draft of the
National Textile Policy, the
government is planning to attract
foreign investments thereby creating
employment opportunities to 35 million
people
FDI inflows in textiles sector, inclusive
of dyed and printed textile, stood at
US$ 2.55 billion from April 2000 to
June 2017
In April 2017, StalkBuyLove, an online
fashion brand, has raised US$ 1
million venture debt from Trifecta
Capital, to expand its team and
strengthen the supply chain
technology.
Foreign investments
Notes: BTRA - The Bombay Textile Research Association, SITRA - South India Textile Research Association, NITRA - Northern India Textile Research Association, SASMIRA -
Synthetic and Art Silk Mills Research Association
Textiles and Apparels
CASE STUDIES
For updated information, please visit www.ibef.org Textiles and Apparels 37
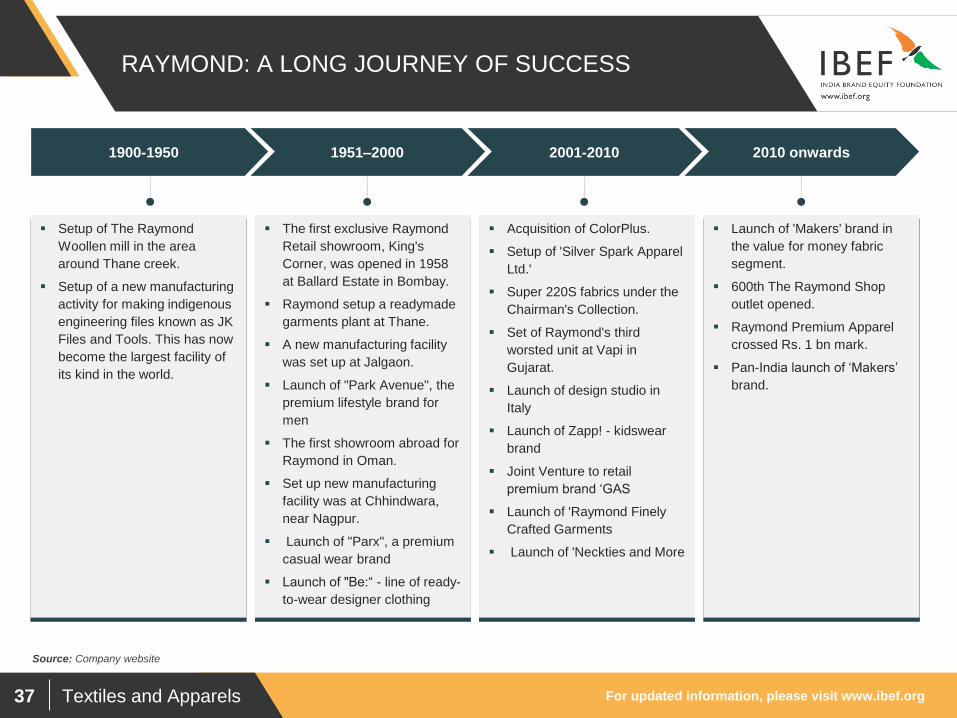
RAYMOND: A LONG JOURNEY OF SUCCESS
Source: Company website
1900-1950 1951–2000 2001-2010 2010 onwards
Setup of The Raymond
Woollen mill in the area
around Thane creek.
Setup of a new manufacturing
activity for making indigenous
engineering files known as JK
Files and Tools. This has now
become the largest facility of
its kind in the world.
The first exclusive Raymond
Retail showroom, King's
Corner, was opened in 1958
at Ballard Estate in Bombay.
Raymond setup a readymade
garments plant at Thane.
A new manufacturing facility
was set up at Jalgaon.
Launch of "Park Avenue", the
premium lifestyle brand for
men
The first showroom abroad for
Raymond in Oman.
Set up new manufacturing
facility was at Chhindwara,
near Nagpur.
Launch of "Parx", a premium
casual wear brand
Launch of "Be:“ - line of ready-
to-wear designer clothing
Acquisition of ColorPlus.
Setup of 'Silver Spark Apparel
Ltd.'
Super 220S fabrics under the
Chairman's Collection.
Set of Raymond's third
worsted unit at Vapi in
Gujarat.
Launch of design studio in
Italy
Launch of Zapp! - kidswear
brand
Joint Venture to retail
premium brand ‘GAS
Launch of 'Raymond Finely
Crafted Garments
Launch of 'Neckties and More
Launch of 'Makers' brand in
the value for money fabric
segment.
600th The Raymond Shop
outlet opened.
Raymond Premium Apparel
crossed Rs. 1 bn mark.
Pan-India launch of ‘Makers’
brand.
For updated information, please visit www.ibef.org Textiles and Apparels 38
WELSPUN INDIA: WORLD’S LARGEST HOME TEXTILE
COMPANY
Revenue (US$ million)
49
5.0
53
7.0
61
2.0
67
2.0
72
5.0
88
0.0
91
3.5
88
7.6
49
5.1
0.0
100.0
200.0
300.0
400.0
500.0
600.0
700.0
800.0
900.0
1,000.0
FY
10
FY
11
FY
12
FY
13
FY
14
FY
15
FY
16
FY
17
H1 F
Y18
Revenue
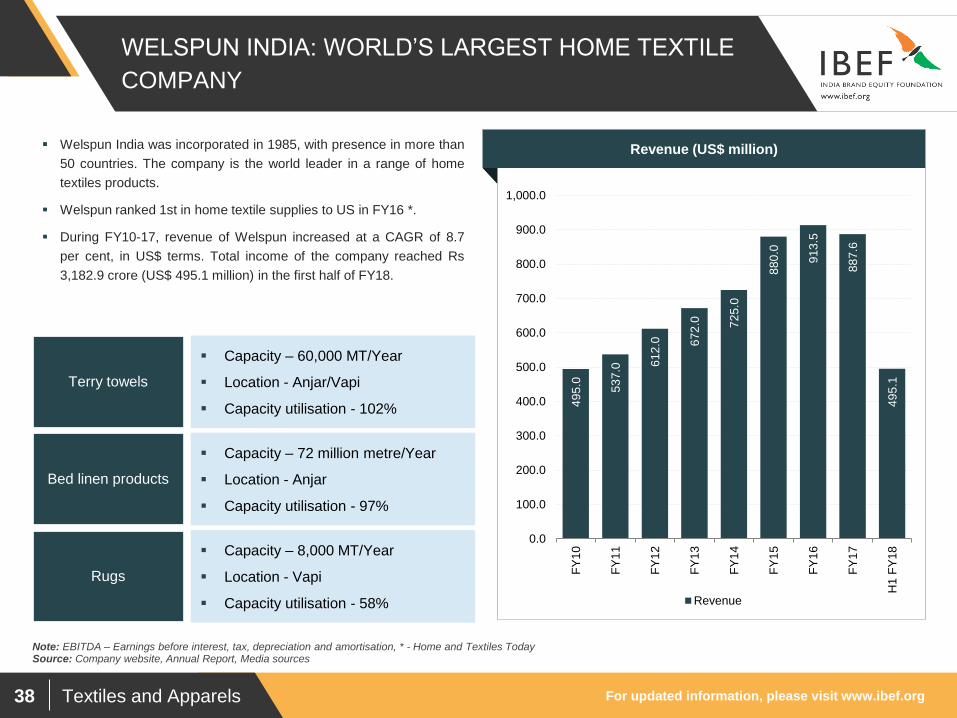
Welspun India was incorporated in 1985, with presence in more than
50 countries. The company is the world leader in a range of home
textiles products.
Welspun ranked 1st in home textile supplies to US in FY16 *.
During FY10-17, revenue of Welspun increased at a CAGR of 8.7
per cent, in US$ terms. Total income of the company reached Rs
3,182.9 crore (US$ 495.1 million) in the first half of FY18.
Source: Company website, Annual Report, Media sources
Capacity – 60,000 MT/Year
Location - Anjar/Vapi
Capacity utilisation - 102%
Terry towels
Capacity – 72 million metre/Year
Location - Anjar
Capacity utilisation - 97%
Bed linen products
Capacity – 8,000 MT/Year
Location - Vapi
Capacity utilisation - 58%
Rugs
Note: EBITDA – Earnings before interest, tax, depreciation and amortisation, * - Home and Textiles Today
For updated information, please visit www.ibef.org Textiles and Apparels 39
TIRUPUR: TEXTILES HUB OF INDIA
Source: Company website, Annual Report
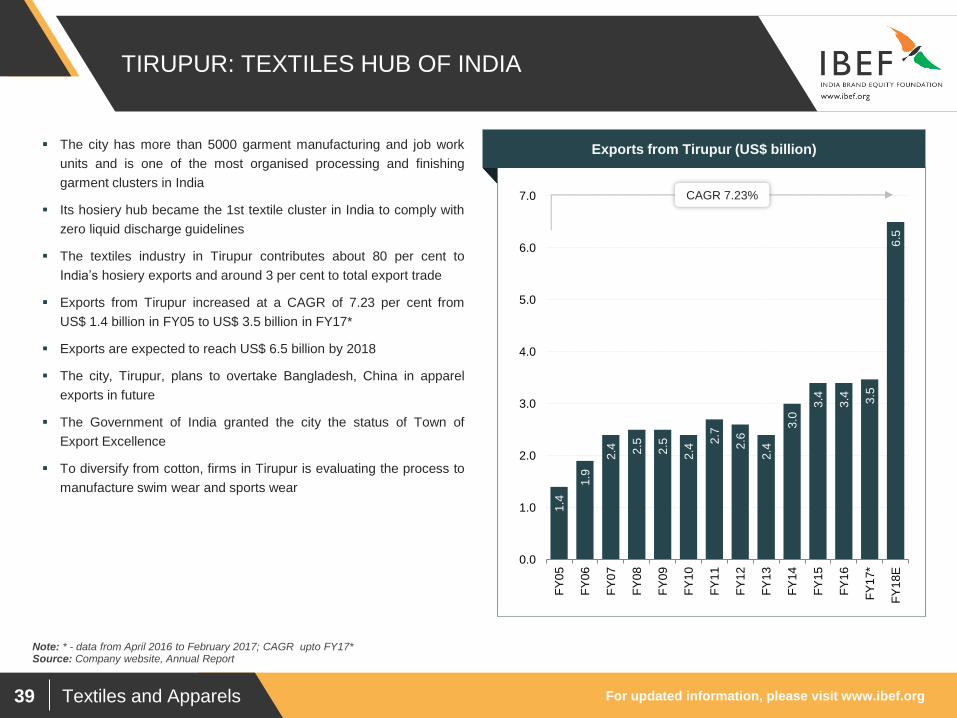
The city has more than 5000 garment manufacturing and job work
units and is one of the most organised processing and finishing
garment clusters in India
Its hosiery hub became the 1st textile cluster in India to comply with
zero liquid discharge guidelines
The textiles industry in Tirupur contributes about 80 per cent to
India’s hosiery exports and around 3 per cent to total export trade
Exports from Tirupur increased at a CAGR of 7.23 per cent from
US$ 1.4 billion in FY05 to US$ 3.5 billion in FY17*
Exports are expected to reach US$ 6.5 billion by 2018
The city, Tirupur, plans to overtake Bangladesh, China in apparel
exports in future
The Government of India granted the city the status of Town of
Export Excellence
To diversify from cotton, firms in Tirupur is evaluating the process to
manufacture swim wear and sports wear
Exports from Tirupur (US$ billion)
1.4
1.9
2.4
2.5
2.5
2.4
2.7
2.6
2.4
3.0
3.4
3.4
3.5
6.5
0.0
1.0
2.0
3.0
4.0
5.0
6.0
7.0
FY
05
FY
06
FY
07
FY
08
FY
09
FY
10
FY
11
FY
12
FY
13
FY
14
FY
15
FY
16
FY
17*
FY
18E
CAGR 7.23%
Note: * - data from April 2016 to February 2017; CAGR upto FY17*
Textiles and Apparels
KEY INDUSTRY
ORGANISATIONS
For updated information, please visit www.ibef.org Textiles and Apparels 41
INDUSTRY ORGANISATIONS
Visakhapatnam port traffic (million tonnes) The Textile Association (India) (TAI) The South India Textile Research Association (SITRA)
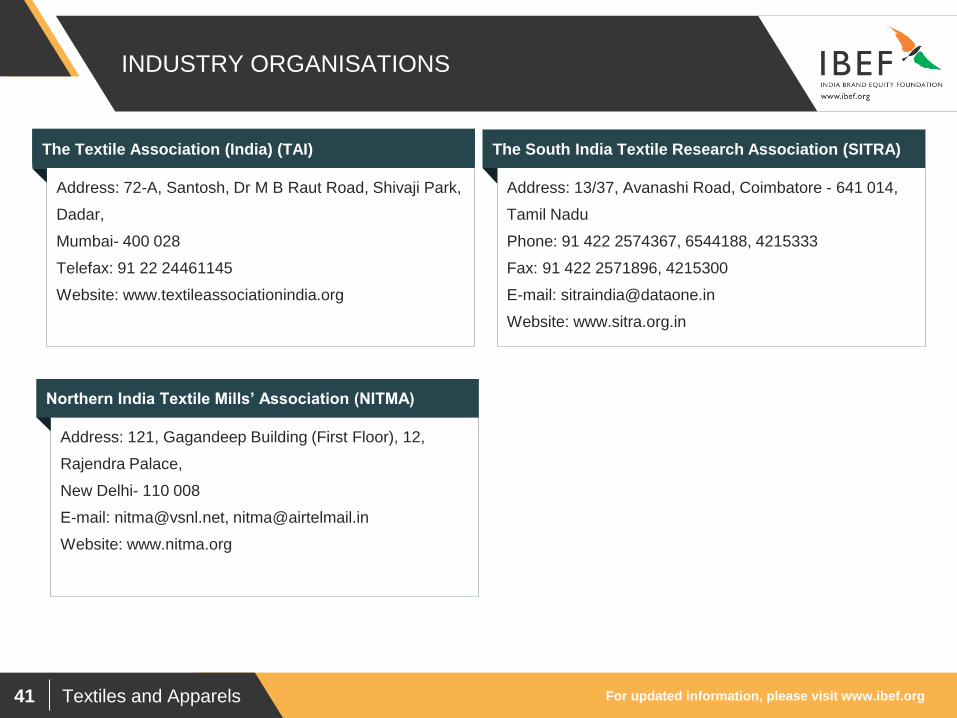
Address: 13/37, Avanashi Road, Coimbatore - 641 014,
Tamil Nadu
Phone: 91 422 2574367, 6544188, 4215333
Fax: 91 422 2571896, 4215300
E-mail: [email protected]
Website: www.sitra.org.in
Address: 72-A, Santosh, Dr M B Raut Road, Shivaji Park,
Dadar,
Mumbai- 400 028
Telefax: 91 22 24461145
Website: www.textileassociationindia.org
Northern India Textile Mills’ Association (NITMA)
Address: 121, Gagandeep Building (First Floor), 12,
Rajendra Palace,
New Delhi- 110 008
E-mail: [email protected], [email protected]
Website: www.nitma.org
Textiles and Apparels
USEFUL
INFORMATION
For updated information, please visit www.ibef.org Textiles and Apparels 43
GLOSSARY
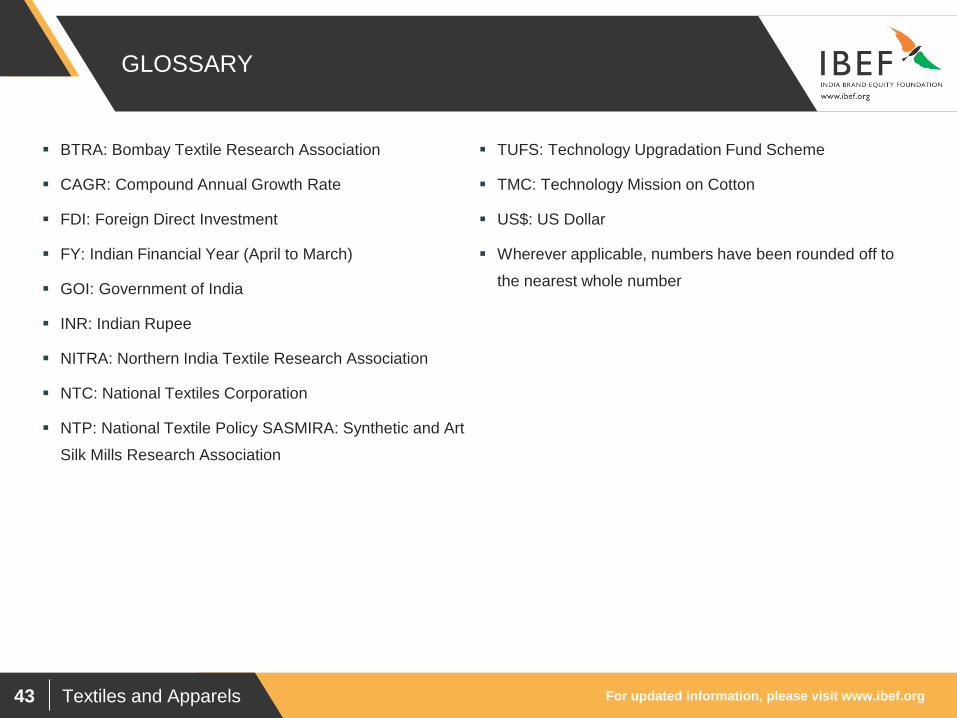
BTRA: Bombay Textile Research Association
CAGR: Compound Annual Growth Rate
FDI: Foreign Direct Investment
FY: Indian Financial Year (April to March)
GOI: Government of India
INR: Indian Rupee
NITRA: Northern India Textile Research Association
NTC: National Textiles Corporation
NTP: National Textile Policy SASMIRA: Synthetic and Art
Silk Mills Research Association
TUFS: Technology Upgradation Fund Scheme
TMC: Technology Mission on Cotton
US$: US Dollar
Wherever applicable, numbers have been rounded off to
the nearest whole number
For updated information, please visit www.ibef.org Textiles and Apparels 44
EXCHANGE RATES
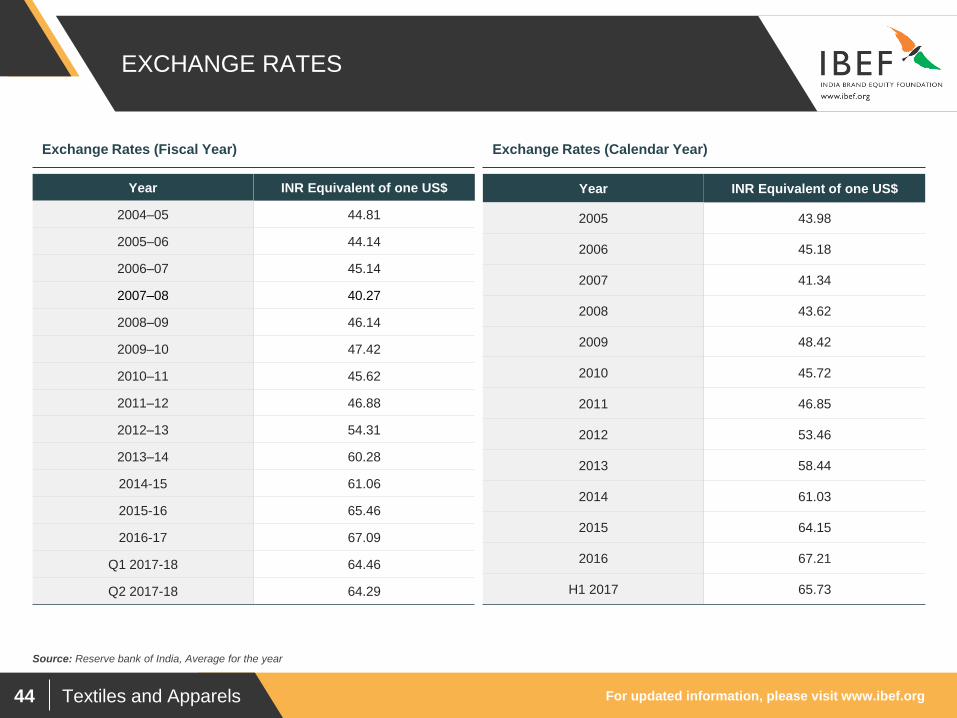
Year INR Equivalent of one US$
2004–05 44.81
2005–06 44.14
2006–07 45.14
2007–08 40.27
2008–09 46.14
2009–10 47.42
2010–11 45.62
2011–12 46.88
2012–13 54.31
2013–14 60.28
2014-15 61.06
2015-16 65.46
2016-17 67.09
Q1 2017-18 64.46
Q2 2017-18 64.29
Year INR Equivalent of one US$
2005 43.98
2006 45.18
2007 41.34
2008 43.62
2009 48.42
2010 45.72
2011 46.85
2012 53.46
2013 58.44
2014 61.03
2015 64.15
2016 67.21
H1 2017 65.73
Exchange Rates (Fiscal Year) Exchange Rates (Calendar Year)
Source: Reserve bank of India, Average for the year
For updated information, please visit www.ibef.org Textiles and Apparels 45
DISCLAIMER
India Brand Equity Foundation (IBEF) engaged Aranca to prepare this presentation and the same has been prepared by Aranca in consultation
with IBEF.
All rights reserved. All copyright in this presentation and related works is solely and exclusively owned by IBEF. The same may not be reproduced,
wholly or in part in any material form (including photocopying or storing it in any medium by electronic means and whether or not transiently or
incidentally to some other use of this presentation), modified or in any manner communicated to any third party except with the written approval
of IBEF.
This presentation is for information purposes only. While due care has been taken during the compilation of this presentation to ensure that the
information is accurate to the best of Aranca and IBEF’s knowledge and belief, the content is not to be construed in any manner whatsoever as a
substitute for professional advice.
Aranca and IBEF neither recommend nor endorse any specific products or services that may have been mentioned in this presentation and nor do
they assume any liability or responsibility for the outcome of decisions taken as a result of any reliance placed on this presentation.
Neither Aranca nor IBEF shall be liable for any direct or indirect damages that may arise due to any act or omission on the part of the user due to any
reliance placed or guidance taken from any portion of this presentation.