Embed Size (px)
Citation preview

TEXTILE MILLS LIMITED
BOARD OF DIRECTORS Mr. S.M. Idrees Allawala
Mr. S. M. Mansoor Allawala
Mr. Kamran Idrees Allawala
Mr. Naeem Idrees Allawala
Mr. Omair Idrees Allawala
Mr. Rizwan Idrees Allawala
Mr. Muhammad Israil
Mr. Muhammad Saeed
Mr. Rizwan Idrees Allawala
Mr. Muhammad Saeed
Mr. Muhammad Israil
Syed Shahid Sultan
M/s. Deloitte Yousuf Adil
Chartered Accountants
Mr.Mr.Mr. Muhammad
Kamran Idrees AllawalaRizwan Idrees Allawala
Saeed
- Chairman- Member- Member
- Chairman
- CEO
- Director
- Director
- Director
- Director
- Director
- Director
- Chairman
- Member
- Member
- Secretary
AUDIT COMMITTEE
Mr. Muhammad JawaidCHIEF FINANCIAL OFFICER
Syed Shahid SultanCOMPANY SECRETARY
AUDITORS
HUMAN RESOURCE &REMUNERATIONCOMMITTEE
National Bank of PakistanBank Alfalah LimitedHabib Metropolitan Bank Ltd.Soneri Bank LimitedSilk Bank Ltd.Meezan Bank Ltd.Bank of Punjab Ltd.BankIslami Pakistan Ltd.Bank Al Habib Ltd.Dubai Islamic Bank Pakistan Ltd.
6-C, Ismail Centre, 1st Floor,
Central Commercial Area,
Bahadurabad,
Karachi - 74800.
BANKERS
REGISTERED OFFICE
SHARES REGISTRAR
MILLS
M/S. NI Associates (Pvt) Ltd.
Kot Shah Mohammad,
Tehsil Nankana,
District Nankana,
Punjab.
KarachiFebruary 24, 2017
S.M. Idrees AllawalaChairman
for and on behalf of the Board
The Directors of your Company are pleased to present the condensed interimfinancial information of the Company for the half year ended December 31,2016 duly reviewed by the external auditors.
Sales during the period under review amounted to Rs. 929.318 million ascompared to Rs. 913.215 million during the corresponding period whichshows an increase of 1.76%. Finance cost amounted to Rs. 45.327 millionas compared to Rs. 45.734 million in the comparable period. Profit after taxworked out to Rs. 19.539 million during the period as compared to loss aftertax of Rs. 44.111 million in the corresponding period. Earnings per shareamounted to Rs. 1.08 as compared to loss per share of Rs. 2.44 in thecomparable half of last year.
The period under review has also been a tough one for the spinning sector.A number of spinning units had to close down due to persistent losses. Priceof raw cotton remained high during the period but the same trend was notwitnessed in the rate of yarn. As a result, margins remained meagre.However, by the grace of Allah, the management has been fortunate totimely procure the required raw material at low prices and successfullypulled your Company out of losses. This led to a green bottom-line for theperiod under review.
The challenges for the industry continued throughout the period such asheavy surcharges on electricity consumption and weakened demand forPakistani yarn in the export market especially in China. Continued supply ofRLNG and implementation of goals set out in the Textile Policy 2014-19 intrue spirit are likely to benefit the sector. Eligibility of spinning sector forLTFF scheme of the State Bank of Pakistan and the recent incentives by thePrime Minister for the textile sector such as Duty Drawback on export oftextile products and slashing of duties and taxes on import of machinery andraw material are promising. But, worsening law and order situation maydaunt the anticipated revival of the industry therefore, the government hasto take stern remedial action.
The Board wishes to place on record its gratitude for the valuable supportand confidence of the bankers, customers and suppliers and appreciates thecommendable services rendered by the employees.
Introduction
Scope of Review
Conclusion
Chartered Accountants
Engagement Partner:Nadeem Yousuf Adil
Dated: February 24, 2017Place: Karachi
We have reviewed the accompanying condensed interim balance sheet ofIDREES TEXTILE MILLS LIMITED (“the Company”) as at December 31, 2016,and the related condensed interim profit and loss account, condensed interimcash flow statement and condensed interim statement of changes in equitytogether with the notes forming part thereof for the six months then ended(here-in-after referred to as "condensed interim financial information").Management is responsible for the preparation and presentation of thiscondensed interim financial information in accordance with approved accountingstandards as applicable in Pakistan for interim financial reporting.Our responsibility is to express a conclusion on this condensed interim financialinformation based on our review. The figures for the quarter endedDecember 31, 2016 in the condensed interim profit & loss accounthave not been reviewed, and we do not express a conclusion on them.
We conducted our review in accordance with the International Standard onReview Engagements 2410, "Review of Interim Financial Information Performedby the Independent Auditor of the Entity”. A review of interim financialinformation consists of making inquiries, primarily of the persons responsible forfinancial and accounting matters, and applying analytical and other reviewprocedures. A review is substantially less in scope than an audit conducted inaccordance with International Standards on Auditing and consequently does notenable us to obtain assurance that we would become aware of all significantmatters that might be identified in an audit. Accordingly, we do not express anaudit opinion.
Based on our review, nothing has come to our attention that causes us tobelieve that the accompanying condensed interim financial information as of andfor the six months ended December 31, 2016 is not prepared, in all materialrespects, in accordance with approved accounting standards as applicablein Pakistan for condensed interim financial reporting.
CHIEF EXECUTIVE OFFICER DIRECTOR
The annexed notes 1 to 13 form an integral part of this condensed interim financial information.
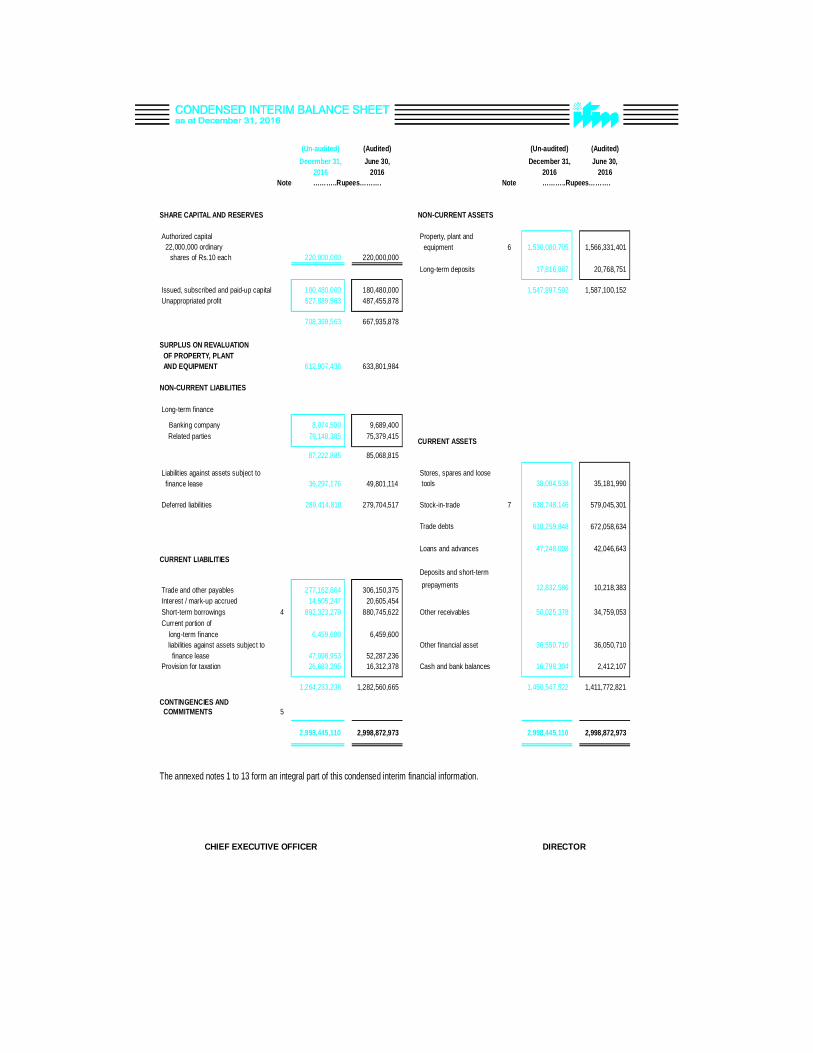
(Un-audited) (Audited) (Un-audited) (Audited)December 31, June 30, December 31, June 30,
2016 2016 2016 2016Note Note
SHARE CAPITAL AND RESERVES NON-CURRENT ASSETS
Authorized capital Property, plant and22,000,000 ordinary equipment 6 1,530,080,705 1,566,331,401
shares of Rs.10 each 220,000,000 220,000,000Long-term deposits 17,816,887 20,768,751
Issued, subscribed and paid-up capital 180,480,000 180,480,000 1,547,897,592 1,587,100,152Unappropriated profit 527,889,563 487,455,878
708,369,563 667,935,878
SURPLUS ON REVALUATIONOF PROPERTY, PLANTAND EQUIPMENT 612,907,438 633,801,984
NON-CURRENT LIABILITIES
Long-term finance
Banking company 8,074,500 9,689,400Related parties 79,148,385 75,379,415 CURRENT ASSETS
87,222,885 85,068,815
Stores, spares and loosefinance lease 36,297,176 49,801,114 tools 38,084,538 35,181,990
Deferred liabilities 289,414,810 279,704,517 Stock-in-trade 7 638,748,146 579,045,301
Trade debts 610,259,848 672,058,634
Loans and advances 47,248,008 42,046,643CURRENT LIABILITIES
Deposits and short-term
Trade and other payables 277,162,864 306,150,375 prepayments 12,832,586 10,218,383
Interest / mark-up accrued 14,505,247 20,605,454Short-term borrowings 4 892,323,279 880,745,622 Other receivables 50,025,378 34,759,053Current portion of
long-term finance 6,459,600 6,459,600liabilities against assets subject to Other financial asset 36,550,710 36,050,710
finance lease 47,098,953 52,287,236Provision for taxation 26,683,295 16,312,378 Cash and bank balances 16,798,304 2,412,107
1,264,233,238 1,282,560,665 1,450,547,522 1,411,772,821
CONTINGENCIES ANDCOMMITMENTS 5
2,998,445,110 2,998,872,973 2,998,445,110 2,998,872,973
………..Rupees……….………..Rupees……….
Liabilities against assets subject to
The annexed notes 1 to 13 form an integral part of this condensed interim financial information.
CHIEF EXECUTIVE OFFICER DIRECTOR
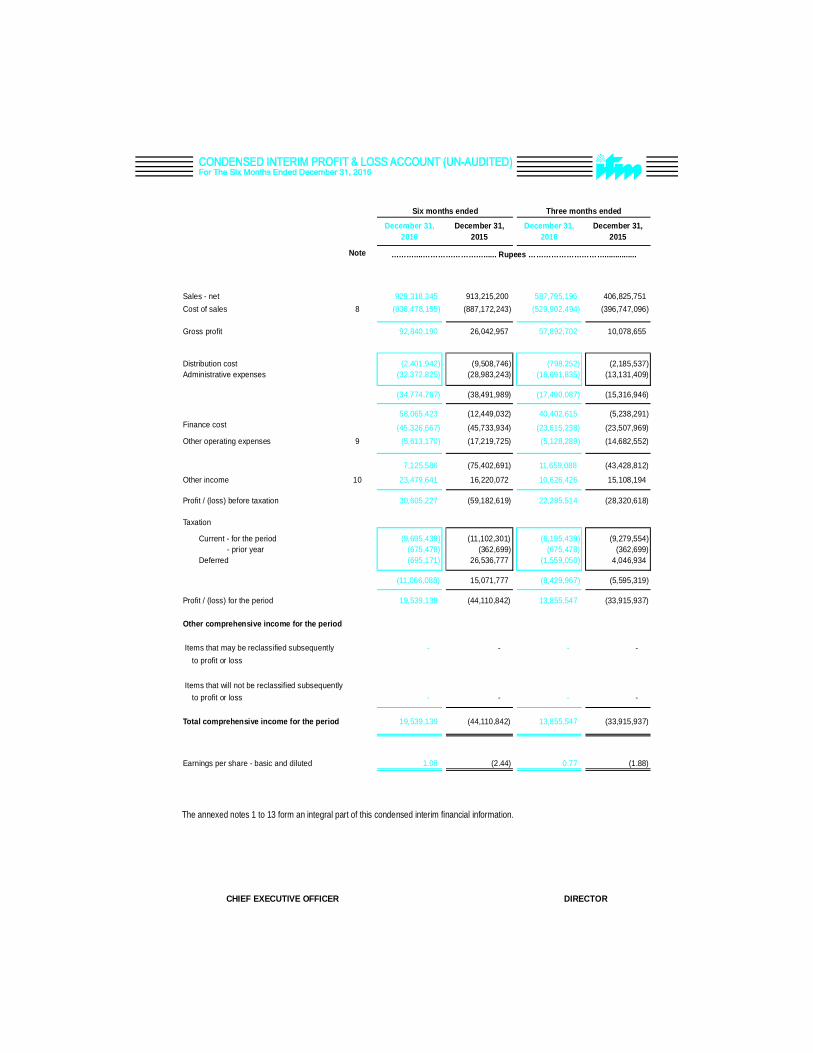
Note
Sales - net 929,318,345 913,215,200 587,795,196 406,825,751Cost of sales 8 (836,478,155) (887,172,243) (529,902,494) (396,747,096)
Gross profit 92,840,190 26,042,957 57,892,702 10,078,655
Distribution cost (2,401,942) (9,508,746) (798,252) (2,185,537)Administrative expenses (32,372,825) (28,983,243) (16,691,835) (13,131,409)
(34,774,767) (38,491,989) (17,490,087) (15,316,946)
58,065,423 (12,449,032) 40,402,615 (5,238,291)Finance cost (45,326,667) (45,733,934) (23,615,238) (23,507,969)Other operating expenses 9 (5,613,170) (17,219,725) (5,128,289) (14,682,552)
7,125,586 (75,402,691) 11,659,088 (43,428,812)
Other income 10 23,479,641 16,220,072 10,626,426 15,108,194
Profit / (loss) before taxation 30,605,227 (59,182,619) 22,285,514 (28,320,618)
Taxation
Current - for the period (9,695,439) (11,102,301) (6,195,439) (9,279,554)- prior year (675,478) (362,699) (675,478) (362,699)
Deferred (695,171) 26,536,777 (1,559,050) 4,046,934
(11,066,088) 15,071,777 (8,429,967) (5,595,319)
Profit / (loss) for the period 19,539,139 (44,110,842) 13,855,547 (33,915,937)
Other comprehensive income for the period
Items that may be reclassified subsequently - - - -to profit or loss
Items that will not be reclassified subsequentlyto profit or loss - - - -
Total comprehensive income for the period 19,539,139 (44,110,842) 13,855,547 (33,915,937)
Earnings per share - basic and diluted 1.08 (2.44) 0.77 (1.88)
………....……………………...... Rupees …………………………...............
Six months ended Three months ended
December 31,2016
December 31,2015
December 31,2016
December 31,2015
CHIEF EXECUTIVE OFFICER DIRECTOR
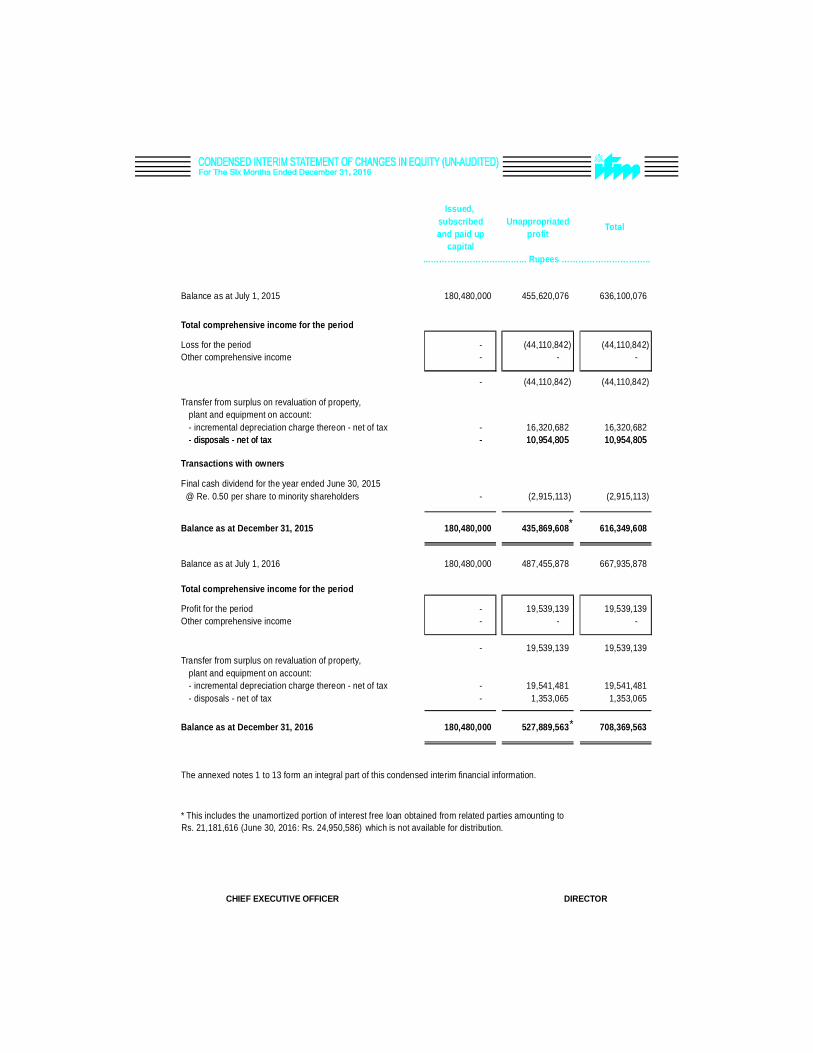
Balance as at July 1, 2015
Total comprehensive income for the period
Loss for the periodOther comprehensive income
Transfer from surplus on revaluation of property,plant and equipment on account:- incremental depreciation charge thereon - net of tax- disposals - net of tax- disposals - net of tax
Transactions with owners
Final cash dividend for the year ended June 30, 2015@ Re. 0.50 per share to minority shareholders
Balance as at December 31, 2015
Balance as at July 1, 2016
Total comprehensive income for the period
Profit for the periodOther comprehensive income
Transfer from surplus on revaluation of property,plant and equipment on account:- incremental depreciation charge thereon - net of tax- disposals - net of tax
Balance as at December 31, 2016
The annexed notes 1 to 13 form an integral part of this condensed interim financial information.
Issued,subscribed Unappropriatedand paid up profit
capital
180,480,000 455,620,076 636,100,076
- (44,110,842) (44,110,842)- - -
- (44,110,842) (44,110,842)
- 16,320,682 16,320,682- 10,954,805 10,954,805
...……………………..……... Rupees …………………………..
Total
- 10,954,805 10,954,805
- (2,915,113) (2,915,113)
180,480,000 435,869,608 616,349,608
180,480,000 487,455,878 667,935,878
- 19,539,139 19,539,139- - -
- 19,539,139 19,539,139
- 19,541,481 19,541,481- 1,353,065 1,353,065
180,480,000 527,889,563 708,369,563
*
*
* This includes the unamortized portion of interest free loan obtained from related parties amounting toRs. 21,181,616 (June 30, 2016: Rs. 24,950,586) which is not available for distribution.
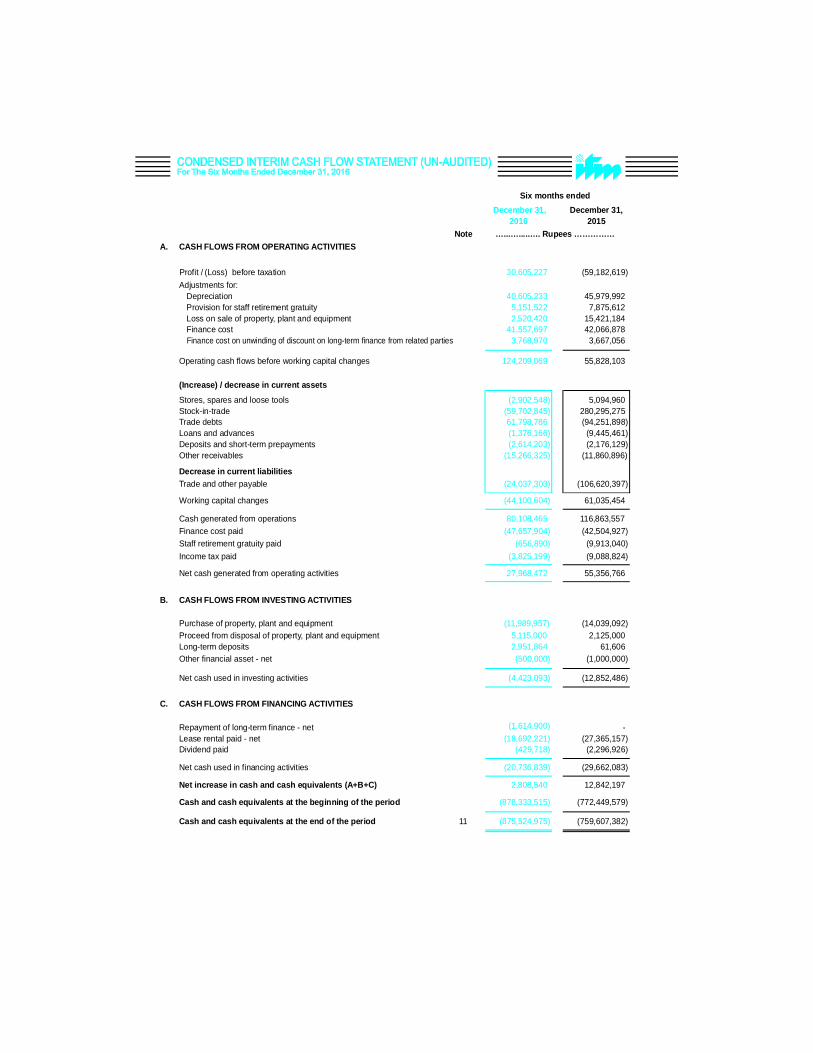
NoteA. CASH FLOWS FROM OPERATING ACTIVITIES
Profit / (Loss) before taxation 30,605,227 (59,182,619)Adjustments for:
Depreciation 40,605,233 45,979,992Provision for staff retirement gratuity 5,151,522 7,875,612Loss on sale of property, plant and equipment 2,520,420 15,421,184Finance cost 41,557,697 42,066,878Finance cost on unwinding of discount on long-term finance from related parties 3,768,970 3,667,056
Operating cash flows before working capital changes 124,209,069 55,828,103
(Increase) / decrease in current assets
Stores, spares and loose tools (2,902,548) 5,094,960Stock-in-trade (59,702,845) 280,295,275Trade debts 61,798,786 (94,251,898)Loans and advances (1,376,166) (9,445,461)Deposits and short-term prepayments (2,614,203) (2,176,129)Other receivables (15,266,325) (11,860,896)
Decrease in current liabilitiesTrade and other payable (24,037,303) (106,620,397)
Working capital changes (44,100,604) 61,035,454
Cash generated from operations 80,108,465 116,863,557Finance cost paid (47,657,904) (42,504,927)Staff retirement gratuity paid (656,890) (9,913,040)Income tax paid (3,825,199) (9,088,824)
Net cash generated from operating activities 27,968,472 55,356,766
B. CASH FLOWS FROM INVESTING ACTIVITIES
Purchase of property, plant and equipment (11,989,957) (14,039,092)Proceed from disposal of property, plant and equipment 5,115,000 2,125,000Long-term deposits 2,951,864 61,606Other financial asset - net (500,000) (1,000,000)
Net cash used in investing activities (4,423,093) (12,852,486)
C. CASH FLOWS FROM FINANCING ACTIVITIES
Repayment of long-term finance - net (1,614,900) -Lease rental paid - net (18,692,221) (27,365,157)Dividend paid (429,718) (2,296,926)
Net cash used in financing activities (20,736,839) (29,662,083)
Net increase in cash and cash equivalents (A+B+C) 2,808,540 12,842,197
Cash and cash equivalents at the beginning of the period (878,333,515) (772,449,579)
Cash and cash equivalents at the end of the period 11 (875,524,975) (759,607,382)
Six months endedDecember 31,
2016December 31,
2015…...….....…. Rupees ……………
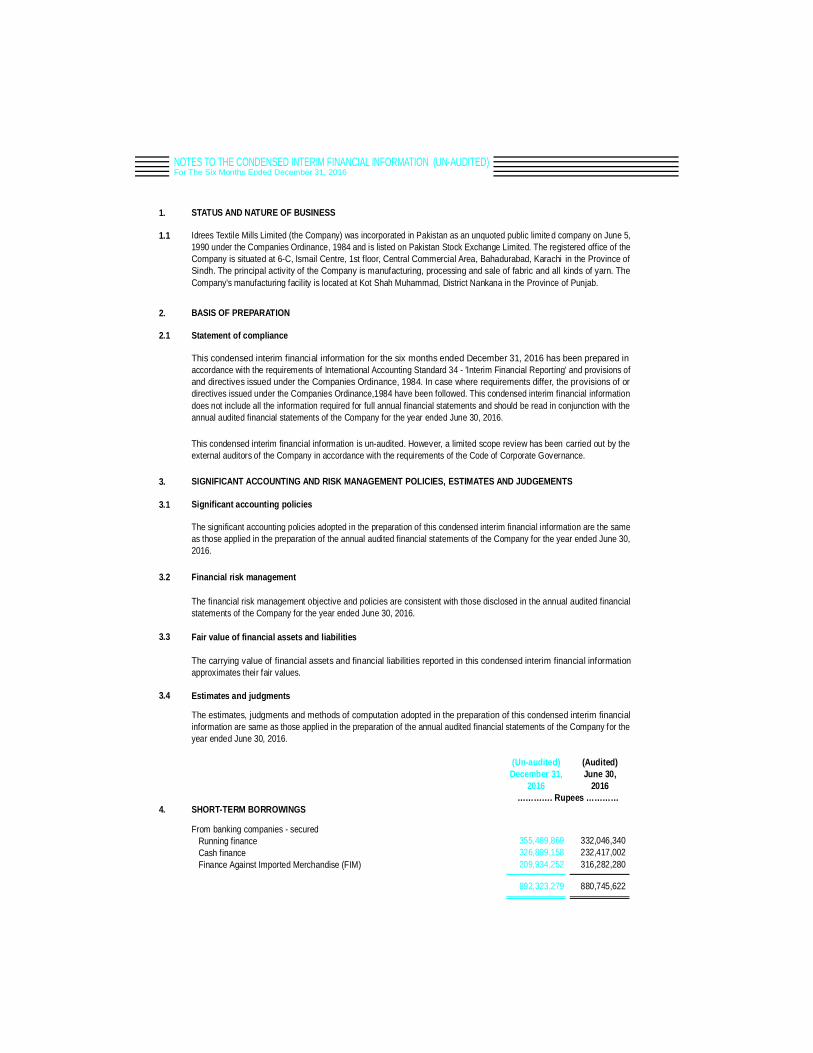
1. STATUS AND NATURE OF BUSINESS
1.1
2. BASIS OF PREPARATION
2.1 Statement of compliance
3. SIGNIFICANT ACCOUNTING AND RISK MANAGEMENT POLICIES, ESTIMATES AND JUDGEMENTS
3.1 Significant accounting policies
3.2 Financial risk management
3.3 Fair value of financial assets and liabilities
3.4 Estimates and judgments
4. SHORT-TERM BORROWINGS
From banking companies - securedRunning financeCash financeFinance Against Imported Merchandise (FIM)
Idrees Textile Mills Limited (the Company) was incorporated in Pakistan as an unquoted public limite d company on June 5,1990 under the Companies Ordinance, 1984 and is listed on Pakistan Stock Exchange Limited. The registered office of theCompany is situated at 6-C, Ismail Centre, 1st floor, Central Commercial Area, Bahadurabad, Karachi in the Province ofSindh. The principal activity of the Company is manufacturing, processing and sale of fabric and all kinds of yarn. TheCompany's manufacturing facility is located at Kot Shah Muhammad, District Nankana in the Province of Punjab.
This condensed interim financial information for the six months ended December 31, 2016 has been prepared inaccordance with the requirements of International Accounting Standard 34 - 'Interim Financial Reporting' and provisions ofand directives issued under the Companies Ordinance, 1984. In case where requirements differ, the provisions of ordirectives issued under the Companies Ordinance,1984 have been followed. This condensed interim financial informationdoes not include all the information required for full annual financial statements and should be read in conjunction with theannual audited financial statements of the Company for the year ended June 30, 2016.
This condensed interim financial information is un-audited. However, a limited scope review has been carried out by theexternal auditors of the Company in accordance with the requirements of the Code of Corporate Governance.
The significant accounting policies adopted in the preparation of this condensed interim financial information are the sameas those applied in the preparation of the annual audited financial statements of the Company for the year ended June 30,2016.
The carrying value of financial assets and financial liabilities reported in this condensed interim financial informationapproximates their fair values.
The estimates, judgments and methods of computation adopted in the preparation of this condensed interim financialinformation are same as those applied in the preparation of the annual audited financial statements of the Company for theyear ended June 30, 2016.
The financial risk management objective and policies are consistent with those disclosed in the annual audited financialstatements of the Company for the year ended June 30, 2016.
(Un-audited) (Audited)December 31, June 30,
2016 2016
355,489,869 332,046,340326,899,158 232,417,002209,934,252 316,282,280
892,323,279 880,745,622
…………. Rupees …………
NOTES TO THE CONDENSED INTERIM FINANCIAL INFORMATION (UN-AUDITED)For The Six Months Ended December 31, 2016
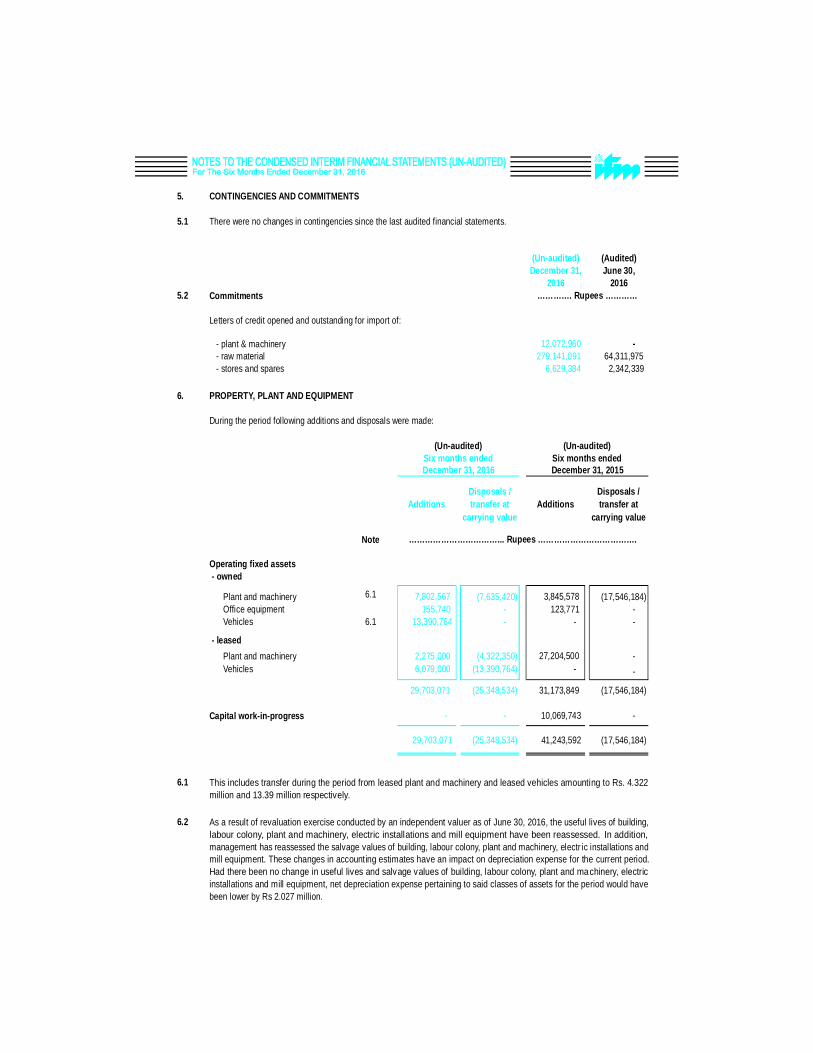
5.
5.1 There were no changes in contingencies since the last audited financial statements.
(Un-audited) (Audited)December 31, June 30,
2016 20165.2 Commitments
Letters of credit opened and outstanding for import of:
- plant & machinery 12,072,960 -- raw material 279,141,091 64,311,975- stores and spares 6,629,384 2,342,339
6. PROPERTY, PLANT AND EQUIPMENT
Note
Operating fixed assets- owned
Plant and machinery 6.1 7,802,567 (7,635,420) 3,845,578 (17,546,184)Office equipment 155,740 - 123,771 -Vehicles 6.1 13,390,764 - - -
- leasedPlant and machinery 2,275,000 (4,322,350) 27,204,500 -Vehicles 6,079,000 (13,390,764) - -
29,703,071 (25,348,534) 31,173,849 (17,546,184)
Capital work-in-progress - - 10,069,743 -
29,703,071 (25,348,534) 41,243,592 (17,546,184)
6.1
6.2
This includes transfer during the period from leased plant and machinery and leased vehicles amounting to Rs. 4.322million and 13.39 million respectively.
As a result of revaluation exercise conducted by an independent valuer as of June 30, 2016, the useful lives of building,labour colony, plant and machinery, electric installations and mill equipment have been reassessed. In addition,management has reassessed the salvage values of building, labour colony, plant and machinery, electr ic installations andmill equipment. These changes in accounting estimates have an impact on depreciation expense for the current period.Had there been no change in useful lives and salvage values of building, labour colony, plant and machinery, electricinstallations and mill equipment, net depreciation expense pertaining to said classes of assets for the period would havebeen lower by Rs 2.027 million.
Six months ended
……………………………... Rupees ……………………………….
December 31, 2015
During the period following additions and disposals were made:
Disposals /transfer at
carrying valueAdditions
Disposals /transfer at
carrying value
(Un-audited)
December 31, 2016Six months ended
(Un-audited)
Additions
…………. Rupees …………
CONTINGENCIES AND COMMITMENTS
(Un-audited) (Audited)December 31, June 30,
2016 2016
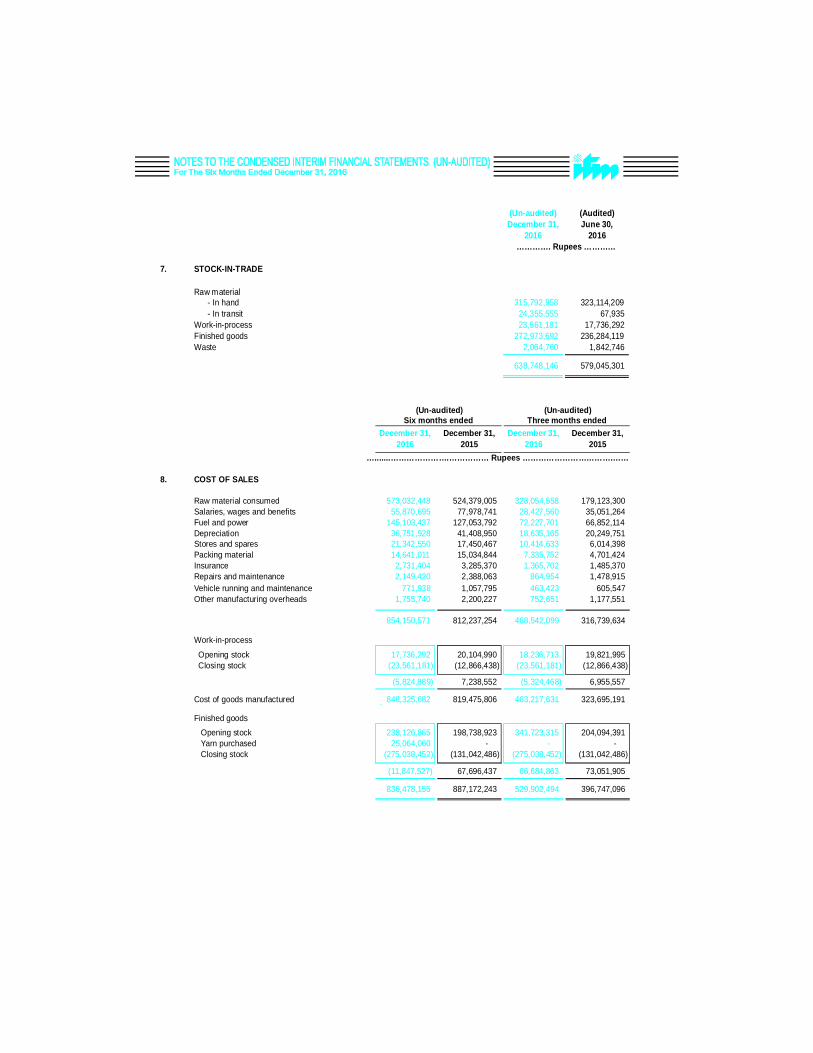
7. STOCK-IN-TRADE
Raw material- In hand 315,792,958 323,114,209- In transit 24,355,555 67,935
Work-in-process 23,561,181 17,736,292Finished goods 272,973,692 236,284,119Waste 2,064,760 1,842,746
638,748,146 579,045,301
…………. Rupees …………
8. COST OF SALES
Raw material consumed 573,032,448 524,379,005 328,054,558 179,123,300Salaries, wages and benefits 55,870,695 77,978,741 28,427,560 35,051,264Fuel and power 145,103,437 127,053,792 72,227,701 66,852,114Depreciation 36,751,928 41,408,950 18,635,165 20,249,751Stores and spares 21,342,550 17,450,467 10,414,633 6,014,398Packing material 14,641,011 15,034,844 7,335,752 4,701,424Insurance 2,731,404 3,285,370 1,365,702 1,485,370Repairs and maintenance 2,149,420 2,388,063 864,954 1,478,915Vehicle running and maintenance 771,938 1,057,795 463,423 605,547Other manufacturing overheads 1,755,740 2,200,227 752,651 1,177,551
854,150,571 812,237,254 468,542,099 316,739,634
Work-in-process
Opening stock 17,736,292 20,104,990 18,236,713 19,821,995Closing stock (23,561,181) (12,866,438) (23,561,181) (12,866,438)
(5,824,889) 7,238,552 (5,324,468) 6,955,557
Cost of goods manufactured 848,325,682 819,475,806 463,217,631 323,695,191`
Finished goods
Opening stock 238,126,865 198,738,923 341,723,315 204,094,391Yarn purchased 25,064,060 - - -Closing stock (275,038,452) (131,042,486) (275,038,452) (131,042,486)
(11,847,527) 67,696,437 66,684,863 73,051,905
836,478,155 887,172,243 529,902,494 396,747,096
….......………………….…………… Rupees …………………………….……
December 31,2016
(Un-audited)
December 31,2015
Six months endedDecember 31,
2015December 31,
2016
(Un-audited)Three months ended
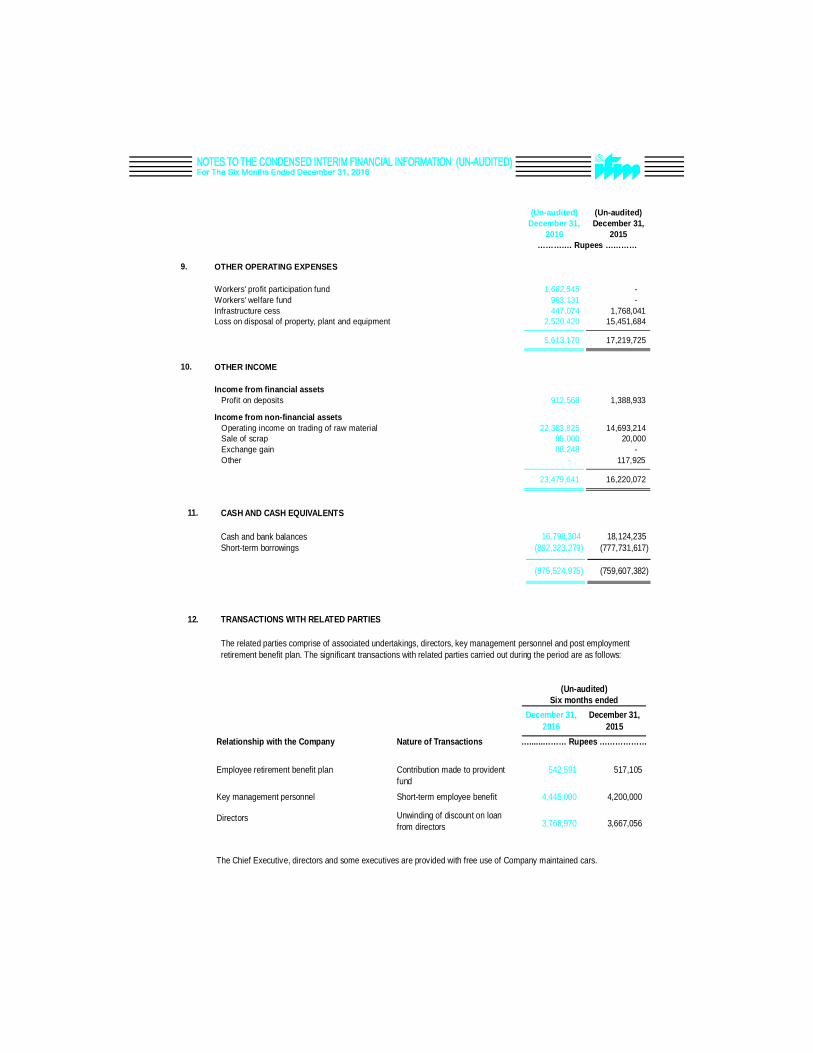
10. OTHER INCOME
Income from financial assetsProfit on deposits 912,568 1,388,933
Income from non-financial assetsOperating income on trading of raw material 22,383,825 14,693,214Sale of scrap 95,000 20,000Exchange gain 88,248 -Other - 117,925
23,479,641 16,220,072
(Un-audited) (Un-audited)December 31, December 31,
2016 2015
9. OTHER OPERATING EXPENSES
Workers' profit participation fund 1,662,545 -Workers' welfare fund 983,131 -Infrastructure cess 447,074 1,768,041Loss on disposal of property, plant and equipment 2,520,420 15,451,684
5,613,170 17,219,725
…………. Rupees …………
11. CASH AND CASH EQUIVALENTS
Cash and bank balances 16,798,304 18,124,235Short-term borrowings (892,323,279) (777,731,617)
(875,524,975) (759,607,382)
12. TRANSACTIONS WITH RELATED PARTIES
The related parties comprise of associated undertakings, directors, key management personnel and post employmentretirement benefit plan. The significant transactions with related parties carried out during the period are as follows:
Relationship with the Company Nature of Transactions
542,591 517,105
Key management personnel Short-term employee benefit 4,445,000 4,200,000
Directors
Contribution made to providentfund
(Un-audited)
December 31,2016
The Chief Executive, directors and some executives are provided with free use of Company maintained cars.
December 31,2015
Unwinding of discount on loanfrom directors 3,667,0563,768,970
Employee retirement benefit plan
…......……… Rupees ………………
Six months ended
CHIEF EXECUTIVE OFFICER DIRECTOR
13. DATE OF AUTHORIZATION FOR ISSUEThis condensed interim financial information was authorized for issue on February 24, 2017 by the Board of Directors of theCompany.