Embed Size (px)
Citation preview
Center for Transportation ResearchThe University of Texas at Austin
3208 Red RiverAustin, TX 78705
Phone: (512) 232-3100
To order reports: (512) 232-3126 (CTR Library)Fax: (512) 232-3088 (CTR Library)E-mail: [email protected]
Web site: www.utexas.edu/research/ctrCTR Library Web site: http://library.ctr.utexas.edu/index.htm
Texas Truck Data Collection Guidebook
Jolanda ProzziCarleton WongRob Harrison
0-4713-P4
October 2004
Center for Transportation ResearchThe University of Texas at Austin
www.utexas.edu/research/ctr/pdf_reports/0_4713_P4.pdf
2
Performing Organization:Center for Transportation Research,The University of Texas at Austin3208 Red River, Suite 200Austin, Texas 78705-2650
Sponsoring Organization:Texas Department of Transportation,Research and Technology Implementation OfficeP.O. Box 5080Austin, Texas 78763-5080
Project conducted in cooperation with the Texas Department of Transportation and the Federal Highway Commission.
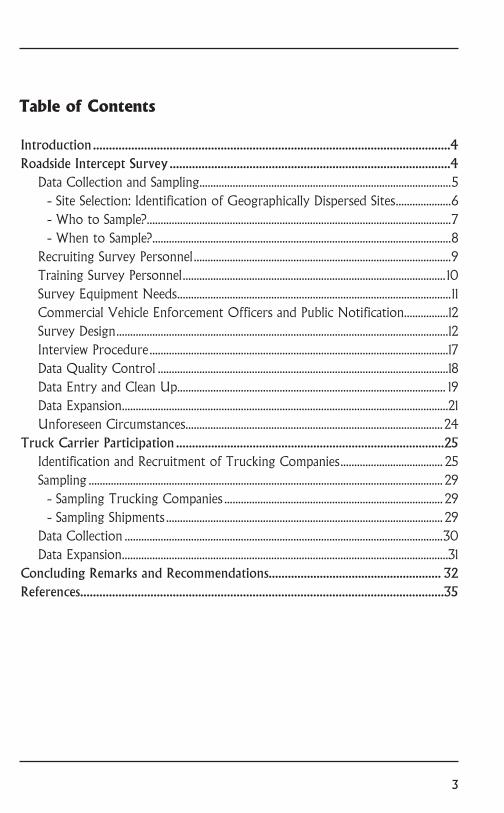
Abstract: In August 2003, the Texas Department of Trans-portation (TxDOT) contracted with the Center for Transportation Research at The University of Texas at Austin to recommend a robust meth-odology to TxDOT planners for collecting and maintaining inter-county and interstate truck travel data in a format required for the Statewide Analysis Model (SAM). This guidebook discusses two data collection approaches — roadside intercept surveys and truck carrier participation — that showed the most promise of providing TxDOT with statistically reliable and verifi-able truck travel data over the next three to five years.
Keywords:Truck travel data, statewide planning, roadside intercept surveys, truck car-rier participation.
No. of Pages:
36
35
References
Bureau of Transportation Statistics. 1996. "How National Transportation Analysis Regions (NTARs) Were Defined for CFS," February 19.
Available at: http://www.bts.gov/programs/commodity_flow_survey/Casavant, K.L., W.R. Gillis, D. Blankenship, and C. Howard, Jr. 1995.
"Survey Methodology for Collecting Freight Truck and Destination Data." Transportation Research Record 1477, Washington DC.
Federal Highway Administration. 1996. "Quick Response Freight Manual: Final Report." Prepared by Cambridge Systematics, Inc., Comsis Corporation, University of Wisconsin, Milwaukee, September.
Gillis, W.R. 1994. "Washington State Freight Truck Origin and Destination Study: Methods, Procedures, and Data Dictionary." EWITS Research Report Number 3, Washington.
Jessup, E., K.L. Casavant, and C.T. Lawson. 2004. "Truck Trip Data Collection Methods: Final Report." Pullman, Washington: Department of Agricultural and Resource Economics at the Washington State University, Report Number SPR 343, February.
National Research Council of the National Academies. 2003. "Measuring Personal Travel and Goods Movement: A Review of the Bureau of Transportation Statistics Surveys." Transportation Research Board Special Report 277, Washington DC.
Strategic Freight Transportation Analysis. 2002-2003. Training Packet for Origin and Destination Survey Volunteers.
Texas Department of Transportation. 2003. "External Station Travel Surveys." Specification No.: TxDOT 968-85-20*, Texas Department of Transportation: General Services Division, Revised: December.
Transportation Research Board. 2003. "Special Report 276: A Concept for a National Freight Data Program," Prepared by the Committee on Freight Transportation Data: A Framework for Development, Washington, D.C.
34 3
Table of Contents
Introduction ................................................................................................................4Roadside Intercept Survey ........................................................................................4
Data Collection and Sampling...........................................................................................5- Site Selection: Identification of Geographically Dispersed Sites ....................6- Who to Sample? ..............................................................................................................7- When to Sample? ............................................................................................................8
Recruiting Survey Personnel .............................................................................................9Training Survey Personnel ............................................................................................... 10Survey Equipment Needs ...................................................................................................11Commercial Vehicle Enforcement Officers and Public Notification ................12Survey Design ........................................................................................................................12Interview Procedure ............................................................................................................17Data Quality Control .........................................................................................................18Data Entry and Clean Up................................................................................................. 19Data Expansion ......................................................................................................................21Unforeseen Circumstances ............................................................................................. 24
Truck Carrier Participation ....................................................................................25Identification and Recruitment of Trucking Companies ..................................... 25Sampling ................................................................................................................................ 29
- Sampling Trucking Companies ............................................................................... 29- Sampling Shipments .................................................................................................... 29
Data Collection ...................................................................................................................30Data Expansion ......................................................................................................................31
Concluding Remarks and Recommendations ...................................................... 32References ..................................................................................................................35
4
IntroductionPrimary freight data collection efforts involve
collecting truck travel data directly from the freight community (i.e., shippers, carriers, receivers, and freight forwarders) through surveys, including roadside intercept surveys, mail-out/mail-back questionnaires, combined telephone-mail-out/mail-back questionnaires or telephone interviews. Done correctly, these survey methods are, in gen-eral, the most reliable and accurate methods of ob-taining truck travel data for statewide freight plan-ning programs. This guidebook discusses two data collection approaches - roadside intercept surveys and truck carrier participation - that showed the most promise of providing TxDOT with statistical-ly reliable and verifiable truck travel data is to be used in the freight model of the Statewide Analy-sis Model (SAM). For a detailed discussion of the short term and intermediate long term options for collecting truck travel data available to TxDOT, the reader is referred to Research Report 0-4713-1 entitled "Securing Truck Data for Texas."
Few states have relied on collecting primary truck travel data for statewide modeling or plan-ning, partly because this can be costly and time-consuming at the state level. The exception has been Washington State's Eastern Washington Intermodal Transportation Study (EWITS) and the subsequent Strategic Freight Transportation Analy-sis (SFTA) study. The objective of both these stud-ies has been to provide Washington with useful freight movement data and statistically reliable in-formation on truck characteristics and commodity
RoadsideInterceptSurveys
33
tem performance, the safety of the road network, and the funding of the state-maintained road in-frastructure.
32
Collecting primary truck travel data through either of these two approaches will inevitably be more costly than purchasing the Reebie TRAN-SEARCH database or estimating county-level truck travel data from publicly available data sources, such as the CFS. However, done correctly, both these approaches will provide TxDOT with more reliable and robust truck travel data for statewide planning.
It is estimated that surveying 96 sites one day per week four times per year would cost TxDOT in excess of $5 million using the bid prices of survey-ing companies for 2004 as the benchmark. Since there is no precedent for collecting statewide truck travel data through a data sharing partnership with trucking companies, it is more difficult to estimate the costs associated with this approach. It is, how-ever, foreseeable that this will entail a large upfront cost arising from the recruitment of trucking com-panies, the development of software to minimize the burden on trucking companies in submitting the data, and finally labor costs associated with compiling and managing the database. The recur-ring annual costs would, however, be limited to liaising with the companies, compiling and man-aging the database. Of the two approaches it is thus anticipated that a truck data sharing partner-ship with trucking companies will be more cost-effective than the truck intercept survey approach. Although still costly, this approach is worth further consideration by TxDOT.
Ultimately, higher truck travel data collection costs should be weighted against the benefits of reliable truck travel data that can be used to deter-mine the impacts of truck traffic on mobility, sys-
Concluding Remarks and Recommendations
5
flows for all major Washington highways through an extensive program of statewide origin-destina-tion truck intercept surveys of truck drivers. Valu-able lessons learned and innovative practices em-ployed in both these studies are highlighted in text boxes throughout this section of the guidebook to illustrate or emphasize certain aspects of this ap-proach.
Finally, it has to be mentioned that TxDOT has detailed specifications for conducting external sta-tion surveys (see Specification No.: TxDOT 968-85-20*). The external station survey specification "describes service to conduct interviews, surveys, geocode and report data, provide traffic control and automatic vehicle classification counts in the study area..." (TxDOT, 2003). The objective of this section of the document is thus not to replace, contradict or replicate the specifications used by TxDOT. Rather it is anticipated that the informa-tion provided in this section of the guidebook can be used as a framework to modify the specifica-tions in the future when a decision is made to col-lect truck travel data for the SAM through roadside intercept surveys.
Data Collection and SamplingSince it is impossible to intercept every single
truck that travels to, from, in or through Texas, inferences or predictions about the population of trucks are typically made from an appropriately selected sample. Sampling results in savings in re-sources, money, and time. Incorrect sampling pro-cedures or human judgment may, however, cause bias and result in the collection of unreliable data (Snedecor, 1989). The objective of this section is
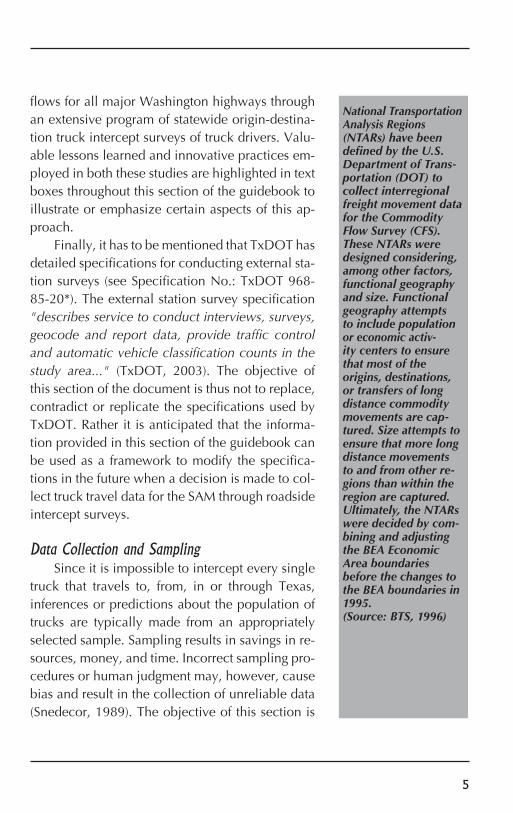
National Transportation Analysis Regions (NTARs) have been defined by the U.S. Department of Trans-portation (DOT) to collect interregional freight movement data for the Commodity Flow Survey (CFS). These NTARs were designed considering, among other factors, functional geography and size. Functional geography attempts to include population or economic activ-ity centers to ensure that most of the origins, destinations, or transfers of long distance commodity movements are cap-tured. Size attempts to ensure that more long distance movements to and from other re-gions than within the region are captured. Ultimately, the NTARs were decided by com-bining and adjusting the BEA Economic Area boundaries before the changes to the BEA boundaries in 1995.(Source: BTS, 1996)
6
to provide insight into answering three questions:
•Where to sample? In other words, how to select appropriate sites and roadways where roadside intercept surveys can be conducted. • Who to sample? In other words, which trucks at the sites. • When to sample? In other words, which days of the week and seasons to account day-of- the-week and seasonal variation.
Site Selection: Identification of Geographically Dispersed SitesThe optimal sample size is not only influ-
enced by the level of reliability that is required, but also the total cost of implementing the survey. The latter would be largely a function of the de-gree of geographical coverage and the number of days surveyed. In identifying the physical roadway sections for the roadside intercept surveys the fol-lowing should thus be considered:
• Texas's eight National Transportation Analy - sis Regions (NTARs) to ensure geographical coverage; • Non-urban roadway sections to capture county-to-county movements; • Roadway functional system to capture truck movements on all major road classes, and • Traffic volume and vehicle classification to ensure a significant volume of daily truck traffic traverses the roadway section.
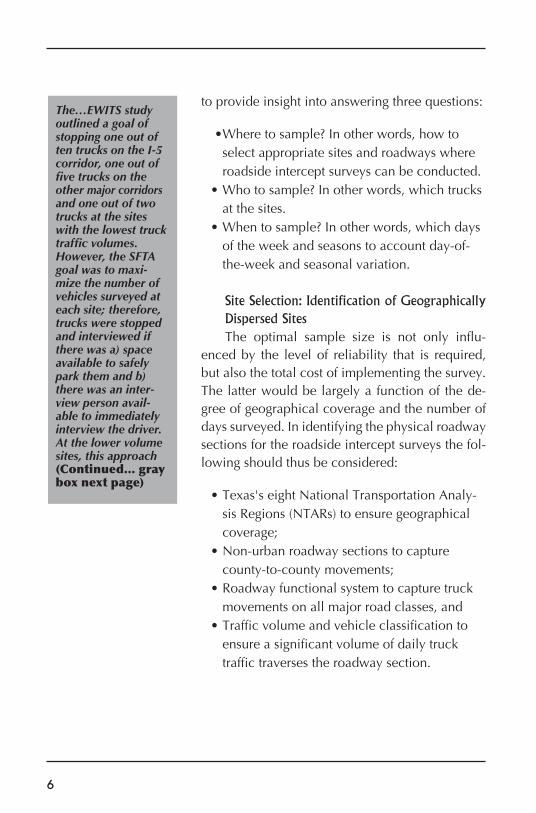
The…EWITS study outlined a goal of stopping one out of ten trucks on the I-5 corridor, one out of five trucks on the other major corridors and one out of two trucks at the sites with the lowest truck traffic volumes. However, the SFTA goal was to maxi-mize the number of vehicles surveyed at each site; therefore, trucks were stopped and interviewed if there was a) space available to safely park them and b) there was an inter-view person avail-able to immediately interview the driver. At the lower volume sites, this approach(Continued... gray box next page)
31
cially the smaller companies, is minimized. Most of the trucking companies, however, agreed that submitting the data electronically will enhance their participation. For the larger trucking com-panies with computerized systems, it will be rela-tively easy to run queries and provide TxDOT with the data needed as the requested data is readily available in their systems.
Data ExpansionThe data expansion procedure would be
similar as for the roadside intercept surveys. The sample data obtained can be expanded to reflect the truck travel characteristics for the population of trucking companies by using the inverse of the sampling rate. For example if 10 percent of the trucking companies of a particular size were surveyed the expansion factor would be 100/10, which equals 10. This first weight is used to ex-pand the sample data for each season to reflect the characteristics of the population for that week and season.
The objective of the second weight is to deter-mine the characteristics of the population across seasons. In other words, to determine the char-acteristics of the Average Annual Weekly Truck Trips. This is achieved by calculating the weighted average factors across the four seasons and apply-ing this factor to the expanded sample data (see Data Expansion, page 21).
30
destination, and whether it is a truckload or less-than-truckload shipment for all their shipments in an assigned week four times a year. For shipments that include more than one commodity, the truck-ing company will be asked to report the major commodity in terms of shipment weight.
Data CollectionTo minimize the data reporting cost burden
imposed on participating trucking companies, electronic reporting options need to be explored. The 2002 Economic Census developed survey software that allowed for the importation of busi-ness data directly from company spreadsheets, thus reducing the burden on respondents in an effort to encourage participation in the survey (National Research Council of the National Acad-emies, 2003). Electronic reporting will also reduce the cost of data entry for TxDOT and reduce re-porting errors.
Since some larger trucking companies already use the internet to transmit manifest information among the shipper, carrier, and truck driver it is assumed that the internet can also be used to share relevant data with TxDOT. Options to transmit this information securely using Secure Socket Layers (SSL) and encryption are available.
During the discussions with the eight trucking company representatives it became apparent that it will be more difficult for smaller trucking com-panies to use electronic reporting options since their systems are not as sophisticated. To ensure participation, every effort should thus be made to ensure that the labor cost burden imposed on trucking companies in compiling the data, espe-
“For the 2002 CFS, each establishment was as-signed a 1-week reporting period every quarter, for a total of 4 weeks in the calendar year. By assign-ing different reporting periods to different es-tablishments, the sample covered all 52 weeks of the year” (National Research Council of the National Academies, 2003).
7
To ensure geographical coverage of the state of Texas and to account for variations in the char-acteristics of trucks that use different roadways, it is recommended that a total of 96 sites be identified: three sites per major highway type (i.e., interstate, state highway, Texas highway, and farm-to-mar-ket/ranch-to-market) in each of the eight NTARs in Texas. In selecting the location of the survey stations, care should be taken to ensure that a sig-nificant proportion of the inter-urban freight trips can be captured in an average week.
The vendors should visit each of the roadway sections to determine an appropriate site where surveys can be conducted, i.e., weigh stations, truck rest stops, etc. Attention should be paid to existing roadway conditions, sight distances, pre-vailing vehicle speeds, and the presence of shoul-ders and auxiliary lanes. After determining the fea-sibility of the sites as interview sites, it is important to obtain the required permission for collecting data at these sites. The necessary permits to con-duct surveys at public right-of-way locations can be obtained from TxDOT districts having jurisdic-tion over the roadways at each station site. Finally, Traffic Control Plans should be prepared, detailing the existing roadway geometry, the types of traffic control devices that will be used, and areas of ref-uge for the interviewers at roadside locations.
Who to Sample?Although it seems reasonable to follow a sys-
tematic sampling approach where every nth ve-hicle is sampled, the objective should be to inter-view as many trucks as possible given available space and an interviewer to administer the survey.
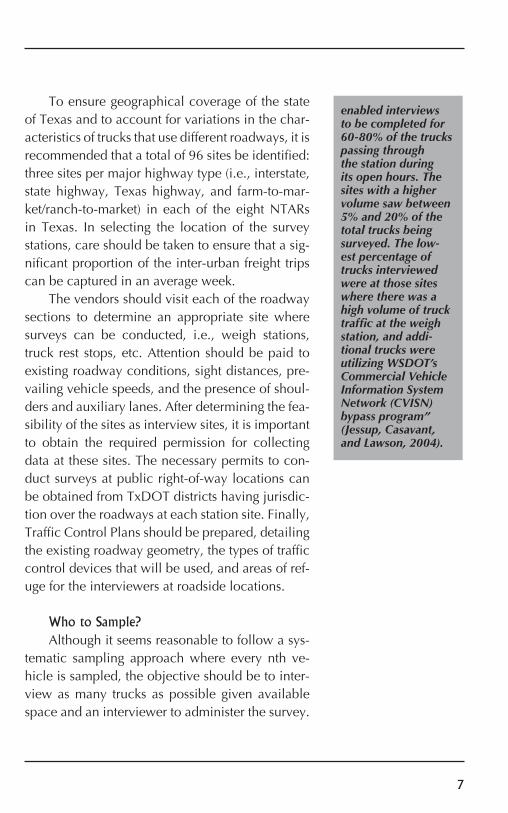
enabled interviews to be completed for 60-80% of the trucks passing through the station during its open hours. The sites with a higher volume saw between 5% and 20% of the total trucks being surveyed. The low-est percentage of trucks interviewed were at those sites where there was a high volume of truck traffic at the weigh station, and addi-tional trucks were utilizing WSDOT’s Commercial Vehicle Information System Network (CVISN) bypass program” (Jessup, Casavant, and Lawson, 2004).
8
Targets can be set, for example to have an objec-tive of surveying 10 percent of all trucks on In-terstate facilities, 5 percent of all trucks on major corridors (i.e., U.S. highways and state highways), and 50 percent of all trucks at sites with low truck traffic volumes.
When to Sample?To account for seasonal variation, day-of-
the week variation, and time-of-day variation, it is recommended that roadside intercept surveys be conducted at a minimum every season (four times a year) ideally, over a one week period for 24 hours per day at each site. Using the bid prices by surveying companies for 2004 as a guideline it is, however, foreseen that the costs of conduct-ing roadside intercept surveys seven days a week for 24 hours each day will be prohibitive. The op-tion thus exists to collect truck data on fewer days. Wednesdays are typically chosen to collect truck travel data, because truck flows tend to be higher/lower towards the beginning and end of the week. Most holidays or observances of holidays also typically occur on Mondays or Fridays. It is, how-ever, strongly recommended that intercept surveys be conducted at a minimum on one weekday and one weekend day to account for day of the week variations as truck flows are typically lower on the weekends than on weekdays.
Given the number of sites proposed for Tex-as (i.e., 96 sites), TxDOT is advised to schedule the seasonal surveys over a two month period. In scheduling the surveys, considerable care should also be taken to reduce the probability of survey-ing the same flow of trucks at more than one site.
The truck roadside intercept surveys conducted by Washington State University were conducted at weigh stations and ports of entry (Casavant, Gil-lis, Blankenship, and Howard, Jr. 1995).
29
fy and support needed freight investments, and (d) share examples of best practices from other groups in other states (Freight Stakeholders National Net-work, nd).
SamplingSampling Trucking CompaniesFor data collected from a sample, sample size
is a key determinant of data quality and reliability, but also of cost. Statistical formulas exist to de-termine the number of trucking companies that have to participate in a data sharing arrangement with TxDOT to ensure a statistically representative sample (see Text box). It is suggested that a ran-dom sample of trucking companies are selected and approached to participate in the data sharing initiative. Once the sampled list of trucking com-panies has been determined, TxDOT should in-volve, among others, the TMTA and Metropolitan Planning Organizations with freight committees to identify the appropriate contact person in each company.
According to the TxDOT Motor Carrier Regis-tration Database, a large number of trucking com-panies in Texas (approximately 41 percent) have only a single truck insured. It is foreseen that these smaller companies will be particularly challenging to involve in a data sharing relationship, because the owner is frequently the driver of the truck.
Sampling ShipmentsSimilar to the approach adopted by the Com-
modity Flow Survey, it is recommended that the trucking companies are asked to provide TxDOT with data on the value, weight, commodity, origin,
Determiningthe Sample Size
The following statistical formula can be used to calculate the appropriate sample size:
Where,n = Number of trucking companies to be included in the sampleZ = Critical value corresponding to a specified confidence levelE = Margin of error
�
��� �������
��� ∝
�∝��
28
ing order of number of times mentioned:
• no information of the company will be included in the aggregate database that is compiled and used by TxDOT; • the data will not be used for law enforcement or litigation against the company; • the Texas Motor Transportation Association (TMTA) will be involved to protect the interests of those that participate; • no severe cost burden will be imposed on the trucking company in compiling the data; • TxDOT will demonstrate to the trucking companies that the data will be used for a worthwhile purpose; • no shipper details will be requested, and • the trucking company will have access to the aggregated database compiled by TxDOT.
Only one trucking company indicated that TxDOT will have to compensate the company for the costs of extracting the data and providing it to the agency as a condition of participation.
Given this positive response, the research team was encouraged that an extensive public out-reach effort, including a news release, and the in-volvement of the TMTA, can result in a statistically representative sample of truck carriers being con-vinced to provide TxDOT with the required data. In addition, resources are available to TxDOT to assist in recruiting trucking companies. One such a resource is the Freight Stakeholders National Network. The Network can (a) recruit members from their constituencies, (b) provide policy sup-port and technical sources to the group, (c) identi-
9
Recruiting Survey PersonnelThe SFTA study found that approximately
15 to 18 people were required at each site over a 24-hour period for conducting the interviews. This translates into an average of four to five people per interview shift per site (Clark, Jessup, and Casavant, 2002). The finding and hiring of a large number of short-term employees represents a major cost when performing roadside intercept interviews (Gillis, 1994). In the past, TxDOT has entered into a contract with vendors, such as Gra-ham Traffic or Alliance Texas, to conduct external station surveys for both passengers and commer-cial vehicles. These vendors have access to trained surveyors and supervisors, although the extent of the proposed effort might require the recruiting and training of additional surveyors and supervi-sors.
To reduce costs, it is possible to recruit volun-teers from local organizations or educational insti-tutions that are interested in performing communi-ty service. Recruiting volunteers who reside close to the interview sites will reduce transportation costs and their familiarity with the area will result in better knowledge and an understanding of the regions where the interviews will be conducted (Gillis, 1994). Assuming there are no groups that are willing to provide volunteer labor, the option exists to allow groups to use the roadside intercept surveys as a fundraising opportunity. This could translate into significant cost savings compared to hiring trained surveyors or a large number of short-term employees.
“… Washington State service organizations (Lions and Kiwanis Clubs) were offered the opportunity to conduct truck driver interviews as a club fund- raising activity… As a result of initial recruitment efforts, eight Lions Clubs and one Kiwanis Club agreed to provide members to serve as local interview teams. All clubs were based in the regions surrounding the selected interview sites. Their close proxim-ity minimized travel costs for the interview team. Club member’s personal knowledge of local roads and industries also proved to be a major advantage in communicating and understanding responses provided by truck driv-ers” (Clark, Jessup, and Casavant, 2002).
10
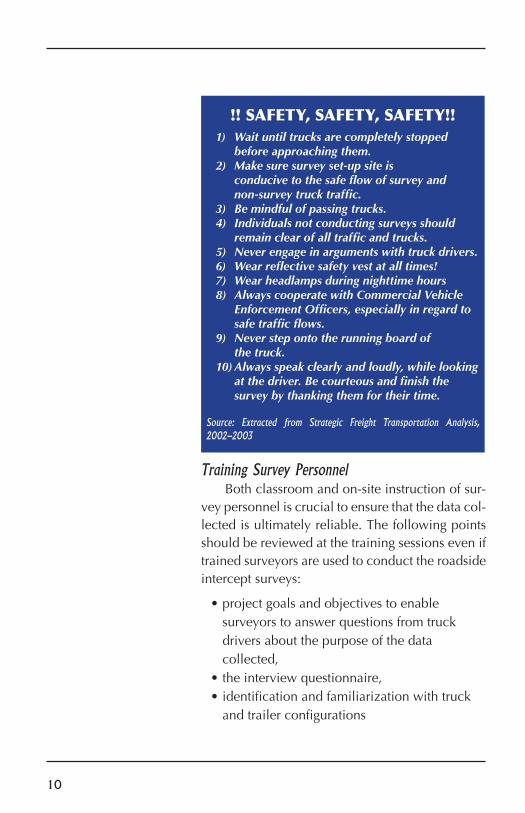
Training Survey PersonnelBoth classroom and on-site instruction of sur-
vey personnel is crucial to ensure that the data col-lected is ultimately reliable. The following points should be reviewed at the training sessions even if trained surveyors are used to conduct the roadside intercept surveys:
• project goals and objectives to enable surveyors to answer questions from truck drivers about the purpose of the data collected, • the interview questionnaire, • identification and familiarization with truck and trailer configurations
!! SAFETY, SAFETY, SAFETY!! 1) Wait until trucks are completely stopped before approaching them. 2) Make sure survey set-up site is conducive to the safe flow of survey and non-survey truck traffic. 3) Be mindful of passing trucks. 4) Individuals not conducting surveys should remain clear of all traffic and trucks. 5) Never engage in arguments with truck drivers. 6) Wear reflective safety vest at all times! 7) Wear headlamps during nighttime hours 8) Always cooperate with Commercial Vehicle Enforcement Officers, especially in regard to safe traffic flows. 9) Never step onto the running board of the truck. 10) Always speak clearly and loudly, while looking at the driver. Be courteous and finish the survey by thanking them for their time.
Source: Extracted from Strategic Freight Transportation Analysis, 2002-2003
27
“The Intermodal, Freight, and Safety Subcommit-tee’s responsibility will focus on issues related to improving the flow and safety of goods move-ments in the region, as well as the use of existing rail freight corridors for commuter rail service. Representatives of the various private sec-tor interests, including Intermodal and Freight, will be asked to meet with the Subcommittee to maintain a dialogue on issues of common interest and to identify opportu-nities for public/private sector partnerships.”Source: www.nctcog.org/trans/committees/ ifs/
The research team obtained access to the TxDOT Motor Carrier Registration Database, which contains the company address and tele-phone numbers of truck carriers registered in Texas. It, however, seldom contains the name of a contact person in the company. When a random sample of these companies was approached, the research team found that "company operators" or company employees answering the telephone in most instances act as "gatekeepers". It was thus very difficult to (1) identify the appropriate com-pany representative that can make a decision about entering into a data sharing partnership with TxDOT, and (2) to be transferred to that person. This type of "cold calling" was very time consum-ing and did not provide a satisfactory response.
The research team thus approached a number of trucking companies that have been exposed to transportation planning through their involvement with the North Central Texas Council of Govern-ment's Intermodal Freight and Safety Committee (IFS). The membership list of the IFS Committee was obtained and representatives of eight truck-ing companies were interviewed to determine whether:
• the company would consider participating in a truck data sharing initiative with TxDOT, and • their conditions for participation.
All the trucking companies interviewed in-dicated their willingness to participate in a data sharing arrangement with TxDOT provided that certain conditions are met. The following list re-flects the conditions for participation in descend-
26
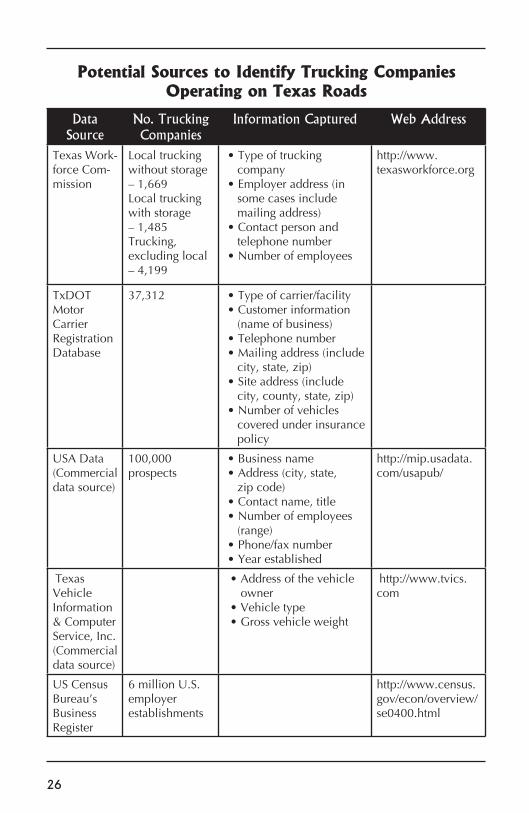
Potential Sources to Identify Trucking Companies Operating on Texas Roads
Data Source
No. Trucking Companies
Information Captured Web Address
Texas Work-force Com-mission
Local trucking without storage – 1,669Local trucking with storage – 1,485Trucking, excluding local – 4,199
• Type of trucking company • Employer address (in some cases include mailing address) • Contact person and telephone number • Number of employees
http://www.texasworkforce.org
TxDOT Motor Carrier Registration Database
37,312 • Type of carrier/facility • Customer information (name of business) • Telephone number • Mailing address (include city, state, zip) • Site address (include city, county, state, zip) • Number of vehicles covered under insurance policy
USA Data (Commercial data source)
100,000prospects
• Business name • Address (city, state, zip code) • Contact name, title • Number of employees (range) • Phone/fax number • Year established
http://mip.usadata.com/usapub/
Texas Vehicle Information & Computer Service, Inc. (Commercial data source)
• Address of the vehicle owner • Vehicle type • Gross vehicle weight
http://www.tvics.com
US Census Bureau’s Business Register
6 million U.S. employer establishments
http://www.census.gov/econ/overview/se0400.html
11
and items to bring on-site (Clark, Jessup, and Casavant, 2002 and Gillis, 1994).
Survey Equipment NeedsEquipment needs will vary depending on the
volume of truck traffic at the site and when the surveys are conducted. Besides general office sup-plies, equipment, such as cones and safety vests, are required to ensure the safety of the survey crew. In addition, it is recommended that the sur-veyors be provided with attire (i.e., hat) that will enable truck drivers to identify the survey crew. The following materials checklist was used in the SFTA study:
• enough surveys for each site, • pens, highlighters, pencils, staplers and staples, • clipboards, • reflective orange safety vests, • traffic cones, • "Survey Team Ahead" sign, • hats, • plastic containers for storing surveys, • headlamps for nighttime survey shifts, • two-way radios, and • tally counters (Clark, Jessup, and Casavant, 2002).
• personal interview techniques, including, greeting, etiquette and proper behavior, and asking and phrasing of survey questions, • personal safety, including, letters of release of liability, and • personal conduct, including, on-time per- formance, acceptable attire, writing legibly,
12
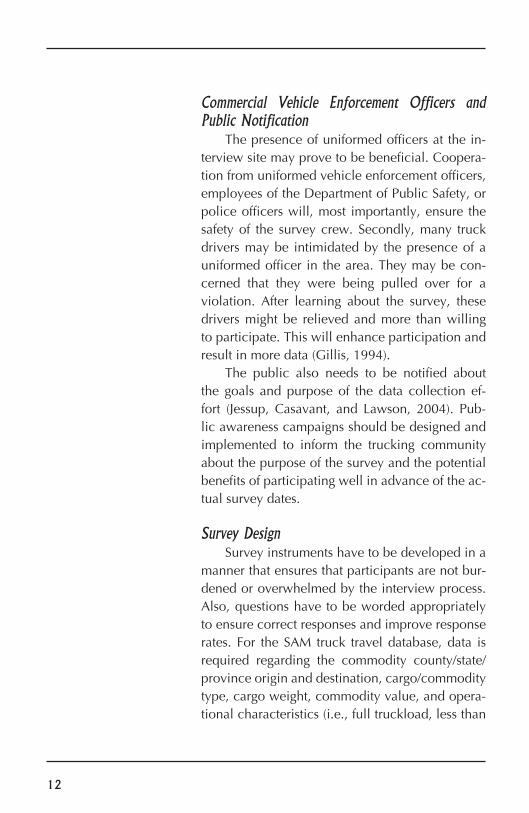
Commercial Vehicle Enforcement Officers and Public Notification
The presence of uniformed officers at the in-terview site may prove to be beneficial. Coopera-tion from uniformed vehicle enforcement officers, employees of the Department of Public Safety, or police officers will, most importantly, ensure the safety of the survey crew. Secondly, many truck drivers may be intimidated by the presence of a uniformed officer in the area. They may be con-cerned that they were being pulled over for a violation. After learning about the survey, these drivers might be relieved and more than willing to participate. This will enhance participation and result in more data (Gillis, 1994).
The public also needs to be notified about the goals and purpose of the data collection ef-fort (Jessup, Casavant, and Lawson, 2004). Pub-lic awareness campaigns should be designed and implemented to inform the trucking community about the purpose of the survey and the potential benefits of participating well in advance of the ac-tual survey dates.
Survey DesignSurvey instruments have to be developed in a
manner that ensures that participants are not bur-dened or overwhelmed by the interview process. Also, questions have to be worded appropriately to ensure correct responses and improve response rates. For the SAM truck travel database, data is required regarding the commodity county/state/province origin and destination, cargo/commodity type, cargo weight, commodity value, and opera-tional characteristics (i.e., full truckload, less than
25
It has been recognized that effective partner-ships are needed between government and the freight community to ensure adequate planning and funding of transportation infrastructure at the state and local levels. Despite this recognition, the transportation planning community struggles to understand the needs of the freight community partly due to the inferior freight data that is avail-able to freight planners (Freight Stakeholders Na-tional Network, nd).
Enhanced freight mobility through infra-structure improvements is in the interest of both the private sector and the transportation planning community. In addition, reliable freight data can be valuable to the private sector in informing in-vestment decisions relating to equipment utiliza-tion, new markets, and business opportunities (Transportation Research Board, 2003). This sur-vey approach is based on the hypothesis that a statistically representative sample of truck carriers operating in, from, to, and through Texas can be convinced to share their operational data needed by TxDOT. This section of the guidebook discuss-es the anticipated components of such a data shar-ing partnership.
Identification and Recruitment of Trucking Companies
A number of databases exist from which a representative random sample of truck carriers operating on Texas roads can be identified in the table on the following page, Potential Sources to Identify Trucking Companies Operating on Texas Roads.
Truck Carrier Participation
24
tured in the survey (i.e., number of empty trucks, cargo tonnage, value etc.) and summed to arrive at the average annual weekly characteristics of truck movements in a specific geographic region.
Unforeseen CircumstancesHarsh weather conditions, including severe
thunderstorms or rain, may affect the quality of the data gathered. Any events that are out of the ordi-nary, such as construction, automobile collisions, or hazardous material spills, should be well docu-mented (Gillis, 1994). Even where unforeseen cir-cumstances may cease data collection temporarily in the case of extreme weather (e.g., tornadoes) or hazardous conditions (e.g., fuel leak), the in-terview site weight as defined in Section 2.2.10 can still be calculated. However, since fewer truck drivers will be interviewed, the value of the site weight will be much higher than normal. This will, however, assist in the statistical adjustment of the sample data that would otherwise be missing (Gil-lis, 1994). Good planning requires that alternate backup data collection days be scheduled in the event that unforeseen circumstances result in in-adequate data collection.
13
full, or empty).When developing survey questions, it is im-
portant to keep in mind that truck driver coop-eration is crucial to the success of the survey. To minimize the inconvenience to the truck driver, it is important to keep the survey instrument as brief as possible. This also allows for more trucks to be surveyed. Some questions could thus be complet-ed by the surveyor through observation. Examples of such questions include the date, time of day, and the vehicle configuration (see survey instru-ment). This will reduce the amount of time spent conducting the actual interview with the partici-pating truck driver.
All questions should avoid wording bias. Ex-amples of wording bias would be "loaded" ques-tions or structuring questions in a way to elicit a certain response. Answers to questions should be kept as simple as possible by minimizing the amount of writing necessary to complete the sur-vey. Checkboxes for frequently appearing answer choices can be used to save time.
Texas's close proximity to Mexico and its large Spanish-speaking population would require the use of bilingual interviewers to prevent any con-fusion caused by language barriers. It is recom-mended that the entire survey should be complet-ed in approximately two to three minutes (Jessup, Casavant, and Lawson, 2004). A longer question-naire may result in impatience and fatigue in the participant, which could compromise the integrity of the collected data.
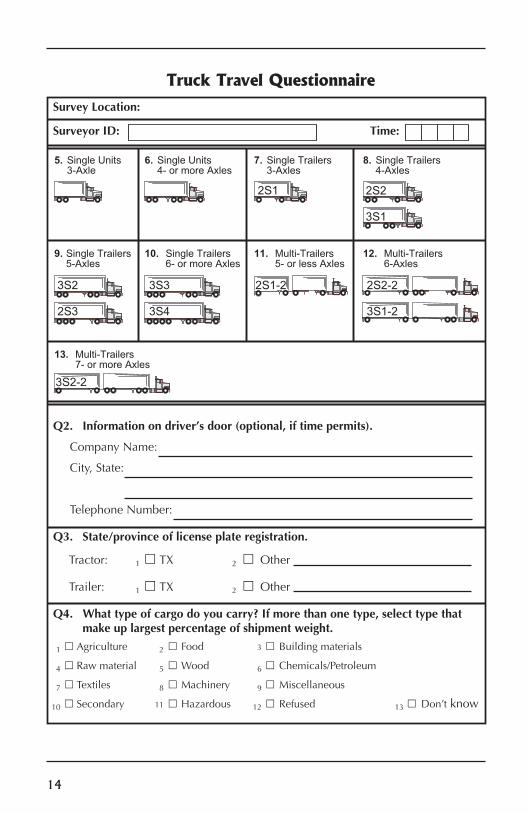
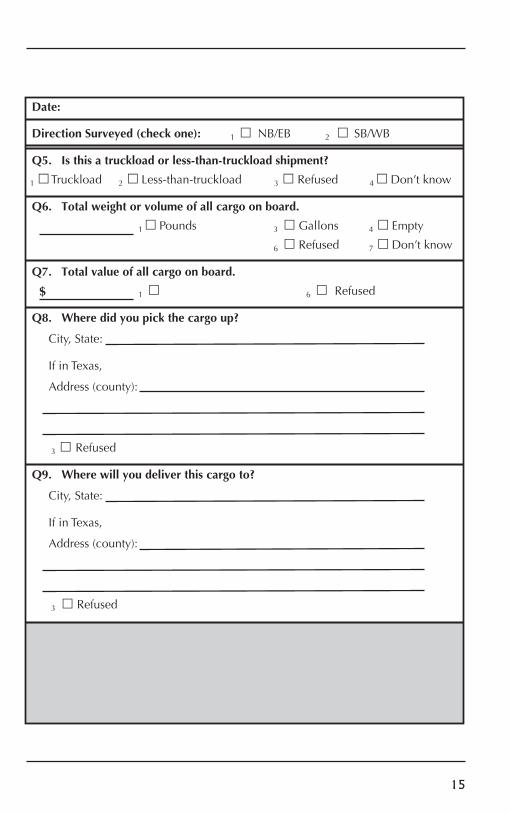
The proposed survey on page 14 and 15, Truck Travel Questionnaire and the table, Explanation of the Data Fields on page 16, provide an example of
14
�����
��� ���
���
���
���
���
���
�����
�����
�����
�� ���� ����������
�� ���� ������ �� ���� �����
�� ���� ���������������
�� ���� ���������������
�� ���� ���������������
�� ���� ���������� �� ���� �����
�� ���������������������
��� ���������������� �� ���� �����
��� ���������������� �� ���� �����
��������� ���
����������� �����
��� ������ ������������������� ��������� ��������� � �
�����������
� ���������
���������������
�!� � � �"��������������������� ����#�� �� ���
�������� � � �� � � �����
��� ���� � � �� � � �����
�$� %&� � ���������#�����������'�������� &������ ���������� � ���� &� ��(��������#�� ������� �#�����&����� �)��#& �
� � ��� ������� � � ���� � !� �� ������� ��"
# � $�%����� �� & � '��� ( � ���� ���")*��������
+ � ��,� ��" - � .��� ���� / � . "���������"
�0 � ��������� �� � 1�2�����" �� � $�3�"�� � � 4��5�6��%
Truck Travel Questionnaire
23
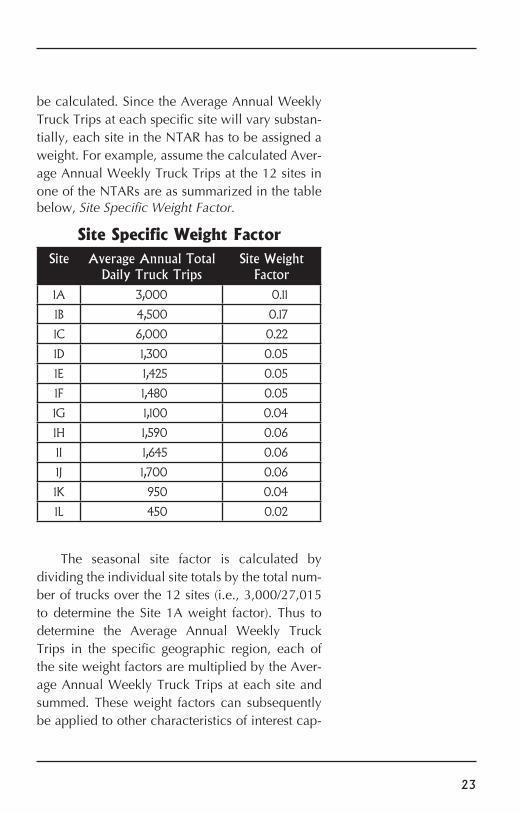
be calculated. Since the Average Annual Weekly Truck Trips at each specific site will vary substan-tially, each site in the NTAR has to be assigned a weight. For example, assume the calculated Aver-age Annual Weekly Truck Trips at the 12 sites in one of the NTARs are as summarized in the table below, Site Specific Weight Factor.
Site Specific Weight Factor
The seasonal site factor is calculated by dividing the individual site totals by the total num-ber of trucks over the 12 sites (i.e., 3,000/27,015 to determine the Site 1A weight factor). Thus to determine the Average Annual Weekly Truck Trips in the specific geographic region, each of the site weight factors are multiplied by the Aver-age Annual Weekly Truck Trips at each site and summed. These weight factors can subsequently be applied to other characteristics of interest cap-
Site Average Annual Total Daily Truck Trips
Site Weight Factor
1A 3,000 0.11
1B 4,500 0.17
1C 6,000 0.22
1D 1,300 0.05
1E 1,425 0.05
1F 1,480 0.05
1G 1,100 0.04
1H 1,590 0.06
1I 1,645 0.06
1J 1,700 0.06
1K 950 0.04
1L 450 0.02
22
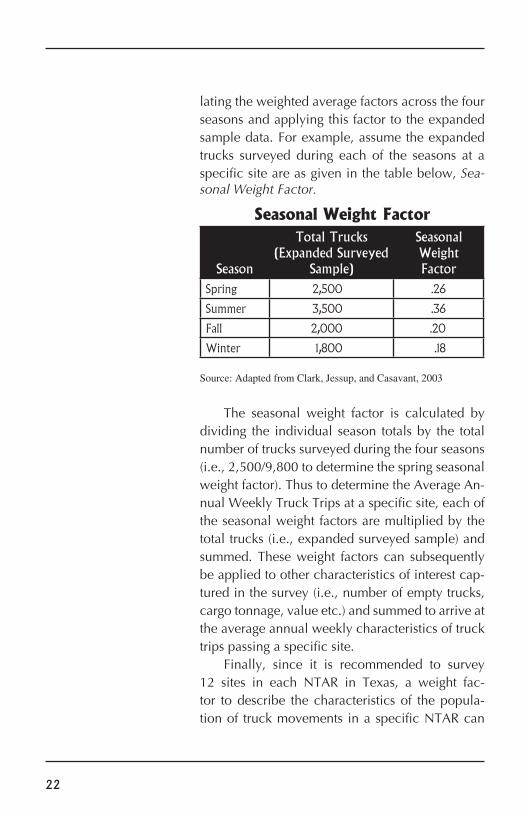
Seasonal Weight Factor
The seasonal weight factor is calculated by dividing the individual season totals by the total number of trucks surveyed during the four seasons (i.e., 2,500/9,800 to determine the spring seasonal weight factor). Thus to determine the Average An-nual Weekly Truck Trips at a specific site, each of the seasonal weight factors are multiplied by the total trucks (i.e., expanded surveyed sample) and summed. These weight factors can subsequently be applied to other characteristics of interest cap-tured in the survey (i.e., number of empty trucks, cargo tonnage, value etc.) and summed to arrive at the average annual weekly characteristics of truck trips passing a specific site.
Finally, since it is recommended to survey 12 sites in each NTAR in Texas, a weight fac-tor to describe the characteristics of the popula-tion of truck movements in a specific NTAR can
lating the weighted average factors across the four seasons and applying this factor to the expanded sample data. For example, assume the expanded trucks surveyed during each of the seasons at a specific site are as given in the table below, Sea-sonal Weight Factor.
Season
Total Trucks (Expanded Surveyed
Sample)
Seasonal Weight Factor
Spring 2,500 .26
Summer 3,500 .36
Fall 2,000 .20
Winter 1,800 .18
Source: Adapted from Clark, Jessup, and Casavant, 2003
15
�� ��
����� ��������������&��(��� � � � !)7! � � �!)'!
�*� ��� &����� ���(����������+ &��+ ���(�����&����� '
� �����6���� � � 8�""9����9����6���� � $�3�"�� #�4��5�6��%
�,� � ���)��#& ������������������#���-����
�� *����" � :�����" # � 7����
( � $�3�"�� + �4��5�6��%
�.� � ������������������#���-����
� � ( � $�3�"��
�/� %&��������������(� &�����#���'
� ���������
;3 ���,�"�
�����""<������=�
� $�3�"��
�0� %&����)��������������� &������#� '
� ���������
;3 ���,�"�
�����""<������=�
� $�3�"��
1
16
Field Name Description
Survey Location A unique number assigned to each survey site
Date Survey date
Surveyor ID A unique number assigned to each surveyor
Time Time survey is conducted
Direction Surveyed Direction in which truck traffic is surveyed
Vehicle Classification Truck and trailer configuration
Company Name Name of trucking company as printed on the driver’s door
City City as printed on the driver’s door
State State as printed on the driver’s door
Telephone Number Telephone number on the driver’s door
Tractor License Plate Registration
License plate registration number of the trac-tor
Trailer License Plate Registration
License plate registration number of the trailer
Commodity The major commodity carried
Shipment Type Whether shipment is a truckload or less-than-truckload*
Payload Weight The weight of the cargo that is carried
Cargo Value The value of the cargo that is carried
Cargo Origin City City where the cargo was picked up
Cargo Origin State State/province where the cargo was picked up
Cargo Origin Address Address where the cargo was picked up
Cargo Destination City City where the cargo will be dropped off
Cargo Destination State State where the cargo will be dropped off
Cargo Destination Address Address where the cargo will be dropped off
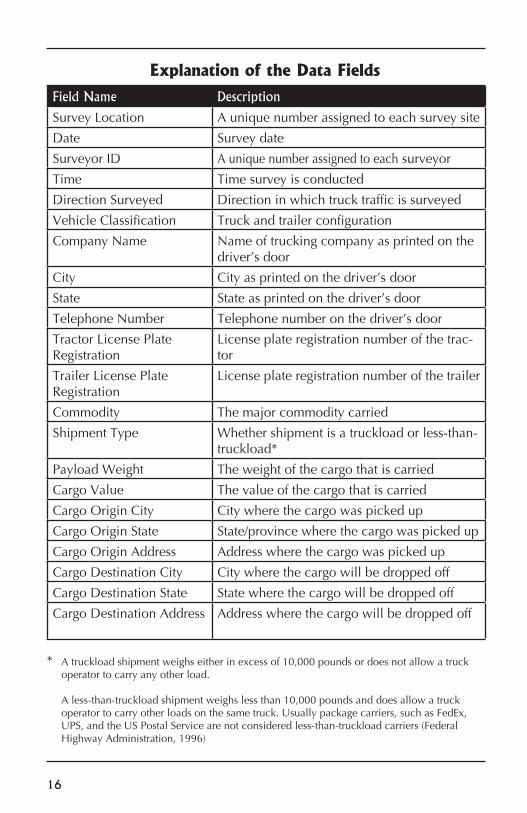
Explanation of the Data Fields
* A truckload shipment weighs either in excess of 10,000 pounds or does not allow a truck operator to carry any other load. A less-than-truckload shipment weighs less than 10,000 pounds and does allow a truck operator to carry other loads on the same truck. Usually package carriers, such as FedEx, UPS, and the US Postal Service are not considered less-than-truckload carriers (Federal Highway Administration, 1996)
21
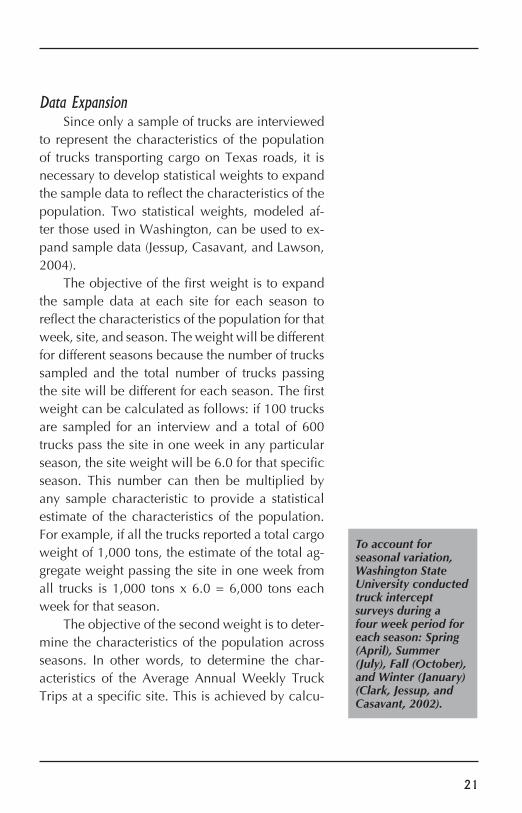
Data ExpansionSince only a sample of trucks are interviewed
to represent the characteristics of the population of trucks transporting cargo on Texas roads, it is necessary to develop statistical weights to expand the sample data to reflect the characteristics of the population. Two statistical weights, modeled af-ter those used in Washington, can be used to ex-pand sample data (Jessup, Casavant, and Lawson, 2004).
The objective of the first weight is to expand the sample data at each site for each season to reflect the characteristics of the population for that week, site, and season. The weight will be different for different seasons because the number of trucks sampled and the total number of trucks passing the site will be different for each season. The first weight can be calculated as follows: if 100 trucks are sampled for an interview and a total of 600 trucks pass the site in one week in any particular season, the site weight will be 6.0 for that specific season. This number can then be multiplied by any sample characteristic to provide a statistical estimate of the characteristics of the population. For example, if all the trucks reported a total cargo weight of 1,000 tons, the estimate of the total ag-gregate weight passing the site in one week from all trucks is 1,000 tons x 6.0 = 6,000 tons each week for that season.
The objective of the second weight is to deter-mine the characteristics of the population across seasons. In other words, to determine the char-acteristics of the Average Annual Weekly Truck Trips at a specific site. This is achieved by calcu-
To account for seasonal variation, Washington State University conducted truck intercept surveys during a four week period for each season: Spring (April), Summer (July), Fall (October), and Winter (January) (Clark, Jessup, and Casavant, 2002).
20
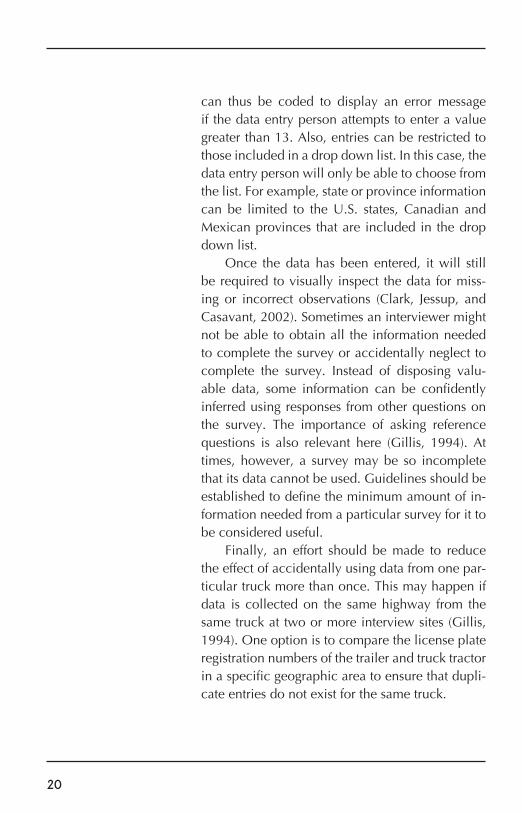
can thus be coded to display an error message if the data entry person attempts to enter a value greater than 13. Also, entries can be restricted to those included in a drop down list. In this case, the data entry person will only be able to choose from the list. For example, state or province information can be limited to the U.S. states, Canadian and Mexican provinces that are included in the drop down list.
Once the data has been entered, it will still be required to visually inspect the data for miss-ing or incorrect observations (Clark, Jessup, and Casavant, 2002). Sometimes an interviewer might not be able to obtain all the information needed to complete the survey or accidentally neglect to complete the survey. Instead of disposing valu-able data, some information can be confidently inferred using responses from other questions on the survey. The importance of asking reference questions is also relevant here (Gillis, 1994). At times, however, a survey may be so incomplete that its data cannot be used. Guidelines should be established to define the minimum amount of in-formation needed from a particular survey for it to be considered useful.
Finally, an effort should be made to reduce the effect of accidentally using data from one par-ticular truck more than once. This may happen if data is collected on the same highway from the same truck at two or more interview sites (Gillis, 1994). One option is to compare the license plate registration numbers of the trailer and truck tractor in a specific geographic area to ensure that dupli-cate entries do not exist for the same truck.
17
“The truck drivers were provided with a coupon for a free cup of coffee as a token of thanks for their participation” (Casa-vant, Gillis, Blanken-ship, and Howard, 1995).
a proposed truck travel questionnaire that can be used in roadside intercept surveys.
Interview ProcedureTrucks selected for an interview should be di-
rected to a designated area. As the selected truck is parking, the interviewer should record informa-tion, such as the time of day, the truck configura-tion, and the company information, that is avail-able through visual observation to minimize the amount of time and inconvenience to the truck driver.
Once the truck is safely parked, the interview-er should approach the truck driver in a friendly and polite manner and request cooperation in the survey. The driver should be informed that par-ticipation in the survey is voluntary. Once a driver agrees to participate, the interviewer should go through the questions as quickly as possible while maintaining proper quality control. If, for any rea-son, there is inadequate space for trucks to park safely and an interviewer is not available, a truck driver who would have participated should be al-lowed to leave (Gillis, 1994). It is thus very im-portant to have an adequate number of surveyors available to collect data.
18
As an incentive to perform work of the highest quality, incentives may be awarded to those groups who provide surveyors with com-plete, accurate, and legible questionnaires (Gillis, 1994).
Data Quality ControlErrors are inevitable when collecting data.
Some examples of errors that could occur during data collection include:
• systematic errors caused by inappropriate interview procedures, inappropriate site selection, or ambiguous questions, • inaccurate responses given by the truck drivers, and • inaccurate recording of vehicle data or driver responses by the surveyor (Jessup, Casavant, and Lawson, 2004).
Effective data management will help to reduce errors from mistakes in data collection or database entry. The number of systematic errors that may result from ambiguous questions can be reduced by conducting pilot tests of survey instru-ments to identify problems with questionnaire wording. Any inappropriately worded or ambigu-ous questions should be addressed appropriately in updated versions of the survey. In addition, on-going improvements to survey instruments should be encouraged. Feedback from both the survey crew and supervisors involved in the data collec-tion process should be collected and considered. By improving the clarity of the interview questions, drivers are also less likely to provide inaccurate re-sponses, which will reduce potential errors further (Gillis, 1994).
An informative training program is a form of data quality control that is established well before the actual surveying takes place. Training should, however, not end once the surveying begins.
19
Ongoing training and supervision provide an op-portunity for answering questions that came up and will remind the survey crew of the interview procedures, which will reduce the number of er-rors caused by inaccurate data recording. Supervi-sors should also check completed questionnaires immediately for accuracy and completion. Any problems identified can thus be immediately ad-dressed.
Finally, logic checks should be performed on all questionnaires before being entered into a da-tabase. For example, a potential error that may oc-cur is when the driver provides the gross vehicle weight of both the cargo and the truck instead of the weight of the cargo being transported. Certain assumptions thus need to be established for han-dling such errors before the data is entered into a database. For example, if the cargo weight provid-ed exceeds the legal limit for that truck's particular axle configuration, the weight will be assumed to be the gross weight of the truck and cargo. Refer-ence questions could also be included in the sur-vey to facilitate the checking of answers that truck drivers are providing and surveyors are recording.
Data Entry and Clean UpCapturing data electronically through the use
of handheld computers or other devices may re-duce data entry errors. Alternatively, data entry forms with numerous built in checks can be pro-grammed to facilitate the accurate entry of data. For example, the data that can be entered in certain data entry boxes can be restricted. As an example, Question 4 in the survey has 13 possible choices, ranging numerically from 1 to 13. The software
20
can thus be coded to display an error message if the data entry person attempts to enter a value greater than 13. Also, entries can be restricted to those included in a drop down list. In this case, the data entry person will only be able to choose from the list. For example, state or province information can be limited to the U.S. states, Canadian and Mexican provinces that are included in the drop down list.
Once the data has been entered, it will still be required to visually inspect the data for miss-ing or incorrect observations (Clark, Jessup, and Casavant, 2002). Sometimes an interviewer might not be able to obtain all the information needed to complete the survey or accidentally neglect to complete the survey. Instead of disposing valu-able data, some information can be confidently inferred using responses from other questions on the survey. The importance of asking reference questions is also relevant here (Gillis, 1994). At times, however, a survey may be so incomplete that its data cannot be used. Guidelines should be established to define the minimum amount of in-formation needed from a particular survey for it to be considered useful.
Finally, an effort should be made to reduce the effect of accidentally using data from one par-ticular truck more than once. This may happen if data is collected on the same highway from the same truck at two or more interview sites (Gillis, 1994). One option is to compare the license plate registration numbers of the trailer and truck tractor in a specific geographic area to ensure that dupli-cate entries do not exist for the same truck.
17
“The truck drivers were provided with a coupon for a free cup of coffee as a token of thanks for their participation” (Casa-vant, Gillis, Blanken-ship, and Howard, 1995).
a proposed truck travel questionnaire that can be used in roadside intercept surveys.
Interview ProcedureTrucks selected for an interview should be di-
rected to a designated area. As the selected truck is parking, the interviewer should record informa-tion, such as the time of day, the truck configura-tion, and the company information, that is avail-able through visual observation to minimize the amount of time and inconvenience to the truck driver.
Once the truck is safely parked, the interview-er should approach the truck driver in a friendly and polite manner and request cooperation in the survey. The driver should be informed that par-ticipation in the survey is voluntary. Once a driver agrees to participate, the interviewer should go through the questions as quickly as possible while maintaining proper quality control. If, for any rea-son, there is inadequate space for trucks to park safely and an interviewer is not available, a truck driver who would have participated should be al-lowed to leave (Gillis, 1994). It is thus very im-portant to have an adequate number of surveyors available to collect data.
16
Field Name Description
Survey Location A unique number assigned to each survey site
Date Survey date
Surveyor ID A unique number assigned to each surveyor
Time Time survey is conducted
Direction Surveyed Direction in which truck traffic is surveyed
Vehicle Classification Truck and trailer configuration
Company Name Name of trucking company as printed on the driver’s door
City City as printed on the driver’s door
State State as printed on the driver’s door
Telephone Number Telephone number on the driver’s door
Tractor License Plate Registration
License plate registration number of the trac-tor
Trailer License Plate Registration
License plate registration number of the trailer
Commodity The major commodity carried
Shipment Type Whether shipment is a truckload or less-than-truckload*
Payload Weight The weight of the cargo that is carried
Cargo Value The value of the cargo that is carried
Cargo Origin City City where the cargo was picked up
Cargo Origin State State/province where the cargo was picked up
Cargo Origin Address Address where the cargo was picked up
Cargo Destination City City where the cargo will be dropped off
Cargo Destination State State where the cargo will be dropped off
Cargo Destination Address Address where the cargo will be dropped off
Explanation of the Data Fields
* A truckload shipment weighs either in excess of 10,000 pounds or does not allow a truck operator to carry any other load. A less-than-truckload shipment weighs less than 10,000 pounds and does allow a truck operator to carry other loads on the same truck. Usually package carriers, such as FedEx, UPS, and the US Postal Service are not considered less-than-truckload carriers (Federal Highway Administration, 1996)
21
Data ExpansionSince only a sample of trucks are interviewed
to represent the characteristics of the population of trucks transporting cargo on Texas roads, it is necessary to develop statistical weights to expand the sample data to reflect the characteristics of the population. Two statistical weights, modeled af-ter those used in Washington, can be used to ex-pand sample data (Jessup, Casavant, and Lawson, 2004).
The objective of the first weight is to expand the sample data at each site for each season to reflect the characteristics of the population for that week, site, and season. The weight will be different for different seasons because the number of trucks sampled and the total number of trucks passing the site will be different for each season. The first weight can be calculated as follows: if 100 trucks are sampled for an interview and a total of 600 trucks pass the site in one week in any particular season, the site weight will be 6.0 for that specific season. This number can then be multiplied by any sample characteristic to provide a statistical estimate of the characteristics of the population. For example, if all the trucks reported a total cargo weight of 1,000 tons, the estimate of the total ag-gregate weight passing the site in one week from all trucks is 1,000 tons x 6.0 = 6,000 tons each week for that season.
The objective of the second weight is to deter-mine the characteristics of the population across seasons. In other words, to determine the char-acteristics of the Average Annual Weekly Truck Trips at a specific site. This is achieved by calcu-
To account for seasonal variation, Washington State University conducted truck intercept surveys during a four week period for each season: Spring (April), Summer (July), Fall (October), and Winter (January) (Clark, Jessup, and Casavant, 2002).
22
Seasonal Weight Factor
The seasonal weight factor is calculated by dividing the individual season totals by the total number of trucks surveyed during the four seasons (i.e., 2,500/9,800 to determine the spring seasonal weight factor). Thus to determine the Average An-nual Weekly Truck Trips at a specific site, each of the seasonal weight factors are multiplied by the total trucks (i.e., expanded surveyed sample) and summed. These weight factors can subsequently be applied to other characteristics of interest cap-tured in the survey (i.e., number of empty trucks, cargo tonnage, value etc.) and summed to arrive at the average annual weekly characteristics of truck trips passing a specific site.
Finally, since it is recommended to survey 12 sites in each NTAR in Texas, a weight fac-tor to describe the characteristics of the popula-tion of truck movements in a specific NTAR can
lating the weighted average factors across the four seasons and applying this factor to the expanded sample data. For example, assume the expanded trucks surveyed during each of the seasons at a specific site are as given in the table below, Sea-sonal Weight Factor.
Season
Total Trucks (Expanded Surveyed
Sample)
Seasonal Weight Factor
Spring 2,500 .26
Summer 3,500 .36
Fall 2,000 .20
Winter 1,800 .18
Source: Adapted from Clark, Jessup, and Casavant, 2003
15
�� ��
����� ��������������&��(��� � � � !)7! � � �!)'!
�*� ��� &����� ���(����������+ &��+ ���(�����&����� '
� �����6���� � � 8�""9����9����6���� � $�3�"�� #�4��5�6��%
�,� � ���)��#& ������������������#���-����
�� *����" � :�����" # � 7����
( � $�3�"�� + �4��5�6��%
�.� � ������������������#���-����
� � ( � $�3�"��
�/� %&��������������(� &�����#���'
� ���������
;3 ���,�"�
�����""<������=�
� $�3�"��
�0� %&����)��������������� &������#� '
� ���������
;3 ���,�"�
�����""<������=�
� $�3�"��
1
14
�����
��� ���
���
���
���
���
���
�����
�����
�����
�� ���� ����������
�� ���� ������ �� ���� �����
�� ���� ���������������
�� ���� ���������������
�� ���� ���������������
�� ���� ���������� �� ���� �����
�� ���������������������
��� ���������������� �� ���� �����
��� ���������������� �� ���� �����
��������� ���
����������� �����
��� ������ ������������������� ��������� ��������� � �
�����������
� ���������
���������������
�!� � � �"��������������������� ����#�� �� ���
�������� � � �� � � �����
��� ���� � � �� � � �����
�$� %&� � ���������#�����������'�������� &������ ���������� � ���� &� ��(��������#�� ������� �#�����&����� �)��#& �
� � ��� ������� � � ���� � !� �� ������� ��"
# � $�%����� �� & � '��� ( � ���� ���")*��������
+ � ��,� ��" - � .��� ���� / � . "���������"
�0 � ��������� �� � 1�2�����" �� � $�3�"�� � � 4��5�6��%
Truck Travel Questionnaire
23
be calculated. Since the Average Annual Weekly Truck Trips at each specific site will vary substan-tially, each site in the NTAR has to be assigned a weight. For example, assume the calculated Aver-age Annual Weekly Truck Trips at the 12 sites in one of the NTARs are as summarized in the table below, Site Specific Weight Factor.
Site Specific Weight Factor
The seasonal site factor is calculated by dividing the individual site totals by the total num-ber of trucks over the 12 sites (i.e., 3,000/27,015 to determine the Site 1A weight factor). Thus to determine the Average Annual Weekly Truck Trips in the specific geographic region, each of the site weight factors are multiplied by the Aver-age Annual Weekly Truck Trips at each site and summed. These weight factors can subsequently be applied to other characteristics of interest cap-
Site Average Annual Total Daily Truck Trips
Site Weight Factor
1A 3,000 0.11
1B 4,500 0.17
1C 6,000 0.22
1D 1,300 0.05
1E 1,425 0.05
1F 1,480 0.05
1G 1,100 0.04
1H 1,590 0.06
1I 1,645 0.06
1J 1,700 0.06
1K 950 0.04
1L 450 0.02
24
tured in the survey (i.e., number of empty trucks, cargo tonnage, value etc.) and summed to arrive at the average annual weekly characteristics of truck movements in a specific geographic region.
Unforeseen CircumstancesHarsh weather conditions, including severe
thunderstorms or rain, may affect the quality of the data gathered. Any events that are out of the ordi-nary, such as construction, automobile collisions, or hazardous material spills, should be well docu-mented (Gillis, 1994). Even where unforeseen cir-cumstances may cease data collection temporarily in the case of extreme weather (e.g., tornadoes) or hazardous conditions (e.g., fuel leak), the in-terview site weight as defined in Section 2.2.10 can still be calculated. However, since fewer truck drivers will be interviewed, the value of the site weight will be much higher than normal. This will, however, assist in the statistical adjustment of the sample data that would otherwise be missing (Gil-lis, 1994). Good planning requires that alternate backup data collection days be scheduled in the event that unforeseen circumstances result in in-adequate data collection.
13
full, or empty).When developing survey questions, it is im-
portant to keep in mind that truck driver coop-eration is crucial to the success of the survey. To minimize the inconvenience to the truck driver, it is important to keep the survey instrument as brief as possible. This also allows for more trucks to be surveyed. Some questions could thus be complet-ed by the surveyor through observation. Examples of such questions include the date, time of day, and the vehicle configuration (see survey instru-ment). This will reduce the amount of time spent conducting the actual interview with the partici-pating truck driver.
All questions should avoid wording bias. Ex-amples of wording bias would be "loaded" ques-tions or structuring questions in a way to elicit a certain response. Answers to questions should be kept as simple as possible by minimizing the amount of writing necessary to complete the sur-vey. Checkboxes for frequently appearing answer choices can be used to save time.
Texas's close proximity to Mexico and its large Spanish-speaking population would require the use of bilingual interviewers to prevent any con-fusion caused by language barriers. It is recom-mended that the entire survey should be complet-ed in approximately two to three minutes (Jessup, Casavant, and Lawson, 2004). A longer question-naire may result in impatience and fatigue in the participant, which could compromise the integrity of the collected data.
The proposed survey on page 14 and 15, Truck Travel Questionnaire and the table, Explanation of the Data Fields on page 16, provide an example of
12
Commercial Vehicle Enforcement Officers and Public Notification
The presence of uniformed officers at the in-terview site may prove to be beneficial. Coopera-tion from uniformed vehicle enforcement officers, employees of the Department of Public Safety, or police officers will, most importantly, ensure the safety of the survey crew. Secondly, many truck drivers may be intimidated by the presence of a uniformed officer in the area. They may be con-cerned that they were being pulled over for a violation. After learning about the survey, these drivers might be relieved and more than willing to participate. This will enhance participation and result in more data (Gillis, 1994).
The public also needs to be notified about the goals and purpose of the data collection ef-fort (Jessup, Casavant, and Lawson, 2004). Pub-lic awareness campaigns should be designed and implemented to inform the trucking community about the purpose of the survey and the potential benefits of participating well in advance of the ac-tual survey dates.
Survey DesignSurvey instruments have to be developed in a
manner that ensures that participants are not bur-dened or overwhelmed by the interview process. Also, questions have to be worded appropriately to ensure correct responses and improve response rates. For the SAM truck travel database, data is required regarding the commodity county/state/province origin and destination, cargo/commodity type, cargo weight, commodity value, and opera-tional characteristics (i.e., full truckload, less than
25
It has been recognized that effective partner-ships are needed between government and the freight community to ensure adequate planning and funding of transportation infrastructure at the state and local levels. Despite this recognition, the transportation planning community struggles to understand the needs of the freight community partly due to the inferior freight data that is avail-able to freight planners (Freight Stakeholders Na-tional Network, nd).
Enhanced freight mobility through infra-structure improvements is in the interest of both the private sector and the transportation planning community. In addition, reliable freight data can be valuable to the private sector in informing in-vestment decisions relating to equipment utiliza-tion, new markets, and business opportunities (Transportation Research Board, 2003). This sur-vey approach is based on the hypothesis that a statistically representative sample of truck carriers operating in, from, to, and through Texas can be convinced to share their operational data needed by TxDOT. This section of the guidebook discuss-es the anticipated components of such a data shar-ing partnership.
Identification and Recruitment of Trucking Companies
A number of databases exist from which a representative random sample of truck carriers operating on Texas roads can be identified in the table on the following page, Potential Sources to Identify Trucking Companies Operating on Texas Roads.
Truck Carrier Participation
26
Potential Sources to Identify Trucking Companies Operating on Texas Roads
Data Source
No. Trucking Companies
Information Captured Web Address
Texas Work-force Com-mission
Local trucking without storage – 1,669Local trucking with storage – 1,485Trucking, excluding local – 4,199
• Type of trucking company • Employer address (in some cases include mailing address) • Contact person and telephone number • Number of employees
http://www.texasworkforce.org
TxDOT Motor Carrier Registration Database
37,312 • Type of carrier/facility • Customer information (name of business) • Telephone number • Mailing address (include city, state, zip) • Site address (include city, county, state, zip) • Number of vehicles covered under insurance policy
USA Data (Commercial data source)
100,000prospects
• Business name • Address (city, state, zip code) • Contact name, title • Number of employees (range) • Phone/fax number • Year established
http://mip.usadata.com/usapub/
Texas Vehicle Information & Computer Service, Inc. (Commercial data source)
• Address of the vehicle owner • Vehicle type • Gross vehicle weight
http://www.tvics.com
US Census Bureau’s Business Register
6 million U.S. employer establishments
http://www.census.gov/econ/overview/se0400.html
11
and items to bring on-site (Clark, Jessup, and Casavant, 2002 and Gillis, 1994).
Survey Equipment NeedsEquipment needs will vary depending on the
volume of truck traffic at the site and when the surveys are conducted. Besides general office sup-plies, equipment, such as cones and safety vests, are required to ensure the safety of the survey crew. In addition, it is recommended that the sur-veyors be provided with attire (i.e., hat) that will enable truck drivers to identify the survey crew. The following materials checklist was used in the SFTA study:
• enough surveys for each site, • pens, highlighters, pencils, staplers and staples, • clipboards, • reflective orange safety vests, • traffic cones, • "Survey Team Ahead" sign, • hats, • plastic containers for storing surveys, • headlamps for nighttime survey shifts, • two-way radios, and • tally counters (Clark, Jessup, and Casavant, 2002).
• personal interview techniques, including, greeting, etiquette and proper behavior, and asking and phrasing of survey questions, • personal safety, including, letters of release of liability, and • personal conduct, including, on-time per- formance, acceptable attire, writing legibly,
10
Training Survey PersonnelBoth classroom and on-site instruction of sur-
vey personnel is crucial to ensure that the data col-lected is ultimately reliable. The following points should be reviewed at the training sessions even if trained surveyors are used to conduct the roadside intercept surveys:
• project goals and objectives to enable surveyors to answer questions from truck drivers about the purpose of the data collected, • the interview questionnaire, • identification and familiarization with truck and trailer configurations
!! SAFETY, SAFETY, SAFETY!! 1) Wait until trucks are completely stopped before approaching them. 2) Make sure survey set-up site is conducive to the safe flow of survey and non-survey truck traffic. 3) Be mindful of passing trucks. 4) Individuals not conducting surveys should remain clear of all traffic and trucks. 5) Never engage in arguments with truck drivers. 6) Wear reflective safety vest at all times! 7) Wear headlamps during nighttime hours 8) Always cooperate with Commercial Vehicle Enforcement Officers, especially in regard to safe traffic flows. 9) Never step onto the running board of the truck. 10) Always speak clearly and loudly, while looking at the driver. Be courteous and finish the survey by thanking them for their time.
Source: Extracted from Strategic Freight Transportation Analysis, 2002-2003
27
“The Intermodal, Freight, and Safety Subcommit-tee’s responsibility will focus on issues related to improving the flow and safety of goods move-ments in the region, as well as the use of existing rail freight corridors for commuter rail service. Representatives of the various private sec-tor interests, including Intermodal and Freight, will be asked to meet with the Subcommittee to maintain a dialogue on issues of common interest and to identify opportu-nities for public/private sector partnerships.”Source: www.nctcog.org/trans/committees/ ifs/
The research team obtained access to the TxDOT Motor Carrier Registration Database, which contains the company address and tele-phone numbers of truck carriers registered in Texas. It, however, seldom contains the name of a contact person in the company. When a random sample of these companies was approached, the research team found that "company operators" or company employees answering the telephone in most instances act as "gatekeepers". It was thus very difficult to (1) identify the appropriate com-pany representative that can make a decision about entering into a data sharing partnership with TxDOT, and (2) to be transferred to that person. This type of "cold calling" was very time consum-ing and did not provide a satisfactory response.
The research team thus approached a number of trucking companies that have been exposed to transportation planning through their involvement with the North Central Texas Council of Govern-ment's Intermodal Freight and Safety Committee (IFS). The membership list of the IFS Committee was obtained and representatives of eight truck-ing companies were interviewed to determine whether:
• the company would consider participating in a truck data sharing initiative with TxDOT, and • their conditions for participation.
All the trucking companies interviewed in-dicated their willingness to participate in a data sharing arrangement with TxDOT provided that certain conditions are met. The following list re-flects the conditions for participation in descend-
28
ing order of number of times mentioned:
• no information of the company will be included in the aggregate database that is compiled and used by TxDOT; • the data will not be used for law enforcement or litigation against the company; • the Texas Motor Transportation Association (TMTA) will be involved to protect the interests of those that participate; • no severe cost burden will be imposed on the trucking company in compiling the data; • TxDOT will demonstrate to the trucking companies that the data will be used for a worthwhile purpose; • no shipper details will be requested, and • the trucking company will have access to the aggregated database compiled by TxDOT.
Only one trucking company indicated that TxDOT will have to compensate the company for the costs of extracting the data and providing it to the agency as a condition of participation.
Given this positive response, the research team was encouraged that an extensive public out-reach effort, including a news release, and the in-volvement of the TMTA, can result in a statistically representative sample of truck carriers being con-vinced to provide TxDOT with the required data. In addition, resources are available to TxDOT to assist in recruiting trucking companies. One such a resource is the Freight Stakeholders National Network. The Network can (a) recruit members from their constituencies, (b) provide policy sup-port and technical sources to the group, (c) identi-
9
Recruiting Survey PersonnelThe SFTA study found that approximately
15 to 18 people were required at each site over a 24-hour period for conducting the interviews. This translates into an average of four to five people per interview shift per site (Clark, Jessup, and Casavant, 2002). The finding and hiring of a large number of short-term employees represents a major cost when performing roadside intercept interviews (Gillis, 1994). In the past, TxDOT has entered into a contract with vendors, such as Gra-ham Traffic or Alliance Texas, to conduct external station surveys for both passengers and commer-cial vehicles. These vendors have access to trained surveyors and supervisors, although the extent of the proposed effort might require the recruiting and training of additional surveyors and supervi-sors.
To reduce costs, it is possible to recruit volun-teers from local organizations or educational insti-tutions that are interested in performing communi-ty service. Recruiting volunteers who reside close to the interview sites will reduce transportation costs and their familiarity with the area will result in better knowledge and an understanding of the regions where the interviews will be conducted (Gillis, 1994). Assuming there are no groups that are willing to provide volunteer labor, the option exists to allow groups to use the roadside intercept surveys as a fundraising opportunity. This could translate into significant cost savings compared to hiring trained surveyors or a large number of short-term employees.
“… Washington State service organizations (Lions and Kiwanis Clubs) were offered the opportunity to conduct truck driver interviews as a club fund- raising activity… As a result of initial recruitment efforts, eight Lions Clubs and one Kiwanis Club agreed to provide members to serve as local interview teams. All clubs were based in the regions surrounding the selected interview sites. Their close proxim-ity minimized travel costs for the interview team. Club member’s personal knowledge of local roads and industries also proved to be a major advantage in communicating and understanding responses provided by truck driv-ers” (Clark, Jessup, and Casavant, 2002).
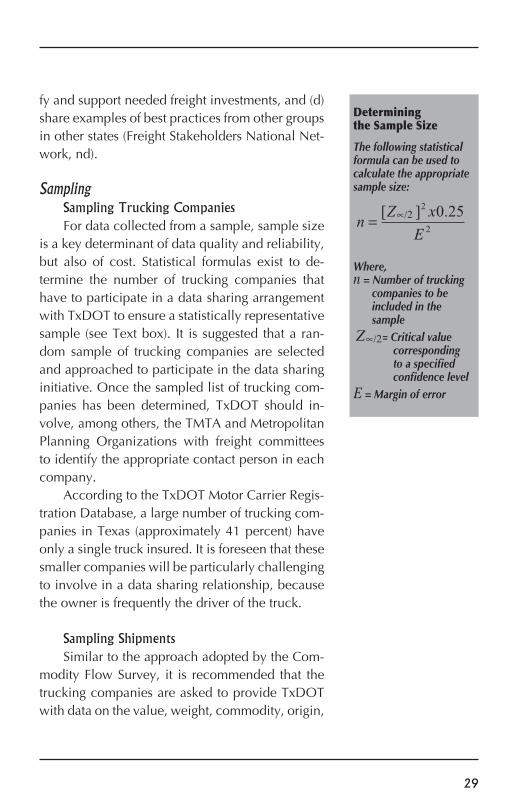
8
Targets can be set, for example to have an objec-tive of surveying 10 percent of all trucks on In-terstate facilities, 5 percent of all trucks on major corridors (i.e., U.S. highways and state highways), and 50 percent of all trucks at sites with low truck traffic volumes.
When to Sample?To account for seasonal variation, day-of-
the week variation, and time-of-day variation, it is recommended that roadside intercept surveys be conducted at a minimum every season (four times a year) ideally, over a one week period for 24 hours per day at each site. Using the bid prices by surveying companies for 2004 as a guideline it is, however, foreseen that the costs of conduct-ing roadside intercept surveys seven days a week for 24 hours each day will be prohibitive. The op-tion thus exists to collect truck data on fewer days. Wednesdays are typically chosen to collect truck travel data, because truck flows tend to be higher/lower towards the beginning and end of the week. Most holidays or observances of holidays also typically occur on Mondays or Fridays. It is, how-ever, strongly recommended that intercept surveys be conducted at a minimum on one weekday and one weekend day to account for day of the week variations as truck flows are typically lower on the weekends than on weekdays.
Given the number of sites proposed for Tex-as (i.e., 96 sites), TxDOT is advised to schedule the seasonal surveys over a two month period. In scheduling the surveys, considerable care should also be taken to reduce the probability of survey-ing the same flow of trucks at more than one site.
The truck roadside intercept surveys conducted by Washington State University were conducted at weigh stations and ports of entry (Casavant, Gil-lis, Blankenship, and Howard, Jr. 1995).
29
fy and support needed freight investments, and (d) share examples of best practices from other groups in other states (Freight Stakeholders National Net-work, nd).
SamplingSampling Trucking CompaniesFor data collected from a sample, sample size
is a key determinant of data quality and reliability, but also of cost. Statistical formulas exist to de-termine the number of trucking companies that have to participate in a data sharing arrangement with TxDOT to ensure a statistically representative sample (see Text box). It is suggested that a ran-dom sample of trucking companies are selected and approached to participate in the data sharing initiative. Once the sampled list of trucking com-panies has been determined, TxDOT should in-volve, among others, the TMTA and Metropolitan Planning Organizations with freight committees to identify the appropriate contact person in each company.
According to the TxDOT Motor Carrier Regis-tration Database, a large number of trucking com-panies in Texas (approximately 41 percent) have only a single truck insured. It is foreseen that these smaller companies will be particularly challenging to involve in a data sharing relationship, because the owner is frequently the driver of the truck.
Sampling ShipmentsSimilar to the approach adopted by the Com-
modity Flow Survey, it is recommended that the trucking companies are asked to provide TxDOT with data on the value, weight, commodity, origin,
Determiningthe Sample Size
The following statistical formula can be used to calculate the appropriate sample size:
Where,n = Number of trucking companies to be included in the sampleZ = Critical value corresponding to a specified confidence levelE = Margin of error
�
��� �������
��� ∝
�∝��
30
destination, and whether it is a truckload or less-than-truckload shipment for all their shipments in an assigned week four times a year. For shipments that include more than one commodity, the truck-ing company will be asked to report the major commodity in terms of shipment weight.
Data CollectionTo minimize the data reporting cost burden
imposed on participating trucking companies, electronic reporting options need to be explored. The 2002 Economic Census developed survey software that allowed for the importation of busi-ness data directly from company spreadsheets, thus reducing the burden on respondents in an effort to encourage participation in the survey (National Research Council of the National Acad-emies, 2003). Electronic reporting will also reduce the cost of data entry for TxDOT and reduce re-porting errors.
Since some larger trucking companies already use the internet to transmit manifest information among the shipper, carrier, and truck driver it is assumed that the internet can also be used to share relevant data with TxDOT. Options to transmit this information securely using Secure Socket Layers (SSL) and encryption are available.
During the discussions with the eight trucking company representatives it became apparent that it will be more difficult for smaller trucking com-panies to use electronic reporting options since their systems are not as sophisticated. To ensure participation, every effort should thus be made to ensure that the labor cost burden imposed on trucking companies in compiling the data, espe-
“For the 2002 CFS, each establishment was as-signed a 1-week reporting period every quarter, for a total of 4 weeks in the calendar year. By assign-ing different reporting periods to different es-tablishments, the sample covered all 52 weeks of the year” (National Research Council of the National Academies, 2003).
7
To ensure geographical coverage of the state of Texas and to account for variations in the char-acteristics of trucks that use different roadways, it is recommended that a total of 96 sites be identified: three sites per major highway type (i.e., interstate, state highway, Texas highway, and farm-to-mar-ket/ranch-to-market) in each of the eight NTARs in Texas. In selecting the location of the survey stations, care should be taken to ensure that a sig-nificant proportion of the inter-urban freight trips can be captured in an average week.
The vendors should visit each of the roadway sections to determine an appropriate site where surveys can be conducted, i.e., weigh stations, truck rest stops, etc. Attention should be paid to existing roadway conditions, sight distances, pre-vailing vehicle speeds, and the presence of shoul-ders and auxiliary lanes. After determining the fea-sibility of the sites as interview sites, it is important to obtain the required permission for collecting data at these sites. The necessary permits to con-duct surveys at public right-of-way locations can be obtained from TxDOT districts having jurisdic-tion over the roadways at each station site. Finally, Traffic Control Plans should be prepared, detailing the existing roadway geometry, the types of traffic control devices that will be used, and areas of ref-uge for the interviewers at roadside locations.
Who to Sample?Although it seems reasonable to follow a sys-
tematic sampling approach where every nth ve-hicle is sampled, the objective should be to inter-view as many trucks as possible given available space and an interviewer to administer the survey.
enabled interviews to be completed for 60-80% of the trucks passing through the station during its open hours. The sites with a higher volume saw between 5% and 20% of the total trucks being surveyed. The low-est percentage of trucks interviewed were at those sites where there was a high volume of truck traffic at the weigh station, and addi-tional trucks were utilizing WSDOT’s Commercial Vehicle Information System Network (CVISN) bypass program” (Jessup, Casavant, and Lawson, 2004).
6
to provide insight into answering three questions:
•Where to sample? In other words, how to select appropriate sites and roadways where roadside intercept surveys can be conducted. • Who to sample? In other words, which trucks at the sites. • When to sample? In other words, which days of the week and seasons to account day-of- the-week and seasonal variation.
Site Selection: Identification of Geographically Dispersed SitesThe optimal sample size is not only influ-
enced by the level of reliability that is required, but also the total cost of implementing the survey. The latter would be largely a function of the de-gree of geographical coverage and the number of days surveyed. In identifying the physical roadway sections for the roadside intercept surveys the fol-lowing should thus be considered:
• Texas's eight National Transportation Analy - sis Regions (NTARs) to ensure geographical coverage; • Non-urban roadway sections to capture county-to-county movements; • Roadway functional system to capture truck movements on all major road classes, and • Traffic volume and vehicle classification to ensure a significant volume of daily truck traffic traverses the roadway section.
The…EWITS study outlined a goal of stopping one out of ten trucks on the I-5 corridor, one out of five trucks on the other major corridors and one out of two trucks at the sites with the lowest truck traffic volumes. However, the SFTA goal was to maxi-mize the number of vehicles surveyed at each site; therefore, trucks were stopped and interviewed if there was a) space available to safely park them and b) there was an inter-view person avail-able to immediately interview the driver. At the lower volume sites, this approach(Continued... gray box next page)
31
cially the smaller companies, is minimized. Most of the trucking companies, however, agreed that submitting the data electronically will enhance their participation. For the larger trucking com-panies with computerized systems, it will be rela-tively easy to run queries and provide TxDOT with the data needed as the requested data is readily available in their systems.
Data ExpansionThe data expansion procedure would be
similar as for the roadside intercept surveys. The sample data obtained can be expanded to reflect the truck travel characteristics for the population of trucking companies by using the inverse of the sampling rate. For example if 10 percent of the trucking companies of a particular size were surveyed the expansion factor would be 100/10, which equals 10. This first weight is used to ex-pand the sample data for each season to reflect the characteristics of the population for that week and season.
The objective of the second weight is to deter-mine the characteristics of the population across seasons. In other words, to determine the char-acteristics of the Average Annual Weekly Truck Trips. This is achieved by calculating the weighted average factors across the four seasons and apply-ing this factor to the expanded sample data (see Data Expansion, page 21).
32
Collecting primary truck travel data through either of these two approaches will inevitably be more costly than purchasing the Reebie TRAN-SEARCH database or estimating county-level truck travel data from publicly available data sources, such as the CFS. However, done correctly, both these approaches will provide TxDOT with more reliable and robust truck travel data for statewide planning.
It is estimated that surveying 96 sites one day per week four times per year would cost TxDOT in excess of $5 million using the bid prices of survey-ing companies for 2004 as the benchmark. Since there is no precedent for collecting statewide truck travel data through a data sharing partnership with trucking companies, it is more difficult to estimate the costs associated with this approach. It is, how-ever, foreseeable that this will entail a large upfront cost arising from the recruitment of trucking com-panies, the development of software to minimize the burden on trucking companies in submitting the data, and finally labor costs associated with compiling and managing the database. The recur-ring annual costs would, however, be limited to liaising with the companies, compiling and man-aging the database. Of the two approaches it is thus anticipated that a truck data sharing partner-ship with trucking companies will be more cost-effective than the truck intercept survey approach. Although still costly, this approach is worth further consideration by TxDOT.
Ultimately, higher truck travel data collection costs should be weighted against the benefits of reliable truck travel data that can be used to deter-mine the impacts of truck traffic on mobility, sys-
Concluding Remarks and Recommendations
5
flows for all major Washington highways through an extensive program of statewide origin-destina-tion truck intercept surveys of truck drivers. Valu-able lessons learned and innovative practices em-ployed in both these studies are highlighted in text boxes throughout this section of the guidebook to illustrate or emphasize certain aspects of this ap-proach.
Finally, it has to be mentioned that TxDOT has detailed specifications for conducting external sta-tion surveys (see Specification No.: TxDOT 968-85-20*). The external station survey specification "describes service to conduct interviews, surveys, geocode and report data, provide traffic control and automatic vehicle classification counts in the study area..." (TxDOT, 2003). The objective of this section of the document is thus not to replace, contradict or replicate the specifications used by TxDOT. Rather it is anticipated that the informa-tion provided in this section of the guidebook can be used as a framework to modify the specifica-tions in the future when a decision is made to col-lect truck travel data for the SAM through roadside intercept surveys.
Data Collection and SamplingSince it is impossible to intercept every single
truck that travels to, from, in or through Texas, inferences or predictions about the population of trucks are typically made from an appropriately selected sample. Sampling results in savings in re-sources, money, and time. Incorrect sampling pro-cedures or human judgment may, however, cause bias and result in the collection of unreliable data (Snedecor, 1989). The objective of this section is
National Transportation Analysis Regions (NTARs) have been defined by the U.S. Department of Trans-portation (DOT) to collect interregional freight movement data for the Commodity Flow Survey (CFS). These NTARs were designed considering, among other factors, functional geography and size. Functional geography attempts to include population or economic activ-ity centers to ensure that most of the origins, destinations, or transfers of long distance commodity movements are cap-tured. Size attempts to ensure that more long distance movements to and from other re-gions than within the region are captured. Ultimately, the NTARs were decided by com-bining and adjusting the BEA Economic Area boundaries before the changes to the BEA boundaries in 1995.(Source: BTS, 1996)
4
IntroductionPrimary freight data collection efforts involve
collecting truck travel data directly from the freight community (i.e., shippers, carriers, receivers, and freight forwarders) through surveys, including roadside intercept surveys, mail-out/mail-back questionnaires, combined telephone-mail-out/mail-back questionnaires or telephone interviews. Done correctly, these survey methods are, in gen-eral, the most reliable and accurate methods of ob-taining truck travel data for statewide freight plan-ning programs. This guidebook discusses two data collection approaches - roadside intercept surveys and truck carrier participation - that showed the most promise of providing TxDOT with statistical-ly reliable and verifiable truck travel data is to be used in the freight model of the Statewide Analy-sis Model (SAM). For a detailed discussion of the short term and intermediate long term options for collecting truck travel data available to TxDOT, the reader is referred to Research Report 0-4713-1 entitled "Securing Truck Data for Texas."
Few states have relied on collecting primary truck travel data for statewide modeling or plan-ning, partly because this can be costly and time-consuming at the state level. The exception has been Washington State's Eastern Washington Intermodal Transportation Study (EWITS) and the subsequent Strategic Freight Transportation Analy-sis (SFTA) study. The objective of both these stud-ies has been to provide Washington with useful freight movement data and statistically reliable in-formation on truck characteristics and commodity
RoadsideInterceptSurveys
33
tem performance, the safety of the road network, and the funding of the state-maintained road in-frastructure.

34 3
Table of Contents
Introduction ................................................................................................................4Roadside Intercept Survey ........................................................................................4
Data Collection and Sampling...........................................................................................5- Site Selection: Identification of Geographically Dispersed Sites ....................6- Who to Sample? ..............................................................................................................7- When to Sample? ............................................................................................................8
Recruiting Survey Personnel .............................................................................................9Training Survey Personnel ............................................................................................... 10Survey Equipment Needs ...................................................................................................11Commercial Vehicle Enforcement Officers and Public Notification ................12Survey Design ........................................................................................................................12Interview Procedure ............................................................................................................17Data Quality Control .........................................................................................................18Data Entry and Clean Up................................................................................................. 19Data Expansion ......................................................................................................................21Unforeseen Circumstances ............................................................................................. 24
Truck Carrier Participation ....................................................................................25Identification and Recruitment of Trucking Companies ..................................... 25Sampling ................................................................................................................................ 29
- Sampling Trucking Companies ............................................................................... 29- Sampling Shipments .................................................................................................... 29
Data Collection ...................................................................................................................30Data Expansion ......................................................................................................................31
Concluding Remarks and Recommendations ...................................................... 32References ..................................................................................................................35
2
Performing Organization:Center for Transportation Research,The University of Texas at Austin3208 Red River, Suite 200Austin, Texas 78705-2650
Sponsoring Organization:Texas Department of Transportation,Research and Technology Implementation OfficeP.O. Box 5080Austin, Texas 78763-5080
Project conducted in cooperation with the Texas Department of Transportation and the Federal Highway Commission.
Abstract: In August 2003, the Texas Department of Trans-portation (TxDOT) contracted with the Center for Transportation Research at The University of Texas at Austin to recommend a robust meth-odology to TxDOT planners for collecting and maintaining inter-county and interstate truck travel data in a format required for the Statewide Analysis Model (SAM). This guidebook discusses two data collection approaches — roadside intercept surveys and truck carrier participation — that showed the most promise of providing TxDOT with statistically reliable and verifi-able truck travel data over the next three to five years.
Keywords:Truck travel data, statewide planning, roadside intercept surveys, truck car-rier participation.
No. of Pages:
36
35
References
Bureau of Transportation Statistics. 1996. "How National Transportation Analysis Regions (NTARs) Were Defined for CFS," February 19.
Available at: http://www.bts.gov/programs/commodity_flow_survey/Casavant, K.L., W.R. Gillis, D. Blankenship, and C. Howard, Jr. 1995.
"Survey Methodology for Collecting Freight Truck and Destination Data." Transportation Research Record 1477, Washington DC.
Federal Highway Administration. 1996. "Quick Response Freight Manual: Final Report." Prepared by Cambridge Systematics, Inc., Comsis Corporation, University of Wisconsin, Milwaukee, September.
Gillis, W.R. 1994. "Washington State Freight Truck Origin and Destination Study: Methods, Procedures, and Data Dictionary." EWITS Research Report Number 3, Washington.
Jessup, E., K.L. Casavant, and C.T. Lawson. 2004. "Truck Trip Data Collection Methods: Final Report." Pullman, Washington: Department of Agricultural and Resource Economics at the Washington State University, Report Number SPR 343, February.
National Research Council of the National Academies. 2003. "Measuring Personal Travel and Goods Movement: A Review of the Bureau of Transportation Statistics Surveys." Transportation Research Board Special Report 277, Washington DC.
Strategic Freight Transportation Analysis. 2002-2003. Training Packet for Origin and Destination Survey Volunteers.
Texas Department of Transportation. 2003. "External Station Travel Surveys." Specification No.: TxDOT 968-85-20*, Texas Department of Transportation: General Services Division, Revised: December.
Transportation Research Board. 2003. "Special Report 276: A Concept for a National Freight Data Program," Prepared by the Committee on Freight Transportation Data: A Framework for Development, Washington, D.C.

Center for Transportation ResearchThe University of Texas at Austin
3208 Red RiverAustin, TX 78705
Phone: (512) 232-3100
To order reports: (512) 232-3126 (CTR Library)Fax: (512) 232-3088 (CTR Library)E-mail: [email protected]
Web site: www.utexas.edu/research/ctrCTR Library Web site: http://library.ctr.utexas.edu/index.htm
Texas Truck Data Collection Guidebook
Jolanda ProzziCarleton WongRob Harrison
0-4713-P4
October 2004
Center for Transportation ResearchThe University of Texas at Austin
www.utexas.edu/research/ctr/pdf_reports/0_4713_P4.pdf