Embed Size (px)
Citation preview
Texas Tech University, Madhusudhan R. Pallaka, December 2019
0
Calorimetric Characterization of Nanoconfined Melts, Glasses and Reactive Monomers
by
Madhusudhan R. Pallaka, B.Tech Chemical Engineering
A Dissertation
In
Chemical Engineering
Submitted to the Graduate Faculty
of Texas Tech University in
Partial Fulfillment of
the Requirements for
the Degree of
DOCTOR OF PHILOSOPHY
Approved
Dr. Sindee L. Simon
Chair of Committee
Dr. Gregory McKenna
Dr. Wei Li
Dr. Jingjing Qiu
Dr. Mark Sheridan
Dean of the Graduate School
December 2019

Texas Tech University, Madhusudhan R. Pallaka, December 2019
0
Copyright 2019, Madhusudhan R. Pallaka
Texas Tech University, Madhusudhan R. Pallaka, December 2019
ii
ACKNOWLEDGEMENTS
PhD has been an emotional journey – lots of downs, lots of nothingness, and a
few ups. At the end of the day, all I strive for are those “few ups”. Those “few ups”
would not have been possible without strong, motivational and good people around me.
I would like to first thank my research advisor, Dr. Sindee Simon, for being a
constant source of motivation throughout my doctoral studies, without her support and
guidance I would not have made it this far. I hope the mentee-mentor relationship
continues for years to come. I would also like to thank Dr. Gregory McKenna for his
insightful polymer and viscoelasticity lectures, general research advice, and for allowing
me to use his lab facilities. I would also like to thank Dr. Wei Li, Dr. Jingjing Qiu, and
Dr. Burak Aksak for their time and also for agreeing to be a part of my PhD defense
committee.
I would also like to acknowledge Dr. Daniel Unruh for his insight and assistance
with X-ray diffraction experiments. I would also like to thank Dr. Kristin Hutchins for
allowing me to use the GPC instrument for polymer molecular weight measurements. I
would also like to thank Dr. Heedong Yoon, Qi Li, Amer and Dejie Kong for their
tassistance in AFM measurements. I am also extremely grateful for Dr. Yung Koh’s
invaluable help and advice. I would also like to thank all of Dr. Simon’s group members -
it was a wonderful experience working with you all. I would like to specially thank Naz,
Dr. Zhiyuan Qian, Qian, Rozana, and Alex for their friendship and fruitful research
collaborations.
Texas Tech University, Madhusudhan R. Pallaka, December 2019
iii
To my undergraduate and school friends - Firstly, I would like to thank my dear
friend Rohit Joshi who motivated me to take up the mammoth task of pursing a PhD in
chemical engineering. I would also like to thank Dilip and Prashant for their continued
support and camaraderie. Shanker, Goutham and Abhitej, I thank each one of you for
putting up with me for 18 long years. I hope you guys never get to read this!
To my Lubbock friends – Apoorva, Srinivas, Malini, Chumki, Sriram, Ashwin,
Dinesh, Iyeswaria, Chandu, Bala, Srikant and Sagnik. I have had the best of my times
with you all, a big thank you for your friendship.
I cannot end this acknowledgement without thanking my “bestest” and sweetest
friend, Richa. I can proudly say that you are my best friend, hands down! I am extremely
thankful for your selfless friendship, motivation, care, and best of all, for being an ear to
all my problems. I cannot thank you enough for what you have done for me.
To my family – I would like to thank Malli mama, Ratna akka, Venkat bava garu
Latha akka, Chatterjee uncle and Shibani aunty, for being my family away from home. I
would also like to thank my grandmother, Eswaramma, for always being the first one to
support me in all my endeavors – you never stop to inspire me! Thank you, Anil bava,
Raghu anna, Leela akka, Sailu akka and Pedamma for your love and support.
Lastly, my parents and sister – Thank you, Amma, Nanna, and Chinnu, for being
my source of strength and encouragement through thick and thin. Thank you, Amma and
Nanna, for letting me follow my dreams, for teaching me grit, patience and perseverance.
Thank you, Chinnu, for your love and support, and for being my stress buster. Lastly,
thank you all for making this journey with me.
Texas Tech University, Madhusudhan R. Pallaka, December 2019
iv
TABLE OF CONTENTS
ACKNOWLEDGEMENTS ................................................................................................ ii
ABSTRACT ...................................................................................................................... vii
LIST OF TABLES ............................................................................................................. ix
LIST OF FIGURES ............................................................................................................ x
1. INTRODUCTION .......................................................................................................... 1
References ....................................................................................................................... 5
2. BACKGROUND ............................................................................................................ 7
2.1 Differential and fast scanning calorimetry ................................................................ 7
2.2 Melting and melting behavior under nanoconfinement ............................................ 9
2.3 Glass transition and Glass transition behavior under nanoconfinement ................. 12
2.4 Structural recovery and structural recovery under nanoconfinement ..................... 19
2.5 Step-growth polymerization under nanoconfinement ............................................. 25
References ..................................................................................................................... 28
3. MATERIALS ................................................................................................................ 54
3.1 Nanopore confinement ............................................................................................ 54
3.2 n-alkanes.................................................................................................................. 55
3.3 Polystyrene films on different substrates ................................................................ 55
3.4 Indium and vapor-deposited gold ............................................................................ 56
3.5 AAO supported and stacked polystyrene nanorods ................................................ 57
3.6 Epoxy-amine monomer mixture for linear epoxy polymerization .......................... 59
References ..................................................................................................................... 60
4. MELTING BEHAVIOR OF N-ALKANES IN ANODIC ALUMINUM OXIDE
(AAO) NANOPORES USING FLASH DIFFERENTIAL SCANNING
CALORIMETRY .......................................................................................................... 66
4.1 Introduction ............................................................................................................. 66
4.2 Experimental ........................................................................................................... 67
4.2.2 Methodology .................................................................................................... 67
4.3 Data analysis ........................................................................................................... 69
4.3.1 Symmetry analysis ........................................................................................... 69
4.4 Results ..................................................................................................................... 72
4.4.1 Melting of C16 in the bulk and AAO nanopores ............................................... 72
Texas Tech University, Madhusudhan R. Pallaka, December 2019
v
4.4.2 Solid-solid transition and melting of C19 in bulk and AAO nanopores ............ 73
4.5 Discussion ............................................................................................................... 75
4.6 Conclusions ............................................................................................................. 78
References ..................................................................................................................... 80
5. ORIGIN OF THE BROAD ENDOTHERMIC PEAK OBSERVED AT LOW
TEMPERATURES FOR POLYSTYRENE AND METALS IN FLASH
DIFFERENTIAL SCANNING CALORIMETRY ....................................................... 93
5.1 Introduction ............................................................................................................. 93
5.2 Experimental ........................................................................................................... 94
5.2.1 Methodology .................................................................................................... 94
5.3 Results ..................................................................................................................... 98
5.3.1 Aging of polystyrene on different substrates ................................................... 98
5.3.2 Cooling rate dependence of polystyrene on different substrates .................... 100
5.3.3 Cooling rate dependence and aging of indium and vapor-deposited gold ..... 102
5.4 Discussion ............................................................................................................. 104
5.5 Conclusions ........................................................................................................... 107
6. THE GLASS TRANSITION BEHAVIOR OF ANODIC ALUMINUM OXIDE
(AAO) SUPPORTED AND STACKED POLYSTYRENE NANORODS USING
FLASH DIFFERENTIAL SCANNING CALORIMETRY ....................................... 122
6.1 Introduction ........................................................................................................... 122
6.2 Experimental ......................................................................................................... 125
6.2.1 Methodology .................................................................................................. 125
6.3 Results ................................................................................................................... 128
6.3.1 Stacked PS nanorods in ionic liquid ............................................................... 128
6.3.2 AAO supported PS nanorods ......................................................................... 131
6.3.3 Low temperature endotherm in stacked and AAO supported PS nanorods ... 132
6.4 Discussion ............................................................................................................. 134
6.5 Conclusions ........................................................................................................... 137
References ................................................................................................................... 139
7. ENTHALPY RECOVERY OF 2D STACKED POLYSTYRENE
NANORODS USING FLASH DIFFERENTIAL SCANNING CALORIMETRY ... 155
7.1 Introduction ........................................................................................................... 155
7.2 Experimental ......................................................................................................... 157
7.2.1 Methodology .................................................................................................. 157
Texas Tech University, Madhusudhan R. Pallaka, December 2019
vi
7.3 Results and discussion ........................................................................................... 161
7.4 Conclusions ........................................................................................................... 169
References ................................................................................................................... 171
8. REACTION KINETICS OF LINEAR EPOXY POLYMERIZATION IN CPG
NANOPORES ............................................................................................................. 182
8.1 Introduction ........................................................................................................... 182
8.2 Experimental ......................................................................................................... 183
8.2.1 Methodology ...................................................................................................... 183
8.3 Results ................................................................................................................... 184
8.4 Discussion ............................................................................................................. 191
8.5 Conclusions ........................................................................................................... 192
References ................................................................................................................... 193
9. CONCLUSIONS......................................................................................................... 205
10. FUTURE WORK ...................................................................................................... 210
10.1 Glass transition behavior and structural recovery of polynorbornene
thin films using Flash differential scanning calorimetry ................................... 210
10.2 Glass transition behavior and enthalpy relaxation of thermoplastic
epoxy reinforced with multi-walled carbon nanotubes using Flash DSC........... 211
10.3 Obtaining three Kovacs’ signatures of structural recovery for 20 nm
stacked PS rods and 20 nm ultrathin PS film, and modeling with
the modified TNM model ................................................................................... 212
10.4 Reaction kinetics of alumina and silica filled epoxy polymerization ................. 213
References ................................................................................................................... 215
Texas Tech University, Madhusudhan R. Pallaka, December 2019
vii
ABSTRACT
Nanoconfined materials exhibit altered and interesting behavior different from the
bulk. Understanding the behavior of nanoconfined materials is of great importance to
both nanoscience and nanotechnology communities. This work aims to elucidate the
effect of nanoconfinement on melting, the glass transition and associated structural
relaxation kinetics, and reactivity using Flash and conventional differential scanning
calorimetry.
The feasibility of anodic aluminum oxide nanopores (AAO) as a form of 2D
nanoconfinement on the Flash DSC is investigated by studying the melting behavior of n-
hexadecane and n-nonadecane. Depressed melting and solid-solid transition temperatures
are observed in the AAO nanopores which validates the use of AAO as a
nanoconfinement matrix. The results suggest an abnormal melting behavior in the AAO
nanopores which is investigated using X-ray diffraction.
The glass transition behavior of 20, 55, and 350 nm AAO supported and stacked
polystyrene (PS) nanorods is studied using Flash DSC. The results indicate that the glass
transition temperatures are depressed for stacked PS nanorods less than 100 nm; on the
other hand, bulk-like behavior is observed for AAO supported PS nanorods irrespective
of rod diameter. The effect of spatial dimensionality on glass transition behavior is also
investigated.
The structural recovery kinetics of 20 and 350 nm stacked PS nanorods is
investigated using Flash differential scanning calorimetry. The results indicate an
enhanced overall structural recovery rate for 20 nm stacked PS rods when compared to
Texas Tech University, Madhusudhan R. Pallaka, December 2019
viii
350 nm stacked PS rods. Importance of comparing structural recovery rates at same
distances from their respective glass transition temperature is highlighted. In addition, the
effect of spatial dimensionality on structural recovery is also investigated using a
relaxation time map.
The reaction kinetics of step-growth linear epoxy polymerization is studied in
CPG nanopores using conventional DSC. The results suggest an enhanced reaction in the
nanopores. The glass transition behavior of cured linear epoxy polymer is also studied.
In addition to the nanoconfinement effects, the current controversies regarding the
mechanisms of structural recovery are also investigated.
Texas Tech University, Madhusudhan R. Pallaka, December 2019
ix
LIST OF TABLES
3.1 Specifications of AAO nanopore templates. ………………………… 64
3.2 Specifications of CPG nanopores. …………………………………… 65
3.3 Polystyrene Molecular weights from GPC. ………………………….. 66
4.1 Liquid state specific heat capacities, Cp = a + bT + cT2 with T in K. 85
5.1 Summary of sample masses, substrate types or conditions. …………. 111
5.2 WLF parameters for PS on top of different substrates for ∆Tf, Hi+Lo in
Figure 5.5.c. ………………………………………………………….. 112
6.1 WLF parameters C1 and C2; fragility and activation Energy of
stacked PS rods in ionic liquid*, AAO supported PS rods*, PS thin
films, and bulk PS. ……………………………………………………
144
7.1 WLF parameters C1 and C2; fragility and activation Energy of 20 and
350 nm stacked PS rods dispersed in ionic liquid, 20 nm ultrathin PS
films, and bulk. ………………………………………………………. 174
8.1 Kinetic parameters from the autocatalytic model for bulk. Kinetic
Parameters from the second order model for 55 and 7.5 nm CPG. ...... 197
8.2 Summary of glass transition temperature, step change in heat
capacities for epoxy polymer synthesized in bulk, 55 and 7.5 nm
CPG……………………………………………………………………
198
Texas Tech University, Madhusudhan R. Pallaka, December 2019
x
LIST OF FIGURES
2.1 Schematic of a DSC heating scan with glass transition, melting, and
an exothermic reaction. ………………………………………………. 43
2.2 Schematic of a UFS 1 sensor (reproduced from [14] with permission
from Elsevier). The inset image shows the heating area of UFS1 chip
sensor marked with an orange boundary. ……………………………
44
2.3 Enthalpy versus temperature schematic for melting transition. ……… 45
2.4 Schematic of a heat flow scan showing depressed melting point in
overfilled nanopores. ………………………………………………… 46
2.5 Enthalpy versus temperature schematic of glass transition on cooling. 47
2.6 Enthalpy versus temperature schematic for fictive temperature
obtained on heating. ………………………………………………… 48
2.7 Schematic showing DSC traces obtained on heating after cooling
different rates. Fictive temperature calculation using Moynihan’s
method. ……………………………………………………………… 49
2.8 (a) Schematic of enthalpy recovery during isothermal aging at Ta (b)
Enthalpy recovery of polystyrene for intrinsic isotherm experiments.
(adapted from Lopez and Simon [126] with permission from ACS) ... 50
2.9 (a) Schematic of asymmetry of approach experiment, where down
and up jumps are made from equilibrium (b) Enthalpy recovery of
polystyrene for down and up jump experiments showing asymmetry
of approach. (adapted from Lopez and Simon [126] with permission
from ACS) ……………………………………………………………
51
2.10 (a) Schematic of memory effect experiment, where Ta is reached in
two steps: 1) a down jump to T1 from To and partial aging at T1 until
fictive temperature equals Ta, 2) a final jump from partially aged state
to Ta (b) Enthalpy recovery of polystyrene demonstrating memory
effect. (adapted from Lopez and Simon [126] with permission from
ACS) ………………………………………………………………… 52
Texas Tech University, Madhusudhan R. Pallaka, December 2019
xi
2.11 (a) Enthalpy versus temperature and (b) Heat flow versus temperature
schematics showing the broad low-temperature endotherm. ………… 53
3.1 Preparation of AAO supported and stacked PS nanorods using
vacuum melt infiltration technique. ………………………………… 61
3.2 Scanning electron micrographs of PS nanorods after dissolving the
AAO and before and after separation from the film substrate. The
samples were sputtered with a thin layer of iridium (2- 5 nm) before
imaging. ……………………………………………………………… 62
4.1 Flash DSC chip with AAO template in the heating area. …………… 84
4.2 (a) symmetry analysis for a heat flow scan with phase transition of
C16 in AAO. The heat flow scans in red and blue represent the raw
data. The sections highlighted in black on the red and blue curves are
the regions chosen to determine the symmetry line. The orange line
denotes the symmetry line that is to be subtracted from the raw data.
(b) Corrected heat capacity data of Figure 4.2.a after symmetry
analysis. (The y-axis is labelled positive on either side of the zero-
axis since the heat capacity of a material is always positive.) ……… 85
4.3 A schematic of overfilled and underfilled nanopores. Resolved peaks
after deconvolution of overfilled pores are shown in green and red for
confined and bulk melting, respectively. …………………………… 86
4.4 Heat flow data for n-hexadecane in bulk and (a) 55 nm AAO pores
(b) 20 nm AAO pores; the melting in the nanopores is shown as a
function of pore fullness. The bulk melting peak obtained by
deconvolution is indicated by arrows for the bulk and overfilled pores 87
4.5 Heat flow data for bulk n-nonadecane and n-nonadecane in (a) 55 nm
AAO pores and (b) 20 nm AAO pores. The heat flow data for
nanoconfined C19 with varying pore fullness is also presented. …… 88
4.6 The magnitude of the melting point depression for C16 in 55 and 20
nm AAO pores (inverted solid red triangle), Linear fit through the
ΔTms of 55 and 20 nm AAO pores (red dashed line), experimental
data for silica-gel nanopores as function of inverse pore diameter
from reference 11 (upright brown triangles), linear fit through the
ΔTms of 55 nm AAO and silica-gel nanopores (brown dashed line),
experimental data for KIT-6 (solid purple square); SBA-15 (solid
lime green diamond); C-SBA-15 (cyan right angled triangle); native
CPG (solid green circles) from reference 40, experimental data for
silanized CPG as a function of inverse pore diameter from reference
13 (open blue circles). Also shown are the Gibbs-Thomson (G-T)
predictions of ΔTm using Equation 2.1 with the surface energy from 89
Texas Tech University, Madhusudhan R. Pallaka, December 2019
xii
reference 13 (blue dashed line). The properties of aforementioned
nanopore matrices are summarized in the appended table. …………
4.7 ∆Tm vs 1 d⁄ (solid red circles) and ∆Tss vs 1 d⁄ (purple solid squares)
of C19 in AAO nanopores. The red dashed line and purple solid line
are obtained by linear regression of the presented data. …………… 90
4.8 (a) Overlaid Powder X-ray patterns of C16 in bulk (red), in 55 nm
AAO pores (green) and in 18 nm AAO pores (blue) at -18 °C. (b)
Overlaid Powder X-ray patterns of C19 in bulk (red), in 55 nm AAO
pores (green) and in 18 nm AAO pores (blue) at room temperature. 91
5.1 Evolution of DSC scans of polystyrene on a bare chip at Ta = 20.5 °C
as a function of aging time (ta) (b) Excess specific heat of polystyrene
film aged for 8 hours on different substrates at Ta = 20.5 °C
(deconvoluted peaks of polystyrene film on a bare chip are shown as
dashed lines). ………………………………………………………… 113
5.2 (a) Enthalpy of aging (ΔHa) as a function of aging time for
polystyrene on different substrates (b) The change in fictive
temperature (ΔTf = Tf0 – Tf(ta)) as a function of aging time for
polystyrene on different substrates. The solid symbols represent ΔHa
and ΔTf that were obtained inclusive of both low and high
temperature endotherms and the open symbols represent those
obtained only from high temperature endotherms. …………………
114
5.3 Evolution of DSC scans of polystyrene as a function of different
cooling rates on different substrates scanned to (a) 30 °C and (b) -80
°C. …………………………………………………………………… 115
5.4 Limiting fictive temperatures as a function of cooling rate for
polystyrene on different substrates when scanned to (a) 30 °C and (b)
-80 °C. In case of limiting fictive temperatures when scanned to -80
°C, the low temperature endotherm is excluded. Also shown are
results from our earlier studies. ……………………………………… 116
5.5 (a) Excess specific heat scans of polystyrene on top of different
substrates at a cooling rate of 0.1 K/s with 1000 K/s as the reference
curve. (b) Enthalpy values of polystyrene on top of different
substrates as a function of cooling rates (c) The change in fictive
temperature corresponding to the values in Figure 5.5.b as a function
of cooling rates. The solid and open symbols correspond to values
excluding the low temperature endotherm and values including the
low temperature endotherm, respectively. The WLF fits are shown as
solid lines. …………………………………………………………… 117
Texas Tech University, Madhusudhan R. Pallaka, December 2019
xiii
5.6 (a) Cooling rate dependent melting scans of Indium. (b) Aging time
dependent melting scans of indium obtained at an aging temperature
of 20.5 °C. (c) Excess specific heat of melting of indium at various
cooling rates with respect to 1000 K/s. (d) Excess specific heat of
melting of indium at various aging times with respect to the unaged
scan. In all cases indium was cooled to -80 °C before obtaining the
heating scan. …………………………………………………………
118
5.7 Cooling rate dependent melting scans of indium when scanned to 30
°C. …………………………………………………………………… 119
5.8 (a) Cooling rate dependent and (b) aging time dependent heat flow
scans of gold at Ta = 20.5 °C. Gold was deposited at two substrate
temperatures, Ts = 23 °C and 125 °C. The inset figures show data at a
substrate temperature of 125 °C. ……………………………………
120
5.9 (a) ΔH vs log q and (b) ΔH vs log ta for indium, and gold at Ts = 23
°C and 125 °C. ……………………………………………………… 121
6.1 (a) Averaged heat flow scans of stacked 20 nm polystyrene rods
dispersed in ionic liquid at a heating rate of 600 K/s after cooling at
rates varying from 0.1 to 1000 K/s. (b) Comparison of averaged
specific heat vs temperature data of different sizes of stacked
polystyrene rods dispersed in ionic liquid at various cooling rates. … 145
6.2 Fictive temperature as a function of cooling rate for 20, 55 and 350
stacked polystyrene rods dispersed in ionic liquid compared with
bulk data from previous work. The solid lines are the WLF fits
obtained from the parameters listed in Table 6.1. …………………… 146
6.3 Comparison of specific heat flow scans of annealed 20 nm stacked
PS rods and 20 nm Stacked PS rods before annealing. ……………… 147
6.4 Heat flow scans of polystyrene nanorods supported in (a) 20 nm
AAO (b) 55 nm AAO (c) 350 nm AAO. …………………………… 148
6.5 Limiting fictive temperatures as function of cooling rate for
polystyrene nanorods supported in 20 nm AAO, 55 nm AAO, 350 nm
AAO; the data is compared to stacked PS nanorods and bulk films
from previous studies. ……………………………………………… 149
Texas Tech University, Madhusudhan R. Pallaka, December 2019
xiv
6.6 (a) Low temperature heat flow scans of 20 nm stacked PS rods on
bare chip and dispersed in ionic liquid (b) excess specific heat flows
of 20 nm stacked PS rods on bare chip and ionic liquid at 0.1 K/s
with respect to 1000 K/s, inset shows excess specifc heats as a
function of cooling rate for 20 nm stacked PS rods on bare chip. ……
150
6.7 Change in fictive temperatures for 20 nm stacked PS rods on bare
chip and dispersed in ionic liquid as a function of cooling rate, inset
shows fictive temperatures of the same samples as a function of
cooling rate. ………………………………………………………… 151
6.8 (a) Low temperature heat flow scans of AAO supported rods 20 nm
polystyrene nanorods (b) excess specific heat data of AAO supported
20 nm polystyrene nanorods for various cooling rates with respect to
1000 K/s. …………………………………………………………… 152
6.9 Magnitude of Tg depressions at 0.1 K/s (6 K/min) for different sizes
of stacked PS rods in ionic liquid (filled green circles), single
ultrathin PS films (filled red squares), PS nanowires in aqueous
dispersion (filled lime green left-angled triangles), PS nanospheres in
aqueous dispersion (filled pink diamonds), and PS nanospheres (open
diagonal square). The black dashed lines are Roth and Dutcher’s
upper and lower limits, the solid black line is obtained from modified
Keddie and Jones’ data. ………………………………………………
153
6.10 Magnitude of Tg depressions for different sizes of AAO Supported
PS nanorods from this work (left corner-filled green squares;
Torkelson and co-workers31 (solid black triangles); Zhu and co-
workers37 (lower half-filled triangles); Xue and co-workers36 (ΔTg,hi;
right half-filled violet squares, ΔTg,lo; left half-filled violet squares). 154
7.1 Flash DSC heating scans as a function of aging time for (a) 20 nm
stacked PS nanorods (green) after aging at Ta = 80.5 °C (b) 350 nm
stacked SP nanorods (red) after aging at Ta = 90.5 °C. The aging
temperatures are at the same distance from their respective Tfo
obtained at a cooling rate of 1000 K/s. ……………………………… 175
7.2 Flash DSC heat flow scans for 20 nm stacked PS nanorods on heating
from -80 °C as function of aging time at aging temperatures (a) 80.5
°C and (b) -20.5 °C. The insets show the excess specific heats with
respect to the unaged specific heat (1000 K/s) as a function of aging
temperature and aging time. ………………………………………… 176
Texas Tech University, Madhusudhan R. Pallaka, December 2019
xv
7.3 (a) Tf -Ta vs log ta for different jump sizes from Tfo for (a) 20 nm
stacked PS nanorods dispersed in ionic liquid (solid green left angled
triangles) and 350 nm stacked rods (solid red diamonds) (b) 20 and
350 nm stacked PS rods compared with 20 nm ultrathin (solid blue
squares) and bulk PS films (red diamonds) from previous studies. … 177
7.4 Aging rate comparison at (a) similar aging temperatures and (b)
similar jump sizes for 20 and 350 nm stacked PS nanorods, 20 nm
ultrathin PS film and bulk. …………………………………………… 178
7.5 Relaxation time map including induction times (tind; diamonds),
average relaxation times (squares) and times to reach equilibrium (t∞,
circles) as a function of (a) T and (b) Tfo-T are shown for 20 (solid
green symbols) and 350 nm (solid red symbols) stacked PS rods
along with 20 nm ultrathin PS film (open blue symbols) and bulk
(open orange symbols). The black dashed line is linear fit to all the
induction times. The colored solid lines (red, blue and green) are the
WLF dependence of average relaxation times obtained using the
cooling rate dependence of Tg. The colored short-dashed lines are the
same WLF dependence data shifted by a constant. ………………… 179
7.6 Excess specific heat data versus temperature on heating from -80 °C
as a function of aging time for 20 nm stacked PS nanorods aged at (a)
80.5 °C and (b) -20.5 °C. ……………………………………………
180
7.7 (a) Tf and (b) Tf -Ta vs log ta for three different aging temperatures
when cooled to -80 °C. ……………………………………………… 181
8.1 Representative reaction exotherms of epoxy polymerization in the (a)
bulk and (b) 55 nm CPG nanopores at various heating rates. ……… 199
8.2 Conversion x as a function of temperature for the bulk reaction. The
black lines are the best fits from the second order autocatalytic
model. ……………………………………………………………… 200
8.3 Conversion x as a function of temperature for reaction in 55 nm CPG
nanopores. The black solid line is the best fit from the second order
reaction model. ……………………………………………………… 201
8.4 (a) Comparison of representative reaction exotherms in bulk, 55 and
7. 5 nm CPG nanopores (b) conversion versus temperature of
reactions in bulk, 55 and 7.5 nm CPG nanopores. The black solid line
for the bulk is the best fit to the second order autocatalytic model and
the black solid lines for 55 and 7.5 nm CPG pores are the best fits to
the second order model. ……………………………………………… 202
Texas Tech University, Madhusudhan R. Pallaka, December 2019
xvi
8.5 (a) Isoconversional analysis of the bulk data at different heating rates.
(b) Apparent activation energies of the epoxy reaction in bulk, 55 and
7.5 nm CPG as a function of conversion from KAS isoconversion
method. (the error bars for the activation energy at a given
conversion was obtained from the standard error of the linear fit) …...
203
8.6 Glass transition temperatures obtained on heating at 10 K/min after
cooling at the same rater for bulk, 55 nm CPG and 7.5 nm CPG. …… 204
Texas Tech University, Madhusudhan R. Pallaka, December 2019
1
CHAPTER 1
INTRODUCTION
Material properties are significantly affected when the material dimensions are
scaled down from a macro scale or bulk to the nanometer scale (<< 100 nm), where the
nano-dimensions begin to overlap with the molecular length scales of polymers and small
molecules, alike. Understanding the impact of nanoconfinement on material properties
has been a topic of research in the fields of nanotechnology and nanoscience since the
seminal work of Jackson and McKenna.1-2 In addition, the use of novel experimental
techniques to probe the nanoconfinement effects has also increased, including the advent
of nanocalorimetry or Flash differential scanning calorimetry which is able to study ultra-
low sample masses with ultra-rapid heating or cooling rates. In recent years, 1D ultrathin
polymer films3-9 and 3D nanospheres10-11 have been studied using Flash differential
scanning calorimetry to understand the nanoconfinement effects. The work reported in
this dissertation primarily involves employing 2D confinement on the Flash DSC to study
the effect of nanoconfinement on melting, glass transition, and structural recovery. The
work in this dissertation also focusses on addressing the existing controversies in the field
of glass transition and structural recovery, including the existence of a double mechanism
of relaxation during structural recovery in the glassy state10, 12-18, in contrast to a widely
reported single mechanism. These controversial studies also report that the presence of a
low-temperature endotherm is a signature for fast-secondary relaxation mechanism, and
part of the work in this dissertation aims at understanding the origins of this low-
temperature endotherm and its relation to the double mechanism of structural recovery
Texas Tech University, Madhusudhan R. Pallaka, December 2019
2
using Flash differential scanning calorimetry. In addition to the effects of
nanoconfinement on melting, the glass transition, and structural recovery, reactions are
also affected by nanoconfinement, and work is reported in this dissertation on the
reaction kinetics of a step growth polymerization under nanoconfinement using
conventional differential scanning calorimetry.
This dissertation consists of ten chapters. Chapter 1 is this introduction. Chapter 2
provides some background on differential scanning calorimetry, melting, glass transition,
structural recovery and step-growth polymerization, as well as background and literature
review on the effect of nanoconfinement. Chapter 3 discusses the materials used in this
dissertation. Chapters 4-8 are manuscripts where each chapter is either adapted from
published work or manuscript in preparation. Each chapter consists of introduction,
methodology, results, discussion and conclusions. Chapter 9 summarizes overall
conclusions of the work in this dissertation. In chapter 10, recommendations for future
work are suggested.
A brief description of each of the major chapters, from 4 to 8, follows. Chapter 4,
entitled “Melting behavior of n-alkanes in anodic aluminum oxide (AAO) nanopores
using Flash differential scanning calorimetry” was published in Thermochimica Acta,
volume 663, pages 157-164, in 2018.19 The work details the efficacy of using AAO
nanopores as 2D nanoconfinement on the Flash DSC through the investigation of the
size-dependent melting behavior of n-alkanes. The chapter also discusses interesting
melting behavior of alkanes in AAO nanopores. The X-ray diffraction measurements
reported in this chapter were performed by Dr. Daniel Unruh, and he is a coauthor of the
paper published.
Texas Tech University, Madhusudhan R. Pallaka, December 2019
3
Chapter 5, entitled “Origin of the Broad Endothermic Peak Observed at Low
Temperatures for Polystyrene and Metals in Flash Differential Scanning Calorimetry”
will be submitted for publication. This chapter deals with the origins of the broad low-
temperature endotherm and its relationship with the secondary relaxation using glassy
polystyrene and crystalline metals. The results suggest that the low temperature
endotherm is an artifact. Coworker Rozana Bari performed the cooling rate dependent
measurements on polystyrene reported in this chapter, whereas the current author (MRP)
performed the enthalpy recovery measurements on polystyrene, and the cooling rate
dependent and aging measurements on indium and gold. The work has been written
collaboratively.
Chapter 6, entitled “The Glass Transition Behavior of Anodic Aluminum Oxide
(AAO) Supported and Stacked Polystyrene Nanorods Using Flash Differential Scanning
Calorimetry” will be submitted for publication. Chapter 6 deals with the effect of spatial
dimensionality on the glass transition behavior with AAO supported and stacked
polystyrene nanorods using Flash differential scanning calorimetry and comparing the
results to 1D ultrathin polystyrene films. The AAO supported PS nanorods do not exhibit
any depression in glass transition temperature, whereas the stacked PS rods below 100
nm show a size-dependent glass transition depression that is larger than 1D ultrathin PS
film.
Chapter 7, entitled “Enthalpy Recovery of 2D Stacked Polystyrene Nanorods
Using Flash Differential Scanning Calorimetry” will be submitted for publication.
Chapter 7 deals with the effect of spatial dimensionality on the enthalpy recovery of 2D
stacked polystyrene nanorods in comparison to that of 1D ultrathin polystyrene films.
Texas Tech University, Madhusudhan R. Pallaka, December 2019
4
The results suggest that the enthalpy recovery rate is enhanced for smaller sized stacked
PS rods when compared to bulk-like stacked PS rods. However, effect of spatial
dimensionality is insignificant as the 2D stacked rods and 1D films of 20 nm have similar
enthalpy recovery rates.
Chapter 8, entitled “Reaction Kinetics of Linear Epoxy Polymerization in CPG
nanopores” will be submitted for publication. This chapter deals with the reaction
kinetics of epoxy polymerization in CPG nanopores as a function of pore size. The
reaction kinetics are found to accelerated with the magnitude of acceleration increasing
with decreasing pore size. The effects are attributed to the surface silanol groups on the
nanopore surface.
Texas Tech University, Madhusudhan R. Pallaka, December 2019
5
References
1. Jackson, C. L.; McKenna, G. B., The Melting Behavior of Organic Materials
Confined in Porous Solids. J. Chem. Phys. 1990, 93 (12), 9002-9011.
2. Jackson, C. L.; McKenna, G. B., The glass-transition of organic liquids confined to
small pores. J. Non-Cryst. Solids 1991, 131, 221-224.
3. Koh, Y. P.; Simon, S. L., Enthalpy recovery of ultrathin polystyrene film using
Flash DSC. Polymer 2018, 143, 40-45.
4. Grassia, L.; Koh, Y. P.; Rosa, M.; Simon, S. L., Complete set of enthalpy recovery
data using Flash DSC: experiment and modeling. Macromolecules 2018, 51 (4),
1549-1558.
5. Koh, Y. P.; Grassia, L.; Simon, S. L., Structural recovery of a single polystyrene
thin film using nanocalorimetry to extend the aging time and temperature range.
Thermochim. Acta 2015, 603, 135-141.
6. Yoon, H.; Koh, Y. P.; Simon, S. L.; McKenna, G. B., An ultrastable polymeric
glass: Amorphous fluoropolymer with extreme fictive temperature reduction by
vacuum pyrolysis. Macromolecules 2017, 50 (11), 4562-4574.
7. Gao, S.; Koh, Y. P.; Simon, S. L., Calorimetric Glass Transition of Single
Polystyrene Ultrathin Films. Macromolecules 2013, 46 (2), 562-570.
8. Shamim, N.; Koh, Y. P.; Simon, S. L.; McKenna, G. B., Glass transition
temperature of thin polycarbonate films measured by flash differential scanning
calorimetry. J. Polym. Sci., Part B: Polym. Phys. 2014, 52 (22), 1462-1468.
9. Koh, Y. P.; Simon, S. L., The glass transition and enthalpy recovery of a single
polystyrene ultrathin film using Flash DSC. The Journal of Chemical Physics 2017,
146 (20), 203329.
10. Perez-De-Eulate, N. G.; Cangialosi, D., Double Mechanism for Structural
Recovery of Polystyrene Nanospheres. Macromolecules 2018, 51 (9), 3299-3307.
11. Perez-de-Eulate, N. G.; Di Lisio, V.; Cangialosi, D., Glass Transition and
Molecular Dynamics in Polystyrene Nanospheres by Fast Scanning Calorimetry.
ACS Macro Letters 2017, 6, 859-863.
12. Monnier, X.; Cangialosi, D., Effect of molecular weight on vitrification kinetics
and molecular mobility of a polymer glass confined at the microscale. Thermochim.
Acta 2019, 677, 60-66.
Texas Tech University, Madhusudhan R. Pallaka, December 2019
6
13. Cangialosi, D.; Boucher, V. M.; Alegría, A.; Colmenero, J., Direct evidence of two
equilibration mechanisms in glassy polymers. Phys. Rev. Lett. 2013, 111 (9),
095701.
14. Monnier, X.; Cangialosi, D., Thermodynamic ultrastability of a polymer glass
confined at the micrometer length scale. Phys. Rev. Lett. 2018, 121 (13), 137801.
15. Perez-de-Eulate, N. G.; Di Lisio, V.; Cangialosi, D., Glass Transition and
Molecular Dynamics in Polystyrene Nanospheres by Fast Scanning Calorimetry.
ACS Macro Letters 2017, 6 (8), 859-863.
16. Boucher, V. M.; Cangialosi, D.; Alegría, A.; Colmenero, J., Reaching the ideal
glass transition by aging polymer films. PCCP 2017, 19 (2), 961-965.
17. Perez-De Eulate, N. G.; Cangialosi, D., The very long-term physical aging of glassy
polymers. PCCP 2018, 20 (18), 12356-12361.
18. Boucher, V. M.; Cangialosi, D.; Alegría, A.; Colmenero, J., Complex
nonequilibrium dynamics of stacked polystyrene films deep in the glassy state. The
Journal of Chemical Physics 2017, 146 (20), 203312.
19. Pallaka, M. R.; Unruh, D. K.; Simon, S. L., Melting behavior of n-alkanes in anodic
aluminum oxide (AAO) nanopores using Flash differential scanning calorimetry.
Thermochim. Acta 2018, 663, 157-164.
Texas Tech University, Madhusudhan R. Pallaka, December 2019
7
CHAPTER 2
BACKGROUND
2.1 Differential and fast scanning calorimetry
Calorimetry, which is based on the law of conservation of energy, is a useful
analytical tool in material science for determining the thermal properties by corelating
temperature with specific physical properties of materials. Amongst the many known
types of calorimetry techniques, differential scanning calorimetry1-6 (DSC) is one of the
widely used techniques to follow processes including, but not limited to, phase
transitions, glass transitions and related behavior, and reactions. The DSC technique
measures heat flow, absorbed or dissipated by the material, as a function of temperature
and time; schematic of a typical DSC heating scan with major events including melting,
glass transition, and an exothermic reaction is shown in Figure 2.1.
The DSCs are classified into two types based on how the heat flow of the sample
is obtained1-6: 1) heat flux DSC, and 2) power-compensated DSC. In case of a heat flux
DSC, a sample pan with material, and an empty reference pan are heated simultaneously
on a thermoelectric disk inside a furnace. Based on the heat capacity (Cp) of the material
enclosed in the sample pan or due to an endothermic or exothermic process in the sample
material, a temperature difference occurs between the sample and the reference pan. The
temperature difference is correlated to the heat flow using the thermal equivalence of
Ohm’s law.1-2, 6 In a power compensated DSC, the sample pan and the reference are
heated separately in two different furnaces. The sample and the reference pans are
Texas Tech University, Madhusudhan R. Pallaka, December 2019
8
maintained at the same temperature, and the difference in power required to maintain the
temperature is recorded as a function of time and temperature.2, 4 In this dissertation
work, both power-compensated and heat flux DSCs were used.
The conventional DSC that was used for some part of this dissertation work; i.e.,
in chapter 8, was a Mettler Toledo (MT) 823e, which is a heat flux DSC with a ceramic
sensor/heater connected to a gold-gold/palladium thermocouple. The sample and
reference pans are usually sealed in 20 µl standard or hermetic aluminum pans and placed
on two separate measuring platforms for measurement; a purge gas like N2 is
continuously circulated into the cell to prevent oxidation and degradation. A modern
conventional DSC like MT 823e requires sample masses in the range of milligrams
which obviates the study of single polymer ultrathin films with ultra-low sample masses;
and also, a conventional DSC can only achieve scan rates as high as 300 K/min with
proper sample handling, but are not enough to emulate industrial scale polymer
processing conditions7, suppress crystallization and decomposition8-10, and prevent
reorganization phenomenon in metastable phases11.
The aforementioned limitations of conventional DSCs led to the development of
fast scanning calorimetry.7, 11-14 The only commercially available calorimeter adopting
the fast scanning ability is a Mettler Toledo Flash DSC which was also used in the work
described in chapters 4-7. Flash DSC operates using a UFS 1 chip sensor in the power-
compensation mode with a signal time constant less than 1 ms which helps to achieve
rapid heating and cooling rates (40,000 K/s). The scanning rates can also reach as low as
0.1 K/s because of the sensor’s high sensitivity; thus, a range of the scanning rates
overlap with those of the conventional DSC.15 The UFS 1 chip sensor is based on MEMS
Texas Tech University, Madhusudhan R. Pallaka, December 2019
9
technology (MEMS: Micro-Electro-Mechanical-Systems) and is embedded in a ceramic
support.15 The sensor has a sample and reference side (twin calorimeters) as in the
conventional heat flux DSC except, there is no need of pans or crucibles.15-16 The
schematic of a UFS 1 sensor is shown in Figure 2.2.15-16 The UFS 1 sensor has two
silicon nitride (SIN) membranes (sample and reference side) with a thickness of 2 µm
and length of 1.6 mm. The heating area or the sample furnace on the SIN membrane is in
the center with an effective heating area17 of 0.09 mm2, as shown in the inset of Figure
2.2; the heating area has been coated with 0.5 µm aluminum for a homogenous
temperature profile, and the heat capacity is 600 nJ/K. The temperature is measured with
eight thermocouples connecting the bottom of the furnace to the thick silicon frame as
shown in Figure 2.2. The bottom of the furnace has been coated with silicon dioxide to
act as a dielectric layer.
2.2 Melting and melting behavior under nanoconfinement
Melting is a first order thermodynamic phase transition from an ordered crystal
phase into a disordered liquid phase. Melting is classified as a first order transition in the
Ehrenfest sense18 because of the discontinuity in the first derivative of Gibbs free energy
with respect to temperature or pressure. The melting transition is described in the
enthalpy versus temperature schematic in Figure 2.3. According to modified
Lindemann’s criterion19-21, upon heating a material from the crystalline phase the thermal
vibrations increase with the increase in temperature and there comes a temperature at
which the root-mean square of amplitude of vibrations and the interatomic distance
reaches a critical value, this is when the first drop of liquid forms, and is called the
melting point (Tm) . The material stays at a constant temperature until all the crystal
Texas Tech University, Madhusudhan R. Pallaka, December 2019
10
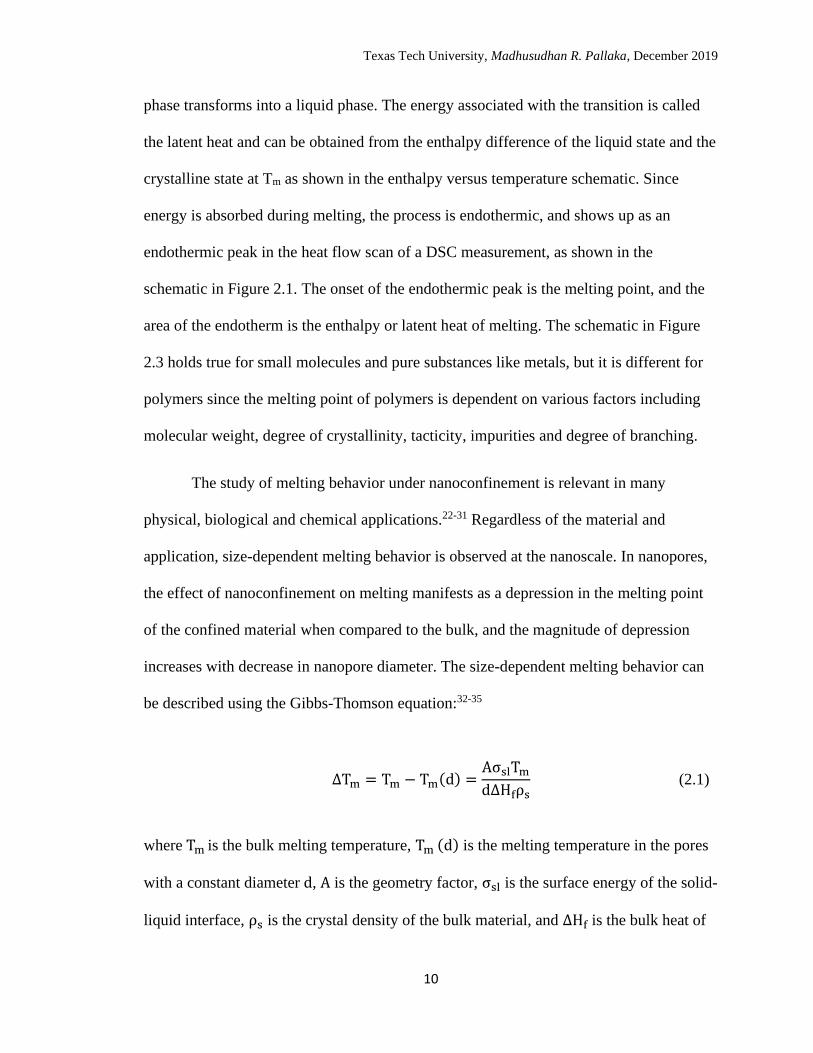
phase transforms into a liquid phase. The energy associated with the transition is called
the latent heat and can be obtained from the enthalpy difference of the liquid state and the
crystalline state at Tm as shown in the enthalpy versus temperature schematic. Since
energy is absorbed during melting, the process is endothermic, and shows up as an
endothermic peak in the heat flow scan of a DSC measurement, as shown in the
schematic in Figure 2.1. The onset of the endothermic peak is the melting point, and the
area of the endotherm is the enthalpy or latent heat of melting. The schematic in Figure
2.3 holds true for small molecules and pure substances like metals, but it is different for
polymers since the melting point of polymers is dependent on various factors including
molecular weight, degree of crystallinity, tacticity, impurities and degree of branching.
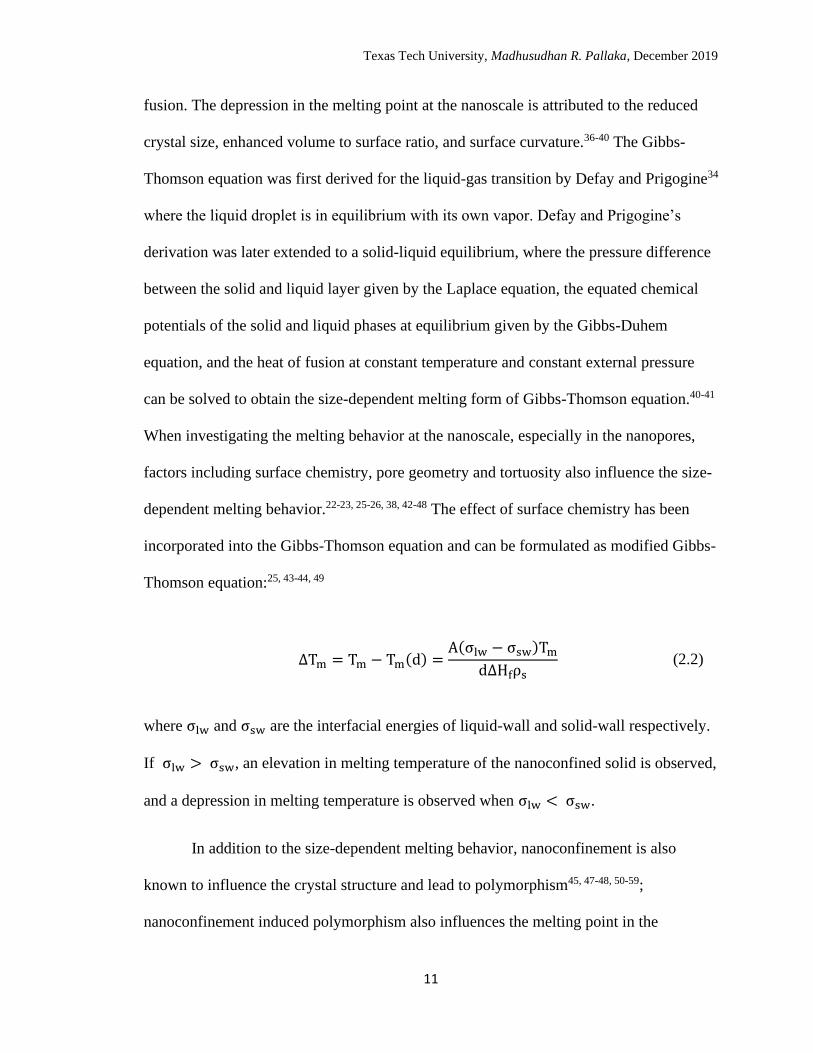
The study of melting behavior under nanoconfinement is relevant in many
physical, biological and chemical applications.22-31 Regardless of the material and
application, size-dependent melting behavior is observed at the nanoscale. In nanopores,
the effect of nanoconfinement on melting manifests as a depression in the melting point
of the confined material when compared to the bulk, and the magnitude of depression
increases with decrease in nanopore diameter. The size-dependent melting behavior can
be described using the Gibbs-Thomson equation:32-35
∆Tm = Tm − Tm(d) =AσslTm
d∆Hfρs
(2.1)
where Tm is the bulk melting temperature, Tm (d) is the melting temperature in the pores
with a constant diameter d, A is the geometry factor, σsl is the surface energy of the solid-
liquid interface, ρs is the crystal density of the bulk material, and ∆Hf is the bulk heat of
Texas Tech University, Madhusudhan R. Pallaka, December 2019
11
fusion. The depression in the melting point at the nanoscale is attributed to the reduced
crystal size, enhanced volume to surface ratio, and surface curvature.36-40 The Gibbs-
Thomson equation was first derived for the liquid-gas transition by Defay and Prigogine34
where the liquid droplet is in equilibrium with its own vapor. Defay and Prigogine’s
derivation was later extended to a solid-liquid equilibrium, where the pressure difference
between the solid and liquid layer given by the Laplace equation, the equated chemical
potentials of the solid and liquid phases at equilibrium given by the Gibbs-Duhem
equation, and the heat of fusion at constant temperature and constant external pressure
can be solved to obtain the size-dependent melting form of Gibbs-Thomson equation.40-41
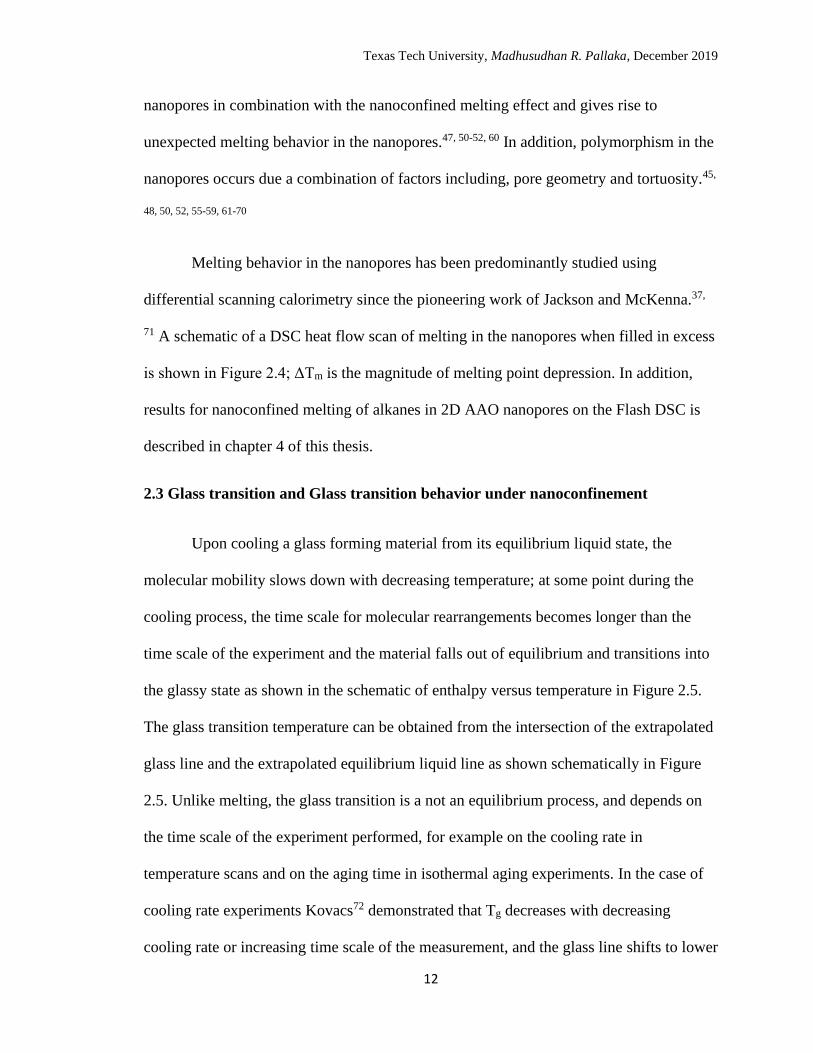
When investigating the melting behavior at the nanoscale, especially in the nanopores,
factors including surface chemistry, pore geometry and tortuosity also influence the size-
dependent melting behavior.22-23, 25-26, 38, 42-48 The effect of surface chemistry has been
incorporated into the Gibbs-Thomson equation and can be formulated as modified Gibbs-
Thomson equation:25, 43-44, 49
∆Tm = Tm − Tm(d) =A(σlw − σsw)Tm
d∆Hfρs
(2.2)
where σlw and σsw are the interfacial energies of liquid-wall and solid-wall respectively.
If σlw > σsw, an elevation in melting temperature of the nanoconfined solid is observed,
and a depression in melting temperature is observed when σlw < σsw.
In addition to the size-dependent melting behavior, nanoconfinement is also
known to influence the crystal structure and lead to polymorphism45, 47-48, 50-59;
nanoconfinement induced polymorphism also influences the melting point in the
Texas Tech University, Madhusudhan R. Pallaka, December 2019
12
nanopores in combination with the nanoconfined melting effect and gives rise to
unexpected melting behavior in the nanopores.47, 50-52, 60 In addition, polymorphism in the
nanopores occurs due a combination of factors including, pore geometry and tortuosity.45,
48, 50, 52, 55-59, 61-70
Melting behavior in the nanopores has been predominantly studied using
differential scanning calorimetry since the pioneering work of Jackson and McKenna.37,
71 A schematic of a DSC heat flow scan of melting in the nanopores when filled in excess
is shown in Figure 2.4; ΔTm is the magnitude of melting point depression. In addition,
results for nanoconfined melting of alkanes in 2D AAO nanopores on the Flash DSC is
described in chapter 4 of this thesis.
2.3 Glass transition and Glass transition behavior under nanoconfinement
Upon cooling a glass forming material from its equilibrium liquid state, the
molecular mobility slows down with decreasing temperature; at some point during the
cooling process, the time scale for molecular rearrangements becomes longer than the
time scale of the experiment and the material falls out of equilibrium and transitions into
the glassy state as shown in the schematic of enthalpy versus temperature in Figure 2.5.
The glass transition temperature can be obtained from the intersection of the extrapolated
glass line and the extrapolated equilibrium liquid line as shown schematically in Figure
2.5. Unlike melting, the glass transition is a not an equilibrium process, and depends on
the time scale of the experiment performed, for example on the cooling rate in
temperature scans and on the aging time in isothermal aging experiments. In the case of
cooling rate experiments Kovacs72 demonstrated that Tg decreases with decreasing
cooling rate or increasing time scale of the measurement, and the glass line shifts to lower
Texas Tech University, Madhusudhan R. Pallaka, December 2019
13
enthalpy values as shown in Figure 2.5; in general, a 3 K change in Tg is observed for an
order of magnitude change in cooling rate.72
Since the glass transition is defined on cooling, Tg should be measured only on
cooling.73-76 However, in DSC measurements it is generally measured on heating owing
to historical difficulties in calibration, temperature control, and sensitivity during slow
cooling. Upon heating a material from the glassy state, the material first follows the glass
line, overshoots the liquid line, and then regains equilibrium at high temperatures. The
magnitude of the overshoot and the temperature at which the glass reaches equilibrium
depends on the cooling rate at which it was formed; a dense or low enthalpy glass formed
by slow cooling has lower molecular mobility and requires a larger overshoot and higher
temperatures to reach equilibrium when compared to a high temperature glass formed by
faster cooling as shown schematically in Figure 2.6.73, 77 The measure of glass structure
on heating in the case of cooling rate experiments is quantified using the limiting fictive
temperature (Tfˈ).78-79 Tfˈ can be obtained from the intersection of the extrapolated
enthalpy liquid line and the enthalpy glass line, and is approximately equivalent to Tg
(within 1 K) when measured on cooling at the same rate.73, 75-76
The heat flow or specific heat trace from a DSC measurement is essentially the
derivative of the enthalpy versus temperature data and has a step change at the glass
transition with an endothermic overshoot at the end of it; schematic in Figure 2.7 shows
the DSC traces obtained at slow and fast cooling rates, respectively. Limiting fictive
temperatures from the heat flow or specific heat scans are obtained using the Moynihan’s
method79 which is an area matching method as defined in Equation 2.3:
(2.3)
Texas Tech University, Madhusudhan R. Pallaka, December 2019
14
∫ (��𝑙 − ��𝑔)𝑑𝑇 = ∫ (�� − ��𝑔)𝑑𝑇 𝑇≫𝑇𝑔
𝑇≪𝑇𝑔
𝑇≫𝑇𝑔
𝑇𝑓ˈ
where �� is the heat flow of the aged scan, ��𝑙 is the liquid state heat flow, and ��𝑔 is the
glassy state heat flow. Since the areas being equated using Equation 2.3 have common
areas, the area matching is simplified to matching the similarly colored portions as shown
in Figure 2.7.
The glass transition appears to be a second order thermodynamic transition in the
Ehrenfest18 sense because of its discontinuity in heat capacity or the second derivative of
Gibbs-free energy (ΔG). However, it is not a true second order transition even though at
the first glance it might look like one, because Cp,glass < Cp,liquid ; on the other hand,
experimental observations clearly show the kinetic aspect of glass transition.72, 74, 78, 80-81
The two leading theories, Gibbs-DiMarzio configurational entropy model82-84 and free
volume model85-86, attempt to explain the glass transition behavior from a thermodynamic
and kinetics aspect, respectively.
The Gibbs-DiMarzio configurational entropy model is developed based on the
Flory-Huggins lattice model87-88. The lattice model, which is based on the polymer chains
and vacant sides in a lattice, predicts that the configurational entropy decreases with
decreasing temperature due the reduction of number of configurational arrangements of
molecules in the glassy state. At longer time scales, the configurational entropy reaches
zero at the second order transition temperature (T2). T2 is also known as the ideal
thermodynamic Tg or the lower limit for Tg, and is often empirically related to the Vogel
temperature89,T∞, from the viscosity models, at which the viscosity reaches infinity
approximately ~50 K below the nominal Tg measured at 10 K/min; it is also related to the
Texas Tech University, Madhusudhan R. Pallaka, December 2019
15
Kauzmann temperature90 (TK). The Gibbs-DiMarzio configurational entropy model also
resolves the Kauzmann’s negative configurational entropy paradox83, 91 with a
thermodynamic approach where the configurational entropy stays at zero even below T2;
however, T2 is a theoretically postulated value and cannot be measured experimentally.
Recently, Simon and McKenna demonstrated the non-existence of a thermodynamic
glass transition (T2) using extrapolated entropy and enthalpy 130 K below TK, where the
equilibrium entropy was found to be nonzero even at a finite temperature.92 In addition,
there is no diverging time scale (i.e., WLF is not followed at low temperatures) so the
value T∞ is not “real” and its equivalence to TK is not an evidence of an underlying
thermodynamic transition.93-94 Nevertheless, Adam and Gibbs introduced the concept
called cooperatively rearranging region (CRR) to describe the relaxation behavior of
glassy materials. The CRR has an inverse relationship with temperature and the glass
transition happens when the length scale of CRR is greater than a certain size. In
addition, the reduction in Tg under nanoconfinement has been attributed to the decrease in
CRR95-98, though the Gibbs-DiMarzio model predicts an increase in Tg due to the
decrease in configurational entropy under nanoconfinement.
Free volume models are based on an empirical Doolittle equation86, 99 which
relates temperature dependence of viscosity to free volume:
ln 𝜂 = ln 𝐴 + ln 𝐵 [𝜗 − 𝜗𝑓
𝜗𝑓]
(2.4)
where 𝜂 is the viscosity, A and B are constants, 𝜗 is specific volume, and 𝜗𝑓 is the free
volume. Fox and Flory were the first to relate free volume to Tg;100-101 they suggested that
Texas Tech University, Madhusudhan R. Pallaka, December 2019
16
a material undergoes glass transition when the free volume becomes constant. William
Landell and Ferry85, further enhanced the free volume concept assuming a linear
dependence of free volume on temperature: 𝑓 = 𝑓𝑜 + 𝛼𝑓(𝑇 − 𝑇𝑜); where 𝑓 =𝜗
𝜗𝑓 is the
fractional free volume, 𝑇𝑜 is the reference temperature, and 𝛼𝑓 is the volumetric thermal
expansion coefficient of free volume. Further, equation 2.4 can be expressed as:
log 𝑎𝑇 =ln 𝜂 (𝑇)
ln 𝜂 (𝑇𝑜)=
𝐵
2.303[1
𝑓−
1
𝑓𝑜]
(2.5)
Substituting f in equation 2.5 gives:
log 𝑎𝑇 =− (
𝐵2.303𝑓𝑜
) (𝑇 − 𝑇𝑜)
𝑓𝑜 𝛼𝑓⁄ + (𝑇 − 𝑇𝑜)
(2.6)
Comparing equation 2.6 with the exiting form of WLF relationship, once can deduce that
C1= 𝐵
2.303𝑓𝑜 and C2 = 𝑓𝑜 𝛼𝑓⁄ and 𝑇𝑜 = 𝑇𝑔.85 Equation 2.6 can also be expressed in terms of
relaxation time for glass forming materials above Tg (Tg + 10 ≤T < Tg + 100).
The super-Arrhenius temperature dependence of viscosity follows the well-known
Vogel-Fulcher- Tammann (VFT) relationship89, 102-103:
𝜂 = 𝜂𝑜𝑒𝑥𝑝 [𝐵
𝑇 − 𝑇∞]
(2.7)
where 𝜂𝑜 and 𝐵 are material dependent VFT parameters, 𝑇∞ is the temperature at which
viscosity goes to infinity; it is also known as the Vogel temperature which is 50 K
below 𝑇𝑔. Mathematically VFT parameters are related to WLF parameters by 𝐵 =
Texas Tech University, Madhusudhan R. Pallaka, December 2019
17
2.303𝐶1𝐶2 and 𝑇∞ = 𝑇𝑔 − 𝐶2. The free volume theory also solves the Kauzmann paradox
by demonstrating a kinetic divergence of viscosity at 𝑇∞. However, the divergence is
disproved by McKenna and co-workers.104-105
The glass transition behavior under nanoconfinement has been a topic of interest
since the pioneering discoveries of Jackson and McKenna,71, 106 and Keddie and Jones107
where Tg depressions at the nanoscale were observed for organic liquids and PS thin
films, respectively.106-107 Over the last 25 years, the challenges in understanding the glass
transition behavior at the nanoscale became much more complex with contrasting glassy
behavior under nanoconfinement.95-97, 108-118 In general, for a glassy polymer under
nanoconfinement the Tg can increase, decrease or remain unchanged when compared to
the bulk. The key factors that contribute to the sign and magnitude of change in Tg under
nanoconfinement include spatial dimensionality or geometry, interfacial effects. In case
of spatial dimensionality, enhanced volume to surface ratio in the order of 1D < 2D < 3D
can contribute to a higher magnitude of Tg depression in 3D confinement. For example,
Priestley and co-workers119-120, and Cangialosi and co-workers121 observed a stronger
confinement effect and a larger Tg depression in 3D PS nanospheres when compared to
1D supported polystyrene (PS) thin films107, 122 at the same length scale.120 Priestley and
co-workers119-120 attributed the larger magnitude of depression to the enhanced volume to
surface ratio; similar findings for 2D stacked PS nanorods are reported in chapter 6 of
this dissertation. Priestley and co-workers also laid emphasis on the enhancement of free
surface with increasing dimensionality as a reason for larger Tg depression; in addition,
the depressed Tgs reverted to the bulk for PS nanospheres capped with a silica shell.120 A
similar effect of free surface has been observed by Sharp and Forrest for supported PS
Texas Tech University, Madhusudhan R. Pallaka, December 2019
18
thin films capped with gold;116 however, a weak dependence of Tg depression on free
surface was reported by Forrest and Dalnoki-Veress.115 In addition, Koh and Simon123
reported Tg depressions for PIB-PS-PIB trilayer film with eliminated free surfaces for a
60 nm PS film; and also, for silica-supported and silica-capped PS films. The
freestanding PS films with two free surfaces show a dramatic decrease in Tg,116 but
similar magnitude of Tg depressions were not observed in case of other free standing
polymer thin films like PMMA112-113 and PVAc114.
Contrasting results were also observed for 2D nanorods confined in anodic
aluminum oxide (AAO) nanopores with no free surface, where two Tgs, one depressed
and one elevated, were reported by Xue and co-workers124 for PMMA and PS, depressed
Tgs with a molecular weight effect on the magnitude of Tg were reported by Torkelson
and co-workers125 for PS, and a slight elevation in Tg was reported by Zhu and co-
workers126 for PS. Results for a high molecular weight PS with and without AAO
nanopores are reported in chapter 6. In addition, both PS and PMMA exhibit elevated Tgs
when fabricated as nanotubes inside AAO nanopores,127-128 where elevation of Tg in PS
has been attributed to a curvature effect128, and a strong interfacial effect with the
hydroxyl groups in case of PMMA.127 Increase in Tg under nanoconfinement has been
observed when there is a strong surface interfacial effect with hydrogen bonding
polymers like PMMA. Silica-supported PMMA thin films108, 110, and previously
mentioned PMMA nanotubes and nanorods in AAO demonstrated increase in Tg when
compared to the bulk. On the other hand, when strong interacting surfaces were absent,
Tg depressions were observed for free standing 1D PMMA thin films112 and 3D PMMA
Texas Tech University, Madhusudhan R. Pallaka, December 2019
19
nanospheres111, whereas bulk values were observed for PMMA nanotubes127 and
nanorods129 without AAO support.
2.4 Structural recovery and structural recovery under nanoconfinement
A material in the glassy state is not in equilibrium; hence the thermodynamic
quantities like volume and enthalpy continuously evolve towards equilibrium when held
isothermally in the glassy state.130-131 The process of evolution of thermodynamic
quantities towards equilibrium is called structural recovery or structural relaxation.
Depending on the measured thermodynamic quantity, the process can be classified as
volume recovery or enthalpy recovery. The term physical aging is also used to indicate
structural recovery, but generally denotes the change in mechanical properties132-135
during structural recovery; in addition, physical aging is also used to differentiate from
irreversible aging processes such as chemical, thermal, gamma and biological aging.
The process of structural recovery can be followed by using the fictive
temperature which is a measure of glass structure as defined by Tool.78 The fictive
temperature (Tf) is the intersection of extrapolated enthalpy liquid line with the
extrapolated glass line as shown schematically in Figure 2.8. The schematic also shows
the evolution of glass structure with aging; the fictive temperature goes from Tfo to Ta
assuming equilibrium line is reached. The fictive temperature of an aged scan on the DSC
is calculated using the Moynihan’s method (Equation 2.3) and is shown schematically in
Figure 2.7.
The essential kinetic features of structural recovery were demonstrated in the
seminal work of Kovacs72 using departure from equilibrium (δ) as a measure of recovery
Texas Tech University, Madhusudhan R. Pallaka, December 2019
20
towards equilibrium. δ is simply a measure of how far a given glass is from the
extrapolated equilibrium liquid line; it is (𝜈 − 𝜈∞) 𝑣∞⁄ in case of volume and 𝐻 − 𝐻∞ in
case of enthalpy.136-137 Kovacs’ three signatures of structural recovery include intrinsic
isotherms, asymmetry of approach, and memory effect.72 Kovacs performed volume
recovery experiments on PVAc to obtain the three signatures.137 Recently, Lopez and
Simon136 obtained the three signatures of Kovacs in the enthalpy space using Flash DSC;
they captured the complete recovery process starting from the initial plateau at zero
departure because of the ability to capture short time aging response. Prior to Lopez and
Simon’s work,136 intrinsic isotherm and asymmetry of approach experiments has been
obtained in the enthalpy space138-143, but the complete memory effect experiment
including the initial departure at zero plateau has not previously been performed. An
intrinsic isotherm experiment is similar to the schematic shown in Figure 2.8.a, and
Figure 2.8.b shows the enthalpy recovery for bulk PS in terms of departure for several
intrinsic isotherms as a function of aging time where the equilibrium was attained for all
aging temperatures.136 The schematic for asymmetry of approach experiment is shown in
Figure 2.9.a. In the asymmetry of approach experiment, aging is performed at the same
aging temperature which is accessed by an up jump and a down jump from equilibrium of
equal size but in opposite directions, as shown schematically in Figure 2.9.a. The
structural recovery is followed by the red and blue arrows as shown in Figure 2.9.a. The
enthalpy recovery responses for the asymmetry of approach experiment is shown in
Figure 2.9.b.136 The recovery responses clearly show the asymmetric approach of up and
down jumps. The recovery would have been symmetric if the structural recovery is only
dependent on the departure temperature, but the responses clearly demonstrate that the
Texas Tech University, Madhusudhan R. Pallaka, December 2019
21
structure of the glass also plays an important role alongside temperature; in addition, the
auto-retarded shape of the down jump response is due to the continuous decrease in
mobility, and the auto-acceleration response of the up jump is due to the continuous
increase in mobility. The memory effect experiment involves a two-step temperature
history as shown schematically in Figure 2.10.a. The two steps involve a down jump
from To at equilibrium to T1 where partial isothermal aging is performed at T1 until the
fictive temperature reaches Ta, and then a final jump is made to Ta where the enthalpy
recovery is followed with aging time. Since the partially aged glass is at a fictive
temperature equal to the aging temperature, there is no driving force for structural
recovery; however, as aging time increases, the enthalpy of the glass increases from the
equilibrium value reaches a maximum and recovers back to equilibrium again as seen
from Figure 2.10.b, indicating that the glass has memory of the previous thermal
history.136 In addition, a glass with a single relaxation time would not have shown signs
of aging with zero driving force. Thus, the memory effect indicates that the glass has a
distribution of relaxation times.
The essential kinetic features of structural recovery including non-linearity and
non-exponentiality can be described by Tool-Narayanaswamy-Moynihan (TNM)78, 144-145
and Kovacs-Aklonis-Hutcheson-Ramos (KAHR) models137 of structural recovery. The
TNM model adopts a continuous relaxation time distribution of Kolrasusch-William-
Watts function85, 146 to achieve the non-exponential decay of fictive temperature:
𝑑𝑇𝑓
𝑑𝑇= 1 − exp [− (∫ (
𝑑𝑡
𝜏)
𝑡
0
)
𝛽
]
(2.8)
Texas Tech University, Madhusudhan R. Pallaka, December 2019
22
where 𝛽 is the non-exponentiality parameter, varying from 0 to 1. The parameter 𝛽
indicates the width of relaxation times, where 𝛽 = 1 transforms equation 2.8 into a simple
exponential decay with a single relaxation time. The non-linearity of structural recovery
kinetics is achieved in the TNM model by expressing the relaxation time, 𝜏, as a
temperature- and structure-dependent parameter using an Arrhenius type equation, with
the fictive temperature used to describe the instantaneous state of the glass structure.
𝜏 = 𝐴 𝑒𝑥𝑝 [∆ℎ
𝑅𝑇+
(1 − 𝑥)∆ℎ
𝑅(
1
𝑇𝑓−
1
𝑇)]
(2.9)
where 𝐴 is the pre-exponential factor, ∆ℎ is the apparent activation energy of structural
recovery, and x varies from 0 to 1. When x = 1, the relaxation time of structural recovery
is linear, devoid of structural dependence; as x decreases, the relaxation time shifts from
being linear to non-linear due to more contribution from structure. In addition, Bari and
Simon evaluated and recommended the best routes to determine the nonlinearity and
activation energy parameters to use the TNM model to simulate enthalpy relaxation data
of PS obtained at high cooling rates on the Flash DSC.147
In general, the TNM and KAHR models do a good job in capturing the kinetics
associated with structural recovery, but there are limitations148-154 in utilizing a single set
of model parameters to quantitatively describe all types of structural recovery data.148-156
Since, the TNM model utilizes an Arrhenius temperature dependence of relaxation time,
the applicability of the equation is limited to only in the glassy state below Tg and for a
limited range of temperatures. Recently, Grassia and Simon modified the existing TNM
model by using an odd symmetric function of WLF equation to extend the temperature
Texas Tech University, Madhusudhan R. Pallaka, December 2019
23
range of relaxation times to incorporate both non-equilibrium glassy states and
equilibrium liquid states.143, 157 The modified TNM model requires the fit of two
parameters along with the two WLF parameters obtained from cooling rate dependent
experiments.143, 157 The modified TNM model can describe the structural recovery for
aging temperature in the vicinity of Tg as well as quantitatively reproducing experimental
results for the three signatures of structural recovery with a single set of parameters.143, 157
Nanoconfinement not only affects the glass transition behavior of materials but
also the kinetics of structural recovery. The rates of structural recovery under
nanoconfinement are reported to be enhanced158-163, reduced164-165 or unchanged126, 166
relative to the bulk. The results reported are dependent on the type of measurement
technique, confinement, and material. Since structural recovery depends on driving force
and mobility, it is important to compare structural recovery rates at same distance from
Tg for nanoconfined polymers with reduced Tgs, because the aging temperature for
nanoconfined case will be closer to Tg when compared at same aging temperatures;
hence, nanoconfined polymers will have a higher recovery rate at a given temperature (or
zero recovery rate above their Tg).
In addition to influencing the rate of structural recovery, nanoconfinement is also
known to influence the mechanism of structural recovery. Cangialosi and co-workers
reported a two-step mechanism for structural recovery in the enthalpy space in case of 1D
stacked PS films163, 167-170 and 3D PS nanospheres171; a two-step mechanism has also been
observed in bulk PS and other polymers, but at much longer time scales.169, 171-172
Cangialosi and co-workers attributed the fast secondary relaxation mechanism to a broad
Texas Tech University, Madhusudhan R. Pallaka, December 2019
24
low temperature endotherm present in addition to the primary endotherm related to the
glass transition.
The presence of broad-low temperature endotherms has been observed by
Cangialosi and co-workers for both bulk and nanoconfined polymers;168-171, 173-174
Cangialosi and co-workers attributed the presence of low temperature endotherms to a
fast-secondary relaxation mechanism which could be helpful in obtaining low energy
state glasses. From the results reported, the low temperature endotherms are both cooling
rate dependent173-174 and aging time dependent168-171, and are observed on the heating
scan from an ultra-low temperature (-90 °C). A schematic depicting the presence of a low
temperature endotherm in enthalpy space as a function of temperature is shown in Figure
2.11.a. The blue solid line is the unaged glass or glass obtained at a high cooling rate
(1000 K/s) with a glassy slope of Cpgo, the red dashed line is a heating scan from room
temperature after aging at a temperature Ta for a given time t or after cooling at a rate
slower than that used to obtain the unaged glass (blue solid line), and the green dotted
line is a heating scan from an ultra-low temperature (-90 °C) after aging at a temperature
Ta for a given time t or after cooling to an ultra-low temperature at a rate slower than that
used to obtain the unaged glass (blue solid line). The green dotted line, which is the
heating scan from an ultra-low temperature, shows the increase in slope from Cpg = Cpgo
to Cpg > Cpgo as the glass is heated, and the slope reverts to Cpgo in the vicinity of the glass
transition. The gradual increase in the slope of the glass line of the dotted green curve
manifests into a board low-temperature endotherm in the DSC heat flow scan as shown
schematically in Figure 2.11.b. The low temperature endotherms have been observed in
both conventional and Flash DSCs. Using the conventional DSC, the low temperature
Texas Tech University, Madhusudhan R. Pallaka, December 2019
25
endotherms have been observed for 1D stacked PS thin films and bulk polymers
including polysulfone, poly(arylate), and polycarbonate.168-170 The fictive temperature of
a 30 nm stacked PS thin film aged at 243 K (Tg-100) reached the predicted Kauzmann
temperature for PS (270 to 280 K) under less than 2 days of aging due to the presence of
low temperature endotherm. Using the Flash DSC, cooling rate dependent and aging time
dependent low temperature endotherms have been observed for micronscale poly (4-tert-
butyl styrene) films and 3D PS nanospheres, respectively.171, 173-174 In case of micronscale
poly (4-tert-butyl styrene) films, the presence of a low temperature endotherm at a
cooling rate of 0.1 K/s contributed to a fictive temperature decrease of ~ 80 K when
compared to the nominal Tg of the polymer.174 In chapters 5-7, the origins and
implications of the low temperature endotherms are discussed for micronscale polymer
films, metals, and stacked and AAO supported PS nanorods using Flash DSC.
2.5 Step-growth polymerization under nanoconfinement
Step-growth polymerization usually occurs through the reaction of different
functional groups including, but not limited to, -COOH, -OH, -NH2, OCN, NCO, -COC-
.175-176 Polymer formation via step growth mechanism occurs only when the monomers in
the reaction mixture at least have a functionality ≥ 2. The functionality dictates
crosslinking, branching, and linear growth of the polymer. The molecular weight during a
step-growth polymerization reaction increases slowly with time; most step-growth
polymerization reactions proceed by formation of dimers, trimers, oligomers, and
eventually the polymer.175
Epoxies are an important class of polymers that are synthesized via step-growth
polymerization. One of the ways to synthesize epoxy polymers is by the reaction of an
Texas Tech University, Madhusudhan R. Pallaka, December 2019
26
epoxide functional group with an amine functional group (NH2). Most epoxy resins are
multifunctional with two or more reactive epoxide groups, and the functionality of the
amine dictates what type of polymer is formed; if the functionality of the amine is > two,
branching or crosslinking occurs and if the functionality is equal to 2, a linear epoxy
polymer is formed. The step-growth polymerization of epoxy proceeds via three most
important reaction pathways, including the uncatalyzed, self-promoted, and alcohol-
catalyzed reaction pathways.177-178 The uncatalyzed pathway only involves the epoxy and
amine species and is least likely to happen because of the other amine and alcohol
impurities present in the system. The alcohol-catalyzed pathway is the most favorable
and the one with the lowest activation energy barrier; the alcohol-catalyzed pathway
plays an important role in accelerating the polymerization in the later stages of the
conversion once the hydroxyl groups are formed from the cleavage of the epoxide group.
The initial stages of the reaction in the absence of a catalyst may proceed via both
uncatalyzed and self-promoted pathways, where the self-promoted pathway has a faster
reaction rate. In addition, each of the three reaction pathways proceed via an acyclic or a
cyclic transition state depending on the favorability or entropy of activation.177 In the
cyclic transition, bond cleavage and bond transfer of epoxy-primary amine or secondary
amine can occur simultaneously, leading directly to the formation of the product, but this
route is prone to steric crowding leading to a higher activation energy; on the other hand,
the acyclic transition state avoids steric crowding and have lower energy barriers at the
expense of multiple intermediate steps.177
In addition to melting, glass transition, and structural recovery, nanoconfinement
is also known to influence reactions. In the case of step-growth polymerization reactions,
Texas Tech University, Madhusudhan R. Pallaka, December 2019
27
the reaction rates are enhanced under nanoconfinement. Step-growth polymerization
under nanoconfinement has been studied for phenolic resins179, cyanate esters180-183,
epoxy-amines184, and polyurethanes.185 The step-growth polymerization under
nanoconfinement is usually followed using either Raman or FTIR (Fourier transform
Infrared) spectroscopy or DSC. In chapter 8 of this work, a DSC was used to follow the
reaction kinetics of epoxy polymerization under nanoconfinement.
Texas Tech University, Madhusudhan R. Pallaka, December 2019
28
References
1. Höhne, G.; Hemminger, W. F.; Flammersheim, H.-J., Differential scanning
calorimetry. Springer Science & Business Media: 2013.
2. Charsley, E.; Price, D.; Hunter, N.; Gabbott, P.; Kett, V.; Gaisford, S.; Priestley, I.;
Duncan, J.; Royall, P.; Scowen, I., Principles of thermal analysis and calorimetry.
Royal society of chemistry: 2019.
3. Höhne, G.; Schawe, J., Dynamic behaviour of power compensated differential
scanning calorimeters: Part 1. DSC as a linear system. Thermochim. Acta 1993,
229, 27-36.
4. Tanaka, S., Theory of power-compensated DSC. Thermochim. Acta 1992, 210, 67-
76.
5. Weber-Anneler, H.; Arndt, R., Thermal methods of analysis/differential scanning
calorimetry in theory and application. Thermochim. Acta 1985, 85, 271-274.
6. Gill, P.; Moghadam, T. T.; Ranjbar, B., Differential scanning calorimetry
techniques: applications in biology and nanoscience. Journal of biomolecular
techniques: JBT 2010, 21 (4), 167.
7. Zhuravlev, E.; Schick, C., Fast scanning power compensated differential scanning
nano-calorimeter: 2. Heat capacity analysis. Thermochim. Acta 2010, 505 (1), 14-
21.
8. Magoń, A.; Wurm, A.; Schick, C.; Pangloli, P.; Zivanovic, S.; Skotnicki, M.; Pyda,
M., Heat capacity and transition behavior of sucrose by standard, fast scanning and
temperature-modulated calorimetry. Thermochim. Acta 2014, 589, 183-196.
9. Cebe, P.; Hu, X.; Kaplan, D. L.; Zhuravlev, E.; Wurm, A.; Arbeiter, D.; Schick, C.,
Beating the heat-fast scanning melts silk beta sheet crystals. Scientific reports 2013,
3.
10. Cebe, P.; Partlow, B. P.; Kaplan, D. L.; Wurm, A.; Zhuravlev, E.; Schick, C., Using
flash DSC for determining the liquid state heat capacity of silk fibroin.
Thermochim. Acta 2015, 615, 8-14.
11. Schick, C.; Mathot, V., Fast Scanning Calorimetry. Springer: 2016.
12. Poel, G. V.; Istrate, D.; Magon, A.; Mathot, V., Performance and calibration of the
Flash DSC 1, a new, MEMS-based fast scanning calorimeter. J. Therm. Anal.
Calorim. 2012, 110 (3), 1533-1546.
13. Mathot, V.; Pyda, M.; Pijpers, T.; Poel, G. V.; Van de Kerkhof, E.; Van
Herwaarden, S.; Van Herwaarden, F.; Leenaers, A., The Flash DSC 1, a power
Texas Tech University, Madhusudhan R. Pallaka, December 2019
29
compensation twin-type, chip-based fast scanning calorimeter (FSC): first findings
on polymers. Thermochim. Acta 2011, 522 (1-2), 36-45.
14. Van Herwaarden, S.; Iervolino, E.; Van Herwaarden, F.; Wijffels, T.; Leenaers, A.;
Mathot, V., Design, performance and analysis of thermal lag of the UFS1 twin-
calorimeter chip for fast scanning calorimetry using the Mettler-Toledo Flash DSC
1. Thermochim. Acta 2011, 522 (1), 46-52.
15. Schawe, J. E.; Pogatscher, S., Material characterization by fast scanning
calorimetry: practice and applications. In Fast Scanning Calorimetry, Springer:
2016; pp 3-80.
16. Zhuravlev, E.; Schick, C., Fast scanning power compensated differential scanning
nano-calorimeter: 1. The device. Thermochim. Acta 2010, 505 (1), 1-13.
17. Simon, S. L.; Koh, Y. P., The glass transition and structural recovery using flash
DSC. In Fast Scanning Calorimetry, Springer: 2016; pp 433-459.
18. Ehrenfest, P. In Phase changes in the ordinary and extended sense classified
according to the corresponding singularities of the thermodynamic potential, Proc
Acad Sci Amsterdam, 1933; pp 153-157.
19. Gilvarry, J. J., The Lindemann and Grüneisen laws. Phys. Rev. 1956, 102 (2), 308.
20. Lindemann, F., The calculation of molecular vibration frequencies Phys. Z 1910,
11, 609.
21. Chakravarty, C.; Debenedetti, P. G.; Stillinger, F. H., Lindemann measures for the
solid-liquid phase transition. The Journal of chemical physics 2007, 126 (20),
204508.
22. Lee, K.; Yu, G.; Woo, E.; Hwang, S.; Shin, K., Freezing and Melting in Nanopores.
In Adsorption and Phase Behaviour in Nanochannels and Nanotubes, Dunne, L. J.;
Manos, G., Eds. Springer Netherlands: Dordrecht, 2010; pp 257-272.
23. Christenson, H. K., Confinement effects on freezing and melting. J. Phys.:
Condens. Matter 2001, 13 (11), R95.
24. Gelb, L. D.; Gubbins, K.; Radhakrishnan, R.; Sliwinska-Bartkowiak, M., Phase
separation in confined systems. Rep. Prog. Phys. 1999, 62 (12), 1573.
25. Alba-Simionesco, C.; Coasne, B.; Dosseh, G.; Dudziak, G.; Gubbins, K.;
Radhakrishnan, R.; Sliwinska-Bartkowiak, M., Effects of confinement on freezing
and melting. J. Phys.: Condens. Matter 2006, 18 (6), R15.
26. Jiang, Q.; Ward, M. D., Crystallization under nanoscale confinement. Chem. Soc.
Rev. 2014, 43 (7), 2066-2079.
Texas Tech University, Madhusudhan R. Pallaka, December 2019
30
27. Padhye, R.; Aquino, A. J.; Tunega, D.; Pantoya, M. L., Fluorination of an Alumina
Surface: Modeling Aluminum–Fluorine Reaction Mechanisms. ACS applied
materials & interfaces 2017, 9 (28), 24290-24297.
28. Padhye, R. Altering surface properties toward enhanced reactivity. 2017.
29. Padhye, R.; Smith, D. K.; Korzeniewski, C.; Pantoya, M. L., Tailoring surface
conditions for enhanced reactivity of aluminum powders with solid oxidizing
agents. Appl. Surf. Sci. 2017, 402, 225-231.
30. Padhye, R.; Aquino, A. J.; Tunega, D.; Pantoya, M. L., Effect of polar environments
on the aluminum oxide shell surrounding aluminum particles: simulations of
surface hydroxyl bonding and charge. ACS applied materials & interfaces 2016, 8
(22), 13926-13933.
31. Padhye, R.; McCollum, J.; Korzeniewski, C.; Pantoya, M. L., Examining
Hydroxyl–Alumina Bonding Toward Aluminum Nanoparticle Reactivity. The
Journal of Physical Chemistry C 2015, 119 (47), 26547-26553.
32. Pawlow, P., On the melting temperature of the corns of salol. Z. Phys. Chem 1910,
74, 562.
33. Jackson, K.; Chalmers, B., Freezing of liquids in porous media with special
reference to frost heave in soils. J. Appl. Phys. 1958, 29 (8), 1178-1181.
34. Defay, R.; Prigogine, I.; Bellemans, A.; Everett, D., Surface tension and adsorption.
1966. Longmans, London.
35. Thomson, W., 4. On the Equilibrium of Vapour at a Curved Surface of Liquid.
Proceedings of the Royal Society of Edinburgh 1872, 7, 63-68.
36. Park, J. Y.; McKenna, G. B., Size and confinement effects on the glass transition
behavior of polystyrene/o-terphenyl polymer solutions. Physical Review B 2000,
61 (10), 6667-6676.
37. Jackson, C. L.; McKenna, G. B., The Melting Behavior of Organic Materials
Confined in Porous Solids. J. Chem. Phys. 1990, 93 (12), 9002-9011.
38. Alcoutlabi, M.; McKenna, G. B., Effects of confinement on material behaviour at
the nanometre size scale. J. Phys.: Condens. Matter 2005, 17 (15), R461.
39. McKenna, G. B.; Spe, Size and confinement effects on the glass transition. 2000; p
2004-2008.
40. Sun, J.; Simon, S., The melting behavior of aluminum nanoparticles. Thermochim.
Acta 2007, 463 (1), 32-40.
Texas Tech University, Madhusudhan R. Pallaka, December 2019
31
41. Sun, J. Thermodynamics and kinetics at the nanoscale: thermal behavior of
aluminum nanoparticles and development of nanoporous low-k dielectrics. Texas
Tech University, 2004.
42. Tang, X.-P.; Mezick, B. K.; Kulkarni, H.; Wu, Y., Elevation of melting temperature
for confined palmitic acid inside cylindrical nanopores. The Journal of Physical
Chemistry B 2007, 111 (7), 1507-1510.
43. Dosseh, G.; Xia, Y.; Alba-Simionesco, C., Cyclohexane and benzene confined in
MCM-41 and SBA-15: confinement effects on freezing and melting. The Journal
of Physical Chemistry B 2003, 107 (26), 6445-6453.
44. Maheshwari, P.; Dutta, D.; Sharma, S.; Sudarshan, K.; Pujari, P.; Majumder, M.;
Pahari, B.; Bandyopadhyay, B.; Ghoshray, K.; Ghoshray, A., Effect of interfacial
hydrogen bonding on the freezing/melting behavior of nanoconfined liquids. The
Journal of Physical Chemistry C 2010, 114 (11), 4966-4972.
45. Graubner, G.; Rengarajan, G. T.; Anders, N.; Sonnenberger, N.; Enke, D.; Beiner,
M.; Steinhart, M., Morphology of porous hosts directs preferred polymorph
formation and influences kinetics of solid/solid transitions of confined
pharmaceuticals. Crystal Growth & Design 2013, 14 (1), 78-86.
46. Kim, B. S.; Jeong, Y. G.; Shin, K., Influence of surface property on the
crystallization of hentetracontane under nanoscopic cylindrical confinement. The
Journal of Physical Chemistry B 2013, 117 (19), 5978-5988.
47. Huber, P., Soft matter in hard confinement: phase transition thermodynamics,
structure, texture, diffusion and flow in nanoporous media. J. Phys.: Condens.
Matter 2015, 27 (10), 103102.
48. Wang, L. P.; Li, Q. F.; Wang, C.; Lan, X. Z., Size-Dependent Phase Behavior of
the Hexadecane–Octadecane System Confined in Nanoporous Glass. The Journal
of Physical Chemistry C 2014, 118 (31), 18177-18186.
49. Takei, T.; Nakada, M.; Yoshikawa, N.; Hiroe, Y.; Yoshida, H., Effect of organic
functional groups on the phase transition of organic liquids in silica mesopores. J.
Therm. Anal. Calorim. 2016, 123 (3), 1787-1794.
50. Huber, P.; Soprunyuk, V. P.; Knorr, K., Structural transformations of even-
numbered n-alkanes confined in mesopores. Physical Review E 2006, 74 (3),
031610.
51. Henschel, A.; Hofmann, T.; Huber, P.; Knorr, K., Preferred orientations and
stability of medium length n-alkanes solidified in mesoporous silicon. Physical
Review E 2007, 75 (2), 021607.
52. Huber, P.; Wallacher, D.; Albers, J.; Knorr, K., Quenching of lamellar ordering in
an n-alkane embedded in nanopores. EPL (Europhysics Letters) 2004, 65 (3), 351.
Texas Tech University, Madhusudhan R. Pallaka, December 2019
32
53. Cheng, S.; McKenna, G. B., Nanoconfinement Effects on the Glass Transition and
Crystallization Behaviors of Nifedipine. Molecular pharmaceutics 2019, 16 (2),
856-866.
54. Burger, A.; Ramberger, R., On the polymorphism of pharmaceuticals and other
molecular crystals. I. Microchimica Acta 1979, 72 (3), 259-271.
55. Rengarajan, G.; Enke, D.; Steinhart, M.; Beiner, M., Stabilization of the amorphous
state of pharmaceuticals in nanopores. J. Mater. Chem. 2008, 18 (22), 2537-2539.
56. Beiner, M.; Rengarajan, G.; Pankaj, S.; Enke, D.; Steinhart, M., Manipulating the
crystalline state of pharmaceuticals by nanoconfinement. Nano Lett. 2007, 7 (5),
1381-1385.
57. Wang, L. P.; Sui, J.; Zhai, M.; Tian, F.; Lan, X. Z., Physical Control of Phase
Behavior of Hexadecane in Nanopores. The Journal of Physical Chemistry C 2015,
119 (32), 18697-18706.
58. Fu, D.; Su, Y.; Gao, X.; Liu, Y.; Wang, D., Confined Crystallization of n-
Hexadecane Located inside Microcapsules or outside Submicrometer Silica
Nanospheres: A Comparison Study. The Journal of Physical Chemistry B 2013,
117 (20), 6323-6329.
59. Su, Y.; Liu, G.; Xie, B.; Fu, D.; Wang, D., Crystallization features of normal
alkanes in confined geometry. Acc. Chem. Res. 2013, 47 (1), 192-201.
60. Pallaka, M. R.; Unruh, D. K.; Simon, S. L., Melting behavior of n-alkanes in anodic
aluminum oxide (AAO) nanopores using Flash differential scanning calorimetry.
Thermochim. Acta 2018, 663, 157-164.
61. Ravikovitch, P. I.; Neimark, A. V., Density functional theory of adsorption in
spherical cavities and pore size characterization of templated nanoporous silicas
with cubic and three-dimensional hexagonal structures. Langmuir 2002, 18 (5),
1550-1560.
62. Mu, R.; Malhotra, V., Effects of surface and physical confinement on the phase
transitions of cyclohexane in porous silica. Physical Review B 1991, 44 (9), 4296.
63. Fette, E. V.; Pham, A.; Adalsteinsson, T., Crystallization and melting transitions of
hexadecane droplets in polystyrene nanocapsules. The Journal of Physical
Chemistry B 2008, 112 (17), 5403-5411.
64. Kutnjak, Z.; Kralj, S.; Lahajnar, G.; Žumer, S., Calorimetric study of
octylcyanobiphenyl liquid crystal confined to a controlled-pore glass. Physical
Review E 2003, 68 (2), 021705.
Texas Tech University, Madhusudhan R. Pallaka, December 2019
33
65. Grigoriadis, C.; Duran, H.; Steinhart, M.; Kappl, M.; Butt, H.-J. r.; Floudas, G.,
Suppression of phase transitions in a confined rodlike liquid crystal. ACS nano
2011, 5 (11), 9208-9215.
66. Jiang, K.; Xie, B.; Fu, D.; Luo, F.; Liu, G.; Su, Y.; Wang, D., Solid− Solid Phase
Transition of n-Alkanes in Multiple Nanoscale Confinement. The Journal of
Physical Chemistry B 2009, 114 (3), 1388-1392.
67. Farasat, R.; Vyazovkin, S., Nanoconfined Solid–Solid Transitions: Attempt To
Separate the Size and Surface Effects. The Journal of Physical Chemistry C 2015,
119 (17), 9627-9636.
68. Toriyama, K.; Okazaki, M., Molecular packing of long-chain n-alkanes in the
MCM-41 nanochannel as probed by the free radicals produced by γ-irradiation. The
Journal of Physical Chemistry B 2004, 108 (34), 12917-12920.
69. Suzuki, Y.; Duran, H.; Steinhart, M.; Kappl, M.; Butt, H.-J. r.; Floudas, G.,
Homogeneous nucleation of predominantly cubic ice confined in nanoporous
alumina. Nano Lett. 2015, 15 (3), 1987-1992.
70. Kumar, M. V.; Prasad, S. K., Influence of quenched disorder created by nanosilica
network on phase transitions in tetracosane. RSC Advances 2012, 2 (22), 8531-
8538.
71. Jackson, C. L.; McKenna, G. B., Vitrification and crystallization of organic liquids
confined to nanoscale pores. Chem. Mater. 1996, 8 (8), 2128-2137.
72. Kovacs, A., Glass transition in amorphous polymers: a phenomenological study.
Adv. Polym. Sci 1963, 3 (3), 394-507.
73. Badrinarayanan, P.; Zheng, W.; Li, Q.; Simon, S. L., The glass transition
temperature versus the fictive temperature. J. Non-Cryst. Solids 2007, 353 (26),
2603-2612.
74. Plazek, D. J.; Bero, C. A., Precise glass temperatures. J. Phys.: Condens. Matter
2003, 15 (11), S789.
75. Plazek, D.; Frund Jr, Z., Epoxy resins (DGEBA): the curing and physical aging
process. J. Polym. Sci., Part B: Polym. Phys. 1990, 28 (4), 431-448.
76. Plazek, D. J.; Ngai, K. L., The glass temperature. In Physical properties of polymers
handbook, Springer: 2007; pp 187-215.
77. Badrinarayanan, P.; Simon, S. L., Origin of the divergence of the timescales for
volume and enthalpy recovery. Polymer 2007, 48 (6), 1464-1470.
78. Tool, A. Q., Relation between inelastic deformability and thermal expansion of
glass in its annealing range. J. Am. Ceram. Soc. 1946, 29 (9), 240-253.
Texas Tech University, Madhusudhan R. Pallaka, December 2019
34
79. Moynihan, C. T.; Easteal, A. J.; De BOLT, M. A.; Tucker, J., Dependence of the
fictive temperature of glass on cooling rate. J. Am. Ceram. Soc. 1976, 59 (1‐2), 12-
16.
80. McKenna, G. B.; Simon, S. L., The glass transition: Its measurement and
underlying physics. Handbook of thermal analysis and calorimetry 2002, 3, 49-
109.
81. McKenna, G., Comprehensive polymer science. Polymer properties 1989, 2, 311-
362.
82. DiMarzio, E.; Gibbs, J., Chain stiffness and the lattice theory of polymer phases.
The Journal of Chemical Physics 1958, 28 (5), 807-813.
83. Gibbs, J. H.; DiMarzio, E. A., Nature of the glass transition and the glassy state.
The Journal of Chemical Physics 1958, 28 (3), 373-383.
84. Gibbs, J. H., Nature of the glass transition in polymers. The Journal of Chemical
Physics 1956, 25 (1), 185-186.
85. Williams, M. L.; Landel, R. F.; Ferry, J. D., The Temperature Dependence of
Relaxation Mechanisms in Amorphous Polymers and Other Glass-forming Liquids.
J. Am. Chem. Soc. 1955, 77 (14), 3701-3707.
86. Doolittle, A. K., Studies in Newtonian flow. II. The dependence of the viscosity of
liquids on free‐space. J. Appl. Phys. 1951, 22 (12), 1471-1475.
87. Huggins, M. L., Some properties of solutions of long-chain compounds. The
Journal of Physical Chemistry 1942, 46 (1), 151-158.
88. Flory, P. J., Principles of polymer chemistry. Cornell University Press: 1953.
89. Vogel, H., The law of the relation between the viscosity of liquids and the
temperature. Phys. Z 1921, 22, 645-646.
90. Kauzmann, W., The nature of the glassy state and the behavior of liquids at low
temperatures. Chem. Rev. 1948, 43 (2), 219-256.
91. Stillinger, F. H., Supercooled liquids, glass transitions, and the Kauzmann paradox.
The Journal of chemical physics 1988, 88 (12), 7818-7825.
92. Simon, S. L.; McKenna, G. B., Experimental evidence against the existence of an
ideal glass transition. J. Non-Cryst. Solids 2009, 355 (10-12), 672-675.
93. Zhao, J.; Simon, S. L.; McKenna, G. B., Using 20-million-year-old amber to test
the super-Arrhenius behaviour of glass-forming systems. Nature Communications
2013, 4.
Texas Tech University, Madhusudhan R. Pallaka, December 2019
35
94. Zhao, J.; Ragazzi, E.; McKenna, G. B., Something about amber: Fictive
temperature and glass transition temperature of extremely old glasses from copal to
Triassic amber. Polymer 2013, 54 (26), 7041-7047.
95. Ellison, C. J.; Torkelson, J. M., The distribution of glass-transition temperatures in
nanoscopically confined glass formers. Nature materials 2003, 2 (10), 695.
96. Ellison, C. J.; Ruszkowski, R. L.; Fredin, N. J.; Torkelson, J. M., Dramatic
reduction of the effect of nanoconfinement on the glass transition of polymer films
via addition of small-molecule diluent. Phys. Rev. Lett. 2004, 92 (9), 095702.
97. Ellison, C. J.; Mundra, M. K.; Torkelson, J. M., Impacts of polystyrene molecular
weight and modification to the repeat unit structure on the glass transition−
nanoconfinement effect and the cooperativity length scale. Macromolecules 2005,
38 (5), 1767-1778.
98. Campbell, C. G.; Vogt, B. D., Examination of the influence of cooperative
segmental dynamics on the glass transition and coefficient of thermal expansion in
thin films probed using poly (n-alkyl methacrylate) s. Polymer 2007, 48 (24), 7169-
7175.
99. Doolittle, A. K., Studies in Newtonian flow. I. The dependence of the viscosity of
liquids on temperature. J. Appl. Phys. 1951, 22 (8), 1031-1035.
100. Fox, D., Physics and chemistry of the organic solid state. Interscience Publishers:
1963; Vol. 2.
101. Flory, P.; Fox, T., Treatment of intrinsic viscosities. J. Am. Chem. Soc. 1951, 73
(5), 1904-1908.
102. Tammann, G.; Hesse, W., The dependence of viscosity upon the temperature of
supercooled liquids. Z. Anorg. Allg. Chem 1926, 156, 245-257.
103. Fulcher, G. S., Analysis of recent measurements of the viscosity of glasses. J. Am.
Ceram. Soc. 1925, 8 (6), 339-355.
104. Yoon, H.; Koh, Y. P.; Simon, S. L.; McKenna, G. B., An ultrastable polymeric
glass: Amorphous fluoropolymer with extreme fictive temperature reduction by
vacuum pyrolysis. Macromolecules 2017, 50 (11), 4562-4574.
105. Yoon, H.; McKenna, G. B., Testing the paradigm of an ideal glass transition:
Dynamics of an ultrastable polymeric glass. Science advances 2018, 4 (12),
eaau5423.
106. Jackson, C. L.; McKenna, G. B., The glass-transition of organic liquids confined to
small pores. J. Non-Cryst. Solids 1991, 131, 221-224.
Texas Tech University, Madhusudhan R. Pallaka, December 2019
36
107. Keddie, J. L.; Jones, R. A.; Cory, R. A., Size-dependent depression of the glass
transition temperature in polymer films. EPL (Europhysics Letters) 1994, 27 (1),
59.
108. Grohens, Y.; Brogly, M.; Labbe, C.; David, M.-O.; Schultz, J., Glass transition of
stereoregular poly (methyl methacrylate) at interfaces. Langmuir 1998, 14 (11),
2929-2932.
109. Porter, C. E.; Blum, F. D., Thermal characterization of PMMA thin films using
modulated differential scanning calorimetry. Macromolecules 2000, 33 (19), 7016-
7020.
110. Priestley, R. D.; Mundra, M. K.; Barnett, N. J.; Broadbelt, L. J.; Torkelson, J. M.,
Effects of nanoscale confinement and interfaces on the glass transition temperatures
of a series of poly (n-methacrylate) films. Aust. J. Chem. 2007, 60 (10), 765-771.
111. Feng, S.; Chen, Y.; Mai, B.; Wei, W.; Zheng, C.; Wu, Q.; Liang, G.; Gao, H.; Zhu,
F., Glass transition of poly (methyl methacrylate) nanospheres in aqueous
dispersion. PCCP 2014, 16 (30), 15941-15947.
112. Roth, C.; Pound, A.; Kamp, S.; Murray, C.; Dutcher, J., Molecular-weight
dependence of the glass transition temperature of freely-standing poly (methyl
methacrylate) films. The European Physical Journal E 2006, 20 (4), 441-448.
113. Sharp, J.; Forrest, J., Thickness dependence of the dynamics in thin films of
isotactic poly (methylmethacrylate). The European Physical Journal E 2003, 12
(1), 97-101.
114. O'connell, P.; McKenna, G., Rheological measurements of the thermoviscoelastic
response of ultrathin polymer films. Science 2005, 307 (5716), 1760-1763.
115. Forrest, J.; Dalnoki-Veress, K.; Dutcher, J., Interface and chain confinement effects
on the glass transition temperature of thin polymer films. Physical Review E 1997,
56 (5), 5705.
116. Sharp, J.; Forrest, J. A., Free surfaces cause reductions in the glass transition
temperature of thin polystyrene films. Phys. Rev. Lett. 2003, 91 (23), 235701.
117. Reiter, G., Mobility of polymers in films thinner than their unperturbed size. EPL
(Europhysics Letters) 1993, 23 (8), 579.
118. Arndt, M.; Stannarius, R.; Gorbatschow, W.; Kremer, F., Dielectric investigations
of the dynamic glass transition in nanopores. Physical Review E 1996, 54 (5), 5377.
119. Zhang, C.; Boucher, V. M.; Cangialosi, D.; Priestley, R. D., Mobility and glass
transition temperature of polymer nanospheres. Polymer 2013, 54 (1), 230-235.
Texas Tech University, Madhusudhan R. Pallaka, December 2019
37
120. Zhang, C.; Guo, Y.; Priestley, R. D., Glass transition temperature of polymer
nanoparticles under soft and hard confinement. Macromolecules 2011, 44 (10),
4001-4006.
121. Perez-de-Eulate, N. G.; Di Lisio, V.; Cangialosi, D., Glass Transition and
Molecular Dynamics in Polystyrene Nanospheres by Fast Scanning Calorimetry.
ACS Macro Letters 2017, 6 (8), 859-863.
122. Keddie, J.; Jones, R., Glass Transition Behavior in Ultra‐Thin Polystyrene Films.
Isr. J. Chem. 1995, 35 (1), 21-26.
123. Koh, Y. P.; McKenna, G. B.; Simon, S. L., Calorimetric glass transition
temperature and absolute heat capacity of polystyrene ultrathin films. Journal of
Polymer Science Part B-Polymer Physics 2006, 44 (24), 3518-3527.
124. Teng, C.; Li, L.; Wang, Y.; Wang, R.; Chen, W.; Wang, X.; Xue, G., How thermal
stress alters the confinement of polymers vitrificated in nanopores. The Journal of
Chemical Physics 2017, 146 (20), 203319.
125. Askar, S.; Wei, T.; Tan, A. W.; Torkelson, J. M., Molecular weight dependence of
the intrinsic size effect on T g in AAO template-supported polymer nanorods: A
DSC study. The Journal of Chemical Physics 2017, 146 (20), 203323.
126. Wei, W.; Feng, S.; Zhou, Q.; Liang, H.; Long, Y.; Wu, Q.; Gao, H.; Liang, G.; Zhu,
F., Study on glass transition and physical aging of polystyrene nanowires by
differential scanning calorimetry. Journal of Polymer Research 2017, 24 (3), 38.
127. Tan, A. W.; Torkelson, J. M., Poly (methyl methacrylate) nanotubes in AAO
templates: Designing nanotube thickness and characterizing the T g-confinement
effect by DSC. Polymer 2016, 82, 327-336.
128. Chen, J.; Li, L.; Zhou, D.; Wang, X.; Xue, G., Effect of geometric curvature on
vitrification behavior for polymer nanotubes confined in anodic aluminum oxide
templates. Physical Review E 2015, 92 (3), 032306.
129. Li, L.; Zhou, D.; Huang, D.; Xue, G., Double glass transition temperatures of poly
(methyl methacrylate) confined in alumina nanotube templates. Macromolecules
2013, 47 (1), 297-303.
130. Hodge, I. M., Enthalpy relaxation and recovery in amorphous materials. J. Non-
Cryst. Solids 1994, 169 (3), 211-266.
131. Hodge, I. M., Physical aging in polymer glasses. Science 1995, 267 (5206), 1945.
132. Qian, Z. Viscoelastic and nanomechanical behaviors of polymeric materials. 2018.
Texas Tech University, Madhusudhan R. Pallaka, December 2019
38
133. Qian, Z.; McKenna, G. B., Mechanical spectral hole burning of an entangled
polymer solution in the stress-controlled domain. Physical Review E 2018, 98 (1),
012501.
134. Qian, Z.; McKenna, G. B., Expanding the application of the van Gurp-Palmen plot:
New insights into polymer melt rheology. Polymer 2018, 155, 208-217.
135. Qian, Z.; Risan, J.; Stadnick, B.; McKenna, G. B., Apparent depth‐dependent
modulus and hardness of polymers by nanoindentation: Investigation of surface
detection error and pressure effects. J. Polym. Sci., Part B: Polym. Phys. 2018, 56
(5), 414-428.
136. Lopez, E.; Simon, S. L., Signatures of structural recovery in polystyrene by
nanocalorimetry. Macromolecules 2016, 49 (6), 2365-2374.
137. Kovacs, A. J.; Aklonis, J. J.; Hutchinson, J. M.; Ramos, A. R., Isobaric volume and
enthalpy recovery of glasses. II. A transparent multiparameter theory. Journal of
Polymer Science: Polymer Physics Edition 1979, 17 (7), 1097-1162.
138. Fujimori, H.; Oguni, M., Non-exponentiality of the enthalpy relaxation under
constant-temperature conditions in the time domain in supercooled liquids and
glasses. J. Non-Cryst. Solids 1994, 172, 601-607.
139. Fujimori, H.; Fujita, H.; Oguni, M., Nonlinearity of the enthalpic response function
to a temperature jump and its interpretation based on fragility in liquid glasses. Bull.
Chem. Soc. Jpn. 1995, 68 (2), 447-455.
140. Boucher, V. M.; Cangialosi, D.; Alegria, A.; Colmenero, J., Enthalpy recovery of
PMMA/silica nanocomposites. Macromolecules 2010, 43 (18), 7594-7603.
141. Hofer, K.; Perez, J.; Johari, G., Detecting enthalpy ‘cross-over’in vitrified solids by
differential scanning calorimetry. Philos. Mag. Lett. 1991, 64 (1), 37-43.
142. Adachi, K.; Kotaka, T., Volume and enthalpy relaxation in polystyrene. Polym. J.
1982, 14 (12), 959.
143. Koh, Y. P.; Grassia, L.; Simon, S. L., Structural recovery of a single polystyrene
thin film using nanocalorimetry to extend the aging time and temperature range.
Thermochim. Acta 2015, 603, 135-141.
144. Narayanaswamy, O., A model of structural relaxation in glass. J. Am. Ceram. Soc.
1971, 54 (10), 491-498.
145. Moynihan, C.; Macedo, P.; Montrose, C.; Montrose, C.; Gupta, P.; DeBolt, M.;
Dill, J.; Dom, B.; Drake, P.; Easteal, A., Structural relaxation in vitreous materials.
Ann. N.Y. Acad. Sci. 1976, 279 (1), 15-35.
Texas Tech University, Madhusudhan R. Pallaka, December 2019
39
146. Kohlrausch, R., Theorie des elektrischen Rückstandes in der Leidener Flasche.
Annalen der Physik 1854, 167 (2), 179-214.
147. Bari, R.; Simon, S. L., Determination of the nonlinearity and activation energy
parameters in the TNM model of structural recovery. J. Therm. Anal. Calorim.
2018, 131 (1), 317-324.
148. Grassia, L.; Simon, S. L., Modeling volume relaxation of amorphous polymers:
modification of the equation for the relaxation time in the KAHR model. Polymer
2012, 53 (16), 3613-3620.
149. Scherer, G. W., Volume relaxation far from equilibrium. J. Am. Ceram. Soc. 1986,
69 (5), 374-381.
150. Moynihan, C.; Crichton, S.; Opalka, S., Linear and non-linear structural relaxation.
J. Non-Cryst. Solids 1991, 131, 420-434.
151. Vyazovkin, S.; Sbirrazzuoli, N.; Dranca, I., Variation of the effective activation
energy throughout the glass transition. Macromol. Rapid Commun. 2004, 25 (19),
1708-1713.
152. Hodge, I., Effects of annealing and prior history on enthalpy relaxation in glassy
polymers. 6. Adam-Gibbs formulation of nonlinearity. Macromolecules 1987, 20
(11), 2897-2908.
153. Hodge, I., Adam-Gibbs formulation of nonlinearity in glassy-state relaxations.
Macromolecules 1986, 19 (3), 936-938.
154. Hodge, I. M.; Huvard, G. S., Effects of annealing and prior history on enthalpy
relaxation in glassy polymers. 3. Experimental and modeling studies of
polystyrene. Macromolecules 1983, 16 (3), 371-375.
155. McKenna, G. B.; Simon, S. L., Structural recovery and physical aging of polymeric
glasses. In Polymer Glasses, CRC Press: 2016; pp 39-70.
156. McKenna, G. B.; Simon, S. L., 50th Anniversary Perspective: Challenges in the
dynamics and kinetics of glass-forming polymers. Macromolecules 2017, 50 (17),
6333-6361.
157. Grassia, L.; Koh, Y. P.; Rosa, M.; Simon, S. L., Complete set of enthalpy recovery
data using Flash DSC: experiment and modeling. Macromolecules 2018, 51 (4),
1549-1558.
158. Boucher, V. M.; Cangialosi, D.; Alegría, A.; Colmenero, J.; González-Irun, J.; Liz-
Marzan, L. M., Accelerated physical aging in PMMA/silica nanocomposites. Soft
Matter 2010, 6 (14), 3306-3317.
Texas Tech University, Madhusudhan R. Pallaka, December 2019
40
159. Bian, Y.; Pejanović, S.; Kenny, J.; Mijović, J., Dynamics of multifunctional
polyhedral oligomeric silsesquioxane/poly (propylene oxide) nanocomposites as
studied by dielectric relaxation spectroscopy and dynamic mechanical
spectroscopy. Macromolecules 2007, 40 (17), 6239-6248.
160. Koh, Y. P.; Simon, S. L., Enthalpy recovery of ultrathin polystyrene film using
Flash DSC. Polymer 2018, 143, 40-45.
161. Koh, Y. P.; Simon, S. L., The glass transition and enthalpy recovery of a single
polystyrene ultrathin film using Flash DSC. The Journal of Chemical Physics 2017,
146 (20), 203329.
162. Guo, Y.; Zhang, C.; Lai, C.; Priestley, R. D.; D’Acunzi, M.; Fytas, G., Structural
relaxation of polymer nanospheres under soft and hard confinement: isobaric versus
isochoric conditions. ACS nano 2011, 5 (7), 5365-5373.
163. Boucher, V. M.; Cangialosi, D.; Alegría, A.; Colmenero, J., Enthalpy recovery in
nanometer to micrometer thick polystyrene films. Macromolecules 2012, 45 (12),
5296-5306.
164. Pye, J. E.; Rohald, K. A.; Baker, E. A.; Roth, C. B., Physical aging in ultrathin
polystyrene films: Evidence of a gradient in dynamics at the free surface and its
connection to the glass transition temperature reductions. Macromolecules 2010,
43 (19), 8296-8303.
165. Green, P. F.; Glynos, E.; Frieberg, B., Polymer films of nanoscale thickness: linear
chain and star-shaped macromolecular architectures. Mrs Communications 2015, 5
(3), 423-434.
166. Koh, Y. P.; Simon, S. L., Structural Relaxation of Stacked Ultrathin Polystyrene
Films. Journal of Polymer Science Part B-Polymer Physics 2008, 46 (24), 2741-
2753.
167. Cangialosi, D.; Boucher, V. M.; Alegría, A.; Colmenero, J., Direct evidence of two
equilibration mechanisms in glassy polymers. Phys. Rev. Lett. 2013, 111 (9),
095701.
168. Boucher, V. M.; Cangialosi, D.; Alegría, A.; Colmenero, J., Reaching the ideal
glass transition by aging polymer films. PCCP 2017, 19 (2), 961-965.
169. Perez-De Eulate, N. G.; Cangialosi, D., The very long-term physical aging of glassy
polymers. PCCP 2018, 20 (18), 12356-12361.
170. Boucher, V. M.; Cangialosi, D.; Alegría, A.; Colmenero, J., Complex
nonequilibrium dynamics of stacked polystyrene films deep in the glassy state. The
Journal of Chemical Physics 2017, 146 (20), 203312.
Texas Tech University, Madhusudhan R. Pallaka, December 2019
41
171. Perez-De-Eulate, N. G.; Cangialosi, D., Double Mechanism for Structural
Recovery of Polystyrene Nanospheres. Macromolecules 2018, 51 (9), 3299-3307.
172. Cangialosi, D.; Boucher, V. M.; Alegria, A.; Colmenero, J., Direct Evidence of
Two Equilibration Mechanisms in Glassy Polymers. Phys. Rev. Lett. 2013, 111 (9),
5.
173. Monnier, X.; Cangialosi, D., Effect of molecular weight on vitrification kinetics
and molecular mobility of a polymer glass confined at the microscale. Thermochim.
Acta 2019, 677, 60-66.
174. Monnier, X.; Cangialosi, D., Thermodynamic ultrastability of a polymer glass
confined at the micrometer length scale. Phys. Rev. Lett. 2018, 121 (13), 137801.
175. Odian, G., Principles of polymerization. John Wiley & Sons: 2004.
176. Gupta, S. K.; Kumar, A., Reaction engineering of step growth polymerization.
Springer Science & Business Media: 2012.
177. Ehlers, J.-E.; Rondan, N. G.; Huynh, L. K.; Pham, H.; Marks, M.; Truong, T. N.,
Theoretical study on mechanisms of the epoxy− amine curing reaction.
Macromolecules 2007, 40 (12), 4370-4377.
178. Jang, J.; Kim, S. C.; Lee, Y., Reaction pathway of liquid crystalline epoxy
resin/aromatic diamine curing system. Macromol. Rapid Commun. 2000, 21 (14),
960-963.
179. Amanuel, S.; Malhotra, V. M., Effects of physical confinement (< 125 nm) on the
curing behavior of phenolic resin. J. Appl. Polym. Sci. 2006, 99 (6), 3183-3186.
180. Li, Q.; Simon, S. L., Surface Chemistry Effects on the Reactivity and Properties of
Nanoconfined Bisphenol M Dicyanate Ester in Controlled Pore Glass.
Macromolecules 2009, 42 (10), 3573-3579.
181. Koh, Y. P.; Li, Q.; Simon, S. L., T g and reactivity at the nanoscale. Thermochim.
Acta 2009, 492 (1), 45-50.
182. Lopez, E.; Simon, S. L., Trimerization Reaction Kinetics and T g Depression of
Polycyanurate under Nanoconfinement. Macromolecules 2015, 48 (13), 4692-
4701.
183. Li, Q.; Simon, S. L., Curing of bisphenol M dicyanate ester under nanoscale
constraint. Macromolecules 2008, 41 (4), 1310-1317.
184. Tarnacka, M.; Dulski, M.; Starzonek, S.; Adrjanowicz, K.; Mapesa, E. U.;
Kaminski, K.; Paluch, M., Following kinetics and dynamics of DGEBA-aniline
polymerization in nanoporous native alumina oxide membranes–FTIR and
dielectric studies. Polymer 2015, 68, 253-261.
Texas Tech University, Madhusudhan R. Pallaka, December 2019
42
185. Sanz, B.; Ballard, N.; Marcos-Fernández, Á.; Asua, J. M.; Mijangos, C.,
Confinement effects in the step-growth polymerization within AAO templates and
modeling. Polymer 2018, 140, 131-139.
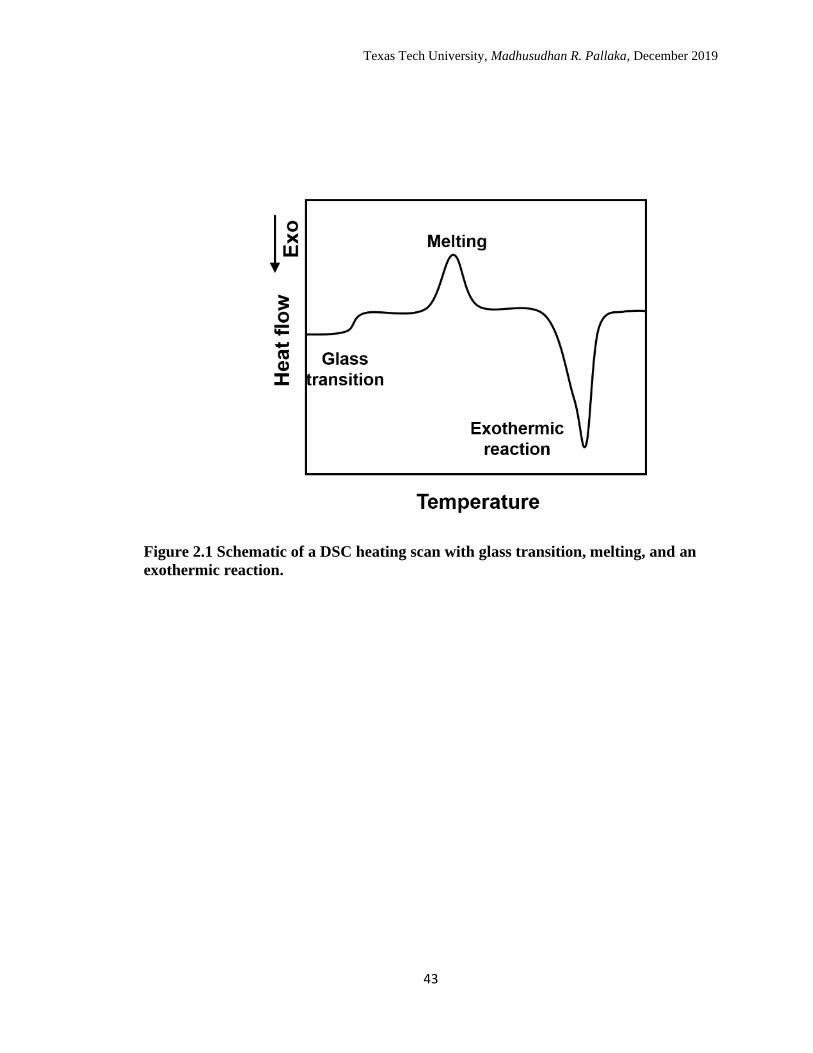
Texas Tech University, Madhusudhan R. Pallaka, December 2019
43
Figure 2.1 Schematic of a DSC heating scan with glass transition, melting, and an
exothermic reaction.
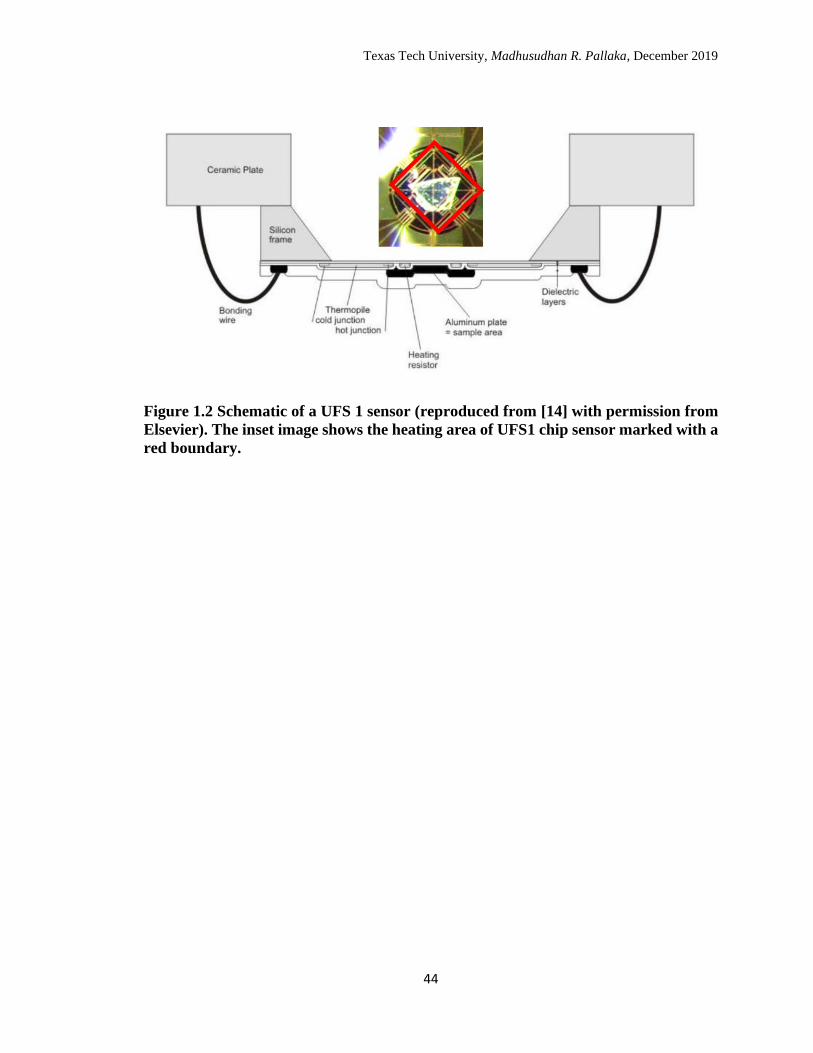
Texas Tech University, Madhusudhan R. Pallaka, December 2019
44
Figure 1.2 Schematic of a UFS 1 sensor (reproduced from [14] with permission from
Elsevier). The inset image shows the heating area of UFS1 chip sensor marked with a
red boundary.
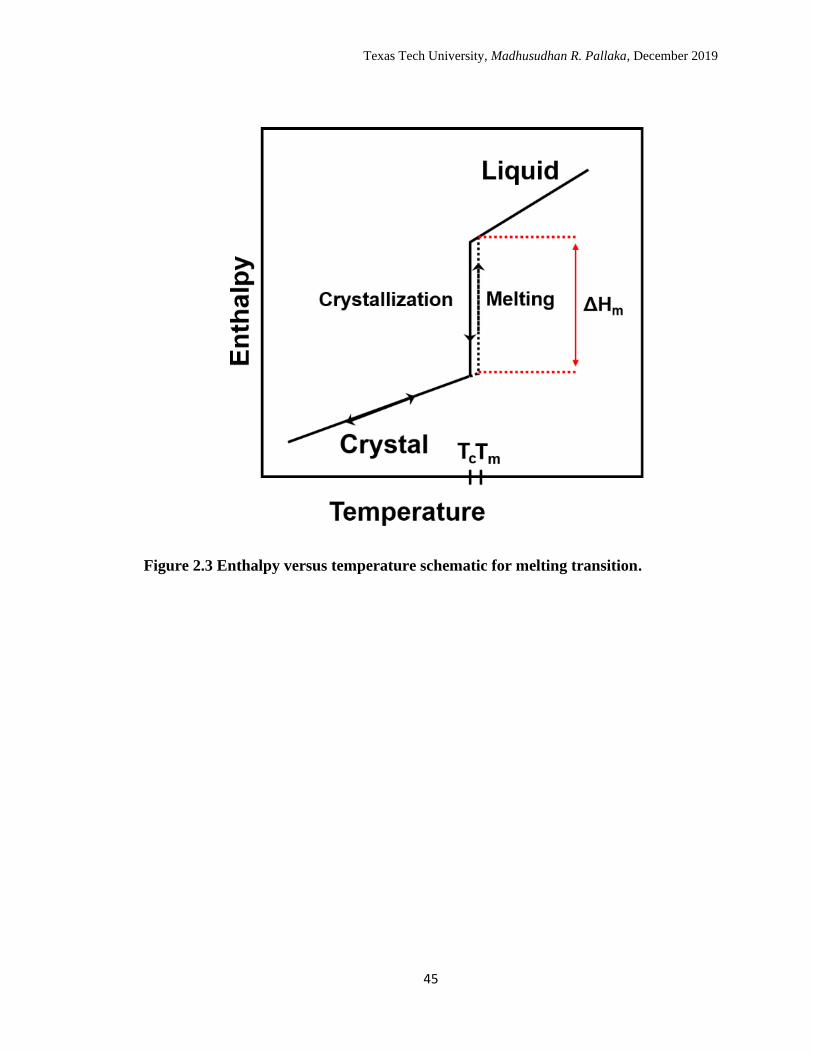
Texas Tech University, Madhusudhan R. Pallaka, December 2019
45
Figure 2.3 Enthalpy versus temperature schematic for melting transition.
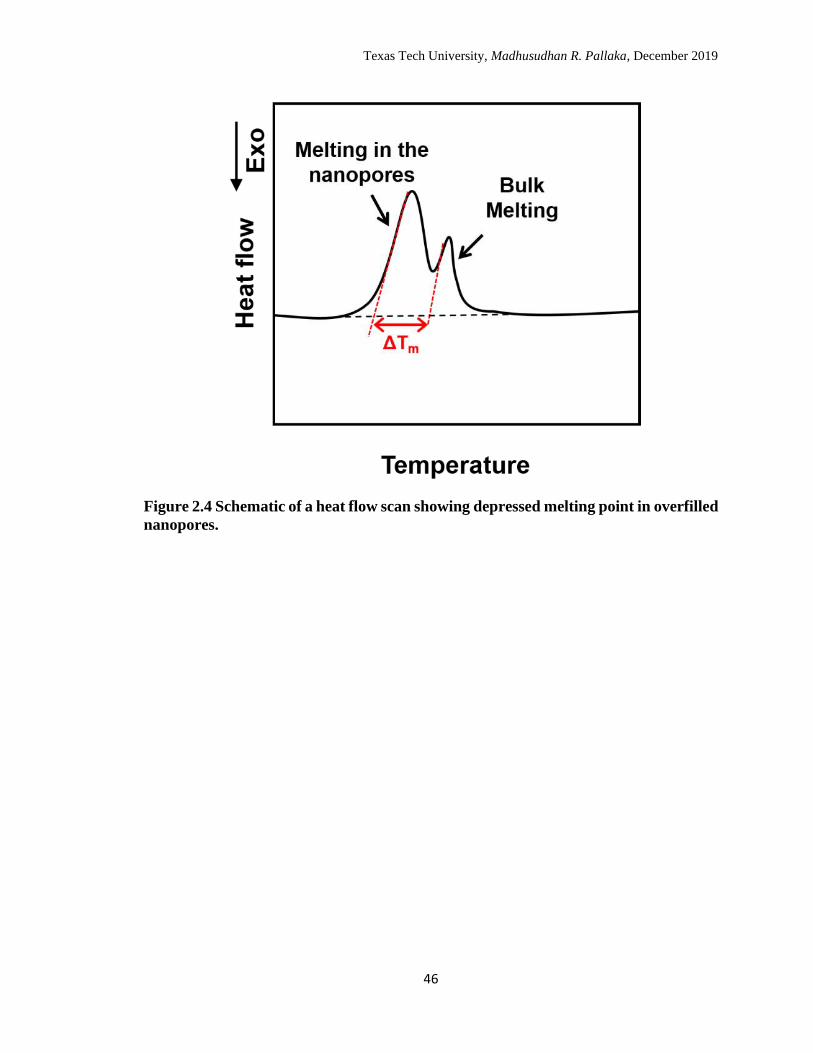
Texas Tech University, Madhusudhan R. Pallaka, December 2019
46
Figure 2.4 Schematic of a heat flow scan showing depressed melting point in overfilled
nanopores.
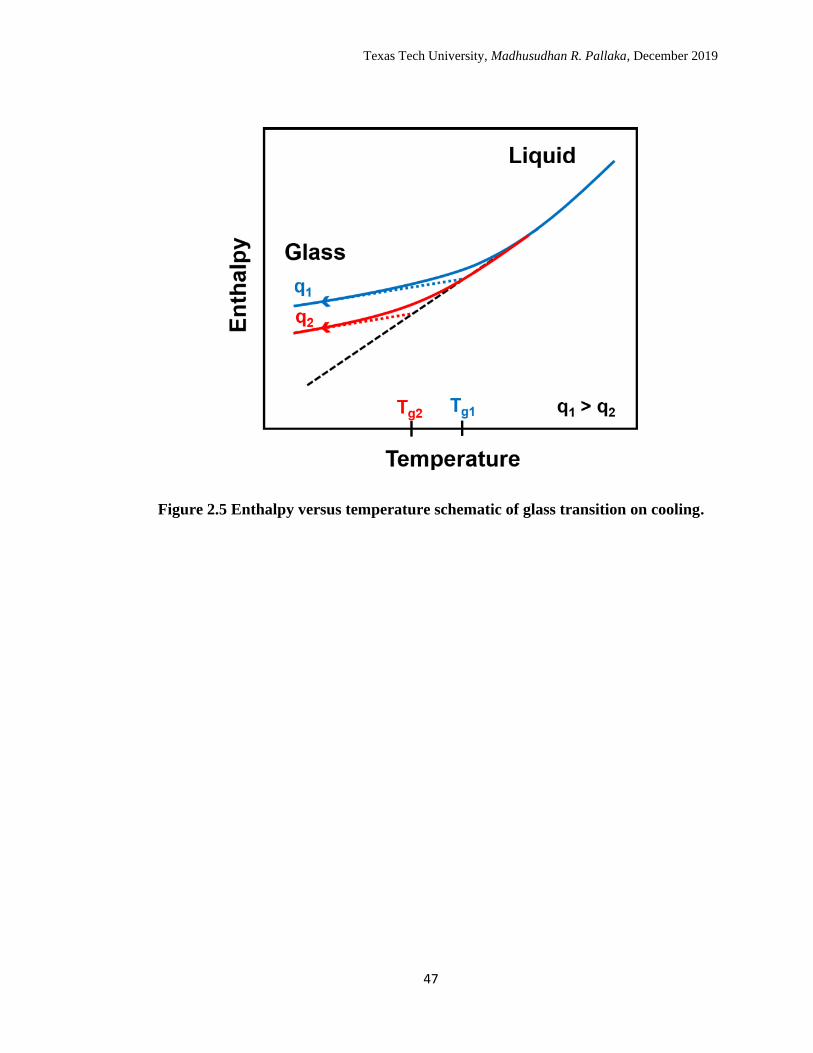
Texas Tech University, Madhusudhan R. Pallaka, December 2019
47
Figure 2.5 Enthalpy versus temperature schematic of glass transition on cooling.
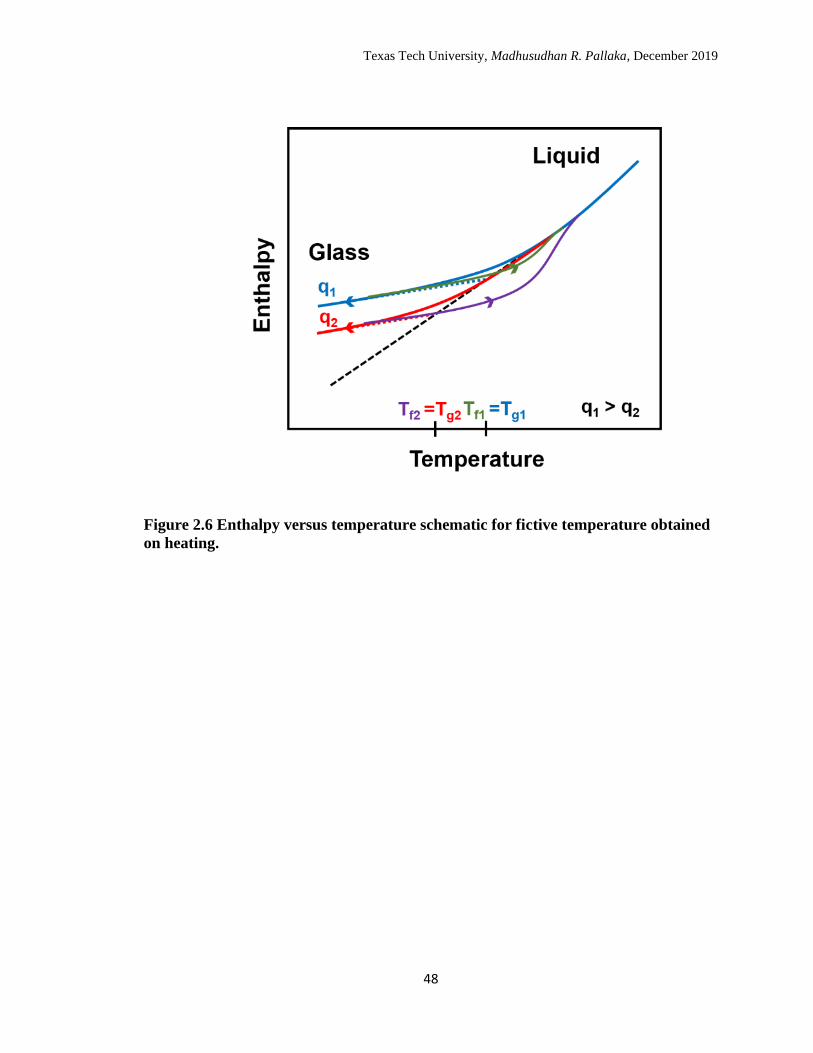
Texas Tech University, Madhusudhan R. Pallaka, December 2019
48
Figure 2.6 Enthalpy versus temperature schematic for fictive temperature obtained
on heating.
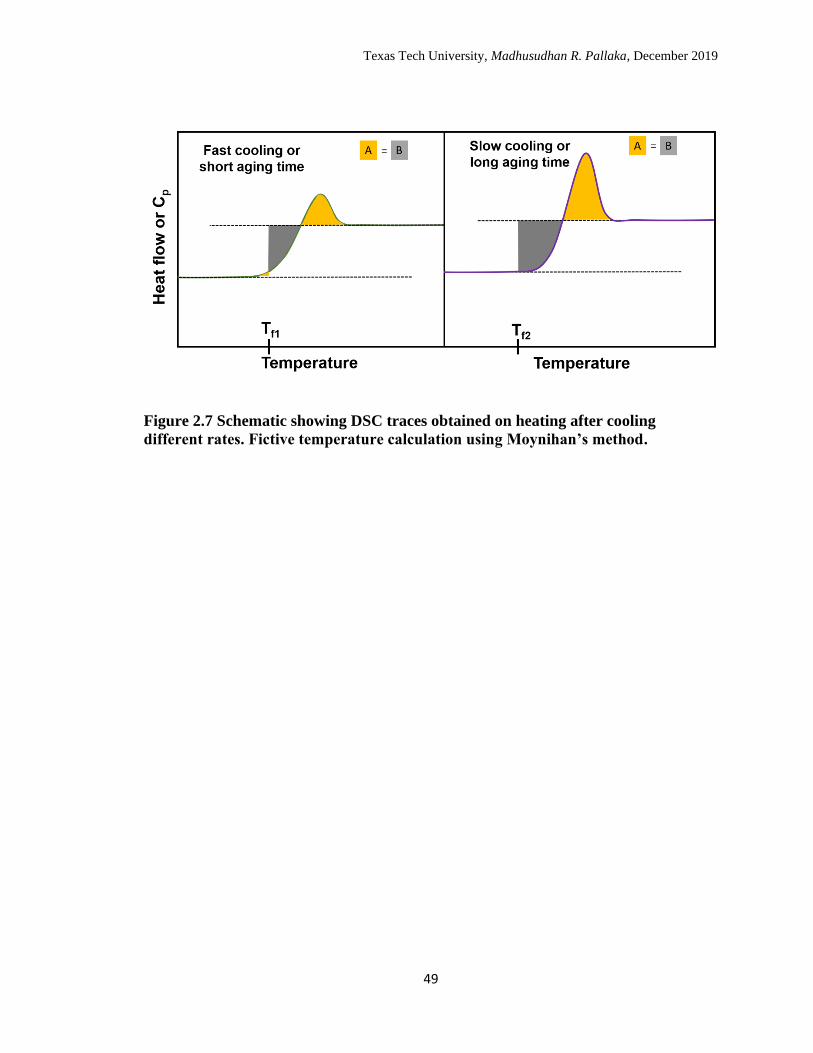
Texas Tech University, Madhusudhan R. Pallaka, December 2019
49
Figure 2.7 Schematic showing DSC traces obtained on heating after cooling
different rates. Fictive temperature calculation using Moynihan’s method.
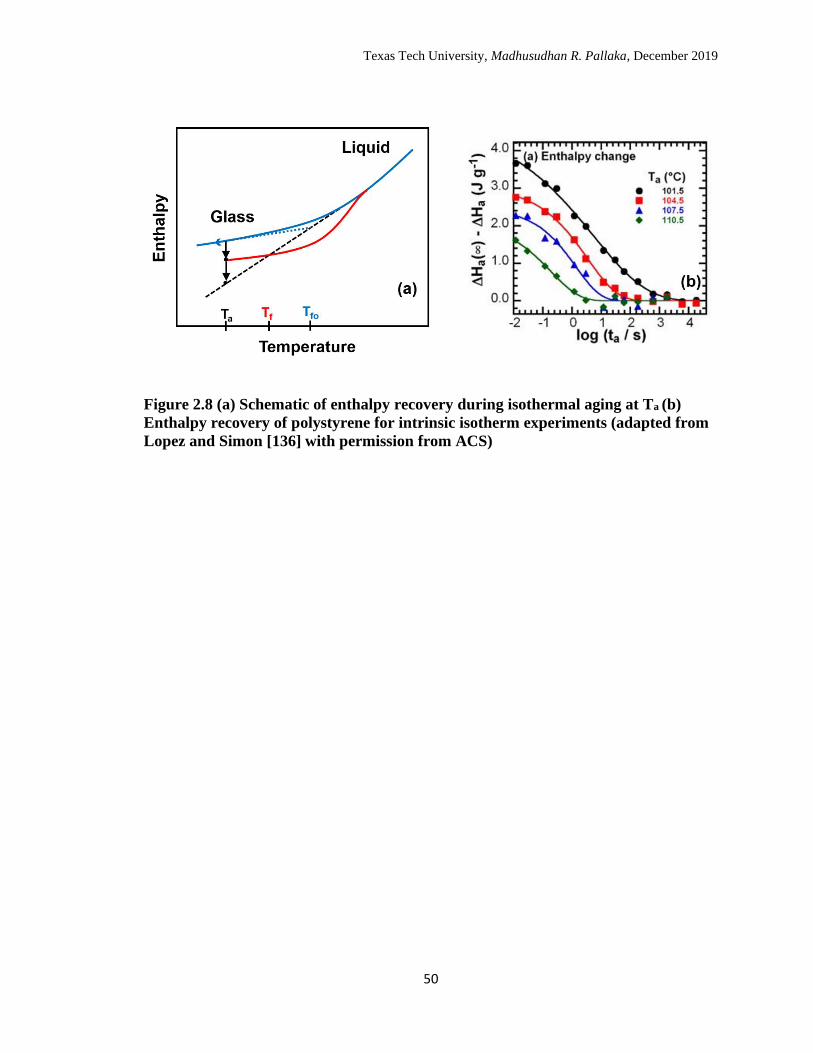
Texas Tech University, Madhusudhan R. Pallaka, December 2019
50
Figure 2.8 (a) Schematic of enthalpy recovery during isothermal aging at Ta (b)
Enthalpy recovery of polystyrene for intrinsic isotherm experiments (adapted from
Lopez and Simon [136] with permission from ACS)
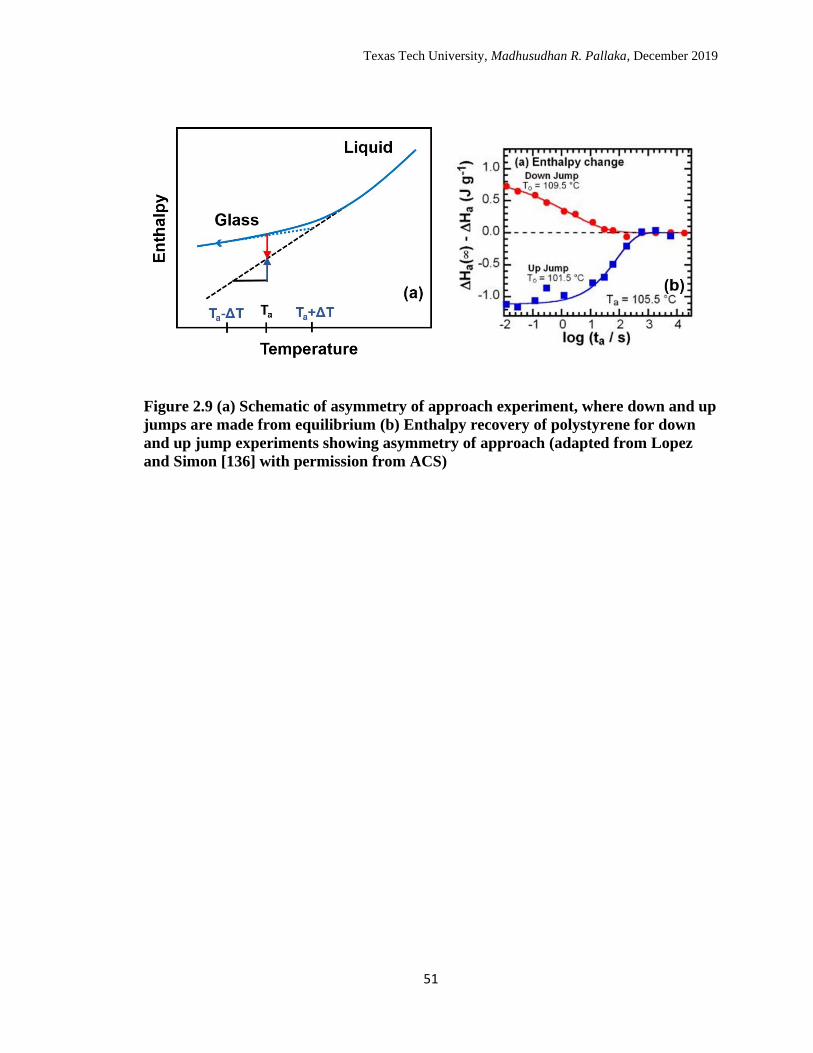
Texas Tech University, Madhusudhan R. Pallaka, December 2019
51
Figure 2.9 (a) Schematic of asymmetry of approach experiment, where down and up
jumps are made from equilibrium (b) Enthalpy recovery of polystyrene for down
and up jump experiments showing asymmetry of approach (adapted from Lopez
and Simon [136] with permission from ACS)
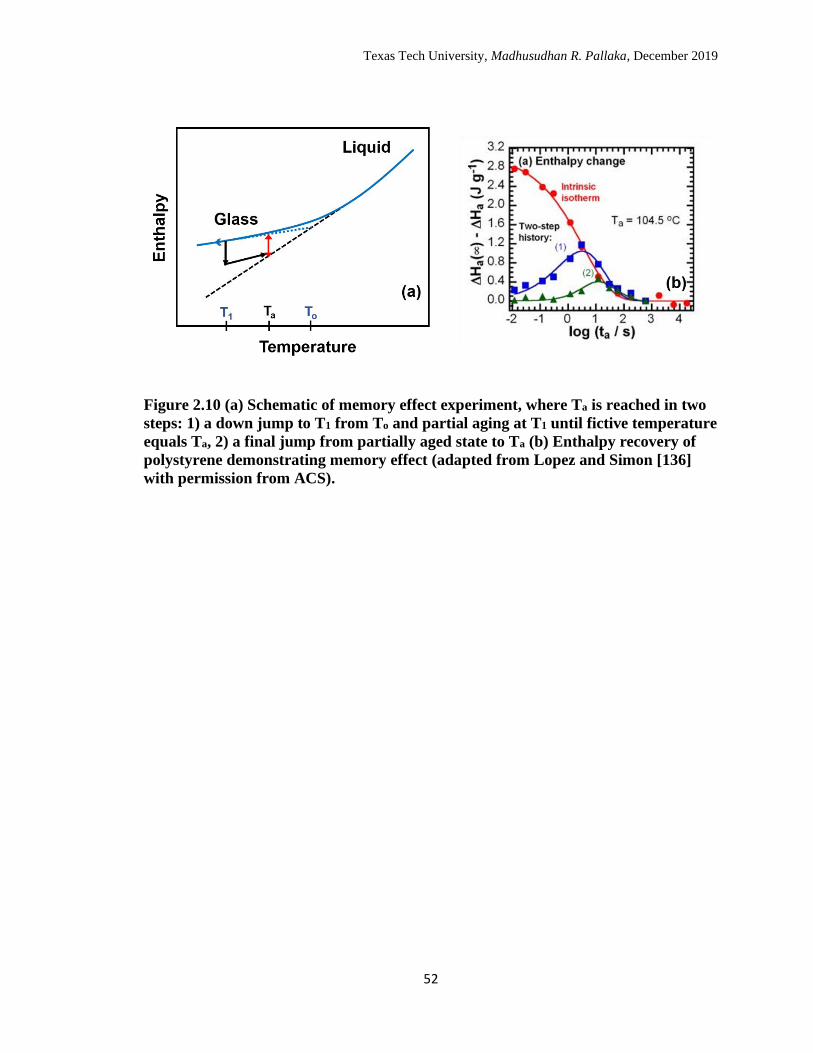
Texas Tech University, Madhusudhan R. Pallaka, December 2019
52
Figure 2.10 (a) Schematic of memory effect experiment, where Ta is reached in two
steps: 1) a down jump to T1 from To and partial aging at T1 until fictive temperature
equals Ta, 2) a final jump from partially aged state to Ta (b) Enthalpy recovery of
polystyrene demonstrating memory effect (adapted from Lopez and Simon [136]
with permission from ACS).
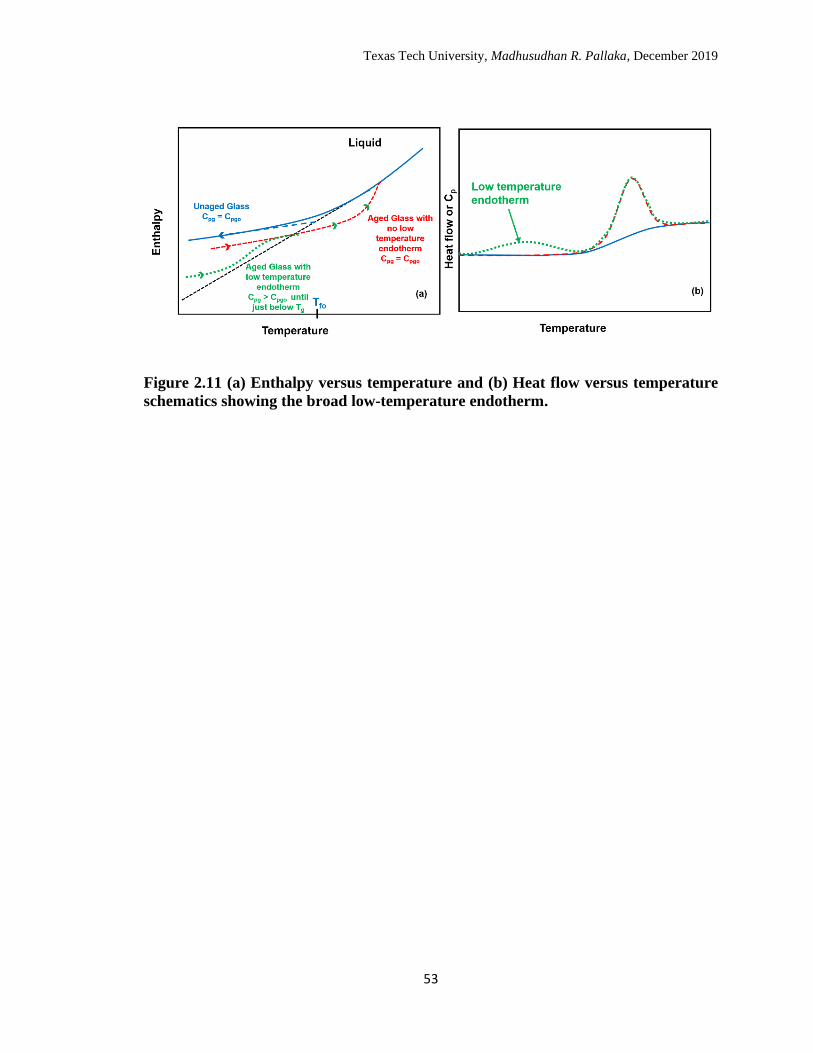
Texas Tech University, Madhusudhan R. Pallaka, December 2019
53
Figure 2.11 (a) Enthalpy versus temperature and (b) Heat flow versus temperature
schematics showing the broad low-temperature endotherm.
Texas Tech University, Madhusudhan R. Pallaka, December 2019
54
CHAPTER 3
MATERIALS
3.1 Nanopore confinement
Two types of nanopores matrices, Anodic Aluminum Oxide nanopores (AAO)
and borosilicate controlled pore glass (CPG), were used in this study. AAO nanopores
were used for experiments in chapters 4-7, whereas CPG nanopores were used for
experiments in chapter 8. The specifications of AAO nanopores and CPG nanopores are
listed in Tables 3.1 and 3.2, respectively. In chapter 4, the AAO nanopores with a
thickness of 5 µm and pore diameters of 20 and 55 nm were used to study the effect of
nanoconfinement on melting, whereas AAO templates with 50 µm thickness and pore
diameters of 18 and 55 nm were used for X-ray diffraction measurements to improve the
signal to noise ratio. In chapter 5, the AAO nanopores with a thickness of 5 µm and pore
diameters of 55 and 350 nm were used as substrates for micronscale polystyrene films. In
chapter 6, the AAO nanopores with a thickness of 5 µm and pore diameters of 20, 55 and
350 nm were used to prepare AAO supported PS nanorods of chosen diameter. The AAO
nanopores were also used as molds to prepare 2D stacked nanorods to study glass
transition behavior; 20 and 350 nm stacked PS rods were also used in chapter 7 for
enthalpy recovery studies. The thickness of the AAO template was limited to 5 μm for
Flash DSC in order to minimize the thermal lag effects on the Flash DSC.1-3 The AAO
templates were cleaned to remove the surface impurities by immersing in
dichloromethane for 3-5 minutes and subsequently washing them several times with
methyl alcohol before drying them in the vacuum oven for two hours at 150 °C. The
Texas Tech University, Madhusudhan R. Pallaka, December 2019
55
vacuum dried templates were then stored under a desiccant to prevent absorption of
adventitious moisture. In chapter 8, CPG nanopores with pore diameters 7.5 and 55 nm
were used as a nanoconfinement matrix to study the effect of nanoconfinement on epoxy-
amine step-growth polymerization kinetics. Prior to use, CPG was cleaned with boiling
nitric acid at 110 °C for 10 hours and subsequently washed with deionized water several
times before vacuum drying at 285 °C for 24 hours. Cleaned and dried CPG was stored
under desiccant to prevent absorption of adventitious water.
3.2 n-alkanes
The n-alkanes used in chapter 4 of this dissertation were n-hexadecane (Sigma-
Aldrich, 99 % purity) and n-nonadecane (Arcos Organics, 99 % purity), both were used
without further purification.
3.3 Polystyrene films on different substrates
This section lists the materials and sample making procedures that were used for
experiments in chapter 5.
A high molecular weight, atactic polystyrene (PS) (Scientific Polymer Products
Inc., USA) with a weight-average molecular weight of 2287 kg/mol and a PDI of 1.04 was
used to prepare films placed on the bare chip, Krytox oil and 55 nm AAO template. Another
atactic polystyrene (PS) with a number-average molecular weight of 2415 kg/mol and a
PDI of 1.15 was used to prepare the film placed on top of 350 nm AAO template.
Polystyrene films were prepared by spin-coating 10 wt % solution of polystyrene
in toluene (99.999% purity, HPLC grade, Sigma-Aldrich) on hydrophilic silicon and mica
substrates. The thicknesses of the films made using both the molecular weights were
Texas Tech University, Madhusudhan R. Pallaka, December 2019
56
measured using an atomic force microscope (Agilent technologies) in tapping mode by
making a scratch on the film on top of silicon wafer; the thicknesses were measured to be
as 1.3 ± 0.1 µm and 1.3 ± 0.3 µm for Mn = 2,199,000 and 2,100,000 g/mol, respectively.
Polystyrene films were placed on the Flash DSC sensors on top of four different
substrates. In case of PS films on Krytox oil and bare chip, two PS films were cut directly
from the silicon substrate where one PS film was placed on top of Krytox oil (DuPontTM)
already present on the heating area of the chip sensor, and the other film was transferred
directly on to the surface of the heating area using a wire loop with a blob of water to
prevent folding of the film. The PS film that was transferred directly onto the chip with the
help of water was dried for a week at room temperature under a desiccant to eliminate
water. The PS films that were placed on AAO substrates were floated on water from the
mica substrate and picked up on a wire mesh, which was followed by a day of ambient
drying and 2 days of vacuum drying at 50 °C. The dried films were placed on top of two
AAO substrates of pore diameters 55 and 350 nm (see Table 3.1 for specifications),
respectively; additionally, the films were allowed to adhere to the template for 30 minutes
at 120 °C in a vacuum oven.
3.4 Indium and vapor-deposited gold
In addition to polystyrene, gold (Kurt J. Lesker Company, Purity: 99.99 %) and
indium (Mettler Toledo, Purity: 99.995 %) were also used for experiments in chapter 5. 50
± 2 nm thick gold was vapor-deposited on the heating area of the Flash DSC chip under
vacuum at two different substrate temperatures (Ts), 23 and 125 °C. In case of indium, a
small pellet was flattened out to approximately ~1 µm thickness and placed on the heating
area of the Flash DSC chip.
Texas Tech University, Madhusudhan R. Pallaka, December 2019
57
3.5 AAO supported and stacked Polystyrene nanorods
This section lists the materials and sample making procedures for samples used
for experiments in chapters 6 and 7.
The high-molecular-weight atactic polystyrene (PS) (Mw = 2415 kg/mol, PDI =
1.15) used in this study was purchased from Polymer Source Inc; a high molecular
weight PS was specifically used to prevent the stacked rods from melting together and
form a bulk polymer. The weight average molecular weight (Mw) and the number average
molecular weight (Mn) of as received PS was obtained by performing gel permeation
chromatography (Tosoh EcoSEC) with an RI detector. The GPC samples were prepared
by dissolving PS in HPLC-grade THF for 24 hours at room temperature. The dissolved
solutions were filtered through a 0.45 µm PTFE syringe filter before loading into the
auto-sampler. Manufacture reported and recharacterized molecular weights of PS are
shown in Table 3.3
The AAO supported and stacked polystyrene nanorods were synthesized by
vacuum melt infiltration of a precursor polystyrene film into an AAO template4-5. In case
of supported polystyrene nanorods, the thickness of a precursor film was chosen to
exactly fill the pores of the AAO template. After various trials based on the available
volume in the pores, films with thicknesses of 0.45 μm, 0.70 μm, and 1.3 μm were chosen
to be vacuum infiltrated into 20, 55 and 350 nm AAO templates (specifications in Table
3.1), respectively. The vacuum infiltration into the aforementioned templates was done at
190 °C for 4 hours to yield AAO supported PS nanorods of chosen diameter. The
precursor films were produced by spin-coating concentrated (~10 wt. %)
polystyrene/toluene solutions (using HPLC-grade, 99.99 % pure toluene) onto cleaved
Texas Tech University, Madhusudhan R. Pallaka, December 2019
58
mica; subsequently, the films were floated on water, picked up by a tweezer and dried for
48 hours under vacuum at 50 °C before they were placed atop the AAO template for
infiltration. The schematic of the infiltration process for AAO supported PS nanorods is
shown in the upper section of Figure 3.1. In case of stacked PS nanorods, a thicker
polystyrene film (~ 50 μm), prepared by compression molding under vacuum in a hot
press at 170 °C, was chosen to infiltrate into AAO templates for all the pore diameters
mentioned. The infiltration conditions were similar to that of AAO supported PS
nanorods. After infiltration, the AAO template was removed by dissolving it in 1 M
sodium hydroxide solution; the supernatant and the excess PS film holding PS nanorods
was vacuum filtered with copious amounts of deionized (DI) water. The excess PS film
with the nanorods was collected and dried in vacuo at 50 °C for 24 hours. The PS
nanorods were separated from the excess PS film by delicately cutting them with a
scalpel. The schematic describing the infiltration process for stacked PS nanorods is
shown in the lower section of Figure 3.1. The stacked PS rods that were characterized for
glass transition behavior in chapter 6, are also used in chapter 7 to perform enthalpy
recovery studies. SEM images of stacked PS nanorods are shown in Figure 3.2. Images
were captured using a Hitachi S-4300 high resolution SEM after removal of the AAO
template and before and after the separation of nanorods from the excess PS film
substrate. The molecular weights of polystyrene nanorods was obtained from the same
GPC using the excess polystyrene film which was under similar processing conditions as
the nanorods; molecular weights of polystyrene nanorods are shown in Table 3.3. The
weight average molecular weight of the polymer significantly reduced to 1000 kg/mol
Texas Tech University, Madhusudhan R. Pallaka, December 2019
59
and the PDI increased to 1.48; as observed from previous studies6-7, the resulting change
in Tg due to change in molecular weight is approximately 0.05 K.
3.6 Epoxy-amine monomer mixture for linear epoxy polymerization
The liquid epoxy resin, Bisphenol A diglycidyl ether (DGEBA, Sigma Aldrich,
Purity: > 99 %) was used in this study; its epoxy equivalent weight is 176 g/eq. An
aromatic amine, aniline (Alfa Aesar, Purity: 99.99 %), was used as the curing agent; its
amine hydrogen equivalent weight is 46.6 g/eq. A 1:1 stoichiometric cure mixture was
prepared by mixing 26.5 parts by weight of aniline and 100 parts by weight of DGEBA;
applying the rule of mixtures the density of the monomer mixture is 1.16 g/cm3. Several
batches of the cure mixture were prepared and stored under a desiccant in a freezer below
-10 °C to avoid curing during storage. The monomer mixture was used in chapter 8 to
study the nanoconfinement effect on linear epoxy polymerization.
Texas Tech University, Madhusudhan R. Pallaka, December 2019
60
References
1. Toda, A.; Konishi, M., An evaluation of thermal lags of fast-scan microchip DSC
with polymer film samples. Thermochim. Acta 2014, 589, 262-269.
2. Schawe, J. E., Measurement of the thermal glass transition of polystyrene in a
cooling rate range of more than six decades. Thermochim. Acta 2015, 603, 128-
134.
3. Zhuravlev, E.; Schick, C., Fast scanning power compensated differential scanning
nano-calorimeter: 2. Heat capacity analysis. Thermochim. Acta 2010, 505 (1), 14-
21.
4. Martín, J.; Maiz, J.; Sacristan, J.; Mijangos, C., Tailored polymer-based nanorods
and nanotubes by" template synthesis": From preparation to applications. Polymer
2012, 53 (6), 1149-1166.
5. Zhang, M.; Dobriyal, P.; Chen, J.-T.; Russell, T. P.; Olmo, J.; Merry, A., Wetting
transition in cylindrical alumina nanopores with polymer melts. Nano Lett. 2006, 6
(5), 1075-1079.
6. Plazek, D. J.; O'Rourke, V. M., Viscoelastic behavior of low molecular weight
polystyrene. Journal of Polymer Science Part A‐2: Polymer Physics 1971, 9 (2),
209-243.
7. Simon, S. L.; Sobieski, J.; Plazek, D., Volume and enthalpy recovery of
polystyrene. Polymer 2001, 42 (6), 2555-2567.
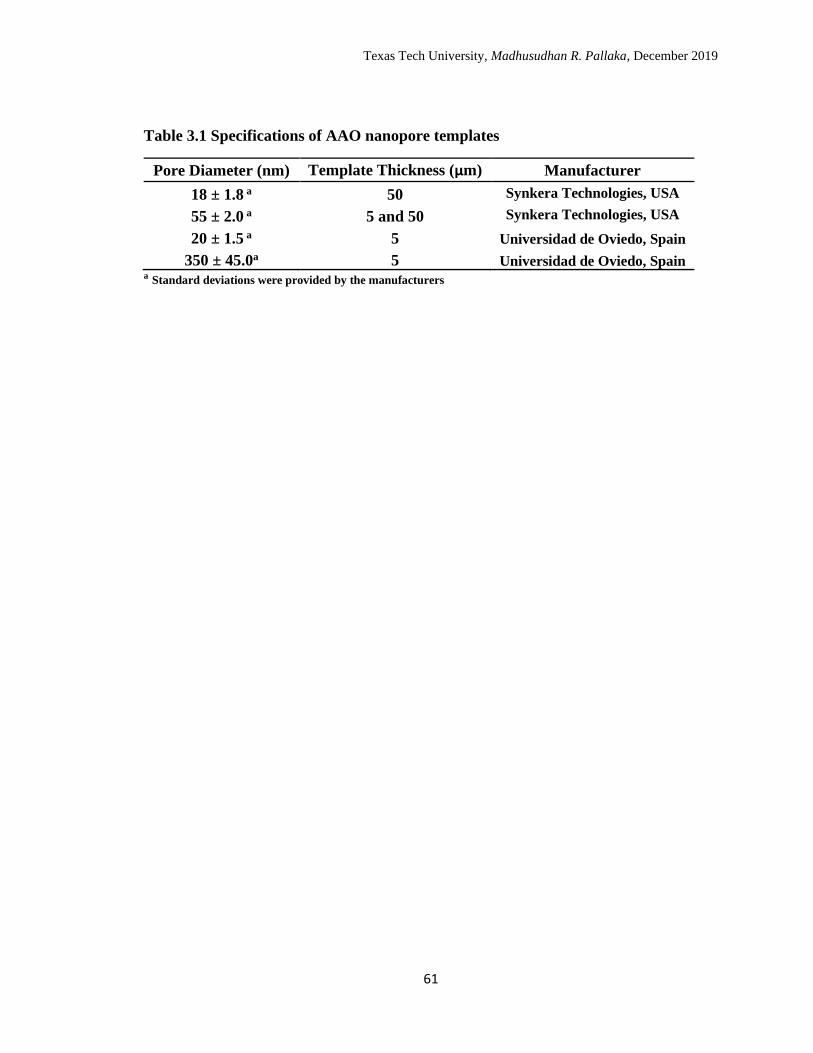
Texas Tech University, Madhusudhan R. Pallaka, December 2019
61
Table 3.1 Specifications of AAO nanopore templates
Pore Diameter (nm) Template Thickness (µm) Manufacturer
18 ± 1.8 a 50 Synkera Technologies, USA
55 ± 2.0 a 5 and 50 Synkera Technologies, USA
20 ± 1.5 a 5 Universidad de Oviedo, Spain
350 ± 45.0a 5 Universidad de Oviedo, Spain a Standard deviations were provided by the manufacturers
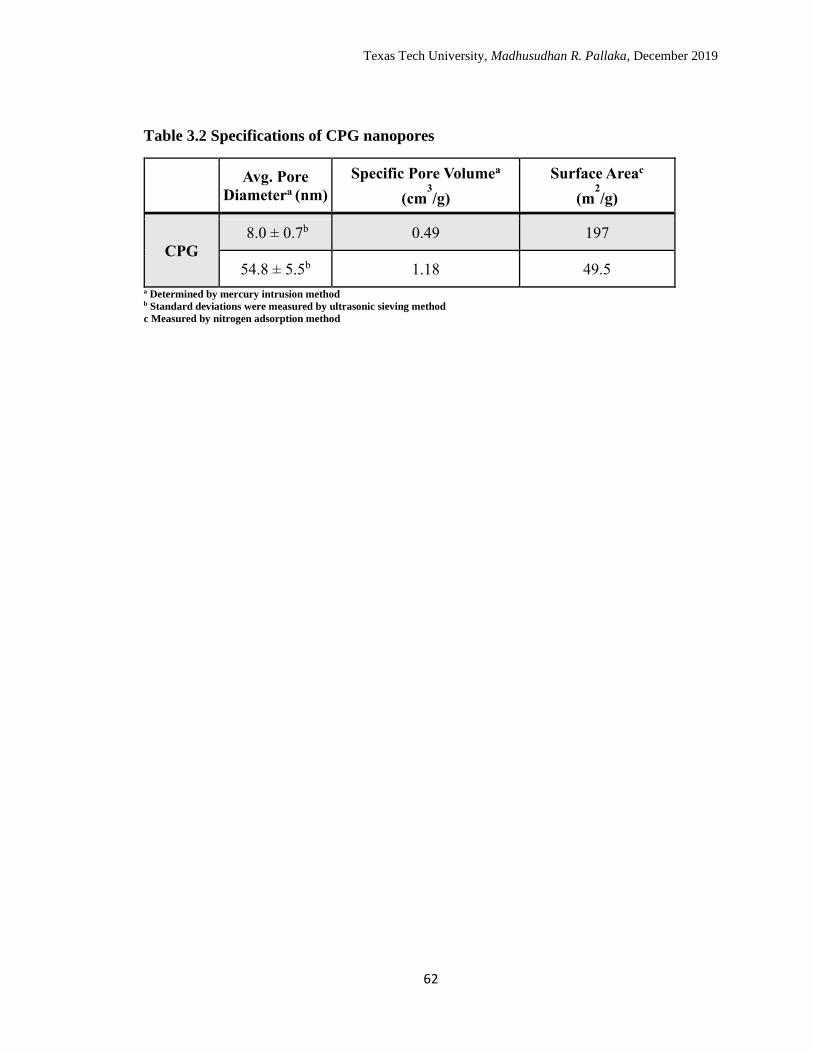
Texas Tech University, Madhusudhan R. Pallaka, December 2019
62
Table 3.2 Specifications of CPG nanopores
Avg. Pore
Diametera (nm)
Specific Pore Volumea
(cm3
/g)
Surface Areac
(m2
/g)
CPG
8.0 ± 0.7b 0.49 197
54.8 ± 5.5b 1.18 49.5
a Determined by mercury intrusion method b Standard deviations were measured by ultrasonic sieving method
c Measured by nitrogen adsorption method
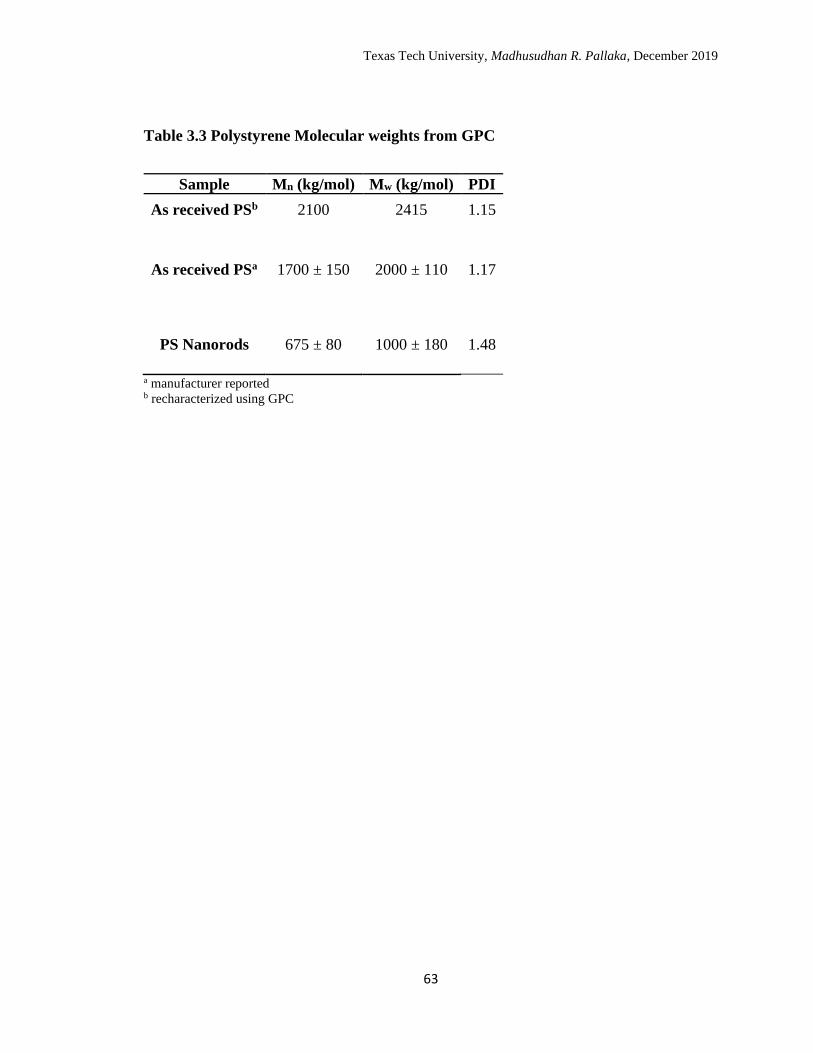
Texas Tech University, Madhusudhan R. Pallaka, December 2019
63
Table 3.3 Polystyrene Molecular weights from GPC
Sample Mn (kg/mol) Mw (kg/mol) PDI
As received PSb 2100 2415 1.15
As received PSa 1700 ± 150 2000 ± 110
1.17
PS Nanorods 675 ± 80 1000 ± 180 1.48
a manufacturer reported b recharacterized using GPC
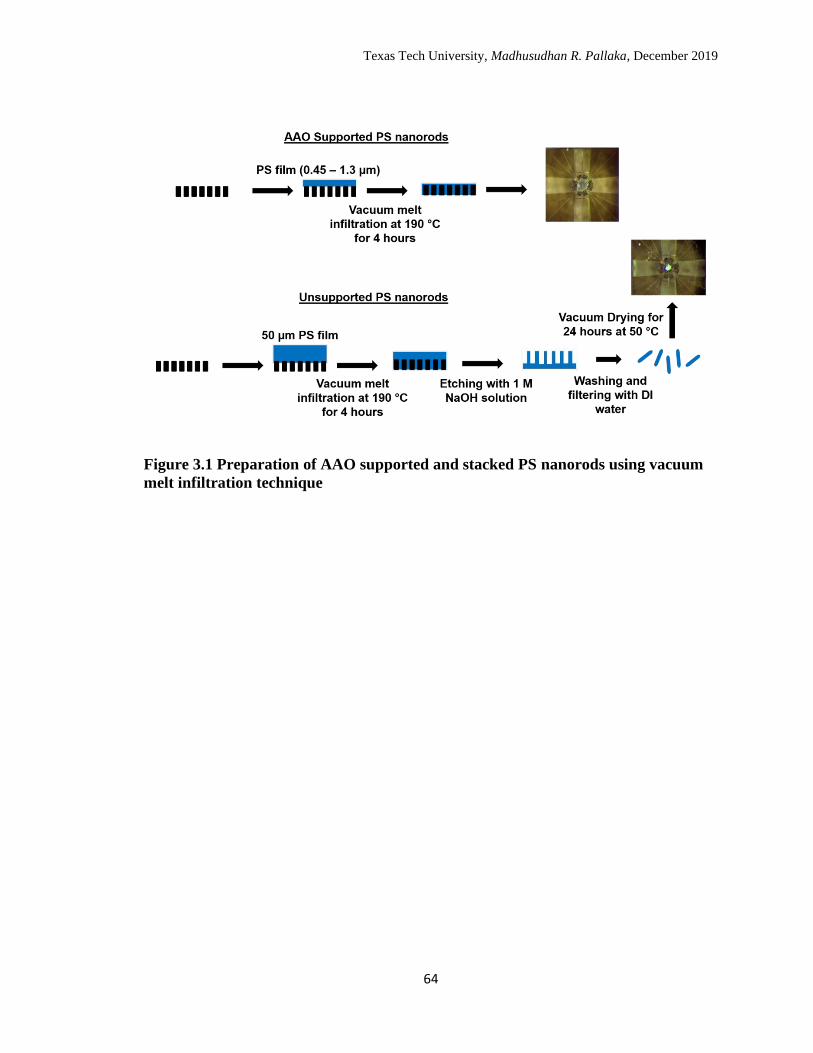
Texas Tech University, Madhusudhan R. Pallaka, December 2019
64
Figure 3.1 Preparation of AAO supported and stacked PS nanorods using vacuum
melt infiltration technique
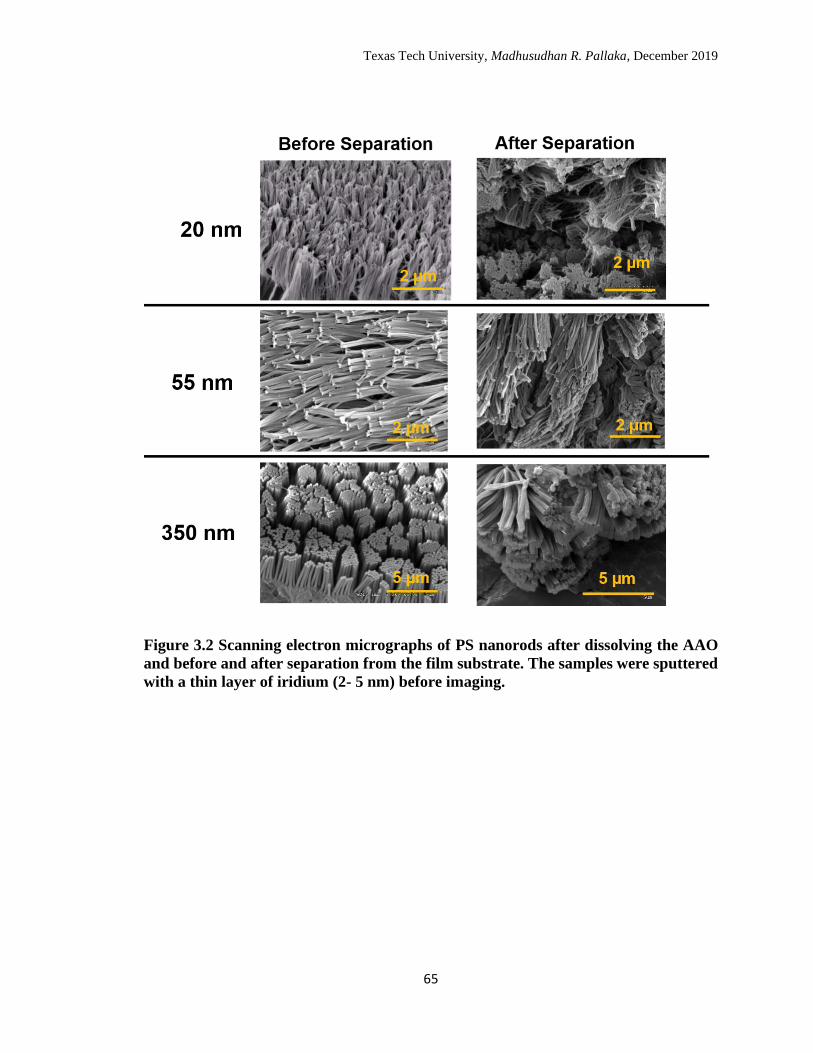
Texas Tech University, Madhusudhan R. Pallaka, December 2019
65
Figure 3.2 Scanning electron micrographs of PS nanorods after dissolving the AAO
and before and after separation from the film substrate. The samples were sputtered
with a thin layer of iridium (2- 5 nm) before imaging.
Texas Tech University, Madhusudhan R. Pallaka, December 2019
66
CHAPTER 4
MELTING BEHAVIOR OF N-ALKANES IN ANODIC ALUMINUM
OXIDE (AAO) NANOPORES USING FLASH DIFFERENTIAL
SCANNING CALORIMETRY
4.1 Introduction
A widely used experimental technique to probe nanoscale confinement effects is
differential scanning calorimetry (DSC). Advancements in the field of calorimetry have
led to the advent of fast scanning calorimetry, allowing heating and cooling rates as high
as 105 K/s.1-3 Such rapid scanning rates are able to mirror conditions during industrial
scale polymer processing,1 as wells as facilitating measurements of the melting point of
sucrose4 and silk fibroin protein5 and the glass transition of rapidly crystallizing
materials6. In addition, the rapid scanning rates offer advantages in terms of measuring
small samples, with sample masses typically ranging from 10 ng to 1 μg. This advantage
enables the study of the properties of single ultra-thin polymeric films,7-9 which otherwise
is tedious in a conventional DSC due to the need for milligrams of material. Although
thin films have been used to probe the nanoconfinement effects with the Flash DSC, the
2D nanopore confinement geometry has never been used with rapid scanning DSC to the
best of our knowledge, and that is the aim of this work.
In this study, an anodic aluminum oxide (AAO) nanoporous membrane is used as
a nanoconfinement matrix for investigation of the phase transitions of n-hexadecane
(C16H34) and n-nonadecane (C19H40) with rapid scanning Flash DSC. The results are
compared to previous studies.10-13 Although our primary objective is to demonstrate the
ability to study nanopore-confined samples with Flash DSC, nanoconfinement of
Texas Tech University, Madhusudhan R. Pallaka, December 2019
67
paraffins (n-alkanes) also finds application in the field of thermal energy storage as phase
change materials (PCMs) especially for thermal energy demands below 120 °C due to the
high latent heat and negligible supercooling.14 Furthermore, microencapsulation and
nanoencapsulation of n-alkanes has contributed to increasing the efficiency of thermal
energy storage in PCMs by enhancing the heat transfer area and broadening the range of
melting temperatures utilizing the size-dependent melting behavior.15-17 Nanoconfined n-
alkanes have also been used as model systems to understand the morphology and melting
behavior of polyolefins at the nanoscale18.
4.2 Experimental
4.2.2 Methodology
Flash differential scanning calorimetry
The experiments were performed on a Mettler Toledo Flash DSC 1 equipped with
a Freon intercooler maintained at -105 °C and a nitrogen gas purge of 20 ml/min. UFS 1
calorimetric chips, both bare and gold coated (a layer of 38.0 ± 0.6 nm is deposited in-
house using physical vapor deposition), were conditioned and corrected according to the
manufacturer’s procedure prior to use. The gold-coated chips were used to verify that
chip surface energy did not influence Tm of n-alkanes. In addition to the manufacturer’s
correction, an additional temperature correction was made for each individual chip based
on the melting of bulk n-hexadecane (C16) and n-nonadecane (C19), as discussed later.
All of the measurements for bulk and nanoconfinement studies for a particular
material followed a similar temperature program with a fixed heating and cooling rate of
±600 K/s. C16 was scanned between -55 and 50 °C, whereas C19 was scanned between 0
and 70 °C. Six cooling and heating cycles were used in both cases, and data were
Texas Tech University, Madhusudhan R. Pallaka, December 2019
68
analyzed on heating. The upper temperature for cooling/heating cycles was chosen such
that negligible sample loss due to vaporization occurred during the six cycles performed;
this was confirmed as the scans superposed exactly within the noise of the measurements
(0.015 ± 0.001 mW).
The Flash DSC measurement procedure involved the following steps: 1) An
empty sensor was first scanned following the cooling and heating cycle described above.
2) A piece of an AAO template (≤ 0.09 mm2) was cut from the parent template under a
microscope and transferred onto the calorimetric sensor, shown in Figure 4.1; and a heat
flow measurement similar to the empty sensor was performed on the blank AAO
template. 3) The AAO template was moved to the side and n-alkane was transferred onto
the heating area and the thermal behavior of the bulk n-alkane was measured. 4) The
piece of AAO template was then placed on the bulk n-alkane and imbibement occurred
spontaneously. The measurements commenced immediately on the generally overfilled
sample (i.e., filled template + bulk excess sample); in some cases, additional alkane was
added after step 4 to obtain an overfilled sample. For studies of the effect of pore fullness,
repeated evaporation was performed at 100 °C for C16 and 160 °C for C19 followed by a
heating scan, and this cycle was repeated until evaporation was complete.
X-ray diffraction
The powder X-ray diffraction patterns were obtained using a Rigaku Ultima Ⅲ
powder diffractometer using CuKα (1.5418 Å) radiation. The incident X-ray beam was
modified using the Rigaku Cross Beam Optics system to create parallel beam geometry.
The patterns were obtained for C16 and C19, in bulk, in 55 nm AAO and in 18nm AAO. In
case of C16, the patterns were collected at -18 °C (maintained using a cold metal block
Texas Tech University, Madhusudhan R. Pallaka, December 2019
69
immersed in liquid nitrogen) in the 2θ range of 3 – 45°; in case of C19, the patterns were
obtained at room temperature in 2θ range of 3 – 40°. In both cases, the data collection
rates were set at 5°/min with a step width of 0.02°.
4.3 Data analysis
4.3.1 Symmetry analysis
When a sample is heated and cooled at the same rate, the heat flow curves on
heating and cooling are expected to be asymmetric about the x-axis due to the heat losses
and due to the heat capacity of the UFS 1 sensor (~ 1.7 x 10⁻⁸ J/g).2, 19 Heat flows are,
thus, corrected using a symmetry analysis19 in order obtain the absolute heat capacity. To
perform the symmetry analysis, regions away from transitions are chosen as shown in
Figure 4.2.a, i.e., below and above the region of phase transitions. The chosen regions are
linearly fitted, and then a symmetry line with two sections is constructed by taking the
arithmetic average of the fitted lines for cooling and heating scans. The entire symmetry
line is constructed by interpolating in the region of transition(s). Finally, the sample heat
flows are corrected by subtracting the symmetry line and the symmetry corrected empty
sensor heat flows. In the case of material confined in the nanopores, an additional
contribution of heat flow from the AAO templates also exists. So, for the symmetry
analysis of nanoconfined samples, the symmetry corrected heating and cooling heat flows
of blank AAO templates are subtracted from the nanoconfined heat flows. A typical
result is shown for corrected heat capacity data in Figure 4.2.b for C16 in AAO.
3.2.2 Estimation of Sample Mass and Pore Fullness
Flash DSC requires ultra-low sample masses for the experiments. Since sample
masses cannot be determined by weighing, they are determined from the data obtained
Texas Tech University, Madhusudhan R. Pallaka, December 2019
70
from the experiment. The first method used to calculate sample mass is based on the
corrected heat capacity coupled with data from the literature:20-22
m =Cp,meas
Cp,lit
(4.1)
where m is sample mass, Cp,meas is the corrected heat capacity from the measurements in
JK−1, and Cp,lit is the specific heat capacity in Jg−1K−1 from the literature; the latter are
obtained from the parameters in Table 4.120 for two liquids of interest.
A second technique used in the calculation of mass is to use the enthalpic change
relative to that in the literature for a first order transition:
m =∆Hmeas
∆Hf
(4.2)
where m is the sample mass, ∆Hmeas is the heat released during melting in J, and ∆Hf is
the bulk heat of fusion of the material in Jg−1. The values of sample masses calculated
from Equation 4.1 (1.86 ng) and Equation 4.2 (1.94 ng) for the symmetry-corrected data
in Figure 4.2.a agree quite well. For the described experiments, the sample masses ranged
from 4 to 100 ng with a typical error of ~ 5 %.
Pore fullness in the overfilled pores is determined by first deconvolution of
overlapped peaks associated with bulk and nanoconfined melting as shown in Figure 4.3.
The pore fullness is determined from the relative amount of heat release:
Texas Tech University, Madhusudhan R. Pallaka, December 2019
71
Pore fullness =(
∆Hmeas,bulk
∆Hf) + (
∆Hmeas,conf
∆Hf(d))
(∆Hmeas,conf
∆Hf(d))
(4.3)
where ∆Hmeas,bulk and ∆Hmeas,conf are the measured heats in J associated with the
melting peaks for the bulk and nanoconfined n-alkane, respectively (i.e., the areas under
red and green peaks in Figure 4.3), ∆Hf is the bulk heat of fusion of the material in Jg−1,
and ∆Hf(d) is the heat of fusion of the material in nanopores of pore diameter (d) in Jg−1.
For C16, ∆Hf(d) is available13, but in case of C19, due to a lack of data in the literature, it
is assumed that ∆Hf(d) ≈ ∆Hf. This latter assumption is expected to give a reasonable
estimate for pore fullness; for example, for C16, the error in assuming ∆Hf(d) ≈ ∆Hf is
negligible in 55 nm AAO pores and less than 3 % in 20 nm AAO pores. Similarly, if a
polymorph with a different heat of fusion is present in the pores, similar magnitudes of
error are expected in the degree of filling since the change in ∆Hf for various polymorphs
of organic crystals are typically in the range of 10-20 %.23-24 As we show later, the
melting point depression is independent of the degree of fullness; hence, reasonable
estimates of pore fullness are sufficient for this work.
For underfilled pores, which are obtained by partially evaporating the n-alkane
from overfilled samples, the pore fullness is:
Pore fullness =∆Hmeas,underfilled
∆Hmeas,conf
(4.4)
where ∆Hmeas,underfilled is the measured heat released during the melting of n-alkane in
partially filled nanopores (area under the black peak for underfilled pores) and
Texas Tech University, Madhusudhan R. Pallaka, December 2019
72
∆Hmeas,conf is again the measured heat released during the melting of n-alkane in
completely full nanopores; the latter is the area under the red peak in Figure 4.3, obtained
from the previous scans of the same sample with overfilled pores, i.e., prior to partial
vaporization.
4.4 Results
4.4.1 Melting of C16 in the bulk and AAO nanopores
Representative scans of symmetry-corrected melting endotherms of bulk and
nanoconfined C16 are shown in Figure 4.4.a and Figure 4.4.b for 55 and 20 nm pores,
respectively. The melting point is taken as the onset point. For the bulk samples shown in
the uppermost scans, Tm= 19.88 °C (Figure 4.4.a) and Tm= 18.47 °C (Figure 4.4.b), are
higher than the NIST literature value (Tm= 18 °C).25 Melting temperatures for the bulk
ranged from 15.30 to 20.60 °C with an average of 17.84 °C ± 1.96 °C when measured on
ten different flash DSC sensors. For six sensors coated with gold the Tms ranged from
16.00 to 19.50 °C with an average of 18.17 ± 1.38 °C. The deviations of Tm from
literature values on both bare and gold-coated chips are typical of the errors for Flash
sensors8 and indicate that additional calibration of a given sensor is needed for more
accurate data. In fact, n-hexadecane can be used as a temperature calibrant for the Flash
DSC; and, it is indeed used in this study as an internal standard to determine the melting
point depression in the nanopores (Tm(d)), as discussed below.
The melting of C16 in 55 and 20 nm overfilled AAO nanopores results in two
overlapping peaks as shown in Figure 4.3 and Figures 4.4.a and 4.4.b for the scans with
pore fullness greater than 100 %. The lower temperature peak is related to the melting of
Texas Tech University, Madhusudhan R. Pallaka, December 2019
73
C16 in the nanopores, whereas the peak at the higher temperature is related to the bulk,
which provides an internal reference to quantify the magnitude of depression (ΔTm =
Tm − Tm(d)) in the nanopores. The melting points are obtained from the onsets of the
resolved peaks after deconvolution (with the resolved bulk melting peaks shown in green
and the corresponding onsets indicated by arrows in Figures 4.4.a and 4.4.b).
The average melting point depression (∆Tm) for 55 nm overfilled samples is 4.20
± 0.60 °C based on the average of four overfilled samples on three chips. Similarly, the
∆Tm for 20 nm overfilled samples is 6.01 ± 0.24 °C based on the average of ten overfilled
samples on one chip. By systematically evaporating the material from the overfilled
pores, we obtain underfilled pores with pore fullness less than 100 %; also shown in
Figures 4.4.a and 4.4.b. The melting point of AAO nanoconfined C16 is found to be
independent of pore fullness with an average melting point of 13.77 ± 0.18 °C in 55 nm
AAO pores and 11.99 ± 0.21 °C in 20 nm AAO pores, respectively. These melting point
values were calculated based on overfilled and underfilled samples on various chips and
with the temperature corrected based on the bulk Tm of C16 on the respective chip.
4.4.2 Solid-solid transition and melting of C19 in bulk and AAO nanopores
Symmetry-corrected heat flows for the melting of bulk and nanopore-confined C19
are shown in Figures 4.5.a and 4.5.b. The representative heating scans for the bulk C19,
uppermost scans, reveal a solid-solid transition along with the melting transition.
Polymorphic transitions like solid-solid transitions occur in odd numbered n-alkanes
starting from n-nonane (n-C9H20) and have been suggested to arise from transition
between a stable crystalline phase to a rotator phase with conformational disorder prior to
melting.20, 26-27 In the case of C19, specifically, the transition is from an orthorhombic
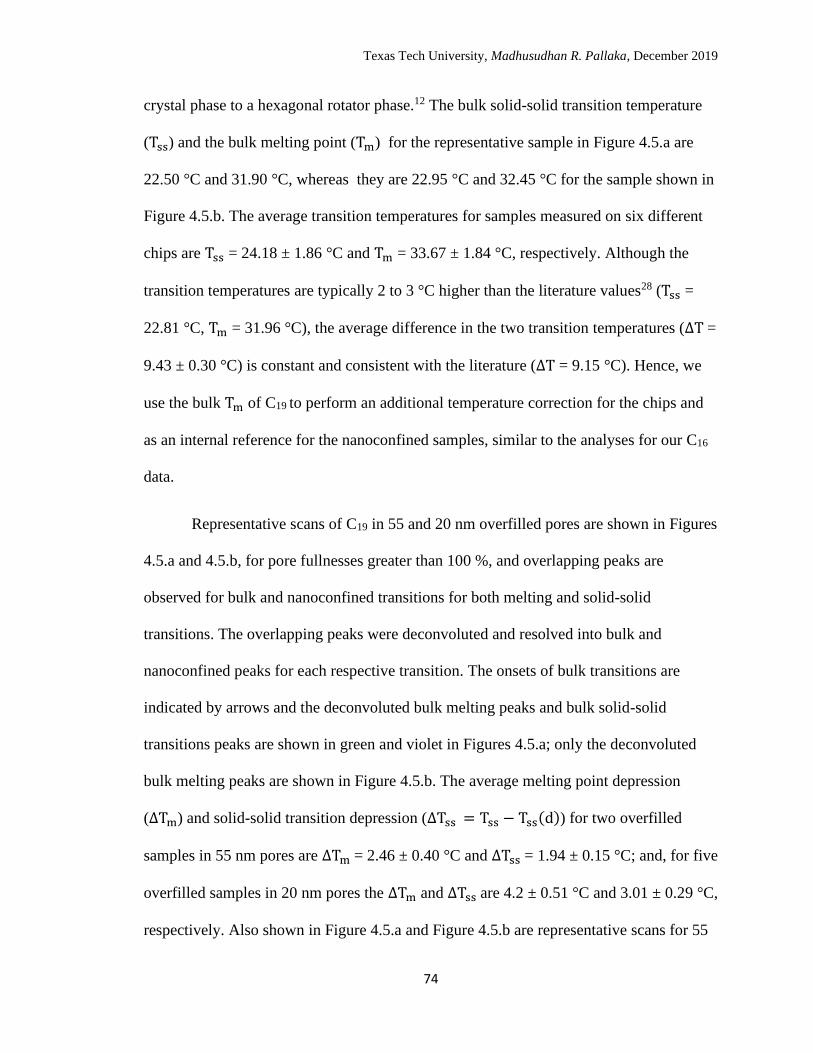
Texas Tech University, Madhusudhan R. Pallaka, December 2019
74
crystal phase to a hexagonal rotator phase.12 The bulk solid-solid transition temperature
(Tss) and the bulk melting point (Tm) for the representative sample in Figure 4.5.a are
22.50 °C and 31.90 °C, whereas they are 22.95 °C and 32.45 °C for the sample shown in
Figure 4.5.b. The average transition temperatures for samples measured on six different
chips are Tss = 24.18 ± 1.86 °C and Tm = 33.67 ± 1.84 °C, respectively. Although the
transition temperatures are typically 2 to 3 °C higher than the literature values28 (Tss =
22.81 °C, Tm = 31.96 °C), the average difference in the two transition temperatures (∆T =
9.43 ± 0.30 °C) is constant and consistent with the literature (∆T = 9.15 °C). Hence, we
use the bulk Tm of C19 to perform an additional temperature correction for the chips and
as an internal reference for the nanoconfined samples, similar to the analyses for our C16
data.
Representative scans of C19 in 55 and 20 nm overfilled pores are shown in Figures
4.5.a and 4.5.b, for pore fullnesses greater than 100 %, and overlapping peaks are
observed for bulk and nanoconfined transitions for both melting and solid-solid
transitions. The overlapping peaks were deconvoluted and resolved into bulk and
nanoconfined peaks for each respective transition. The onsets of bulk transitions are
indicated by arrows and the deconvoluted bulk melting peaks and bulk solid-solid
transitions peaks are shown in green and violet in Figures 4.5.a; only the deconvoluted
bulk melting peaks are shown in Figure 4.5.b. The average melting point depression
(ΔTm) and solid-solid transition depression (ΔTss = Tss − Tss(d)) for two overfilled
samples in 55 nm pores are ΔTm = 2.46 ± 0.40 °C and ΔTss = 1.94 ± 0.15 °C; and, for five
overfilled samples in 20 nm pores the ΔTm and ΔTss are 4.2 ± 0.51 °C and 3.01 ± 0.29 °C,
respectively. Also shown in Figure 4.5.a and Figure 4.5.b are representative scans for 55
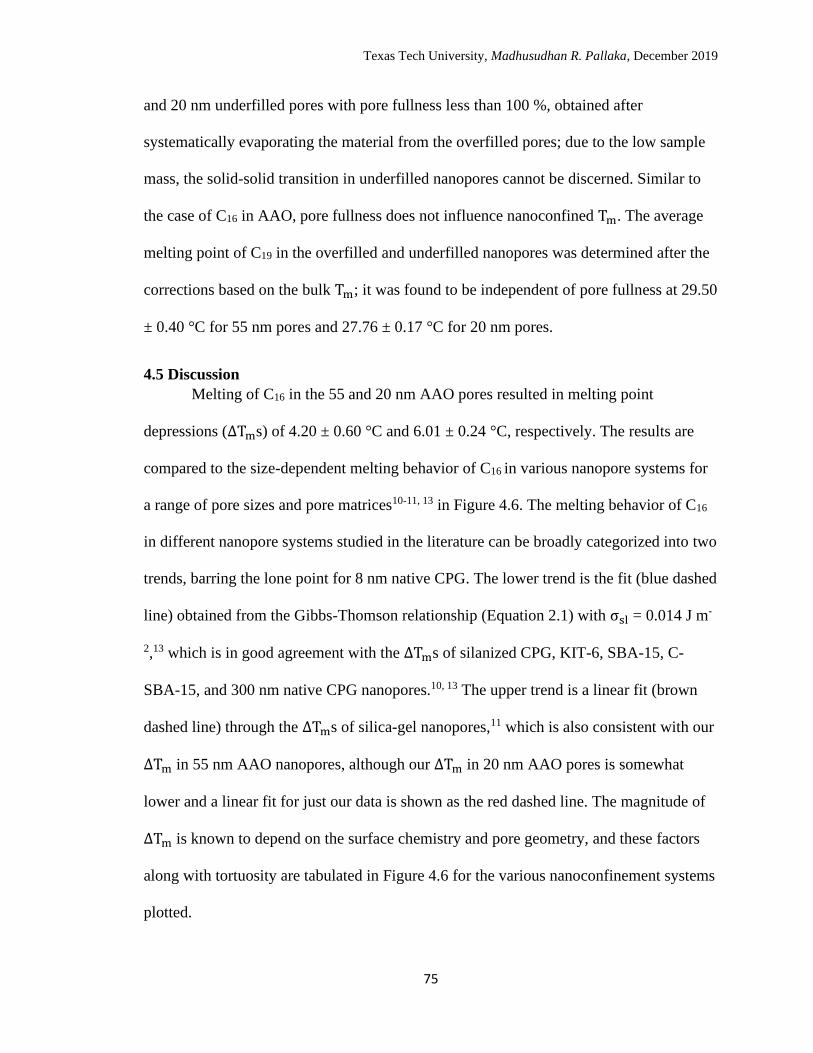
Texas Tech University, Madhusudhan R. Pallaka, December 2019
75
and 20 nm underfilled pores with pore fullness less than 100 %, obtained after
systematically evaporating the material from the overfilled pores; due to the low sample
mass, the solid-solid transition in underfilled nanopores cannot be discerned. Similar to
the case of C16 in AAO, pore fullness does not influence nanoconfined Tm. The average
melting point of C19 in the overfilled and underfilled nanopores was determined after the
corrections based on the bulk Tm; it was found to be independent of pore fullness at 29.50
± 0.40 °C for 55 nm pores and 27.76 ± 0.17 °C for 20 nm pores.
4.5 Discussion Melting of C16 in the 55 and 20 nm AAO pores resulted in melting point
depressions (ΔTms) of 4.20 ± 0.60 °C and 6.01 ± 0.24 °C, respectively. The results are
compared to the size-dependent melting behavior of C16 in various nanopore systems for
a range of pore sizes and pore matrices10-11, 13 in Figure 4.6. The melting behavior of C16
in different nanopore systems studied in the literature can be broadly categorized into two
trends, barring the lone point for 8 nm native CPG. The lower trend is the fit (blue dashed
line) obtained from the Gibbs-Thomson relationship (Equation 2.1) with σsl = 0.014 J m-
2,13 which is in good agreement with the ΔTms of silanized CPG, KIT-6, SBA-15, C-
SBA-15, and 300 nm native CPG nanopores.10, 13 The upper trend is a linear fit (brown
dashed line) through the ΔTms of silica-gel nanopores,11 which is also consistent with our
ΔTm in 55 nm AAO nanopores, although our ΔTm in 20 nm AAO pores is somewhat
lower and a linear fit for just our data is shown as the red dashed line. The magnitude of
ΔTm is known to depend on the surface chemistry and pore geometry, and these factors
along with tortuosity are tabulated in Figure 4.6 for the various nanoconfinement systems
plotted.
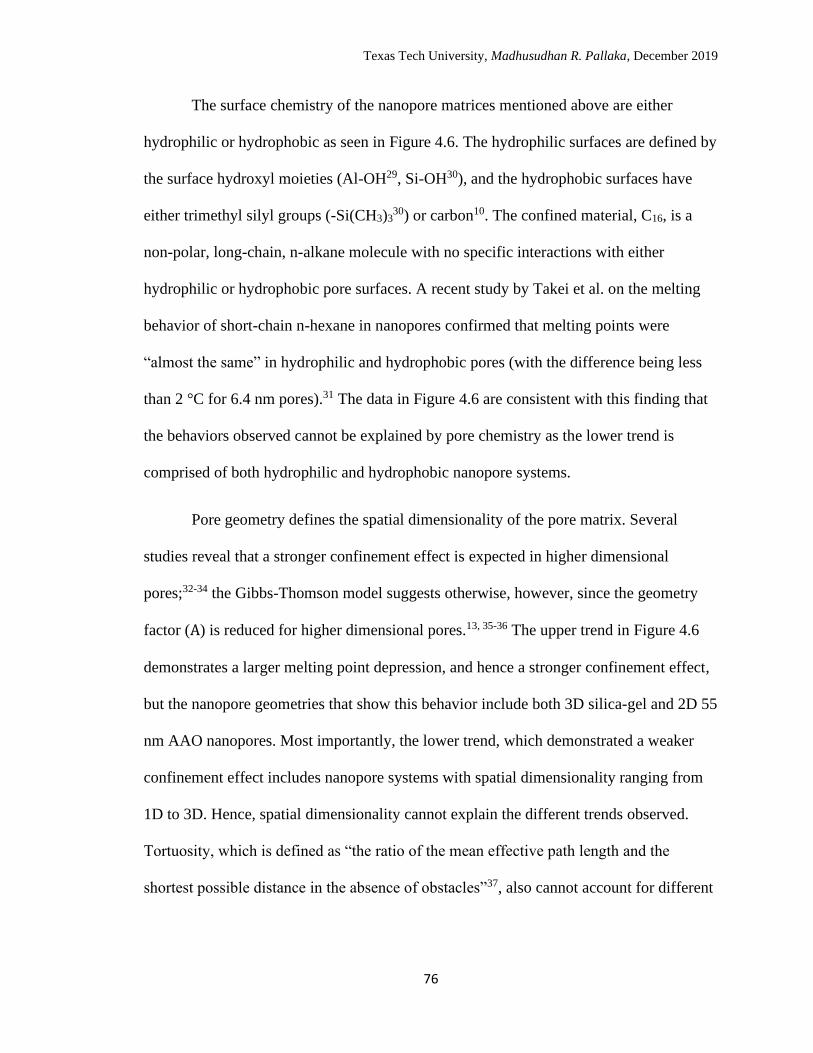
Texas Tech University, Madhusudhan R. Pallaka, December 2019
76
The surface chemistry of the nanopore matrices mentioned above are either
hydrophilic or hydrophobic as seen in Figure 4.6. The hydrophilic surfaces are defined by
the surface hydroxyl moieties (Al-OH29, Si-OH30), and the hydrophobic surfaces have
either trimethyl silyl groups (-Si(CH3)330) or carbon10. The confined material, C16, is a
non-polar, long-chain, n-alkane molecule with no specific interactions with either
hydrophilic or hydrophobic pore surfaces. A recent study by Takei et al. on the melting
behavior of short-chain n-hexane in nanopores confirmed that melting points were
“almost the same” in hydrophilic and hydrophobic pores (with the difference being less
than 2 °C for 6.4 nm pores).31 The data in Figure 4.6 are consistent with this finding that
the behaviors observed cannot be explained by pore chemistry as the lower trend is
comprised of both hydrophilic and hydrophobic nanopore systems.
Pore geometry defines the spatial dimensionality of the pore matrix. Several
studies reveal that a stronger confinement effect is expected in higher dimensional
pores;32-34 the Gibbs-Thomson model suggests otherwise, however, since the geometry
factor (A) is reduced for higher dimensional pores.13, 35-36 The upper trend in Figure 4.6
demonstrates a larger melting point depression, and hence a stronger confinement effect,
but the nanopore geometries that show this behavior include both 3D silica-gel and 2D 55
nm AAO nanopores. Most importantly, the lower trend, which demonstrated a weaker
confinement effect includes nanopore systems with spatial dimensionality ranging from
1D to 3D. Hence, spatial dimensionality cannot explain the different trends observed.
Tortuosity, which is defined as “the ratio of the mean effective path length and the
shortest possible distance in the absence of obstacles”37, also cannot account for different
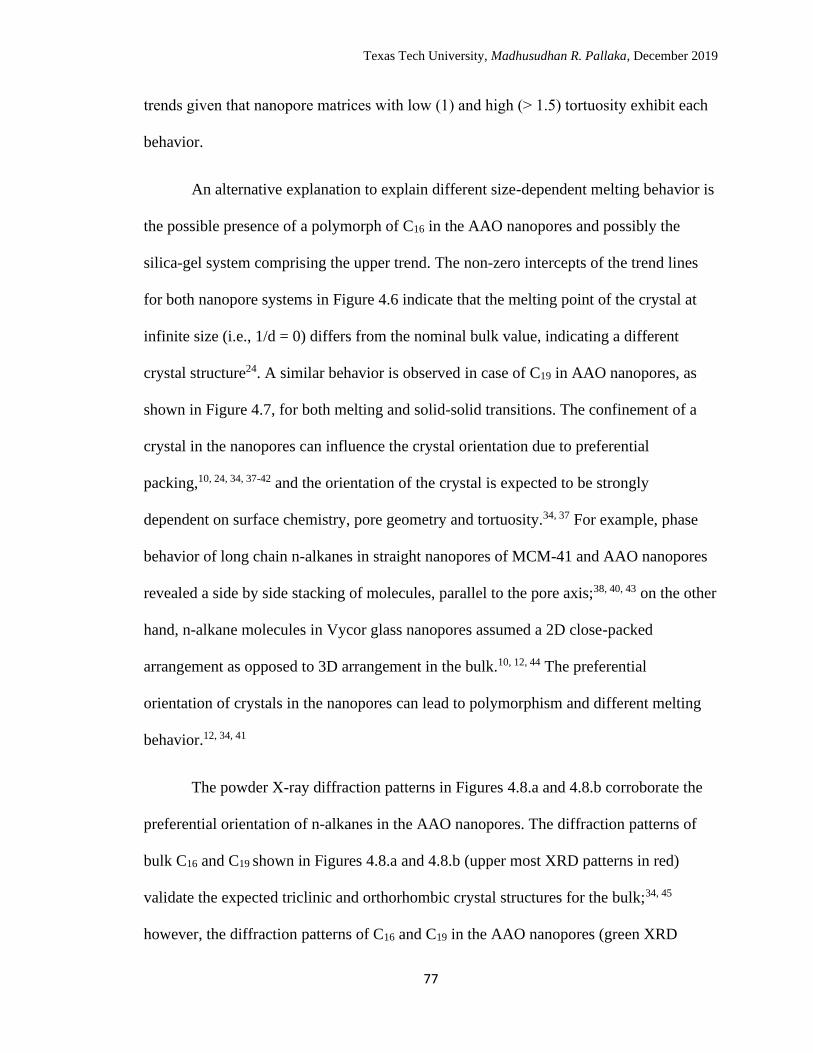
Texas Tech University, Madhusudhan R. Pallaka, December 2019
77
trends given that nanopore matrices with low (1) and high (˃ 1.5) tortuosity exhibit each
behavior.
An alternative explanation to explain different size-dependent melting behavior is
the possible presence of a polymorph of C16 in the AAO nanopores and possibly the
silica-gel system comprising the upper trend. The non-zero intercepts of the trend lines
for both nanopore systems in Figure 4.6 indicate that the melting point of the crystal at
infinite size (i.e., 1/d = 0) differs from the nominal bulk value, indicating a different
crystal structure24. A similar behavior is observed in case of C19 in AAO nanopores, as
shown in Figure 4.7, for both melting and solid-solid transitions. The confinement of a
crystal in the nanopores can influence the crystal orientation due to preferential
packing,10, 24, 34, 37-42 and the orientation of the crystal is expected to be strongly
dependent on surface chemistry, pore geometry and tortuosity.34, 37 For example, phase
behavior of long chain n-alkanes in straight nanopores of MCM-41 and AAO nanopores
revealed a side by side stacking of molecules, parallel to the pore axis;38, 40, 43 on the other
hand, n-alkane molecules in Vycor glass nanopores assumed a 2D close-packed
arrangement as opposed to 3D arrangement in the bulk.10, 12, 44 The preferential
orientation of crystals in the nanopores can lead to polymorphism and different melting
behavior.12, 34, 41
The powder X-ray diffraction patterns in Figures 4.8.a and 4.8.b corroborate the
preferential orientation of n-alkanes in the AAO nanopores. The diffraction patterns of
bulk C16 and C19 shown in Figures 4.8.a and 4.8.b (upper most XRD patterns in red)
validate the expected triclinic and orthorhombic crystal structures for the bulk;34, 45
however, the diffraction patterns of C16 and C19 in the AAO nanopores (green XRD
Texas Tech University, Madhusudhan R. Pallaka, December 2019
78
pattern (55 nm) and blue XRD pattern (18 nm)) show preferential reflections at 2θ =
21.6° and 2θ = 35.4°, with the latter only strongly observed for C16 in the 18 nm AAO
pores. In other work on C19 in Vycor glass, Huber et al. observed that the Bragg
reflections from low diffraction angles (2θ < 15) were absent for material in Vycor glass
pores, indicating that the characteristic lamellar ordering of the bulk has been sacrificed
in the nanopores12. In addition, they found peak broadening at temperatures comparable
to ours,indicating some disorder, which may arise from the tortuous nature of the Vycor
pores. Here we similarly find an absence of low angle diffraction peaks for C16 and C19 in
both 55 and 18 nm AAO pores (shown in Figures 4.8.a and 4.8.b); however, we only see
slight peak broadening, presumably due to our straight pores. The suppression of the
lamellar ordering in the nanopores transforms the ordered bulk crystal structure into a
nematocrystalline structure with chains parallel to the pore axis.12, 34 This change in
crystal structure from the bulk has an additional influence in lowering the melting point
in the nanopores along with the size-dependent melting effect.
4.6 Conclusions
Anodic aluminum oxide (AAO) templates were successfully used as
nanoconfinement matrices on the Flash DSC. The influence of nanoconfinement on the
phase transitions of n-hexadecane and n-nonadecane was studied as a function of pore
diameter and pore fullness. Melting of n-hexadecane in the AAO pores revealed a
melting point depression (ΔTm) of 4.20 ± 0.60 °C in 55 nm AAO pores and 6.01 ± 0.24
°C in 20 nm AAO pores compared to the bulk, and was found to be independent of pore
fullness. Melting of n-nonadecane in AAO pores resulted in ΔTms of 2.46 ± 0.40 °C and
of 4.2 ± 0.51 °C and solid-solid transition depressions (ΔTsss) of 1.94 ± 0.15 °C and 3.01
Texas Tech University, Madhusudhan R. Pallaka, December 2019
79
± 0.29 °C in 55 and 20 nm AAO pores, respectively; the depressions were again
independent of pore fullness. A comparison of ∆Tm vs 1/d of C16 in AAO nanopores with
various nanopore matrices studied in the literature revealed at least two distinct trends for
nanoconfined melting behavior. Possible explanations to elucidate the different melting
behaviors based on surface chemistry, pore geometry, and tortuosity were ruled out.
Rather, the presence of a nematocrystalline structure in AAO confined C16 is the
presumed origin of the observed distinct melting behavior, as corroborated by the
presence of the Bragg peaks at only 2θ = 21.6° and 2θ = 35.4° and the absence of low
angle Bragg peaks (2θ < 15) for the confined material. The ∆Tm vs 1/d behavior for
melting and solid-solid transition for C19 similarly do not extrapolate to bulk values at
infinite crystal size (1/d = 0). C19 also only shows one Bragg peak at 2θ = 21.6°: These
results indicate that a nematocrystalline structure is formed in the AAO nanopores.
Texas Tech University, Madhusudhan R. Pallaka, December 2019
80
References
1. Poel, G. V.; Istrate, D.; Magon, A.; Mathot, V., Performance and calibration of the
Flash DSC 1, a new, MEMS-based fast scanning calorimeter. J. Therm. Anal.
Calorim. 2012, 110 (3), 1533-1546.
2. Zhuravlev, E.; Schick, C., Fast scanning power compensated differential scanning
nano-calorimeter: 2. Heat capacity analysis. Thermochim. Acta 2010, 505 (1), 14-
21.
3. Zhuravlev, E.; Schick, C., Fast scanning power compensated differential scanning
nano-calorimeter: 1. The device. Thermochim. Acta 2010, 505 (1), 1-13.
4. Magoń, A.; Wurm, A.; Schick, C.; Pangloli, P.; Zivanovic, S.; Skotnicki, M.; Pyda,
M., Heat capacity and transition behavior of sucrose by standard, fast scanning and
temperature-modulated calorimetry. Thermochim. Acta 2014, 589, 183-196.
5. Cebe, P.; Hu, X.; Kaplan, D. L.; Zhuravlev, E.; Wurm, A.; Arbeiter, D.; Schick, C.,
Beating the heat-fast scanning melts silk beta sheet crystals. Scientific reports 2013,
3.
6. Shamim, N.; Koh, Y. P.; Simon, S. L.; McKenna, G. B., The glass transition of
trinitrotoluene (TNT) by flash DSC. Thermochim. Acta 2015, 620, 36-39.
7. Gao, S.; Koh, Y. P.; Simon, S. L., Calorimetric Glass Transition of Single
Polystyrene Ultrathin Films. Macromolecules 2013, 46 (2), 562-570.
8. Koh, Y. P.; Grassia, L.; Simon, S. L., Structural recovery of a single polystyrene
thin film using nanocalorimetry to extend the aging time and temperature range.
Thermochimica Acta 2015, 603, 135-141.
9. Shamim, N.; Koh, Y. P.; Simon, S. L.; McKenna, G. B., Glass transition
temperature of thin polycarbonate films measured by flash differential scanning
calorimetry. J. Polym. Sci., Part B: Polym. Phys. 2014, 52 (22), 1462-1468.
10. Wang, L. P.; Sui, J.; Zhai, M.; Tian, F.; Lan, X. Z., Physical Control of Phase
Behavior of Hexadecane in Nanopores. The Journal of Physical Chemistry C 2015,
119 (32), 18697-18706.
11. Illeková, E.; Miklošovičová, M.; Šauša, O.; Berek, D., Solidification and melting
of cetane confined in the nanopores of silica gel. J. Therm. Anal. Calorim. 2011,
108 (2), 497-503.
12. Huber, P.; Wallacher, D.; Albers, J.; Knorr, K., Quenching of lamellar ordering in
an n-alkane embedded in nanopores. EPL (Europhysics Letters) 2004, 65 (3), 351.
Texas Tech University, Madhusudhan R. Pallaka, December 2019
81
13. Qin, Q.; McKenna, G. B., Melting of solvents nanoconfined by polymers and
networks. J. Polym. Sci., Part B: Polym. Phys. 2006, 44 (24), 3475-3486.
14. Rao, Z.; Wang, S.; Peng, F., Self diffusion and heat capacity of n-alkanes based
phase change materials: A molecular dynamics study. Int. J. Heat Mass Transfer
2013, 64, 581-589.
15. Konuklu, Y.; Paksoy, H. O.; Unal, M., Nanoencapsulation of n-alkanes with poly
(styrene-co-ethylacrylate) shells for thermal energy storage. Applied Energy 2015,
150, 335-340.
16. Zhang, J.; Feng, Y.; Yuan, H.; Feng, D.; Zhang, X.; Wang, G., Thermal properties
of C 17 H 36/MCM-41 composite phase change materials. Computational
Materials Science 2015, 109, 300-307.
17. Zhang, D.; Tian, S.; Xiao, D., Experimental study on the phase change behavior of
phase change material confined in pores. Solar Energy 2007, 81 (5), 653-660.
18. Su, Y.; Liu, G.; Xie, B.; Fu, D.; Wang, D., Crystallization features of normal
alkanes in confined geometry. Acc. Chem. Res. 2013, 47 (1), 192-201.
19. Cebe, P.; Partlow, B. P.; Kaplan, D. L.; Wurm, A.; Zhuravlev, E.; Schick, C., Using
flash DSC for determining the liquid state heat capacity of silk fibroin.
Thermochim. Acta 2015, 615, 8-14.
20. Huang, D.; Simon, S. L.; McKenna, G. B., Chain length dependence of the
thermodynamic properties of linear and cyclic alkanes and polymers. The Journal
of chemical physics 2005, 122 (8), 084907.
21. Ditmars, D.; Ishihara, S.; Chang, S.; Bernstein, G.; West, E., Enthalpy and heat-
capacity standard reference material: synthetic sapphire (a-Al2O3) from 10 to 2250
K. J. Res. Natl. Bur. Stand 1982, 87 (2), 159-163.
22. Vélez, C.; Khayet, M.; de Zárate, J. O., Temperature-dependent thermal properties
of solid/liquid phase change even-numbered n-alkanes: n-Hexadecane, n-
octadecane and n-eicosane. Applied Energy 2015, 143, 383-394.
23. Burger, A.; Ramberger, R., On the polymorphism of pharmaceuticals and other
molecular crystals. I. Microchimica Acta 1979, 72 (3), 259-271.
24. Beiner, M.; Rengarajan, G.; Pankaj, S.; Enke, D.; Steinhart, M., Manipulating the
crystalline state of pharmaceuticals by nanoconfinement. Nano Lett. 2007, 7 (5),
1381-1385.
25. Wolf, E. M.; Simon, S. L.; Plazek, D. J.; Soc Plast, E., Volume and enthalpy
recovery of polystyrene. 1998; Vol. 44, p 3411-3414.
Texas Tech University, Madhusudhan R. Pallaka, December 2019
82
26. Jiang, K.; Xie, B.; Fu, D.; Luo, F.; Liu, G.; Su, Y.; Wang, D., Solid− Solid Phase
Transition of n-Alkanes in Multiple Nanoscale Confinement. The Journal of
Physical Chemistry B 2009, 114 (3), 1388-1392.
27. Maroncelli, M.; Qi, S. P.; Strauss, H. L.; Snyder, R. G., Nonplanar conformers and
the phase behavior of solid n-alkanes. J. Am. Chem. Soc. 1982, 104 (23), 6237-
6247.
28. http://webbook.nist.gov/chemistry/.
29. Buijnsters, J. G.; Zhong, R.; Tsyntsaru, N.; Celis, J.-P., Surface wettability of
macroporous anodized aluminum oxide. ACS applied materials & interfaces 2013,
5 (8), 3224-3233.
30. Jackson, C. L.; McKenna, G. B., The Melting Behavior of Organic Materials
Confined in Porous Solids. J. Chem. Phys. 1990, 93 (12), 9002-9011.
31. Takei, T.; Nakada, M.; Yoshikawa, N.; Hiroe, Y.; Yoshida, H., Effect of organic
functional groups on the phase transition of organic liquids in silica mesopores. J.
Therm. Anal. Calorim. 2016, 123 (3), 1787-1794.
32. Alba-Simionesco, C.; Coasne, B.; Dosseh, G.; Dudziak, G.; Gubbins, K.;
Radhakrishnan, R.; Sliwinska-Bartkowiak, M., Effects of confinement on freezing
and melting. J. Phys.: Condens. Matter 2006, 18 (6), R15.
33. Richert, R., Dynamics of nanoconfined supercooled liquids. Annu. Rev. Phys.
Chem. 2011, 62, 65-84.
34. Huber, P., Soft matter in hard confinement: phase transition thermodynamics,
structure, texture, diffusion and flow in nanoporous media. J. Phys.: Condens.
Matter 2015, 27 (10), 103102.
35. Sun, J.; Simon, S., The melting behavior of aluminum nanoparticles. Thermochim.
Acta 2007, 463 (1), 32-40.
36. Defay, R.; Prigogine, I.; Bellemans, A.; Everett, D., Surface tension and adsorption.
1966. Longmans, London.
37. Graubner, G.; Rengarajan, G. T.; Anders, N.; Sonnenberger, N.; Enke, D.; Beiner,
M.; Steinhart, M., Morphology of porous hosts directs preferred polymorph
formation and influences kinetics of solid/solid transitions of confined
pharmaceuticals. Crystal Growth & Design 2013, 14 (1), 78-86.
38. Okazaki, M.; Toriyama, K.; Anandan, S., Dynamics and packing mode of long-
chained n-alkane molecules in the nano-channel of MCM-41. Chem. Phys. Lett.
2005, 401 (4), 363-367.
Texas Tech University, Madhusudhan R. Pallaka, December 2019
83
39. Kumar, M. V.; Prasad, S. K., Influence of quenched disorder created by nanosilica
network on phase transitions in tetracosane. RSC Advances 2012, 2 (22), 8531-
8538.
40. Toriyama, K.; Okazaki, M., Molecular packing of long-chain n-alkanes in the
MCM-41 nanochannel as probed by the free radicals produced by γ-irradiation. The
Journal of Physical Chemistry B 2004, 108 (34), 12917-12920.
41. Henschel, A.; Hofmann, T.; Huber, P.; Knorr, K., Preferred orientations and
stability of medium length n-alkanes solidified in mesoporous silicon. Physical
Review E 2007, 75 (2), 021607.
42. Wang, L. P.; Li, Q. F.; Wang, C.; Lan, X. Z., Size-Dependent Phase Behavior of
the Hexadecane–Octadecane System Confined in Nanoporous Glass. The Journal
of Physical Chemistry C 2014, 118 (31), 18177-18186.
43. Kim, B. S.; Jeong, Y. G.; Shin, K., Influence of surface property on the
crystallization of hentetracontane under nanoscopic cylindrical confinement. The
Journal of Physical Chemistry B 2013, 117 (19), 5978-5988.
44. Huber, P.; Soprunyuk, V. P.; Knorr, K., Structural transformations of even-
numbered n-alkanes confined in mesopores. Physical Review E 2006, 74 (3),
031610.
45. Craig, S. R.; Hastie, G. P.; Roberts, K. J.; Sherwood, J. N., Investigation into the
structures of some normal alkanes within the homologous series C13H28 to
C60H122 using high-resolution synchrotron X-ray powder diffraction. J. Mater.
Chem. 1994, 4 (6), 977-981.
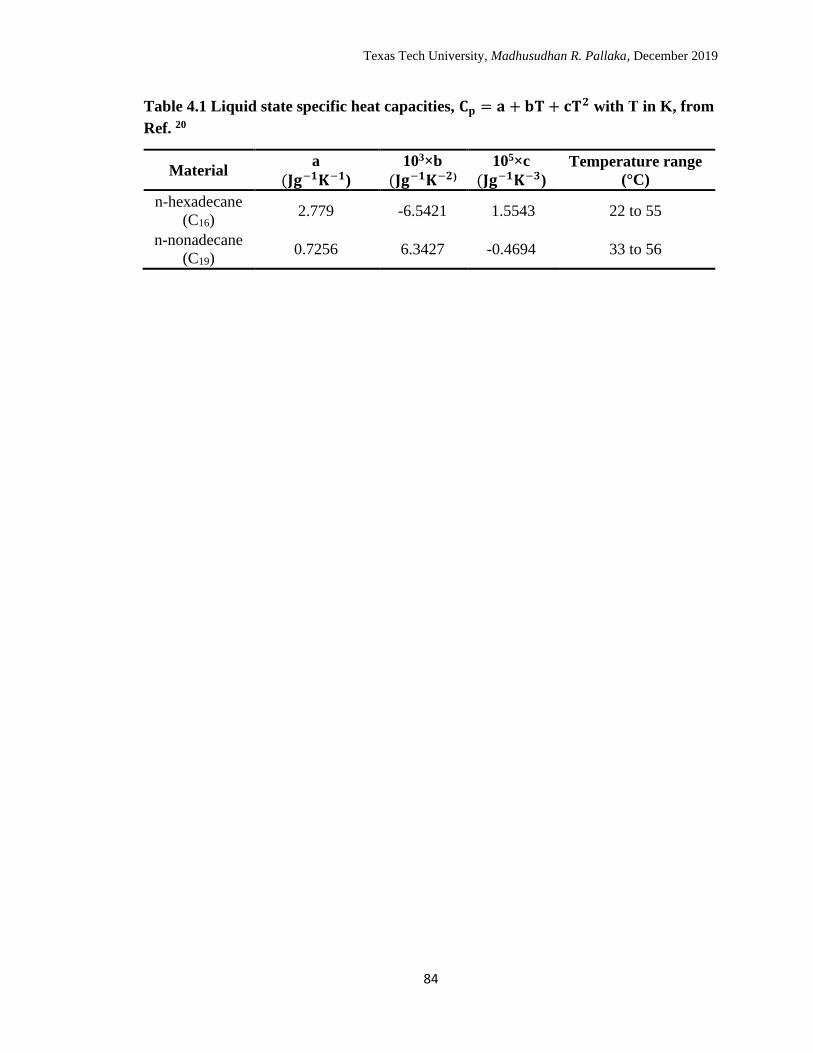
Texas Tech University, Madhusudhan R. Pallaka, December 2019
84
Table 4.1 Liquid state specific heat capacities, 𝐂𝐩 = 𝐚 + 𝐛𝐓 + 𝐜𝐓𝟐 with T in K, from
Ref. 20
Material a
(𝐉𝐠−𝟏𝐊−𝟏)
103×b
(𝐉𝐠−𝟏𝐊−𝟐)
105×c
(𝐉𝐠−𝟏𝐊−𝟑)
Temperature range
(°C)
n-hexadecane
(C16) 2.779 -6.5421 1.5543 22 to 55
n-nonadecane
(C19) 0.7256 6.3427 -0.4694 33 to 56
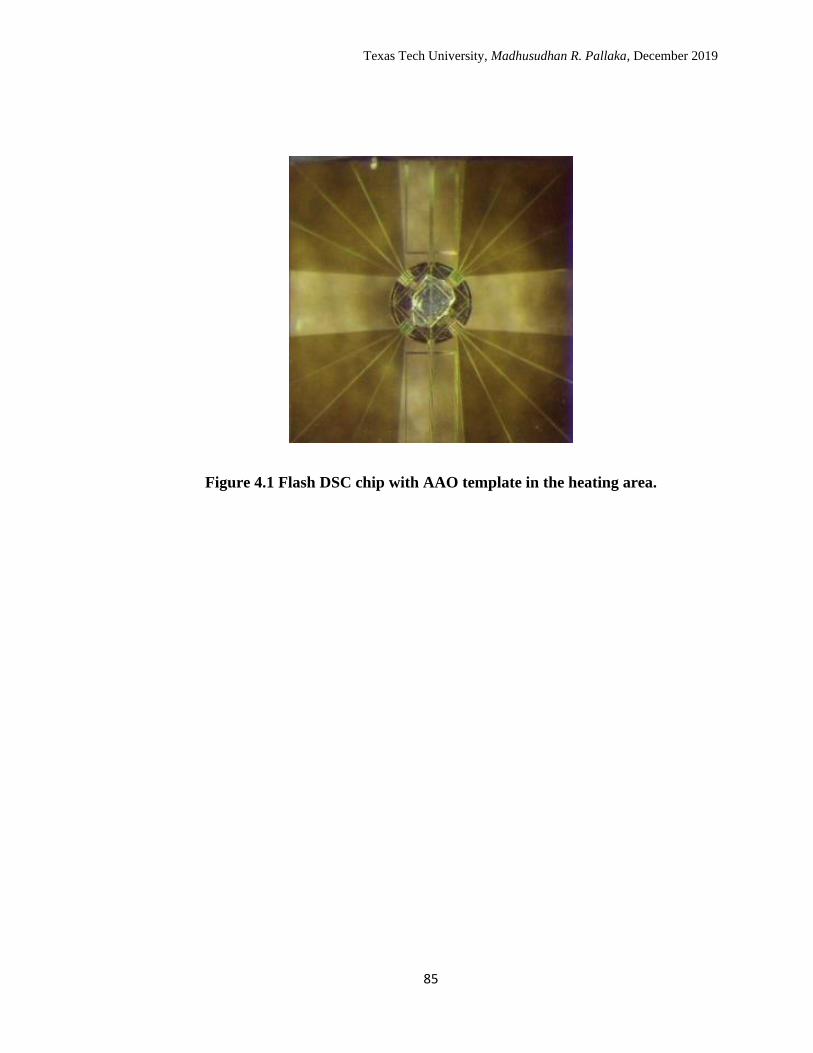
Texas Tech University, Madhusudhan R. Pallaka, December 2019
85
Figure 4.1 Flash DSC chip with AAO template in the heating area.
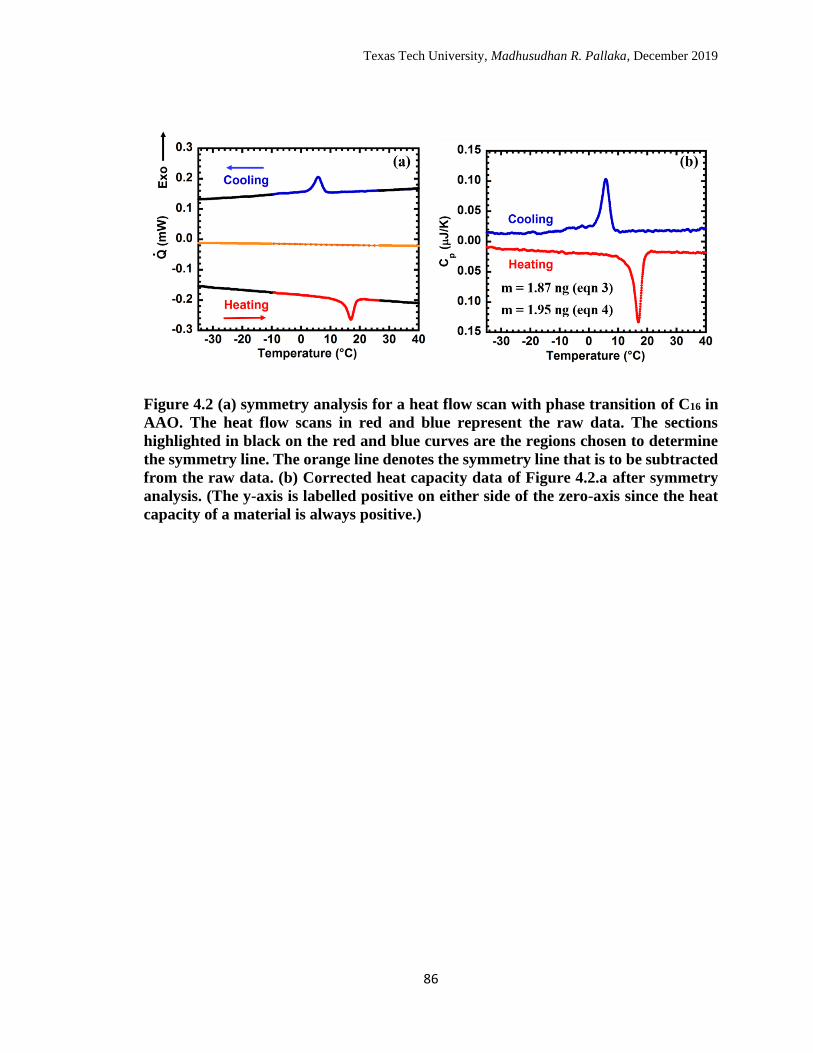
Texas Tech University, Madhusudhan R. Pallaka, December 2019
86
Figure 4.2 (a) symmetry analysis for a heat flow scan with phase transition of C16 in
AAO. The heat flow scans in red and blue represent the raw data. The sections
highlighted in black on the red and blue curves are the regions chosen to determine
the symmetry line. The orange line denotes the symmetry line that is to be subtracted
from the raw data. (b) Corrected heat capacity data of Figure 4.2.a after symmetry
analysis. (The y-axis is labelled positive on either side of the zero-axis since the heat
capacity of a material is always positive.)
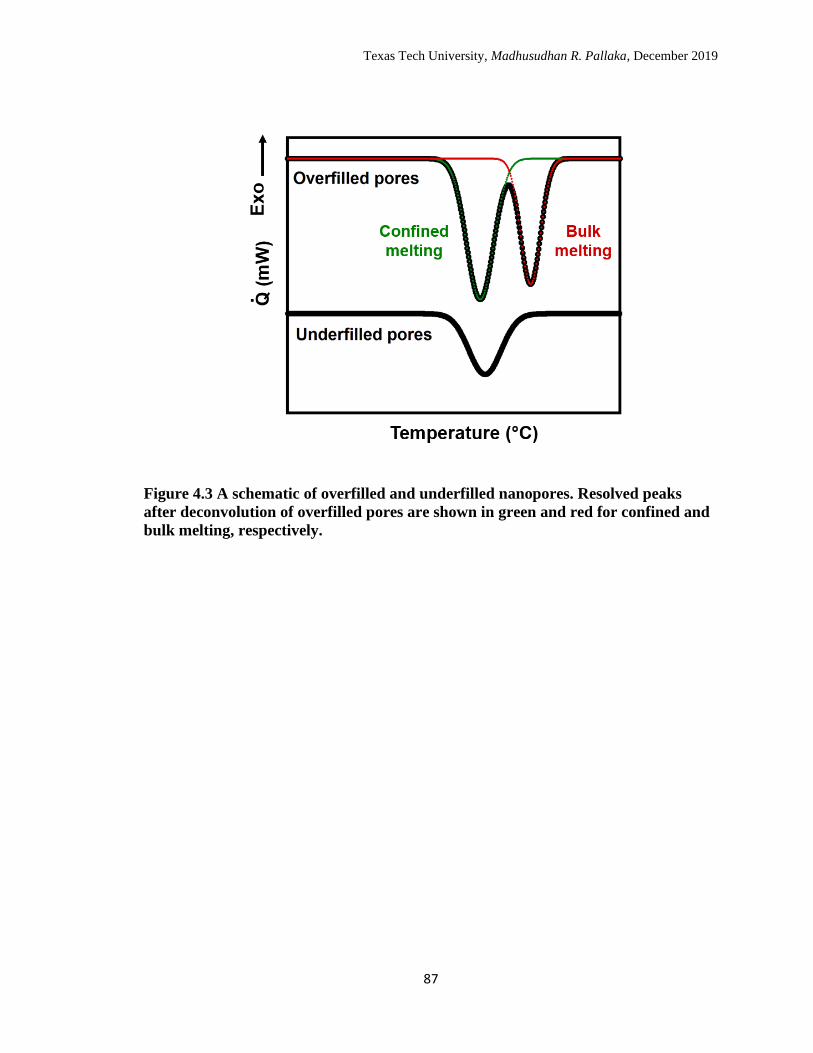
Texas Tech University, Madhusudhan R. Pallaka, December 2019
87
Figure 4.3 A schematic of overfilled and underfilled nanopores. Resolved peaks
after deconvolution of overfilled pores are shown in green and red for confined and
bulk melting, respectively.
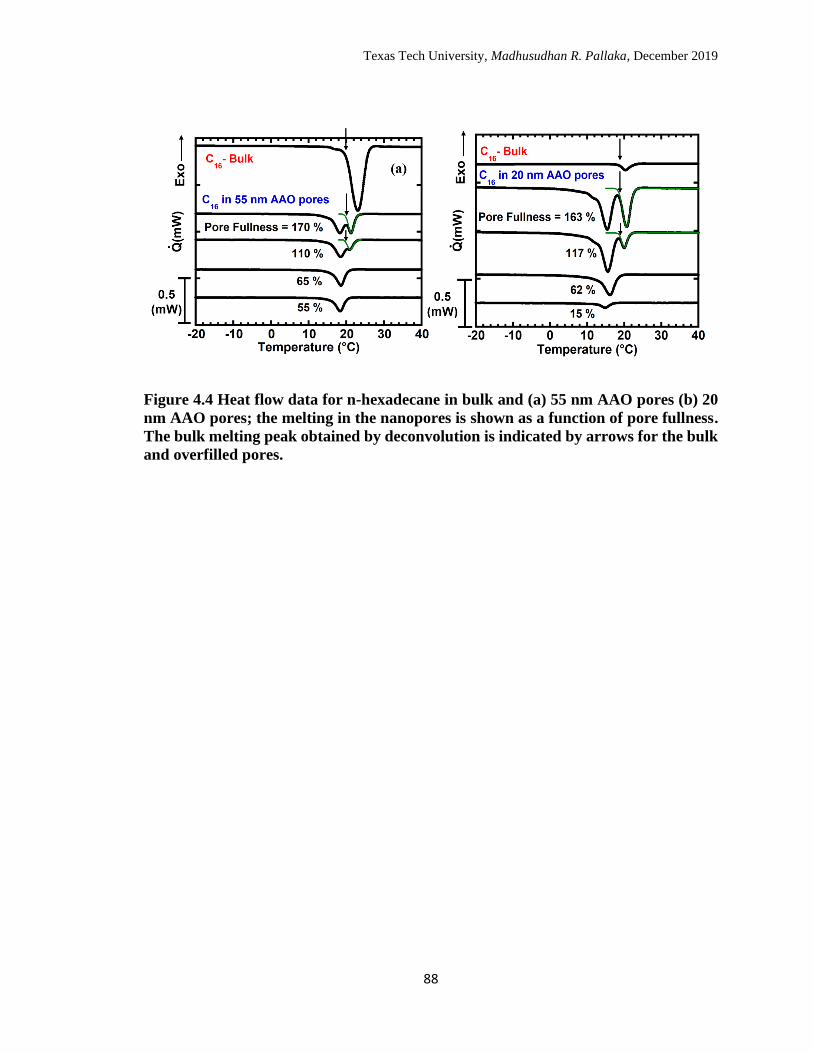
Texas Tech University, Madhusudhan R. Pallaka, December 2019
88
Figure 4.4 Heat flow data for n-hexadecane in bulk and (a) 55 nm AAO pores (b) 20
nm AAO pores; the melting in the nanopores is shown as a function of pore fullness.
The bulk melting peak obtained by deconvolution is indicated by arrows for the bulk
and overfilled pores.
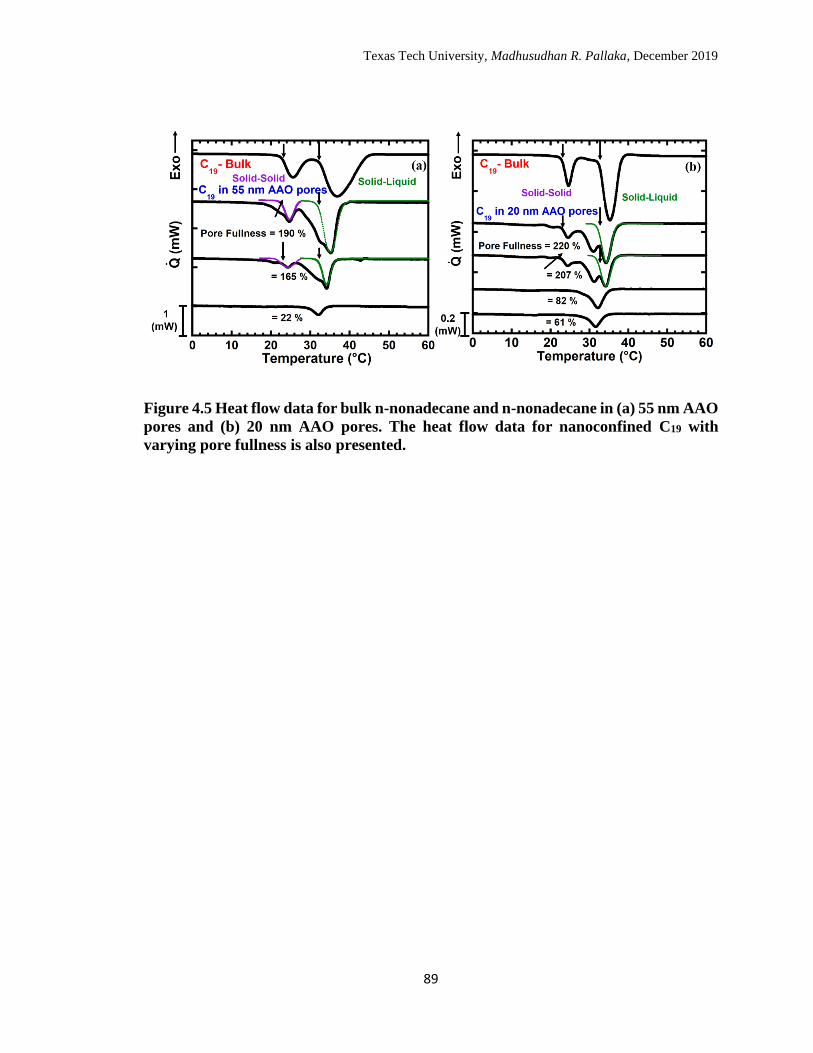
Texas Tech University, Madhusudhan R. Pallaka, December 2019
89
Figure 4.5 Heat flow data for bulk n-nonadecane and n-nonadecane in (a) 55 nm AAO
pores and (b) 20 nm AAO pores. The heat flow data for nanoconfined C19 with
varying pore fullness is also presented.
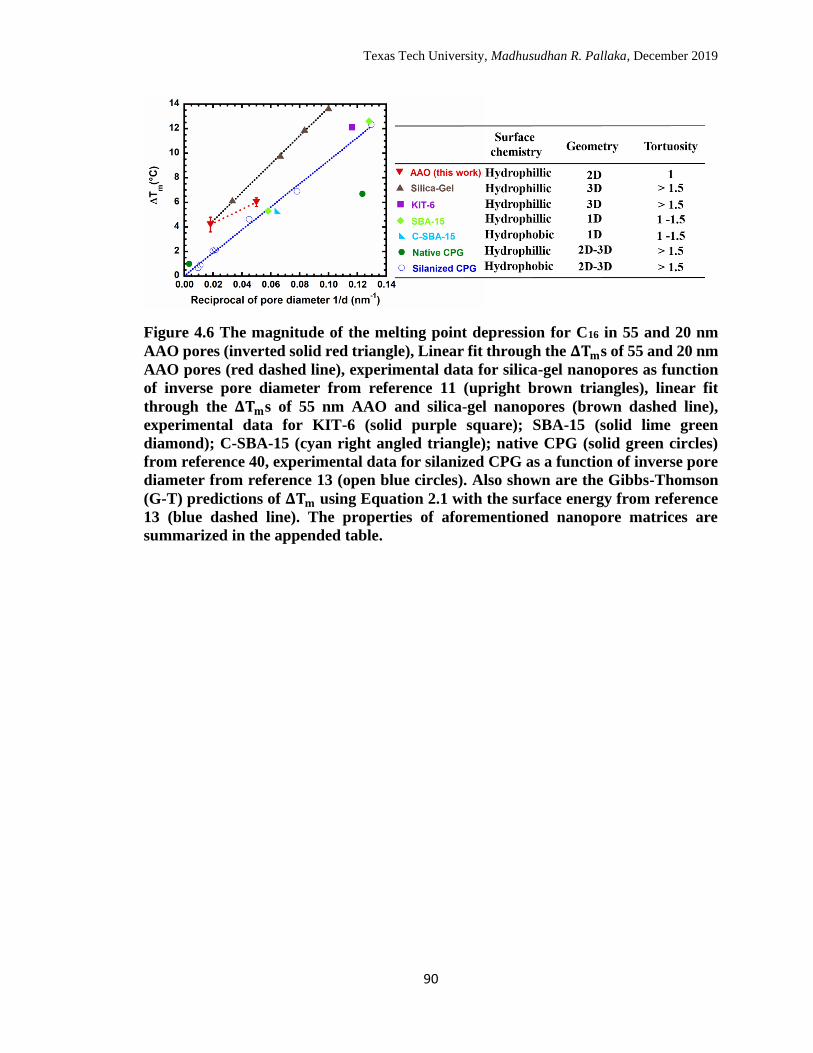
Texas Tech University, Madhusudhan R. Pallaka, December 2019
90
Figure 4.6 The magnitude of the melting point depression for C16 in 55 and 20 nm
AAO pores (inverted solid red triangle), Linear fit through the 𝚫𝐓𝐦s of 55 and 20 nm
AAO pores (red dashed line), experimental data for silica-gel nanopores as function
of inverse pore diameter from reference 11 (upright brown triangles), linear fit
through the 𝚫𝐓𝐦s of 55 nm AAO and silica-gel nanopores (brown dashed line),
experimental data for KIT-6 (solid purple square); SBA-15 (solid lime green
diamond); C-SBA-15 (cyan right angled triangle); native CPG (solid green circles)
from reference 40, experimental data for silanized CPG as a function of inverse pore
diameter from reference 13 (open blue circles). Also shown are the Gibbs-Thomson
(G-T) predictions of 𝚫𝐓𝐦 using Equation 2.1 with the surface energy from reference
13 (blue dashed line). The properties of aforementioned nanopore matrices are
summarized in the appended table.
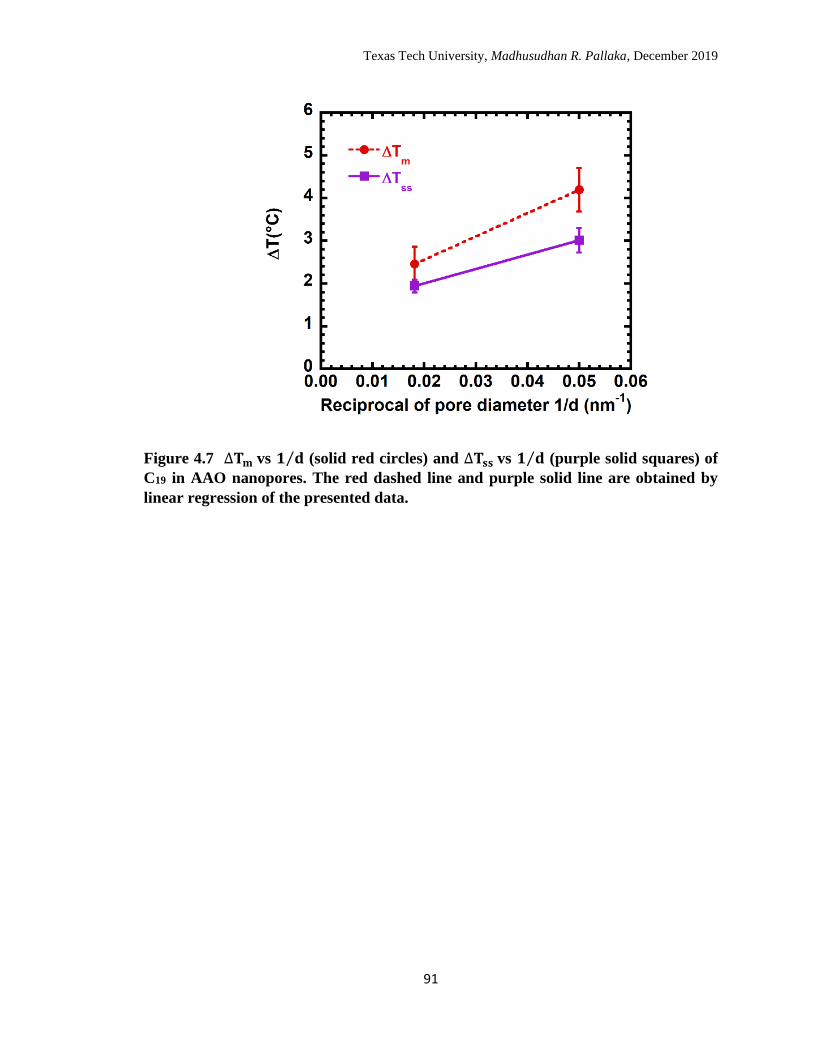
Texas Tech University, Madhusudhan R. Pallaka, December 2019
91
Figure 4.7 ∆𝐓𝐦 vs 𝟏 𝐝⁄ (solid red circles) and ∆𝐓𝐬𝐬 vs 𝟏 𝐝⁄ (purple solid squares) of
C19 in AAO nanopores. The red dashed line and purple solid line are obtained by
linear regression of the presented data.
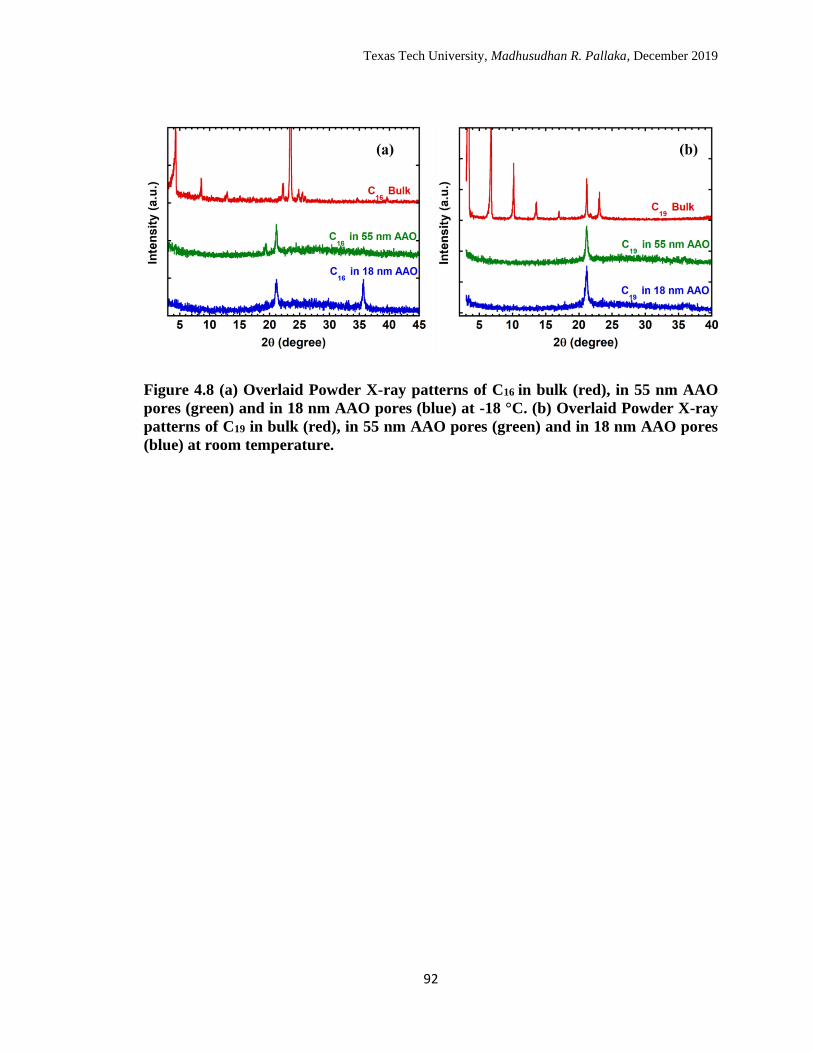
Texas Tech University, Madhusudhan R. Pallaka, December 2019
92
Figure 4.8 (a) Overlaid Powder X-ray patterns of C16 in bulk (red), in 55 nm AAO
pores (green) and in 18 nm AAO pores (blue) at -18 °C. (b) Overlaid Powder X-ray
patterns of C19 in bulk (red), in 55 nm AAO pores (green) and in 18 nm AAO pores
(blue) at room temperature.
Texas Tech University, Madhusudhan R. Pallaka, December 2019
93
CHAPTER 5
ORIGIN OF THE BROAD ENDOTHERMIC PEAK OBSERVED AT
LOW TEMPERATURES FOR POLYSTYRENE AND METALS IN
FLASH DIFFERENTIAL SCANNING CALORIMETRY
5.1 Introduction
Broad low-temperature endothermic overshoots have been observed for polymers
in the glassy state (T<<Tg), both nano and micron scale alike, when studied using Flash
differential scanning calorimetry.1-3 The low temperature endotherms of micrometer thick
poly(4-tert butylstyrene) films demonstrated a cooling rate dependence, where the area of
the endotherm increased with decrease in cooling rate1-2. In addition, broad low-
temperature endotherms were also observed for polystyrene nanospheres3 whilst
performing structural recovery studies, where the low temperature endotherms increased
with increase in aging time and decrease in aging temperature; intermediate plateaus were
also observed during the relaxation process at as small as 100 s for 230 nm polystyrene
nanospheres.3 The presence of low temperature endotherm has been interpreted by
Cangialosi and co-workers1, 3-6 to mean that the glassy dynamics is faster at temperatures
T<<Tg where the glassy material exhibits highly viscous conditions, and slower dynamics
at vicinity of the Tg where a glassy material exhibit low viscosity, which is in contrast
with the fact that glassy dynamics slow down with increase in viscosity. In addition to the
studies using Flash differential scanning calorimetry, low temperature structural recovery
studies (Ta<<Tg) of various glassy polymers on conventional DSC also exhibited low
temperature broad endothermic peaks. Room temperature aging of three polymers,
poly(acrylate), poly(bisphenol-A-carbonate), and polysulfone showed aging plateau
Texas Tech University, Madhusudhan R. Pallaka, December 2019
94
between aging times of 60 days to 30 years due to the presence of a low temperature
endotherm.5 1D Stacked polystyrene thin films with thicknesses in the range of 30 nm
and 95 nm also exhibited broad low temperature endotherms contributing to the two-step
structural recovery process.4, 6 The existence of an endotherm at low temperature for
glassy polymers is certainly controversial due to the lack of systematic and scientific
studies. We hypothesize that the residual stresses have contributed to the low temperature
endotherm.
In this study, we investigate the existence and consistency of the low temperature
endothermic overshoots by performing cooling rate dependent and room temperature
aging experiments using Flash differential scanning calorimetry on 1.3-micron thick
polystyrene films atop different substrates including Krytox oil, 350 nm AAO template,
55 nm AAO template, and directly on the bare chip. The different substrates allow a
systematic change of residual stress with the direct contact one being the one with the
highest stress. In addition to the studies on glassy polystyrene, we also studied the
influence of cooling rate dependence and aging on crystalline metals, indium and vapor-
deposited gold at two different substrate temperatures, to probe the possible origins of the
broad low-temperature endotherms.
5.2 Experimental
5.2.1 Methodology
Flash differential scanning calorimetry
A Mettler Toledo Flash DSC 1 with a Freon intercooler maintained at -100 °C
was used to perform measurements; a 20 ml/min nitrogen gas purge was used for inert
Texas Tech University, Madhusudhan R. Pallaka, December 2019
95
atmosphere. The chip sensors were conditioned and corrected according to the
manufacturer’s recommendation. To explore the low temperature endothermic peak two
different measurements were performed: 1) cooling rate dependent measurements, and 2)
aging or structural recovery measurements. In cooling rate dependent measurements a
heating scan was obtained at 1000 K/s after cooling at various rates in the range of 0.1 to
1000 K/s for two different scanning ranges, -80 to 190 °C and 30 to 190 °C, for
polystyrene samples on four different substrates and 1 µm thick indium sample (Tm =
156.9 °C); in case of 50 nm vapor deposited gold samples, the high end temperature was
380 °C instead of 190 °C. Structural recovery or aging experiments involved obtaining
the aged scan at a heating rate of 1000 K/s from -80 °C after isothermally aging at 20 °C
for a prespecified time ranging from 0.01s to 8 hours; all the aged scans were followed by
unaged scans and the high end temperatures are similar to the cooling rate dependent
measurements.
The sample masses for polystyrene films on the bare chip and Krytox oil, and 50
nm vapor deposited gold samples were obtained by dividing the symmetry corrected heat
flow 7-8 with the absolute heat capacity of polystyrene9 or gold10 at a defined temperature.
The sample masses of polystyrene films on 55 nm and 350 nm AAO could not obtained
using symmetry analysis because the heat flow of empty AAO templates could not be
measured separately; hence, the sample masses were obtained from the step change in
heat flow measured at Tg and the change in heat capacity (∆𝐶𝑝) for a bulk polystyrene
film defined in equation 5.1:11-13
Texas Tech University, Madhusudhan R. Pallaka, December 2019
96
∆𝐶𝑝 = 0.433 − 0.00148𝑇𝑓 ˈ (℃)
(5.1)
where 𝑇𝑓 ˈ is the limiting fictive temperature of a polystyrene sample for a cooling rate of
1000 K/s. The sample mass of indium was obtained by dividing the measured heat flow
of melting with the enthalpy of melting14 (28.41 J/g). The sample masses of all the
samples are listed in Table 5.1.
Calculation of Enthalpy difference and Fictive Temperature
The enthalpy difference as a function of aging time (ta) and different cooling rates
(q) relative to a reference state is obtained from Equation 5.2:
𝛥𝐻 =1
𝑚𝛽∫ (𝛥��)𝑑𝑇
𝑇ℎ𝑖𝑔ℎ
𝑇𝑙𝑜𝑤
(5.2)
where 𝛥�� is difference in heat flows of an aged scan at a given ta and an unaged scan
(��𝐴𝑔𝑒𝑑(𝑡𝑎) − ��𝑈𝑛𝑎𝑔𝑒𝑑) for aging experiments, and difference in heat flows of heating
scans after cooling at a rate q and 1000 K/s (��𝑞 − ��1000) for cooling rate dependent
experiments, 𝑚 is the sample mass, and 𝛽 is the heating rate of 1000 K/s. The integration
limits, 𝑇ℎ𝑖𝑔ℎ and 𝑇𝑙𝑜𝑤, for all polystyrene measurements was varied to obtain the high
temperature area (related to the glass transition), and the total area (high temperature area
+ low temperature area) to study the evolution of the low temperature endothermic peak.
In case of gold and indium, integration limits spanned the entire breadth of their
respective measurements.
Texas Tech University, Madhusudhan R. Pallaka, December 2019
97
The limiting fictive temperature (Tfˈ) was determined from the superposed Flash
DSC heating scans after cooling at various rates between 0.1 to 1000 K/s by Moynihan’s
method15 for cooling rates > 10 K/s and by a simplified form, Richardson’s method16, for
cooling rates < 10 K/s where Tfˈ is lower than the onset of devitrification. The
Moynihan’s method and Richardson’s method are defined here in terms of heat flow:
∫ (��𝑙 − ��𝑔)𝑇≫𝑇𝑔
𝑇𝑓
𝑑𝑇 = ∫ (�� − ��𝑔)𝑇≫𝑇𝑔
𝑇≪𝑇𝑔
𝑑𝑇 (5.3)
∫ (��𝑙 − ��)𝑇≫𝑇𝑔
𝑇𝑓
𝑑𝑇 = 0 (5.4)
where ��, ��𝑙, and ��𝑔 are the sample heat flow, liquid heat flow, and glass heat flow,
respectively. The fictive temperature, Tf, is related to the enthalpy difference obtained in
Equation 5.2 by:
𝛥𝐻 = − ∫ ∆𝐶𝑝
𝑇𝑓
𝑇𝑓0
𝑑𝑇 (5.5)
where Tf0 is the initial fictive temperature or the fictive temperature of the unaged glass
in case aging experiments and the limiting fictive temperature, Tfˈ, for a cooling rate of
1000 K/s in case of cooling rate dependent experiments, and ∆𝐶𝑝 is the temperature
dependent step change in heat capacity from Equation 5.1.
The cooling rate dependence on fictive temperature Tfˈ can be described by the
Williams-Landel-Ferry (WLF)17 equation:
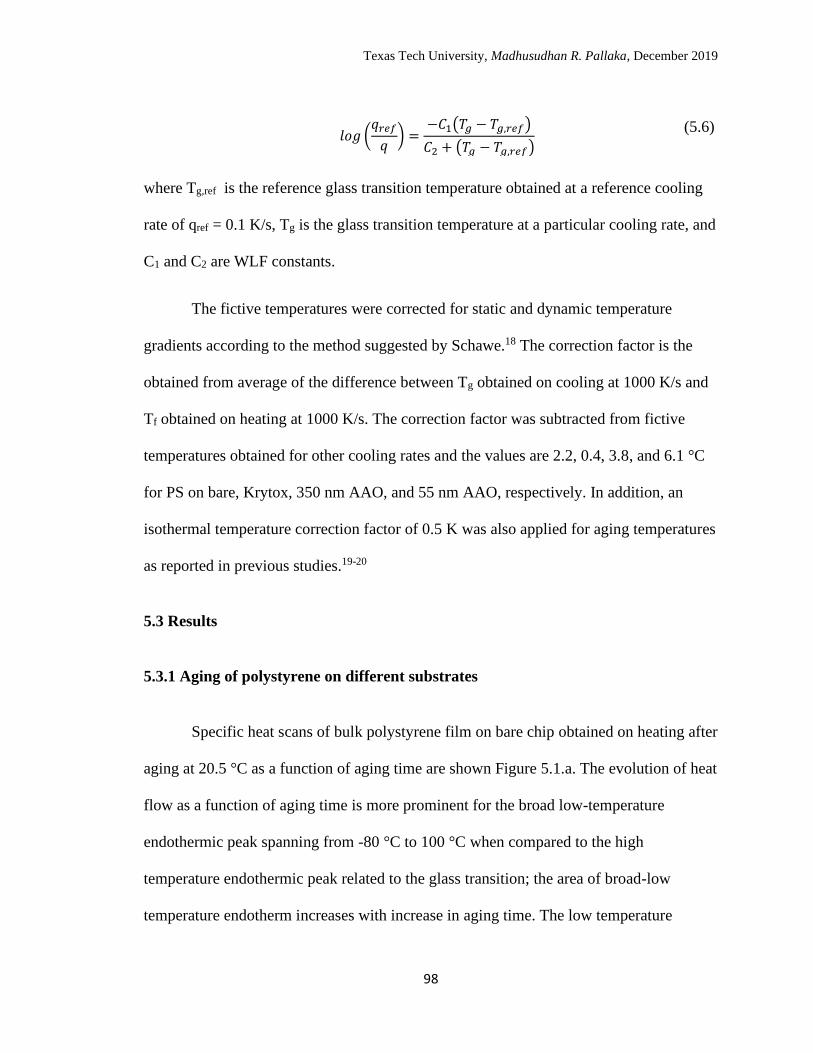
Texas Tech University, Madhusudhan R. Pallaka, December 2019
98
𝑙𝑜𝑔 (𝑞𝑟𝑒𝑓
𝑞) =
−𝐶1(𝑇𝑔 − 𝑇𝑔,𝑟𝑒𝑓)
𝐶2 + (𝑇𝑔 − 𝑇𝑔,𝑟𝑒𝑓)
(5.6)
where Tg,ref is the reference glass transition temperature obtained at a reference cooling
rate of qref = 0.1 K/s, Tg is the glass transition temperature at a particular cooling rate, and
C1 and C2 are WLF constants.
The fictive temperatures were corrected for static and dynamic temperature
gradients according to the method suggested by Schawe.18 The correction factor is the
obtained from average of the difference between Tg obtained on cooling at 1000 K/s and
Tf obtained on heating at 1000 K/s. The correction factor was subtracted from fictive
temperatures obtained for other cooling rates and the values are 2.2, 0.4, 3.8, and 6.1 °C
for PS on bare, Krytox, 350 nm AAO, and 55 nm AAO, respectively. In addition, an
isothermal temperature correction factor of 0.5 K was also applied for aging temperatures
as reported in previous studies.19-20
5.3 Results
5.3.1 Aging of polystyrene on different substrates
Specific heat scans of bulk polystyrene film on bare chip obtained on heating after
aging at 20.5 °C as a function of aging time are shown Figure 5.1.a. The evolution of heat
flow as a function of aging time is more prominent for the broad low-temperature
endothermic peak spanning from -80 °C to 100 °C when compared to the high
temperature endothermic peak related to the glass transition; the area of broad-low
temperature endotherm increases with increase in aging time. The low temperature
Texas Tech University, Madhusudhan R. Pallaka, December 2019
99
endotherm was also followed for polystyrene films on different substrates including
Krytox oil, 350 nm AAO and 55 nm AAO. The excess specific heat scans with respect to
the unaged specific heat scans of polystyrene films on different substrates after aging for
8 hours at 20.5 °C are shown in Figure 5.1.b. Upon qualitative comparison, the high
temperature endothermic peaks for all the samples have similar devitrification
temperatures and peak areas irrespective of the substrate, but the low temperature
endotherms have peak areas dependent on the substrate with the polystyrene film on the
bare chip having the largest area. The enthalpies of aging, which were obtained using
Equation 5.3 for the deconvoluted high temperature (open symbols) and low temperature
(solid symbols) peaks, are shown for all aging times in Figure 5.2.a; the corresponding
change in fictive temperatures, estimated from Equation 5.5, are shown in Figure 5.2.b.
The enthalpies of aging of the high temperature peaks (ΔHa,Hi = 1.9 ± 0.1 J/g) are
reproducible for different substrates at a given aging time; and also, the corresponding
average change in fictive temperature for a 1.3 µm thick polystyrene that has been aged
for 8 hours at 20.5 °C on different substrates is ΔTf,Hi = 7.1 ± 0.3 °C, which is somewhat
similar to that observed in a recent study21, but the ΔHa,, Hi+Lo is 22.5 J/g and the
corresponding ΔTf,, Hi+Lo is approximately ~ 90 °C for polystyrene film on bare chip
which is quite close to being Tf = Ta. In addition, the variation in ΔTf,,Hi+Los across
substrates is significant; ΔTf,, Hi+Lo of polystyrene film on bare chip is 300 % larger than
the ΔTf,, Hi+Lo for polystyrene film on 55 nm AAO.
Texas Tech University, Madhusudhan R. Pallaka, December 2019
100
5.3.2 Cooling rate dependence of polystyrene on different substrates
Specific heat scans on heating for bulk polystyrene film on the bare chip as a
function of different cooling rates from 0.1 to 1000 K/s are shown in Figure 5.3, with the
left panel (Figure 5.3.a) showing the results when scanned to 30 °C and the right panel
(Figure 5.3.b) showing the results when scanned to -80 °C. In both the cases, the enthalpy
overshoots shift to higher temperatures and larger areas as cooling rate decreases. The
experimental data obtained for the two cases have similar devitrification points with well
superposed liquid lines, whereas glass lines are well superposed only in the case of
cooling to 30 °C. The glass lines when scanned to -80 °C are not well superposed and an
evolution of a broad low-temperature endothermic overshoot similar to what was
observed in case of aforementioned aging experiments is observed with decreasing
cooling rates.
Tfˈs as a function of cooling rates for different substrates and scanning to different
temperatures is shown in Figure 5.4; Tfˈs are estimated using Moynihan’s or
Richardson’s method for only high temperature endothermic peaks. The resulting Tfˈs for
scans performed to 30 (open symbols) and -80 °C (solid symbols) on different substrates
are comparable within the error as shown in Figure 5.4. The Tfˈs as a function of cooling
rates are well described by the WLF equation and are plotted as solid lines, and the
parameters are C1 = 18.9, C2 = 55.3, and Tg,ref = 374.7 K (at a reference cooling rates of
0.1 K/s) which are comparable to the values reported by Simon and co-workers.9, 13, 19-20,
22-23 The Tfˈs from this work are also compared with those obtained using conventional
DSC and Flash DSC from previous studies,11-13, 20 and they show good agreement.
Texas Tech University, Madhusudhan R. Pallaka, December 2019
101
The contribution of the low temperature endotherm to change in fictive
temperature cannot be quantified using Moynihan’s or Richardson’s method; hence, they
are estimated using the same method that was used in case of aging experiments. The
excess specific heat data for 0.1 K/s with respect to 1000 K/s for polystyrene on top of
four different substrates are shown in Figure 5.5.a, where the largest low temperature
endotherm is observed in the case of polystyrene film on bare chip for scans performed to
-80 °C which is in agreement with the aging behavior observed for the same sample aged
at 20.5 °C for 8 hours. The enthalpy values which are obtained from Equation 5.3 using
the excess heat flow scans are shown in Figure 5.5.b as a function of cooling rate for all
four substrates. Similar enthalpy values are observed for H- H1000, Hi (near Tg) plotted as
open symbol, and at 0.1 K/s; the average value for all four samples is 3.4 ± 0.2 J/g.
However, H- H1000, Hi+lo, (plotted as solid symbol) values are irreproducible when the low
temperature endotherm is included. Polystyrene on the bare chip has the highest enthalpy
(H- H1000, Hi+lo), presumably due to residual stress developed between the Flash DSC
sensor and the polystyrene film on cooling to -80 °C. The enthalpy values for different
cooling rates are further used to obtain the change in fictive temperatures by using ∆Cp
from Equation 5.1. The change in fictive temperatures, ∆Tf, Hi+Lo and ∆Tf,Hi, are shown in
Figure 5.5.c as a function of cooling rate, as solid and open symbols, respectively. The
average ∆Tf,Hi is 13.1 ± 0.8 °C for 0.1 K/s cooling rate.
The H- H1000, Hi+lo = 14.8 ± 0.7 J/g for polystyrene film on bare chip (∆Tf, Hi+Lo
=56.9 ± 2.8 °C) bare chip is approximately five times higher when compared to the value
obtained including the high temperature overshoot near Tg. In addition, the inconsistent
cooling rate dependent ∆Tf, Hi+Los which decrease in the order of bare chip > Krytox oil >
Texas Tech University, Madhusudhan R. Pallaka, December 2019
102
350 nm AAO > 55 nm AAO, indicate a strong substrate effect. Also, the WLF fit to the
∆Tf, His shown in Figure 5.5.c is well described by the same WLF parameters that used to
fit the data in Figure 5.4.
The fit of the WLF equation for ∆Tf, Hi+Lo are also plotted (except the data for PS
film on 55 nm AAO) using the parameters reported in Table 5.2, and the values of C1 and
C2 are not comparable to the universal values17, C1 = 17.44 and C2 = 51.6, or the values
reported by Koh et al.20. The ∆Tf, Hi+Lo data for PS film on 55 nm AAO could not be fitted
with a WLF equation as the endotherm at low temperature did not follow any trend as a
function of different cooling rates.
5.3.3 Cooling rate dependence and aging of indium and vapor-deposited gold
In the previous sections, we have seen that the low temperature endotherm of
micronscale PS films is inconsistent across substrates, which suggests that the low
temperature endotherm is possibly an artifact and not a signature of secondary relaxation.
To further eliminate the idea of attributing the low temperature endotherm to a secondary
relaxation, similar aging and cooling rate dependent experiments are performed on
crystalline metals, indium and vapor-deposited gold, which are in solid state equilibrium
with no known relaxations in the temperature range of interest (-80 to 110 °C).
Melting scans of 1 µm thick indium at a heating rate of 1000 K/s from -80 °C
after cooling at various rates in the range of 0.1 to 1000 K/s are shown in Figure 5.6.a,
and after aging at 20.5 °C for various times in the range of 0.01 s to 8 hours are shown in
Figure 5.6.b. In both the figures melting transitions of indium are observed, and the
onsets and enthalpies of melting are found to be independent of cooling rates and aging
Texas Tech University, Madhusudhan R. Pallaka, December 2019
103
times. In additon to the melting transition, broad low-temperature endotherms,
reminiscent to those observed in case of PS films are observed.
The broad low temperature endotherms also exhibit cooling rate dependent
behavior where the low temperature endotherm area increases with decreasing cooling
rate as shown in Figure 5.6.a; the low temperature exotherms also evolve with increasing
aging time as shown in Figure 5.6.b. The evolution of the low temperature endotherms as
a function cooling rates and aging times are better captured in the excess specific heat
scans shown in Figures 5.6.c and 5.6.d, respectively. On the other hand, the low
temperature endotherms are not observed when indium is cooled to 30 °C instead of -80
°C, as shown in Figure 5.7.
Cooling rate and aging time dependent excess specific heats of 50 nm vapor-
deposited gold are shown in Figures 5.8.a and 5.8.b; the main figures show the excess
specific heats at a substrate temperature of 23 °C, while the insets show the data at a
substrate temperature of 125 °C. The excess specific heats exhibit similar broad
endotherms as seen in polystyrene films and indium. The endotherms commenced at low
temperatures and ended at ~ 300 °C for all the excess specific heat scans irrespective of the
type of experiment (cooling rate dependent and aging) and substrate temperatures. In case
of polystyrene films and indium the low temperature endotherms ended before the onset of
their respective transitions, but in case of gold the melting temperature is distant from the
ending temperature of low temperature endotherm.
The enthalpies of the low temperature endotherms from cooling rate dependent and
aging time dependent excess specific heats of indium and 50 nm vapor-deposited gold are
shown in Figures 5.9.a and 5.9.b. As mentioned before the enthalpies increase with
Texas Tech University, Madhusudhan R. Pallaka, December 2019
104
decreasing cooling rate and increase with increaing aging time for all gold and indium
samples. The enthalpies are found to be slightly higher in case of 50 nm vapor deposited
gold at Ts = 125 °C for cooling rate dependent and aging experiments, respectively. In
cases of the slowest cooling rate (0.1 K/s) and highest aging time (8 hours), the enthalpies
are in the range of 40-45 J/g for both gold samples and 6-10 J/g for indium. The enthalpies
when quantified to the change in fictive temperatures (∆Tfs) using the ΔCp of polystyrene,
the ∆Tfs are about ~ 130-150 °C for vapor deposited gold samples and ~ 20-30 °C for
indium at the slowest cooling rate (0.1 K/s) and highest aging time (8 hours).
5.4 Discussion
The effect of different cooling rates on limiting fictive temperature for PS bulk film
was reported previously by Simon and co-workers where PS was scanned to 30 °C.12-13, 22,
24 Here, we studied and compared the heat flow curves and resulting Tfˈs by scanning to
two different end temperatures, -80 and 30 °C, for micronscale PS films on four different
substrates. The Tfˈs obtained by Moynihan’s or Richardson’s method for two different end
temperatures gave comparable results for polystyrene samples on top of four different
substrates and are in agreement with our previous work as shown in Figure 5.4.11-13, 20
Similarly, enthalpy values obtained by integrating the high temperature area (glass
transition region) from 110 to 160 °C for polystyrene on top of four different substrates are
also comparable with an average value of 3.44 ± 0.18 J/g at a cooling rate of 0.1 K/s, which
is slightly lower than the average value (4.18 ± 0.43 J/g) from previous studies9, 12-13, 23. In
case of aging experiments at 20.5 °C, the enthalpy of aging of the glass transition area (110
to 160 °C) also demonstrated good agreement with an average value of 1.62 ± 0.14 J/g for
an aging time of 8 hours across different substrates. On the other hand, the enthalpy values
Texas Tech University, Madhusudhan R. Pallaka, December 2019
105
obtained including the low temperature endotherm for both cooling rate and aging time
dependent experiments were different for all the substrates studied; in case of cooling rate
experiments, the enthalpy difference for polystyrene on bare chip is ~200 % larger than
that obtained for polystyrene film on 55 nm AAO at 0.1 K/s; in case of aging experiments,
the enthalpy is ~300 % larger at an aging time of 8 hours. In both types of experiments the
largest area was observed for polystyrene on the bare chip, and smallest area was observed
for polystyrene film on 55 nm AAO pores; the enthalpy difference between substrates is
presumably due to the stresses developed between the sensor membrane and the sample
when cooled to ultra-low temperature. In addition, the lack of reproducibility of the
enthalpy values for polystyrene on top of different substrates by considering the low
temperature endotherm suggests that this low temperature endotherm is an artifact rather a
secondary relaxation.
The idea of correlating the low-temperature endotherms observed on Flash DSC
with a fast secondary relaxation mechanism was first suggested by Cangialosi and co-
workers3, where polystyrene nanospheres aged at low temperatures for longer times
exhibited a low-temperature endotherm, and supposedly contributed to a two-step
structural recovery process. In addition, Cangialosi and co-workers3 reported that the low-
temperature endotherm was not observed for bulk nanospheres, contrary to what was
observed in this work on 1.3 µm polystyrene films (bulk). Cangialosi and co-workers also
reported the appearance of low temperature endotherms1 for different micron sized poly(4-
tert-butylstyrene) films as a function of cooling rates and thicknesses of micronscale films;
thinner micronscale films showed larger low-temperature endothermic overshoots and
hence an 80 °C change in Tf for 2.5 µm thick film.1 The large change in Tf was attributed
Texas Tech University, Madhusudhan R. Pallaka, December 2019
106
to the fast-secondary relaxation contributed by the low-temperature endotherm; however,
bulk-like mobilities were reported for all micronscale poly(4-tert-butylstyrene) films
irrespective of the large changes in Tf.1 In this work for a 1.3 µm polystyrene film on bare
chip, ΔTf,Hi+Lo was as large as ~ 56 °C at 0.1 K/s and as large as ~ 90 °C for an 8 hour aged
sample at 20.5 °C; the ΔTf,Hi+Los decreased in the order of: bare chip > Krytox Oil > 350
nm AAO > 55 nm AAO due to the reduction in the area of the low-temperature endotherm.
The effect of the substrate on ΔTf,Hi was not observed and therefore have values from
cooling rate dependent and aging time dependent studeis in good agreement with previous
studies in our lab9, 13, 21, 23. The largest reduction in fictive temperatures observed from this
work, and Cangialosi and co-workers1 are higher than the fictive temperature depressions
observed in nanoconfined polymers9, 13, 22, 25-30, 20 million year aged amber31-32, and
ultrastable molecular and polymer glasses33-35
The low temperature endotherms, both cooling rate dependent and aging time
dependent, were also observed in the case of metals such as indium and gold. Broader and
larger low temperature endotherm appears at the slowest cooling rate (0.1 K/s) and longest
aging time (8 hours) for both indium and gold. In the case of vapor-deposited gold, the low
temperature endotherm is slightly larger for the deposition temperature of 125 °C when
compared to 23 °C, presumably due to more residual stress developed due to larger
temperature difference from the deposition temperature to -80 °C. Indium and gold are
crystalline metals in solid state equilibrium with no known relaxations, further proving that
the low-temperature endotherms are not related to a material property, but presumably
occur from the interaction between the membrane of the Flash DSC sensor and the sample.
Texas Tech University, Madhusudhan R. Pallaka, December 2019
107
5.5 Conclusions
Flash differential scanning calorimetry was used to study the origin of low
temperature endotherms with 1.3 µm polystyrene films on top of four different substrates,
indium, and vapor-deposited gold. The low temperature endotherms were observed for 1.3
µm polystyrene film on different substrates, indium, and vapor-deposited gold for both
aging and cooling rate experiments when scanned to an ultra-low temperature of -80 °C.
The low temperature endotherms were non-existent in case of cooling rate dependent
experiments for all polystyrene samples and indium when the low-end temperature was
limited to 30 °C. In addition, the area of the low temperature endotherm for both cooling
rate and aging time dependent experiments was found to be dependent on the substrate
type, whereas the high temperature endotherm in the vicinity of Tg was found to be
independent of the substrate type at a given cooling rate or aging time. The inconsistency
in the magnitude of areas pertinent to the low temperature endotherm suggest that the low
temperature endotherm is an artifact and not a material property. In addition, the occurrence
of low temperature endotherms in crystalline materials like indium and vapor-deposited
gold further strengthens the fact that the low temperature endotherm lacks the physics of
being a secondary relaxation mechanism.
Texas Tech University, Madhusudhan R. Pallaka, December 2019
108
References
1. Monnier, X.; Cangialosi, D., Thermodynamic ultrastability of a polymer glass
confined at the micrometer length scale. Physical review letters 2018, 121 (13),
137801.
2. Monnier, X.; Cangialosi, D., Effect of molecular weight on vitrification kinetics
and molecular mobility of a polymer glass confined at the microscale. Thermochim.
Acta 2019, 677, 60-66.
3. Perez-De-Eulate, N. G.; Cangialosi, D., Double Mechanism for Structural
Recovery of Polystyrene Nanospheres. Macromolecules 2018, 51 (9), 3299-3307.
4. Boucher, V. M.; Cangialosi, D.; Alegría, A.; Colmenero, J., Reaching the ideal
glass transition by aging polymer films. PCCP 2017, 19 (2), 961-965.
5. Perez-De Eulate, N. G.; Cangialosi, D., The very long-term physical aging of glassy
polymers. PCCP 2018, 20 (18), 12356-12361.
6. Boucher, V. M.; Cangialosi, D.; Alegría, A.; Colmenero, J., Complex
nonequilibrium dynamics of stacked polystyrene films deep in the glassy state. The
Journal of Chemical Physics 2017, 146 (20), 203312.
7. Pallaka, M. R.; Unruh, D. K.; Simon, S. L., Melting behavior of n-alkanes in anodic
aluminum oxide (AAO) nanopores using Flash differential scanning calorimetry.
Thermochim. Acta 2018, 663, 157-164.
8. Cebe, P.; Partlow, B. P.; Kaplan, D. L.; Wurm, A.; Zhuravlev, E.; Schick, C., Using
flash DSC for determining the liquid state heat capacity of silk fibroin.
Thermochim. Acta 2015, 615, 8-14.
9. Koh, Y. P.; McKenna, G. B.; Simon, S. L., Calorimetric glass transition
temperature and absolute heat capacity of polystyrene ultrathin films. Journal of
Polymer Science Part B-Polymer Physics 2006, 44 (24), 3518-3527.
10. Takahashi, Y.; Akiyama, H., Heat capacity of gold from 80 to 1000 k. Thermochim.
Acta 1986, 109 (1), 105-109.
11. Koh, Y. P.; Simon, S. L., Structural relaxation of stacked ultrathin polystyrene
films. Journal of Polymer Science Part B: Polymer Physics 2008, 46 (24), 2741-
2753.
12. Lopez, E.; Simon, S. L., Signatures of structural recovery in polystyrene by
nanocalorimetry. Macromolecules 2016, 49 (6), 2365-2374.
13. Gao, S.; Koh, Y. P.; Simon, S. L., Calorimetric Glass Transition of Single
Polystyrene Ultrathin Films. Macromolecules 2013, 46 (2), 562-570.
Texas Tech University, Madhusudhan R. Pallaka, December 2019
109
14. http://webbook.nist.gov/chemistry/.
15. Moynihan, C. T.; Macedo, P. B.; Montrose, C. J.; Gupta, P. K.; DeBolt, M. A.; Dill,
J. F.; Dom, B. E.; Drake, P. W.; Easteal, A. J.; Elterman, P. B., Structural relaxation
in vitreous materials*. Annals of the New York Academy of Sciences 1976, 279 (1),
15-35.
16. Richardson, M.-J.; Savill, N., Derivation of accurate glass transition temperatures
by differential scanning calorimetry. Polymer 1975, 16 (10), 753-757.
17. Williams, M. L.; Landel, R. F.; Ferry, J. D., The Temperature Dependence of
Relaxation Mechanisms in Amorphous Polymers and Other Glass-forming Liquids.
J. Am. Chem. Soc. 1955, 77 (14), 3701-3707.
18. Schawe, J. E., Measurement of the thermal glass transition of polystyrene in a
cooling rate range of more than six decades. Thermochim. Acta 2015, 603, 128-
134.
19. Koh, Y. P.; Gao, S.; Simon, S. L., Structural recovery of a single polystyrene thin
film using Flash DSC at low aging temperatures. Polymer 2016, 96, 182-187.
20. Koh, Y. P.; Grassia, L.; Simon, S. L., Structural recovery of a single polystyrene
thin film using nanocalorimetry to extend the aging time and temperature range.
Thermochimica Acta 2015, 603, 135-141.
21. Grassia, L.; Koh, Y. P.; Rosa, M.; Simon, S. L., Complete set of enthalpy recovery
data using Flash DSC: experiment and modeling. Macromolecules 2018, 51 (4),
1549-1558.
22. Koh, Y. P.; Simon, S. L., The glass transition and enthalpy recovery of a single
polystyrene ultrathin film using Flash DSC. The Journal of Chemical Physics 2017,
146 (20), 203329.
23. Gao, S.; Simon, S. L., Measurement of the limiting fictive temperature over five
decades of cooling and heating rates. Thermochim. Acta 2015, 603, 123-127.
24. Koh, Y. P.; Gao, S.; Simon, S. L., Structural Recovery for a Single Polystyrene
Ultrathin Film Using Flash DSC. Bulletin of the American Physical Society 2015,
60.
25. Roth, C.; Pound, A.; Kamp, S.; Murray, C.; Dutcher, J., Molecular-weight
dependence of the glass transition temperature of freely-standing poly (methyl
methacrylate) films. The European Physical Journal E 2006, 20 (4), 441-448.
26. Sharp, J.; Forrest, J., Thickness dependence of the dynamics in thin films of
isotactic poly (methylmethacrylate). The European Physical Journal E 2003, 12
(1), 97-101.
Texas Tech University, Madhusudhan R. Pallaka, December 2019
110
27. Forrest, J.; Dalnoki-Veress, K.; Dutcher, J., Interface and chain confinement effects
on the glass transition temperature of thin polymer films. Physical Review E 1997,
56 (5), 5705.
28. Sharp, J.; Forrest, J. A., Free surfaces cause reductions in the glass transition
temperature of thin polystyrene films. Phys. Rev. Lett. 2003, 91 (23), 235701.
29. Reiter, G., Mobility of polymers in films thinner than their unperturbed size. EPL
(Europhysics Letters) 1993, 23 (8), 579.
30. Koh, Y. P.; Simon, S. L., Structural Relaxation of Stacked Ultrathin Polystyrene
Films. Journal of Polymer Science Part B-Polymer Physics 2008, 46 (24), 2741-
2753.
31. Zhao, J.; Simon, S. L.; McKenna, G. B., Using 20-million-year-old amber to test
the super-Arrhenius behaviour of glass-forming systems. Nature communications
2013, 4, 1783.
32. Zhao, J.; Ragazzi, E.; McKenna, G. B., Something about amber: Fictive
temperature and glass transition temperature of extremely old glasses from copal to
Triassic amber. Polymer 2013, 54 (26), 7041-7047.
33. Swallen, S. F.; Kearns, K. L.; Mapes, M. K.; Kim, Y. S.; McMahon, R. J.; Ediger,
M. D.; Wu, T.; Yu, L.; Satija, S., Organic glasses with exceptional thermodynamic
and kinetic stability. Science 2007, 315 (5810), 353-356.
34. Yoon, H.; Koh, Y. P.; Simon, S. L.; McKenna, G. B., An ultrastable polymeric
glass: Amorphous fluoropolymer with extreme fictive temperature reduction by
vacuum pyrolysis. Macromolecules 2017, 50 (11), 4562-4574.
35. Yoon, H.; McKenna, G. B., Testing the paradigm of an ideal glass transition:
Dynamics of an ultrastable polymeric glass. Science advances 2018, 4 (12),
eaau5423.
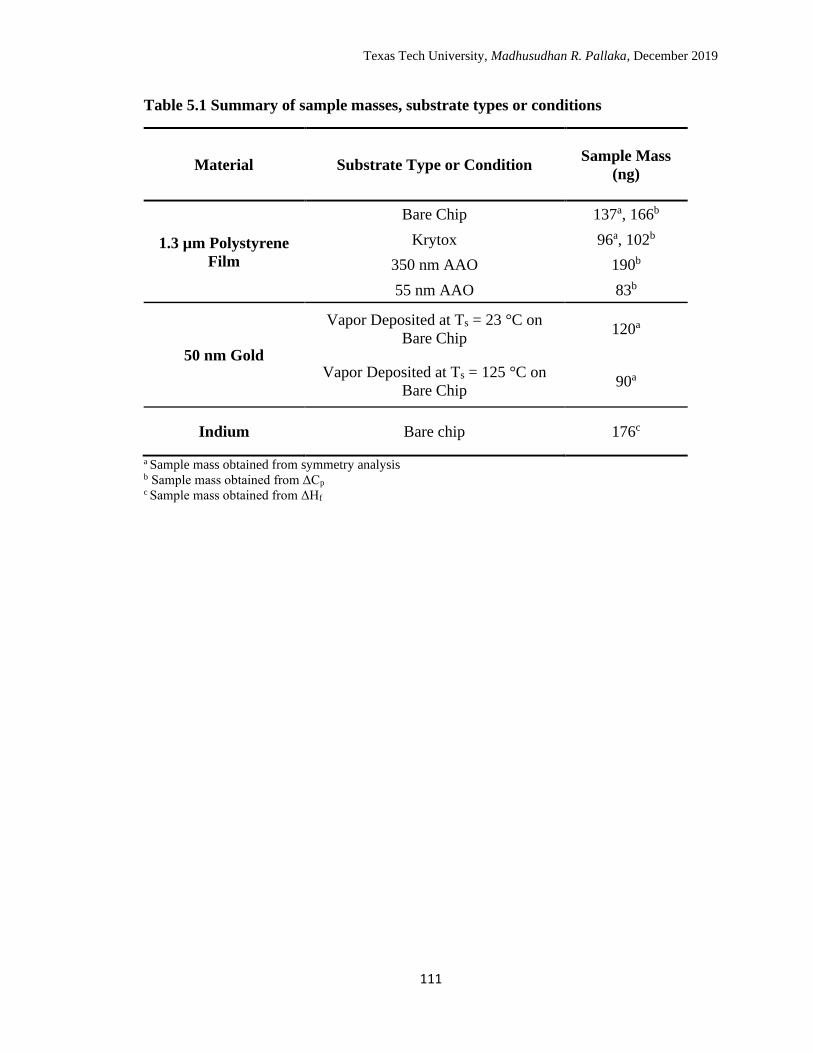
Texas Tech University, Madhusudhan R. Pallaka, December 2019
111
Table 5.1 Summary of sample masses, substrate types or conditions
Material Substrate Type or Condition Sample Mass
(ng)
1.3 µm Polystyrene
Film
Bare Chip 137a, 166b
Krytox 96a, 102b
350 nm AAO 190b
55 nm AAO 83b
50 nm Gold
Vapor Deposited at Ts = 23 °C on
Bare Chip 120a
Vapor Deposited at Ts = 125 °C on
Bare Chip 90a
Indium Bare chip 176c
a Sample mass obtained from symmetry analysis b Sample mass obtained from ΔCp c Sample mass obtained from ΔHf
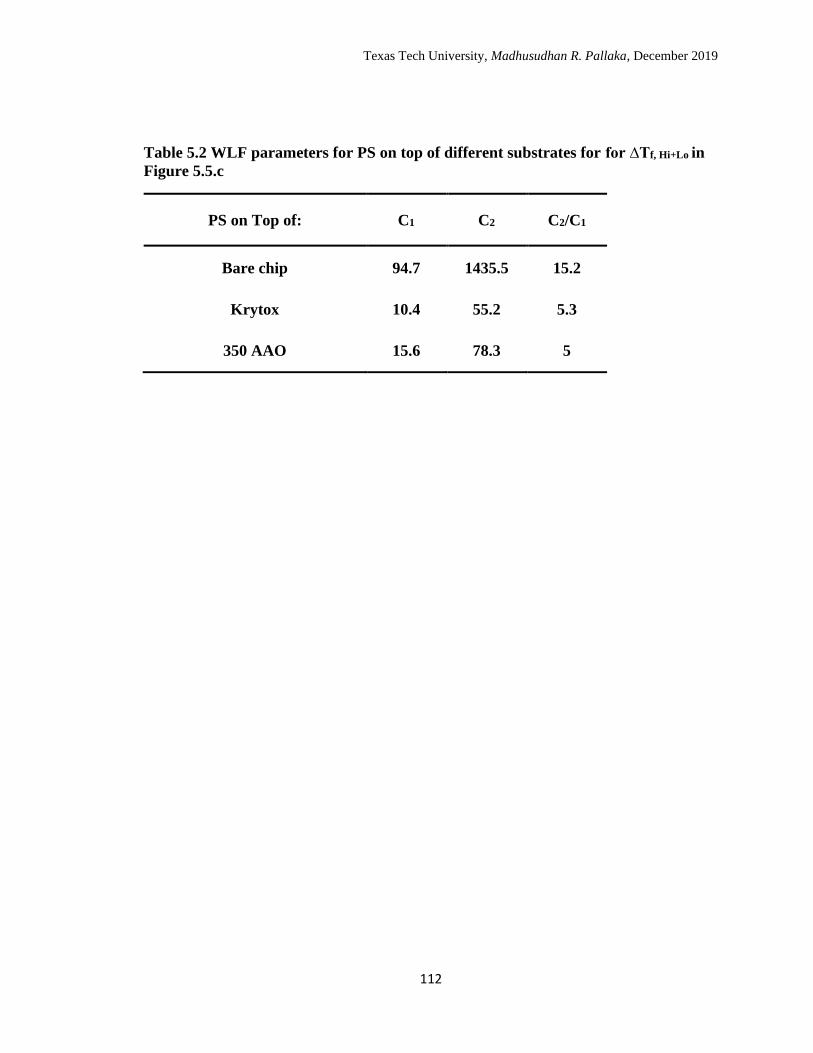
Texas Tech University, Madhusudhan R. Pallaka, December 2019
112
Table 5.2 WLF parameters for PS on top of different substrates for for ∆Tf, Hi+Lo in
Figure 5.5.c
PS on Top of: C1 C2 C2/C1
Bare chip 94.7 1435.5 15.2
Krytox 10.4 55.2 5.3
350 AAO 15.6 78.3 5
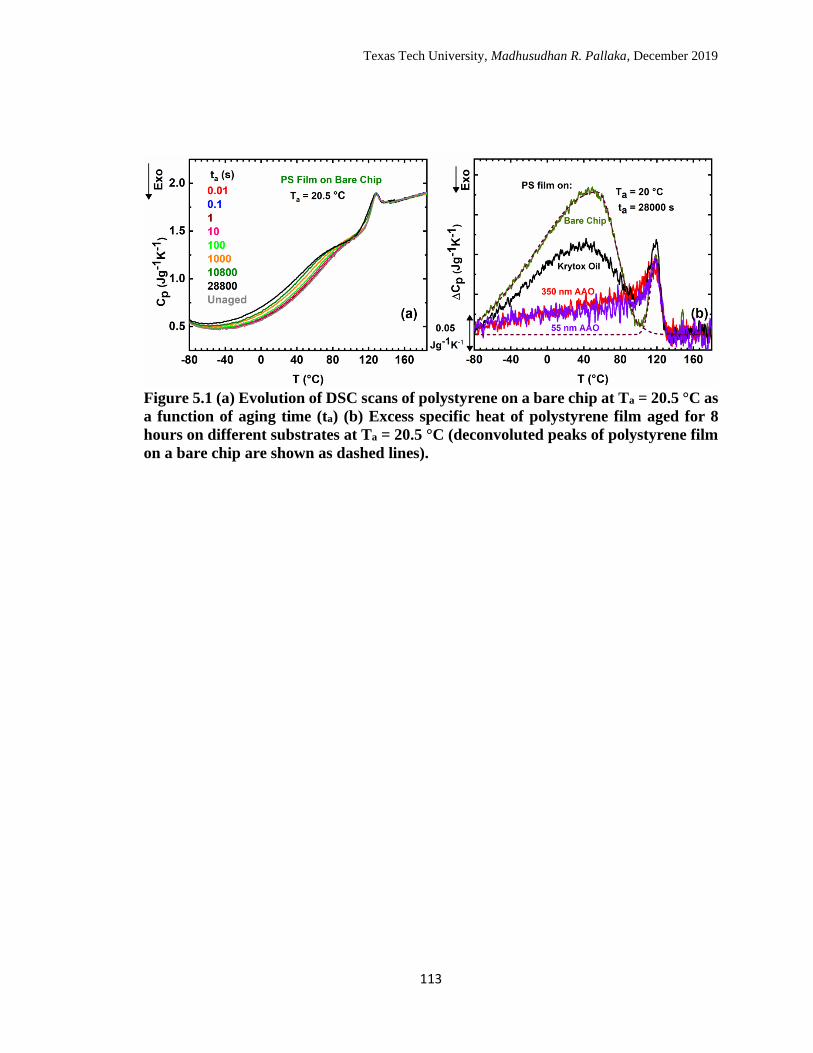
Texas Tech University, Madhusudhan R. Pallaka, December 2019
113
Figure 5.1 (a) Evolution of DSC scans of polystyrene on a bare chip at Ta = 20.5 °C as
a function of aging time (ta) (b) Excess specific heat of polystyrene film aged for 8
hours on different substrates at Ta = 20.5 °C (deconvoluted peaks of polystyrene film
on a bare chip are shown as dashed lines).
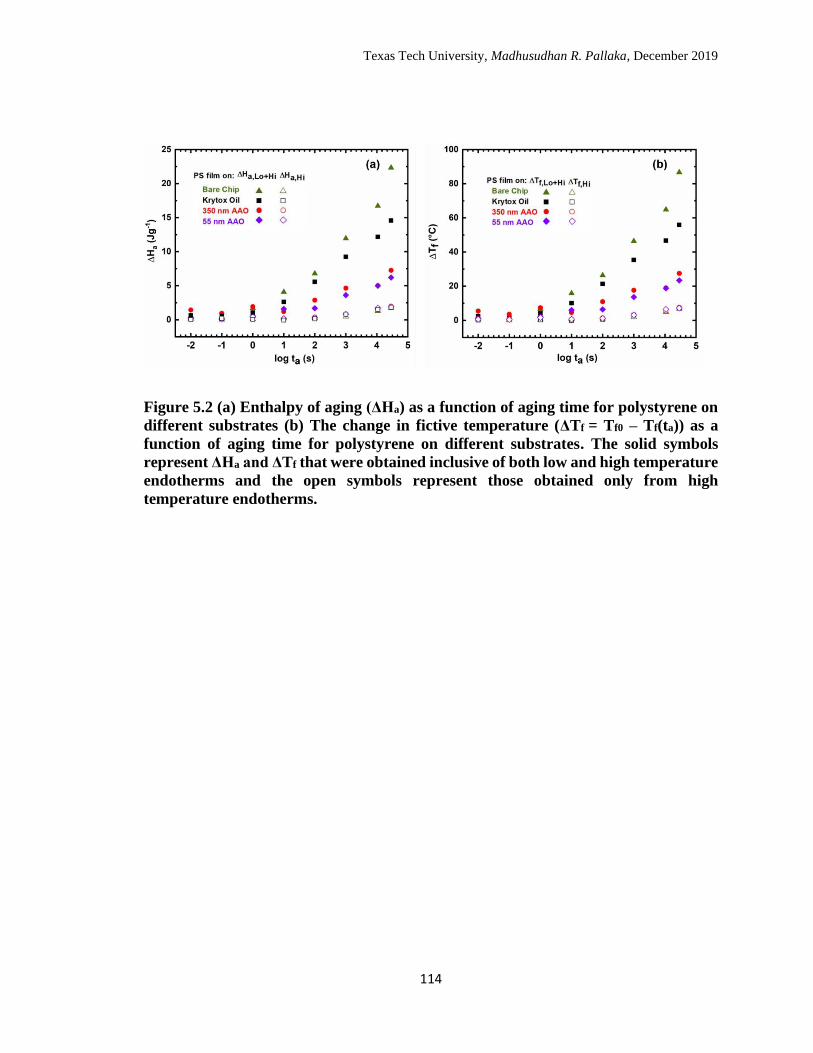
Texas Tech University, Madhusudhan R. Pallaka, December 2019
114
Figure 5.2 (a) Enthalpy of aging (ΔHa) as a function of aging time for polystyrene on
different substrates (b) The change in fictive temperature (ΔTf = Tf0 – Tf(ta)) as a
function of aging time for polystyrene on different substrates. The solid symbols
represent ΔHa and ΔTf that were obtained inclusive of both low and high temperature
endotherms and the open symbols represent those obtained only from high
temperature endotherms.
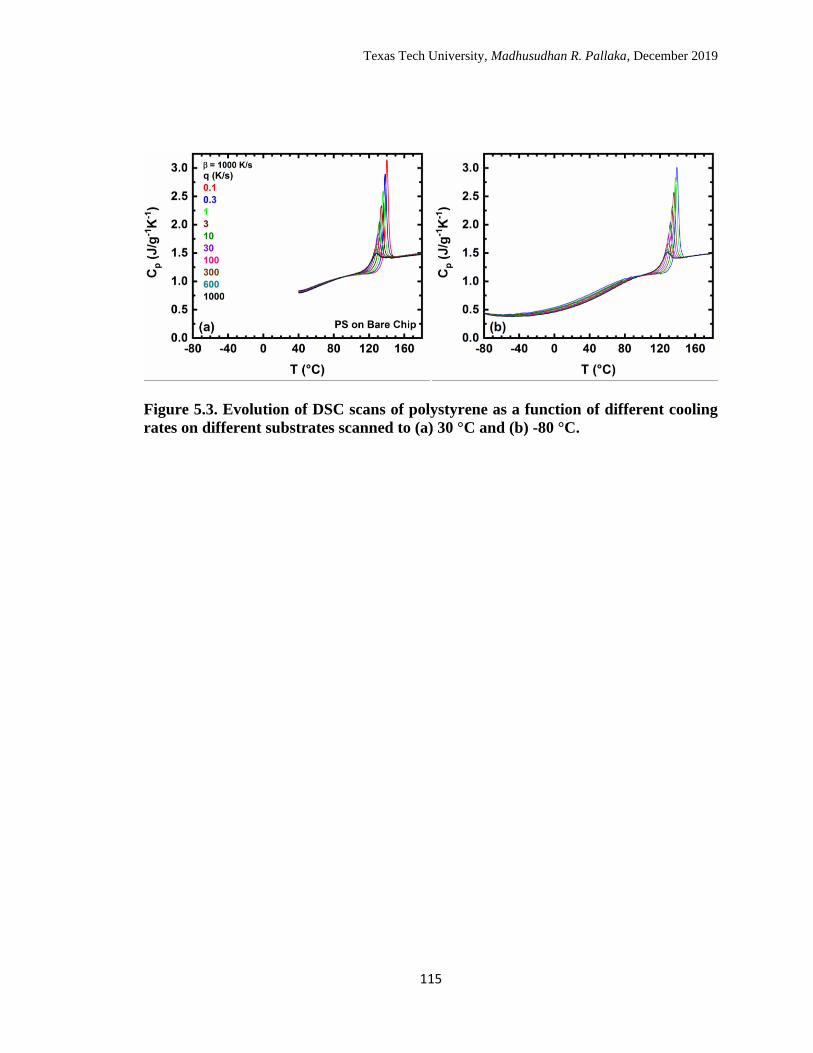
Texas Tech University, Madhusudhan R. Pallaka, December 2019
115
Figure 5.3. Evolution of DSC scans of polystyrene as a function of different cooling
rates on different substrates scanned to (a) 30 °C and (b) -80 °C.
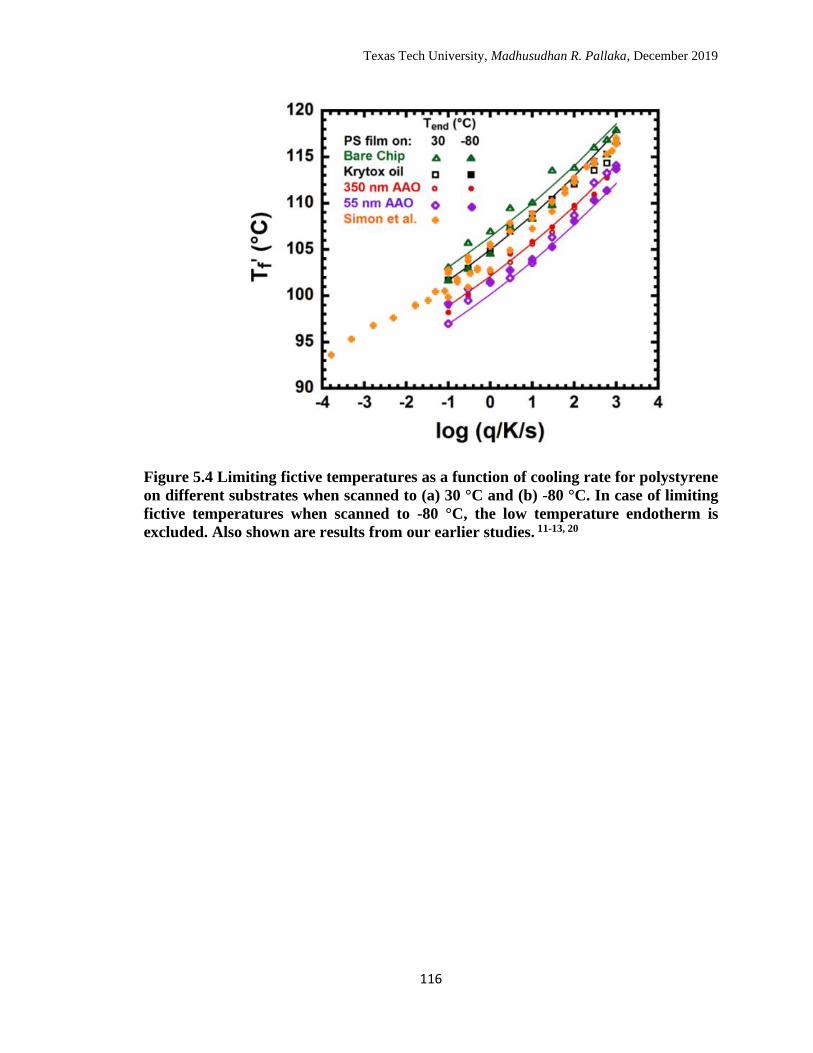
Texas Tech University, Madhusudhan R. Pallaka, December 2019
116
Figure 5.4 Limiting fictive temperatures as a function of cooling rate for polystyrene
on different substrates when scanned to (a) 30 °C and (b) -80 °C. In case of limiting
fictive temperatures when scanned to -80 °C, the low temperature endotherm is
excluded. Also shown are results from our earlier studies. 11-13, 20
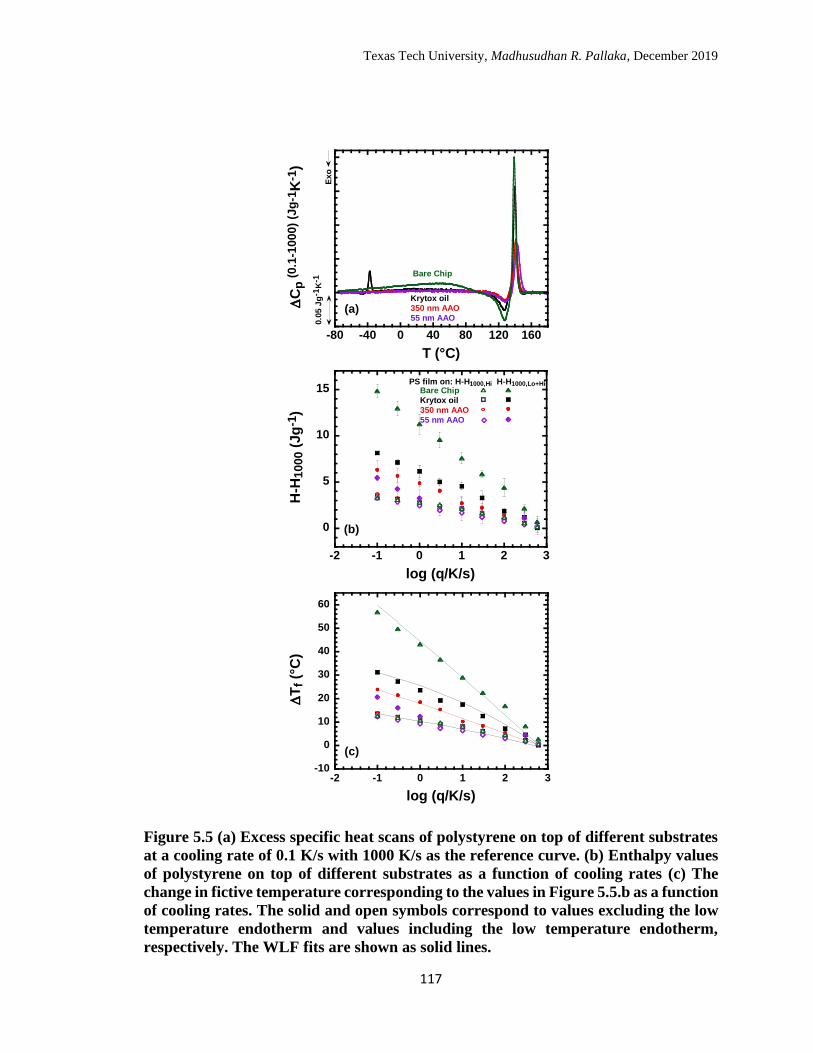
Texas Tech University, Madhusudhan R. Pallaka, December 2019
117
Figure 5.5 (a) Excess specific heat scans of polystyrene on top of different substrates
at a cooling rate of 0.1 K/s with 1000 K/s as the reference curve. (b) Enthalpy values
of polystyrene on top of different substrates as a function of cooling rates (c) The
change in fictive temperature corresponding to the values in Figure 5.5.b as a function
of cooling rates. The solid and open symbols correspond to values excluding the low
temperature endotherm and values including the low temperature endotherm,
respectively. The WLF fits are shown as solid lines.
-80 -40 0 40 80 120 160
C
p (
0.1
-1000)
(Jg
-1K
-1)
T (°C)
0.0
5 J
g-1
K-1
Ex
o
Krytox oil
350 nm AAO
55 nm AAO
Bare Chip
(a)
0
5
10
15
-2 -1 0 1 2 3
H-H
1000 (
Jg
-1)
log (q/K/s)
PS film on: H-H1000,Hi H-H1000,Lo+HiBare Chip
Krytox oil
350 nm AAO
55 nm AAO
(b)
-10
0
10
20
30
40
50
60
-2 -1 0 1 2 3
PS+K with endoK (w/o endo)350AAO endo350AAO w/o endo55AAO endo55AAO w/o endoWT endoWT w/o endoKrytox(withendo)350AAO (with endo)55AAO (With endo)WT(With endo)Krytox(W/O endo)
log (q/K/s)
T
f (°
C)
(c)
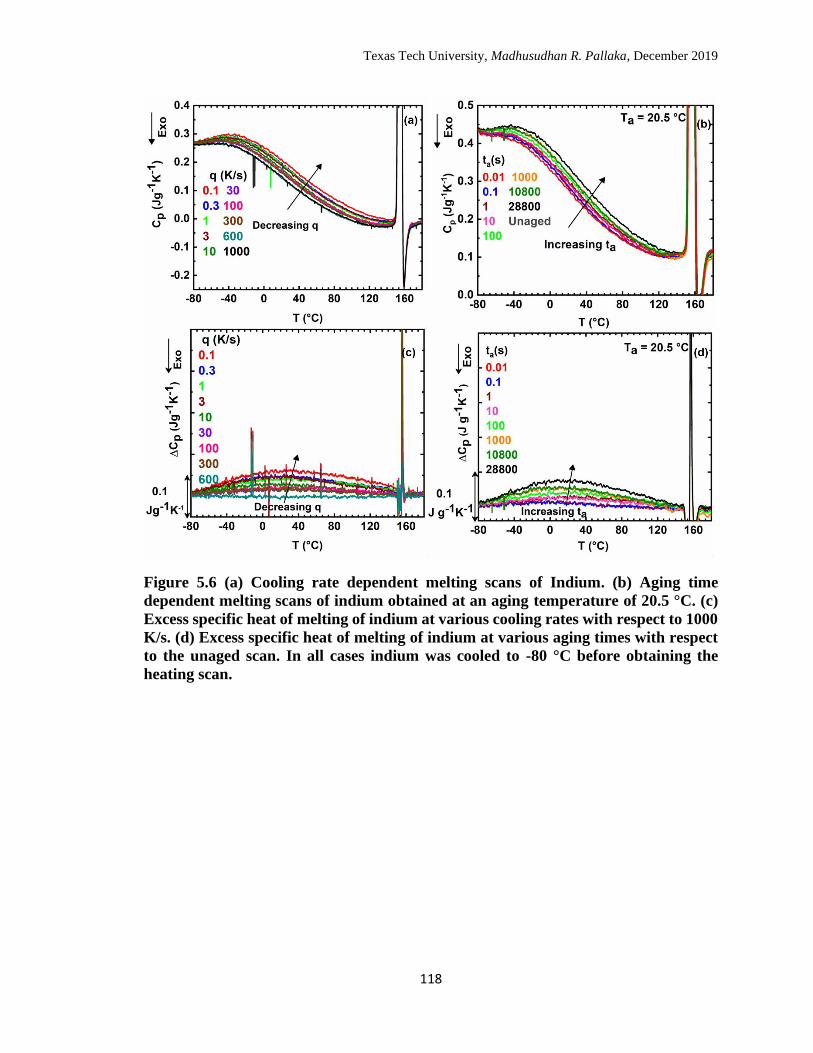
Texas Tech University, Madhusudhan R. Pallaka, December 2019
118
Figure 5.6 (a) Cooling rate dependent melting scans of Indium. (b) Aging time
dependent melting scans of indium obtained at an aging temperature of 20.5 °C. (c)
Excess specific heat of melting of indium at various cooling rates with respect to 1000
K/s. (d) Excess specific heat of melting of indium at various aging times with respect
to the unaged scan. In all cases indium was cooled to -80 °C before obtaining the
heating scan.
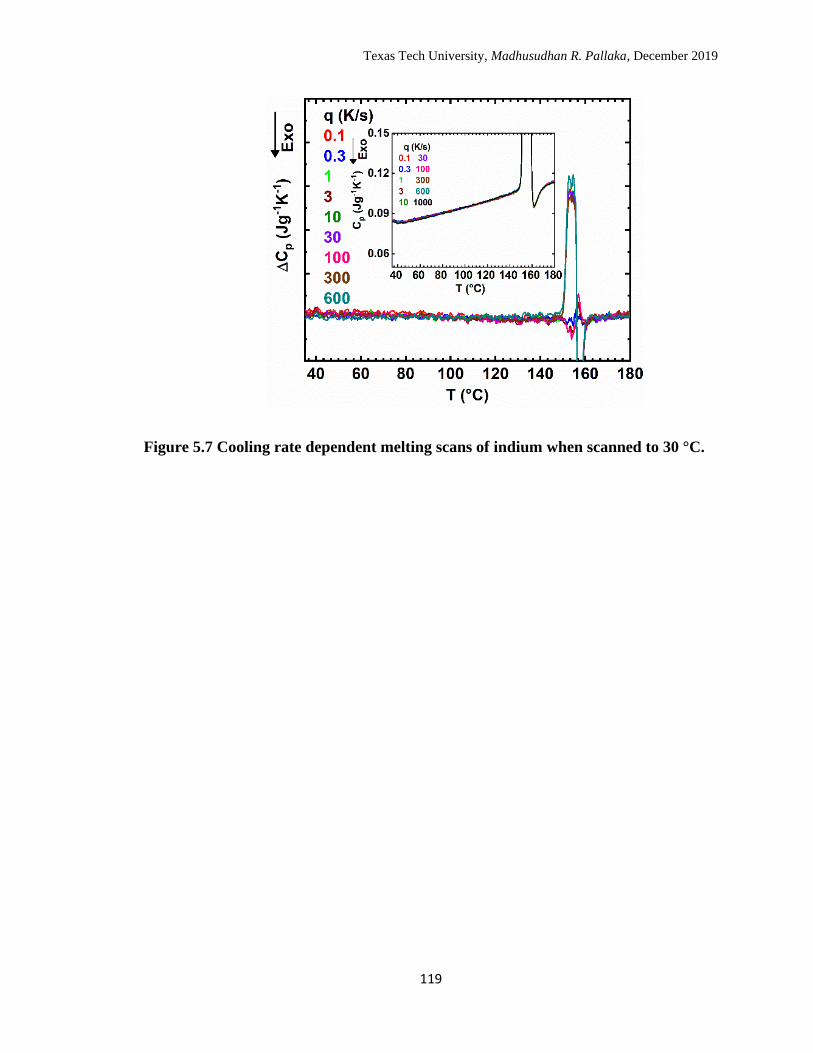
Texas Tech University, Madhusudhan R. Pallaka, December 2019
119
Figure 5.7 Cooling rate dependent melting scans of indium when scanned to 30 °C.
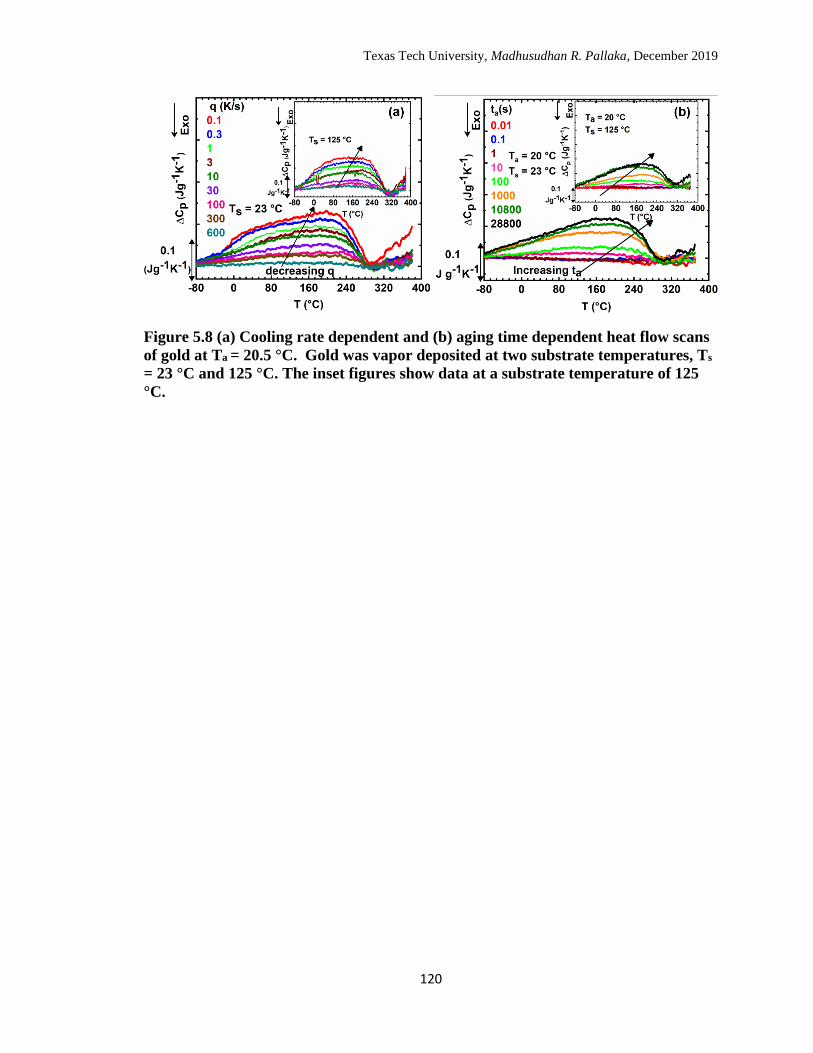
Texas Tech University, Madhusudhan R. Pallaka, December 2019
120
Figure 5.8 (a) Cooling rate dependent and (b) aging time dependent heat flow scans
of gold at Ta = 20.5 °C. Gold was vapor deposited at two substrate temperatures, Ts
= 23 °C and 125 °C. The inset figures show data at a substrate temperature of 125
°C.
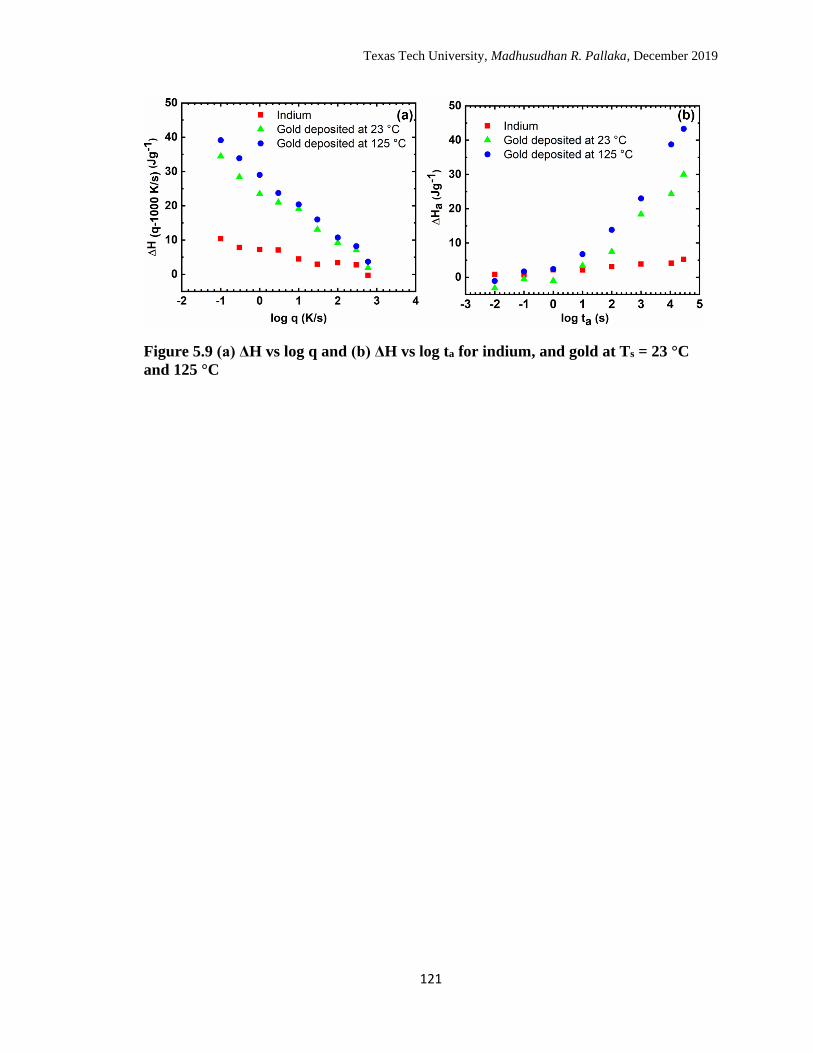
Texas Tech University, Madhusudhan R. Pallaka, December 2019
121
Figure 5.9 (a) ΔH vs log q and (b) ΔH vs log ta for indium, and gold at Ts = 23 °C
and 125 °C
Texas Tech University, Madhusudhan R. Pallaka, December 2019
122
CHAPTER 6
THE GLASS TRANSITION BEHAVIOR OF ANODIC ALUMINUM
OXIDE (AAO) SUPPORTED AND STACKED POLYSTYRENE
NANORODS USING FLASH DIFFERENTIAL SCANNING
CALORIMETRY
6.1 Introduction
Properties of polymers under nanoconfinement have been of significant interest
due to their role in many practical applications including coatings, composites, and
membrane technology. Among the key properties, the glass transition temperature (Tg)
has been well studied and is found to be significantly affected at the nanoscale when
compared to the bulk. At the nanoscale, Tg can increase, decrease or remain unchanged
based on different factors1-6: 1) nanoconfinement geometry, 2) interaction between the
confined material and substrate, 3) glass former molecular structure and architecture.
Recently, the influence of nanoconfinement geometry on Tg for a variety of polymers has
attracted attention due to their potential applications in the semiconductor industry where
size and dimensionality play a key role. Nanoconfinement geometry is categorized based
on spatial dimensionality which includes, 1-D thin films, 2-D nanowires/nanorods and 3-
D nanospheres. In the case of polystyrene (PS), size-dependent Tg of 1-D thin films has
been extensively studied using various experimental techniques for supported, free-
standing, sandwiched, and stacked films.3, 7-26 In general, for polystyrene, Tg is depressed
in ultrathin films on neutral or weakly interacting substrates,3, 7-26 and a non-linear
dependence on film thickness (h), independent of molecular weight is observed:13-14
Texas Tech University, Madhusudhan R. Pallaka, December 2019
123
𝑇𝑔(ℎ) = 𝑇𝑔𝑏𝑢𝑙𝑘 [1 − (
𝛼
ℎ)
𝛿
]
(6.1)
where 𝑇𝑔(ℎ) is the glass transition temperature at film thickness h, 𝑇𝑔𝑏𝑢𝑙𝑘 is the bulk glass
transition temperature (373.8 ± 0.7 K for polystyrene), and 𝛼 and 𝛿 are the fitting
parameters whose values have been reported to be 1.3 nm and 1.28, respectively.11-14 The
existence of Tg depression for 1D thin films has been generally attributed to an interplay
of two factors: 1) enhanced mobility at the free surface and 2) intrinsic size effect.3, 7-35
The work on the size-dependent Tg of 2-D polystyrene nanorods is relatively new
and has been mainly studied using anodic aluminum oxide (AAO) nanopores29, 31, 36-37 as
a support and in aqueous dispersion. Zhu and co-workers reported a 3 K increase in Tg
for polystyrene (Mw = 280 kg/mol) inside AAO nanopores irrespective of pore diameter;
they also reported a depression of 24 K for aqueous dispersed 100 nm-diameter PS wires
prepared via electrospinning 37. On the other hand, Torkelson and co-workers31 reported a
Tg depression for polystyrene nanorods when 𝑑 ≤ 2𝑅𝑔 where 𝑑 is the diameter of
nanorods and 𝑅𝑔 is the radius of gyration – a maximum depression of 8 K was reported
for 24 nm polystyrene rods with a molecular weight (Mw) of 1420 kg/mol.31 In a study by
Xue and co-workers36 where low molecular weights (6 – 60 Kg/mol) were used, two Tgs
were reported at intermediate cooling rates (10 K/min), whereas bulk values were
observed at the highest rates (120 K/s).36 In our study the first objective is to probe the
existence of two Tg’s in case of high molecular weight polystyrene (2100 kg/mol)
nanorods supported inside different sizes of AAO at rapid heating and cooling rates using
Texas Tech University, Madhusudhan R. Pallaka, December 2019
124
Flash differential scanning calorimetry; also, the results will be compared to similarly-
sized stacked polystyrene nanorods where the nanorods are devoid of AAO support and
other relevant work on polystyrene nanorods confined in AAO31, 37-38. The feasibility of
the use of AAO nanopores as a form of nanoconfinement on the Flash DSC has been
previously demonstrated in our group where size-dependent melting behavior of n-
alkanes was successfully studied.39
In case of 3D polystyrene nanospheres, the size-dependent glass transition
behavior has been studied using different environments and experimental techniques.
Priestley and co-workers27, 33 reported Tg depressions for aqueous dispersed27 and air
exposed33 nanospheres when diameter was less than 400 nm – a maximum depression of
56 K was observed for aqueous dispersed nanospheres with d = 90 nm. When the
nanospheres were capped with silica27, no Tg depressions were observed. Cangialosi and
co-workers40 also reported Tg depressions when 3D PS nanospheres dispersed in
poly(dimethylsiloxane) were studied on the Flash DSC. In addition to the first objective,
we also intend to compare our results from AAO supported and stacked 2D polystyrene
nanorods to 1D ultra-thin polystyrene films and 3D polystyrene nanospheres from the
literature to study the effect of spatial dimensionality on Tg.
In the results reported in chapter 5 on bulk polystyrene films on Flash DSC, we
observed a broad low-temperature endotherm on heating after cooling to an ultra-low
temperature of -80 °C, i.e., 180 K below the nominal Tg. The low temperature endotherm
was found to be cooling rate dependent, similar to the endothermic overshoot associated
with the glass transition, but unlike the magnitude of the overshoot at Tg which does not
depend on the substrate for a given cooling rate, the magnitude of the low temperature
Texas Tech University, Madhusudhan R. Pallaka, December 2019
125
endotherm was found to be substrate dependent with the largest overshoot observed at a
cooling rate of 0.1 K/s for bulk polystyrene film on bare chip. Additionally, in chapter 5,
we also found cooling rate dependent broad low-temperature endotherms in case of
crystalline metals, indium and vapor deposited gold, when scanned to -80 °C. The
presence of cooling rate dependent broad low-temperature endotherms has been
attributed to a secondary relaxation by Cangialosi and co-workers for micronscale
poly(4-tert butyl styrene) films studied on Flash DSC,41-42 but based on results in chapter
6 on bulk polystyrene films on multiple substrates, and crystalline metals it was
concluded that the low temperature endotherm is not a signature of secondary relaxation
and attributed it to residual stresses, presumably between the sample and chip membrane
when scanned to ultra-low temperatures. In this work, we extend the studies on bulk
polystyrene films from our previous work and perform similar low temperature
experiments on stacked and AAO supported polystyrene rods to probe the low
temperature endotherms using Flash DSC.
6.2 Experimental
6.2.1 Methodology
Flash Differential Scanning Calorimetry
The glass transition behavior of AAO supported and stacked PS nanorods was
studied using a Mettler Toledo Flash DSC 1 with a Freon intercooler and 20 ml/min
nitrogen gas purge. Prior to the measurements, UFS 1 calorimetric chips were
conditioned and corrected at a sensor temperature of -100 °C following the
manufacturer’s procedure. In addition to the aforementioned correction, an additional
temperature calibration was performed using phenanthrene (Tm= 98.7 °C) on the
Texas Tech University, Madhusudhan R. Pallaka, December 2019
126
reference side of the chip. The Tfˈs were also corrected for dynamic heat transfer effects
following the preocedure recommended by Schawe et al.43, where a correction factor,
equal to the average of the differnece between glass transition temperatures measured on
cooling and subsequent heating at ±600 K/s, is subtracted from all Tfs (since all are
obtained on heating at 600 K/s). Correction factors were in the range of 3-4 K for stacked
PS nanorods, and 6-9 K in case of AAO supported PS nanorods.
In case of AAO supported PS nanorods, a small piece (< 0.09 mm2) was cut from
the parent template and transferred onto the chip with the help of a hair; on the other
hand, stacked PS nanorods were first separated from the PS film with the help of a micro-
scalpel and then a sufficient amount was transferred similarly with a hair, and later
[C7C1im] [NTf2] ionic liquid was added for better thermal contact; no plasticization was
observed, but a slight increase (~2 K) in Tg was observed when compared to bare
nanorods.
The measurement protocol comprised of two steps - a dummy step and a main
step. The dummy step was the first step that was performed after the sample was placed
onto the sensor and was done only once on each of the samples. The dummy step
comprised of five to six simultaneous heating and cooling steps from 25 to 180 °C at
±600 K/s; it was crucial in establishing good thermal contact between the sample and the
chip sensor. In the main step, the sample was heated from 25 °C to 180 °C at 600 K/s and
was isothermally held for 0.5 s to erase the thermal history. The sample devoid of
thermal history was then cooled from 180 °C to two either, -80 or 30 °C, at different rates
in the range of 0.1 – 1000 K/s. The cooling scan was followed by a heating scan to 180
°C at 600 K/s. The main step was repeated 10 times where each of them had three
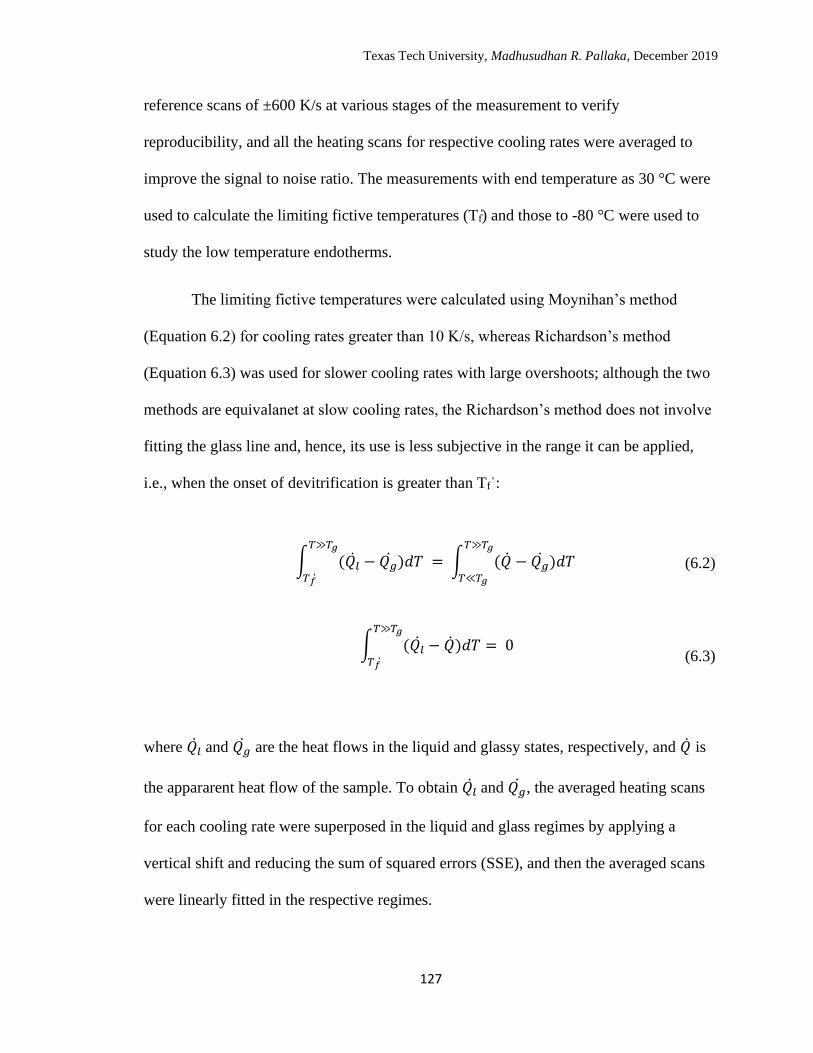
Texas Tech University, Madhusudhan R. Pallaka, December 2019
127
reference scans of ±600 K/s at various stages of the measurement to verify
reproducibility, and all the heating scans for respective cooling rates were averaged to
improve the signal to noise ratio. The measurements with end temperature as 30 °C were
used to calculate the limiting fictive temperatures (Tf) and those to -80 °C were used to
study the low temperature endotherms.
The limiting fictive temperatures were calculated using Moynihan’s method
(Equation 6.2) for cooling rates greater than 10 K/s, whereas Richardson’s method
(Equation 6.3) was used for slower cooling rates with large overshoots; although the two
methods are equivalanet at slow cooling rates, the Richardson’s method does not involve
fitting the glass line and, hence, its use is less subjective in the range it can be applied,
i.e., when the onset of devitrification is greater than Tfˈ:
∫ (𝑄𝑙 − 𝑄��)𝑑𝑇 = ∫ (�� − 𝑄��)𝑑𝑇
𝑇≫𝑇𝑔
𝑇≪𝑇𝑔
𝑇≫𝑇𝑔
𝑇𝑓
(6.2)
∫ (𝑄𝑙 − ��)𝑑𝑇 = 0
𝑇≫𝑇𝑔
𝑇𝑓
(6.3)
where 𝑄𝑙 and 𝑄�� are the heat flows in the liquid and glassy states, respectively, and �� is
the appararent heat flow of the sample. To obtain 𝑄𝑙 and 𝑄��, the averaged heating scans
for each cooling rate were superposed in the liquid and glass regimes by applying a
vertical shift and reducing the sum of squared errors (SSE), and then the averaged scans
were linearly fitted in the respective regimes.
Texas Tech University, Madhusudhan R. Pallaka, December 2019
128
The sample mass of the stacked PS nanorods was obtained by symmetry
analysis39, 44, which involves correcting the measured heat flow of stacked PS nanorods
for heat losses and the addenda heat capacity of the empty chip, and dividing the
symmetry-corrected heat flow with glassy absolute heat capacity of polystyrene11 at a
defined temperature. The sample masses of 20, 55, and 350 nm stacked PS nanorods are
145, 86 and 350 ng, respectively. On the other hand, the sample mass of PS in AAO
supported PS rods was obtained by dividing the step change in heat flow at Tg and the
step change in heat capacity for a bulk polystyrene11-12, 45; the sample masses are 74, 96,
and 111 ng for PS supported in 20, 55 and 350 nm AAO templates.
6.3 Results
6.3.1 Stacked PS nanorods in ionic liquid
Flash DSC heating scans for stacked 20 nm PS nanorods dispersed in ionic liquid
are shown as a function of cooling rate (q) in Figures 6.1.a. The area of enthalpy
overshoot increases in magnitude and shifts to higher temperatures as the cooling rate
decreases from 1000 K/s to 0.1 K/s; this phenomenon is well understood and is related to
the kinetics associated with the glass transition. The data for stacked 20 nm PS rods is
transformed to heat capacity and compared to the data for 55 and 350 nm stacked rods in
Figure 6.1.b. The enthalpy overshoots for both 20 and 55 nm stacked PS nanorods shift to
lower temperatures with respect to 350 nm stacked PS rods; the shifts also resulted in
reduced limiting fictive temperatures for 20 and 55 nm stacked PS rods as indicated by
arrows in Figure 6.1.b. A similar but smaller shift in overshoot at Tg was also observed in
case of stacked thin films11, but in case of 20 nm ultrathin films46 only a slight
broadening was observed at the low temperature side. Tg reductions are observed for all
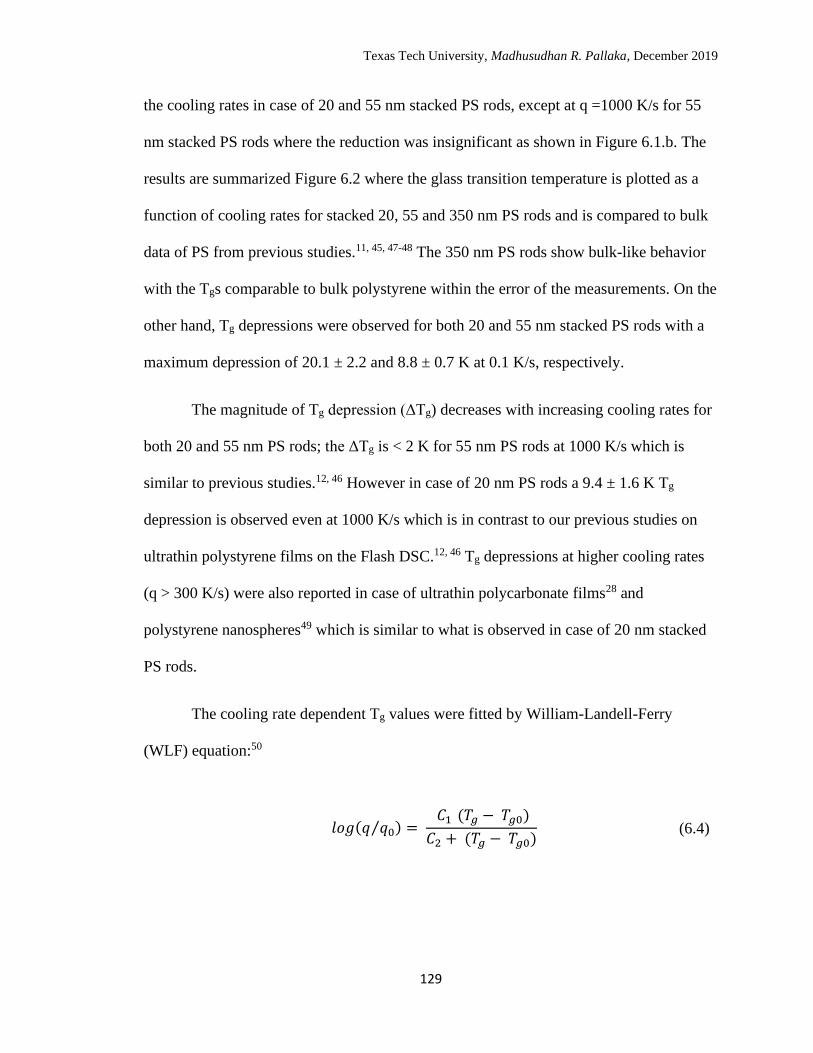
Texas Tech University, Madhusudhan R. Pallaka, December 2019
129
the cooling rates in case of 20 and 55 nm stacked PS rods, except at q =1000 K/s for 55
nm stacked PS rods where the reduction was insignificant as shown in Figure 6.1.b. The
results are summarized Figure 6.2 where the glass transition temperature is plotted as a
function of cooling rates for stacked 20, 55 and 350 nm PS rods and is compared to bulk
data of PS from previous studies.11, 45, 47-48 The 350 nm PS rods show bulk-like behavior
with the Tgs comparable to bulk polystyrene within the error of the measurements. On the
other hand, Tg depressions were observed for both 20 and 55 nm stacked PS rods with a
maximum depression of 20.1 ± 2.2 and 8.8 ± 0.7 K at 0.1 K/s, respectively.
The magnitude of Tg depression (ΔTg) decreases with increasing cooling rates for
both 20 and 55 nm PS rods; the ΔTg is < 2 K for 55 nm PS rods at 1000 K/s which is
similar to previous studies.12, 46 However in case of 20 nm PS rods a 9.4 ± 1.6 K Tg
depression is observed even at 1000 K/s which is in contrast to our previous studies on
ultrathin polystyrene films on the Flash DSC.12, 46 Tg depressions at higher cooling rates
(q > 300 K/s) were also reported in case of ultrathin polycarbonate films28 and
polystyrene nanospheres49 which is similar to what is observed in case of 20 nm stacked
PS rods.
The cooling rate dependent Tg values were fitted by William-Landell-Ferry
(WLF) equation:50
𝑙𝑜𝑔(𝑞 𝑞0⁄ ) = 𝐶1 (𝑇𝑔 − 𝑇𝑔0)
𝐶2 + (𝑇𝑔 − 𝑇𝑔0)
(6.4)
Texas Tech University, Madhusudhan R. Pallaka, December 2019
130
where 𝑞 is the cooling rate, 𝑞0 is the reference cooling rate where 𝑇𝑔 = 𝑇𝑔0, which is
chosen to be 0.1 K/s in this case, and 𝐶1 and 𝐶2 are the WLF parameters. The fitting
parameters along with the apparent activation energy (𝐸𝑎 𝑅 = 2.3 𝐶1𝑇𝑔2 𝐶2 ⁄⁄ ) for glass
formation and dynamic fragility (𝑚 = −𝑑𝑙𝑜𝑔 𝑞
𝑑(𝑇𝑔0
𝑇𝑔)
= 𝐶1𝑇𝑔 𝐶2 ⁄ ) are shown in Table 6.1. The
activation energy of glass formation decreases with decreasing PS rod diameter; it
decreases from 113 kK to 71 kK to 62 kK for 350, 55 and 20 nm rods, respectively.
While the activation energy for 350 nm rods is comparable to bulk (105 kK) and 71 nm
PS films (102 kK), the values for 55 nm and 20 nm rods are lower than 47 nm (95 kK)
ultrathin PS film, but comparable to 20 nm ultrathin film.12, 34, 46 The dynamic fragilities
(m) of stacked PS nanorods also decrease with decreasing PS rod diameter; it decreases
from 131 to 85 to 76 for 350, 55 and 20 nm rods, respectively. The 20 and 55 nm stacked
PS rods have a reduced dynamic fragility (m) when compared to the bulk, 71 and 47 nm
PS films. The fragility of 20 nm stacked PS rods is only slightly lower than the fragility
film of 84.5 ± 3.6. In spite of the similarities of activation energy and dynamic fragility,
Tg depressions vary significantly between the 20 nm stacked PS rods and 20 nm ultrathin
PS film.
The depressed glass transition temperature of 20 nm stacked PS rods is not
affected even after multiple scans and isothermal holds at 180 °C for 6 s; it is attributed to
long time scales for chain interpenetration for a high molecular weight PS, which is
approximately 30 min based on bulk interlayer diffusion for PS of Mw = 1000 kg/mol.55
On the other hand, the time taken for the molecules to diffuse one radius of gyration (Rg
= 28 nm56) based on self-diffusion coefficient (0.8 × 10⁻¹⁵ cm2/s) at 170 °C for PS of
Texas Tech University, Madhusudhan R. Pallaka, December 2019
131
aforementioned molecular weight is approximately 2 hours.11, 55 Interestingly, thermal
annealing of the 20 nm stacked PS nanorods at 160 °C for up to 24 hours did not result in
recovery of Tg towards the bulk, which is in contrast to the behavior demonstrated by
ultrathin films,12 but is similar to what was observed in case of stacked PS thin films
where it was deemed that the time required for polymer diffusion across layers in a
stacked system is longer than that expected in case of a single ultrathin film.11 As
suggested in case of stacked PS thin films11, the recovery of depressed Tgs for 20 nm
stacked PS rods to bulk values also occurred only after a combination of compression
(10,000 psi) and thermal annealing in vacuum at 170 °C for 5 hours in a platen press. The
specific heat data before and after annealing of 20 nm stacked PS rods are shown in
Figure 6.3; the reduced Tgs seen at 0.1 and 1000 K/s clearly reverted to bulk values as
indicated by the shift in overshoots to higher temperatures after annealing in the platen
press.
6.3.2 AAO supported PS nanorods
Representative heat flow scans of PS nanorods supported in 20, 55 and 350 nm
AAO pores for various cooling rates are shown in Figures 6.4.a, 6.4.b, and 6.4.c,
respectively. Identical to the stacked PS nanorods, the AAO supported PS nanorods also
demonstrate cooling rate dependence where the enthalpy overshoots increase in area and
shift to higher temperatures with decrease in cooling rate, as expected. The main
differences that stand out when the heat flow scans of stacked PS nanorods for a given
size are compared with that of AAO supported PS nanorods are the shifts in overshoots’
peak temperatures to higher temperatures, relatively broader breadths of glass transitions,
and the shoulders or peaks that occur at either lower or higher temperature side of the
Texas Tech University, Madhusudhan R. Pallaka, December 2019
132
overshoots at slower cooling rates (q ≤ 10 K/s). The shifts of overshoots’ peak
temperatures and the broader breadth of the glass transition occur because of static and
dynamic temperature gradients43 in the AAO supported PS rods. The Tgs of 20, 55 and
350 nm AAO supported PS rods that were obtained on heating for various cooling rates
were corrected for static and dynamic temperature gradients; the Tg values as a function
of cooling rate are shown in Figure 6.5 and are compared to bulk polystyrene films.
The Tgs of 20, 55 and 350 nm AAO supported PS rods demonstrate bulk-like
behavior with the values in good agreement with the bulk polystyrene films, as shown in
Figure 6.5. When the Tgs of AAO supported PS rods are compared with their respective
stacked PS rods, a 21,10 and 3 K increase in Tg is observed for 20, 55 and 350 nm AAO
supported PS rods at 0.1 K/s cooling rate; on the other hand, a 10 K Tg increase is
observed in case of 20 nm AAO supported PS rods and insignificant changes in case of
55 and 350 nm AAO supported rods at 1000 K/s. Fragilities and activation energies of
20, 55 and 350 nm AAO supported PS rods are shown in Table 6.1; their respective
values are comparable to those of PS bulk films11-12, 45 and 350 nm stacked PS rods.
6.3.3 Low temperature endotherm in stacked and AAO supported PS nanorods
The effect of scanning to -80 °C is studied on 20 nm stacked PS rods directly on
bare chip and subsequently, with the addition of ionic liquid; heat flow scans for various
cooling rates in the range of 0.1 to 1000 K/s are shown in Figure 6.6.a. In addition to the
characteristic endotherms at the glass transition shown in Figure 6.3 and 6.6.a, a broad
low-temperature endothermic peak is observed between -50 and 100 °C. The low-
temperature endotherm increases in area as the cooling rate decreases, but unlike the
Texas Tech University, Madhusudhan R. Pallaka, December 2019
133
endotherm at Tg, it is dependent on the sample with a 34 % larger area observed for the
case of PS on a bare chip compared to PS dispersed in ionic liquid for a cooling rate of
0.1 K/s, as shown in Figures 6.6.a and 6.6.b. The sample dependent broad low-
temperature endothermic peaks were also observed in case of micronscale PS films on
different substrates where the largest area was observed for PS film on bare chip; on the
other hand, the endotherm related to Tg was constant across substrates. Cangialosi and
co-workers41-42 interpreted the presence of cooling rate dependent low temperature
endotherms as a signature of a fast-secondary relaxation in addition to the primary
relaxation at Tg; an 80 K change in fictive temperature at the 0.1 K/s was reported for 2.5
µm PtBS film where the large change in fictive temperature was attributed to the low
temperature endotherm42
The enthalpy difference associated with the low and high temperature endotherm is related
to the fictive temperature using Equation 6.5:
𝛥𝐻 = − ∫ ∆𝐶𝑝
𝑇𝑓
𝑇𝑓ˈ
𝑑𝑇 (6.5)
∆𝐶𝑝 = 0.407 − 0.0016 𝑇𝑓ˈ (6.6)
where Tfˈ is limiting fictive temperature in °C at a cooling rate of 1000 K/s and ∆𝐶𝑝 is the
temperature dependent step change in heat capacity (Equation 6.6) obtained from the
symmetry corrected 20 nm stacked PS rods data. The change in fictive temperatures for
both the samples at all cooling rates are shown in Figure 6.7 and the inset shows Tf as a
function of cooling rate. ΔTf at 0.1 K/s with the inclusion of the low temperature
endotherm is as large as ~ 85 K for 20 nm stacked PS nanorods on bare chip and as large
Texas Tech University, Madhusudhan R. Pallaka, December 2019
134
as ~65 K with the addition of ionic liquid. The ΔTfs in case of stacked PS rods are
comparatively higher than those obtained from micronscale polystyrene films on bare
chip and Krytox oil, but the dependency of ΔTfs on the substrate is similar and suggests
that the low temperature endotherms in 20 nm stacked PS nanorods are also artifacts
arising due to the residual stress between the sample and the chip membrane. In addition,
the cooling rate dependent broad-low temperature endotherms observed in case of
crystalline metals, gold and indium from studies in chapter 5 additionally proves that the
low temperature endotherm is not associated with a secondary relaxation.
On the other hand, 20 nm polystyrene nanorods supported in AAO nanopores did
not show any sign of a low temperature endotherm as seen from the heat flow scans
shown in Figure 6.8.a and the excess specific heat data shown in Figure 6.8.b. This
behavior is consistent with the fact that magnitude the low temperature endotherm
decreased when microscale polystyrene films were placed on 55 nm and 350 nm AAO
where the smallest area was observed in case of PS film on 55 nm AAO.
6.4 Discussion
The magnitude of the Tg depressions (ΔTg = Tg(h*) - Tg,bulk) for stacked PS
nanorods dispersed in ionic liquid as a function of characteristic length (h*) at 0.1 K/s are
shown in Figure 6.9. The characteristic length, h*, is equal to the volume to surface ratio
of the confinement dimensionality/geometry; it is equal to film thickness, h, for 1D
ultrathin films, d/4 for 2D nanorods/nanowires with diameter d, and d/6 for 3D
nanospheres with diameter d. The ΔTgs of 2D stacked PS nanorods are compared to 1D
ultrathin PS films12, 46, 2D PS nanowires37, and 3D PS nanospheres27, 40 along with the
modified result of Keddie and Jones for supported polystyrene films14 from Equation 6.1
Texas Tech University, Madhusudhan R. Pallaka, December 2019
135
(solid black lines), and Roth and Dutcher’s upper and lower limits3 (dashed lines) of the
data compiled from the literature in Figure 6.9. The ΔTgs for stacked PS nanorods at 0.1
K/s fall between Roth and Dutcher’s upper limit, and Keddie and Jones’ Equation 6.1 for
supported polystyrene films14, and are in good agreement with the ΔTgs of 1D ultrathin
PS films12, 46 at comparable characteristic lengths (h*). For example, the ΔTg for 55 nm
stacked PS nanorods (h* = d/4 = ~14 nm) is within ~ 3 K when compared to the ΔTg of
20 nm ultrathin polystyrene film (h* = h = ~20 nm), similar agreement is also observed
for 350 nm stacked PS rods (h*= 88 nm) and 71 nm ultrathin PS film (h*= 71 nm). The
ΔTgs of 2D PS nanowires in aqueous dispersion from Zhu and co-workers37 follow
similar non-linear size dependence as that of supported PS thin films and stacked PS
nanorods, but sit at the lower limit of Roth and Dutcher’s compiled data set from the
literature; larger ΔTgs are observed in case of 2D PS nanowires at higher h*. The
differences between characteristic length (h*) dependent ΔTgs of 2D PS nanowires and
2D stacked PS nanorods may be attributable to the difference in sample environment and
method of sample preparation; 2D PS nanowires are aqueous dispersed and are prepared
by electrospinning, whereas 2D stacked PS nanorods from our work are dispersed in
ionic liquid and are prepared by vacuum melt infiltration into AAO nanopores. The effect
of sample environment on ΔTg versus h* is also be observed in case of 3D PS nanospheres
in aqueous dispersion27 versus 3D PS nanospheres in PDMS40 where larger ΔTgs are
observed for PS nanospheres in aqueous dispersion at similar h*s; in addition, good
agreement is observed in case of aqueous dispersed 2D PS nanowires37 and 3D PS
nanospheres40 at low h*s. The characteristic length dependent ΔTgs of 1D ultrathin PS
films46-47 and 2D stacked PS nanorods are also compared to non-aqueous dispersed 3D
Texas Tech University, Madhusudhan R. Pallaka, December 2019
136
PS nanospheres40 in Figure 6.9. Even though the data pertinent to this comparison were
all obtained using Flash DSC at a cooling rate of 0.1 K/s with PS molecular weight
greater than 1000 kg/mol, the ΔTg versus h* of 3D PS nanospheres does not fit into the
trend of 1D ultrathin films and 2D stacked PS nanorods. The disagreements of ΔTgs
between different spatial dimensions, especially with 3D PS nanospheres suggest that a
simple volume/surface ratio scaling factor cannot explain the spatial dimension
dependent nanoconfinement effect on ΔTg.
In contrast to the Tg depression observed in stacked PS nanorods, AAO supported
PS rods demonstrate size-independent bulk-like behavior as shown in Figure 6.10. The
bulk-like behavior after capping nanoparticles is also observed in case of silica-capped
PS nanospheres27, where PS nanospheres, when uncapped (aqueous dispersed), exhibited
size-dependent Tg depression, and bulk-like behavior after being capped with silica; the
behavior has been attributed to the eliminated free surface post capping.27 ΔTg versus h*
behavior of AAO supported PS rods at 0.1 K/s is compared with those reported by Zhu
and co-workers37, Torkelson and co-workers31, and Xue and co-workers36 in Figure 6.10.
ΔTgs as a function of h* from this work are in good agreement with those reported by Zhu
and co-workers37 at a cooling rate of 10 K/min (0.17 K/s) and Mw = 280 kg/mol; in both
cases, the ΔTgs are ~2-3 K higher than the bulk. In case of ΔTgs reported by Torkelson
and co-workers31 at a cooling rate of 40 K/min (0.67 K/s) and Mw = 1260 kg/mol, good
agreement with our work is observed for ΔTgs at h* ≥ 15.8 nm (d ≥ 63 nm) at a
comparable cooling rate of 1 K/s, but for lower d or h*, deviations are observed. A ~ 6 K
Tg depression was reported by Torkelson and co-workers31 at h* = 6 nm (d = 24 nm);
however, Tg depressions less than 3 K were observed when the heat flow scans published
Texas Tech University, Madhusudhan R. Pallaka, December 2019
137
by Torkelson and co-workers31 were analyzed using the procedure employed in this
work. Xue and co-workers36 reported two Tgs, one depressed and one elevated, for AAO
supported PS nanorods; ΔTg versus h* shown in Figure 6.10 are for PS at Mw = 6 kg/mol.
The results contrast with those reported in this work, Zhu and co-workers37, and
Torkelson and co-workers31 which is presumably due to the low molecular weight PS (6
and 60 kg/mol) used in Xue and co-workers’ study.36
6.5 Conclusions
The glass transition behavior of AAO supported and stacked 2D polystyrene
nanorods was studied using the Flash DSC at cooling rates spanning four decades. The
glass transition temperatures of 20 and 55 nm stacked PS nanorods were found to depressed
by 20.1 ± 2.2 and 8.8 ± 0.7 K when compared to the bulk, respectively. In addition, a Tg
depression of 10 K was also observed at 1000 K/s, in contrast to 20 nm ultrathin films
where no Tg depression was observed at high rates8. The effect of spatial dimensionality
on the Tg depression was observed, with the magnitude of Tg depression for 20 nm stacked
PS rods being ~ 8 K higher than that of the 20 nm ultrathin PS film. Importantly, when the
ΔTgs of 2D stacked PS nanorods were compared with 1D PS thin films and 3D PS
nanospheres as a function of volume to surface ratio, 1D PS thin films and 2D stacked PS
nanorods demonstrated good agreement, and fell within the literature data compiled by
Roth and Dutcher3. The disagreement with 3D PS nanospheres suggests that the effect of
spatial dimensionality is more complex than a simple volume to surface scaling. In case of
AAO supported PS nanorods, bulk-like behavior was observed independent of size, which
contrasts with stacked PS nanorods without AAO support. The behavior is comparable to
silica-capped 3D PS nanospheres versus aqueous dispersed PS nanospheres27 and PS
Texas Tech University, Madhusudhan R. Pallaka, December 2019
138
nanowires in AAO versus aqueous dispersed nanowires37, where similar bulk-like behavior
was observed after capping. Also, bulk-like behavior was observed in AAO supported PS
rods was also observed in other studies30-31, 37 at comparable molecular weights. Also, it is
recommended to exercise caution while performing measurements at ultra-low
temperatures due to the occurrence of broad low-temperature endotherms similar to those
observed in this study and previous studies41-42. The low temperature endotherms are
artifacts and not a signature of secondary relaxation because of their irreproducible
behavior and presence in crystalline metals.
Texas Tech University, Madhusudhan R. Pallaka, December 2019
139
References
1. Alcoutlabi, M.; McKenna, G. B., Effects of confinement on material behaviour at
the nanometre size scale. J. Phys.: Condens. Matter 2005, 17 (15), R461.
2. McKenna, G. B.; Simon, S. L., 50th Anniversary Perspective: Challenges in the
dynamics and kinetics of glass-forming polymers. Macromolecules 2017, 50 (17),
6333-6361.
3. Roth, C. B.; Dutcher, J. R., Glass transition and chain mobility in thin polymer
films. J. Electroanal. Chem. 2005, 584 (1), 13-22.
4. Napolitano, S.; Glynos, E.; Tito, N. B., Glass transition of polymers in bulk,
confined geometries, and near interfaces. Rep. Prog. Phys. 2017, 80 (3), 036602.
5. Ediger, M.; Forrest, J., Dynamics near free surfaces and the glass transition in thin
polymer films: a view to the future. Macromolecules 2013, 47 (2), 471-478.
6. Richert, R., Dynamics of nanoconfined supercooled liquids. Annu. Rev. Phys.
Chem. 2011, 62, 65-84.
7. Roth, C. B.; McNerny, K. L.; Jager, W. F.; Torkelson, J. M., Eliminating the
enhanced mobility at the free surface of polystyrene: fluorescence studies of the
glass transition temperature in thin bilayer films of immiscible polymers.
Macromolecules 2007, 40 (7), 2568-2574.
8. Forrest, J.; Dalnoki-Veress, K.; Dutcher, J., Interface and chain confinement effects
on the glass transition temperature of thin polymer films. Physical Review E 1997,
56 (5), 5705.
9. Forrest, J. A.; Dalnoki-Veress, K., The glass transition in thin polymer films. Adv.
Colloid Interface Sci. 2001, 94 (1-3), 167-195.
10. Forrest, J.; Dalnoki-Veress, K.; Stevens, J.; Dutcher, J., Effect of free surfaces on
the glass transition temperature of thin polymer films. Phys. Rev. Lett. 1996, 77
(10), 2002.
11. Koh, Y. P.; McKenna, G. B.; Simon, S. L., Calorimetric glass transition
temperature and absolute heat capacity of polystyrene ultrathin films. Journal of
Polymer Science Part B-Polymer Physics 2006, 44 (24), 3518-3527.
12. Gao, S.Y.; Koh, Y. P.; Simon, S. L., Calorimetric Glass Transition of Single
Polystyrene Ultrathin Films. Macromolecules 2013, 46 (2), 562-570.
13. Keddie, J. L.; Jones, R. A.; Cory, R. A., Size-dependent depression of the glass
transition temperature in polymer films. EPL (Europhysics Letters) 1994, 27 (1),
59.
Texas Tech University, Madhusudhan R. Pallaka, December 2019
140
14. Keddie, J.; Jones, R., Glass Transition Behavior in Ultra‐Thin Polystyrene Films.
Isr. J. Chem. 1995, 35 (1), 21-26.
15. Pye, J. E.; Roth, C. B., Above, below, and in‐between the two glass transitions of
ultrathin free‐standing polystyrene films: Thermal expansion coefficient and
physical aging. J. Polym. Sci., Part B: Polym. Phys. 2015, 53 (1), 64-75.
16. Pye, J. E.; Roth, C. B., Two simultaneous mechanisms causing glass transition
temperature reductions in high molecular weight freestanding polymer films as
measured by transmission ellipsometry. Phys. Rev. Lett. 2011, 107 (23), 235701.
17. Yin, H.; Cangialosi, D.; Schönhals, A., Glass transition and segmental dynamics in
thin supported polystyrene films: the role of molecular weight and annealing.
Thermochim. Acta 2013, 566, 186-192.
18. Boucher, V. M.; Cangialosi, D.; Yin, H.; Schönhals, A.; Alegría, A.; Colmenero,
J., T g depression and invariant segmental dynamics in polystyrene thin films. Soft
Matter 2012, 8 (19), 5119-5122.
19. Tress, M.; Erber, M.; Mapesa, E. U.; Huth, H.; Muller, J.; Serghei, A.; Schick, C.;
Eichhorn, K.-J.; Voit, B.; Kremer, F., Glassy dynamics and glass transition in
nanometric thin layers of polystyrene. Macromolecules 2010, 43 (23), 9937-9944.
20. O'Connell, P. A.; Hutcheson, S. A.; McKenna, G. B., Creep behavior of ultra‐thin
polymer films. J. Polym. Sci., Part B: Polym. Phys. 2008, 46 (18), 1952-1965.
21. Yoon, H.; McKenna, G. B., Substrate effects on glass transition and free surface
viscoelasticity of ultrathin polystyrene films. Macromolecules 2014, 47 (24), 8808-
8818.
22. Wang, J.; McKenna, G. B., Viscoelastic and glass transition properties of ultrathin
polystyrene films by dewetting from liquid glycerol. Macromolecules 2013, 46 (6),
2485-2495.
23. Yang, Z.; Fujii, Y.; Lee, F. K.; Lam, C.-H.; Tsui, O. K., Glass transition dynamics
and surface layer mobility in unentangled polystyrene films. Science 2010, 328
(5986), 1676-1679.
24. DeMaggio, G.; Frieze, W.; Gidley, D.; Zhu, M.; Hristov, H.; Yee, A., Interface and
surface effects on the glass transition in thin polystyrene films. Phys. Rev. Lett.
1997, 78 (8), 1524.
25. Fukao, K.; Miyamoto, Y., Glass transitions and dynamics in thin polymer films:
dielectric relaxation of thin films of polystyrene. Physical Review E 2000, 61 (2),
1743.
Texas Tech University, Madhusudhan R. Pallaka, December 2019
141
26. Kim, G.; Libera, M., Morphological development in solvent-cast polystyrene−
polybutadiene− polystyrene (SBS) triblock copolymer thin films. Macromolecules
1998, 31 (8), 2569-2577.
27. Zhang, C.; Guo, Y.; Priestley, R. D., Glass transition temperature of polymer
nanoparticles under soft and hard confinement. Macromolecules 2011, 44 (10),
4001-4006.
28. Shamim, N.; Koh, Y. P.; Simon, S. L.; McKenna, G. B., Glass transition
temperature of thin polycarbonate films measured by flash differential scanning
calorimetry. J. Polym. Sci., Part B: Polym. Phys. 2014, 52 (22), 1462-1468.
29. Alexandris, S.; Papadopoulos, P.; Sakellariou, G.; Steinhart, M.; Butt, H.-J. r.;
Floudas, G., Interfacial Energy and Glass Temperature of Polymers Confined to
Nanoporous Alumina. Macromolecules 2016, 49 (19), 7400-7414.
30. Tan, A. W.; Torkelson, J. M., Poly (methyl methacrylate) nanotubes in AAO
templates: Designing nanotube thickness and characterizing the T g-confinement
effect by DSC. Polymer 2016, 82, 327-336.
31. Askar, S.; Wei, T.; Tan, A. W.; Torkelson, J. M., Molecular weight dependence of
the intrinsic size effect on T g in AAO template-supported polymer nanorods: A
DSC study. The Journal of Chemical Physics 2017, 146 (20), 203323.
32. Lyulin, A. V.; Balabaev, N. K.; Baljon, A. R.; Mendoza, G.; Frank, C. W.; Yoon,
D. Y., Interfacial and topological effects on the glass transition in free-standing
polystyrene films. The Journal of Chemical Physics 2017, 146 (20), 203314.
33. Zhang, C.; Boucher, V. M.; Cangialosi, D.; Priestley, R. D., Mobility and glass
transition temperature of polymer nanospheres. Polymer 2013, 54 (1), 230-235.
34. Koh, Y. P.; Simon, S. L., Structural Relaxation of Stacked Ultrathin Polystyrene
Films. Journal of Polymer Science Part B-Polymer Physics 2008, 46 (24), 2741-
2753.
35. Ediger, M. D.; Yu, L., Polymer glasses: From gas to nanoglobular glass. Nature
materials 2012, 11 (4), 267-268.
36. Teng, C.; Li, L.; Wang, Y.; Wang, R.; Chen, W.; Wang, X.; Xue, G., How thermal
stress alters the confinement of polymers vitrificated in nanopores. The Journal of
Chemical Physics 2017, 146 (20), 203319.
37. Wei, W.; Feng, S.; Zhou, Q.; Liang, H.; Long, Y.; Wu, Q.; Gao, H.; Liang, G.; Zhu,
F., Study on glass transition and physical aging of polystyrene nanowires by
differential scanning calorimetry. Journal of Polymer Research 2017, 24 (3), 38.
38. Xue, G.; Teng, C.; Xu, J.; Li, L. In Dramatic alteration of Tg of polystyrene
confined in cylindrical nanopores, APS Meeting Abstracts, 2014; p 19006.
Texas Tech University, Madhusudhan R. Pallaka, December 2019
142
39. Pallaka, M. R.; Unruh, D. K.; Simon, S. L., Melting behavior of n-alkanes in anodic
aluminum oxide (AAO) nanopores using Flash differential scanning calorimetry.
Thermochim. Acta 2018, 663, 157-164.
40. Perez-de-Eulate, N. G.; Di Lisio, V.; Cangialosi, D., Glass Transition and
Molecular Dynamics in Polystyrene Nanospheres by Fast Scanning Calorimetry.
ACS Macro Letters 2017, 6, 859-863.
41. Monnier, X.; Cangialosi, D., Effect of molecular weight on vitrification kinetics
and molecular mobility of a polymer glass confined at the microscale. Thermochim.
Acta 2019, 677, 60-66.
42. Monnier, X.; Cangialosi, D., Thermodynamic ultrastability of a polymer glass
confined at the micrometer length scale. Phys. Rev. Lett. 2018, 121 (13), 137801.
43. Schawe, J. E., Measurement of the thermal glass transition of polystyrene in a
cooling rate range of more than six decades. Thermochim. Acta 2015, 603, 128-
134.
44. Cebe, P.; Partlow, B. P.; Kaplan, D. L.; Wurm, A.; Zhuravlev, E.; Schick, C., Using
flash DSC for determining the liquid state heat capacity of silk fibroin.
Thermochim. Acta 2015, 615, 8-14.
45. Lopez, E.; Simon, S. L., Signatures of structural recovery in polystyrene by
nanocalorimetry. Macromolecules 2016, 49 (6), 2365-2374.
46. Koh, Y. P.; Simon, S. L., The glass transition and enthalpy recovery of a single
polystyrene ultrathin film using Flash DSC. The Journal of Chemical Physics 2017,
146 (20), 203329.
47. Koh, Y. P.; Simon, S. L., Enthalpy recovery of polystyrene: does a long-term aging
plateau exist? Macromolecules 2013, 46 (14), 5815-5821.
48. Gao, S.; Simon, S. L., Measurement of the limiting fictive temperature over five
decades of cooling and heating rates. Thermochim. Acta 2015, 603, 123-127.
49. Perez-de-Eulate, N. G.; Di Lisio, V.; Cangialosi, D., Glass Transition and
Molecular Dynamics in Polystyrene Nanospheres by Fast Scanning Calorimetry.
ACS Macro Letters 2017, 6 (8), 859-863.
50. Williams, M. L.; Landel, R. F.; Ferry, J. D., The temperature dependence of
relaxation mechanisms in amorphous polymers and other glass-forming liquids. J.
Am. Chem. Soc. 1955, 77 (14), 3701-3707.
51. Koh, Y. P.; Simon, S. L., Enthalpy recovery of ultrathin polystyrene film using
Flash DSC. Polymer 2018, 143, 40-45.
Texas Tech University, Madhusudhan R. Pallaka, December 2019
143
52. Koh, Y. P.; Gao, S.; Simon, S. L., Structural recovery of a single polystyrene thin
film using Flash DSC at low aging temperatures. Polymer 2016, 96, 182-187.
53. Grassia, L.; Koh, Y. P.; Rosa, M.; Simon, S. L., Complete set of enthalpy recovery
data using Flash DSC: experiment and modeling. Macromolecules 2018, 51 (4),
1549-1558.
54. Koh, Y. P.; Grassia, L.; Simon, S. L., Structural recovery of a single polystyrene
thin film using nanocalorimetry to extend the aging time and temperature range.
Thermochim. Acta 2015, 603, 135-141.
55. Whitlow, S. J.; Wool, R. P., Diffusion of polymers at interfaces: a secondary ion
mass spectroscopy study. Macromolecules 1991, 24 (22), 5926-5938.
56. Rubinstein, M.; Colby, R. H., Polymer physics. Oxford university press New York:
2003; Vol. 23.
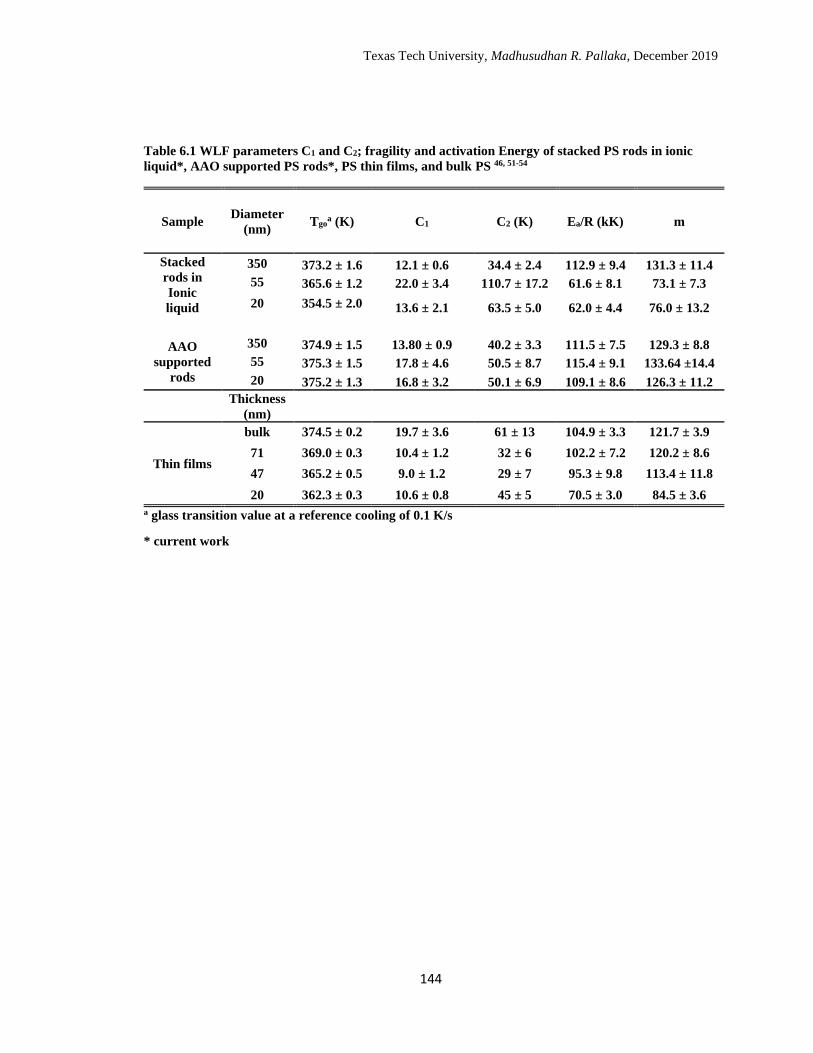
Texas Tech University, Madhusudhan R. Pallaka, December 2019
144
Table 6.1 WLF parameters C1 and C2; fragility and activation Energy of stacked PS rods in ionic
liquid*, AAO supported PS rods*, PS thin films, and bulk PS 46, 51-54
Sample Diameter
(nm) Tgo
a (K) C1 C2 (K) Ea/R (kK) m
Stacked
rods in
Ionic
liquid
350 373.2 ± 1.6 12.1 ± 0.6 34.4 ± 2.4 112.9 ± 9.4 131.3 ± 11.4
55 365.6 ± 1.2 22.0 ± 3.4 110.7 ± 17.2 61.6 ± 8.1 73.1 ± 7.3
20 354.5 ± 2.0 13.6 ± 2.1 63.5 ± 5.0 62.0 ± 4.4 76.0 ± 13.2
AAO
supported
rods
350 374.9 ± 1.5 13.80 ± 0.9 40.2 ± 3.3 111.5 ± 7.5 129.3 ± 8.8
55 375.3 ± 1.5 17.8 ± 4.6 50.5 ± 8.7 115.4 ± 9.1 133.64 ±14.4
20 375.2 ± 1.3 16.8 ± 3.2 50.1 ± 6.9 109.1 ± 8.6 126.3 ± 11.2
Thickness
(nm)
Thin films
bulk 374.5 ± 0.2 19.7 ± 3.6 61 ± 13 104.9 ± 3.3 121.7 ± 3.9
71 369.0 ± 0.3 10.4 ± 1.2 32 ± 6 102.2 ± 7.2 120.2 ± 8.6
47 365.2 ± 0.5 9.0 ± 1.2 29 ± 7 95.3 ± 9.8 113.4 ± 11.8
20 362.3 ± 0.3 10.6 ± 0.8 45 ± 5 70.5 ± 3.0 84.5 ± 3.6
a glass transition value at a reference cooling of 0.1 K/s
* current work
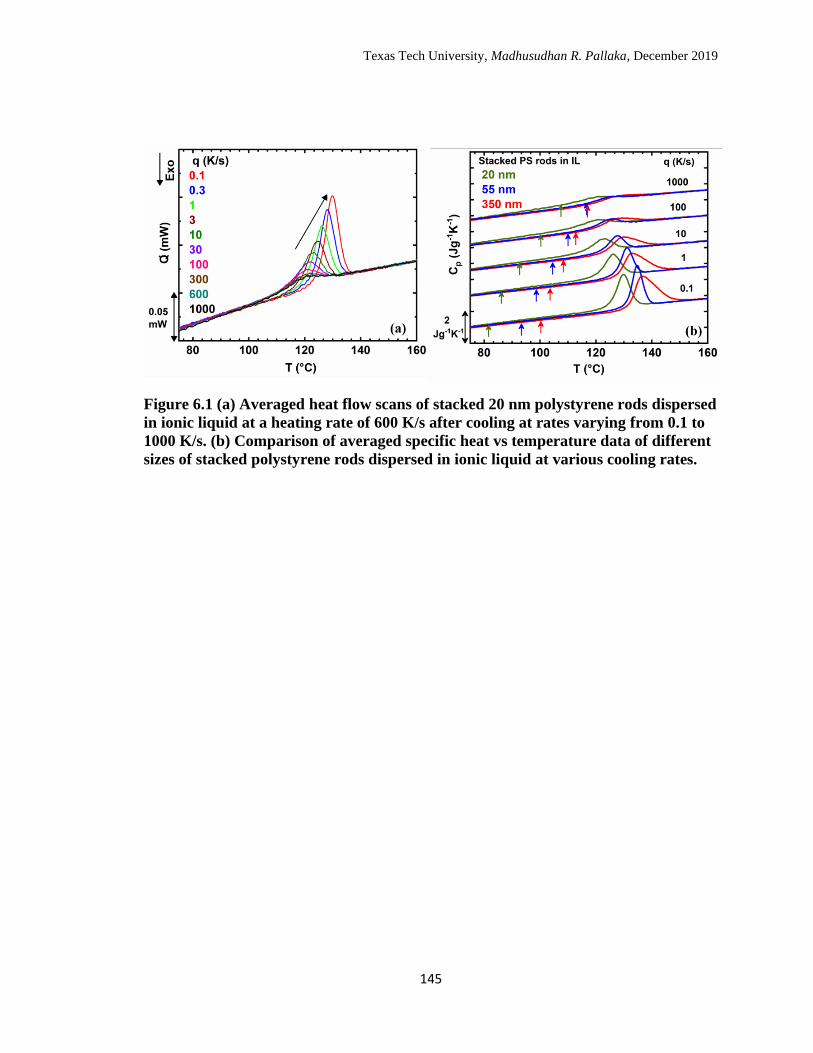
Texas Tech University, Madhusudhan R. Pallaka, December 2019
145
Figure 6.1 (a) Averaged heat flow scans of stacked 20 nm polystyrene rods dispersed
in ionic liquid at a heating rate of 600 K/s after cooling at rates varying from 0.1 to
1000 K/s. (b) Comparison of averaged specific heat vs temperature data of different
sizes of stacked polystyrene rods dispersed in ionic liquid at various cooling rates.
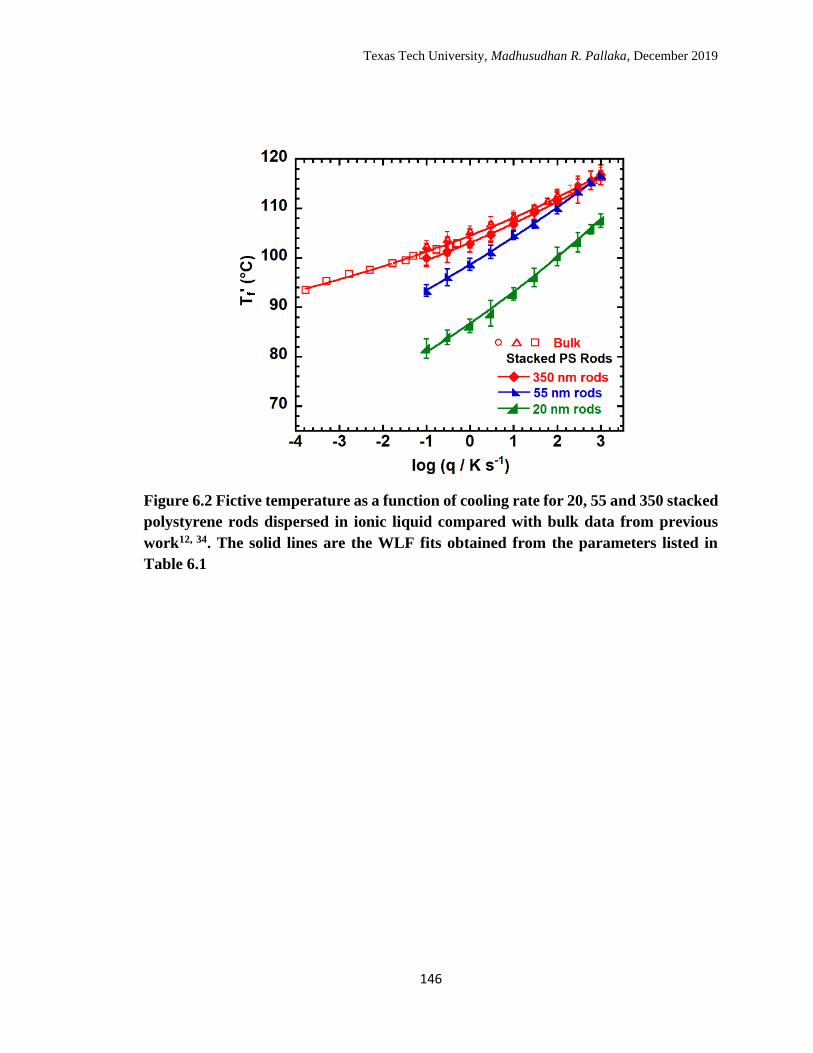
Texas Tech University, Madhusudhan R. Pallaka, December 2019
146
Figure 6.2 Fictive temperature as a function of cooling rate for 20, 55 and 350 stacked
polystyrene rods dispersed in ionic liquid compared with bulk data from previous
work12, 34. The solid lines are the WLF fits obtained from the parameters listed in
Table 6.1
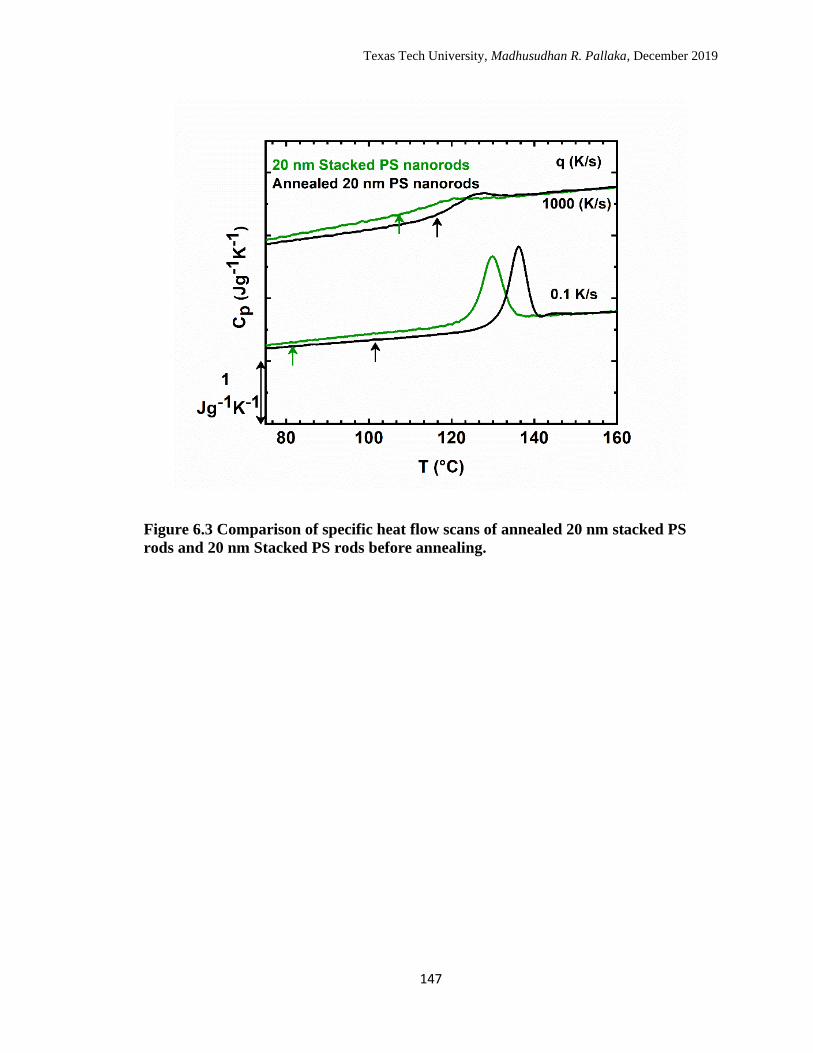
Texas Tech University, Madhusudhan R. Pallaka, December 2019
147
Figure 6.3 Comparison of specific heat flow scans of annealed 20 nm stacked PS
rods and 20 nm Stacked PS rods before annealing.
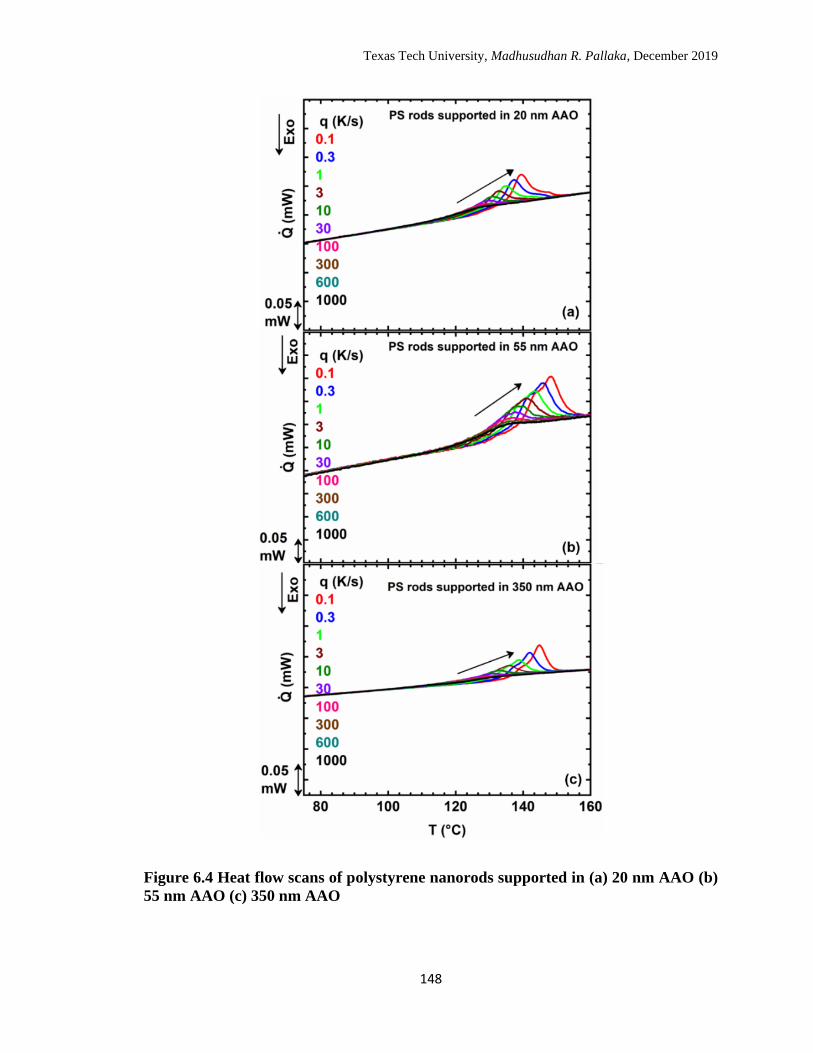
Texas Tech University, Madhusudhan R. Pallaka, December 2019
148
Figure 6.4 Heat flow scans of polystyrene nanorods supported in (a) 20 nm AAO (b)
55 nm AAO (c) 350 nm AAO
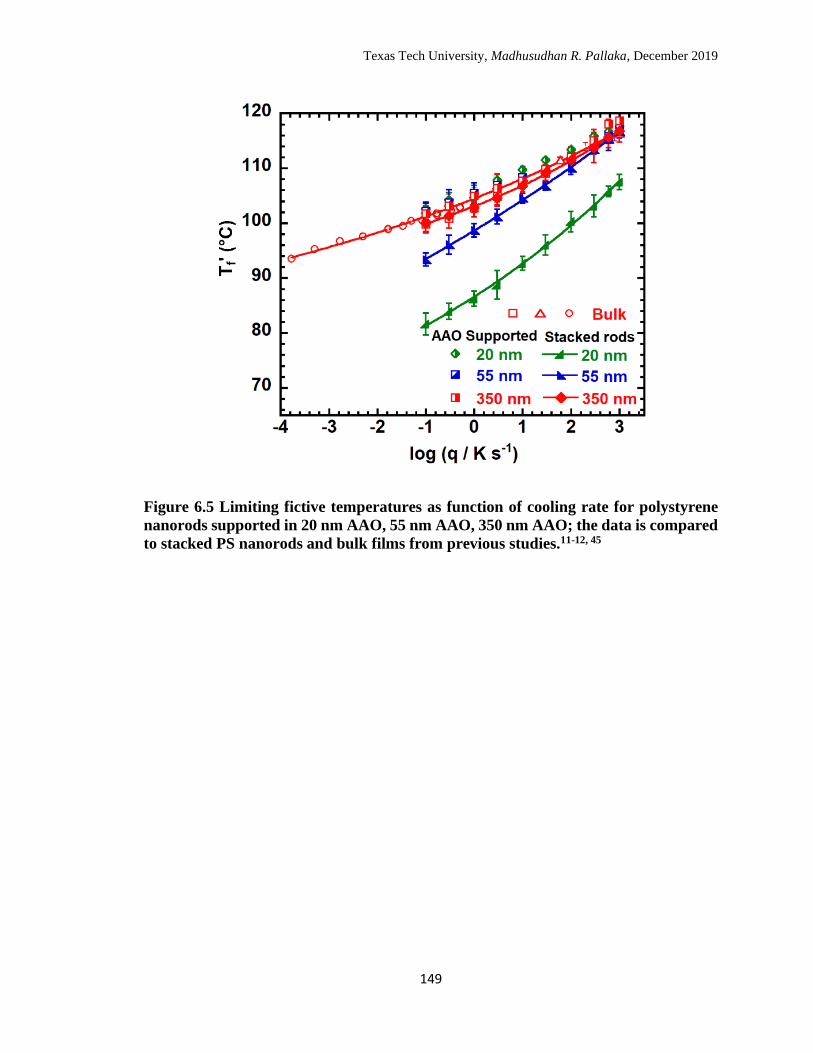
Texas Tech University, Madhusudhan R. Pallaka, December 2019
149
Figure 6.5 Limiting fictive temperatures as function of cooling rate for polystyrene
nanorods supported in 20 nm AAO, 55 nm AAO, 350 nm AAO; the data is compared
to stacked PS nanorods and bulk films from previous studies.11-12, 45
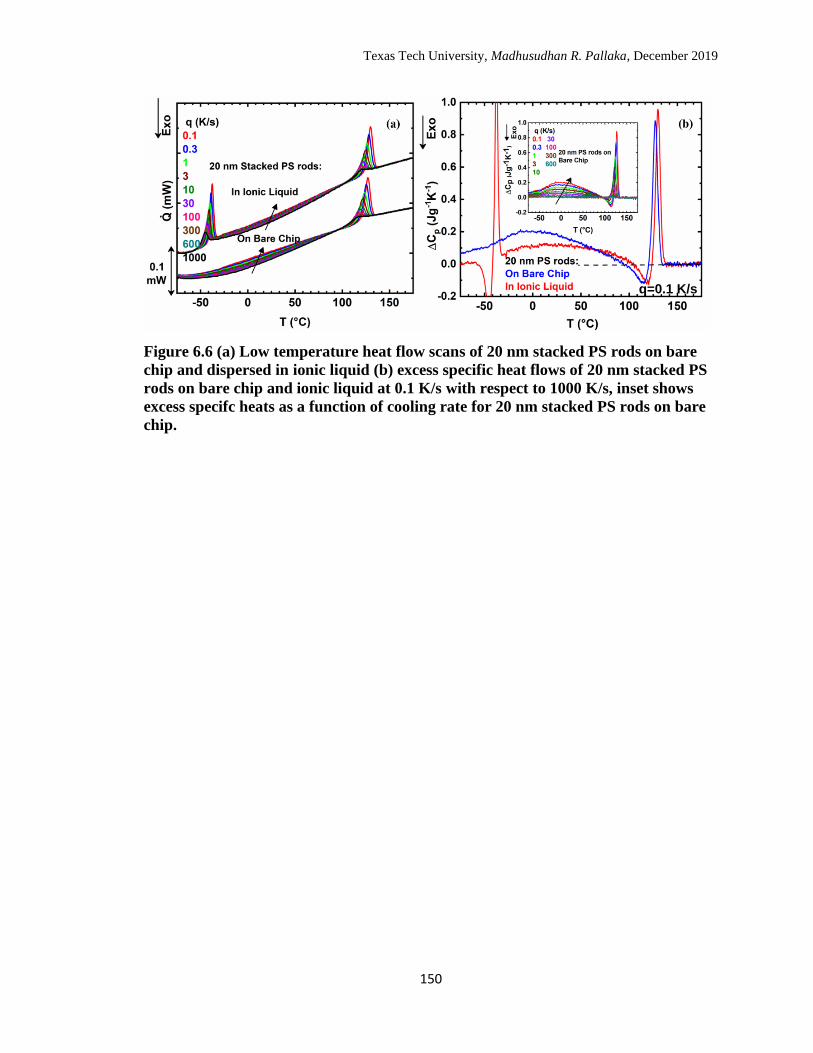
Texas Tech University, Madhusudhan R. Pallaka, December 2019
150
Figure 6.6 (a) Low temperature heat flow scans of 20 nm stacked PS rods on bare
chip and dispersed in ionic liquid (b) excess specific heat flows of 20 nm stacked PS
rods on bare chip and ionic liquid at 0.1 K/s with respect to 1000 K/s, inset shows
excess specifc heats as a function of cooling rate for 20 nm stacked PS rods on bare
chip.
q=0.1 K/s
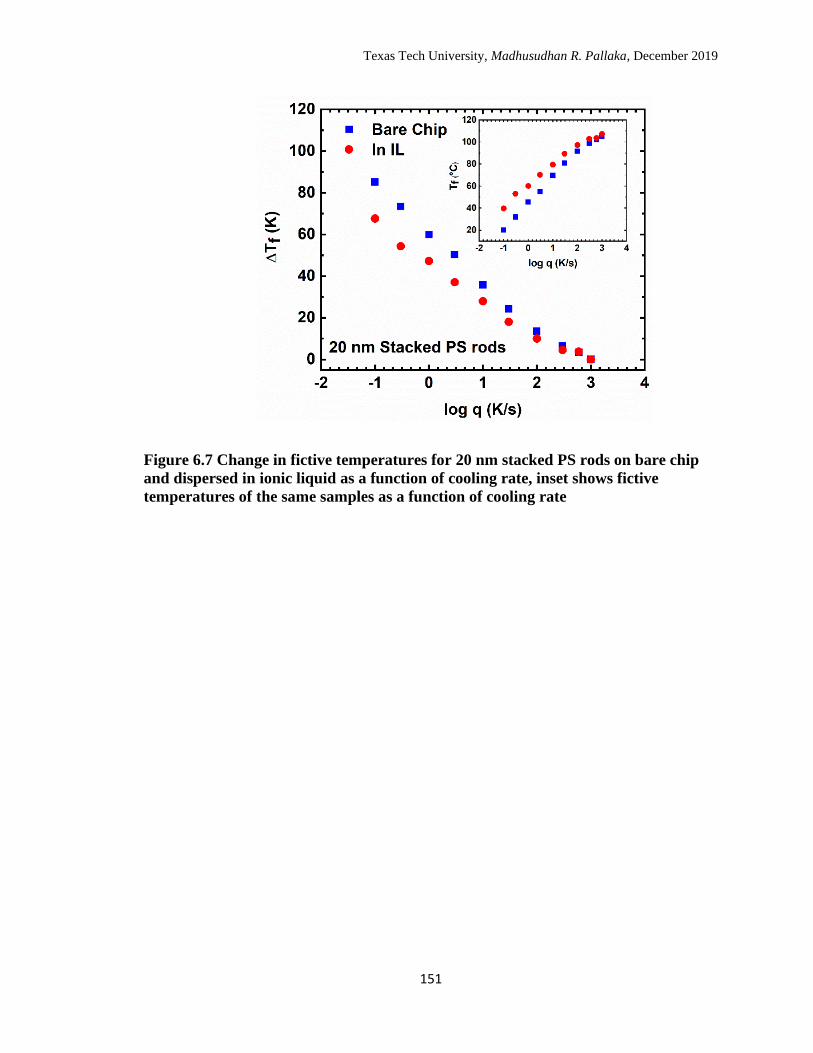
Texas Tech University, Madhusudhan R. Pallaka, December 2019
151
Figure 6.7 Change in fictive temperatures for 20 nm stacked PS rods on bare chip
and dispersed in ionic liquid as a function of cooling rate, inset shows fictive
temperatures of the same samples as a function of cooling rate
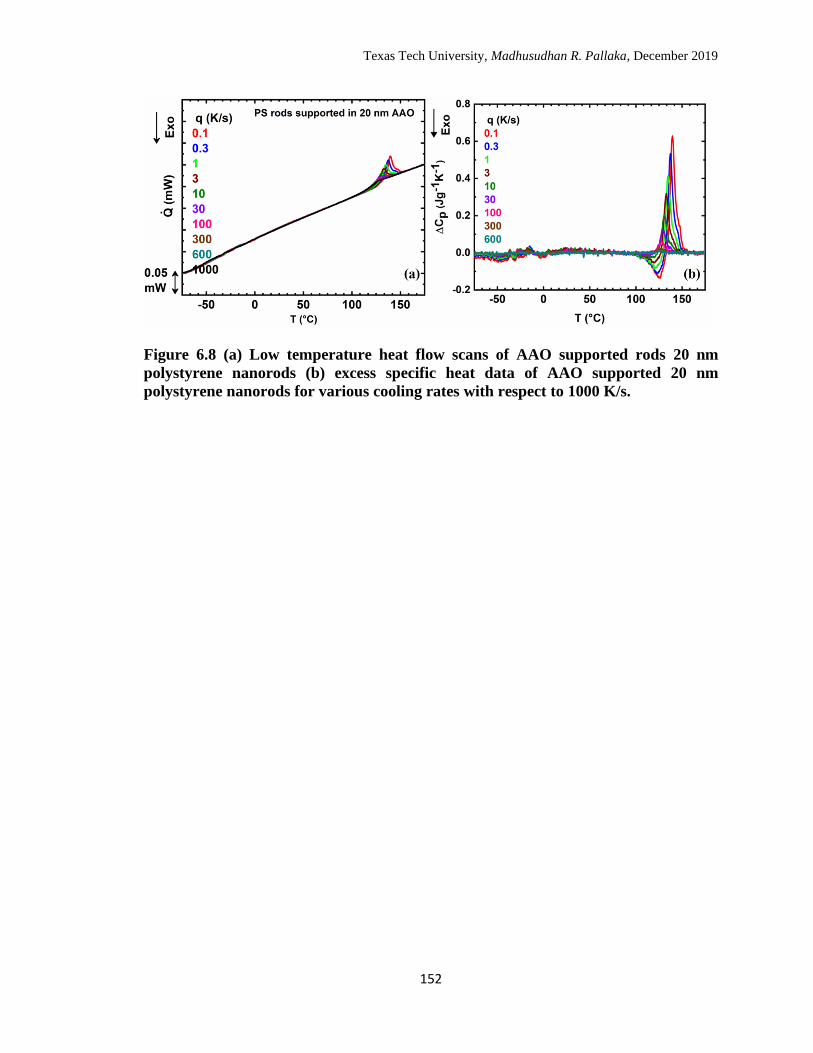
Texas Tech University, Madhusudhan R. Pallaka, December 2019
152
Figure 6.8 (a) Low temperature heat flow scans of AAO supported rods 20 nm
polystyrene nanorods (b) excess specific heat data of AAO supported 20 nm
polystyrene nanorods for various cooling rates with respect to 1000 K/s.
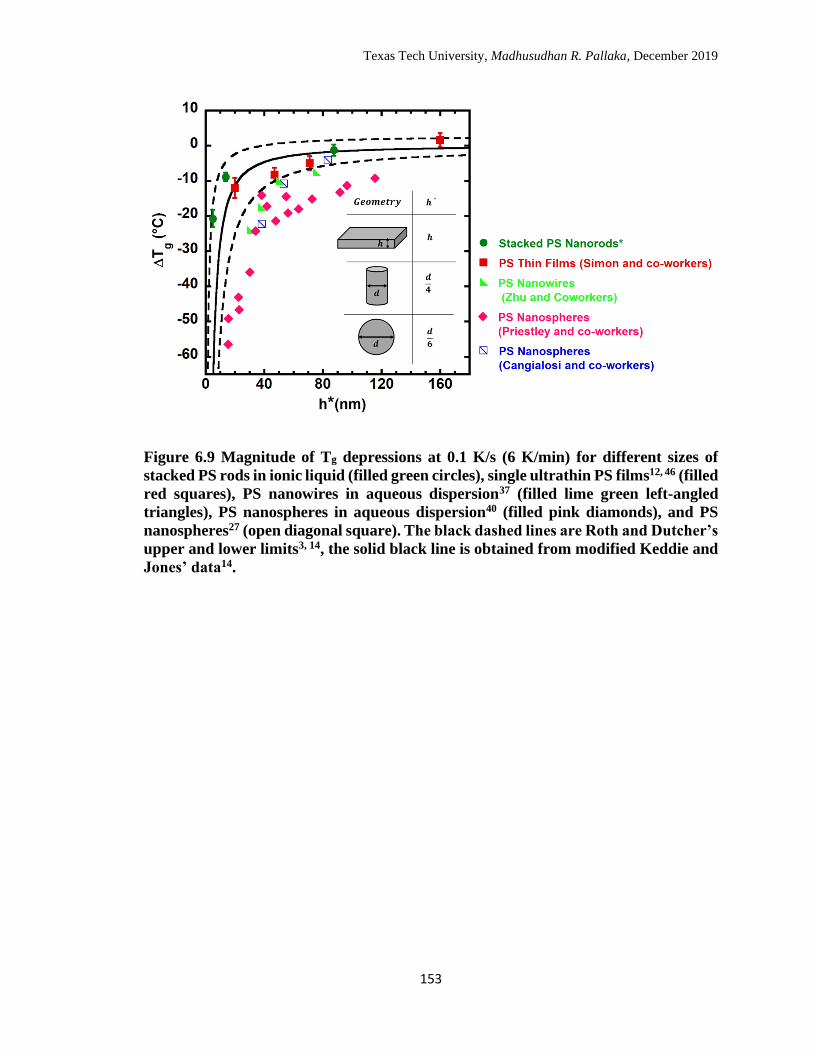
Texas Tech University, Madhusudhan R. Pallaka, December 2019
153
Figure 6.9 Magnitude of Tg depressions at 0.1 K/s (6 K/min) for different sizes of
stacked PS rods in ionic liquid (filled green circles), single ultrathin PS films12, 46 (filled
red squares), PS nanowires in aqueous dispersion37 (filled lime green left-angled
triangles), PS nanospheres in aqueous dispersion40 (filled pink diamonds), and PS
nanospheres27 (open diagonal square). The black dashed lines are Roth and Dutcher’s
upper and lower limits3, 14, the solid black line is obtained from modified Keddie and
Jones’ data14.
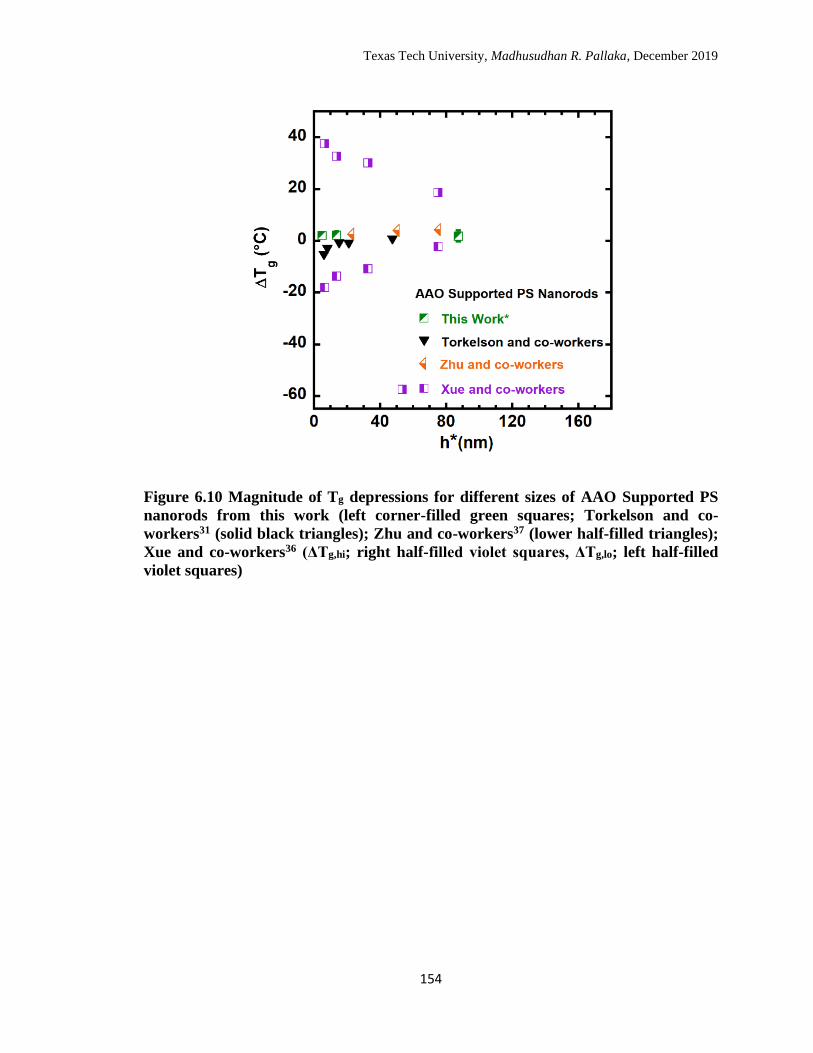
Texas Tech University, Madhusudhan R. Pallaka, December 2019
154
Figure 6.10 Magnitude of Tg depressions for different sizes of AAO Supported PS
nanorods from this work (left corner-filled green squares; Torkelson and co-
workers31 (solid black triangles); Zhu and co-workers37 (lower half-filled triangles);
Xue and co-workers36 (ΔTg,hi; right half-filled violet squares, ΔTg,lo; left half-filled
violet squares)
Texas Tech University, Madhusudhan R. Pallaka, December 2019
155
CHAPTER 7
ENTHALPY RECOVERY OF 2D STACKED POLYSTYRENE
NANORODS USING FLASH DIFFERENTIAL SCANNING
CALORIMETRY
7.1 Introduction
Polymeric glasses are nonequilibrium materials whose thermodynamic properties
spontaneously evolve towards equilibrium as a function of time via a process termed as
structural recovery. Structural recovery can either be volume recovery or enthalpy
recovery depending on the thermodynamic quantity that is being measured. Structural
recovery of polystyrene (PS) under nanoconfinement has been a topic of significant
interest for the past 25 years. In our group, extensive studies were performed on the
enthalpy recovery of 1D stacked1 and ultrathin PS films2-6 using conventional and Flash
differential scanning calorimetry, respectively. In the case of 1D stacked PS films, the
overall rate of enthalpy recovery was reported to be similar to that of the bulk when
compared at aging temperatures which are at similar distances from their respective glass
transition temperatures (Tg), but accelerated enthalpy recovery was observed when
compared at same aging temperatures.1 In case of ultrathin PS films, enthalpy recovery of
single 20 nm ultrathin film was studied on the Flash DSC2, 4 which has advantages
including handling nanogram samples, sensitivity to aging times as short as 0.01 s, and
ability to access higher aging temperatures of Tg + 15 °C for the high fictive-temperature
glass created by cooling at very high rates (1000 K/s); more importantly, the overall rate
of enthalpy recovery in the glassy state for a single 20 nm thick ultra-thin polystyrene
film was found to be faster when compared to 1.1 µm thick film (bulk).2, 4, 6 Boucher and
co-workers also reported enhanced enthalpy recovery in case of stacked PS films when
Texas Tech University, Madhusudhan R. Pallaka, December 2019
156
compared to the bulk, but these comparisons were made at same aging temperatures
rather than at same jump size from Tg.7 On the other hand, reduced structural recovery
rates were reported by Pye and Roth for volume recovery studies on 30 nm ultrathin PS
film8, and by Frieberg, Glynos, and Green for experiments performed as a function of
aging temperature on linear and star-shaped PS thin films9.
Recently, there has been a growing interest in the influence of spatial
dimensionality/geometry of nanoconfinement on the structural recovery of polystyrene.
Zhu and co-workers studied enthalpy recovery of aqueous-dispersed and AAO-supported
2D PS nanowires10, where the rate of enthalpy recovery below Tg was found to be reduced
in both systems when compared to the bulk.10 Priestley and co-workers investigated the
enthalpy relaxation of aqueous dispersed and silica-capped 3D PS nanospheres, where they
found accelerated enthalpy recovery rates in case of aqueous dispersed PS nanospheres,
and reduced rates in case of silica-capped PS nanospheres;11Cangialosi and co-workers
also reported enhanced enthalpy recovery rates in case of 3D PS nanospheres dispersed in
poly(dimethyl siloxane)12. In this study, one of our objectives is to investigate the enthalpy
recovery of 20 and 350 nm stacked PS nanorods dispersed in ionic liquid using Flash
differential scanning calorimetry as a function of aging temperature and aging time. For
this same system, we previously studied the glass transition behavior, finding a Tg
depression of ~ 20 K for 20 nm stacked PS nanorods and bulk-like behavior for 350 nm
stacked PS nanorods, both dispersed in ionic liquid. The enthalpy recovery results from
stacked PS nanorods will be compared with our group’s previous studies on 1D 20 nm
ultrathin PS film, as well as with literature results for other nanoconfinement geometries.
Texas Tech University, Madhusudhan R. Pallaka, December 2019
157
In the majority of the studies on structural recovery of polystyrene, the recovery
towards equilibrium has been reported to be monotonic in both bulk and nanoscale.1-7, 11,
13 However, Cangialosi and co-workers reported a two-step structural recovery towards
equilibrium, in case of 1D stacked PS thin films14-16 and 3D PS nanospheres12. The two
steps have been related to a fast equilibration mechanism with a weak Arrhenius-like
temperature dependence, and the usual slow equilibration mechanism with a super
Arrhenius behavior.12, 14-17 The faster mechanism is related to the presence of a broad low
temperature endotherm at lower than usual aging temperatures for nanoconfined PS.12, 14-
15 These broad low-temperature endotherms ranging from -80 to 100 °C were also
observed in our recent studies for micronscale PS films on various substrates, and for
stacked PS nanorods, as well as for metallic samples with no relaxation mechanisms in
the temperature range of the endotherm. We attribute the low temperature endotherm as
an artifact due its inconsistent area (6 to 28 J/g, aging at 20.5 °C for 8 hours) for bulk PS
films on different substrates, and due to its presence for crystalline metals, gold and
indium. Thus, in addition to examining the kinetics of structural recovery of 2D stacked
PS nanorods, we also examine the implication of our findings on the existence of double
mechanism of structural recovery and its relationship with the low temperature
endotherms with 20 nm stacked PS nanorods on the Flash DSC.
7.2 Experimental
7.2.1 Methodology
Flash Differential Scanning Calorimetry
The enthalpy recovery studies on separated PS nanorods were performed using a
Mettler Toledo Flash DSC 1 equipped with a Freon intercooler and a 20 ml/min nitrogen
Texas Tech University, Madhusudhan R. Pallaka, December 2019
158
gas purge. The steady state cooler temperature was set to -100 °C, and the Flash DSC
chips were conditioned and corrected according to the manufacturer’s recommendation.
The temperature of the chip was calibrated using the onset melting temperature of
phenanthrene (Tm = 98.4 °C), and an isothermal correction factor of 0.5 K was used, as
reported in previous studies2, 4-5. The fictive temperatures on heating were also corrected
for static and dynamic temperature gradients following a method suggested by Schawe et
al.18
The separated PS nanorods were transferred onto the heating area of the chip with
the help of a hair. To ensure good contact with the heating area and to get a consistent
signal, the stacked nanorods were heated and cooled between 30 °C and 190 °C at 600
K/s for a total of 10 cycles. A symmetry correction19-20 was performed for 600 K/s
cooling and heating scans to account for heat losses and the addenda heat capacity of the
empty chip. The sample mass of the nanorods was obtained by dividing the symmetry
corrected measured heat flow of the nanorods with the glassy specific heat capacity of
polystyrene. The sample masses for 20 and 350 nm stacked PS nanorods are 145 and 350
ng, respectively. After preliminary measurements on bare stacked PS nanorods, [C7C1im]
[NTf2] ionic liquid was added for better thermal contact; no plasticization was observed,
but a slight increase (~2 K) in Tg was observed when compared to the bare nanorods.
Enthalpy recovery experiments were performed on stacked PS nanorods dispersed
in ionic liquid with two different end temperatures, 30 and -80 °C, respectively. The
enthalpy recovery experiments scanning to 30 °C are similar to those on thin films
previously studied in our group and were performed at various aging temperatures
between 50.5 and 110.5 °C for aging times (ta) ranging from 0.01 to 86400 s (24 hours) at
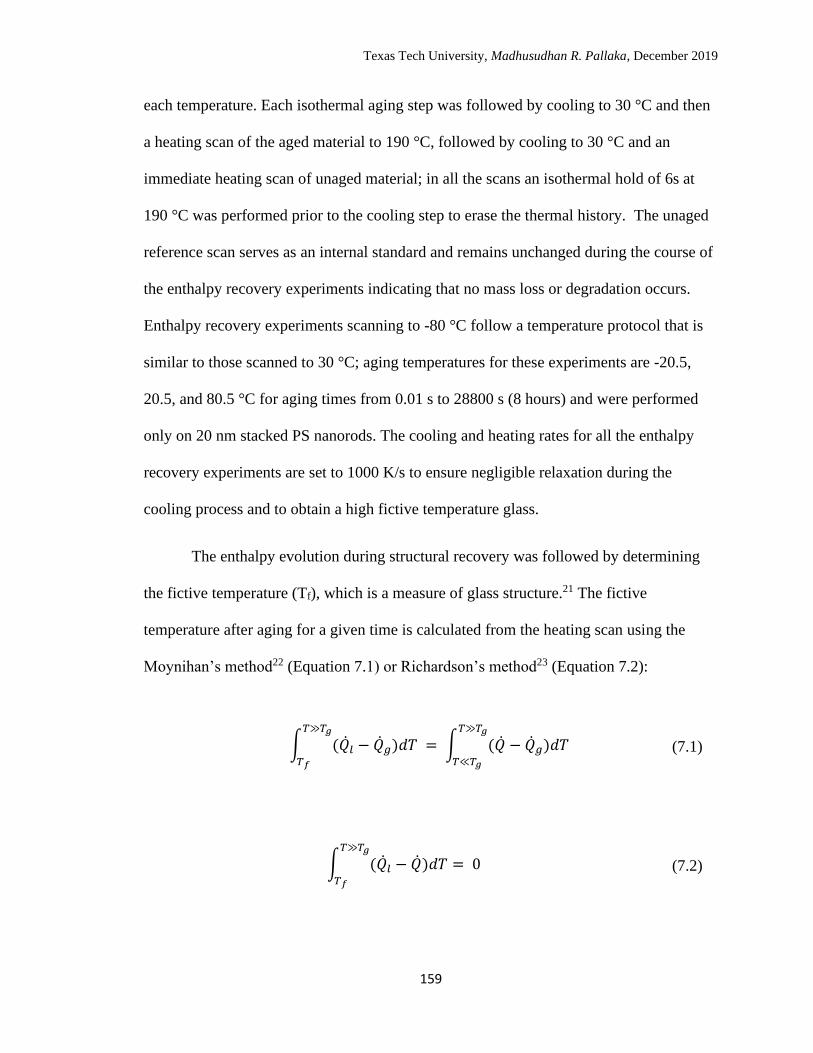
Texas Tech University, Madhusudhan R. Pallaka, December 2019
159
each temperature. Each isothermal aging step was followed by cooling to 30 °C and then
a heating scan of the aged material to 190 °C, followed by cooling to 30 °C and an
immediate heating scan of unaged material; in all the scans an isothermal hold of 6s at
190 °C was performed prior to the cooling step to erase the thermal history. The unaged
reference scan serves as an internal standard and remains unchanged during the course of
the enthalpy recovery experiments indicating that no mass loss or degradation occurs.
Enthalpy recovery experiments scanning to -80 °C follow a temperature protocol that is
similar to those scanned to 30 °C; aging temperatures for these experiments are -20.5,
20.5, and 80.5 °C for aging times from 0.01 s to 28800 s (8 hours) and were performed
only on 20 nm stacked PS nanorods. The cooling and heating rates for all the enthalpy
recovery experiments are set to 1000 K/s to ensure negligible relaxation during the
cooling process and to obtain a high fictive temperature glass.
The enthalpy evolution during structural recovery was followed by determining
the fictive temperature (Tf), which is a measure of glass structure.21 The fictive
temperature after aging for a given time is calculated from the heating scan using the
Moynihan’s method22 (Equation 7.1) or Richardson’s method23 (Equation 7.2):
∫ (��𝑙 − ��𝑔)𝑑𝑇 = ∫ (�� − ��𝑔)𝑑𝑇 𝑇≫𝑇𝑔
𝑇≪𝑇𝑔
𝑇≫𝑇𝑔
𝑇𝑓
(7.1)
∫ (��𝑙 − ��)𝑑𝑇 = 0𝑇≫𝑇𝑔
𝑇𝑓
(7.2)
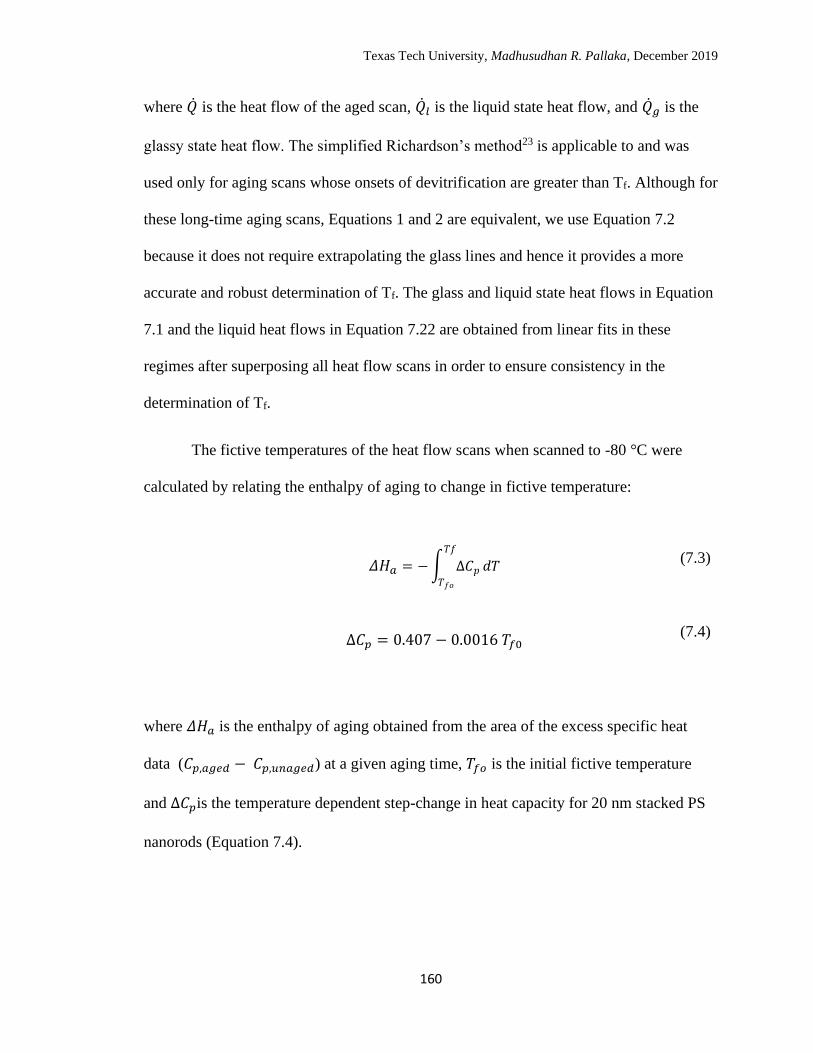
Texas Tech University, Madhusudhan R. Pallaka, December 2019
160
where �� is the heat flow of the aged scan, ��𝑙 is the liquid state heat flow, and ��𝑔 is the
glassy state heat flow. The simplified Richardson’s method23 is applicable to and was
used only for aging scans whose onsets of devitrification are greater than Tf. Although for
these long-time aging scans, Equations 1 and 2 are equivalent, we use Equation 7.2
because it does not require extrapolating the glass lines and hence it provides a more
accurate and robust determination of Tf. The glass and liquid state heat flows in Equation
7.1 and the liquid heat flows in Equation 7.22 are obtained from linear fits in these
regimes after superposing all heat flow scans in order to ensure consistency in the
determination of Tf.
The fictive temperatures of the heat flow scans when scanned to -80 °C were
calculated by relating the enthalpy of aging to change in fictive temperature:
𝛥𝐻𝑎 = − ∫ ∆𝐶𝑝
𝑇𝑓
𝑇𝑓𝑜
𝑑𝑇 (7.3)
∆𝐶𝑝 = 0.407 − 0.0016 𝑇𝑓0 (7.4)
where 𝛥𝐻𝑎 is the enthalpy of aging obtained from the area of the excess specific heat
data (𝐶𝑝,𝑎𝑔𝑒𝑑 − 𝐶𝑝,𝑢𝑛𝑎𝑔𝑒𝑑) at a given aging time, 𝑇𝑓𝑜 is the initial fictive temperature
and ∆𝐶𝑝is the temperature dependent step-change in heat capacity for 20 nm stacked PS
nanorods (Equation 7.4).
Texas Tech University, Madhusudhan R. Pallaka, December 2019
161
7.3 Results and discussion
Representative flash DSC heating scans of 20 and 350 nm stacked PS nanorods
are shown in Figures 7.1.a and 7.2.b as a function of aging time at aging temperatures,
80.5 and 90.5, respectively; the heat flow scans are obtained on heating from 30 °C. For
the sake of comparison, the aging temperatures are chosen such that they are at the same
distance from the initial fictive temperatures (Tfo), which are 107.5 ± 1.4 and 116.8 ± 2.0
°C for 20 and 350 nm stacked PS nanorods, respectively, based on the unaged scans. The
overshoots for both 20 and 350 nm stacked PS nanorods increase in magnitude and shift
to higher temperatures as the aging time increases because higher temperatures are
needed to reach the equilibrium liquid line as the mobility decreases during isothermal
aging. The enthalpy recovery process is quantified by the fictive temperature of the aged
scans calculated using Moynihan’s (Equation 7.1) and Richardson’s methods (Equation
7.2).
Flash DSC heat flow scans on heating from -80 °C for 20 nm stacked rods after
aging at temperatures 80.5 and -20.5 °C are shown in Figures 7.2.a and 7.2.b. The aged
scans obtained on heating from -80 °C exhibit braod low-temperature endotherms
spanning from -40 to 110 °C in addition to the primary high temperature endotherm
observed in the vicinity of glass transition. In the case of aging at 80.5 °C, both high and
low temperature endotherms evolve with aging time, whereas in the case of aging at -20.5
°C only the low temperature endotherm evolves with aging time because of the large
jump size from Tfo. The fictive temperatures for the aged scans heated from -80 °C are
obtained using Equations 7.3 and 7.4 for only the primary high temperature endotherm
Texas Tech University, Madhusudhan R. Pallaka, December 2019
162
for aging temperatures -20.5, 20.5 and 80.5 °C. The implications of the low temperature
endotherm on enthalpy recovery of stacked PS nanorods will be discussed later.
The fictive temperature data is plotted as departure from equilibrium, Tf -Ta
versus logarithm aging time in Figure 7.3.a, where solid green left-angled triangles and
solid red diamonds represent the enthalpy recovery of 20 and 350 nm stacked PS
nanorods respectively. The enthalpy recovery process of stacked PS nanorods is also
compared with bulk and 20 nm ultrathin PS films from previous studies to understand the
effect of nanoconfinement geometry. Since Tfo of 20 nm stacked PS nanorods is different
from that of 350 nm stacked PS nanorods and PS films, the enthalpy recovery
comparison is made at similar jump sizes (Tfo - Ta) rather than similar aging
temperatures; hence, the initial values are similar for all the samples. The responses for
all the samples evolve from Tfo-Ta to zero for all jump sizes. The time at which Tf -Ta
starts to evolve towards zero has been termed the induction time (tind); interestingly, the
induction times of 20 nm stacked PS nanorods for respective jump sizes are similar to the
350 nm stacked PS nanorods. In addition, the temperature dependence of induction time
is approximately ~20 K/decade which is also similar to that of bulk and 20 nm PS thin
films as shown in Figure 7.3.b; hence, demonstrating insignificant dependence of spatial
dimensionality on tind. PS film. After the induction period, Tf -Ta for 20 and 350 nm
stacked PS rods decreases linearly with logarithm of aging time; the recovery is
monotonic which is in contrast to intermediate plateaus reported by Cangialosi and co-
workers for 3D PS nanospheres at timescales as small as 100 s for 230 nm nanospheres
aged at 353 K (Tfo -Ta = 31 K).12 Post induction time, there are two possibilities in the
enthalpy recovery that are observed based on the magnitude of jump size: 1) Equilibrium
Texas Tech University, Madhusudhan R. Pallaka, December 2019
163
is not attained for larger jump sizes in the range of 27 – 67 K even at long aging times. 2)
Equilibrium is attained for smaller jump sizes, 7 and 17 K, where Tf-Ta reaches zero (2.0
± 1.5 K). In addition, no induction times are observed for jump sizes 127 and -4 K,
because in the former case the aging has not commenced yet, whereas in the latter case
the polymer is already in the equilibrium liquid state. Upon qualitative comparison of the
enthalpy recovery of 20 and 350 nm stacked rods, it is evident that the recovery rate for
20 nm stacked PS rods is higher than that of 350 nm stacked PS rods, especially at larger
jump sizes (27 – 67 K); at smaller jump sizes the rates are comparable. On the other
hand, the enthalpy recovery rates of 20 and 350 nm stacked rods are similar to those of 20
nm ultrathin and bulk PS films from previous studies2-6, respectively. At a jump size of
87 K, the recovery rate of 20 nm stacked PS rods is comparable to the that of a bulk PS
film.3
The apparent aging rate (R) is calculated from the slope of linear region of Tf-Ta
versus logarithm aging time:
𝑅 = −𝑑(𝑇𝑓 − 𝑇𝑎)
𝑑𝑙𝑜𝑔𝑡𝑎
(
(7.5)
where R is the aging rate in K/decade and the minus sign is added to make the quantity
positive. The aging rates of 20 and 350 nm stacked PS rods are compared with 20 nm
ultrathin film and the bulk as a function of aging temperatures and jump sizes in Figures
7.4.a and 7.4.b, respectively. The aging rates of 20 nm stacked PS rods are slightly higher
Texas Tech University, Madhusudhan R. Pallaka, December 2019
164
than 20 nm ultrathin films for aging temperatures 50.5 and 60.5 °C, but when compared
at similar jump sizes the overall aging rates of the 20nm stacked PS nanorods are very
similar to 20 nm ultrathin film. In both comparisons though, the overall aging rate of 20
nm stacked rods is higher than 350 nm stacked and bulk at lower aging temperatures or
larger jump sizes. As the jump sizes get smaller, the aging rate decreases and both
stacked rods and thin films for all sizes have similar aging rates within error, but when
compared as a function of aging temperature, for example, at Ta = 100 °C the 20 nm
stacked PS rods has a lower aging rate than 350 nm stacked PS rods and thin films
because the material is closer to equilibrium due to the depressed Tg, hence the driving
force to recovery is lower.
The enthalpy recovery behavior of 20 and 350 nm stacked PS rods are compared
using a relaxation map alongside 20 nm ultrathin PS film and the bulk in Figures 7.5.a
and 7.5.b. The relaxation map comprises of time scales including the induction times
(tind), average relaxation times (τavg), and times to reach equilibrium (t∞). The three
relaxation times are plotted as a function of T and Tfo – T in Figures 7.5.a and 7.5.b,
respectively. In case of induction times and times to reach equilibrium, T is equal to the
aging temperature (Ta) and in case of average relaxation times obtained from the cooling
rate dependence of Tg, T is equal to Tg at a given cooling rate. The activation energy
obtained from the William-Landell- Ferry27 (WLF) parameters can be used to obtain the
average relaxation time (τ) at Tg. The WLF parameters, the reference glass transition
temperatures Tg,ref, and the calculated activation energies for 20 and 350 nm stacked rods
along with 20 nm ultrathin and bulk PS films are shown in Table 7.1. The relationship
between apparent activation energy and τ has been established by Hodge28 using the
Texas Tech University, Madhusudhan R. Pallaka, December 2019
165
Deborah number (DN) which can be expressed in terms of rate of change of effective
time scale during cooling (dτ dt⁄ ). The relationship simplifies to τ = RTg
2
Eaq and the
average relaxation times for 20 and 350 nm stacked rods are shown in Figures 7.5.a and
7.5.b along as a function T and Tfo-T; also shown are the relaxation times for bulk and 20
nm ultrathin film from previous studies.2, 4-6 The average relaxation times follow the
WLF temperature dependence similar to that of Tfˈ vs log q:
𝑙𝑜𝑔𝜏 = 𝐶1 (𝑇𝑔 − 𝑇𝑔,𝑟𝑒𝑓)
𝐶2 + (𝑇𝑔 − 𝑇𝑔,𝑟𝑒𝑓)+ 𝑙𝑜𝑔𝜏0
(
(7.6)
where C1 and C2 are the WLF parameters listed in Table 7.1, Tg,ref is the reference Tg at a
cooling rate of 0.1 K/s, and τ0 is reference average relaxation time obtained using the
Hodge’s equation 𝜏0 = 𝑅𝑇𝑔0
2
𝐸𝑎𝑞0. The values of logτ0 in Equation 7.6 are 1.36 and 1.10 for 20
and 350 nm stacked PS nanorods, respectively. Since the WLF parameters of 20 and 350
nm stacked PS nanorods are different, they also have different temperature dependence of
average relaxation times when comapred as a function of T and Tfo-T. Interestingly, the
average relaxation times of 20 nm stacked PS rods and 20 nm ultrathin PS film, and 350
nm stacked PS rods and bulk PS have similar temperature dependence when compared as
a function Tfo-T. The similarity in the temperature dependence of the average relaxation
times of 20 nm stacked rods and 20 nm ultrathin film may also be the reason for similar
enthalpy recovery behavior irrespective of the difference in magnitude of Tg depression
and spatial dimensionality.
Texas Tech University, Madhusudhan R. Pallaka, December 2019
166
The induction times for 20 and 350 nm stacked PS nanorods are determined from
the intersection of the average intial Tf-Ta with the linear fit obtained from the data up to
3 decades after the initial drop in Tf-Ta. The induction times of 20 and 350 nm stacked PS
rods are similar to those obtained for 20 nm ultrathin PS film4 and bulk4-5 when compared
as a function of jump size Tfo-Ta, whereas the induction times for 20 nm stacked PS rods
are slightly lower than 350 nm stacked PS rods, and 20 nm ultrathin and bulk PS films
when comapred at same aging temperatures which implies that the relaxation time is
slightly faster when comapard at same temperatures.
The times to reach equilibrium for both 20 and 350 nm stacked PS rods are
obtained from the Tf-Ta data close to equilibrium using the following equation:
𝑙𝑜𝑔𝑡∞ = 𝜏0 [𝑙𝑛 (𝑇𝑓𝑜 − 𝑇𝑎
𝑇𝑓∞ − 𝑇𝑎)]
1/𝛽
(
(7.7)
where relaxation time 𝜏0 and nonexponentiality paramater 𝛽 are the KWW
parameters. 𝑇𝑓𝑜 − 𝑇𝑎 is the initial departure from equilibrium temperature. The time to
reach equilibrium is defined as the time taken to reach 𝑇𝑓 − 𝑇𝑎 = 0.035 K, as reported in
other work.29 The time to reach equilibrium for 20 nm stacked PS rods is slightly faster
than 350 nm stacked PS rods at a jump size of 17 K; whereas, similar equilibrium times
were observed at a jump size of 7 K. When the time to reach equilibrium is compared at
the same aging temperature, Ta = 100.5 °C, the 20 nm stacked PS rods reach the
equilibrium faster than all other samples because of Ta’s proximity to Tfo. The time to
Texas Tech University, Madhusudhan R. Pallaka, December 2019
167
reach equilibrium can also be described as the same WLF temperature dependance as
average relaxation time; hence, they can be related as: 𝑙𝑜𝑔𝑡∞ = 𝑙𝑜𝑔𝜏 + 𝐴, where 𝐴 is the
shift factor from average relaxation time that is necessary to describe time to reach
equilibrium. The shifted average relxation time WLF fits to 𝑡∞ for 20 nm ultrathin film
and the bulk are shown in Figures 7.5.a and 7.5.b as short-dashed blue and red lines,
respectively. The same values of 𝐴, 3.53 and 1.95 , that are used to shift 20 nm ultrathin
film and the bulk also describe the 𝑡∞s for 20 and 350 nm stacked PS rods; the green
short-dashed line which is shifted by 3.53 from average relaxation times for 20 nm
stacked PS rods is shown in Figures 7.5.a.
In the previously discussed enthalpy recovery process for 20 nm stacked PS
nanorods when scanned to 30 °C, the recovery towards equilibrium is linear and
monotonic for aging temperatures between 50.5 to 110.5 °C, but Cangialosi and co-
workers report a non-monotonic, two-step recovery towards equilibrium in case of PS
stacked thin films14-15 and PS nanospheres12, where the second step was related to the
presence of a braod-low temperature endotherm. In the measurements by Cangialosi and
co-workers, the samples were cooled to – 90 °C post aging and heated back from the
same temperature to capture the aged scan; in addition, aging was also performed at
temperatures as low as – 90 °C (Tg – 140). Here, we report enthalpy recovery for 2D
stacked PS nanorods scanning to – 80 °C for aging temperatures -20.5, 20.5 and 80.5 °C.
The evolution of the low temperature endotherm with aging time can be clearly seen in
the Figures 7.6.a and 7.6.b which show the excess specific heats with respect to the
unaged heat flow as a function of aging time. Although the low-temperature endotherms
demonstrate similar behavior on aging as the enthalpy overhshoots at Tg, we have
Texas Tech University, Madhusudhan R. Pallaka, December 2019
168
observed the same low temperature endotherms for indium and gold samples. In addition,
the area of the low temperature endotherm is sample dependent for nominally the same
material, differing by as high as 300 % for a bulk PS film depending on whether it is
placed on the bare chip, on a layer of Krytox oil, or on a thin AAO template. Hence, we
have concluded that the low-temperature endotherm does not contain physics related to
the glassy material being studied but, rather, is related to the sample and chip sensor
configuration.
To verify the two-step recovery observed by Cangialosi and co-workers, we
deduced the fictive temperatures of the aged scans including the low temperature
endotherm for three different aging temperatures which have low, medium and high jump
sizes from the initial fictive temperature (Tfo). The fictive temperatures are calculated
using Equations 7.3 and 7.4 with the low temperature endotherm included. The decrease
in fictive temperature as a function of aging time is shown in Figure 7.7.a; the data is also
plotted as Tf - Ta as a function of aging time in Figure 7.7.b for the sake of comparison.
The recovery towards equilibrium for all aging temperatures with the inclusion of the low
temperature endotherm is still linear and monotonic unlike the two-step recovery reported
by Cangialosi and co-workers at similar jump sizes and characteristic lengths for PS thin
films14-15 and PS nanospheres12; in case of 230 nm 3D PS nanospheres, intermediate
plateaus were reported at time scales as small as 100 s at a jump size of 31 K.12 In case of
enthalpy recovery at 80.5 °C, Tf - Ta decreases from Tf0 - Ta = 27 K to – 50 K; i.e, 50 K
below the equilibrium value. The fact that the fictive temperature has recovered past the
aging temperature does not fit into the physics of enthalpy recovery and implies that the
low temperature endotherm is an artifact which occurs when scanned to ultra-low
Texas Tech University, Madhusudhan R. Pallaka, December 2019
169
temperatures. Additional evidence can also be observed from the enthalpy recovery at 20
°C, where a ~ 40 K change in fictive temperature is observed after aging for only 8 hours;
the change in fictive temperature is comparable to that obtained for a 20 Ma aged amber
(~43.6 K)30-31.
7.4 Conclusions
The enthalpy recovery of 20 and 350 nm stacked 2D polystyrene nanorods
dispersed in ionic liquid was studied using the Flash DSC. The enthalpy recovery
measurments for 20 and 350 nm stacked PS nanorods were perfromed at similar jump sizes
in the range of -4 to 127 K from Tfo for aging times ranging from 0.01 s to 8 hrs; the Tfos
are 107.5 ± 1.4 and 116.8 ± 2.0 °C for 20 and 350 nm stacked PS nanorods, respectively.
The enthalpy recovery behavior in both 20 and 350 nm stacked PS nanorods was linear and
monotonic at all jump sizes where enthalpy recovery was observed. The induction times
for both 20 and 350 nm stacked PS rods were similar and also in good agreement with the
induction times of 20 nm ultrathin film and bulk from previous studies in our laboratory
when comapared at similar distances from Tfo, whereas shorter induction times are
observed when comapred at same aging temperatures. In both 20 and 350 nm stacked rods,
the equilibrium was reached for jump sizes less than 17 K with similar enthalpy recovery
rates; on the other hand, enhanced enthalpy recovery rates were observed in case of 20 nm
stacked rods when compared to 350 nm stacked rods at jump sizes greater than 17 K. The
overall enthalpy recovery rate of 20 nm stacked PS nanorods was found to be similar to
that of 20 nm ultrathin film. Similar agreement in overall enthalpy recovery rate was also
observed for 350 nm stacked PS rods and bulk implying an insignificant effect of spatial
dimensionality on the enthalpy recovery behavior. The similarity in enthalpy recovery
Texas Tech University, Madhusudhan R. Pallaka, December 2019
170
behavior across spatial dimensionality is presumably due to the similar temperature
dependence of average relaxation times. Enthalpy recovery meaurements scanning to -80
°C also exhibited a linear and monotonic decrease in fictive temperature inspite of the
presence of broad low temeperature endotherms at all aging temperatures studied. In case
of enthalpy recovery measurements at an aging temperature of 80.5 °C, fictive temperature
was found to be 50 K below the aging temperature when the low temperature endotherm
was included in the enthalpy recovery. The abnormal decrease in fictive temperature
beyond aging temperature indicates that the low temperature endotherm is not a secondary
relaxation but an artifact presumably arising due to generated residual stresses when
scanned to ultra-low temperatures.
Texas Tech University, Madhusudhan R. Pallaka, December 2019
171
References
1. Koh, Y. P.; Simon, S. L., Structural Relaxation of Stacked Ultrathin Polystyrene
Films. Journal of Polymer Science Part B-Polymer Physics 2008, 46 (24), 2741-
2753.
2. Koh, Y. P.; Simon, S. L., Enthalpy recovery of ultrathin polystyrene film using
Flash DSC. Polymer 2018, 143, 40-45.
3. Grassia, L.; Koh, Y. P.; Rosa, M.; Simon, S. L., Complete set of enthalpy recovery
data using Flash DSC: experiment and modeling. Macromolecules 2018, 51 (4),
1549-1558.
4. Koh, Y. P.; Simon, S. L., The glass transition and enthalpy recovery of a single
polystyrene ultrathin film using Flash DSC. The Journal of Chemical Physics 2017,
146 (20), 203329.
5. Koh, Y. P.; Gao, S.; Simon, S. L., Structural recovery of a single polystyrene thin
film using Flash DSC at low aging temperatures. Polymer 2016, 96, 182-187.
6. Koh, Y. P.; Grassia, L.; Simon, S. L., Structural recovery of a single polystyrene
thin film using nanocalorimetry to extend the aging time and temperature range.
Thermochim. Acta 2015, 603, 135-141.
7. Boucher, V. M.; Cangialosi, D.; Alegría, A.; Colmenero, J., Enthalpy recovery in
nanometer to micrometer thick polystyrene films. Macromolecules 2012, 45 (12),
5296-5306.
8. Pye, J. E.; Rohald, K. A.; Baker, E. A.; Roth, C. B., Physical aging in ultrathin
polystyrene films: Evidence of a gradient in dynamics at the free surface and its
connection to the glass transition temperature reductions. Macromolecules 2010,
43 (19), 8296-8303.
9. Green, P. F.; Glynos, E.; Frieberg, B., Polymer films of nanoscale thickness: linear
chain and star-shaped macromolecular architectures. Mrs Communications 2015, 5
(3), 423-434.
10. Wei, W.; Feng, S.; Zhou, Q.; Liang, H.; Long, Y.; Wu, Q.; Gao, H.; Liang, G.; Zhu,
F., Study on glass transition and physical aging of polystyrene nanowires by
differential scanning calorimetry. Journal of Polymer Research 2017, 24 (3), 38.
11. Guo, Y.; Zhang, C.; Lai, C.; Priestley, R. D.; D’Acunzi, M.; Fytas, G., Structural
relaxation of polymer nanospheres under soft and hard confinement: isobaric versus
isochoric conditions. ACS nano 2011, 5 (7), 5365-5373.
12. Perez-De-Eulate, N. G.; Cangialosi, D., Double Mechanism for Structural
Recovery of Polystyrene Nanospheres. Macromolecules 2018, 51 (9), 3299-3307.
Texas Tech University, Madhusudhan R. Pallaka, December 2019
172
13. Koh, Y. P.; Simon, S. L., Enthalpy recovery of polystyrene: does a long-term aging
plateau exist? Macromolecules 2013, 46 (14), 5815-5821.
14. Boucher, V. M.; Cangialosi, D.; Alegría, A.; Colmenero, J., Reaching the ideal
glass transition by aging polymer films. PCCP 2017, 19 (2), 961-965.
15. Boucher, V. M.; Cangialosi, D.; Alegría, A.; Colmenero, J., Complex
nonequilibrium dynamics of stacked polystyrene films deep in the glassy state. The
Journal of Chemical Physics 2017, 146 (20), 203312.
16. Cangialosi, D.; Boucher, V. M.; Alegría, A.; Colmenero, J., Direct evidence of two
equilibration mechanisms in glassy polymers. Phys. Rev. Lett. 2013, 111 (9),
095701.
17. Perez-De Eulate, N. G.; Cangialosi, D., The very long-term physical aging of glassy
polymers. PCCP 2018, 20 (18), 12356-12361.
18. Schawe, J. E., Measurement of the thermal glass transition of polystyrene in a
cooling rate range of more than six decades. Thermochim. Acta 2015, 603, 128-
134.
19. Pallaka, M. R.; Unruh, D. K.; Simon, S. L., Melting behavior of n-alkanes in anodic
aluminum oxide (AAO) nanopores using Flash differential scanning calorimetry.
Thermochim. Acta 2018, 663, 157-164.
20. Cebe, P.; Partlow, B. P.; Kaplan, D. L.; Wurm, A.; Zhuravlev, E.; Schick, C., Using
flash DSC for determining the liquid state heat capacity of silk fibroin.
Thermochim. Acta 2015, 615, 8-14.
21. Tool, A. Q., Relation between inelastic deformability and thermal expansion of
glass in its annealing range. J. Am. Ceram. Soc. 1946, 29 (9), 240-253.
22. Moynihan, C. T.; Easteal, A. J.; De BOLT, M. A.; Tucker, J., Dependence of the
fictive temperature of glass on cooling rate. J. Am. Ceram. Soc. 1976, 59 (1‐2), 12-
16.
23. Richardson, M.-J.; Savill, N., Derivation of accurate glass transition temperatures
by differential scanning calorimetry. Polymer 1975, 16 (10), 753-757.
24. Shamim, N.; Koh, Y. P.; Simon, S. L.; McKenna, G. B., The glass transition of
trinitrotoluene (TNT) by flash DSC. Thermochim. Acta 2015, 620, 36-39.
25. Koh, Y. P.; McKenna, G. B.; Simon, S. L., Calorimetric glass transition
temperature and absolute heat capacity of polystyrene ultrathin films. Journal of
Polymer Science Part B-Polymer Physics 2006, 44 (24), 3518-3527.
26. Gao, S. Y.; Koh, Y. P.; Simon, S. L., Calorimetric Glass Transition of Single
Polystyrene Ultrathin Films. Macromolecules 2013, 46 (2), 562-570.
Texas Tech University, Madhusudhan R. Pallaka, December 2019
173
27. Williams, M. L.; Landel, R. F.; Ferry, J. D., The temperature dependence of
relaxation mechanisms in amorphous polymers and other glass-forming liquids. J.
Am. Chem. Soc. 1955, 77 (14), 3701-3707.
28. Hodge, I. M., Enthalpy relaxation and recovery in amorphous materials. J. Non-
Cryst. Solids 1994, 169 (3), 211-266.
29. Simon, S.; Sobieski, J.; Plazek, D., Volume and enthalpy recovery of polystyrene.
Polymer 2001, 42 (6), 2555-2567.
30. Zhao, J.; Ragazzi, E.; McKenna, G. B., Something about amber: Fictive
temperature and glass transition temperature of extremely old glasses from copal to
Triassic amber. Polymer 2013, 54 (26), 7041-7047.
31. Zhao, J.; Simon, S. L.; McKenna, G. B., Using 20-million-year-old amber to test
the super-Arrhenius behaviour of glass-forming systems. Nature communications
2013, 4, 1783.
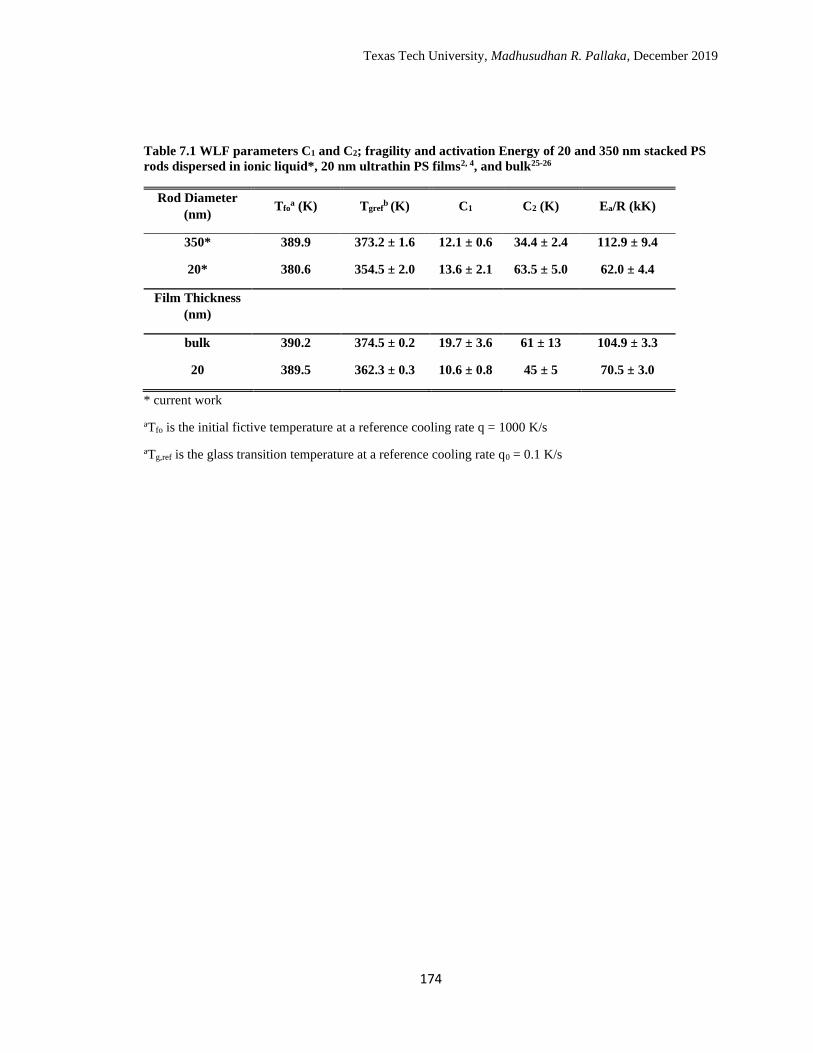
Texas Tech University, Madhusudhan R. Pallaka, December 2019
174
Table 7.1 WLF parameters C1 and C2; fragility and activation Energy of 20 and 350 nm stacked PS
rods dispersed in ionic liquid*, 20 nm ultrathin PS films2, 4, and bulk25-26
Rod Diameter
(nm) Tfo
a (K) Tgrefb (K) C1 C2 (K) Ea/R (kK)
350* 389.9 373.2 ± 1.6 12.1 ± 0.6 34.4 ± 2.4 112.9 ± 9.4
20* 380.6 354.5 ± 2.0 13.6 ± 2.1 63.5 ± 5.0 62.0 ± 4.4
Film Thickness
(nm)
bulk 390.2 374.5 ± 0.2 19.7 ± 3.6 61 ± 13 104.9 ± 3.3
20 389.5 362.3 ± 0.3 10.6 ± 0.8 45 ± 5 70.5 ± 3.0
* current work
aTfo is the initial fictive temperature at a reference cooling rate q = 1000 K/s
aTg,ref is the glass transition temperature at a reference cooling rate q0 = 0.1 K/s
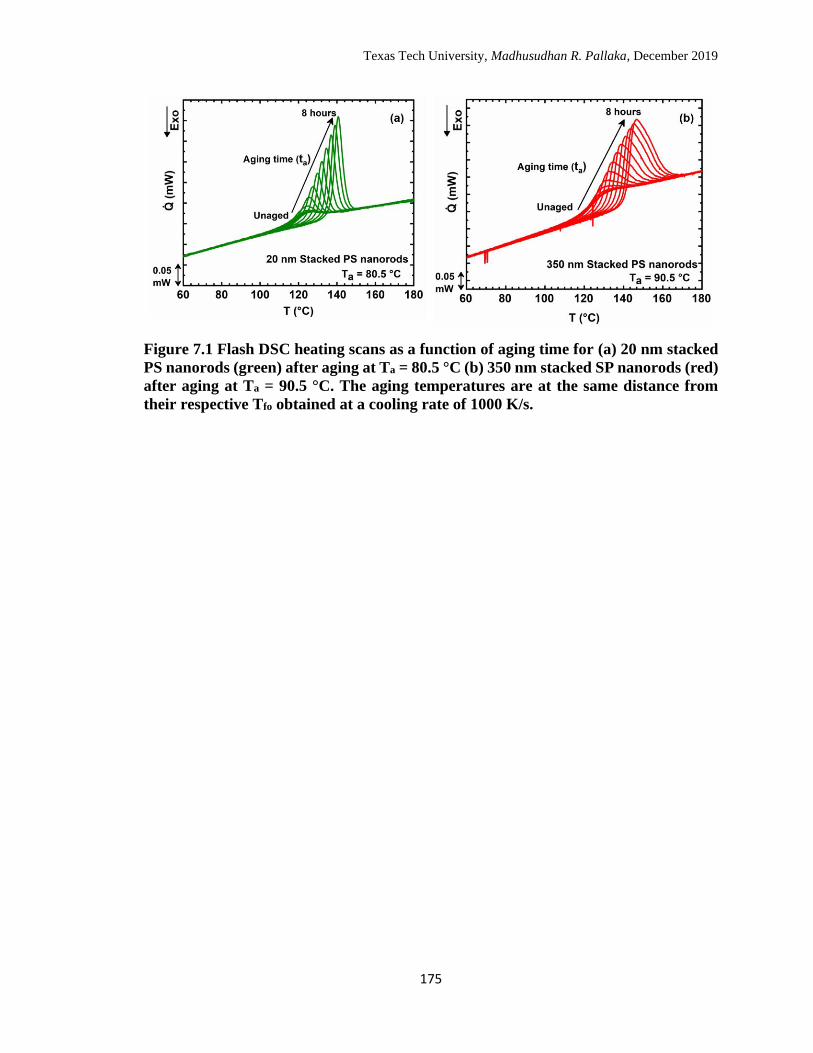
Texas Tech University, Madhusudhan R. Pallaka, December 2019
175
Figure 7.1 Flash DSC heating scans as a function of aging time for (a) 20 nm stacked
PS nanorods (green) after aging at Ta = 80.5 °C (b) 350 nm stacked SP nanorods (red)
after aging at Ta = 90.5 °C. The aging temperatures are at the same distance from
their respective Tfo obtained at a cooling rate of 1000 K/s.
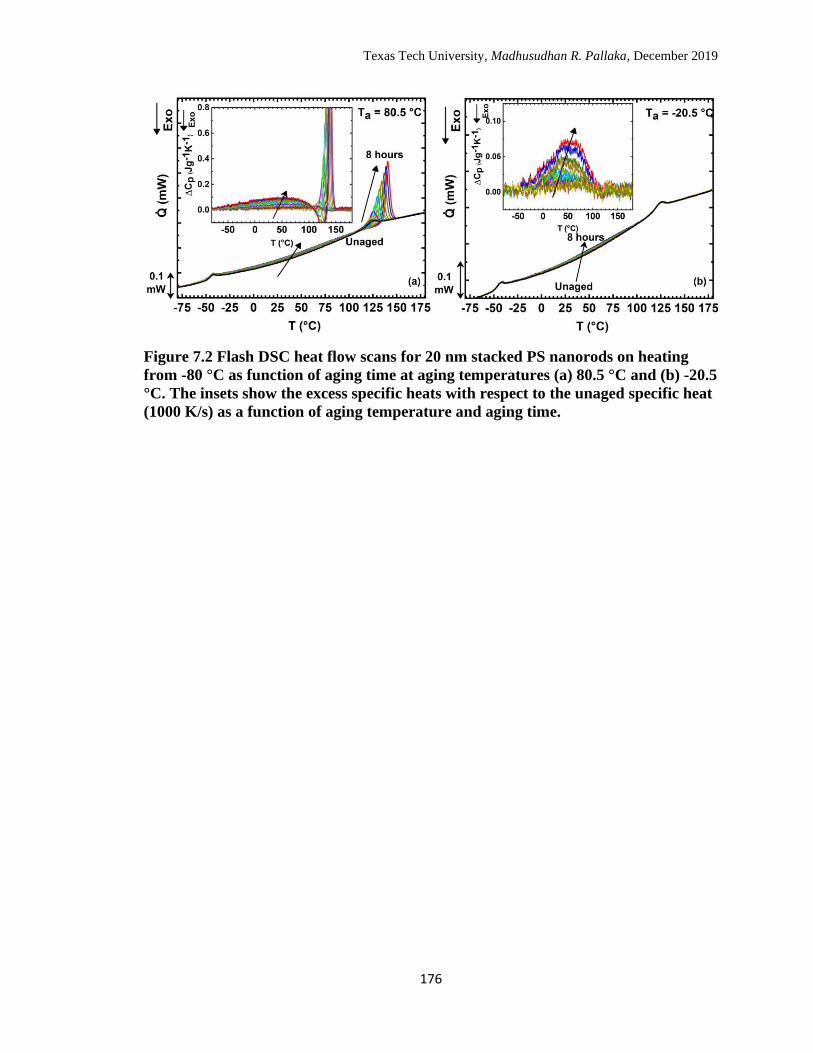
Texas Tech University, Madhusudhan R. Pallaka, December 2019
176
Figure 7.2 Flash DSC heat flow scans for 20 nm stacked PS nanorods on heating
from -80 °C as function of aging time at aging temperatures (a) 80.5 °C and (b) -20.5
°C. The insets show the excess specific heats with respect to the unaged specific heat
(1000 K/s) as a function of aging temperature and aging time.
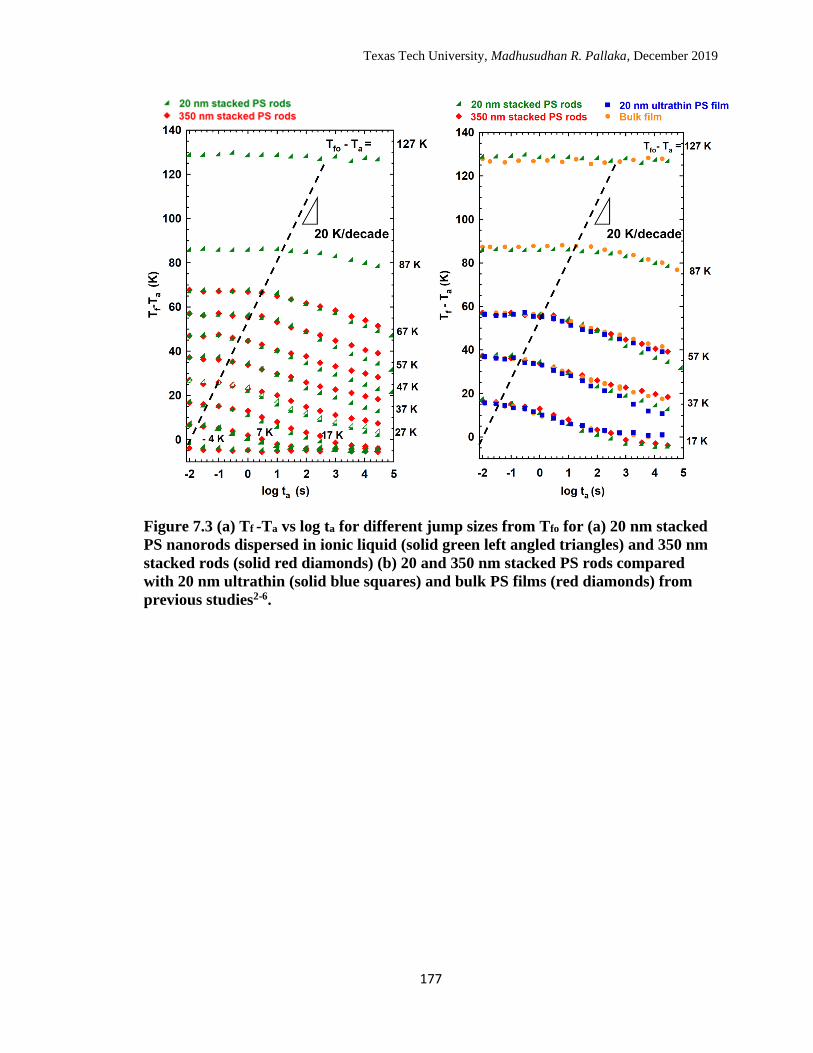
Texas Tech University, Madhusudhan R. Pallaka, December 2019
177
Figure 7.3 (a) Tf -Ta vs log ta for different jump sizes from Tfo for (a) 20 nm stacked
PS nanorods dispersed in ionic liquid (solid green left angled triangles) and 350 nm
stacked rods (solid red diamonds) (b) 20 and 350 nm stacked PS rods compared
with 20 nm ultrathin (solid blue squares) and bulk PS films (red diamonds) from
previous studies2-6.
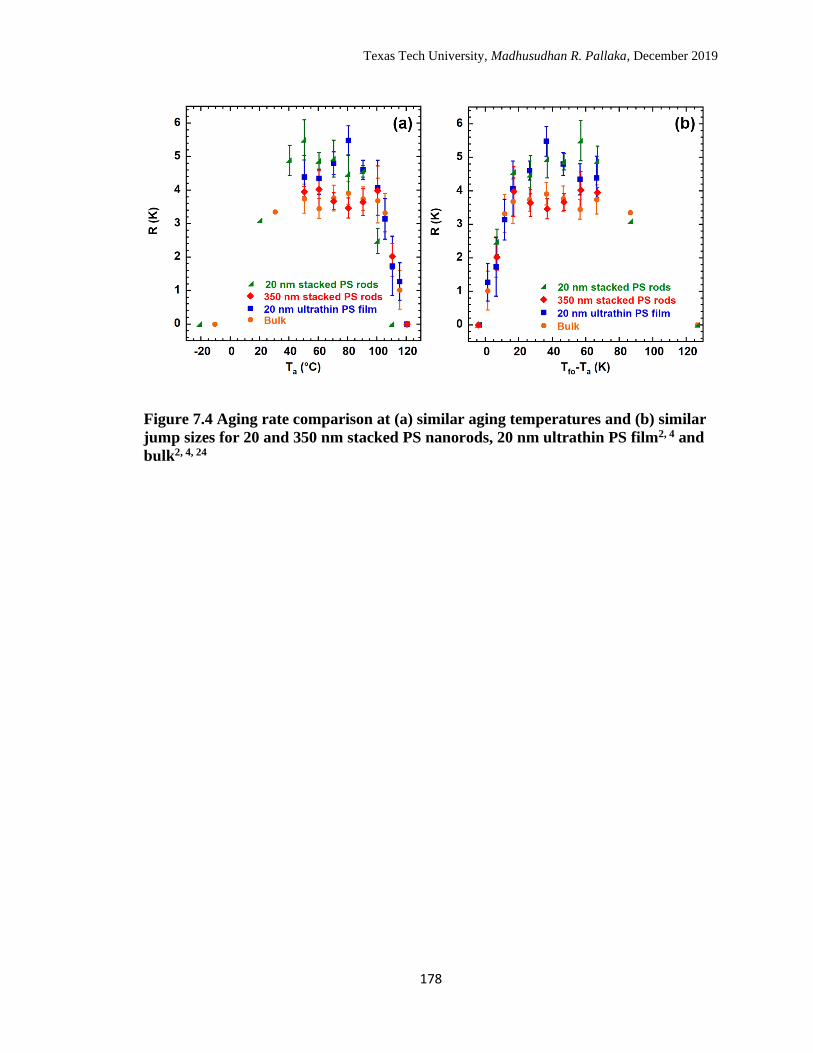
Texas Tech University, Madhusudhan R. Pallaka, December 2019
178
Figure 7.4 Aging rate comparison at (a) similar aging temperatures and (b) similar
jump sizes for 20 and 350 nm stacked PS nanorods, 20 nm ultrathin PS film2, 4 and
bulk2, 4, 24
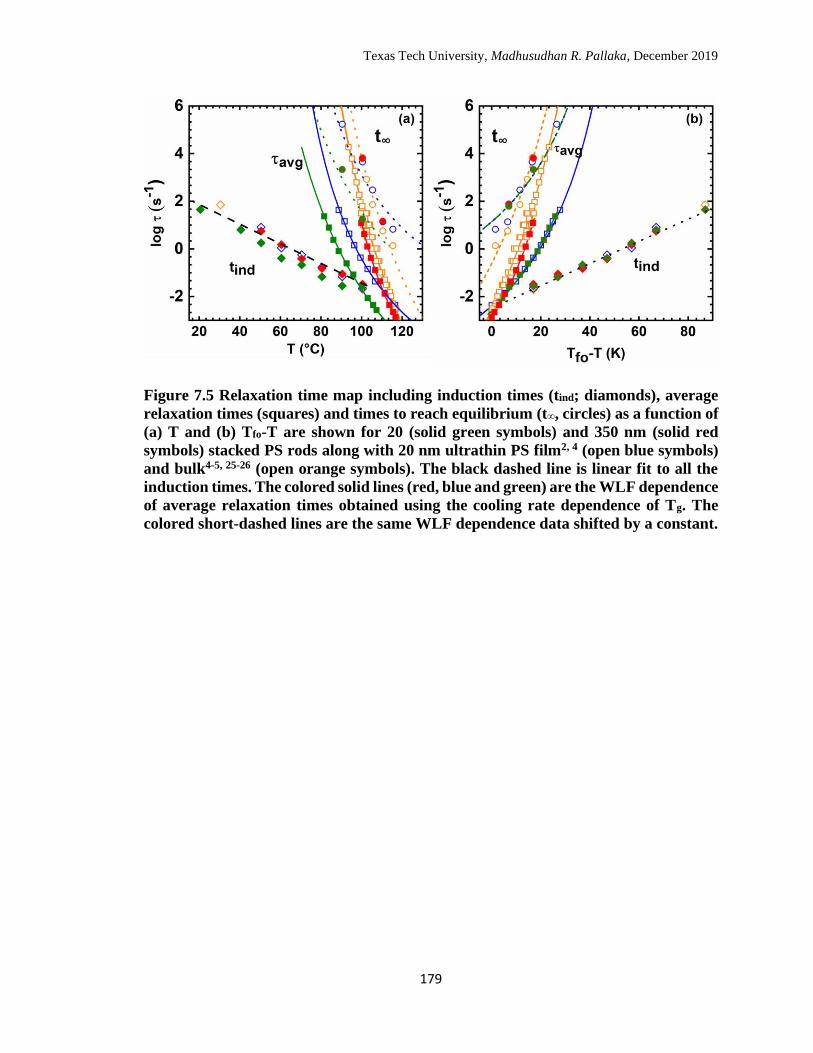
Texas Tech University, Madhusudhan R. Pallaka, December 2019
179
Figure 7.5 Relaxation time map including induction times (tind; diamonds), average
relaxation times (squares) and times to reach equilibrium (t∞, circles) as a function of
(a) T and (b) Tfo-T are shown for 20 (solid green symbols) and 350 nm (solid red
symbols) stacked PS rods along with 20 nm ultrathin PS film2, 4 (open blue symbols)
and bulk4-5, 25-26 (open orange symbols). The black dashed line is linear fit to all the
induction times. The colored solid lines (red, blue and green) are the WLF dependence
of average relaxation times obtained using the cooling rate dependence of Tg. The
colored short-dashed lines are the same WLF dependence data shifted by a constant.
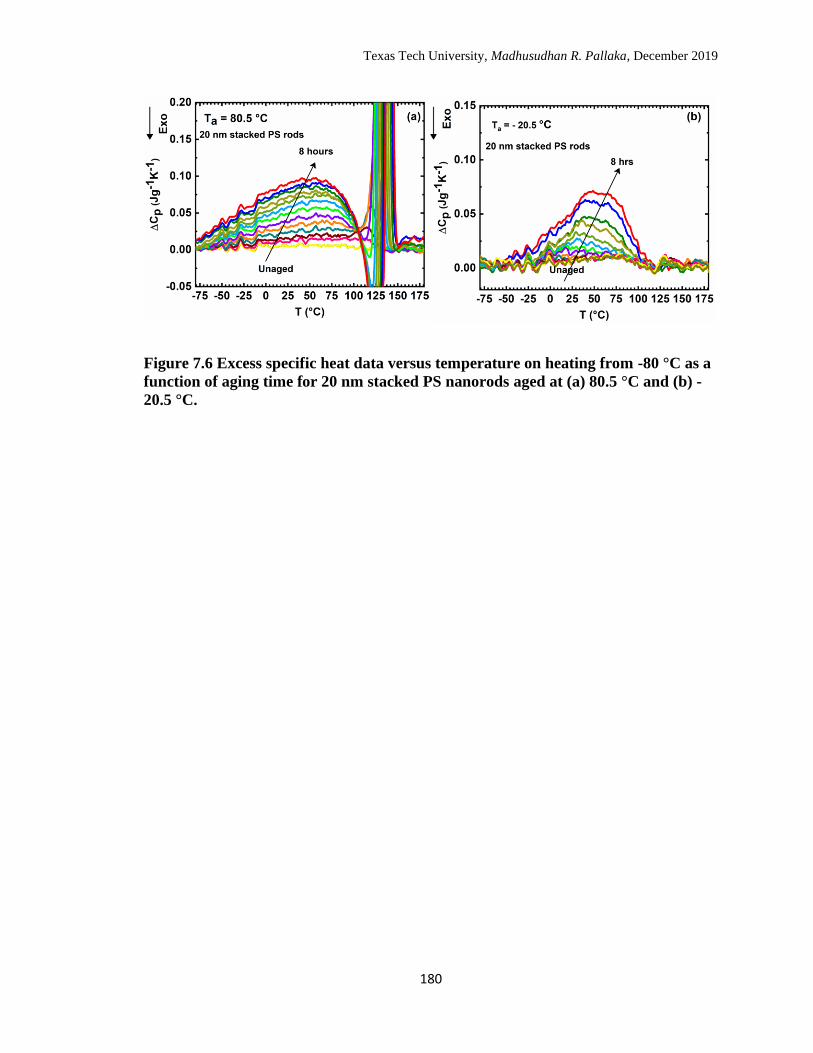
Texas Tech University, Madhusudhan R. Pallaka, December 2019
180
Figure 7.6 Excess specific heat data versus temperature on heating from -80 °C as a
function of aging time for 20 nm stacked PS nanorods aged at (a) 80.5 °C and (b) -
20.5 °C.
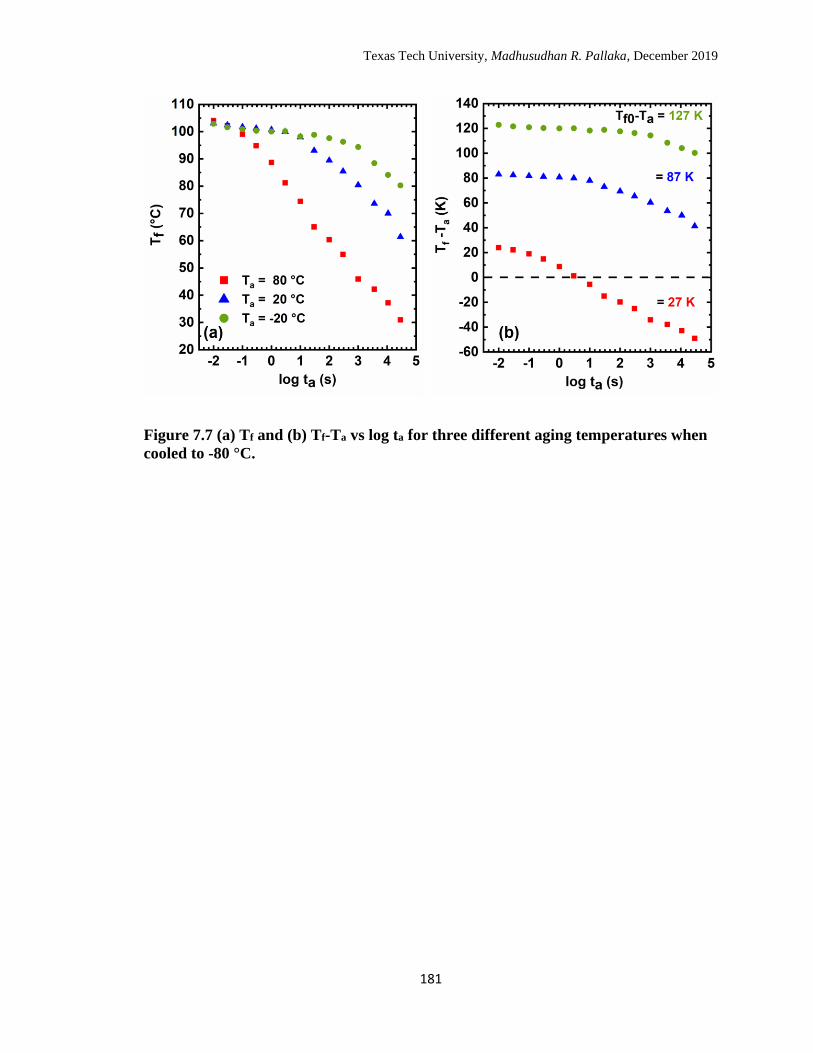
Texas Tech University, Madhusudhan R. Pallaka, December 2019
181
Figure 7.7 (a) Tf and (b) Tf-Ta vs log ta for three different aging temperatures when
cooled to -80 °C.
Texas Tech University, Madhusudhan R. Pallaka, December 2019
182
CHAPTER 8
REACTION KINETICS OF LINEAR EPOXY POLYMERIZATION
IN CPG NANOPORES
8.1 Introduction
The effect of nanoconfinement on reaction kinetics of step-growth polymerization
has been well studied over the last decade.1-5 In general, accelerated cure kinetics are
observed under nanoconfinement, with the degree of acceleration increasing with
decreasing pore diameter.1-5 The acceleration is hypothesized to be due to an increase in
the local concentration of reactive species as a result of surface layering or ordering;3, 6-7
however, layering has been validated only in silanized nanopores where reactive
functional groups like hydroxyls are absent. In native nanopores, the underlying physics
to explain accelerated reaction kinetics is more complex due to the presence of surface
silanol groups. In the case of nanoconfined dicyanate ester polymerization,5, 8 a faster
degree of cure was observed in native nanopores when compared to silanized nanopores
and the acceleration in native pores was attributed to an additional catalytic effect of
available surface silanol groups. The catalytic effect of hydroxyl moieties has also been
observed in case of epoxy-amine polymerization, where accelerated cure was observed
when hydroxyl-functionalized particles were added to the curing mixture9-17; in addition,
the cure rate increased with increase in particle loading until aggregation was observed13-
14, 16-17. Recently, Tarnacka and co-workers2 studied the reaction kinetics of a linear
epoxy system in native anodic aluminum oxide (AAO) nanopores with surface hydroxyl
groups using FTIR and found acceleration in all of the pore sizes studied and specifically,
a 5-fold increase in 35 nm pores. Since it is well known that epoxy-amine polymerization
Texas Tech University, Madhusudhan R. Pallaka, December 2019
183
reactions are influenced by hydroxyl groups, the acceleration effect observed in the
native AAO nanopores may not be solely attributed to the confinement effect, rather it
could be a combination of both confinement and catalytic effect from hydroxyl groups or
a sole contribution from the catalytic effect of hydroxyl groups. To further investigate the
aforementioned possibilities, here we study a linear epoxy polymerization similar to that
investigated by Tarnacka et al.2 in a different nanopore matrix, specifically borosilicate
controlled pore glass (CPG), which has a lower density of surface hydroxyls when
compared to AAO nanopores, using differential scanning calorimetry.
8.2 Experimental
8.2.1 Methodology
Differential scanning calorimetry
The curing was followed using a Mettler Toledo DSC 823 with a Freon
intercooler maintained at -80 °C and a nitrogen gas purge of 50 ml/min. Hermetic pans
(20 µl; PerkinElmer, Inc.) were used to study both bulk and nanoconfined reactions. For
the bulk samples, 3-5 mg was loaded into the pan; for nanoconfined samples, 3-6 mg of
CPG was loaded followed by the monomer mixture whose weight was chosen such that it
fills 70-85 % of the pore volume of respective pore diameter. Imbibement occurred
spontaneously and the pans were immediately sealed under a nitrogen blanket to
minimize adventitious water. The pans with CPG samples were immediately stored on
dry ice (-78 °C) to prevent cure during storage. The conversion during storage or prior to
the DSC measurements was estimated to be less than 5 %; the conversion was estimated
using DiBenedetto equation18 which relates the glass transition temperature of partially
cured mixture (Tg,12) with conversion (x):
Texas Tech University, Madhusudhan R. Pallaka, December 2019
184
Tg,12 − T𝑔𝑜
Tg∞ − T𝑔𝑜=
λx
1 − (1 − λ)x
(8.1)
where Tg,12 is the glass transition temperature of a partially cured sample, Tgo (= -40.8 ±
2.4 °C) is the glass transition temperature of the uncured sample, Tg∞ (= 88.5 ± 3.4 °C) is
the glass transition temperature of a fully cured sample, and λ = 0.6619 is a structure-
dependent parameter. The glass transition temperatures were captured in the temperature
range of -70 to -20 °C for Tg0 and Tg,12, and 30 to 160 or 210 °C for Tg∞ on heating at 10
K/min after cooling at the same rate. The limiting fictive temperature (Tfˈ) is calculated
from the captured data on heating using the Moynihan’s method20 and is approximately
equal to Tg (~ 1 K) when measured on cooling at the same rate21; hence, it will be
addressed as Tg in the forthcoming sections.
Dynamic DSC experiments were performed to monitor the evolution of the curing
process in the DSC at various heating rates in the range of 1-30 K/min for both bulk and
nanoconfined samples; three samples were measured for repeatability. Heat flow
calibration was performed using indium; temperature calibration was performed using
indium and octane. In addition, sample weight measurements made before and after the
DSC scans indicated that weight losses were less than 2 %.
8.3 Results
Representative reaction exotherms of DGEBA and aniline polymerization in bulk
and 55 nm CPG nanopores for five different heating rates are shown in Figures 8.1.a and
8.1.b. The heat flow for the reaction at different heating rates is normalized by the factor
of β/βref for the sake of comparison, where β is the heating rate and βref is 5 K/min. The
Texas Tech University, Madhusudhan R. Pallaka, December 2019
185
reaction exotherms shift to higher temperatures with increasing heating rate for both bulk
and 55 nm CPG because of the reduced reaction time at a given temperature as heating
rate increases. In 55 nm CPG, the polymerization reaction occurs at a significantly lower
temperature when compared with the bulk at a given heating rate. The shifts in the
reaction qualitatively in agreement with the results from Tarnacka et al.2 for the same
reaction in AAO nanopores. The average heat of reaction (∆𝐻𝑏𝑢𝑙𝑘) obtained from the
areas under the exotherms are 437.8 ± 8.6 J/g and 427.7 ± 9.5 J/g for bulk and 55 nm
CPG, respectively. The average heats of reaction are independent of heating rate and
confinement and are in good agreement with the literature (∆𝐻𝑏𝑢𝑙𝑘 = 426 J/g).22 We will
perform a more quantitative comparison using the reaction kinetics.
To study the kinetics of the reaction in the bulk and nanopores, the temperature-
dependent heat flow data is converted to temperature-dependent conversion data using
Equation 8.2:
𝑥 =∫ ��𝑑𝑡
𝑡
0
∫ ��𝑑𝑡𝑡∞
0
(8.2)
where x is the conversion at a given time t, and t∞ is the total reaction time, and �� is heat
flow in J/g. The conversion, x, in equation 8.2 is defined as the ratio of exotherm area at
time t to the total exotherm area.
The conversion versus temperature data for the reaction in the bulk are shown in
Figure 8.2 and are well described by a second order autocatalytic model:
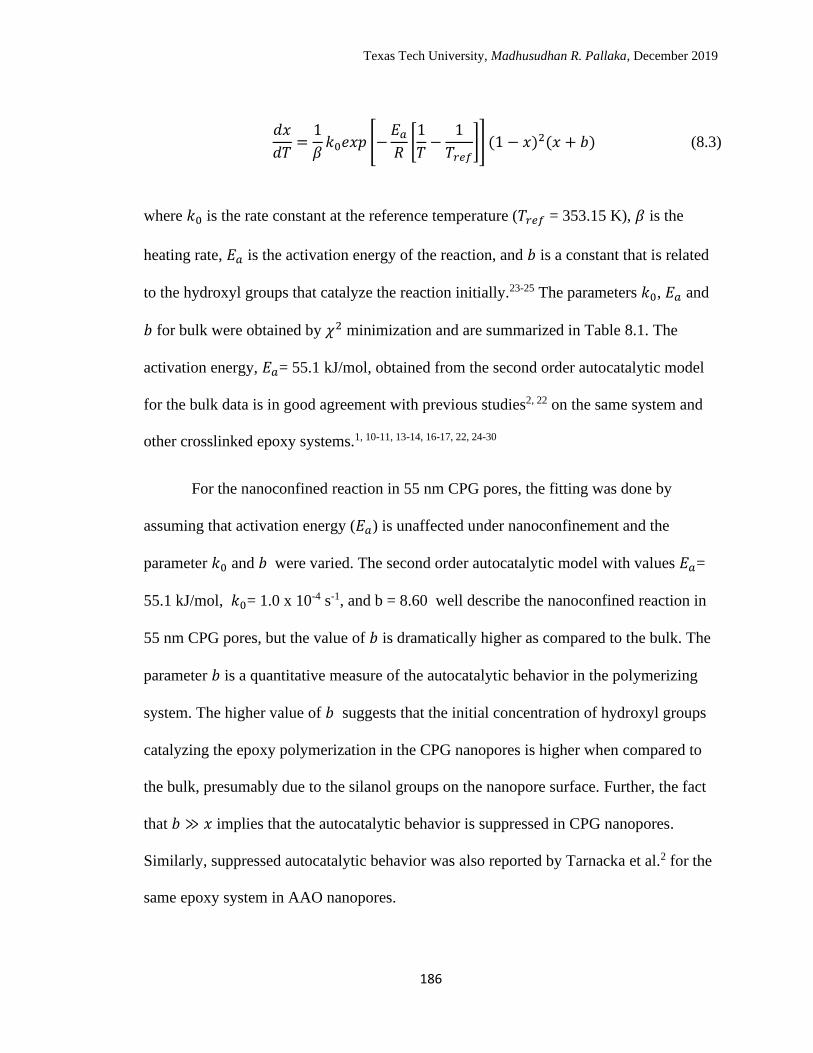
Texas Tech University, Madhusudhan R. Pallaka, December 2019
186
𝑑𝑥
𝑑𝑇=
1
𝛽𝑘0𝑒𝑥𝑝 [−
𝐸𝑎
𝑅[1
𝑇−
1
𝑇𝑟𝑒𝑓]] (1 − 𝑥)2(𝑥 + 𝑏)
(8.3)
where 𝑘0 is the rate constant at the reference temperature (𝑇𝑟𝑒𝑓 = 353.15 K), 𝛽 is the
heating rate, 𝐸𝑎 is the activation energy of the reaction, and 𝑏 is a constant that is related
to the hydroxyl groups that catalyze the reaction initially.23-25 The parameters 𝑘0, 𝐸𝑎 and
𝑏 for bulk were obtained by 𝜒2 minimization and are summarized in Table 8.1. The
activation energy, 𝐸𝑎= 55.1 kJ/mol, obtained from the second order autocatalytic model
for the bulk data is in good agreement with previous studies2, 22 on the same system and
other crosslinked epoxy systems.1, 10-11, 13-14, 16-17, 22, 24-30
For the nanoconfined reaction in 55 nm CPG pores, the fitting was done by
assuming that activation energy (𝐸𝑎) is unaffected under nanoconfinement and the
parameter 𝑘0 and 𝑏 were varied. The second order autocatalytic model with values 𝐸𝑎=
55.1 kJ/mol, 𝑘0= 1.0 x 10⁻⁴ s-1, and b = 8.60 well describe the nanoconfined reaction in
55 nm CPG pores, but the value of 𝑏 is dramatically higher as compared to the bulk. The
parameter 𝑏 is a quantitative measure of the autocatalytic behavior in the polymerizing
system. The higher value of 𝑏 suggests that the initial concentration of hydroxyl groups
catalyzing the epoxy polymerization in the CPG nanopores is higher when compared to
the bulk, presumably due to the silanol groups on the nanopore surface. Further, the fact
that 𝑏 ≫ 𝑥 implies that the autocatalytic behavior is suppressed in CPG nanopores.
Similarly, suppressed autocatalytic behavior was also reported by Tarnacka et al.2 for the
same epoxy system in AAO nanopores.
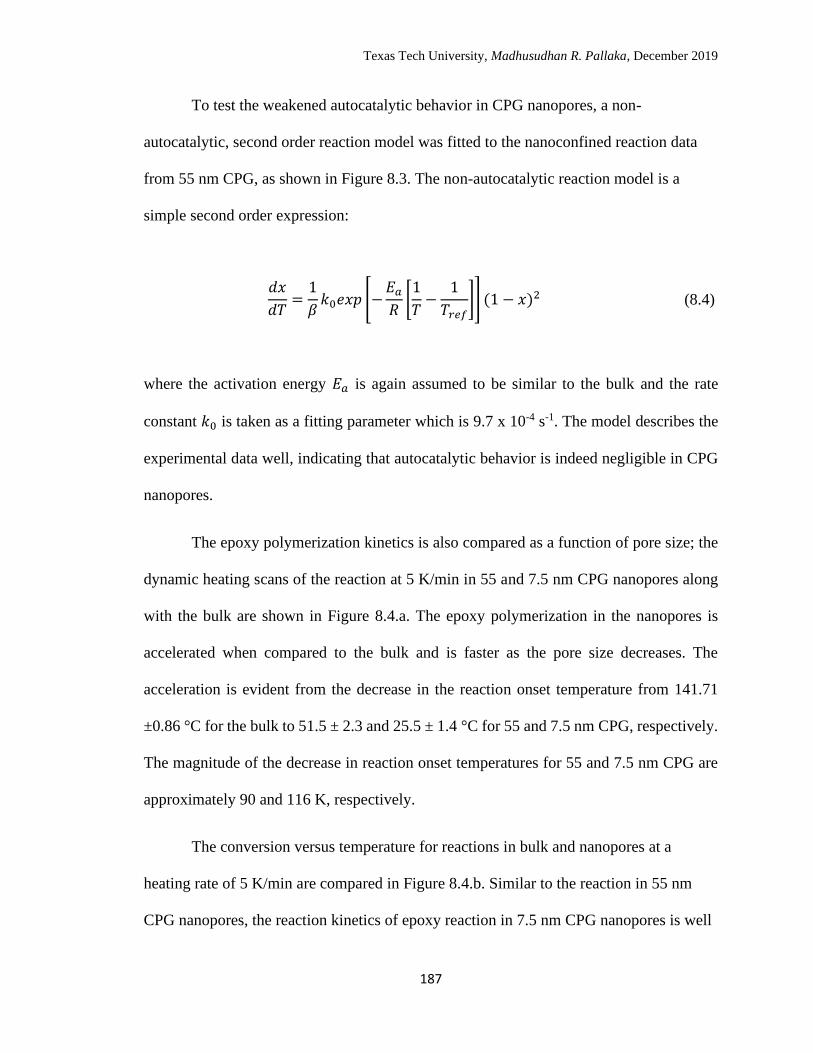
Texas Tech University, Madhusudhan R. Pallaka, December 2019
187
To test the weakened autocatalytic behavior in CPG nanopores, a non-
autocatalytic, second order reaction model was fitted to the nanoconfined reaction data
from 55 nm CPG, as shown in Figure 8.3. The non-autocatalytic reaction model is a
simple second order expression:
𝑑𝑥
𝑑𝑇=
1
𝛽𝑘0𝑒𝑥𝑝 [−
𝐸𝑎
𝑅[1
𝑇−
1
𝑇𝑟𝑒𝑓]] (1 − 𝑥)2
(8.4)
where the activation energy 𝐸𝑎 is again assumed to be similar to the bulk and the rate
constant 𝑘0 is taken as a fitting parameter which is 9.7 x 10⁻⁴ s-1. The model describes the
experimental data well, indicating that autocatalytic behavior is indeed negligible in CPG
nanopores.
The epoxy polymerization kinetics is also compared as a function of pore size; the
dynamic heating scans of the reaction at 5 K/min in 55 and 7.5 nm CPG nanopores along
with the bulk are shown in Figure 8.4.a. The epoxy polymerization in the nanopores is
accelerated when compared to the bulk and is faster as the pore size decreases. The
acceleration is evident from the decrease in the reaction onset temperature from 141.71
±0.86 °C for the bulk to 51.5 ± 2.3 and 25.5 ± 1.4 °C for 55 and 7.5 nm CPG, respectively.
The magnitude of the decrease in reaction onset temperatures for 55 and 7.5 nm CPG are
approximately 90 and 116 K, respectively.
The conversion versus temperature for reactions in bulk and nanopores at a
heating rate of 5 K/min are compared in Figure 8.4.b. Similar to the reaction in 55 nm
CPG nanopores, the reaction kinetics of epoxy reaction in 7.5 nm CPG nanopores is well
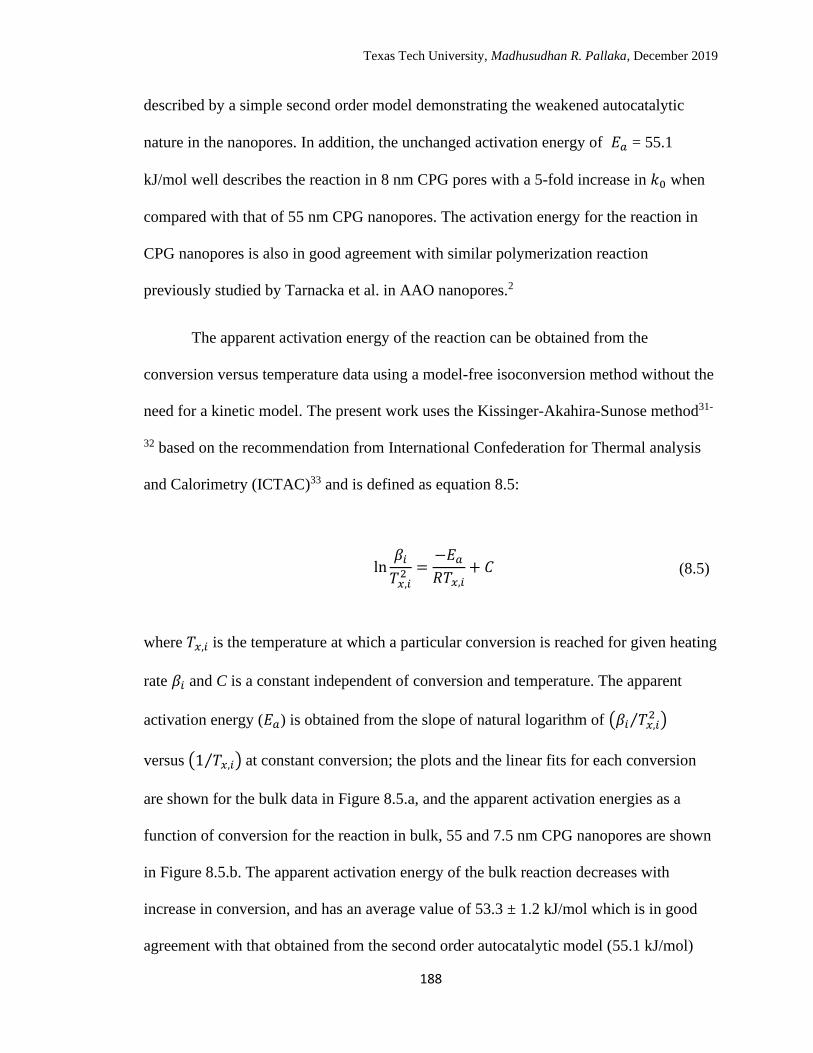
Texas Tech University, Madhusudhan R. Pallaka, December 2019
188
described by a simple second order model demonstrating the weakened autocatalytic
nature in the nanopores. In addition, the unchanged activation energy of 𝐸𝑎 = 55.1
kJ/mol well describes the reaction in 8 nm CPG pores with a 5-fold increase in 𝑘0 when
compared with that of 55 nm CPG nanopores. The activation energy for the reaction in
CPG nanopores is also in good agreement with similar polymerization reaction
previously studied by Tarnacka et al. in AAO nanopores.2
The apparent activation energy of the reaction can be obtained from the
conversion versus temperature data using a model-free isoconversion method without the
need for a kinetic model. The present work uses the Kissinger-Akahira-Sunose method31-
32 based on the recommendation from International Confederation for Thermal analysis
and Calorimetry (ICTAC)33 and is defined as equation 8.5:
ln𝛽𝑖
𝑇𝑥,𝑖2 =
−𝐸𝑎
𝑅𝑇𝑥,𝑖+ 𝐶
(8.5)
where 𝑇𝑥,𝑖 is the temperature at which a particular conversion is reached for given heating
rate 𝛽𝑖 and C is a constant independent of conversion and temperature. The apparent
activation energy (𝐸𝑎) is obtained from the slope of natural logarithm of (𝛽𝑖 𝑇𝑥,𝑖2⁄ )
versus (1 𝑇𝑥,𝑖⁄ ) at constant conversion; the plots and the linear fits for each conversion
are shown for the bulk data in Figure 8.5.a, and the apparent activation energies as a
function of conversion for the reaction in bulk, 55 and 7.5 nm CPG nanopores are shown
in Figure 8.5.b. The apparent activation energy of the bulk reaction decreases with
increase in conversion, and has an average value of 53.3 ± 1.2 kJ/mol which is in good
agreement with that obtained from the second order autocatalytic model (55.1 kJ/mol)
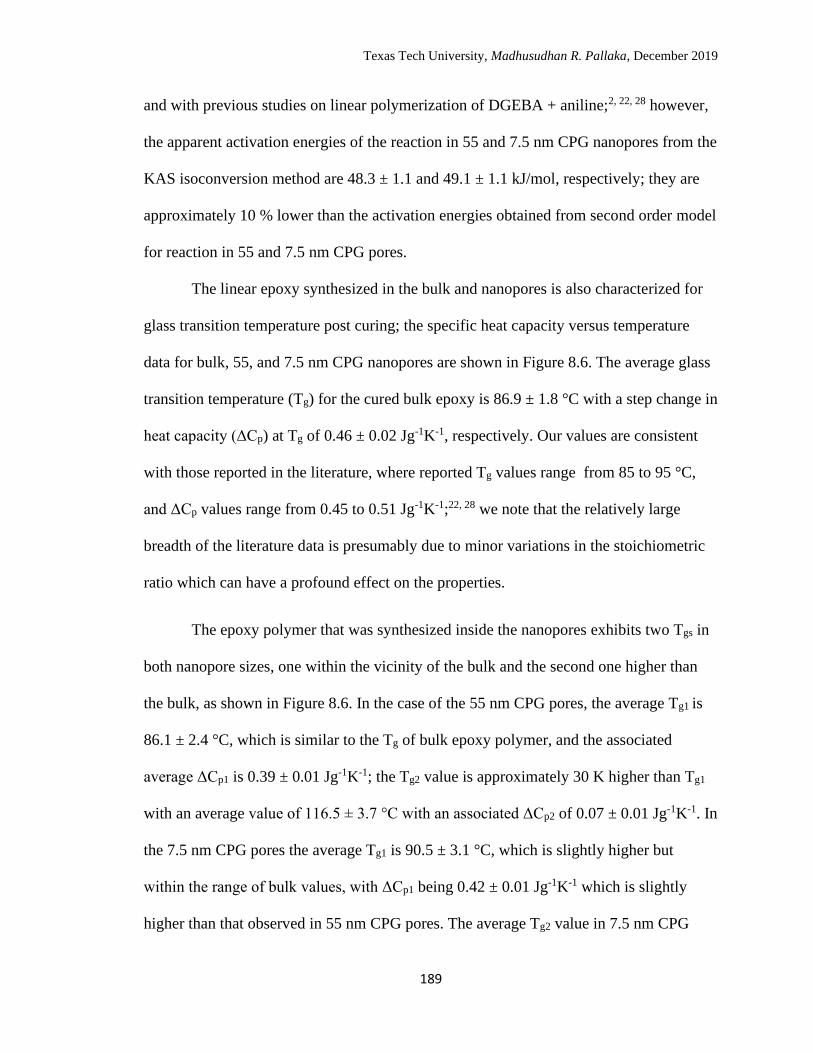
Texas Tech University, Madhusudhan R. Pallaka, December 2019
189
and with previous studies on linear polymerization of DGEBA + aniline;2, 22, 28 however,
the apparent activation energies of the reaction in 55 and 7.5 nm CPG nanopores from the
KAS isoconversion method are 48.3 ± 1.1 and 49.1 ± 1.1 kJ/mol, respectively; they are
approximately 10 % lower than the activation energies obtained from second order model
for reaction in 55 and 7.5 nm CPG pores.
The linear epoxy synthesized in the bulk and nanopores is also characterized for
glass transition temperature post curing; the specific heat capacity versus temperature
data for bulk, 55, and 7.5 nm CPG nanopores are shown in Figure 8.6. The average glass
transition temperature (Tg) for the cured bulk epoxy is 86.9 ± 1.8 °C with a step change in
heat capacity (ΔCp) at Tg of 0.46 ± 0.02 Jg-1K-1, respectively. Our values are consistent
with those reported in the literature, where reported Tg values range from 85 to 95 °C,
and ΔCp values range from 0.45 to 0.51 Jg-1K-1;22, 28 we note that the relatively large
breadth of the literature data is presumably due to minor variations in the stoichiometric
ratio which can have a profound effect on the properties.
The epoxy polymer that was synthesized inside the nanopores exhibits two Tgs in
both nanopore sizes, one within the vicinity of the bulk and the second one higher than
the bulk, as shown in Figure 8.6. In the case of the 55 nm CPG pores, the average Tg1 is
86.1 ± 2.4 °C, which is similar to the Tg of bulk epoxy polymer, and the associated
average ΔCp1 is 0.39 ± 0.01 Jg-1K-1; the Tg2 value is approximately 30 K higher than Tg1
with an average value of 116.5 ± 3.7 °C with an associated ΔCp2 of 0.07 ± 0.01 Jg-1K-1. In
the 7.5 nm CPG pores the average Tg1 is 90.5 ± 3.1 °C, which is slightly higher but
within the range of bulk values, with ΔCp1 being 0.42 ± 0.01 Jg-1K-1 which is slightly
higher than that observed in 55 nm CPG pores. The average Tg2 value in 7.5 nm CPG
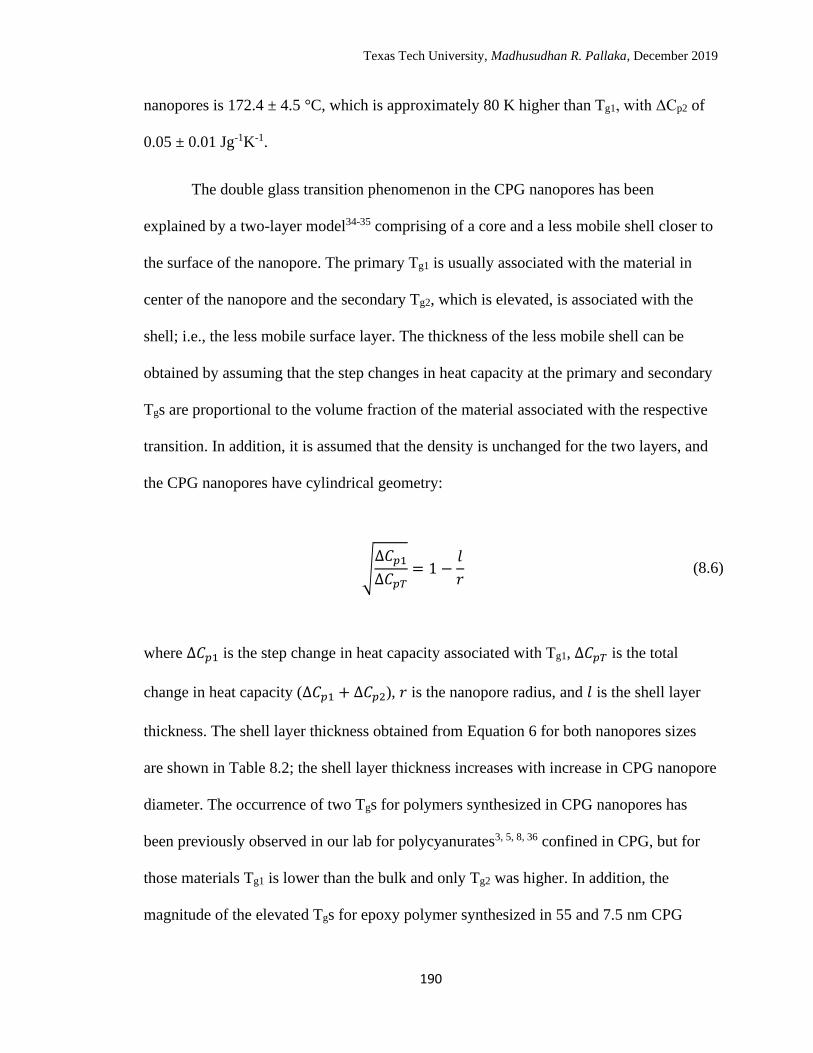
Texas Tech University, Madhusudhan R. Pallaka, December 2019
190
nanopores is 172.4 ± 4.5 °C, which is approximately 80 K higher than Tg1, with ΔCp2 of
0.05 ± 0.01 Jg-1K-1.
The double glass transition phenomenon in the CPG nanopores has been
explained by a two-layer model34-35 comprising of a core and a less mobile shell closer to
the surface of the nanopore. The primary Tg1 is usually associated with the material in
center of the nanopore and the secondary Tg2, which is elevated, is associated with the
shell; i.e., the less mobile surface layer. The thickness of the less mobile shell can be
obtained by assuming that the step changes in heat capacity at the primary and secondary
Tgs are proportional to the volume fraction of the material associated with the respective
transition. In addition, it is assumed that the density is unchanged for the two layers, and
the CPG nanopores have cylindrical geometry:
√Δ𝐶𝑝1
Δ𝐶𝑝𝑇= 1 −
𝑙
𝑟
(8.6)
where Δ𝐶𝑝1 is the step change in heat capacity associated with Tg1, Δ𝐶𝑝𝑇 is the total
change in heat capacity (Δ𝐶𝑝1 + Δ𝐶𝑝2), 𝑟 is the nanopore radius, and 𝑙 is the shell layer
thickness. The shell layer thickness obtained from Equation 6 for both nanopores sizes
are shown in Table 8.2; the shell layer thickness increases with increase in CPG nanopore
diameter. The occurrence of two Tgs for polymers synthesized in CPG nanopores has
been previously observed in our lab for polycyanurates3, 5, 8, 36 confined in CPG, but for
those materials Tg1 is lower than the bulk and only Tg2 was higher. In addition, the
magnitude of the elevated Tgs for epoxy polymer synthesized in 55 and 7.5 nm CPG
Texas Tech University, Madhusudhan R. Pallaka, December 2019
191
nanopores are significantly higher when compared to that observed for polycyanurates,3-5,
7-8, 36-38 presumably due to the strong interfacial effect of the hydroxyl groups on the
surface layer formed in CPG nanopores.
8.4 Discussion
The epoxy-amine reaction kinetics is accelerated under nanoconfinement for the
bulk and nanopores as indicated by the decrease in the temperature at the onset of the
reactrion exotherm. We can then quantify the acceleration by comparing the initial
reaction rate, obtained from the reaction model Equations 8.3 and 8.4 at x = 0
(𝑑𝑥 𝑑𝑡⁄ |x=0); the initial reaction rates for the second order autocatalytic and non-
autocatalytic models are equal to 𝑘0𝑏 and 𝑘0, respectively. A comparison of
nanoconfined and bulk initial reaction rates reveals that initial reaction rates in 55 and 7.5
nm CPG nanopores are accelerated over the bulk by 240 and 1280 times, respectively;
however, only a 5-fold acceleration is observed when the initial reaction rates of 55 and
7.5 nm CPG nanopores are compared. The initial reaction rate is also estimated from the
work of Tarnacka et al., where they used the Avrami model to describe the reaction
kinetics;2 we calculated their initial reaction rates for bulk and 35 nm AAO pores to be
1.5 x 10⁻⁴ and 7.5 x 10⁻⁴ s-1, respectively.2 Thus, in the work of Tarnacka et al., the initial
reaction rate accelerated five times in 35 nm AAO pores, considerably lower than the
magnitude observed in our work. In addition, the bulk initial reaction rate is 40-fold faster
in case of Tarnacka et al.’s study2 and 6-fold faster in case of Wise et al.’s22 study when
compared to our work; future studies will be performed to address the differences. On the
other hand, the initial reaction rate is 1.3 times slower in 35 nm AAO pores2 when
compared to that in 55 nm CPG pores a somewhat surprising finding, given the smaller
Texas Tech University, Madhusudhan R. Pallaka, December 2019
192
pore diameter and higher density of hydroxyl groups (4 OH/nm2 in CPG39 vs 19 OH/nm2
in AAO40) in AAO nanopores. The result suggests that the reaction rate is not directly
proportional to the density of hydroxyl groups. The reason for higher reaction rates in
CPG nanopores when compared to that in AAO nanopores is not clear at this point and
will be addressed in future studies.
8.5 Conclusions
The reaction kinetics of linear epoxy polymerization in bulk and in 55 and 7.5 nm
CPG nanopores were investigated using differential scanning calorimetry in dynamic
mode. The polymerization reaction is found to be accelerated in the nanopores, as
evidenced by a decrease in the onset temperature for the nanoconfined reaction exotherm.
A second order autocatalytic reaction model describes both bulk and nanoconfined data
well, but autocatalytic behavior is weaker in the nanopores and well described by a
simple non-autocatalytic second order model. Two Tgs were observed in both 55 and 7.5
nm CPG nanopores. Tg1s were in good agreement with the bulk values, and Tg2s were
found to be elevated by 30 and 80 K in 55 and 7.5 nm CPG nanopores, respectively. The
initial reaction rates were accelerated by 240 and 1280 times in 55 and 7.5 nm CPG
pores, presumably due to silanol groups on the CPG nanopore surface.
Texas Tech University, Madhusudhan R. Pallaka, December 2019
193
References
1. Sanz, B.; Ballard, N.; Marcos-Fernández, Á.; Asua, J. M.; Mijangos, C.,
Confinement effects in the step-growth polymerization within AAO templates and
modeling. Polymer 2018, 140, 131-139.
2. Tarnacka, M.; Dulski, M.; Starzonek, S.; Adrjanowicz, K.; Mapesa, E. U.;
Kaminski, K.; Paluch, M., Following kinetics and dynamics of DGEBA-aniline
polymerization in nanoporous native alumina oxide membranes–FTIR and
dielectric studies. Polymer 2015, 68, 253-261.
3. Lopez, E.; Simon, S. L., Trimerization Reaction Kinetics and T g Depression of
Polycyanurate under Nanoconfinement. Macromolecules 2015, 48 (13), 4692-
4701.
4. Li; Simon, S. L., Curing of Bisphenol M Dicyanate Ester under Nanoscale
Constraint. Macromolecules 2008, 41 (4), 1310-1317.
5. Li, Q.; Simon, S. L., Surface Chemistry Effects on the Reactivity and Properties of
Nanoconfined Bisphenol M Dicyanate Ester in Controlled Pore Glass.
Macromolecules 2009, 42 (10), 3573-3579.
6. Malvaldi, M.; Bruzzone, S.; Picchioni, F., Confinement Effect in Diffusion-
Controlled Stepwise Polymerization by Monte Carlo Simulation. The Journal of
Physical Chemistry B 2006, 110 (25), 12281-12288.
7. Koh, Y. P.; Simon, S. L., Kinetic Study of Trimerization of Monocyanate Ester in
Nanopores. J. Phys. Chem. B 2011, 115 (5), 925-932.
8. Li, Q.; Simon, S. L., Curing of bisphenol M dicyanate ester under nanoscale
constraint. Macromolecules 2008, 41 (4), 1310-1317.
9. Ryu, S. H.; Sin, J.; Shanmugharaj, A., Study on the effect of hexamethylene
diamine functionalized graphene oxide on the curing kinetics of epoxy
nanocomposites. Eur. Polym. J. 2014, 52, 88-97.
10. Zabihi, O.; Hooshafza, A.; Moztarzadeh, F.; Payravand, H.; Afshar, A.; Alizadeh,
R., Isothermal curing behavior and thermo-physical properties of epoxy-based
thermoset nanocomposites reinforced with Fe2O3 nanoparticles. Thermochim.
Acta 2012, 527, 190-198.
11. Rajabi, L.; Kaihani, S.; Kurdian, A.; Rezai, N., Dynamic cure kinetics of
epoxy/TiO2 nanocomposites. Science of Advanced Materials 2010, 2 (2), 200-209.
12. Rosso, P.; Ye, L., Epoxy/Silica Nanocomposites: Nanoparticle‐Induced Cure
Kinetics and Microstructure. Macromol. Rapid Commun. 2007, 28 (1), 121-126.
Texas Tech University, Madhusudhan R. Pallaka, December 2019
194
13. Sanctuary, R.; Baller, J.; Zielinski, B.; Becker, N.; Krüger, J.; Philipp, M.; Müller,
U.; Ziehmer, M., Influence of Al2O3 nanoparticles on the isothermal cure of an
epoxy resin. J. Phys.: Condens. Matter 2008, 21 (3), 035118.
14. Baller, J.; Thomassey, M.; Ziehmer, M.; Sanctuary, R., The catalytic influence of
alumina nanoparticles on epoxy curing. Thermochim. Acta 2011, 517 (1-2), 34-39.
15. Choi, S.; Janisse, A. P.; Liu, C.; Douglas, E. P., Effect of water addition on the cure
kinetics of an epoxy‐amine thermoset. J. Polym. Sci., Part A: Polym. Chem. 2011,
49 (21), 4650-4659.
16. Ghaemy, M.; Nasab, S. A.; Barghamadi, M., Nonisothermal cure kinetics of
diglycidylether of bisphenol‐A/amine system reinforced with nanosilica particles.
J. Appl. Polym. Sci. 2007, 104 (6), 3855-3863.
17. Ghaemy, M.; Bazzar, M.; Mighani, H., Effect of nanosilica on the kinetics of cure
reaction and thermal degradation of epoxy resin. Chin. J. Polym. Sci. 2011, 29 (2),
141-148.
18. DiBenedetto, A., Prediction of the glass transition temperature of polymers: a
model based on the principle of corresponding states. J. Polym. Sci., Part B: Polym.
Phys. 1987, 25 (9), 1949-1969.
19. Min, B.-G.; Stachurski, Z.; Hodgkin, J., Cure kinetics of elementary reactions of a
DGEBA/DDS epoxy resin: 1. Glass transition temperature versus conversion.
Polymer 1993, 34 (23), 4908-4912.
20. Moynihan, C. T.; Easteal, A. J.; De BOLT, M. A.; Tucker, J., Dependence of the
fictive temperature of glass on cooling rate. J. Am. Ceram. Soc. 1976, 59 (1‐2), 12-
16.
21. Badrinarayanan, P.; Zheng, W.; Li, Q.; Simon, S. L., The glass transition
temperature versus the fictive temperature. J. Non-Cryst. Solids 2007, 353 (26),
2603-2612.
22. Wise, C. W.; Cook, W. D.; Goodwin, A. A., Chemico-diffusion kinetics of model
epoxy-amine resins. Polymer 1997, 38 (13), 3251-3261.
23. Horie, K.; Hiura, H.; Sawada, M.; Mita, I.; Kambe, H., Calorimetric investigation
of polymerization reactions. III. Curing reaction of epoxides with amines. J. Polym.
Sci., Part A: Polym. Chem. 1970, 8 (6), 1357-1372.
24. Wisanrakkit, G.; Gillham, J., The glass transition temperature (Tg) as an index of
chemical conversion for a high‐Tg amine/epoxy system: chemical and diffusion‐
controlled reaction kinetics. J. Appl. Polym. Sci. 1990, 41 (11‐12), 2885-2929.
Texas Tech University, Madhusudhan R. Pallaka, December 2019
195
25. Wisanrakkit, G.; Gillham, J.; Enns, J., The glass transition temperature (Tg) as a
parameter for monitoring the cure of an amine/epoxy system at constant heating
rates. J. Appl. Polym. Sci. 1990, 41 (7‐8), 1895-1912.
26. Wisanrakkit, G.; Gillham, J. K., Continuous heating transformation (CHT) cure
diagram of an aromatic amine/epoxy system at constant heating rates. J. Appl.
Polym. Sci. 1991, 42 (9), 2453-2463.
27. Gupta, S. K.; Kumar, A., Reaction engineering of step growth polymerization.
Springer Science & Business Media: 2012.
28. Swier, S.; Van Assche, G.; Van Mele, B., Reaction kinetics modeling and thermal
properties of epoxy–amines as measured by modulated‐temperature DSC. I. Linear
step‐growth polymerization of DGEBA+ aniline. J. Appl. Polym. Sci. 2004, 91 (5),
2798-2813.
29. Pascault, J.-P.; Williams, R. J., Epoxy polymers: new materials and innovations.
John Wiley & Sons: 2009.
30. May, C., Epoxy resins: chemistry and technology. CRC press: 1987.
31. Kissinger, H. E., Reaction kinetics in differential thermal analysis. Anal. Chem.
1957, 29 (11), 1702-1706.
32. Akahira, T.; Sunose, T., Method of determining activation deterioration constant of
electrical insulating materials. Res. Rep. Chiba Inst. Technol.(Sci. Technol.) 1971,
16, 22-31.
33. Vyazovkin, S.; Chrissafis, K.; Di Lorenzo, M. L.; Koga, N.; Pijolat, M.; Roduit, B.;
Sbirrazzuoli, N.; Sunol, J. J., ICTAC Kinetics Committee recommendations for
collecting experimental thermal analysis data for kinetic computations.
Thermochim. Acta 2014, 590, 1-23.
34. Mel’nichenko, Y. B.; Schüller, J.; Richert, R.; Ewen, B.; Loong, C. K., Dynamics
of hydrogen‐bonded liquids confined to mesopores: A dielectric and neutron
spectroscopy study. The Journal of chemical physics 1995, 103 (6), 2016-2024.
35. Arndt, M.; Stannarius, R.; Gorbatschow, W.; Kremer, F., Dielectric investigations
of the dynamic glass transition in nanopores. Physical Review E 1996, 54 (5), 5377.
36. Koh, Y. P.; Li, Q.; Simon, S. L., T g and reactivity at the nanoscale. Thermochim.
Acta 2009, 492 (1), 45-50.
37. Koh, Y. P.; Simon, S. L., Crystallization and Vitrification of a Cyanurate Trimer in
Nanopores. J. Phys. Chem. B 2012, 116 (26), 7754-7761.
38. Koh, Y. P.; Simon, S. L., Kinetic Study of Trimerization of Monocyanate Ester in
Nanopores (vol 115, pg 925, 2011). J. Phys. Chem. B 2012, 116 (1), 731-731.
Texas Tech University, Madhusudhan R. Pallaka, December 2019
196
39. Zhuravlev, L., Concentration of hydroxyl groups on the surface of amorphous
silicas. Langmuir 1987, 3 (3), 316-318.
40. Tsyganenko, A. A.; Mardilovich, P. P., Structure of alumina surfaces. J. Chem.
Soc., Faraday Trans. 1996, 92 (23), 4843-4852.
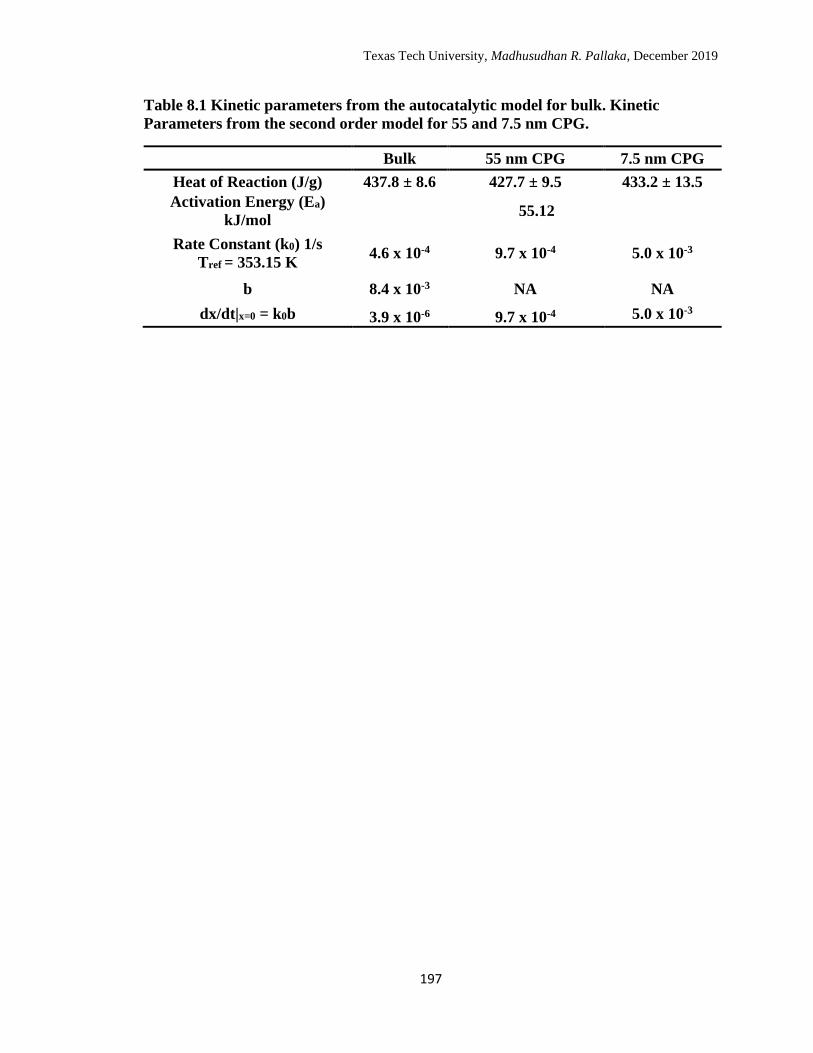
Texas Tech University, Madhusudhan R. Pallaka, December 2019
197
Table 8.1 Kinetic parameters from the autocatalytic model for bulk. Kinetic
Parameters from the second order model for 55 and 7.5 nm CPG.
Bulk 55 nm CPG 7.5 nm CPG
Heat of Reaction (J/g) 437.8 ± 8.6 427.7 ± 9.5 433.2 ± 13.5
Activation Energy (Ea)
kJ/mol 55.12
Rate Constant (k0) 1/s
Tref = 353.15 K 4.6 x 10⁻⁴ 9.7 x 10⁻⁴ 5.0 x 10⁻³
b 8.4 x 10⁻³ NA NA
dx/dt|x=0 = k0b 3.9 x 10⁻⁶ 9.7 x 10⁻⁴ 5.0 x 10⁻³
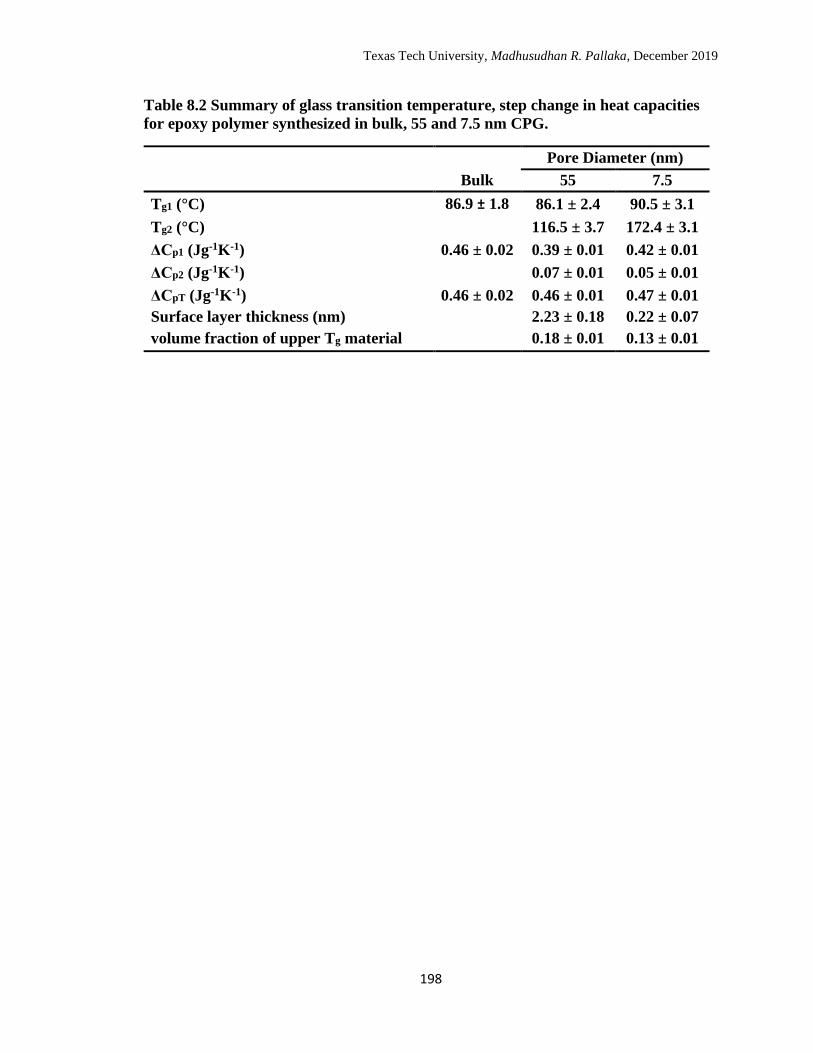
Texas Tech University, Madhusudhan R. Pallaka, December 2019
198
Table 8.2 Summary of glass transition temperature, step change in heat capacities
for epoxy polymer synthesized in bulk, 55 and 7.5 nm CPG.
Pore Diameter (nm) Bulk 55 7.5
Tg1 (°C) 86.9 ± 1.8 86.1 ± 2.4 90.5 ± 3.1
Tg2 (°C) 116.5 ± 3.7 172.4 ± 3.1
ΔCp1 (Jg-1K-1) 0.46 ± 0.02 0.39 ± 0.01 0.42 ± 0.01
ΔCp2 (Jg-1K-1) 0.07 ± 0.01 0.05 ± 0.01
ΔCpT (Jg-1K-1) 0.46 ± 0.02 0.46 ± 0.01 0.47 ± 0.01
Surface layer thickness (nm) 2.23 ± 0.18 0.22 ± 0.07
volume fraction of upper Tg material 0.18 ± 0.01 0.13 ± 0.01
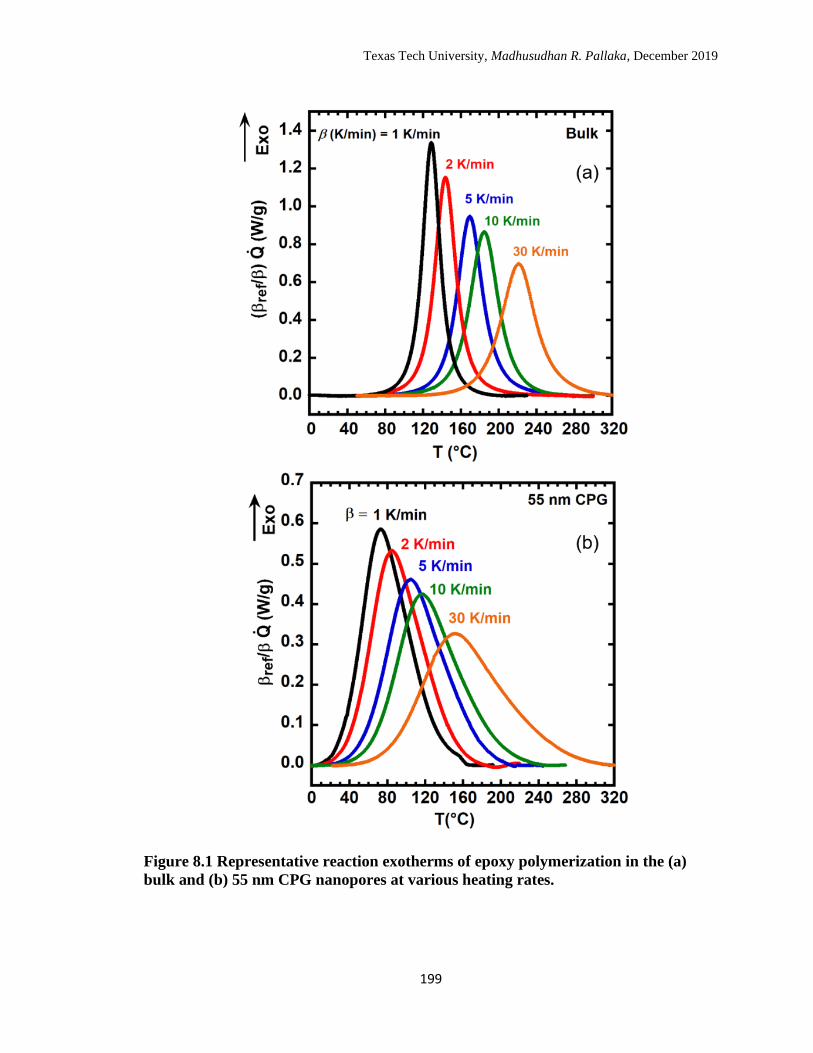
Texas Tech University, Madhusudhan R. Pallaka, December 2019
199
Figure 8.1 Representative reaction exotherms of epoxy polymerization in the (a)
bulk and (b) 55 nm CPG nanopores at various heating rates.
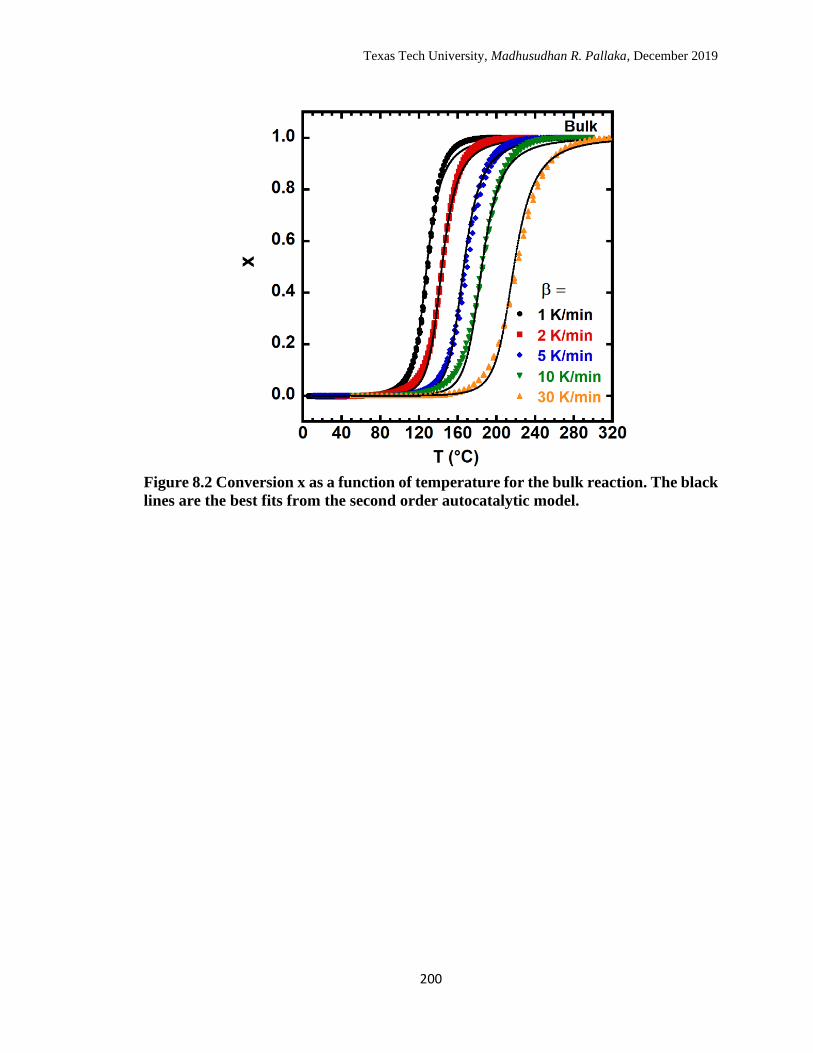
Texas Tech University, Madhusudhan R. Pallaka, December 2019
200
Figure 8.2 Conversion x as a function of temperature for the bulk reaction. The black
lines are the best fits from the second order autocatalytic model.
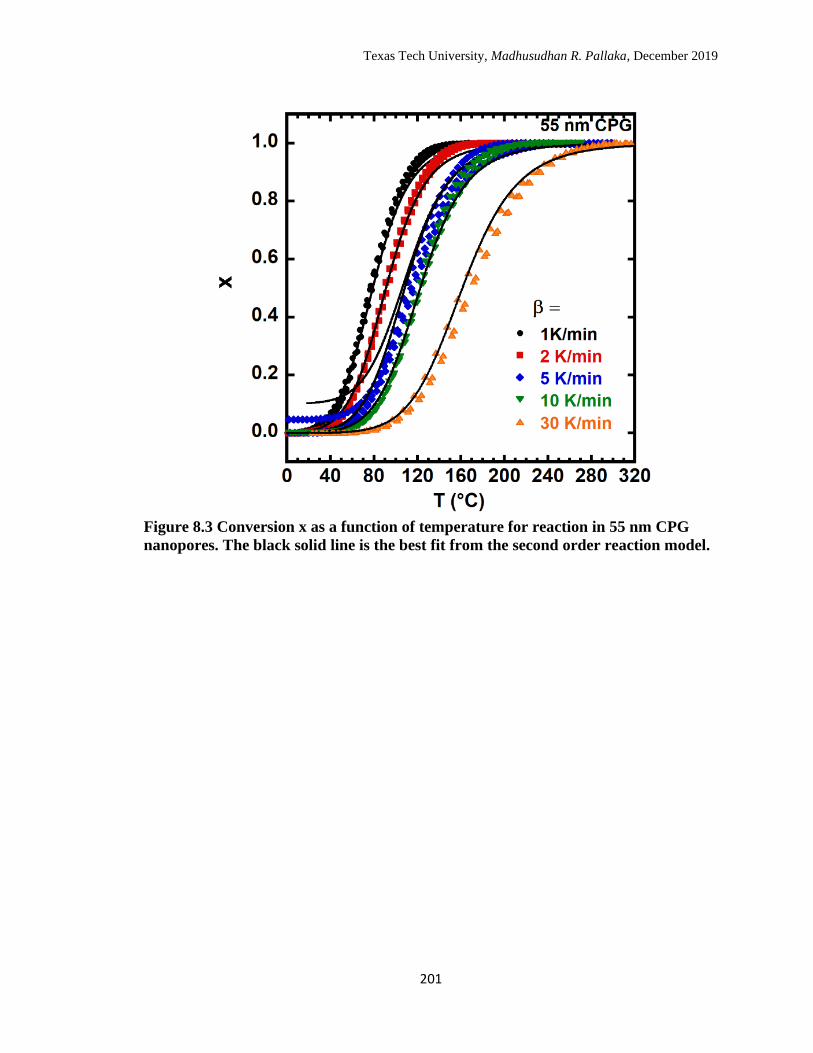
Texas Tech University, Madhusudhan R. Pallaka, December 2019
201
Figure 8.3 Conversion x as a function of temperature for reaction in 55 nm CPG
nanopores. The black solid line is the best fit from the second order reaction model.
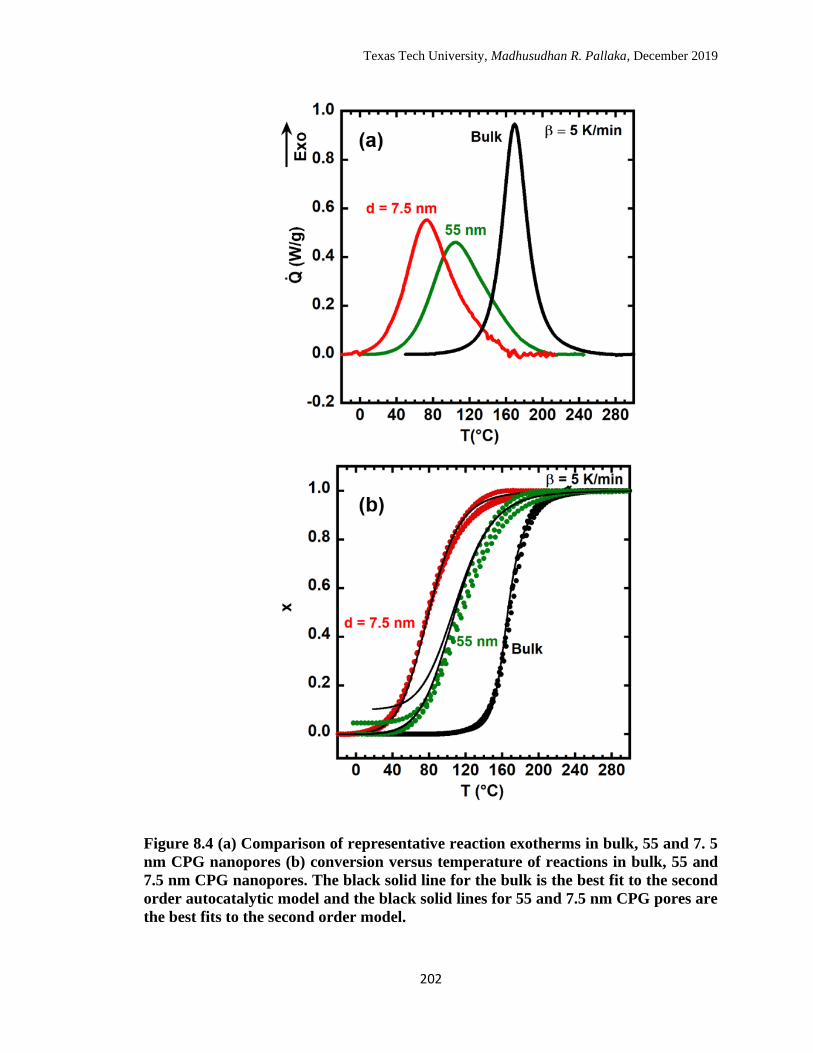
Texas Tech University, Madhusudhan R. Pallaka, December 2019
202
Figure 8.4 (a) Comparison of representative reaction exotherms in bulk, 55 and 7. 5
nm CPG nanopores (b) conversion versus temperature of reactions in bulk, 55 and
7.5 nm CPG nanopores. The black solid line for the bulk is the best fit to the second
order autocatalytic model and the black solid lines for 55 and 7.5 nm CPG pores are
the best fits to the second order model.
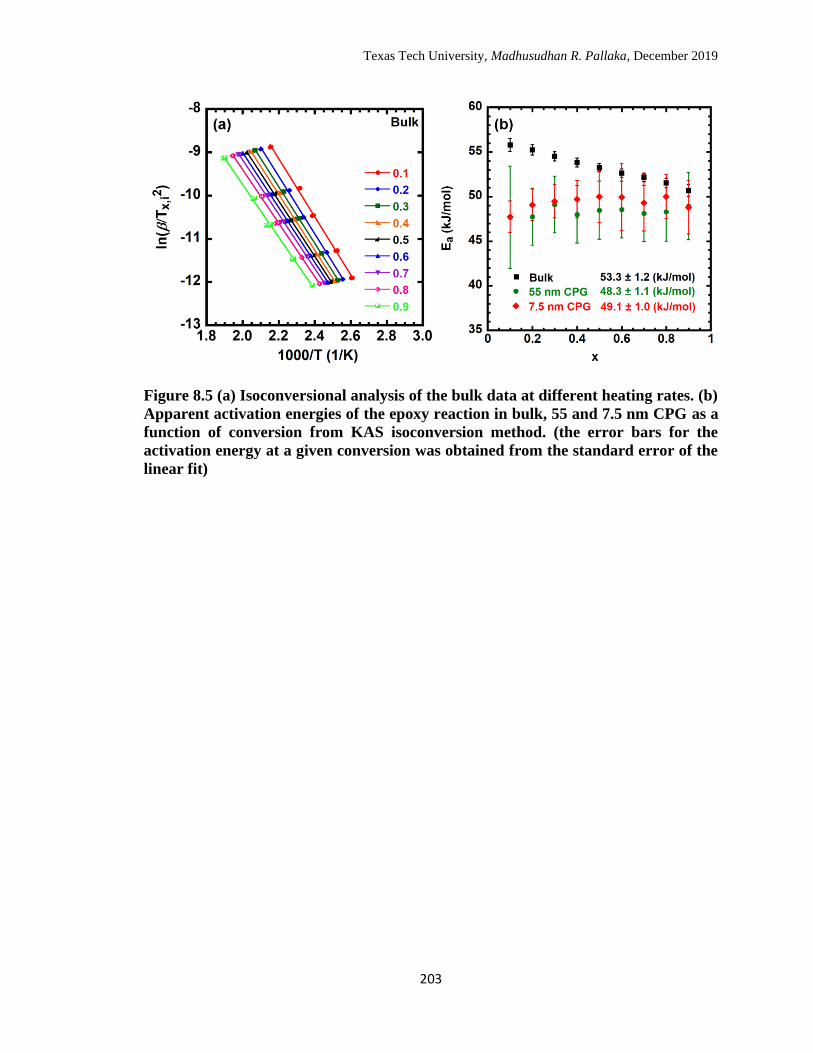
Texas Tech University, Madhusudhan R. Pallaka, December 2019
203
Figure 8.5 (a) Isoconversional analysis of the bulk data at different heating rates. (b)
Apparent activation energies of the epoxy reaction in bulk, 55 and 7.5 nm CPG as a
function of conversion from KAS isoconversion method. (the error bars for the
activation energy at a given conversion was obtained from the standard error of the
linear fit)
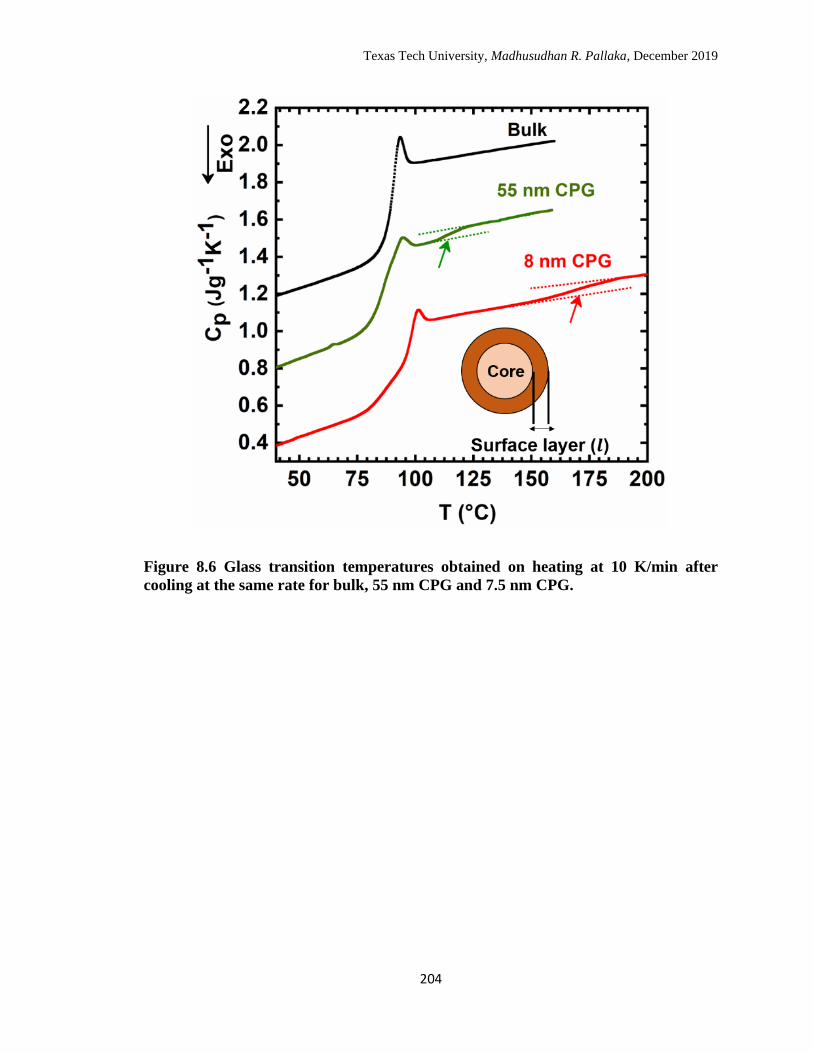
Texas Tech University, Madhusudhan R. Pallaka, December 2019
204
Figure 8.6 Glass transition temperatures obtained on heating at 10 K/min after
cooling at the same rate for bulk, 55 nm CPG and 7.5 nm CPG.
Texas Tech University, Madhusudhan R. Pallaka, December 2019
205
CHAPTER 9
CONCLUSIONS
In this dissertation, the effect of nanoconfinement on melting, glass transition,
structural recovery, and step-growth polymerization kinetics was investigated. In
addition, the origin of low-temperature endotherms and their relationship to two-step
structural recovery was also investigated. To study the effect of nanoconfinement on
melting, glass transition and structural recovery, and to investigate the origin of low-
temperature endotherms, Flash differential scanning calorimetry was used; a conventional
DSC was used to study the effect of nanoconfinement on step-growth polymerization
kinetics.
Nanoconfinement effects on the melting and solid-solid transitions of n-
hexadecane (C16H34) and n-nonadecane (C19H40) were studied in an anodic aluminum
oxide (AAO) nanoporous membrane with pore diameters of 20 and 55 nm. The major
findings are:
• AAO nanopore membranes can be used on the Flash DSC to study the
nanoconfinement effects in 2D space.
• Nanoconfined melting of n-hexadecane results in a melting point depression (∆Tm) of
4.20 ± 0.60 °C in 55 nm AAO pores and 6.01 ± 0.24 °C in 20 nm AAO pores.
• Nanoconfined melting of n-nonadecane(C19) results in a melting point depression of
2.46 ± 0.40 °C and 4.2 ± 0.51 °C in 55 and 20 nm AAO pores, whereas its solid-solid
Texas Tech University, Madhusudhan R. Pallaka, December 2019
206
transition was found to be depressed by 1.94 ± 0.15 °C and 3.01 ± 0.29 °C in 55 and
20 nm AAO pores, respectively.
• Interestingly, the size-dependent melting behavior (∆Tm vs 1/d) for both C16 and C19
does not extrapolate to the bulk melting point at infinite pore size, indicating that a
different crystal structure, perhaps a nematocrystalline state may be formed in AAO
nanopores, as backed up by X-ray diffraction.
The glass transition behavior of AAO supported and stacked polystyrene (PS)
nanorods (2D) for diameters in the range of 20-350 nm was studied using Flash
differential scanning calorimetry over four decades of cooling rates, from 0.1 – 1000 K/s.
Major findings are:
• Tg depressions of 20.1 ± 2.2 and 8.8 ± 0.7 K are observed in case of 20 and 55 nm
stacked PS nanorods dispersed in ionic liquid, whereas bulk-like behavior is observed
in the case of 350 nm PS nanorods.
• An effect of spatial dimensionality is found; the Tg depression for 20 nm 2D stacked
PS nanorods is 8 K larger when compared to that of 20 nm 1D ultrathin PS film from
previous studies.
• The size-dependent glass transition behavior of 2D stacked PS nanorods compares
well with our group’s previous studies on 1D ultrathin PS films when scaled using the
volume to surface ratio.
• In the case of AAO supported PS nanorods bulk-like behavior is observed
irrespective of confinement diameter; the behavior is consistent with similar studies
in the literature.
Texas Tech University, Madhusudhan R. Pallaka, December 2019
207
Enthalpy recovery of 2D stacked polystyrene nanorods dispersed in ionic liquid was
studied for two different rod diameters, 20 and 350 nm, using Flash Differential scanning
calorimetry. The major findings are:
• The enthalpy recovery towards equilibrium is found to be linear and monotonic for
jump sizes where structural recovery is observed (7 K to 87 K), unlike the two-step
recovery reported in the literature at aging time scales within the range used in this
work.
• Enhanced enthalpy recovery rates are observed for 20 nm stacked PS nanorods when
compared to 350 nm stacked PS nanorods at jump sizes greater than 17 K, whereas
similar enthalpy recovery rates are observed when compared at jump sizes smaller
than 17 K.
• The importance of comparing enthalpy recovery at similar jump sizes is also
highlighted, based on induction times, which are similar for stacked rods and ultrathin
films from previous studies when compared at similar jump sizes, but shorter
induction times are observed in case of 20 nm stacked PS rods when compared at
similar aging temperatures.
• The effect of spatial dimensionality on enthalpy recovery rates is found to be
insignificant when overall enthalpy recovery rates of 20 and 350 nm stacked PS
nanorods are compared with 20 nm ultrathin and bulk PS films from previous studies.
The similarity in enthalpy recovery rates is attributed to similar temperature
dependence of their respective average relaxation times.
The origin of low temperature endotherms was investigated using Flash differential
scanning calorimetry for micronsale PS thinfilms, 2D stacked PS rods, 2D AAO
Texas Tech University, Madhusudhan R. Pallaka, December 2019
208
supported PS rods, and metals, with a conclusion that the low temperature endotherms do
not exhibit physics related to the segmental or a secondary relaxation in glassy materials.
Rather, the low temperature endotherm is related to the sample and chip configuration.
Findings that lead to the aforementioned conclusion are:
• Broad low-temperature endotherms are observed for both micron-scale PS films and
20 nm stacked PS rods which were both cooling rate dependent and aging time
dependent and were found to be sample dependent for nominally the same material
investigated. For example, the areas of the low temperature endotherms decreased by
in the order of micron-scale PS film on bare chip > Krytox oil > 350 nm AAO > 55
nm AAO. In addition, a similar decrease in the low temperature endotherm area is
observed for 20 nm PS stacked nanorods dispersed ionic liquid versus the same
sample on bare chip.
• In addition to glassy polymers, the low temperature endotherms are also observed for
crystalline metals, indium and vapor-deposited gold, neither of which have
relaxations in the temperature range of interest (-80 to 110 °C).
• When enthalpy recovery of 20 nm stacked PS rods was studied with the inclusion of
the low temperature endotherm at aging temperatures -20.5, 20.5 and 80.5 °C, no
evidence of a two-step recovery was observed at timescales reported for 3D PS
nanospheres in the literature.
The reaction kinetics of linear epoxy polymerization in bulk, 55, and 7.5 nm
native controlled pore glass (CPG) nanopores was investigated using dynamic differential
scanning calorimetry (DSC). The major findings are:
Texas Tech University, Madhusudhan R. Pallaka, December 2019
209
• Polymerization is found to be accelerated in the nanopores, as indicated by a 90 and
116 K decrease in the onset temperatures of the reaction exotherm in 55 and 7.5 nm
CPG nanopores, respectively.
• The acceleration in the nanopores is quantified by initial reaction rates which are 240
and 1280 times faster in 55 and 7.5 nm CPG nanopores than in the bulk.
• The autocatalytic behavior which is observed in the bulk is found to be weakened in
the nanopores; hence, a simple second order model is used to model the nanoconfined
reaction kinetics.
• Two Tgs are observed in both 55 and 7.5 nm CPG nanopores. Tg1s are in good
agreement with the bulk values, and Tg2s are found to be elevated by 30 and 80 K in
55 and 7.5 nm CPG nanopores, respectively.
• The enhanced initial reaction rates, the weakened autocatalytic character, and elevated
Tg2s in native CPG nanopores are attributed to the surface silanol groups.
Texas Tech University, Madhusudhan R. Pallaka, December 2019
210
CHAPTER 10
FUTURE WORK
In this dissertation, Flash differential scanning calorimetry has been
predominantly used to study the nanoconfinement effects on melting, the glass transition,
and structural recovery. The ability of the Flash DSC to handle ultra-low sample masses
aided in characterizing stacked and AAO supported nanorods and previous studies on
ultrathin PS films. In addition, the main advantage of the Flash DSC is its ability to
achieve rapid scanning rates which are useful in creating high fictive temperature glasses;
and also, to suppress time sensitive processes like decomposition and crystallization. The
instruments extreme sensitivity at smaller time scales also helps in studying the enthalpy
recovery of polymers effectively. To expand the applicability of Flash DSC’s advantages,
some recommendations for future work are suggested in 10.1,10.2 and 10.3. In 10.4, a
future extension to the work described in chapter 8 is suggested.
10.1 Glass transition behavior and structural recovery of polynorbornene thin films
using Flash differential scanning calorimetry
The norbornene class of polymers are high Tg (>613 K)1-2 and high free volume3
polymers with excellent applications as membranes in butanol-water separations and gas
separations.4-5 Depending on the operating temperature the polymer is prone to physical
aging over time and may lose permeability;6 hence, studying the aging behavior of
norbornene class of polymers is relevant. Lewis and Vogt7 studied the structural
relaxation of thin films (60 nm to 2.3 µm) of a random copolymer of poly(butyl
Texas Tech University, Madhusudhan R. Pallaka, December 2019
211
norbornene) and poly(hexafluoroisopropyl norbornene) using ellipsometry and observed
structural relaxation even at 303 K (Tg -300 K) In addition, the aging rates decreased with
decreasing film thickness and increasing aging temperatures. This somewhat surprising
result warrants enthalpy recovery studies on the same norbornene copolymer for various
film thicknesses using Flash DSC. In addition, the use of Flash DSC will also help in
suppressing the side reactions that prevent annealing above Tg by employing ultra-fast
heating rates (1000 K/s) which have been successfully used in suppressing the
degradation of silk fibroin proteins8-9 and sucrose10. In addition to the enthalpy recovery
studies, the study of the size-dependent glass transition behavior of nanoscale thin films
of a polynorbornene copolymer is also interesting. Interestingly, previous studies on a
similar norbornene polymer did not result in any Tg depression because of the presence of
s rigid bicyclic backbone11 Generally, lack of Tg depression in nanoscale films implies
bulk-like mobility, which means the structural recovery process is expected to be size
independent which is contrary to Vogt and co-workers’7 finding, thus making the
investigation of structural recovery kinetics of norbornene polymers more interesting.
10.2 Glass transition behavior and enthalpy relaxation of thermoplastic epoxy
reinforced with multi-walled carbon nanotubes using Flash DSC
In general epoxy polymers are good insulators, but due to their excellent
mechanical properties they are preferred as a polymer matrix in thermal interface
materials (TIM) which are used in microelectronic packaging to plug voids in heat sinks
for efficient heat transfer.12 Since the epoxy polymer matrix has insulating properties,
thermally conductive fillers like carbon nanotubes are used to significantly enhance the
thermal conductivity; at optimum loadings (5-6 vol %)13of carbon nanotubes a 200 %
Texas Tech University, Madhusudhan R. Pallaka, December 2019
212
increase in thermal conductivity has been observed.12, 14-16 Recently, thermoplastic epoxy
polymers are being used as a polymer matrix in thermal interface materials owing to the
relative ease in impregnating fillers into the matrix.17 Since thermal interface materials
operate at temperatures where physical aging is relevant, the study of glass transition and
related behavior for a model thermoplastic epoxy polymer reinforced with multi-walled
carbon nanotubes (MWCNTs) is important; generally, an increase in the glass transition
temperature has been reported for MWCNT filled epoxy polymer18, but most studies lack
direct impregnation of MWCNTs into the polymer, rather, MWCNTs are dispersed into
the epoxy resin before curing. The objective of this suggested future study is to
investigate the glass transition behavior and enthalpy relaxation of thermoplastic epoxy
(DGEBA + Aniline) reinforced with multi-walled carbon nanotubes, where the carbon
nanotube reinforced thermoplastic epoxy will be prepared by first dissolving a chosen
weight percent of neat epoxy polymer in HPLC grade THF solvent, and then MWCNTs
will be dispersed into the dissolved solution by ultrasonication. The polymer solution
with dispersed MWCNTs will be spin coated into thin films. The glass transition and
enthalpy relaxation behavior will be studied as function of MWCNT loading in the
thermoplastic epoxy film.
10.3 Obtaining three Kovacs’ signatures of structural recovery for 20 nm stacked
PS rods and 20 nm ultrathin PS film, and modeling with the modified TNM model
In chapter 7 of this dissertation, we have performed enthalpy recovery
measurements on 20 nm stacked PS nanorods. An interesting finding in that work is that
similar enthalpy recovery rates were observed for 20 nm stacked PS nanorods and 20 nm
ultrathin PS film. In order to better understand the kinetics of structural recovery of 2D
Texas Tech University, Madhusudhan R. Pallaka, December 2019
213
20 nm stacked rods and 1D 20 nm ultrathin film, one of the recommendations for future
work is to extend the enthalpy recovery experiments to obtain Kovacs’19 other signatures
of structural recovery, asymmetry of approach and memory effect. As a second
recommendation, the modeling of enthalpy recovery data of 20 nm stacked PS rods and
20 nm ultrathin film using Grassia and Simon’s modified TNM model20-21 is suggested.
The applicability of modified TNM model for nanoconfined data can also be elucidated
in this suggested study. The modified TNM model uses an odd symmetric function of
WLF equation to extend the temperature range of relaxation times to incorporate both
non-equilibrium glassy states and equilibrium liquid states,20-21 and the modified TNM
model requires only the fit of two parameters along with the WLF parameters obtained
from cooling rate dependent experiments.20-21
10.4 Reaction kinetics of alumina and silica filled epoxy polymerization
The reaction kinetics of epoxy polymerization in bulk, 55 and 7.5 nm CPG
nanopores have been discussed in Chapter 8, where accelerated initial reaction rates were
observed in 55 and 7.5 nm CPG nanopores when compared to the bulk. The magnitudes
of acceleration were found to be 240 and 1280 times in 55 and 7.5 nm CPG nanopores,
respectively; in addition, the acceleration factor was found to be higher in the case of
reaction in 55 nm CPG nanopores than that observed by Tarnacka and co-workers22 for
the same epoxy polymerization reaction in 35 nm AAO nanopores despite presumably
having lower a density of hydroxy groups on the nanopore surface (4 OH/nm2 in CPG23
versus 19 OH/nm2 in AAO24) and larger nanopore diameter. The enhanced reaction
kinetics under nanoconfinement is generally understood to be due to a combination of
nanoconfinement and surface effects. In the study reported in chapter 8 and the study by
Texas Tech University, Madhusudhan R. Pallaka, December 2019
214
Tarnacka and co-workers, native nanopores with surface hydroxyl groups were used,
resulting in an enhanced reaction rate of epoxy polymerization in addition to the
nanoconfinement effect. In order to understand the exact reason for enhanced reaction
kinetics in CPG nanopores when compared to AAO nanopores, separating the
nanoconfinement effect and surface effect is important. Attempt to study the
nanoconfinement effect alone using silianized CPG nanopores (trimethylsilyl groups)
was not successful because of poor wetting and plug formation of DGEBA + Aniline
liquid mixture in silanized CPG nanopores. Therefore, future recommendation is to study
the surface effect or the influence of hydroxyl groups and types of hydroxyl groups (Si-
OH and Al-OH) on the reaction kinetics of DGEBA + Aniline polymerization by adding
silica and alumina nanoparticles as fillers. The future study has two objectives: 1) To
compare the reaction kinetics with silica and alumina nano particles as a function of
hydroxyl concentration. 2) To compare the reaction kinetics of silica nanoparticles and
CPG nanopores at similar hydroxyl concentrations. In addition, to ensure homogenous
dispersion of particles ultrasonication method may be used.
Texas Tech University, Madhusudhan R. Pallaka, December 2019
215
References
1. Henschke, O.; Köller, F.; Arnold, M., Polyolefins with high glass transition
temperatures. Macromol. Rapid Commun. 1997, 18 (7), 617-623.
2. Bergström, C. H.; Seppälä, J. V., Effects of polymerization conditions when
making norbornene‐ethylene copolymers using the metallocene catalyst ethylene
bis (indenyl) zirconium dichloride and MAO to obtain high glass transition
temperatures. J. Appl. Polym. Sci. 1997, 63 (8), 1063-1070.
3. Wilks, B. R.; Chung, W. J.; Ludovice, P. J.; Rezac, M. R.; Meakin, P.; Hill, A. J.,
Impact of average free‐volume element size on transport in stereoisomers of
polynorbornene. I. Properties at 35° C. J. Polym. Sci., Part B: Polym. Phys. 2003,
41 (18), 2185-2199.
4. Kim, D.-G.; Takigawa, T.; Kashino, T.; Burtovyy, O.; Bell, A.; Register, R. A.,
Hydroxyhexafluoroisopropylnorbornene block and random copolymers via vinyl
addition polymerization and their application as biobutanol pervaporation
membranes. Chem. Mater. 2015, 27 (19), 6791-6801.
5. Knapp, B.; Elce, E.; Bedwell, B.; Langsdorf, L. J.; Wilks, R., Polynorbornene
pervaporation membrane films, preparation and use thereof. Google Patents: 2012.
6. Yin, H.; Chapala, P.; Bermeshev, M.; Schonhals, A.; Bohning, M., Molecular
mobility and physical aging of a highly permeable glassy polynorbornene as
revealed by dielectric spectroscopy. ACS Macro Letters 2017, 6 (8), 813-818.
7. Lewis, E. A.; Vogt, B. D., Thickness dependence of structural relaxation in spin‐
cast polynorbornene films with high glass transition temperatures (> 613 K). J.
Polym. Sci., Part B: Polym. Phys. 2018, 56 (1), 53-61.
8. Cebe, P.; Hu, X.; Kaplan, D. L.; Zhuravlev, E.; Wurm, A.; Arbeiter, D.; Schick, C.,
Beating the heat-fast scanning melts silk beta sheet crystals. Scientific reports 2013,
3.
9. Cebe, P.; Partlow, B. P.; Kaplan, D. L.; Wurm, A.; Zhuravlev, E.; Schick, C., Using
flash DSC for determining the liquid state heat capacity of silk fibroin.
Thermochim. Acta 2015, 615, 8-14.
10. Magoń, A.; Wurm, A.; Schick, C.; Pangloli, P.; Zivanovic, S.; Skotnicki, M.; Pyda,
M., Heat capacity and transition behavior of sucrose by standard, fast scanning and
temperature-modulated calorimetry. Thermochim. Acta 2014, 589, 183-196.
11. Torres, J. M.; Wang, C.; Coughlin, E. B.; Bishop, J. P.; Register, R. A.; Riggleman,
R. A.; Stafford, C. M.; Vogt, B. D., Influence of chain stiffness on thermal and
mechanical properties of polymer thin films. Macromolecules 2011, 44 (22), 9040-
9045.
Texas Tech University, Madhusudhan R. Pallaka, December 2019
216
12. Biercuk, M.; Llaguno, M. C.; Radosavljevic, M.; Hyun, J.; Johnson, A. T.; Fischer,
J. E., Carbon nanotube composites for thermal management. Appl. Phys. Lett. 2002,
80 (15), 2767-2769.
13. Yu, A.; Ramesh, P.; Itkis, M. E.; Bekyarova, E.; Haddon, R. C., Graphite
nanoplatelet− epoxy composite thermal interface materials. The Journal of Physical
Chemistry C 2007, 111 (21), 7565-7569.
14. Han, Z.; Fina, A., Thermal conductivity of carbon nanotubes and their polymer
nanocomposites: A review. Prog. Polym. Sci. 2011, 36 (7), 914-944.
15. Saw, W. S.; Mariatti, M., Properties of synthetic diamond and graphene
nanoplatelet-filled epoxy thin film composites for electronic applications. Journal
of Materials Science: Materials in Electronics 2012, 23 (4), 817-824.
16. Xu, X.; Thwe, M. M.; Shearwood, C.; Liao, K., Mechanical properties and
interfacial characteristics of carbon-nanotube-reinforced epoxy thin films. Appl.
Phys. Lett. 2002, 81 (15), 2833-2835.
17. Imanishi, T., In-situ polymerizable thermoplastic epoxy resin and high performance
FRTP using it and fiber fabrics. Proceedings of 16th ICCM, 2007 2007, 1, 194-195.
18. Thakre, P. R.; Bisrat, Y.; Lagoudas, D. C., Electrical and mechanical properties of
carbon nanotube‐epoxy nanocomposites. J. Appl. Polym. Sci. 2010, 116 (1), 191-
202.
19. Kovacs, A. J.; Aklonis, J. J.; Hutchinson, J. M.; Ramos, A. R., Isobaric volume and
enthalpy recovery of glasses. II. A transparent multiparameter theory. Journal of
Polymer Science: Polymer Physics Edition 1979, 17 (7), 1097-1162.
20. Grassia, L.; Koh, Y. P.; Rosa, M.; Simon, S. L., Complete set of enthalpy recovery
data using Flash DSC: experiment and modeling. Macromolecules 2018, 51 (4),
1549-1558.
21. Koh, Y. P.; Grassia, L.; Simon, S. L., Structural recovery of a single polystyrene
thin film using nanocalorimetry to extend the aging time and temperature range.
Thermochim. Acta 2015, 603, 135-141.
22. Tarnacka, M.; Dulski, M.; Starzonek, S.; Adrjanowicz, K.; Mapesa, E. U.;
Kaminski, K.; Paluch, M., Following kinetics and dynamics of DGEBA-aniline
polymerization in nanoporous native alumina oxide membranes–FTIR and
dielectric studies. Polymer 2015, 68, 253-261.
23. Zhuravlev, L., Concentration of hydroxyl groups on the surface of amorphous
silicas. Langmuir 1987, 3 (3), 316-318.
24. Tsyganenko, A. A.; Mardilovich, P. P., Structure of alumina surfaces. J. Chem.
Soc., Faraday Trans. 1996, 92 (23), 4843-4852.