Embed Size (px)
Citation preview
Texas High Plains Vegetable & Weed Control Research Program
Research Summary Reports
2008
Texas A & M University
Department of Horticultural Sciences Texas AgriLife Research & Extension Center
Russell W. Wallace, Ph.D. Extension Vegetable & Weed Specialist
Alisa K. Petty
Research Technician
2
Table of Contents Page No. INTRODUCTION ………………………………………………………………………………………………....... 3 ACKNOWLEDGEMENTS…………………………………………………………………………………………. 4 COOPERATORS………………………………………………………………………………………………….... 4 CHEMICAL LIST………………………………………………………………………………………………….... 5 MAXIMUM DAILY TEMPERATURES AND MONTHLY RAINFALL ………………………………………… 7
RESULTS OF HIGH PLAINS TRIALS 8 Herbicides and Weed Control
Herbicide screen for mustard and collard greens ………………………………………………………………. 9
Selected herbicides for weed control and injury in processing cucumbers ………………………………….. 11
Evaluation of selected herbicides for weed control and injury in yellow squash ……………………………. 13
Evaluation of selected herbicides for in direct-seeded watermelon ………………………………………….. 15
Evaluation of V-10142 & Chateau for weed control and injury in chile & bell peppers …………………….. 17
Evaluation of post-applied herbicides on crop injury in processing snap beans ……………………………. 20
Evaluation of herbicides for weed control and injury in pumpkins ……………………………………………. 22
Evaluation of an experimental nematicide for crop injury, yield and nematode control in peppers …….… 24
Evaluation of an experimental nematicide for crop injury, yield and nematode control in tomatoes ……… 29
Evaluation of experimental nematicide for crop injury, yield and nematode control in cucumbers ………. 34
Variety, Fertility and Cultural Practices
Effect of Nitamin 30L Foliar spray on nitrogen leaf uptake ……………………………………………………. 38
Evaluation of snap bean varieties for heat tolerance and yield on the Texas High Plains (I) ……………... 40
Evaluation of snap bean varieties for heat tolerance and yield on the Texas High Plains (II) …………….. 44
Evaluation of selected pumpkin varieties grown on the Texas High Plains …………………………………. 45
Evaluation of watermelons varieties for production on the Texas High Plains ……………………………… 48
Evaluation of selected tomato varieties for heat tolerance and yield ………………………………………… 50
RESULTS OF WINTERGARDEN TRIALS 54 Herbicide evaluation for crop injury on spinach grown in the Wintergarden ………………………………… 55
Evaluation of herbicides and selected rates on spinach grown at three densities …………………………. 59
Effect of Nitamin 30L Foliar and Nfusion Blend fertilizers on spinach yield …………………………………. 62
Evaluation of herbicides on beet greens, Swiss chard and spinach …………………...……………………..
64
3
INTRODUCTION: The High Plains Vegetable & Weed Control Research Program is located at the Texas AgriLife Research & Extension Center in Lubbock. The primary objective of the program is to evaluate herbicides and other weed control option, as well as crop production practices and varieties for vegetables produced on the Texas High Plains, as well as leafy green vegetables grown in the Wintergarden Region, and to assist with vegetable research in cooperation with other universities through the United States. This program would not be successful without the support staff, private companies, government agencies and volunteers. Many thanks are given to Alisa K. Petty, Vegetable Research Technician at Lubbock and to summer assistant Brad for their assistance with field work and data collection during the season. The assistance and expertise of Jenifer Smith (Farm Director) and Debbie Cline and Roy Riddle with vegetable trials conducted at the Carolyn Lanier Youth Farm supported by the South Plains Food Bank are greatly appreciated. Also, many thanks to Wendy Durrett, Extension Secretary for her office support. Notice: This report is not intended as a book of recommendations for using unregistered pesticides on field or homegrown vegetables crops in Texas. Growers and home gardeners should always read and follow label directions of any pesticides or other chemicals used in production of vegetables.
For more information, phone: 806-746-6101 or email at [email protected]
High Plains Vegetable Website: http://lubbock.tamu.edu/horticulture/

4
ACKNOWLEDGEMENTS: Listed below are those who financially and/or otherwise supported the vegetable program during 2008. Without their support this program would not be possible. Financial Support – Allens, Inc. Aceto
Texas AgriLife Extension Service - Statewide Watermelon Project
Georgia-Pacific
Pesticide Management Alternatives Program USDA-CSREES
Wintergarden Spinach Producers Board
Valent BioSciences
USDA-CSREES Specialty Crops Research Initiative
Products and Other In-Kind Donations – South Plains Food Bank Farm Bayer CropScience Dewitt Seed Company Del Monte Company Dow AgroSciences Allens, Inc. Gowan Company Willhite Seeds Harris Moran Valent BioSciences Siegers Seed Netafim USA Hollar Seeds Pure Line Seeds Kimberly Seeds Seminis Seeds Asgrow/Seminis Seed Champion Seeds Syngenta/Rogers Seed Syngenta Crop Protection Hazera Seeds COOPERATORS: Texas AgriLife Research & Extension Dr. Juan Anciso, Dr. Larry Stein, Mike Foster,
Dr. Ron French, Dr. Terry Wheeler Allen’s, Inc.
William Russell, Doug Dillon
Del Monte Research Farm (Crystal City)
Allen Mize, Aaron Phillips, Cruz Hernandez
South Plains Food Bank
Jenifer Smith, Debbie Cline, Roy Riddle
Cornell University
Dr. Robin Bellinder
5
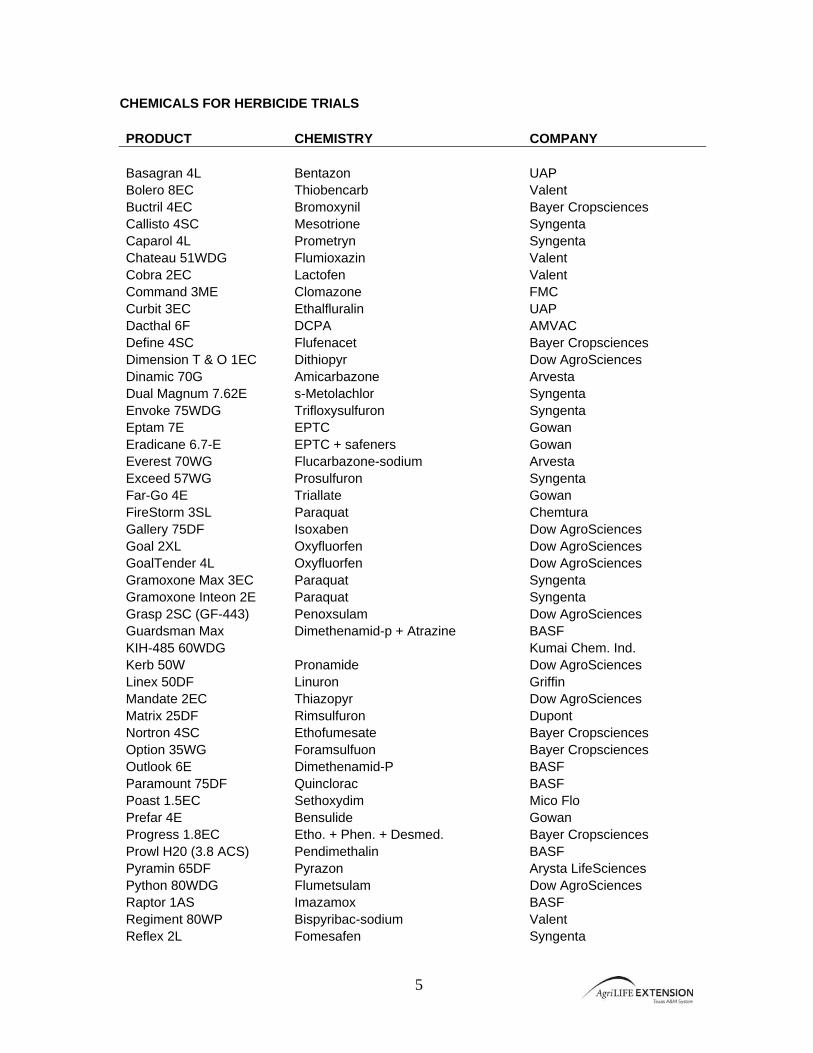
CHEMICALS FOR HERBICIDE TRIALS PRODUCT CHEMISTRY COMPANY Basagran 4L Bentazon UAP Bolero 8EC Thiobencarb Valent Buctril 4EC Bromoxynil Bayer Cropsciences Callisto 4SC Mesotrione Syngenta Caparol 4L Prometryn Syngenta Chateau 51WDG Flumioxazin Valent Cobra 2EC Lactofen Valent Command 3ME Clomazone FMC Curbit 3EC Ethalfluralin UAP Dacthal 6F DCPA AMVAC Define 4SC Flufenacet Bayer Cropsciences Dimension T & O 1EC Dithiopyr Dow AgroSciences Dinamic 70G Amicarbazone Arvesta Dual Magnum 7.62E s-Metolachlor Syngenta Envoke 75WDG Trifloxysulfuron Syngenta Eptam 7E EPTC Gowan Eradicane 6.7-E EPTC + safeners Gowan Everest 70WG Flucarbazone-sodium Arvesta Exceed 57WG Prosulfuron Syngenta Far-Go 4E Triallate Gowan FireStorm 3SL Paraquat Chemtura Gallery 75DF Isoxaben Dow AgroSciences Goal 2XL Oxyfluorfen Dow AgroSciences GoalTender 4L Oxyfluorfen Dow AgroSciences Gramoxone Max 3EC Paraquat Syngenta Gramoxone Inteon 2E Paraquat Syngenta Grasp 2SC (GF-443) Penoxsulam Dow AgroSciences Guardsman Max Dimethenamid-p + Atrazine BASF KIH-485 60WDG Kumai Chem. Ind. Kerb 50W Pronamide Dow AgroSciences Linex 50DF Linuron Griffin Mandate 2EC Thiazopyr Dow AgroSciences Matrix 25DF Rimsulfuron Dupont Nortron 4SC Ethofumesate Bayer Cropsciences Option 35WG Foramsulfuon Bayer Cropsciences Outlook 6E Dimethenamid-P BASF Paramount 75DF Quinclorac BASF Poast 1.5EC Sethoxydim Mico Flo Prefar 4E Bensulide Gowan Progress 1.8EC Etho. + Phen. + Desmed. Bayer Cropsciences Prowl H20 (3.8 ACS) Pendimethalin BASF Pyramin 65DF Pyrazon Arysta LifeSciences Python 80WDG Flumetsulam Dow AgroSciences Raptor 1AS Imazamox BASF Regiment 80WP Bispyribac-sodium Valent Reflex 2L Fomesafen Syngenta

6
PRODUCT
CHEMISTRY
COMPANY
Rely 1EC Glufosinate-ammonium Bayer Cropsciences Ro-Neet 6E Cycloate Helm-Agro Roundup Original Max Glyphosate Monsanto Sandea 75WDG Halosulfuron Gowan Select 2EC Clethodim Valent Sencor 75DF Metribuzin Bayer Cropsciences Solicam DF Norflurazon Syngenta Spartan 75WDG Sulfentrazone FMC Spin-Aid 1.3EC Phenmedipham Bayer Cropsciences Starane 1.5EC Fluroxypyr Dow AgroSciences Stinger 3EC Clopyralid Dow AgroSciences Strategy Ethalfluralin + Clomazone UAP Suprend 80WDG Prometryn + Trifloxysulfuron Syngenta Surflan A.S. Oryzalin Dow AgroSciences Targa Quizalafop Gowan Target 6Plus MCPA Thistrol 2EC MCPB Nu-Farm Americas UltraBlazer 2EC Acifluorfen-sodium BASF UpBeet 50DF Triflusulfuron-methyl Dupont V-10142 75WDG Imazosulfuron Valent V-10146 3.3SC Unknown Valent Valor 51WDG Flumioxazin Valent Valor SX 51WDG Flumioxazin Valent PRODUCT CHEMISTRY COMPANY SURFACTANTS Activator 90 NIS UAP Herbimax COC UAP Superb HC COC Agriliance Class Act Next Gen. Corn-based NIS + Amm. Sulf. Agriliance Preference Soybean NIS Agriliance Prime Oil Petroleum-based COC Agriliance Interlock Penetrant/Drift Reduction Agriliance

7
Maximum Daily Temperatures and Monthly Rainfall
at the Texas AgriLife Research & Extension Center - Lubbock
Day of the
Week
April
May
June
July
August
Sept.
Oct. 1 62.1 89.1 104.3 88.1 96.1 86.5 82.7
2 58.3 74.8 103.6 89.3 95.0 88.8 81.1
3 83.0 69.2 101.8 89.1 95.7 73.6 86.9
4 67.0 80.3 103.0 87.8 97.1 84.5 84.2
5 78.9 91.6 96.8 92.1 98.2 90.6 68.1
6 76.8 80.0 94.3 89.0 93.7 90.1 70.6
7 87.5 66.9 96.8 87.9 87.7 85.4 75.4
8 71.3 83.2 99.2 85.0 91.5 68.9 80.8
9 52.4 81.1 86.3 81.5 95.9 69.5 79.3
10 65.2 88.1 98.5 90.6 95.2 72.0 85.7
11 61.5 71.8 105.9 96.4 87.7 70.7 72.4
12 61.7 92.5 100.2 93.9 91.0 81.0 67.7
13 65.9 86.6 96.5 79.7 92.8 81.6 71.5
14 77.5 67.5 99.1 84.1 90.7 73.3 52.0
15 87.0 65.3 101.4 85.5 82.4 72.9 62.5
16 89.7 73.0 103.6 84.0 75.1 78.0 66.4
17 68.2 75.4 85.5 89.1 75.3 77.3 76.6
18 74.3 88.2 90.4 90.1 81.0 76.7 74.2
19 86.9 97.3 95.9 90.3 76.3 78.1 80.6
20 88.1 88.7 88.2 90.3 80.2 79.8 78.6
21 N/A 96.8 87.9 93.9 88.2 80.2 74.8
22 N/A 93.7 91.5 94.3 90.6 80.5 61.9
23 73.6 95.8 95.8 94.0 87.6 81.0 63.3
24 91.2 89.6 89.9 92.7 88.3 83.3 75.6
25 74.2 92.4 91.3 90.1 87.6 79.9 75.4
26 81.2 94.0 96.2 91.9 88.7 81.1 74.4
27 65.1 92.2 97.8 96.1 90.3 83.5 62.0
28 81.6 76.9 94.5 98.0 86.3 81.5 73.6
29 88.1 89.6 75.7 93.5 87.2 83.9 78.8
30 94.4 97.3 85.9 94.0 79.4 84.2 82.8
31 104.1 98.6 83.0 81.0
Total Rainfall (inches)
0.82 3.95 0.92 0.15 0.53 8.35 3.06

8
Trial Results for the Texas High Plains
9
Herbicide Screen for Mustard and Collard Greens
Russell W. Wallace & Alisa K. Petty
Texas AgriLife Research & Extension Center - Lubbock
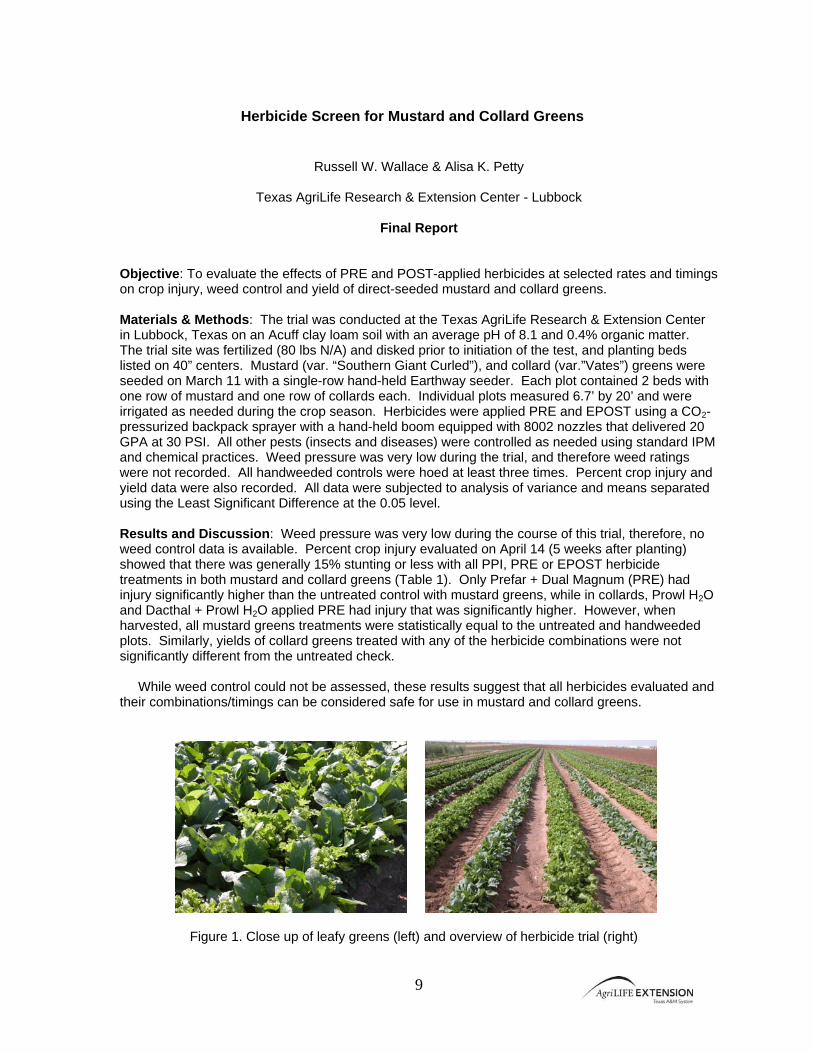
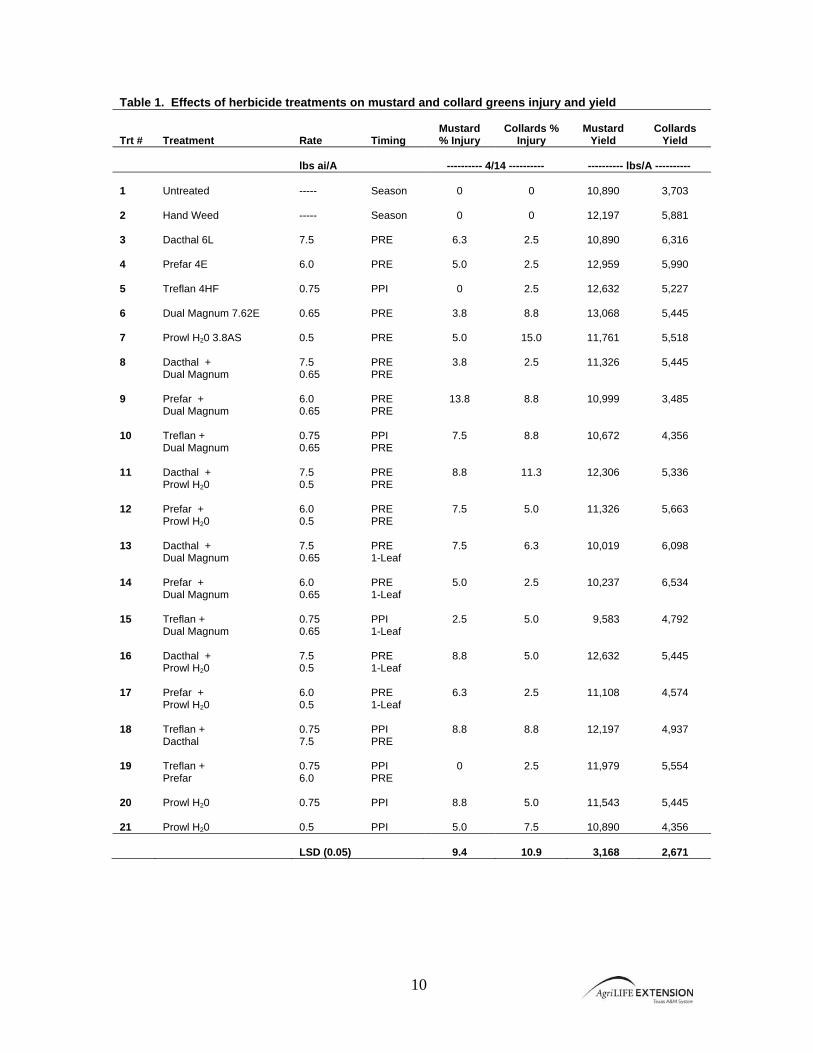
Final Report Objective: To evaluate the effects of PRE and POST-applied herbicides at selected rates and timings on crop injury, weed control and yield of direct-seeded mustard and collard greens. Materials & Methods: The trial was conducted at the Texas AgriLife Research & Extension Center in Lubbock, Texas on an Acuff clay loam soil with an average pH of 8.1 and 0.4% organic matter. The trial site was fertilized (80 lbs N/A) and disked prior to initiation of the test, and planting beds listed on 40” centers. Mustard (var. “Southern Giant Curled”), and collard (var.”Vates”) greens were seeded on March 11 with a single-row hand-held Earthway seeder. Each plot contained 2 beds with one row of mustard and one row of collards each. Individual plots measured 6.7’ by 20’ and were irrigated as needed during the crop season. Herbicides were applied PRE and EPOST using a CO2-pressurized backpack sprayer with a hand-held boom equipped with 8002 nozzles that delivered 20 GPA at 30 PSI. All other pests (insects and diseases) were controlled as needed using standard IPM and chemical practices. Weed pressure was very low during the trial, and therefore weed ratings were not recorded. All handweeded controls were hoed at least three times. Percent crop injury and yield data were also recorded. All data were subjected to analysis of variance and means separated using the Least Significant Difference at the 0.05 level. Results and Discussion: Weed pressure was very low during the course of this trial, therefore, no weed control data is available. Percent crop injury evaluated on April 14 (5 weeks after planting) showed that there was generally 15% stunting or less with all PPI, PRE or EPOST herbicide treatments in both mustard and collard greens (Table 1). Only Prefar + Dual Magnum (PRE) had injury significantly higher than the untreated control with mustard greens, while in collards, Prowl H2O and Dacthal + Prowl H2O applied PRE had injury that was significantly higher. However, when harvested, all mustard greens treatments were statistically equal to the untreated and handweeded plots. Similarly, yields of collard greens treated with any of the herbicide combinations were not significantly different from the untreated check. While weed control could not be assessed, these results suggest that all herbicides evaluated and their combinations/timings can be considered safe for use in mustard and collard greens.
Figure 1. Close up of leafy greens (left) and overview of herbicide trial (right)
10
Table 1. Effects of herbicide treatments on mustard and collard greens injury and yield Trt #
Treatment
Rate
Timing
Mustard % Injury
Collards %
Injury
Mustard
Yield
Collards
Yield
lbs ai/A
---------- 4/14 ----------
---------- lbs/A ---------- 1
Untreated
-----
Season
0
0
10,890
3,703
2
Hand Weed
-----
Season
0
0
12,197
5,881
3
Dacthal 6L
7.5
PRE
6.3
2.5
10,890
6,316
4
Prefar 4E
6.0
PRE
5.0
2.5
12,959
5,990
5
Treflan 4HF
0.75
PPI
0
2.5
12,632
5,227
6
Dual Magnum 7.62E
0.65
PRE
3.8
8.8
13,068
5,445
7
Prowl H20 3.8AS
0.5
PRE
5.0
15.0
11,761
5,518
8
Dacthal + Dual Magnum
7.5 0.65
PRE PRE
3.8
2.5
11,326
5,445
9
Prefar + Dual Magnum
6.0 0.65
PRE PRE
13.8
8.8
10,999
3,485
10
Treflan + Dual Magnum
0.75 0.65
PPI PRE
7.5
8.8
10,672
4,356
11
Dacthal + Prowl H20
7.5 0.5
PRE PRE
8.8
11.3
12,306
5,336
12
Prefar + Prowl H20
6.0 0.5
PRE PRE
7.5
5.0
11,326
5,663
13
Dacthal + Dual Magnum
7.5 0.65
PRE 1-Leaf
7.5
6.3
10,019
6,098
14
Prefar + Dual Magnum
6.0 0.65
PRE 1-Leaf
5.0
2.5
10,237
6,534
15
Treflan + Dual Magnum
0.75 0.65
PPI 1-Leaf
2.5
5.0
9,583
4,792
16
Dacthal + Prowl H20
7.5 0.5
PRE 1-Leaf
8.8
5.0
12,632
5,445
17
Prefar + Prowl H20
6.0 0.5
PRE 1-Leaf
6.3
2.5
11,108
4,574
18
Treflan + Dacthal
0.75 7.5
PPI PRE
8.8
8.8
12,197
4,937
19
Treflan + Prefar
0.75 6.0
PPI PRE
0
2.5
11,979
5,554
20
Prowl H20
0.75
PPI
8.8
5.0
11,543
5,445
21
Prowl H20
0.5
PPI
5.0
7.5
10,890
4,356
LSD (0.05)
9.4
10.9
3,168
2,671
11
Selected Herbicides for Weed Control and Injury in Processing Cucumbers
Russell W. Wallace & Alisa K. Petty
Texas AgriLife Research & Extension Center - Lubbock
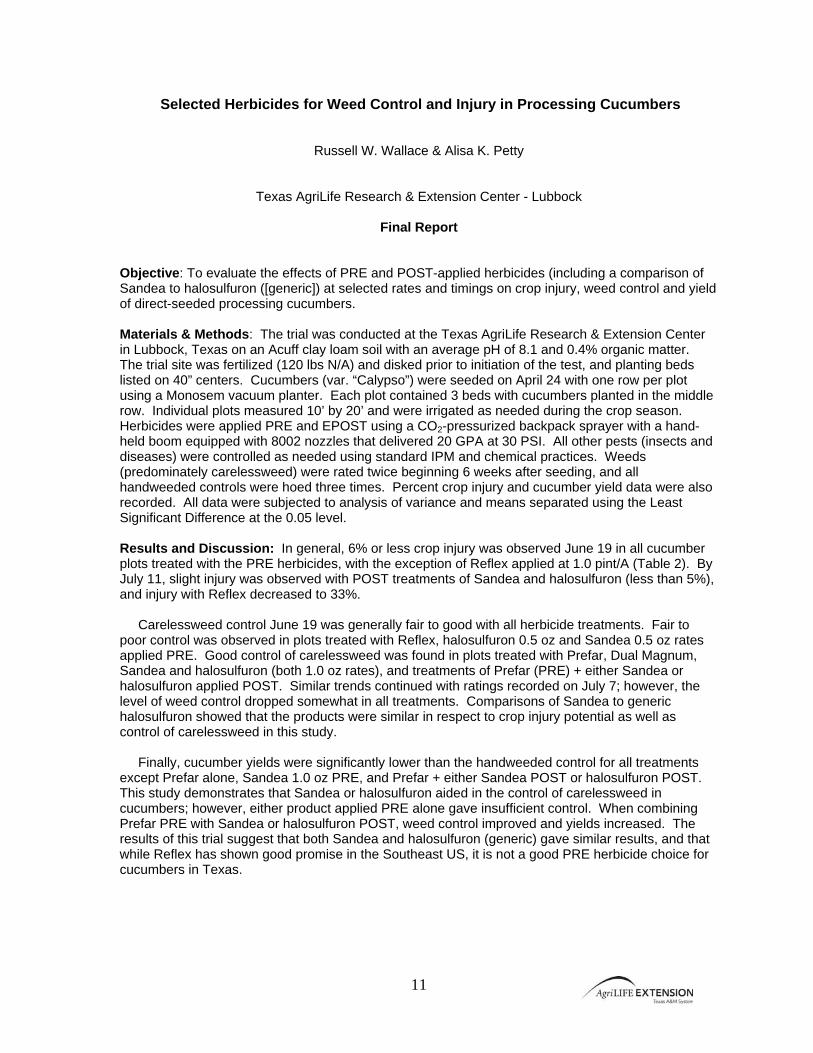
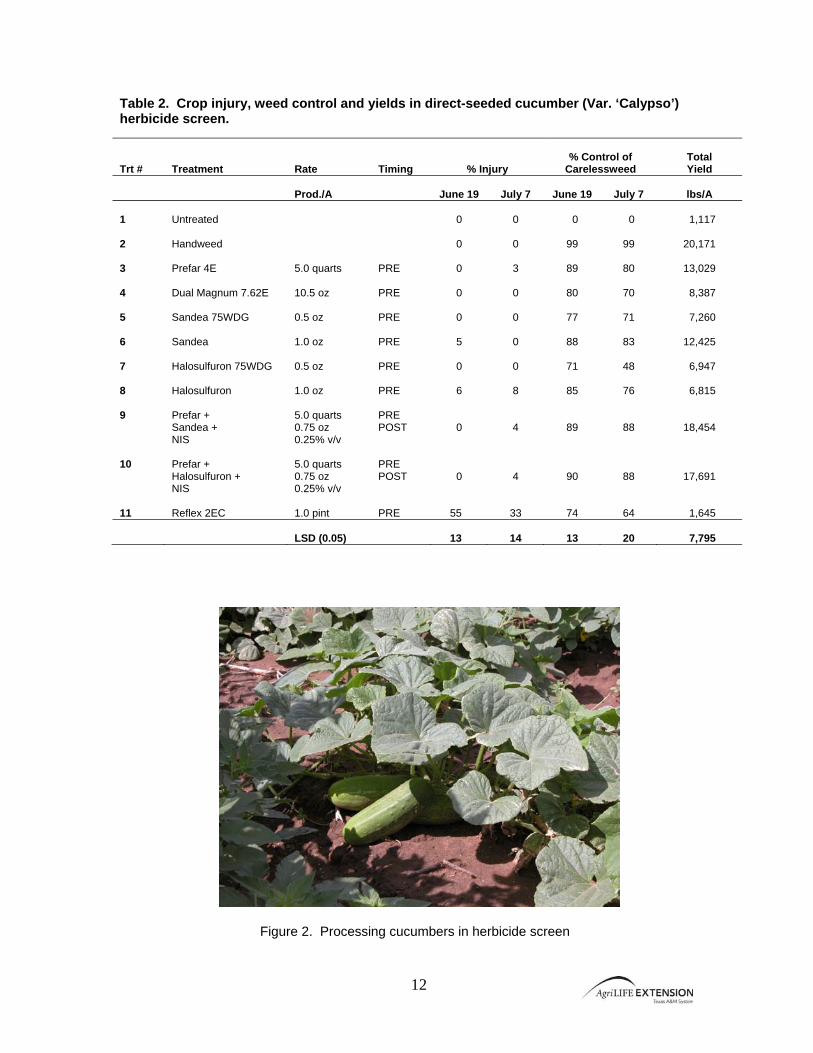
Final Report Objective: To evaluate the effects of PRE and POST-applied herbicides (including a comparison of Sandea to halosulfuron ([generic]) at selected rates and timings on crop injury, weed control and yield of direct-seeded processing cucumbers. Materials & Methods: The trial was conducted at the Texas AgriLife Research & Extension Center in Lubbock, Texas on an Acuff clay loam soil with an average pH of 8.1 and 0.4% organic matter. The trial site was fertilized (120 lbs N/A) and disked prior to initiation of the test, and planting beds listed on 40” centers. Cucumbers (var. “Calypso”) were seeded on April 24 with one row per plot using a Monosem vacuum planter. Each plot contained 3 beds with cucumbers planted in the middle row. Individual plots measured 10’ by 20’ and were irrigated as needed during the crop season. Herbicides were applied PRE and EPOST using a CO2-pressurized backpack sprayer with a hand-held boom equipped with 8002 nozzles that delivered 20 GPA at 30 PSI. All other pests (insects and diseases) were controlled as needed using standard IPM and chemical practices. Weeds (predominately carelessweed) were rated twice beginning 6 weeks after seeding, and all handweeded controls were hoed three times. Percent crop injury and cucumber yield data were also recorded. All data were subjected to analysis of variance and means separated using the Least Significant Difference at the 0.05 level. Results and Discussion: In general, 6% or less crop injury was observed June 19 in all cucumber plots treated with the PRE herbicides, with the exception of Reflex applied at 1.0 pint/A (Table 2). By July 11, slight injury was observed with POST treatments of Sandea and halosulfuron (less than 5%), and injury with Reflex decreased to 33%. Carelessweed control June 19 was generally fair to good with all herbicide treatments. Fair to poor control was observed in plots treated with Reflex, halosulfuron 0.5 oz and Sandea 0.5 oz rates applied PRE. Good control of carelessweed was found in plots treated with Prefar, Dual Magnum, Sandea and halosulfuron (both 1.0 oz rates), and treatments of Prefar (PRE) + either Sandea or halosulfuron applied POST. Similar trends continued with ratings recorded on July 7; however, the level of weed control dropped somewhat in all treatments. Comparisons of Sandea to generic halosulfuron showed that the products were similar in respect to crop injury potential as well as control of carelessweed in this study. Finally, cucumber yields were significantly lower than the handweeded control for all treatments except Prefar alone, Sandea 1.0 oz PRE, and Prefar + either Sandea POST or halosulfuron POST. This study demonstrates that Sandea or halosulfuron aided in the control of carelessweed in cucumbers; however, either product applied PRE alone gave insufficient control. When combining Prefar PRE with Sandea or halosulfuron POST, weed control improved and yields increased. The results of this trial suggest that both Sandea and halosulfuron (generic) gave similar results, and that while Reflex has shown good promise in the Southeast US, it is not a good PRE herbicide choice for cucumbers in Texas.
12
Table 2. Crop injury, weed control and yields in direct-seeded cucumber (Var. ‘Calypso’) herbicide screen.
Figure 2. Processing cucumbers in herbicide screen
Trt #
Treatment
Rate
Timing
% Injury
% Control of
Carelessweed
Total Yield
Prod./A
June 19
July 7
June 19
July 7
lbs/A
1
Untreated
0
0
0
0
1,117
2
Handweed
0
0
99
99
20,171
3
Prefar 4E
5.0 quarts
PRE
0
3
89
80
13,029
4
Dual Magnum 7.62E
10.5 oz
PRE
0
0
80
70
8,387
5
Sandea 75WDG
0.5 oz
PRE
0
0
77
71
7,260
6
Sandea
1.0 oz
PRE
5
0
88
83
12,425
7
Halosulfuron 75WDG
0.5 oz
PRE
0
0
71
48
6,947
8
Halosulfuron
1.0 oz
PRE
6
8
85
76
6,815
9
Prefar + Sandea + NIS
5.0 quarts 0.75 oz 0.25% v/v
PRE POST
0
4
89
88
18,454
10
Prefar + Halosulfuron + NIS
5.0 quarts 0.75 oz 0.25% v/v
PRE POST
0
4
90
88
17,691
11
Reflex 2EC
1.0 pint
PRE
55
33
74
64
1,645
LSD (0.05)
13
14
13
20
7,795
13
Evaluation of Selected Herbicides for Weed Control and Injury in Yellow Squash
Russell W. Wallace & Alisa K. Petty
Texas AgriLife Research & Extension Center - Lubbock
Final Report Objective: To evaluate the effects of PRE and POST-applied herbicides including Sandea and halosulfuron (generic) at selected rates and timings on crop injury, weed control and yield of direct-seeded yellow squash. Materials & Methods: The trial was conducted at the Texas AgriLife Research & Extension Center in Lubbock, Texas on an Acuff clay loam soil with an average pH of 8.1 and 0.4% organic matter. The trial site was fertilized (120 lbs N/A) and disked prior to initiation of the test, and planting beds listed on 40” centers. Squash (var. “Supersett”) was seeded on April 24 with one row per plot using a Monosem vacuum planter. Each plot contained 3 beds with squash planted in the middle row. Individual plots measured 10’ by 20’ and were irrigated as needed during the crop season. Herbicides were applied PRE and EPOST using a CO2-pressurized backpack sprayer with a hand-held boom equipped with 8002 nozzles that delivered 20 GPA at 30 PSI. All other pests (insects and diseases) were controlled as needed using standard IPM and chemical practices. Weeds (predominately carelessweed) were rated twice within each beginning 6 weeks after seeding, and all handweeded controls were hoed three times. Percent crop injury and squash yield (harvested ten times and combined) data were also recorded. All data were subjected to analysis of variance and means separated using the Least Significant Difference at the 0.05 level. Results and Discussion: Percent crop injury recorded on June 19 showed that PRE applications of Sandea and halosulfuron caused 10 – 15% injury (stunting) when applied at the low rate (0.5 oz/A), but when applied at twice that rate, crop injury significantly increased to 34% or higher (Table 3). When applied POST following Prefar PRE applications, Sandea and halosulfuron both showed considerably less crop injury (maximum 6%). When observed 3 weeks later on July 7, injury had decreased with the PRE applications (though still significantly higher than the controls). POST applications observed at that same time showed an increase in crop stunting to just over 10% stunting. In contrast to the cucumber trial (page 11), Reflex did not cause significant crop injury at either rating in this yellow squash test. Control of carelessweed on June 19 was generally good to excellent regardless of herbicide treatment (Table 3). Best control (> 97%) was achieved when Prefar was applied PRE followed by POST applications of either Sandea or halosulfuron. When either Sandea or halosulfuron were applied PRE, control was reduced, though somewhat better with the average Sandea (90%) treatment compared to halosulfuron (83%). By July 7, carelessweed control was poor only where halosulfuron alone was applied PRE. It is unclear why control was reduced so much in those plots compared to those treated with Sandea alone. However, based on yield results, it is apparent that control continued to decrease in both Sandea and halosulfuron plots. Squash yields were significantly lower than the handweeded plots in both rates of Sandea and halosulfuron, as well as in the untreated control. All other treatments, while somewhat reduced, were not significantly less. These results suggest that when Sandea and halosulfuron are applied PRE, additional herbicides may be needed to improve overall weed control and extend control of carelessweed throughout all of the extended harvesting period.

14
Table 3. Crop injury, weed control and yields in direct-seeded yellow squash (var. ‘Supersett’) herbicide screen.
Figure 3. Yellow squash treated with Prefar (PRE) + Sandea (POST) on left; and an untreated plot with high weed pressure on right.
Trt #
Treatment
Rate
Timing
% Injury
% Control of
Carelessweed
Total Yield
Prod./A
June 19
July 7
June 19
July 7
lbs/A
1
Untreated
0
0
0
0
8,130
2
Handweed
0
0
99
99
14,599
3
Prefar 4E
5.0 quarts
PRE
3
0
91
83
10,859
4
Dual Magnum 7.62E
10.5 oz
PRE
0
0
92
89
16,559
5
Sandea 75WDG
0.5 oz
PRE
15
10
94
90
5,269
6
Sandea
1.0 oz
PRE
34
20
90
81
2,784
7
Halosulfuron 75WDG
0.5 oz
PRE
10
5
84
74
6,211
8
Halosulfuron
1.0 oz
PRE
45
26
84
45
3,467
9
Prefar + Sandea + NIS
5.0 quarts 0.75 oz 0.25% v/v
PRE POST
6
11
99
96
9,789
10
Prefar + Halosulfuron + NIS
5.0 quarts 0.75 oz 0.25% v/v
PRE POST
5
13
97
97
9,916
11
Reflex 2EC
1.0 pint
PRE
4
0
90
86
8,849
LSD (0.05)
17
14
9
24
6,213
15
Evaluation of Selected Herbicides for in Direct-Seeded Watermelon
Russell W. Wallace & Alisa K. Petty
Texas AgriLife Research & Extension Center - Lubbock
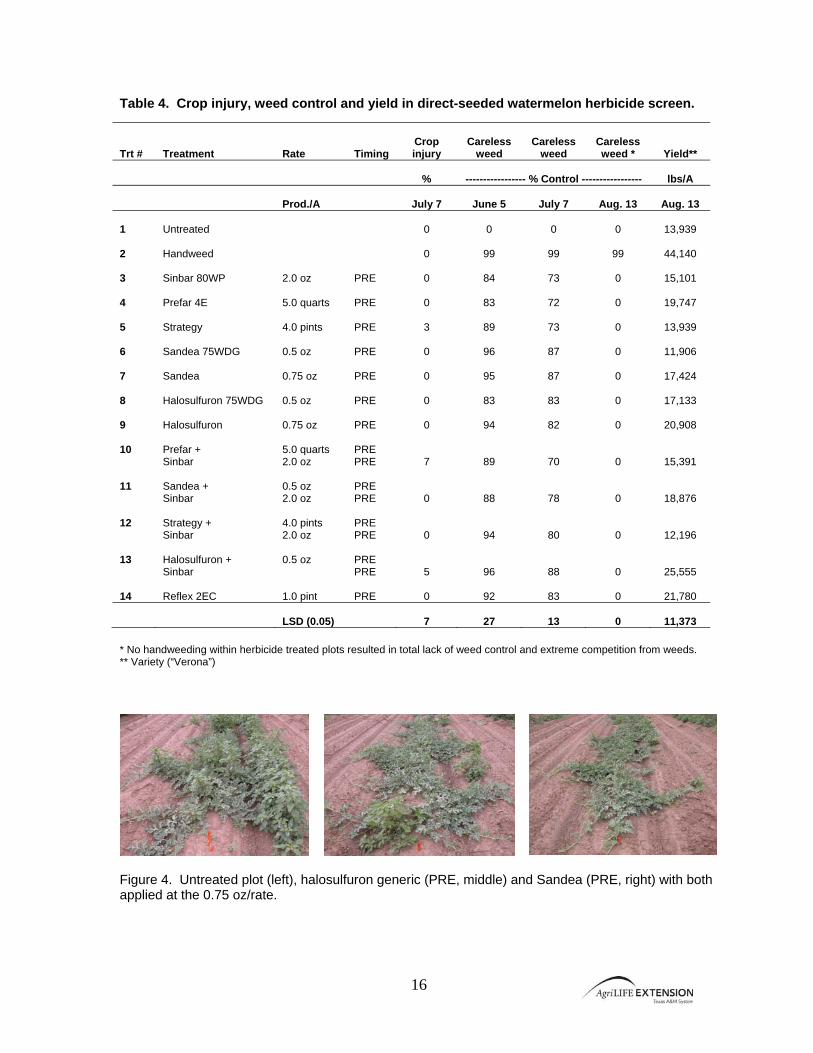
Final Report Objective: To evaluate the effects of PRE and POST-applied herbicides including Sandea and halosulfuron (generic) at selected rates and timings on crop injury, weed control and yield of direct-seeded watermelon on the Texas High Plains. Materials & Methods: The trial was conducted at the Texas AgriLife Research & Extension Center in Lubbock, Texas on an Acuff clay loam soil with an average pH of 8.1 and 0.4% organic matter. The trial site was fertilized (120 lbs N/A) and disked prior to initiation of the test, and planting beds listed on 40” centers. Watermelons (var. “Verona”) were seeded on April 24 with one row per plot using a Monosem vacuum planter. Each plot contained 3 beds with watermelons planted in the middle row. Individual plots measured 10’ by 20’ and were irrigated as needed during the crop season. Herbicides were applied PRE and EPOST using a CO2-pressurized backpack sprayer with a hand-held boom equipped with 8002 nozzles that delivered 20 GPA at 30 PSI. All other pests (insects and diseases) were controlled as needed using standard IPM and chemical practices. Weeds (predominately carelessweed) were rated twice beginning 6 weeks after seeding, and all handweeded controls were hoed three times. Percent crop injury and watermelon yield data were also recorded. All data were subjected to analysis of variance and means separated using the Least Significant Difference at the 0.05 level. Results and Discussion: Ratings evaluated on July 7 showed that no herbicide treatment, regardless of application rate caused more than 7% injury (Table 4). Only minor injury was observed in direct-seeded watermelons with Strategy, Prefar + Sinbar, or Halosulfuron + Sinbar. Carelessweed populations were very low during the first half of the trial period and PRE control of weeds was 85% or better with all treatments except Sinbar, Prefar or halosulfuron (0.5 oz/A). By July 7 control of carelessweed had decreased to less than 90% for all treatments. Where Sinbar, Prefar or Strategy was applied alone, control was less than 75%. Similarly, control was less than 80% where Prefar or Sandea were applied with Sinbar. However, by harvest time (August 13), weeds had grown sufficiently large enough to cause significant competition and resulted in zero percent control in all treatments except the handweeded control. Watermelon yields were significantly lower in all herbicide treatments when compared to the handweeded control, suggesting that handweeding would have resulted in increased yields. Halosulfuron + Sinbar had the highest yield within the herbicide treated plots and this yield was significantly higher when compared to the untreated control and Sandea applied at the low rate. The overall results of this trial suggest that all herbicides applied alone or in combination did not provide sufficient long-term control of carelessweed and that under grower field conditions cultivation or handweeding would have been recommended. Sinbar is a relatively new registration for Texas, and these results suggest that it is safe to watermelons grown within the state; however, growers should recognize that the weed spectrum of control may be limited. Additionally, Reflex did not injure watermelons and showed some promise but it would likely not receive a registration west of Highway 77 due to environmental conditions related to carryover potential and crop rotation restrictions.
16
Table 4. Crop injury, weed control and yield in direct-seeded watermelon herbicide screen.
* No handweeding within herbicide treated plots resulted in total lack of weed control and extreme competition from weeds. ** Variety (“Verona”)
Figure 4. Untreated plot (left), halosulfuron generic (PRE, middle) and Sandea (PRE, right) with both applied at the 0.75 oz/rate.
Trt #
Treatment
Rate
Timing
Crop injury
Careless
weed
Careless
weed
Careless weed *
Yield**
%
----------------- % Control -----------------
lbs/A
Prod./A
July 7
June 5
July 7
Aug. 13
Aug. 13 1
Untreated
0
0
0
0
13,939
2
Handweed
0
99
99
99
44,140
3
Sinbar 80WP
2.0 oz
PRE
0
84
73
0
15,101
4
Prefar 4E
5.0 quarts
PRE
0
83
72
0
19,747
5
Strategy
4.0 pints
PRE
3
89
73
0
13,939
6
Sandea 75WDG
0.5 oz
PRE
0
96
87
0
11,906
7
Sandea
0.75 oz
PRE
0
95
87
0
17,424
8
Halosulfuron 75WDG
0.5 oz
PRE
0
83
83
0
17,133
9
Halosulfuron
0.75 oz
PRE
0
94
82
0
20,908
10
Prefar + Sinbar
5.0 quarts 2.0 oz
PRE PRE
7
89
70
0
15,391 11
Sandea + Sinbar
0.5 oz 2.0 oz
PRE PRE
0
88
78
0
18,876 12
Strategy + Sinbar
4.0 pints 2.0 oz
PRE PRE
0
94
80
0
12,196 13
Halosulfuron + Sinbar
0.5 oz
PRE PRE
5
96
88
0
25,555 14
Reflex 2EC
1.0 pint
PRE
0
92
83
0
21,780
LSD (0.05)
7
27
13
0
11,373
17
Evaluation of V-10142 & Chateau for Weed Control and Injury in Chile & Bell Peppers
Russell W. Wallace & Alisa K. Petty
Texas AgriLife Research & Extension Center - Lubbock
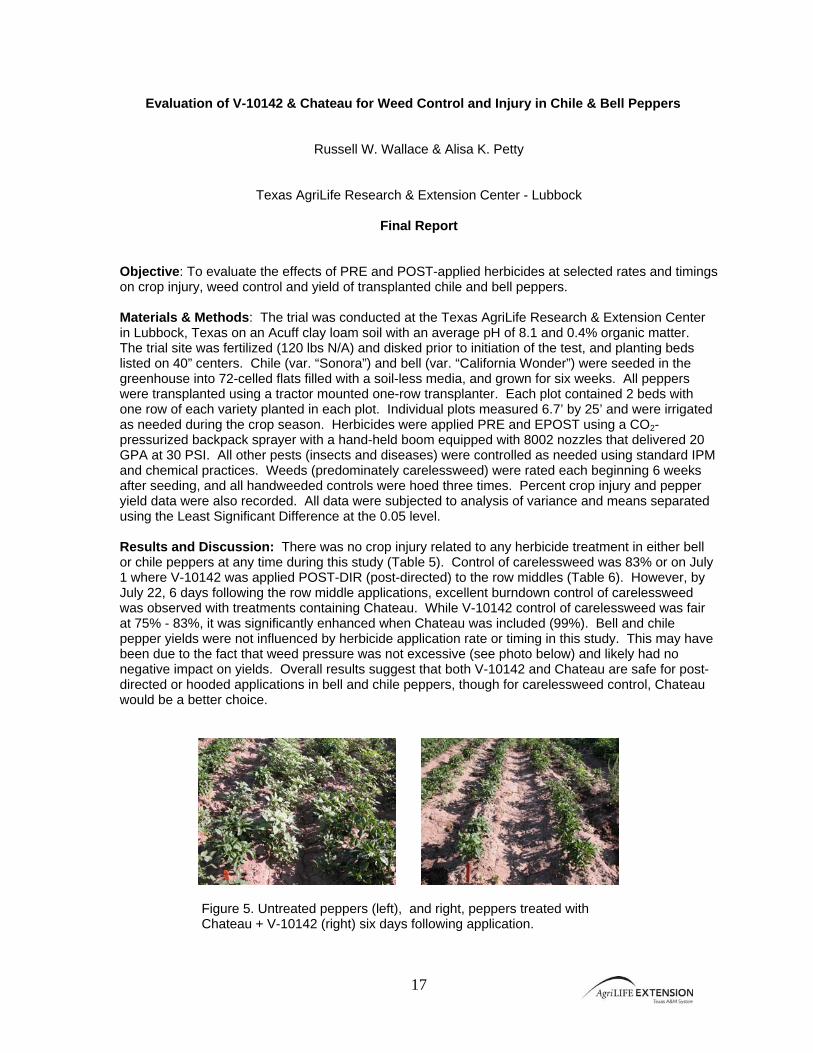
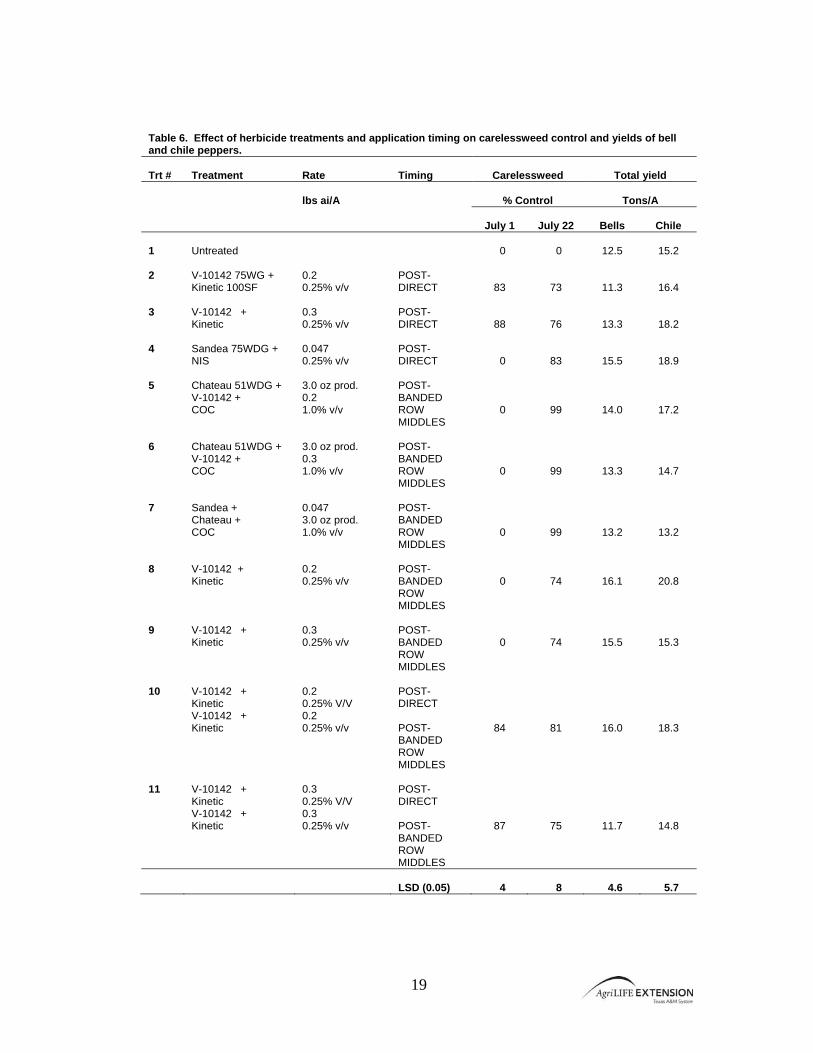
Final Report Objective: To evaluate the effects of PRE and POST-applied herbicides at selected rates and timings on crop injury, weed control and yield of transplanted chile and bell peppers. Materials & Methods: The trial was conducted at the Texas AgriLife Research & Extension Center in Lubbock, Texas on an Acuff clay loam soil with an average pH of 8.1 and 0.4% organic matter. The trial site was fertilized (120 lbs N/A) and disked prior to initiation of the test, and planting beds listed on 40” centers. Chile (var. “Sonora”) and bell (var. “California Wonder”) were seeded in the greenhouse into 72-celled flats filled with a soil-less media, and grown for six weeks. All peppers were transplanted using a tractor mounted one-row transplanter. Each plot contained 2 beds with one row of each variety planted in each plot. Individual plots measured 6.7’ by 25’ and were irrigated as needed during the crop season. Herbicides were applied PRE and EPOST using a CO2-pressurized backpack sprayer with a hand-held boom equipped with 8002 nozzles that delivered 20 GPA at 30 PSI. All other pests (insects and diseases) were controlled as needed using standard IPM and chemical practices. Weeds (predominately carelessweed) were rated each beginning 6 weeks after seeding, and all handweeded controls were hoed three times. Percent crop injury and pepper yield data were also recorded. All data were subjected to analysis of variance and means separated using the Least Significant Difference at the 0.05 level. Results and Discussion: There was no crop injury related to any herbicide treatment in either bell or chile peppers at any time during this study (Table 5). Control of carelessweed was 83% or on July 1 where V-10142 was applied POST-DIR (post-directed) to the row middles (Table 6). However, by July 22, 6 days following the row middle applications, excellent burndown control of carelessweed was observed with treatments containing Chateau. While V-10142 control of carelessweed was fair at 75% - 83%, it was significantly enhanced when Chateau was included (99%). Bell and chile pepper yields were not influenced by herbicide application rate or timing in this study. This may have been due to the fact that weed pressure was not excessive (see photo below) and likely had no negative impact on yields. Overall results suggest that both V-10142 and Chateau are safe for post-directed or hooded applications in bell and chile peppers, though for carelessweed control, Chateau would be a better choice.
Figure 5. Untreated peppers (left), and right, peppers treated with Chateau + V-10142 (right) six days following application.
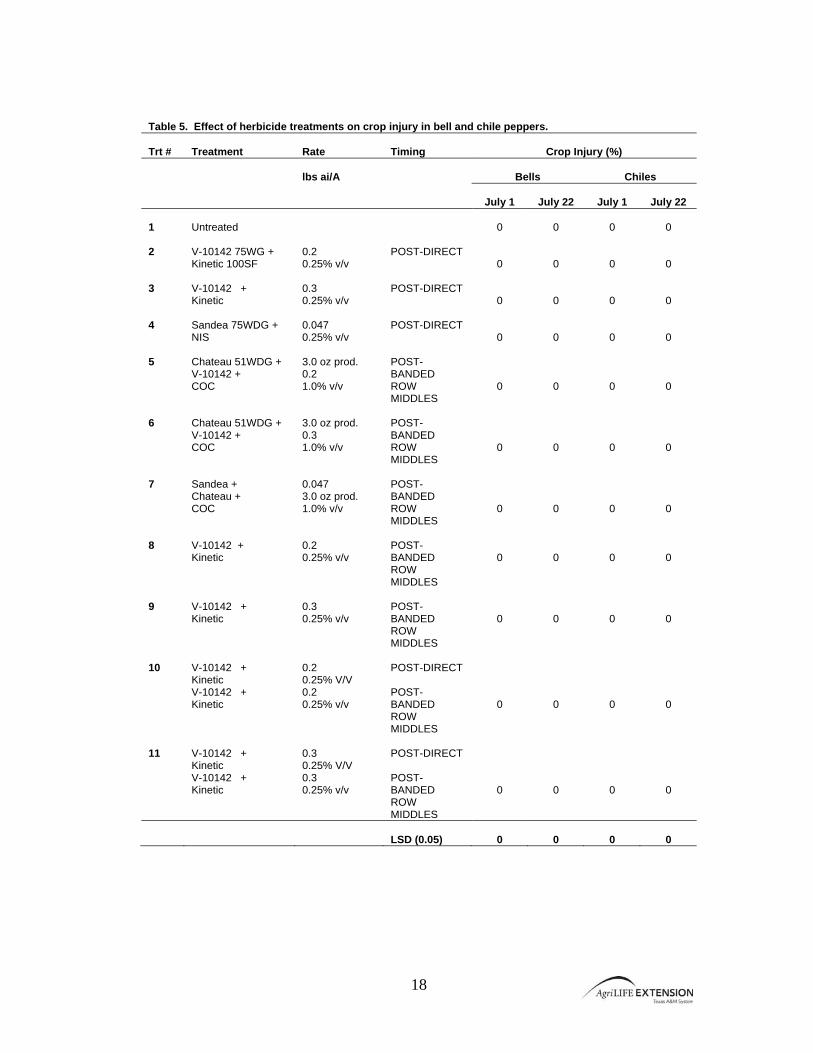
18
Table 5. Effect of herbicide treatments on crop injury in bell and chile peppers. Trt #
Treatment
Rate
Timing
Crop Injury (%)
lbs ai/A
Bells
Chiles
July 1
July 22
July 1
July 22
1
Untreated
0
0
0
0
2
V-10142 75WG + Kinetic 100SF
0.2 0.25% v/v
POST-DIRECT
0
0
0
0 3
V-10142 + Kinetic
0.3 0.25% v/v
POST-DIRECT
0
0
0
0 4
Sandea 75WDG + NIS
0.047 0.25% v/v
POST-DIRECT
0
0
0
0 5
Chateau 51WDG + V-10142 + COC
3.0 oz prod. 0.2 1.0% v/v
POST-BANDED ROW MIDDLES
0
0
0
0
6
Chateau 51WDG + V-10142 + COC
3.0 oz prod. 0.3 1.0% v/v
POST-BANDED ROW MIDDLES
0
0
0
0
7
Sandea + Chateau + COC
0.047 3.0 oz prod. 1.0% v/v
POST-BANDED ROW MIDDLES
0
0
0
0
8
V-10142 + Kinetic
0.2 0.25% v/v
POST-BANDED ROW MIDDLES
0
0
0
0
9
V-10142 + Kinetic
0.3 0.25% v/v
POST-BANDED ROW MIDDLES
0
0
0
0
10
V-10142 + Kinetic V-10142 + Kinetic
0.2 0.25% V/V 0.2 0.25% v/v
POST-DIRECT POST-BANDED ROW MIDDLES
0
0
0
0
11
V-10142 + Kinetic V-10142 + Kinetic
0.3 0.25% V/V 0.3 0.25% v/v
POST-DIRECT POST-BANDED ROW MIDDLES
0
0
0
0
LSD (0.05)
0
0
0
0
19
Table 6. Effect of herbicide treatments and application timing on carelessweed control and yields of bell and chile peppers. Trt #
Treatment
Rate
Timing
Carelessweed
Total yield
lbs ai/A
% Control
Tons/A
July 1
July 22
Bells
Chile
1
Untreated
0
0
12.5
15.2
2
V-10142 75WG + Kinetic 100SF
0.2 0.25% v/v
POST-DIRECT
83
73
11.3
16.4 3
V-10142 + Kinetic
0.3 0.25% v/v
POST-DIRECT
88
76
13.3
18.2 4
Sandea 75WDG + NIS
0.047 0.25% v/v
POST-DIRECT
0
83
15.5
18.9 5
Chateau 51WDG + V-10142 + COC
3.0 oz prod. 0.2 1.0% v/v
POST-BANDED ROW MIDDLES
0
99
14.0
17.2
6
Chateau 51WDG + V-10142 + COC
3.0 oz prod. 0.3 1.0% v/v
POST-BANDED ROW MIDDLES
0
99
13.3
14.7
7
Sandea + Chateau + COC
0.047 3.0 oz prod. 1.0% v/v
POST-BANDED ROW MIDDLES
0
99
13.2
13.2
8
V-10142 + Kinetic
0.2 0.25% v/v
POST-BANDED ROW MIDDLES
0
74
16.1
20.8
9
V-10142 + Kinetic
0.3 0.25% v/v
POST-BANDED ROW MIDDLES
0
74
15.5
15.3
10
V-10142 + Kinetic V-10142 + Kinetic
0.2 0.25% V/V 0.2 0.25% v/v
POST-DIRECT POST-BANDED ROW MIDDLES
84
81
16.0
18.3
11
V-10142 + Kinetic V-10142 + Kinetic
0.3 0.25% V/V 0.3 0.25% v/v
POST-DIRECT POST-BANDED ROW MIDDLES
87
75
11.7
14.8
LSD (0.05)
4
8
4.6
5.7

20
Evaluation of Post-Applied Herbicides on Crop Injury in Processing Snap Beans
Russell W. Wallace & Alisa K. Petty
Texas AgriLife Research & Extension Center - Lubbock
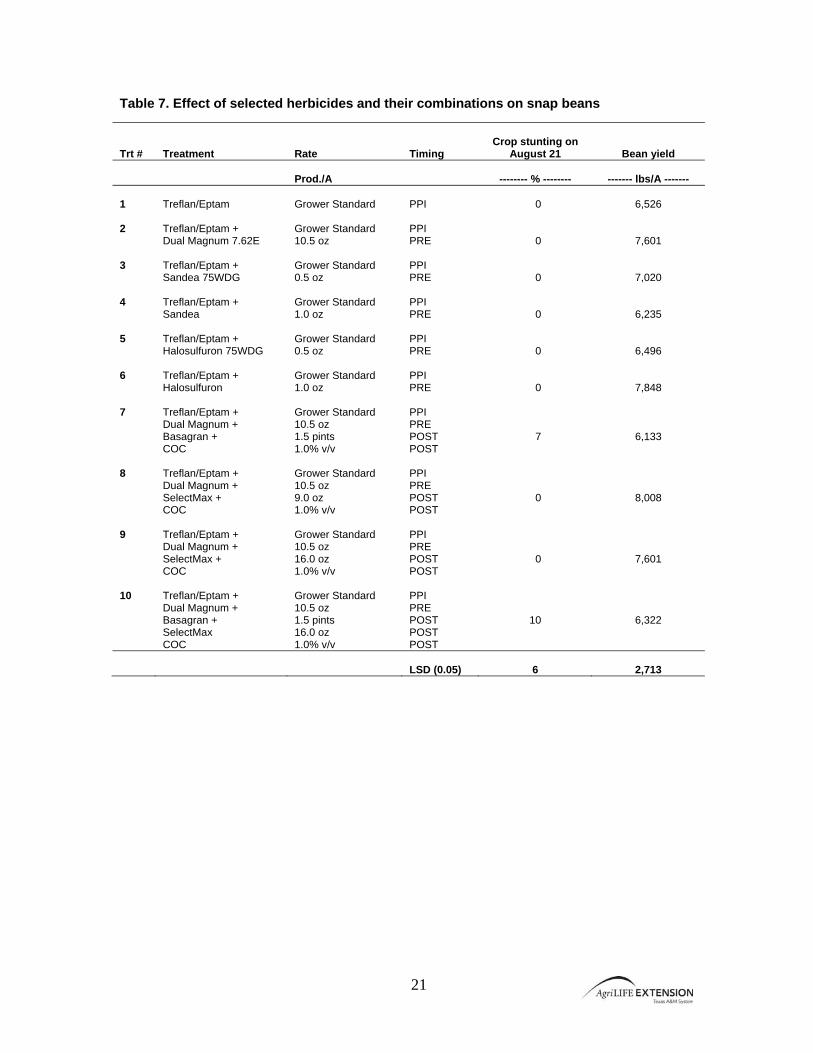
Final Report Objective: To evaluate the effects of PRE and POST-applied herbicides at selected rates and timings on crop injury, weed control and yield of processing snap beans grown on the High Plains. Materials & Methods: The trial was conducted on a grower’s field located near Farwell, Texas on a sandy loam soil. The trial site was fertilized, and disked prior to initiation of the test according to standard grower practices. Snap beans (var. “BBL 156”) were planted by the grower using his equipment into plots containing 5 rows (15” spacing). Individual plots measured 6.7’ by 20’ and were irrigated with a center pivot system as needed during the crop season. A standard application of Treflan + Eptam was incorporated prior to planting by the grower. Treatment herbicides were applied PRE and POST using a CO2-pressurized backpack sprayer with a hand-held boom equipped with 8002 nozzles that delivered 20 GPA at 30 PSI. All other pests (insects and diseases) were controlled as needed by the grower. Weeds were rated once during the season, and there was no untreated or handweeded controls in this trial, only a grower standard herbicide treatment. Percent crop injury and snap bean yield data were recorded. All data were subjected to analysis of variance and means separated using the Least Significant Difference at the 0.05 level. Results and Discussion: Weed pressure was extremely low at this location of the grower’s field and as a result, weed control data could not be recorded. Only minor leaf injury was observed with POST treatments that contained Basagran herbicide only (Table 7), and this injury was typical at 10% or less. Additionally, there was no observable crop injury with either Sandea or halosulfuron (generic) when comparing the two similar products, nor was there any observable leaf injury with SelectMax grass control herbicide. All herbicide treatments had no negative effects on snap bean yields and there were no significant differences between yields for any herbicide treatment. The results indicate that all herbicides and selected combinations are safe for use on processing snap beans on the Texas High Plains.
Figure 6. Emerging snap beans in area of herbicide screen (left) and a bean field almost ready to harvest (right).
21
Table 7. Effect of selected herbicides and their combinations on snap beans
Trt #
Treatment
Rate
Timing
Crop stunting on
August 21
Bean yield
Prod./A
-------- % --------
------- lbs/A ------- 1
Treflan/Eptam
Grower Standard
PPI
0
6,526
2
Treflan/Eptam + Dual Magnum 7.62E
Grower Standard 10.5 oz
PPI PRE
0
7,601 3
Treflan/Eptam + Sandea 75WDG
Grower Standard 0.5 oz
PPI PRE
0
7,020 4
Treflan/Eptam + Sandea
Grower Standard 1.0 oz
PPI PRE
0
6,235 5
Treflan/Eptam + Halosulfuron 75WDG
Grower Standard 0.5 oz
PPI PRE
0
6,496 6
Treflan/Eptam + Halosulfuron
Grower Standard 1.0 oz
PPI PRE
0
7,848 7
Treflan/Eptam + Dual Magnum + Basagran + COC
Grower Standard 10.5 oz 1.5 pints 1.0% v/v
PPI PRE POST POST
7
6,133
8
Treflan/Eptam + Dual Magnum + SelectMax + COC
Grower Standard 10.5 oz 9.0 oz 1.0% v/v
PPI PRE POST POST
0
8,008
9
Treflan/Eptam + Dual Magnum + SelectMax + COC
Grower Standard 10.5 oz 16.0 oz 1.0% v/v
PPI PRE POST POST
0
7,601
10
Treflan/Eptam + Dual Magnum + Basagran + SelectMax COC
Grower Standard 10.5 oz 1.5 pints 16.0 oz 1.0% v/v
PPI PRE POST POST POST
10
6,322
LSD (0.05)
6
2,713
22
Evaluation of Herbicides for Weed Control and Injury in Pumpkins
Russell W. Wallace & Alisa K. Petty
Texas AgriLife Research & Extension Center - Lubbock
Final Report Objective: To evaluate the effects of PRE and POST-applied herbicides at selected rates and timings on crop injury, weed control and yield of pumpkins grown on the High Plains. Materials & Methods: The trial was conducted on a grower’s field located near Lorenzo, Texas on a sandy loam soil. The trial site was fertilized, and disked prior to initiation of the test according to standard grower practices, and planting beds listed on 40” centers. Pumpkins (var. “Fairytale”) were planted by the grower using his equipment at a 40” between-row and 80” in-row spacing. Individual plots measured 13’ by 60’ and were irrigated using a drip system as needed during the crop season. A standard application of Treflan was incorporated prior to planting by the grower. Treatment herbicides were applied PRE and POST using a CO2-pressurized backpack sprayer with a hand-held boom equipped with 8002 nozzles that delivered 20 GPA at 30 PSI. All other pests (insects and diseases) were controlled as needed by the grower. Weeds were rated twice during the season, and handweeded controls hoed once. Percent crop injury and pumpkin yield data were recorded. All data were subjected to analysis of variance and means separated using the Least Significant Difference at the 0.05 level.
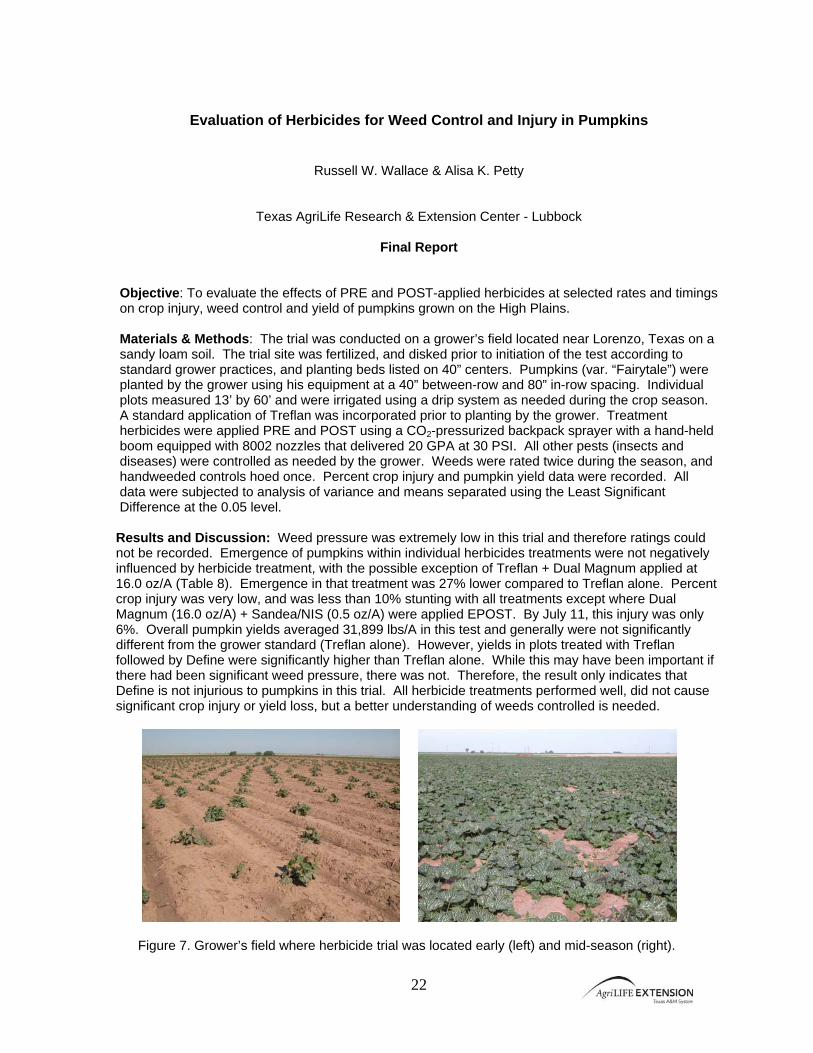
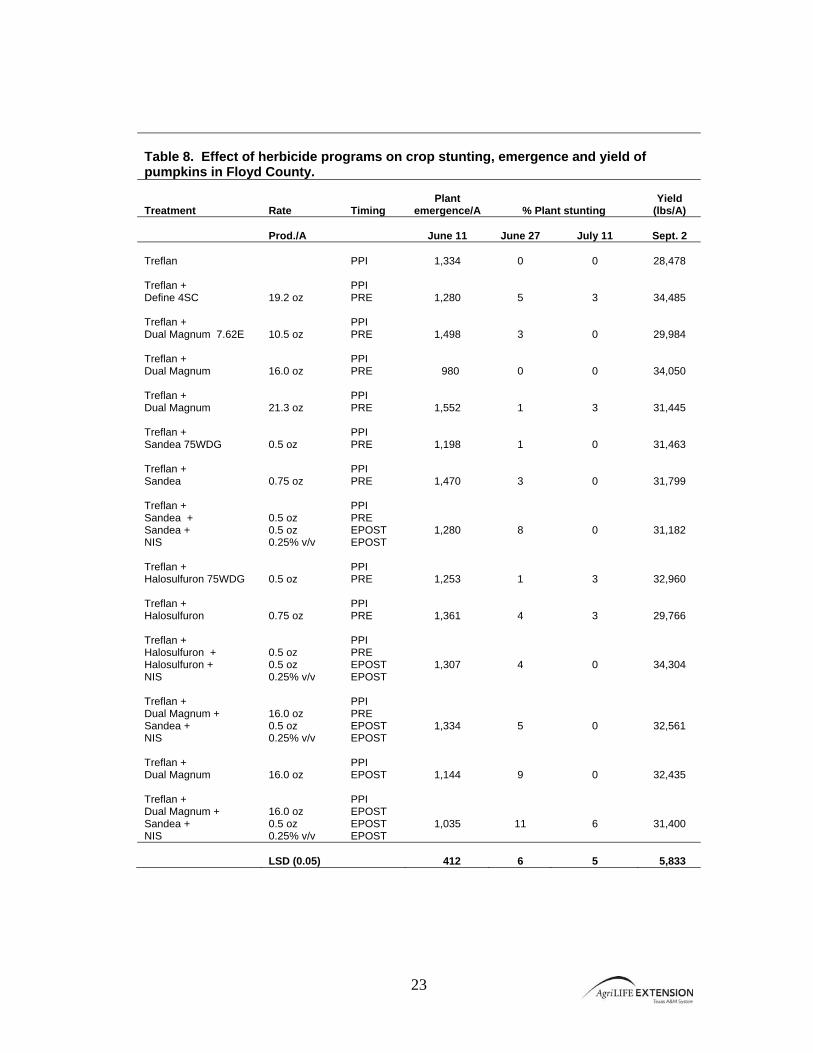
Results and Discussion: Weed pressure was extremely low in this trial and therefore ratings could not be recorded. Emergence of pumpkins within individual herbicides treatments were not negatively influenced by herbicide treatment, with the possible exception of Treflan + Dual Magnum applied at 16.0 oz/A (Table 8). Emergence in that treatment was 27% lower compared to Treflan alone. Percent crop injury was very low, and was less than 10% stunting with all treatments except where Dual Magnum (16.0 oz/A) + Sandea/NIS (0.5 oz/A) were applied EPOST. By July 11, this injury was only 6%. Overall pumpkin yields averaged 31,899 lbs/A in this test and generally were not significantly different from the grower standard (Treflan alone). However, yields in plots treated with Treflan followed by Define were significantly higher than Treflan alone. While this may have been important if there had been significant weed pressure, there was not. Therefore, the result only indicates that Define is not injurious to pumpkins in this trial. All herbicide treatments performed well, did not cause significant crop injury or yield loss, but a better understanding of weeds controlled is needed.
Figure 7. Grower’s field where herbicide trial was located early (left) and mid-season (right).
23
Table 8. Effect of herbicide programs on crop stunting, emergence and yield of pumpkins in Floyd County. Treatment
Rate
Timing
Plant
emergence/A
% Plant stunting
Yield
(lbs/A)
Prod./A
June 11
June 27
July 11
Sept. 2 Treflan
PPI
1,334
0
0
28,478
Treflan + Define 4SC
19.2 oz
PPI PRE
1,280
5
3
34,485 Treflan + Dual Magnum 7.62E
10.5 oz
PPI PRE
1,498
3
0
29,984 Treflan + Dual Magnum
16.0 oz
PPI PRE
980
0
0
34,050 Treflan + Dual Magnum
21.3 oz
PPI PRE
1,552
1
3
31,445 Treflan + Sandea 75WDG
0.5 oz
PPI PRE
1,198
1
0
31,463 Treflan + Sandea
0.75 oz
PPI PRE
1,470
3
0
31,799 Treflan + Sandea + Sandea + NIS
0.5 oz 0.5 oz 0.25% v/v
PPI PRE EPOST EPOST
1,280
8
0
31,182
Treflan + Halosulfuron 75WDG
0.5 oz
PPI PRE
1,253
1
3
32,960 Treflan + Halosulfuron
0.75 oz
PPI PRE
1,361
4
3
29,766 Treflan + Halosulfuron + Halosulfuron + NIS
0.5 oz 0.5 oz 0.25% v/v
PPI PRE EPOST EPOST
1,307
4
0
34,304
Treflan + Dual Magnum + Sandea + NIS
16.0 oz 0.5 oz 0.25% v/v
PPI PRE EPOST EPOST
1,334
5
0
32,561
Treflan + Dual Magnum
16.0 oz
PPI EPOST
1,144
9
0
32,435 Treflan + Dual Magnum + Sandea + NIS
16.0 oz 0.5 oz 0.25% v/v
PPI EPOST EPOST EPOST
1,035
11
6
31,400
LSD (0.05)
412
6
5
5,833

24
Evaluation of an Experimental Nematicide for Crop Injury, Yield and Nematode Control in Peppers
Russell W. Wallace, Terry Wheeler and Alisa K. Petty
Final Report
Objective: Evaluate the effects of an experimental nematicide (EN) when applied through drip irrigation on crop injury, vigor, yield, nematode populations and root galling in chile peppers grown on the Texas High Plains. Materials and Methods: The trials were conducted at the Carolyn Lanier Youth Farm owned and operated by the South Plains Food Bank located in southeast Lubbock, Lubbock County, Texas during the 2008 growing season. The test site was located on a sandy loam soil with an average pH of 7.6 and 1% organic matter. The trial site was previously treated with compost, which was disked into the soil several weeks before initiation of the test. Prior to transplanting of the first test, the site was rototilled and disked. At transplanting of the first trial on May 9, drip tape (Netafim Typhoon 25gph with 12” emitter spacing) was placed on the surface near the planted rows. Preplant soil samples were collected from within the area to be seeded in each trial. Pepper transplants (var. “Sonora”) were transplanted by hand using a bulb transplanter into plots measuring 6.7’ x 30’. Within each plot, pepper transplants were spaced to 12” within-row and 80” between rows for a final stand of 24 plants per plot. Prior to transplanting, Dual Magnum (10.4 oz/A) was applied preplant, and during the early season, Sandea (0.5 oz/A) and Poast (1.0 pint/A) were applied postemergence to control emerged broadleaf and grass weeds, and all plots were hand-weeded as needed. At transplanting, a second drip line measuring 25’ in length was placed along side the irrigation line within each plot, and used for chemical treatments. Treatment lines were plugged at both ends until used for injecting the individual treatments at the specified timings. Injections were made using 5.0 gallons of water as a carrier plus the correct amount of chemical. Treatment lines were connected to CO2 tanks pressurized to 15 psi. Following completion of the treatments, 3.0 gallons of additional clean water was injected to clear the lines. The concentration of Vydate CLV was tested and ranged from 40,000 to 47,000 ppm. EN treatments were applied at 0.75, 1.0, 1.5 or 2.0 lbs ai/A. Treatment, soil and root sample timings are shown in Table 9. During crop growth, foliar insecticides and fungicides were applied as needed to control pests. Fertilizer (liquid humic acid) was applied weekly through the irrigation drip lines as standard procedure by the grower. Crop stunting and vigor were rated beginning 1 month following the first application to emerged plants for approximately 6 weeks. Peppers were hand-harvested, and at initial harvest (July 29 for Pepper A; August 14 for Pepper B) soil samples were taken from within the planted rows of each plot. Peppers were harvested twice and treatment yields were combined. At the final harvest, root samples were taken from each plot to assess root galling. Both trials were conducted as RCBD’s with 4 replications, and stunting (arcsine transformed data), vigor and yield data were subjected to analysis of variance with means separated using the Least Significant Difference at the 0.05 level. Nematode egg, juvenile and adult counts were transformed (Log10 (count + 1) prior to analyzes using the probable value of t.
Table 9. Timings of nematode sampling during both pepper trials. Timing of events Pepper (A) Pepper (B) Injections At planting May 9 June 10 14 days June 24 21 days July 1 28 days June 4 July 7 42 days 56 days July 2 July 22 Soil samples May 5 (preplant), July 28 June 6 (preplant), August 14 Root samples August 14 September 10
25
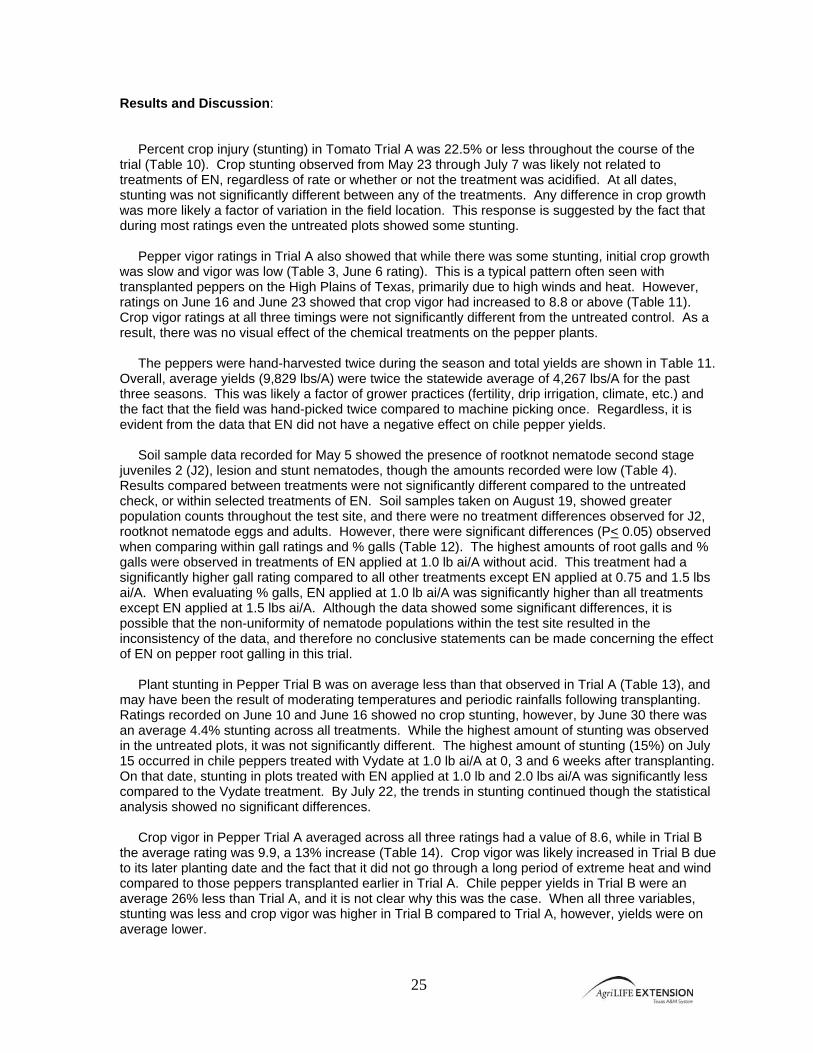
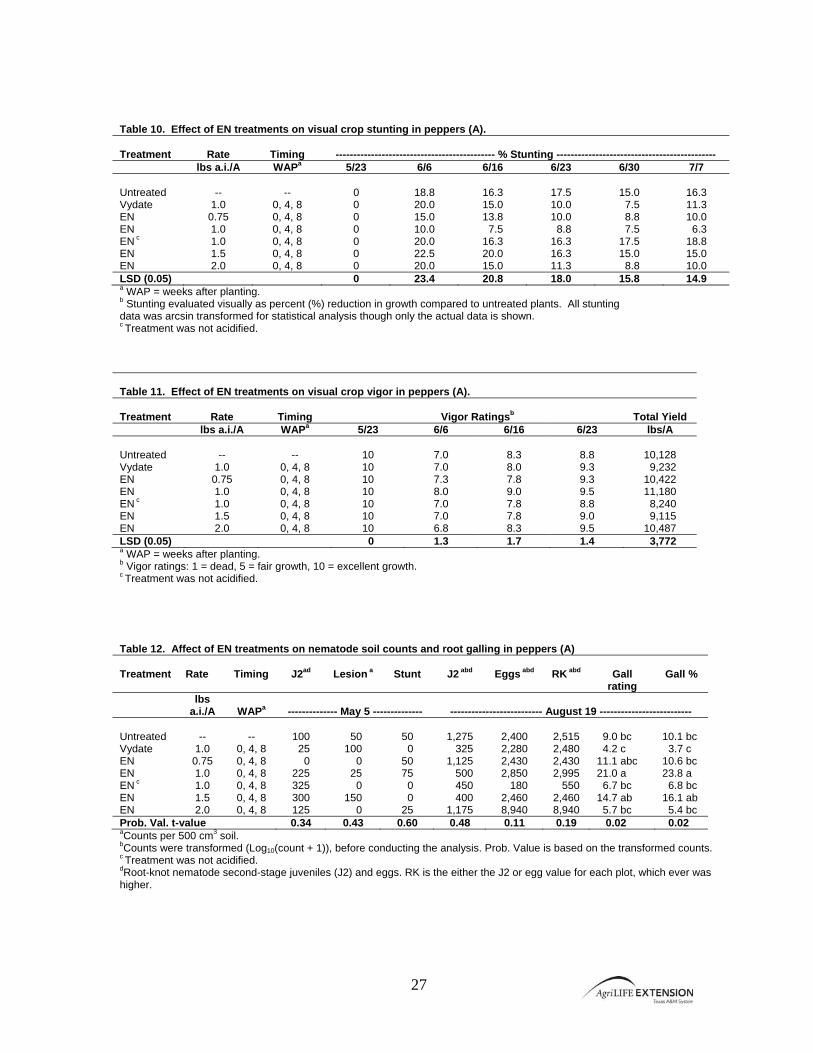
Results and Discussion: Percent crop injury (stunting) in Tomato Trial A was 22.5% or less throughout the course of the trial (Table 10). Crop stunting observed from May 23 through July 7 was likely not related to treatments of EN, regardless of rate or whether or not the treatment was acidified. At all dates, stunting was not significantly different between any of the treatments. Any difference in crop growth was more likely a factor of variation in the field location. This response is suggested by the fact that during most ratings even the untreated plots showed some stunting. Pepper vigor ratings in Trial A also showed that while there was some stunting, initial crop growth was slow and vigor was low (Table 3, June 6 rating). This is a typical pattern often seen with transplanted peppers on the High Plains of Texas, primarily due to high winds and heat. However, ratings on June 16 and June 23 showed that crop vigor had increased to 8.8 or above (Table 11). Crop vigor ratings at all three timings were not significantly different from the untreated control. As a result, there was no visual effect of the chemical treatments on the pepper plants. The peppers were hand-harvested twice during the season and total yields are shown in Table 11. Overall, average yields (9,829 lbs/A) were twice the statewide average of 4,267 lbs/A for the past three seasons. This was likely a factor of grower practices (fertility, drip irrigation, climate, etc.) and the fact that the field was hand-picked twice compared to machine picking once. Regardless, it is evident from the data that EN did not have a negative effect on chile pepper yields. Soil sample data recorded for May 5 showed the presence of rootknot nematode second stage juveniles 2 (J2), lesion and stunt nematodes, though the amounts recorded were low (Table 4). Results compared between treatments were not significantly different compared to the untreated check, or within selected treatments of EN. Soil samples taken on August 19, showed greater population counts throughout the test site, and there were no treatment differences observed for J2, rootknot nematode eggs and adults. However, there were significant differences (P< 0.05) observed when comparing within gall ratings and % galls (Table 12). The highest amounts of root galls and % galls were observed in treatments of EN applied at 1.0 lb ai/A without acid. This treatment had a significantly higher gall rating compared to all other treatments except EN applied at 0.75 and 1.5 lbs ai/A. When evaluating % galls, EN applied at 1.0 lb ai/A was significantly higher than all treatments except EN applied at 1.5 lbs ai/A. Although the data showed some significant differences, it is possible that the non-uniformity of nematode populations within the test site resulted in the inconsistency of the data, and therefore no conclusive statements can be made concerning the effect of EN on pepper root galling in this trial. Plant stunting in Pepper Trial B was on average less than that observed in Trial A (Table 13), and may have been the result of moderating temperatures and periodic rainfalls following transplanting. Ratings recorded on June 10 and June 16 showed no crop stunting, however, by June 30 there was an average 4.4% stunting across all treatments. While the highest amount of stunting was observed in the untreated plots, it was not significantly different. The highest amount of stunting (15%) on July 15 occurred in chile peppers treated with Vydate at 1.0 lb ai/A at 0, 3 and 6 weeks after transplanting. On that date, stunting in plots treated with EN applied at 1.0 lb and 2.0 lbs ai/A was significantly less compared to the Vydate treatment. By July 22, the trends in stunting continued though the statistical analysis showed no significant differences. Crop vigor in Pepper Trial A averaged across all three ratings had a value of 8.6, while in Trial B the average rating was 9.9, a 13% increase (Table 14). Crop vigor was likely increased in Trial B due to its later planting date and the fact that it did not go through a long period of extreme heat and wind compared to those peppers transplanted earlier in Trial A. Chile pepper yields in Trial B were an average 26% less than Trial A, and it is not clear why this was the case. When all three variables, stunting was less and crop vigor was higher in Trial B compared to Trial A, however, yields were on average lower.

26
Although not significant, there was a trend for a 2% decrease in yields when comparing the average of all EN treatments to the untreated plots in Trial A. However, in Trial B, the comparison showed an average 18% increase over the untreated peppers, possibly showing an affect of EN on pepper yields. When comparing the average EN treatment to Vydate, yields were 7% and 30% higher with EN in Trials A and B, respectively. Soil samples assessed for the presence of nematodes on June 6 showed that there were almost no rootknot nematode second stage juveniles 2 (J2), lesion and stunt nematodes present within the trial site (Table 15). However, by August 14 J2, rootknot nematode eggs and adult populations had increased to measurable numbers. While not significant, there was a trend for fewer J2 populations when comparing the average EN treatment (133.8) to the untreated plots (1,025), an 87% decrease. This may suggest a weak effect of EN on the J2 nematodes. Rootknot nematode egg and adult populations were also not significantly different compared to either the untreated or Vydate treatments when observed on August 14. Although it is interesting to note that EN (non-acidified) treatments were higher for both eggs and adults compared to the other treatments, this was inconsistent with Trial A and does not suggest an effect of the lack of an acidifying agent in that treatment. Root gall ratings and % galls were similar to rootknot nematode population counts, and were found not to be significantly different between treatments. Gall ratings were an average 46% higher in EN treatments, and similarly, % galls were found to be 32% higher when compared to the untreated plots. This trend was similar to that found in Trial A. Overall, the results of this study show that there was no significant effect of EN on nematode populations regardless of treatment timing, rate and acidification in peppers at this location. Vydate response was similar in regards to nematode populations, though there may have been a slight positive yield response with EN compared to Vydate. Although there was no effect of EN on nematode populations in this study, treating peppers with EN had a positive trend on yields in the later planting of the two trials. While the method of chemical application was very precise; the high variation of nematode populations in the field may have attributed to the lack of significance between treatments.
Figure 8. Overview of pepper trial located at South Plains Food Bank Farm, Lubbock, Texas
27
Table 10. Effect of EN treatments on visual crop stunting in peppers (A). Treatment
Rate
Timing
--------------------------------------------- % Stunting ---------------------------------------------
lbs a.i./A WAPa 5/23 6/6 6/16 6/23 6/30 7/7 Untreated -- -- 0 18.8 16.3 17.5 15.0 16.3 Vydate 1.0 0, 4, 8 0 20.0 15.0 10.0 7.5 11.3 EN 0.75 0, 4, 8 0 15.0 13.8 10.0 8.8 10.0 EN 1.0 0, 4, 8 0 10.0 7.5 8.8 7.5 6.3 EN c 1.0 0, 4, 8 0 20.0 16.3 16.3 17.5 18.8 EN 1.5 0, 4, 8 0 22.5 20.0 16.3 15.0 15.0 EN 2.0 0, 4, 8 0 20.0 15.0 11.3 8.8 10.0 LSD (0.05) 0 23.4 20.8 18.0 15.8 14.9 a WAP = weeks after planting. b Stunting evaluated visually as percent (%) reduction in growth compared to untreated plants. All stunting data was arcsin transformed for statistical analysis though only the actual data is shown. c Treatment was not acidified. Table 11. Effect of EN treatments on visual crop vigor in peppers (A). Treatment
Rate
Timing
Vigor Ratingsb
Total Yield
lbs a.i./A WAPa 5/23 6/6 6/16 6/23 lbs/A Untreated -- -- 10 7.0 8.3 8.8 10,128 Vydate 1.0 0, 4, 8 10 7.0 8.0 9.3 9,232 EN 0.75 0, 4, 8 10 7.3 7.8 9.3 10,422 EN 1.0 0, 4, 8 10 8.0 9.0 9.5 11,180 EN c 1.0 0, 4, 8 10 7.0 7.8 8.8 8,240 EN 1.5 0, 4, 8 10 7.0 7.8 9.0 9,115 EN 2.0 0, 4, 8 10 6.8 8.3 9.5 10,487 LSD (0.05) 0 1.3 1.7 1.4 3,772 a WAP = weeks after planting. b Vigor ratings: 1 = dead, 5 = fair growth, 10 = excellent growth. c Treatment was not acidified.
Table 12. Affect of EN treatments on nematode soil counts and root galling in peppers (A) Treatment
Rate
Timing
J2ad
Lesion a
Stunt
J2 abd
Eggs abd
RK abd
Gall
rating
Gall %
lbs a.i./A
WAPa
-------------- May 5 --------------
-------------------------- August 19 --------------------------
Untreated -- -- 100 50 50 1,275 2,400 2,515 9.0 bc 10.1 bc Vydate 1.0 0, 4, 8 25 100 0 325 2,280 2,480 4.2 c 3.7 c EN 0.75 0, 4, 8 0 0 50 1,125 2,430 2,430 11.1 abc 10.6 bc EN 1.0 0, 4, 8 225 25 75 500 2,850 2,995 21.0 a 23.8 a EN c 1.0 0, 4, 8 325 0 0 450 180 550 6.7 bc 6.8 bc EN 1.5 0, 4, 8 300 150 0 400 2,460 2,460 14.7 ab 16.1 ab EN 2.0 0, 4, 8 125 0 25 1,175 8,940 8,940 5.7 bc 5.4 bc Prob. Val. t-value 0.34 0.43 0.60 0.48 0.11 0.19 0.02 0.02 aCounts per 500 cm3 soil. bCounts were transformed (Log10(count + 1)), before conducting the analysis. Prob. Value is based on the transformed counts. c Treatment was not acidified. dRoot-knot nematode second-stage juveniles (J2) and eggs. RK is the either the J2 or egg value for each plot, which ever was higher.
28
Table 13. Effect of EN treatments on visual crop stunting and diseased plants in peppers (B). Treatment
Rate
Timing
------------------------------------------------ % Stunting ------------------------------------------------
lbs a.i./A WAPa June 10 6/16 6/23 6/30 7/7 7/15 7/22 Untreated -- -- 0 0 5.0 8.8 11.3 12.5 10.0 Vydate 1.0 0, 3, 6 0 0 0 7.5 6.3 15.0 13.8 EN 0.75 0, 3, 6 0 0 0 3.8 6.3 6.3 7.5 EN 1.0 0, 3, 6 0 0 0 0 5.0 3.8 3.8 EN 1.0 0, 2, 4 0 0 0 5.0 3.8 6.3 5.0 EN c 1.0 0, 3, 6 0 0 0 2.5 7.5 10.0 12.5 EN 1.5 0, 3, 6 0 0 0 5.0 8.8 10.0 15.0 EN 2.0 0, 3, 6 0 0 2.5 2.5 5.0 3.8 6.3 LSD (0.05) 0 0 7.0 8.0 10.0 9.4 10.2
a WAP = weeks after planting. b Stunting evaluated visually as percent (%) reduction in growth compared to untreated plants. All stunting data was arcsin transformed for statistical analysis though only the actual data is shown. c Treatment was not acidified.
Table 14. Effect of EN treatments on crop vigor and total yields in peppers (B). Treatment
Rate
Timing
Vigor Ratingsb
Total Yield
lbs a.i./A WAPa 6/16 6/23 6/30 lbs/Ad Untreated -- -- 10 9.5 9.8 6,371 Vydate 1.0 0, 3, 6 10 10 10 5,489 EN 0.75 0, 3, 6 10 10 9.8 6,273 EN 1.0 0, 3, 6 10 10 10 9,664 EN 1.0 0, 2, 4 10 10 10 7,913 EN c 1.0 0, 3, 6 10 10 10 8,011 EN 1.5 0, 3, 6 10 10 10 7,298 EN 2.0 0, 3, 6 10 10 10 7,547 LSD (0.05) 0 0.3 0.4 2,450 a WAP = weeks after planting. b Vigor ratings: 1 = dead, 5 = fair growth, 10 = excellent growth. c Treatment was not acidified. Table 15. Affect of EN treatments on nematode soil counts and root galling in peppers (B) Treatment
Rate
Timing
J2ad
Lesion a
Stunt
J2 abd
Eggs abd
RK abd
Gall
rating
Gall %
lbs a.i./A
WAPa
--------------- June 6 --------------
-
-------------------------- August 14 --------------------------
Untreated -- -- 0 25 0 1,025 1,020 1,630 1.5 1.3 Vydate 1.0 0, 3, 6 25 25 25 425 780 875 2.0 1.3 EN 0.75 0, 3, 6 0 0 0 600 390 815 3.2 2.3 EN 1.0 0, 3, 6 0 0 0 0 210 210 2.6 1.6 EN 1.0 0, 2, 4 0 0 0 75 1,740 1,740 2.6 1.9 EN c 1.0 0, 3, 6 0 0 25 53 1,980 2,005 4.0 2.8 EN 1.5 0, 3, 6 0 0 0 0 810 810 2.6 2.0 EN 2.0 0, 3, 6 0 0 0 75 510 510 1.8 0.9 Prob. Val. t-value 0.46 0.58 0.58 0.16 0.98 0.28 0.67 0.62 aCounts per 500 cm3 soil. bCounts were transformed (Log10(count + 1)), before conducting the analysis. Prob. Value is based on the transformed counts. c Treatment was not acidified. dRoot-knot nematode second-stage juveniles (J2) and eggs. RK is the either the J2 or egg value for each plot, which ever was higher.
29
Evaluation of an Experimental Nematicide for Crop Injury, Yield and Nematode Control in Tomatoes
Russell W. Wallace, Terry Wheeler and Alisa K. Petty
Final Report
Objective: Evaluate the effects of an experimental nematicide (EN) when applied through drip irrigation on crop injury, vigor, fruit yield, nematode populations and root galling in tomatoes grown on the Texas High Plains. Materials and Methods: The trials were conducted at the Carolyn Lanier Youth Farm owned and operated by the South Plains Food Bank located in southeast Lubbock, Lubbock County, Texas during the 2008 growing season. The test site was located on a sandy loam soil with an average pH of 7.6 and 1% organic matter. The trial site was previously treated with compost, which was disked into the soil several weeks before initiation of the test. Prior to transplanting of the first test, the site was rototilled and disked. At transplanting of the first trial on May 5, drip tape (Netafim Typhoon 25gph with 12” emitter spacing) was placed on the surface near the planted rows. Preplant soil samples were collected from within the area to be seeded in each trial. Tomato transplants (var. “Spitfire”) were transplanted by hand using a bulb transplanter into plots measuring 6.7’ x 30’. Within each plot, tomato transplants were spaced to 12” within-row and 80” between rows for a final stand of 24 plants per plot. Prior to transplanting, Dual Magnum (10.4 oz/A) was applied preplant, and during the early season, Sandea (0.5 oz/A) and Poast (1.0 pint/A) were applied postemergence to control emerged broadleaf and grass weeds, and all plots were hand-weeded as needed. At transplanting, a second drip line measuring 25’ in length was placed along side the irrigation line within each plot, and used for chemical treatments. Treatment lines were plugged at both ends until used for injecting the individual treatments at the specified timings. Injections were made using 5.0 gallons of water as a carrier plus the correct amount of chemical. Treatment lines were connected to CO2 tanks pressurized to 15 psi. Following completion of the treatments, 3.0 gallons of additional clean water was injected to clear the lines. The concentration of Vydate CLV was tested and ranged from 40,000 to 47,000 ppm. EN treatments were applied at 0.75, 1.0, 1.5 or 2.0 lbs ai/A. Treatment, soil and root sample timings are shown in Table 16. During crop growth, foliar insecticides and fungicides were applied as needed to control pests; however, there was a virus infection on almost all plants within both tests that caused foliar symptoms (leaf curl and death) and ultimately reduced yields. The virus is under investigation by a plant pathologist and early indications were that it was a phloem-transported virus vectored possibly by pysllids. Fertilizer (liquid humic acid) was applied weekly through the irrigation drip lines as standard procedure by the grower. Crop stunting and vigor were rated beginning 1 month following the first application to emerged plants for approximately 6 weeks. Tomatoes were hand-harvested, and at initial harvest (August 19 for Tomato A; August 7 for Tomato B) soil samples were taken from within the planted rows of each plot. Tomatoes were harvested at least 3 times and treatment yields combined. At the final harvest, root samples were taken from each plot to assess root galling. Both trials were conducted as RCBD’s with 4 replications, and stunting (arcsine transformed data), vigor and yield data were subjected to analysis of variance with means separated using the Least Significant Difference at the 0.05 level. Nematode egg, juvenile and adult counts were transformed (Log10 (count + 1) prior to analyzes using the probable value of t.
Table 16. Timings of nematode sampling during both tomato trials. Timing of events Tomato (A) Tomato (B) Injections At planting June 6 May 5 14 days May 20 21 days May 27 28 days July 3 June 2 42 days June 17 56 days August 4 Soil samples June 4 (preplant), August 19 May 5 (preplant), August 14 Root samples September 9 August 27
30
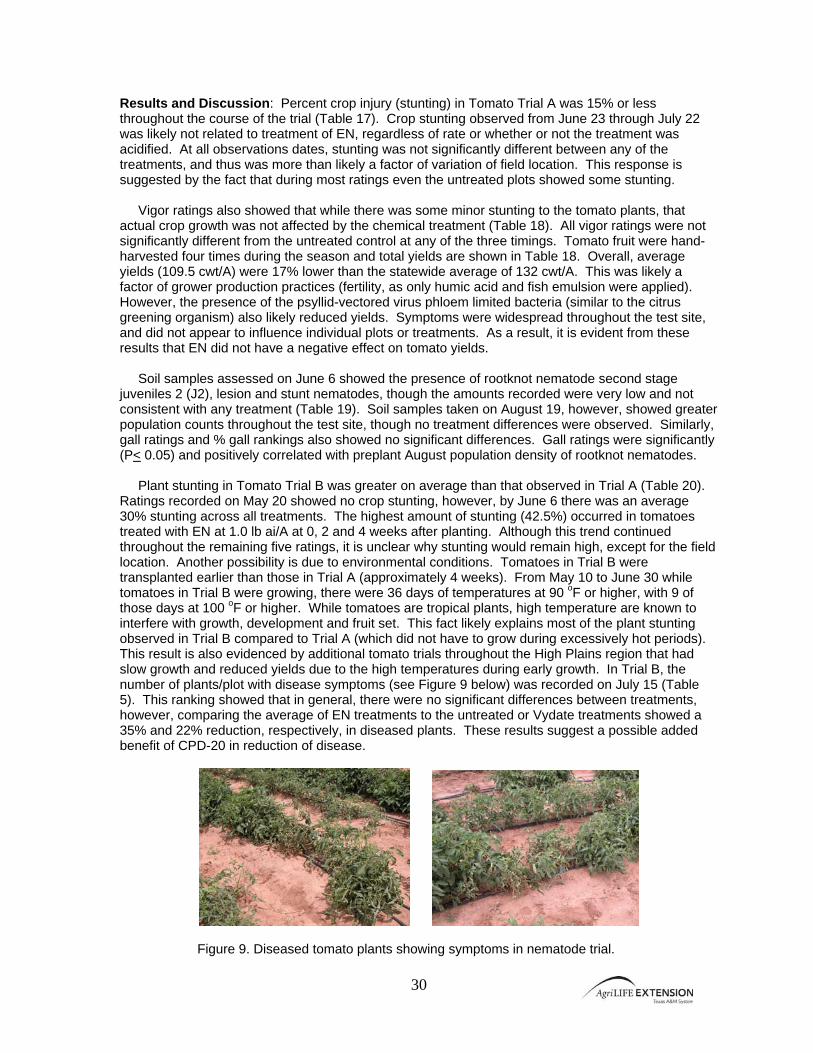
Results and Discussion: Percent crop injury (stunting) in Tomato Trial A was 15% or less throughout the course of the trial (Table 17). Crop stunting observed from June 23 through July 22 was likely not related to treatment of EN, regardless of rate or whether or not the treatment was acidified. At all observations dates, stunting was not significantly different between any of the treatments, and thus was more than likely a factor of variation of field location. This response is suggested by the fact that during most ratings even the untreated plots showed some stunting. Vigor ratings also showed that while there was some minor stunting to the tomato plants, that actual crop growth was not affected by the chemical treatment (Table 18). All vigor ratings were not significantly different from the untreated control at any of the three timings. Tomato fruit were hand-harvested four times during the season and total yields are shown in Table 18. Overall, average yields (109.5 cwt/A) were 17% lower than the statewide average of 132 cwt/A. This was likely a factor of grower production practices (fertility, as only humic acid and fish emulsion were applied). However, the presence of the psyllid-vectored virus phloem limited bacteria (similar to the citrus greening organism) also likely reduced yields. Symptoms were widespread throughout the test site, and did not appear to influence individual plots or treatments. As a result, it is evident from these results that EN did not have a negative effect on tomato yields. Soil samples assessed on June 6 showed the presence of rootknot nematode second stage juveniles 2 (J2), lesion and stunt nematodes, though the amounts recorded were very low and not consistent with any treatment (Table 19). Soil samples taken on August 19, however, showed greater population counts throughout the test site, though no treatment differences were observed. Similarly, gall ratings and % gall rankings also showed no significant differences. Gall ratings were significantly (P< 0.05) and positively correlated with preplant August population density of rootknot nematodes. Plant stunting in Tomato Trial B was greater on average than that observed in Trial A (Table 20). Ratings recorded on May 20 showed no crop stunting, however, by June 6 there was an average 30% stunting across all treatments. The highest amount of stunting (42.5%) occurred in tomatoes treated with EN at 1.0 lb ai/A at 0, 2 and 4 weeks after planting. Although this trend continued throughout the remaining five ratings, it is unclear why stunting would remain high, except for the field location. Another possibility is due to environmental conditions. Tomatoes in Trial B were transplanted earlier than those in Trial A (approximately 4 weeks). From May 10 to June 30 while tomatoes in Trial B were growing, there were 36 days of temperatures at 90 oF or higher, with 9 of those days at 100 oF or higher. While tomatoes are tropical plants, high temperature are known to interfere with growth, development and fruit set. This fact likely explains most of the plant stunting observed in Trial B compared to Trial A (which did not have to grow during excessively hot periods). This result is also evidenced by additional tomato trials throughout the High Plains region that had slow growth and reduced yields due to the high temperatures during early growth. In Trial B, the number of plants/plot with disease symptoms (see Figure 9 below) was recorded on July 15 (Table 5). This ranking showed that in general, there were no significant differences between treatments, however, comparing the average of EN treatments to the untreated or Vydate treatments showed a 35% and 22% reduction, respectively, in diseased plants. These results suggest a possible added benefit of CPD-20 in reduction of disease.
Figure 9. Diseased tomato plants showing symptoms in nematode trial.
31
Crop vigor in Trial A averaged across all three ratings had a value of 9.9, while in Trial B the average rating was only 8.3, a 16% reduction (Table 21). Crop vigor was likely reduced in Trial B due to its earlier planting date and the fact that it went through a longer period of extreme heat compared to Trial A. Also, tomato yields in Trial B were on average higher than Trial A, likely due to less impact of the psyllid-vectored phloem-limited bacteria (Table 21). Although not significant, there was a trend for lower yields of tomatoes in the untreated control plots compared to the other treatments. The average EN treatment had yields 26% and 16% higher when compared to the untreated control and Vydate treatments, respectively. This may be related to the higher numbers of plants in the untreated plots that had symptoms of disease when observed on July 15. Additionally, although there was higher stunting with EN (1.0 lb ai/A) applied at 0, 2, and 4 WAP, yields were not lower but fell within the higher range of all EN treatments. Soil samples assessed for the presence of nematodes on May 5 showed that there were relatively few present, though some populations of rootknot nematode J2, lesion, spiral and dagger nematodes were observed (Table 22). There were no significant differences observed between any of the treatments on that date. Soil samples taken on August 14 showed much higher populations of rootknot nematode J2, rootknot nematode eggs and a statistic that combines the highest egg or J2 value for rootknot nematodes compared with those recorded on May 5. However, due to plot-plot variation and the pattern of nematode populations, there were no observable differences in counts of rootknot nematode J2, rootknot nematode eggs and rootknot nematodes (combined J2 or eggs) on August 14. In fact, average populations in the untreated plots were lowest suggesting that even the randomization of plots failed to provide statistical differences within treatments. The results showed that both eggs and rootknot nematode populations were 3.6 and 5.2 times greater in the average EN treatment compared to the Vydate and untreated control, respectively. Unfortunately, this also does not correlate well with the fact that tomato yields were lowest in the untreated control plots for Trial B, unless unknown factors other than nematodes were present (e.g. other root diseases) and were suppressed by EN treatments. However, there was no evidence of any soilborne fungal pathogens in the test site. Overall, the results of this study show that there was no significant effect of EN on nematode populations regardless of treatment timing and rates in tomatoes at this location. Vydate was slightly more effective, though not significantly different from the EN treatments for suppressing nematodes in these trials. Although there was no effect of EN on nematode populations in this study, treating tomatoes with EN had a positive trend on tomato yields in the earlier of the two trials. While the method of chemical application was very precise; the high variation of nematode populations in the field may have attributed to the lack of significance between treatments.
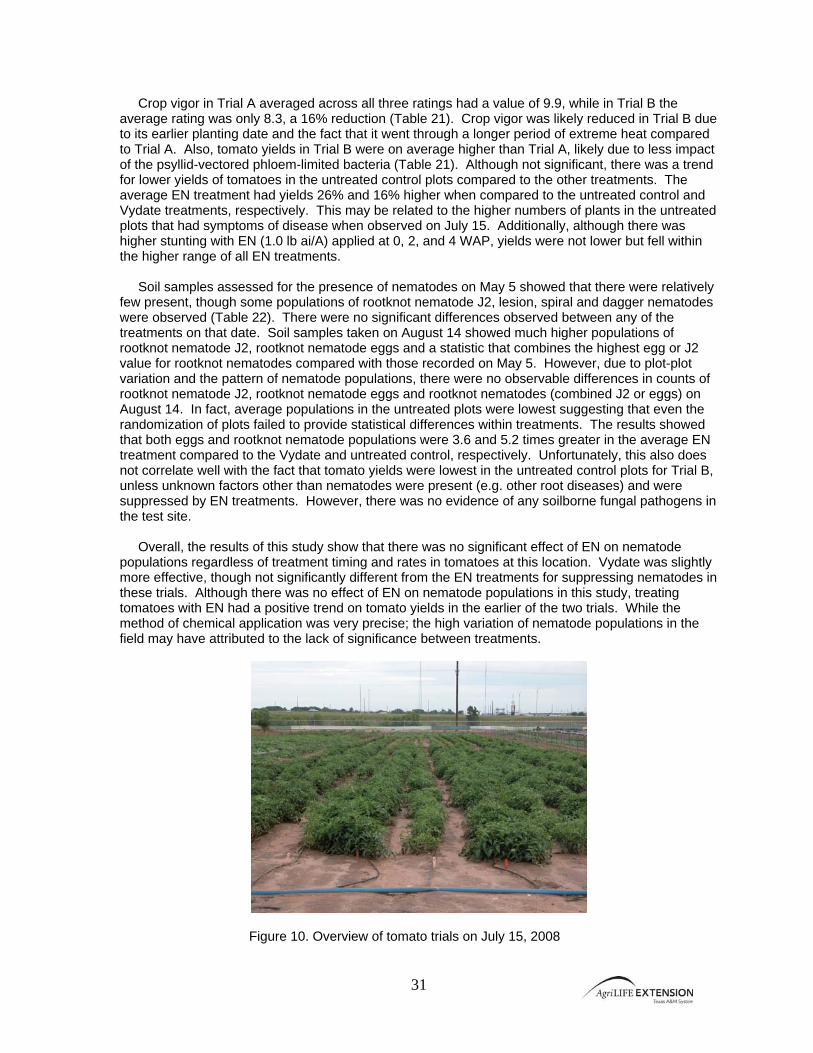
Figure 10. Overview of tomato trials on July 15, 2008
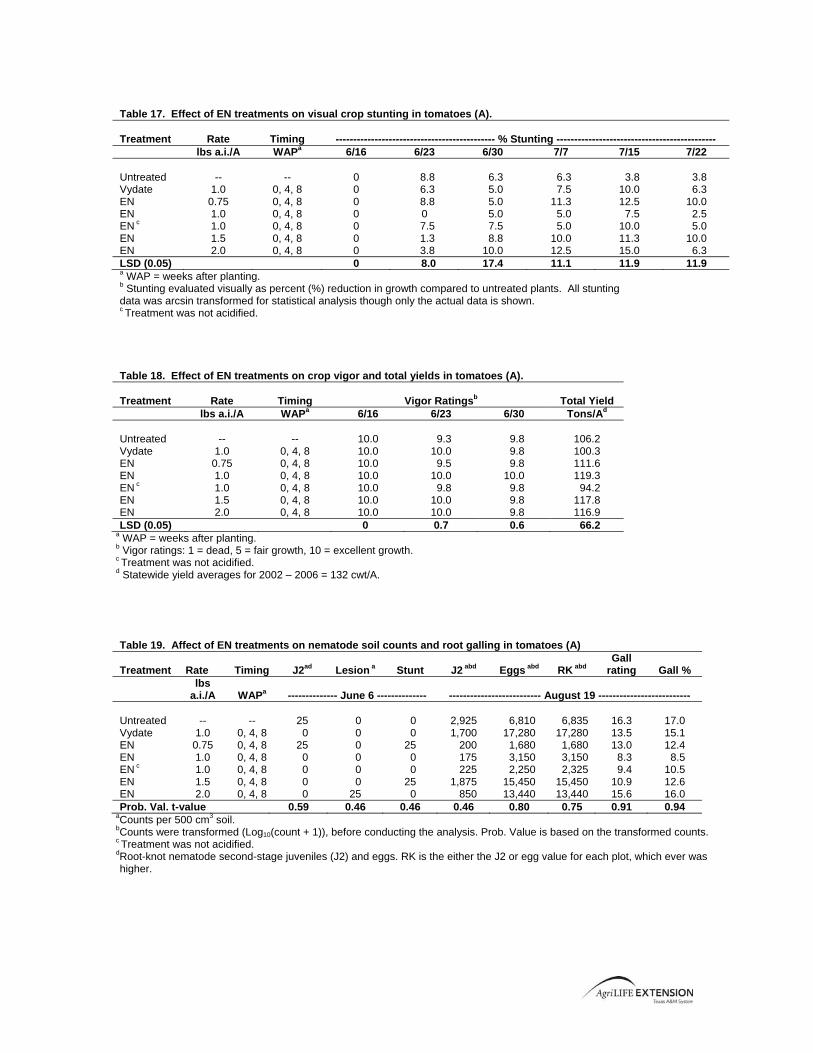
Table 17. Effect of EN treatments on visual crop stunting in tomatoes (A). Treatment
Rate
Timing
--------------------------------------------- % Stunting ---------------------------------------------
lbs a.i./A WAPa 6/16 6/23 6/30 7/7 7/15 7/22 Untreated -- -- 0 8.8 6.3 6.3 3.8 3.8 Vydate 1.0 0, 4, 8 0 6.3 5.0 7.5 10.0 6.3 EN 0.75 0, 4, 8 0 8.8 5.0 11.3 12.5 10.0 EN 1.0 0, 4, 8 0 0 5.0 5.0 7.5 2.5 EN c 1.0 0, 4, 8 0 7.5 7.5 5.0 10.0 5.0 EN 1.5 0, 4, 8 0 1.3 8.8 10.0 11.3 10.0 EN 2.0 0, 4, 8 0 3.8 10.0 12.5 15.0 6.3 LSD (0.05) 0 8.0 17.4 11.1 11.9 11.9 a WAP = weeks after planting. b Stunting evaluated visually as percent (%) reduction in growth compared to untreated plants. All stunting data was arcsin transformed for statistical analysis though only the actual data is shown. c Treatment was not acidified. Table 18. Effect of EN treatments on crop vigor and total yields in tomatoes (A). Treatment
Rate
Timing
Vigor Ratingsb
Total Yield
lbs a.i./A WAPa 6/16 6/23 6/30 Tons/Ad Untreated -- -- 10.0 9.3 9.8 106.2 Vydate 1.0 0, 4, 8 10.0 10.0 9.8 100.3 EN 0.75 0, 4, 8 10.0 9.5 9.8 111.6 EN 1.0 0, 4, 8 10.0 10.0 10.0 119.3 EN c 1.0 0, 4, 8 10.0 9.8 9.8 94.2 EN 1.5 0, 4, 8 10.0 10.0 9.8 117.8 EN 2.0 0, 4, 8 10.0 10.0 9.8 116.9 LSD (0.05) 0 0.7 0.6 66.2
a WAP = weeks after planting. b Vigor ratings: 1 = dead, 5 = fair growth, 10 = excellent growth. c Treatment was not acidified. d Statewide yield averages for 2002 – 2006 = 132 cwt/A. Table 19. Affect of EN treatments on nematode soil counts and root galling in tomatoes (A) Treatment
Rate
Timing
J2ad
Lesion a
Stunt
J2 abd
Eggs abd
RK abd
Gall rating
Gall %
lbs a.i./A
WAPa
-------------- June 6 --------------
-------------------------- August 19 --------------------------
Untreated -- -- 25 0 0 2,925 6,810 6,835 16.3 17.0 Vydate 1.0 0, 4, 8 0 0 0 1,700 17,280 17,280 13.5 15.1 EN 0.75 0, 4, 8 25 0 25 200 1,680 1,680 13.0 12.4 EN 1.0 0, 4, 8 0 0 0 175 3,150 3,150 8.3 8.5 EN c 1.0 0, 4, 8 0 0 0 225 2,250 2,325 9.4 10.5 EN 1.5 0, 4, 8 0 0 25 1,875 15,450 15,450 10.9 12.6 EN 2.0 0, 4, 8 0 25 0 850 13,440 13,440 15.6 16.0 Prob. Val. t-value 0.59 0.46 0.46 0.46 0.80 0.75 0.91 0.94
aCounts per 500 cm3 soil. bCounts were transformed (Log10(count + 1)), before conducting the analysis. Prob. Value is based on the transformed counts. c Treatment was not acidified. dRoot-knot nematode second-stage juveniles (J2) and eggs. RK is the either the J2 or egg value for each plot, which ever was higher.

33
Table 20. Effect of EN treatments on visual crop stunting and diseased plants in tomatoes (B). Treatment
Rate
Timing
------------------------------------- % Stunting -------------------------------------
Symptomatic Plants
lbs a.i./A WAPa 5/20 6/6 6/16 6/23 6/30 7/7 7/15 Untreated -- -- 0 22.5 16.3 15.0 15.0 16.3 10.5 Vydate 1.0 0, 3, 6 0 26.3 16.3 13.8 12.3 18.8 9.5 EN 0.75 0, 3, 6 0 31.3 20.0 15.0 13.8 13.8 4.5 EN 1.0 0, 3, 6 0 35.0 26.3 18.8 18.8 17.5 7.3 EN 1.0 0, 2, 4 0 42.5 27.5 30.0 25.0 28.8 7.8 EN c 1.0 0, 3, 6 0 26.3 20.0 12.5 18.8 21.3 8.5 EN 1.5 0, 3, 6 0 25.0 16.3 7.5 5.0 7.5 5.5 EN 2.0 0, 3, 6 0 31.3 18.8 16.3 17.5 17.5 7.0 LSD (0.05) 0 16.6 18.5 10.2 12.4 9.3 5.6 a WAP = weeks after planting. b Stunting evaluated visually as percent (%) reduction in growth compared to untreated plants. All stunting data was arcsin transformed for statistical analysis though only the actual data is shown. c Treatment was not acidified.
a WAP = weeks after planting. b Vigor ratings: 1 = dead, 5 = fair growth, 10 = excellent growth. c Treatment was not acidified. d Statewide yield averages for 2002 – 2006 = 132 cwt/A.
aCounts per 500 cm3 soil. bCounts were transformed (Log10(count + 1)), before conducting the analysis. Prob. Value is based on the transformed counts. c Treatment was not acidified. dRoot-knot nematode second-stage juveniles (J2) and eggs. RK is the either the J2 or egg value for each plot, which ever was higher.
Table 21. Effect of EN treatments on crop vigor and total yields in tomatoes (B). Treatment
Rate
Timing
Vigor Ratingsb
Total Yield
lbs a.i./A WAPa 6/6 6/16 6/23 Tons/Ad Untreated -- -- 9.0 8.8 9.0 103.9 Vydate 1.0 0, 3, 6 8.3 8.5 8.8 118.3 EN 0.75 0, 3, 6 8.0 8.3 9.0 133.3 EN 1.0 0, 3, 6 7.5 7.8 8.0 140.9 EN 1.0 0, 2, 4 7.0 7.3 8.3 146.8 EN c 1.0 0, 3, 6 7.8 8.3 8.8 116.6 EN 1.5 0, 3, 6 8.3 9.0 9.8 152.3 EN 2.0 0, 3, 6 7.8 7.8 9.0 152.8 LSD (0.05) 1.8 2.1 1.7 89.3
Table 22. Affect of EN treatments on nematode soil counts and root galling in tomatoes (B) Treatment
Rate
Timing
J2ad
Lesion a
Spiral a
Dagger
J2 abd
Eggs abd
RK abd
Gall rating
Gall %
lbs a.i./A
WAPa
---------------------- May 5 -----------------------
-------------------------- August 14 -------------------------
Untreated -- -- 125 25 0 0 1,850 5,430 5,430 40.1 40.8 Vydate 1.0 0, 3, 6 50 125 0 0 3,250 7,740 7,975 32.8 33.4 EN 0.75 0, 3, 6 50 25 25 0 2,225 27,960 27,960 48.9 49.4 EN 1.0 0, 3, 6 25 0 0 0 1,575 12,060 12,125 49.3 50.5 EN 1.0 0, 2, 4 0 0 25 25 1,675 33,450 33,450 35.7 37.2 EN c 1.0 0, 3, 6 50 125 0 0 5,000 60,600 60,905 31.8 32.9 EN 1.5 0, 3, 6 0 0 0 0 3,800 25,080 25,330 44.4 46.8 EN 2.0 0, 3, 6 50 25 0 0 2,375 10,800 10,960 46.1 50.3
Prob. Val. T-value 0.81 0.28 0.46 0.46 0.55 0.40 0.29 0.83 0.76
34
Evaluation of an Experimental Nematicide for Crop Injury, Yield and Nematode Control in Cucumbers
Russell W. Wallace, Terry Wheeler and Alisa K. Petty
Final Report Objective: To evaluate the effect of an experimental nematicide (EN) when applied through drip irrigation on crop injury, vigor, cucumber yield, nematode populations and root galling in cucumbers grown on the Texas High Plains. Materials and Methods: The trials were conducted at the Carolyn Lanier Youth Farm owned and operated by the South Plains Food Bank located in southeast Lubbock, Lubbock County, Texas during the 2008 growing season. The test site was located on a sandy loam soil with an average pH of 7.6 and 1% organic matter. The trial site was previously treated with compost, which was disked into the soil several weeks before initiation of the test. Prior to planting of the first test, the site was rototilled and disked. At seeding of the first planting on May 13, drip tape (Netafim Typhoon 25gph with 12” emitter spacing) was placed on the surface near the planted rows. Preplant soil samples were collected from within the area to be seeded in each trial. Cucumber seed (var. “Calypso”) was planted using an Earthway gravity-fed, hand-push seeder into single-row plots measuring 6.7’ x 30’. Following planting, Dual Magnum (10.4 oz/A) was applied preemergence, and during the early season, Sandea (0.5 oz/A) and Poast (1.0 pint/A) were applied postemergence to control emerged broadleaf and grass weeds. Additionally, all plots were hand-weeded as needed. A second drip line measuring 25’ in length was placed along side the irrigation line within each plot, and used for chemical treatments. Treatment lines were plugged at both ends until used for injecting the individual treatments at the specified timings. Injections were made using 5.0 gallons of water as a carrier plus the correct amount of chemical. Treatment lines were connected to CO2 tanks pressurized to 15 psi. Following completion of the treatments, 3.0 gallons of additional clean water was injected to clear the lines. The concentration of Vydate CLV was tested and ranged from 40,000 to 47,000 ppm. EN treatments were applied at 0.75, 1.0 or 2.0 lbs ai/A. Treatment, soil and root sampling timings are shown in Table 23. Within each plot, emerged seedlings were thinned to 12” with a final stand of 24 plants per plot. During crop growth, foliar insecticides and fungicides were applied as needed to control pests. Fertilizer (liquid humic acid) was applied weekly through the irrigation drip lines as standard procedure by the grower. Crop stunting and vigor were rated beginning 7 days following the first application to emerged plants for approximately 5 weeks. Cucumbers were hand-harvested, and at initial harvest (July 24 for Cucumber A; July 11 for Cucumber B) soil samples were taken from within the planted rows of each plot. Cucumber trials were harvested 3 times each and all treatment yields combined. At the final harvest, root samples were taken from each plot to assess root galling. Both trials were conducted as RCBD’s with 4 replications, and stunting (arcsine transformed data), vigor and yield data were subjected to analysis of variance with means separated using the Least Significant Difference at the 0.05 level. Nematode egg, juvenile and adult counts were transformed (Log10 (count + 1) prior to analyzes using the probable value of t.
Table 23. Timings of nematode sampling during both cucumber trials. Timing of events Cucumber (A) Cucumber (B) Injections At planting June 9 May 13 7 days May 20 14 days June 24 21 days June 30 June 3 28 days July 7 42 days July 21 June 23 Soil samples June 6 (preplant), July 29 May 5 (preplant), July 8, July 18 Root samples August 5 July 18

35
Results and Discussion: Treatments of EN applied during Cucumber Trial A showed no significant differences in crop injury (stunting) throughout the course of the season (Table 24). By June 23, only Vydate had 6.3% crop stunting, though this was not significantly different from any of the other treatments. Although Vydate continued to have slightly higher crop stunting on June 30, this effect had dissipated by July 7. All crop stunting data in Cucumber trial A can be more likely attributed to random soil variations within the field rather than the effects of any of the chemical treatments. Crop vigor ratings assessed on June 16, June 23 and June 30 showed no negative effects of EN or Vydate on the cucumber plants (Table 25). Crop vigor was excellent (10.0) for all plants during the first two ratings, but dropped slightly to 9.5 for several treatments when rated on June 30. Again, it is more likely that the vigor reduction is due to field conditions rather than any effects of the chemical treatments. When totaled across all three harvests, all cucumber yields in Trial A were not significantly different from the untreated control (Table 25). However, there was a significant difference in yields when EN was applied at 0.75 lbs ai/A compared to EN (acidified) applied at 1.0 lbs ai/A, with both treatments occurring at 0, 3, and 6 weeks after planting. It is unclear from this data why there would be a significant reduction at the 1.0 lb ai/A rate in this trial, as neither of the other two 1.0 lb ai/A treatments showed significant reductions. Soil samples assessed on June 6 showed zero populations of second stage juveniles (J2) or rootknot nematodes, and zero to very low populations of lesion, spiral and cyst nematodes present in the soil (Table 26). When sampled on July 29, J2, eggs of rootknot nematodes and RK, which represents J2 or eggs for each plot, depending on which had the greater value, had increased slightly, but were not significantly different between treatments. Nematode populations may have been influenced by an excessive rainfall event that occurred a few days following planting where over 3.0” of rain fell and flooded a portion of the cucumber trial area. Gall ratings from root sampled on July 29 were also low and non-significant, and generally showed 4.0% or less galling. Plant stunting in Cucumber Trial B was somewhat greater than that observed in Trial A, although again, there were no significant differences between treatments at any of the ratings (Table 27). Similar to Trial A, however; there was a trend for Vydate to have slightly higher stunting ratings when compared to all treatments except EN (non-acidified) applied at 1.0 lb ai/A. There is perhaps a benefit to adding an acidifying agent to the treatment to reduce potential crop injury. Similar to Trial A, vigor ratings in Trial B showed no significant differences between any of the treatments (Table 28). All plants within each treatment showed excellent signs of crop growth and had no deleterious effects of chemical treatment. Soil samples assessed on May 5 showed low populations on average, with no significant differences observed between treatments for J2, lesion and spiral nematode populations (Table 29). By July 8, nematode populations had increased an average factor of 35; however, treatment effects were still non-significant. There was a trend for nematode eggs and rootknot populations to have higher numbers in the untreated control plots, but again there was too much variation of nematode populations in the field to show significant differences. Similarly, J2, eggs and rootknot nematode counts recorded on July 18 showed large variations in the numbers when comparing treatments, but these were not statistically significant. The percentage of galls formed on the cucumber roots in Trial B were 9.4 times greater than those recorded in Trial A, showing greater root infection (though still non-significant). Cucumber plots in Trial B were planted 3 weeks prior to the high rainfall event that occurred following planting of Trial A, and may have already been well established. The overall results of this study show that there was no effect of EN on nematode populations regardless of treatment timing and rates in cucumbers. Vydate was just as ineffective for controlling nematodes in these trials. The method of chemical application was very precise; however, the high variation of nematode populations within the field may have attributed to the lack of significance between treatments.

36
Table 24. Effect of EN treatments on visual crop stunting in cucumbers (A). Treatment
Rate
Timing
Stuntingb
lbs a.i./A WAPa 6/16 6/23 6/30 7/7 7/15 Untreated -- -- 0 0 2.5 3.8 6.3 Vydate 1.0 0, 2, 4 0 6.3 17.5 5.0 10.0 EN 0.75 0, 2, 4 0 0 5.0 2.5 2.5 EN 0.75 0, 3, 6 0 0 2.5 8.8 6.3 EN 1.0 0, 2, 4 0 0 5.0 2.5 2.5 EN 1.0 0, 3, 6 0 0 7.5 6.3 11.3 EN c 1.0 0, 3, 6 0 0 5.0 8.8 3.8 LSD (0.05) 0 8.4 16.7 15.8 16.9
a WAP = weeks after planting. b Stunting evaluated visually as percent (%) reduction in growth compared to untreated plants. All stunting data was arcsin transformed for statistical analysis though only the actual data is shown. c Treatment was not acidified.
Table 25. Effect of EN treatments on crop vigor and total yields in cucumbers (A). Treatment
Rate
Timing
Vigor Ratingsb
Total Yield
lbs a.i./A WAPa 6/16 6/23 6/30 Tons/A Untreated -- -- 10.0 10.0 10.0 7.7 Vydate 1.0 0, 2, 4 10.0 10.0 9.5 7.7 EN 0.75 0, 2, 4 10.0 10.0 9.5 9.1 EN 0.75 0, 3, 6 10.0 10.0 9.8 10.8 EN 1.0 0, 2, 4 10.0 10.0 10.0 7.9 EN 1.0 0, 3, 6 10.0 10.0 10.0 6.0 EN c 1.0 0, 3, 6 10.0 10.0 10.0 9.8 LSD (0.05)
0 0 0.9 4.3
a WAP = weeks after planting. b Vigor ratings: 1 = dead, 5 = fair growth, 10 = excellent growth. c Treatment was not acidified.
Table 26. Affect of EN treatments on nematode soil counts and root galling in cucumbers (A)
Rate Timing
J2a
Lesion a
Spiral a
Cyst a
J2 ab
Eggs ab
RK ab
Gall rating
Gall %
lbs a.i./A
WAPa
---------------------- June 6 --------------------
--
---------------------------- July 29 ---------------------------
-- Untreated -- -- 0 0 0 50 0 0 0 2.2 2.0 Vydate 1.0 0, 2, 4 0 50 0 50 0 0 0 3.2 4.0 EN 0.75 0, 2, 4 0 0 0 0 200 0 200 3.1 3.9 EN 0.75 0, 3, 6 0 0 25 50 25 330 330 2.9 2.7 EN 1.0 0, 2, 4 0 0 0 0 50 0 50 1.5 1.8 EN 1.0 0, 3, 6 0 0 0 50 0 0 0 1.4 1.6 EN c 1.0 0, 3, 6 0 0 25 0 0 0 0 1.2 1.2 Prob. Val. t-value 0.03 0.46 0.31 0.65 0.46 0.64 0.91 0.85
aCounts per 500 cm3 soil. bCounts were transformed (Log10(count + 1)), before conducting the analysis. Prob. Value is based on the transformed counts. c Treatment was not acidified.
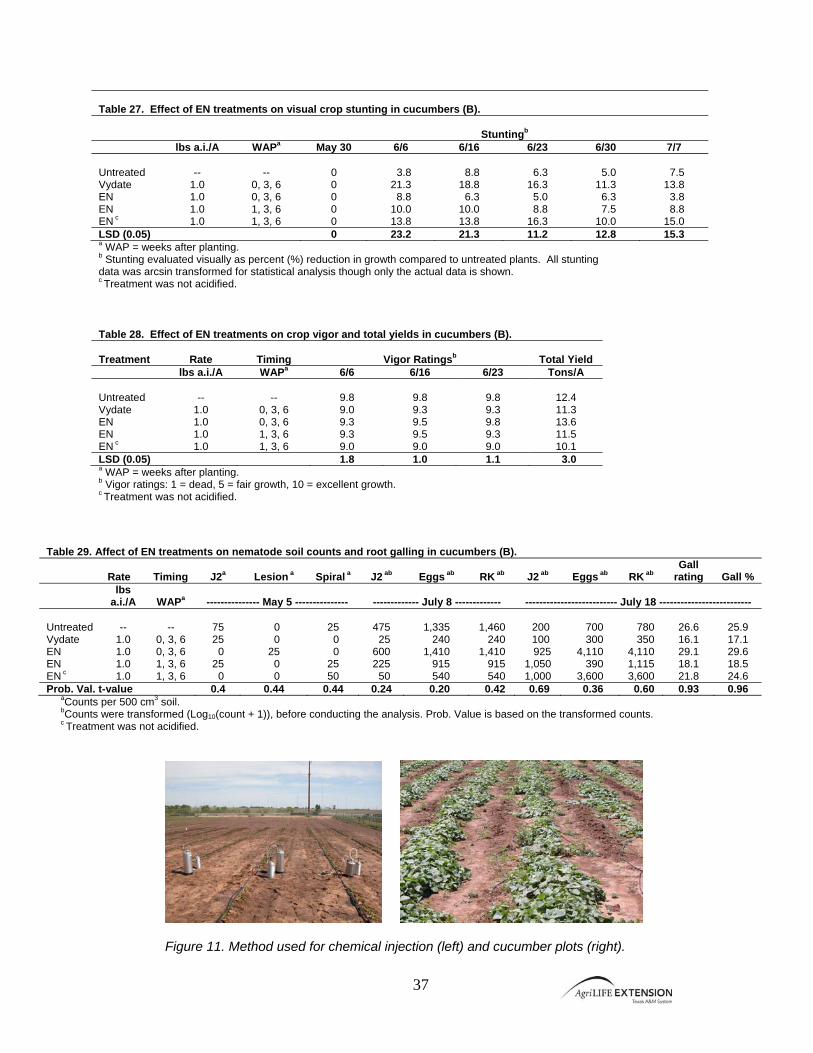
37
Table 27. Effect of EN treatments on visual crop stunting in cucumbers (B).
Stuntingb lbs a.i./A WAPa May 30 6/6 6/16 6/23 6/30 7/7 Untreated -- -- 0 3.8 8.8 6.3 5.0 7.5 Vydate 1.0 0, 3, 6 0 21.3 18.8 16.3 11.3 13.8 EN 1.0 0, 3, 6 0 8.8 6.3 5.0 6.3 3.8 EN 1.0 1, 3, 6 0 10.0 10.0 8.8 7.5 8.8 EN c 1.0 1, 3, 6 0 13.8 13.8 16.3 10.0 15.0 LSD (0.05) 0 23.2 21.3 11.2 12.8 15.3 a WAP = weeks after planting. b Stunting evaluated visually as percent (%) reduction in growth compared to untreated plants. All stunting data was arcsin transformed for statistical analysis though only the actual data is shown. c Treatment was not acidified. Table 28. Effect of EN treatments on crop vigor and total yields in cucumbers (B). Treatment
Rate
Timing
Vigor Ratingsb
Total Yield
lbs a.i./A WAPa 6/6 6/16 6/23 Tons/A Untreated -- -- 9.8 9.8 9.8 12.4 Vydate 1.0 0, 3, 6 9.0 9.3 9.3 11.3 EN 1.0 0, 3, 6 9.3 9.5 9.8 13.6 EN 1.0 1, 3, 6 9.3 9.5 9.3 11.5 EN c 1.0 1, 3, 6 9.0 9.0 9.0 10.1 LSD (0.05) 1.8 1.0 1.1 3.0 a WAP = weeks after planting. b Vigor ratings: 1 = dead, 5 = fair growth, 10 = excellent growth. c Treatment was not acidified.
Table 29. Affect of EN treatments on nematode soil counts and root galling in cucumbers (B).
Rate Timing
J2a
Lesion a
Spiral a
J2 ab
Eggs ab
RK ab
J2 ab
Eggs ab
RK ab
Gall rating
Gall %
lbs a.i./A
WAPa
--------------- May 5 ---------------
------------- July 8 -------------
-------------------------- July 18 --------------------------
Untreated -- -- 75 0 25 475 1,335 1,460 200 700 780 26.6 25.9 Vydate 1.0 0, 3, 6 25 0 0 25 240 240 100 300 350 16.1 17.1 EN 1.0 0, 3, 6 0 25 0 600 1,410 1,410 925 4,110 4,110 29.1 29.6 EN 1.0 1, 3, 6 25 0 25 225 915 915 1,050 390 1,115 18.1 18.5 EN c 1.0 1, 3, 6 0 0 50 50 540 540 1,000 3,600 3,600 21.8 24.6 Prob. Val. t-value 0.4 0.44 0.44 0.24 0.20 0.42 0.69 0.36 0.60 0.93 0.96
aCounts per 500 cm3 soil. bCounts were transformed (Log10(count + 1)), before conducting the analysis. Prob. Value is based on the transformed counts. c Treatment was not acidified.
Figure 11. Method used for chemical injection (left) and cucumber plots (right).
38
Effect of Nitamin 30L Foliar Spray on Nitrogen Leaf Uptake
Russell W. Wallace and Alisa K. Petty
Texas AgriLife Research & Extension Center - Lubbock
Final Report Objective: To evaluate beans, cabbage, cotton and corn for uptake of nitrogen and other nutrients in the leaf when grown under environmental conditions of the Texas High Plains. Materials & Methods: The trial was conducted at the Texas AgriLife Research & Extension Center located in Lubbock on an Acuff clay loam soil with a pH of 8.1 and 0.4% organic matter. Cabbage was seeded in the greenhouse during mid-May and allowed to grow for approximately 6 weeks before being transplanted in the field on April 29. Cotton, beans and field corn were planted previously on April 28. All plots consisted of two 40” beds measuring 6.7’’ x 20’. Nitamin 30L and other products (Solubor, Foli-Gro and Zinc Nitrate) were applied using a CO2-pressurized backpack sprayer equipped with a hand-held 4-nozzle spray boom. The test site was not fertilized preplant during 2008, and all plots were irrigated weekly using furrow irrigation. Insects and diseases were controlled as-needed with chemicals. At 3 and 10 days after applications for each crop, 20 randomly-selected leaves were hand-harvested, washed and dried down in paper sacks. All treatments were sent to A & L Plains Agricultural Laboratories (Lubbock, TX) for nutrient analyses. The trial was conducted as a RCBD with 3 replications and all data were subjected to analysis of variance and means separated using Fisher’s Protected LSD at the 0.05 level.
Results and Discussion: Results of the trial showed that in general there were no significant differences in nitrogen (N) uptake when leaves were analysed separately by crop. However, when the data was combined across all four crops, there were some differences observed (Table 30). Analysis of N levels showed that when compared to the untreated check, N increased when crops were treated with Nitamin 30L, Zinc Nitrate + Nitamin 30L and with Solubor + Foli-Gro. When Nitamin 30L was sprayed in combination with Solubor + Foli-Gro, N was not significantly higher, but increased an average 2%. These data suggest that while not clearly a definitive increase, Nitamin 30L appears to be absorbed and increase N levels in the leaves of plants. More trials with increased replications are needed to determine whether the response can occur across more crops. There were no differences in sulfur (S), potassium (K), magnesium (Mg), calcium (Ca), sodium (Na), boron (B), manganese (Mn), iron (Fe), and copper (Cu) leaf content; however, phosphorus (P) levels were significantly higher when crops were treated with Zinc Nitrate, Nitamin 30L, Solubor + Foli-Gro, and Solubor + Foli-Gro + Nitamin 30L. On average, P levels were 10% higher in those treatments compared to the untreated control. Additionally, Zn levels were significantly higher by 440% and 260% in Zinc Nitrate and Zinc Nitrate + Nitamin 30L plots, respectively. Finally, the presence of aluminum (Al) was significantly lower in leaves treated with Zinc Nitrate alone.
Overall, the results of this study suggest that Nitamin 30L is absorbed and taken into the leaves of snap beans, cabbage, corn and cotton when applied as a broadcast spray. While the results are not conclusive, they are positive, and more testing would help to increase the knowledge base for which crops have improved absorption of Nitamin 30L, and which crops may need to be avoided.
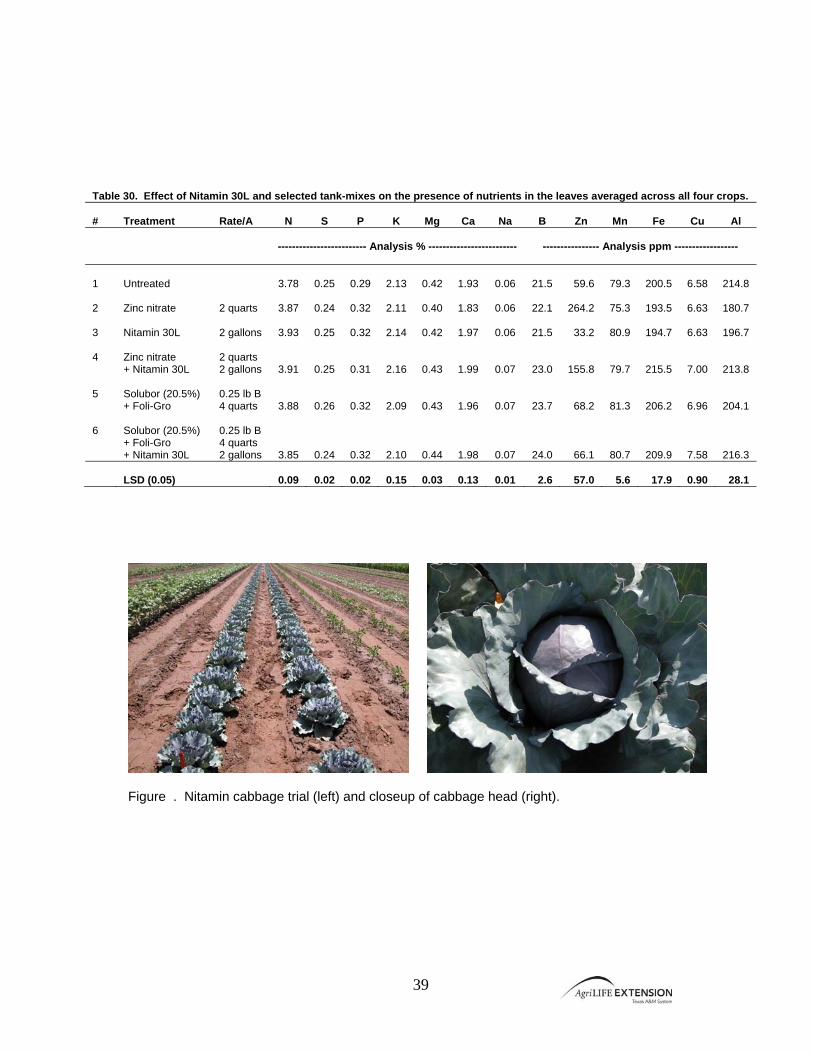
39
Figure . Nitamin cabbage trial (left) and closeup of cabbage head (right).
Table 30. Effect of Nitamin 30L and selected tank-mixes on the presence of nutrients in the leaves averaged across all four crops. #
Treatment
Rate/A
N
S
P
K
Mg
Ca
Na
B
Zn
Mn
Fe
Cu
Al
------------------------- Analysis % -------------------------
---------------- Analysis ppm ------------------
1
Untreated
3.78
0.25
0.29
2.13
0.42
1.93
0.06
21.5
59.6
79.3
200.5
6.58
214.8
2
Zinc nitrate
2 quarts
3.87
0.24
0.32
2.11
0.40
1.83
0.06
22.1
264.2
75.3
193.5
6.63
180.7
3
Nitamin 30L
2 gallons
3.93
0.25
0.32
2.14
0.42
1.97
0.06
21.5
33.2
80.9
194.7
6.63
196.7
4
Zinc nitrate + Nitamin 30L
2 quarts 2 gallons
3.91
0.25
0.31
2.16
0.43
1.99
0.07
23.0
155.8
79.7
215.5
7.00
213.8 5
Solubor (20.5%) + Foli-Gro
0.25 lb B 4 quarts
3.88
0.26
0.32
2.09
0.43
1.96
0.07
23.7
68.2
81.3
206.2
6.96
204.1 6
Solubor (20.5%) + Foli-Gro + Nitamin 30L
0.25 lb B 4 quarts 2 gallons
3.85
0.24
0.32
2.10
0.44
1.98
0.07
24.0
66.1
80.7
209.9
7.58
216.3
LSD (0.05)
0.09
0.02
0.02
0.15
0.03
0.13
0.01
2.6
57.0
5.6
17.9
0.90
28.1

40
Evaluation of Snap Bean Varieties for Heat Tolerance and Yield on the Texas High Plains (I)
Russell W. Wallace & Alisa K. Petty
Texas AgriLife Research & Extension Center - Lubbock
Final Report Objective: To evaluate the effects of heat on yield performance of selected processing snap beans when grown at 3 timings on the Texas High Plains. Materials & Methods: The trial was conducted on three grower’s fields located near Farwell, Texas, generally on sandy loam soils. The trial sites were fertilized, and disked prior to initiation of the test according to standard grower practices, and beans planted on 30” centers. Snap bean varieties were planted in June, July and August by the growers using standard equipment. Following planting beans were irrigated using an overhead center pivot system as needed during the crop season. A standard application of Treflan or Dual Magnum was incorporated prior to planting by the grower. All other pests (insects and diseases) were controlled as needed by the grower. Crop emergence was recorded 2 weeks following planting and at harvest. Snap bean pod yields were recorded by randomly selecting 5’ sections within each plot by removing the plants and stripping off the pods. Total plant weight, pod weight, and plant number were recorded. Pods were then graded into sieve size categories using a commercial grader owned by the processor. All data were subjected to analysis of variance and means separated using the Least Significant Difference at the 0.05 level. Results and Discussion: Early-planted (June) snap beans showed that when compared to the grower standard (BBL 156), emergence was significantly less for round pod beans PLS 84, and flat beans Herrera and Roma II (Table 31). Round pod bean yields were highest with Huntington followed by BBL 156 (grower standard) and Embassy, all which had yields at 7.0 tons/A or higher. Lowest yields were found with KSI 196 (another grower standard), HTS Bush Bean, and PLS 84. Flat beans gave yields of 5.2 tons or better. Round pod beans planted in mid-July emerged more uniformly across varieties and none were significantly different from the standard BBL 156 (Table 32). Similar to the earlier planting, Huntington gave yields equal to BBL 156, which were highest at this planting. Embassy also performed well at this planting. Lowest yields were found in plantings of HTS Bush Bean, PLS 84, and HS 418G. With flat beans, yields of Herrera and Roma II averaged only 3.4 tons/A. Beans planted in August showed that emergence was influenced by variety selection (Table 33). Embassy, GB 83 and PLS 84 had the lowest emergence while Ulysses and Weapon had the highest. For round pod beans, average yields were highest with Weapon followed by Hayden, and these yields were 27% and 21% higher, respectively, when compared to BBL 156 (standard). Flat beans planted showed higher yields for all three varieties and were 6.0 tons/A or higher. When combined across all three planting dates, emergence was greatest with Huntington, Hayden and Herrera with an average 16.0 plants/3’ row (Table 34). Yields of round pod beans were highest with Huntington, followed by BBL 156 and Weapon, and Embassy. All four varieties averaged 6.0 tons/A or better, which is approximately 1.0 ton better than the grower average across the Texas High Plains. Percent pod weight of total round pod plants was highest with Spartacus, followed by PLS 84, Embassy and BBL 156 indicating that these varieties had a greater weight of pods per unit mass of stems and leaves. Sieve size distribution was variable between varieties (Figure 13). Overall, the results of this trial suggest that Huntington and Embassy are comparable to BBL 156 in terms of yields when planted early, mid-season or late on the Texas High Plains.
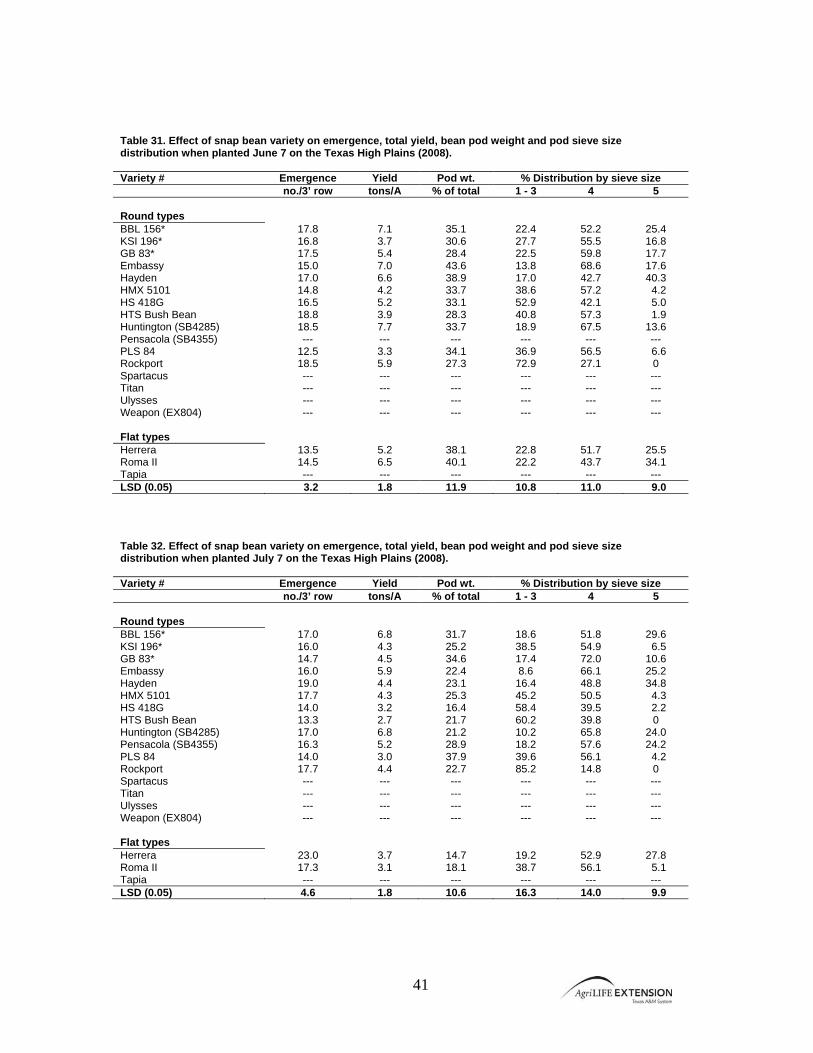
41
Table 31. Effect of snap bean variety on emergence, total yield, bean pod weight and pod sieve size distribution when planted June 7 on the Texas High Plains (2008). Variety # Emergence Yield Pod wt. % Distribution by sieve size no./3’ row tons/A % of total 1 - 3 4 5 Round types BBL 156* 17.8 7.1 35.1 22.4 52.2 25.4 KSI 196* 16.8 3.7 30.6 27.7 55.5 16.8 GB 83* 17.5 5.4 28.4 22.5 59.8 17.7 Embassy 15.0 7.0 43.6 13.8 68.6 17.6 Hayden 17.0 6.6 38.9 17.0 42.7 40.3 HMX 5101 14.8 4.2 33.7 38.6 57.2 4.2 HS 418G 16.5 5.2 33.1 52.9 42.1 5.0 HTS Bush Bean 18.8 3.9 28.3 40.8 57.3 1.9 Huntington (SB4285) 18.5 7.7 33.7 18.9 67.5 13.6 Pensacola (SB4355) --- --- --- --- --- --- PLS 84 12.5 3.3 34.1 36.9 56.5 6.6 Rockport 18.5 5.9 27.3 72.9 27.1 0 Spartacus --- --- --- --- --- --- Titan --- --- --- --- --- --- Ulysses --- --- --- --- --- --- Weapon (EX804) --- --- --- --- --- --- Flat types Herrera 13.5 5.2 38.1 22.8 51.7 25.5 Roma II 14.5 6.5 40.1 22.2 43.7 34.1 Tapia --- --- --- --- --- --- LSD (0.05) 3.2 1.8 11.9 10.8 11.0 9.0
Table 32. Effect of snap bean variety on emergence, total yield, bean pod weight and pod sieve size distribution when planted July 7 on the Texas High Plains (2008). Variety # Emergence Yield Pod wt. % Distribution by sieve size no./3’ row tons/A % of total 1 - 3 4 5 Round types BBL 156* 17.0 6.8 31.7 18.6 51.8 29.6 KSI 196* 16.0 4.3 25.2 38.5 54.9 6.5 GB 83* 14.7 4.5 34.6 17.4 72.0 10.6 Embassy 16.0 5.9 22.4 8.6 66.1 25.2 Hayden 19.0 4.4 23.1 16.4 48.8 34.8 HMX 5101 17.7 4.3 25.3 45.2 50.5 4.3 HS 418G 14.0 3.2 16.4 58.4 39.5 2.2 HTS Bush Bean 13.3 2.7 21.7 60.2 39.8 0 Huntington (SB4285) 17.0 6.8 21.2 10.2 65.8 24.0 Pensacola (SB4355) 16.3 5.2 28.9 18.2 57.6 24.2 PLS 84 14.0 3.0 37.9 39.6 56.1 4.2 Rockport 17.7 4.4 22.7 85.2 14.8 0 Spartacus --- --- --- --- --- --- Titan --- --- --- --- --- --- Ulysses --- --- --- --- --- --- Weapon (EX804) --- --- --- --- --- --- Flat types Herrera 23.0 3.7 14.7 19.2 52.9 27.8 Roma II 17.3 3.1 18.1 38.7 56.1 5.1 Tapia --- --- --- --- --- --- LSD (0.05) 4.6 1.8 10.6 16.3 14.0 9.9

42
Table 34. Effect of snap bean variety on emergence, total yield, bean pod weight and pod sieve size distribution averaged across the season when planted on the Texas High Plains (2008). Variety # Emergence Yield Pod wt. % Distribution by sieve size no./3’ row tons/A % of total 1 - 3 4 5 Round types BBL 156* 15.3 6.2 36.6 24.5 54.8 20.7 KSI 196* 15.1 3.6 26.9 44.8 46.6 8.7 GB 83* 13.6 4.2 34.1 28.0 58.9 13.1 Embassy 13.6 6.0 38.6 13.7 67.2 19.1 Hayden 16.3 5.7 34.8 16.7 43.0 40.3 HMX 5101 14.8 4.2 31.0 40.3 54.1 5.6 HS 418G 12.8 3.5 28.3 66.6 30.8 2.6 HTS Bush Bean 14.8 3.2 27.2 53.2 46.1 0.7 Huntington (SB4285) 16.7 6.9 30.0 19.7 62.3 18.0 Pensacola (SB4355)** 13.0 4.3 35.6 30.0 56.2 13.8 PLS 84 11.1 3.0 40.8 38.8 56.1 5.1 Rockport 15.7 5.0 29.8 82.3 17.7 0 Spartacus** 11.0 4.6 43.1 16.3 48.6 35.1 Titan** 11.7 3.2 29.2 51.3 44.2 4.5 Ulysses** 14.7 4.4 31.0 18.6 52.0 29.4 Weapon (EX804)** 15.0 6.2 35.9 15.8 59.7 24.5 Flat types Herrera 16.0 5.0 33.3 21.0 52.5 26.5 Roma II 14.2 5.7 38.4 26.8 48.3 24.9 Tapia** 10.7 6.1 62.3 22.2 35.7 42.1 LSD (0.05) 2.6 1.2 7.9 10.6 9.7 7.0
* Standard grower varieties ** Varieties not included in the analyses due to being planted only once or twice during the season.
Table 33. Effect of snap bean variety on emergence, total yield, bean pod weight and pod sieve size distribution when planted early August on the Texas High Plains (2008). Variety # Emergence Yield Pod wt. % Distribution by sieve size no./3’ row tons/A % of total 1 - 3 4 5 Round types BBL 156* 10.3 4.5 43.3 33.1 61.3 5.6 KSI 196* 12.0 2.9 23.7 73.7 26.3 0 GB 83* 7.3 2.5 41.1 46.1 44.5 9.4 Embassy 9.3 4.9 48.2 18.4 66.5 15.0 Hayden 12.7 5.7 41.0 16.5 37.6 45.9 HMX 5101 12.0 4.0 33.1 37.7 53.6 8.6 HS 418G 6.7 1.6 33.9 92.9 7.1 0 HTS Bush Bean 11.0 4.5 40.3 91.9 8.1 0 Huntington (SB4285) 14.0 5.8 33.7 30.5 51.8 17.7 Pensacola (SB4355) 9.7 3.4 42.2 41.7 54.7 3.5 PLS 84 6.3 2.7 52.7 40.6 55.5 3.9 Rockport 10.0 4.5 40.3 91.9 8.1 0 Spartacus 11.0 4.6 43.1 16.3 48.6 35.1 Titan 11.7 3.2 29.2 51.3 44.2 4.5 Ulysses 14.7 4.4 31.0 18.6 52.0 29.4 Weapon (EX804) 15.0 6.2 35.9 15.8 59.7 24.5 Flat types Herrera 12.3 6.0 45.2 20.2 53.3 26.5 Roma II 10.7 7.2 56.4 21.1 46.5 32.4 Tapia 10.7 6.1 62.3 22.2 35.7 42.1 LSD (0.05) 5.2 1.5 18.1 21.3 20.1 14.0
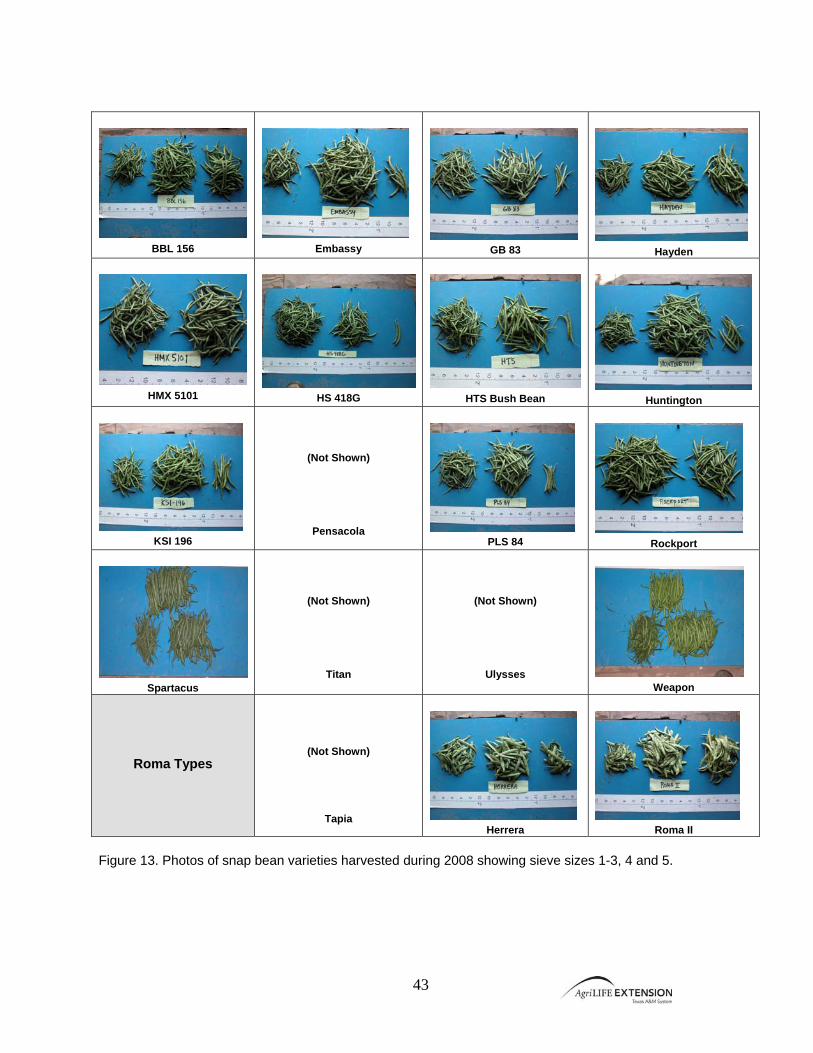
43
BBL 156
Embassy
GB 83
Hayden
HMX 5101 HS 418G
HTS Bush Bean Huntington
KSI 196
(Not Shown)
Pensacola PLS 84
Rockport
Spartacus
(Not Shown)
Titan
(Not Shown)
Ulysses Weapon
Roma Types
(Not Shown)
Tapia Herrera
Roma II
Figure 13. Photos of snap bean varieties harvested during 2008 showing sieve sizes 1-3, 4 and 5.
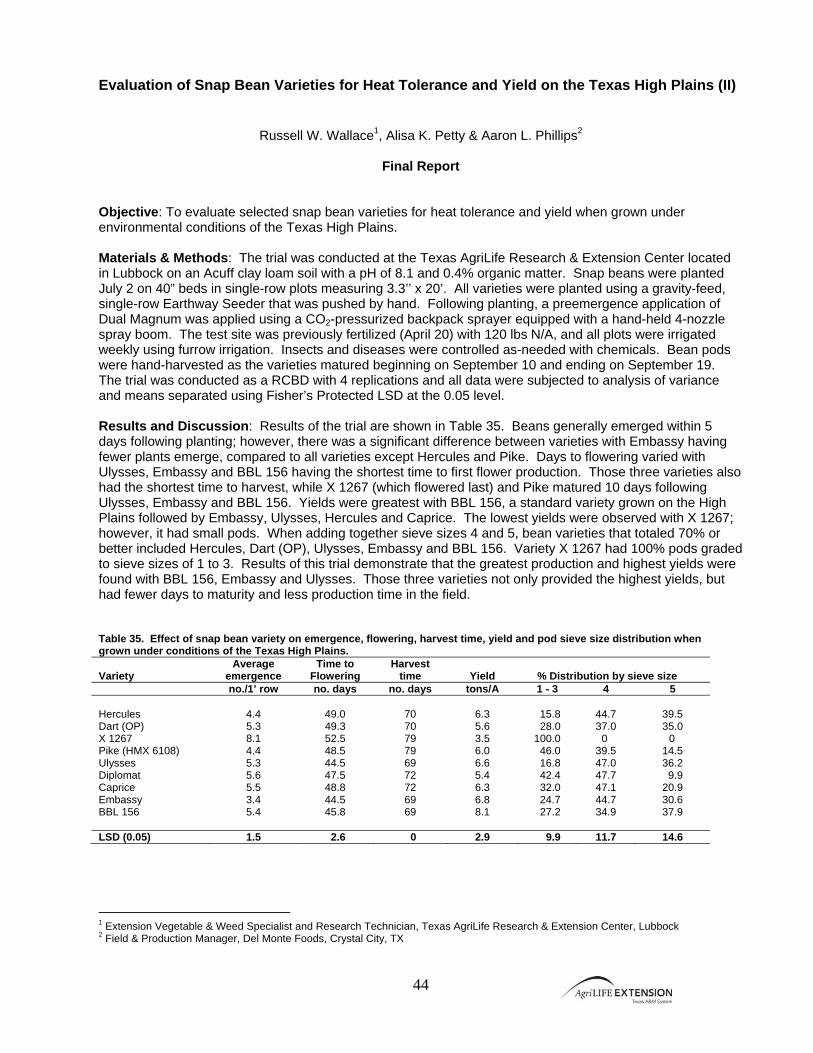
44
Evaluation of Snap Bean Varieties for Heat Tolerance and Yield on the Texas High Plains (II)
Russell W. Wallace1, Alisa K. Petty & Aaron L. Phillips2
Final Report Objective: To evaluate selected snap bean varieties for heat tolerance and yield when grown under environmental conditions of the Texas High Plains. Materials & Methods: The trial was conducted at the Texas AgriLife Research & Extension Center located in Lubbock on an Acuff clay loam soil with a pH of 8.1 and 0.4% organic matter. Snap beans were planted July 2 on 40” beds in single-row plots measuring 3.3’’ x 20’. All varieties were planted using a gravity-feed, single-row Earthway Seeder that was pushed by hand. Following planting, a preemergence application of Dual Magnum was applied using a CO2-pressurized backpack sprayer equipped with a hand-held 4-nozzle spray boom. The test site was previously fertilized (April 20) with 120 lbs N/A, and all plots were irrigated weekly using furrow irrigation. Insects and diseases were controlled as-needed with chemicals. Bean pods were hand-harvested as the varieties matured beginning on September 10 and ending on September 19. The trial was conducted as a RCBD with 4 replications and all data were subjected to analysis of variance and means separated using Fisher’s Protected LSD at the 0.05 level. Results and Discussion: Results of the trial are shown in Table 35. Beans generally emerged within 5 days following planting; however, there was a significant difference between varieties with Embassy having fewer plants emerge, compared to all varieties except Hercules and Pike. Days to flowering varied with Ulysses, Embassy and BBL 156 having the shortest time to first flower production. Those three varieties also had the shortest time to harvest, while X 1267 (which flowered last) and Pike matured 10 days following Ulysses, Embassy and BBL 156. Yields were greatest with BBL 156, a standard variety grown on the High Plains followed by Embassy, Ulysses, Hercules and Caprice. The lowest yields were observed with X 1267; however, it had small pods. When adding together sieve sizes 4 and 5, bean varieties that totaled 70% or better included Hercules, Dart (OP), Ulysses, Embassy and BBL 156. Variety X 1267 had 100% pods graded to sieve sizes of 1 to 3. Results of this trial demonstrate that the greatest production and highest yields were found with BBL 156, Embassy and Ulysses. Those three varieties not only provided the highest yields, but had fewer days to maturity and less production time in the field. Table 35. Effect of snap bean variety on emergence, flowering, harvest time, yield and pod sieve size distribution when grown under conditions of the Texas High Plains. Variety
Average emergence
Time to Flowering
Harvest time
Yield
% Distribution by sieve size
no./1’ row no. days no. days tons/A 1 - 3 4 5 Hercules 4.4 49.0 70 6.3 15.8 44.7 39.5 Dart (OP) 5.3 49.3 70 5.6 28.0 37.0 35.0 X 1267 8.1 52.5 79 3.5 100.0 0 0 Pike (HMX 6108) 4.4 48.5 79 6.0 46.0 39.5 14.5 Ulysses 5.3 44.5 69 6.6 16.8 47.0 36.2 Diplomat 5.6 47.5 72 5.4 42.4 47.7 9.9 Caprice 5.5 48.8 72 6.3 32.0 47.1 20.9 Embassy 3.4 44.5 69 6.8 24.7 44.7 30.6 BBL 156 5.4 45.8 69 8.1 27.2 34.9 37.9 LSD (0.05) 1.5 2.6 0 2.9 9.9 11.7 14.6
1 Extension Vegetable & Weed Specialist and Research Technician, Texas AgriLife Research & Extension Center, Lubbock 2 Field & Production Manager, Del Monte Foods, Crystal City, TX

45
Evaluation of Selected Pumpkin Varieties Grown on the Texas High Plains
Russell W. Wallace and Alisa K. Petty
Final Report Objective: To evaluate pumpkin varieties for yield and quality when grown on the Texas High Plains. Materials & Methods: The trial was conducted at the Texas AgriLife Research & Extension Center located in Lubbock on an Acuff clay loam soil with a pH of 8.1 and 0.4% organic matter. Pumpkins were seeded by hand on June 4 onto 40” beds in 5-row plots measuring 16.7’ x 30’. Following planting, a preemergence application of Dual Magnum was applied. The test site was fertilized with 80 lbs N/A, and all plots were irrigated weekly using furrow irrigation. Insects, diseases and weeds were controlled as-needed with chemicals. Pumpkins were hand-harvested as the varieties matured. The trial was conducted as a RCBD with 2 replications, and data subjected to ANOVA and means separated using Fisher’s Protected LSD (0.05) Results and Discussion: See results in Table 36. Variety
Seed source
Description and characteristics by seed company
Appalachian
Seminis
110 days, Jack ‘O Lantern type, bush; thick fleshed, lightly sutured, dark orange fruit
Spooktacular
Seminis
85 days, small vine, orange smooth, 3 – 4 lbs (pie type)
PXT 13067440 III
Seminis
Biotech variety (unknown)
Aspen
Hollar Seeds
95 days, semi-bush hybrid. Medium ribs, good handles, good rich orange color
Neon
Hollar Seeds
70 days, semi-bush jack-o-lantern hybrid, orange with 7 – 8 lb fruit.
Jack of All Trades
Hollar Seeds
90 days, uniform, excellent handle, smooth w/ light sutures. Semi-bush, dark orange
Gladiator
Champion Seed
90 – 100 days, deep orange, round
Sorcerer
Champion Seed
90 – 100 days, dark orange, semi-full vine, round
Fairytale
Champion Seed
110 days, deeply lobed squatty fruit, mahogany brown, vigorous vines
Knuckle Head
Siegers Seed
105 days, vine type, orange, slightly tall fruit, heavily populated with warts
Goose Bumps
Siegers Seed
95 days, vine type with round orange fruit that is heavily populated with warts
Gremlins
Siegers Seed
100 days, Large sized, multi-shaped gourds, various solid and speckled colors
Hannibal
Siegers Seed
Powdery mildew tolerance, upright, dark orange, slight sutures and a standard rind
Magic Lantern
DeWitt Seed
Upright shape, dark orange
Aladdin
DeWitt Seed
Round to tall, dark orange
Gold Strike
DeWitt Seed
110 days, vine, dark orange, slightly flattened fruit
Gold Rush
DeWitt Seed
120 days, large vines, deep orange
Gold Standard
DeWitt Seed
90 days, restricted vine, deep orange
Gold Bullion
DeWitt Seed
100 days, semi-bush, orange
Howdy Doody
DeWitt Seed
90 days, restricted vine, slightly squatted fruit
Charisma
DeWitt Seed
98 days, blocky round, deep orange, reduced vine
Wolf
DeWitt Seed
120 days, large handles, deep orange, 15 – 25 lbs (Johnny’s Selected Seeds)
Mystic Plus
DeWitt Seed
Round upright, 5 – 6 lbs, dark orange (Harris Seeds)
Howden
Local
115 days, vine, deep orange
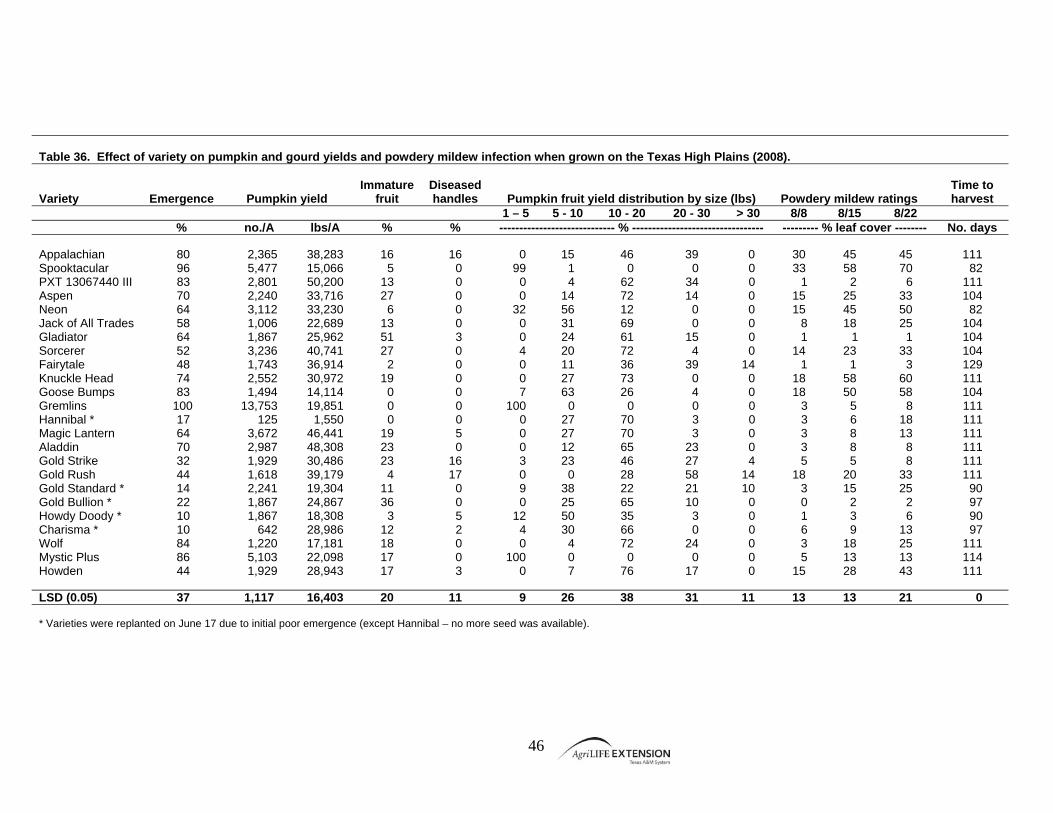
46
Table 36. Effect of variety on pumpkin and gourd yields and powdery mildew infection when grown on the Texas High Plains (2008). Variety
Emergence
Pumpkin yield Immature
fruit Diseased handles
Pumpkin fruit yield distribution by size (lbs)
Powdery mildew ratings Time to harvest
1 – 5 5 - 10 10 - 20 20 - 30 > 30 8/8 8/15 8/22 % no./A lbs/A % % ----------------------------- % --------------------------------- --------- % leaf cover -------- No. days Appalachian 80 2,365 38,283 16 16 0 15 46 39 0 30 45 45 111 Spooktacular 96 5,477 15,066 5 0 99 1 0 0 0 33 58 70 82 PXT 13067440 III 83 2,801 50,200 13 0 0 4 62 34 0 1 2 6 111 Aspen 70 2,240 33,716 27 0 0 14 72 14 0 15 25 33 104 Neon 64 3,112 33,230 6 0 32 56 12 0 0 15 45 50 82 Jack of All Trades 58 1,006 22,689 13 0 0 31 69 0 0 8 18 25 104 Gladiator 64 1,867 25,962 51 3 0 24 61 15 0 1 1 1 104 Sorcerer 52 3,236 40,741 27 0 4 20 72 4 0 14 23 33 104 Fairytale 48 1,743 36,914 2 0 0 11 36 39 14 1 1 3 129 Knuckle Head 74 2,552 30,972 19 0 0 27 73 0 0 18 58 60 111 Goose Bumps 83 1,494 14,114 0 0 7 63 26 4 0 18 50 58 104 Gremlins 100 13,753 19,851 0 0 100 0 0 0 0 3 5 8 111 Hannibal * 17 125 1,550 0 0 0 27 70 3 0 3 6 18 111 Magic Lantern 64 3,672 46,441 19 5 0 27 70 3 0 3 8 13 111 Aladdin 70 2,987 48,308 23 0 0 12 65 23 0 3 8 8 111 Gold Strike 32 1,929 30,486 23 16 3 23 46 27 4 5 5 8 111 Gold Rush 44 1,618 39,179 4 17 0 0 28 58 14 18 20 33 111 Gold Standard * 14 2,241 19,304 11 0 9 38 22 21 10 3 15 25 90 Gold Bullion * 22 1,867 24,867 36 0 0 25 65 10 0 0 2 2 97 Howdy Doody * 10 1,867 18,308 3 5 12 50 35 3 0 1 3 6 90 Charisma * 10 642 28,986 12 2 4 30 66 0 0 6 9 13 97 Wolf 84 1,220 17,181 18 0 0 4 72 24 0 3 18 25 111 Mystic Plus 86 5,103 22,098 17 0 100 0 0 0 0 5 13 13 114 Howden 44 1,929 28,943 17 3 0 7 76 17 0 15 28 43 111 LSD (0.05) 37 1,117 16,403 20 11 9 26 38 31 11 13 13 21 0 * Varieties were replanted on June 17 due to initial poor emergence (except Hannibal – no more seed was available).
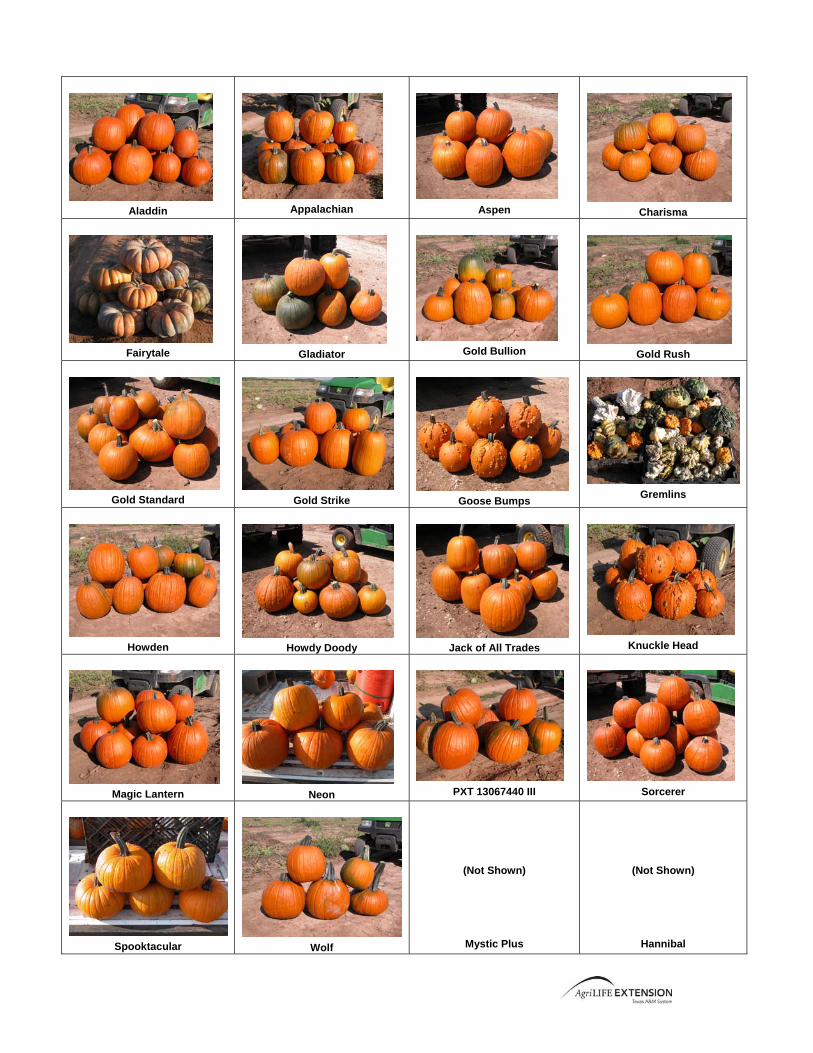
Aladdin
Appalachian
Aspen
Charisma
Fairytale
Gladiator
Gold Bullion
Gold Rush
Gold Standard
Gold Strike
Goose Bumps
Gremlins
Howden
Howdy Doody
Jack of All Trades
Knuckle Head
Magic Lantern
Neon
PXT 13067440 III
Sorcerer
Spooktacular
Wolf
(Not Shown)
Mystic Plus
(Not Shown)
Hannibal
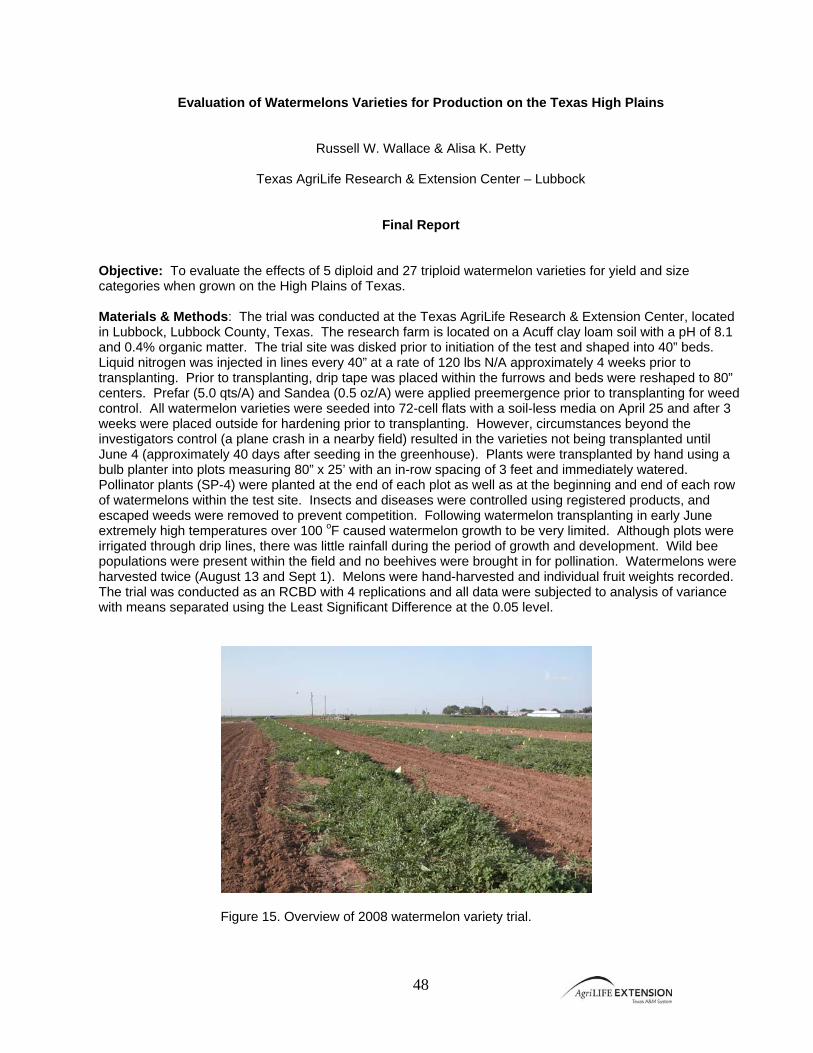
48
Evaluation of Watermelons Varieties for Production on the Texas High Plains
Russell W. Wallace & Alisa K. Petty
Texas AgriLife Research & Extension Center – Lubbock
Final Report Objective: To evaluate the effects of 5 diploid and 27 triploid watermelon varieties for yield and size categories when grown on the High Plains of Texas. Materials & Methods: The trial was conducted at the Texas AgriLife Research & Extension Center, located in Lubbock, Lubbock County, Texas. The research farm is located on a Acuff clay loam soil with a pH of 8.1 and 0.4% organic matter. The trial site was disked prior to initiation of the test and shaped into 40” beds. Liquid nitrogen was injected in lines every 40” at a rate of 120 lbs N/A approximately 4 weeks prior to transplanting. Prior to transplanting, drip tape was placed within the furrows and beds were reshaped to 80” centers. Prefar (5.0 qts/A) and Sandea (0.5 oz/A) were applied preemergence prior to transplanting for weed control. All watermelon varieties were seeded into 72-cell flats with a soil-less media on April 25 and after 3 weeks were placed outside for hardening prior to transplanting. However, circumstances beyond the investigators control (a plane crash in a nearby field) resulted in the varieties not being transplanted until June 4 (approximately 40 days after seeding in the greenhouse). Plants were transplanted by hand using a bulb planter into plots measuring 80” x 25’ with an in-row spacing of 3 feet and immediately watered. Pollinator plants (SP-4) were planted at the end of each plot as well as at the beginning and end of each row of watermelons within the test site. Insects and diseases were controlled using registered products, and escaped weeds were removed to prevent competition. Following watermelon transplanting in early June extremely high temperatures over 100 oF caused watermelon growth to be very limited. Although plots were irrigated through drip lines, there was little rainfall during the period of growth and development. Wild bee populations were present within the field and no beehives were brought in for pollination. Watermelons were harvested twice (August 13 and Sept 1). Melons were hand-harvested and individual fruit weights recorded. The trial was conducted as an RCBD with 4 replications and all data were subjected to analysis of variance with means separated using the Least Significant Difference at the 0.05 level.
Figure 15. Overview of 2008 watermelon variety trial.
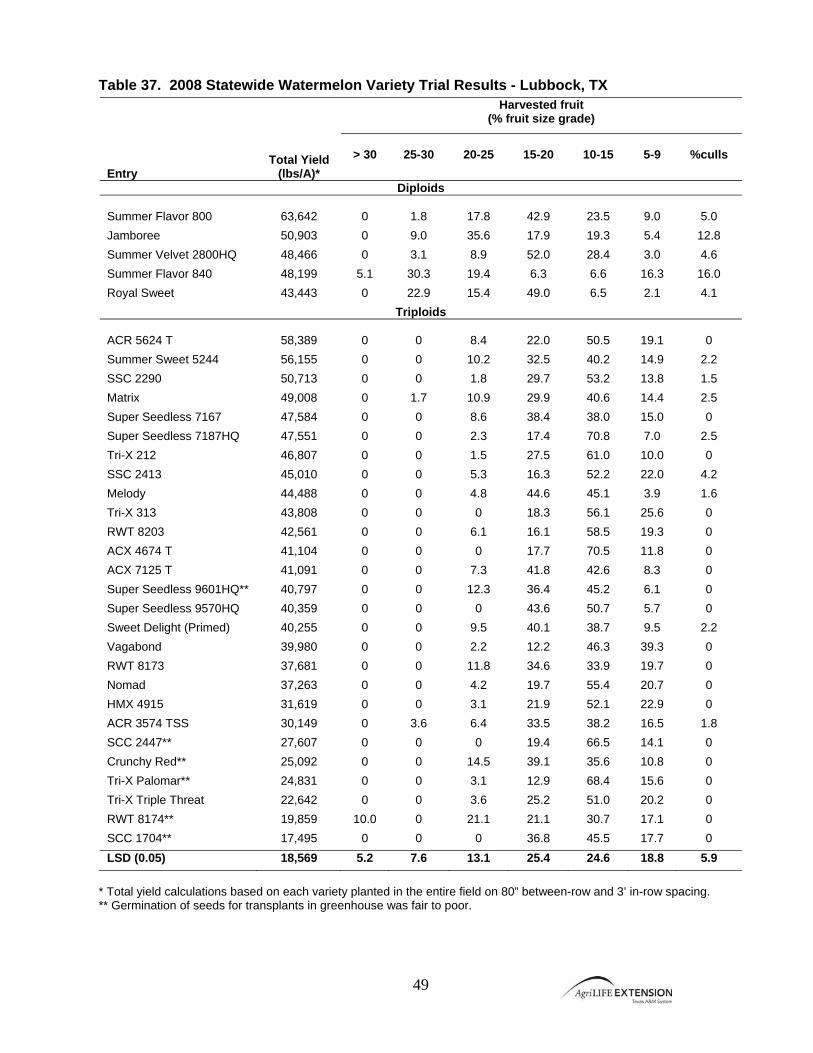
49
Table 37. 2008 Statewide Watermelon Variety Trial Results - Lubbock, TX Entry
Total Yield (lbs/A)*
Harvested fruit (% fruit size grade)
> 30 25-30 20-25 15-20
10-15
5-9 %culls
Diploids Summer Flavor 800 63,642 0 1.8 17.8 42.9 23.5 9.0 5.0 Jamboree 50,903 0 9.0 35.6 17.9 19.3 5.4 12.8 Summer Velvet 2800HQ 48,466 0 3.1 8.9 52.0 28.4 3.0 4.6 Summer Flavor 840 48,199 5.1 30.3 19.4 6.3 6.6 16.3 16.0 Royal Sweet 43,443 0 22.9 15.4 49.0 6.5 2.1 4.1
Triploids ACR 5624 T 58,389 0 0 8.4 22.0 50.5 19.1 0 Summer Sweet 5244 56,155 0 0 10.2 32.5 40.2 14.9 2.2 SSC 2290 50,713 0 0 1.8 29.7 53.2 13.8 1.5 Matrix 49,008 0 1.7 10.9 29.9 40.6 14.4 2.5 Super Seedless 7167 47,584 0 0 8.6 38.4 38.0 15.0 0 Super Seedless 7187HQ 47,551 0 0 2.3 17.4 70.8 7.0 2.5 Tri-X 212 46,807 0 0 1.5 27.5 61.0 10.0 0 SSC 2413 45,010 0 0 5.3 16.3 52.2 22.0 4.2 Melody 44,488 0 0 4.8 44.6 45.1 3.9 1.6 Tri-X 313 43,808 0 0 0 18.3 56.1 25.6 0 RWT 8203 42,561 0 0 6.1 16.1 58.5 19.3 0 ACX 4674 T 41,104 0 0 0 17.7 70.5 11.8 0 ACX 7125 T 41,091 0 0 7.3 41.8 42.6 8.3 0 Super Seedless 9601HQ** 40,797 0 0 12.3 36.4 45.2 6.1 0 Super Seedless 9570HQ 40,359 0 0 0 43.6 50.7 5.7 0 Sweet Delight (Primed) 40,255 0 0 9.5 40.1 38.7 9.5 2.2 Vagabond 39,980 0 0 2.2 12.2 46.3 39.3 0 RWT 8173 37,681 0 0 11.8 34.6 33.9 19.7 0 Nomad 37,263 0 0 4.2 19.7 55.4 20.7 0 HMX 4915 31,619 0 0 3.1 21.9 52.1 22.9 0 ACR 3574 TSS 30,149 0 3.6 6.4 33.5 38.2 16.5 1.8 SCC 2447** 27,607 0 0 0 19.4 66.5 14.1 0 Crunchy Red** 25,092 0 0 14.5 39.1 35.6 10.8 0 Tri-X Palomar** 24,831 0 0 3.1 12.9 68.4 15.6 0 Tri-X Triple Threat 22,642 0 0 3.6 25.2 51.0 20.2 0 RWT 8174** 19,859 10.0 0 21.1 21.1 30.7 17.1 0 SCC 1704** 17,495 0 0 0 36.8 45.5 17.7 0 LSD (0.05) 18,569 5.2 7.6 13.1 25.4 24.6 18.8 5.9
* Total yield calculations based on each variety planted in the entire field on 80” between-row and 3’ in-row spacing. ** Germination of seeds for transplants in greenhouse was fair to poor.
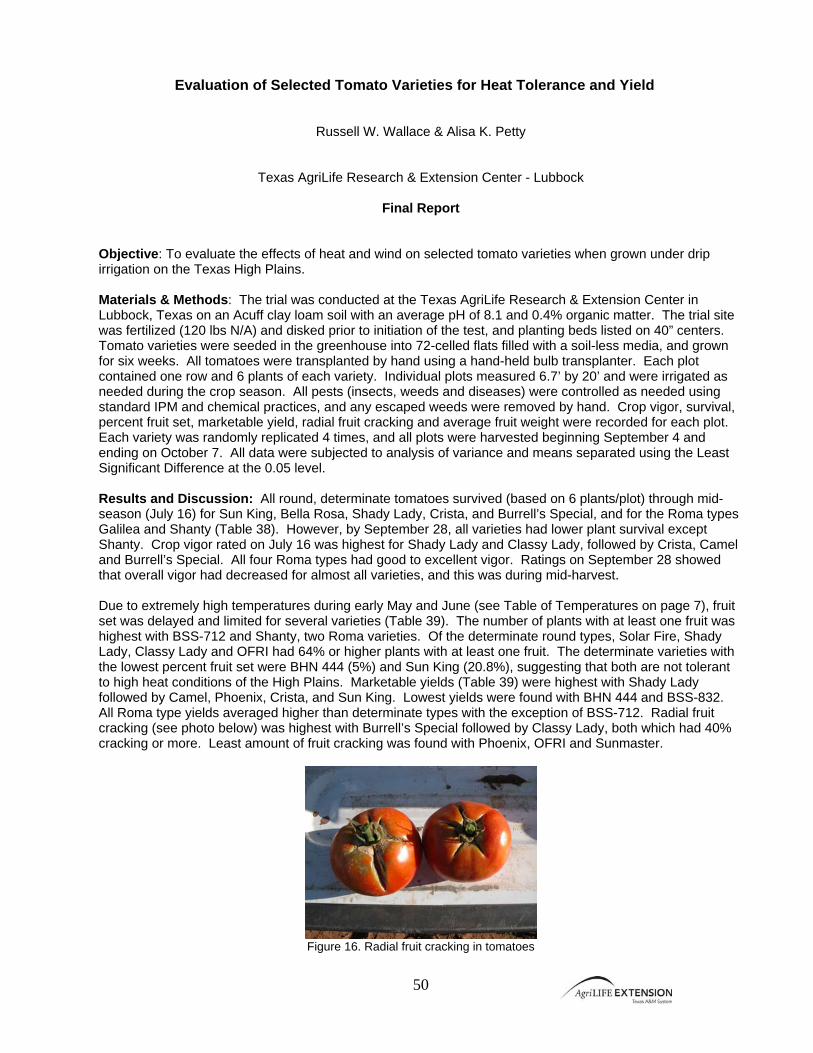
50
Evaluation of Selected Tomato Varieties for Heat Tolerance and Yield
Russell W. Wallace & Alisa K. Petty
Texas AgriLife Research & Extension Center - Lubbock
Final Report Objective: To evaluate the effects of heat and wind on selected tomato varieties when grown under drip irrigation on the Texas High Plains. Materials & Methods: The trial was conducted at the Texas AgriLife Research & Extension Center in Lubbock, Texas on an Acuff clay loam soil with an average pH of 8.1 and 0.4% organic matter. The trial site was fertilized (120 lbs N/A) and disked prior to initiation of the test, and planting beds listed on 40” centers. Tomato varieties were seeded in the greenhouse into 72-celled flats filled with a soil-less media, and grown for six weeks. All tomatoes were transplanted by hand using a hand-held bulb transplanter. Each plot contained one row and 6 plants of each variety. Individual plots measured 6.7’ by 20’ and were irrigated as needed during the crop season. All pests (insects, weeds and diseases) were controlled as needed using standard IPM and chemical practices, and any escaped weeds were removed by hand. Crop vigor, survival, percent fruit set, marketable yield, radial fruit cracking and average fruit weight were recorded for each plot. Each variety was randomly replicated 4 times, and all plots were harvested beginning September 4 and ending on October 7. All data were subjected to analysis of variance and means separated using the Least Significant Difference at the 0.05 level. Results and Discussion: All round, determinate tomatoes survived (based on 6 plants/plot) through mid-season (July 16) for Sun King, Bella Rosa, Shady Lady, Crista, and Burrell’s Special, and for the Roma types Galilea and Shanty (Table 38). However, by September 28, all varieties had lower plant survival except Shanty. Crop vigor rated on July 16 was highest for Shady Lady and Classy Lady, followed by Crista, Camel and Burrell’s Special. All four Roma types had good to excellent vigor. Ratings on September 28 showed that overall vigor had decreased for almost all varieties, and this was during mid-harvest. Due to extremely high temperatures during early May and June (see Table of Temperatures on page 7), fruit set was delayed and limited for several varieties (Table 39). The number of plants with at least one fruit was highest with BSS-712 and Shanty, two Roma varieties. Of the determinate round types, Solar Fire, Shady Lady, Classy Lady and OFRI had 64% or higher plants with at least one fruit. The determinate varieties with the lowest percent fruit set were BHN 444 (5%) and Sun King (20.8%), suggesting that both are not tolerant to high heat conditions of the High Plains. Marketable yields (Table 39) were highest with Shady Lady followed by Camel, Phoenix, Crista, and Sun King. Lowest yields were found with BHN 444 and BSS-832. All Roma type yields averaged higher than determinate types with the exception of BSS-712. Radial fruit cracking (see photo below) was highest with Burrell’s Special followed by Classy Lady, both which had 40% cracking or more. Least amount of fruit cracking was found with Phoenix, OFRI and Sunmaster.
Figure 16. Radial fruit cracking in tomatoes
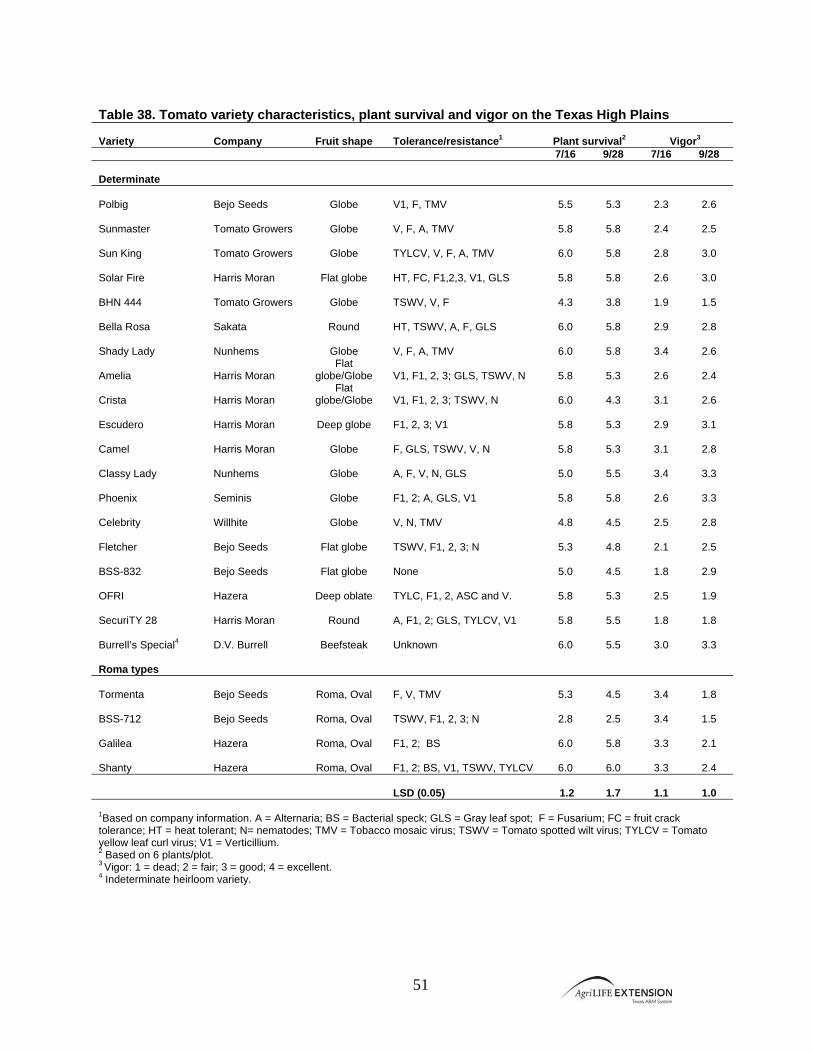
51
Table 38. Tomato variety characteristics, plant survival and vigor on the Texas High Plains Variety
Company
Fruit shape
Tolerance/resistance1
Plant survival2
Vigor3
7/16 9/28 7/16 9/28 Determinate
Polbig
Bejo Seeds
Globe
V1, F, TMV
5.5
5.3
2.3
2.6
Sunmaster
Tomato Growers
Globe
V, F, A, TMV
5.8
5.8
2.4
2.5
Sun King
Tomato Growers
Globe
TYLCV, V, F, A, TMV
6.0
5.8
2.8
3.0
Solar Fire
Harris Moran
Flat globe
HT, FC, F1,2,3, V1, GLS
5.8
5.8
2.6
3.0
BHN 444
Tomato Growers
Globe
TSWV, V, F
4.3
3.8
1.9
1.5
Bella Rosa
Sakata
Round
HT, TSWV, A, F, GLS
6.0
5.8
2.9
2.8
Shady Lady
Nunhems
Globe
V, F, A, TMV
6.0
5.8
3.4
2.6
Amelia
Harris Moran
Flat globe/Globe
V1, F1, 2, 3; GLS, TSWV, N
5.8
5.3
2.6
2.4
Crista
Harris Moran
Flat globe/Globe
V1, F1, 2, 3; TSWV, N
6.0
4.3
3.1
2.6
Escudero
Harris Moran
Deep globe
F1, 2, 3; V1
5.8
5.3
2.9
3.1
Camel
Harris Moran
Globe
F, GLS, TSWV, V, N
5.8
5.3
3.1
2.8
Classy Lady
Nunhems
Globe
A, F, V, N, GLS
5.0
5.5
3.4
3.3
Phoenix
Seminis
Globe
F1, 2; A, GLS, V1
5.8
5.8
2.6
3.3
Celebrity
Willhite
Globe
V, N, TMV
4.8
4.5
2.5
2.8
Fletcher
Bejo Seeds
Flat globe
TSWV, F1, 2, 3; N
5.3
4.8
2.1
2.5
BSS-832
Bejo Seeds
Flat globe
None
5.0
4.5
1.8
2.9
OFRI
Hazera
Deep oblate
TYLC, F1, 2, ASC and V.
5.8
5.3
2.5
1.9
SecuriTY 28
Harris Moran
Round
A, F1, 2; GLS, TYLCV, V1
5.8
5.5
1.8
1.8
Burrell’s Special4
D.V. Burrell
Beefsteak
Unknown
6.0
5.5
3.0
3.3
Roma types
Tormenta
Bejo Seeds
Roma, Oval
F, V, TMV
5.3
4.5
3.4
1.8
BSS-712
Bejo Seeds
Roma, Oval
TSWV, F1, 2, 3; N
2.8
2.5
3.4
1.5
Galilea
Hazera
Roma, Oval
F1, 2; BS
6.0
5.8
3.3
2.1
Shanty
Hazera
Roma, Oval
F1, 2; BS, V1, TSWV, TYLCV
6.0
6.0
3.3
2.4
LSD (0.05)
1.2
1.7
1.1
1.0
1Based on company information. A = Alternaria; BS = Bacterial speck; GLS = Gray leaf spot; F = Fusarium; FC = fruit crack tolerance; HT = heat tolerant; N= nematodes; TMV = Tobacco mosaic virus; TSWV = Tomato spotted wilt virus; TYLCV = Tomato yellow leaf curl virus; V1 = Verticillium. 2 Based on 6 plants/plot. 3 Vigor: 1 = dead; 2 = fair; 3 = good; 4 = excellent. 4 Indeterminate heirloom variety.
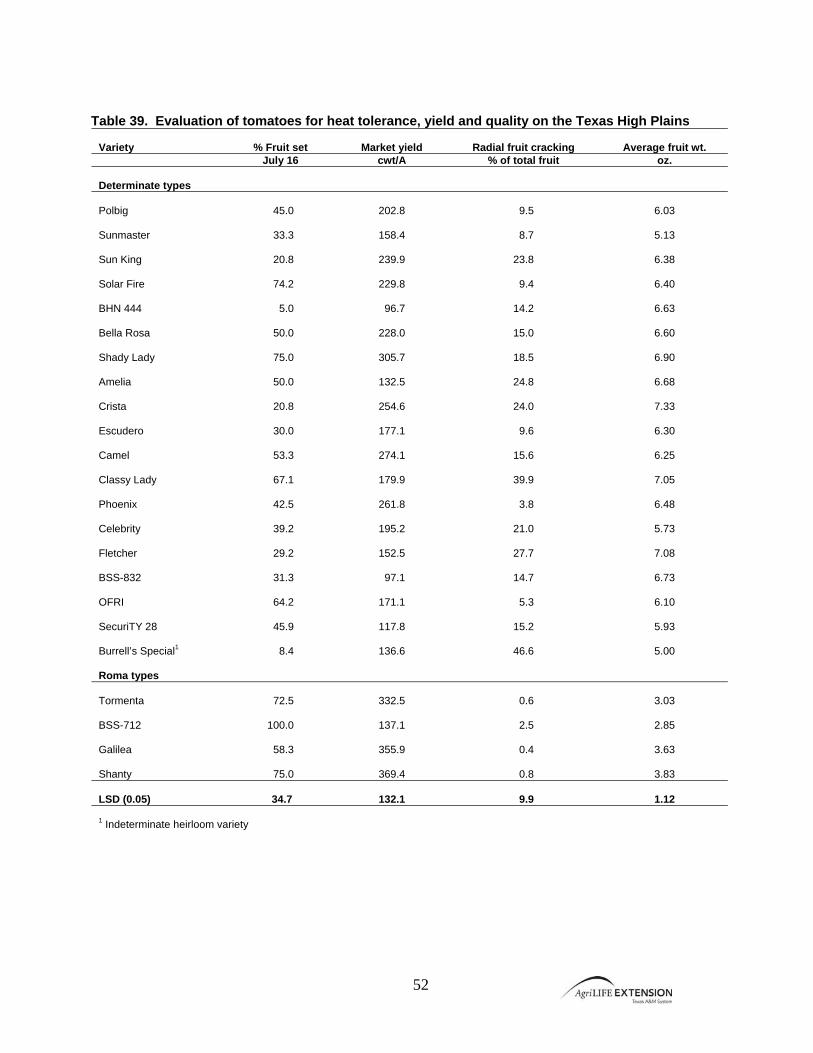
52
Table 39. Evaluation of tomatoes for heat tolerance, yield and quality on the Texas High Plains
Variety
% Fruit set
Market yield
Radial fruit cracking
Average fruit wt.
July 16 cwt/A % of total fruit oz. Determinate types
Polbig
45.0
202.8
9.5
6.03
Sunmaster
33.3
158.4
8.7
5.13
Sun King
20.8
239.9
23.8
6.38
Solar Fire
74.2
229.8
9.4
6.40
BHN 444
5.0
96.7
14.2
6.63
Bella Rosa
50.0
228.0
15.0
6.60
Shady Lady
75.0
305.7
18.5
6.90
Amelia
50.0
132.5
24.8
6.68
Crista
20.8
254.6
24.0
7.33
Escudero
30.0
177.1
9.6
6.30
Camel
53.3
274.1
15.6
6.25
Classy Lady
67.1
179.9
39.9
7.05
Phoenix
42.5
261.8
3.8
6.48
Celebrity
39.2
195.2
21.0
5.73
Fletcher
29.2
152.5
27.7
7.08
BSS-832
31.3
97.1
14.7
6.73
OFRI
64.2
171.1
5.3
6.10
SecuriTY 28
45.9
117.8
15.2
5.93
Burrell’s Special1
8.4
136.6
46.6
5.00
Roma types
Tormenta
72.5
332.5
0.6
3.03
BSS-712
100.0
137.1
2.5
2.85
Galilea
58.3
355.9
0.4
3.63
Shanty
75.0
369.4
0.8
3.83
LSD (0.05)
34.7
132.1
9.9
1.12
1 Indeterminate heirloom variety
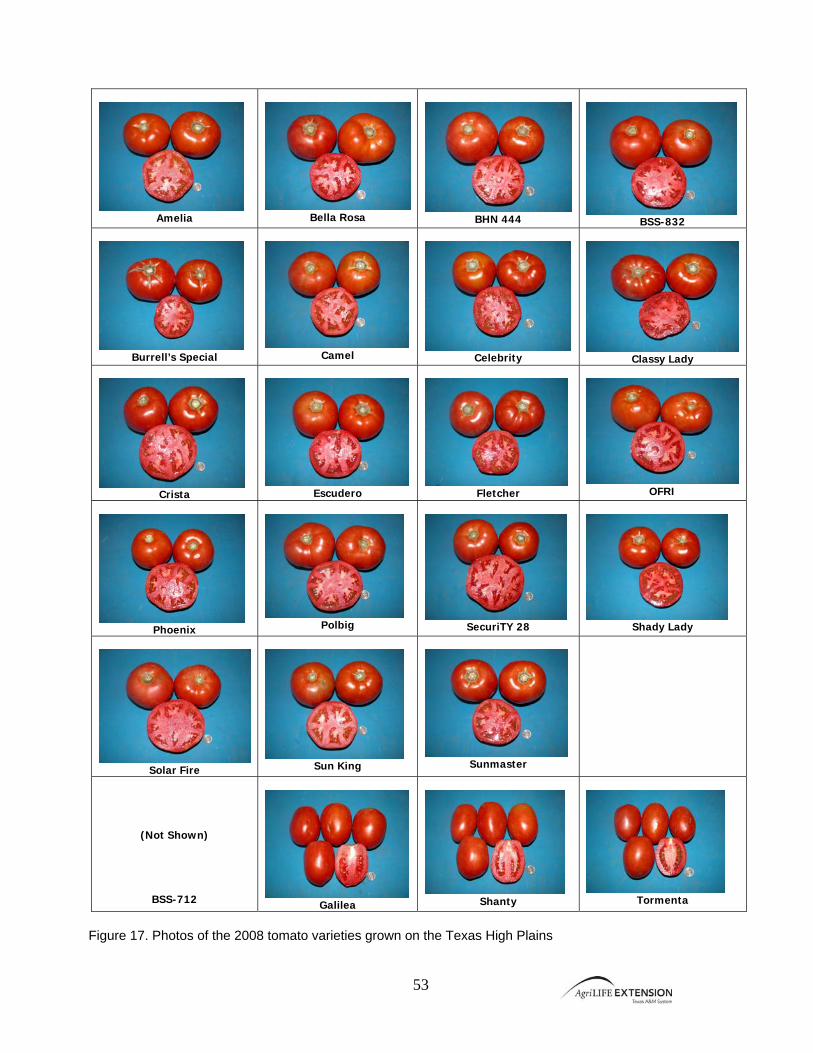
53
Amelia
Bella Rosa
BHN 444
BSS-832
Burrell’s Special
Camel
Celebrity
Classy Lady
Crista
Escudero
Fletcher
OFRI
Phoenix
Polbig
SecuriTY 28
Shady Lady
Solar Fire
Sun King
Sunmaster
(Not Shown)
BSS-712
Galilea
Shanty
Tormenta
Figure 17. Photos of the 2008 tomato varieties grown on the Texas High Plains

54
Trial Results for the Texas Wintergarden
55
Herbicide Evaluation for Crop Injury on Spinach Grown in the Wintergarden
Russell W. Wallace & Alisa K. Petty
Texas AgriLife Extension & Texas AgriLife Research - Lubbock
Final Report Objective: To evaluate the effects of PRE and POST-applied herbicides on processing spinach (Spinacia oleracea) for weed control and crop injury. Materials & Methods: The trial was conducted at the Del Monte Research Farm located in Crystal City on a Bookout clay loam soil with a pH of 7.6 and 1.1% organic matter. Spinach (var. “DMC 66-09”) was planted November 5, 2007 on 80” beds in plots measuring 6.7’ x 25’. Preemergence (PPI or PRE) and postemergence (POST) herbicides were applied using a CO2-pressurized backpack sprayer. POST herbicides were applied at the spinach 2-leaf and 5-leaf stages. Crop injury, yield and herbicide costs were evaluated for each treatment. The test site was irrigated, using a linear system and insects and diseases controlled as needed. Spinach was harvested on January 17 and weighed for yield. The trial was conducted as a RCBD with 4 replications and all data were subjected to analysis of variance and means separated using Fisher’s Protected LSD at the 0.05 level. Results and Discussion: Weeds were generally not present within the trial site, and as a result, observations could not be recorded. Spinach injury was defined as both overall crop stunting and leaf twisting in this trial (Table 40). Leaf twisting and malformation was apparent from applications of Stinger herbicide, while leaf burning was observed only with Spin-Aid. In this study, when applied alone, both Ro-Neet (Trt . 3) and Dual Magnum (Trt. 4) caused 15 – 19% early injury (stunting) on November 27. When applied together PPI or separately (Trt. 7 & 8), spinach injury increased slightly, but not significantly. Injury from Dual Magnum was reduced slightly when applied at half rates PRE and again at the 2-leaf stage (Trt. 5 & 6). When Dual Magnum was applied in combination with Stinger (Trt. 9), injury was significantly greater than when either product was applied alone (Trt. 5 & 11). The greatest injury was observed when Spin-Aid was applied at the 2-leaf stage, regardless of whether it was applied alone or tank-mixed (Trt. 10, 13, 14, 19, 20). Injury was reduced significantly when Spin-Aid applications were delayed until the 5-leaf stage (Trt. 15 & 21), showing enhanced tolerance for older spinach. Combining SelectMax with Stinger for a single application generally did not increase crop stunting (Trt. 16, 17 & 18). When tank-mixed with Spin-Aid, crop injury was equivalent to similar treatments where Spin-Aid was applied alone (Trt. 14 & 19). Injury ratings on January 9 showed that the spinach crop in general was outgrowing the initial crop injury, though it was still apparent in treatments showing greater than 15% stunting (Table 40). Leaf twisting from applications of Stinger was significantly higher only when Stinger was tank-mixed with Dual Magnum (Trt. 9), SelectMax (Trt. 18), or Spin-Aid (Trt. 20 & 21), and growers would be advised not to tank-mix Stinger with any other products. Applications of Stinger applied at both the 2-leaf and 5-leaf stages also increased leaf twisting (Trt. 12). Spinach yields (Table 40) ranged from 4.6 tons/A (Trt. 14) to 9.7 tons/A (Trt. 2). In general, where Dual Magnum was applied PRE at the 10.9 oz rate (not including any Spin-Aid treatments), there was a minimum of an 8% yield reduction, similar to previous years. However, when Spin-Aid was included POST, yields were reduced an average 38% compared to the handweeded control (Trt. 2). Overall assessment indicates that Stinger is safe to spinach, though leaf twisting may occur as times. Caution should be used with Spin-Aid applications. Stinger applied alone may reduce overall yield, and it should not be tank-mixed with any other herbicide for POST applications in processing spinach. Total costs of individual weed control and herbicide programs (including an estimated spraying cost of $6/A) indicate that treatments cost anywhere from $0/A up to $177/A based on individual herbicides selected and number of applications (Table 40). As mentioned previously, there were very few weeds present within the test site during 2007, and weeds did not compete with the spinach crop. As a result, the cheapest
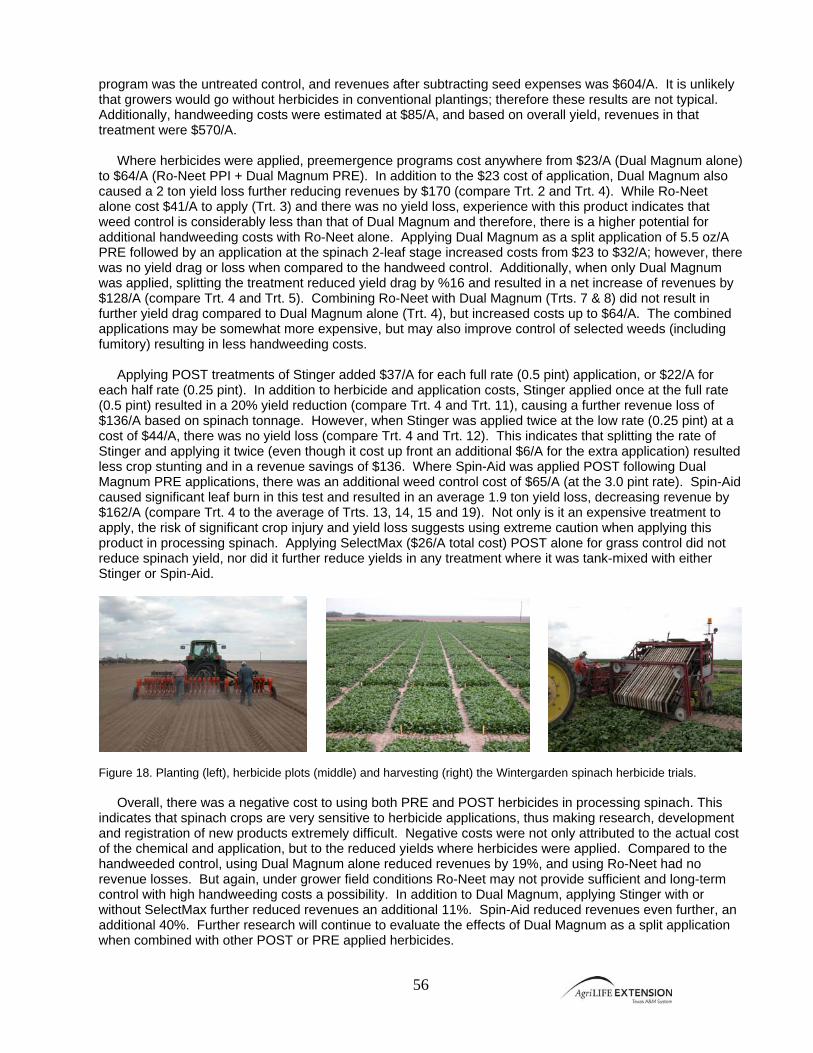
56
program was the untreated control, and revenues after subtracting seed expenses was $604/A. It is unlikely that growers would go without herbicides in conventional plantings; therefore these results are not typical. Additionally, handweeding costs were estimated at $85/A, and based on overall yield, revenues in that treatment were $570/A. Where herbicides were applied, preemergence programs cost anywhere from $23/A (Dual Magnum alone) to $64/A (Ro-Neet PPI + Dual Magnum PRE). In addition to the $23 cost of application, Dual Magnum also caused a 2 ton yield loss further reducing revenues by $170 (compare Trt. 2 and Trt. 4). While Ro-Neet alone cost $41/A to apply (Trt. 3) and there was no yield loss, experience with this product indicates that weed control is considerably less than that of Dual Magnum and therefore, there is a higher potential for additional handweeding costs with Ro-Neet alone. Applying Dual Magnum as a split application of 5.5 oz/A PRE followed by an application at the spinach 2-leaf stage increased costs from $23 to $32/A; however, there was no yield drag or loss when compared to the handweed control. Additionally, when only Dual Magnum was applied, splitting the treatment reduced yield drag by %16 and resulted in a net increase of revenues by $128/A (compare Trt. 4 and Trt. 5). Combining Ro-Neet with Dual Magnum (Trts. 7 & 8) did not result in further yield drag compared to Dual Magnum alone (Trt. 4), but increased costs up to $64/A. The combined applications may be somewhat more expensive, but may also improve control of selected weeds (including fumitory) resulting in less handweeding costs. Applying POST treatments of Stinger added $37/A for each full rate (0.5 pint) application, or $22/A for each half rate (0.25 pint). In addition to herbicide and application costs, Stinger applied once at the full rate (0.5 pint) resulted in a 20% yield reduction (compare Trt. 4 and Trt. 11), causing a further revenue loss of $136/A based on spinach tonnage. However, when Stinger was applied twice at the low rate (0.25 pint) at a cost of $44/A, there was no yield loss (compare Trt. 4 and Trt. 12). This indicates that splitting the rate of Stinger and applying it twice (even though it cost up front an additional $6/A for the extra application) resulted less crop stunting and in a revenue savings of $136. Where Spin-Aid was applied POST following Dual Magnum PRE applications, there was an additional weed control cost of $65/A (at the 3.0 pint rate). Spin-Aid caused significant leaf burn in this test and resulted in an average 1.9 ton yield loss, decreasing revenue by $162/A (compare Trt. 4 to the average of Trts. 13, 14, 15 and 19). Not only is it an expensive treatment to apply, the risk of significant crop injury and yield loss suggests using extreme caution when applying this product in processing spinach. Applying SelectMax ($26/A total cost) POST alone for grass control did not reduce spinach yield, nor did it further reduce yields in any treatment where it was tank-mixed with either Stinger or Spin-Aid.
Figure 18. Planting (left), herbicide plots (middle) and harvesting (right) the Wintergarden spinach herbicide trials. Overall, there was a negative cost to using both PRE and POST herbicides in processing spinach. This indicates that spinach crops are very sensitive to herbicide applications, thus making research, development and registration of new products extremely difficult. Negative costs were not only attributed to the actual cost of the chemical and application, but to the reduced yields where herbicides were applied. Compared to the handweeded control, using Dual Magnum alone reduced revenues by 19%, and using Ro-Neet had no revenue losses. But again, under grower field conditions Ro-Neet may not provide sufficient and long-term control with high handweeding costs a possibility. In addition to Dual Magnum, applying Stinger with or without SelectMax further reduced revenues an additional 11%. Spin-Aid reduced revenues even further, an additional 40%. Further research will continue to evaluate the effects of Dual Magnum as a split application when combined with other POST or PRE applied herbicides.
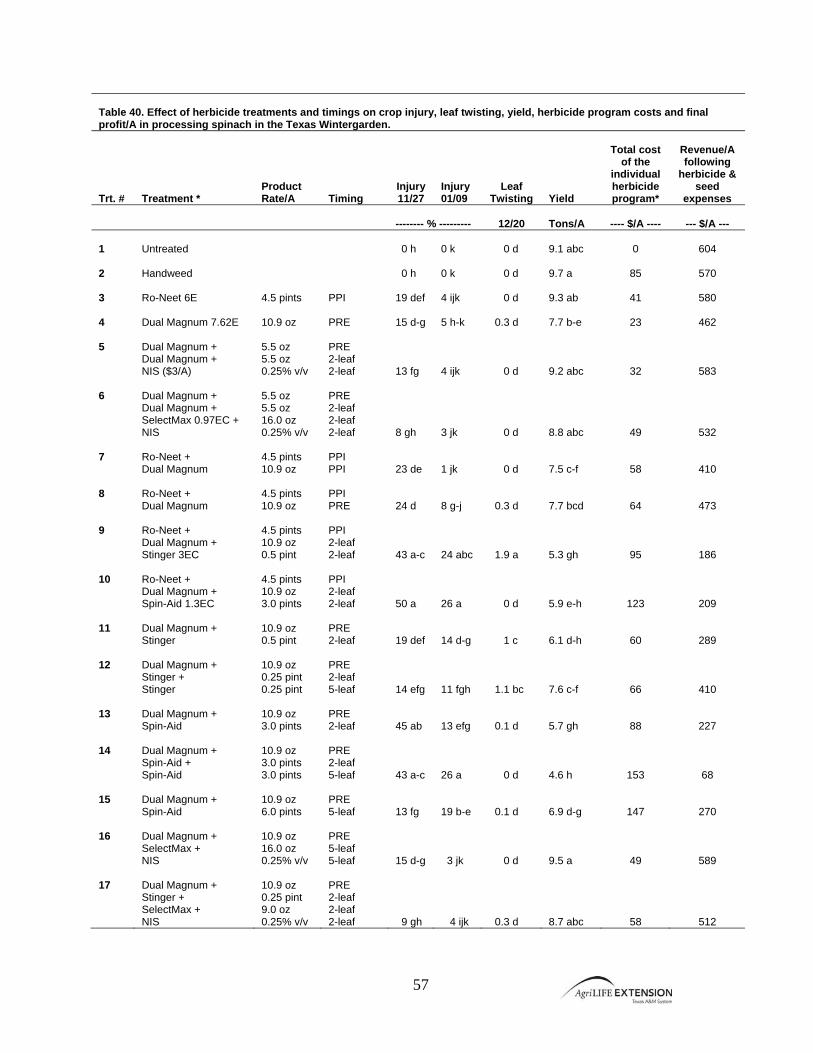
57
Table 40. Effect of herbicide treatments and timings on crop injury, leaf twisting, yield, herbicide program costs and final profit/A in processing spinach in the Texas Wintergarden. Trt. #
Treatment *
Product Rate/A
Timing
Injury 11/27
Injury 01/09
Leaf Twisting
Yield
Total cost
of the individual herbicide program*
Revenue/A following
herbicide & seed
expenses
-------- % ---------
12/20
Tons/A
---- $/A ----
--- $/A ---
1
Untreated
0 h
0 k
0 d
9.1 abc
0
604
2
Handweed
0 h
0 k
0 d
9.7 a
85
570
3
Ro-Neet 6E
4.5 pints
PPI
19 def
4 ijk
0 d
9.3 ab
41
580
4
Dual Magnum 7.62E
10.9 oz
PRE
15 d-g
5 h-k
0.3 d
7.7 b-e
23
462
5
Dual Magnum + Dual Magnum + NIS ($3/A)
5.5 oz 5.5 oz 0.25% v/v
PRE 2-leaf 2-leaf
13 fg
4 ijk
0 d
9.2 abc
32
583 6
Dual Magnum + Dual Magnum + SelectMax 0.97EC + NIS
5.5 oz 5.5 oz 16.0 oz 0.25% v/v
PRE 2-leaf 2-leaf 2-leaf
8 gh
3 jk
0 d
8.8 abc
49
532 7
Ro-Neet + Dual Magnum
4.5 pints 10.9 oz
PPI PPI
23 de
1 jk
0 d
7.5 c-f
58
410 8
Ro-Neet + Dual Magnum
4.5 pints 10.9 oz
PPI PRE
24 d
8 g-j
0.3 d
7.7 bcd
64
473 9
Ro-Neet + Dual Magnum + Stinger 3EC
4.5 pints 10.9 oz 0.5 pint
PPI 2-leaf 2-leaf
43 a-c
24 abc
1.9 a
5.3 gh
95
186 10
Ro-Neet + Dual Magnum + Spin-Aid 1.3EC
4.5 pints 10.9 oz 3.0 pints
PPI 2-leaf 2-leaf
50 a
26 a
0 d
5.9 e-h
123
209 11
Dual Magnum + Stinger
10.9 oz 0.5 pint
PRE 2-leaf
19 def
14 d-g
1 c
6.1 d-h
60
289 12
Dual Magnum + Stinger + Stinger
10.9 oz 0.25 pint 0.25 pint
PRE 2-leaf 5-leaf
14 efg
11 fgh
1.1 bc
7.6 c-f
66
410 13
Dual Magnum + Spin-Aid
10.9 oz 3.0 pints
PRE 2-leaf
45 ab
13 efg
0.1 d
5.7 gh
88
227 14
Dual Magnum + Spin-Aid + Spin-Aid
10.9 oz 3.0 pints 3.0 pints
PRE 2-leaf 5-leaf
43 a-c
26 a
0 d
4.6 h
153
68 15
Dual Magnum + Spin-Aid
10.9 oz 6.0 pints
PRE 5-leaf
13 fg
19 b-e
0.1 d
6.9 d-g
147
270 16
Dual Magnum + SelectMax + NIS
10.9 oz 16.0 oz 0.25% v/v
PRE 5-leaf 5-leaf
15 d-g
3 jk
0 d
9.5 a
49
589 17
Dual Magnum + Stinger + SelectMax + NIS
10.9 oz 0.25 pint 9.0 oz 0.25% v/v
PRE 2-leaf 2-leaf 2-leaf
9 gh
4 ijk
0.3 d
8.7 abc
58
512
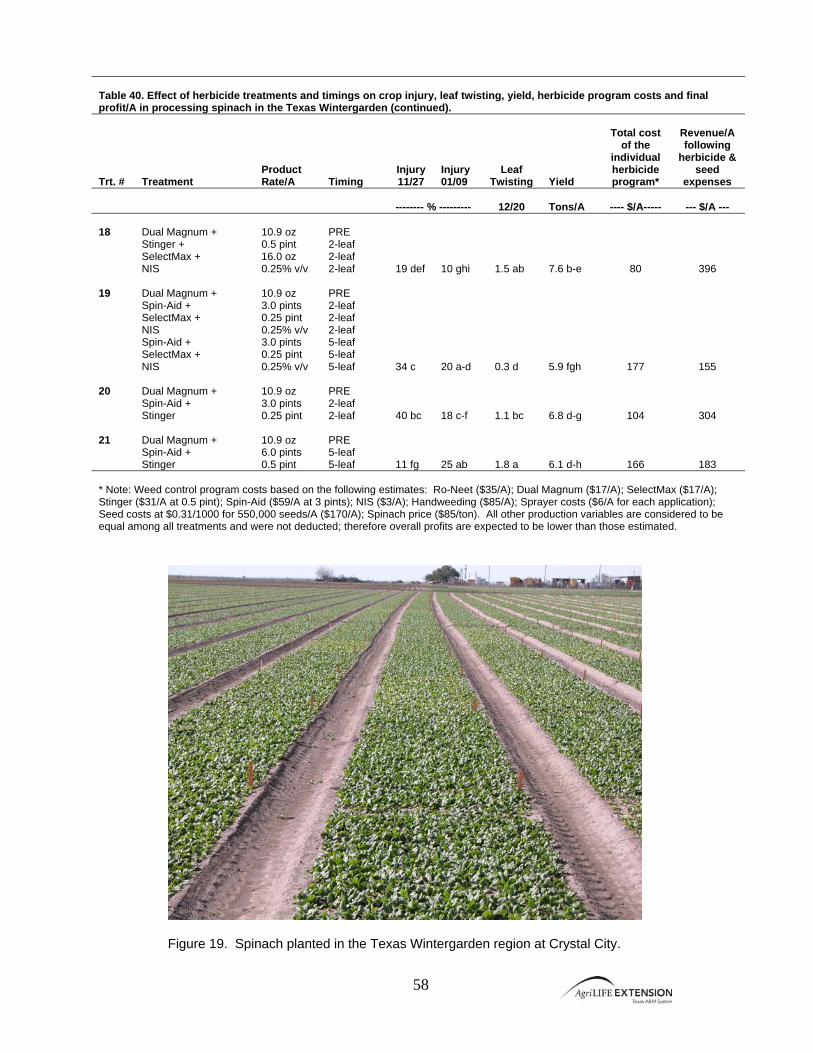
58
Table 40. Effect of herbicide treatments and timings on crop injury, leaf twisting, yield, herbicide program costs and final profit/A in processing spinach in the Texas Wintergarden (continued). Trt. #
Treatment
Product Rate/A
Timing
Injury 11/27
Injury 01/09
Leaf Twisting
Yield
Total cost
of the individual herbicide program*
Revenue/A following
herbicide & seed
expenses
-------- % ---------
12/20
Tons/A
---- $/A-----
--- $/A ---
18
Dual Magnum + Stinger + SelectMax + NIS
10.9 oz 0.5 pint 16.0 oz 0.25% v/v
PRE 2-leaf 2-leaf 2-leaf
19 def
10 ghi
1.5 ab
7.6 b-e
80
396 19
Dual Magnum + Spin-Aid + SelectMax + NIS Spin-Aid + SelectMax + NIS
10.9 oz 3.0 pints 0.25 pint 0.25% v/v 3.0 pints 0.25 pint 0.25% v/v
PRE 2-leaf 2-leaf 2-leaf 5-leaf 5-leaf 5-leaf
34 c
20 a-d
0.3 d
5.9 fgh
177
155 20
Dual Magnum + Spin-Aid + Stinger
10.9 oz 3.0 pints 0.25 pint
PRE 2-leaf 2-leaf
40 bc
18 c-f
1.1 bc
6.8 d-g
104
304 21
Dual Magnum + Spin-Aid + Stinger
10.9 oz 6.0 pints 0.5 pint
PRE 5-leaf 5-leaf
11 fg
25 ab
1.8 a
6.1 d-h
166
183 * Note: Weed control program costs based on the following estimates: Ro-Neet ($35/A); Dual Magnum ($17/A); SelectMax ($17/A); Stinger ($31/A at 0.5 pint); Spin-Aid ($59/A at 3 pints); NIS ($3/A); Handweeding ($85/A); Sprayer costs ($6/A for each application); Seed costs at $0.31/1000 for 550,000 seeds/A ($170/A); Spinach price ($85/ton). All other production variables are considered to be equal among all treatments and were not deducted; therefore overall profits are expected to be lower than those estimated.
Figure 19. Spinach planted in the Texas Wintergarden region at Crystal City.
59
Evaluation of Herbicides and Selected Rates on Spinach Grown at Three Densities
Russell W. Wallace & Alisa K. Petty
Texas AgriLife Extension & Texas AgriLife Research - Lubbock
Final Report Objective: To evaluate the effects of PRE-applied Ro-Neet, Dual Magnum and Outlook applied at 2 rates on weed populations and crop injury in processing spinach (Spinacia oleracea) planted at three densities. Materials & Methods: The trial was conducted at the Del Monte Research Farm located in Crystal City on a Bookout clay loam soil with a pH of 7.6 and 1.1% organic matter. Spinach (var. “DMC 66-09”) was planted November 5, 2007 on 80” beds in plots measuring 6.7’ x 25’. Preemergence (PPI or PRE) herbicides were applied using a CO2-pressurized backpack sprayer with a hand-held boom equipped with four 8002 nozzles that delivered 20 GPA at 30 PSI. Within each crop density, herbicides were applied at 0.5X and 1X rates along with an untreated control for each density. Crop emergence (November 19) and crop injury ratings were recorded on November 27 and December 20 in 2007, and January 9, 2008. The entire test site was irrigated, using a linear system and insects and diseases controlled as needed. Spinach was harvested on January 17 and weighed for yield. The trial was conducted as a split-plot design with 4 replications and all data were subjected to analysis of variance and means separated at the 5% level. All percent injury data recorded was arc sin transformed prior to analyses, though actual values are used within the text. Results and Discussion: There was a significant difference in the average numbers of emerged spinach plants between densities (Table 41), with the lowest density having 550,607 plants/A followed by 1,085,000 plants/A, and the highest density had 1,376,500 plants/A. In general, crop injury was greater in 2008 compared to the same trial conducted in 2007. With all three herbicides, the high rate caused higher crop injury and stunting compared to the half rate (Table 42). Outlook caused more early injury (average 50%) than either Dual Magnum (14%) or Ro-Neet (22%). When rated in January, crop injury was less than 15% for all Dual Magnum and Ro-Neet treatments; however, injury with Outlook generally remained high. As spinach density increased, visible crop injury tended to decrease, suggested that higher seeding rates may be beneficial if potential crop injury is expected due to herbicide use and environmental conditions (Table 42). Fumitory was the dominant weed found within the trial site, though populations were considered to be very low in 2007. All three herbicides gave good control of fumitory, and increasing the seeding rate from 550,607 plants/A to 1,085,000 plants/A or higher significantly reduced fumitory populations. This suggests that the higher seeding rates may be beneficial for suppressing weeds if high weed populations are expected based on past field histories. Finally, spinach yields were highest in plots not treated with herbicides (average 9.5 tons/A), followed by those treated with Dual Magnum (8.6 tons/A). Although not statistical less, yields in Dual Magnum-treated plots were an average 9% less when compared to the untreated. This is consistent with most years showing that even without weed pressure, Dual Magnum results in some yield drag. Ro-Neet (8.0 tons/A) and Outlook (6.6 tons/A) treatments had average yields that were significantly less than the untreated plots. When subtracted from total spinach revenues, the cost of each herbicide program was small in comparison to the seed costs (Table 42). At the lower seeding density (550,000 plants/A), seed costs were $170/A, and increased to $336 and $427/A at the medium and high seeding rates, respectively. Average costs of Ro-Neet applications were estimated to be $41/A ($35 for chemical + $6 application costs) and were estimated to be $23/A for both Dual Magnum and Outlook. When subtracting both herbicide and seed costs from the total revenues of harvested spinach, revenues ranged from $85/A up to $584/A (Table 41). When averaging across seeding densities, revenues by herbicide showed that Dual Magnum averaged $402/A, followed by Ro-Neet ($339/A) and Outlook ($231/A). Averaging each individual herbicide rate across the three seeding densities showed that using the lower herbicide rates were more profitable, not only in terms of chemical application costs, but in terms of less yield reductions. Ro-Neet applied at 4.5 pints (standard rate) averaged revenues of $258/A while the lower rate (2.3 pts/A) averaged $420/A. Dual Magnum applied at 10.9 oz/A (standard rate) averaged revenues of $358/A while the lower rate increased revenues to $447/A. Significant crop injury decreased overall
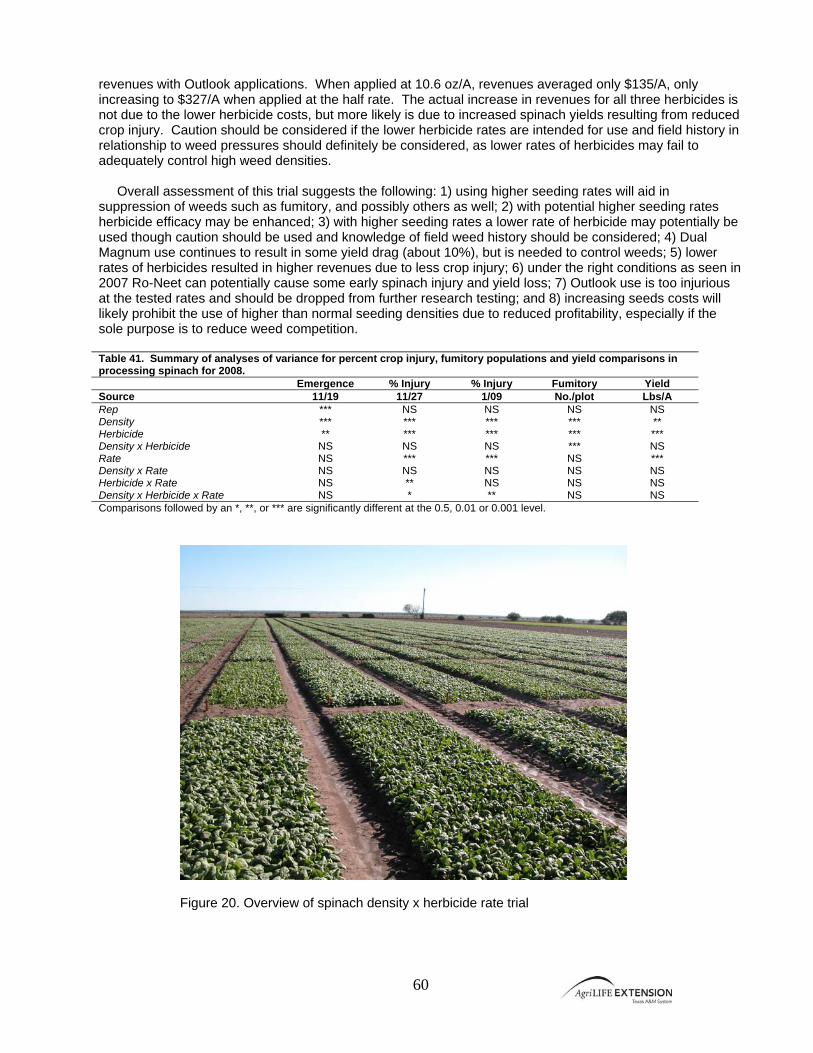
60
revenues with Outlook applications. When applied at 10.6 oz/A, revenues averaged only $135/A, only increasing to $327/A when applied at the half rate. The actual increase in revenues for all three herbicides is not due to the lower herbicide costs, but more likely is due to increased spinach yields resulting from reduced crop injury. Caution should be considered if the lower herbicide rates are intended for use and field history in relationship to weed pressures should definitely be considered, as lower rates of herbicides may fail to adequately control high weed densities. Overall assessment of this trial suggests the following: 1) using higher seeding rates will aid in suppression of weeds such as fumitory, and possibly others as well; 2) with potential higher seeding rates herbicide efficacy may be enhanced; 3) with higher seeding rates a lower rate of herbicide may potentially be used though caution should be used and knowledge of field weed history should be considered; 4) Dual Magnum use continues to result in some yield drag (about 10%), but is needed to control weeds; 5) lower rates of herbicides resulted in higher revenues due to less crop injury; 6) under the right conditions as seen in 2007 Ro-Neet can potentially cause some early spinach injury and yield loss; 7) Outlook use is too injurious at the tested rates and should be dropped from further research testing; and 8) increasing seeds costs will likely prohibit the use of higher than normal seeding densities due to reduced profitability, especially if the sole purpose is to reduce weed competition. Table 41. Summary of analyses of variance for percent crop injury, fumitory populations and yield comparisons in processing spinach for 2008. Emergence % Injury % Injury Fumitory Yield Source 11/19 11/27 1/09 No./plot Lbs/A Rep *** NS NS NS NS Density *** *** *** *** ** Herbicide ** *** *** *** *** Density x Herbicide NS NS NS *** NS Rate NS *** *** NS *** Density x Rate NS NS NS NS NS Herbicide x Rate NS ** NS NS NS Density x Herbicide x Rate NS * ** NS NS Comparisons followed by an *, **, or *** are significantly different at the 0.5, 0.01 or 0.001 level.
Figure 20. Overview of spinach density x herbicide rate trial

61
Table 42. Means for percent crop injury, fumitory populations, yield and profit/A for individual treatments in processing spinach for 2007 – 2008 trials. Trt #
Treatment*
Crop Density
Product Rate/A
Timing
% Injury
% Injury
Fumitory
Yield
Revenue/A following
herbicide & seed
expenses 11/27 1/09 No./m2 Tons/A ----- $ ----- 1
Untreated
Low
0
0
1.93
8.9
584
2
Untreated
Med
0
0
0.28
10.1
520
3
Untreated
High
0
0
0.33
9.4
374
4
Ro-Neet
Low
4.5 pts
PPI
39
15
0.08
6.1
306
5
Ro-Neet
Low
2.3 pts
PPI
21
3
0.10
8.5
530
6
Ro-Neet
Med
4.5 pts
PPI
28
13
0.03
7.6
267
7
Ro-Neet
Med
2.3 pts
PPI
10
3
0.05
9.2
420
8
Ro-Neet
High
4.5 pts
PPI
19
3
0.08
7.9
200
9
Ro-Neet
High
2.3 pts
PPI
15
3
0
8.9
310
10
Dual Magnum
Low
10.9 oz
PRE
20
9
0
7.8
471
11
Dual Magnum
Low
5.4 oz
PRE
16
6
0.10
8.2
516
12
Dual Magnum
Med
10.9 oz
PRE
16
8
0
8.5
367
13
Dual Magnum
Med
5.4 oz
PRE
15
1
0.05
9.5
458
14
Dual Magnum
High
10.9 oz
PRE
8
3
0
8.1
235
15
Dual Magnum
High
5.4 oz
PRE
9
0
0.05
9.5
366
16
Outlook
Low
10.6 oz
PRE
69
41
0
4.7
204
17
Outlook
Low
5.3 oz
PRE
36
21
0.03
6.7
386
18
Outlook
Med
10.6 oz
PRE
59
23
0
5.2
85
19
Outlook
Med
5.3 oz
PRE
44
20
0
7.4
278
20
Outlook
High
10.6 oz
PRE
64
24
0
6.6
115
21
Outlook
High
5.3 oz
PRE
25
4
0
8.9
319
* Note: Untreated plots were not handweeded, as weed pressure was very low. Seed costs were calculated on $0.31/1000 seeds and estimated to be $170/A for low density, $336/A for medium density, and $427/A for high density plantings. Cost of Outlook and Dual Magnum estimated to be $17/A. Cost of Ro-Neet ($35/A). Cost of sprayer application ($6/A). All other factors (irrigation, insecticides, fungicides, fertility, and other costs of production) considered equal and were not deducted from the profit/A data.
62
Effect of Nitamin 30L Foliar and Nfusion Blend Fertilizers on Spinach Yield
Russell W. Wallace & Alisa K. Petty
Texas AgriLife Research & Extension Center – Lubbock
Final Report Objective: To evaluate the effects of Nitamin 30L Foliar and Nfusion Blend fertility treatments on the yield of processing spinach in Texas. Materials & Methods: The trial was conducted at the Del Monte Research Farm, located in Crystal City, Zavala County, Texas. The farm is located on a Bookout clay loam soil with a pH of 7.7 and 1.0% organic matter. The trial site was disked prior to initiation of the test and shaped into 80” beds. Spinach (var. “DMC 66-09”) was planted on November 5, 2007 using a commercial vacuum precision planter that seeded 18 lines of spinach into plots measuring 6.7’’ x 25’. The herbicide Dual Magnum was applied preemergence following planting at a rate of 0.65 lb ai/A. The entire test site was fertilized with 125 lbs N/A approximately 5 weeks before planting. Fertility treatments were applied as seen in Table 43. The first harvest occurred 73 days following planting on January 17, 2008, while the second cut occurred 28 days later on February 14. All pests including insects, diseases and weeds were controlled using standard grower practices. Spinach was harvested using a commercially-available harvester that cut the spinach approximately 2” above the ground. Spinach was collected in a tarp and weighed. The trial was conducted as an RCBD with 4 replications and all data were subjected to analysis of variance with means separated using the Least Significant Difference at the 0.05 level. Results & Discussion: Spinach emergence was uniform throughout the test area, and averaged 550,000 plants/A (Table 43). Regardless of fertility applications, at the first cut, yields were not significantly different between treatments; therefore no statistical inferences can be made. However, trends did exist. Yields were highest in the control treatment where only 125 lbs of preplant fertilizer was applied. Yields in the control treatment were an average 13% higher than all other treatments combined. It is likely that differences in treatment yields for this test were due to variable in-plot differences in soil fertility or other unknown factors. For example, the first 5 treatments only had 125 lbs of N applied preplant with no additional fertility treatments applied until after the first harvest, yet yields varied from 6.3 tons to 8.3 tons (a 25% difference). Spinach treated just once with Nitamin 30L Foliar three weeks prior to the first cut had yields 18% less compared to the control. When Nitamin 30L Foliar was sprayed twice (4 and 2 weeks before the first-cut), yields were higher (12%) than where it was applied only once, but still not higher than the control treatment. Yields recorded at the second cut had less variability than those at the first cut; however, the data did show significant differences between treatments, though again, none were statistically different from the control treatment. Where Nfusion Blend was applied following the first cut at 175 lbs N/A, yields increased to 5.7 tons/A (5% higher than the control). Where Nitamin 30L Foliar was applied 3 weeks before each cutting (plus 62.5 lbs urea N/A), yield was 6% higher than the control. Total yields (combined from both cuts) showed no significant differences between treatments, and the control plots (only 125 lbs N/A for the entire season) had the highest average yields. The results of this study are inconclusive, and did not show the benefits of adding additional nitrogen to the spinach crops, regardless of formulation.

63
Figure 21. Closeup of high density spinach used in Nitamin 30L Foliar trial.
Table 43. First- and second-cuts and total spinach yields following nitrogen fertilizer treatments. Treatment
Total Nitrogen (lbs/A)
Timing
Yield (First cut)
Yield (Second cut)
Total Yield
------------------------ tons/A ------------------------ Conventional (Control)
125
Preplant
8.3
5.4
13.7 Conventional Urea
238
125 lbs Preplant + 112.5 lbs after “Harvest #1”
7.6
5.1
12.7 Conventional Urea
250
125 lbs Preplant + 125 lbs after “Harvest #1”
7.6
5.4
13.0 Conventional Nfusion Blend**
300
125 lbs Preplant + 175 lbs Nfusion after “Harvest #1””
6.3
5.7
12.0 Conventional Nfusion Blend**
200
125 lbs Preplant + 75 lbs after “Harvest #1”
7.4
5.1
12.5 Conventional Nitamin 30L Foliar Urea Nitamin 30L Foliar
188
125 lbs Preplant + 2 gallons/A (3 weeks before cutting) 62.5 lbs after “Harvest #1” + 2 gallons/A (3 weeks before cutting)
6.8
5.7
12.5
Conventional Nitamin 30L Foliar Nitamin 30L Foliar Nitamin 30L Foliar Nitamin 30L Foliar
125
125 lbs Preplant + 2 gallons (4 weeks before Harvest #1) + 2 gallons (2 weeks before Harvest #1) + 2 gallons (4 weeks before Harvest #2) + 2 gallons (2 weeks before Harvest #2)
7.7
5.5
13.2
LSD (0.05)
2.2
0.6
2.3
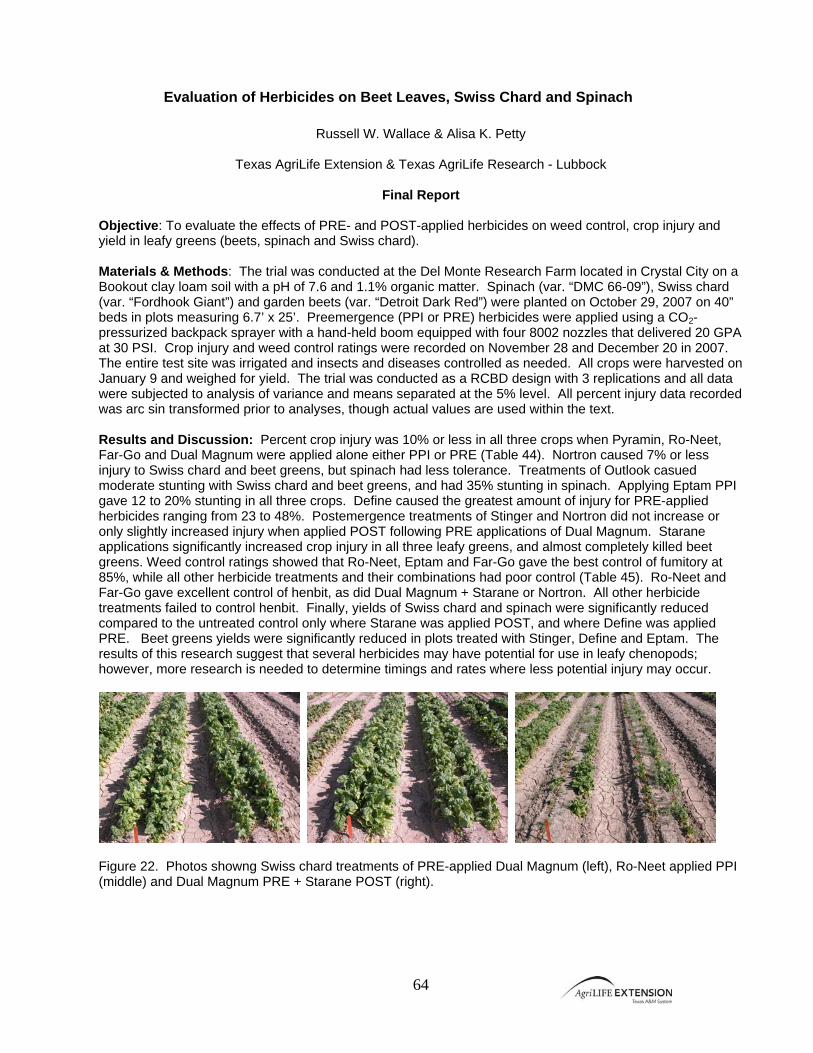
64
Evaluation of Herbicides on Beet Leaves, Swiss Chard and Spinach
Russell W. Wallace & Alisa K. Petty
Texas AgriLife Extension & Texas AgriLife Research - Lubbock
Final Report Objective: To evaluate the effects of PRE- and POST-applied herbicides on weed control, crop injury and yield in leafy greens (beets, spinach and Swiss chard). Materials & Methods: The trial was conducted at the Del Monte Research Farm located in Crystal City on a Bookout clay loam soil with a pH of 7.6 and 1.1% organic matter. Spinach (var. “DMC 66-09”), Swiss chard (var. “Fordhook Giant”) and garden beets (var. “Detroit Dark Red”) were planted on October 29, 2007 on 40” beds in plots measuring 6.7’ x 25’. Preemergence (PPI or PRE) herbicides were applied using a CO2-pressurized backpack sprayer with a hand-held boom equipped with four 8002 nozzles that delivered 20 GPA at 30 PSI. Crop injury and weed control ratings were recorded on November 28 and December 20 in 2007. The entire test site was irrigated and insects and diseases controlled as needed. All crops were harvested on January 9 and weighed for yield. The trial was conducted as a RCBD design with 3 replications and all data were subjected to analysis of variance and means separated at the 5% level. All percent injury data recorded was arc sin transformed prior to analyses, though actual values are used within the text. Results and Discussion: Percent crop injury was 10% or less in all three crops when Pyramin, Ro-Neet, Far-Go and Dual Magnum were applied alone either PPI or PRE (Table 44). Nortron caused 7% or less injury to Swiss chard and beet greens, but spinach had less tolerance. Treatments of Outlook casued moderate stunting with Swiss chard and beet greens, and had 35% stunting in spinach. Applying Eptam PPI gave 12 to 20% stunting in all three crops. Define caused the greatest amount of injury for PRE-applied herbicides ranging from 23 to 48%. Postemergence treatments of Stinger and Nortron did not increase or only slightly increased injury when applied POST following PRE applications of Dual Magnum. Starane applications significantly increased crop injury in all three leafy greens, and almost completely killed beet greens. Weed control ratings showed that Ro-Neet, Eptam and Far-Go gave the best control of fumitory at 85%, while all other herbicide treatments and their combinations had poor control (Table 45). Ro-Neet and Far-Go gave excellent control of henbit, as did Dual Magnum + Starane or Nortron. All other herbicide treatments failed to control henbit. Finally, yields of Swiss chard and spinach were significantly reduced compared to the untreated control only where Starane was applied POST, and where Define was applied PRE. Beet greens yields were significantly reduced in plots treated with Stinger, Define and Eptam. The results of this research suggest that several herbicides may have potential for use in leafy chenopods; however, more research is needed to determine timings and rates where less potential injury may occur.
Figure 22. Photos showng Swiss chard treatments of PRE-applied Dual Magnum (left), Ro-Neet applied PPI (middle) and Dual Magnum PRE + Starane POST (right).
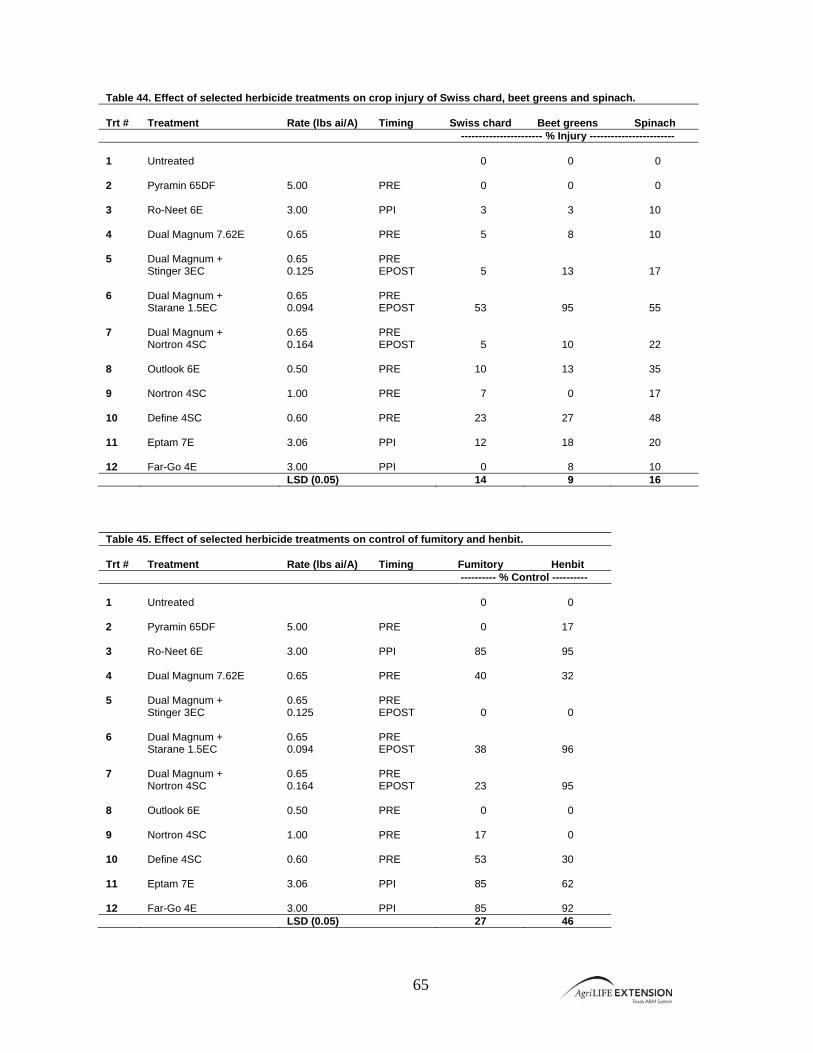
65
Table 44. Effect of selected herbicide treatments on crop injury of Swiss chard, beet greens and spinach. Trt #
Treatment
Rate (lbs ai/A)
Timing
Swiss chard
Beet greens
Spinach
----------------------- % Injury ------------------------ 1
Untreated
0
0
0
2
Pyramin 65DF
5.00
PRE
0
0
0
3
Ro-Neet 6E
3.00
PPI
3
3
10
4
Dual Magnum 7.62E
0.65
PRE
5
8
10
5
Dual Magnum + Stinger 3EC
0.65 0.125
PRE EPOST
5
13
17 6
Dual Magnum + Starane 1.5EC
0.65 0.094
PRE EPOST
53
95
55 7
Dual Magnum + Nortron 4SC
0.65 0.164
PRE EPOST
5
10
22 8
Outlook 6E
0.50
PRE
10
13
35
9
Nortron 4SC
1.00
PRE
7
0
17
10
Define 4SC
0.60
PRE
23
27
48
11
Eptam 7E
3.06
PPI
12
18
20
12
Far-Go 4E
3.00
PPI
0
8
10
LSD (0.05) 14 9 16
Table 45. Effect of selected herbicide treatments on control of fumitory and henbit. Trt #
Treatment
Rate (lbs ai/A)
Timing
Fumitory
Henbit
---------- % Control ---------- 1
Untreated
0
0
2
Pyramin 65DF
5.00
PRE
0
17
3
Ro-Neet 6E
3.00
PPI
85
95
4
Dual Magnum 7.62E
0.65
PRE
40
32
5
Dual Magnum + Stinger 3EC
0.65 0.125
PRE EPOST
0
0 6
Dual Magnum + Starane 1.5EC
0.65 0.094
PRE EPOST
38
96 7
Dual Magnum + Nortron 4SC
0.65 0.164
PRE EPOST
23
95 8
Outlook 6E
0.50
PRE
0
0
9
Nortron 4SC
1.00
PRE
17
0
10
Define 4SC
0.60
PRE
53
30
11
Eptam 7E
3.06
PPI
85
62
12
Far-Go 4E
3.00
PPI
85
92
LSD (0.05) 27 46
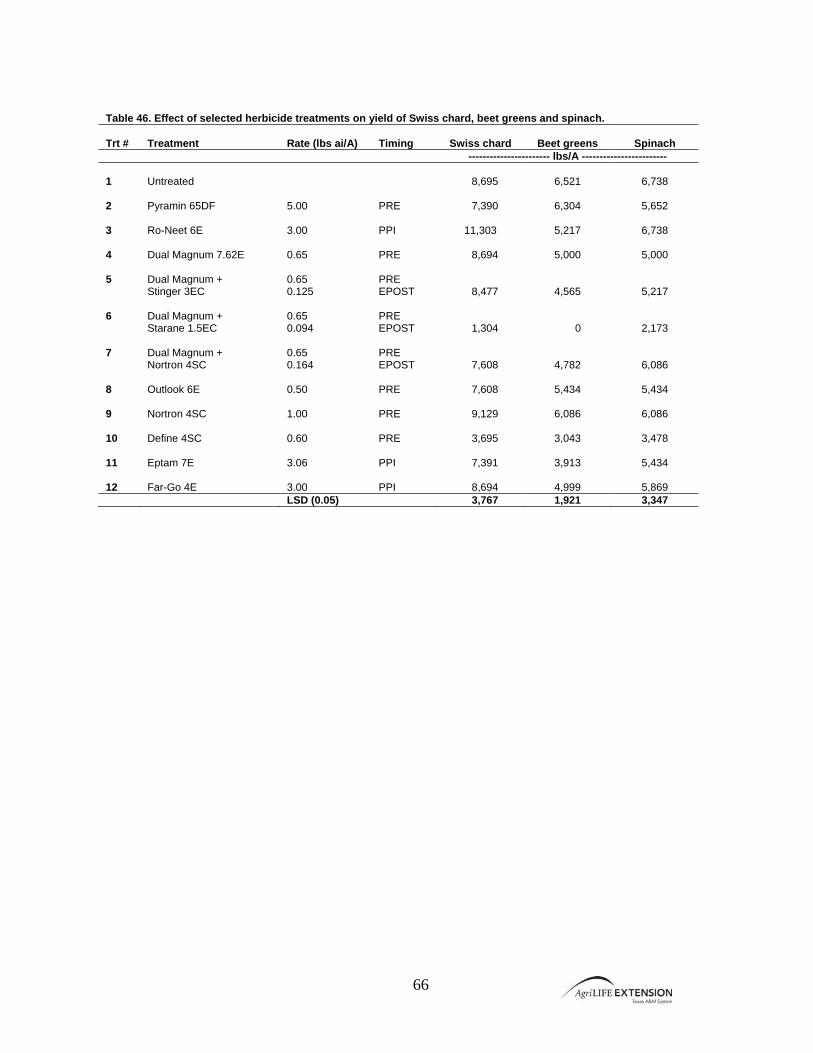
66
Table 46. Effect of selected herbicide treatments on yield of Swiss chard, beet greens and spinach. Trt #
Treatment
Rate (lbs ai/A)
Timing
Swiss chard
Beet greens
Spinach
----------------------- lbs/A ------------------------ 1
Untreated
8,695
6,521
6,738
2
Pyramin 65DF
5.00
PRE
7,390
6,304
5,652
3
Ro-Neet 6E
3.00
PPI
11,303
5,217
6,738
4
Dual Magnum 7.62E
0.65
PRE
8,694
5,000
5,000
5
Dual Magnum + Stinger 3EC
0.65 0.125
PRE EPOST
8,477
4,565
5,217 6
Dual Magnum + Starane 1.5EC
0.65 0.094
PRE EPOST
1,304
0
2,173 7
Dual Magnum + Nortron 4SC
0.65 0.164
PRE EPOST
7,608
4,782
6,086 8
Outlook 6E
0.50
PRE
7,608
5,434
5,434
9
Nortron 4SC
1.00
PRE
9,129
6,086
6,086
10
Define 4SC
0.60
PRE
3,695
3,043
3,478
11
Eptam 7E
3.06
PPI
7,391
3,913
5,434
12
Far-Go 4E
3.00
PPI
8,694
4,999
5,869
LSD (0.05) 3,767 1,921 3,347