Embed Size (px)
Citation preview

1999 TEXAS TRANSIT STATISTICS
Texas Department
of Transportation

NOTICE
This document is disseminated under the sponsorship of the Federal TransitAdministration, U.S. Department of Transportation in the interest of informationexchange. The United States Government assumes no liability for its contents oruse thereof.
The preparation of this report was financed in part through a grant for technical studies fromthe United States Department of Transportation under the provision 49 U.S.C. Section 5313.

PREPARED BY: PUBLIC TRANSPORTATIONDIVISION
TEXAS DEPARTMENTOF TRANSPORTATION
IN COOPERATION WITH: Public transit operators and city officialsthroughout the state.
July 2000
1999 Texas Transit Statistics
RecycledPaper

Acknowledgements
The information presented on transit operations in this report is a tabulation of thedata provided by the transit systems. Information on public transportation grants wasprovided by the Federal Transit Administration, U.S. Department of Transportation,and the Texas Department of Transportation. The Texas Department of Transportationwishes to express its appreciation to city and regional officials, as well as transitoperators and public transportation coordinators (PTCs) for their cooperation andassistance during the year. Without their help, this report would not be possible.

Table of ContentsPage
Introduction ...................................................................................................................... 1
Figure 1: Cities and Counties Served by Public Transportation Systems ................. 3
Figure 2: Statewide Ridership ................................................................................... 4
Table 1: Federal Financial Assistance to Texas ....................................................... 5
URBAN TRANSIT SYSTEMS
Summary: Urbanized Transit Systems ........................................................................ 7
Table 2: Urbanized Transit Systems—A Comparison ofFY 1998 and FY 1999 ................................................................................ 8
Urbanized Transit Systems Notes/Comment Section ................................ 9
Table 3: Urbanized Transit Systems Expenses and RevenuesCY1989 - FY 1999 ................................................................................... 10
Figure 3: Expenses, Revenues, Deficits and Farebox CY1989-FY 1999 ............... 10
Figure 4: Urbanized Transit System Ridership CY 1989- FY 1999 ......................... 11
Figure 5: Percent of State Urbanized Transit Ridership .......................................... 11
Table 4: Urbanized Transit System Ridership by SystemFY 1998 and FY 1999 .............................................................................. 12
Figure 6a: Metropolitan Transit Authorities Farebox Recovery ................................. 13
Figure 6b: Metropolitan Transit Authorities Operating Funding ................................. 14
Figure 6c: Metropolitan Transit Authorities Capital Funding ..................................... 14
Figure 7a: Urbanized Transit Systems Farebox Recovery........................................ 15
Figure 7b: Urbanized Transit Systems Operating Funding ....................................... 16
Figure 7c: Urbanized Transit Systems Capital Funding ............................................ 16
Table 5: Revenue by Urbanized Transit System FY 1998 and FY 1999 ............... 17
Table 6: Urbanized Transit System Vehicle Miles FY 1998 and FY 1999 .............. 18
Table 6: Urbanized Transit System Vehicle Hours FY 1998 and FY 1999............ 19
Table 7: Expenses by Urbanized Transit System FY 1998 and FY 1999 .............. 20
Table 8: Net Expense of Urbanized Transit SystemFY 1998 and FY 1999 .............................................................................. 21

Table 9: Urbanized Transit Systems Personnel and Equipment DataFY 1999 ................................................................................................... 22
Table 10: Urbanized Transit Systems Passengers andVehicle Miles Per Capita FY 1998 and FY 1999 ..................................... 23
NONURBANIZED TRANSIT SYSTEMS
Summary: Nonurbanized Transit Systems ................................................................ 24
Figure 8: Map of Section 5311 Operator Service Areas ......................................... 25
Table 11: Nonurbanized Transit Systems—A Comparison ofFY 1998 and FY 1999 .............................................................................. 26
Nonurbanized Transit Systems Notes/Comment Section ........................ 27
Table 12: Nonurbanized Transit Systems Average Number ofVehicles, Passenger Trips, Miles and Operating ExpensesCY 1994-FY 1999 .................................................................................... 28
Figure 9: Nonurbanized Transit Systems One-Way PassengerTrips, Vehicle Miles and Operating ExpensesCY 1994- FY 1999 ................................................................................... 28
Table 13: Nonurbanized Transit Systems FY 1998 - FY 1999(Section 5311 Report) ......................................................................... 29-30
Table 14: Nonurbanized Transit Systems Farebox Recovery.................................. 31
Table 15: Nonurbanized Transit Systems Cost Per Passenger Trip ........................ 32
ELDERLY AND DISABLED
Summary : Elderly and Disabled Transportation Services Providedby Non-Profit Entities ............................................................................... 33
Table 16: Elderly and Disabled Transportation—A Comparison ofFY 1998 and FY 1999 .............................................................................. 34
Table 17: Elderly and Disabled Transportation Average Numberof Vehicles, Passenger Trips, Miles and Operating ExpensesCY 1994- FY 1999 ................................................................................... 35
Table of ContentsPage 2
Table of ContentsPage 3
Figure 10: Elderly and Disabled One-Way Passenger Trips, VehicleMiles and Operating Expenses CY 1994-FY 1999 .................................. 35
Table 18: Elderly and Disabled Transportation Providers(Section 5310 Report) FY 1998 .......................................................... 36-44
Table 19: Elderly and Disabled Transportation Providers(Section 5310 Report) FY 1999 .......................................................... 45-53
URBANIZED DEFINITIONS .................................................................... 54
TRANSIT SYSTEM ADDRESSES
Metropolitan Transit Authorities (MTAs) ........................................................................... 56
Urbanized Transit Systems ............................................................................................... 57
Nonurbanized Transit Systems ......................................................................................... 61
Elderly & Disabled Transportation Systems ...................................................................... 65

INTRODUCTION
In 1999, Texas public transportation operators provided 280.1 million one-waypassenger trips to Texans and state visitors. This document is based on data compiledfrom reports by public transportation providers who receive assistance through theTexas Department of Transportation and/or the Federal Transit Administration.
Transit’s role in moving people is impressive. This report provides an array of datafor each type of service provider.
Program Agency Number Passengers Vehicles
MTA 7 256,655,344 3,978
Urbanized (5307) 26 15,418,708 581
Nonurbanized (5311) 41 4,277,851 1,009
Elderly/Disabled (5310) 314 3,714,742 1,269
Total 388 280,066,645 6,837
1
2
Information on Texas Department of Transportation (TxDOT) in Texas isavailable on the Web
http://www.dot.state.tx.us/
To view the Public Transportation Division’s home page on the Web forspecific information concerning transit services
click on the Public Transportation button on TxDOT’s home page
For further information concerning this report, please write or call:
Texas Department of TransportationPublic Transportation Division
125 East 11th StreetAustin, Texas 78701-2483
(512) 416-2810
Web E-Mail:[email protected]

3
FIGURE 1CITIES AND COUNTIES SERVED BY PUBLIC TRANSPORTATION SYSTEMS
Geographic Coverageof Public Transportation
Texas Department of TransportationApril 1, 1999
Texas Department
of Transportation
AMARILLO
LUBBOCK WICHITA FALLSSHERMAN-DENISON
DALLASFORTWORTH
TYLER
WACO
BRYAN-COLLEGE STATION
BEAUMONTPORT ARTHUR
GALVESTON
LAREDO
BROWNSVILLE
SAN ANGELO
ABILENE
LEWISVILLE
MESQUITE
LONGVIEW
GRAND PRARIE
TEXAS CITY
TEMPLE
DENTON
NETS
McALLEN
EL PASO
TEXARKANA
KILLEEN
HARLINGEN
Deaf SmithRandall Arm
strong Donley Collings-
worth
Oldham Potter Carson Gray Wheeler
HemphillRobertsHutc
hinsonMooreHartley
Dallam Sherman Hansford Ochiltree Lipscomb
Parmer Castro Swisher Briscoe HallChil
dress
CookeMon
tague
Clay
WichitaWilbarger
Hardeman
ArcherBaylor
FoardCottleMotleyFloydHaleLambBailey
KnoxKingDickens
WiseJackYoungThrock-
mortonStonewall
Kent
CrosbyLubbock
HockleyCochran
Yoakum Terry Lynn GarzaDenton
TarrantParker
Gaines Borden Scurry Fisher Jones Shackle-ford
StephensPaloPinto
Haskell
Dawson
MartinAndrews Howard
Crockett
ReaganUpton
MidlandEctor
Crane
Winkler
Ward
Loving
Reeves
PecosJeff Davis
Terrell
CulbersonHudspeth
ElPaso
Val VerdePresidio Brewster
Glassc
ock
Mor
ris
Camp
Upshur
Fran
klin
Hopkins
WoodRains
HuntCollin
Van Zandt
Kaufman
Rock-WallDallas
HoodTaylorNolanMitchell
Eastland
Sterling
Johnson Ellis
Navarro
Freestone
McLennan
F a l l s
Bell
Coryell
Hill
Mi lam
Madison
Burleson Braz
os
Grim
esMontgomeryLee
Washington
Burnet
Lampasas
Travis
BastropBlanco
Hays
Comanche
M i l l s
San Saba
LlanoMason
GillespieKimble
MenardMcC
ulloch
Concho
BrownColemanRunnelsCoke
Irion
TomGreen
Schleicher
Sutton
Henderson Rusk
Polk
SanJacinto
Wal
ler
AustinKerrKendall
Comal Caldwell
GuadalupeBexarBanderaReal
Edwards
Kinney Uvalde Medina
Wilson
Gonzales
Fort Bend
Brazoria
Colorado
LavacaWharton
JacksonDewitt
Smith
Somer-vell
Callahan
Rob
erts
on
Cherokee
Gregg
Anderson
Leon
Nacogdoches
Bosque
WilliamsonWalker
Hamilton
Liberty
Harris
Galveston
Fayette
Erath
Houston
Trinity
Limestone
Cass
Marion
Harrison
Angelina
Shelby
Sabine
Panola
Tyler
Orange
Jefferson
Hardin
Chambers
Jasp
er New
ton
San
Augu
stin
eMatagorda
Maverick Zavala Frio Atascosa Karnes
BeeLiveOak
McMullenLa SalleDimmitt
Goliad
Victoria
Calhoun
Refugio
Aransas
San Patricio
BrooksKenedy
Willacy
Cameron
Hidalgo
Webb DuvallJimWells
Jim HoggZapata
Starr
Kleberg
Nueces
FanninGrayson Lamar
Red River
Bowie
TitusDelta
ARLINGTON
CORPUS CHRISTI
HOUSTONAUSTIN
SAN ANTONIOVICTORIA
Cities served by metropolitan transit authorities
Cities served by small urban transit systems
Counties served by rural or specialized (elderly & disabled) transit systems
Counties not served

4
Figure 2:STATEWIDE RIDERSHIP
1999
MTA 256,655,344Urbanized 15,418,708Nonurbanized 4,277,851Elderly and Disabled 3,714,742TOTAL PASSENGERS 280,066,645
MTA91%
Urbanized6%
Nonurbanized2%
Elderly and Disabled1%

5
TAB
LE 1
: FE
DE
RA
L F
INA
NC
IAL
AS
SIS
TAN
CE
TO
TE
XA
S T
RA
NS
IT(F
Y 9
9App
ortio
nmen
ts)
Age
ncy
Type
Sec
tion
5303
/531
3S
ectio
n 53
07S
ectio
n 53
09S
ectio
n 53
10S
ectio
n 53
11C
MA
Q a
nd O
ther
(Elig
ible
# A
genc
ies)
Pla
nnin
g A
ctiv
ities
Urb
aniz
ed A
reas
Dis
cret
iona
ryE
lder
ly/D
isab
led
Rur
al/N
on-u
rban
ized
Tran
sfer
sT
OTA
L
Urb
aniz
ed T
rans
it S
yste
ms
Und
er 2
00,0
00 P
op.
(26)
$76,
188
$19,
954,
468
$3,9
70,0
00$1
,310
,200
$25,
310,
856
Ove
r 20
0,00
0 P
op.
(8)
167,
500
115,
986,
127
102,
886,
140
22,3
63,0
0024
1,40
2,76
7
Met
ropo
litan
Pla
nnin
g
Org
aniz
atio
ns (
25)
2,66
2,30
52,
662,
305
Eld
erly
/Dis
able
d Tr
ansi
t
Sec
tion
5310
(79
veh
. pur
chas
ed)
3,18
8,20
53,
188,
205
Rur
al/N
on-U
rban
ized
Tra
nsit
Sec
tion
5311
(41
)21
,504
4,46
6,25
08,
712,
877
4,28
0,00
017
,480
,631
Inte
rcity
Bus
1,62
5,80
11,
625,
801
RTA
P18
9,73
718
9,73
7
Oth
er A
genc
ies
76,1
3476
,134
Sta
te C
oord
inat
ion/
Adm
/
Tech
nica
l Ass
itanc
e60
4,93
735
4,24
450
0,00
01,
459,
181
TOTA
L F
ED
ER
AL
$3,6
08,5
68$1
35,9
40,5
95$1
11,3
22,3
90$3
,542
,449
$11,
028,
415
$27,
953,
200
$293
,395
,617
CM
AQ
and
oth
er tr
ansf
ers
- s
ee n
ext p
age
for
deta
ils.
Sou
rce:
FTA
App
ortio
nmen
ts fo
r F
Y 1
999
and
the
Texa
s S
TIP

6
FY
99
CM
AQ
AN
D O
TH
ER
TR
AN
SF
ER
S
Pro
ject
Gra
ntee
Loca
tion
Pro
ject
Des
crip
tion
CM
AQ
OT
HE
RTO
TAL
DA
RT
Dal
las
Van
pool
Sup
port
, Rid
er R
ebat
e$3
20,0
00
DA
RT
Dal
las
Trav
el D
eman
d M
gmt,
188,
000
DA
RT
Dal
las
Trav
el D
eman
d M
gmt,
Van
pool
Sup
port
359,
000
DA
RT
/The
TD
alla
s/F
ort W
orth
RA
ILT
RA
N14
,000
,000
Isla
nd T
rans
itG
alve
ston
Trol
ley
Exp
ansi
on to
U. o
f Tx.
Med
. Ctr.
160,
000
Gul
f Coa
st C
ente
rTe
xas
City
-LaM
arqu
eE
lect
ric B
us D
emo
Pro
ject
400,
000
Gul
f Coa
st C
ente
rTe
xas
City
Ope
ratio
ns/M
aint
enan
ce F
acitl
ity, P
hase
ll75
0,20
0
ME
TR
OH
oust
onE
lect
ric B
us P
roje
ct48
0,00
0
ME
TR
OH
oust
onB
us A
/C U
nits
1,20
0,00
0
ME
TR
OH
oust
onS
huttl
e S
ervi
ce2,
850,
000
Bra
zos
Tran
sit
The
Woo
dlan
dsR
esea
rch
For
est P
ark/
Bus
es48
0,00
0
Bra
zos
Tran
sit
The
Woo
dlan
dsTo
wn
Cen
ter
Ped
estr
ian/
Tran
sit W
ay3,
800,
000
El P
aso
Cou
nty
El P
aso
Rur
al tr
ansi
t bus
es96
,000
The
TF
ort W
orth
Van
pool
Veh
icle
Acq
uisi
tion
750,
000
The
TF
ort W
orth
Tran
sit F
leet
Alte
rnat
e F
uels
Pro
gram
1,00
0,00
0
Sun
Met
roE
l Pas
oTr
ansi
t Mal
l Con
stru
ctio
n40
0,00
0
Sun
Met
roE
l Pas
oR
ubbe
r Ti
re T
rolle
y O
pera
tions
720,
000
Tota
l$2
7,63
3,20
0$3
20,0
00$2
7,95
3,20
0
Sou
rce:
U.S
. Dep
artm
ent o
f Tra
nspo
rtat
ion
and
Texa
s S
TIP

URBANIZED TRANSIT SYSTEMS

7
SummaryUrbanized Transit Systems
The small urbanized transit (5307) and the metropolitan transit authorities’ (MTA)data continues to be separated to reflect a more accurate comparison of the systems.
The small 5307 agencies provided more than 15.4 million one-way passengertrips in 1999 reflecting a 3.2 percent decrease from the 15.9 million passengers carriedin 1998. Total vehicle miles and hours continued to show an increase from the 1998data, which might be attributed to agencies expanding their service area or extendingservice on existing routes. Operating revenue for the urbanized transit systemsincreased slightly by 2.5 percent, whereas operating expenses increased 6.9 percentfrom the previous year data. Financially, the urbanized transit system’s fareboxrecovery ratio increased significantly by 18.7 percent to $7.6 million.
Two new urbanized systems have started since the 1998 report was published.Hill Country Transit District has been designated as the urban transit district toprovide transit services to the cities of Copperas Cove, Killeen, and Harker Heights.The original contract to provide transit service was signed in December, 1998. Fiscalyear 1999 operations were primarily paratransit service.
The City of Victoria designated Golden Crescent Regional Planning Commission(GCRPC) as the urban transit district for the city in November 1998. GCRPC beganproviding demand response service in February 1999.
The MTA’s continued to show substantial increases in their ridership and servicesin the metropolitan areas. They provided 256.7 million one-way passenger trips inFY99 reflecting a 4.2 percent increase from the 246.2 million passengers in 1998.The services for vehicle miles, hours, employees and the number of buses increasedsignificantly from the 1998 data. The operating revenue and farebox recoverygenerated by the MTA’s continues to increase, whereas operating expense for FY 99showed a significant decrease.
NOTE: Fiscal year is the agency’s fiscal year. With only a few exceptions, thefiscal year ends on August 31 or September 30.
8
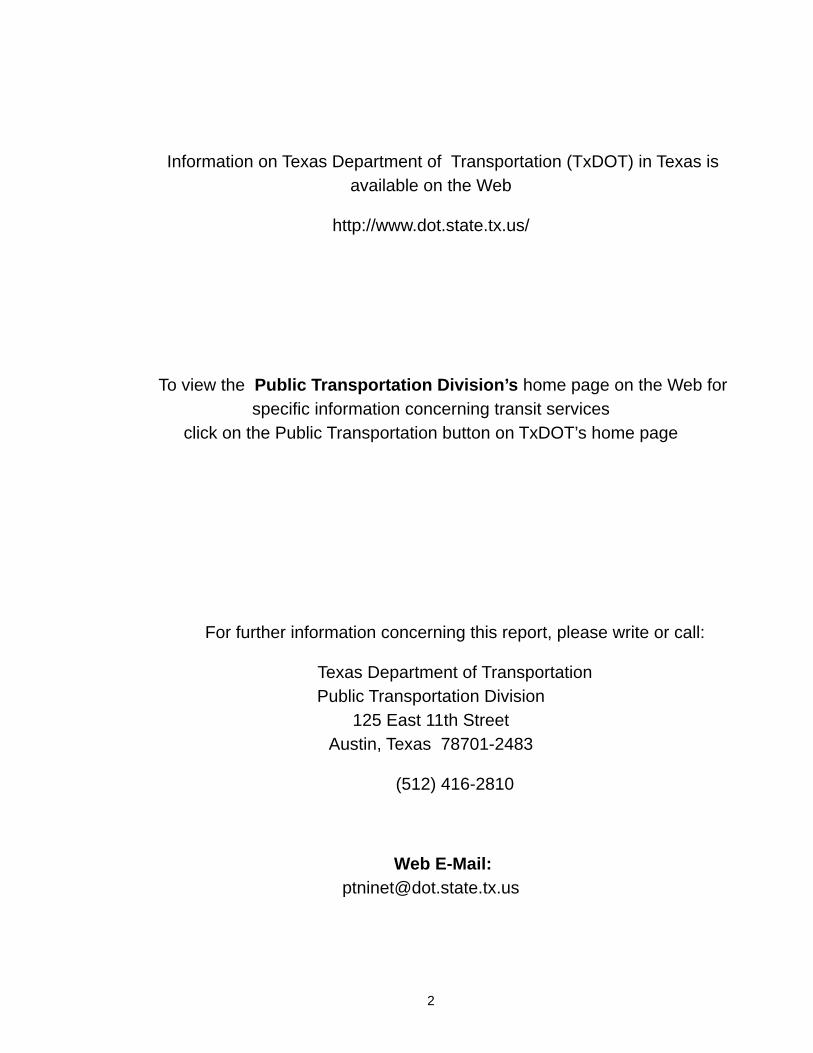
TABLE 2: SMALL URBANIZED TRANSIT SYSTEMSA Comparison of Fiscal Year 1998 and 1999
RidershipTotal passengers decreased 3.2% to 15.4 millionPassengers/vehicle mile decreased slightly from 1.2 to 1.1Passengers/vehicle hour decreased from 16.1 to 14.0
ServiceTotal vehicle miles increased 7.4% to 14.4 millionTotal vehicle hours increased 10.2% to1.1 millionAverage number of buses increased 17.6% to 581Number of employees increased by 6.7%
FinancesOperating revenues increased 2.5% to $8.1 millionOperating expenses increased 6.9% to $39.8 millionFarebox recovery ratio increased 18.7% to $7.6 millionSales tax revenue increased 6.4% to $3.3 million (Laredo)
METROPOLITAN TRANSIT AUTHORITIES (MTAs)A Comparison of Fiscal Year 1998 and 1999
RidershipTotal passengers increased 4.2% to 256.7 millionPassengers/vehicle mile increased slightly from 1.66 to 1.68Passengers/vehicle hour increased slightly to 25.7
ServiceTotal vehicle miles increased 3.2% to 153.0 millionTotal vehicle hours increased 4.1% to 10 millionAverage number of buses increased 8.1% to 3,978Number of employees increased 10.4% to 9,475
FinancesOperating revenues increased 2.4% to $159 millionOperating expenses decreased 6.2% to $645 millionFarebox recovery ratio increased by 1.5% to $120.7 millionSales tax revenue increased 7.3% to $907.9 million
Note: Small Urbans (5307) and MTA’s have been separated to show a more accurate comparison

UR
BA
NIZ
ED
TR
AN
SIT
SY
ST
EM
SN
OT
ES
/CO
MM
EN
T S
EC
TIO
N
SO
UR
CE
AG
EN
CY
EX
PLA
NAT
ION
TAB
LE 3
: EX
PE
NS
ES
& R
EV
EN
UE
ALL
1996
om
itted
bec
ause
not
all
data
col
lect
ed fo
r a
12 m
onth
per
iod.
Rep
ortin
g er
ror
in 1
998.
Ope
ratin
g E
xpen
se &
Rev
enue
cor
rect
ed fr
om p
revi
ous
repo
rt.
TAB
LE 4
: RID
ER
SH
IPG
alve
ston
Isla
ndR
ider
ship
dec
reas
ed s
igni
fican
tly fo
r F
Y 1
999
due
to th
e tr
olle
ys b
eing
shut
dow
n fo
r m
ajor
con
stru
ctio
n pr
ojec
ts o
n th
e ro
adw
ays.
Bry
an-C
olle
ge S
tatio
nR
epor
ting
erro
r in
199
8. S
houl
d ha
ve b
een
$136
,077
inst
ead
of$8
7,29
1.
Gal
vest
on Is
land
Rep
ortin
g er
ror
in 1
998.
Ope
ratin
g R
even
ue h
as b
een
corr
ecte
d du
e to
Lare
doin
clud
ing
gran
t fun
ds in
with
oth
er r
even
ue.
TAB
LE 5
: RE
VE
NU
EG
rand
Pra
irie
Sta
rted
col
lect
ing
fare
s in
FY
99. E
stab
lishe
d by
City
Cou
ncil
$1.
00ea
ch w
ay fo
r gr
ocer
y sh
oppi
ng, w
ork
& s
choo
l.
NE
TS
Rep
ortin
g er
ror
in 1
998.
Due
to m
athe
mat
ical
err
or th
e ag
ency
mul
tiplie
d tr
ips,
did
not
take
out
for
book
cer
tific
ates
, no
char
ge tr
ips,
etc
.
Tem
ple
Tran
sit
Sta
rted
col
lect
ing
fare
s in
FY
99.
Firs
t tw
elve
rid
ers
free
, $1.
00 c
harg
e th
erea
fter.
TAB
LE 6
: RE
VE
NU
E M
ILE
SLe
wis
ville
Rep
ortin
g er
ror
in 1
998.
Did
not
incl
uded
all
the
vehi
cles
mile
s fo
rS
PA
N, o
nly
Lew
isvi
lle o
f 79,
916.
NE
TS
NE
TS
dec
reas
e in
rev
enue
mile
s du
e to
dis
cont
inui
ng s
ubco
ntra
ctse
rvic
e to
one
of i
ts s
enio
r ci
tizen
s ag
enci
es in
199
9.
TAB
LE 6
-A:
RE
VE
NU
E H
OU
RS
Texa
s C
ity-L
aMar
que
Rep
ortin
g er
ror
in 1
998.
Rev
enue
Hou
rs w
ere
com
bine
d fo
r bo
th th
e 53
07/5
311
prog
ram
s.
TAB
LE 7
: EX
PE
NS
EG
rand
Pra
irie
& T
empl
eS
tart
ed c
olle
ctin
g O
pera
ting
Rev
enue
in 1
999.
Tran
sit
Texa
s C
ity-L
aMar
que
Rep
ortin
g er
ror
in 1
998.
Ope
ratin
g E
xpen
se c
ombi
ned
for
both
the
5307
/531
1 pr
ogra
ms.
For
t Wor
th T
rans
it R
even
ue H
ours
wer
e co
mbi
ned
for
both
the
5307
/531
1 pr
ogra
ms.
Rep
ortin
g er
ror
in 1
998.
Inc
orre
ct d
ata
orig
inal
ly r
epor
ted.
NO
TE
: D
ATA
DE
FIN
ITIO
NS
AR
E L
OC
AT
ED
AT
TH
E E
ND
OF
TH
IS R
EP
OR
T.
9
10
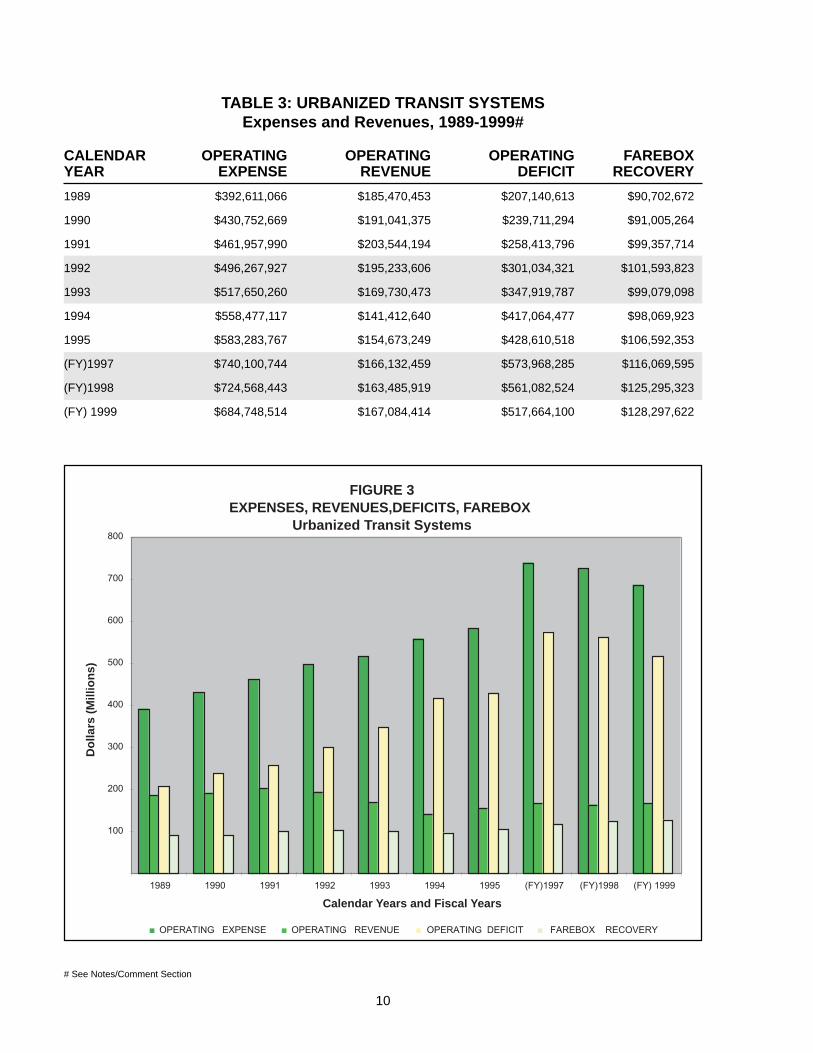
# See Notes/Comment Section
TABLE 3: URBANIZED TRANSIT SYSTEMSExpenses and Revenues, 1989-1999#
CALENDAR OPERATING OPERATING OPERATING FAREBOXYEAR EXPENSE REVENUE DEFICIT RECOVERY
1989 $392,611,066 $185,470,453 $207,140,613 $90,702,672
1990 $430,752,669 $191,041,375 $239,711,294 $91,005,264
1991 $461,957,990 $203,544,194 $258,413,796 $99,357,714
1992 $496,267,927 $195,233,606 $301,034,321 $101,593,823
1993 $517,650,260 $169,730,473 $347,919,787 $99,079,098
1994 $558,477,117 $141,412,640 $417,064,477 $98,069,923
1995 $583,283,767 $154,673,249 $428,610,518 $106,592,353
(FY)1997 $740,100,744 $166,132,459 $573,968,285 $116,069,595
(FY)1998 $724,568,443 $163,485,919 $561,082,524 $125,295,323
(FY) 1999 $684,748,514 $167,084,414 $517,664,100 $128,297,622
FIGURE 3EXPENSES, REVENUES,DEFICITS, FAREBOX
Urbanized Transit Systems
100
200
300
400
500
600
700
800
1989 1990 1991 1992 1993 1994 1995 (FY)1997 (FY)1998 (FY) 1999
Calendar Years and Fiscal Years
OPERATING EXPENSE OPERATING REVENUE OPERATING DEFICIT FAREBOX RECOVERY
Dol
lars
(M
illio
ns)

11
FIGURE 5:PERCENT OF STATE URBANIZED TRANSIT RIDERSHIP
Fiscal Year 1999
Rid
ersh
ip (
Mill
ions
)FIGURE 4:
URBANIZED TRANSIT SYSTEMS RIDERSHIP 1989-1999
50
100
150
200
250
300
1989 1990 1991 1992 1993 1994 1995 1997 1998 1999
Calendar Years and Fiscal Years
HOUSTON35%
DALLAS20%
FORT WORTH2%
SMALLURBANIZED
6%
CORPUS CHRISTI4%
EL PASO5%
AUSTIN13%SAN ANTONIO
15%
Total Urbanized Ridership 272,074,052

12
TAB
LE 4
: UR
BA
NIZ
ED
TR
AN
SIT
SY
ST
EM
RID
ER
SH
IP B
Y S
YS
TE
MF
isca
l Yea
rs 1
998
and
1999
Reg
ular
Rou
te P
asse
nger
sTr
ansf
ers
(1)
Tota
l Pas
seng
ers
Urb
aniz
ed S
yste
ms
1998
1999
1998
1999
1998
1999
Abi
lene
363,
132
360,
770
149,
475
132,
620
512,
607
493,
390
Am
arill
o32
5,17
726
1,71
012
9,32
611
6,60
245
4,50
337
8,31
2A
rling
ton
102,
349
103,
053
00
102,
349
103,
053
Bea
umon
t83
8,48
093
0,27
830
8,88
436
2,11
61,
147,
364
1,29
2,39
4B
row
nsvi
lle1,
517,
460
1,52
5,64
70
01,
517,
460
1,52
5,64
7B
ryan
-Col
lege
Sta
tion
186,
282
196,
280
75,7
3580
,568
262,
017
276,
848
Den
ton
112,
962
114,
001
42,8
3444
,750
155,
796
158,
751
Gal
vest
on Is
land
#1,
226,
946
869,
028
135,
174
89,4
931,
362,
120
958,
521
Gra
nd P
rairi
e37
,051
24,4
480
037
,051
24,4
48K
illee
n0
24,8
160
00
24,8
16La
redo
3,93
7,41
13,
809,
779
405,
435
422,
864
4,34
2,84
64,
232,
643
Lew
isvi
lle26
,698
25,8
450
026
,698
25,8
45Lo
ngvi
ew15
,923
19,6
310
015
,923
19,6
31Lu
bboc
k3,
679,
463
3,54
4,53
533
7,69
229
8,43
34,
017,
155
3,84
2,96
8M
cAlle
n19
1,86
523
5,70
731
,952
41,1
3322
3,81
727
6,84
0M
esqu
ite21
,573
20,8
090
021
,573
20,8
09N
orth
east
Tra
nsp.
Ser
vice
Tar
rant
Co.
31,3
0121
,686
00
31,3
0121
,686
Por
t Art
hur
181,
880
175,
356
20,2
2617
,582
202,
106
192,
938
San
Ang
elo
179,
404
185,
858
28,8
1426
,778
208,
218
212,
636
She
rman
-Den
ison
149,
465
152,
829
00
149,
465
152,
829
Tem
ple
23,6
4224
,619
00
23,6
4224
,619
Texa
s C
ity-L
aMar
que
49,2
6262
,906
00
49,2
6262
,906
Tyle
r97
,176
63,1
330
24,2
1897
,176
87,3
51V
icto
ria0
10,8
210
00
10,8
21W
aco
555,
859
635,
596
143,
747
144,
266
699,
606
779,
862
Wic
hita
Fal
ls20
0,72
919
3,97
521
,626
24,1
6922
2,35
521
8,14
4U
rban
ized
Sub
-Tot
al14
,051
,490
13,5
93,1
161,
830,
920
1,82
5,59
215
,882
,410
15,4
18,7
08M
TA’s
Aus
tin26
,871
,142
31,4
77,1
185,
576,
381
3,79
8,18
632
,447
,523
35,2
75,3
04C
orpu
s C
hris
ti3,
810,
768
4,16
6,49
42,
023,
848
2,08
1,64
85,
834,
616
6,24
8,14
2D
alla
s56
,244
,500
54,6
91,0
900
056
,244
,500
54,6
91,0
90E
l Pas
o11
,999
,579
11,2
69,1
021,
495,
149
1,63
7,83
813
,494
,728
12,9
06,9
40F
ort W
orth
3,91
7,81
44,
123,
534
1,27
4,84
21,
767,
688
5,19
2,65
65,
891,
222
Hou
ston
70,0
20,1
4574
,451
,035
25,1
39,9
0125
,230
,897
95,1
60,0
4699
,681
,932
San
Ant
onio
31,6
19,6
6635
,763
,502
6,19
0,54
76,
197,
212
37,8
10,2
1341
,960
,714
MTA
Sub
-Tot
al20
4,48
3,61
421
5,94
1,87
541
,700
,668
40,7
13,4
6924
6,18
4,28
225
6,65
5,34
4G
RA
ND
TO
TAL
218,
535,
104
229,
534,
991
43,5
31,5
8842
,539
,061
262,
066,
692
272,
074,
052
(1)
Zer
o in
dica
tes
tran
sfer
s in
clud
ed in
reg
ular
rou
te p
asse
nger
s or
no
tran
sfer
s.S
yste
ms
with
dem
and
repo
nse
serv
ice
are
incl
uded
in r
egul
ar r
oute
pas
seng
ers.
# S
ee N
otes
/Com
men
t Sec
tion

13
FIG
UR
E 6
a:FA
RE
BO
X R
EC
OV
ER
YM
ET
RO
PO
LITA
N T
RA
NS
IT A
UT
HO
RIT
IES
(M
TAs)
Fis
cal Y
ear
1999
LOC
AT
ION
OF
TR
AN
SIT
SY
ST
EM
FAREBOX RECOVERY % OF OPERATING EXPENSE
8.7
19.7
18.8
11
22.8
16.5
12
05
10152025
Aus
tinC
orpu
s C
hris
tiD
alla
sE
l Pas
oF
t. W
orth
Hou
ston
San
Ant
onio

14
FIGURE 6b:OPERATING FUNDING
METROPOLITAN TRANSIT AUTHORITIES (MTAs)Fiscal Year 1999
FIGURE 6c:CAPITAL FUNDING
METROPOLITAN TRANSIT AUTHORITIES (MTAs)Fiscal Year 1999
FEDERAL STATE LOCAL OTHER TOTAL OPERATING
$88,449,708 0 $337,222,931 $9,532,642 $435,205,281
FEDERAL STATE LOCAL OTHER TOTAL CAPITAL
$250,377,530 0 $21,757,321 $76,129,097 $348,263,948
LOCAL78%
OTHER2%
STATE0%
FEDERAL20%
OTHER22%
FEDERAL72%
STATE0%
LOCAL6%

FIG
UR
E 7
a:FA
RE
BO
X R
EC
OV
ER
YU
rban
ized
Tra
nsit
Sys
tem
sF
isca
l Yea
r 19
99
15
FAREBOX RECOVERY % OF OPERATING EXPENSE
6.4
6.4
18.7
21.9
12.5
11.9
13.4
1.5
0.5
29.9
2.2
11.1
38.2
6.1
1.9
4.8
14.9
9.7
6.8
1.2
2.1
5.8
9.9
15.8
19.2
11.3
05
1015202530354045
AB
LA
MA
AR
LB
MT
BR
WB
RY
DE
NG
AL
GR
PK
ILLA
RLE
WLO
NLB
BM
AC
ME
SN
ET
PR
TS
JTS
HR
TE
MT
EX
TY
LV
ICW
AC
WF
S
Loca
tion
of T
rans
it S
yste
mLE
GE
ND
AB
BR
CIT
YA
BB
RC
ITY
AB
BR
CIT
YA
BB
RC
ITY
AB
BR
CIT
YA
BL
Abi
lene
BR
YB
ryan
-Col
lege
Sta
tion
LAR
Lare
doM
ES
Mes
quite
TE
MTe
mpl
eA
MA
Am
arill
oD
EN
Den
ton
LEW
Lew
isvi
lleN
ET
Nor
thea
st T
rans
pT
EX
Texa
s C
ityA
RL
Arli
ngto
nG
AL
Gal
vest
onLO
NLo
ngvi
ewS
ervi
ceT
YL
Tyle
rB
MT
Bea
umon
tG
RP
Gra
nd P
rairi
eLB
BLu
bboc
kS
JTS
an A
ngel
oV
ICV
icto
riaB
RW
Bro
wns
ville
KIL
Kill
een
MA
CM
cAlle
nS
HR
She
rman
-Den
ison
WA
CW
aco
WF
SW
ichi
ta F
alls
* G
rand
Pra
irie
and
Tem
ple
star
ted
colle
ctin
g fa
rebo
x in
FY
199
9.

16
FIGURE 7b:OPERATING FUNDING
URBANIZED TRANSIT SYSTEMSFiscal Year 1999
FIGURE 7c:CAPITAL FUNDING
URBANIZED TRANSIT SYSTEMSFiscal Year 1999
FEDERAL STATE LOCAL OTHER TOTAL OPERATING
$15,638,394 $7,750,406 $6,682,266 $1,195,648 $31,266,714
FEDERAL STATE LOCAL OTHER TOTAL CAPITAL
$9,979,707 $1,288,930 $1,726,113 $250,936 $13,245,686
FEDERAL50%
STATE25%
LOCAL21%
OTHER4%
LOCAL13%
OTHER2%
STATE10%
FEDERAL75%

17
TAB
LE 5
: R
EV
EN
UE
BY
UR
BA
NIZ
ED
TR
AN
SIT
SY
ST
EM
FIS
CA
L Y
EA
RS
199
8 A
ND
199
9F
areb
oxO
ther
Tota
l Ope
ratin
g R
even
ueS
ales
Tax
Rev
enue
Urb
aniz
ed S
yste
ms
1998
1999
1998
1999
1998
1999
1998
1999
Abi
lene
183,
162
165,
953
16,7
3829
,986
199,
900
195,
939
Am
arill
o17
4,37
115
1,30
030
,041
35,1
9320
4,41
218
6,49
3A
rling
ton
90,7
0295
,877
1,28
614
,806
91,9
8811
0,68
3B
eaum
ont
458,
410
502,
298
19,5
8019
,688
477,
990
521,
986
Bro
wns
ville
785,
591
768,
964
69,9
4510
,705
855,
536
779,
669
Bry
an-C
olle
ge S
tatio
n-#
136,
077
198,
791
00
136,
077
198,
791
Den
ton
76,1
3578
,624
00
76,1
3578
,624
Gal
vest
on Is
land
-#34
0,38
733
9,16
10
034
0,38
733
9,16
1G
rand
Pra
irie-
#0
3,80
80
00
3,80
8K
illee
n0
1,89
70
00
1,89
7La
redo
#2,
212,
690
2,26
3,85
60
02,
212,
690
2,26
3,85
63,
098,
447
3,30
2,11
2Le
wis
ville
4,06
85,
306
25,8
0922
,296
29,8
7727
,602
Long
view
16,4
0318
,075
00
16,4
0318
,075
Lubb
ock
876,
475
1,97
3,64
81,
004,
012
01,
880,
487
1,97
3,64
8M
cAlle
n13
9,04
413
3,19
02,
407
014
1,45
113
3,19
0M
esqu
ite14
,522
10,8
010
014
,522
10,8
01N
orth
east
Tra
nsp.
Ser
vice
Tar
rant
Co.
-#46
,985
26,7
250
046
,985
26,7
25P
ort A
rthu
r16
6,07
216
1,41
70
016
6,07
216
1,41
7S
an A
ngel
o10
3,40
092
,281
10,3
9510
,955
113,
795
103,
236
She
rman
-Den
ison
45,2
2745
,612
00
45,2
2745
,612
Tem
ple-
#0
2,60
40
00
2,60
4Te
xas
City
- L
a M
arqu
e26
,767
24,1
500
026
,767
24,1
50Ty
ler
45,0
7656
,358
00
45,0
7656
,358
Vic
toria
022
,274
00
022
,274
Wac
o30
5,82
135
0,61
330
2,96
330
5,39
360
8,78
465
6,00
6W
ichi
ta F
alls
161,
778
151,
220
00
161,
778
151,
220
Urb
aniz
ed S
ub-T
otal
$6,4
09,1
63$7
,644
,803
$1,4
83,1
76$4
49,0
22$7
,892
,339
$8,0
93,8
25$3
,098
,447
$3,3
02,1
12M
TA’s
Aus
tin7,
643,
726
8,49
3,31
45,
998,
054
9,54
0,41
913
,641
,780
18,0
33,7
3397
,188
,099
105,
991,
057
Cor
pus
Chr
isti
1,10
7,70
51,
100,
338
503,
346
963,
061
1,61
1,05
12,
063,
399
14,9
47,9
6115
,564
,436
Dal
las
33,4
45,7
4635
,459
,866
4,06
9,40
44,
608,
201
37,5
15,1
5040
,068
,067
311,
098,
251
336,
047,
784
El P
aso
7,57
6,18
77,
459,
895
522,
811
7,13
4,76
88,
098,
998
14,5
94,6
6320
,397
,628
21,6
66,4
88F
ort W
orth
4,35
1,26
73,
486,
551
2,41
1,96
92,
553,
554
6,76
3,23
66,
040,
105
29,4
91,2
5532
,510
,682
Hou
ston
46,8
95,0
9948
,430
,760
15,2
63,5
579,
532,
642
62,1
58,6
5657
,963
,402
313,
478,
552
332,
937,
916
San
Ant
onio
17,8
66,4
3016
,222
,095
7,93
8,27
94,
005,
125
25,8
04,7
0920
,227
,220
59,0
45,7
2363
,211
,861
MTA
Sub
-Tot
al$1
18,8
86,1
60$1
20,6
52,8
19$3
6,70
7,42
0$3
8,33
7,77
0$1
55,5
93,5
80$1
58,9
90,5
89$8
45,6
47,4
69$9
07,9
30,2
24G
RA
ND
TO
TAL
$125
,295
,323
$128
,297
,622
$38,
190,
596
$38,
786,
792
$163
,485
,919
$167
,084
,414
$848
,745
,916
$911
,232
,336
Sal
es ta
x re
venu
e re
flect
Tex
as C
ompt
rolle
r’s d
ata.
# S
ee N
otes
/Com
men
t Sec
tion

18
TAB
LE 6
: UR
BA
NIZ
ED
TR
AN
SIT
SY
ST
EM
VE
HIC
LE A
ND
RE
VE
NU
E M
ILE
SF
ISC
AL
YE
AR
S 1
998
AN
D 1
999
Tota
l Veh
icle
Mile
sTo
tal R
even
ue M
iles
Urb
aniz
ed S
yste
ms
1998
1999
1998
1999
Abi
lene
650,
545
703,
536
626,
758
662,
075
Am
arill
o89
8,38
799
8,34
986
8,72
295
7,01
8A
rling
ton
681,
985
704,
538
629,
505
651,
773
Bea
umon
t75
2,24
485
0,49
073
9,11
077
9,29
8B
row
nsvi
lle56
0,53
758
5,86
452
1,98
754
6,62
1B
ryan
-Col
lege
Sta
tion
695,
310
676,
269
641,
444
655,
523
Den
ton
337,
301
333,
771
321,
452
317,
840
Gal
vest
on Is
land
659,
886
596,
719
653,
657
590,
490
Gra
nd P
rairi
e16
3,62
912
4,42
511
2,70
510
6,93
8K
illee
n0
162,
234
016
2,23
4La
redo
1,83
9,07
31,
972,
065
1,41
5,06
61,
726,
380
Lew
isvi
lle-#
84,5
0913
9,31
913
5,82
513
2,72
7Lo
ngvi
ew79
,767
99,5
7079
,767
99,5
70Lu
bboc
k1,
831,
652
1,95
1,68
01,
722,
812
1,83
5,93
9M
cAlle
n23
9,48
322
7,03
022
8,78
322
3,10
9M
esqu
ite28
4,38
726
6,90
725
7,80
324
6,10
4N
orth
east
Tra
nsp.
Ser
vice
Tar
rant
Co.
-#23
8,25
823
7,20
723
8,25
815
8,43
4P
ort A
rthu
r33
1,48
831
5,30
630
6,68
430
2,45
5S
an A
ngel
o42
9,20
242
5,57
541
5,12
742
4,17
1S
herm
an-D
enis
on44
1,66
154
4,08
639
3,71
546
1,64
9Te
mpl
e99
,752
100,
335
64,3
7495
,400
Texa
s C
ity-L
aMar
que
782,
287
920,
149
691,
184
702,
523
Tyle
r22
8,90
115
2,35
360
,217
150,
701
Vic
toria
087
,470
087
,470
Wac
o62
8,49
073
2,19
362
5,94
465
5,31
7W
ichi
ta F
alls
437,
358
448,
622
416,
531
427,
259
Urb
aniz
ed S
ub-T
otal
13,3
76,0
9214
,356
,062
12,1
67,4
3013
,159
,018
MTA
’sA
ustin
9,66
5,13
113
,941
,759
8,59
9,02
812
,421
,788
Cor
pus
Chr
isti
4,73
8,36
94,
502,
582
4,11
7,27
14,
004,
286
Dal
las
28,5
51,6
4924
,368
,763
24,0
04,3
1920
,853
,443
El P
aso
8,37
3,91
69,
089,
546
7,65
5,61
68,
248,
511
For
t Wor
th8,
396,
035
8,35
8,03
07,
621,
970
7,67
2,91
1H
oust
on57
,348
,935
59,3
88,7
4748
,595
,398
50,5
94,1
02S
an A
nton
io31
,107
,959
33,3
28,3
1427
,829
,712
29,5
72,4
72M
TA S
ub-T
otal
148,
181,
994
152,
977,
741
128,
423,
314
133,
367,
513
GR
AN
D T
OTA
L16
1,55
8,08
616
7,33
3,80
314
0,59
0,74
414
6,52
6,53
1
# S
ee N
otes
/Com
men
t Sec
tion

19
TAB
LE 6
a: U
RB
AN
IZE
D T
RA
NS
IT S
YS
TE
M V
EH
ICLE
AN
D R
EV
EN
UE
HO
UR
S F
ISC
AL
YE
AR
S 1
998
AN
D 1
999
Tota
l Veh
icle
Hou
rsTo
tal R
even
ue H
ours
Urb
aniz
ed S
yste
ms
1998
1999
1998
1999
Abi
lene
47,0
3850
,938
44,5
5748
,162
Am
arill
o58
,330
60,7
0156
,181
59,8
40A
rling
ton
47,6
4648
,922
43,1
0944
,783
Bea
umon
t58
,840
65,9
4156
,858
59,8
69B
row
nsvi
lle49
,286
46,9
6847
,432
43,8
78B
ryan
-Col
lege
Sta
tion
43,9
8743
,010
37,9
6438
,962
Den
ton
24,5
1424
,754
21,7
4821
,692
Gal
vest
on Is
land
61,4
3457
,864
58,0
5354
,483
Gra
nd P
rairi
e11
,800
18,4
525,
885
14,0
56K
illee
n0
15,6
000
15,6
00La
redo
157,
193
186,
175
145,
775
177,
101
Lew
isvi
lle6,
307
9,83
85,
052
8,31
1Lo
ngvi
ew6,
300
7,89
26,
300
7,89
2Lu
bboc
k13
2,20
016
2,09
312
9,06
815
7,12
8M
cAlle
n19
,552
20,4
4318
,720
18,2
49M
esqu
ite21
,336
20,1
6019
,558
18,3
96N
orth
east
Tra
nsp.
Ser
vice
Tar
rant
Co.
15,4
9112
,365
15,4
9112
,365
Por
t Art
hur
21,4
7220
,582
20,6
6419
,327
San
Ang
elo
36,4
3635
,059
33,4
6233
,519
She
rman
-Den
ison
26,5
5327
,540
23,5
4523
,522
Tem
ple
8,35
29,
164
8,35
28,
326
Texa
s C
ity-L
aMar
que-
#36
,592
40,8
9531
,015
31,5
32Ty
ler
21,2
3718
,343
10,0
3416
,485
Vic
toria
05,
897
05,
897
Wac
o47
,792
50,1
1247
,180
50,0
60W
ichi
ta F
alls
27,4
2328
,516
26,1
1727
,158
Urb
aniz
ed S
ub-T
otal
987,
111
1,08
8,22
491
2,12
01,
016,
593
MTA
’sA
ustin
719,
055
1,03
7,82
167
2,80
694
6441
Cor
pus
Chr
isti
280,
066
277,
919
259,
551
2642
46D
alla
s2,
024,
141
1,72
4,47
91,
795,
892
1,58
0,03
9E
l Pas
o59
9,35
165
5,33
555
7,29
160
9,19
7F
ort W
orth
534,
729
567,
862
515,
484
553,
163
Hou
ston
3,55
7,15
53,
685,
206
3,16
2,65
13,
320,
049
San
Ant
onio
1,89
3,44
92,
013,
183
1,76
2,91
91,
861,
264
MTA
Sub
-Tot
al9,
607,
946
9,96
1,80
58,
726,
594
9,13
4,39
9G
RA
ND
TO
TAL
10,5
95,0
5711
,050
,029
9,63
8,71
410
,150
,992
# S
ee N
otes
/Com
men
t Sec
tion

20
TAB
LE 7
: EX
PE
NS
E B
Y U
RB
AN
IZE
D T
RA
NS
IT S
YS
TE
M F
ISC
AL
YE
AR
S 1
998
AN
D 1
999
Tota
lTo
tal
Net
Ope
ratin
g R
even
ue(1
)O
pera
ting
Exp
ense
Ope
ratin
g E
xpen
seU
rban
ized
Sys
tem
s19
9819
9919
9819
9919
9819
99A
bile
ne$1
99,9
00$1
95,9
39$1
,395
,884
$1,4
73,7
62$1
,195
,984
$1,2
77,8
23A
mar
illo
204,
412
186,
493
2,22
1,59
22,
351,
922
2,01
7,18
02,
165,
429
Arli
ngto
n91
,988
110,
683
1,44
8,44
81,
487,
665
1,35
6,46
01,
376,
982
Bea
umon
t47
7,99
052
1,98
62,
422,
737
2,68
3,71
51,
944,
747
2,16
1,72
9B
row
nsvi
lle85
5,53
677
9,66
92,
702,
305
3,51
2,62
61,
846,
769
2,73
2,95
7B
ryan
-Col
lege
Sta
tion
136,
077
198,
791
1,21
1,23
91,
590,
684
1,07
5,16
21,
391,
893
Den
ton
76,1
3578
,624
611,
165
659,
936
535,
030
581,
312
Gal
vest
on Is
land
340,
387
339,
161
2,17
8,18
42,
539,
325
1,83
7,79
72,
200,
164
Gra
nd P
rairi
e-#
03,
808
359,
188
254,
245
359,
188
250,
437
Kill
een*
01,
897
036
8,70
10
366,
804
Lare
do2,
212,
690
2,26
3,85
69,
188,
897
7,57
9,21
86,
976,
207
5,31
5,36
2Le
wis
ville
29,8
7727
,602
219,
036
246,
673
189,
159
219,
071
Long
view
16,4
0318
,075
157,
133
162,
243
140,
730
144,
168
Lubb
ock
1,88
0,48
71,
973,
648
5,08
7,12
95,
172,
424
3,20
6,64
23,
198,
776
McA
llen
141,
451
133,
190
532,
970
552,
126
391,
519
418,
936
Mes
quite
14,5
2210
,801
468,
891
563,
276
454,
369
552,
475
Nor
thea
st T
rans
p. S
ervi
ce T
arra
nt C
o.46
,985
26,7
2549
7,04
655
6,22
345
0,06
152
9,49
8P
ort A
rthu
r16
6,07
216
1,41
71,
010,
143
1,08
2,64
184
4,07
192
1,22
4S
an A
ngel
o11
3,79
510
3,23
688
9,35
195
2,40
577
5,55
684
9,16
9S
herm
an-D
enis
on45
,227
45,6
1261
8,05
667
1,21
457
2,82
962
5,60
2Te
mpl
e-#
02,
604
216,
500
222,
799
216,
500
220,
195
Texa
s C
ity -
La
Mar
que-
#26
,767
24,1
5086
7,55
288
1,74
884
0,78
585
7,59
8Ty
ler
45,0
7656
,358
559,
355
970,
269
514,
279
913,
911
Vic
toria
*0
22,2
740
225,
674
020
3,40
0W
aco
608,
784
656,
006
1,59
6,01
12,
218,
391
987,
227
1,56
2,38
5W
ichi
ta F
alls
161,
778
151,
220
693,
611
787,
018
531,
833
635,
798
Urb
aniz
ed S
ub-T
otal
$7,8
92,3
39$8
,093
,825
$37,
152,
423
$39,
766,
923
$29,
260,
084
$31,
673,
098
MTA
’sA
ustin
$13,
641,
780
$18,
033,
733
$68,
280,
373
$70,
891,
076
$54,
638,
593
$52,
857,
343
Cor
pus
Chr
isti
1,61
1,05
12,
063,
399
12,9
66,8
1112
,579
,510
11,3
55,7
6010
,516
,111
Dal
las
37,5
15,1
5040
,068
,067
182,
879,
137
179,
676,
955
145,
363,
987
139,
608,
888
El P
aso
8,09
8,99
814
,594
,663
36,8
98,0
8239
,662
,320
28,7
99,0
8425
,067
,657
For
t Wor
th-#
6,76
3,23
66,
040,
105
29,5
50,2
7931
,559
,827
22,7
87,0
4325
,519
,722
Hou
ston
62,1
58,6
5657
,963
,402
266,
917,
064
212,
187,
702
204,
758,
408
154,
224,
300
San
Ant
onio
25,8
04,7
0920
,227
,220
89,9
24,2
7498
,424
,201
64,1
19,5
6578
,196
,981
MTA
Sub
-Tot
al$1
55,5
93,5
80$1
58,9
90,5
89$6
87,4
16,0
20$6
44,9
81,5
91$5
31,8
22,4
40$4
85,9
91,0
02G
RA
ND
TO
TAL
$163
,485
,919
$167
,084
,414
$724
,568
,443
$684
,748
,514
$561
,082
,524
$517
,664
,100
(1)
Incl
udes
fare
box,
and
oth
er o
pera
ting
inco
me.
*New
Sta
rt#-
See
Not
es/C
omm
ent S
ectio
n

21
TAB
LE 8
: N
ET
EX
PE
NS
E O
F U
RB
AN
IZE
D T
RA
NS
IT S
YS
TE
MS
FIS
CA
L Y
EA
RS
199
8 A
ND
199
9
Net
Ope
ratin
gN
et O
pera
ting
Net
Ope
ratin
gTo
tal O
pera
ting
Tota
l Ope
ratin
gTo
tal O
pera
ting
Exp
ense
s P
erE
xpen
ses
Per
Exp
ense
Per
Cos
t Per
Cos
t Per
Veh
icle
Cos
t Per
Veh
icle
Pas
seng
erV
ehic
le M
ileV
ehic
le H
our
Pas
seng
er M
ileH
our
Urb
aniz
ed S
yste
ms
1998
1999
1998
1999
1998
1999
1998
1999
1998
1999
1998
1999
Abi
lene
2.33
2.59
1.84
1.82
25.4
325
.09
2.72
2.99
2.15
2.09
29.6
828
.93
Am
arill
o4.
445.
722.
252.
1734
.58
35.6
74.
896.
222.
472.
3638
.09
38.7
5A
rling
ton
13.2
513
.36
1.99
1.95
28.4
728
.15
14.1
514
.44
2.12
2.11
30.4
030
.41
Bea
umon
t1.
691.
672.
592.
5433
.05
32.7
82.
112.
083.
223.
1641
.18
40.7
0B
row
nsvi
lle1.
221.
793.
294.
6637
.47
58.1
91.
782.
304.
826.
0054
.83
74.7
9B
ryan
-Col
lege
Sta
tion
4.29
5.03
1.62
2.06
25.5
532
.36
4.62
5.75
1.74
2.35
27.5
436
.98
Den
ton
3.43
3.66
1.59
1.74
21.8
323
.48
3.92
4.16
1.81
1.98
24.9
326
.66
Gal
vest
on Is
land
0.33
2.30
0.68
3.69
7.28
38.0
21.
602.
653.
304.
2635
.46
43.8
8G
rand
Pra
irie
9.69
10.2
42.
202.
0130
.44
13.5
79.
6910
.40
2.20
2.04
30.4
413
.78
Kill
een
0.00
14.7
80.
002.
260.
0023
.51
0.00
14.8
60.
002.
270.
0023
.63
Lare
do0.
531.
261.
252.
7014
.60
28.5
52.
121.
795.
003.
8458
.46
40.7
1Le
wis
ville
7.09
8.48
2.24
1.57
29.9
922
.27
8.20
9.54
2.59
1.77
34.7
325
.07
Long
view
8.84
7.34
1.76
1.45
22.3
418
.27
9.87
8.26
1.97
1.63
24.9
420
.56
Lubb
ock
0.80
0.83
1.75
1.64
24.2
619
.73
1.27
1.35
2.78
2.65
38.4
831
.91
McA
llen
1.75
1.51
1.63
1.85
20.0
220
.49
2.38
1.99
2.23
2.43
27.2
627
.01
Mes
quite
21.0
626
.55
1.60
2.07
21.3
027
.40
21.7
427
.07
1.65
2.11
21.9
827
.94
Nor
thea
st T
rans
p. S
ervi
ce T
arra
nt C
o.14
.38
24.4
21.
892.
2329
.05
42.8
215
.88
25.6
52.
092.
3432
.09
44.9
8P
ort A
rthu
r4.
184.
772.
552.
9239
.31
44.7
65.
005.
613.
053.
4347
.04
52.6
0S
an A
ngel
o3.
723.
991.
812.
0021
.29
24.2
24.
274.
482.
072.
2424
.41
27.1
7S
herm
an-D
enis
on3.
834.
091.
301.
1521
.57
22.7
24.
144.
391.
401.
2323
.28
24.3
7Te
mpl
e9.
168.
942.
172.
1925
.92
24.0
39.
169.
052.
172.
2225
.92
24.3
1Te
xas
City
-La
Mar
que
20.3
813
.63
1.28
0.93
27.4
320
.97
20.9
214
.02
1.32
0.96
28.1
621
.56
Tyle
r5.
2910
.46
2.25
6.00
24.2
249
.82
5.76
11.1
12.
446.
3726
.34
52.9
0V
icto
ria0.
0018
.80
0.00
2.33
0.00
34.4
90.
0020
.86
0.00
2.58
0.00
38.2
7W
aco
1.41
2.00
1.57
2.13
20.6
631
.18
2.28
2.84
2.54
3.03
33.3
944
.27
Wic
hita
Fal
ls2.
392.
911.
221.
4219
.39
22.3
03.
123.
611.
591.
7525
.29
27.6
0M
TA’s
Aus
tin1.
681.
505.
653.
7975
.99
50.9
32.
102.
017.
065.
0894
.96
68.3
1C
orpu
s C
hris
ti1.
951.
682.
402.
3440
.55
37.8
42.
222.
012.
742.
7946
.30
45.2
6D
alla
s2.
582.
555.
095.
7371
.82
80.9
63.
253.
296.
417.
3790
.35
104.
19E
l Pas
o2.
131.
943.
442.
7648
.05
38.2
52.
733.
074.
414.
3661
.56
60.5
2F
ort W
orth
2.21
4.33
1.37
3.05
21.4
444
.94
3.51
5.36
2.17
3.78
34.0
855
.58
Hou
ston
2.15
1.55
3.57
2.60
57.5
641
.85
2.80
2.13
4.65
3.57
75.0
457
.58
San
Ant
onio
1.70
1.86
2.06
2.35
33.8
638
.84
2.38
2.35
2.89
2.95
47.4
948
.89

22
TABLE 9: URBANIZED TRANSIT SYSTEM PERSONNEL AND EQUIPMENT DATAFISCAL YEAR 1999
Number of Rail/Trolleys Total Number of
Total Number of Buses in service Employees
Urbanized Systems 1999 1999 1999
Abilene 26 0 42
Amarillo 22 0 44
Arlington 25 0 38
Beaumont 23 0 51
Brownsville 21 0 40
Bryan-College Station 18 0 2
Denton 20 0 30
Galveston Island 20 4 49
Grand Prairie 11 0 10
Killeen 10 0 20
Laredo 66 0 186
Longview 52 0 7
Lewisville 8 0 13
Lubbock 76 0 127
McAllen 8 0 14
Mesquite 17 0 18.6
Northeast Transp. Service Tarrant Co. 9 0 12
Port Arthur 16 0 29
San Angelo 13 0 24
Sherman-Denison 15 0 22.5
Temple 8 0 9
Texas City-La Marque 41 0 29
Tyler 8 0 21
Victoria 10 0 15
Waco 24 0 43.10
Wichita Falls 10 0 20
Urbanized Sub-Total 577 4 916.2
MTA’s
Austin 430 0 758
Corpus Christi 117 0 260
Dallas 654 60 1,924
El Paso 248 0 578
Fort Worth 242 0 517
Houston 1,395 0 3,730
San Antonio 832 0 1,708
MTA Sub-Total 3,918 60 9,475
GRAND TOTAL 4,495 64 10,391

23
TAB
LE 1
0: U
RB
AN
IZE
D T
RA
NS
IT S
YS
TE
M P
AS
SE
NG
ER
S A
ND
VE
HIC
LE M
ILE
S P
ER
CA
PIT
AF
ISC
AL
YE
AR
S 1
998
AN
D 1
999
1990
Are
aP
opul
atio
n(1
) (1
,000
’s)
Pas
seng
ers
(1,0
00’s
) an
d P
asse
nger
s P
er C
apita
Veh
icle
Mile
s (1
,000
’s)
and
Veh
icle
Mile
s P
er C
apita
Urb
aniz
ed A
rea
1998
1999
1998
1999
Abi
lene
108
513
4.8
493
4.6
651
6.0
704
6.5
Am
arill
o15
845
52.
937
82.
489
85.
799
86.
3A
rling
ton
262
102
0.4
103
0.4
682
2.6
705
2.7
Bea
umon
t12
31,
147
9.3
1,29
210
.575
26.
185
06.
9B
row
nsvi
lle11
81,
517
12.9
1,52
612
.956
14.
858
65.
0B
ryan
-Col
lege
Sta
tion
108
262
2.4
579
5.4
695
6.4
676
6.3
Den
ton
6615
62.
415
92.
433
75.
133
45.
1G
alve
ston
Isla
nd58
1,36
223
.595
916
.566
011
.459
710
.3G
rand
Pra
irie
100
370.
424
0.2
164
1.6
124
1.2
Kill
een
640
0.0
250.
40
0.0
162
2.5
Lare
do12
44,
343
35.0
4,23
334
.11,
839
14.8
1,97
215
.9Le
wis
ville
7927
0.3
260.
385
1.1
139
1.8
Long
view
7616
0.2
200.
380
1.1
100
1.3
Lubb
ock
188
4,01
721
.43,
843
20.4
1,83
29.
71,
952
10.4
McA
llen
263
224
0.9
277
1.1
239
0.9
227
0.9
Mes
quite
101
220.
221
0.2
284
2.8
267
2.6
Nor
thea
st T
rans
p. S
ervi
ce T
arra
nt C
o.29
531
0.1
220.
123
80.
823
70.
8P
ort A
rthu
r11
020
21.
819
31.
833
13.
031
52.
9S
an A
ngel
o85
208
2.4
213
2.5
429
5.0
426
5.0
She
rman
-Den
ison
5614
92.
715
32.
744
27.
954
49.
7Te
mpl
e59
240.
425
0.4
100
1.7
100
1.7
Texa
s C
ity-L
aMar
que
5549
0.9
631.
178
214
.21,
326
24.1
Tyle
r80
971.
287
1.1
229
2.9
152
1.9
Vic
toria
550
0.0
110.
20
0.0
871.
6W
aco
144
700
4.9
780
5.4
628
4.4
732
5.1
Wic
hita
Fal
ls97
222
2.3
218
2.2
437
4.5
449
4.6
Urb
aniz
ed T
otal
3,03
215
,882
133.
615
,723
129.
713
,375
124.
614
,761
143.
0M
TA’s
Aus
tin56
232
,448
57.7
35,2
7562
.89,
665
17.2
13,9
4224
.8C
orpu
s C
hris
ti27
05,
835
21.6
10,4
4038
.74,
738
17.5
4,50
316
.7D
alla
s2,
035
56,2
4527
.654
,691
26.9
28,5
5214
.024
,369
12.0
El P
aso
563
13,4
9524
.012
,907
22.9
8,37
414
.99,
090
16.1
For
t Wor
th1,
168
5,19
34.
45,
891
5.0
8,39
67.
28,
358
7.2
Hou
ston
2,90
295
,160
32.8
99,6
8234
.357
,349
19.8
59,3
8920
.5S
an A
nton
io1,
129
37,8
1033
.541
,961
37.2
31,1
0827
.633
,328
29.5
MTA
’s T
otal
8,62
924
6,18
620
1.7
260,
847
227.
814
8,18
211
8.2
152,
979
126.
7G
RA
ND
TO
TAL
11,6
6126
2,06
833
5.2
276,
570
357.
516
1,55
724
2.7
167,
740
269.
8
(1)
Sou
rce
- C
ensu
s 19
90: F
inal
Pop
ulat
ion
and
Hou
sing
Cou
nts
for
Texa
s, O
ffice
of th
e G
over
nor,
Texa
s S
tate
Dat
a C
ente
r, N
umbe
r 2
Ser
ies
1991

NONURBANIZED TRANSIT SYSTEMS

24
SUMMARYNonurbanized Transit Systems
Urban Texans aren’t the only ones riding public transportation. During fiscal year1999, 41 rural transportation agencies continued to provide over four million one-waypassenger trips. These agencies maintained and operated over 1,000 vehicles. Thosevehicles traveled 21.5 million miles. Total operating expenses of these nonurbanizedsystems increased from $29.7 million in 1998 to $30.9 million in 1999. This year theforty-one rural agencies maintained an average farebox recovery ratio at 14 percent.
A couple of these nonurbanized systems expanded their service coverage area duringthe 1999 fiscal year. Golden Crescent Regional Planning Commission in conjunctionwith the department, under a pilot program, initiated rural transportation service forthe first time in Matagorda County. Also, West Texas Opportunities, Inc. expandedservice to include Ector and Midland Counties for their traveling public.
NOTE: Fiscal year is the agency’s fiscal year. With only a few exceptions, the fiscalyear ends on August 31 or September 30.

25
FIGURE 8:SECTION 5311 OPERATORS
Archer
Dallam Sherman Hansford Ochiltree Lipscomb
Hartley Moore
Hutchin
son
Roberts Hemphill
Oldham Potter Carson Gray
Deaf Smith Randall Armstrong
Wheeler
DonleyCollings-
worth
Swisher Briscoe HallChil
dres
s
Motley CottleFoard
HardemanWilbarger
Dickens King Knox
Parmer Castro
Bailey Lamb Hale Floyd
Cochr
an HockleyLubbock
Crosby
Yoakum Terry Lynn Garza
Gaines Dawson
WichitaClay
Mon
tagu
e
CookeBaylor
Throck-morton Young
Grayson Fannin
Lamar RedRiver
Delta
Hunt Hopkins
Rains
Fra
nklin
Mor
risTitus
Bowie
CassCamp
UpshurMarion
Harrison
Panola
Hudspeth
Culberson
Jeff Davis
PresidioBrewster
Andrews Martin
Reeves
Pecos
Loving Winkler Ector Midland
Ward CraneUpton
Terrell
Kent Stonewall Haskell
Borden Scurry Fisher Jones
Shack
elford
Howard MitchellNolan Taylor
Callahan
Jack Wise
PaloPinto
Parker Tarrant
Erath
HoodJohnson
Denton Collin
Dallas
Rock-wall
Kaufm
an
Ellis
Navarro
Wood
VanZandt Smith
Henderson
AndersonCherokee
Rusk
Gregg
GlasscockSterling
Coke Runnels
ReaganIrion
TomGreen Concho
CrockettSchleicher
Sutton
Menard
Kimble
Edwards
Real
Val Verde
Kinney
Maverick
Zavala
Dimmit La Salle
Webb
Duval
Zapata JimHogg Brooks
Kenedy
Starr HidalgoWillacy
Cameron
Steph
ens
Eastland
ColemanBrown Comanche
McCulloch San Saba
Mills
Lampasas
Hamilton
Bosque
Hill
Coryell
McLennan
Limestone
Bell
Falls
Mason LlanoBurnet
Williamson
LeeGillespie Blanco Travis
HaysBastrop
Caldwell
Freestone
Leon
Robertson
Milam
Madison
Brazos
Burleson
Washington
Grim
es
Walker
ShelbyNacogdoches
Houston
Angelina
San
Aug
ustin
e
Trinity
Polk
SanJacinto
Sabine
Gonzales
FayetteAustin
Colorado
Lavaca
DewittJackson
Victoria
Wharton
Matagorda
Calhoun
Liberty
Chambers
Tyler
Jasp
er
New
ton
Hardin
Orange
Jefferson
Montgomery
Waller Harris
FortBend
BrazoriaGalv
esto
n
Kerr
Bandera
Uvalde
KendallComal
GuadalupeBexar
Medina
Frio Atascosa
Wilson
McMullen
Karnes
Goliad
LiveOak
Bee Refugio
SanPatricio Ar
ansa
s
NuecesJim
Wells
Kleberg
El Paso
Key:
1. Panhandle Community Services, Inc. 2. South Plains Community Action Association, Inc. 3. Caprock Community Action Association, Inc. 4. Aspermont Small Business Development Center, Inc. 5. Rolling Plains Management Corporation 6. Texoma Area Paratransit System, Inc. (TAPS) 7. Services Program for Aging Needs in Denton County (SPAN) 8. Collin County Committee on Aging 9. Hunt County Committee on Aging10. Ark-Tex Council of Governments11. West Texas Opportunities, Inc.12. People for Progress13. Central Texas Rural Transit District14. Palo Pinto County Transportation Council15. Parker County Transportation Service, Inc.16. The Transit System, Inc.17. Community Services, Inc. (Corsicana)18. Cleburne, City of19. Kaufman County Senior Citizens Services, Inc.20. East Texas Council of Governments21. Concho Valley Council of Governments22. Hill Country Transit District23. Del Rio, City of24. Heart of Texas Council of Governments25. Capital Area Rural Transportation System (CARTS)26. Brazos Transit District27. Community Council of Southwest Texas, Inc.28. Alamo Area Council of Governments29. Golden Crescent Regional Planning Commission
Texas Department of TransportationApril 1999
30. Colorado Valley Transit, Inc.31. Gulf Coast Center32. South East Texas Regional Planning Commission33. Bee Community Action Agency34. San Patricio County Community Action Agency35. Webb County Community Action Agency36. Community Action Council of South Texas37. Rural Economic Assistance League, Inc. (REAL)38. Kleberg County Human Services39. Lower Rio Grande Valley Development Council40. South Padre Island, Town of41. County of El Paso
Rural PublicTransportation
Operators111
333
222
111111121212
555
444
131313
212121
232323
353535
363636
393939 404040SOUTH PADRE
ISLAND
383838373737
343434
333333
282828272727 292929
303030313131
252525
262626
323232
202020
101010666
888 999777
191919171717
181818161616151515141414
222222242424
414141
Texas Department
of Transportation

26
TABLE 11: NONURBANIZED TRANSIT SYSTEMSA Comparison of Fiscal Year 1998 and 1999
Ridership
Total passengers increased by 2.3% to 4.3 million Passengers/vehicle mile remained the same at 0.20
Service
Total vehicle miles increased 2.8% to 21.5 millionAverage number of vehicles increased 2.4% to 1,009
Finances
Operating expenses increased 4.0% to $30.9 millionFarebox recovery ratio remained the same at 14%

27
NO
NU
RB
AN
IZE
D T
RA
NS
IT S
YS
TE
MS
NO
TE
S/C
OM
ME
NT
SE
CT
ION
:
SO
UR
CE
AG
EN
CY
EX
PLA
NAT
ION
1996
om
itted
bec
ause
not
all
data
col
lect
ed fo
r a
12 m
onth
per
iod.
TAB
LE 1
2:A
LLR
epor
ting
erro
r in
199
8. O
ne-W
ay P
asse
nger
Trip
s co
rrec
ted
tore
flect
4,2
34,0
36 in
stea
d of
pub
lishe
d 4,
363,
601.
Col
lin C
o. C
OA
Rep
ortin
g er
ror
in 1
998.
Sho
uld
have
bee
n 63
,622
trip
s in
stea
d of
the
publ
ishe
d 19
3,18
7.
Com
mun
ity C
ounc
il of
SW
TIn
crea
se in
mile
age
due
to th
e ad
ditio
n of
five
new
veh
icle
s an
dad
ditio
nal o
ut-o
f-ar
ea r
oute
s fo
r al
l the
cou
ntie
s.
TAB
LE 1
3:G
olde
n C
resc
ent R
PC
Incr
ease
d in
mile
s by
sev
enty
-thr
ee p
erce
nt,
due
to in
crea
se in
serv
ice
in th
e V
icto
ria c
ount
y ar
ea, w
ith n
o re
stric
tions
on
mile
s fo
rth
e re
side
nts.
Hea
rt o
f Tex
as C
OG
Dra
mat
ic in
crea
se in
Ope
ratin
g E
xpen
se fo
r 19
99 d
ue to
impl
emen
tatio
n of
a s
tric
t pre
vent
ativ
e m
aint
enan
ce p
rogr
am fo
rve
hicl
es, a
lso
incr
ease
d dr
iver
’s h
ours
and
wag
es.
ALL
Rep
ortin
g er
ror
in 1
998.
Tot
al F
areb
ox R
even
ue s
houl
d ha
ve b
een
$4,2
10,5
52.6
1 in
stea
d of
pub
lishe
d $4
,205
,325
.70.
TAB
LE 1
4:C
apro
ck C
omm
unity
AA
Rep
ortin
g er
ror
in 1
998.
Tot
al R
even
ue F
ares
$32
,231
.42
inst
ead
of p
ublis
hed
$27,
004.
51.
NO
TE
: D
ATA
DE
FIN
ITIO
NS
AR
E L
OC
AT
ED
AT
TH
E E
ND
OF
TH
IS R
EP
OR
T.

28
FIGURE 9:NONURBANIZED TRANSIT SYSTEMS
Section 5311 Report
TABLE 12: NONURBANIZED TRANSIT SYSTEMS–#SECTION 5311 REPORT
Average No. One-Way Vehicle Operating Year Vehicles Passenger Trips Miles Expense
1994 979 4,640,434 18,368,305 $25,414,735
1995 998 4,738,805 19,655,076 $27,695,509
1997 968 4,215,401 20,217,342 $29,153,068
1998 985 4,234,036 20,928,345 $29,693,306
1999 1,009 4,277,851 21,522,974 $30,920,974
#-See Notes/Comment Section
5
10
15
20
25
30
35
1994 1995 1997 1998 1999
Calendar Years and Fiscal Years
One-Way Passenger Trips Vehicle Miles Operating Expense

29
TAB
LE 1
3: N
ON
UR
BA
NIZ
ED
TR
AN
SIT
SY
ST
EM
SS
EC
TIO
N 5
311
RE
PO
RT
FIS
CA
L Y
EA
RS
199
8 A
ND
199
9
Ave
rage
No.
of V
ehic
les
Tota
l One
-Way
Pas
seng
er T
rips
Tota
l Veh
icle
Mile
sTo
tal O
pera
ting
Exp
ense
sR
ural
Tra
nsit
Pro
vide
r (H
eadq
uart
ers)
1998
1999
1998
1999
1998
1999
1998
1999
Ala
mo
Are
a C
ounc
il of
Gov
ernm
ents
(S
an A
nton
io)
4050
119,
458
123,
112
652,
296
904,
931
$1,0
76,7
69.0
0$1
,042
,527
.00
Ark
-Tex
Cou
ncil
of G
over
nmen
ts (
Texa
rkan
a)38
4412
7,09
913
4,78
297
9,47
81,
047,
097
750,
961.
7675
6,13
0.83
Asp
erm
ont S
mal
l Bus
ines
s D
evel
opm
ent C
tr. (
Asp
erm
ont)
78
14,5
6611
,969
312,
269
294,
456
349,
537.
3231
3,27
4.86
Bee
Com
mun
ity A
ctio
n A
genc
y (B
eevi
lle)
2425
21,0
0023
,647
108,
151
105,
507
335,
460.
6144
0,93
4.46
Bra
zos
Tran
sit D
istr
ict (
Bry
an)
7676
765,
142
764,
617
3,16
6,39
82,
966,
957
5,53
9,16
6.00
5,16
0,19
6.52
Cap
ital A
rea
Rur
al T
rans
port
atio
n S
yste
m (
CA
RT
S)
(Aus
tin)
7475
316,
030
331,
650
1,57
0,62
91,
391,
069
2,74
7,55
7.43
2,76
5,81
8.26
Cap
rock
Com
mun
ity A
ctio
n A
ssoc
. (C
rosb
yton
)21
2075
,148
57,5
8441
6,51
234
0,73
845
9,32
1.04
552,
118.
52C
entr
al T
exas
Rur
al T
rans
it D
istr
ict (
Col
eman
)16
1736
,083
43,9
6946
3,00
355
3,47
056
2,64
2.79
688,
307.
62C
lebu
rne
City
of (
Cle
burn
e)5
628
,480
29,8
3611
4,89
210
7,67
914
9,75
0.95
146,
269.
80C
ollin
Cou
nty
Com
mitt
ee o
n A
ging
(M
cKin
ney)
-#25
2563
,622
72,9
0445
5,07
249
8,40
439
7,85
5.00
492,
937.
00C
olor
ado
Val
ley
Tra
nsit
(Col
umbu
s)18
2062
,611
75,8
0545
8,76
753
1,21
556
5,73
9.38
698,
576.
07C
omm
unity
Act
. Cou
ncil
of S
outh
Tex
as (
Rio
Gra
nde
City
)36
3645
,207
41,6
8722
0,69
523
5,00
283
6,73
6.95
793,
210.
22C
omm
unity
Cou
ncil
of S
outh
wes
t Tex
as (
Uva
lde)
-#19
2185
,380
89,1
2139
6,78
966
5,99
539
5,58
7.28
425,
612.
59C
omm
unity
Ser
vice
s, In
c. (
Cor
sica
na)
1921
61,0
5961
,470
244,
358
299,
935
389,
569.
0040
9,67
9.00
Con
cho
Val
ley
Cou
ncil
of G
over
nmen
ts (
San
Ang
elo)
1820
96,7
8585
,555
184,
317
211,
216
518,
426.
8362
8,36
1.95
Cou
nty
of E
l Pas
o (E
l Pas
o)4
422
,761
21,3
3320
5,81
118
9,68
220
2,66
2.00
249,
298.
00D
el R
io, C
ity o
f (D
el R
io)
77
70,9
3440
,016
91,7
6414
4,17
143
3,94
2.42
393,
971.
17E
ast T
exas
Cou
ncil
of G
over
nmen
ts (
Kilg
ore)
5448
152,
814
132,
740
1,09
1,68
897
5,38
61,
097,
735.
0097
4,65
3.00
Gol
den
Cre
scen
t Reg
iona
l Pla
nnin
g C
omm
issi
on (
Vic
toria
)-#
2627
68,2
4296
,304
393,
824
683,
728
543,
911.
1164
9,11
5.77
Gul
f Coa
st C
ente
r (G
alve
ston
)12
1240
,868
43,0
3751
6,48
153
0,53
162
9,33
5.00
716,
404.
74H
eart
of T
exas
Cou
ncil
of G
over
nmen
ts (
Wac
o)-#
3936
119,
641
117,
662
788,
480
576,
040
528,
395.
001,
079,
420.
33H
ill C
ount
ry T
rans
it D
istr
ict (
San
Sab
a)44
4720
4,19
517
6,38
050
6,55
346
3,97
11,
082,
079.
7797
1,67
3.81
Hun
t Cou
nty
Com
mitt
ee o
n A
ging
(G
reen
ville
)7
713
,891
15,3
7611
4,87
410
4,39
426
5,17
9.69
206,
353.
51K
aufm
an C
o. S
enio
r C
itize
ns S
ervi
ce (
Terr
ell)
1212
25,0
2427
,425
295,
124
299,
755
271,
196.
0034
1,61
8.00
Kle
berg
Cou
nty
Hum
an S
ervi
ces
(Kin
gsvi
lle)
1210
60,0
4821
,643
130,
788
96,5
6919
2,61
5.02
160,
723.
00Lo
wer
Rio
Gra
nde
Val
ley
Dev
elop
. Cou
ncil
(McA
llen)
1715
55,2
2660
,151
354,
629
333,
235
688,
328.
0484
7,22
9.82
Pal
o P
into
Cou
nty
Tran
spor
tatio
n C
ounc
il (M
iner
al W
ells
)12
1458
,747
49,6
2422
4,95
623
8,16
927
8,61
5.94
250,
728.
78P
anha
ndle
Com
mun
ity S
ervi
ces
(Am
arill
o)45
4114
2,76
616
4,33
469
1,83
569
7,61
11,
070,
498.
8492
4,77
7.07
Par
ker
Cou
nty
Tra
nspo
rtat
ion
Ser
vice
, Inc
. (W
eath
erfo
rd)
2223
57,2
9743
,723
571,
152
496,
181
520,
375.
0354
6,26
8.01
Peo
ple
for
Pro
gres
s, In
c. (
Sw
eetw
ater
)11
1296
,996
119,
333
205,
384
198,
644
331,
580.
8541
9,46
1.66
Rol
ling
Pla
ins
Man
agem
ent C
orp.
(C
row
ell)
2119
169,
665
220,
946
307,
124
389,
243
680,
027.
4288
9,04
6.06
Rur
al E
cono
mic
Ass
ista
nce
Leag
ue, I
nc. (
RE
AL)
(A
lice)
1817
69,8
8558
,097
291,
797
246,
937
305,
096.
4437
3,36
9.73
San
Pat
ricio
Cou
nty
Com
mun
ity A
ctio
n A
genc
y (S
into
n)5
470
,090
56,5
1722
9,84
115
7,41
940
1,13
0.11
325,
357.
77S
ervi
ces
Pro
gram
for A
ging
Nee
ds (
SP
AN
) (D
ento
n)12
1531
,182
48,8
7329
6,48
535
0,50
242
5,58
5.00
497,
277.
00S
outh
Eas
t Tex
as R
egio
nal P
lann
ing
Com
m. (
Bea
umon
t)25
2511
4,53
386
,169
696,
756
697,
706
721,
360.
9273
4,95
7.40
Sou
th P
adre
Isla
nd, T
own
of (
Sou
th P
adre
Isla
nd)
44
59,5
2267
,674
65,8
0059
,721
192,
849.
9920
9,54
6.57
Sou
th P
lain
s C
omm
unity
Act
ion
Ass
oc. (
Leve
lland
)29
2510
0,29
410
2,54
052
6,30
361
4,27
31,
062,
415.
171,
095,
467.
68Te
xom
a A
rea
Par
atra
nsit
Sys
tem
/TA
PS
(S
herm
an)
3239
146,
862
172,
301
758,
907
925,
906
740,
818.
7681
0,00
3.43
Tran
sit S
yste
m In
c., T
he (
Gle
n R
ose)
2325
33,3
2133
,362
628,
841
636,
831
607,
966.
1465
1,37
2.77
Web
b C
o. C
omm
unity
Act
ion
Age
ncy
(Lar
edo)
2122
173,
885
171,
752
410,
860
413,
147
644,
795.
0052
8,83
6.95
Wes
t Tex
as O
ppor
tuni
ties,
Inc.
(La
mes
a)39
4015
7,67
718
2,83
178
8,66
284
9,55
169
9,73
0.48
760,
087.
38To
tals
985
1,00
94,
234,
036
4,27
7,85
120
,928
,345
21,5
22,9
74$2
9,69
3,30
6.48
$30,
920,
974.
11A
vera
ge fo
r 4
1 S
yste
ms
2425
103,
269
101,
335
510,
447
502,
879
$724
,226
.99
$728
,742
.61
#-S
ee N
otes
/Com
men
t Sec
tion

30
TAB
LE 1
3 C
ON
TIN
UE
D:
NO
NU
RB
AN
IZE
D T
RA
NS
IT S
YS
TE
MS
SE
CT
ION
531
1 R
EP
OR
T F
ISC
AL
YE
AR
S 1
998
AN
D 1
999
Cos
t Per
Veh
icle
Mile
Cos
t Per
Pas
seng
er T
rip P
asse
nger
s P
er V
ehic
le M
ileR
ural
Tra
nsit
Pro
vide
r (H
eadq
uart
ers)
1998
1999
1998
1999
1998
1999
Ala
mo
Are
a C
ounc
il of
Gov
ernm
ents
(S
an A
nton
io)
1.65
1.15
9.01
8.47
0.18
0.14
Ark
-Tex
Cou
ncil
of G
over
nmen
ts (
Texa
rkan
a)0.
770.
725.
915.
610.
130.
13A
sper
mon
t Sm
all B
usin
ess
Dev
elop
men
t Ctr.
(A
sper
mon
t)1.
121.
0624
.00
26.1
70.
050.
04B
ee C
omm
unity
Act
ion
Age
ncy
(Bee
ville
)3.
104.
1815
.97
18.6
50.
190.
22B
razo
s Tr
ansi
t Dis
tric
t (B
ryan
)1.
751.
747.
246.
750.
240.
26C
apita
l Are
a R
ural
Tra
nspo
rtat
ion
Sys
tem
(C
AR
TS
) (A
ustin
)1.
751.
998.
698.
340.
200.
24C
apro
ck C
omm
unity
Act
ion
Ass
oc. (
Cro
sbyt
on)
1.10
1.62
6.11
9.59
0.18
0.17
Cen
tral
Tex
as R
ural
Tra
nsit
Dis
tric
t (C
olem
an)
1.22
1.24
15.5
915
.65
0.08
0.08
Cle
burn
e C
ity o
f (C
lebu
rne)
1.30
1.36
5.26
4.90
0.25
0.28
Col
lin C
ount
y C
omm
ittee
on
Agi
ng (
McK
inne
y)0.
870.
996.
256.
760.
140.
15C
olor
ado
Val
ley
Tran
sit (
Col
umbu
s)1.
231.
329.
049.
220.
140.
14C
omm
unity
Act
. Cou
ncil
of S
outh
Tex
as (
Rio
Gra
nde
City
)3.
793.
3818
.51
19.0
30.
200.
18C
omm
unity
Cou
ncil
of S
outh
wes
t Tex
as (
Uva
lde)
1.00
0.64
4.63
4.78
0.22
0.13
Com
mun
ity S
ervi
ces,
Inc.
(C
orsi
cana
)1.
591.
376.
386.
660.
250.
20C
onch
o V
alle
y C
ounc
il of
Gov
ernm
ents
(S
an A
ngel
o)2.
812.
975.
367.
340.
530.
41C
ount
y of
El P
aso
(El P
aso)
0.00
0.00
8.90
11.6
90.
110.
11D
el R
io, C
ity o
f (D
el R
io)
4.73
2.73
6.12
9.85
0.77
0.28
Eas
t Tex
as C
ounc
il of
Gov
ernm
ents
(K
ilgor
e)1.
011.
007.
187.
340.
140.
14G
olde
n C
resc
ent R
egio
nal P
lann
ing
Com
mis
sion
(V
icto
ria)
1.38
0.95
7.97
6.74
0.17
0.14
Gul
f Coa
st C
ente
r (G
alve
ston
)1.
221.
3515
.40
16.6
50.
080.
08H
eart
of T
exas
Cou
ncil
of G
over
nmen
ts (
Wac
o)0.
671.
874.
429.
170.
150.
20H
ill C
ount
ry T
rans
it D
istr
ict (
San
Sab
a)2.
142.
095.
305.
510.
400.
38H
unt C
ount
y C
omm
ittee
on
Agi
ng (
Gre
envi
lle)
2.31
1.98
19.0
913
.42
0.12
0.15
Kau
fman
Co.
Sen
ior
Citi
zens
Ser
vice
(Te
rrel
l)0.
921.
1410
.84
12.4
60.
080.
09K
lebe
rg C
ount
y H
uman
Ser
vice
s (K
ings
ville
)1.
471.
663.
217.
430.
460.
22Lo
wer
Rio
Gra
nde
Val
ley
Dev
elop
. Cou
ncil
(McA
llen)
1.94
2.54
12.4
614
.09
0.16
0.18
Pal
o P
into
Cou
nty
Tra
nspo
rtat
ion
Cou
ncil
(Min
eral
Wel
ls)
1.24
1.05
4.74
5.05
0.26
0.21
Pan
hand
le C
omm
unity
Ser
vice
s (A
mar
illo)
1.55
1.33
7.50
5.63
0.21
0.24
Par
ker
Cou
nty
Tran
spor
tatio
n S
ervi
ce, I
nc. (
Wea
ther
ford
)0.
911.
109.
0812
.49
0.10
0.09
Peo
ple
for
Pro
gres
s, In
c. (
Sw
eetw
ater
)1.
612.
113.
423.
520.
470.
60R
ollin
g P
lain
s M
anag
emen
t Cor
p. (
Cro
wel
l)2.
212.
284.
014.
020.
550.
57R
ural
Eco
nom
ic A
ssis
tanc
e Le
ague
, Inc
. (R
EA
L) (
Alic
e)1.
051.
514.
376.
430.
240.
24S
an P
atric
io C
ount
y C
omm
unity
Act
ion
Age
ncy
(Sin
ton)
1.75
2.07
5.72
5.76
0.30
0.36
Ser
vice
s P
rogr
am fo
r Agi
ng N
eeds
(S
PA
N)
(Den
ton)
1.44
1.42
13.6
510
.17
0.11
0.14
Sou
th E
ast T
exas
Reg
iona
l Pla
nnin
g C
omm
. (B
eaum
ont)
1.04
1.05
6.30
8.53
0.16
0.12
Sou
th P
adre
Isla
nd, T
own
of (
Sou
th P
adre
Isla
nd)
2.93
3.51
3.24
3.10
0.90
1.13
Sou
th P
lain
s C
omm
unity
Act
ion
Ass
oc. (
Leve
lland
)2.
021.
7810
.59
10.6
80.
190.
17Te
xom
a A
rea
Par
atra
nsit
Sys
tem
/TA
PS
(S
herm
an)
0.98
0.87
5.04
4.70
0.19
0.19
Tran
sit S
yste
m In
c., T
he (
Gle
n R
ose)
0.97
1.02
18.2
519
.52
0.05
0.05
Web
b C
o. C
omm
unity
Act
ion
Age
ncy
(Lar
edo)
1.57
1.28
3.71
3.08
0.42
0.42
Wes
t Tex
as O
ppor
tuni
ties,
Inc.
(La
mes
a)0.
890.
894.
444.
160.
200.
22A
vera
ge fo
r 41
Sys
tem
s1.
421.
447.
017.
230.
210.
20

31
TAB
LE 1
4: N
ON
UR
BA
NIZ
ED
TR
AN
SIT
SY
ST
EM
SS
EC
TIO
N 5
311
FAR
EB
OX
RE
CO
VE
RY
FIS
CA
L Y
EA
RS
199
8 A
ND
199
9
Far
ebox
Rev
enue
Tota
l Ope
ratin
g E
xpen
seF
areb
ox R
ecov
ery
Rur
al T
rans
it P
rovi
der
(Hea
dqua
rter
s)19
9819
9919
9819
9919
9819
99A
lam
o A
rea
Cou
ncil
of G
over
nmen
ts (
San
Ant
onio
)$4
6,94
0.00
$67,
103.
00$1
,076
,769
.00
$1,0
42,5
27.0
04%
6%A
rk-T
ex C
ounc
il of
Gov
ernm
ents
(Te
xark
ana)
74,7
54.3
765
,297
.58
750,
961.
7675
6,13
0.83
10%
9%A
sper
mon
t Sm
all B
usin
ess
Dev
elop
men
t Ctr.
(A
sper
mon
t)21
,878
.98
27,4
66.0
734
9,53
7.32
313,
274.
866%
9%B
ee C
omm
unity
Act
ion
Age
ncy
(Bee
ville
)14
,789
.62
11,2
79.0
433
5,46
0.61
440,
934.
464%
3%B
razo
s Tr
ansi
t Dis
tric
t (B
ryan
)1,
875,
267.
001,
928,
173.
475,
539,
166.
005,
160,
196.
5234
%37
%C
apita
l Are
a R
ural
Tra
nspo
rtat
ion
Sys
tem
(C
AR
TS
) (A
ustin
)10
8,74
5.12
112,
580.
222,
747,
557.
432,
765,
818.
264%
4%C
apro
ck C
omm
unity
Act
ion
Ass
oc. (
Cro
sbyt
on)-
#32
,231
.42
36,2
00.7
145
9,32
1.04
552,
118.
527%
7%C
entr
al T
exas
Rur
al T
rans
it D
istr
ict (
Col
eman
)60
,569
.79
69,6
74.0
056
2,64
2.79
688,
307.
6211
%10
%C
lebu
rne
City
of (
Cle
burn
e)29
,251
.00
26,2
32.6
514
9,75
0.95
146,
269.
8020
%18
%C
ollin
Cou
nty
Com
mitt
ee o
n A
ging
(M
cKin
ney)
39,3
21.0
058
,645
.00
397,
855.
0049
2,93
7.00
10%
12%
Col
orad
o V
alle
y Tr
ansi
t (C
olum
bus)
32,1
14.0
331
,239
.45
565,
739.
3869
8,57
6.07
6%4%
Com
mun
ity A
ct. C
ounc
il of
Sou
th T
exas
(R
io G
rand
e C
ity)
64,5
70.0
473
,210
.03
836,
736.
9579
3,21
0.22
8%9%
Com
mun
ity C
ounc
il of
Sou
thw
est T
exas
(U
vald
e)55
,081
.14
42,4
13.6
439
5,58
7.28
425,
612.
5914
%10
%C
omm
unity
Ser
vice
s, In
c. (
Cor
sica
na)
28,4
47.0
013
,613
.00
389,
569.
0040
9,67
9.00
7%3%
Con
cho
Val
ley
Cou
ncil
of G
over
nmen
ts (
San
Ang
elo)
38,4
08.0
937
,473
.32
518,
426.
8362
8,36
1.95
7%6%
Cou
nty
of E
l Pas
o (E
l Pas
o)27
,898
.00
31,9
38.0
020
2,66
2.00
249,
298.
0014
%13
%D
el R
io, C
ity o
f (D
el R
io)
141,
780.
1679
,451
.15
433,
942.
4239
3,97
1.17
33%
20%
Eas
t Tex
as C
ounc
il of
Gov
ernm
ents
(K
ilgor
e)11
6,97
3.74
88,5
58.0
01,
097,
735.
0097
4,65
3.00
11%
9%G
olde
n C
resc
ent R
egio
nal P
lann
ing
Com
mis
sion
(V
icto
ria)
29,6
21.7
541
,774
.59
543,
911.
1164
9,11
5.77
5%6%
Gul
f Coa
st C
ente
r (G
alve
ston
)22
,175
.00
14,8
61.5
862
9,33
5.00
716,
404.
744%
2%H
eart
of T
exas
Cou
ncil
of G
over
nmen
ts (
Wac
o)54
1,63
2.99
655,
052.
8452
8,39
5.00
1,07
9,42
0.33
103%
61%
Hill
Cou
ntry
Tra
nsit
Dis
tric
t (S
an S
aba)
51,9
39.3
749
,423
.71
1,08
2,07
9.77
971,
673.
815%
5%H
unt C
ount
y C
omm
ittee
on
Agi
ng (
Gre
envi
lle)
17,7
92.3
27,
049.
5726
5,17
9.69
206,
353.
517%
3%K
aufm
an C
o. S
enio
r C
itize
ns S
ervi
ce (
Terr
ell)
20,4
87.0
023
,314
.00
271,
196.
0034
1,61
8.00
8%7%
Kle
berg
Cou
nty
Hum
an S
ervi
ces
(Kin
gsvi
lle)
4,72
9.57
4,54
7.70
192,
615.
0216
0,72
3.00
2%3%
Low
er R
io G
rand
e V
alle
y D
evel
op. C
ounc
il (M
cAlle
n)23
,440
.75
18,3
06.6
368
8,32
8.04
847,
229.
823%
2%P
alo
Pin
to C
ount
y Tr
ansp
orta
tion
Cou
ncil
(Min
eral
Wel
ls)
90,3
98.7
513
2,04
6.50
278,
615.
9425
0,72
8.78
32%
53%
Pan
hand
le C
omm
unity
Ser
vice
s (A
mar
illo)
95,9
97.8
494
,004
.83
1,07
0,49
8.84
924,
777.
079%
10%
Par
ker
Cou
nty
Tran
spor
tatio
n S
ervi
ce, I
nc. (
Wea
ther
ford
)72
,703
.68
71,3
67.9
452
0,37
5.03
546,
268.
0114
%13
%P
eopl
e fo
r P
rogr
ess,
Inc.
(S
wee
twat
er)
19,1
83.3
512
,000
.75
331,
580.
8541
9,46
1.66
6%3%
Rol
ling
Pla
ins
Man
agem
ent C
orp.
(C
row
ell)
27,3
57.9
340
,936
.15
680,
027.
4288
9,04
6.06
4%5%
Rur
al E
cono
mic
Ass
ista
nce
Leag
ue, I
nc. (
RE
AL)
(A
lice)
15,4
10.0
017
,083
.00
305,
096.
4437
3,36
9.73
5%5%
San
Pat
ricio
Cou
nty
Com
mun
ity A
ctio
n A
genc
y (S
into
n)12
,875
.99
9,02
8.03
401,
130.
1132
5,35
7.77
3%3%
Ser
vice
s P
rogr
am fo
r Agi
ng N
eeds
(S
PAN
) (D
ento
n)18
,888
.00
26,8
83.0
042
5,58
5.00
497,
277.
004%
5%S
outh
Eas
t Tex
as R
egio
nal P
lann
ing
Com
m. (
Bea
umon
t)42
,429
.32
35,7
93.3
972
1,36
0.92
734,
957.
406%
5%S
outh
Pad
re Is
land
, Tow
n of
(S
outh
Pad
re Is
land
)84
7.00
0.00
192,
849.
9920
9,54
6.57
0%0%
Sou
th P
lain
s C
omm
unity
Act
ion
Ass
oc. (
Leve
lland
)8,
764.
3514
,394
.72
1,06
2,41
5.17
1,09
5,46
7.68
1%1%
Texo
ma
Are
a P
arat
rans
it S
yste
m/T
AP
S (
She
rman
)86
,752
.92
76,2
83.8
674
0,81
8.76
810,
003.
4312
%9%
Tran
sit S
yste
m In
c., T
he (
Gle
n R
ose)
29,5
05.5
826
,554
.58
607,
966.
1465
1,37
2.77
5%4%
Web
b C
o. C
omm
unity
Act
ion
Age
ncy
(Lar
edo)
134,
359.
7113
2,92
1.75
644,
795.
0052
8,83
6.95
21%
25%
Wes
t Tex
as O
ppor
tuni
ties,
Inc.
(La
mes
a)34
,238
.94
39,3
17.4
669
9,73
0.48
760,
087.
385%
5%To
tals
$4,2
10,5
52.6
1$4
,343
,494
.91
$29,
693,
306.
48$3
0,92
0,97
4.11
Ave
rage
for
41 S
yste
ms
$102
,696
$105
,939
$724
,226
.99
$754
,170
.10
14%
14%
#-S
ee N
otes
/Com
men
t Sec
tion

32
TAB
LE 1
5: N
ON
UR
BA
NIZ
ED
TR
AN
SIT
SY
ST
EM
SC
ost P
er P
asse
nger
Trip
Fis
cal Y
ear
1999
8.4
7
5.6
1
26.1
7
18.6
5
6.7
5
8.3
4
9.5
9
15.6
5
4.9
0
6.7
6
9.2
2
19.0
3
4.7
8
6.6
6 7.3
4
9.8
5
7.3
4
6.7
4
16.6
5
9.1
7
5.5
1
13.4
2
12.4
6
7.4
3
14.0
9
5.0
5 5.6
3
12.4
9
3.5
2 4.0
2
6.4
3
5.7
6
10.1
7
8.5
3
3.1
0
10.6
8
4.7
0
19.5
2
4.1
6
05
10
15
20
25
30
Ala
mo A
rea
Counci
l of
Gover
nm
ents
(S
an A
nto
nio
)
Ark
-Tex
Counci
l of
Gover
nm
ents
(T
exar
kan
a)
Asp
erm
ont
Sm
all
Busi
nes
s D
evel
opm
ent
Ctr
. (A
sper
mont)
Bee
Com
munit
y A
ctio
n A
gen
cy (
Bee
vil
le)
Bra
zos
Tra
nsi
t D
istr
ict
(Bry
an)
Cap
ital
Are
a R
ura
l T
ransp
ort
atio
n S
yst
em (
CA
RT
S)
(Aust
in)
Cap
rock
Com
munit
y A
ctio
n A
ssoc.
(C
rosb
yto
n)
Cen
tral
Tex
as R
ura
l T
ransi
t D
istr
ict
(Cole
man
)
Cle
burn
e C
ity o
f (C
leburn
e)
Coll
in C
ounty
Com
mit
tee
on A
gin
g (
McK
inney
)
Colo
rado V
alle
y T
ransi
t (C
olu
mbus)
Com
munit
y A
ct. C
ounci
l of
South
Tex
as (
Rio
Gra
nde
Cit
y)
Com
munit
y C
ounci
l of
South
wes
t T
exas
(U
val
de)
Com
munit
y S
ervic
es, In
c. (
Cors
ican
a)
Conch
o V
alle
y C
ounci
l of
Gover
nm
ents
(S
an A
ngel
o)
Del
Rio
, C
ity o
f (D
el R
io)
Eas
t T
exas
Counci
l of
Gover
nm
ents
(K
ilgore
)
Gold
en C
resc
ent
Reg
ional
Pla
nnin
g C
om
mis
sion (
Vic
tori
a)
Gulf
Coas
t C
ente
r (G
alves
ton)
Hea
rt o
f T
exas
Counci
l of
Gover
nm
ents
(W
aco)
Hil
l C
ountr
y T
ransi
t D
istr
ict
(San
Sab
a)
Hunt
County
Com
mit
tee
on A
gin
g (
Gre
envil
le)
Kau
fman
Co. S
enio
r C
itiz
ens
Ser
vic
e (T
erre
ll)
Kle
ber
g C
ounty
Hum
an S
ervic
es (
Kin
gsv
ille
)
Low
er R
io G
rande
Val
ley D
evel
op. C
ounci
l (M
cAll
en)
Pal
o P
into
County
Tra
nsp
ort
atio
n C
ounci
l (M
iner
al W
ells
)
Pan
han
dle
Com
munit
y S
ervic
es (
Am
aril
lo)
Par
ker
County
Tra
nsp
ort
atio
n S
ervic
e, I
nc.
(W
eath
erfo
rd)
Peo
ple
for
Pro
gre
ss, In
c. (
Sw
eetw
ater
)
Roll
ing P
lain
s M
anag
emen
t C
orp
. (C
row
ell)
Rura
l E
conom
ic A
ssis
tance
Lea
gue,
Inc.
(R
EA
L)
(Ali
ce)
San
Pat
rici
o C
ounty
Com
munit
y A
ctio
n A
gen
cy (
Sin
ton)
Ser
vic
es P
rogra
m f
or
Agin
g N
eeds
(SP
AN
) (D
ento
n)
South
Eas
t T
exas
Reg
ional
Pla
nnin
g C
om
m. (B
eaum
ont)
South
Pad
re I
slan
d, T
ow
n o
f (S
outh
Pad
re I
slan
d)
South
Pla
ins
Com
munit
y A
ctio
n A
ssoc.
(L
evel
land)
Tex
om
a A
rea
Par
atra
nsi
t S
yst
em/T
AP
S (
Sher
man
)
Tra
nsi
t S
yst
em I
nc.
, T
he
(Gle
n R
ose
)
Wes
t T
exas
Opport
unit
ies,
Inc.
(L
ames
a)
3.0
8W
ebb C
o. C
om
munit
y A
ctio
n A
gen
cy (
Lar
edo)
11.6
9E
l P
aso C
ounty
(E
l P
aso)
Ave
rage
Cos
t Per
Pas
seng
er T
rip =
$7.
23

ELDERLY AND DISABLED TRANSPORTATIONSERVICES PROVIDED BY NONPROFIT ENTITIES

33
SUMMARYElderly and Disabled Transportation Services
Provided by Nonprofit Entities
During FY99, over three million one-way passenger trips were provided by 314nonprofit entities operating vehicles purchased through the Federal TransitAdministration’s Section 5310 program. The number of vehicles maintained andoperated by such entities was 1,269. These vehicles were driven over 17.3 millionmiles. The nonprofit entities responsible for these vehicles spent over $16.3 millionin 1999 providing transportation services for elderly and disabled Texans. Ridershipand service in this program showed a slight decrease from the FY98 data. Severalfactors may be contributing to this change. Contracts for purchased transportationinstead of vehicles curtails growth in the fleet size. Also, existing urban and ruraltransit agencies are obtaining Section 5310 contracts, a change from past years. Insuch instances, the elderly/disabled vehicles and passenger counts are included inthe agency’s report of general public ridership.
As noted in the previous report the “New Contract” notation indicates that the agencyreceived funding as part of the FY99 federal program of projects. The notation appliesto both existing providers replacing or augmenting their fleet as well as agenciesentering the program for the first time.
NOTE: Fiscal year is the agency’s fiscal year. With only a few exceptions, the fiscalyear ends on August 31 or September 30.

34
TABLE 16: ELDERLY AND DISABLED TRANSPORTATIONA Comparison of Fiscal Year 1998 and 1999
Ridership
Total passengers decreased by 7.5 % to 3.7 million Passengers/vehicle mile remained the same at .21
Service
Total vehicle miles decreased 8% to 17.3 millionAverage number of vehicles decreased 4.9% to 1,269
Finances
Operating expenses increased 2.5% to $16.3 million

35
FIGURE 10:ELDERLY AND DISABLED TRANSPORTATION
Section 5310 Report
TABLE 17: ELDERLY AND DISABLED TRANSPORTATIONSection 5310 Report*
Average One-WayNumber of Passenger Vehicle Operating
Year Vehicles Trips Miles Expenses
1994 983 3,759,137 13,893,284 $11,201,493.00
1995 1,123 4,045,4112 15,401,264 $13,016,956.00
1997 1,296 3,873,988 16,481,964 $14,852,050.72
1998 1,335 3,958,561 18,767,804 $15,937,829.27
1999 1,269 3,714,742 17,291,486 $16,322,578.53
Mill
ions
2
4
6
8
10
12
14
16
18
20
1994 1995 1997 1998 1999Calendar Years and Fiscal Years
One-Way Passenger Trips Vehicle Miles Operating Expense
* FY96 omitted because not all data for a 12 month period.

36
TAB
LE 1
8:E
LDE
RLY
AN
D D
ISA
BLE
D T
RA
NS
PO
RTA
TIO
N P
RO
VID
ER
SS
ectio
n 53
10 R
epor
tF
isca
l Yea
r 19
98
1998
1998
1998
1998
1998
1998
1998
Ave
rage
Tota
l One
-Way
Tota
lTo
tal
Cos
tC
ost P
erP
asse
nger
s19
98N
o. o
fP
asse
nger
Veh
icle
Ope
ratin
gP
er V
ehic
leP
asse
nger
Per
Veh
icle
New
Tran
spor
tatio
n P
rovi
ders
(H
eadq
uart
ers)
Veh
icle
sTr
ips
Mile
sE
xpen
ses
Mile
Trip
Mile
Con
trac
ts
100
D.I.
D. M
emor
Nur
s &
Reh
ab C
tr (
Dum
as)
211
83,
497
2,70
8.10
0.77
22.9
50.
03A
bile
ne A
dult
Day
Car
e (A
bile
ne)
25,
431
22,7
1224
,109
.45
1.06
4.44
0.24
Abi
lene
Goo
dwill
Indu
strie
s (A
bile
ne)
21,
111
23,7
145,
686.
700.
245.
120.
05A
ctio
nS, I
nc. o
f Bra
zoria
Cou
nty
(Ang
leto
n)6
17,1
8993
,973
75,9
33.9
40.
814.
420.
18A
dult
Day
Act
ivity
& H
ealth
Cen
ter
(Lub
bock
)4
31,3
2064
,841
84,4
63.0
01.
302.
700.
48A
dult
Day
Car
e of
San
Ang
elo
(San
Ang
elo)
212
,125
39,2
6444
,111
.57
1.12
3.64
0.31
New
Con
trac
tA
ffect
iona
te A
rms
Adu
lt D
ay H
ealth
Car
e C
ente
r (V
icto
ria)
39,
060
24,9
357,
744.
000.
310.
850.
36A
IDS
Res
ourc
es o
f Rur
al T
exas
(W
eath
erfo
rd)
32,
782
35,6
7120
,408
.62
0.57
7.34
0.08
Air
For
ce V
illag
e F
ound
atio
n, In
c. (
San
Ant
onio
)5
11,9
8644
,450
60,1
39.6
71.
355.
020.
27N
ew C
ontr
act
Air
For
ce V
illag
e II,
Inc.
(S
an A
nton
io)
416
,585
57,5
9453
,231
.58
0.92
3.21
0.29
Ala
med
a H
eigh
ts O
utre
ach
Fou
ndat
ion
Ctr.
(D
alla
s)2
6,83
413
,896
31,9
70.0
02.
304.
680.
49N
ew C
ontr
act
Ala
mo
Hea
ring
Impa
ired
Sr
Citi
zens
Inc
(San
Ant
onio
)1
1,34
412
,576
8,87
2.57
0.71
6.60
0.11
Alc
ohol
ic R
ehab
ilita
tion
Cen
ter
(San
Ant
onio
)1
2,56
910
3,78
016
,842
.00
0.16
6.56
0.02
Aliv
iane
NO
-AD
, Inc
. (IR
WC
RC
) (E
l Pas
o)6
32,4
1912
7,06
611
3,63
5.36
0.89
3.51
0.26
Alp
ha T
au O
meg
a S
r. O
pp. S
vcs.
(S
an A
nton
io)
210
,933
74,0
7718
0,16
7.16
2.43
16.4
80.
15N
ew C
ontr
act
Am
arill
o M
ulti.
Ctr.
for
the
Agi
ng (
Am
arill
o)19
77,8
0128
6,43
51,
494,
024.
005.
2219
.20
0.27
New
Con
trac
tA
mar
illo
Wes
ley
Com
mun
ity C
ente
r, In
c. (
Am
arill
o)1
31,5
744,
443
5,37
9.06
1.21
0.17
7.11
Am
eric
an A
ssoc
. Ret
ired
Per
sons
(B
row
nwoo
d)2
4,42
920
,795
13,5
84.1
20.
653.
070.
21A
mer
ican
Leg
ion
of T
usco
la (
Tye)
129
51,
679
2,36
4.50
1.41
8.02
0.18
Am
eric
an R
ed C
ross
HIV
/AID
S G
tr H
ou A
rea
Chp
t (H
oust
on)
4083
,418
1,16
6,44
072
9,08
4.00
0.63
8.74
0.07
New
Con
trac
tA
mer
ican
Rel
igio
us T
own
Hal
l Mee
ting,
Inc.
(Ir
ving
)12
42,5
5323
3,58
615
2,00
6.00
0.65
3.57
0.18
Am
igos
Del
Val
le, I
nc. (
Mis
sion
)24
104,
426
210,
499
240,
060.
001.
142.
300.
50N
ew C
ontr
act
And
erso
n C
ount
y S
helte
red
Wor
ksho
p (P
ales
tine)
25,
105
16,2
9514
,972
.50
0.92
2.93
0.31
New
Con
trac
tA
ndre
ws
Cen
tral
Sm
ith C
ount
y (T
yler
)6
40,1
5211
4,42
947
,861
.95
0.42
1.19
0.35
And
rew
s S
enio
r C
ente
r (A
ndre
ws)
21,
232
11,7
3515
,344
.00
1.31
12.4
50.
10A
rche
r N
eigh
borh
ood
Act
ion
Gro
up, I
nc. (
Arc
her
City
)1
2,10
27,
452
13,1
33.0
81.
766.
250.
28A
ustin
Rec
over
y C
ente
r (A
ustin
)8
27,9
9184
,150
48,6
08.6
00.
581.
740.
33A
ustin
Sta
te S
choo
l (A
ustin
)35
71,7
8617
9,46
854
,935
.79
0.31
0.77
0.40
Azl
eway
Boy
s R
anch
(Ty
ler)
34,
686
92,8
0820
,567
.00
0.22
4.39
0.05
Bal
mor
hea
Sr
Citi
zens
Ctr
of R
eeve
s C
o (B
alm
orhe
a)1
3,67
38,
037
7,70
0.00
0.96
2.10
0.46
Bap
tist M
emor
ial G
eria
tric
Cen
ter
(San
Ang
elo)
222
,269
54,4
7261
,075
.00
1.12
2.74
0.41
Bas
trop
Co
Em
erge
ncy
Foo
d P
antr
y &
Sup
port
Ctr
Inc
(Bas
trop
)1
1,55
34,
872
2,49
5.39
0.51
1.61
0.32
Bea
umon
t Ass
oc. f
or S
r. C
its. (
Bea
umon
t)9
37,2
9016
4,44
314
3,19
2.64
0.87
3.84
0.23
Bea
umon
t Pro
duct
s an
d S
ervi
ces,
Inc.
(B
eaum
ont)
55,
411
42,4
9410
1,19
4.20
2.38
18.7
00.
13B
ethe
l Uni
ted
Met
hodi
st C
hurc
h (S
an A
nton
io)
15,
242
12,7
4016
,882
.00
1.33
3.22
0.41
Bet
hpha
ge C
omm
unity
Ser
vice
s (B
row
nwoo
d)0
1,36
36,
355
7,43
5.35
1.17
5.46
0.21
Bet
hpha
ge M
issi
on S
outh
(S
an A
ngel
o)11
35,1
0113
2,44
359
,362
.81
0.45
1.69
0.27

37
Bet
hpha
ge M
issi
on S
outh
at L
ubbo
ck (
Lubb
ock)
738
,591
92,5
4814
,004
.17
0.15
0.36
0.42
New
Con
trac
tB
ienv
ivir
Sen
ior
Hea
lth S
ervi
ces
(El P
aso)
1263
,026
178,
394
462,
253.
002.
597.
330.
35B
ig B
end
Com
mun
ity A
ctio
n C
omitt
ee, I
nc. (
Mar
fa)
51,
589
69,5
9255
,345
.00
0.80
34.8
30.
02B
ig S
prin
g R
otar
y C
lub
(Big
Spr
ing)
14,
053
9,85
710
,132
.00
1.03
2.50
0.41
Biv
ins
Mem
oria
l Nur
sing
Hom
e (A
mar
illo)
153
31,
231
9,90
4.66
8.05
18.5
80.
43B
less
ed S
acra
men
t Chu
rch
Sen
ior
Cen
ter
(San
Ant
onio
)1
3,56
91,
444
1,70
0.00
1.18
0.48
2.47
Boo
ker
Boo
ster
Clu
b, In
c. d
ba T
win
Oak
es (
Am
arill
o)1
827,
699
2,38
4.42
0.31
29.0
80.
01B
orde
r Are
a N
utrit
ion
Cen
ter
(Lar
edo)
710
1,73
280
,435
76,0
33.2
70.
950.
751.
26B
owie
Sen
ior
Citi
zens
Pro
ject
, Inc
. (B
owie
)2
3,85
321
,911
17,2
19.3
60.
794.
470.
18B
renh
am S
tate
Sch
ool (
Bre
nham
)45
102,
227
217,
354
126,
715.
000.
581.
240.
47B
row
n C
o. A
ssoc
. Ret
arde
d C
its. (
Bro
wnw
ood)
210
,630
12,8
3512
,363
.50
0.96
1.16
0.83
New
Con
trac
tB
ukne
r V
illas
(A
ustin
)1
00
0.00
0.00
0.00
0.00
New
Con
trac
tB
urke
Fou
ndat
ion
(Aus
tin)
632
,427
136,
787
32,9
30.0
60.
241.
020.
24B
urne
t Co
MH
MR
Adv
isor
y B
oard
(M
arbl
e F
alls
)1
6,18
718
,418
5,26
5.57
0.29
0.85
0.34
C.C
. You
ng M
emor
ial H
ome
(Dal
las)
11,
286
5,14
79,
208.
291.
797.
160.
25C
aldw
ell C
o M
enta
l Ret
arda
tion
Ass
oc. (
Lock
hart
)1
400
773
5,55
0.00
7.18
13.8
80.
52C
alho
un C
ount
y S
enio
r C
its. A
ssoc
. (P
ort L
avac
a)3
7,98
345
,659
44,1
68.0
00.
975.
530.
17C
alla
han
Cou
nty
Nut
ritio
n P
roje
ct (
Bai
rd)
14,
041
3,30
673
5.86
0.22
0.18
1.22
Cam
p C
o. D
evel
op. D
isab
led
Ass
oc. (
Pitt
sbur
g)3
8,29
330
,162
14,9
73.4
50.
501.
810.
27C
amp
Sum
mit,
Inc.
(D
alla
s)1
872,
369
3,48
0.00
1.47
40.0
00.
04C
anyo
n La
ke A
ctio
n C
ente
r (C
anyo
n La
ke)
272
33,
509
5,98
3.47
1.71
8.28
0.21
Can
yons
Ret
irem
ent C
omm
unity
(A
mar
illo)
15,
735
31,6
4517
,814
.90
0.56
3.11
0.18
Cap
ital A
rea
Reh
ab. C
tr. (
Aus
tin)
117,
586
110,
025
172,
704.
281.
5722
.77
0.07
Cap
rock
Com
mun
ity A
ctui
b A
ssoc
iatio
n In
c. (
Cro
sbyt
on)
161
95,
560
3,75
0.69
0.67
6.06
0.11
New
Con
trac
tC
ente
r fo
r th
e R
etar
ded,
Inc.
(H
oust
on)
23,
762
32,7
318,
417.
400.
262.
240.
11C
entr
al T
exas
Sen
ior
Min
istr
y (W
aco)
820
,750
141,
717
139,
902.
000.
996.
740.
15C
entr
o de
Sal
ud F
amili
ar L
a F
e, In
c. (
El P
aso)
110
02,
319
1,30
2.00
0.56
13.0
20.
04C
hero
kee
Cou
nty
MR
Ass
ocia
tion
(Rus
k)8
41,5
6513
5,33
969
,388
.81
0.51
1.67
0.31
New
Con
trac
tC
hild
ress
Prid
e (C
hild
ress
)2
55,4
4322
,433
24,5
22.8
81.
090.
442.
47C
hilli
coth
e Tr
avel
ers,
Inc.
(C
hilli
coth
e)1
1,48
14,
627
1,60
0.52
0.35
1.08
0.32
Chr
ist t
he K
ing
Chu
rch
Sr.
Citi
zens
Ctr.
(S
an A
nton
io)
111
,960
6,28
617
,692
.02
2.81
1.48
1.90
Chr
istia
n C
are
Cen
ters
(La
kew
ood
Vill
age)
23,
068
23,0
037,
059.
570.
312.
300.
13C
hris
tian
Car
e C
ente
rs, I
nc. (
Mes
quite
)5
30,3
0069
,815
25,4
38.6
00.
360.
840.
43C
hris
tian
Sen
ior
Ser
vice
s (S
an A
nton
io)
146
988
13,
854.
724.
388.
220.
53N
ew C
ontr
act
City
of G
rand
Pra
irie
(Gra
nd P
rairi
e)2
4,23
239
,679
65,4
63.1
61.
6515
.47
0.11
New
Con
trac
tC
ity o
f Lan
cast
er S
enio
r C
itize
n’s
Pro
gram
(Dal
las)
14,
666
7,73
97,
413.
000.
961.
590.
60
TAB
LE 1
8:E
LDE
RLY
AN
D D
ISA
BLE
D T
RA
NS
PO
RTA
TIO
N P
RO
VID
ER
SS
ectio
n 53
10 R
epor
tF
isca
l Yea
r 19
98
1998
1998
1998
1998
1998
1998
1998
Ave
rage
Tota
l One
-Way
Tota
lTo
tal
Cos
tC
ost P
erP
asse
nger
s19
98N
o. o
fP
asse
nger
Veh
icle
Ope
ratin
gP
er V
ehic
leP
asse
nger
Per
Veh
icle
New
Tran
spor
tatio
n P
rovi
ders
(H
eadq
uart
ers)
Veh
icle
sTr
ips
Mile
sE
xpen
ses
Mile
Trip
Mile
Con
trac
ts

38
City
of P
ortla
nd (
Por
tland
)1
582
7,01
73,
940.
800.
566.
770.
08C
ity o
f San
Ant
onio
Hou
sing
Aut
horit
y E
&D
Pro
g (S
an A
nton
io)
140
01,
500
3,00
0.00
2.00
7.50
0.27
City
of S
an A
nton
io S
uppo
rt S
erv.
for
Eld
erly
(S
an A
nton
io)
1931
,005
292,
859
371,
234.
001.
2711
.97
0.11
Cla
y C
ount
y S
enio
r C
itize
ns, I
nc. (
Hen
eritt
a)1
1,53
913
,884
7,61
1.90
0.55
4.95
0.11
Clif
f Hav
en A
dult
Hea
lth C
are
(Dal
las)
19,
636
28,6
5048
,695
.00
1.70
5.05
0.34
Coc
hran
Cou
nty
Sr
Citi
zens
Ass
oc. I
nc. (
Mor
ton)
12,
622
11,2
8212
,052
.46
1.07
4.60
0.23
Com
al C
ount
y S
enio
r C
itize
ns F
ound
atio
n (N
ew B
raun
fels
)2
5,20
136
,087
54,9
13.7
21.
5210
.56
0.14
Com
bine
d C
omm
unity
Act
ion
(Sm
ithvi
lle)
212
,796
56,9
8544
,960
.31
0.79
3.51
0.22
Com
mun
ity A
ctio
n C
orp.
of W
ichi
ta F
alls
(W
ichi
ta F
alls
)3
8,20
410
5,30
089
,339
.00
0.85
10.8
90.
08C
omm
unity
Act
ion
Cor
pora
tion
of S
outh
Tex
as (
Alic
e)4
7,64
08,
419
26,6
37.6
53.
163.
490.
91C
omm
unity
Act
ion
Cou
ncil
of S
outh
Tex
as (
Rio
Gra
nde
City
)1
464
6,26
384
4.81
0.13
1.82
0.07
New
Con
trac
tC
omm
unity
Act
ion
Nac
ogdo
ches
, Inc
. (N
acog
doch
es)
159
33,
405
7,17
3.30
2.11
12.1
00.
17N
ew C
ontr
act
Com
mun
ity A
ctio
n P
rogr
am, I
nc. (
Abi
lene
)1
1,89
989
,445
2,76
8.79
0.03
1.46
0.02
Com
mun
ity a
nd S
enio
r S
ervi
ces
of M
idla
nd, I
nc. (
Mid
land
)1
6,17
38,
227
16,2
05.8
41.
972.
630.
75N
ew C
ontr
act
Com
mun
ity C
ounc
il of
SC
Tex
as In
c A
ging
Pro
g (S
egui
n)11
29,2
0725
6,09
832
8,41
9.23
1.28
11.2
40.
11C
omm
unity
Cou
ncil
of S
outh
wes
t Tex
as, I
nc.
(Uva
lde)
454
,498
88,9
6323
,457
.49
0.26
0.43
0.61
Com
mun
ity H
omes
for A
dults
, Inc
. (D
alla
s)2
3,89
420
,680
10,5
10.0
00.
512.
700.
19C
once
rned
Citi
zens
of J
ack
Co.
(Ja
cksb
oro)
29,
603
22,8
4836
,157
.73
1.58
3.77
0.42
Cor
ners
tone
Ret
irem
ent C
omm
unity
(Te
xark
ana)
187
27,
916
13,8
95.5
01.
7615
.94
0.11
New
Con
trac
tC
ounc
il O
aks
Voc
atio
nal E
nhan
cem
ent S
ervi
ces
(San
Ant
onio
)1
809
13,4
361,
956.
220.
152.
420.
06C
ounc
il of
Inde
pend
ent L
ivin
g (S
an A
nton
io)
10
00.
000.
000.
000.
00N
ew C
ontr
act
Cou
nty
Reh
abili
tatio
n C
ente
r, In
c. (
Tyle
r)4
45,7
1311
7,50
940
,957
.00
0.35
0.90
0.39
Coz
by -
Ger
man
y H
ospi
tal (
Gra
nd S
alin
e)2
1,00
430
,289
5,86
3.86
0.19
5.84
0.03
Cra
ne C
ount
y S
enio
r C
itize
ns (
Cra
ne)
15,
153
3,38
68,
515.
002.
511.
651.
52C
rock
ett R
esou
rce
Cen
ter
for
Inde
pend
ent L
ivin
g (C
rock
ett)
10
035
4.00
0.00
0.00
0.00
Dan
Dan
cige
r Je
wis
h C
omm
unity
Ctr
(F
ort W
orth
)1
3,18
15,
529
12,3
82.8
02.
243.
890.
58D
awso
n C
o. S
r. C
its. C
ente
r (L
ames
a)5
3,76
119
,131
19,4
45.0
01.
025.
170.
20D
iete
rt C
laim
Sen
ior
Citi
zens
Cen
ter,
Inc.
(K
errv
ille)
723
,985
125,
135
127,
274.
001.
025.
310.
19D
onle
y C
ount
y S
enio
r C
itize
ns A
ssoc
. (C
lare
ndon
)0
5624
421
8.50
0.90
3.90
0.23
Dor
a R
ober
ts R
ehab
ilita
tion
Cen
ter
(Big
Spr
ing)
13,
038
10,2
491,
164.
010.
110.
380.
30D
ublin
Sen
ior
Citi
zens
, Inc
. (D
ublin
)1
3,02
46,
240
14,6
69.0
02.
354.
850.
48E
ast S
abin
e S
enio
r S
ervi
ces
(Hem
phill
)6
2,59
011
7,98
49,
396.
810.
083.
630.
02E
ast T
exas
AID
S P
roje
ct (
Nac
ogdo
ches
)1
1,77
324
,396
60,1
40.4
52.
4733
.92
0.07
New
Con
trac
tE
ast T
exas
Ope
n D
oor,
Inc.
(M
arsh
all)
436
,270
46,7
3030
,777
.12
0.66
0.85
0.78
Eas
t Tex
as T
reat
men
t Cen
ter
(Kilg
ore)
22,
052
28,0
2520
,563
.08
0.73
10.0
20.
07E
ctor
Cou
nty
Sen
ior
Cen
ter
(Ode
ssa)
12,
419
8,69
413
,006
.99
1.50
5.38
0.28
TAB
LE 1
8:E
LDE
RLY
AN
D D
ISA
BLE
D T
RA
NS
PO
RTA
TIO
N P
RO
VID
ER
SS
ectio
n 53
10 R
epor
tF
isca
l Yea
r 19
98
1998
1998
1998
1998
1998
1998
1998
Ave
rage
Tota
l One
-Way
Tota
lTo
tal
Cos
tC
ost P
erP
asse
nger
s19
98N
o. o
fP
asse
nger
Veh
icle
Ope
ratin
gP
er V
ehic
leP
asse
nger
Per
Veh
icle
New
Tran
spor
tatio
n P
rovi
ders
(H
eadq
uart
ers)
Veh
icle
sTr
ips
Mile
sE
xpen
ses
Mile
Trip
Mile
Con
trac
ts

39
Ede
n H
eigh
ts, I
nc. (
New
Bra
unfe
ls)
12,
219
1,09
02,
856.
242.
621.
292.
04E
den
Hom
e fo
r th
e A
ged,
Inc.
(N
ew B
raun
fels
)1
6,89
915
,805
19,3
29.4
51.
222.
800.
44E
dgew
ater
Met
hodi
st R
etire
men
t Com
m. (
Hou
ston
)1
4,07
49,
142
2,77
9.00
0.30
0.68
0.45
Ele
ctra
Ser
vice
Cor
pora
tion
(Ele
ctra
)2
4,98
825
,442
22,4
65.7
40.
884.
500.
20E
lizab
eth
J. B
ivin
s H
ome
for
the
Age
d(A
mar
illo)
134
12,
591
12,0
00.0
04.
6335
.19
0.13
Ella
Aus
tin C
omm
unity
Cen
ter/
Sr.
Nut
ritio
n (S
an A
nton
io)
120
,280
20,7
9420
,302
.51
0.98
1.00
0.98
Elli
s C
ount
y C
omm
ittee
on
Agi
ng (
Wax
ahac
hie)
65,
597
15,4
2329
,306
.00
1.90
5.24
0.36
Elm
woo
d U
nite
d M
etho
dist
Chu
rch
(Dal
las)
16,
047
16,5
439,
862.
190.
601.
630.
37E
rath
Cou
nty
Sen
ior
Citi
zens
, Inc
. (S
teph
envi
lle)
33,
342
10,8
6218
,843
.26
1.73
5.64
0.31
New
Con
trac
tE
vang
elic
al L
uth
Goo
d S
am S
oc/d
ba P
ks G
ood
Sam
Vge
(Ode
ssa)
12,
213
27,0
637,
063.
340.
263.
190.
08F
amily
Out
reac
h an
d R
esou
rce
Inc.
(P
ales
tine)
28,
606
60,0
7823
,749
.36
0.40
2.76
0.14
Far
wel
l Con
vale
scen
t Cen
ter
(Far
wel
l)1
910
7,75
84,
517.
710.
584.
960.
12F
ayet
te C
ount
y C
omm
for
MH
MR
Age
ncy,
Inc
(Sch
ulen
berg
)1
2,80
28,
341
3,24
8.19
0.39
1.16
0.34
Firs
t Uni
ted
Met
hodi
st C
hurc
h (N
ew B
raun
fels
)2
280
10,5
912,
211.
000.
217.
900.
03F
ishe
r C
ount
y M
emor
ial P
ost 5
072
(Rob
y)3
847
33,0
206,
279.
420.
197.
410.
03F
oard
Cou
nty
Sen
ior
Citi
zens
Cor
p. (
Cro
wel
l)1
3,88
73,
847
11,4
47.0
02.
982.
941.
01F
ort B
end
Co.
Sen
ior
Citi
zens
(R
ichm
ond)
1531
,807
188,
105
138,
503.
150.
744.
350.
17F
ound
atio
n fo
r M
HM
R/P
erm
ian
Bas
in (
Mid
land
)8
13,1
7868
,341
138,
907.
002.
0310
.54
0.19
Frie
nds
of E
lder
Citi
zens
, Inc
. (P
alac
ios)
719
,291
996,
461
180,
001.
380.
189.
330.
02N
ew C
ontr
act
Gill
espi
e C
o. C
omm
ittee
on
Agi
ng (
Fre
deric
ksbu
rg)
412
,259
53,3
0352
,682
.66
0.99
4.30
0.23
Gol
den
Acr
es A
ctiv
ity C
ente
r (D
alla
s)5
14,8
0740
,146
115,
415.
872.
877.
790.
37G
olde
n A
ge H
ome
(Loc
khar
t)3
3,12
919
,320
8,08
2.00
0.42
2.58
0.16
New
Con
trac
tG
onza
les
Cou
nty
Hea
lthA
genc
y(G
onza
les)
134
32,
680
1,85
3.97
0.69
5.41
0.13
New
Con
trac
tG
oodw
ill In
dust
ries
(Lub
bock
)5
59,8
1865
,732
27,6
68.1
10.
420.
460.
91G
oodw
ill In
dust
ries
of S
an A
nton
io (
San
Ant
onio
)8
36,4
4913
7,85
214
7,39
9.00
1.07
4.04
0.26
Gra
ce P
resb
yter
ian
Vill
age,
Inc.
(D
alla
s)3
3,91
924
,097
21,6
72.0
00.
905.
530.
16N
ew C
ontr
act
Gre
ater
Ran
dolp
h S
er. P
rog.
Inc.
(U
nive
rsal
City
)3
10,2
9844
,748
32,4
83.4
90.
733.
150.
23G
regg
Har
rison
Cen
ter
for
MH
MR
Ser
vice
s (G
lade
wat
er)
510
,790
70,6
5418
,619
.00
0.26
1.73
0.15
Gre
gg-H
arris
on C
o. A
ssoc
. MH
MR
Ser
v. (
Mar
shal
l)6
13,3
5175
,056
20,6
48.0
00.
281.
550.
18G
ulf C
oast
Com
mun
ity S
ervi
ces
Ass
ocia
tion
(H
oust
on)
8598
,670
987,
929
160,
113.
670.
161.
620.
10H
ale
Cen
ter
Sen
ior
Cits
. Ass
oc, I
nc. (
Hal
e C
ente
r)1
3,86
19,
167
9,82
7.30
1.07
2.55
0.42
Hal
l’s R
esid
entia
l Tre
atm
ent C
ente
r (K
empn
er)
22,
889
18,3
3316
,795
.00
0.92
5.81
0.16
Han
sfor
d M
anor
Nur
sing
Hom
e (S
pear
man
)1
1,75
913
,824
7,19
4.89
0.52
4.09
0.13
Har
land
ale
Sen
ior
Cen
ter
(San
Ant
onio
)1
13,5
4610
,856
16,2
21.4
11.
491.
201.
25H
ays
Cou
nty
Vet
eran
s A
dmin
istr
atio
n (A
ustin
)2
1,64
831
,643
14,9
85.4
40.
479.
090.
05H
ealth
, Inc
. (S
an A
nton
io)
25,
811
13,0
1729
,586
.69
2.27
5.09
0.45
TAB
LE 1
8:E
LDE
RLY
AN
D D
ISA
BLE
D T
RA
NS
PO
RTA
TIO
N P
RO
VID
ER
SS
ectio
n 53
10 R
epor
tF
isca
l Yea
r 19
98
1998
1998
1998
1998
1998
1998
1998
Ave
rage
Tota
l One
-Way
Tota
lTo
tal
Cos
tC
ost P
erP
asse
nger
s19
98N
o. o
fP
asse
nger
Veh
icle
Ope
ratin
gP
er V
ehic
leP
asse
nger
Per
Veh
icle
New
Tran
spor
tatio
n P
rovi
ders
(H
eadq
uart
ers)
Veh
icle
sTr
ips
Mile
sE
xpen
ses
Mile
Trip
Mile
Con
trac
ts

40
Hed
ley
Sen
ior
Citi
zens
Ass
oc. (
Hed
ley)
025
253
711
2.00
0.21
0.44
0.47
HIA
LCO
-OIC
, Hou
sing
Ass
ista
nce,
Inc.
(C
orpu
s C
hris
ti)1
125,
180
1,90
9.87
0.37
159.
160.
00H
ill C
ount
ry M
HM
R C
omm
unity
Ser
vice
s (D
el R
io)
22,
135
22,0
8113
,792
.00
0.62
6.46
0.10
Hill
top
Hav
en (
Gun
ter)
21,
437
23,5
56$3
0,52
3.47
1.30
21.2
40.
06H
ockl
ey C
ount
y S
r. C
its. A
ssoc
. (Le
vella
nd)
49,
068
25,0
7846
,852
.64
1.87
5.17
0.36
Hol
y F
amily
Sen
ior
Cen
ter
(San
Ant
onio
)1
10,3
4415
,095
14,6
61.6
30.
971.
420.
69H
oly
Ros
ary
Sen
ior
Cen
ter
(San
Ant
onio
)1
7,24
97,
472
8,81
8.68
1.18
1.22
0.97
New
Con
trac
tH
ood
Cou
nty
Com
mitt
ee o
n A
ging
(G
ranb
ury)
83,
600
75,6
5632
,857
.31
0.43
9.13
0.05
Hou
sing
Aut
horit
y of
the
City
of C
ente
r (C
ente
r)1
125
352
362.
111.
032.
900.
36N
ew C
ontr
act
Inde
pend
ence
Squ
are,
Inc.
(S
an A
nton
io)
17,
127
13,5
8010
,300
.91
0.76
1.45
0.52
Indo
chin
ese
Cul
ture
Cen
ter
(Hou
ston
)2
10,6
5026
,400
55,1
81.6
72.
095.
180.
40In
man
Chr
istia
n C
ente
r (S
an A
nton
io)
42,
208
14,3
2024
,072
.00
1.68
10.9
00.
15In
stitu
te o
f Cog
nitiv
e D
evel
op In
c (S
an A
ngel
o)3
18,6
7121
,444
32,1
28.0
01.
501.
720.
87Ja
mes
L. W
est P
resb
y. S
pec
Car
e C
tr (
Ft.
Wor
th)
32,
788
2,75
37,
854.
002.
852.
821.
01N
ew C
ontr
act
Jew
ish
Com
mun
ity C
tr/H
oust
on (
Hou
ston
)5
14,8
1432
,583
16,5
41.0
70.
511.
120.
45N
ew C
ontr
act
Jew
ish
Fed
erat
ion
of E
l Pas
o (E
l Pas
o)2
3,75
55,
050
8,28
5.00
1.64
2.21
0.74
New
Con
trac
tJi
m H
ogg
Cou
nty
Tra
nsp.
Pro
gram
(H
ebbr
onvi
lle)
13,
659
11,0
0110
,541
.24
0.96
2.88
0.33
Jone
s C
ount
y A
ging
Ser
vice
s P
rogr
am (
Ans
on)
22,
550
13,1
458,
750.
470.
673.
430.
19N
ew C
ontr
act
Julie
tte F
owle
r H
omes
, Inc
. (D
alla
s)2
1,10
82,
974
13,8
33.0
04.
6512
.48
0.37
Juni
or H
elpi
ng H
and
for
Chi
ldre
n (A
ustin
)1
1,63
46,
195
1,45
1.00
0.23
0.89
0.26
Ken
mar
Opp
ortu
nity
Cen
ter,
Inc.
(La
Gra
nge)
11,
560
33,6
793,
485.
530.
100.
000.
00K
ing’
s M
anor
Met
hodi
st H
ome,
Inc.
(H
eref
ord)
21,
195
13,6
454,
119.
960.
303.
450.
09K
iwan
is C
lub
of C
olor
ado
City
(C
olor
ado
City
)1
332
4,31
44,
259.
920.
9912
.83
0.08
Kiw
anis
Gol
den
K (
Sny
der)
13,
336
4,70
47,
232.
401.
542.
170.
71K
lebe
rg C
ount
y H
uman
Ser
vice
s (
Kin
gsvi
lle)
32,
539
12,3
346,
546.
600.
532.
580.
21L.
U.L
.A.C
. Pro
ject
Am
ista
d (E
l Pas
o)7
20,2
3826
6,87
932
9,08
7.00
1.23
16.2
60.
08N
ew C
ontr
act
Lam
ar C
ount
y H
uman
Res
ourc
es C
ounc
il (P
aris
)15
62,6
4142
5,21
328
5,17
5.65
0.67
4.55
0.15
New
Con
trac
tLa
nd M
anor
, Inc
. (B
eaum
ont)
357
,344
33,0
8116
,545
.15
0.50
0.29
1.73
Libe
rty
Cou
nty
Pro
ject
on
Agi
ng (
Libe
rty)
910
,827
116,
789
71,9
42.6
50.
626.
640.
09N
ew C
ontr
act
Lubb
ock
Fai
th C
ente
r, In
c. (
Lubb
ock)
15,
171
44,7
738,
735.
290.
201.
690.
12Lu
bboc
k R
egio
nal M
HM
R C
ente
r (L
ubbo
ck)
415
,360
62,8
1826
,884
.71
0.43
1.75
0.24
Lufk
in W
orks
hop
& O
pp. C
tr. (
Lufk
in)
13,
960
16,0
008,
000.
000.
502.
020.
25Lu
ther
an C
omm
unity
Svc
s./E
l Pas
o (E
l Pas
o)9
52,4
5219
2,19
719
1,89
5.68
1.00
3.66
0.27
New
Con
trac
tLu
ther
an H
ome
of W
est T
exas
(Lu
bboc
k)1
1,30
247
,570
3,96
4.85
0.08
3.05
0.03
Luth
eran
Soc
. Svc
./Adu
lt D
ay (
Aus
tin)
46,
325
43,7
5333
,227
.27
0.76
5.25
0.14
Lynn
Co.
Pio
neer
s, In
c. (
Taho
ka)
110
,237
9,80
313
,489
.46
1.38
1.32
1.04
TAB
LE 1
8:E
LDE
RLY
AN
D D
ISA
BLE
D T
RA
NS
PO
RTA
TIO
N P
RO
VID
ER
SS
ectio
n 53
10 R
epor
tF
isca
l Yea
r 19
98
1998
1998
1998
1998
1998
1998
1998
Ave
rage
Tota
l One
-Way
Tota
lTo
tal
Cos
tC
ost P
erP
asse
nger
s19
98N
o. o
fP
asse
nger
Veh
icle
Ope
ratin
gP
er V
ehic
leP
asse
nger
Per
Veh
icle
New
Tran
spor
tatio
n P
rovi
ders
(H
eadq
uart
ers)
Veh
icle
sTr
ips
Mile
sE
xpen
ses
Mile
Trip
Mile
Con
trac
ts

41
Mar
brid
ge F
ound
atio
n, In
c. (
Man
chac
a)5
81,5
9226
8,74
517
5,26
8.59
0.65
2.15
0.30
Mar
ian
Mos
s E
nter
pris
es, I
nc. (
Lubb
ock)
11,
897
7,42
83,
586.
520.
481.
890.
26M
arsh
all A
rea
Ass
oc. R
etar
ded
Citi
zens
(M
arsh
all)
427
,920
91,6
6340
,581
.00
0.44
1.45
0.30
Mar
tin C
ount
y S
enio
r C
ente
r (S
tant
on)
12,
584
5,47
05,
646.
001.
032.
180.
47N
ew C
ontr
act
Mar
y Le
e F
ound
atio
n (A
ustin
)16
26,9
0574
,007
100,
666.
001.
363.
740.
36N
ew C
ontr
act
May
Sen
ior
Citi
zens
, Inc
. (M
ay)
11,
181
15,7
415,
377.
000.
344.
550.
08M
eals
-on
-Whe
els
of J
ohns
on C
ount
y (C
lebu
rne)
41,
336
52,8
8139
,318
.77
0.74
29.4
30.
03M
edic
al C
ente
r N
ursi
ng H
ome
(Cla
rend
on)
171
26,
766
1,59
6.16
0.24
2.24
0.11
Med
ina
Cou
nty
Pub
lic T
rans
port
atio
n (H
ondo
)20
49,2
7828
8,64
631
6,99
7.43
1.10
6.43
0.17
Mex
ican
Am
eric
an U
nity
Cou
ncil
(San
Ant
onio
)1
625
3,86
112
,427
.00
3.22
19.8
80.
16M
HM
R S
ervi
ces
for
Con
cho
Val
ley
(San
Ang
elo)
68,
500
44,7
774,
815.
570.
110.
570.
19M
HM
R S
ervi
ces
of T
exom
a (D
enis
on)
7037
,277
655,
407
47,1
28.0
00.
071.
260.
06M
iddl
e R
io G
rand
e D
evel
opm
ent F
ound
atio
n (C
arriz
o S
prin
gs)
1666
,904
116,
661
93,8
00.0
30.
801.
400.
57M
idla
nd A
ssoc
for
Ret
arde
d C
itize
ns (
Mid
land
)5
32,4
8059
,030
50,1
21.0
90.
851.
540.
55M
idto
wn
Man
or, I
nc. (
Wic
hita
Fal
ls)
14,
790
4,72
617
,624
.53
3.73
3.68
1.01
Mis
sion
Roa
d D
evel
op. C
tr. (
San
Ant
onio
)7
34,4
6511
4,25
472
,841
.00
0.64
2.11
0.30
Mis
sion
San
Jos
e C
hurc
h S
r C
tr (
San
Ant
onio
)1
5,57
48,
352
4,43
0.32
0.53
0.79
0.67
Mon
ahan
s M
R S
ervi
ce o
f San
Ang
elo
Sta
te S
choo
l (M
onah
ans)
11,
079
20,8
525,
608.
020.
275.
200.
05M
onta
gue
Co.
Car
pent
ers
Sho
p (N
ocon
a)2
7,06
522
,362
16,7
37.6
60.
752.
370.
32M
onta
gue
Co.
Indi
vidu
al D
evel
opm
ent C
orp.
(B
owie
)1
1,82
94,
745
1,34
2.13
0.28
0.73
0.39
Mon
tgom
ery
Cou
nty
Com
. on
Agi
ng (
Con
roe)
1242
,769
344,
319
404,
859.
421.
189.
470.
12N
ew C
ontr
act
Mur
ray
Man
or -
200
Obl
ate
(San
Ant
onio
)1
712
3,58
61,
505.
550.
422.
110.
20N
ew C
ontr
act
Nac
ogdo
ches
Han
dica
pped
Hou
sing
(N
acog
doch
es)
14,
126
12,7
0518
,211
.63
1.43
4.41
0.32
Nac
ogdo
ches
Tre
atm
ent C
tr. (
Nac
ogdo
ches
)2
3,31
512
,338
4,64
4.63
0.38
1.40
0.27
New
Con
trac
tN
avar
ro C
o. A
ssoc
. for
Ret
arde
d C
its. (
Cor
sica
na)
517
,851
92,9
1837
,873
.50
0.41
2.12
0.19
New
Hor
izon
s R
anch
& C
ente
r, In
c. (
Gol
dthw
aite
)15
29,3
9225
9,76
073
,901
.00
0.28
2.51
0.11
New
Mile
ston
es F
ound
atio
n, In
c. (
Aus
tin)
4050
,860
370,
270
251,
922.
000.
684.
950.
14N
ew M
ount
Ple
asan
t Sen
ior
Cen
ter
(San
Ant
onio
)1
20,3
3623
,711
7,89
4.00
0.33
0.39
0.86
New
Vis
tas,
Inc.
(E
l Pas
o)7
1,67
831
,112
61,5
01.8
71.
9836
.65
0.05
Nor
thea
st T
exas
Opp
ortu
nitie
s (M
t. V
erno
n)11
34,2
1516
4,68
622
4,49
1.65
1.36
6.56
0.21
New
Con
trac
tN
otre
Dam
e of
Dal
las
Sch
ools
(Ir
ving
)8
17,0
5246
,505
34,8
03.0
00.
752.
040.
37N
utrit
ion
and
Ser
vice
s fo
r S
enio
rs (
Bea
umon
t)5
12,4
6214
2,27
333
,155
.00
0.23
2.66
0.09
Oak
Law
n C
omm
unity
Ser
vice
s (D
alla
s)4
8,86
010
4,27
421
8,10
5.10
2.09
24.6
20.
08O
chilt
ree
Cou
nty
Sr.
Cits
. Ass
oc. (
Per
ryto
n)1
192
1,05
01,
200.
001.
146.
250.
18O
ppor
tuni
ties,
Inc.
(B
orge
r)1
3,19
06,
467
3,50
5.00
0.54
1.10
0.49
Opp
ortu
nity
Wor
ksho
p, In
c. (
Mon
ahan
s)1
3,45
04,
551
9,55
6.00
2.10
2.77
0.76
TAB
LE 1
8:E
LDE
RLY
AN
D D
ISA
BLE
D T
RA
NS
PO
RTA
TIO
N P
RO
VID
ER
SS
ectio
n 53
10 R
epor
tF
isca
l Yea
r 19
98
1998
1998
1998
1998
1998
1998
1998
Ave
rage
Tota
l One
-Way
Tota
lTo
tal
Cos
tC
ost P
erP
asse
nger
s19
98N
o. o
fP
asse
nger
Veh
icle
Ope
ratin
gP
er V
ehic
leP
asse
nger
Per
Veh
icle
New
Tran
spor
tatio
n P
rovi
ders
(H
eadq
uart
ers)
Veh
icle
sTr
ips
Mile
sE
xpen
ses
Mile
Trip
Mile
Con
trac
ts

42
TAB
LE 1
8:E
LDE
RLY
AN
D D
ISA
BLE
D T
RA
NS
PO
RTA
TIO
N P
RO
VID
ER
SS
ectio
n 53
10 R
epor
tF
isca
l Yea
r 19
98
1998
1998
1998
1998
1998
1998
1998
Ave
rage
Tota
l One
-Way
Tota
lTo
tal
Cos
tC
ost P
erP
asse
nger
s19
98N
o. o
fP
asse
nger
Veh
icle
Ope
ratin
gP
er V
ehic
leP
asse
nger
Per
Veh
icle
New
Tran
spor
tatio
n P
rovi
ders
(H
eadq
uart
ers)
Veh
icle
sTr
ips
Mile
sE
xpen
ses
Mile
Trip
Mile
Con
trac
ts
Our
Lad
y of
Gua
dalu
pe N
utr.
(San
Ant
onio
)1
504
8,26
110
,455
.00
1.27
20.7
40.
06P
anol
a C
o. A
ssoc
. for
Ret
arde
d C
itize
ns (
Car
thag
e)1
3,50
816
,068
2,82
3.51
0.18
0.80
0.22
Par
aple
tics
on In
depe
nden
t Nat
ure
Trai
ls (
Poi
nt)
(Dal
las)
148
418
,509
4,54
3.42
0.25
9.39
0.03
Par
ker
Cou
nty
Com
m. o
n A
ging
(W
eath
erfo
rd)
32,
679
15,2
6518
,346
.68
1.20
6.85
0.18
Pec
os C
o. C
omm
unity
Act
ion
(For
t Sto
ckto
n)3
2,48
732
,974
8,17
7.35
0.25
3.29
0.08
New
Con
trac
tP
hoen
ix H
ouse
, Inc
. (D
alla
s)5
7,70
975
,988
36,8
61.8
50.
494.
780.
10P
ittsb
urg
Med
ical
Ctr
dba
Sun
shin
e C
ente
r (P
ittsb
urg)
27,
055
40,9
3433
,573
.23
0.82
4.76
0.17
Pla
no C
omm
unity
Hom
es, I
nc. (
Pla
no)
213
,925
14,9
3626
,692
.00
1.79
1.92
0.93
New
Con
trac
tP
leas
anto
n S
enio
r C
itize
n A
ssoc
. (P
leas
anto
n)3
1,99
311
,602
8,73
3.81
0.75
4.38
0.17
New
Con
trac
tP
resa
Com
mun
ity S
ervi
ce C
tr. (
San
Ant
onio
)6
43,7
3310
8,76
110
0,08
5.00
0.92
2.29
0.40
Qua
nah
Sen
ior
Citi
zens
Ctr.
Inc.
(Q
uana
h)2
4,62
912
,858
23,1
76.7
11.
805.
010.
36R
ainb
ow S
enio
r C
ente
r F
ound
atio
n, In
c. (
Boe
rne)
10.
000.
000.
000.
000.
000.
06R
anki
n S
enio
r C
itizn
es S
ervi
ces,
Inc.
(R
anki
n)2
2,61
911
,725
9,42
4.60
0.80
3.60
0.22
Ray
of H
ope,
Inc.
(A
ving
er)
11,
171
20,3
9010
,431
.07
0.51
8.91
0.06
Red
Riv
er C
ounc
il on
Alc
ohol
and
Dru
g A
buse
(Te
xark
ana)
15,
182
18,2
082,
549.
410.
140.
490.
28R
ehab
ilita
tion
Mis
sion
(H
oust
on)
12,
231
2,02
84,
514.
242.
232.
021.
10R
escu
e M
issi
on o
f El P
aso
(El P
aso)
22,
106
22,8
075,
407.
000.
242.
570.
09R
esid
entia
l Ind
epen
dent
Liv
ing,
Inc.
(M
esqu
ite)
28,
025
22,3
7810
,529
.56
0.47
1.31
0.36
Rio
Con
cho
Man
or (
San
Ang
elo)
338
22,
157
6,39
3.34
2.96
16.7
40.
18R
io C
onch
o W
est (
San
Ang
elo)
15,
214
7,22
19,
511.
171.
321.
820.
72R
io G
rand
e S
tate
Cen
ter
(Har
linge
n)1
2,00
35,
308
18,1
74.0
83.
429.
070.
38R
iver
side
Hea
lthca
re, I
nc.d
ba. N
orm
andy
Ter
race
(sa
n A
nton
io)
10.
0010
,977
9,60
1.68
0.26
1.92
0.13
New
Con
trac
tR
ural
Tay
lor
Co
Agi
ng S
erv
(Tye
)2
1,61
77,
080
6,60
5.48
0.93
4.09
0.23
Sab
ine
Val
leyC
ente
r (M
arsh
all)
05,
002
37,3
606,
758.
000.
181.
350.
13S
abin
e V
alle
yCen
ter
(Mar
shal
l)6
9,39
744
,592
7,60
1.00
0.17
0.81
0.21
Sac
red
Hea
rt S
enio
r C
itize
ns C
ente
r (S
an A
nton
io)
25,
710
9,75
91,
400.
000.
140.
900.
06S
alva
tion
Arm
y C
omm
unity
Sen
ior
Citi
zens
Cen
ter
(Tyl
er)
00
00.
000.
000.
000.
00N
ew C
ontr
act
Sal
vatio
n A
rmy
Will
iam
Boo
th A
pts.
(Ty
ler)
31,
548
26,4
9510
,518
.00
0.40
6.79
0.06
San
Ant
onio
AID
S F
ound
atio
n (S
an A
nton
io)
11,
334
8,34
423
,604
.00
2.83
17.6
90.
16S
an A
nton
io U
rban
Min
istr
ies
(San
Ant
onio
)4
7,11
066
,395
19,8
28.8
90.
302.
790.
11S
an J
uan
de L
os L
agos
Chu
rch
(San
Ant
onio
)1
9,08
97,
804
9,18
5.47
1.18
1.01
1.16
San
Pat
ricio
Cou
nty
Com
mun
ity A
ctio
n A
genc
y (S
into
n)2
4,53
156
,813
15,8
89.8
00.
283.
510.
08S
an P
edro
Chu
rch
of C
hris
t Nut
ritio
n C
tr (
San
Ant
onio
)1
1,47
65,
297
2,82
8.66
0.53
1.92
0.28
Sea
rs M
emor
ial M
etho
dist
Ctr.
(A
bile
ne)
27,
949
49,1
4739
,982
.00
0.81
5.03
0.16
Sen
ior
Citi
zen
Pro
ject
of C
ham
bers
Cou
nty
(Ana
huac
)1
2,89
322
,812
22,9
30.8
21.
017.
930.
13S
enio
r C
itize
ns A
ctiv
ities
, Inc
. (Te
mpl
e)0
7411
839
1.94
3.32
5.30
0.63

43
TAB
LE 1
8:E
LDE
RLY
AN
D D
ISA
BLE
D T
RA
NS
PO
RTA
TIO
N P
RO
VID
ER
SS
ectio
n 53
10 R
epor
tF
isca
l Yea
r 19
98
1998
1998
1998
1998
1998
1998
1998
Ave
rage
Tota
l One
-Way
Tota
lTo
tal
Cos
tC
ost P
erP
asse
nger
s19
98N
o. o
fP
asse
nger
Veh
icle
Ope
ratin
gP
er V
ehic
leP
asse
nger
Per
Veh
icle
New
Tran
spor
tatio
n P
rovi
ders
(H
eadq
uart
ers)
Veh
icle
sTr
ips
Mile
sE
xpen
ses
Mile
Trip
Mile
Con
trac
ts
Sen
ior
Citi
zens
Act
ivity
Ctr.
Bur
kbur
nett
(Bur
kbur
nett)
13,
380
5,72
611
,909
.38
2.08
3.52
0.59
Sen
ior
Citi
zens
Clu
b of
Pet
rolia
, Inc
. (P
etro
lia)
166
31,
912
805.
140.
421.
210.
35S
enio
r C
itize
ns o
f Buf
falo
Gap
(B
uffa
lo G
ap)
11,
108
2,04
520
0.50
0.10
0.18
0.54
Sen
ior
Citi
zens
Ser
vice
s (T
exar
kana
)4
8,20
944
,486
59,5
47.4
91.
347.
250.
18S
enio
r C
itize
ns S
ervi
ces
of N
. Tx.
(W
ichi
ta F
alls
)5
3,42
428
,592
14,1
47.0
90.
494.
130.
12S
enio
r N
utrit
ion
Act
iviti
es P
rogr
am (
SN
AP
) S
wee
twat
er)
11,
971
4,05
82,
017.
420.
501.
020.
49S
equo
ia, I
nc. (
Dal
las)
34,
707
25,6
4413
,815
.00
0.54
2.93
0.18
Ser
enity
Fou
ndat
ion
of T
exas
121
41,
234
2,03
1.24
1.65
9.49
0.17
Ser
vice
Ctr.
Old
er A
mer
ican
s (C
rock
ett)
21,
068
10,5
095,
195.
640.
494.
860.
10S
even
Acr
es J
ewis
h G
eria
tric
Cen
ter
(Hou
ston
)3
12,0
5816
,416
52,3
96.7
93.
194.
350.
73S
herm
an C
ount
y O
lder
Tex
ans
(Str
atfo
rd)
11,
033
4,38
216
,603
.87
3.79
16.0
70.
24S
mith
Cou
nty
Sen
ior
Cit
Tran
spor
t Inc
. (Ty
ler)
2166
,340
341,
225
336,
944.
320.
995.
080.
19N
ew C
ontr
act
Som
erse
t Sen
ior
Citi
zens
Cen
ter,
Inc.
(S
omer
set)
18,
323
20,9
9620
,479
.89
0.98
2.46
0.40
Sou
th P
lain
s A
IDS
Res
ourc
e C
ente
r (L
ubbo
ck)
12,
240
19,1
9311
,431
.93
0.60
5.10
0.12
Sou
th P
lain
s C
omm
unity
Act
ion
Ass
ocia
tion,
Inc.
(Le
vella
nd)
211
,354
54,5
5116
,676
.87
0.31
1.47
0.21
Sou
th P
lain
s F
ood
Ban
k, In
c. (
Lubb
ock)
12,
013
22,6
3710
,980
.85
0.49
5.45
0.09
Sou
ther
n H
ealth
care
Sys
tem
s, In
c. (
Yoa
kum
)1
1,29
54,
966
8,00
7.00
1.61
6.18
0.00
Sou
thvi
ew N
ursi
ng C
ente
r (T
yler
)1
732
4,52
92,
498.
500.
553.
410.
16S
outh
wes
t AID
S C
omm
ittee
(E
l Pas
o)1
2,28
918
,754
26,3
72.4
41.
4111
.52
0.12
Sou
thw
est K
ey P
rogr
am, I
nc. (
Bro
wns
ville
)4
79,1
3843
,024
108,
152.
002.
511.
371.
84S
peci
al H
ealth
Res
ourc
es o
f Eas
t Tex
as (
Long
view
)2
2,23
230
,732
19,0
19.1
10.
628.
520.
07S
t. A
gnes
Chu
rch
Sen
ior
Cen
ter
(San
Ant
onio
)1
13,7
2713
,290
12,4
41.8
30.
940.
911.
03S
t. A
lpho
nsus
Chu
rch
Nut
ritio
n P
rogr
am (
San
Ant
onio
)1
5,60
86,
940
17,6
32.2
42.
543.
140.
81S
t. A
ntho
ny S
enio
r C
ente
r (E
lmen
dorf
)1
27,8
7025
,912
7,80
8.60
0.30
0.28
1.08
New
Con
trac
tS
t. D
omin
ic D
ioce
san
Cen
ter
(Hou
ston
)1
170
304
466.
311.
532.
740.
56S
t. G
rego
ry th
e G
reat
Par
rish(
San
Ant
onio
)1
00
168.
000.
000.
000.
00N
ew C
ontr
act
St.
John
’s E
pisc
opal
Ret
irem
ent C
orpo
ratio
n (O
dess
a)1
1,11
86,
623
6,28
9.21
0.95
5.63
0.17
St.
Jude
Cat
holic
Chu
rch
Nut
ri C
tr. (
San
Ant
onio
)1
2,74
911
,724
5,29
5.00
0.45
1.93
0.23
St.
Mat
thew
’s N
utrit
ion
Sen
ior
Cen
ter
(San
Ant
onio
)1
7,16
914
,978
25,2
17.2
11.
683.
520.
48S
t. Ti
mot
hy’s
Cat
holic
Chu
rch
(San
Ant
onio
)1
5,30
013
,694
18,5
74.5
81.
363.
500.
39Ta
rran
t Cou
nty/
Am
er. R
ed C
ross
(F
t. W
orth
)26
30,2
4349
3,67
892
3,54
1.46
1.87
30.5
40.
06Te
jas
Hom
e fo
r Yo
uth
(Hou
ston
)4
5,84
213
,050
14,6
23.8
21.
122.
500.
45Te
rrel
l Cou
nty
Sen
ior
Citi
zens
Tra
nsp
Pro
gram
(S
ande
rson
)1
2,89
97,
600
3,94
9.77
0.52
1.36
0.38
Texa
rkan
a S
helte
red
Wor
ksho
p (T
exar
kana
)10
45,8
0658
,533
28,8
34.9
10.
490.
630.
78Te
xark
ana
Spe
cial
Edu
catio
n C
ente
r, In
c. (
Texa
rkan
a)18
68,9
0531
3,29
730
2,52
3.11
0.97
4.39
0.22
New
Con
trac
tTe
xas
Elk
s F
ound
. Han
dica
pped
Chi
ld. (
Lulin
g)2
2,75
752
,195
18,2
09.5
00.
356.
600.
05

44
TAB
LE 1
8:E
LDE
RLY
AN
D D
ISA
BLE
D T
RA
NS
PO
RTA
TIO
N P
RO
VID
ER
SS
ectio
n 53
10 R
epor
tF
isca
l Yea
r 19
98
1998
1998
1998
1998
1998
1998
1998
Ave
rage
Tota
l One
-Way
Tota
lTo
tal
Cos
tC
ost P
erP
asse
nger
s19
98N
o. o
fP
asse
nger
Veh
icle
Ope
ratin
gP
er V
ehic
leP
asse
nger
Per
Veh
icle
New
Tran
spor
tatio
n P
rovi
ders
(H
eadq
uart
ers)
Veh
icle
sTr
ips
Mile
sE
xpen
ses
Mile
Trip
Mile
Con
trac
ts
The
Frie
ndly
Doo
r, In
c. (
Iow
a P
ark)
14,
582
7,15
312
,109
.00
1.69
2.64
0.64
Tho
mas
on H
ealth
Ser
v F
ound
atio
n (E
l Pas
o)5
7,96
589
,697
120,
396.
001.
3415
.12
0.09
New
Con
trac
tTo
wn
of V
an H
orn(
El P
aso)
124
77,
389
3,97
1.54
0.54
16.0
80.
03N
ew C
ontr
act
Tria
ngle
AID
S N
etw
ork
(Bea
umon
t)1
3,24
627
,908
34,7
52.2
41.
2510
.71
0.12
Trin
ity C
o. S
r. C
itize
ns, I
nc. (
Gro
veto
n)1
763,
253
1,48
0.50
0.46
19.4
80.
02Tr
inity
Lut
hera
n H
ome
(Rou
nd R
ock)
021
040
11,
270.
513.
176.
050.
52Tr
inity
Lut
hera
n H
ome
(Shi
ner)
12,
467
8,09
59,
235.
041.
143.
740.
30Tr
inity
Pla
ce, I
nc. (
Rou
nd R
ock)
11,
555
1,94
97,
954.
004.
085.
120.
80Tr
inity
Ter
race
Ret
irem
ent C
ente
r (F
ort W
orth
)5
9,38
529
,515
57,7
66.0
01.
966.
160.
32U
nite
d C
ereb
ral P
alsy
/Cap
itol A
rea
(Aus
tin)
11,
593
6,26
02,
025.
250.
321.
270.
25N
ew C
ontr
act
Var
iety
Clu
b C
are-
Van
Sys
tem
(D
alla
s)26
53,9
7723
1,45
625
7,14
5.85
1.11
4.76
0.23
Vic
toria
Cou
nty
Sen
ior
Citi
zens
Ass
oc, I
nc. (
Vic
toria
)7
25,2
7712
1,91
611
2,47
0.54
0.92
4.45
0.21
W F
MH
MR
Wor
k A
ct C
tr M
elio
r B
ridge
(W
ichi
ta F
alls
)1
4,29
14,
116
6,56
9.06
1.60
1.53
1.04
Wal
ker
Cou
nty
Sen
ior
Cen
ter
(Hun
tsvi
lle)
44,
995
64,6
6924
,353
.11
0.38
4.88
0.08
War
d C
ount
y G
rand
falls
Sen
ior
Citi
zens
(G
rand
falls
)1
1,35
514
,292
14,6
28.3
11.
0210
.80
0.09
War
d C
ount
y S
enio
r C
itize
ns C
ente
r (M
onah
ans)
12,
308
3,39
45,
697.
991.
682.
470.
68W
arm
Spr
ings
Reh
ab H
osp
(Gon
zale
s)2
1,36
828
,557
15,5
18.1
70.
5411
.34
0.05
Wel
lingt
on S
helt.
Wor
ksho
p, In
c. (
Wel
lingt
on)
051
575
758
3.64
0.77
1.13
0.68
Wes
ley
Com
mun
ity C
ente
r of
San
Ant
onio
(S
an A
nton
io)
14,
010
4,92
712
,060
.00
2.45
3.01
0.81
Wes
t Tex
as C
hris
tian
Fou
nd. (
San
Ang
elo)
15,
593
8,57
814
,302
.00
1.67
2.56
0.65
Wic
hita
Co.
Cha
pter
/Am
. Red
Cro
ss (
Wic
hita
Fal
ls)
138
53,
435
3,83
4.30
1.12
9.96
0.11
Wis
e C
ount
y C
omm
ittee
on
Agi
ng (
Dec
atur
)2
1,37
826
,144
17,4
93.0
00.
6712
.69
0.05
Woo
dsid
e T
rails
Wild
erne
ss E
xper
ienc
e In
c (S
mith
ville
)4
10,6
8255
,628
15,3
60.3
60.
281.
440.
19N
ew C
ontr
act
YM
CA
of M
etro
. For
t Wor
th (
For
t Wor
th)
1372
,110
197,
035
373,
366.
001.
895.
180.
37N
ew C
ontr
act
Youn
g C
ount
y S
enio
r C
itize
ns A
ssoc
. (G
raha
m)
16,
425
12,8
2026
,901
.65
2.10
4.19
0.50
Youn
g C
ount
y S
enio
r C
ub C
ente
r (O
lney
)1
2,12
013
,548
8,87
8.28
0.66
4.19
0.16
Yout
h an
d F
amily
Enr
ichm
ent C
tr. In
c. (
Tyle
r)5
4,25
013
1,20
644
,117
.74
0.34
10.3
80.
03Y
WC
A o
f Met
ropo
litan
Dal
las
(Dal
las)
22,
171
5,77
818
,103
.00
3.13
8.34
0.38
YW
CA
OF
San
Ant
onio
& B
exar
Cou
nty
(San
Ant
onio
)1
959
1,58
51,
480.
100.
931.
540.
61N
ew C
ontr
act
Zap
ta C
ount
y (Z
apat
a)2
4,36
824
,838
23,8
25.7
90.
965.
450.
18N
ew C
ontr
act
Tota
l for
Fis
cal Y
ear
1998
1,33
53,
958,
561
18,7
67,8
04$1
5,93
7,82
9.27
Ave
rage
for
319
Sys
tem
s4.
1812
,409
58,8
33$4
9,96
1.85
$0.8
5$4
.03
0.21

45
TAB
LE 1
8:E
LDE
RLY
AN
D D
ISA
BLE
D T
RA
NS
PO
RTA
TIO
N P
RO
VID
ER
SS
ectio
n 53
10 R
epor
tF
isca
l Yea
r 19
99
1999
1999
1999
1999
1999
1999
1999
Ave
rage
Tota
l One
-Way
Tota
lTo
tal
Cos
tC
ost P
erP
asse
nger
s19
99N
o. o
fP
asse
nger
Veh
icle
Ope
ratin
gP
er V
ehic
leP
asse
nger
Per
Veh
icle
New
Tran
spor
tatio
n P
rovi
ders
(H
eadq
uart
ers)
Veh
icle
sTr
ips
Mile
sE
xpen
ses
Mile
Trip
Mile
Con
trac
ts
100
D.I.
D. M
emor
Nur
s &
Reh
ab C
tr (
Dum
as)
238
35,
661
709.
960.
131.
850.
07A
bile
ne A
dult
Day
Car
e (A
bile
ne)
26,
141
28,2
5832
,996
.19
1.17
5.37
0.22
Abi
lene
Goo
dwill
Indu
strie
s (A
bile
ne)
22,
034
25,9
219,
323.
500.
364.
580.
08A
ctio
nS, I
nc. o
f Bra
zoria
Cou
nty
(Ang
leto
n)6
15,8
5080
,674
79,7
24.3
20.
995.
030.
20A
dovo
cacy
Out
reac
h(E
lgin
)0
961
13,9
152,
214.
500.
162.
300.
07N
ew C
ontr
act
Adu
lt D
ay A
ctiv
ity &
Hea
lth C
ente
r (L
ubbo
ck)
433
,677
63,0
7983
,703
.00
1.33
2.49
0.53
Adu
lt D
ay C
are
of S
an A
ngel
o (S
an A
ngel
o)3
11,6
1136
,127
44,0
98.0
61.
223.
800.
32N
ew C
ontr
act
Affe
ctio
nate
Arm
s A
dult
Day
Hea
lth C
are
Cen
ter
(Vic
toria
)3
8,16
819
,658
9,11
0.00
0.46
1.12
0.42
AID
S R
esou
rces
of R
ural
Tex
as (
Wea
ther
ford
)4
3,47
445
,306
16,7
03.0
20.
374.
810.
08A
ir F
orce
Vill
age
Fou
ndat
ion,
Inc.
(S
an A
nton
io)
515
,251
53,7
8861
,381
.15
1.14
4.02
0.28
Air
For
ce V
illag
e II,
Inc.
(S
an A
nton
io)
418
,816
57,4
1361
,313
.60
1.07
3.26
0.33
Ala
med
a H
eigh
ts O
utre
ach
Fou
ndat
ion
Ctr.
(D
alla
s)2
9,97
919
,959
34,6
00.0
01.
733.
470.
50A
lam
o H
earin
g Im
paire
d S
r C
itize
ns In
c (S
an A
nton
io)
178
492
656.
421.
338.
420.
16A
lcoh
olic
Reh
abili
tatio
n C
ente
r (S
an A
nton
io)
15,
022
25,6
3014
,998
.00
0.59
2.99
0.20
Aliv
iane
NO
-AD
, Inc
. (IR
WC
RC
) (E
l Pas
o)5
16,6
8110
5,29
510
7,73
5.91
1.02
6.46
0.16
Alp
ha T
au O
meg
a S
r. O
pp. S
vcs.
(S
an A
nton
io)
26,
449
57,6
2178
,968
.46
1.37
12.2
50.
11N
ew C
ontr
act
Am
arill
o M
ulti.
Ctr.
for
the
Agi
ng (
Am
arill
o)20
73,0
2030
1,82
41,
494,
024.
004.
9520
.46
0.24
New
Con
trac
tA
mer
ican
Ass
oc. R
etire
d P
erso
ns (
Bro
wnw
ood)
23,
231
16,3
909,
876.
600.
603.
060.
20A
mer
ican
Leg
ion
of T
usco
la (
Tye)
172
1,44
637
5.31
0.26
0.00
0.05
Am
eric
an R
ed C
ross
HIV
/AID
S G
tr H
ou A
rea
Chp
t (H
oust
on)
4193
,474
1,15
3,49
181
5,89
3.04
0.71
8.73
0.08
New
Con
trac
tA
mer
ican
Rel
igio
us T
own
Hal
l Mee
ting,
Inc.
(Ir
ving
)11
39,8
4816
6,12
516
5,86
8.00
1.00
4.16
0.24
Am
igos
Del
Val
le, I
nc. (
Mis
sion
)24
113,
802
218,
926
254,
782.
001.
162.
240.
52A
nder
son
Cou
nty
Com
mun
ity C
ounc
il, In
c. (
Pal
estin
e)1
3,82
921
,594
11,2
38.0
00.
522.
930.
18N
ew C
ontr
act
And
erso
n C
ount
y S
helte
red
Wor
ksho
p (P
ales
tine)
23,
239
11,4
898,
782.
030.
762.
710.
28A
ndre
ws
Cen
tral
Sm
ith C
ount
y (T
yler
)6
27,6
4085
,775
46,3
13.0
00.
541.
680.
32A
ndre
ws
Sen
ior
Cen
ter
(And
rew
s)2
1,60
710
,965
8,36
7.00
0.76
5.21
0.15
Arc
her
Nei
ghbo
rhoo
d A
ctio
n G
roup
, Inc
. (A
rche
r C
ity)
11,
841
4,62
77,
301.
851.
583.
970.
40A
ustin
Rec
over
y C
ente
r (A
ustin
)8
24,1
4065
,371
24,8
77.0
00.
381.
030.
37A
ustin
Sta
te S
choo
l (A
ustin
)33
68,6
9717
1,74
745
,820
.00
0.27
0.67
0.40
Aus
tin T
ravi
s C
o. M
HM
R C
ente
r (A
ustin
)38
43,9
2733
1,74
224
3,42
7.00
0.73
5.54
0.13
Azl
eway
Boy
s R
anch
(Ty
ler)
23,
677
68,5
9324
,751
.00
0.36
6.73
0.05
Bal
mor
hea
Sr
Citi
zens
Ctr
of R
eeve
s C
o (B
alm
orhe
a)1
2,99
17,
575
8,85
7.00
1.17
2.96
0.39
Bap
tist M
emor
ial G
eria
tric
Cen
ter
(San
Ang
elo)
217
,120
40,5
7360
,186
.00
1.48
3.52
0.42
Bas
trop
Co
Em
erge
ncy
Foo
d P
antr
y &
Sup
port
Ctr
Inc
(Bas
trop
)1
926
5,23
34,
096.
540.
784.
420.
18B
eaum
ont A
ssoc
. for
Sr.
Cits
. (B
eaum
ont)
836
,800
167,
076
190,
492.
001.
145.
180.
22N
ew C
ontr
act
Bea
umon
t Pro
duct
s an
d S
ervi
ces,
Inc.
(B
eaum
ont)
55,
694
59,8
4710
6,82
0.43
1.78
18.7
60.
10

46
TAB
LE 1
8:E
LDE
RLY
AN
D D
ISA
BLE
D T
RA
NS
PO
RTA
TIO
N P
RO
VID
ER
SS
ectio
n 53
10 R
epor
tF
isca
l Yea
r 19
99
1999
1999
1999
1999
1999
1999
1999
Ave
rage
Tota
l One
-Way
Tota
lTo
tal
Cos
tC
ost P
erP
asse
nger
s19
99N
o. o
fP
asse
nger
Veh
icle
Ope
ratin
gP
er V
ehic
leP
asse
nger
Per
Veh
icle
New
Tran
spor
tatio
n P
rovi
ders
(H
eadq
uart
ers)
Veh
icle
sTr
ips
Mile
sE
xpen
ses
Mile
Trip
Mile
Con
trac
ts
Bet
hel U
nite
d M
etho
dist
Chu
rch
(San
Ant
onio
)1
5,21
111
,599
9,17
6.00
0.79
1.76
0.45
Bet
hpha
ge M
issi
on S
outh
(S
an A
ngel
o)9
32,1
1510
7,78
051
,435
.00
0.48
1.60
0.30
Bet
hpha
ge M
issi
on S
outh
at L
ubbo
ck (
Lubb
ock)
28,
704
23,1
392,
614.
050.
110.
300.
38B
ienv
ivir
Sen
ior
Hea
lth S
ervi
ces
(El P
aso)
1262
,541
174,
974
521,
234.
002.
988.
330.
36N
ew C
ontr
act
Big
Ben
d C
omm
unity
Act
ion
Com
ittee
, Inc
. (M
arfa
)5
2,13
681
,784
35,3
07.0
00.
4316
.53
0.03
Big
Spr
ing
Rot
ary
Clu
b (B
ig S
prin
g)1
2,68
79,
167
8,43
2.32
0.92
3.14
0.29
Biv
ins
Mem
oria
l Nur
sing
Hom
e (A
mar
illo)
135
02,
119
7,74
9.69
3.66
22.1
40.
17B
less
ed S
acra
men
t Chu
rch
Sen
ior
Cen
ter
(San
Ant
onio
)1
3,64
41,
412
1,70
0.00
1.20
0.47
2.58
Boo
ker
Boo
ster
Clu
b, In
c. d
ba T
win
Oak
es (
Am
arill
o)1
755,
281
1,60
2.04
0.30
21.3
60.
01B
orde
r Are
a N
utrit
ion
Cen
ter
(Lar
edo)
694
,384
83,3
5282
,593
.49
0.99
0.88
1.13
Bow
ie S
enio
r C
itize
ns P
roje
ct, I
nc. (
Bow
ie)
24,
078
27,6
0512
,403
.51
0.45
3.04
0.15
Bre
nham
Sta
te S
choo
l (B
renh
am)
4511
8,96
025
1,19
510
4,82
6.00
0.42
0.88
0.47
Bro
wn
Co.
Ass
oc. R
etar
ded
Cits
. (B
row
nwoo
d)2
6,31
89,
346
19,9
89.8
02.
143.
160.
68N
ew C
ontr
act
Buk
ner
Vill
as (
Aus
tin)
140
371
460
8.17
0.85
1.51
0.56
Bur
ke F
ound
atio
n (A
ustin
)2
8,98
037
,560
10,9
67.6
90.
291.
220.
24B
urne
t Co
MH
MR
Adv
isor
y B
oard
(M
arbl
e F
alls
)1
10,5
9627
,060
6,16
9.99
0.23
0.58
0.39
C.C
. You
ng M
emor
ial H
ome
(Dal
las)
11,
388
5,18
39,
902.
361.
917.
130.
27C
alho
un C
ount
y S
enio
r C
its. A
ssoc
. (P
ort L
avac
a)3
9,42
955
,780
50,2
44.0
00.
905.
330.
17C
alla
han
Cou
nty
Nut
ritio
n P
roje
ct (
Bai
rd)
16,
360
3,44
41,
111.
100.
320.
171.
85C
amp
Co.
Dev
elop
. Dis
able
d A
ssoc
. (P
ittsb
urg)
39,
219
34,3
2014
,610
.71
0.43
1.58
0.27
New
Con
trac
tC
amp
Sum
mit,
Inc.
(D
alla
s)1
641,
755
3,37
6.00
1.92
52.7
50.
04C
anyo
n La
ke A
ctio
n C
ente
r (C
anyo
n La
ke)
21,
487
5,18
24,
742.
010.
923.
190.
29C
anyo
ns R
etire
men
t Com
mun
ity (
Am
arill
o)1
6,95
214
,144
21,2
78.8
31.
503.
060.
49C
apita
l Are
a R
ehab
. Ctr.
(A
ustin
)14
7,36
184
,488
167,
915.
951.
9922
.81
0.09
Cap
rock
Com
mun
ity A
ctui
b A
ssoc
iatio
n In
c. (
Cro
sbyt
on)
16,
776
43,1
3034
,811
.06
0.81
5.14
0.16
Cen
ter
for
the
Ret
arde
d, In
c. (
Hou
ston
)2
2,83
023
,736
7,09
4.27
0.30
2.51
0.12
Cen
tral
Gul
f C
omm
unity
MH
MR
(H
oust
on)
9711
5,13
21,
449,
735
219,
926.
840.
151.
910.
08C
entr
al T
exas
Sen
ior
Min
istr
y (W
aco)
1023
,948
217,
788
142,
482.
000.
655.
950.
11N
ew C
ontr
act
Cen
tro
de S
alud
Fam
iliar
La
Fe,
Inc.
(E
l Pas
o)1
228
1,94
52,
809.
891.
4412
.32
0.12
Che
roke
e C
ount
y M
R A
ssoc
iatio
n (R
usk)
947
,074
151,
223
88,6
10.6
60.
591.
880.
31C
hild
ress
Prid
e db
a H
elen
Far
abee
MH
MR
(C
hild
ress
)1
2,48
63,
342
6,10
9.72
1.83
2.46
0.74
Chi
llico
the
Trav
eler
s, In
c. (
Chi
llico
the)
12,
229
6,59
32,
350.
830.
361.
050.
34C
hris
t the
Kin
g C
hurc
h S
r. C
itize
ns C
tr. (
San
Ant
onio
)1
12,6
417,
375
25,4
39.9
83.
452.
011.
71C
hris
tian
Car
e C
ente
rs (
Lake
woo
d V
illag
e)1
640
4,07
92,
738.
320.
674.
280.
16C
hris
tian
Car
e C
ente
rs, I
nc. (
Mes
quite
)4
27,0
2874
,835
24,7
67.2
70.
330.
920.
36C
hris
tian
Sen
ior
Ser
vice
s (S
an A
nton
io)
11,
038
1,71
65,
413.
323.
155.
220.
60

47
TAB
LE 1
8:E
LDE
RLY
AN
D D
ISA
BLE
D T
RA
NS
PO
RTA
TIO
N P
RO
VID
ER
SS
ectio
n 53
10 R
epor
tF
isca
l Yea
r 19
99
1999
1999
1999
1999
1999
1999
1999
Ave
rage
Tota
l One
-Way
Tota
lTo
tal
Cos
tC
ost P
erP
asse
nger
s19
99N
o. o
fP
asse
nger
Veh
icle
Ope
ratin
gP
er V
ehic
leP
asse
nger
Per
Veh
icle
New
Tran
spor
tatio
n P
rovi
ders
(H
eadq
uart
ers)
Veh
icle
sTr
ips
Mile
sE
xpen
ses
Mile
Trip
Mile
Con
trac
ts
City
of B
alch
Spr
ings
(B
alch
Spr
ings
)1
2,04
43,
116
4,74
5.00
1.52
2.32
0.66
New
Con
trac
tC
ity o
f Ban
gs (
Bro
wn
Co.
)1
1,34
53,
546
1,31
3.25
0.37
0.98
0.38
City
of B
urle
son/
Sen
ior A
ctiv
ity (
Bur
leso
n)1
1,02
13,
794
3,32
5.36
0.88
3.26
0.27
New
Con
trac
tC
ity o
f Gra
nd P
rairi
e (G
rand
Pra
irie)
36,
421
19,5
0079
,549
.18
4.08
12.3
90.
33C
ity o
f Lan
cast
er S
enio
r C
itize
n’s
Pro
gram
(Dal
las)
17,
687
13,8
1815
,060
.82
1.09
1.96
0.56
City
of P
ortla
nd (
Por
tland
)1
568
6,44
24,
406.
000.
687.
760.
09C
ity o
f San
Ant
onio
Hou
sing
Aut
horit
y E
&D
Pro
g (S
an A
nton
io)
11,
249
7,61
819
,599
.00
2.57
15.6
90.
16C
ity o
f San
Ant
onio
Sup
port
Ser
v. fo
r E
lder
ly (
San
Ant
onio
)20
32,3
1835
4,54
137
6,59
8.00
1.06
11.6
50.
09N
ew C
ontr
act
Cla
y C
ount
y S
enio
r C
itize
ns, I
nc. (
Hen
eritt
a)1
505
10,0
136,
101.
240.
6112
.08
0.05
Clif
f Hav
en A
dult
Hea
lth C
are
(Dal
las)
17,
554
26,6
0045
,120
.00
1.70
5.97
0.28
Coc
hran
Cou
nty
Sr
Citi
zens
Ass
oc. I
nc. (
Mor
ton)
12,
239
10,5
9611
,663
.11
1.10
5.21
0.21
Com
bine
d C
omm
unity
Act
ion
(Sm
ithvi
lle)
212
,892
57,3
0146
,378
.16
0.81
3.60
0.22
New
Con
trac
tC
omm
unity
Act
ion
Cor
p. o
f Wic
hita
Fal
ls (
Wic
hita
Fal
ls)
39,
187
91,9
4193
,145
.45
1.01
10.1
40.
10C
omm
unity
Act
ion
Cor
pora
tion
of S
outh
Tex
as (
Alic
e)4
7,28
36,
714
22,4
47.7
43.
343.
081.
08C
omm
unity
Act
ion
Cou
ncil
of S
outh
Tex
as (
Rio
Gra
nde
City
)1
1,82
230
,215
4,00
3.46
0.13
2.20
0.06
Com
mun
ity A
ctio
n N
acog
doch
es, I
nc. (
Nac
ogdo
ches
)1
282
2,23
64,
033.
961.
8014
.30
0.13
Com
mun
ity A
ctio
n P
rogr
am, I
nc. (
Abi
lene
)2
1,55
622
,061
3,47
6.41
0.16
2.23
0.07
Com
mun
ity a
nd S
enio
r S
ervi
ces
of M
idla
nd, I
nc. (
Mid
land
)1
7,42
011
,904
19,8
31.0
01.
672.
670.
62C
omm
unity
Cou
ncil
of S
C T
exas
Inc
Agi
ng P
rog
(Seg
uin)
1423
,996
335,
303
296,
969.
970.
8912
.38
0.07
Com
mun
ity C
ounc
il of
Sou
thw
est T
exas
, Inc
. (U
vald
e)4
37,3
1514
4,29
170
,496
.51
0.49
1.89
0.26
Com
mun
ity H
omes
for A
dults
, Inc
. (D
alla
s)2
3,96
118
,399
11,5
06.0
00.
632.
900.
22C
once
rned
Citi
zens
of J
ack
Co.
(Ja
cksb
oro)
28,
610
22,5
0440
,171
.90
1.79
4.67
0.38
Cor
ners
tone
Ret
irem
ent C
omm
unity
(Te
xark
ana)
21,
954
18,4
2725
,065
.91
1.36
12.8
30.
11C
ounc
il O
aks
Voc
atio
nal E
nhan
cem
ent S
ervi
ces
(San
Ant
onio
)1
632
28,0
483,
235.
100.
125.
120.
02C
ount
y R
ehab
ilita
tion
Cen
ter,
Inc.
(Ty
ler)
336
,956
102,
732
36,5
46.4
90.
360.
990.
36C
ozby
- G
erm
any
Hos
pita
l (G
rand
Sal
ine)
21,
108
29,7
255,
964.
000.
205.
380.
04C
rane
Cou
nty
Sen
ior
Citi
zens
(C
rane
)1
5,61
34,
259
12,4
96.0
02.
932.
231.
32C
rock
ett R
esou
rce
Cen
ter
for
Inde
pend
ent L
ivin
g (C
rock
ett)
00
00.
000.
000.
000.
00D
an D
anci
ger
Jew
ish
Com
mun
ity C
tr (
For
t Wor
th)
13,
731
5,28
28,
689.
541.
652.
330.
71D
awso
n C
o. S
r. C
its. C
ente
r (L
ames
a)3
3,69
119
,291
18,6
62.0
00.
975.
060.
19D
iete
rt C
laim
Sen
ior
Citi
zens
Cen
ter,
Inc.
(K
errv
ille)
823
,307
142,
259
123,
067.
360.
875.
280.
16D
ora
Rob
erts
Reh
abili
tatio
n C
ente
r (B
ig S
prin
g)1
1,73
07,
349
1,40
7.08
0.19
0.81
0.24
Dub
lin S
enio
r C
itize
ns, I
nc. (
Dub
lin)
12,
677
5,09
913
,783
.00
2.70
5.15
0.53
Eas
t Sab
ine
Sen
ior
Ser
vice
s (H
emph
ill)
30
31,3
951,
934.
720.
060.
000.
00E
ast T
exas
AID
S P
roje
ct (
Nac
ogdo
ches
)1
1,27
024
,438
66,7
30.0
92.
7352
.54
0.05
Eas
t Tex
as O
pen
Doo
r, In
c. (
Mar
shal
l)4
28,9
7727
,500
27,0
88.9
80.
990.
931.
05
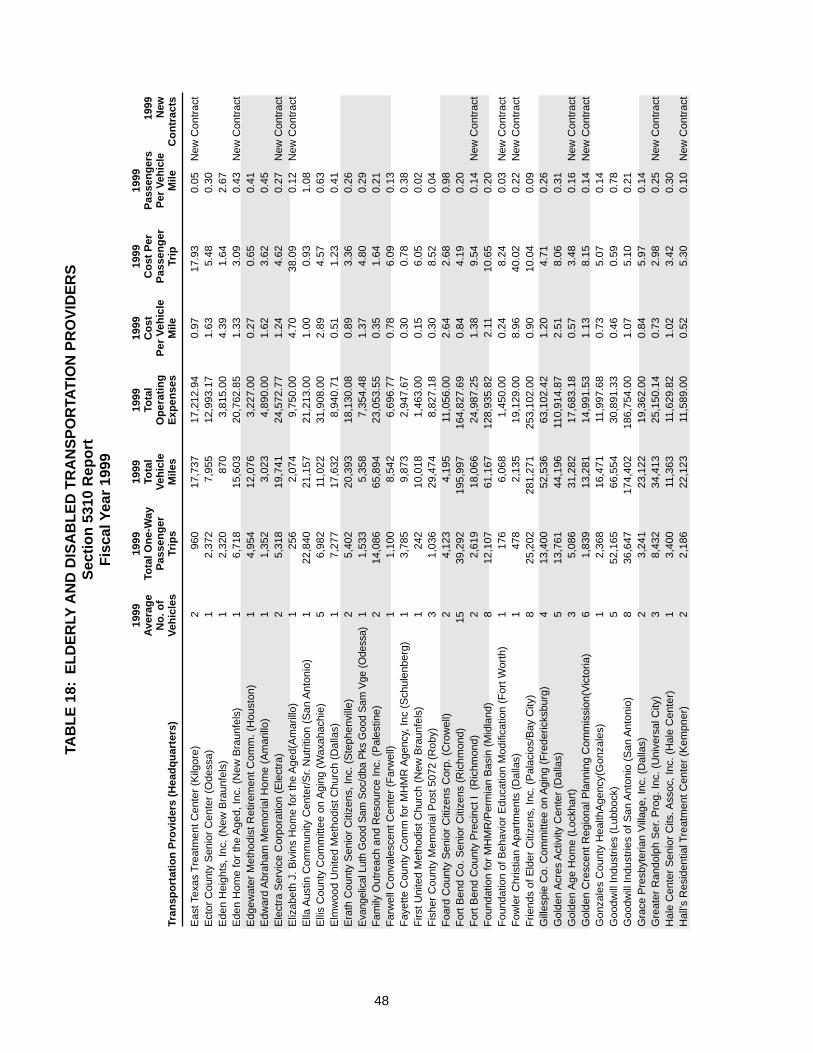
48
TAB
LE 1
8:E
LDE
RLY
AN
D D
ISA
BLE
D T
RA
NS
PO
RTA
TIO
N P
RO
VID
ER
SS
ectio
n 53
10 R
epor
tF
isca
l Yea
r 19
99
1999
1999
1999
1999
1999
1999
1999
Ave
rage
Tota
l One
-Way
Tota
lTo
tal
Cos
tC
ost P
erP
asse
nger
s19
99N
o. o
fP
asse
nger
Veh
icle
Ope
ratin
gP
er V
ehic
leP
asse
nger
Per
Veh
icle
New
Tran
spor
tatio
n P
rovi
ders
(H
eadq
uart
ers)
Veh
icle
sTr
ips
Mile
sE
xpen
ses
Mile
Trip
Mile
Con
trac
ts
Eas
t Tex
as T
reat
men
t Cen
ter
(Kilg
ore)
296
017
,737
17,2
12.9
40.
9717
.93
0.05
New
Con
trac
tE
ctor
Cou
nty
Sen
ior
Cen
ter
(Ode
ssa)
12,
372
7,95
512
,993
.17
1.63
5.48
0.30
Ede
n H
eigh
ts, I
nc. (
New
Bra
unfe
ls)
12,
320
870
3,81
5.00
4.39
1.64
2.67
Ede
n H
ome
for
the
Age
d, In
c. (
New
Bra
unfe
ls)
16,
718
15,6
0320
,762
.85
1.33
3.09
0.43
New
Con
trac
tE
dgew
ater
Met
hodi
st R
etire
men
t Com
m. (
Hou
ston
)1
4,95
412
,076
3,22
7.00
0.27
0.65
0.41
Edw
ard
Abr
aham
Mem
oria
l Hom
e (A
mar
illo)
11,
352
3,02
34,
890.
001.
623.
620.
45E
lect
ra S
ervi
ce C
orpo
ratio
n (E
lect
ra)
25,
318
19,7
4124
,572
.77
1.24
4.62
0.27
New
Con
trac
tE
lizab
eth
J. B
ivin
s H
ome
for
the
Age
d(A
mar
illo)
125
62,
074
9,75
0.00
4.70
38.0
90.
12N
ew C
ontr
act
Ella
Aus
tin C
omm
unity
Cen
ter/
Sr.
Nut
ritio
n (S
an A
nton
io)
122
,840
21,1
5721
,213
.00
1.00
0.93
1.08
Elli
s C
ount
y C
omm
ittee
on
Agi
ng (
Wax
ahac
hie)
56,
982
11,0
2231
,908
.00
2.89
4.57
0.63
Elm
woo
d U
nite
d M
etho
dist
Chu
rch
(Dal
las)
17,
277
17,6
328,
940.
710.
511.
230.
41E
rath
Cou
nty
Sen
ior
Citi
zens
, Inc
. (S
teph
envi
lle)
25,
402
20,3
9318
,130
.08
0.89
3.36
0.26
Eva
ngel
ical
Lut
h G
ood
Sam
Soc
/dba
Pks
Goo
d S
am V
ge (O
dess
a)1
1,53
35,
358
7,35
4.48
1.37
4.80
0.29
Fam
ily O
utre
ach
and
Res
ourc
e In
c. (
Pal
estin
e)2
14,0
8665
,894
23,0
53.5
50.
351.
640.
21F
arw
ell C
onva
lesc
ent C
ente
r (F
arw
ell)
11,
100
8,54
26,
696.
770.
786.
090.
13F
ayet
te C
ount
y C
omm
for
MH
MR
Age
ncy,
Inc
(Sch
ulen
berg
)1
3,78
59,
873
2,94
7.67
0.30
0.78
0.38
Firs
t Uni
ted
Met
hodi
st C
hurc
h (N
ew B
raun
fels
)1
242
10,0
181,
463.
000.
156.
050.
02F
ishe
r C
ount
y M
emor
ial P
ost 5
072
(Rob
y)3
1,03
629
,474
8,82
7.18
0.30
8.52
0.04
Foa
rd C
ount
y S
enio
r C
itize
ns C
orp.
(C
row
ell)
24,
123
4,19
511
,056
.00
2.64
2.68
0.98
For
t Ben
d C
o. S
enio
r C
itize
ns (
Ric
hmon
d)15
39,2
9219
5,99
716
4,82
7.69
0.84
4.19
0.20
For
t Ben
d C
ount
y P
reci
nct I
(R
ichm
ond)
22,
619
18,0
6624
,987
.25
1.38
9.54
0.14
New
Con
trac
tF
ound
atio
n fo
r M
HM
R/P
erm
ian
Bas
in (
Mid
land
)8
12,1
0761
,167
128,
935.
822.
1110
.65
0.20
Fou
ndat
ion
of B
ehav
ior
Edu
catio
n M
odifi
catio
n (F
ort W
orth
)1
176
6,06
81,
450.
000.
248.
240.
03N
ew C
ontr
act
Fow
ler
Chr
istia
n A
part
men
ts (
Dal
las)
147
82,
135
19,1
29.0
08.
9640
.02
0.22
New
Con
trac
tF
riend
s of
Eld
er C
itize
ns, I
nc. (
Pal
acio
s/B
ay C
ity)
825
,202
281,
271
253,
102.
000.
9010
.04
0.09
Gill
espi
e C
o. C
omm
ittee
on
Agi
ng (
Fre
deric
ksbu
rg)
413
,400
52,5
3663
,102
.42
1.20
4.71
0.26
Gol
den
Acr
es A
ctiv
ity C
ente
r (D
alla
s)5
13,7
6144
,196
110,
914.
872.
518.
060.
31G
olde
n A
ge H
ome
(Loc
khar
t)3
5,08
631
,282
17,6
83.1
80.
573.
480.
16N
ew C
ontr
act
Gol
den
Cre
scen
t Reg
iona
l Pla
nnin
g C
omm
issi
on(V
icto
ria)
61,
839
13,2
8114
,991
.53
1.13
8.15
0.14
New
Con
trac
tG
onza
les
Cou
nty
Hea
lthA
genc
y(G
onza
les)
12,
368
16,4
7111
,997
.68
0.73
5.07
0.14
Goo
dwill
Indu
strie
s (L
ubbo
ck)
552
,165
66,5
5430
,891
.33
0.46
0.59
0.78
Goo
dwill
Indu
strie
s of
San
Ant
onio
(S
an A
nton
io)
836
,647
174,
402
186,
754.
001.
075.
100.
21G
race
Pre
sbyt
eria
n V
illag
e, In
c. (
Dal
las)
23,
241
23,1
2219
,362
.00
0.84
5.97
0.14
Gre
ater
Ran
dolp
h S
er. P
rog.
Inc.
(U
nive
rsal
City
)3
8,43
234
,413
25,1
50.1
40.
732.
980.
25N
ew C
ontr
act
Hal
e C
ente
r S
enio
r C
its. A
ssoc
, Inc
. (H
ale
Cen
ter)
13,
400
11,3
6311
,629
.82
1.02
3.42
0.30
Hal
l’s R
esid
entia
l Tre
atm
ent C
ente
r (K
empn
er)
22,
186
22,1
2311
,589
.00
0.52
5.30
0.10
New
Con
trac
t

49
TAB
LE 1
8:E
LDE
RLY
AN
D D
ISA
BLE
D T
RA
NS
PO
RTA
TIO
N P
RO
VID
ER
SS
ectio
n 53
10 R
epor
tF
isca
l Yea
r 19
99
1999
1999
1999
1999
1999
1999
1999
Ave
rage
Tota
l One
-Way
Tota
lTo
tal
Cos
tC
ost P
erP
asse
nger
s19
99N
o. o
fP
asse
nger
Veh
icle
Ope
ratin
gP
er V
ehic
leP
asse
nger
Per
Veh
icle
New
Tran
spor
tatio
n P
rovi
ders
(H
eadq
uart
ers)
Veh
icle
sTr
ips
Mile
sE
xpen
ses
Mile
Trip
Mile
Con
trac
ts
Han
sfor
d M
anor
Nur
sing
Hom
e (S
pear
man
)1
497
13,8
318,
636.
310.
6217
.38
0.04
Har
land
ale
Sen
ior
Cen
ter
(San
Ant
onio
)1
13,1
5610
,299
11,6
15.1
41.
130.
881.
28H
aske
ll C
o. E
xper
ienc
ed C
itize
n C
ente
r (H
aske
ll)1
150
331
103.
000.
310.
690.
45N
ew C
ontr
act
Hay
s C
ount
y V
eter
ans
Adm
inis
trat
ion
(Aus
tin)
21,
676
31,6
5918
,088
.85
0.57
10.7
90.
05H
ealth
, Inc
. (S
an A
nton
io)
25,
144
11,8
4027
,963
.02
2.36
5.44
0.43
HIA
LCO
-OIC
, Hou
sing
Ass
ista
nce,
Inc.
(C
orpu
s C
hris
ti)1
564,
344
1,15
4.00
0.27
20.6
10.
01H
ill C
ount
ry M
HM
R C
omm
unity
Ser
vice
s (D
el R
io)
23,
941
27,1
9313
,792
.00
0.51
3.50
0.14
Hill
top
Hav
en (
Gun
ter)
21,
469
24,0
7231
,133
.03
1.29
21.1
90.
06H
ockl
ey C
ount
y S
r. C
its. A
ssoc
. (Le
vella
nd)
48,
944
29,4
5948
,632
.43
1.65
5.44
0.30
Hol
y F
amily
Sen
ior
Cen
ter
(San
Ant
onio
)1
9,26
111
,855
16,1
98.4
81.
371.
750.
78H
oly
Ros
ary
Sen
ior
Cen
ter
(San
Ant
onio
)1
9,31
87,
911
8,06
5.07
1.02
0.87
1.18
Hoo
d C
ount
y C
omm
ittee
on
Agi
ng (
Gra
nbur
y)8
4,12
578
,712
32,6
36.0
00.
417.
910.
05H
ousi
ng A
utho
rity
of th
e C
ity o
f Cen
ter
(Cen
ter)
159
141
425.
003.
017.
200.
42N
ew C
ontr
act
Inde
pend
ence
Squ
are,
Inc.
(S
an A
nton
io)
18,
536
13,4
6810
,193
.95
0.76
1.19
0.63
Indo
chin
ese
Cul
ture
Cen
ter
(Hou
ston
)2
10,2
5826
,340
59,2
73.9
02.
255.
780.
39In
man
Chr
istia
n C
ente
r (S
an A
nton
io)
41,
497
16,6
1819
,070
.81
1.15
12.7
40.
09N
ew C
ontr
act
Inst
itute
of C
ogni
tive
Dev
elop
Inc
(San
Ang
elo)
213
,735
25,1
7934
,829
.00
1.38
2.54
0.55
Jam
es L
. Wes
t Pre
sby.
Spe
c C
are
Ctr
(F
t. W
orth
)3
3,16
73,
281
8,98
0.62
2.74
2.84
0.97
Jew
ish
Com
mun
ity C
tr/H
oust
on (
Hou
ston
)4
28,5
4461
,868
47,6
33.0
00.
771.
670.
46Je
wis
h F
eder
atio
n of
El P
aso
(El P
aso)
31,
864
14,2
3720
,757
.71
1.46
11.1
40.
13Ji
m H
ogg
Cou
nty
Tra
nsp.
Pro
gram
(H
ebbr
onvi
lle)
12,
546
9,41
210
,541
.24
1.12
4.14
0.27
Jone
s C
ount
y A
ging
Ser
vice
s P
rogr
am (
Ans
on)
22,
596
22,1
0517
,184
.78
0.78
6.62
0.12
Juni
or H
elpi
ng H
and
for
Chi
ldre
n (A
ustin
)1
387
2,51
397
5.00
0.39
2.52
0.15
Ken
mar
Opp
ortu
nity
Cen
ter,
Inc.
(La
Gra
nge)
11,
031
31,3
849,
092.
240.
298.
820.
03K
ing’
s M
anor
Met
hodi
st H
ome,
Inc.
(H
eref
ord)
21,
044
38,9
893,
153.
120.
083.
020.
03K
iwan
is C
lub
of C
olor
ado
City
(C
olor
ado
City
)1
213
2,40
82,
230.
240.
9310
.47
0.09
Kiw
anis
Gol
den
K (
Sny
der)
13,
679
4,79
57,
353.
291.
532.
000.
77K
lebe
rg C
ount
y H
uman
Ser
vice
s (
Kin
gsvi
lle)
31,
566
7,74
910
,684
.62
1.38
6.82
0.20
New
Con
trac
tL.
U.L
.A.C
. Pro
ject
Am
ista
d (E
l Pas
o)8
20,3
9826
6,37
935
8,90
8.00
1.35
17.6
00.
08La
mar
Cou
nty
Hum
an R
esou
rces
Cou
ncil
(Par
is)
1748
,416
436,
242
286,
480.
230.
665.
920.
11N
ew C
ontr
act
Land
Man
or, I
nc. (
Bea
umon
t)2
54,3
7831
,853
18,7
14.4
10.
590.
341.
71Li
bert
y C
ount
y P
roje
ct o
n A
ging
(Li
bert
y)11
9,60
816
0,44
217
4,34
2.59
1.09
18.1
50.
06N
ew C
ontr
act
Lubb
ock
Fai
th C
ente
r, In
c. (
Lubb
ock)
14,
449
40,0
588,
518.
550.
211.
910.
11Lu
bboc
k In
depe
nden
t Sch
ool D
istr
ict (
Lubb
ock)
11,
226
11,3
9545
7.85
0.04
0.37
0.11
New
Con
trac
tLu
bboc
k R
egio
nal M
HM
R C
ente
r (L
ubbo
ck)
36,
154
27,4
8621
,491
.74
0.78
3.49
0.22
Lufk
in W
orks
hop
& O
pp. C
tr. (
Lufk
in)
13,
960
16,0
008,
000.
000.
502.
020.
25
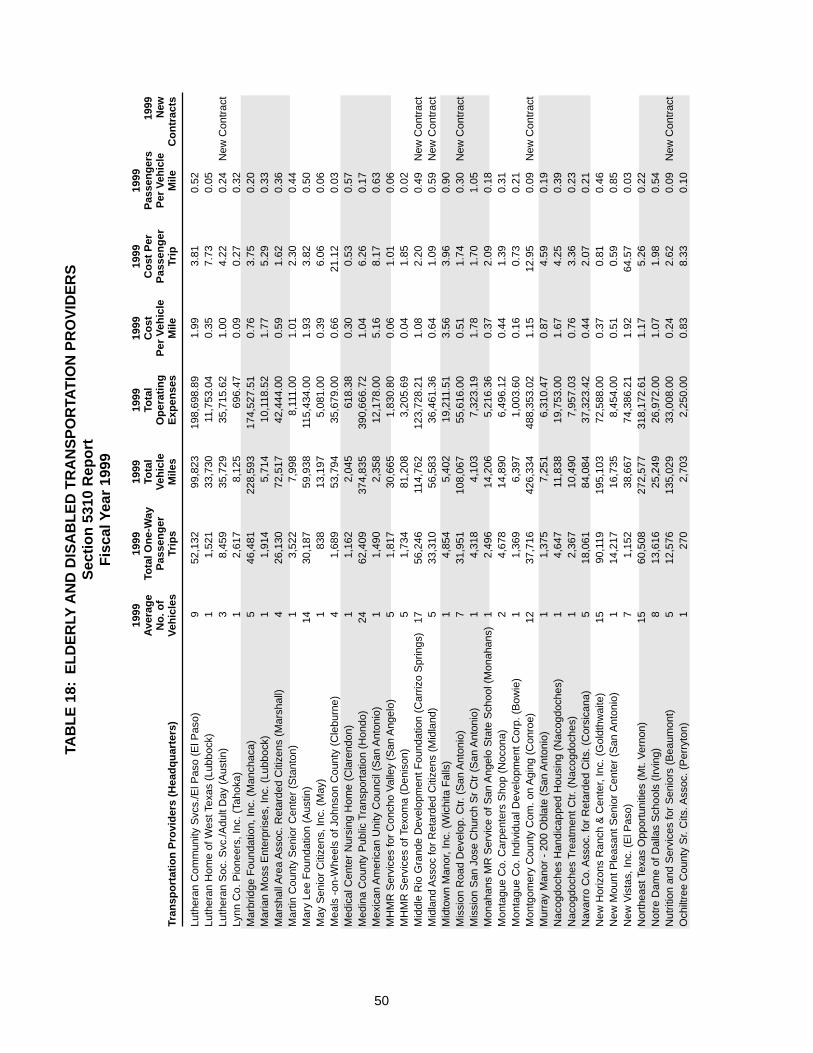
50
TAB
LE 1
8:E
LDE
RLY
AN
D D
ISA
BLE
D T
RA
NS
PO
RTA
TIO
N P
RO
VID
ER
SS
ectio
n 53
10 R
epor
tF
isca
l Yea
r 19
99
1999
1999
1999
1999
1999
1999
1999
Ave
rage
Tota
l One
-Way
Tota
lTo
tal
Cos
tC
ost P
erP
asse
nger
s19
99N
o. o
fP
asse
nger
Veh
icle
Ope
ratin
gP
er V
ehic
leP
asse
nger
Per
Veh
icle
New
Tran
spor
tatio
n P
rovi
ders
(H
eadq
uart
ers)
Veh
icle
sTr
ips
Mile
sE
xpen
ses
Mile
Trip
Mile
Con
trac
ts
Luth
eran
Com
mun
ity S
vcs.
/El P
aso
(El P
aso)
952
,132
99,8
2319
8,69
8.89
1.99
3.81
0.52
Luth
eran
Hom
e of
Wes
t Tex
as (
Lubb
ock)
11,
521
33,7
3011
,753
.04
0.35
7.73
0.05
Luth
eran
Soc
. Svc
./Adu
lt D
ay (
Aus
tin)
38,
459
35,7
2935
,715
.62
1.00
4.22
0.24
New
Con
trac
tLy
nn C
o. P
ione
ers,
Inc.
(Ta
hoka
)1
2,61
78,
125
696.
470.
090.
270.
32M
arbr
idge
Fou
ndat
ion,
Inc.
(M
anch
aca)
546
,481
228,
593
174,
527.
510.
763.
750.
20M
aria
n M
oss
Ent
erpr
ises
, Inc
. (Lu
bboc
k)1
1,91
45,
714
10,1
18.5
21.
775.
290.
33M
arsh
all A
rea
Ass
oc. R
etar
ded
Citi
zens
(M
arsh
all)
426
,130
72,5
1742
,444
.00
0.59
1.62
0.36
Mar
tin C
ount
y S
enio
r C
ente
r (S
tant
on)
13,
522
7,99
88,
111.
001.
012.
300.
44M
ary
Lee
Fou
ndat
ion
(Aus
tin)
1430
,187
59,9
3811
5,43
4.00
1.93
3.82
0.50
May
Sen
ior
Citi
zens
, Inc
. (M
ay)
183
813
,197
5,08
1.00
0.39
6.06
0.06
Mea
ls -
on-W
heel
s of
Joh
nson
Cou
nty
(Cle
burn
e)4
1,68
953
,794
35,6
79.0
00.
6621
.12
0.03
Med
ical
Cen
ter
Nur
sing
Hom
e (C
lare
ndon
)1
1,16
22,
045
618.
380.
300.
530.
57M
edin
a C
ount
y P
ublic
Tra
nspo
rtat
ion
(Hon
do)
2462
,409
374,
835
390,
666.
721.
046.
260.
17M
exic
an A
mer
ican
Uni
ty C
ounc
il (S
an A
nton
io)
11,
490
2,35
812
,178
.00
5.16
8.17
0.63
MH
MR
Ser
vice
s fo
r C
onch
o V
alle
y (S
an A
ngel
o)5
1,81
730
,665
1,83
0.80
0.06
1.01
0.06
MH
MR
Ser
vice
s of
Tex
oma
(Den
ison
)5
1,73
481
,208
3,20
5.69
0.04
1.85
0.02
Mid
dle
Rio
Gra
nde
Dev
elop
men
t Fou
ndat
ion
(Car
rizo
Spr
ings
)17
56,2
4611
4,76
212
3,72
8.21
1.08
2.20
0.49
New
Con
trac
tM
idla
nd A
ssoc
for
Ret
arde
d C
itize
ns (
Mid
land
)5
33,3
1056
,583
36,4
61.3
60.
641.
090.
59N
ew C
ontr
act
Mid
tow
n M
anor
, Inc
. (W
ichi
ta F
alls
)1
4,85
45,
402
19,2
11.5
13.
563.
960.
90M
issi
on R
oad
Dev
elop
. Ctr.
(S
an A
nton
io)
731
,951
108,
067
55,6
16.0
00.
511.
740.
30N
ew C
ontr
act
Mis
sion
San
Jos
e C
hurc
h S
r C
tr (
San
Ant
onio
)1
4,31
84,
103
7,32
3.19
1.78
1.70
1.05
Mon
ahan
s M
R S
ervi
ce o
f San
Ang
elo
Sta
te S
choo
l (M
onah
ans)
12,
496
14,2
065,
216.
360.
372.
090.
18M
onta
gue
Co.
Car
pent
ers
Sho
p (N
ocon
a)2
4,67
814
,890
6,49
6.12
0.44
1.39
0.31
Mon
tagu
e C
o. In
divi
dual
Dev
elop
men
t Cor
p. (
Bow
ie)
11,
369
6,39
71,
003.
600.
160.
730.
21M
ontg
omer
y C
ount
y C
om. o
n A
ging
(C
onro
e)12
37,7
1642
6,33
448
8,35
3.02
1.15
12.9
50.
09N
ew C
ontr
act
Mur
ray
Man
or -
200
Obl
ate
(San
Ant
onio
)1
1,37
57,
251
6,31
0.47
0.87
4.59
0.19
Nac
ogdo
ches
Han
dica
pped
Hou
sing
(N
acog
doch
es)
14,
647
11,8
3819
,753
.00
1.67
4.25
0.39
Nac
ogdo
ches
Tre
atm
ent C
tr. (
Nac
ogdo
ches
)1
2,36
710
,490
7,95
7.03
0.76
3.36
0.23
Nav
arro
Co.
Ass
oc. f
or R
etar
ded
Cits
. (C
orsi
cana
)5
18,0
6184
,084
37,3
23.4
20.
442.
070.
21N
ew H
oriz
ons
Ran
ch &
Cen
ter,
Inc.
(G
oldt
hwai
te)
1590
,119
195,
103
72,5
88.0
00.
370.
810.
46N
ew M
ount
Ple
asan
t Sen
ior
Cen
ter
(San
Ant
onio
)1
14,2
1716
,735
8,45
4.00
0.51
0.59
0.85
New
Vis
tas,
Inc.
(E
l Pas
o)7
1,15
238
,667
74,3
86.2
11.
9264
.57
0.03
Nor
thea
st T
exas
Opp
ortu
nitie
s (M
t. V
erno
n)15
60,5
0827
2,57
731
8,17
2.61
1.17
5.26
0.22
Not
re D
ame
of D
alla
s S
choo
ls (
Irvi
ng)
813
,616
25,2
4926
,972
.00
1.07
1.98
0.54
Nut
ritio
n an
d S
ervi
ces
for
Sen
iors
(B
eaum
ont)
512
,576
135,
029
33,0
08.0
00.
242.
620.
09N
ew C
ontr
act
Och
iltre
e C
ount
y S
r. C
its. A
ssoc
. (P
erry
ton)
127
02,
703
2,25
0.00
0.83
8.33
0.10

51
TAB
LE 1
8:E
LDE
RLY
AN
D D
ISA
BLE
D T
RA
NS
PO
RTA
TIO
N P
RO
VID
ER
SS
ectio
n 53
10 R
epor
tF
isca
l Yea
r 19
99
1999
1999
1999
1999
1999
1999
1999
Ave
rage
Tota
l One
-Way
Tota
lTo
tal
Cos
tC
ost P
erP
asse
nger
s19
99N
o. o
fP
asse
nger
Veh
icle
Ope
ratin
gP
er V
ehic
leP
asse
nger
Per
Veh
icle
New
Tran
spor
tatio
n P
rovi
ders
(H
eadq
uart
ers)
Veh
icle
sTr
ips
Mile
sE
xpen
ses
Mile
Trip
Mile
Con
trac
ts
Opp
ortu
nitie
s, In
c. (
Bor
ger)
13,
070
5,24
23,
420.
000.
651.
110.
59O
ppor
tuni
ty W
orks
hop,
Inc.
(M
onah
ans)
23,
399
15,6
5323
,478
.00
1.50
6.91
0.22
New
Con
trac
tO
ur L
ady
of G
uada
lupe
Nut
r. (S
an A
nton
io)
149
68,
891
10,5
66.4
01.
1921
.30
0.06
Pan
ola
Co.
Ass
oc. f
or R
etar
ded
Citi
zens
(C
arth
age)
12,
654
14,6
643,
303.
940.
231.
240.
18P
arap
letic
s on
Inde
pend
ent N
atur
e Tr
ails
(P
oint
) (D
alla
s)1
437
12,2
986,
060.
000.
4913
.87
0.04
Pec
os C
o. C
omm
unity
Act
ion
(For
t Sto
ckto
n)4
3,50
739
,093
7,37
1.49
0.19
2.10
0.09
New
Con
trac
tP
hoen
ix H
ouse
, Inc
.dba
Life
net (
Dal
las)
55,
445
33,3
6723
,459
.50
0.70
4.31
0.16
Pitt
sbur
g M
edic
al C
tr d
ba S
unsh
ine
Cen
ter
(Pitt
sbur
g)3
1,76
329
,055
10,4
35.4
60.
365.
920.
06N
ew C
ontr
act
Pla
no C
omm
unity
Hom
es S
pons
or (
Pla
no)
156
73,
393
1,82
2.95
0.54
3.22
0.17
New
Con
trac
tP
lano
Com
mun
ity H
omes
, Inc
. (P
lano
)2
11,5
5114
,854
25,7
64.0
01.
732.
230.
78P
leas
anto
n S
enio
r C
itize
n A
ssoc
. (P
leas
anto
n)3
1,33
98,
260
10,5
63.7
91.
287.
890.
16P
resa
Com
mun
ity S
ervi
ce C
tr. (
San
Ant
onio
)5
28,0
3287
,332
87,6
29.3
11.
003.
130.
32N
ew C
ontr
act
Qua
nah
Sen
ior
Citi
zens
Ctr.
Inc.
(Q
uana
h)1
5,86
812
,824
23,7
51.6
61.
854.
050.
46R
anki
n S
enio
r C
itizn
es S
ervi
ces,
Inc.
(R
anki
n)2
2,34
011
,885
6,91
4.00
0.58
2.95
0.20
Red
Riv
er C
ounc
il on
Alc
ohol
and
Dru
g A
buse
(Te
xark
ana)
192
85,
425
1,10
7.59
0.20
1.19
0.17
Reh
abili
tatio
n M
issi
on (
Hou
ston
)1
3,25
57,
699
6,09
7.82
0.79
1.87
0.42
Res
cue
Mis
sion
of E
l Pas
o (E
l Pas
o)2
2,38
816
,350
6,36
7.00
0.39
2.67
0.15
Res
iden
tial I
ndep
ende
nt L
ivin
g, In
c. (
Mes
quite
)1
3,67
112
,430
5,12
5.17
0.41
1.40
0.30
Rio
Con
cho
Eas
t (S
an A
ngel
o)1
2,69
91,
273
3,82
7.91
3.01
1.42
2.12
Rio
Con
cho
Man
or (
San
Ang
elo)
10
01,
307.
250.
000.
000.
00R
io C
onch
o W
est (
San
Ang
elo)
15,
027
7,21
98,
573.
671.
191.
710.
70R
io G
rand
e S
tate
Cen
ter
(Har
linge
n)1
4,32
76,
805
1,45
2.87
0.21
0.34
0.64
Riv
ersi
de H
ealth
care
, Inc
.dba
. Nor
man
dy T
erra
ce (
San
Ant
onio
)2
0.00
31,8
779,
775.
442.
299.
450.
24R
ural
Eco
nom
ic A
ssis
tanc
e Le
ague
, Inc
. (A
lice)
26,
266
33,2
434,
400.
900.
130.
700.
14N
ew C
ontr
act
Rur
al T
aylo
r C
o A
ging
Ser
v (T
ye)
21,
034
4,26
81,
595.
920.
371.
540.
24N
ew C
ontr
act
Sab
ine
Val
leyC
ente
r (M
arsh
all)
08,
361
60,7
1515
,351
.00
0.25
1.84
0.14
Sab
ine
Val
leyC
ente
r (M
arsh
all)
1116
,331
90,6
6417
,319
.00
0.19
1.06
0.18
Sac
red
Hea
rt S
enio
r C
itize
ns C
ente
r (S
an A
nton
io)
16,
599
10,3
781,
754.
000.
170.
420.
10S
alva
tion
Arm
y C
omm
unity
Sen
ior
Citi
zens
Cen
ter
(Tyl
er)
11,
815
8,81
62,
819.
000.
321.
550.
21N
ew C
ontr
act
Sal
vatio
n A
rmy
Will
iam
Boo
th A
pts.
(Ty
ler)
34,
209
40,9
1416
,886
.00
0.41
4.01
0.10
San
Ant
onio
AID
S F
ound
atio
n (S
an A
nton
io)
11,
836
8,84
825
,676
.34
2.90
13.9
80.
21S
an A
nton
io U
rban
Min
istr
ies
(San
Ant
onio
)4
5,27
766
,639
18,8
60.0
00.
283.
570.
08S
an J
uan
de L
os L
agos
Chu
rch
(San
Ant
onio
)2
8,27
28,
162
7,36
1.00
0.90
0.89
1.01
New
Con
trac
tS
an P
atric
io C
ount
y C
omm
unity
Act
ion
Age
ncy
(Sin
ton)
13,
374
12,7
849,
092.
000.
712.
690.
26S
an P
edro
Chu
rch
of C
hris
t Nut
ritio
n C
tr (
San
Ant
onio
)1
1,17
34,
508
6,11
0.00
1.36
5.21
0.26
Sea
rs M
emor
ial M
etho
dist
Ctr.
(A
bile
ne)
28,
987
50,2
1843
,347
.00
0.86
4.82
0.18
New
Con
trac
t

52
TAB
LE 1
8:E
LDE
RLY
AN
D D
ISA
BLE
D T
RA
NS
PO
RTA
TIO
N P
RO
VID
ER
SS
ectio
n 53
10 R
epor
tF
isca
l Yea
r 19
99
1999
1999
1999
1999
1999
1999
1999
Ave
rage
Tota
l One
-Way
Tota
lTo
tal
Cos
tC
ost P
erP
asse
nger
s19
99N
o. o
fP
asse
nger
Veh
icle
Ope
ratin
gP
er V
ehic
leP
asse
nger
Per
Veh
icle
New
Tran
spor
tatio
n P
rovi
ders
(H
eadq
uart
ers)
Veh
icle
sTr
ips
Mile
sE
xpen
ses
Mile
Trip
Mile
Con
trac
ts
Sen
ior
Citi
zen
Pro
ject
of C
ham
bers
Cou
nty
(Ana
huac
)1
2,24
520
,114
18,5
21.1
30.
928.
250.
11S
enio
r C
itize
ns A
ctiv
ity C
tr. B
urkb
urne
tt (B
urkb
urne
tt)1
3,33
25,
113
10,4
60.4
42.
053.
140.
65S
enio
r C
itize
ns o
f Buf
falo
Gap
(B
uffa
lo G
ap)
11,
733
2,35
622
1.00
0.09
0.13
0.74
Sen
ior
Citi
zens
Ser
vice
s (T
exar
kana
)4
8,48
444
,816
52,6
93.8
91.
186.
210.
19N
ew C
ontr
act
Sen
ior
Citi
zens
Ser
vice
s of
N. T
x. (
Wic
hita
Fal
ls)
43,
300
20,7
138,
116.
160.
392.
460.
16S
enio
r N
utrit
ion
Act
iviti
es P
rogr
am (
SN
AP
) S
wee
twat
er)
11,
606
3,74
61,
830.
770.
491.
140.
43S
equo
ia, I
nc. (
Dal
las)
31,
653
18,1
3831
,702
.83
1.75
19.1
80.
09S
eren
ity F
ound
atio
n of
Tex
as1
2,77
67,
255
3,51
2.07
0.48
1.27
0.38
Ser
vice
Ctr.
Old
er A
mer
ican
s (C
rock
ett)
252
87,
392
8,16
7.44
1.10
15.4
70.
07S
even
Acr
es J
ewis
h G
eria
tric
Cen
ter
(Hou
ston
)3
5,98
228
,248
47,4
21.2
61.
687.
930.
21S
hack
elfo
rd C
ount
y C
omm
unity
Res
ourc
e C
ente
r (A
lban
y)1
9374
939
3.45
0.53
4.23
0.12
New
Con
trac
tS
hady
Oak
Nur
sing
Cen
ter
(Mou
lpon
)1
553,
740
654.
080.
1711
.89
0.01
New
Con
trac
tS
herm
an C
ount
y O
lder
Tex
ans
(Str
atfo
rd)
166
44,
188
11,1
25.0
02.
6616
.75
0.16
Sm
ith C
ount
y S
enio
r C
it T
rans
port
Inc.
dba.
Min
ibus
(Ty
ler)
1844
,174
243,
641
342,
676.
511.
417.
760.
18N
ew C
ontr
act
Som
erse
t Sen
ior
Citi
zens
Cen
ter,
Inc.
(S
omer
set)
18,
258
22,0
2719
,851
.14
0.90
2.40
0.37
Sou
th P
lain
s A
IDS
Res
ourc
e C
ente
r (L
ubbo
ck)
12,
040
17,9
5812
,064
.40
0.67
5.91
0.11
Sou
th P
lain
s C
omm
unity
Act
ion
Ass
ocia
tion,
Inc.
(Le
vella
nd)
33,
139
41,8
0250
,386
.30
1.21
16.0
50.
08N
ew C
ontr
act
Sou
th P
lain
s F
ood
Ban
k, In
c. (
Lubb
ock)
12,
397
23,3
639,
525.
680.
413.
970.
10S
outh
ern
Hea
lthca
re S
yste
ms,
Inc.
(Yo
akum
)1
1,06
97,
572
6,03
0.41
0.80
5.64
0.14
Sou
thvi
ew N
ursi
ng C
ente
r (T
yler
)1
1,13
88,
066
3,94
9.12
0.49
3.47
0.14
Sou
thw
est A
IDS
Com
mitt
ee (
El P
aso)
151
74,
250
6,81
9.00
1.60
13.1
90.
12S
outh
wes
t Key
Pro
gram
, Inc
. (B
row
nsvi
lle)
386
,460
54,8
9110
6,04
5.00
1.93
1.23
1.58
New
Con
trac
tS
peci
al H
ealth
Res
ourc
es o
f Eas
t Tex
as (
Long
view
)2
2,18
140
,405
22,9
59.8
80.
5710
.53
0.05
St.
Agn
es C
hurc
h S
enio
r C
ente
r (S
an A
nton
io)
113
,438
17,9
5015
,352
.31
0.86
1.14
0.75
St.
Alp
hons
us C
hurc
h N
utrit
ion
Pro
gram
(S
an A
nton
io)
15,
665
5,91
418
,820
.00
3.18
3.32
0.96
St.
Ant
hony
Sen
ior
Cen
ter
(Elm
endo
rf)
125
,571
25,1
827,
418.
390.
290.
291.
02N
ew C
ontr
act
St.
Gre
gory
the
Gre
atP
arris
h(S
an A
nton
io)
191
45,
409
1,17
1.09
0.22
1.28
0.17
New
Con
trac
tS
t. Jo
hn’s
Epi
scop
al R
etire
men
t Cor
pora
tion
(Ode
ssa)
11,
130
4,31
54,
978.
041.
154.
410.
26S
t. Ju
de C
atho
lic C
hurc
h N
utri
Ctr.
(S
an A
nton
io)
11,
952
3,14
95,
848.
831.
863.
000.
62S
t. M
atth
ew’s
Nut
ritio
n S
enio
r C
ente
r (S
an A
nton
io)
15,
763
23,8
9725
,322
.81
1.06
4.39
0.24
St.
Tim
othy
’s C
atho
lic C
hurc
h (S
an A
nton
io)
16,
432
12,0
7512
,903
.68
1.07
2.01
0.53
Ste
rling
Cou
nty
(Ste
rling
Cou
nty)
112
240
31.0
00.
132.
580.
05N
ew C
ontr
act
Tarr
ant C
ount
y/A
mer
. Red
Cro
ss (
Ft.
Wor
th)
2735
,370
531,
108
947,
950.
651.
7826
.80
0.07
Teja
s H
ome
for
Yout
h (H
oust
on)
415
,063
33,3
6921
,126
.64
0.63
1.40
0.45
Terr
ell C
ount
y S
enio
r C
itize
ns T
rans
p P
rogr
am (
San
ders
on)
12,
992
7,16
75,
729.
970.
801.
920.
42Te
xark
ana
She
ltere
d W
orks
hop
(Tex
arka
na)
1034
,550
63,2
0022
,187
.66
0.35
0.64
0.55

TAB
LE 1
8:E
LDE
RLY
AN
D D
ISA
BLE
D T
RA
NS
PO
RTA
TIO
N P
RO
VID
ER
SS
ectio
n 53
10 R
epor
tF
isca
l Yea
r 19
99
1999
1999
1999
1999
1999
1999
1999
Ave
rage
Tota
l One
-Way
Tota
lTo
tal
Cos
tC
ost P
erP
asse
nger
s19
99N
o. o
fP
asse
nger
Veh
icle
Ope
ratin
gP
er V
ehic
leP
asse
nger
Per
Veh
icle
New
Tran
spor
tatio
n P
rovi
ders
(H
eadq
uart
ers)
Veh
icle
sTr
ips
Mile
sE
xpen
ses
Mile
Trip
Mile
Con
trac
ts
Texa
rkan
a S
peci
al E
duca
tion
Cen
ter,
Inc.
(Te
xark
ana)
2593
,176
445,
370
418,
482.
530.
944.
490.
21N
ew C
ontr
act
The
Frie
ndly
Doo
r, In
c. (
Iow
a P
ark)
14,
246
9,68
27,
548.
000.
781.
780.
44T
hom
ason
Hea
lth S
erv
Fou
ndat
ion
(El P
aso)
58,
173
98,8
0614
4,68
2.00
1.46
17.7
00.
08N
ew C
ontr
act
Tow
n of
Van
Hor
n (E
l Pas
o)1
907
29,6
6311
,287
.48
0.38
12.4
40.
03T
riang
le A
IDS
Net
wor
k (B
eaum
ont)
159
34,
893
10,6
27.3
82.
1717
.92
0.12
Trin
ity C
o. S
r. C
itize
ns, I
nc. (
Gro
veto
n)1
873,
593
1,00
8.00
0.28
11.5
90.
02T
rinity
Lut
hera
n H
ome
(Shi
ner)
13,
828
8,28
99,
781.
601.
182.
560.
46T
rinity
Pla
ce, I
nc. (
Rou
nd R
ock)
169
41,
164
8,10
8.00
6.97
11.6
80.
60T
rinity
Ter
race
Ret
irem
ent C
ente
r (F
ort W
orth
)5
9,83
631
,711
53,5
19.0
01.
695.
440.
31U
nite
d C
ereb
ral P
alsy
/Cap
itol A
rea
(Aus
tin)
17,
593
2,09
91,
462.
000.
700.
193.
62V
arie
ty C
lub
Car
e-V
an S
yste
m (
Dal
las)
2549
,194
228,
377
217,
856.
400.
954.
430.
22N
ew C
ontr
act
Vic
toria
Cou
nty
Sen
ior
Citi
zens
Ass
oc, I
nc. (
Vic
toria
)2
5,26
617
,128
18,1
12.0
01.
063.
440.
31W
F M
HM
R W
ork
Act
Ctr
Mel
ior
Brid
ge (
Wic
hita
Fal
ls)
16,
252
7,85
58,
802.
341.
121.
410.
80W
alke
r C
ount
y S
enio
r C
ente
r (H
unts
ville
)3
7,01
462
,700
41,2
34.2
10.
665.
880.
11W
ard
Cou
nty
Gra
ndfa
lls S
enio
r C
itize
ns (
Gra
ndfa
lls)
11,
333
13,8
8811
,128
.70
0.80
8.35
0.10
War
d C
ount
y S
enio
r C
itize
ns C
ente
r (M
onah
ans)
12,
640
3,99
75,
128.
661.
281.
940.
66N
ew C
ontr
act
War
m S
prin
gs R
ehab
Hos
p (G
onza
les)
158
213
,166
11,1
66.7
80.
8519
.19
0.04
New
Con
trac
tW
esle
y C
omm
unity
Cen
ter
of S
an A
nton
io (
San
Ant
onio
)1
868
456
3,58
8.81
7.87
4.13
1.90
Wes
t Tex
as C
hris
tian
Fou
nd. (
San
Ang
elo)
13,
338
7,55
26,
986.
000.
932.
090.
44W
oods
ide
Trai
ls W
ilder
ness
Exp
erie
nce
Inc
(Sm
ithvi
lle)
58,
103
84,6
7619
,027
.65
0.22
2.35
0.10
New
Con
trac
tY
MC
A o
f Met
ro. F
ort W
orth
(F
ort W
orth
)13
83,5
9016
2,90
137
8,96
1.00
2.33
4.53
0.51
New
Con
trac
tY
oung
Cou
nty
Sen
ior
Citi
zens
Ass
oc. (
Gra
ham
)1
4,58
611
,272
26,0
66.2
62.
315.
680.
41Y
oung
Cou
nty
Sen
ior
Cub
Cen
ter
(Oln
ey)
11,
127
8,24
48,
030.
810.
977.
130.
14Y
outh
and
Fam
ily E
nric
hmen
t Ctr.
Inc.
(Ty
ler)
44,
564
78,4
3024
,789
.65
0.32
5.43
0.06
YW
CA
of M
etro
polit
an D
alla
s (D
alla
s)2
1,65
55,
953
11,3
71.0
01.
916.
870.
28Y
WC
A O
F S
an A
nton
io&
Bex
ar C
ount
y (S
an A
nton
io)
12,
867
5,77
44,
413.
000.
761.
540.
50N
ew C
ontr
act
Zap
ta C
ount
y (Z
apat
a)3
7,04
333
,269
39,1
90.4
41.
185.
560.
21To
tal f
or F
isca
l Yea
r 19
991,
269
3,71
4,74
217
,291
,486
$16,
322,
578.
53A
vera
ge fo
r 31
4 S
yste
ms
4.03
11,8
3055
,068
$51,
982.
73$0
.94
$4.3
90.
21
53
A. SERVICE
ACTUAL VEHICLE MILES AND HOURS: The miles/hours a vehicle travels while inrevenue service (actual vehicle revenue miles/hours) plus deadhead miles/hours. Actualvehicle miles/hours exclude miles and hours for charter services, school bus service,operator training and maintenance testing.
ACTUAL VEHICLE REVENUE MILES AND HOURS: The miles/hours a vehicle travelswhile in revenue service. A transit vehicle is in revenue service only when the vehicle isavailable to the public and there is a reasonable expectation of carrying passengers thateither directly pay fares, are subsidized by public policy, or provide payment through somecontractual agreement. This does not imply that a cash fare must be paid. Vehiclesoperated in free fare services are considered in revenue service. Vehicle revenue miles/hours includes layover/recovery but excludes travel to and from storage facilities, trainingoperators prior to revenue service, road tests and deadhead travel, as well as school busand charter services.
UNLINKED ONE-WAY PASSENGER TRIPS: The number of passengers who boardpublic transportation vehicles. A passenger is counted each time he/she boards a vehicleeven though he/she may be on the same journey from origin to destination.
B. ROLLING STOCK
TOTAL NUMBER OF BUSES, RAIL/TROLLEYS IN SERVICE: The number of revenuevehicles available to meet the annual maximum service requirements. Vehicles availablefor maximum service include spares, out-of-service vehicles, and vehicles in or awaitingmaintenance, but exclude vehicles awaiting sale and emergency contingency vehicles.
TOTAL NUMBER OF EMPLOYEES: Actual person count: Full and part time employeesof the transit agency, permanent or temporary, who hold approved and filled positions atthe end of the fiscal year.
C. SYSTEM REVENUES:
PASSENGER FARE REVENUES: The total passenger fares earned during the reportyear for directly operated service, regardless of whether they are used during the reportyear to pay for operating expenses. These are fares collected and/or paid for throughtickets, passes, tokens, and other fare payment methods. They may be used in a futureyear or they may be used to pay for capital expenses.
SALES TAX: (DEDICATED FUNDS): Any funds raised specifically for transit purposesand which are dedicated at their source (e.g., sales taxes, gasoline taxes) rather thanthrough an allocation from the pool of general funds.
OTHER OPERATING REVENUE: Revenue derived from (1) organizations paying moneyin lieu of passenger fares, etc. (2) transit-related services such as station and vehicleconcessions and advertising; an (3) non-transit related services, such as rental of vehiclesand properties, investment income, and non-park-and-ride parking revenue.
DEFINITIONS FOR TRANSIT STATISTICS REPORTNote: Definitions are retrieved from NATIONAL TRANSIT DATABASE REPORTING MANUAL
54

TOTAL OPERATING REVENUE: The total revenue earned by a transit agency through itstransit operations. It includes passenger, advertising, financial assistance for transitoperations (not capital expenditures) such as federal, state and local government.
D. CAPITAL AND OPERATING FUNDING:
FEDERAL FUNDS: Financial assistance from the federal government to assist in payingthe capital and operating costs of providing transit service.
STATE FUNDS: Financial assistance obtained from the state government to assist inpaying the capital and operating costs of providing transit revenue services.
LOCAL FUNDS: Financial assistance from local government (below the state level) tohelp cover the capital and operating costs of providing transit services.
OTHER FUNDS: Any miscellaneous funds. Examples are funds dedicated to a localgovernment agency for transportation rather than specifically for transit, profits fromcharter service, advertising revenues, and private donations.
E. EXPENSES
TOTAL OPERATING EXPENSE: The total operating cost incurred by a transit agencythrough its transit operation. It includes the following ten expense objects: labor, fringebenefits, service, materials & supplies, utilities, causalities/liabilities cost, taxes, purchasedtransportation, misc. expenses, and expense transfers. These expense objects aresummed by the following four functions: vehicle operations, vehicle maintenance, non-vehicle maintenance and general administration for the total agency expense. Theninclude the ADA-related expenses and total reconciling items expenses to get the totalexpenses from published reports.
DEFINITIONS FOR TRANSIT STATISTICS REPORTNote: Definitions are retrieved from NATIONAL TRANSIT DATABASE REPORTING MANUAL
55

TRANSIT SYSTEM ADDRESSES

56
Metropolitan Transit Authorities (MTA)
AUSTIN
Ms. Karen RaeGeneral ManagerCapital MetropolitanTransportation Authority2910 East Fifth StreetAustin, TX 78702(512)389-7425(512)389-0474 [email protected]
CORPUS CHRISTI
Ms. Linda WatsonGeneral ManagerRegional Transportation Authority1812 South Alameda StreetCorpus Christi, TX 78404-2933(361)883-2287(361)887-7266 [email protected]
DALLAS
Roger SnobleExecutive DirectorDallas Area Rapid TransitP.O. Box 660163Dallas, TX 75266-0163(214)749-3278(214)749-3655 [email protected]
EL PASO
Terry L. ScottGeneral ManagerSun Metro (City of El Paso)700 A. San FranciscoEl Paso, TX 79901(915)533-1220(915)534-5816 Fax
FORT WORTH
Mr. John BartosiewiczGeneral ManagerFort Worth Transit AuthorityP.O. Box 1477Fort Worth, TX 76101(817)215-8700(817)215-8709 [email protected]
HOUSTON
Ms. Shirley DeLiberoGeneral ManagerMetropolitan Transit AuthorityP.O. Box 61429Houston, TX 77208(713)739-4831(713)759-9537 [email protected]
SAN ANTONIO
Mr. John MilamGeneral ManagerVIA Metropolitan TransitP.O. Box 12489San Antonio, TX 78212(210)227-5371(210)227-0584 [email protected]

57
Urbanized Transit Systems
ABILENE
CITY OF ABILENE/CITYLINKBrent Black - General Mgr.1189 S Second StreetAbilene Tx 79602915-676-6403915-676-6407 [email protected]
AMARILLO
CITY OF AMARILLO/AMARILLO TRANSIT COMPANYJudy Phelps, Trans. Mgr.PO Box 1971Amarillo Tx 79105806-342-9142806-342-9146 [email protected]
ARLINGTON
CITY OF ARLINGTON/HANDITRANSue Stevens-ManagerPO Box 231Arlington Tx 76010817-459-5390817-275-2286 [email protected]
BEAUMONT
CITY OF BEAUMONT/BEAUMONT TRANSIT SYSTEMWilliam Munson- Transit Mgr.550 MilamBeaumont Tx 77701409-835-7895409-832-3609 [email protected]
BROWNSVILLE
CITY OF BROWNSVILLE/BROWNSVILLE URBAN SYSTEMNorma Zamora700 S IowaBrownsville Tx 78520956-541-4881956-544-7603 [email protected]
BRYAN-COLLEGE STATION
BRAZOS TRANSIT DISTRICTJohn McBeth-Administrator504 E 27th StreetBryan Tx 77803-4025409-779-7443409-822-7758 [email protected]
DENTON
CITY OF DENTONVeronica Rolen215 E McKinneyDenton Tx 76201940-349-8590940-349-8376 [email protected]
FORT WORTH
NORTH RICHLAND HILLS/NETSYMCA URBAN SERV.Brenda Cross5408 Davis Blvd Ste A.Fort Worth Tx 76180817-485-3933817-428-7162 [email protected]

58
GALVESTON
CITY OF GALVESTONWayne Cook - General Mgr.PO Box 779Galveston Tx 77553409-762-2903409-762-7085 [email protected]
GRAND PRAIRIE
CITY OF GRAND PRAIRIEDoan StephensPO Box 534045Grand Prairie Tx 75053-4045972-237-8319972-237-8116 [email protected]
KILLEEN
DBA HILL COUNTRY TRANSIT DISTRICTCarole WarlickP.O. Box 846San Saba, Tx 76877915-372-3799915-372-6110 [email protected]
LAREDO
LAREDO MUNICIPAL TRANSIT SYSTEMPeter Behrman-General Mgr.1301 Farragut, 3rd floor westLaredo Tx 78040956-795-2250956-795-2279 [email protected]
LEWISVILLE
LEWISVILLE DIAL-A-RIDEStanley Nixon-Grant CoordinatorPO Box 299002Lewisville Tx 75029-9002972-219-3780972-219-3487 [email protected]
LONGVIEW
EAST TEXAS COUNCIL OFGOVERNMENTSRoxanne Pitts3800 Stone RoadKilgore Tx 75662903-984-8641903-237-1009 [email protected]
LUBBOCK
CITY OF LUBBOCK dba CITIBUSJohn Wilson-General Mgr.PO Box 2000Lubbock Tx 79457806-767-2380 ext.230806-767-2387 [email protected]
MCALLEN
LOWER-RIO GRANDE VALLEYDEVELOPMENT COUNCIL (LRGVDC)Richard Hinojosa -Dir. of RegionalPlanning311 N 15th StreetMcAllen Tx 78501956-682-3481956-631-4670 [email protected]
59
MESQUITE
CITY OF MESQUITEMESQUITE TRANSPORTATION FORELDERLY AND DISABLED (MTED)Bill DoranPO Box 850137Mesquite Tx 75185-0137972-216-6411972-216-8102 [email protected]
PORT ARTHUR
CITY OF PORT ARTHUR/PORT ARTHURTRANSITTom Kestranek-Transit Mgr.PO Box 1089Port Arthur Tx 77641-1089409-983-8767409-983-8609 [email protected]
SAN ANGELO
CITY OF SAN ANGELO /SAN ANGELO STREET RAILROADCOMPANYJ.D. ReyesPO Box 1751San Angelo Tx 76902-1751915-657-4210915-655-4874 [email protected]
SHERMAN
TEXOMA COUNCIL OF GOVERNMENTSRobert Wood3201 Texoma Parkway, Ste. 240Sherman Tx 75090903-813-3534903-813-3539 [email protected]
TEMPLE
TEMPLE TRANSITEd Kabobel-Transit Mgr.Municipal Building-2 North MainTemple Tx 76501254-298-5603254-298-5637 [email protected]
TEXAS CITY LAMARQUE
CITY OF TEXAS CITY/GULF COAST CENTERPaulette SheltonDir. Of TransportationPO Box 2490Galveston Tx 77553409-763-2373409-763-5538 [email protected]
TYLER
CITY OF TYLER/TYLER TRANSIT SYSTEMGlory Fon412 West Locust StreetTyler Tx 75702903-531-1202903-531-9418 [email protected]
VICTORIA
CITY OF VICTORIA dba GOLDENCRESCENT REGIONAL PLANNINGCOMMISSIONLisa Cotinas - Dir. Of TransportationPO Box 2028Victoria Tx 77902-2028361-578-1587361-578-8865 [email protected]
60
WACO
WACO TRANSIT SYSTEMChris Phelps -General Mgr.421 Columbus AvenueWaco Tx 76701254-753-1316254-753-8878 [email protected]
WICHITA FALLS
CITY OF WICHITA FALLSSteve Seese -City Planning Admin.P.O. Box 1431Wichita Falls Tx 76307-1431940-761-7451940-761-7461 [email protected]

61
Nonurbanized Transit Systems
Alamo Area Council of GovernmentsAl J. Notzoon- Ex. DirectorAdrienne R. Cohen-Program Mgr.118 Broadway, Suite 400San Antonio, TX 78205210-362-5238210-225-5937 [email protected]
Ark-Tex Council of GovernmentsJames Fisher-Ex. DirectorLynda Woods-Dir. Of Regional Dev.P.O. Box 5307Texarkana,TX 75505903-832-8636903-832-3441 [email protected]
Aspermont Small Business DevelopmentCenter, Inc.Don Mullis-Ex. DirectorDana Myers-Program DirectorP.O. Box 188Aspermont, TX 79502940-989-3538940-989-3445 [email protected]
Bee Community Action AgencyCynthia Carriger-Ex. DirectorP.O. Box 1540Beeville, TX 78104361-358-5530361-358-8947 [email protected]
Brazos Transit DistrictJohn McBeth- Ex. Director504 E. 27th StreetBryan, TX 77803-4025979-779-7443979-822-7758 [email protected]
Capital Area Rural TransportationSystemDavid Marsh- Ex. DirectorEdna Burroughs-Deputy Dir.P.O. Box 6050Austin, TX 78762-6050512-389-1011512-478-1110 [email protected]
Caprock Community ActionAssociation, Inc.Claudia Cowley - Ex. Director224 S. BerkshireCrosbyton, TX 79322806-675-7370806-675-2291 [email protected]
Central Texas Rural Transit DistrictJ.R. Salazar-Gen. Manager2310 S ConchoColeman, TX 76834915-625-4491915-625-5044 [email protected]
City of Cleburne (Cletrans)Ron Parnell-Purchasing ManagerP.O. Box 677Cleburne, TX 76033-0657817-645-0951817-645-0926 [email protected]
City of Del RioElsa Reyes-Acct. Supv.P.O. Box 4239Del Rio, TX 78841830-774-8558830-703-5304 [email protected]

62
Collin County Committeeon AgingEd Casper- Ex. DirectorP.O. Box 396McKinney, TX 75069972-562-6996972-562-0308 [email protected]
Colorado Valley Transit, Inc.Vastene Olier- Ex. DirectorClaudia Wicks-Asst. Dir.P.O. Box 940Columbus, TX 78934409-732-6281409-732-6283 [email protected]
Community Action Council ofSouth TexasEli Ramirez-Trans. Program DirectorP.O. Box Drawer 98Rio Grande City, TX 78582956-487-2585956-487-2871 [email protected]
Community Council ofSouthwest Texas, Inc.Jorge Botello- Ex. DirectorSarah Hidalgo-Cook-Asst. DirectorP.O. Drawer 1709Uvalde, TX 78802-1709830-278-6268830-278-4281 [email protected]
Community Services, Inc.Larry Herrera-Dir. Of TransportationP.O. Box 612Corsicana, TX 75110903-872-2405903-872-0561 [email protected]
Concho Valley Councilof GovernmentsRobert Stephens-Trans. DirectorP. O. Box 60050San Angelo, TX 76906915-944-9666915-944-9925 [email protected]
County of El PasoDavid MarquezCounty Courthouse, Rm. 314500 E. San AntonioEl Paso, TX 79901915-543-3848915-546-2198 [email protected]
East Texas Council of GovernmentsRoxanne Pitts3800 Stone RoadKilgore, TX 75647903-984-8641903-983-1440 [email protected]
Golden Crescent RegionalPlanning CommissionLisa Cortinas-Transp. CoordinatorP.O. Box 2028Victoria, TX 77902361-578-1587361-578-8865 [email protected]
Gulf Coast CenterPaulette Shelton-Dir. Of TransportationP.O. Box 2490Galveston, TX 77553409-763-2373409-763-5538 [email protected]
Heart of Texas Councilof GovernmentsJim Hart-Transp. Coordinator320 Franklin AvenueWaco, TX 76701254-756-7822254-756-0102 [email protected]

63
Hill Country Transit DistrictCarole Warlick-General ManagerP.O. Box 846San Saba, TX 76877915-372-3799915-372-6110 [email protected]
Hunt County Committeeon AgingSally Ann Chavarria-Director3720 O’Neal StreetGreenville, TX 75401903-454-1444903-454-4150 [email protected]
Kaufman County Senior Citizens Services,Inc.Omega A. Hawkins-DirectorP.O. Box 836Terrell, TX 75160972-563-1422972-563-1491 [email protected]
Kleberg County Human ServicesAlberto Guerrero-Dir. Of Transportation720 E. LeeKingsville, TX 78363361-595-8572361-595-8578 [email protected]@intcomm.net
Lower Rio Grande ValleyDevelopment CouncilRichard Hinojosa-Dir. Of Regional Planning4900 North 23rdMcAllen, TX 78504956-682-3481956-631-4670 [email protected]
Palo Pinto County Transportation CouncilReta Imboden-Dir. Of TransportationP.O. Box 1055Mineral Wells, TX 76068940-328-1391940-328-1392 [email protected]
Panhandle CommunityServices, Inc.Robert Whorton-Transportation DirectorP.O. Box 32150Amarillo, TX 79120806-372-2531806-373-8143 [email protected]
Parker County TransportationServices, Inc.Maggie Franklin-DirectorP.O. Box 1236Weatherford, TX 76086817-613-8729817-599-7433 [email protected]
People for Progress, Inc.Gladys Gerst-Ex. Director301 W. ArkansasSweetwater, TX 79556915-235-1748915-235-4950 [email protected]
Rolling Plains ManagementCorporationJerry McMillan-ConsultantP.O. Box 490Crowell, TX 792271-800-633-0852940-684-1571940-684-1718 [email protected]
Rural Economic AssistanceLeague, Inc.Gloria Ramos-Ex. Director301 LuceroAlice, TX 78332361-668-3158361-664-9695 [email protected]

64
San Patricio County CommunityAction AgencyLupita Paiz-Ex. Director512 E. SintonSinton, TX 78387361-364-4290361-364-5842 [email protected]
South East Texas Regional PlanningCommissionBob Dickinson-Dir. Of 911 Air Quality &Trans. ProgramsP.O. Drawer 1387Nederland, TX 77627409-724-1911409-724-6295 [email protected]
South Plains Community ActionAssociation, Inc.William Powell, Jr.-Ex. Director806-894-6104Irma Guerra- Dir. Of Transportation806-894-3800806-894-5349 FaxBox 610Levelland, TX [email protected]
SPAN, Inc.Erika Lissberger-Ex. Director1800 MaloneDenton, TX 76201-1746940-382-2224940-383-8433 [email protected]
Texoma Area ParatransitSystem, Inc.Ven Hammonds-Ex. Director6104 Texoma ParkwaySherman, TX 75090903-893-4601903-893-4766 [email protected]
The Transit System, Inc.Barbara Perry-General ManagerP.O. Box 332Glen Rose, TX 76043254-897-2964254-897-7922 [email protected]
Town of South Padre IslandRobert Fudge P.E.P.O. Box 3410South Padre Island, TX 78597956-761-6456956-761-1659 [email protected]
Webb County CommunityAction AgencyJose Gamez-Transportation Director4801 DaughertyLaredo, TX 78044956-722-5499956-791-2149 [email protected]
West Texas Opportunities, Inc.Janet Everheart-Ex. DirectorP.O. Box 1308Lamesa, TX 79331806-872-8354806-872-5816 [email protected]

Elderly and Disabled Transportation Providers
To obtain a list of addresses for the nonprofit entities providing transportation to the elderlyand disabled, please contact the Texas Department of Transportation, Public TransportationDivision, 125 East 11th Street, Austin, Texas, 78701-2483 or call (512) 416-2810.
Web E-Mail [email protected]
65