Embed Size (px)
Citation preview
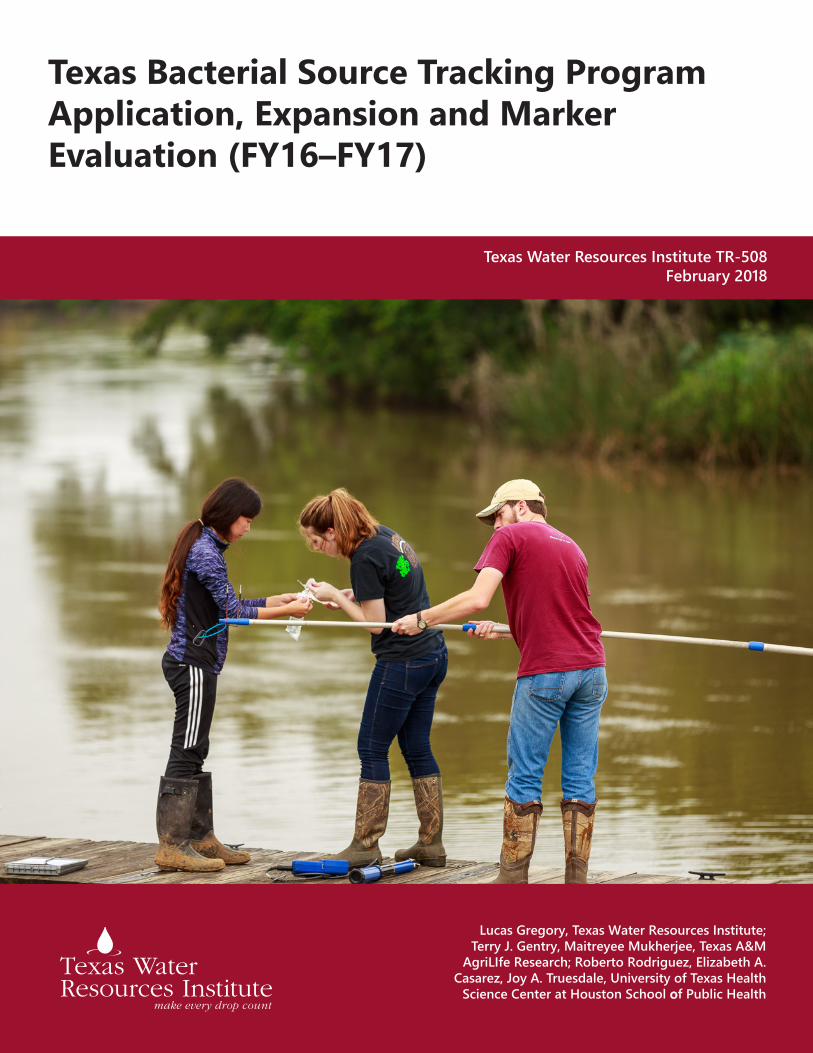
Texas Bacterial Source Tracking Program Application, Expansion and Marker Evaluation (FY16–FY17)
Lucas Gregory, Texas Water Resources Institute; Terry J. Gentry, Maitreyee Mukherjee, Texas A&M
AgriLIfe Research; Roberto Rodriguez, Elizabeth A. Casarez, Joy A. Truesdale, University of Texas Health
Science Center at Houston School of Public Health
Texas Water Resources Institute TR-508February 2018
Texas Bacterial Source Tracking Program Application, Expansion and Marker
Evaluation (FY16–FY17)
TEXAS’ BACTERIAL SOURCE TRACKING PROGRAM
STATE NONPOINT SOURCE GRANT PROGRAM
TSSWCB PROJECT 16-51
Prepared for:
TEXAS STATE SOIL AND WATER CONSERVATION BOARD
Prepared by:
LUCAS GREGORY
TEXAS WATER RESOURCES INSTITUTE
‐‐‐‐‐‐‐‐‐‐‐‐‐‐‐‐‐‐‐‐‐‐‐‐‐‐‐‐
TERRY J. GENTRY
MAITREYEE MUKHERJEE
TEXAS A&M AGRILIFE RESEARCH – DEPARTMENT OF SOIL AND CROP SCIENCES
‐‐‐‐‐‐‐‐‐‐‐‐‐‐‐‐‐‐‐‐‐‐‐‐‐‐‐‐
ROBERTO RODRIGUEZ
ELIZABETH A. CASAREZ
JOY A. TRUESDALE
UNIVERSITY OF TEXAS HEALTH SCIENCE CENTER AT HOUSTON SCHOOL OF PUBLIC HEALTH,
EL PASO CAMPUS
February 2018
TEXAS WATER RESOURCES INSTITUTE TR-508
i
Table of Contents
Table of Contents ............................................................................................................................. i
List of Figures ................................................................................................................................. ii
List of Tables .................................................................................................................................. iii
List of Acronyms ............................................................................................................................ iv
Executive Summary .........................................................................................................................v
Introduction ..................................................................................................................................... 1
Expansion of the Texas E. coli BST Library .................................................................................... 2
Evaluation of the Texas E. coli BST Library ....................................................................................7
Utilization of the Texas E. coli BST Library ................................................................................... 12
BST Program Outreach .................................................................................................................. 21
Literature Cited ............................................................................................................................. 23
Appendix A .................................................................................................................................... 25
ii
List of Figures
Figure 1: Texas E. coli BST Library (ver. 12-17) composition by 7-way split of source classes (1,853 isolates from 1,595 different fecal sample sources). ............................................. 6
Figure 2: Texas E. coli BST Library (ver. 12-17) composition by 3-way split of source classes (1,853 isolates from 1,595 different fecal source samples). ............................................. 6
Figure 3: Identification of E. coli water isolates from the Big Elm Creek Watershed using a 3-way split of source classes and an 80% similarity cutoff (n = 118 isolates from 24 samples). ......................................................................................................................... 13
Figure 4: Identification of E. coli water isolates from the Big Elm Creek Watershed using a 7-way split of source classes and an 80% similarity cutoff ( n = 118 isolates from 24 samples). ......................................................................................................................... 13
Figure 5: Identification of E. coli water isolates from Big Elm Creek Site 14016 using a 3-way split of source classes and an 80% similarity cutoff (n = 60 isolates from 12 samples). ......................................................................................................................... 14
Figure 6: Identification of E. coli water isolates from Big Elm Creek Site 16385 using a 3-way split of source classes and an 80% similarity cutoff (n = 58 isolates from 12 samples). ......................................................................................................................... 14
Figure 7: Identification of E. coli water isolates from the Plum Creek Watershed using a 3-way split of source classes and an 80% similarity cutoff (n = 108 isolates from 60 samples). ......................................................................................................................... 15
Figure 8: Identification of E. coli water isolates from the Plum Creek Watershed using a 7-way split of source classes and an 80% similarity cutoff (n = 108 isolates from 60 samples). ......................................................................................................................... 16
Figure 9: Identification of E. coli water isolates from the Plum Creek Watershed collected under dry versus wet conditions using a 3-way split of source classes and an 80% similarity cutoff (n = 108 isolates from 60 samples). .................................................... 17
Figure 10: Identification of E. coli water isolates from the Plum Creek Watershed collected under dry versus wet conditions using a 7-way split of source classes and an 80% similarity cutoff (n = 108 isolates from 60 samples). ..................................................... 17
Figure 11: Identification of E. coli water isolates from the Plum Creek Watershed using a 3-way split of source classes and an 80% similarity cutoff (n = 108 isolates from 60 samples). ......................................................................................................................... 18
Figure 12: Identification of E. coli water isolates using a 4-way split of source classes. ............... 19 Figure 13: BST qPCR results for water sample batches 1 and 2. .................................................. 20 Figure 14: Number of visits and visitors to Texas BST Program Website during the period of
November 1, 2015 - January 31, 2018. ........................................................................... 22
iii
List of Tables
Table 1: Known source collection targets ....................................................................................... 2 Table 2: Effort for sample collection, fingerprinting, and screening for Texas E. coli BST
Library (ver. 12-17) ............................................................................................................ 4 Table 3: Texas E. coli BST Library (ver. 12-17, cross-library validation) composition and rates
of correct classification (RCCs) by Jackknife analysis of ERIC-RP composite datasets using an 80% similarity cutoff and 3- and 7-way splits .................................................... 5
Table 4: Library comparison treating known source isolates as unknowns. ................................. 9 Table 5: Library comparison to identify water isolates. ................................................................10
iv
List of Acronyms
ARCC Average rate of correct classification ATCC American Type Culture Collection BMP Best management practice bp Base pair BST Bacterial source tracking cfu Colony forming units DNA Deoxyribonucleic acid E. coli Escherichia coli EPA Environmental Protection Agency ERIC‐PCR Enterobacterial repetitive intergenic consensus sequence PCR MDS Multi‐dimensional scaling MPN Most probable number mTEC Membrane Thermotolerant Escherichia coli OSSF On-site sewage facility PCR Polymerase chain reaction qPCR Quantitative PCR RARCC Random average rate of correct classification based on library composition RCC Rate of correct classification RP RiboPrinting rRNA Ribosomal ribonucleic acid SAML Soil and Aquatic Microbiology Laboratory SCSC Texas A&M AgriLife Research, Department of Soil and Crop Sciences SOP Standard operating procedure TAMU Texas A&M University TCEQ Texas Commission on Environmental Quality TMDL Total maximum daily load TSSWC Texas State Soil and Water Conservation Board TRWD Tarrant Regional Water District TWRI Texas Water Resources Institute UPGMA Unweighted Pair Group Method with Arithmetic Mean USDA‐ARS U.S. Department of Agriculture Agricultural Research Service UTSPH EP University of Texas Health Science Center at Houston School of Public Health, El
Paso Campus, Environmental Microbiology Laboratory WPP Watershed protection plan WWTF Wastewater treatment facility

v
Executive Summary
The 2014 Texas Integrated Report of Surface Water Quality identified 255 waterbodies as being impaired due to excessive bacteria in Texas. To identify bacterial sources and help address these impairments, Texas established a Bacterial Source Tracking (BST) Program circa 2006. To support the maintenance, expansion, and use of the Texas BST Library and other BST tools, the Texas Water Resources Institute (TWRI), University of Texas Health Science Center at Houston School of Public Health, El Paso Campus, Environmental Microbiology Laboratory (UTSPH EP), and the Texas A&M AgriLife Research, Department of Soil and Crop Sciences (SCSC) collaborated with the Texas State Soil and Water Conservation Board (TSSWCB) in fiscal years 2016 and 2017 to:
(1) Expand the Texas Escherichia coli (E. coli) BST Library through known source sample collection in the Big Elm Creek and Plum Creek watersheds
(2) Support BST efforts in the Big Elm Creek, Plum Creek, and other watersheds (3) Evaluate and refine the Texas E. coli BST Library by assessing geographic and temporal
stability, composition, average rates of correct classification, diversity of source isolates of the updated library, and working to develop/refine source-specific PCR markers
(4) Provide outreach regarding BST
Major findings from this project were: • The Texas E. coli BST Library was expanded and refined with the current version
containing 1,853 isolates from 1,595 known source fecal samples obtained from nearly 4,000 individual known source fecal samples from 20 watersheds.
• Use of BST in the Big Elm and Plum Creek watersheds revealed that wildlife (both non‐avian and avian) were the leading contributors of E. coli in each respective waterbody followed by domestic animals and humans
• Analysis of the Texas E. coli BST Library and qPCR markers revealed: o Inclusion of additional screening methods during library construction did not
substantially alter identification results compared to a library constructed using the traditional approach
o Demonstrated improved ability to identify cosmopolitan isolates, but more work is needed
o Need more statistical analysis of the data contained in the Texas E. coli BST Library to further improve source identification and identify potential issues
o Good correlation between E. coli BST and tested qPCR markers • Outreach included highlighting the BST Program in:
o The December 2016 Conservation Matters that reached approximately 2,250 subscribers
o Three Facebook posts that reached 1,473 readers o Fifteen tweets or retweets that yielded 6,901 impressions o Two conferences and three meetings where BST Program results were conveyed o The BST Program website that resulted in 476 visits
1
Introduction
According to the 2014 Texas Integrated Report (303(d) List), 245 streams and rivers, 8 oyster waters, and 2 beaches are impaired due to excessive levels of bacteria. Identifying and assessing sources of these bacteria is critical to target best management practices, develop bacterial total maximum daily loads (TMDLs) or watershed protection plans (WPPs), and assess risks from contact recreation.
BST is a valuable tool that can identify and rule‐out significant sources of E. coli pollution in a watershed. The premise behind BST is that genetic and phenotypic tests can identify bacterial strains that are host-specific, which allow the original host species and source of the fecal contamination to be identified. Numerous BST methods are available that use DNA fingerprints and bacterial markers to identify fecal pollution sources. Based on a multi‐year study initiated in 2002, the State of Texas selected the two‐method approach using ERIC‐PCR and RiboPrinting (ERIC‐RP), as this approach was found to be the most accurate and cost‐effective. E. coli is used as the target bacterium because it provides a direct link with water quality standards.
For more than a decade, the Texas BST Program has successfully identified sources of E. coli in dozens of watersheds across Texas. Comprehensive BST has been completed by UTSPH EP and SCSC for the following watersheds: (1) Lake Waco and Belton Lake, (2) San Antonio area, (3) Lake Granbury, (4) Buck Creek, (5) Leon and Lampasas Rivers, (6) Little Brazos River tributaries, (7) Big Cypress Creek, (8) Leona River, (9) Attoyac Bayou, (10) Arroyo Colorado, (11) Navasota River, (12) Big Elm Creek, (13) Plum Creek, and (14) the Trinity River in Tarrant Regional Water District’s service area. A Texas E. coli BST Library has been developed based on known source isolates from these and other (i.e. Upper Trinity River and Upper Oyster Creek) watersheds.
The Texas E. coli BST Library is dynamic, with new isolates being added with each successive BST project. To support maintenance, expansion, and use of the library and other BST tools, TWRI, UTSPH EP, and SCSC collaborated to:
(1) Further evaluate and refine the Texas E. coli BST library by assessing geographic and
temporal stability, composition, average rates of correct classification, diversity of source isolates of the updated library, and working to develop/refine source-specific PCR markers
(2) Support BST efforts in high priority watersheds (3) Provide outreach regarding BST
2
Expansion of the Texas E. coli BST Library
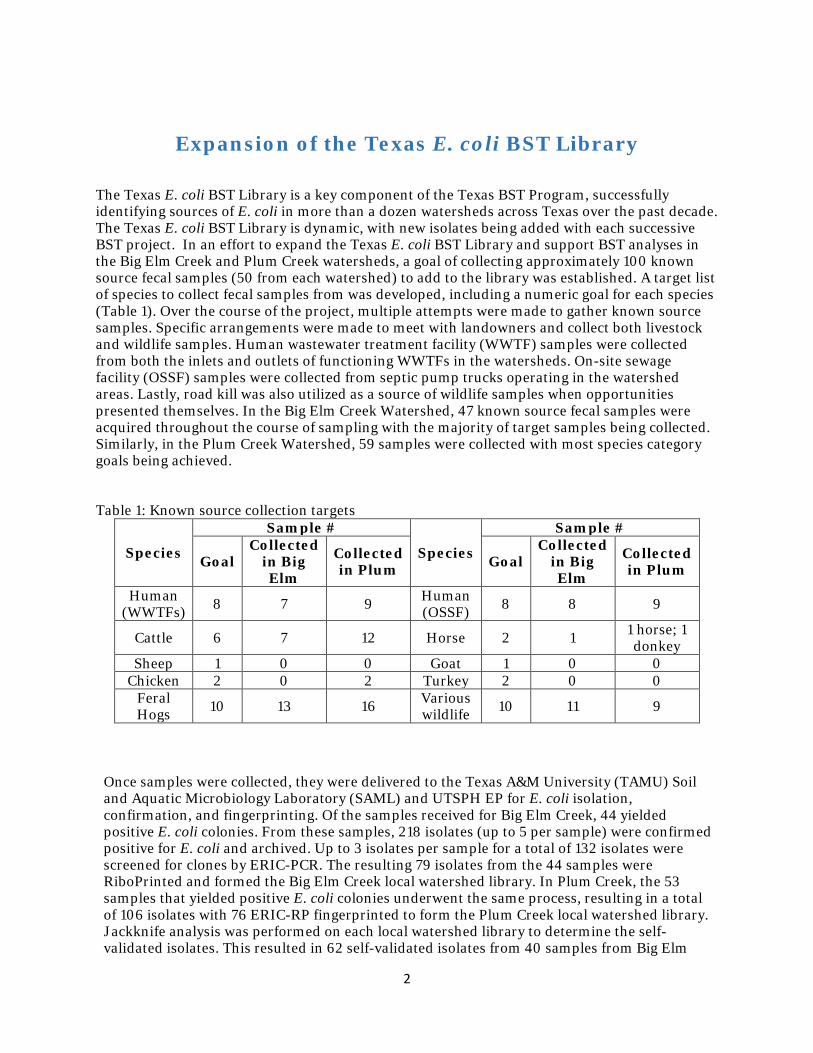
The Texas E. coli BST Library is a key component of the Texas BST Program, successfully identifying sources of E. coli in more than a dozen watersheds across Texas over the past decade. The Texas E. coli BST Library is dynamic, with new isolates being added with each successive BST project. In an effort to expand the Texas E. coli BST Library and support BST analyses in the Big Elm Creek and Plum Creek watersheds, a goal of collecting approximately 100 known source fecal samples (50 from each watershed) to add to the library was established. A target list of species to collect fecal samples from was developed, including a numeric goal for each species (Table 1). Over the course of the project, multiple attempts were made to gather known source samples. Specific arrangements were made to meet with landowners and collect both livestock and wildlife samples. Human wastewater treatment facility (WWTF) samples were collected from both the inlets and outlets of functioning WWTFs in the watersheds. On-site sewage facility (OSSF) samples were collected from septic pump trucks operating in the watershed areas. Lastly, road kill was also utilized as a source of wildlife samples when opportunities presented themselves. In the Big Elm Creek Watershed, 47 known source fecal samples were acquired throughout the course of sampling with the majority of target samples being collected. Similarly, in the Plum Creek Watershed, 59 samples were collected with most species category goals being achieved.
Table 1: Known source collection targets
Species
Sample #
Species
Sample #
Goal Collected
in Big Elm
Collected in Plum Goal
Collected in Big Elm
Collected in Plum
Human (WWTFs) 8 7 9 Human
(OSSF) 8 8 9
Cattle 6 7 12 Horse 2 1 1 horse; 1 donkey
Sheep 1 0 0 Goat 1 0 0 Chicken 2 0 2 Turkey 2 0 0
Feral Hogs 10 13 16 Various
wildlife 10 11 9
Once samples were collected, they were delivered to the Texas A&M University (TAMU) Soil and Aquatic Microbiology Laboratory (SAML) and UTSPH EP for E. coli isolation, confirmation, and fingerprinting. Of the samples received for Big Elm Creek, 44 yielded positive E. coli colonies. From these samples, 218 isolates (up to 5 per sample) were confirmed positive for E. coli and archived. Up to 3 isolates per sample for a total of 132 isolates were screened for clones by ERIC-PCR. The resulting 79 isolates from the 44 samples were RiboPrinted and formed the Big Elm Creek local watershed library. In Plum Creek, the 53 samples that yielded positive E. coli colonies underwent the same process, resulting in a total of 106 isolates with 76 ERIC-RP fingerprinted to form the Plum Creek local watershed library. Jackknife analysis was performed on each local watershed library to determine the self-validated isolates. This resulted in 62 self-validated isolates from 40 samples from Big Elm
3
Creek and 53 self-validated isolates from 40 samples from Plum Creek. These self-validated isolates were then combined with those from other local watersheds to be the basis of the updated Texas E. coli BST Library.
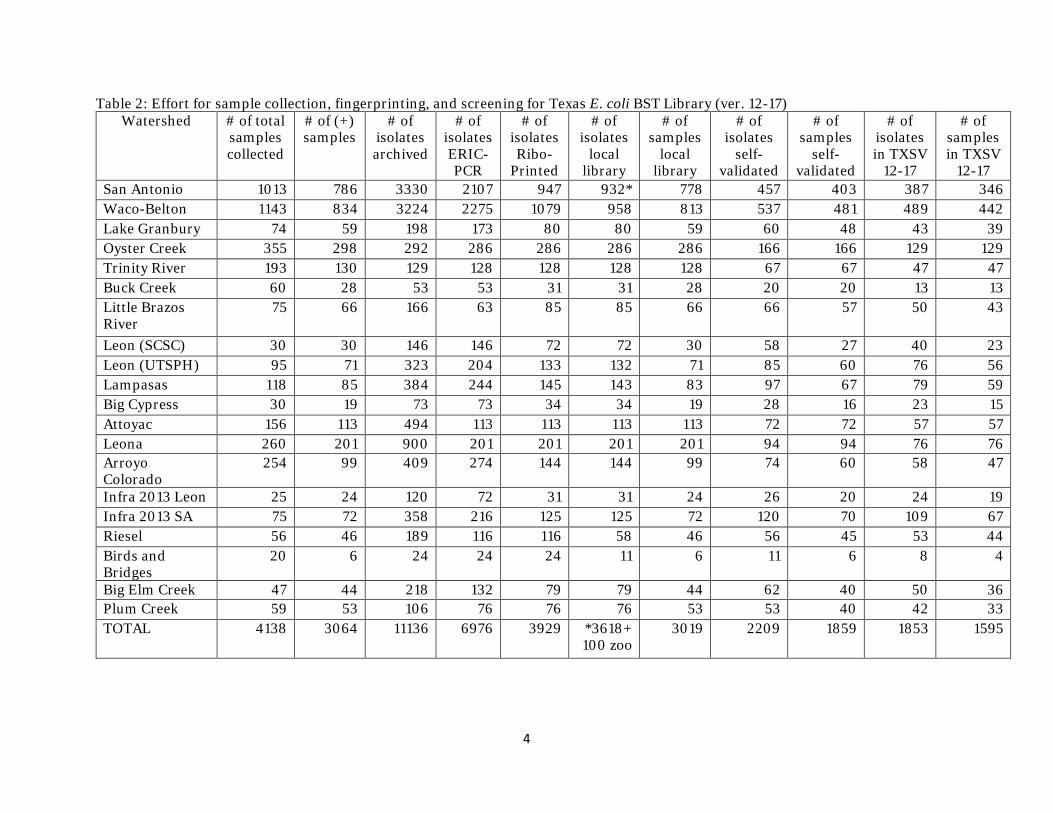
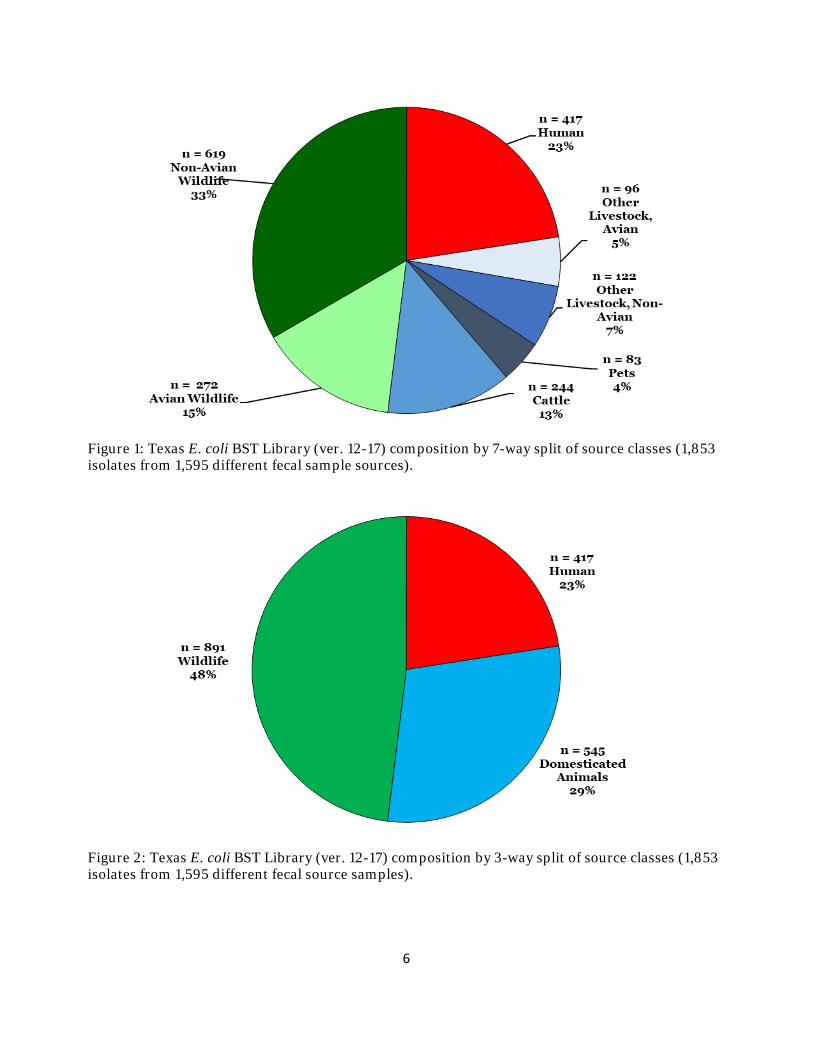
To increase its accuracy and utility, the updated Texas E. coli BST Library with pooled self-validated local watershed libraries as described in Table 2 (2209 isolates) was refined through cross-validation. To attempt to remove cosmopolitan (non-specific) E. coli source isolates, repetitive Jackknife analyses of the combined self-validated libraries were performed to remove isolates that cross-identified between human, domestic animals, and wildlife with the goal of 100% average rate of correct classification (ARCC) using a 3-way split of source classes. 320 isolates were removed after the first Jackknife analysis, leaving 1,889 isolates. Two additional rounds of Jackknife analysis were performed, resulting in 1,853 isolates with a 100% ARCC using a 3-way split of source classes and a 91% ARCC using a 7-way split. A total of 18% of the isolates were singletons (i.e., unique fingerprints) (Table 3). The Texas E. coli BST Library ver. 12-17 contains 1,853 isolates obtained from 1,595 individual fecal samples. Library composition is based on 7- and 3-way source class splits (Figures 1 and 2, respectively).
4
Table 2: Effort for sample collection, fingerprinting, and screening for Texas E. coli BST Library (ver. 12-17) Watershed # of total
samples collected
# of (+) samples
# of isolates archived
# of isolates ERIC-PCR
# of isolates Ribo-
Printed
# of isolates
local library
# of samples
local library
# of isolates
self-validated
# of samples
self-validated
# of isolates in TXSV
12-17
# of samples in TXSV
12-17 San Antonio 1013 786 3330 2107 947 932* 778 457 403 387 346 Waco-Belton 1143 834 3224 2275 1079 958 813 537 481 489 442 Lake Granbury 74 59 198 173 80 80 59 60 48 43 39 Oyster Creek 355 298 292 286 286 286 286 166 166 129 129 Trinity River 193 130 129 128 128 128 128 67 67 47 47 Buck Creek 60 28 53 53 31 31 28 20 20 13 13 Little Brazos River
75 66 166 63 85 85 66 66 57 50 43
Leon (SCSC) 30 30 146 146 72 72 30 58 27 40 23 Leon (UTSPH) 95 71 323 204 133 132 71 85 60 76 56 Lampasas 118 85 384 244 145 143 83 97 67 79 59 Big Cypress 30 19 73 73 34 34 19 28 16 23 15 Attoyac 156 113 494 113 113 113 113 72 72 57 57 Leona 260 201 900 201 201 201 201 94 94 76 76 Arroyo Colorado
254 99 409 274 144 144 99 74 60 58 47
Infra 2013 Leon 25 24 120 72 31 31 24 26 20 24 19 Infra 2013 SA 75 72 358 216 125 125 72 120 70 109 67 Riesel 56 46 189 116 116 58 46 56 45 53 44 Birds and Bridges
20 6 24 24 24 11 6 11 6 8 4
Big Elm Creek 47 44 218 132 79 79 44 62 40 50 36 Plum Creek 59 53 106 76 76 76 53 53 40 42 33 TOTAL 4138 3064 11136 6976 3929
*3618+ 100 zoo
3019 2209 1859 1853 1595
5
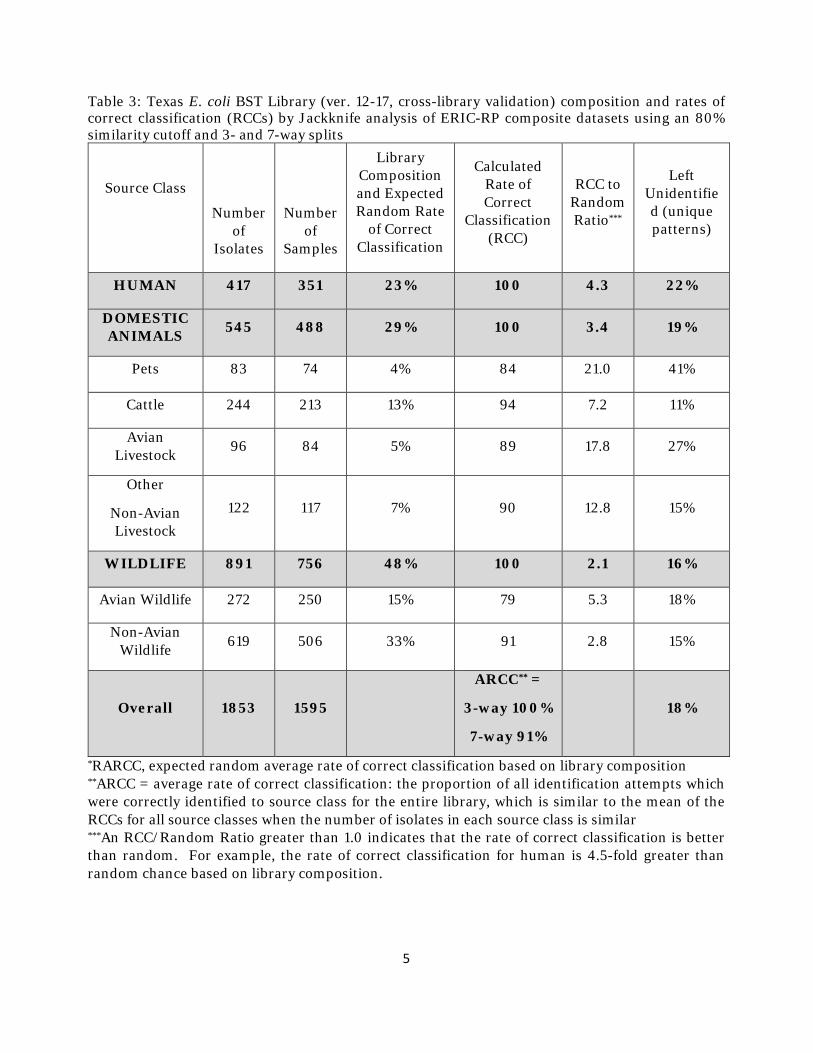
Table 3: Texas E. coli BST Library (ver. 12-17, cross-library validation) composition and rates of correct classification (RCCs) by Jackknife analysis of ERIC-RP composite datasets using an 80% similarity cutoff and 3- and 7-way splits
Source Class
Number of
Isolates
Number of
Samples
Library Composition and Expected Random Rate
of Correct Classification
Calculated Rate of Correct
Classification (RCC)
RCC to Random Ratio***
Left Unidentified (unique patterns)
HUMAN 417 351 23% 100 4.3 22%
DOMESTIC ANIMALS 545 488 29% 100 3.4 19%
Pets 83 74 4% 84 21.0 41%
Cattle 244 213 13% 94 7.2 11%
Avian Livestock 96 84 5% 89 17.8 27%
Other
Non-Avian Livestock
122 117 7% 90 12.8 15%
WILDLIFE 891 756 48% 100 2.1 16%
Avian Wildlife 272 250 15% 79 5.3 18%
Non-Avian Wildlife 619 506 33% 91 2.8 15%
Overall 1853 1595
ARCC** =
3-way 100%
7-way 91%
18%
*RARCC, expected random average rate of correct classification based on library composition **ARCC = average rate of correct classification: the proportion of all identification attempts which were correctly identified to source class for the entire library, which is similar to the mean of the RCCs for all source classes when the number of isolates in each source class is similar ***An RCC/Random Ratio greater than 1.0 indicates that the rate of correct classification is better than random. For example, the rate of correct classification for human is 4.5-fold greater than random chance based on library composition.
6
Figure 1: Texas E. coli BST Library (ver. 12-17) composition by 7-way split of source classes (1,853 isolates from 1,595 different fecal sample sources).
Figure 2: Texas E. coli BST Library (ver. 12-17) composition by 3-way split of source classes (1,853 isolates from 1,595 different fecal source samples).
7
Evaluation of the Texas E. coli BST Library
The Texas E. coli BST Library has been a key component of the Texas BST Program, successfully identifying sources of E. coli in more than a dozen watersheds across Texas over the past decade. Developing a statewide BST library using E. coli isolates from local watershed libraries allows for time and cost savings. The goal of the library is to find reliable source-specific isolates that are useful across broad geographical and temporal ranges. The methods used to create the library have developed over time. Currently, three steps are used to refine the Texas E. coli BST Library: de‐cloning, self‐validation, and cross‐validation of isolates. De‐cloning compares the ERIC–PCR patterns from up to three isolates per individual known source fecal sample. Isolates that are greater than 80% similar are considered clones (identical strains) and subsequently, only one isolate is selected for further consideration. All de‐cloned isolates from individual source samples are included in their respective local watershed library, independent of their similarity to other library isolates. Self‐validation of the local watershed library composite ERIC–RP fingerprints is performed using Jackknife analysis to identify isolates that are correctly classified using a 7‐way split of source classes (i.e., human, pets, cattle, other non‐avian livestock, avian livestock, avian wildlife, and non‐avian wildlife (including feral hogs)). Singleton isolates are defined as those having ERIC–RP fingerprints less than 80% similar to another isolate. In addition to self‐validated isolates, singletons are retained as members of their self‐validated local libraries. Cross‐validation entails a series of watershed/project‐inclusive Jackknife analyses on the pooled self‐validated local libraries to remove all isolates that cross‐identified between human, domestic animals, and wildlife source classes with a goal of 100% ARCC using a 3‐way split. As the number of watersheds and isolates has grown, several issues may need to be further explored.
• The 7-way watershed self-validation step may be too conservative, especially when the local libraries are very small and not diverse. Of the 1,409 isolates that had a bad match in their individual watershed jackknife analyses using a 7-way split of source classes with an 80% similarity cutoff, 40% (560) are good when run against the total self-validated pool using a 3-way split of source classes. The 7-way self-validation step seems to adversely affect Avian Wildlife (41% loss) and all Domestic Animal classes (average 50% loss), especially Pets (55% loss) and other Non-Avian Livestock (56% loss).
• Some of the singleton isolates are never validated. A jackknife analysis was performed on all local watershed isolates combined (before self-validation). A total of 295 (8%) of the 3,618 known source isolates fingerprinted to-date are unique and have no match in the library using the standard 80% similarity cutoff. There does not seem to be an artifact at work; all watershed projects and source classes seem randomly represented. While additional isolates may lose their match through the self-validation and cross-validation steps, these distinctive isolates are carried through so that they

8
represent 16% of the Texas E. coli BST Library (ver. 12-17). However, it appears that these rare isolates are also rare in water samples. Looking at the identification of the 226 water isolates from the current Big Elm Creek and Plum Creek studies, only one water isolate from Big Elm Creek matched a “rare singleton” for identification.
• All jackknife analyses are based on the best match (highest percentage similarity) to a single isolate. An isolate that finds a bad match (80% or greater similarity to an isolate from another source class) is removed. It should be noted, however, that the isolate it badly matched to may find its own best match to be correct (at a higher percent similarity). Subsequently, this isolate stays in the library. The best match for an isolate is relative to the content of the library. Several isolates may be greater than 80% similar to the “unknown”, but its fate is determined only by the isolate with the best match, even if the other matches are from a different source class. It is important to begin to think of the composite ERIC-RP fingerprints more as genotypes with different degrees of relatedness to each other.
• As discussed in previous reports, the best match for many isolates during cross-
validation comes from their own self‐validated local watershed library. On a per-watershed basis, 40-70% of isolates found their best matches with another isolate from their local watershed cohort (but from a different source sample due to de-cloning). When a watershed/project exclusive jackknife analysis was performed on the Texas E. coli BST Library (ver. 12-17), the rate of correct classification (RCC) using a 3-way split of source classes changed from 100% to 66% and from 91% to 45% using the 7-way split. One of the source classes with the biggest potential matching issue is cattle that is identifying as wildlife from other watersheds. If the cattle isolates find a match, half match to cattle while the other half match to wildlife.
• Not all E. coli are source-specific. The strains found in the feces of many different
animals and humans are referred to as “cosmopolitan.” While the general definition of a cosmopolitan isolate is one that is found in more than one source class, a specific definition is needed that accounts for geographical and temporal variability. Several attempts have been made to develop a screening method that can identify such isolates. It is unrealistic to remove all known source cosmopolitan isolates since they will be found in water samples. However, it is still important to remember that a cosmopolitan isolate came from a specific known source and may have passed best match self-validation and cross-validation screenings.
To begin addressing these last three areas of concern, two approaches were attempted.
Approach 1: One watershed vs rest-- exclusive jackknives:
Using the same initial pool of self-validated local watershed libraries as the traditional library construction, the first step of this approach was to run watershed-exclusive jackknives. Each set (watershed project) of self-validated source isolates was run against the combined rest of the self-
9
validated isolates from other watersheds. The results were then composited into a watershed-exclusive jackknife. For this analysis, a cosmopolitan isolate was defined as having a best match with 90% or greater similarity to the wrong 3-way source class; 319 such isolates were found. An additional 46 source isolates were incorrect source matches. For example, 50334-B from deer (WILD) was the closest, albeit a bad match to 10296-B (92.3%) and 10304-B (91.3%), both isolates from cattle (DOM). However, 50334-B had its best match to TR-46529, a swallow (WILD), with 94.2% similarity, and traditionally would not have been removed but was using this more conservative approach. Hence, 365 source isolates were labeled as cosmopolitan and removed. The next step went back to the typical watershed-inclusive serial jackknife analyses on the remaining 1,844 isolates using a 3-way split and 80% similarity cutoff. However, the additional step of removing incorrect source matches at greater than 90% similarity at a 3-way split of source classes was continued and an additional 12 isolates to the 249 isolates that had bad matches were removed. The second round of serial jackknife analysis on the remaining 1,583 isolates revealed 13 more bad matches using a 3-way split and 80% similarity cutoff, though none were cosmopolitan. A final round of jackknife analysis did not identify any additional bad matches. The result, the TEST 1-18 Library, was 1570 isolates with a 100% ARCC using a 3-way split of source classes and a 90% ARCC using a 7-way split. A total of 22% were left unidentified as singletons. The 7-way RCC was 90%. It is important to note that with the cosmopolitan isolates removed as a pre-step, the library dynamic was now different and other isolates were included and excluded that are different from the 12-17 library, besides the deletion of the cosmopolitans.
To compare the two versions of the library, the 79 Big Elm Creek known source isolates and the 76 Plum Creek known source isolates (before self-validation) were treated as unknowns and ran against each library version using a 3-way split of source classes and an 80% similarity cutoff. The rates of correct classification (RCC) and the percentage of isolates left unidentified were similar across libraries (Table 4).
Table 4: Library comparison treating known source isolates as unknowns.
Known Source Isolates (Percent of self-validated isolates)
Texas E.coli BST Library
ver. 12-17
RCC (% left UNID)
TEST 1-18 Library
RCC (% left UNID)
Big Elm Creek known source isolates 62/79 (78%) were self-validated
61% (19%) 63% (19%)
Plum Creek known source isolates 53/76 (70%) were self-validated
67% (13%) 60% (13%)
The 118 water isolates from Big Elm Creek and the 89 water isolates from Plum Creek were then run against the two libraries using a 3-way split of source classes and the 80% similarity cutoff. For the most part, results seem comparable (Table 5). However, the number of isolates identified as from Domestic Animals decreased 45% in the Big Elm Creek Watershed, due to cross-identification with Wildlife.
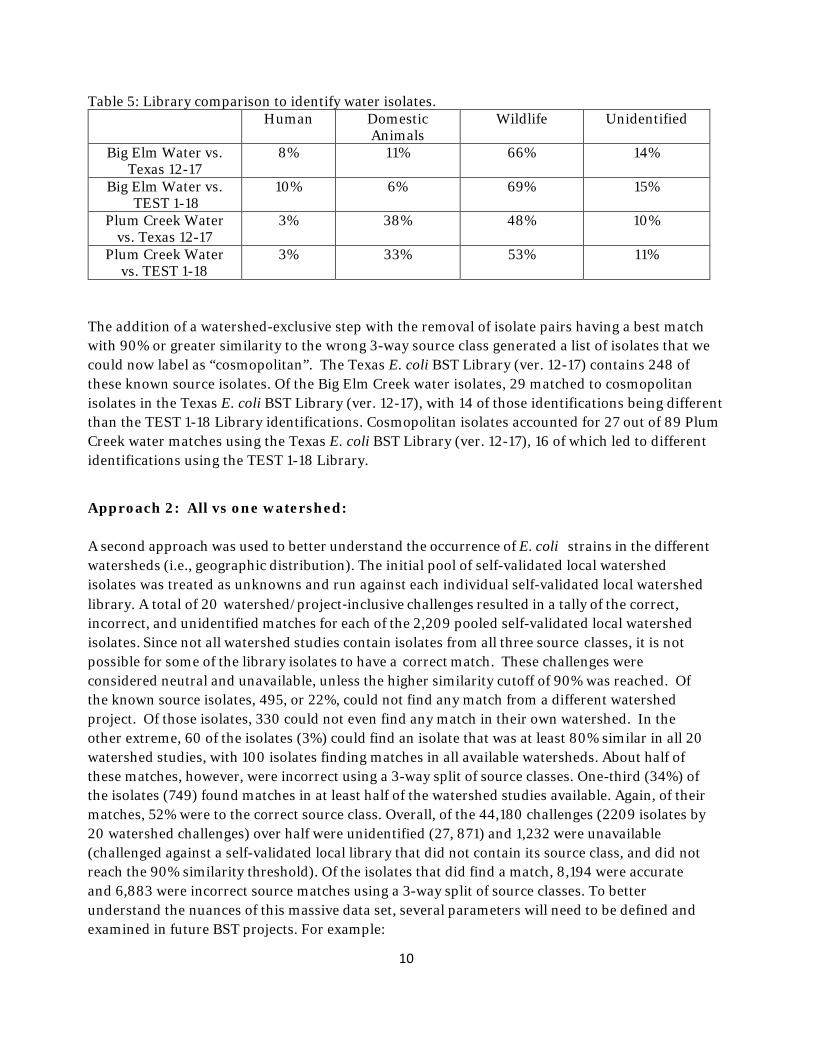
10
Table 5: Library comparison to identify water isolates. Human Domestic
Animals Wildlife Unidentified
Big Elm Water vs. Texas 12-17
8% 11% 66% 14%
Big Elm Water vs. TEST 1-18
10% 6% 69% 15%
Plum Creek Water vs. Texas 12-17
3% 38% 48% 10%
Plum Creek Water vs. TEST 1-18
3% 33% 53% 11%
The addition of a watershed-exclusive step with the removal of isolate pairs having a best match with 90% or greater similarity to the wrong 3-way source class generated a list of isolates that we could now label as “cosmopolitan”. The Texas E. coli BST Library (ver. 12-17) contains 248 of these known source isolates. Of the Big Elm Creek water isolates, 29 matched to cosmopolitan isolates in the Texas E. coli BST Library (ver. 12-17), with 14 of those identifications being different than the TEST 1-18 Library identifications. Cosmopolitan isolates accounted for 27 out of 89 Plum Creek water matches using the Texas E. coli BST Library (ver. 12-17), 16 of which led to different identifications using the TEST 1-18 Library.
Approach 2: All vs one watershed:
A second approach was used to better understand the occurrence of E. coli strains in the different watersheds (i.e., geographic distribution). The initial pool of self-validated local watershed isolates was treated as unknowns and run against each individual self-validated local watershed library. A total of 20 watershed/project‐inclusive challenges resulted in a tally of the correct, incorrect, and unidentified matches for each of the 2,209 pooled self-validated local watershed isolates. Since not all watershed studies contain isolates from all three source classes, it is not possible for some of the library isolates to have a correct match. These challenges were considered neutral and unavailable, unless the higher similarity cutoff of 90% was reached. Of the known source isolates, 495, or 22%, could not find any match from a different watershed project. Of those isolates, 330 could not even find any match in their own watershed. In the other extreme, 60 of the isolates (3%) could find an isolate that was at least 80% similar in all 20 watershed studies, with 100 isolates finding matches in all available watersheds. About half of these matches, however, were incorrect using a 3-way split of source classes. One-third (34%) of the isolates (749) found matches in at least half of the watershed studies available. Again, of their matches, 52% were to the correct source class. Overall, of the 44,180 challenges (2209 isolates by 20 watershed challenges) over half were unidentified (27, 871) and 1,232 were unavailable (challenged against a self-validated local library that did not contain its source class, and did not reach the 90% similarity threshold). Of the isolates that did find a match, 8,194 were accurate and 6,883 were incorrect source matches using a 3-way split of source classes. To better understand the nuances of this massive data set, several parameters will need to be defined and examined in future BST projects. For example:
11
• Should geographical range be defined as presence in a certain percentage of watershed
studies? • Should projects covering the same watershed over time be combined? • How should specificity be defined? • How should cosmopolitan be defined? At what point should they be removed? • How should transient isolates be defined? • Should rare isolates (only from 1 watershed ) be kept?
Statistical programs and expertise will be needed to sort through these 44,180 (2209X20) bits of data, but such an approach takes advantage of the strength and depth of 20 watershed studies across Texas and over a decade of effort.
Future Development of the Texas E. coli BST Library: As indicated in the preceding section, continued evaluation, expansion, and development of the Texas E. coli BST Library is needed as projects move into new watersheds and additional potential sources (e.g., nutria) are added. One key area for potential advancement is through more detailed statistical analysis of the Library. In addition to the question, "where can this fingerprint be found and is it reliably source specific?” other questions will also require a statistical approach. There is concern about potential library bias since isolates from wildlife make up nearly 50% of the Texas E. coli BST Library, which should be examined by a random sampling, or similar, technique. Questions of certainty in water isolate identification should also be examined with the goal of calculating confidence intervals when determining sources.
Further insight may also be gained by a retrospective study of water isolates that have been left unidentified in previous watershed studies. These ERIC-RP composite fingerprints generally represent around 15% of the water isolates. By analyzing which genotypes these represent, how they compare between watersheds, and if they match to known source isolates now in the library database, insight can be gained into the representativeness of the library. While all further analysis may give more insight into the biology and ecology of E. coli in the environment, the focus remains on how this information can be applied to the identification of the sources of fecal pollution in watersheds, and how this can be presented to stakeholders in a clear and useful manner.
12
Utilization of the Texas E. coli BST Library
During the project period, the Texas E. coli BST Library was used to identify fecal pollution source contributors in three watersheds: Big Elm Creek, Plum Creek, and the Trinity River in Tarrant Regional Water District’s service area. The library was supplemented with known source fecal E. coli isolates from the Big Elm Creek and Plum Creek watersheds.
Big Elm Creek In the Big Elm Creek Watershed, monthly water sampling was conducted at two sites over a 12-month period from February 2016 to January 2017. Up to eight isolates from each sample were isolated and confirmed as E. coli (modified mTEC and NA-MUG positive), and up to five isolates per sample were selected for ERIC-PCR and RiboPrinting (ERIC-RP). In total, 189 E. coli isolates were archived from the water samples received and 118 of them were DNA fingerprinted. Of these water isolates, 86% were able to be identified using the Texas E. coli BST Library (ver. 12-17), which includes 50 isolates from 36 known source samples from Big Elm Creek.
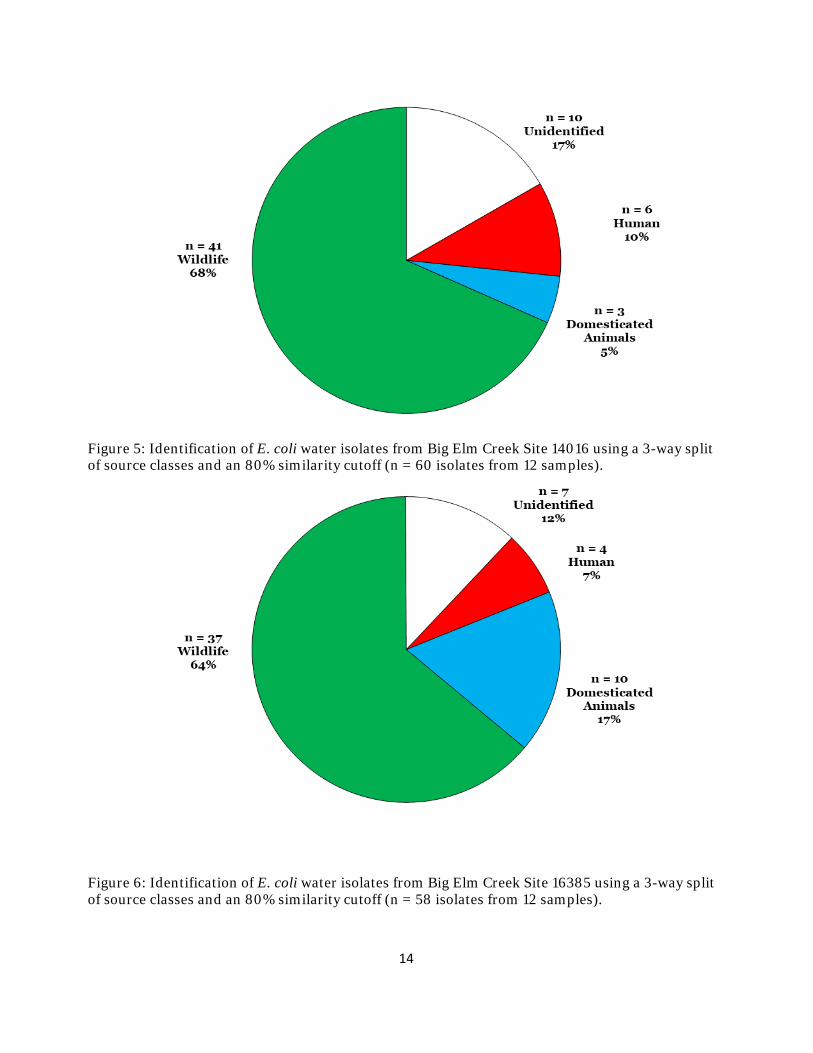
Wildlife (avian and non-avian) dominated identifications (66%) followed by domestic animals (11%) and human sources (9%) (Figure 3). Using the more detailed 7-way split, non-avian wildlife was the dominant contributor (52%), followed by avian wildlife (14%), human (9%), and cattle (6%) (Figure 4). 14% of the isolates were left unidentified. Dividing the isolates by site provides more detailed information about the sources. While Site 14016 followed the general trend discussed above (Figure 5), Site 16385 shows a higher level of isolates identified to domestic animals (17%), particularly cattle (Figure 6). Wildlife dominated identifications at both sites; however, the closest matches were different with about one quarter of the wildlife isolates best matching to mice and raccoons (10 isolates each) for Site 16385 and as many matches each to mice and deer at Site 14016 as to humans. The E. coli counts for both sites measured throughout the study resulted in geometric means of 271 CFU/100mL for Site 14016 and 121 CFU/100mL for Site 16385, making both sites of concern. Each site also had 3 sampling occasions that exceeded the individual sample limit of 399 CFU/100mL. Dividing the isolates from each site by compliance status does not seem to change the overall trends. Of the 15 isolates from the three samples that exceeded individual sample limits at Site 14016, 20% were identified as human, which is actually 3 out of 15 and may not be statistically significant. For site 16385, 5 of the 15 isolates from exceedance samples were left unidentified, giving a larger than typical 33% left unidentified.

13
Figure 3: Identification of E. coli water isolates from the Big Elm Creek Watershed using a 3-way split of source classes and an 80% similarity cutoff (n = 118 isolates from 24 samples).
Figure 4: Identification of E. coli water isolates from the Big Elm Creek Watershed using a 7-way split of source classes and an 80% similarity cutoff ( n = 118 isolates from 24 samples).
14
Figure 5: Identification of E. coli water isolates from Big Elm Creek Site 14016 using a 3-way split of source classes and an 80% similarity cutoff (n = 60 isolates from 12 samples).
Figure 6: Identification of E. coli water isolates from Big Elm Creek Site 16385 using a 3-way split of source classes and an 80% similarity cutoff (n = 58 isolates from 12 samples).
15
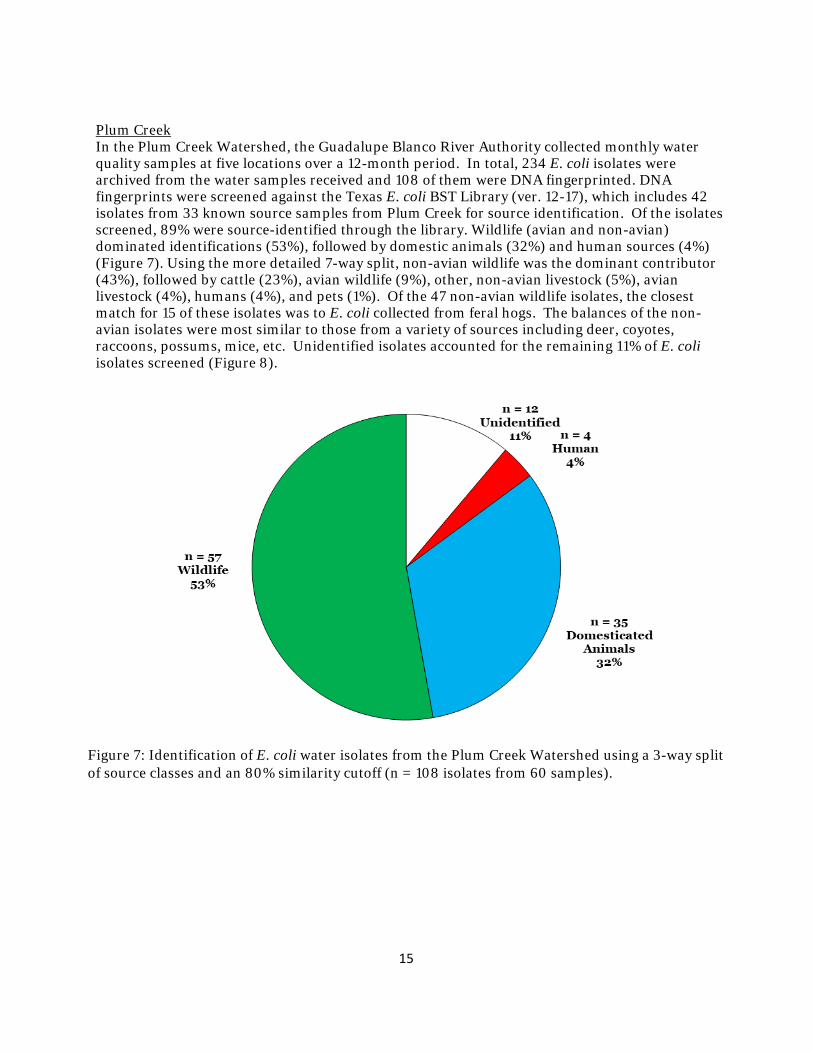
Plum Creek In the Plum Creek Watershed, the Guadalupe Blanco River Authority collected monthly water quality samples at five locations over a 12-month period. In total, 234 E. coli isolates were archived from the water samples received and 108 of them were DNA fingerprinted. DNA fingerprints were screened against the Texas E. coli BST Library (ver. 12-17), which includes 42 isolates from 33 known source samples from Plum Creek for source identification. Of the isolates screened, 89% were source-identified through the library. Wildlife (avian and non-avian) dominated identifications (53%), followed by domestic animals (32%) and human sources (4%) (Figure 7). Using the more detailed 7-way split, non-avian wildlife was the dominant contributor (43%), followed by cattle (23%), avian wildlife (9%), other, non-avian livestock (5%), avian livestock (4%), humans (4%), and pets (1%). Of the 47 non-avian wildlife isolates, the closest match for 15 of these isolates was to E. coli collected from feral hogs. The balances of the non-avian isolates were most similar to those from a variety of sources including deer, coyotes, raccoons, possums, mice, etc. Unidentified isolates accounted for the remaining 11% of E. coli isolates screened (Figure 8).
Figure 7: Identification of E. coli water isolates from the Plum Creek Watershed using a 3-way split of source classes and an 80% similarity cutoff (n = 108 isolates from 60 samples).

16
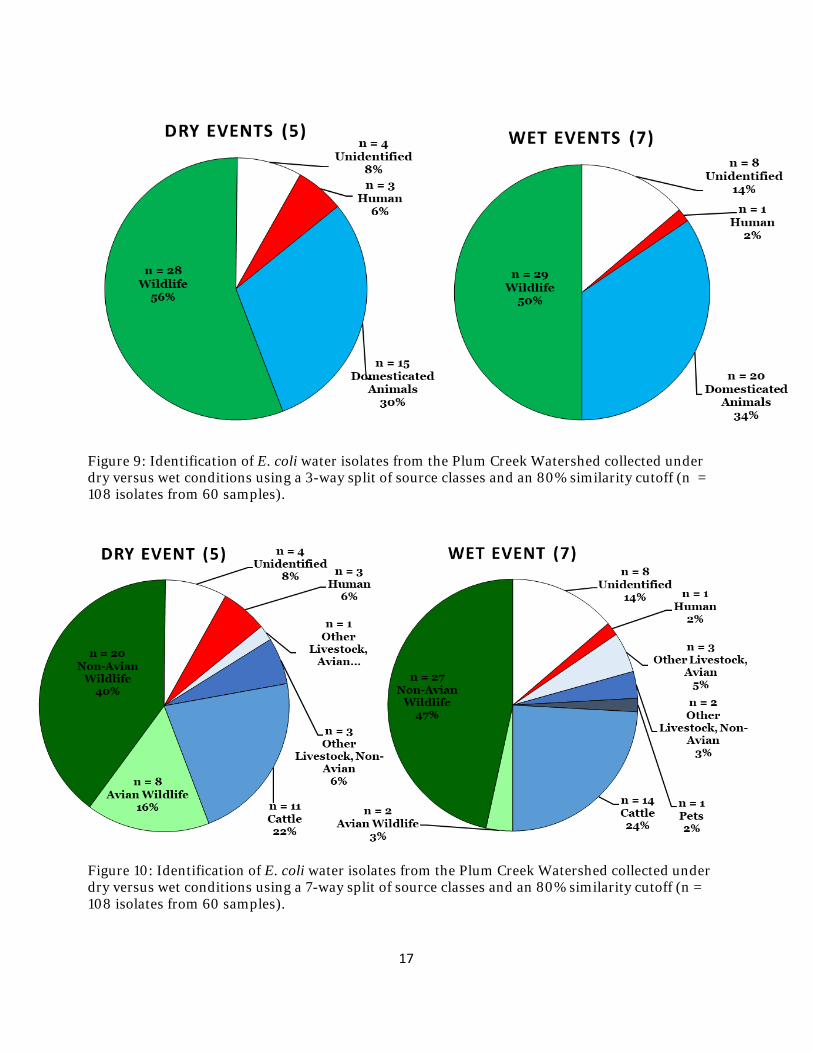
The sources were largely comparable for samples collected under dry and wet conditions (Figures 9 & 10). There was a lower proportion of human isolates detected under wet (2%) versus dry (6%) conditions, which would be consistent with dilution of human sources with increased water volume. The proportion of avian wildlife sources decreased from 16% under dry conditions to 3% under wet conditions, which is also consistent with dilution during increased flow conditions. In contrast, the proportion of unidentified isolated increased from 8% under dry conditions to 14% under wet conditions, which is consistent with results observed in other watersheds and is possibly due to unidentified sources and/or naturalized E. coli populations that are mobilized with rainfall and increased flow.
Figure 8: Identification of E. coli water isolates from the Plum Creek Watershed using a 7-way split of source classes and an 80% similarity cutoff (n = 108 isolates from 60 samples).
17
Figure 9: Identification of E. coli water isolates from the Plum Creek Watershed collected under dry versus wet conditions using a 3-way split of source classes and an 80% similarity cutoff (n = 108 isolates from 60 samples).
Figure 10: Identification of E. coli water isolates from the Plum Creek Watershed collected under dry versus wet conditions using a 7-way split of source classes and an 80% similarity cutoff (n = 108 isolates from 60 samples).
18
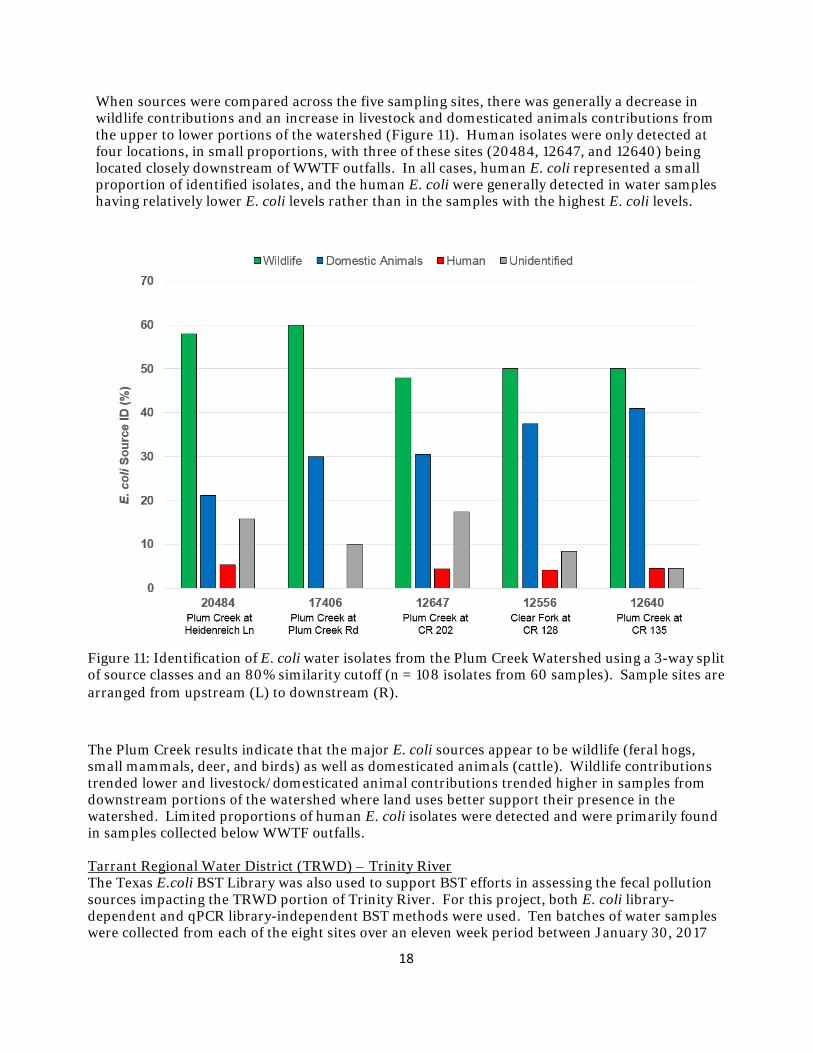
When sources were compared across the five sampling sites, there was generally a decrease in wildlife contributions and an increase in livestock and domesticated animals contributions from the upper to lower portions of the watershed (Figure 11). Human isolates were only detected at four locations, in small proportions, with three of these sites (20484, 12647, and 12640) being located closely downstream of WWTF outfalls. In all cases, human E. coli represented a small proportion of identified isolates, and the human E. coli were generally detected in water samples having relatively lower E. coli levels rather than in the samples with the highest E. coli levels.
Figure 11: Identification of E. coli water isolates from the Plum Creek Watershed using a 3-way split of source classes and an 80% similarity cutoff (n = 108 isolates from 60 samples). Sample sites are arranged from upstream (L) to downstream (R).
The Plum Creek results indicate that the major E. coli sources appear to be wildlife (feral hogs, small mammals, deer, and birds) as well as domesticated animals (cattle). Wildlife contributions trended lower and livestock/domesticated animal contributions trended higher in samples from downstream portions of the watershed where land uses better support their presence in the watershed. Limited proportions of human E. coli isolates were detected and were primarily found in samples collected below WWTF outfalls.
Tarrant Regional Water District (TRWD) – Trinity River The Texas E.coli BST Library was also used to support BST efforts in assessing the fecal pollution sources impacting the TRWD portion of Trinity River. For this project, both E. coli library-dependent and qPCR library-independent BST methods were used. Ten batches of water samples were collected from each of the eight sites over an eleven week period between January 30, 2017
19
and April 18, 2017. The first two batches of water samples were analyzed for the Bacteroidales GenBac3 general (1), HF183/BacR287 human (2), and BacCow ruminant (and other animals; (3)) and Helicobacter GFD bird (4) qPCR markers. For the remaining eight batches of samples, up to 12 E. coli were isolated and archived from each water sample. ERIC-PCR and RiboPrinting composite DNA fingerprints (ERIC-RP) were generated for up to 10 of these E. coli isolates per sample. These patterns were compared to the Texas E. coli BST Library (ver. 5-15) (before the addition of known source isolates from Big Elm Creek and Plum Creek) in an attempt to identify sources contributing to bacterial loading in the TWRD portion of the Trinity River. No concurrent known source samples were collected from the watershed. However, the Texas E. coli BST Library (ver. 5-15) does contain 47 known source isolates from the Trinity River Watershed that were acquired from a 2005 BST study by The Institute for Environmental Health in Seattle, WA.
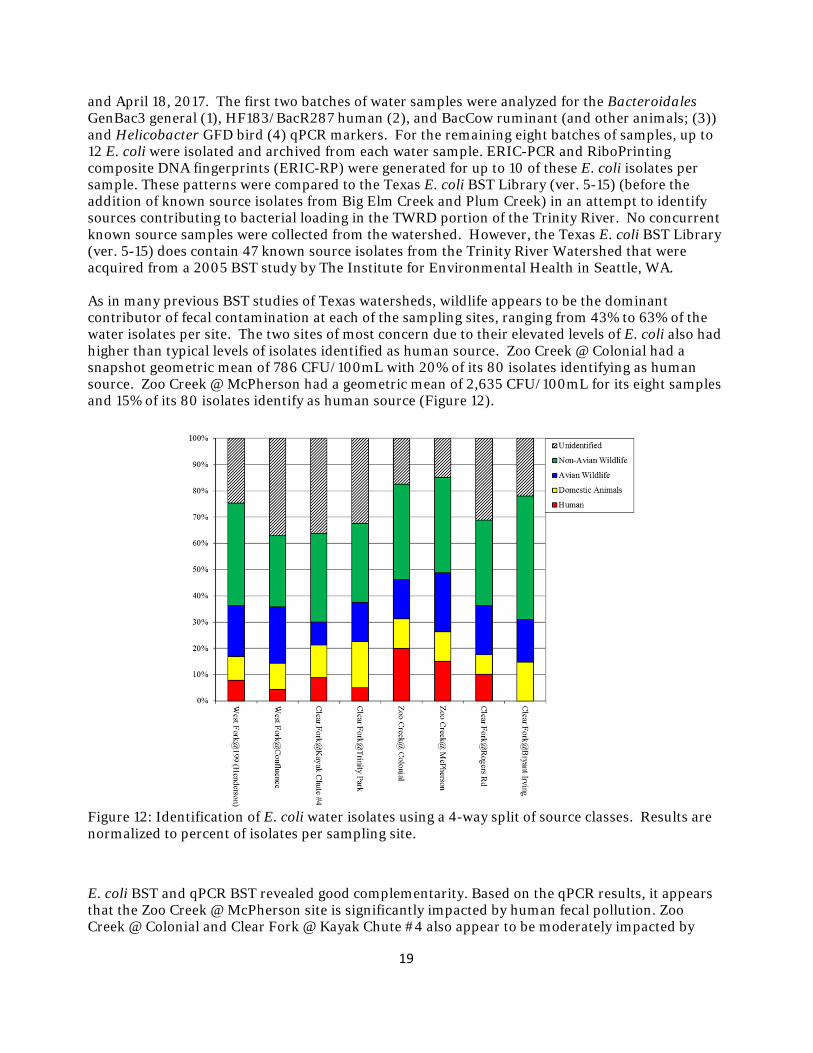
As in many previous BST studies of Texas watersheds, wildlife appears to be the dominant contributor of fecal contamination at each of the sampling sites, ranging from 43% to 63% of the water isolates per site. The two sites of most concern due to their elevated levels of E. coli also had higher than typical levels of isolates identified as human source. Zoo Creek @ Colonial had a snapshot geometric mean of 786 CFU/100mL with 20% of its 80 isolates identifying as human source. Zoo Creek @ McPherson had a geometric mean of 2,635 CFU/100mL for its eight samples and 15% of its 80 isolates identify as human source (Figure 12).
Figure 12: Identification of E. coli water isolates using a 4-way split of source classes. Results are normalized to percent of isolates per sampling site.
E. coli BST and qPCR BST revealed good complementarity. Based on the qPCR results, it appears that the Zoo Creek @ McPherson site is significantly impacted by human fecal pollution. Zoo Creek @ Colonial and Clear Fork @ Kayak Chute #4 also appear to be moderately impacted by
20
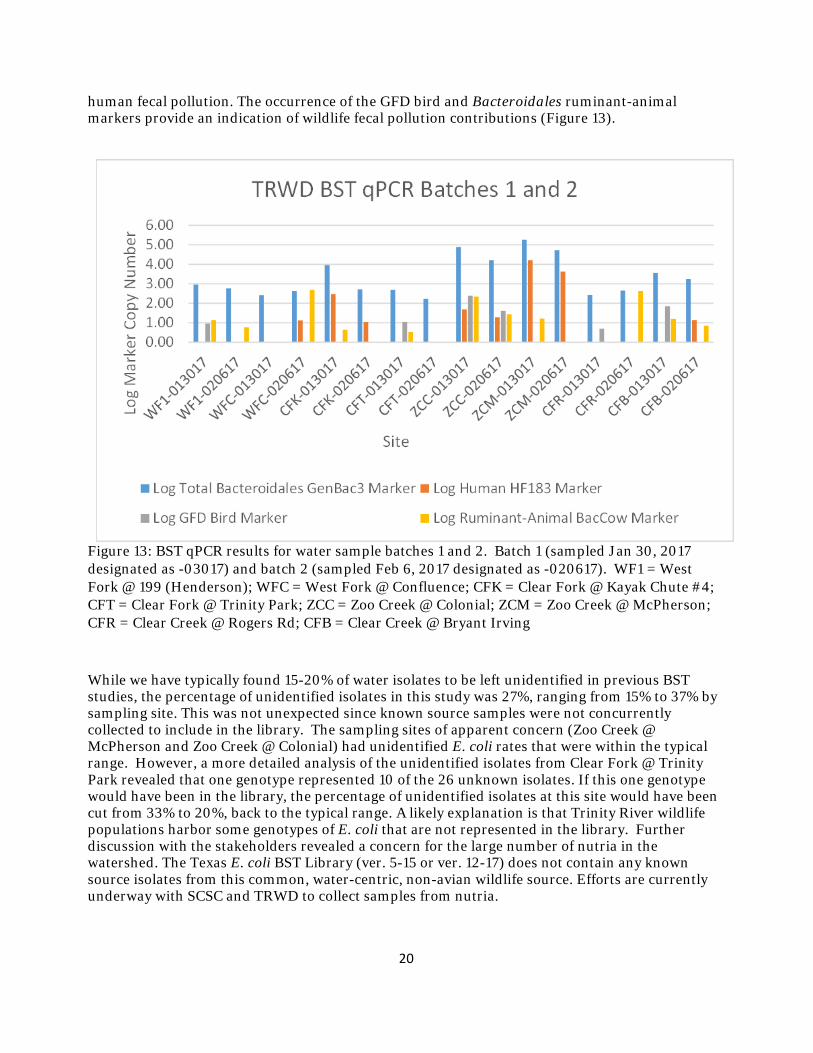
human fecal pollution. The occurrence of the GFD bird and Bacteroidales ruminant-animal markers provide an indication of wildlife fecal pollution contributions (Figure 13).
Figure 13: BST qPCR results for water sample batches 1 and 2. Batch 1 (sampled Jan 30, 2017 designated as -03017) and batch 2 (sampled Feb 6, 2017 designated as -020617). WF1 = West Fork @ 199 (Henderson); WFC = West Fork @ Confluence; CFK = Clear Fork @ Kayak Chute #4; CFT = Clear Fork @ Trinity Park; ZCC = Zoo Creek @ Colonial; ZCM = Zoo Creek @ McPherson; CFR = Clear Creek @ Rogers Rd; CFB = Clear Creek @ Bryant Irving
While we have typically found 15-20% of water isolates to be left unidentified in previous BST studies, the percentage of unidentified isolates in this study was 27%, ranging from 15% to 37% by sampling site. This was not unexpected since known source samples were not concurrently collected to include in the library. The sampling sites of apparent concern (Zoo Creek @ McPherson and Zoo Creek @ Colonial) had unidentified E. coli rates that were within the typical range. However, a more detailed analysis of the unidentified isolates from Clear Fork @ Trinity Park revealed that one genotype represented 10 of the 26 unknown isolates. If this one genotype would have been in the library, the percentage of unidentified isolates at this site would have been cut from 33% to 20%, back to the typical range. A likely explanation is that Trinity River wildlife populations harbor some genotypes of E. coli that are not represented in the library. Further discussion with the stakeholders revealed a concern for the large number of nutria in the watershed. The Texas E. coli BST Library (ver. 5-15 or ver. 12-17) does not contain any known source isolates from this common, water-centric, non-avian wildlife source. Efforts are currently underway with SCSC and TRWD to collect samples from nutria.
21
BST Program Outreach
Outreach regarding BST was also a focus of the project. AgriLife Today, the media outlet for Texas A&M College of Agriculture and Texas A&M AgriLife Research and Extension published an article titled “Research team enhances identification process for bacterial pollution in watersheds” in December 2016. Other outlets including the World News, Bryan-College Station Eagle, Del Rio News Herald, Wilson County News, TSSWCB and the National Institute for Water Resources media all reprinted this story. This article was also reprinted in TWRI’s Conservation Matters and titled “Watersheds across Texas benefit from bacterial source tracking research team’s work” (Appendix A). Conservation Matters is an electronic newsletter that is distributed via email and published online. The newsletter was sent to 2,248 subscribers, with 615 of them opening it, while the website received 113 views. Subsequent Facebook posts about the story and the Texas BST Program reached a combined total of 1,473 readers, with 13 likes and 1 share. On TWRI’s Twitter feed, TxWRI, content related to the BST article and program was distributed via 15 tweets that resulted in 6,901 impressions with a 1.1% engagement rate. Components of the BST program were presented at two conferences. SCSC gave a presentation on “Bacterial Source Tracking: Potential Application to Drinking Water Wells” at the Soil and Water Conservation Society Annual Conference in Louisville, KY, during July 24-27, 2016. Two presentations, one on refinement of poultry markers and the other on characterizing soil E. coli in Riesel were presented by SCSC in June 2017 at the American Society for Microbiology’s ASM Microbe Conference in New Orleans, LA. Information on BST application was also presented to local groups. In July and September 2016, BST application in watershed management and BST support for quantitative microbial risk assessment were presented, respectively, to attendees of the Watershed Coordinator Steering Committee meeting held quarterly in Columbus, TX. An introductory presentation titled “Bacterial Source Tracking” was delivered to the TAMU Student Chapter of the Soil and Water Conservation Society on October 17, 2016 by SCSC. Individual or small group meetings were also held with representatives of the Galveston Bay Estuary Program, Texas Institute for Applied Environmental Research, the University of Houston at Victoria, and the University of Texas at San Antonio to discuss the capabilities and applicability of BST. Two projects evolved from these discussions: “Bacterial Source Tracking (BST) Assessment of Fecal Pollution Sources Impacting the Tarrant Regional Water District Trinity River” and “Bacterial Source Tracking (BST) on Tributaries of Trinity and Galveston Bays”.
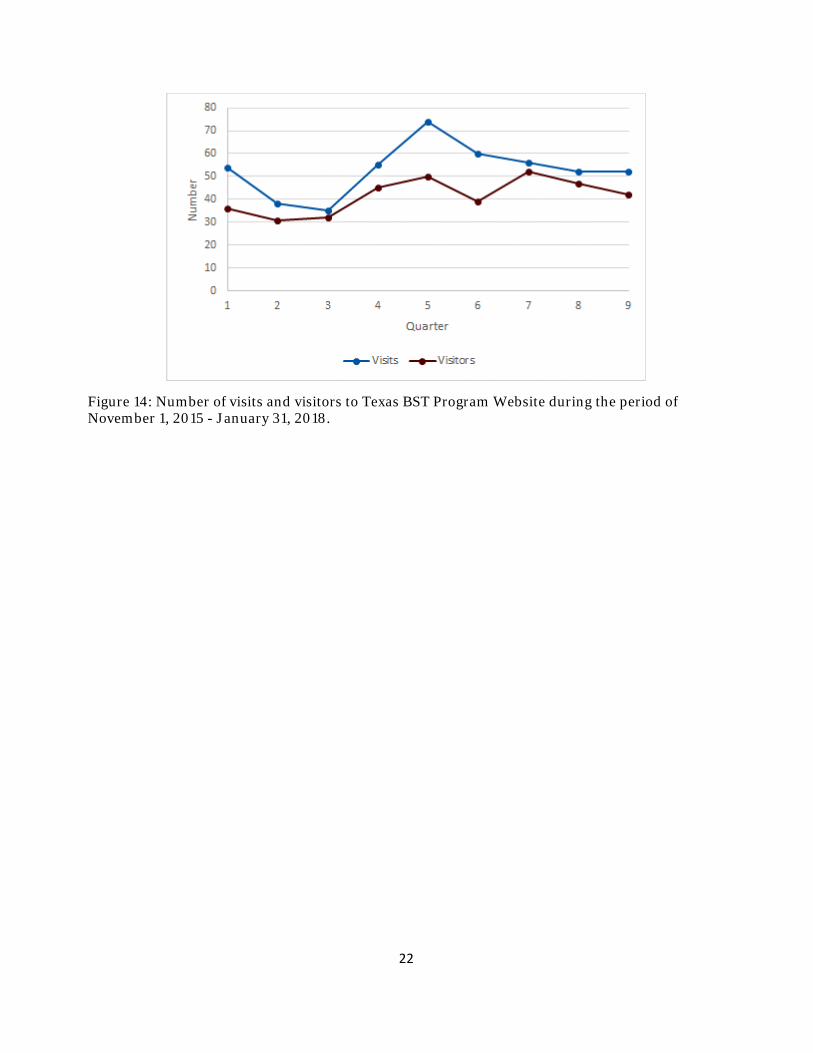
Finally, TWRI hosted and maintained the Texas BST Library website. From November 1, 2015 through January 31, 2018, there were 476 visits from 374 visitors (Figure 14). Of the 476 visits, 257 were from the United States and 195 were from Texas (predominantly College Station, Austin, Houston, and San Antonio). The Czech Republic was second to the United States in number of visits with 64. There were 1,273 page views, for a result of 2.67 pages per session. On average, users stayed on the site for 2 minutes and 10 seconds. Peak visits occurred in the 5th
quarter following the news release and subsequent Facebook activity highlighting the Texas BST Program.
22
Figure 14: Number of visits and visitors to Texas BST Program Website during the period of November 1, 2015 - January 31, 2018.
23
Literature Cited
Altschul, S. F., T. L. Madden, A. A. Schäffer, J. Zhang, Z. Zhang, W. Miller and D. J. Lipman (1997). "Gapped BLAST and PSI‐BLAST: a new generation of protein database search programs." Nucleic Acids Res 25: 3389‐3402.
Bernhard, A. E. and K. G. Field (2000). "A PCR assay to discriminate human and ruminant feces on the basis of host differences in Bacteroides‐Prevotella genes encoding 16S rRNA." Appl Environ Microbiol 66(10): 4571‐4574.
Berthold, A., G. Di Giovanni, E. Casarez, J. Benavides (2015). Bacterial Source Tracking to Support Adaptive Management of the Arroyo Colorado Watershed Protection Plan. College Station, Texas, Texas Water Resources Institute Technical Report TR‐494.
Brennan, F. P., F. Abram, F. A. Chinalia, K. G. Richards and V. O'Flaherty (2010).
"Characterization of environmentally persistent Escherichia coli isolates leached from an Irish soil." Appl Environ Microbiol 76(7): 2175‐2180.
Brinkmeyer, R., R. M. Amon, J. R. Schwarz, T. Saxton, D. Roberts, S. Harrison, N. Ellis, J. Fox, K. DiGuardi,
M. Hochman, S. Duan, R. Stein and C. Elliott (2015). "Distribution and persistence of Escherichia coli and Enterococci in stream bed and bank sediments from two urban streams in Houston, TX." Sci Total Environ 502: 650‐658.
Byappanahalli, M. N., B. M. Roll and R. S. Fujioka (2012). "Evidence for occurrence, persistence, and growth potential of Escherichia coli and enterococci in Hawaii's soil environments." Microbes Environ 27(2): 164‐170.
Byappanahalli, M. N., R. L. Whitman, D. A. Shively, M. J. Sadowsky and S. Ishii (2006). "Population structure, persistence, and seasonality of autochthonous Escherichia coli in temperate, coastal forest soil from a Great Lakes watershed." Environ Microbiol 8(3): 504‐513.
Desai, A. M. and H. S. Rifai (2013). "Escherichia coli concentrations in urban watersheds exhibit diurnal sag: implications for water‐quality monitoring and assessment." JAWRA Journal of the American Water Resources Association 49(4): 766‐779.
Di Giovanni, G. D., E. A. Casarez, J. A. Truesdale, T. J. Gentry, P. Wanjugi, E. Martin and K. Wagner (2015).
Expansion and Evaluation of Texas' Bacterial Source Tracking Program. College Station, Texas, Texas Water Research Institute Technical Report TR‐493.
Ishii, S., W. B. Ksoll, R. E. Hicks and M. J. Sadowsky (2006). "Presence and growth of
naturalized Escherichia coli in temperate soils from Lake Superior watersheds." Appl Environ Microbiol 72(1): 612‐621.
Jones, C. A., K. Wagner, G. D. Di Giovanni, L. Hauck, J. Mott, H. Rifai, R. Srinivasan and G. Ward
(2007). Bacteria Total Maximum Daily Load Task Force Final Report, College Station, Texas, Texas Water Resource Institute Technical Report TR‐341.
24
Kobayashi, A., D. Sano, J. Hatori, S. Ishii and S. Okabe (2013). "Chicken‐ and duck‐associated Bacteroides‐ Prevotella genetic markers for detecting fecal contamination in environmental water." Appl Microbiol Biotechnol 97(16): 7427‐7437.
Perchec‐Merien, A. M. and G. D. Lewis (2013). "Naturalized Escherichia coli from New Zealand wetland and stream environments." FEMS Microbiol Ecol 83(2): 494‐503.
Pisciotta, J. M., D. F. Rath, P. A. Stanek, D. M. Flanery and V. J. Harwood (2002). "Marine bacteria cause false‐positive results in the Colilert‐18 rapid identification test for Escherichia coli in Florida waters." Appl Environ Microbiol 68(2): 539‐544.
Tymensen, L. D., F. Pyrdok, D. Coles, W. Koning, T. A. McAllister, C. C. Jokinen, S. E. Dowd and N. F. Neumann (2015). "Comparative accessory gene fingerprinting of surface water Escherichia coli reveals genetically diverse naturalized population." J Appl Microbiol 119(1): 263‐277.
Walk, S. T., E. W. Alm, L. M. Calhoun, J. M. Mladonicky and T. S. Whittam (2007). "Genetic diversity and population structure of Escherichia coli isolated from freshwater beaches." Environ Microbiol 9(9): 2274‐2288.
25
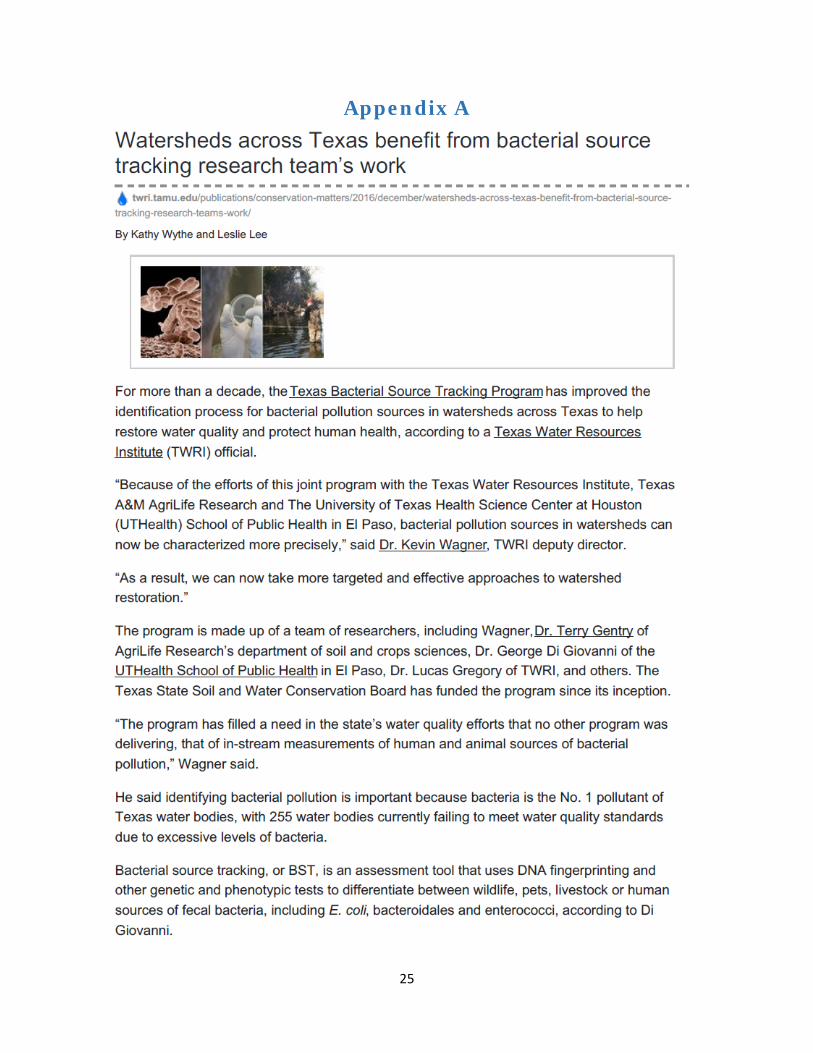
Appendix A
26
27


![Jst bst [portfolio]](https://img.pdfslide.us/doc/110x75/547b8193b4af9fda158b4ed4/jst-bst-portfolio.jpg)