Embed Size (px)
Citation preview
12-31-14
1Preliminary Consortium Draft December
SECTION I. INTRODUCTION to the TETON VIEW REGIONAL PLAN for SUSTAINABLE DEVELOPMENT
The Teton View Regional Plan for Sustainable Development (RPSD) is designed to help city and county officials and public land managers better coordinate their land use planning, resource management, and community development efforts for the region’s long-term benefit. The studies and tools developed as part of this planning process will help communities deal with changing economic and environmental conditions and to prepare for a more resilient future.
This plan has been cooperatively developed on a four- c ount y, t w o-state sc ale because Census data and socioeconomic studies show that our 83,000+ residents actually lead reg io nal lives. Many of us live in one county, but daily commute to work in another county. We travel great distances to shop or use medical facilities found in larger cities. Sometimes we choose to recreate in our own backyard, but frequently we choose to travel across state and county lines for adventures far from home.
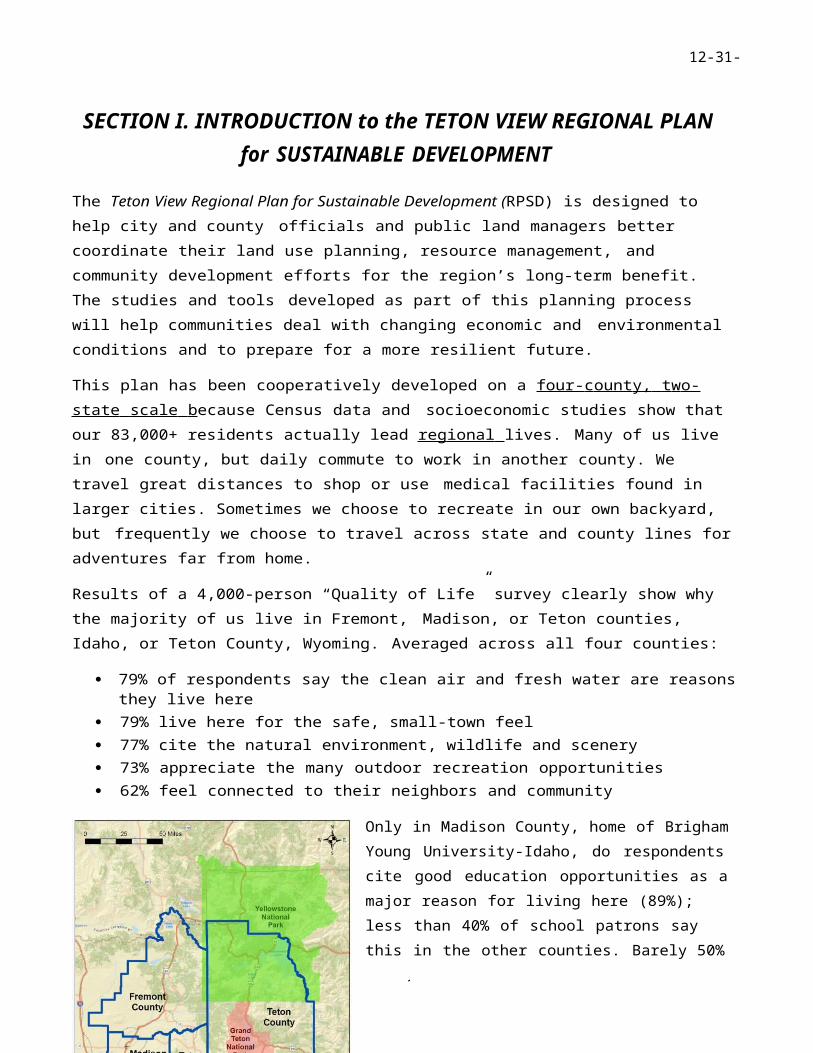
Results of a 4,000-person “Quality of Life” survey clearly show why the majority of us live in Fremont, Madison, or Teton counties, Idaho, or Teton County, Wyoming. Averaged across all four counties:
79% of respondents say the clean air and fresh water are reasons they live here 79% live here for the safe, small-town feel 77% cite the natural environment, wildlife and scenery 73% appreciate the many outdoor recreation opportunities 62% feel connected to their neighbors and community
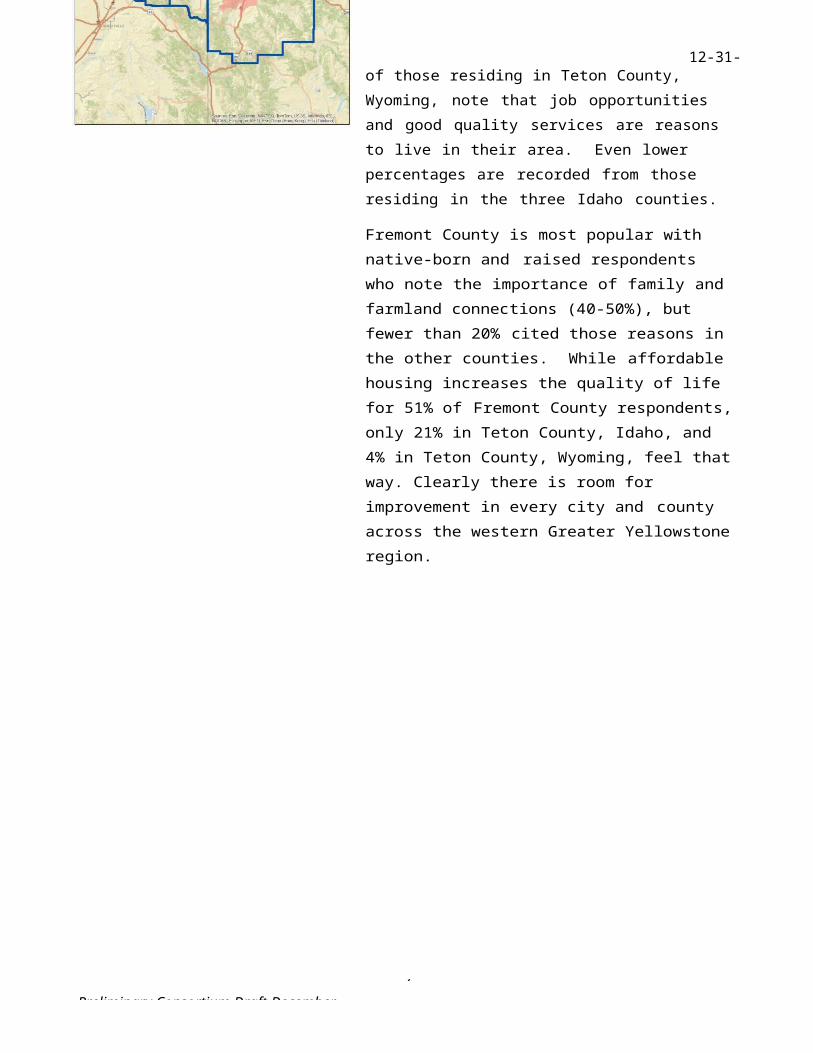
Only in Madison County, home of Brigham Young University-Idaho, do respondents cite good education opportunities as a major reason for living here (89%); less than 40% of school patrons say this in the other counties. Barely 50% of those residing in Teton County, Wyoming, note that job opportunities and good quality services are reasons to live in their area. Even lower percentages are recorded from those residing in the three Idaho counties.
Fremont County is most popular with native-born and raised respondents who note the importance of family and farmland connections (40-50%), but fewer than 20% cited those reasons in the other counties. While affordable housing increases the quality of life for 51% of Fremont County respondents, only 21% in Teton County, Idaho, and 4% in Teton County, Wyoming, feel that way. Clearly there is room for improvement in every city and county across the western Greater Yellowstone region.
12-31-14
2Preliminary Consortium Draft December
HUD SUSTAINABLE COMMUNITIES REGIONAL PLANNING GRANT
In February 2012 the Western Greater Yellowstone Consortium (WGYC) launched a 3-year planning process with the assistance of a $1.5 million Sustainable Communities Regional Planning Grant received from the U.S. Department of Housing and Urban Development (HUD). The HUD Grant helped fund a range of regional studies related to land use, housing, economic, mobility, broadband capacity, recycling infrastructure, and sustainability indicators as well as training and technical assistance for local communities. Study findings and recommendations, and the final reports from technical assistance projects have been integrated into this one regional plan that covers the diversity of communities and landscapes that lie within the four “Teton View” counties.
In addition to Fremont, Madison and Teton counties, Idaho, and Teton County, Wyoming, Consortium signatories included the Idaho cities of Island Park, Ashton, St. Anthony, Rexburg, Driggs, and Victor, plus the Town of Jackson, Wyoming. The public land management agencies that also signed on were the Caribou-Targhee and Bridger-Teton national forests, the USDI Bureau of Land Management (Upper Snake River District), and the Idaho State Department of Lands. The Yellowstone Business Council (dba the Yellowstone Business Partnership) and the Ashton Community Foundation participated as nonprofit partners in the consortium, and Fremont County, Idaho, served as the overall project administrator.
The Teton View Regional Plan includes two guiding documents that were developed for those localities seeking to operate more sustainably and to build resilience into their economies and infrastructure:
The Model Development Code provides a menu of land use concepts and building ordinances that a locality may choose to adopt to advance its sustainability goals and objectives.
A new version of the Greater Yellowstone Framework for Sustainable Development (GY- Framework) is now available with certification criteria designed for local governments.
By using the Model Code and GY-Framework as a “development toolkit” and voluntarily implementing projects proposed in this regional plan, local communities and land management agencies will help advance these “Livability Principles” across the Teton View region:
Provide More Transportation Choices Provide Equitable, Affordable Housing Enhance Economic Competitiveness Support Existing Communities Coordinate Policies and Leverage Investment Value Communities and Neighborhoods
The Teton View Regional Plan thus charts a realistic path towards economic and community resiliency across a changing social and environmental landscape. As they are realized, the plan’s recommended strategies and projects will help promote equity and fairness for all who come to live and work here, while enhancing the quality of life for those who have always called this region home.
12-31-14
3Preliminary Consortium Draft December
PUBLIC PARTICIPATION REQUIREMENTS AND PHILOSOPHY
From the beginning of the grant process, HUD emphasized the importance of involving the public in all activities associated with the Western Greater Yellowstone Consortium. The Consortium members agreed and embraced the opportunity to design a full suite of public participation activities consistent with the fundamental principles of the International Association for Public Participation (IAP2). Those principles include the IAP2 Core Valu es and Code of Ethic s to guide design and implementation of public involvement activities. The complexity of the project as a whole has afforded multiple opportunities to stakeholders depending on their specific interests.
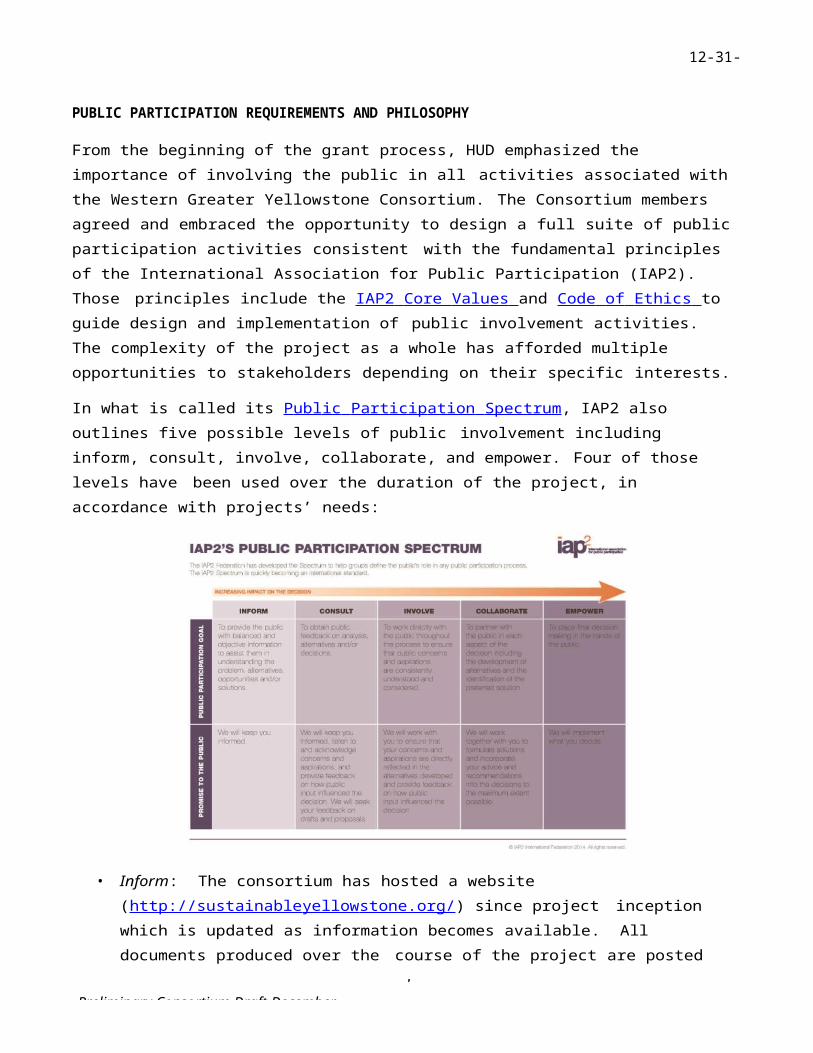
In what is called its P ubl ic Particip ation Spectrum , IAP2 also outlines five possible levels of public involvement including inform, consult, involve, collaborate, and empower. Four of those levels have been used over the duration of the project, in accordance with projects’ needs:
• Inform: The consortium has hosted a website (http://sustainable yellow stone.org/ ) since project inception which is updated as information becomes available. All documents produced over the course of the project are posted there. Documentation of all public participation, including the consortium meeting records and annual summit presentations, are included in Appendix 1 of this plan.
• Consult: The consortium has invited input from the public at various junctures with each individual study and throughout the project. One example is the Wayfinding Signage Project for the City of Driggs, Idaho. Following a community workshop where information was shared about what “wayfinding” is, stakeholders had the opportunity to submit comments to assist a contractor in developing a Signage Plan for Driggs. Please refer to the specific project reports contained in the appendices for descriptions of how each contractor has consulted with stakeholders.

12-31-14
4Preliminary Consortium Draft December
• Involve: Some studies have afforded more frequent involvement of key stakeholders throughout. One example is the Greater Yellowstone Trail Concept Plan. The project team traveled the entire length of the proposed 170 mile Greater Yellowstone Trail corridor October 2-3 to meet with stakeholders in each community and view existing sections of rail bed or trail. The intent of this trip was to gain a feel for the area, verify trail gaps, and obtain a realistic understanding of community needs and desires. A November 21, 2014 workshop pulled 25 key stakeholders together to discuss the findings of the site visits, consider specific issues (i.e., motorized access, paving, etc.) and discuss various project proposals for completing the entire trail corridor.
• Collaborate: The consortium formed “Design Teams” for the several of the studies, including:
o Assessment of Teton View Agriculture for Local and Regional Marketso Greater Yellowstone Framework for Local Governmentso Regional Recycling System Feasibility Studyo Regional Index of Sustainability Indicatorso Western Greater Yellowstone Area Housing Needs Assessment and Regional Analysis
of Implements to Fair Housing Choice
These teams invited the very most interested stakeholders to sit at the table with consortium members in designing and conducting studies. Each provided guidance on overall study design, drafted requests for proposals for contract services, assisted in reviewing proposals and selecting contractors, provided regionally appropriate technical information and guidance to selected contractors, and reviewed preliminary project reports prepared by contractors. For a detailed example of how Design Teams were used, see the description of the role played by the Indicators Design Team in the final report on the Regional Index of Sustainability Indicators in Appendix I.
Program-Wide Public Involvement Opportunities
Some stakeholders have expressed interest in the entire program. Program-side public involvement opportunities have included:
• Project kick-off meeting held on February 15, 2012. This session was attended by a total of 59 people. Objectives for this session included sharing information about how the HUD grant would address common problems faced by the four counties in the Consortium and how HUD’s “Livability Principles” would be used to guide the Consortium’s sustainable development plan; provide the opportunity for participants to: 1) help identify existing resources/efforts, information gaps, and critical areas of focus and 2) discuss the best ways to engage the interested public and underserved populations; and to allow interested stakeholders the opportunity to sign up to serve on one or more of the Design Teams being convened to provide direction for each of the projects to be conducted during preparation of the Teton View Regional Plan.
12-31-14
5Preliminary Consortium Draft December
• An annual summit held on May 2, 2013 and attended by 48 people. Objectives for the session included: providing an overall status of the project; introductions to the two Regional Administrators for the US Department of Housing and Urban Development; receive reports on the progress of several specific projects; and soliciting input for use during development of the Regional Index of Sustainability Indicators.
• An annual summit held on May 7, 2014 and attended by 62 people. Objectives for the session included: receiving an overall status of the project as well as project specific status reports for most of the specific projects; providing feedback to HUD officials in response to four questions:1) In your experience, what have been the positive outcomes attributable the HUD grant in our region to date? 2) What barriers do you think the Western Greater Yellowstone Consortium has faced over the last two years? 3) What strategies or resources might we consider to help overcome barriers and address gaps to finish and implement our plan? 4) What suggestions do you have for HUD, DOT, and EPA as the Partnership for Sustainable Communities continues its work strengthen communities – particularly for rural places?
In addition, the Consortium will conduct a final public involvement period between February 23 and March 22, 2015. Opportunities for the public to provide input will include a survey instrument administered via the project website and attendance at four public sessions (one each planned for each county). The public sessions will be scheduled following briefings scheduled for county and city elected officials throughout the planning area. The briefings will be designed to provide an overall orientation to the entire project as well as an introduction to the Teton View Regional Plan. The public input sessions will be designed to share project ideas for possible implementation upon completion of the Teton View Regional Plan and invite interested stakeholders to assist in ranking those project ideas.The website will be designed to mirror the in-person experience for any interested stakeholders who are unable to attend one of the four public input sessions. The results of the public involvement period will be summarized in Chapter 8 of the Final Teton View Regional Plan and fully analyzed in the final version of Appendix I – Record of Public Participation.
Appendix I will also include a full listing of stakeholders who participated in the development of the Teton View Regional Plan. Even that listing will be a fall short of a full accounting of the regional residents touched during the development of the Plan. Additional points of engagement occurred during collection of data for several of the studies. One example was the 4,059 people who were surveyed during development of the Western Greater Yellowstone Area Housing Needs Assessment. Another example is the 90 people who were tapped during development of the Assessment of Teton View Agriculture for Local and Regional Markets, including 49 people who submitted survey instruments, 24 people who were interviewed one-on-one, and the 17 people who participated in focus group discussions.
12-31-14
6Preliminary Consortium Draft December
ORGANIZATION OF THE TETON VIEW REGIONAL PLAN
The Teton View Regional Plan is presented in five sections including this first introductory section. Section II provides an overview of the formation of the Yellowstone-Teton landscapes and the people who have since resided or seasonally visited this place. Sections III & IV include a total of six chapters that present themes (stated as goals) and strategies organized by regional character type. In Section V a range of possible projects that would advance one or more strategies are organized under six major initiatives that the region may choose to pursue. Each chapter includes recommended sustainability indicators to help measure our collective progress at both community and system-wide level.
Although 80% of the lands in the Teton View region are public rather than private lands, residents and visitors have benefited greatly from the natural resource base protected and managed by local, state and federal agencies. Each government jurisdiction is responsible for the long-term stewardship of their lands that are managed to meet specific agency missions. Historically the region’s economy has been intertwined with how well these missions are fulfilled. In presenting our plan’s strategies, we felt it important to group those chapters that rely on healthy soils, water, range, forests, parks and wildlife.
SECTION III. PRODUCTIVE LANDSCAPES: Managed well, our region’s abundant natural resources will continue to sustain our rural economies and enhance our high quality of life.
Chapter 1. Our Agricultural HeritageChapter 2. Our Wildlife, Public Lands and Special Sites Chapter 3. Four-Season Recreation
Most of the region’s people are concentrated in large and small cities where the majority of jobs, schools and services are located. The distance and topography between our cities is significant, requiring time-intensive commutes that often cross state and county boundaries. Traditionally our counties have conducted their comprehensive planning independent of one another. The HUD Grant has afforded all localities the opportunity to transcend their boundaries by examining housing, transportation, employment and resource issues on a regional scale. These are described in the three chapters focused on the seven cities and their connecting infrastructure.
SECTION IV. RESILIENT COMMUNITIES: We will respect local autonomy while working together to improve the lives of all our year-round residents and seasonal guests.
Chapter 4. Our Distinctive Major Cities Chapter 5. Our Small CitiesChapter 6. Vital Connections
Overall, the plan’s mission is to ensure fair access to quality housing, well-paying jobs, healthy foods, outdoor recreation and public transportation, all while protecting the region’s natural resources and working landscapes. The proposed projects provide a platform for improving the region’s quality of life and building more inclusive and resilient communities on both sides of the Teton Mountain Range.
12-31-14
7Preliminary Consortium Draft December
CROSS-REFERENCING THE GY-FRAMEWORK FOR SUSTAINABLE DEVELOPMENT SCORECARD
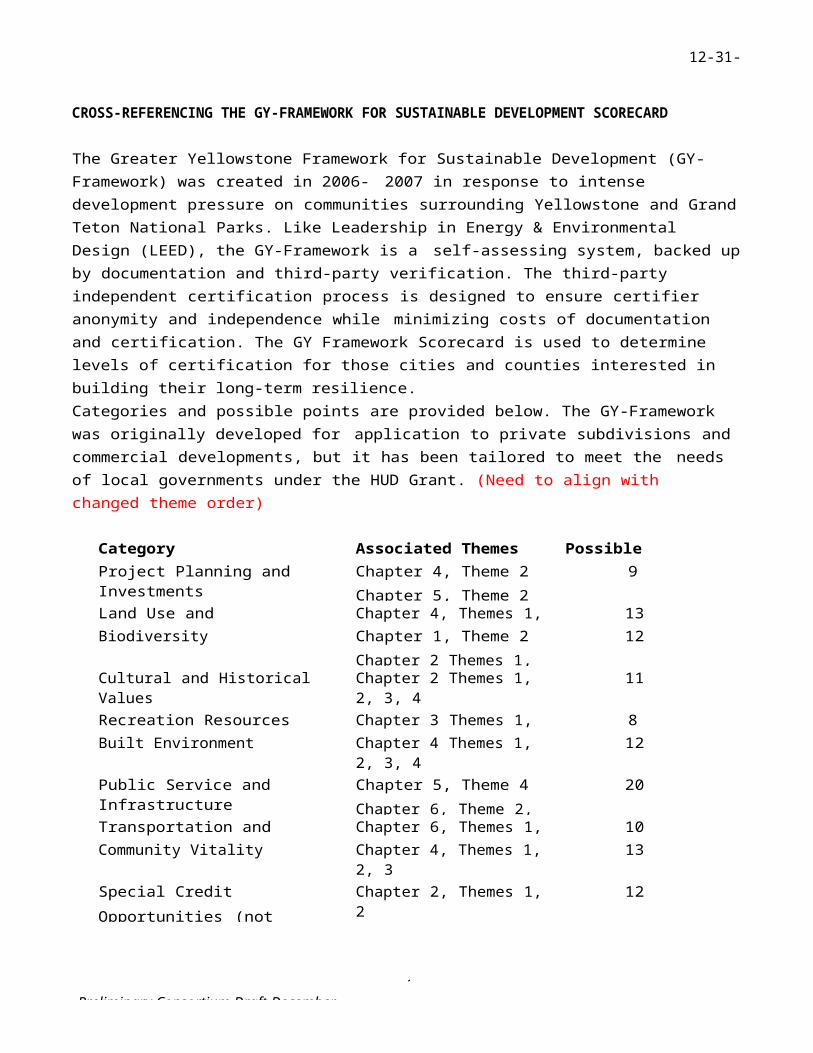
The Greater Yellowstone Framework for Sustainable Development (GY-Framework) was created in 2006- 2007 in response to intense development pressure on communities surrounding Yellowstone and Grand Teton National Parks. Like Leadership in Energy & Environmental Design (LEED), the GY-Framework is a self-assessing system, backed up by documentation and third-party verification. The third-party independent certification process is designed to ensure certifier anonymity and independence while minimizing costs of documentation and certification. The GY Framework Scorecard is used to determine levels of certification for those cities and counties interested in building their long-term resilience.Categories and possible points are provided below. The GY-Framework was originally developed for application to private subdivisions and commercial developments, but it has been tailored to meet the needs of local governments under the HUD Grant. (Need to align with changed theme order)
Category Associated Themes Possible PointsProject Planning and Investments Chapter 4, Theme 2
Chapter 5, Theme 29
Land Use and Conservation Chapter 4, Themes 1, 2 13Biodiversity Chapter 1, Theme 2
Chapter 2 Themes 1, 2, 3, 412
Cultural and Historical Values Chapter 2 Themes 1, 2, 3, 4Chapter 5 Theme 1
11
Recreation Resources Chapter 3 Themes 1, 2, 3 8Built Environment Chapter 4 Themes 1, 2, 3, 4
Chapter 5, Theme 312
Public Service and Infrastructure Chapter 5, Theme 4Chapter 6, Theme 2, 4
20
Transportation and Connectivity Chapter 6, Themes 1, 3 10Community Vitality Chapter 4, Themes 1, 2, 3
Chapter 5, Themes 1, 313
Special Credit Opportunities (not included in Project Total)
Chapter 2, Themes 1, 2 12
12-31-14
8Preliminary Consortium Draft December
ABOUT SUSTAINABILITY INDICATORS
In its simplest sense, an indicator points to an issue or condition and shows how well a system is working, whether it is a company, a financial market or a geographic region. A sustainability indicator, particularly in the context of a community or region, can be considered a variation on a traditional indicator, focusing on the relationship among the topics of economy, environment and society.
Indicators can serve as alerts to emerging problems or challenges and help recognize the steps that need to be taken to address them. In the context of the Teton View region, some characteristics of effective indicators include the following1:
Are relevant to the goals of regional plans and/or local plans such that they are tracking meaningful desired outcomes;
Are clear and concise in the sense that they do not rely on overly complex definitions or calculations that are difficult for stakeholders and decision makers to understand;
Are well grounded in quality data and are defensible; Are usable in making decisions that affect the region, reflecting topics the region can do
something about through local plans or policies; Have a long-range view, rather than tracking disconnected short-term outcomes; Are based on reliable and regularly reported data so that they can be consistently and
accurately tracked over time; or, if data do not currently exist, a system to reliably collect data can be established; and
Can cover multiple social, economic, and/or environmental topics.
The Role of Indicators for the Teton View Regional Plan
In general, by regularly monitoring their performance, sustainability indicators can help Consortium members and the Teton View region determine whether it is moving toward or away from its desired outcomes.
More specifically, sustainability indicators - if well aligned with the Teton View Regional Plan - can help monitor and measure progress across the Plan’s themes and strategies. They can help signal whether or not progress is falling behind intended outcomes, and if corrective action is beneficial in terms of new policies or initiatives.
Regional sustainability indicators can also be a powerful way to help each county/city in the region, as well as other state and federal resource agencies, link and align their plans. If each major plan in the region – for example, each county comprehensive plan – were to integrate a common set of indicators, this would provide a platform for coordinating interests, sharing data to understand regional trends and working in a coordinated fashion on those issues the region shares in common.

12-31-14
9Preliminary Consortium Draft December
1 Hart, Maureen. 2006. Guide to Sustainable Community Indicators, 2nd Ed. Sustainable Measures, West Hartford, CT.

12-31-14
1Preliminary Consortium Draft December
Finally, coordinating the tracking of regional indicators can also help other organizations, from non- profits to schools to chambers of commerce, collaborate and partner with public agencies on issues of shared interest by sharing data, aligning initiatives and working toward common goals.
While there is no proposed central organization to house regional ownership of the indicators, the Teton View Regional Plan provides guidance for local, state and/or federal agencies to integrate them into their respective plans so that each jurisdiction/agency can be working toward common regional outcomes with similar indicators. Periodically, jurisdictions/agencies are advised to come together to collaborate on regional issues and evaluate indicator trends.
The Plan’s indicators are the culmination of a multi-year process to discuss with the region’s stakeholders what matters to them and how to measure what matters. They also reflect extensive research into indicator best practices, and how the region can best build on available and quality data to consistently measure progress year-over-year. Appendix A provides more information on indicator development methodology.
Types of Indicators
The Plan includes both system and performance indicators2. Performance indicators include specific metrics mapped to topic areas and policies therein such as agriculture, water quality, jobs/economic growth, multi-modal transportation and affordable housing. Performance indicators are mapped to specific chapters and themes; the Plan includes a total of 18 performance indicators.
2 Innes, Judith and David Booher. 2000. Indicators for Sustainable Communities: A strategy building on complexity theory and distributed
12-31-14
1Preliminary Consortium Draft December
intelligence. Planning Theory and Practice, Vol. 1, No. 2, 173-186.
1Preliminary Consortium Draft December
12-31-14
SECTION II. AN OVERVIEW OF THE TETON VIEW REGION AND ITS PEOPLE
WHAT LIES BENEATH: THE YELLOWSTONE HOT SPOT3
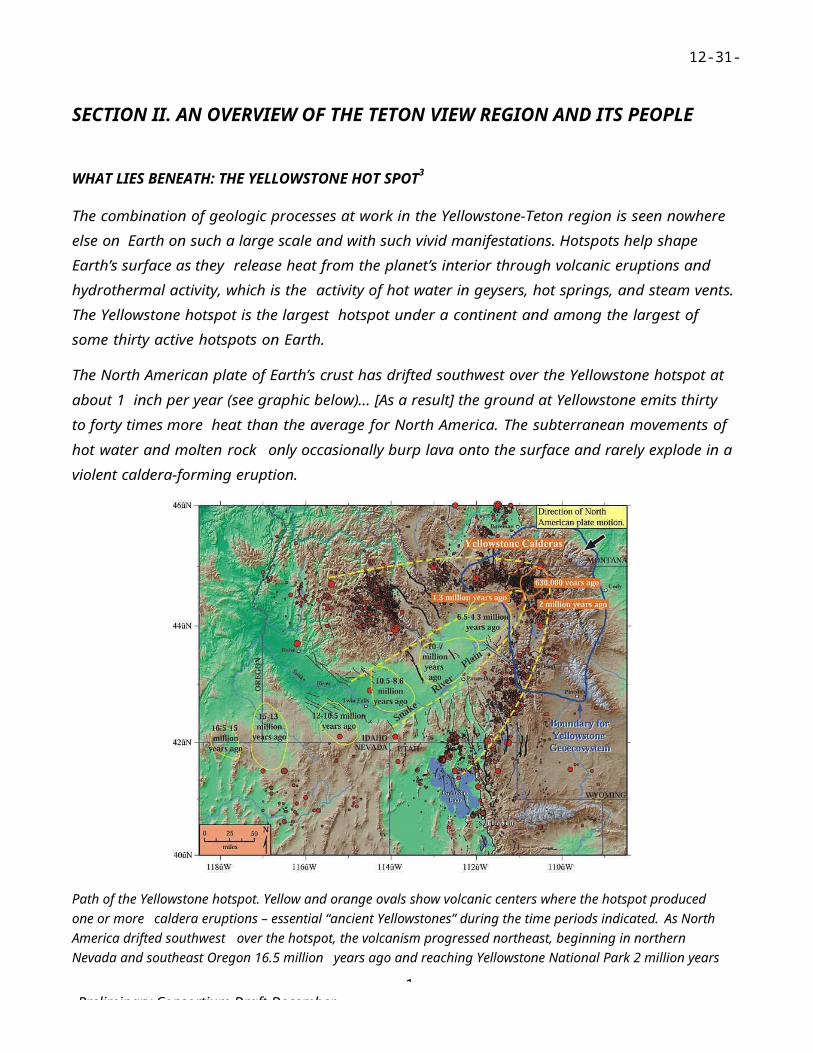
The combination of geologic processes at work in the Yellowstone-Teton region is seen nowhere else on Earth on such a large scale and with such vivid manifestations. Hotspots help shape Earth’s surface as they release heat from the planet’s interior through volcanic eruptions and hydrothermal activity, which is the activity of hot water in geysers, hot springs, and steam vents. The Yellowstone hotspot is the largest hotspot under a continent and among the largest of some thirty active hotspots on Earth.
The North American plate of Earth’s crust has drifted southwest over the Yellowstone hotspot at about 1 inch per year (see graphic below)… [As a result] the ground at Yellowstone emits thirty to forty times more heat than the average for North America. The subterranean movements of hot water and molten rock only occasionally burp lava onto the surface and rarely explode in a violent caldera-forming eruption.
Path of the Yellowstone hotspot. Yellow and orange ovals show volcanic centers where the hotspot produced one or more caldera eruptions – essential “ancient Yellowstones” during the time periods indicated. As North America drifted southwest over the hotspot, the volcanism progressed northeast, beginning in northern Nevada and southeast Oregon 16.5 million years ago and reaching Yellowstone National Park 2 million years ago. A bow-wave or parabola-shaped zone of mountains (browns and tans) and earthquakes (red dots) surrounds the low elevations (greens) of seismically quiet Snake River Plain. The greater Yellowstone “geoecosystem” is outlined in blue. Faults are black lines.
1Preliminary Consortium Draft December
12-31-143 Windows into the Earth: The Geologic Story of Yellowstone and Grand Teton National Parks. Robert B. Smith and Lee J. Siegel, Oxford University Press, 2000. Text and graphic excerpted from pages 9-10; 15-17; 110
12-31-14
1Preliminary Consortium Draft December
Yellowstone already sat high in the Rocky Mountains before it was pushed to loftier heights – above 7,700 feet – atop the hotspot’s broad, upward bulge. The high elevation and resulting climate have helped determine the plants and wildlife that thrive in [and around] Yellowstone.
The lofty heights also helped a 3,500-foot-thick icecap form atop the Yellowstone Plateau during at least three global glacial episodes within the past 250,000 years to 2 million years. The Yellowstone ice field was so large it covered most of Yellowstone and Grand Teton parks – an area extending more than 100 miles north-south and 70 miles east-west. After volcanism shaped Yellowstone’s landscape and the Teton fault produced the terrain of the Teton Range and Jackson Hole, the Ice Age glaciers left they own marks. They shaped the spires of mountains and carved valleys such as those occupied by the Snake and Yellowstone rivers. The glaciers excavated smaller lakes at the base of the Teton Range and deepened Yellowstone and Jackson lakes.
Of all the geological processes fostered by the Yellowstone hotspot, earthquakes are the most dominant on a human timescale. Today in the U.S, only faults in California produce more earthquakes than in the area around Yellowstone. This also includes the Teton fault…that became active in its present form about 13 million years ago. Since then, a few thousand major earthquakes have lifted the Teton Range into its towering setting while simultaneously making the valley of Jackson Hole sink…by a total of 13,000 feet.
THE TETONS AND YELLOWSTONE PLATEAU CAPTURE MOISTURE FOR THE REGION
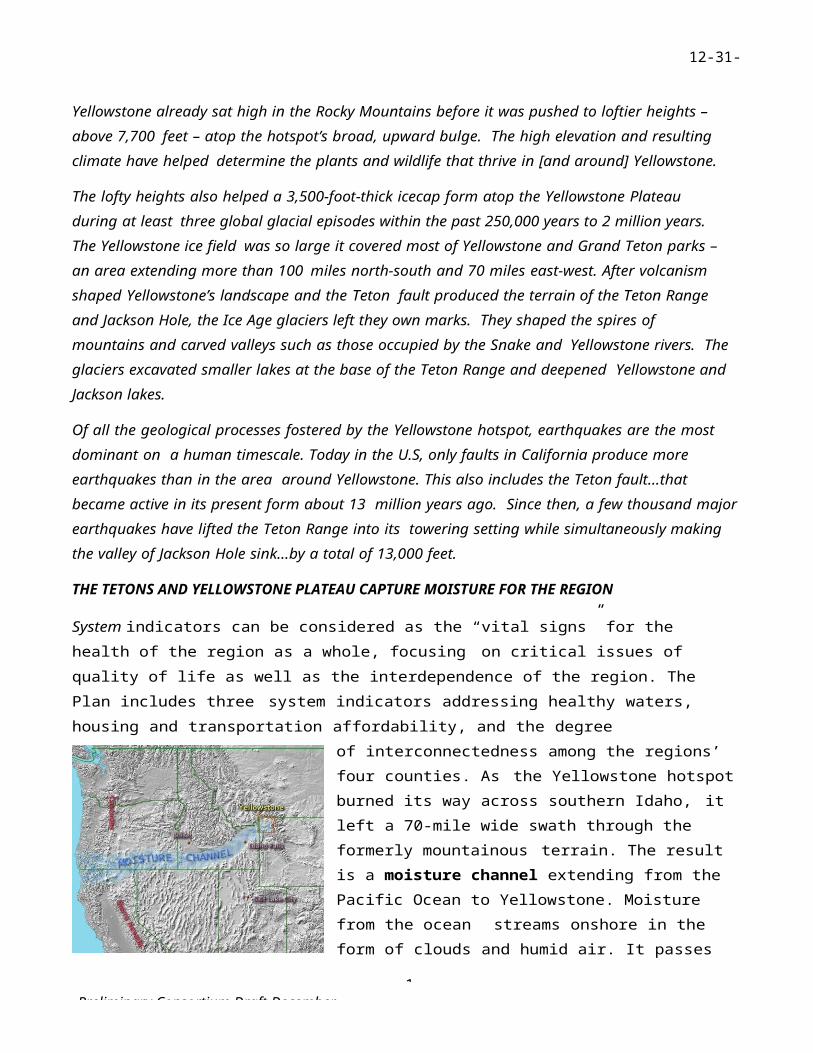
System indicators can be considered as the “vital signs” for the health of the region as a whole, focusing on critical issues of quality of life as well as the interdependence of the region. The Plan includes three system indicators addressing healthy waters, housing and transportation affordability, and the degree
of interconnectedness among the regions’ four counties. As the Yellowstone hotspot burned its way across southern Idaho, it left a 70-mile wide swath through the formerly mountainous terrain. The result is a moisture channel extending from the Pacific Ocean to Yellowstone. Moisture from the ocean streams onshore in the form of clouds and humid air. It passes through the gap between the Sierra and Cascades and on into the Snake River Plain where it is channeled through Southern Idaho with no high plateaus or mountain ranges to impede its progress. Clouds finally encounter upslope conditions at the head of the Snake River Valley at Ashton and Island Park, at
the Teton Range east of Driggs, and on the Yellowstone Plateau inside the national park where the channeled moisture precipitates out as rain and snow. The result is a localized climate that is akin to a climate on the west slope of the Cascades or the northern Sierras. The head of the Snake River Valley, the Tetons, and the Yellowstone Plateau receive much more precipitation than other areas of the region and the area is known for its many streams and abundant winter snows.4
4 Wikipedia description of the climate effects of the Snake River Plain
12-31-14
1Preliminary Consortium Draft December
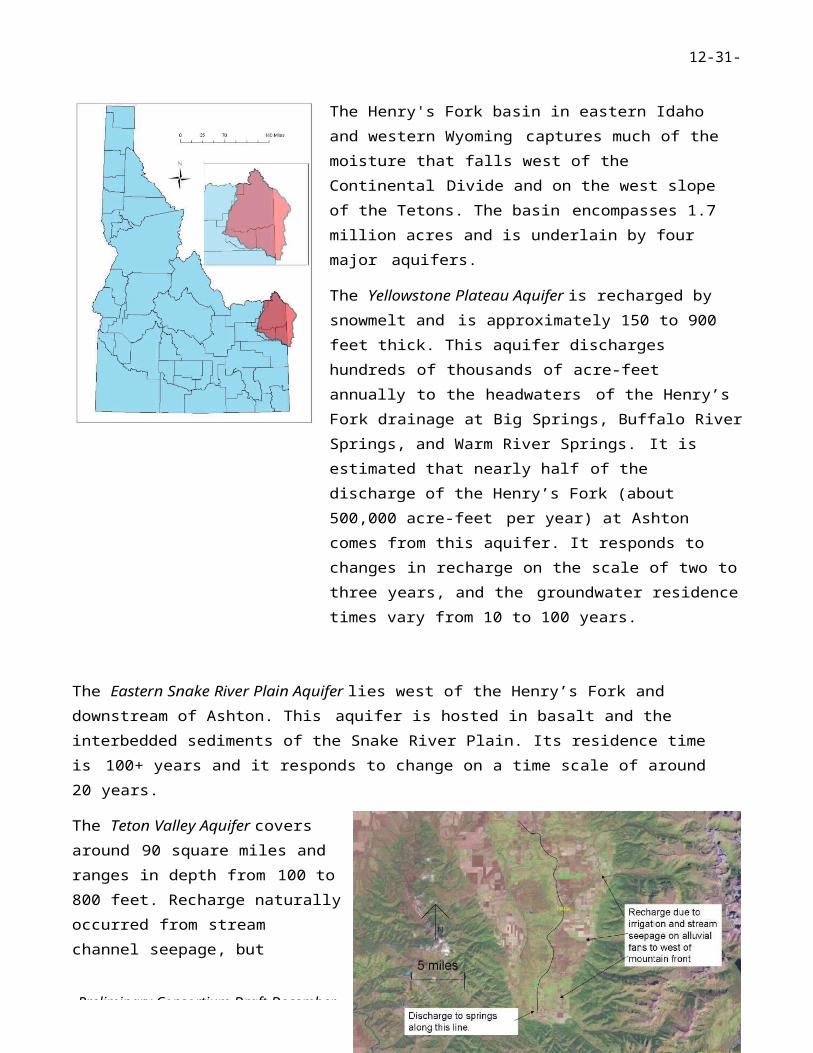
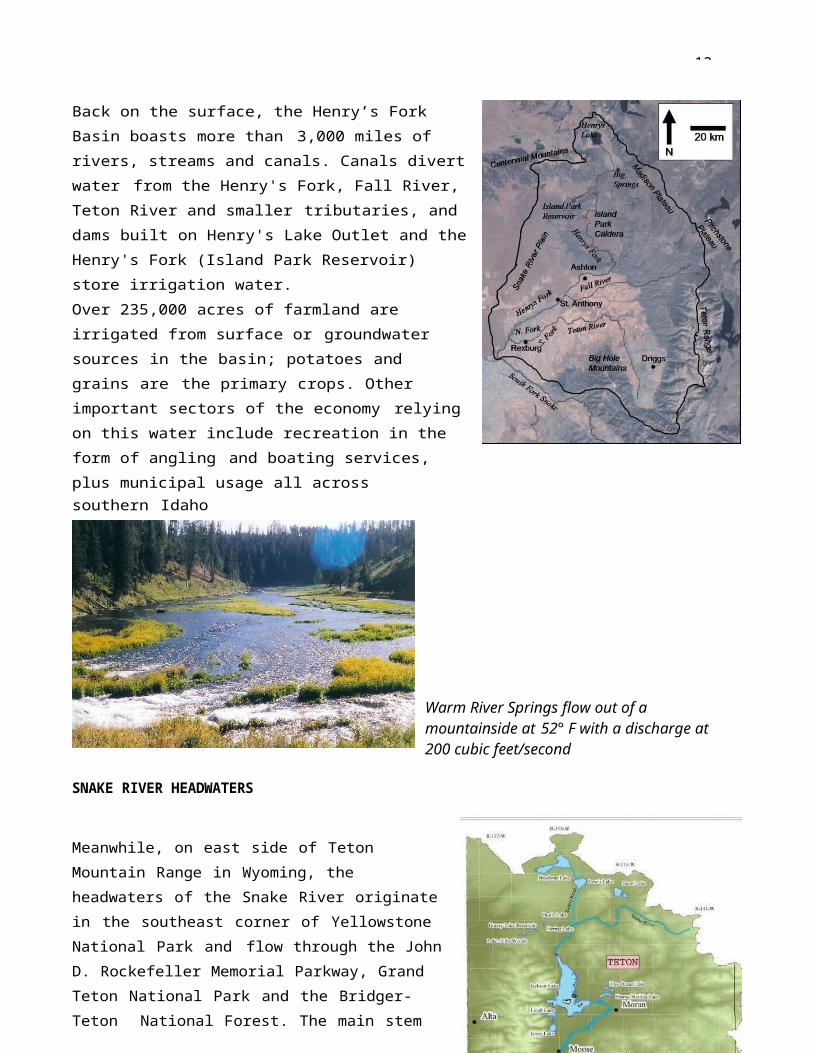
The Henry's Fork basin in eastern Idaho and western Wyoming captures much of the moisture that falls west of the Continental Divide and on the west slope of the Tetons. The basin encompasses 1.7 million acres and is underlain by four major aquifers.
The Yellowstone Plateau Aquifer is recharged by snowmelt and is approximately 150 to 900 feet thick. This aquifer discharges hundreds of thousands of acre-feet annually to the headwaters of the Henry’s Fork drainage at Big Springs, Buffalo River Springs, and Warm River Springs. It is estimated that nearly half of the discharge of the Henry’s Fork (about 500,000 acre-feet per year) at Ashton comes from this aquifer. It responds to changes in recharge on the scale of two to three years, and the groundwater residence times vary from 10 to 100 years.
The Eastern Snake River Plain Aquifer lies west of the Henry’s Fork and downstream of Ashton. This aquifer is hosted in basalt and the interbedded sediments of the Snake River Plain. Its residence time is 100+ years and it responds to change on a time scale of around 20 years.
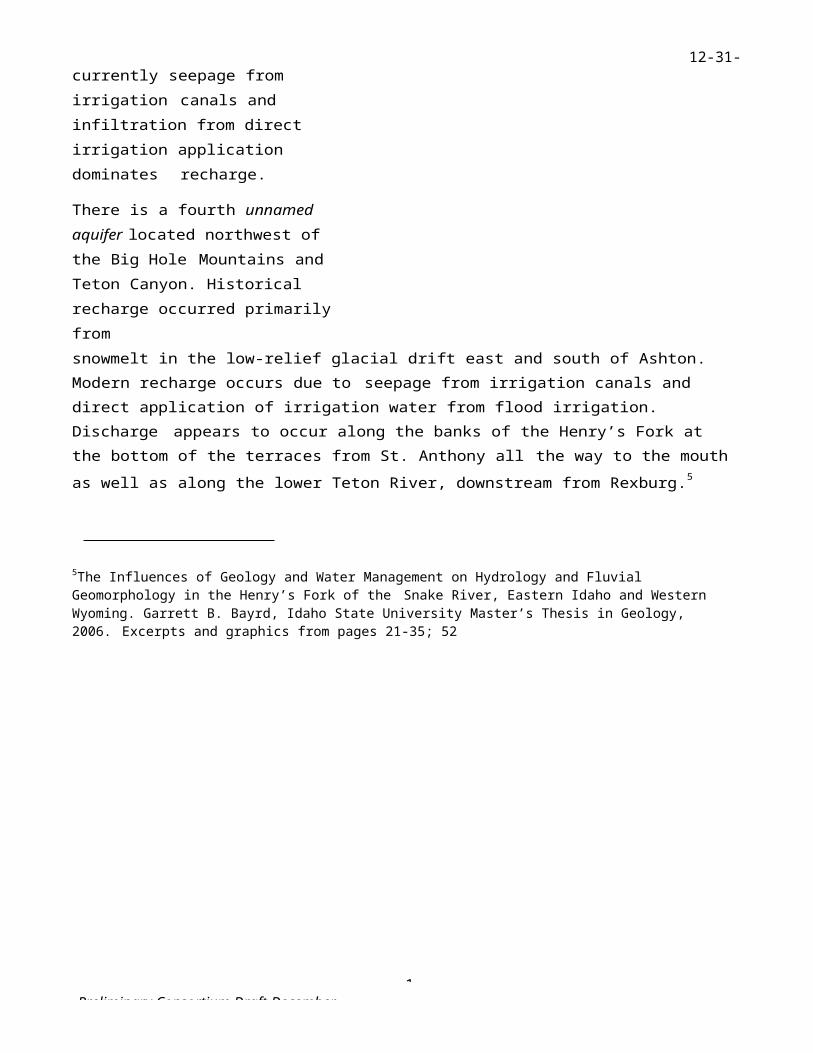
The Teton Valley Aquifer covers around 90 square miles and ranges in depth from 100 to 800 feet. Recharge naturally occurred from stream channel seepage, but currently seepage from irrigation canals and infiltration from direct irrigation application dominates recharge.
There is a fourth unnamed aquifer located northwest of the Big Hole Mountains and Teton Canyon. Historical recharge occurred primarily fromsnowmelt in the low-relief glacial drift east and south of Ashton. Modern recharge occurs due to seepage from irrigation canals and direct application of irrigation water from flood irrigation. Discharge appears to occur along the banks of the Henry’s Fork at the bottom of the terraces from St. Anthony all the way to the mouth as well as along the lower Teton River, downstream from Rexburg.5
5The Influences of Geology and Water Management on Hydrology and Fluvial Geomorphology in the Henry’s Fork of the
12-31-14
1Preliminary Consortium Draft December
Snake River, Eastern Idaho and Western Wyoming. Garrett B. Bayrd, Idaho State University Master’s Thesis in Geology, 2006. Excerpts and graphics from pages 21-35; 52
12-31-
Back on the surface, the Henry’s Fork Basin boasts more than 3,000 miles of rivers, streams and canals. Canals divert water from the Henry's Fork, Fall River, Teton River and smaller tributaries, and dams built on Henry's Lake Outlet and the Henry's Fork (Island Park Reservoir) store irrigation water.Over 235,000 acres of farmland are irrigated from surface or groundwater sources in the basin; potatoes and grains are the primary crops. Other important sectors of the economy relying on this water include recreation in the form of angling and boating services, plus municipal usage all acrosssouthern Idaho
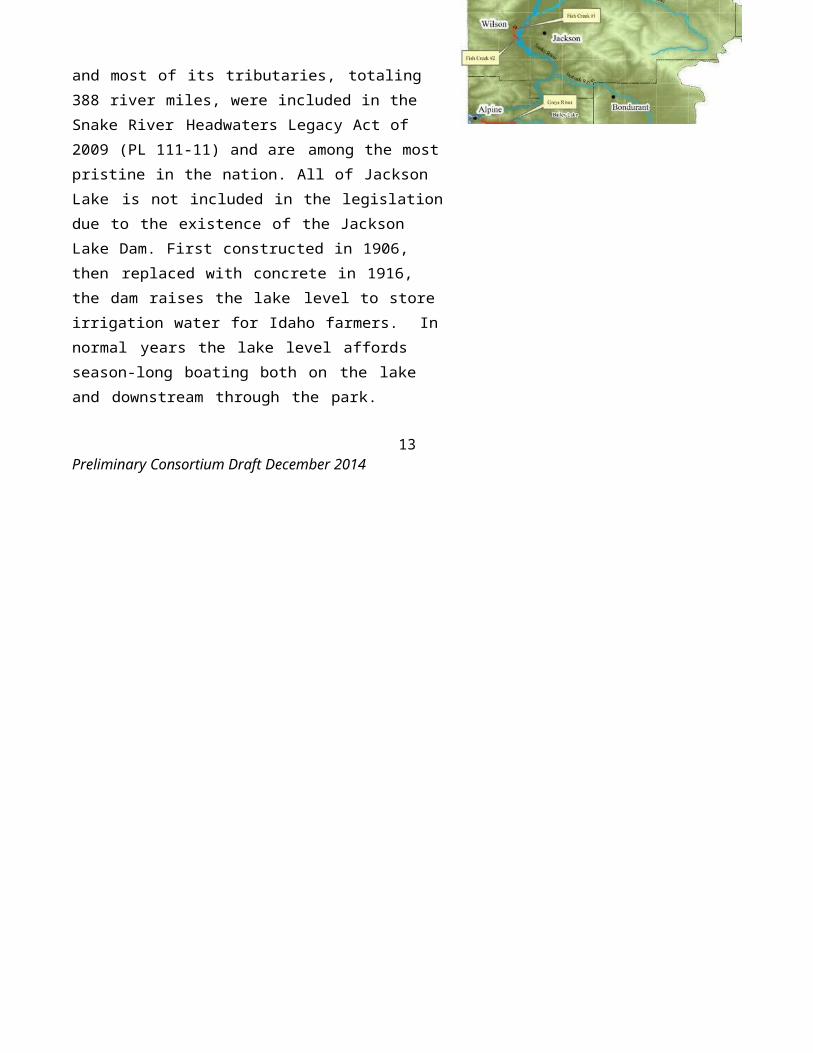
SNAKE RIVER HEADWATERS
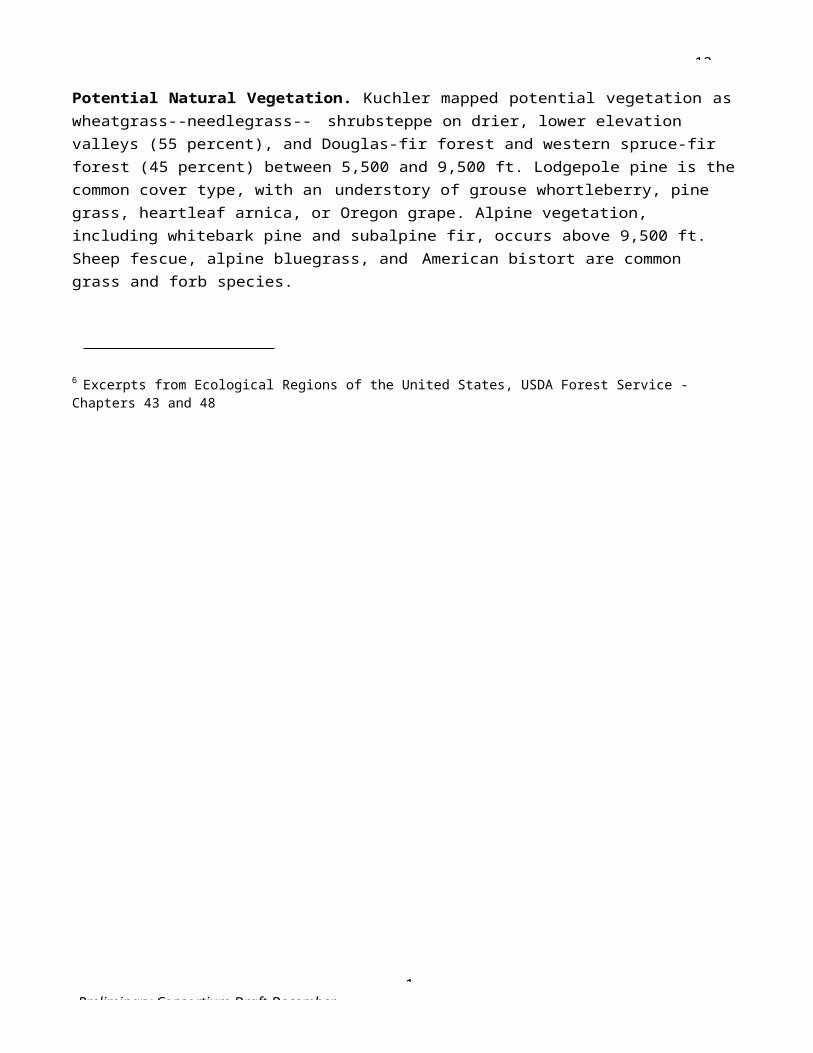
Warm River Springs flow out of a mountainside at 52° F with a discharge at 200 cubic feet/second
Meanwhile, on east side of Teton Mountain Range in Wyoming, the headwaters of the Snake River originate in the southeast corner of Yellowstone National Park and flow through the John D. Rockefeller Memorial Parkway, Grand Teton National Park and the Bridger-Teton National Forest. The main stem and most of its tributaries, totaling 388 river miles, were included in the Snake River Headwaters Legacy Act of 2009 (PL 111-11) and are among the most pristine in the nation. All of Jackson Lake is not included in the legislation due to the existence of the Jackson Lake Dam. First constructed in 1906, then replaced with concrete in 1916, the dam raises the lake level to store irrigation water for Idaho farmers. In normal years the lake level affords season-long boating both on the lake and downstream through the park.
13Preliminary Consortium Draft December 2014
1Preliminary Consortium Draft December
12-31-
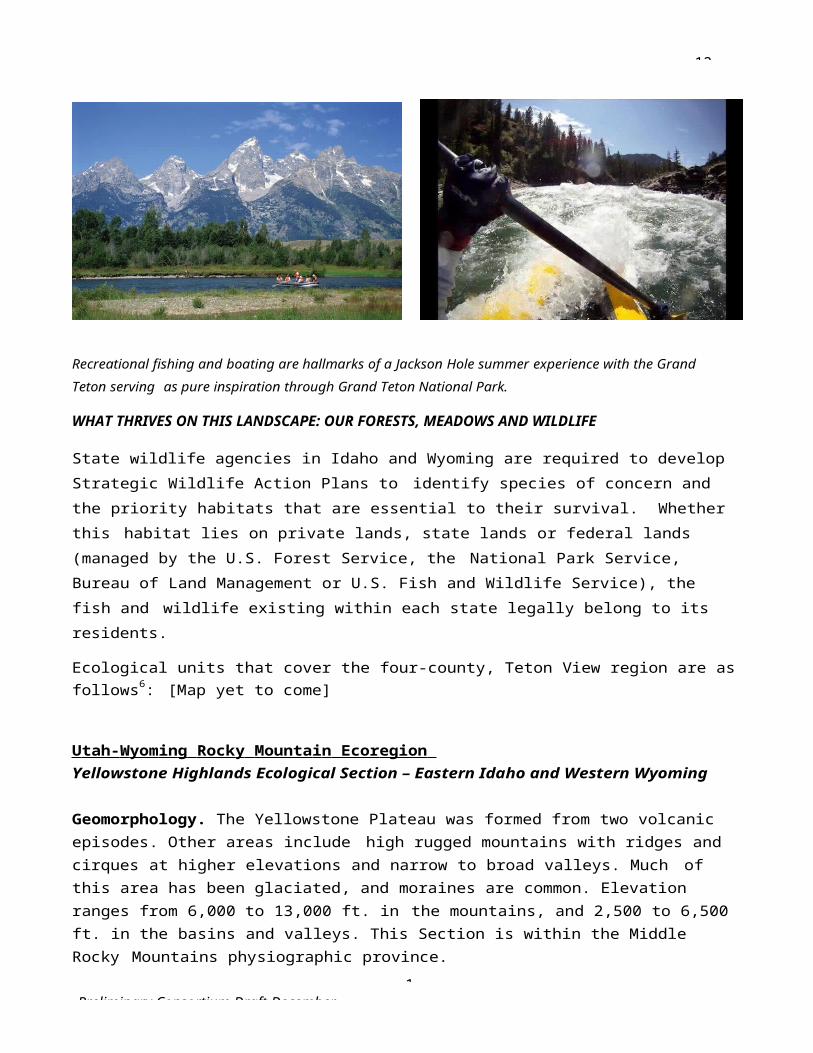
Recreational fishing and boating are hallmarks of a Jackson Hole summer experience with the Grand Teton serving as pure inspiration through Grand Teton National Park.
WHAT THRIVES ON THIS LANDSCAPE: OUR FORESTS, MEADOWS AND WILDLIFE
State wildlife agencies in Idaho and Wyoming are required to develop Strategic Wildlife Action Plans to identify species of concern and the priority habitats that are essential to their survival. Whether this habitat lies on private lands, state lands or federal lands (managed by the U.S. Forest Service, the National Park Service, Bureau of Land Management or U.S. Fish and Wildlife Service), the fish and wildlife existing within each state legally belong to its residents.
Ecological units that cover the four-county, Teton View region are as follows6: [Map yet to come]
U tah- W yom in g Rock y Mounta i n Ecor egion Yellowstone Highlands Ecological Section – Eastern Idaho and Western Wyoming
Geomorphology. The Yellowstone Plateau was formed from two volcanic episodes. Other areas include high rugged mountains with ridges and cirques at higher elevations and narrow to broad valleys. Much of this area has been glaciated, and moraines are common. Elevation ranges from 6,000 to 13,000 ft. in the mountains, and 2,500 to 6,500 ft. in the basins and valleys. This Section is within the Middle Rocky Mountains physiographic province.
Potential Natural Vegetation. Kuchler mapped potential vegetation as wheatgrass--needlegrass-- shrubsteppe on drier, lower elevation valleys (55 percent), and Douglas-fir forest and western spruce-fir forest (45 percent) between 5,500 and 9,500 ft. Lodgepole pine is the common cover type, with an understory of grouse whortleberry, pine grass, heartleaf arnica, or Oregon grape. Alpine vegetation, including whitebark pine and subalpine fir, occurs above 9,500 ft. Sheep fescue, alpine bluegrass, and American bistort are common grass and forb species.
6 Excerpts from Ecological Regions of the United States, USDA Forest Service - Chapters 43 and 48

12-31-
1Preliminary Consortium Draft December
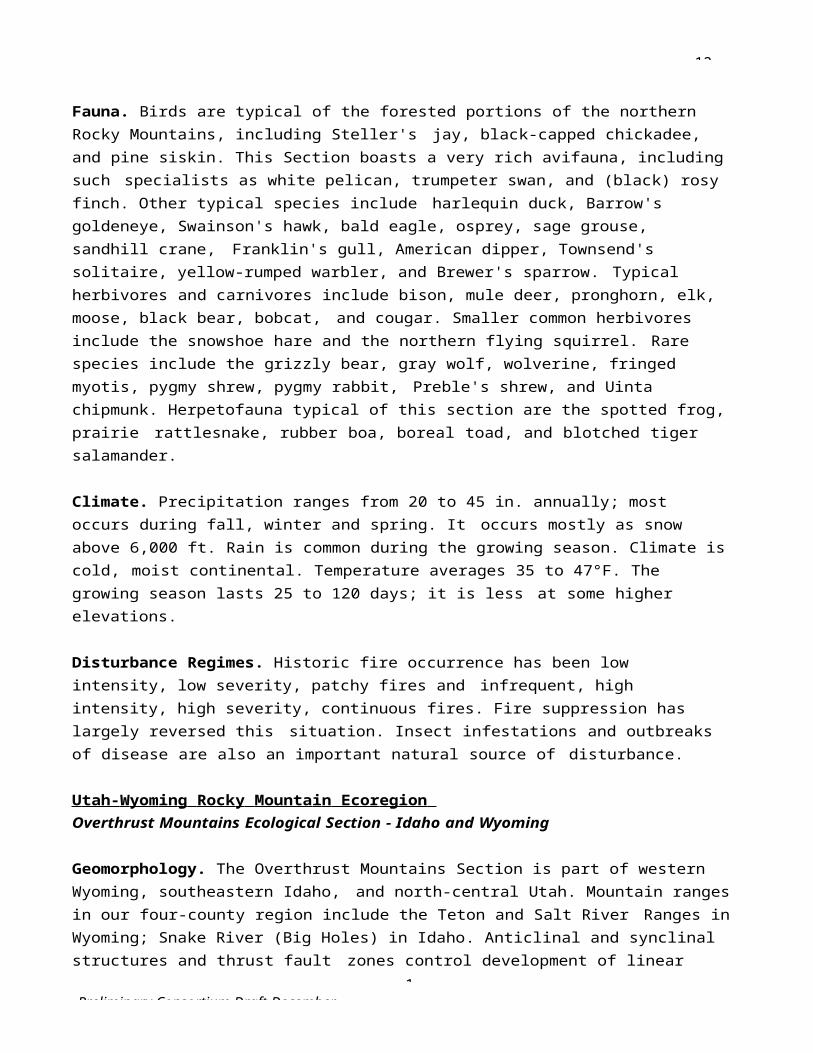
Fauna. Birds are typical of the forested portions of the northern Rocky Mountains, including Steller's jay, black-capped chickadee, and pine siskin. This Section boasts a very rich avifauna, including such specialists as white pelican, trumpeter swan, and (black) rosy finch. Other typical species include harlequin duck, Barrow's goldeneye, Swainson's hawk, bald eagle, osprey, sage grouse, sandhill crane, Franklin's gull, American dipper, Townsend's solitaire, yellow-rumped warbler, and Brewer's sparrow. Typical herbivores and carnivores include bison, mule deer, pronghorn, elk, moose, black bear, bobcat, and cougar. Smaller common herbivores include the snowshoe hare and the northern flying squirrel. Rare species include the grizzly bear, gray wolf, wolverine, fringed myotis, pygmy shrew, pygmy rabbit, Preble's shrew, and Uinta chipmunk. Herpetofauna typical of this section are the spotted frog, prairie rattlesnake, rubber boa, boreal toad, and blotched tiger salamander.
Climate. Precipitation ranges from 20 to 45 in. annually; most occurs during fall, winter and spring. It occurs mostly as snow above 6,000 ft. Rain is common during the growing season. Climate is cold, moist continental. Temperature averages 35 to 47°F. The growing season lasts 25 to 120 days; it is less at some higher elevations.
Disturbance Regimes. Historic fire occurrence has been low intensity, low severity, patchy fires and infrequent, high intensity, high severity, continuous fires. Fire suppression has largely reversed this situation. Insect infestations and outbreaks of disease are also an important natural source of disturbance.
U tah- W yom in g Rock y Mounta i n Ecor egion Overthrust Mountains Ecological Section - Idaho and Wyoming
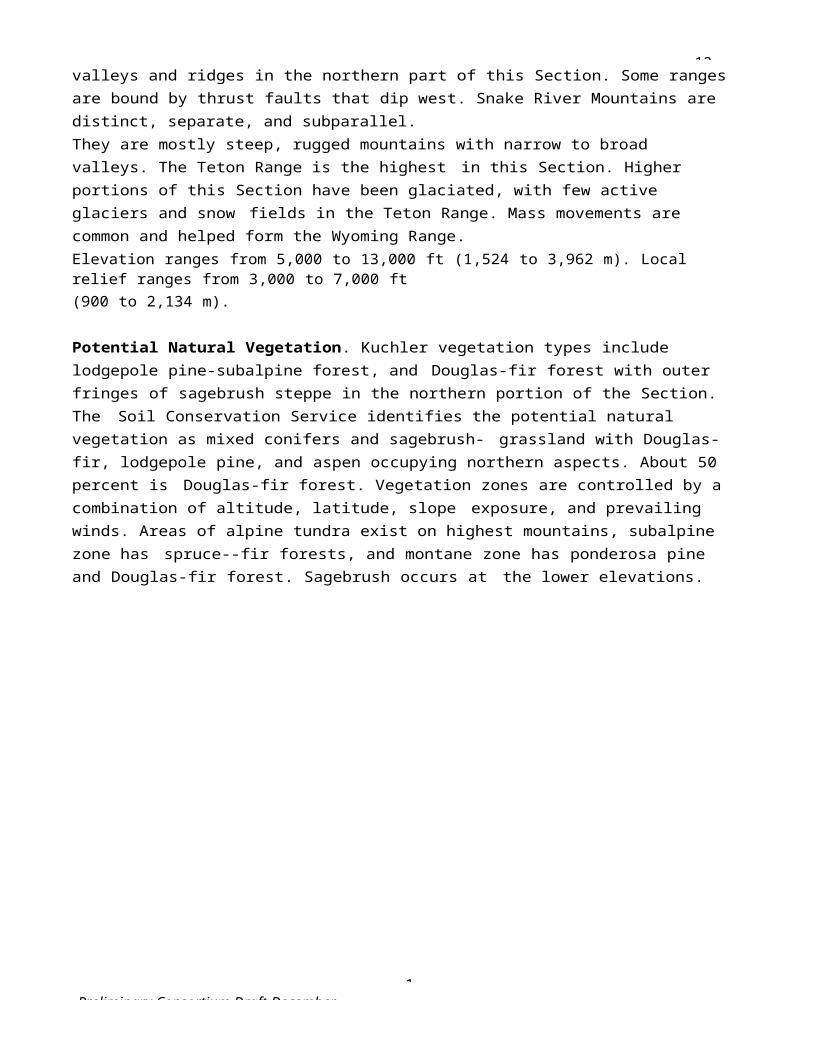
Geomorphology. The Overthrust Mountains Section is part of western Wyoming, southeastern Idaho, and north-central Utah. Mountain ranges in our four-county region include the Teton and Salt River Ranges in Wyoming; Snake River (Big Holes) in Idaho. Anticlinal and synclinal structures and thrust fault zones control development of linear valleys and ridges in the northern part of this Section. Some ranges are bound by thrust faults that dip west. Snake River Mountains are distinct, separate, and subparallel.They are mostly steep, rugged mountains with narrow to broad valleys. The Teton Range is the highest in this Section. Higher portions of this Section have been glaciated, with few active glaciers and snow fields in the Teton Range. Mass movements are common and helped form the Wyoming Range.Elevation ranges from 5,000 to 13,000 ft (1,524 to 3,962 m). Local relief ranges from 3,000 to 7,000 ft(900 to 2,134 m).
Potential Natural Vegetation. Kuchler vegetation types include lodgepole pine-subalpine forest, and Douglas-fir forest with outer fringes of sagebrush steppe in the northern portion of the Section. The Soil Conservation Service identifies the potential natural vegetation as mixed conifers and sagebrush- grassland with Douglas-fir, lodgepole pine, and aspen occupying northern aspects. About 50 percent is Douglas-fir forest. Vegetation zones are controlled by a combination of altitude, latitude, slope exposure, and prevailing winds. Areas of alpine tundra exist on highest mountains, subalpine zone has spruce--fir forests, and montane zone has ponderosa pine and Douglas-fir forest. Sagebrush occurs at the lower elevations.
12-31-
1Preliminary Consortium Draft December
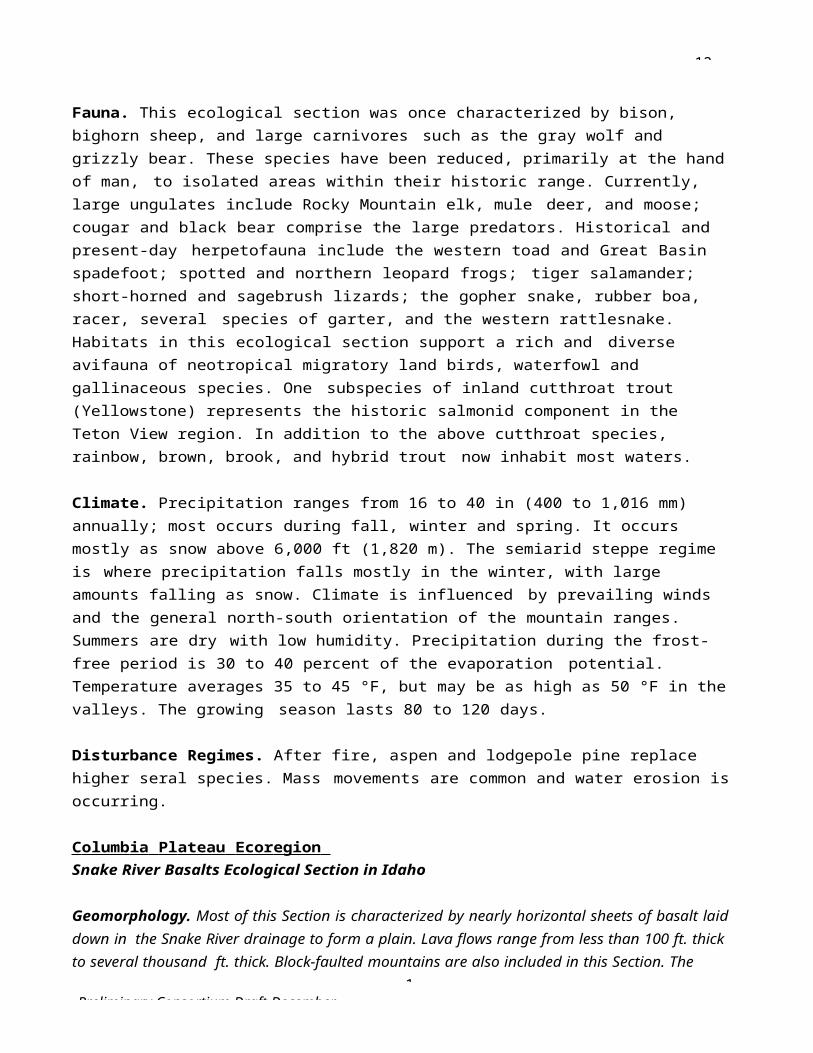
Fauna. This ecological section was once characterized by bison, bighorn sheep, and large carnivores such as the gray wolf and grizzly bear. These species have been reduced, primarily at the hand of man, to isolated areas within their historic range. Currently, large ungulates include Rocky Mountain elk, mule deer, and moose; cougar and black bear comprise the large predators. Historical and present-day herpetofauna include the western toad and Great Basin spadefoot; spotted and northern leopard frogs; tiger salamander; short-horned and sagebrush lizards; the gopher snake, rubber boa, racer, several species of garter, and the western rattlesnake. Habitats in this ecological section support a rich and diverse avifauna of neotropical migratory land birds, waterfowl and gallinaceous species. One subspecies of inland cutthroat trout (Yellowstone) represents the historic salmonid component in the Teton View region. In addition to the above cutthroat species, rainbow, brown, brook, and hybrid trout now inhabit most waters.
Climate. Precipitation ranges from 16 to 40 in (400 to 1,016 mm) annually; most occurs during fall, winter and spring. It occurs mostly as snow above 6,000 ft (1,820 m). The semiarid steppe regime is where precipitation falls mostly in the winter, with large amounts falling as snow. Climate is influenced by prevailing winds and the general north-south orientation of the mountain ranges. Summers are dry with low humidity. Precipitation during the frost-free period is 30 to 40 percent of the evaporation potential. Temperature averages 35 to 45 °F, but may be as high as 50 °F in the valleys. The growing season lasts 80 to 120 days.
Disturbance Regimes. After fire, aspen and lodgepole pine replace higher seral species. Mass movements are common and water erosion is occurring.
C olumb ia Pl ateau Ecor egion Snake River Basalts Ecological Section in Idaho
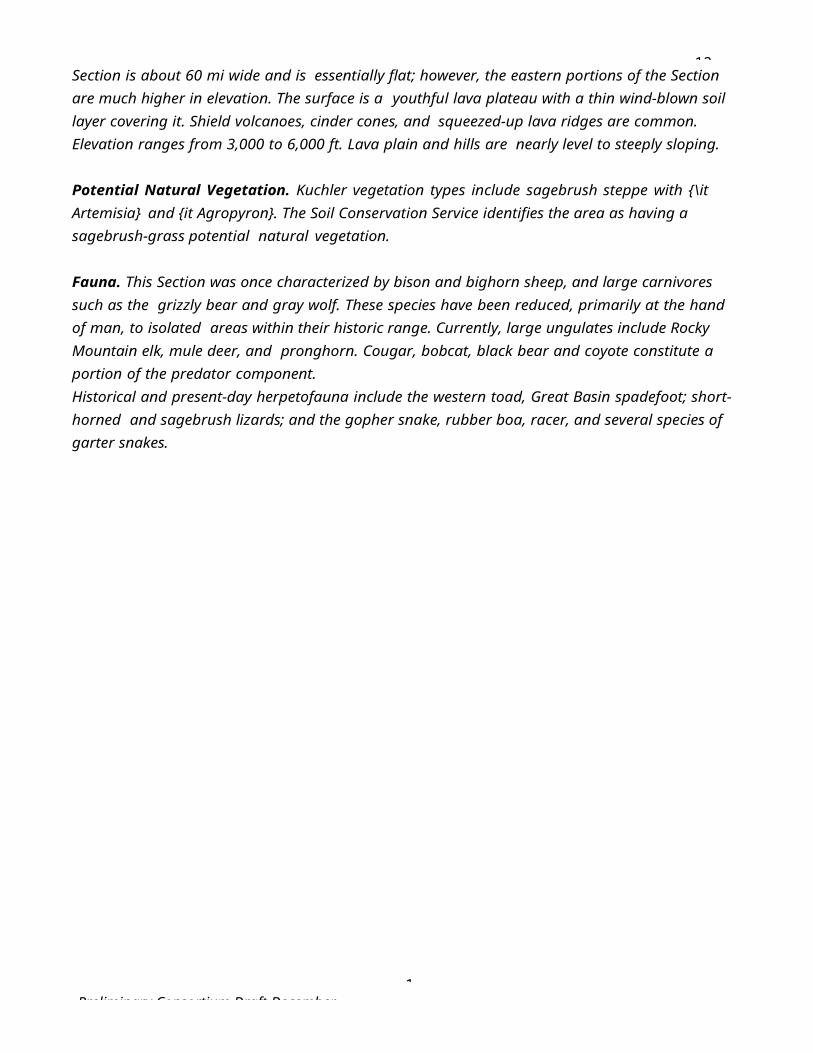
Geomorphology. Most of this Section is characterized by nearly horizontal sheets of basalt laid down in the Snake River drainage to form a plain. Lava flows range from less than 100 ft. thick to several thousand ft. thick. Block-faulted mountains are also included in this Section. The Section is about 60 mi wide and is essentially flat; however, the eastern portions of the Section are much higher in elevation. The surface is a youthful lava plateau with a thin wind-blown soil layer covering it. Shield volcanoes, cinder cones, and squeezed-up lava ridges are common. Elevation ranges from 3,000 to 6,000 ft. Lava plain and hills are nearly level to steeply sloping.
Potential Natural Vegetation. Kuchler vegetation types include sagebrush steppe with {\it Artemisia} and {it Agropyron}. The Soil Conservation Service identifies the area as having a sagebrush-grass potential natural vegetation.
Fauna. This Section was once characterized by bison and bighorn sheep, and large carnivores such as the grizzly bear and gray wolf. These species have been reduced, primarily at the hand of man, to isolated areas within their historic range. Currently, large ungulates include Rocky Mountain elk, mule deer, and pronghorn. Cougar, bobcat, black bear and coyote constitute a portion of the predator component.Historical and present-day herpetofauna include the western toad, Great Basin spadefoot; short-horned and sagebrush lizards; and the gopher snake, rubber boa, racer, and several species of garter snakes.
12-31-
1Preliminary Consortium Draft December
Habitats in this Section support a rich and diverse avifauna of neotropical migratory land birds, waterfowl, and gallinaceous species. Three mammalian species, the yellow pine chipmunk, Great Basin pocket mouse, and the dark phase pika, are endemic to this Section. Salmonid species include rainbow, brown, and brook, as well as hybrid trout.
Climate. Precipitation ranges from 5 to 12 in annually; it is evenly distributed throughout the fall, winter, and spring, but is low in the summer. Precipitation is only 20 percent of the evaporation potential during the frost-free period. Summers are dry with low humidity. Temperature averages 40 to 58 °F. The growing season ranges from 60 to 165 days, decreasing from west to east and with elevation.
Disturbance Regimes. After fire, grasses and forbs replace higher seral species. Water and wind erosion is also occurring.
THOSE WHO LIVED HERE FOR CENTURIES: NATIVE PEOPLES OF THE TETON VIEW REGION
Shosohone-Bannock Tribes7
The traditional lands of the Shoshone and Bannock people were vast and encompassed areas that extended into what are now Canada and Mexico. They were hunters and gathers who moved with the seasons to gather various foods and resources, “de-de-vee-wah” (travelers). Because of the importance of the abundant natural resources needed for hunting, fishing, and gathering, they called themselves by the names of the foods they ate: Agai-deka (salmon eaters), Tuku-deka (sheep eaters), Kuchun-deka (buffalo eaters), Kamu-deka (rabbit eaters), Hukan-deka (seed eaters), Deheya’a-deka (deer eaters), Yamba-deka (root eaters), just to name a few. Each band has similar lifestyles but had some distinct differences in language dialects, traditions and beliefs.The Shoshones of Idaho are the most northerly of the vast Shoshone language group, which extends throughout the northwest and southwestern United States, and well into Canada and Mexico. The Northern Shoshones stayed close to the Snake River, but traveled over vast areas for big game, salmon, camas roots and other important foodsources.
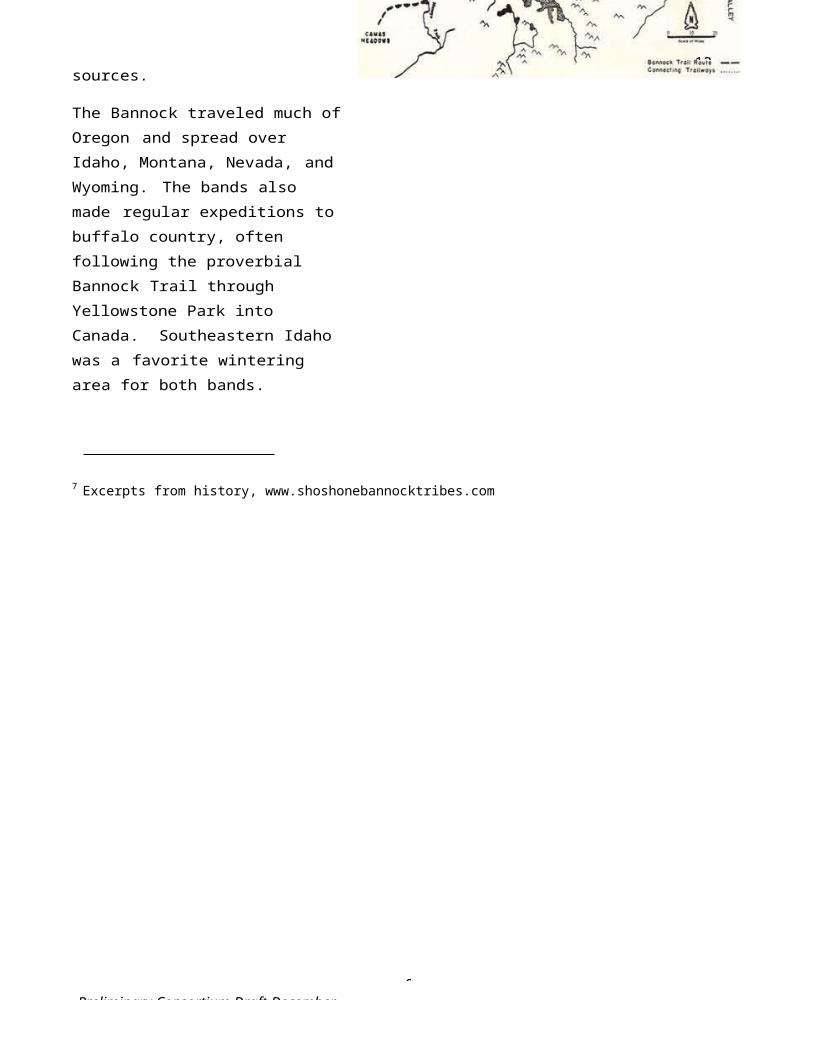
The Bannock traveled much of Oregon and spread over Idaho, Montana, Nevada, and Wyoming. The bands also made regular expeditions to buffalo country, often following the proverbial Bannock Trail through Yellowstone Park into Canada. Southeastern Idaho was a favorite wintering area for both bands.
7 Excerpts from history, www.shoshonebannocktribes.com
8 From
1Preliminary Consortium Draft December
12-31-
Today, descendants of other bands of Shoshone and Bannock reside on the Fort Hall Reservation (in Idaho near Pocatello) but all continue to return to their inherent areas to hunt, fish, gather, socialize, and to exercise their traditional and ceremonial practices.
Eastern Shoshone and Northern Arapaho8
The Wind River Reservation serves as the contemporary home of the Eastern Shoshone and Northern Arapaho tribes. The reservation covers more than 2.2 million acres in central Wyoming's beautiful Wind River Basin. The Wind River Basin, the traditional home of the Shoshones for centuries, is called "The Warm Valley of the Wind River" by its native inhabitants. The reservation is the third largest in the United States.
Under their leader, Chief Washakie, the Eastern Shoshone people were established on the reservation under the Fort Bridger Treaty of 1868. The Northern Arapaho, under their leaders Black Coal, Sharp Nose, Little Wolf, and White Horse, settled on the reservation beginning in 1877. While the Eastern Shoshone and the Northern Arapaho tribes shared the buffalo-hunting tradition of the Great Plains, they did not share the same culture. The history of the Wind River Reservation, then, has been a story of struggle and cooperation.
The Wind River Reservation is significant among Indian reservations in the United States because it is the only reservation in the U.S. that occupies lands chosen by the tribe compelled to live there. Chief Washakie, famed chief of the Shoshone, signed the treaty which established the reservation in 1868. Though a courageous leader in battle, renowned for his legendary victory over a rival Crow chief atop Crow Heart Butte (pictured), Washakie was also a wise peacemaker who negotiated successfully for a reservation on the tribe's historic lands. He understood that to save his people and preserve the legacy of the Shoshone it was wiser to negotiate from a position of relative strength than to fight against the encroaching settlers and risk ceding the tribe's birthplace to the white man.
8 From
1Preliminary Consortium Draft December
12-31-
1Preliminary Consortium Draft December
12-31-
HOMESTEADING AND SETTLEMENT: COMMUNITIES OF THE TETON VIEW REGION
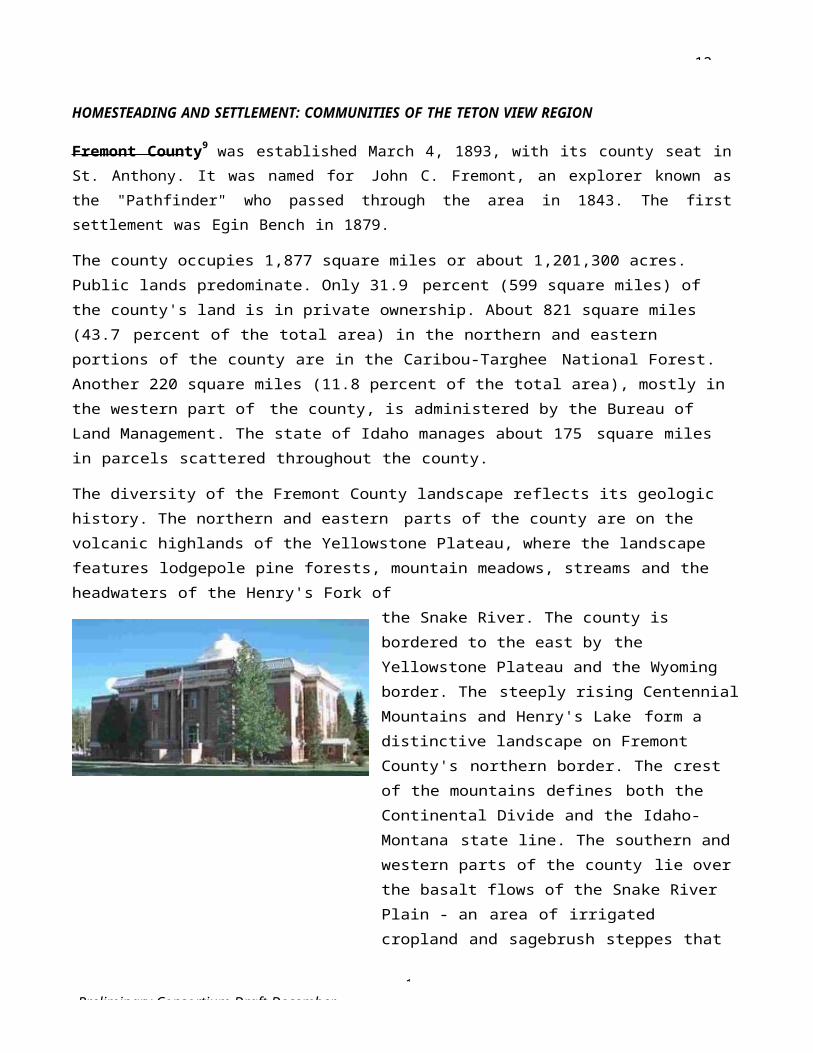
Fremont County9 was established March 4, 1893, with its county seat in St. Anthony. It was named for John C. Fremont, an explorer known as the "Pathfinder" who passed through the area in 1843. The first settlement was Egin Bench in 1879.
The county occupies 1,877 square miles or about 1,201,300 acres. Public lands predominate. Only 31.9 percent (599 square miles) of the county's land is in private ownership. About 821 square miles (43.7 percent of the total area) in the northern and eastern portions of the county are in the Caribou-Targhee National Forest. Another 220 square miles (11.8 percent of the total area), mostly in the western part of the county, is administered by the Bureau of Land Management. The state of Idaho manages about 175 square miles in parcels scattered throughout the county.
The diversity of the Fremont County landscape reflects its geologic history. The northern and eastern parts of the county are on the volcanic highlands of the Yellowstone Plateau, where the landscape features lodgepole pine forests, mountain meadows, streams and the headwaters of the Henry's Fork of
the Snake River. The county is bordered to the east by the Yellowstone Plateau and the Wyoming border. The steeply rising Centennial Mountains and Henry's Lake form a distinctive landscape on Fremont County's northern border. The crest of the mountains defines both the Continental Divide and the Idaho-Montana state line. The southern and western parts of the county lie over the basalt flows of the Snake River Plain - an area of irrigated cropland and sagebrush steppes that
also includes a belt of active sand dunes.
Fremont County10 has three significant cities (St. Anthony, Ashton and Island Park) on U.S. Highway 20, which is heavily traveled by tourists headed for Yellowstone National Park, Henry’s Lake and Harriman State Park. The county attracts many locals to its recreation areas but also draws national and international tourists.
The closure of a sawmill in the 1980s and relocation of the U.S. Forest Service office to nearby Idaho Falls several years ago hurt the local economy, and rebounding has been difficult. Since 2002, the unemployment rates have fluctuated from a low of 3.1 percent in 2007 to a high of 9.2 in 2010. The labor force has held steady during much of the last decade. Government provides the most nonfarm payroll jobs, primarily through the state Juvenile Correction Center in St. Anthony. Federal and state land management agencies employ many workers. Trade, construction and leisure and hospitality also account for large percentages of the jobs in Fremont County.
9 Statistical description from Fremont County Website, http://www.co.fremont.id.us/misc/about/statistics.htm
2Preliminary Consortium Draft December
12-31-10 Fremont County Workforce Trends – Idaho Department of Labor, November 2013
12-31-
3Preliminary Consortium Draft December
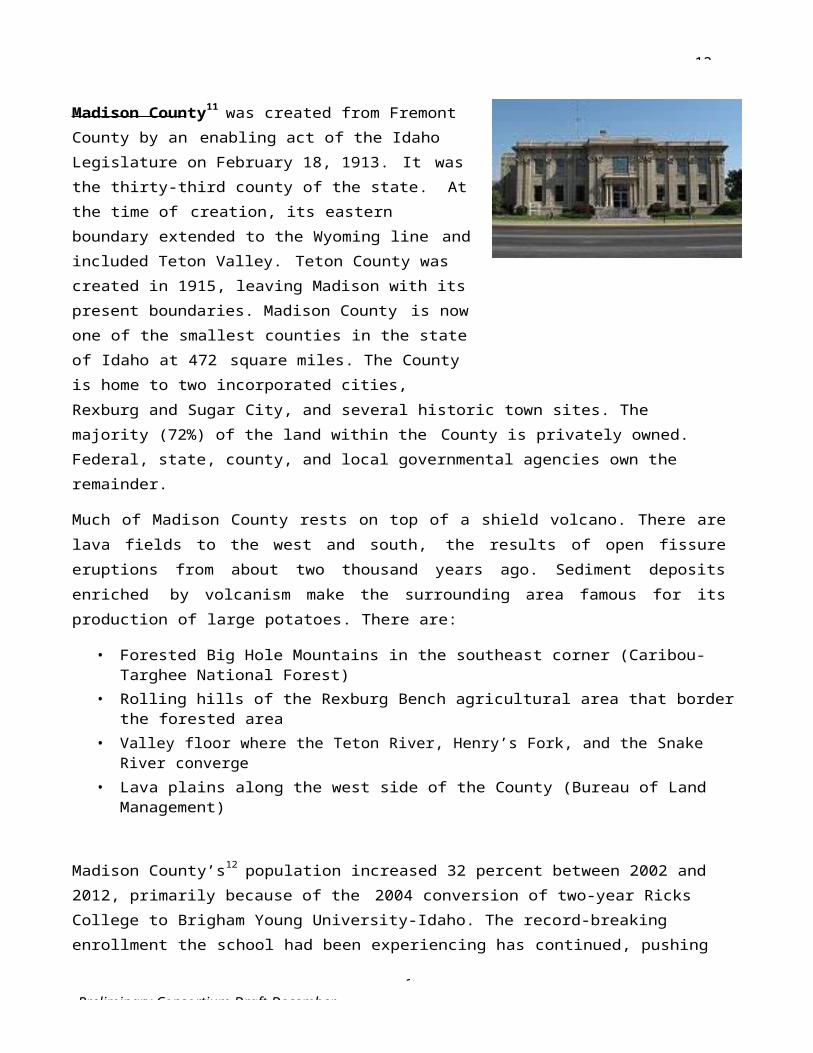
Madison County11 was created from Fremont County by an enabling act of the Idaho Legislature on February 18, 1913. It was the thirty-third county of the state. At the time of creation, its eastern boundary extended to the Wyoming line and included Teton Valley. Teton County was created in 1915, leaving Madison with its present boundaries. Madison County is now one of the smallest counties in the state of Idaho at 472 square miles. The County is home to two incorporated cities,Rexburg and Sugar City, and several historic town sites. The majority (72%) of the land within the County is privately owned. Federal, state, county, and local governmental agencies own the remainder.
Much of Madison County rests on top of a shield volcano. There are lava fields to the west and south, the results of open fissure eruptions from about two thousand years ago. Sediment deposits enriched by volcanism make the surrounding area famous for its production of large potatoes. There are:
• Forested Big Hole Mountains in the southeast corner (Caribou-Targhee National Forest)• Rolling hills of the Rexburg Bench agricultural area that border the forested area• Valley floor where the Teton River, Henry’s Fork, and the Snake River converge• Lava plains along the west side of the County (Bureau of Land Management)
Madison County’s12 population increased 32 percent between 2002 and 2012, primarily because of the 2004 conversion of two-year Ricks College to Brigham Young University-Idaho. The record-breaking enrollment the school had been experiencing has continued, pushing economic growth, especially through construction of student housing and campus expansion. BYU-Idaho plans to further expand its current student population of 15,000 through 2015.
Madison County has maintained one of the lowest unemployment rates in the state. The county has been well below the national and state rates, and the expansion of existing businesses and emergence of new ones has kept its multilingual labor market very tight. Call centers are finding the bilingual skills of computer-trained students enticing. Of the county’s major employers, three are call-center based.New business parks in Rexburg are also attracting many new and expanding businesses. Trade generates a quarter of the county’s jobs, strong in both retail and wholesale. Health care and education also play a large role, and the hospital is expanding as the number of clinics countywide increases.
With growth in population and economic activity comes increased demand for transportation infrastructure. The vision of Madison County and the Rexburg community is for a comprehensive transportation network serving the needs of all residents and visitors...It is extremely important to Madison County residents to provide for all modes of transportation including pedestrian, bicycle and feasible transit facilities.
12-31-
4Preliminary Consortium Draft December
11 Madison County Comprehensive Plan, March 2008, and Madison County website12 Madison County Workforce Trends – Idaho Department of Labor, November 2013
2Preliminary Consortium Draft December
12-31-
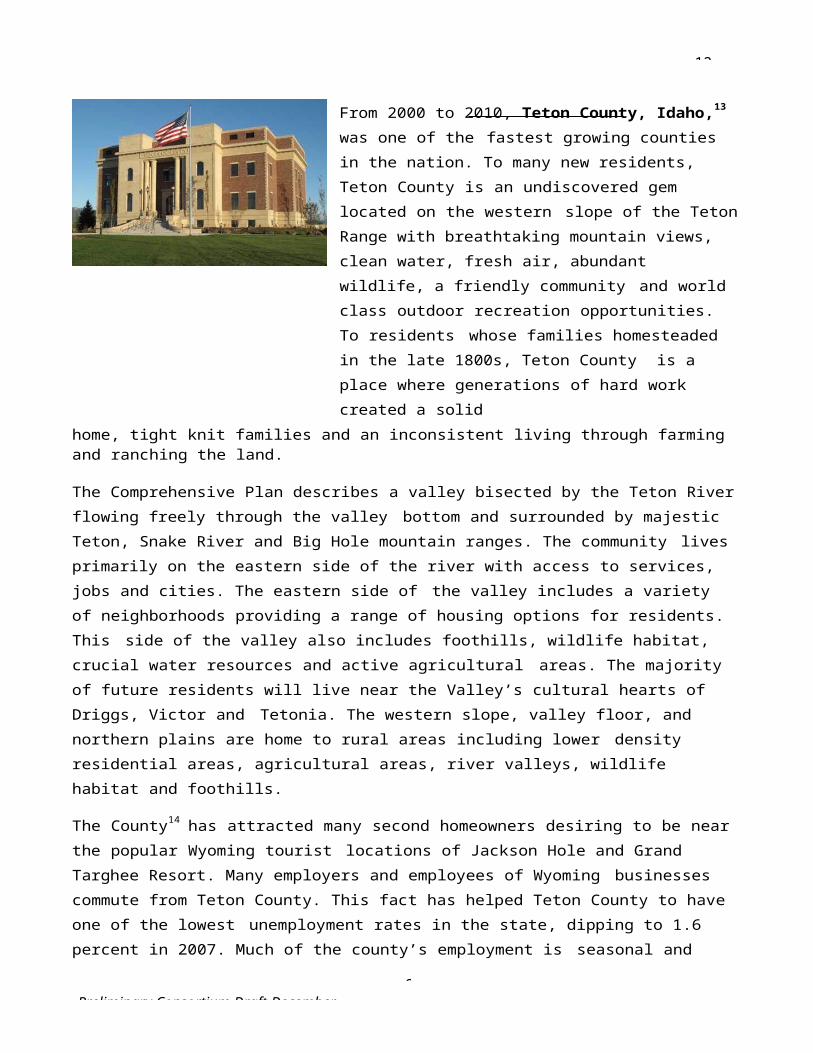
From 2000 to 2010, Teton County, Idaho,13 was one of the fastest growing counties in the nation. To many new residents, Teton County is an undiscovered gem located on the western slope of the Teton Range with breathtaking mountain views, clean water, fresh air, abundant wildlife, a friendly community and world class outdoor recreation opportunities. To residents whose families homesteaded in the late 1800s, Teton County is a place where generations of hard work created a solid
home, tight knit families and an inconsistent living through farming and ranching the land.
The Comprehensive Plan describes a valley bisected by the Teton River flowing freely through the valley bottom and surrounded by majestic Teton, Snake River and Big Hole mountain ranges. The community lives primarily on the eastern side of the river with access to services, jobs and cities. The eastern side of the valley includes a variety of neighborhoods providing a range of housing options for residents. This side of the valley also includes foothills, wildlife habitat, crucial water resources and active agricultural areas. The majority of future residents will live near the Valley’s cultural hearts of Driggs, Victor and Tetonia. The western slope, valley floor, and northern plains are home to rural areas including lower density residential areas, agricultural areas, river valleys, wildlife habitat and foothills.
The County14 has attracted many second homeowners desiring to be near the popular Wyoming tourist locations of Jackson Hole and Grand Targhee Resort. Many employers and employees of Wyoming businesses commute from Teton County. This fact has helped Teton County to have one of the lowest unemployment rates in the state, dipping to 1.6 percent in 2007. Much of the county’s employment is seasonal and depends on tourism, but officials are working toward more year-round employment.
The five main industries are trade, leisure and hospitality, construction, professional and business services and government. State and local government jobs along with hospital and school employment make government the top employer. Trade, leisure and hospitality depend on the local and national tourism market. With population growing so rapidly, residential and commercial construction had been heavy when weather permitted, but both slowed with the onset of the recession.
The Comprehensive Plan envisions that the Valley will have a perimeter trail that rivals the best system in the nation. Pathway connections along old railroad beds and existing roads will augment the perimeter trail and create a complete pathway network. The Plan envisions a road system anchored by formalized gateways and flanked by scenic viewsheds. Scenic vista protection will be centered along Highways 33, 32, 31 and Ski Hill Road - the primary transportation routes through the Valley. The County will be served by a multimodal road and pathway system that connects towns, Grand Targhee Resort, Idaho Falls and Jackson.
2Preliminary Consortium Draft December
12-31-
13 Teton County Comprehensive Plan – A Vision and Framework 2012-203014 Teton County Workforce Trends – Idaho Department of Labor, November 2013
12-31-
2Preliminary Consortium Draft December
Te ton C ounty, Wy om i ng , 15 is located in the northwestern corner of the state, nestled between the majestic Teton and the Gros Ventre Mountain Ranges. Within the county’s borders are the Jackson Hole valley, Gr and Te ton Na ti on al P ar k , the Na ti onal Elk Re fuge , Bri dge r - Te ton N ational Forest, and over 40% of Yellow stone Nati on al P a rk . Approximately 97% of the land within the county's borders is held in public ownership.
The county seat is located in the Tow n of Jac kson , which is the county’s only municipality. County services include a library, public health office, parks and recreation department, public transit and pathways system, planning and building, and emergency response. Other towns within the county include Alta, Hoback Junction, Kelly, Moose, Moran, Teton Village and Wilson, but none are incorporated. Teton County has a single school district, Te ton County Sc ho ol Distric t #1 , a hospital , and a thr ivin g non-prof it c omm unity .
Jackson Hole16 now ranks among the best-known resort communities in the West, and Teton County is one of the wealthiest counties in the nation. Most of that income does not come from wages, but from other sources. Income from investments and professional services are now the primary economic forces in the county. Tourism has dropped to second place. Wealthy people are drawn to the county by its beauty and recreation opportunities, but also by the fact that Wyoming has no state income tax, and property tax rates are quite low compared to other upscale parts of the U.S.
The public lands preserve the scenic vistas and space for a variety of recreational pursuits. Thanks to those lands, people continue to visit—and many stay—to climb mountains, ski, camp, hunt, fish and boat. Debate continues over how to preserve the county’s physical attractions, do a good job serving the millions of visitors, and at the same time maintain the character of a western community that has been so drastically changed by the influx of wealth from the outside.
Teton County’s Strategic Intent on Environmental Stewardship17: We actively protect and enhance our unique landscape and environment, which underpin our economy, community, heritage and future well-being. Our goals:
Support an integrated and efficient multi-modal transportation system Implement land use policies that preserve open space and wildlife habitat and protect air and
water quality Facilitate sustainable living and business practices in our community Reduce Teton County’s environmental footprint through sustainable practices Partner and collaborate with local, state, federal and other agencies
15 Teton County, Wyoming, website – About Teton County16 WyoHistory.org website17 Board of County Commissioners Strategic Plan - Adopted July 16, 2013
12-31-
2Preliminary Consortium Draft December
WHO LIVES HERE NOW: POPULATION AND DEMOGRAPHICS OF THE TETON VIEW REGION
This section provides a review of population and household characteristics in the counties and communities participating in the Regional Analysis of Impediments (See Appendix C). It includes an analysis of protected class concentrations, segregation and RCAP/ECAP in the region as required by HUD. Data from the 100% Census years are primarily used (1990, 2000 and 2010), with supplement from the 2008-2012 ACS 5-year estimates and 2014 Housing Survey, as needed.
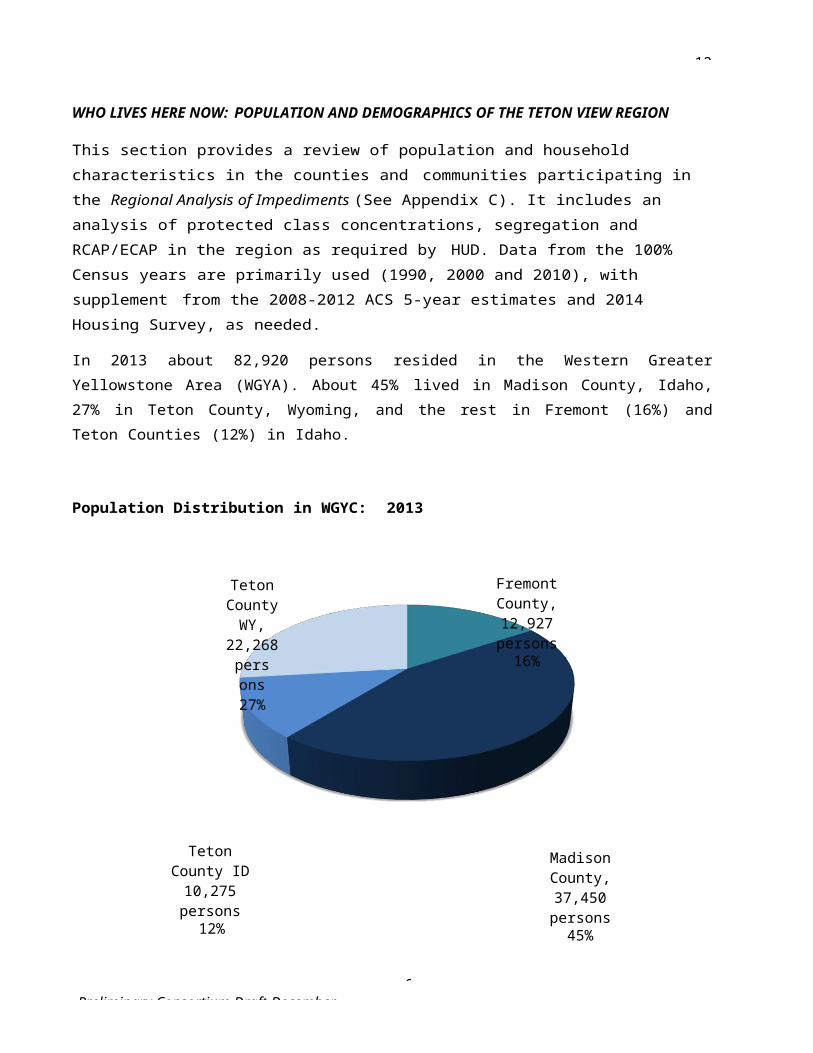
In 2013 about 82,920 persons resided in the Western Greater Yellowstone Area (WGYA). About 45% lived in Madison County, Idaho, 27% in Teton County, Wyoming, and the rest in Fremont (16%) and Teton Counties (12%) in Idaho.
Population Distribution in WGYC: 2013
Teton County WY, 22,268
persons 27%
Teton County ID 10,275 persons
12%
Fremont County, 12,927 persons
16%
Madison County, 37,450 persons
45%
Source: 2013 Census Population Estimates
The WGYA added about 33,000 persons between 1990 and 2010, growing at a rate of 29% during both decades. About 42% of these persons were added in Madison County, 34% in Teton County, Wyoming, 21% in Teton County, Idaho, and 6% in Fremont County. The rates of growth in each county show significant variation:
Teton County, Idaho, grew at the fastest rate – over 70% during each decade. This was fueled by increased jobs, growth in the Grand Targhee Resort area, and demand from workers in Teton County, Wyoming, looking for more affordable homes. Victor grew over 560%, from under 300 persons in 1990 to over 1,900 today;
Madison County showed modest growth in the 1990’s (16%), but then picked up in the 2000’s (37%), with 81% of this growth occurring within the city of Rexburg. The two-year college in
12-31-
2Preliminary Consortium Draft December
Rexburg, formerly known as Ricks College, officially became BYU-I in 2001, a four-year university, fueling the rapid growth in the 2000’s;18
The population in Teton County, Wyoming, grew by 63% in the 1990’s. The growth rate dropped to 17% in the 2000’s. For fear of losing the community’s character, Teton County, Wyoming, adopted land development regulations in 1994 to manage the significant growth that was occurring. Land regulations and the increased scarcity of developable private land (97% of the county is federal land) assisted the slower growth of the 2000’s; and
Fremont County had the slowest growth rate, increasing 12% in the 2000’s. The city of Island Park shows the most growth, increasing over 33% in each decade; however, this equates to only 127 additional persons.
WGYA Population: 1990 to 2013
Counties and Incorporated Cities/Towns
Source: 1990, 2000,2010 US Census;
2013 Censuspopulation estimates
18 Student enrollment increased from about 8,900 in 2000 to over 15,000 in the fall of 2013. Enrollment is projected to increase to about 20,600 students in 2018 (or by about 1,000 students per year).
1990 2000 2010 2013
% Change
1990-00
% Change
2000-10
WGYC Region 49,222 63,536 82,242 82,920 29% 29%
Fremont County, ID 10,937 11,819 13,242 12,927 8% 12%
Ashton 1,114 1,129 1,127 1,084 1% 0%
Island Park 159 215 286 276 35% 33%
St. Anthony 3,010 3,342 3,542 3,465 11% 6%
Madison County, ID 23,674 27,467 37,536 37,450 16% 37%
Rexburg 14,302 17,257 25,484 26,520 21% 48%
Teton County, ID 3,439 5,999 10,170 10,275 74% 70%
Driggs 846 1,100 1,660 1,657 30% 51%
Victor 292 840 1,928 1,938 188% 130%
Teton County, WY 11,172 18,251 21,294 22,268 63% 17%
Jackson 4,472 8,647 9,577 10,135 93% 11%
12-31-
2Preliminary Consortium Draft December
Source: 1990, 2000, 2010 US Census; 2013 Census population estimates
The population is unevenly distributed throughout the WGYA. As shown on the following map:
The area north of Ashton in Fremont County and much of the unincorporated area in Teton County, Wyoming, average less than five persons per square mile.
The most populated area of Fremont County is in and around St. Anthony, with between 88 and 250 persons per square mile.
The most populated area in Teton County, Wyoming, is in and near the town of Jackson.
Rexburg in Madison County has the densest population in the WGYA.
Population Density by Census Tract: WGYA 2010
12-31-
2Preliminary Consortium Draft December
20002010
% Change26%
27%
23%21%
19%17% 18%
19%
9%7% 8% 8%
Age of Population
The proportion of residents between the ages of 5 and 24 declined in the WGYA between 2000 and 2010, whereas the proportion of residents under 5 and over 25 increased. The largest percentage increase occurred at the two extremes – for persons age 5 and under (59% increase) and those age 65 and over (38% increase). Compared to the states of Idaho and Wyoming:
The percentage of college-aged residents (between 18 and 24) is high (21%). About 10% of residents in both Idaho and Wyoming are in this age group;
The percentage of residents between 45 and 64 is low (19%) compared to the states of Idaho (25%) and Wyoming (28%) as a whole; and
The percentage of seniors age 65 and over is low (8%). About 12% of the population in both Idaho and Wyoming are seniors.
WGYC Region
Percentage of Population by Age: 2000, 2010, % Change
30%
25%
20%
15%
10%
5%
70%
60%
50%
40%
30%
20%
10%
0% 0%Under 5 5 to 17 18 to 24 25 to 44 45 to 64 65 and Over
Age of Population
Source: 2000 and 2010 US Census
% o
f
% C
hang
e in

12-31-
2Preliminary Consortium Draft December
When evaluated by area, it is apparent that:
The high proportion of college-aged residents (18 to 24) in the area is related to the students in Rexburg (49% of the population). The town of Jackson also attracts this age group (14%) through seasonal park, ski resort and other tourism-related jobs. The proportion of the population in this age group in all other areas is similar to the state averages (10%);
Residents under 5 increased faster than the population as a whole in all counties and cities/towns, with the cities of Victor (205% increase) and Rexburg (138% increase) topping the list;
Not surprisingly, young adult residents, age 25 to 44, also increased the most in Victor (165%) and Rexburg (147%), as these households are the most likely to have young children. Victor has been attracting young families employed in Teton County, Wyoming, due to comparatively lower housing prices. Rexburg is influenced by BYU-I, both in attracting students and providing jobs for young families;
Areas in Fremont County and in Teton County, Wyoming, lost residents between the ages of 5 and24. These populations increased in both Madison County and Teton County, Idaho, although at slower rates than the population as a whole in each county;
Seniors age 65 and over grew at a faster rate than the population as a whole in both Fremont County (26% vs. 12%, respectively) and Teton County, Wyoming (66% vs. 17%). Only the town of Jackson (18% increase) and the city of Island Park (55%) show this same relationship. This can be attributed in part to an aging population and second homeowners retiring to their homes in Teton County, Wyoming, and Jackson and the Island Park area.
Fremont County has the highest percentage of seniors of all counties in the region (14%). About 16% of the population in the city of Ashton, city of Island Park and the unincorporated county are seniors.
12-31-
2Preliminary Consortium Draft December
Percentage of Population by Age:
2000, 2010 and % Change
2000 Under 5 5 to 17 18 to 24 25 to 44 45 to 64 65 and Over
Fremont County, ID 8% 25% 9% 25% 20% 12%
Ashton 8% 25% 8% 25% 17% 17%
Island Park 4% 15% 11% 27% 28% 13%
St. Anthony 10% 23% 10% 27% 18% 11%
Madison County, ID 7% 19% 40% 16% 12% 6%
Rexburg 6% 12% 57% 12% 8% 5%
Teton County, ID 9% 23% 8% 34% 19% 7%
Driggs 8% 23% 11% 35% 16% 8%
Victor 10% 22% 7% 38% 16% 8%
Teton County, WY 5% 15% 10% 38% 25% 7%
Jackson 5% 13% 14% 44% 18% 6%
2010 Under 5 5 to 17 18 to 24 25 to 44 45 to 64 65 and Over
Fremont County, ID 9% 23% 8% 24% 23% 14%
Ashton 9% 24% 7% 24% 21% 16%
Island Park 6% 13% 6% 24% 34% 16%
St. Anthony 11% 21% 10% 27% 21% 10%
Madison County, ID 10% 16% 36% 21% 11% 6%
Rexburg 10% 11% 49% 20% 7% 4%
Teton County, ID 10% 20% 7% 34% 23% 7%
Driggs 10% 20% 9% 34% 21% 7%
Victor 13% 19% 6% 43% 15% 4%
Teton County, WY 6% 13% 8% 35% 28% 10%
Jackson 7% 11% 12% 44% 21% 6%
12-31-
3Preliminary Consortium Draft December
% Change 2000-2010 Under 5 5 to 17 18 to 24 25 to 44 45 to 64 65 and Over
Fremont County, ID 17% 3% -7% 7% 28% 26%
Ashton 4% -4% -7% -4% 21% -9%
Island Park 89% 15% -25% 19% 61% 55%
St. Anthony 15% -5% 6% 8% 18% -3%
Madison County, ID 84% 18% 25% 77% 31% 26%
Rexburg 138% 28% 27% 147% 34% 11%
Teton County, ID 93% 46% 37% 73% 104% 48%
Driggs 87% 30% 29% 48% 95% 30%
Victor 205% 96% 114% 165% 111% 11%
Teton County, WY 36% 4% -5% 8% 29% 66%
Jackson 33% -3% -7% 11% 25% 18%
Source: 2000 and 2010 US Census
All cities, towns and CDPs were analyzed in the area to determine where the highest concentrations of seniors reside in the WGYA. This is important because it can affect the types of housing and services needed by the resident populations, such as access to nursing and medical care and alternative transportation options.
For the WGYA, where 8% of the population is 65 or older, concentrations (as defined by HUD) occur where the proportion is 18% or more. As shown below:
There are no notable concentrations of seniors in the region. The populations in Warm River and Drummond in Fremont County are each over 33% seniors; however, only seven (7) seniors reside in these communities in total. About 18% of the population in Teton Village, Wyoming, are seniors (61 total). These areas combined comprise only 1% of seniors in the region.
No areas in Madison County exceed 10% seniors, including the census tracts, and all areas in Teton County, Idaho, are 7% or below.
About 17% of the population in the unincorporated area of Teton County, Wyoming, are seniors. While not technically high enough to be defined as a concentration, this equates to 29% of the senior population in this county.
No census tract in the town of Jackson exceeds 12% seniors.
3Preliminary Consortium Draft December
WGYC Av8%
rage
40% 38%
35%
30%
33%
25%e
20%16%
15%10%
14%16% 15% 16%
12% 11% 10%
5%0%
WGYC Ave8%
rage12%
10%9%
10%
8% 7%7%
7% 7%
6% 6%
4% 4% 4%
2%
0%
12-31-
Percent Age 65 and Older by City/Town/CDP: 2010
Fremont County
Madison and Teton Counties, Idaho
% P
erso
ns A
ge 6
5 an
d Ov
er p
er
% P
erso
ns A
ge 6
5 an
d Ov
er p
er
3Preliminary Consortium Draft December
WGYC Average 8%
20%18%16%14%
18%17%
14% 14%13%
12%10%8%6%4%2%0%
12%10%
9%8%
6% 6%
12-31-
Teton County, Wyoming - Source: 2010 US Census
The WGYA has never had a racially diverse population. In 2010, about 91% of the population was white, down from about 94% in 2000. Asian, American Indian/Alaska Native, and Black/African American residents combined comprise 1,300 residents, or 1.6% of the population in the region.
Population by Race: 2000 and 2010
2000 2010 % Change
WGYC Region # % # % 2000-2010
TOTAL Population 63,536 100% 82,242 100% 29%
White 59,594 93.8% 74,620 90.7% 25%
Black or African American 121 0.2% 305 0.4% 152%
American Indian and Alaska Native 280 0.4% 338 0.4% 21%
Asian 309 0.5% 664 0.8% 115%
Native Hawaiian/Other Pacific Islander 77 0.1% 95 0.1% 23%
Some other race 2,437 3.8% 4,974 6.0% 104%
Two or more races 718 1.1% 1,246 1.5% 74%
Source: 2000 and 2010 US Census
% P
erso
ns A
ge 6
5 an
d Ov
er p
er
12-31-
3Preliminary Consortium Draft December
Persons of Hispanic/Latino Origin
The Hispanic/Latino population has historically constituted a very small percentage of the population in Idaho and Wyoming, including the WGYA. Until the 1990’s, Idaho and Wyoming were very predominately white (over 95%). In the WGYA, less than 4% of the population (under 2,000 persons) was Hispanic/Latino in 1990. No county in the WGYA had more than 762 Hispanic/Latino persons in 1990. Teton County, Wyoming, only had 158 persons of Hispanic/Latino origin in 1990, yet now has the highest number of Hispanic/Latino persons in the WGYA (near 3,200 total).
Persons of Hispanic or Latino origin are now more prevalent. Where this population used to reside only seasonally in the area, persons of Hispanic/Latino origin have been making the WGYA their permanent home in recent decades. The Hispanic/Latino population in the WGYA increased from under 4% in 1990 to 11% in 2010. This is very similar to the growth rate seen in the state of Idaho as a whole. In Idaho this population increased from 5% in 1990 to 11% by 201019; growth in Wyoming was slower, increasing from 6% in 1990 to 9% in 2010. A study by the University of Idaho, Idaho Commission on Hispanic Affairs, reported that, as of 2008, most of Idaho’s Hispanic residents were born in the United States rather than immigrants. Just 10% of the state’s total Hispanic population moved to the U.S. in the last decade.20
While the growth of this population was greater in the 1990’s than during the following decade, this population still more than doubled in the 2000’s, accounting for 25% of the population growth in the region, which is similar to state trends.21 By area:
The strongest growth has been in Teton County, Wyoming. About 66% of the total population growth in the 2000’s were persons of Hispanic descent;
The city of Victor has had the strongest growth of all cities and towns in the region and presently houses about 14% of this population; and
The growth of this population picked up in Madison County in the 2000’s after comparatively modest growth in the 1990’s.
19 This growth prompted the Mexico to open its first Idaho consulate in 2008 and reports that it was . See http://consulmex.sre.gob.mx/boise/20 University of Idaho, Idaho Commission on Hispanic Affairs, “Hispanics: An Overview,” June 2010. See also State of Idaho,“2011 Analysis of Impediments to Fair Housing Choice,” May 2012, Sec. II p. 3.21 The WGYA is similar to both the state of Idaho and the state of Wyoming with respect to this figure. The Hispanic/Latino population accounted for 27% of the population growth in each of these states during this same period. Source: 2000 and 2010 US Census.
12-31-
3Preliminary Consortium Draft December
Population of Hispanic/Latino Ethnicity by Area: 1990, 2000, 2010
1990 2000 2010 % Change 90-00
% Change 00-10
WGYC Region 1,910 4,223 8,824 121% 109%
Fremont County, ID 762 1,255 1,694 65% 35%
Ashton 149 157 198 5% 26%
Island Park 5 9 19 80% 111%
St. Anthony 179 514 741 187% 44%
Madison County, ID 753 1,078 2,218 43% 106%
Rexburg 441 697 1,435 58% 106%
Teton County, ID 237 705 1,721 197% 144%
Driggs 74 226 525 205% 132%
Victor 4 90 435 2150% 383%
Teton County, WY 158 1,185 3,191 650% 169%
Jackson 81 1,024 2,607 1164% 155%
Source: 1990, 2000, 2010 US Census
Comparing the distribution of the Hispanic/Latino population in the region to the overall population distribution by county, we find that:
Madison County houses significantly fewer Hispanic/Latino persons relative to its share of the overall population in the WGYA – 25% versus 46%, respectively;
The two Teton Counties house disproportionately more persons of Hispanic descent than their share of the population in the region; and
Fremont County houses a similar percentage of the two populations.
12-31-
3Preliminary Consortium Draft December
TOTAL Population
Hispanic/Latino Ethnicity
46%
36%
25% 26%
19% 20%16%
12%
Distribution of Population by Hispanic/Latino Ethnicity:
WGYA Counties, 2010
50%
45%
40%
35%
30%
25%
20%
15%
10%
5%
0%
Fremont County Madison County Teton County, ID Teton County, WYWGYC County
Source: 2010 US Census
The relative distribution of persons of Hispanic/Latino ethnicity among the counties the WGYA is a factor primarily of employment opportunities and, secondarily, access to housing they can afford.22
Madison County is an exception, where the growth of BYU-I in Rexburg beginning in 2001 helped increase this population.23 While agriculture (which in this region is predominately potatoes) was a primary driver of the Hispanic/Latino population to this area originally, as economies in the WGYA have diversified, this has permitted many previously seasonal workers to move to the area on a year-round basis.24 Counties with the highest proportion of Hispanic/Latino residents in the state of Idaho (greater than 20%) have economies that rely on agriculture and food processing (i.e., mostly southcentral Idaho).25
22 2014 Housing Survey, see Appendix 3. The State of Idaho, “2011 Analysis of Impediments to Fair Housing Choice,” May 2012, report similarly found that there were not strong correlations between affordability and Hispanic presence in a county; rather Hispanic presence may be more strongly related to employment industries. See Sec. I, p. 9.23 Madison County Comprehensive Plan, 2008, p. 13. Available at: http://www.co.madison.id.us/index.php/depts/planning- a-zoning/62-comprehensive-plan24 See 2009 Fremont County Comprehensive Plan. See also the Economic section of this report for more information on economic trends in each county.25 University of Idaho, Idaho Commission on Hispanic Affairs, “Hispanics: An Overview,” June 2010; State of Idaho, “2011 Analysis of Impediments to Fair Housing Choice,” May 2012, Sec. 1, p. 4; University of Idaho, College of Agricultural and Life Sciences, “Community Level Impacts of Idaho’s Changing Dairy Industry,” 2009, available at:
% W
GYC
Pop
ulat
ion
Resi
ding
in E
ach
12-31-
3Preliminary Consortium Draft December
http://icha.idaho.gov/docs/Uof%20I%20Dairy%20Report%20Community_Level_Impacts(10_13_09).pdf
12-31-
3Preliminary Consortium Draft December
Growth in non-agricultural jobs in which Hispanic/Latino residents are predominately employed has been strongest in Teton County, Wyoming, and Teton County, Idaho, in the WGYA.26
Correspondingly, growth in the Hispanic/Latino population has also been strongest in these counties. Job growth has been more modest in Fremont County and this county has had the slowest growth in this population in the region in the past decade. In Madison County, while jobs for this population have shown little growth, BYU-I enrollment has increased since 2000, helping to increase this population. 27
The two Teton Counties are the two most expensive counties in which to live in terms of housing costs;28 yet the Hispanic/Latino population comprises the largest percentage of the population in these counties. When asked why they live in their present community, Spanish respondents to the 2014 Housing Survey predominately responded that they live there for work or jobs, followed by housing costs/availability and family. Similar to the population as a whole, some workers live in Teton County, Idaho, yet work in Teton County, Wyoming, for the comparatively cheaper housing costs. Likewise, some who are employed in Madison County reside within Fremont County. These factors – jobs, then housing and family – have been the primary drivers of where residents live in the region.29
Communities of Concentration
An AI must determine whether there are concentrations of race and ethnicity in an area as compared to the regional average to understand patterns of segregation, if any, in an area. For the WGYC region, where 11% of the population is Hispanic/Latino, concentrations of this ethnicity (based on HUD’s definition) occur where the proportion is 21% or more.
Analyzing by incorporated city and CDP districts, areas of concentration occur in:
Two communities in Fremont County – St. Anthony and Teton City; Two cities in Teton County, Idaho - Driggs and Victor; and The town of Jackson in Teton County, Wyoming.
Together, these areas of concentration represent 51% of the Hispanic/Latino population in the region. About 30% reside in the town of Jackson. Of these, only the town of Jackson has a Hispanic/Latino population over 1,000 persons (2,607 total). All other communities are small, ranging from 163 Hispanic/Latino persons in the city of Teton up to 741 in St. Anthony.
26 See the Economic section of this report. Spanish speaking residents in the WGYA are predominately employed in construction and landscaping jobs (36%) and service sector jobs, including janitorial/housekeeping (29%), food service (24%) and lodging (21%), followed by agriculture (19%). Hispanic residents of Idaho overall we mostly employed in these same professions, with the addition of manufacturing (mainly food manufacturing) and education, health and social assistance. See University of Idaho, Idaho Commission on Hispanic Affairs, “Idaho at a Glance Hispanics: Labor Force & Economy,” Nov. 2010.27 Madison County Comprehensive Plan, 2008, p. 13. Available at: http://www.co.madison.id.us/index.php/depts/planning- a-zoning/62-comprehensive-plan
12-31-
3Preliminary Consortium Draft December
28 See the Housing Profile and Conditions section of this report.29 See 2014 Spanish Housing Survey comments, Appendix 3 of this report.
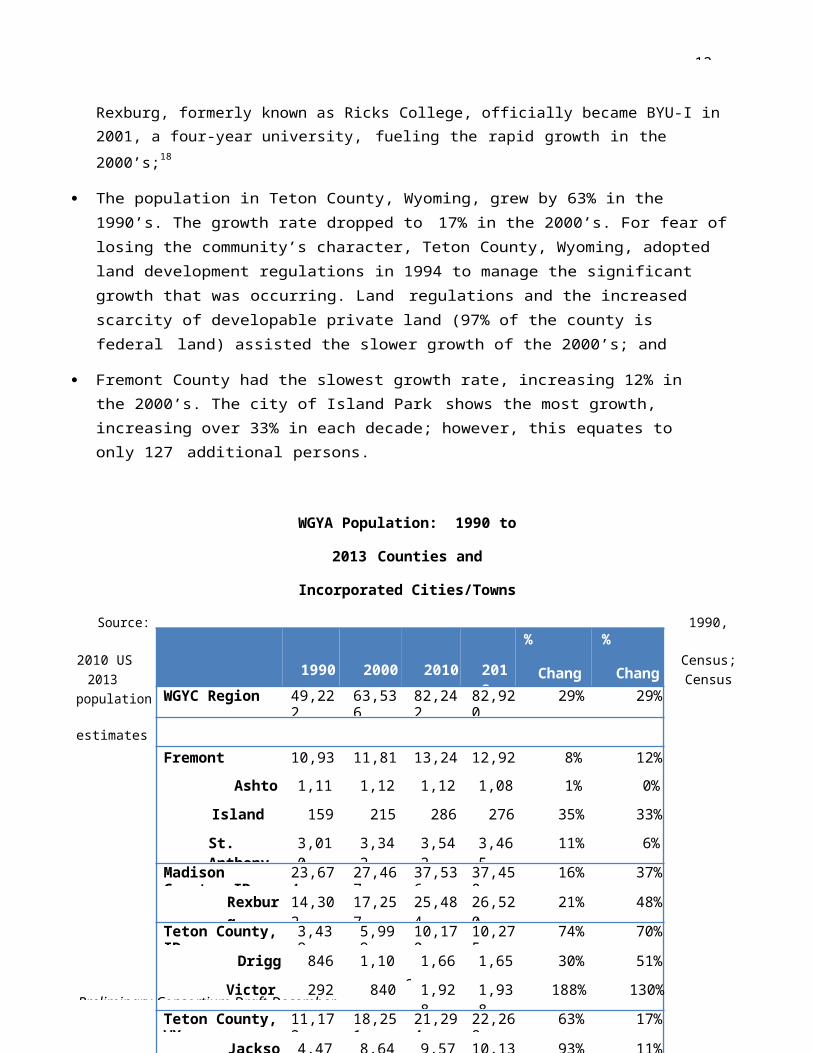
WGYC Avera 11%ge
25%22%
21%
20% 18%
15% 13% 13%
10%7% 8%
5%5%
0% 0%0%
12-31-
3Preliminary Consortium Draft December
Areas of Concentration:
Hispanic/Latino Population, 2010
Total Population
Hispanic/Latino Origin
%Hispanic/Latino
Fremont County, ID
St. Anthony 3,542 741 21%
Teton 735 163 22%
Teton County, ID
Driggs 1,660 525 32%
Victor 1,928 435 23%
Teton County, WY
Jackson 9,577 2,607 27%
Percent Hispanic/Latino Descent by City/Town/CDP: 2010
Fremont County
NOTE: Drummond and Warm River are very small; less than 20 persons combined.
% H
ispa
nic/
Latin
o Po
pula
tion
per

WGYC Average11%
35% 32%
30%
25% 23%
20% 17%
15%11% 11% 12%
10%6% 6% 6%
5%
0%
WGYC Average 11%
30% 27%
25%
20%
15%15% 14%
10%6%
5% 4% 4%5%
3%2%2% 1%
0%
12-31-
3Preliminary Consortium Draft December
Madison and Teton Counties, Idaho
Teton County, Wyoming
Source: 2010 US Census
% H
ispa
nic/
Latin
o Po
pula
tion
per
% H
ispa
nic/
Latin
o Po
pula
tion
per
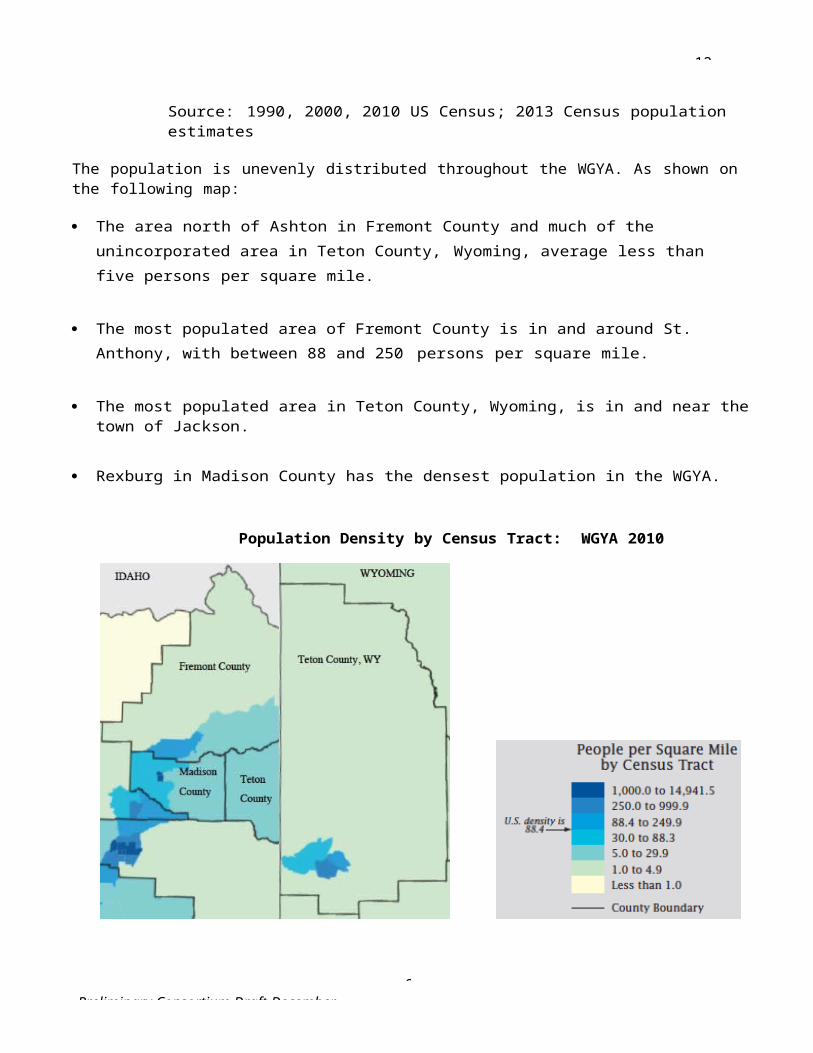
12-31-
4Preliminary Consortium Draft December
In all except Madison County, persons of Hispanic/Latino descent are more likely to be living in city, town and CDP areas than the unincorporated county. This is shown above, where a lower percentage of the population in unincorporated areas is Hispanic/Latino than in the county overall. This is the reverse of population trends in total. For example, in both Fremont County and Teton County, Idaho, only 28% of the Hispanic/Latino population lives in the unincorporated county compared to 56% of the population in total. One primary factor is the lack of housing diversity in unincorporated and non-CDP areas, which are predominately large lot single-family homes.
Two primary factors have led to these concentrations: employment and housing. Jobs in agriculture and food processing, construction/landscaping, other manual trades such as maintenance and mechanical services and tourism-related jobs in accommodation and food services are significant employers of the Hispanic/Latino population in the WGYA (see the Economic section for more detail).
Tourism-related trades dominate in the two Teton Counties, providing significant employment opportunities in Jackson, Driggs and Victor. Teton County, Wyoming, has the most jobs of any county in the region. As with all households in the area, some workers commute over the pass from Driggs or Victor to Jackson for work because housing is more affordable in these communities. One Spanish survey respondent who works in Jackson stated, for example, that they were able to purchase a trailer home in Teton County, Idaho, so they can live together “just as a family, and that is excellent.” About 38% of Hispanic/Latino households reside in mobile homes in Driggs and Victor.
Agriculture is more prominent in Fremont County, accounting for 13% of jobs in the county. Walter’s Produce – an agricultural wholesaler – is a significant employer of Spanish-speaking residents, which is headquartered near Teton, Idaho, and not far from St. Anthony. Broulims Market, another employer, is also located in St. Anthony. And St. Anthony offers access to the farm jobs in the potato fields in the county, as well as nearby Madison County. Homes for purchase are more affordable on average than those in Madison County (see the Housing Profile and Conditions section). About 75% of the Hispanic/Latino population resides in mobile homes in Fremont County, including the St. Anthony and Teton areas.
A common theme with primarily Spanish-speaking residents in the WGYA is that they like how safe the communities are and that they are family friendly. Residing near family is also important. Reviewing survey comments, however, it is apparent that the primary reason these households reside where they do is first because of employment. See Appendix 3 (2014 Spanish Housing Survey comments).
Residential Segregation Analysis Within Communities
This section evaluates the extent to which the ethnic origin of residential populations varies within certain areas. Consequences associated with patterns of segregation can include economic instability, educational inequities, housing market impacts, disinvestment in certain areas and reinforcement of
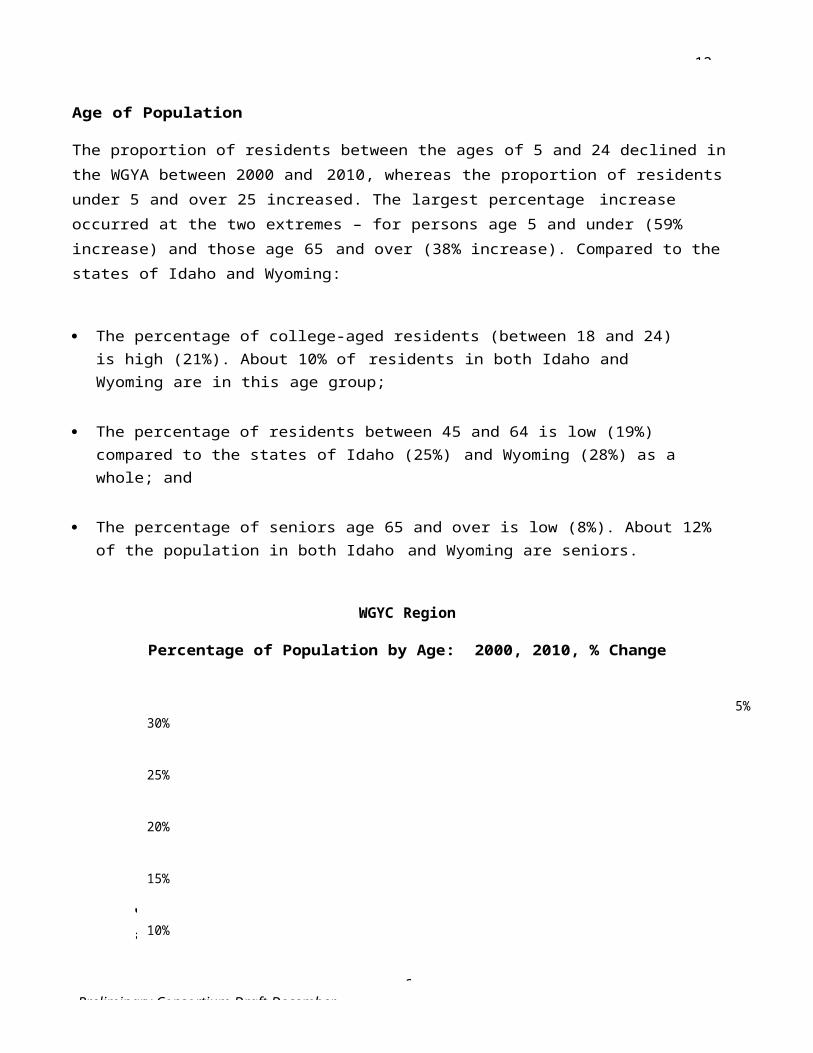
12-31-
4Preliminary Consortium Draft December
prejudicial behaviors. Ethnic minority areas separated from the rest of the community often suffer from reduced educational, employment, financial and other opportunities.
As noted in the introduction to this section, only the city of Rexburg, Idaho, and the town of Jackson, Wyoming, encompass multiple census tracts. All other communities comprise a small portion of one census tract. Therefore, the typical measurements of residential segregation recommended by HUD – the dissimilarity index (defined below) and comparative occupancy of census tracts by population groups – can only be presented for the city of Rexburg, Idaho, and the town of Jackson, Wyoming.
Regarding the smaller communities, these areas generally function like large neighborhoods. Their small populations, rural roads and community atmosphere do not lend themselves to segregation as can be seen in larger cities. Nor are the typical concerns associated with segregation (disinvestment in certain areas, educational inequities, access to town services, etc.) at issue within these small communities. Certain housing subdivisions or projects may have a different mix of residents, but this does not equate to certain residents having vastly different access to amenities or services than any neighboring resident based on their location in the community. In communities with only one commercial center, one public school option, one post office, etc., everyone accesses the same service. Analyzing segregation within these communities is, therefore, not applicable to these small rural areas. The extent to which certain populations are able to reside (or have no other choice but to reside) in certain communities, however, does affect these communities and affects resident access to area resources, which is discussed throughout this report.
Dissimilarity Index
The dissimilarity index30 is a primary metric used to measure the degree of separation of racial or ethnic groups living in an area (i.e., residential segregation). The index falls between 0 and 100. A value of zero(1) implies perfect integration, meaning that every census tract within a region mirrors the groups’ shares in the overall geography. A value of 100 reflects complete segregation, where each census tract is fully comprised of one population or the other. The index reflects the percentage of the ethnic population (in this case the Hispanic/Latino population) that would have to move to achieve full integration in an area.
Dissimilarity cannot be accurately assessed when the racial/ethnic group being measured does not make up a significant portion of the overall population. When a group’s population is under 1,000, use of this index is cautioned.31
Only two incorporated communities in the WGYC are comprised of multiple census tracts: Rexburg, Idaho, and Jackson, Wyoming. These are also the only two jurisdictions in which the Hispanic/Latino
30For a given geographic area, the dissimilarity index is equal to 1/2 Σ ABS [(b/B)-(A/a)], where b is the subgroup population of a census tract, B is the total subgroup population in a city, a is the majority population of a census tract, and A is the
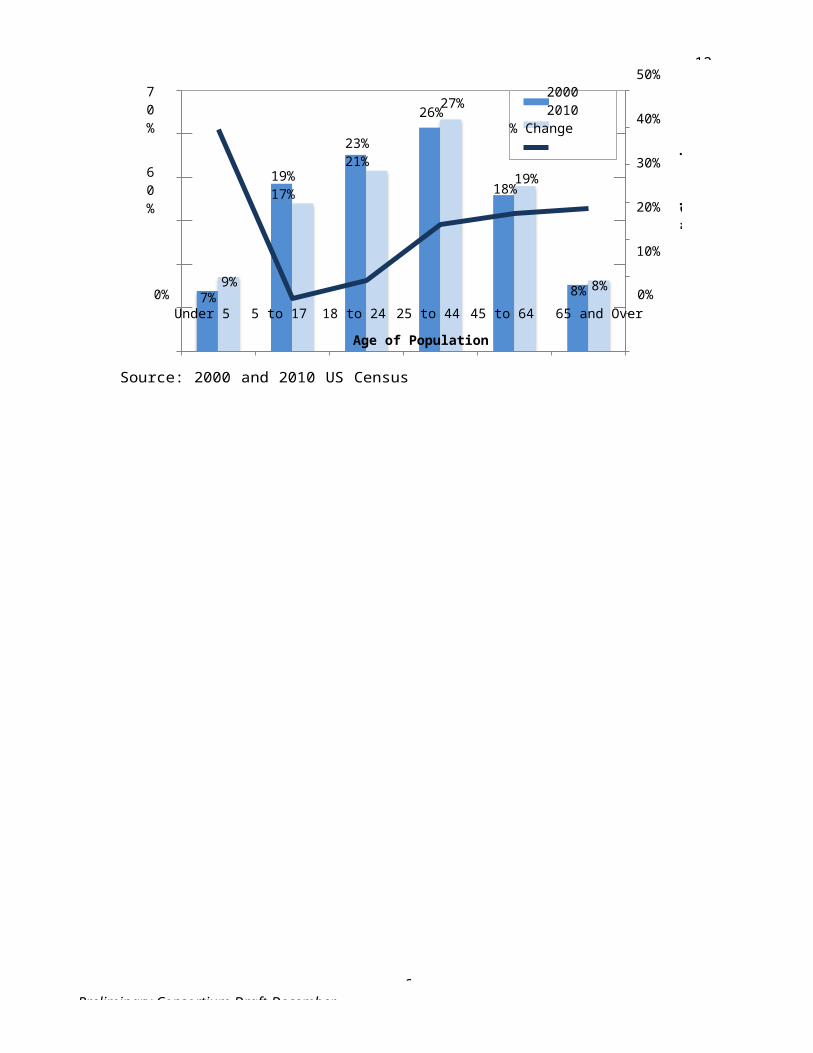
12-31-
4Preliminary Consortium Draft December
total majority population in the city. ABS refers to the absolute value of the calculation.31 See http://www.censusscope.org/segregation.html.
4Preliminary Consortium Draft December
12-31-
population is at least 1,000 persons. Therefore, these are the only two communities for which the dissimilarity index may be calculated.
The dissimilarity index for the city of Rexburg is 3.4, meaning only 3.4% of persons of Hispanic/Latino origin (49 persons) would need to move to achieve full integration.
The dissimilarity index for the town of Jackson is 9.0, meaning only 9.0% of persons of Hispanic/Latino origin (235 persons) would need to move to achieve full integration.
Both communities have near-zero indexes (e.g., almost no segregation).
Distribution by Census Tract
This section presents data on the distribution of persons of Hispanic/Latino origin by census tract for the city of Rexburg, Idaho, and the town of Jackson, Wyoming, given that these are the only two communities in the WGYC which encompass more than one census tract. As reflected by the low dissimilarity index (above), there is little variation in the ethnic origin of populations by census tract within these two communities.
Rex burg
In Rexburg, the population of most census tracts are 5% to 6% Hispanic/Latino, in line with the city’s population as a whole.
The northern-most census tract (CT 9501)32 is an exception at 17% Hispanic/ Latino; however, so few people reside within this tract in Rexburg that this is misleading. Only 1% of the city’s population resides within this tract (291 persons and 49 of Hispanic/Latino origin), whereas the tract as a whole has 6,400 persons. Given that so few persons reside within the city in this tract33 and that the portion of the tract within the city reflects the residential/agricultural character of the unincorporated part of the tract, it is more appropriate to consider the census tract as a whole, which is 6% Hispanic/Latino and in line with the city of Rexburg population.
32 The two darker blue sections in the north part of the city in Rexburg’s census tract map are both part of census tract9501.33 Occupancy by 49 persons of Hispanic/Latino origin of an area housing only 1% of the city’s total population is not large enough to define a pattern or problem of segregation in the area. In fact the character of this portion of the tract exhibits that it is a good area to reside in for access to agricultural, food service, light industrial and retail jobs, as well as residential services. The northwest portion of the tract in Rexburg has a golf course and the northeast portion includes larger retail services (Walmart, Albertsons, Sears, farming and industrial supply, etc.), some industrial uses (Basic American Foods potato and bean processing, car repair, tire service, storage) and other retail options (sporting goods, restaurants, banks, etc.). The area has large operation farms with some grouped single family homes and some manufactured and mobile homes. This same agricultural and residential character continues north through the rest of the census tract up to Sugar City.

4Preliminary Consortium Draft December
12-31-
Jackson
City of Rexburg, IdahoPercent of Population that is Hispanic/Latino by Census
Tract
In Jackson, the population of the three census tracts ranges between 20% and 32% Hispanic/Latino. None of these show significant variation from the city’s average of 27% Hispanic/Latino.
Town of Jackson, WyomingPercent of Population that is Hispanic/Latino by Census Tract
Racially and Ethnically Concentrated Areas of Poverty
RCAPs are spatially concentrated areas with extremely high poverty and the presence of a majority minority population. The existence of RCAPs is the most compelling indicator of extreme segregation. As defined by the Department of Housing and Urban Development (HUD), RCAP/ECAPs are census tracts with a majority non-white population (greater than 50 percent) and a poverty rate exceeding 40 percent or that is three times the metro tract average.
There are no RCAP/ECAP areas within the WGYC region that meet this definition. The most diverse census tract is in Teton County, Wyoming, (CT 9677.01). It is 84% white and 20% of the population is of Hispanic/Latino origin.
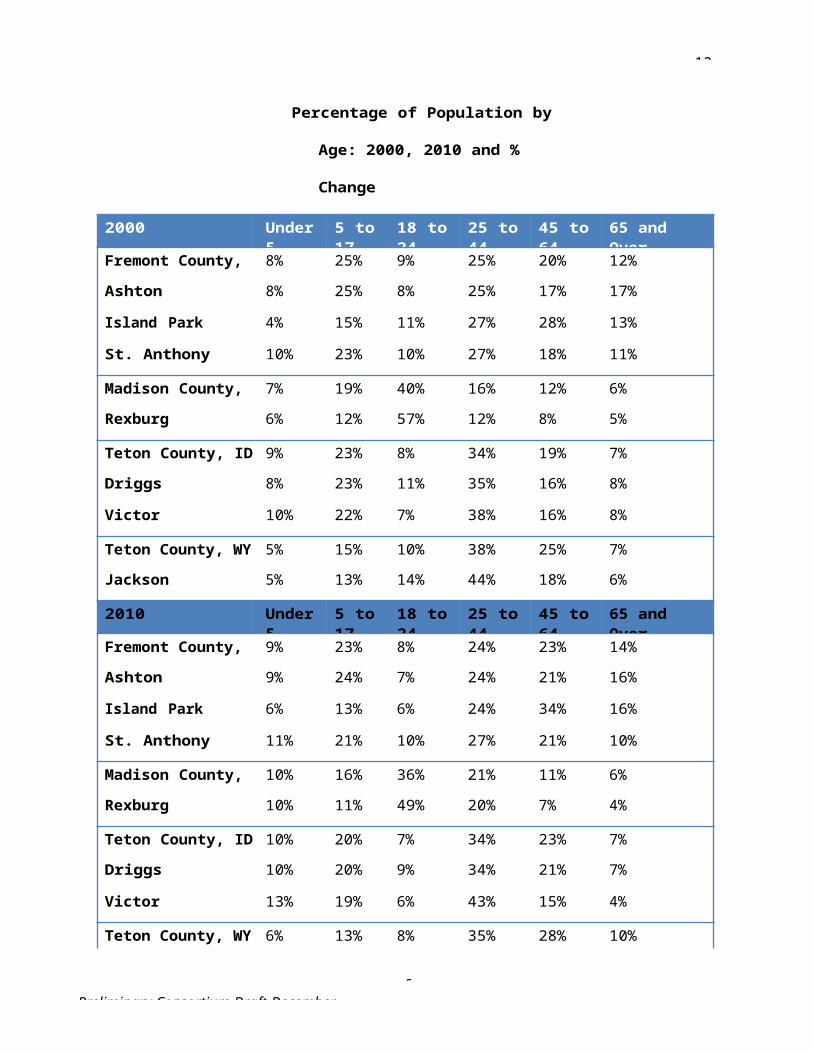
12-31-
4Preliminary Consortium Draft December
Gender
The Fair Housing Act prohibits discrimination in housing based on sex. The percentage of the population that is female in the WGYA dropped slightly in 2010 to 49%. All counties except Madison have a higher proportion of males than females. Mountain resort communities tend to attract more males. The outdoor recreation community in northern Fremont County and the older population also support higher male populations. BYU-I has a higher percentage of female than male students, supporting the larger female population in Madison.
WGYC Population by Gender: 2000 - 2010
2000 2010
Male Female % Female Male Female % Female
WGYC Region 32,064 31,472 50% 41,661 40,581 49%
Fremont County, ID 6,076 5,743 49% 6,963 6,279 47%
Ashton 542 587 52% 553 574 51%
Island Park 114 101 47% 153 133 47%
St. Anthony 1,732 1,610 48% 1,929 1,613 46%
Madison County, ID 13,077 14,390 52% 18,186 19,350 52%
Rexburg 7,795 9,462 55% 12,057 13,427 53%
Teton County, ID 3,178 2,821 47% 5,321 4,849 48%
Driggs 582 518 47% 854 806 49%
Victor 432 408 49% 1,011 917 48%
Teton County, WY 9,733 8,518 47% 11,191 10,103 47%
Jackson 4,671 3,976 46% 5,185 4,392 46%
Source: 2000 and 2010 US Census

12-31-
4Preliminary Consortium Draft December
Disabilities (2000, 2010)
The Fair Housing Act prohibits discrimination based on physical, mental, or emotional handicap, provided reasonable accommodation can be made. Reasonable accommodation may include changes to address the needs of disabled persons, including adaptive structural (e.g., constructing an entrance ramp) or administrative changes (e.g., permitting the use of a service animal). Persons with disabilities are also at greater risk of experiencing housing discrimination, often due to a lack of knowledge about laws governing accommodations for the disabled.
The Census defines a disability as a long-lasting physical, mental or emotional condition that can make it difficult for a person to certain activities, such as walk, climb stairs, dress, bathe, learn or remember. This condition can also impede a person from being able to go outside the home alone or to work.
It is estimated that between about 9% and 11% of persons in the WGYA have a disability – or between 6,600 and 8,200 persons.34 Of persons age 65 and over, 42% have at least one disability.
WGYC RegionPersons With Disabilities by Type: 2010 (est)
2010 PopulationAge 5+
2000 # (2010) % (2000)
Persons age 5+ 75,216 100%
With a disability 8,186 11%
With one type of disability: 5,007 7%
Sensory disability 1,107 1%
Physical disability 1,338 2%
Mental disability 1,059 1%
Self-care disability 21 0%
Go-outside-home disability 401 1%
Employment disability 1,081 1%
With two or more types of disability:
3,178 4%
34 The 2000 Census is the most recent complete data on persons with disabilities over age 5. The 2008-2012 ACS 5-year
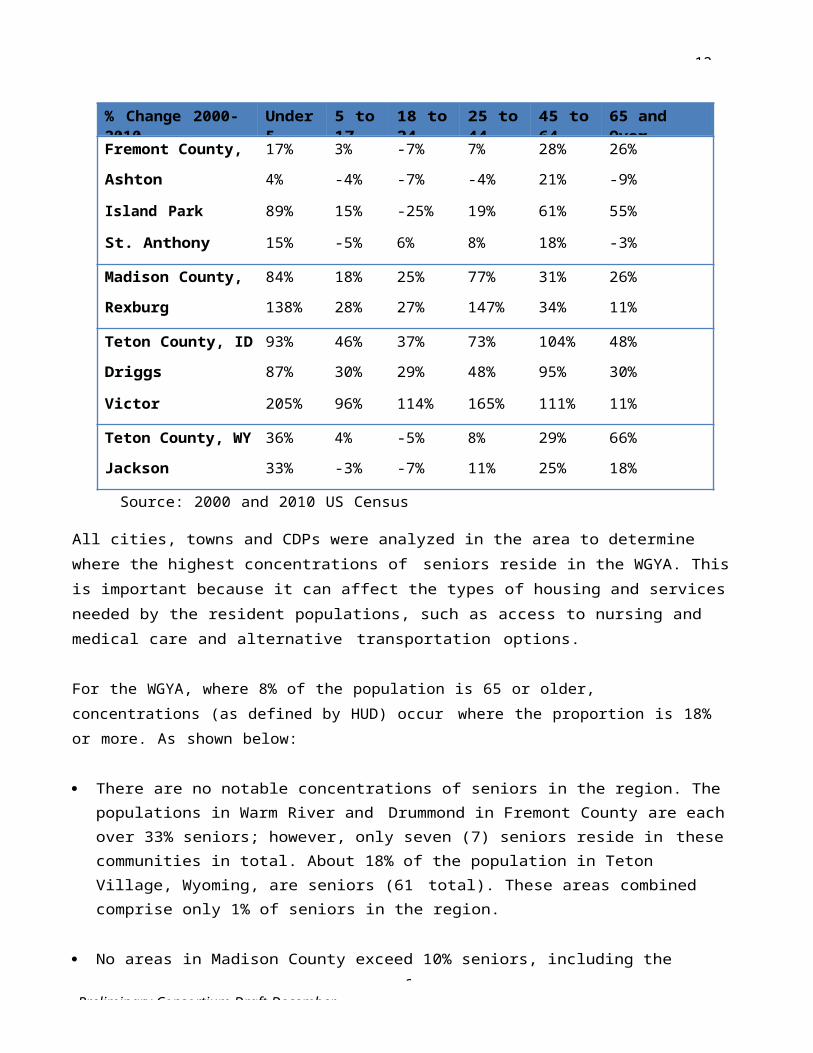
12-31-
4Preliminary Consortium Draft December
estimates are also available, though has a higher margin of error of up to 4% at the county level and up to 15% at the city/town/CDP level in the WGYA.
12-31-
4Preliminary Consortium Draft December
Persons with a Disability Age 5+Total Population Age 5+
43%
38%
29%27% 26%
18%
9% 9%
2008-2012 # (2010) % (ACS)
Persons age 5+ 75,216 100%
Persons with disability 6,735 9%
Sources: 2000 US Census; 2008-2012 ACS 5-year
The proportion of the population with disabilities living in each county was compared to the general distribution of the population overall to understand where higher concentrations of this population may reside.
A greater percentage of persons with disabilities reside in Fremont County than the population as a whole. This is a factor of the higher senior population in this county compared to others in the region.
Madison County, with the youngest population on average, has the lowest proportion of persons with disabilities compared to its share of the total population.
50%
45%
40%
35%
30%
25%
20%
15%
10%
5%
0%
Distribution of Population Age 5+ by County: Persons With Disabilities vs. Total Population, 2010 (est)
Fremont County, ID Madison County, ID Teton County, ID Teton County, WY
Source: 2000 and 2010 US Census
Perc
ent o
f WGY
C Po
pula
tion
Age
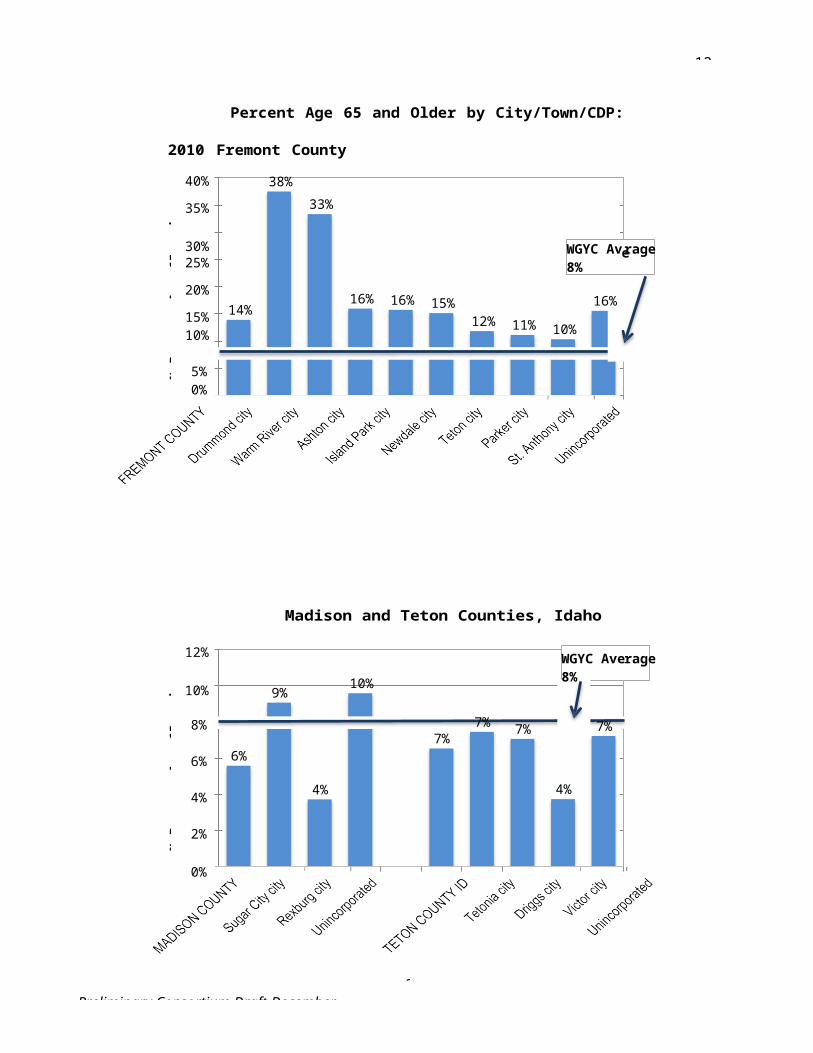
12-31-
4Preliminary Consortium Draft December
More specifically, in the WGYA:
Fremont County has the highest percentage of persons with disabilities (16%). This county also has the highest percentage of seniors (14%).
Rexburg, with the youngest population, has the lowest proportion of persons with disabilities (8%); and
Only St. Anthony is an area of concentration for persons with disabilities, at 22%. The city has at least two (2) senior assisted living centers and 13 affordable rental units for seniors, which accounts for some of this concentration.
Persons with Disabilities by County and City/Town: 2010 (est)
2010Population
age 5+
Persons age 5+
with disabilities
% with disabilities
(2000)
Fremont County, ID
12,076 1,970 16%
Ashton 1,030 184 18%
Island Park 269 33 12%
St. Anthony 3,165 697 22%
Madison County, ID
33,942 3,280 10%
Rexburg 23,032 1,938 8%
Teton County, ID 9,187 950 10%
Driggs 1,499 202 13%
Victor 1,684 200 12%
Teton County, WY
20,011 1,900 9%
Jackson 8,953 1,083 12%
Source: 2000 and 2010 US Census; Consultant team
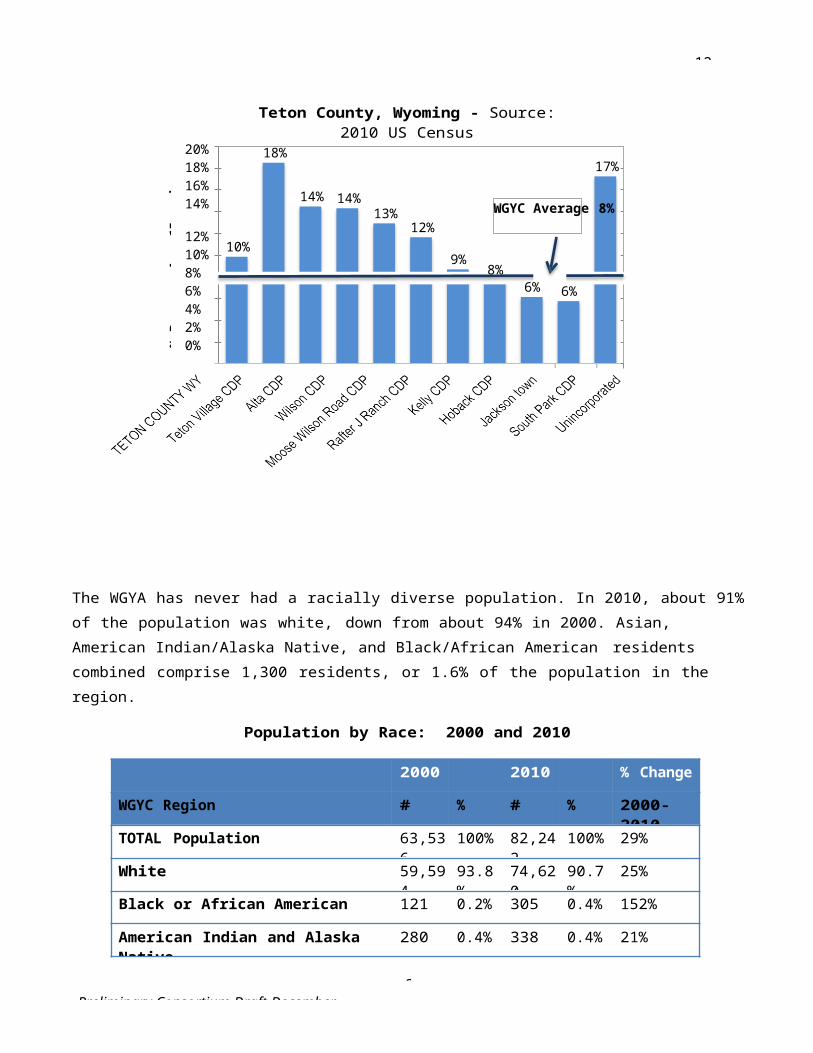
12-31-
4Preliminary Consortium Draft December
Household Characteristics
Households increased by 33% in the WGYA, slightly faster than the population (29%).
Teton County, Idaho, showed the most growth, with the city of Victor more than doubling in size in the 2000’s (133% increase).
Madison County grew at the second fastest rate (49%), primarily driven by growth in Rexburg;
Fremont County and Teton County, Wyoming, grew at similar rates (14% and 17%, respectively). Only the Jackson and St. Anthony showed slower growth in households than the population.
Total Households: 2000 and 2010
2000 2010 %
Change
2000-10WGYA 20,780 27,671 33%
Fremont County 3,885 4,436 14%
Ashton 395 397 1%
Island Park 90 122 36%
St. Anthony 1,091 1,118 2%
Madison County 7,129 10,611 49%
Rexburg 4,274 7,179 68%
Teton County ID 2,078 3,651 76%
Driggs 386 587 52%
Victor 293 683 133%
Teton County WY 7,688 8,973 17%

12-31-
4Preliminary Consortium Draft December
20002010
% Change
31%29%28% 27%
20%19%
15%13%
5% 5%4% 4%
Source: 2000 and 2010 US Census
About two-thirds of households in the regions are family households, which include related persons living together. Households comprised of couples without children showed the largest percentage increase in the region between 2000 and 2010 (52%). These were the only households to increase as a percentage share of households in the region (from 27% in 2000 to 31% in 2010).
35%
30%
25%
20%
15%
10%
5%
WGYC RegionChange in Households by Type: 2000 to 2010
60%
50%
40%
30%
20%
10%
0%Couple
with childrenCouple
no childrenSingle Parent with children
Single Parent no children
0%Living Alone Other
non-family household
Household Type
Source: 2010 US Census
Regarding changes in specific areas of the region since 2000:
Couples with children grew fastest in Victor and Rexburg, showed slow growth in Teton County, Wyoming, and Jackson, and had no growth in Fremont County overall;
Single parents with children increased 24% in the WGYA, with the fastest growth in Teton County, Idaho (104%). Rexburg lost about 5% of their single parent households;
Victor had the fastest growth in non-family households. These households comprise the highest percentage of households in Rexburg (22%) and Jackson (21%) than in other areas in the region;
Persons living alone comprise the highest percentage of households of all household types in Island Park (34%), Jackson (32%) and Teton County, Wyoming (29%). At the other extreme is Rexburg, with only 9% of households consisting of only one person living alone; and
% o
f
% C
hang
e in
Hou
seho
ld
Jackson 3,631 3,964 9%
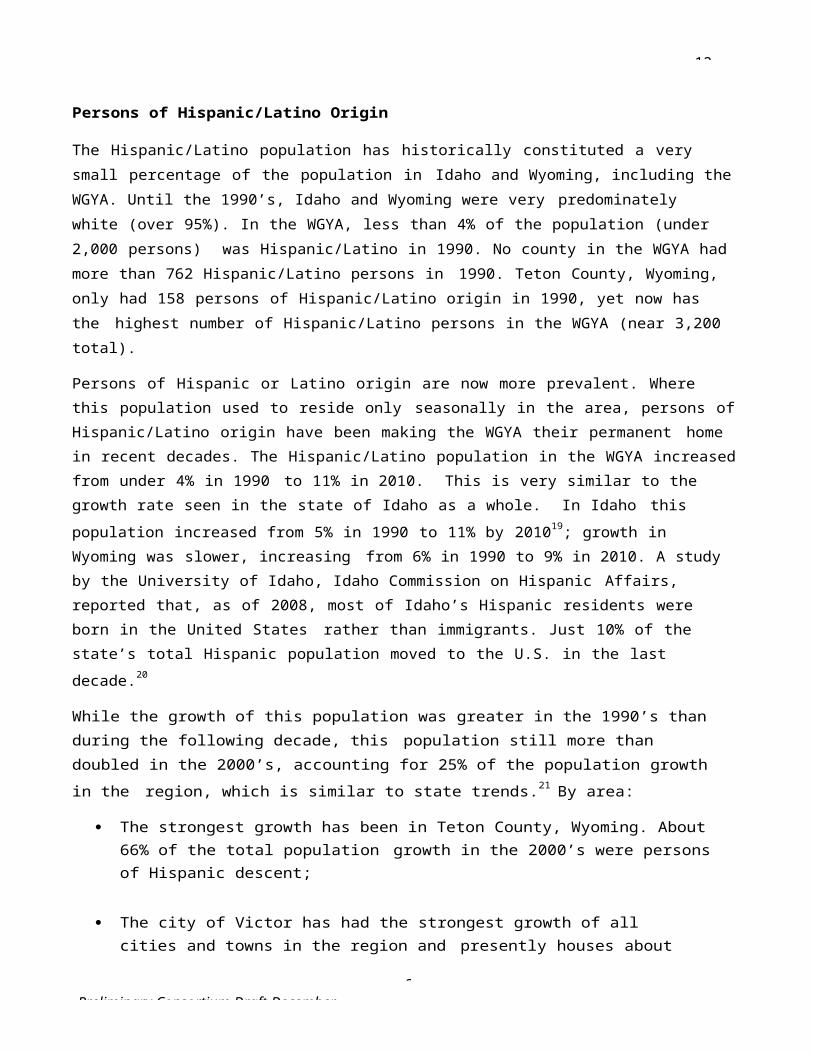
12-31-
4Preliminary Consortium Draft December
In Ashton, only single parent and other non-family households (i.e., roommate households) increased between 2000 and 2010 – all other household types declined.
Households by Type by County and City/Town: 2000 to 2010
Type of Household
# 2010
Married couple Single parent Non-family
With No With No Childre Childre Childre Childre n n n n
Living Alone
Other
Fremont County, ID
Ashton
Island Park
St. Anthony
1,304 1,621
116 114
18 50
336 321
295 216
37 19
4 2
129 71
876 124
99 12
41 7
227 34
Madison County, ID
Rexburg
3,566 3,606
2,106 2,391
361 354
208 220
1,077 1,647
659 1,595
Teton County, ID
Driggs
Victor
1,130 1,021
167 130
232 135
241 117
60 28
43 23
800 342
132 70
164 86
Teton County, WY
Jackson
1,693 2,409
670 726
494 342
250 212
2,621 1,414
1,264 842
% 2010
Married couple Single parent Non-family
Childre None n
Childre None n
Alone Other
Fremont County, ID
Ashton
Island Park
29% 37%
29% 29%
15% 41%
7% 5%
9% 5%
3% 2%
20% 3%
25% 3%
34% 6%
12-31-
5Preliminary Consortium Draft December
St. Anthony 30% 29% 12% 6% 20% 3%
Madison 34% 34% 3% 3% 10% 16%County, ID
Rexburg 29% 33% 3% 3% 9% 22%
Teton County, 31% 28% 7% 3% 22% 9%ID
Driggs 28% 22% 10% 5% 22% 12%
Victor 34% 20% 6% 3% 24% 13%
Teton County, 19% 27% 6% 4% 29% 16%WY
Jackson 17% 18% 6% 5% 32% 21%
% Change
2000-2010
Married couple Single parent Non-family
Childre n
None Childre n
None Alone Other
Fremont 0% 21% 27% 36% 16% 24%County, ID
Ashton -4% -3% 28% 0% -5% 140%
Island Park 20% 43% -20% -33% 64% 0%
St. Anthony 0% 1% 28% 11% -6% 10%
Madison 47% 94% 3% 62% 19% 20%County, ID
Rexburg 94% 151% -5% 58% 21% 19%
Teton County, 60% 86% 104% 26% 81% 101%ID
Driggs 42% 60% 107% 12% 47% 63%
Victor 144% 85% 105% 35% 152% 291%
Teton County, 10% 24% 17% 27% 25% 0%WY
Jackson 9% 15% 5% 17% 17% -4%
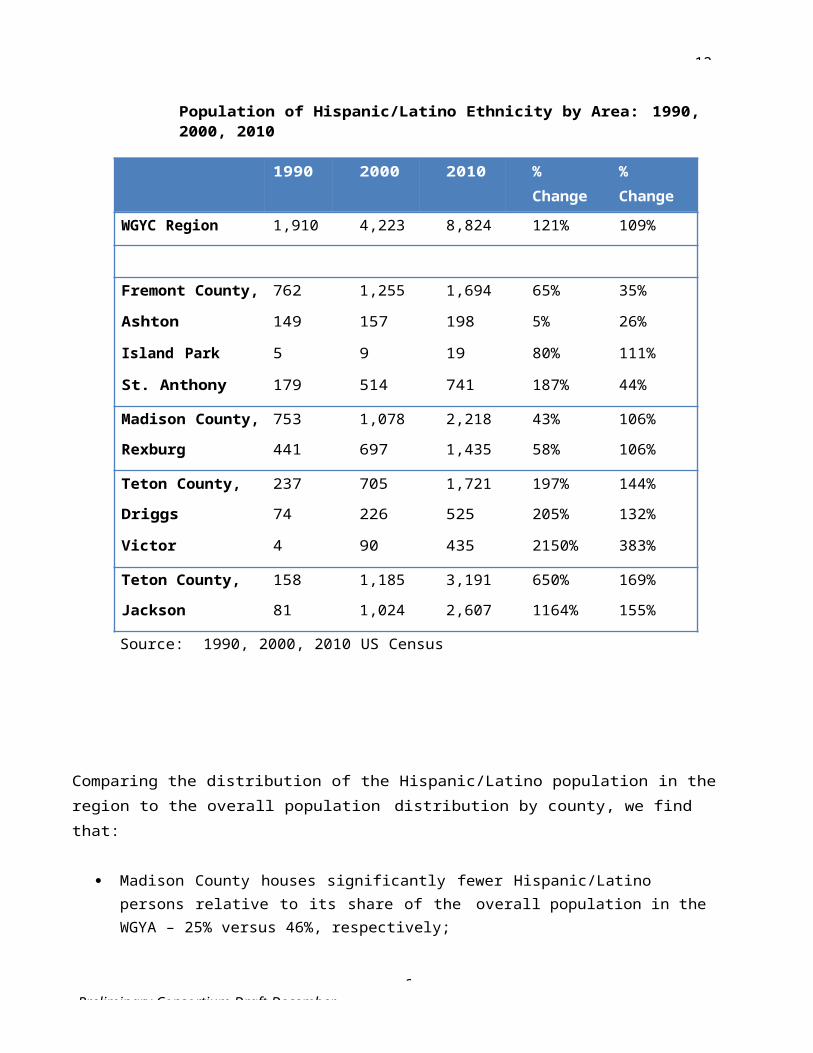
5Preliminary Consortium Draft December
12-31-
Source: 2000 and 2010 US Census
Protection against discrimination in housing for families with children was added in the 1988 amendments to Title VIII of the Civil Rights Act. It is unlawful to refuse to rent or sell to families with children, except in limited circumstances, such as for elderly housing. Single parents are particularly susceptible to discrimination due to lower incomes, fewer housing options and the unwillingness of landlords to rent their units to families with children.
About 5% of households in the WGYA are single parent households with children; 28% are couples with children. There are no areas of concentrations for either single parent households or households with children in the WGYA, although there are some notable differences:
St. Anthony has the highest percentage of single parents with children in the region (12%), followed by Tetonia (11%) and Driggs (10%);
Madison County has the lowest percentage of single parent households with children (3%), but the second highest number of such households (about 360 total), next to Teton County, Wyoming (about 490 total); and
Couples with children comprise the highest percentage of households in Teton County, Idaho, and each of its cities compared to the rest of the WGYA. Teton County, Wyoming, has the lowest percentage of couples with children (19%).
Income
HUD publishes median family income figures for the counties in the WGYA each year. The MFI varies by household size, but HUD also provides the overall median (or middle) income for each area. Many federal housing programs, including low-income tax credit and USDA subsidized units, use HUD MFI’s as the standard that households must meet to be able to income-qualify for units. For example, units affordable for extremely low-income households would be limited to households earning 30% or less of the MFI for the area.
The below table shows the variation in HUD MFI for each county in the WGYA. Family incomes are highest in Teton County, Wyoming, followed by Teton County, Idaho, and Fremont County. Incomes are lowest in Madison County.

5Preliminary Consortium Draft December
12-31-
HUD Median Family Incomes by County: 2014Household size 30%
MFI
50%
MFI
80
%
MFI
100%
MFI
120%
MFI
Fremont County, ID (2.9 persons per household on average)
1-person $11,200 $18,600 $29,750 $37,200 $44,640
2 $12,800 $21,250 $34,000 $42,500 $51,000
3 $14,400 $23,900 $38,250 $47,800 $57,360
4 $15,950 $26,550 $42,500 $53,100 $63,720
Madison County, ID (3.4 persons per household on average)
1-person $11,000 $18,350 $29,300 $36,700 $44,040
2 $12,600 $20,950 $33,500 $41,900 $50,280
3 $14,150 $23,550 $37,700 $47,100 $56,520
4 $15,700 $26,150 $41,850 $52,300 $62,760
Teton County, ID (2.8 persons per household on average)
1-person $12,500 $20,800 $33,250 $41,600 $49,920
2 $14,250 $23,800 $38,000 $47,600 $57,120
3 $16,050 $26,750 $42,750 $53,500 $64,200
4 $17,800 $29,700 $47,500 $59,400 $71,280
Teton County, WY (2.3 persons per household on average)
1-person $20,350 $33,900 $44,750 $67,800 $81,360
2 $23,250 $38,750 $51,150 $77,500 $93,000
3 $26,150 $43,600 $57,550 $87,200 $104,640
4 $29,050 $48,400 $63,900 $96,800 $116,160
Source: HUD; 2010 Census (average household size)
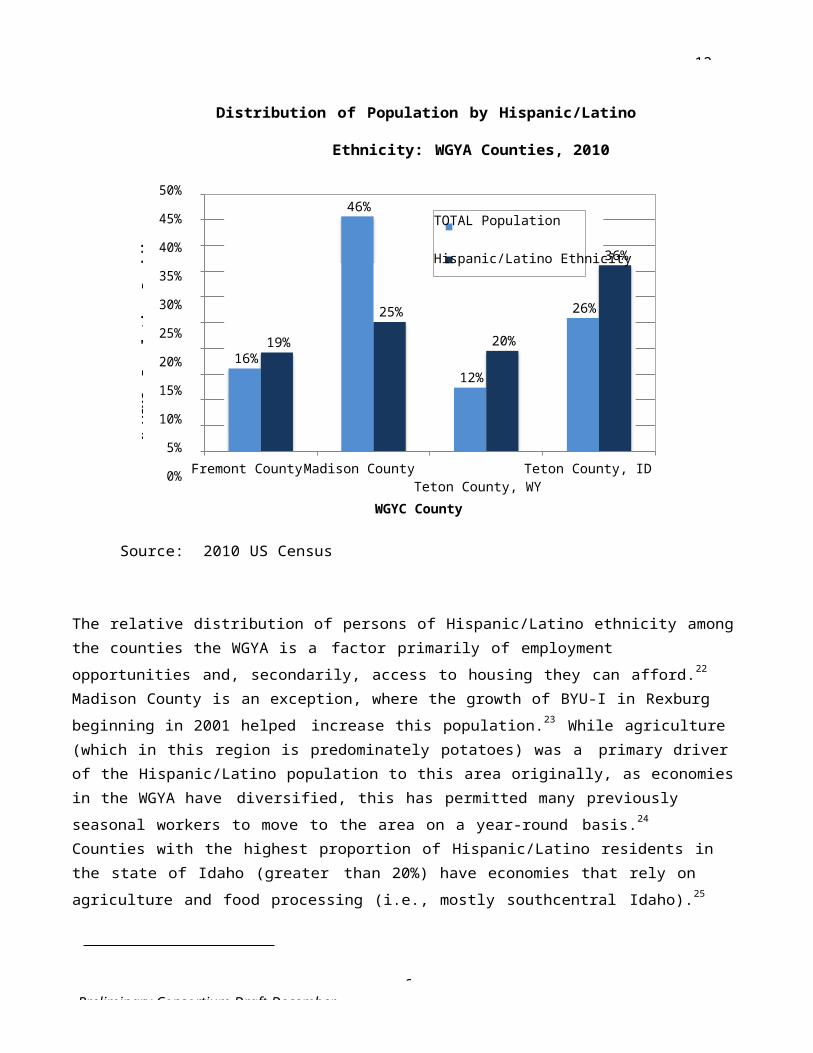
5Preliminary Consortium Draft December
Median Household IncomeMedian Family Income $96,800
$65,000
$51,000 $51,900$59,400$54,900
$40,000 $41,700$40,000
12-31-
The median family income (MFI) is typically higher than the income of all households in a county because non-family household incomes (single persons and roommate households) are not included in HUD’s calculation. The below chart compares the MFI to median incomes of all households in each county. As shown:
The median household income of households in the WGYA is $51,000. This ranges from a high of $65,000 in Teton County, Wyoming, to a low of $40,000 in both Fremont and Madison Counties.
Madison County shows the least variation in median household and family incomes. This is because non-family student households, which are not included in HUD’s estimates, and student family households, which are included in HUD’s estimates, have similarly low incomes; and
Teton County, Wyoming, shows the largest difference between household and median family incomes. The county also has the highest percentage of non-family households of all counties in the region.
Median Household and Family Incomes: 2014 Region and Counties
$120,000
$100,000
$80,000
$60,000
$40,000
$20,000
$0WGYC Region Fremont County Madision County Teton County ID Teton County WY
Sources: Household Income and 50% MFI Households, 2014 Housing
Survey; Family Income, 2014 HUD (not available for the region)
Mei
dan
12-31-
5Preliminary Consortium Draft December
Very-Low-Income Households (50% MFI)
This section analyzes the concentration of households that earn 50% or less MFI in the region, rather than the typical measure of the federal poverty level.
A WGYA family of four earning under $23,850 in 2014 falls within the federal poverty level, defined as the minimum amount of gross income that a family needs for food, clothing, transportation, shelter and other necessities. As illustrated by HUD’s MFI figures, $23,850 goes further in Fremont and Madison Counties than in Teton County, Wyoming, in terms of meeting family expenses. The federal poverty level equates to a 3-person family household earning 50% or less MFI in Fremont and Madison Counties; a 2-person family in Teton County, Idaho, earning less than 50% MFI; and a 2-person family earning less than 30% MFI in Teton County, Wyoming.
Although a 4-person family earning 50% MFI earns significantly more in Teton County, Wyoming, ($48,400) than in Madison County ($26,150), the comparative cost of living in the respective areas means that these households face similar challenges in meeting their household needs. As a result, HUD’s MFI for very-low-income households (i.e., earning 50% or less MFI) provides a more uniform measure of households struggling to meet expenses.
About 25% of households in the WGYA earn under 50% MFI.35 Comparing concentrations by area, we find that:
Households earning under 50% MFI range from a low of 15% of households in Victor to a high of 38% in Rexburg.
Rexburg is the only notable area of concentration for very low-income households. Again, this is related to the student population, where 90% of these households have at least one adult student and are mostly couples without children and roommate households.
Teton County, Idaho, has the lowest percentage of very low-income households of all counties. This is due in part to the fact that 53% of households (72% in Victor) have at least one worker that commutes to higher wage jobs in Teton County, Wyoming.
35 This data is based on the 2014 Housing Survey rather than the ACS. The survey and 2008-2012 ACS reported similar figures for the counties and larger communities; but the ACS has up to a 20% margin of error for some of the smaller communities.
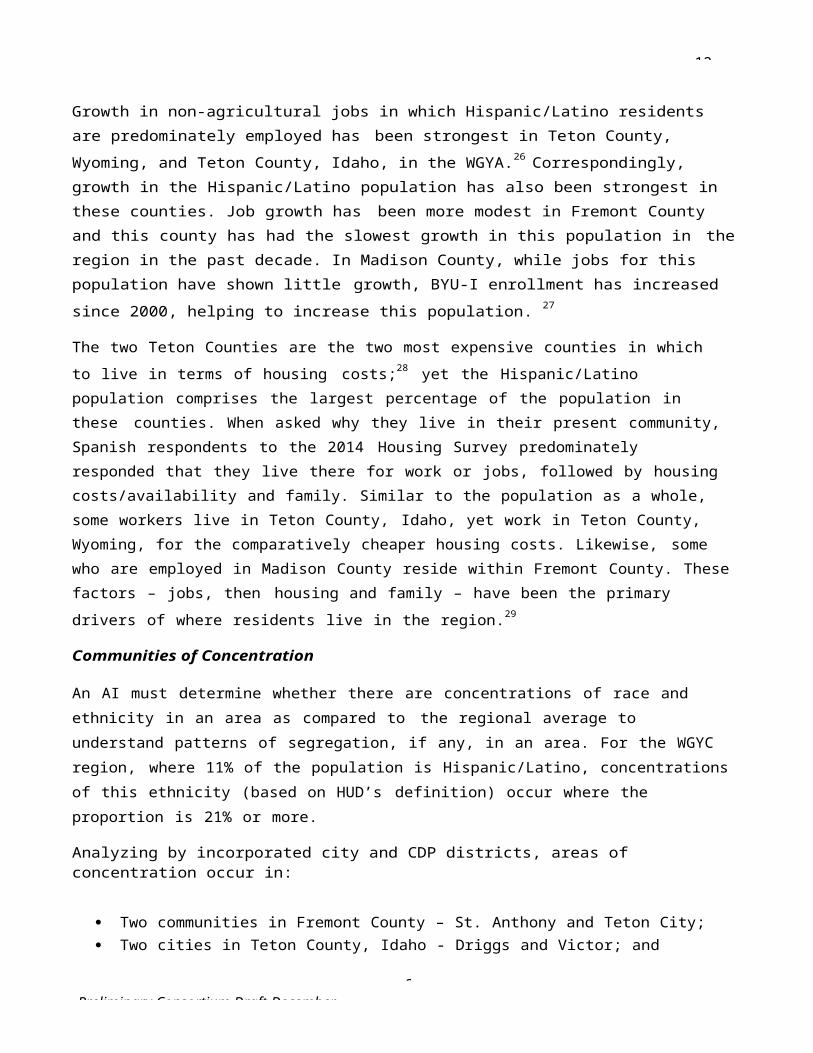
12-31-
5Preliminary Consortium Draft December
Very Low-Income Households by Area: 2014
Households Earning 50% MFI or Less
Median Household Income
WGYC Region 25% $51,000
Fremont County, ID 27% $40,000
Ashton 29% $38,000
Island Park region 25% $50,000
St. Anthony 30% $40,000
Madison County, ID 32% $40,000
Rexburg 38% $34,000
Teton County, ID 16% $54,900
Driggs 20% $49,800
Victor 15% $60,000
Teton County, WY 22% $65,000
Jackson 26% $55,000
Source: 2014 Housing Survey
2008-2012 ACS 5-year data was used to understand the general relationship of incomes of households with persons in protected classes compared to the average household in each county. As shown below:
Single-parent households with a female householder consistently earn the lowest median incomes in each county – at least 50% less than households in total;
Households with a Hispanic/Latino householder are the second lowest income earners, with median incomes between about 20% and 30% less than households in total in the Idaho
12-31-
5Preliminary Consortium Draft December
counties and near 80% less than total households in Teton County, Wyoming. A high 67% of these households in the WGYA earned under 50% AMI;
Senior households earn the least in Fremont County; and
Couples with children have median incomes just above the median income of all households in each county, but slightly below the MFI for households of comparative size (about 4-persons on average).
Income Comparison by Protected Class: 2008-2012 ACS
Fremont County
Madison County Teton County ID
Teton County WY
Median Income Median Income Median Income Median Income
All Households $43,053 $33,776 $56,532 $69,020
65+ Householder $35,413 $43,125 $56,414 $57,344
Couple with child(ren)
$50,954 $48,320 $61,047 $70,938
Single Parent (female)
$28,214 $22,069 $37,583 $35,577
Hispanic/Latino $33,288 $28,000 $41,029 $38,235
Estimated MFI Percentage*
65+ Householder 83% 103% 119% 90%
Couple with child(ren)
96% 92% 103% 89%
Single Parent (female)
62% 50% 74% 52%
Hispanic/Latino 63% 54% 69% 50%
Source: 2008-2012 ACS 5-year estimates; 2012 HUD MFI (see table on p. 54, above); *MFI percentages are estimated based on average household sizes for each class (2 to 4-persons depending upon the class).
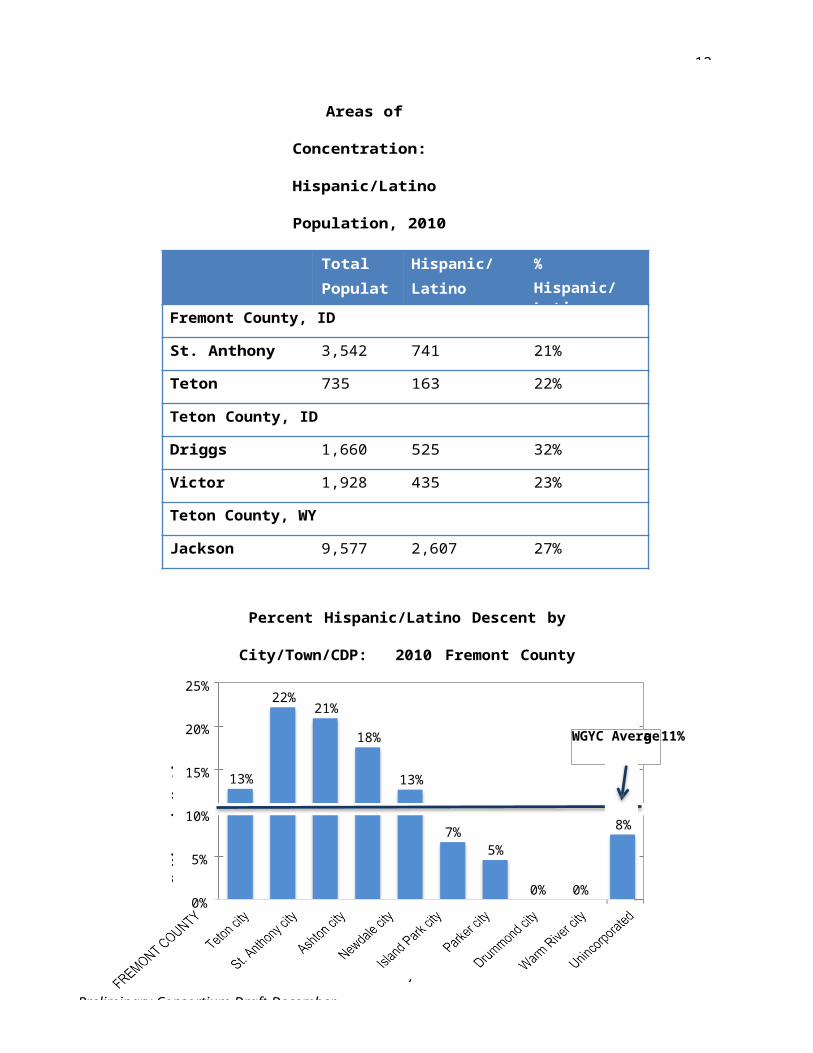
Agriculture
12-31-
5Preliminary Consortium Draft December
SECTION II. PRODUCTIVE LANDSCAPESManaged well, our region’s abundant natural resources will continue to sustain our rural economies and enhance our high quality of life. Livability Principles Addressed:
Provide More Transportation Choices Enhance Economic Competitiveness Support Existing Communities Coordinate Policies and Leverage Investment
Chapter 1. Our Agricultural Heritage
Regional Context
The history of human settlement in the Greater Yellowstone Area (GYA) is similar to that of many western communities. It originated with endemic Native American populations and gradually shifted to homesteading farmers and ranchers encouraged by federal incentives in the mid-late 1800s. Following settlement most private lands were dedicated to agricultural production despite short growing seasons and distant markets. The largely agricultural economy lasted through much of the 1900s, but today 75% of cultivated acreage lies in Fremont and Madison counties. The loss of the freight railroad in 1981made it more difficult for farmers to send crops to market from Teton Valley, and, in the late 1990s, the economy in the two Teton counties began to shift towards a recreation and real estate-based economy.

Source: 2014 Preliminary Agriculture Report
Source: 2014 Preliminary Agriculture Report
12-31-
5Preliminary Consortium Draft December
Agriculture will continue to play an important role in the larger area’s economy both in its own right and for its contribution to the region’s expansive beauty and rural character. In the late 1990s and early 2000s, the Teton Valley experienced a tremendous residential housing boom. After the boom ended in 2008, land values decreased dramatically, especially in Teton County, Idaho, and to a lesser extent in adjacent counties. Low land values and high commodity prices have stabilized agriculture in the short term, but residential development pressurescan be expected to increase as tourism and land values recover.
This plan places a priority on maintaining the region’s agricultural heritage despite the fact that many of our farms are considered small by modern standards. This makes it more difficult to realize a return on the very high capital costs for land and equipment. The shift to lifestyle and tourism is intimately linked to retaining a rural and unique community character. (RPI Consulting 2013)
As part of the HUD Grant, an assessment was conducted of the potential for agriculture-economic development strategies that involve local production for local and regional markets in Teton, Fremont, and Madison Counties in Idaho and Teton County in Wyoming. The assessment used secondary data to characterize the region’s agricultural landscape. The assessment sought to characterize local market potential for producers, understand and explore opportunities for local producers, andidentify key barriers that prevent producers from selling locally and regionally. Findings from the preliminary report include the following:
There is a greater diversity of products grown and more producers than represented in existing data sources like the U.S. Department of Agriculture’s Agricultural Census.
In sparsely populated areas, small amounts of income or a few jobs can be significant for a family and community.
Local supply chains already exist and a high percentage of producers surveyed are already participating in them. The area is not starting from scratch, but building on existing economic activity. Supply chains already exist and demand exists to grow them and add new ones.
While there are not many ranches or farms in the area, livestock processing is viable with a few thousand animals. However, if producers have limited interest in regional markets, then they
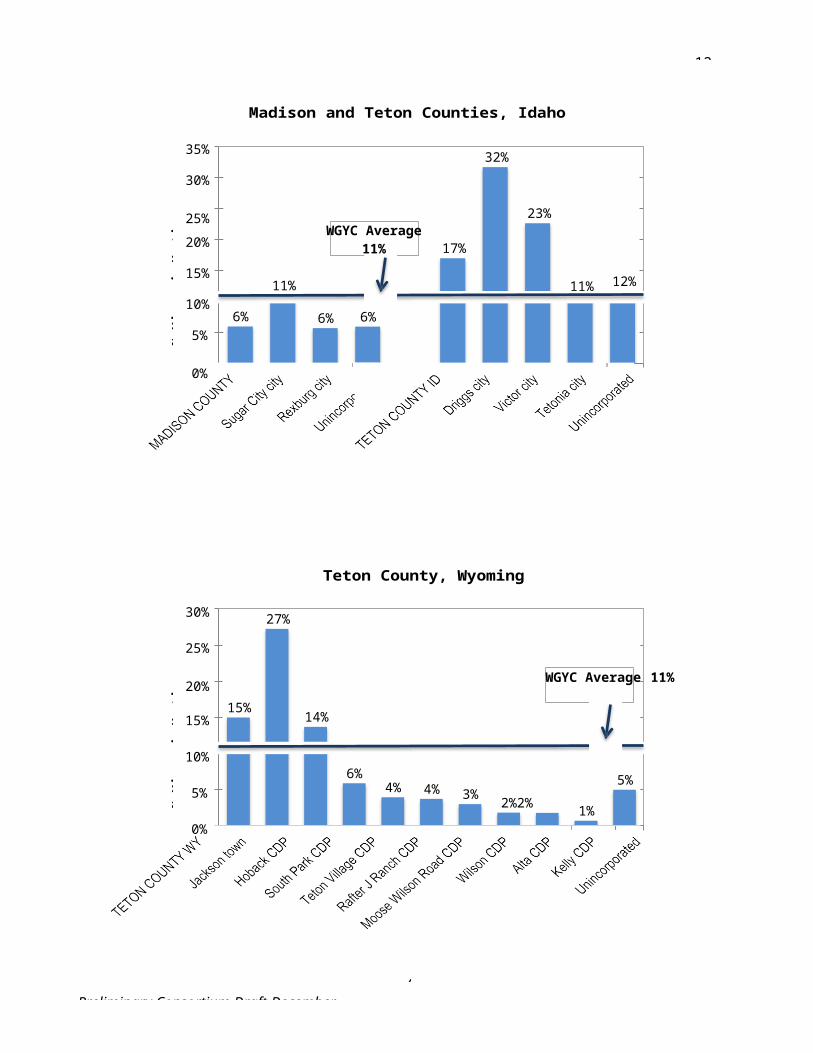
12-31-
5Preliminary Consortium Draft December
likely do not have enough local demand to make a plant work. One possibility is looking at tiering mobile slaughter to existing custom cut operations to meet HRI demand. Local activities need to be linked to a secondary regional market in order for significant infrastructure investments to work.
Existing vegetable supply chains process small quantities for small markets for limited income. Due to the small scale of the operations, large infrastructure projects might not be needed. For current and projected volumes, a simple commercial kitchen in the area might meet most producer and value-added needs.
Networking, marketing, and educational activities that link producers to buyers and consumers will help existing producers and build momentum for expansion of existing and new supply chains.
(2014 Preliminary Agricultural Report)
Source: 2014 Preliminary Agriculture Report
Effective management of the region’s important water resources enables successful agriculture. The GYA lies within the Upper Snake River Basin, which extends from the headwaters of the Snake River downstream to the Milner Dam in Twin Falls. The basin overlies the Eastern Snake Plain Aquifer (ESPA), the largest aquifer in Idaho and one of the most productive aquifers in the world. The Henry’s Fork is a major tributary of the Snake River draining about 2,700 square miles in Idaho plus 500 square miles of Wyoming. The Henry’s Fork Basin Study presents opportunities for developing water supplies, improving water management, and sustaining environmental quality within the basin and for managing groundwater recharge to the ESPA. These opportunities are an essential part of maintaining the region’s high quality of life, which depends on a successful agricultural economy and the preservation of the heritage related to historical agriculture and ranching/grazing. (1992 Henry’s Fork Basin Plan)
Climate Change
The ESPA, the Snake River Basin, and the Henry’s Fork Basin provide for rich agricultural land in the GYA. These water resources and agricultural operations are assets for the future in the face of growing concern over climate change. The federal land-management agencies that operate within the GYA have a long history of working together to coordinate management of the ecosystem across jurisdictional boundaries and to reduce the environmental impact of their operations. In 1964, the National Park Service (NPS) and the U.S. Forest Service (USFS) formed the Greater Yellowstone Coordinating Committee (GYCC), which was joined by the U.S. Fish and Wildlife Service (FWS) in 2002 and the Bureau of Land Management in 2012. The GYCC was formed to allow representatives from each agency to pursue opportunities of mutual cooperation and coordination in the management of core

12-31-
5Preliminary Consortium Draft December
Federal lands
12-31-
6Preliminary Consortium Draft December
in the GYA. The GYCC consists of the National Park Superintendents, National Refuge Managers, National Forest Supervisors, and BLM Managers of 13 federal agency units in the GYA.
The GYCC is actively working to reduce their environmental impact. In 2007, the Sustainable Operations Subcommittee (SOS) of the GYCC began the process of inventorying greenhouse gas emissions from federal operations in the GYA. This was accomplished by the six Forests and the two Refuges using the “EPA Climate Leaders” Tool. The two Parks used the “Climate Leadership in Parks” (CLIP) Tool, part of the Climate Friendly Parks Program.
The GYCC managers and the SOS began collaboratively planning for Greenhouse Gas (GHG) emissions reduction in June, 2009, utilizing a Climate Action Plan Coordinator provided through a 2-year Presidential Management Fellowship with the U.S. Forest Service. As of December, 2010, the ten GYCC agency units have planned 83 separate types of GHG emissions reduction projects for 218 total GHG emissions reduction projects scheduled for completion by 2020.(GYA Climate Action Plan)
6Preliminary Consortium Draft December
12-31-
The national land cover dataset (2012) highlights the agricultural valley area where a variety of seasonal crops are grown. BLM datasets also highlight where grazing allotments are prevalent in the eastern part of the four county study area (shown as Grass/Pasture).
6Preliminary Consortium Draft December
Partner with BYU-I to Recruit Agricultural Entrepreneurs
The College of Agriculture and Life Sciences, the departments, faculty, staff and students uphold the mission of the Church of Jesus Christ of Latter-day Saints and the University as they unitedly strive to:Provide quality educational programs and opportunities for students to serve positive and rewarding careers in areas associated with plants, animals and human life throughout the world.Prepare graduates for lifelong learning and employment experience contributing to a safe, abundant food and fiber supply; promoting the well-being and health of individuals, families, and communities; enhancing sustainability of agricultural and economic systems; and promoting wise and responsible stewardship of divinely endowed natural resources and biological (ecological) systems worldwide.Support and encourage their faculty, staff, and students to be anxiously engaged in a good cause and to do many things of their own free will, bringing to pass a righteous
Source: 2014 Preliminary Agriculture Report
12-31-
Themes and Strategies
Theme 1.1: Support and enhance local agriculture, including crops and ranching/grazing.
Although agriculture is an important part of the region’s economy and heritage, the geography of the agricultural valley area poses many challenges for local producers. The region has low overall population density, is isolated from major population centers, and has a short growing season. Despite the region having a large land area, the amount of land available for crop and livestock production is limited. Across the four counties, 81 percent of all land is public. While only a third of all land in Idaho’s Madison and Teton counties is public, almost all land in Teton County, WY, is public.
The agricultural assessment conducted for the HUD Grant shows that the total number of farms in the Teton region increased between 2007 and 2012. This growth, however, was not even across the region.While the number of farms in Fremont and Madison counties increased, the number decreased in both Teton counties. Most of this growth is among the region’s smallest farms. Between 2007 and 2012, the region gained 57farms less than ten acres in size. Of these, 27 are in Fremont and 21 are in Madison. (2014 Preliminary Agricultural Report)
Fall River Irrigation
Buried piped irrigation canals not only help to generate hydroelectric power, they reduce evaporation and help preserve our water resources.
Photo source:
12-31-
6Preliminary Consortium Draft December
Strategies: Recognize and respect the Right to Farm Act. Improve and maintain roads and other infrastructure important for agricultural
production and transportation. Promote local agricultural industries and businesses and recruit agricultural
entrepreneurs through local universities and education centers. Encourage policies and resources that enable farms to remain viable as circumstances
and markets change. Return platted land to agricultural production where appropriate and viable. Provide a reasonable means for transfer of agricultural land to family members for the
purpose of remaining in agricultural use. Sustain components of the agricultural system that support viability, including regional
storage and distribution centers,supplies, and other infrastructure.
Encourage the launch of a “buy local” program that connects producers and consumers.
Theme 1.2: Manage water resources in the region for the greatest beneficial use and contribution to agricultural heritage.
The Henry’s Fork Basin includes the major portions of the counties of Fremont, Madison, and Teton (Idaho) with their county seats of St. Anthony, Rexburg, and Driggs. The main river systems are the Henry’s Fork, which originates in small streams that empty into Henry’s Lake (the main stem of the Henry’s Fork is usually described as originating at Big Springs), Falls River, which originates in the southwest corner of Yellowstone National Park, and the Teton River, which is formed by the convergence of several creeks and springs on the western flank of the Teton Mountain Range.
The major part of the upper Henry’s Fork Basin consists of a high mountain plateau with lodgepole pine and large open meadows. The upper portion of the Teton River basin largely consists of a wide high- mountain valley. The middle portion of the Henry’s Fork Basin consists largely of undulating plateau lands. The lower basin consists of the relatively flat upper end of the Snake River Plain.
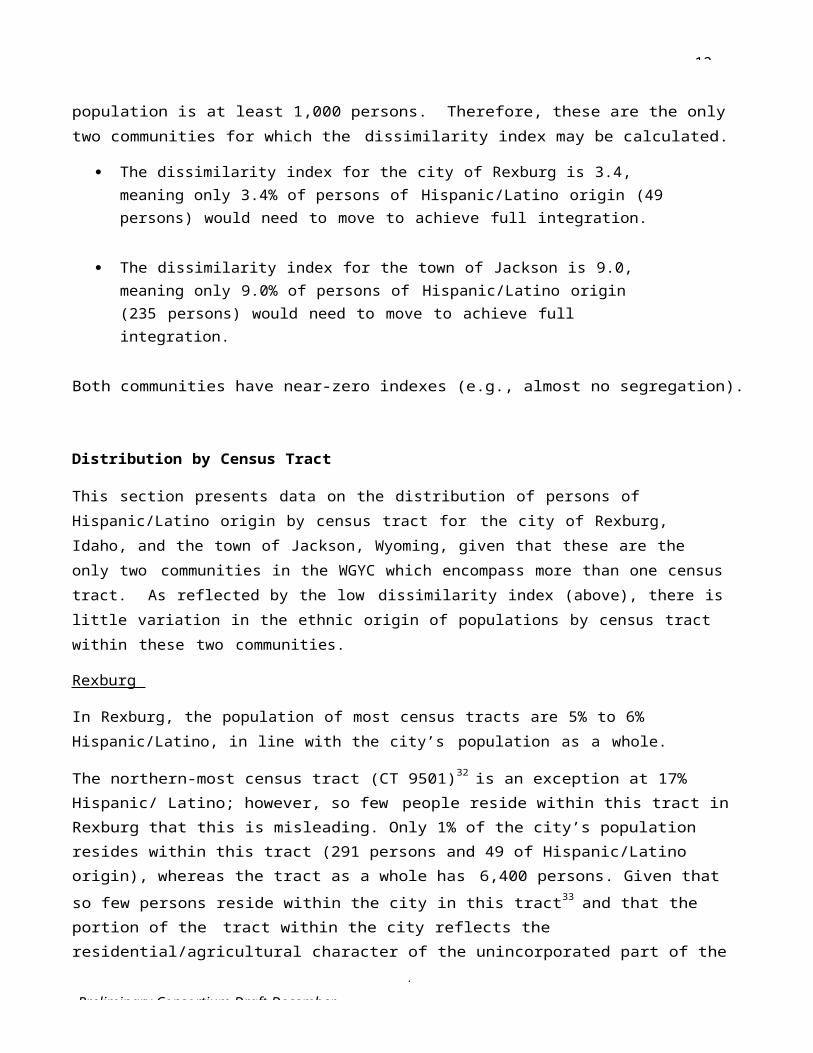
The Eastern Snake Plain Aquifer is a unique asset to the region.
Photo source: Imnh.isu.edu
Henry’s Fork Watershed Council
The watershed council, co-sponsored by the Henry’s Fork Foundation and the Fremont Madison Irrigation District, is a successful model for ongoing collaboration on water management.Photo source:
12-31-
6Preliminary Consortium Draft December
The mean annual flow of the Henry’s Fork near the mouth is 1,407,000 acre-feet or 2,100 cubic feet per second (cfs) with approximately one-third of that contributed by the Fall River and one-third by the Teton River. The flow range is extreme between wet and dry years; it varies from 600,000 acre-feet to 3,000,000 acre-feet. An additional estimated 1,000,000 acre-feet is recharged into the Eastern Snake Plain Aquifer and flows to the west. The plentiful water resources in the Snake River Basin and Henry’s Fork Basin are essential to successful agriculture in the region. The ESPA is a unique asset to the region and ensures regional resiliency in the face of a changing climate, economy, and environmental landscape.(1992 Henry’s Fork Basin Plan)
Strategies: Continue implementation of
successful models for ongoing integrated and collaborative water management.
Balance opportunities for water capture and storage with conservation efforts and irrigation demands.
Maintain high water quality through collaborative programs and data collection.
Support economic development through the integration and coordinationof the use of water, the augmentation of existing supplies, and the protection of designated waterways for all beneficial uses.
Encourage orderly and efficient use of water resources in the basin. Collaborate regionally in planning for additional surface water storage and aquifer
recharge projects.
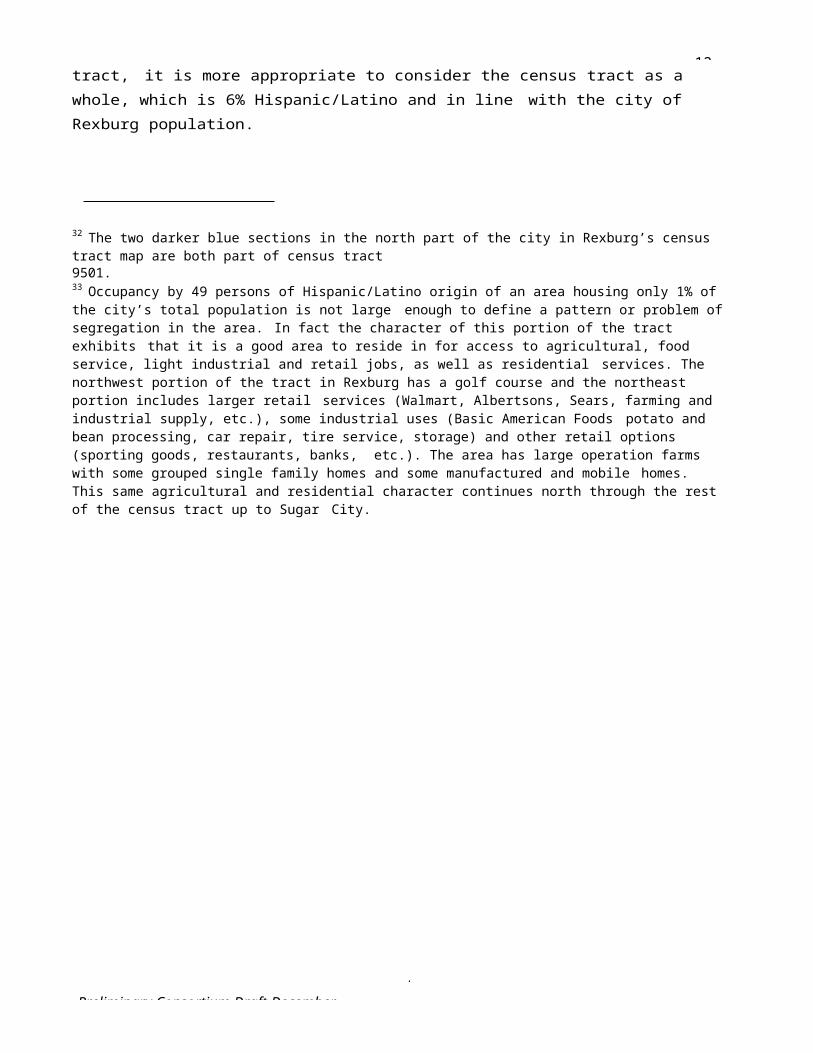
12-31-
6Preliminary Consortium Draft December
Weekly Farmer’s Markets
Weekly Farmer’s Markets occur throughout the region and help connect local producers and consumers.RexburgAshtonTeton ValleyVictorJackson Hole
Photo source
Theme 3: Preserve, nurture, and enhance our rural character while preserving fundamental property rights.
Preservation of rural character and heritage and the support of the local agricultural industry are of high importance to the region for both economic and quality of life reasons. Desired future character and land uses for rural areas include agriculture; ranching; low density residential, with provisions for clustering/conservation developments to protect natural resources or rural character; and conservation and wildlife habitat enhancement/protection.
Source: Ashton Comprehensive Plan
communities in the region.(City and County Comprehensive Plans)
Residents have shown a significant respect for individual property rights. Comprehensive plans recognize the importance of protecting property rights while also achieving other goals of the communities.This balance of effective land planning and private property rights is a common thread among the
Strategies: Encourage the purchase or donation
of conservation easements to provide financial incentives to landowners for maintaining agricultural operations and other large parcels of open space.
Encourage development and land uses that support rural character and heritage and that adhere to high environmental preservation standards.
Respect and preserve cultural and historic sites that support rural character.
Promote strategies that help preserve rural character by enhancing existing communities and directing development towards them.
Incentivize maintaining or creating parcels of contiguously owned lands.
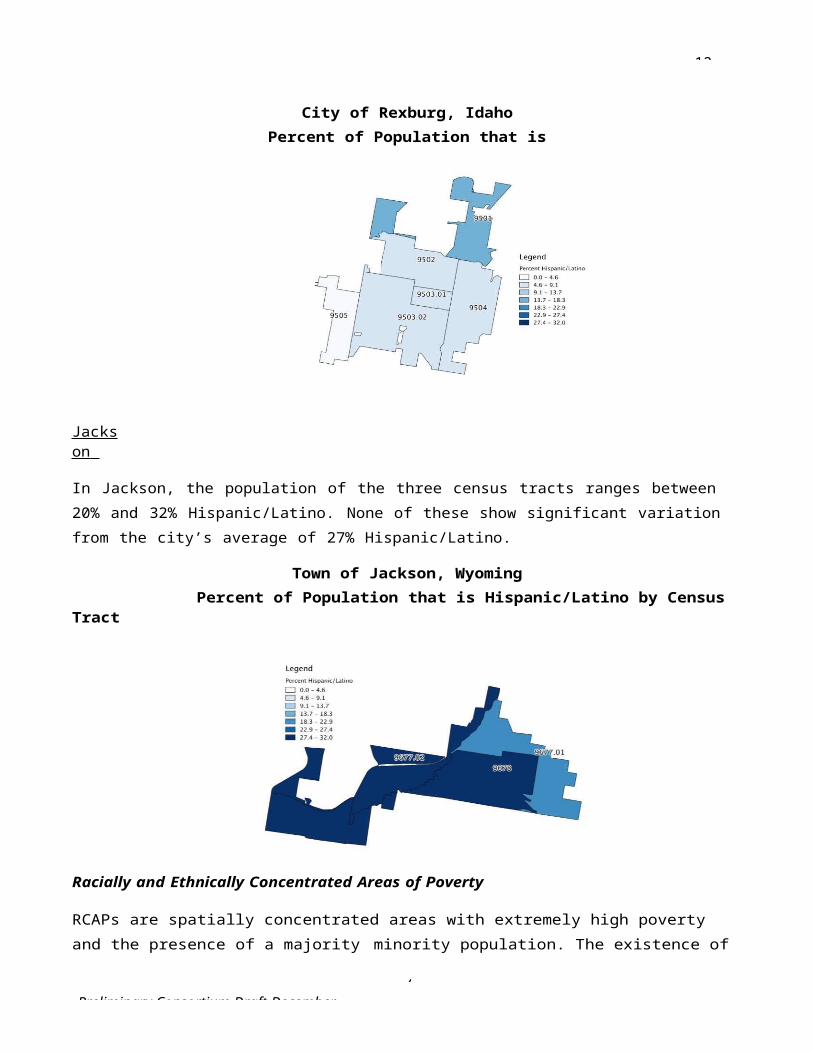
Greater Yellowstone Food Guide
Slow Food in the Tetons promotes and celebrates good, clean, and fair food in our community through educational programming, events, and initiatives. The Greater Yellowstone Food Guide helps to promote and connect local agriculture industries and products with residents and visitors.Photo source:
Grand Teton Distillery
Grand Teton Vodka is an award winning potato vodka that is distilled in Driggs, Idaho. This vodka, which is processed from start to finish at the distillery, is an example of a value-added product that uses regionally produced potatoes to create a premium product with higher returns.Photo source:
12-31-
6Preliminary Consortium Draft December
Protect private property from being taken for public use without just compensation and due process of law.
Theme 4: Enhance the local food movement.
The agriculture assessment completed for the HUD Grant explores the potential for agriculture-economic development strategies that involve local production for local and regional markets in Teton, Fremont, and Madison Counties in Idaho and Teton County in Wyoming. The assessment analyzed available pre-existing (i.e. secondary) data to characterize potential local supply and demand for local agricultural products in the study area. Interviews, focus groups, and administer surveys of key stakeholders were conducted to collect data about the potential for developing local production focused on serving local and regional markets for agricultural products in the study area. (Consortium Meeting Presentation on Agriculture Assessment)
Strategies: Support local food production
outlets such as Farmer’s Markets
Encourage local agriculture production and local consumption of agricultural products.
Support infrastructure toenhance local value-added farm products.
Augment the agricultural sector with an emphasis on providing food for local residents and visitors and exploring opportunities to make and export value-added food products.
Explore options for connecting local food producers with institutional buyers (like hospitals or correctional facilities) and National Park vendors in the area.
Promote networking and education among producers and between producers and potential buyers.
12-31-
6Preliminary Consortium Draft December
Key Indicators
Value of Agricultural Products SoldThis indicator measures the total market value of agricultural products sold in each county within the region.
WhyAgriculture contributes greatly to the Greater Yellowstone region’s economic vitality, providing income to farmers and ranchers through the sale of products including crops, livestock, and poultry. The total value of products sold shows the level of importance and relative influence of agriculture within the regional economy. It helps to illustrate trends related to the preservation and use of land for agricultural purposes, since conversion of agricultural land to other uses will likely decrease overall product yields and sales.
This indicator also indirectly reflects resource availability and environmental quality, because the quantity and quality of agricultural products produced depends on factors such as the availability of water and soil health. In addition, the region’s heritage is strongly rooted in agriculture, contributing to the sense of place and character of the people and the land.
Units of MeasureThis indicator is measured in dollars (total market value of crops sold) per county.
Increasing values for this indicator could indicate greater reliance on agriculture as an industry, or could mean that the agricultural commodities produced are in greater demand. Decreasing values for this indicator might suggest loss of land used for agricultural purposes (leading to lower yields) or decreasing demand for or value of products sold.
SourceData for this indicator is available from the United States Department of Agriculture (USDA) Census of Agriculture, which is conducted every five years. The most recent Census of Agriculture was conducted in 2012.
County-level data is available at the following website:. Total sales (in dollars) is available in Table 2: Market Value of Agricultural Products Sold Including Direct Sales.
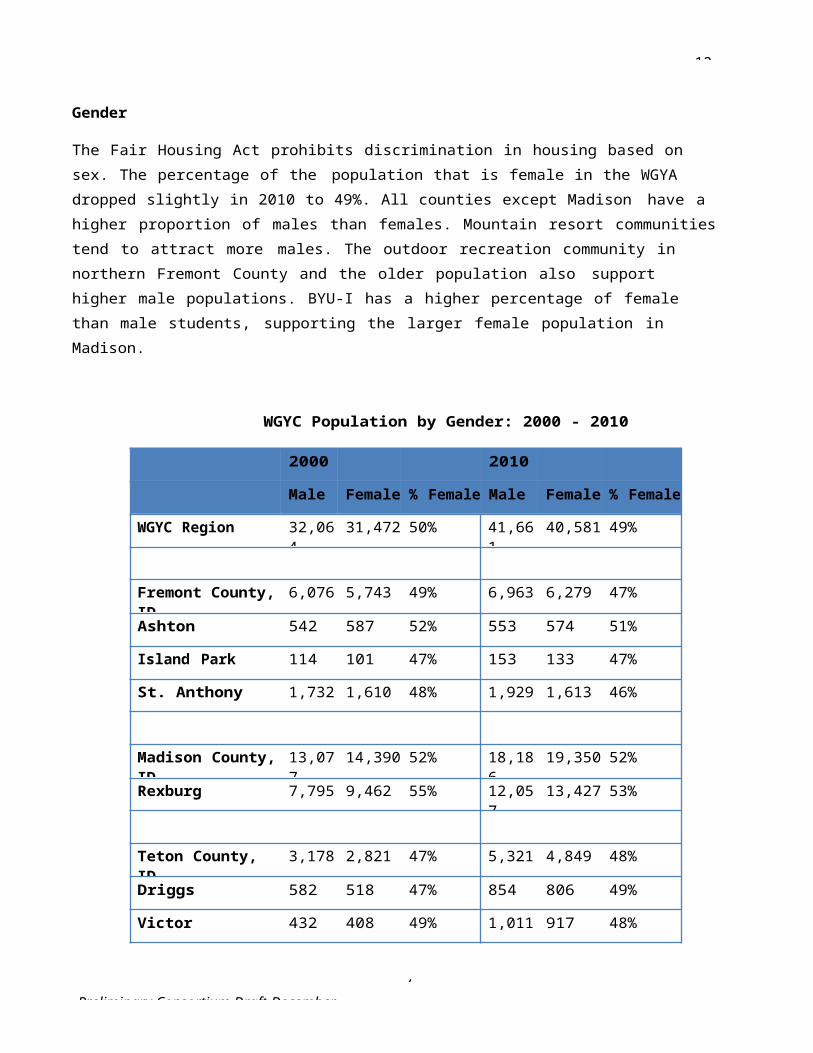
12-31-
6Preliminary Consortium Draft December
Land in FarmsThis indicator measures the total area of land in farms in each county.
WhyThe agricultural heritage of the Greater Yellowstone region is evidenced by the significant amount of acreage devoted to farming. Though the values of the products that are harvested on these lands contribute to overall economic vitality and cultural significance, the relatively low land costs associated with farming are attractive to developers looking to expand housing and non-residential development options. When that farmland is sold or otherwise taken out of active use, the region experiences a decrease in the amount of locally produced farm products. As an indicator, the land in farms helps to illustrate the extent of development that is encroaching on more rural parts of the region that may be more of a sprawling type of development. The risks and negative effects of sprawling development can be significant including infrastructure strain, rural character degradation, and increased drive times and distances. The preservation of agricultural uses relates directly to desired lifestyle values in the region, and the additional benefits to natural systems such as water management and air quality can be correlated as well.
Units of MeasureThis indicator is measured in acres (total land in farms) per county.
Increasing values for this indicator show more land used for farming and agricultural purposes, while decreasing values could indicate farmland lost to development or the loss of viable land or resources for agriculture.
SourceData for this indicator is available from the United States Department of Agriculture (USDA) Census of Agriculture, which is conducted every five years. The most recent Census of Agriculture was conducted in 2012. This data may be supplemented by county property records, as applicable (especially between Census periods).
County-level data is available at the following website: http://w ww .agcensus.usda.gov/ P ubl ic ations/2012/ Full_Re port/Volum e_ 1 ,_C hapte r_2_C ount y_L evel/ . Total land in farms (in acres) is available in Table 8: Farms, Land in Farms.

St. Anthony Sand Dunes
This 10,600 acre playground of clear, shifting, white quartz sand is known for its unique beauty and exceptional recreation opportunities.Prevailing winds carried the sand from the nearby Teton and Snake Rivers and deposited them as dunes among the hills. These hills were once active volcanic vents pouring great depths of lava over the earth.Today the St. Anthony Sand Dunes are home to a Wilderness Study Area (see more info below) and one of the largest population of desert wintering moose in the United States.
12-31-
6Preliminary Consortium Draft December
Chapter 2.Our Wildlife, Public Lands, and Special Sites
Regional Context
Wildlife resources in the GYA have been extensively studied by State and Federal agencies, as well as by local organizations and independent research biologists. This research supports the finding that wildlife resources are not only a basis for local economic viability, but of national importance as well. Elk, moose, deer, buffalo, bighorn sheep, black bear, grizzly bear, bald eagles, and other species, many of which are endangered or threatened, live in the area. (TCD Long Range 2010)
Elk (Wapiti) have long been an important game animal in the area, and their occurrence depends mainly upon the presence of their food supply. Their numbers have varied, but the present population is increasing after a 10 to 15 year low. In summer, elk are distributed in forested areas throughout the region. Habitat use patterns vary with climate and various activities in the area (grazing, logging, and recreation). Most elk migrate by late November and congregate and feed in staging area in the lower elevations, apparently preparing for winter. During mild winters they also use staging area for winter range. By mid-December of most winters, elk have moved to their wintering grounds.
Two main wintering grounds for elk exist in the southwestern part of the GYA. In Idaho, the Juniper Mountains and St. Anthony Sand Dunes provide winter range that is administered by the U.S. Bureau of Land Management (BLM) and the Idaho Department of Fish and Game (IDFG) in cooperation with the Department of Lands and private landowners. In Teton County, Wyoming, the National Elk Refuge provides important winter habitat for the one of the largest elk herds in the United States, as well as habitat for endangered species, birds, fish, and other big game animals. The Refuge is six miles wide at its widest point and ten miles long from southwest to northeast, and is home each winter to approximately 11,000 elk and the largest single herd of bison under federal management.
Henry’s Lake Flat, the flat bottomed valley southeast of Henry’s Lake, is habitat for pronghorn antelope. This flat is predominantly private grassland used for livestock grazing, with small pockets of sagebrush
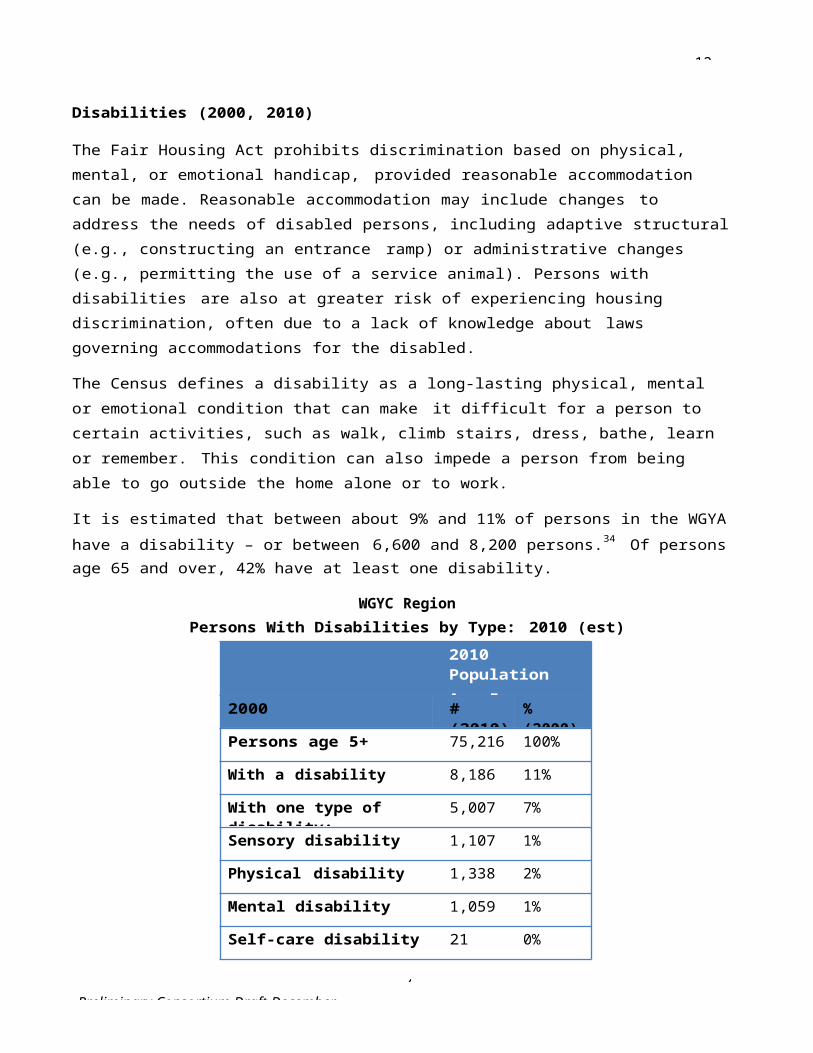
Big Springs
Producing over 120 million gallons of water each day, Big Springs is one of the 40 largest natural springs in the world and a Natural National Landmark. The springs create the headwaters of the Henry’s Fork of the Snake River, which travels across Fremont County creating spectacular scenery at Upper and Lower Mesa Falls. With a constant temperature of 52 degrees, the springs is home to rainbow trout, muskrats, ducks, moose and other critters. It is not unusual to see osprey and eagles dive for a meal of fresh fish from the springs.Photo source:
12-31-
6Preliminary Consortium Draft December
throughout. The IDFG estimates that 180 pronghorn antelope use the summer range in and around Henry’s Lake Flat. The herd migrates north over Raynolds Pass into Montana for the winter.
The Henry’s Fork basin is located along a portion of the Pacific waterfowl flyway. Over a million waterfowl migrate over the area in spring and fall. Fall movements begin in mid-to-late-August and continue through December. Large numbers of ducks and geese concentrate on and around Island Park Reservoir, Henry’s Lake, and HarrimanState Park before moving south. These areas are just over the Continental Divide from the Red Rock Lakes Migratory Water Waterfowl Refuge in Montana, only 15 miles to the northwest. Migrating waterfowl make extensive use of watercourses, lakes, marshes and potholes in the Island Park area. The northward migration begins in late March and continues through May.
The largest of all North American waterfowl, the trumpeter swan is a common resident of the entire region. The open waters of the Henry’s Fork drainage are the primary wintering grounds for the entire Rocky Mountain population of trumpeter swans. Inaddition to the migrants, approximately 50 percent of the resident trumpeters, called the Tri-State subpopulation, winter within the area. The relative isolation, abundant submerged vegetation, and open waters of the Henry’s Fork are critical to the welfare of this important trumpeter population.(1992 Henry’s Fork Basin Plan)
Coexisting with wildlife is an important priority for the region in the context of planning and future development. A healthy co-existence and integration with national forests and national parks that are prominent in the region will support future economic and environmental resiliency.
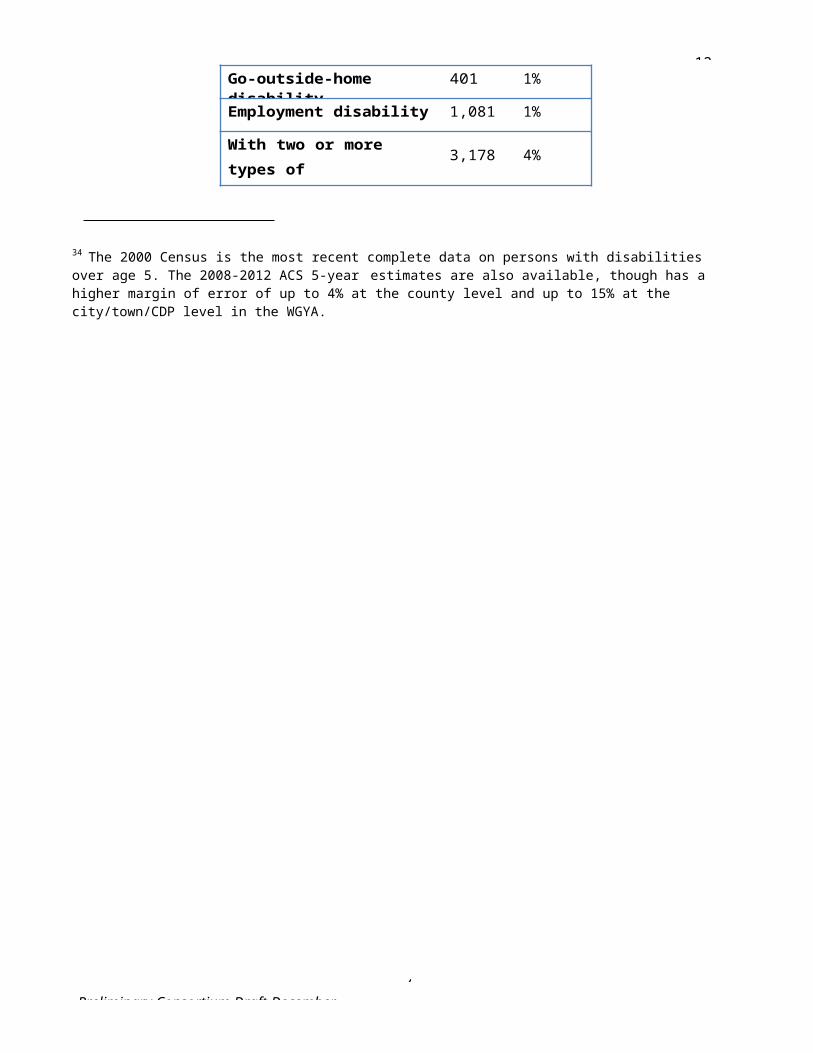
7Preliminary Consortium Draft December
12-31-
The majority of the four county region is public lands consisting of Forest Service, NPS, BLM and State Lands. Within those public lands there is a mix of wilderness, wildlife closures, and recreation areas.
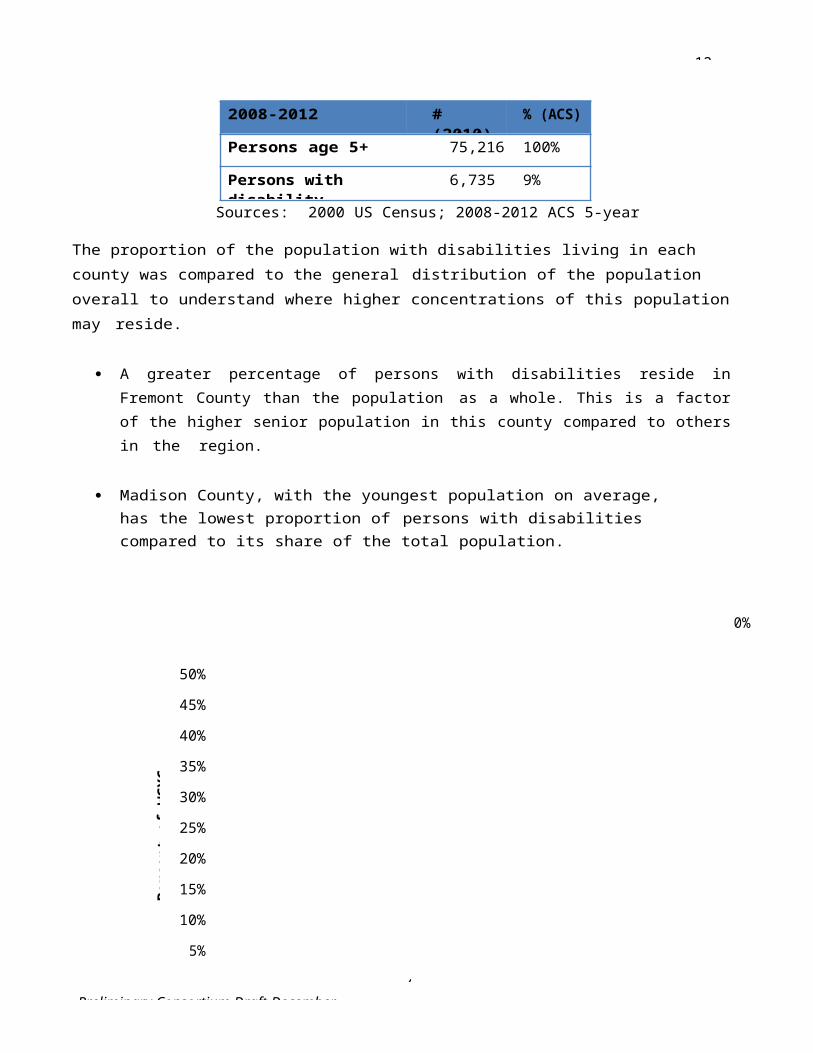
7Preliminary Consortium Draft December
Source: YBP Greater Yellowstone Framework for Sustainable Development
Trumpeter swans overwintering
Photo source: YBP Outdoor Recreation
12-31-
Themes and Strategies
Theme1: Align development on public lands and promote habitat management to strengthen our state preserves.
The GYA is one of the largest intact ecosystems in the contiguous United States. This region encompasses 13 million acres of federal land across three states, containing six National Forests, two National Parks, and two National Wildlife Refuges. The GYA is one of the most highly visited natural regions in the United States, with upwards of 4 million visitors to the ecosystem each year.
Strategies: Encourage a stewardship ethic of land and
water and the conservation of resources. Encourage “rights to hunt” and mitigate
conflicts with other recreational uses. Regularly update all natural and scenic
resource inventories to assess the incremental impacts of development on the resource.
Develop landscape level databases and the use of indicator species to fully understand the change in our environments due to development.
Theme 2: Advance practices that minimize the potential for conflicts with wildlife and support a harmonious and safe relationship between humans and the environment.
Strategies: Preserve key habitats and recreation areas. Maintain and enhance existing local park
spaces. Balance property rights and protection of
natural resources by identifying areas most suitable for development.
Provide technical and implementation support to private landowners in order to improve or maintain the integrity of riparian zones and streambeds.
Promote natural resource protection by a variety of means, including financial compensation for willing buyer/willing seller agreements that promote land and water conservation easements.
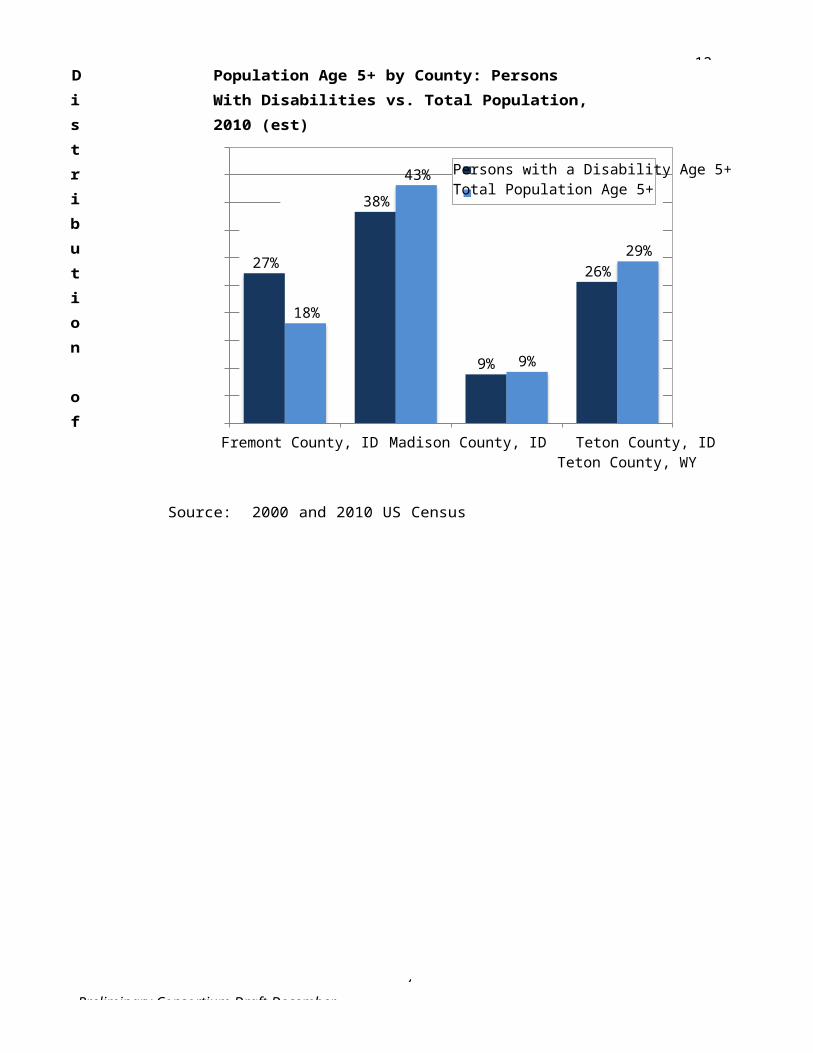
Protection of the Path of the Pronghorn, the longest remaining migration corridor in Greater Yellowstone - Crossing structure and fencing at Trapper’s Point
Elk Migration Corridor – National Elk Refuge
The National Elk Refuge provides, preserves, restores, and manages winter habitat for the nationally significant Jackson Elk Herd as well as habitat for endangered species, birds, fish, and other big game animals. The Refuge celebrated its centennial in 2012.
12-31-
7Preliminary Consortium Draft December
Promote the creation of additional local park spaces and rehabilitation of habitat areas. Protect wildlife, aquatic habitats and scenic views through land use regulations and
guidelines. Encourage the creation of a standard set of best practices for habitat preservation and
minimizing wildlife conflicts tobe included in local comprehensive plans.
Theme 3: Protect, maintain, and enhance the natural assets and critical areas that serve as wildlife corridors.
Strategies: Support the identification of
important wildlife corridors. Adopt regulations that help
support the enhancement and preservation of critical wildlife migration areas.
Protect special areas and sites, including byways, and sand dunes.
Encourage protection of key seasonal habitats such as wildlife calving areas and winter ranges.
Give consideration for land use and water use management to aid in recovery of populations of threatened and endangered species.
Develop and implement a regional strategy to conserve wildlife corridors for migration.
Theme 4: Preserve continuity and function of waterways and wetlands in support of aquatic species and fisheries.
The Henry’s Fork basin provides one of the most important rainbow trout fisheries in the state. In addition to the Henry’s Fork, Teton, Warm, and Buffalo river tributaries support important regional fisheries. Henry’s Lake and Island Park Reservoir are important components of the Henry’s Fork fishery. Basin streams contain rainbow trout, Yellowstone cutthroat trout, brook trout, coho, kokanee, and mountain whitefish. Although cutthroat trout are the native salmonid in the drainage, rainbow
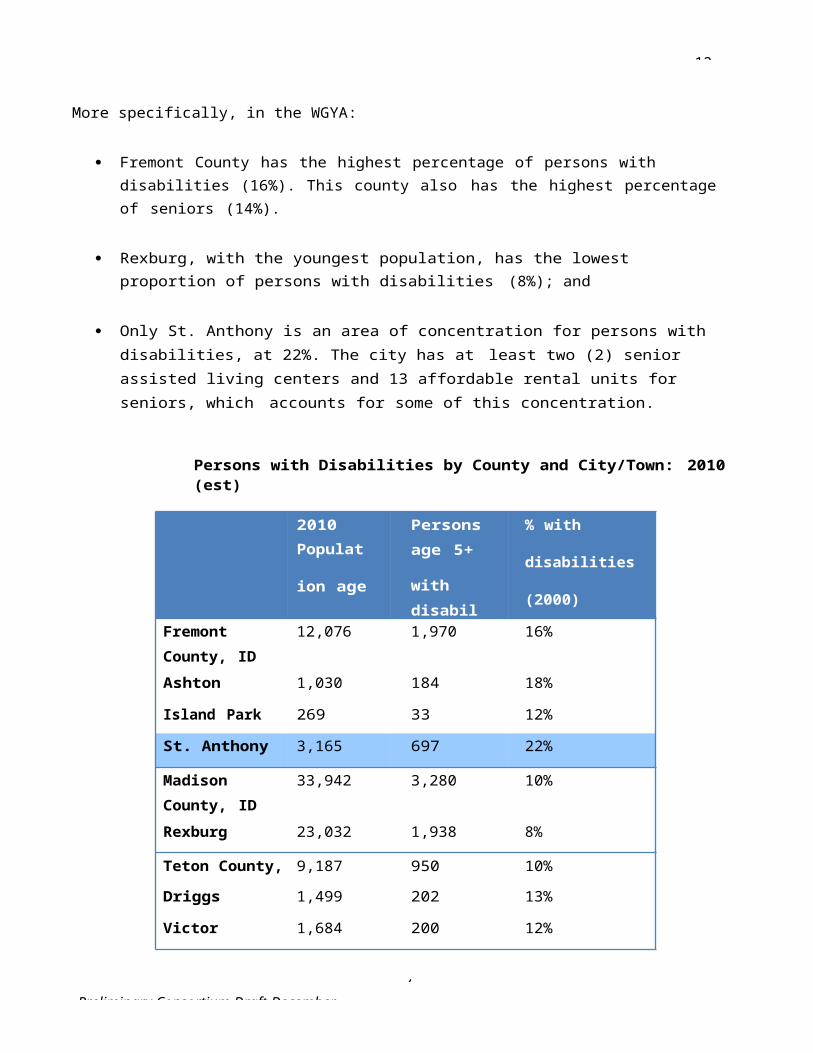
12-31-
7Preliminary Consortium Draft December
trout are

12-31-
7Preliminary Consortium Draft December
considered the most important game species present. Mountain whitefish are the most numerous native game species in the basin. (1992 Henry’s Fork Basin Plan) [Need to add info on Teton Basin and main stem Snake River fisheries].
Strategies: Encourage the screening of irrigation
diversion structures to protect fishery values, where necessary or appropriate.
Work with the state to insure sufficient flow in the tributaries to Henry’s Lake and the tributary to the Teton River to provide spawning habitat for the resident fishery.
Examine the need for minimum streamflows in basin streams. Where the need for a state protected flow is identified, seek to provide such flow.
Support protection of fish passage on existing and future projects. Cutthroat Tout
Construct self-cleaning screens on irrigation diversion structures in selected streams to reduce fish mortality.
Increase the research program to evaluate and improve the fisheries on important Henry’s Fork tributaries such as the Fall, Teton, Warm and Buffalo rivers, and Bitch and Robinson creeks.
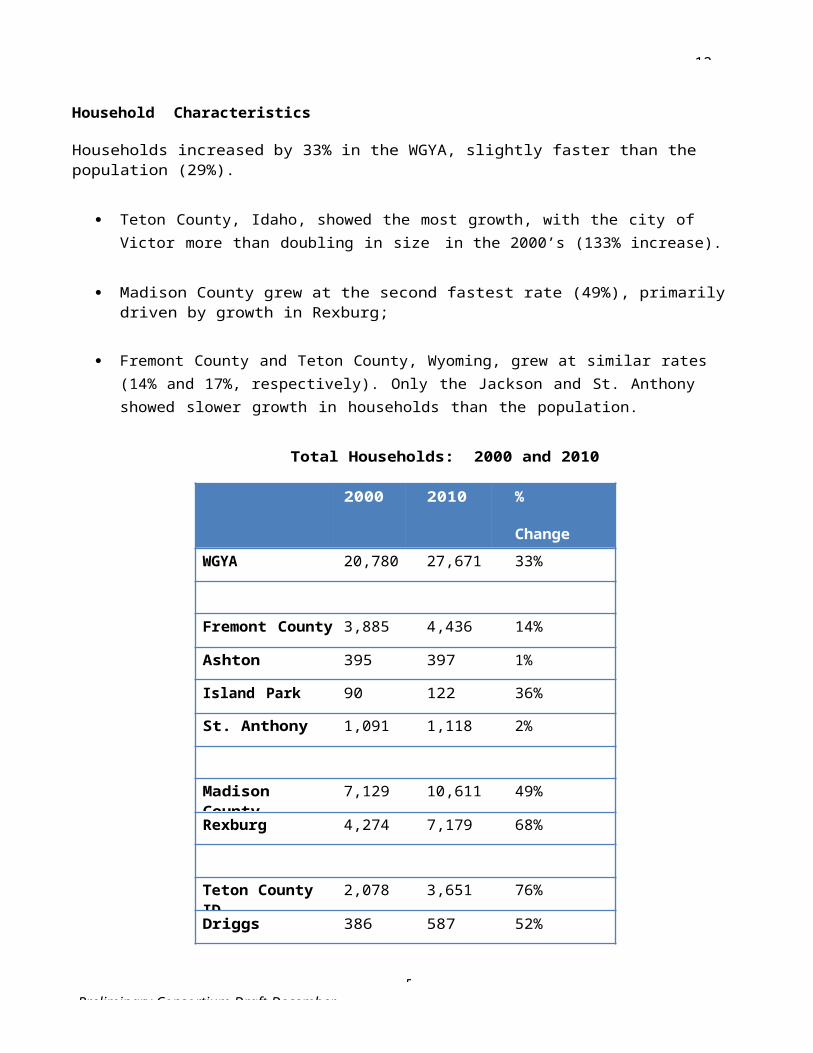
12-31-
7Preliminary Consortium Draft December
Key Indicators
Land Conservation
This indicator measures the total land area conserved by federal, state, and local agencies.
WhyThe natural environment is one of the most commonly cited reasons for residents to live in the Greater Yellowstone Region. As such, the conservation of land for ecosystem functionality, recreation, and protection of habitat and sites of special significance is directly supportive. Conservation occurs at a variety of regulatory levels including local, state, and federal through a variety of mechanisms.Regardless of how the land is acquired, any increase in acreage provides additional opportunities for land stewardship and preservation of the natural functions of that land.
This indicator demonstrates the extent to which there is an overall appreciation and value placed on land conservation, and conversely how much land is being taken out of the supply for development. The indirect benefits of watershed maintenance, habitat preservation, and increased connections to nature for residents are also captured by ensuring that those acres are available as resources for the foreseeable future.
Units of MeasureThis indicator is measured in total acres of land permanently conserved via land ownership or conservation easement. Increasing values indicate the conservation of more land, whereas decreasing values could mean the sale or loss of land or easements for conservation purposes.
SourceLand ownership information for this indicator is available from Headwater Economics’ Economic Profile System – Human Dimensions Toolkit (EPS-HDT). This toolkit uses published statistics from federal data sources and the most recent version is 2013. The toolkit is available at the following website: http://headwatersecono mic s.org/tools/eps-hdt .
Data for this indicator related to conservation easements is available from annual County assessor or GIS records. The Teton Regional Land Trust also maintains information about protected lands in the Upper Snake River Valley (see: http://w ww .tetonlandtrust.org/lands-to-date/summar y ).

12-31-
7Preliminary Consortium Draft December
Yellowstone Cutthroat TroutThis indicator measures the presence of Yellowstone Cutthroat Trout in regional streams and water bodies.
WhyThe health of native species is often dependent on keeping ecosystems functioning at historic levels. In the case of the native Yellowstone Cutthroat Trout, the species faces a number of challenges ranging from habitat loss to predation by non-native species of fish. In addition, the particular species of trout is a desirable sport fish for fly fishermen due to its uniqueness and propensity to feed on insects at maturity.
By gauging the presence of this particular fish species, the region’s water and habitat quality can be tracked along with the impacts of and to the recreational fishing population. As a well-studied species, the presence or absence of Yellowstone Cutthroat Trout can also be related to specific environmental conditions such as droughts as well as indicating the prevalence of introduced species as they interbreed with some of the non-native Rainbow Trout.
Units of MeasureThis indicator is measured in miles of presence in streams and water bodies.
Increasing values could indicate growing trout populations or increased availability of habitat suitable for this species. Decreasing values could indicate threats to the trout population or habitat (e.g., decreasing water quality, loss of habitat, or increase in predators).
SourceData for this indicator is available from the Idaho Departments of Fish and Game, as follows:
Idaho Fish and Wildlife Information System – https://f ish andg ame.i dah o.gov/ifw is/portal/opendata/ id aho- sel ect- fish -spe cie s-presence- streams
A similar resource is not yet developed for Wyoming, but Yellowstone Cutthroat Trout data may be available through the Wyoming Game and Fish Department (see: http://w gfd.wy o.gov/web2011/f ishin g-1000182 . as px ).
Henry’s Fork Foundation is another great resource for fish and habitat information in the Henry’s Fork watershed (see: http://he nrysfork. org/ ).
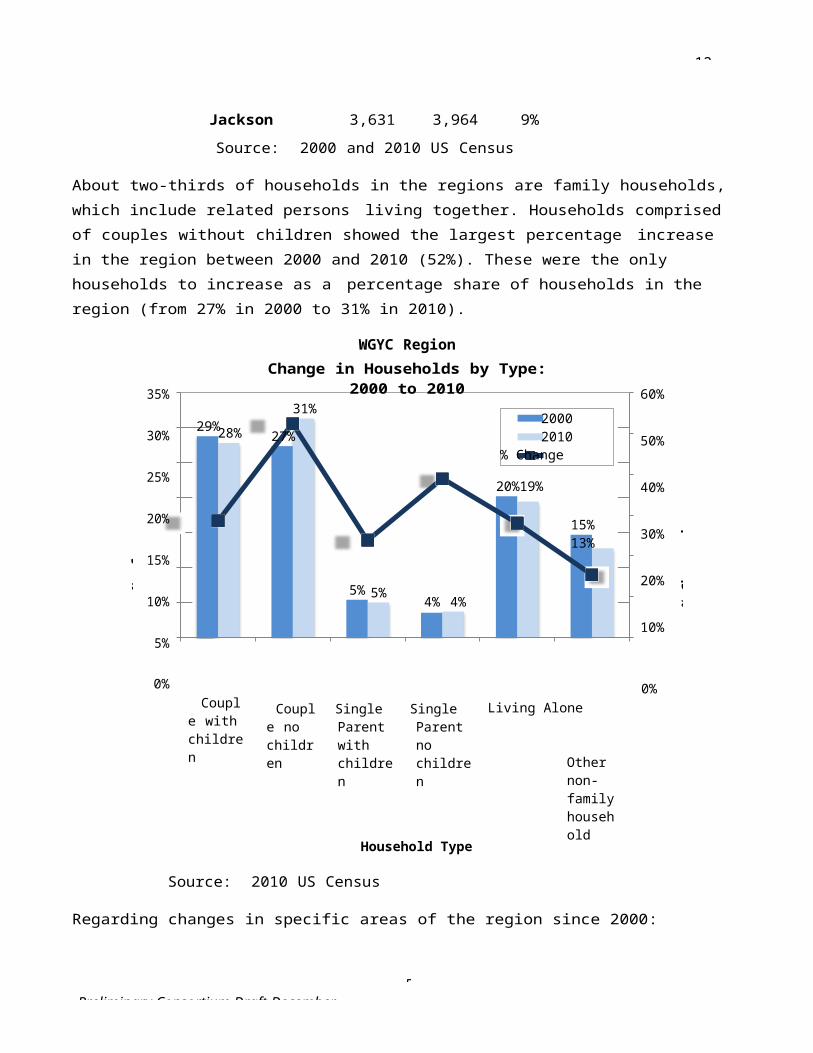
12-31-
7Preliminary Consortium Draft December
Elk HarvestThis indicator measures the demand for elk hunting in the region and is correlated with the health of the elk population.
WhyElk hunting is an important nexus of recreation, economic activity and ecosystem health in the Greater Yellowstone region. The number of elk harvested annually are based on estimated population levels and hunter success, which are affected by habitat quality as well as several other factors such as predation. Since elk are one of the more popular type of game animals to hunt as well as being a prominent trophy species, elk hunting harvests are a robust measure of hunting performance and continued interest from hunters.
The annual elk harvest can also demonstrate the effects of resource management efforts, as elk populations are symbiotic with predator populations as well as particular forage species. Since the relationship between elk and predators also affects economic activity in terms of available elk for hunting, the indicator can help inform the appropriate balance not only of elk but of predator populations as well. Finally, since there are specific tasks often associated with elk hunting such as processing that many hunters will pay for locally, the harvested elk can provide an indication of the activity in that specific sector.
Units of MeasureThis indicator is measured in total number of elk harvested each year (by residents and nonresidents), as reported to and by the state departments of Fish and Wildlife, for the hunting zones that fall within the region.
Increasing values could indicate a greater economic benefit from increased hunting activity as well as increased game availability from habitat improvements. Decreases in this value could indicate a decrease in hunting activity due to either decreased populations of elk or degradation of the hunting experience.
SourceData for this indicator is available from annual hunter and harvest reports from the state departments of fish and game, as follows:
Idaho - https://fishandgame .id aho.go v /content/mhr Wyoming - http://wgfd. wy o.gov/web2011/HU NTING -1000184.aspx
Note that Idaho’s Hunter Reporting will include more in-depth analysis beginning in January 2015.
Source: YBP Outdoor Recreation Prospectus
OHVsHuntingDestination AnglingDude RanchesMountain BikingWhitewater RaftingFat BikesSnowmobiling
12-31-
7Preliminary Consortium Draft December
Chapter 4.Four-Season Recreation
Regional Context
The GYA is known worldwide for its outdoor recreation. Mountain climbing, biking, hiking, skiing,snowmobiling, wildlife viewing, fishing, and hunting are just a few of the outdoor recreation activities that are considered first-class and attract visitors from around the world to the region during every season of the year. It is our wildlife, public lands, and special sites that support the four-season recreation in the area. As such, the GYA exemplifies the complexity and challenges of balancing outdoor recreation and wildland preservation.
The inherent difficulties in protecting the
region’s natural qualities while realizing the economic opportunities for recreation will only intensify as more people move into the region and seek outdoor experiences. Given the rate of population increase in the fastest-growing counties of the GYA, a 10-15 percent annual increase in recreation use is possible (U.S. Census Bureau 2004). Beyond their increasing numbers, people are bringing new forms of recreation with greater technological sophistication, intensity of use, and potential for impacts on natural resources. Accelerating development of private land in the GYA is transforming theregion and creating pressure on public land for recreation and other uses. Environmental influences beyond the GYA (climate change; airborne pollutants; etc) are currently or anticipated to have an effect
on the area as well. (GYCC, 2006)
Source: 2005 Loomis Report
The natural beauty and outstanding recreation opportunities of the Snake River corridor from Southwestern Wyoming to Southeastern Idaho draws thousands of visitors a year. Improving ecological conditions and fisheries has the potential to further increase economic benefits, income, and employment in the area. Through careful management, the Snake River can support irrigated agriculture and hydropower generation, as well as robust recreational activities.
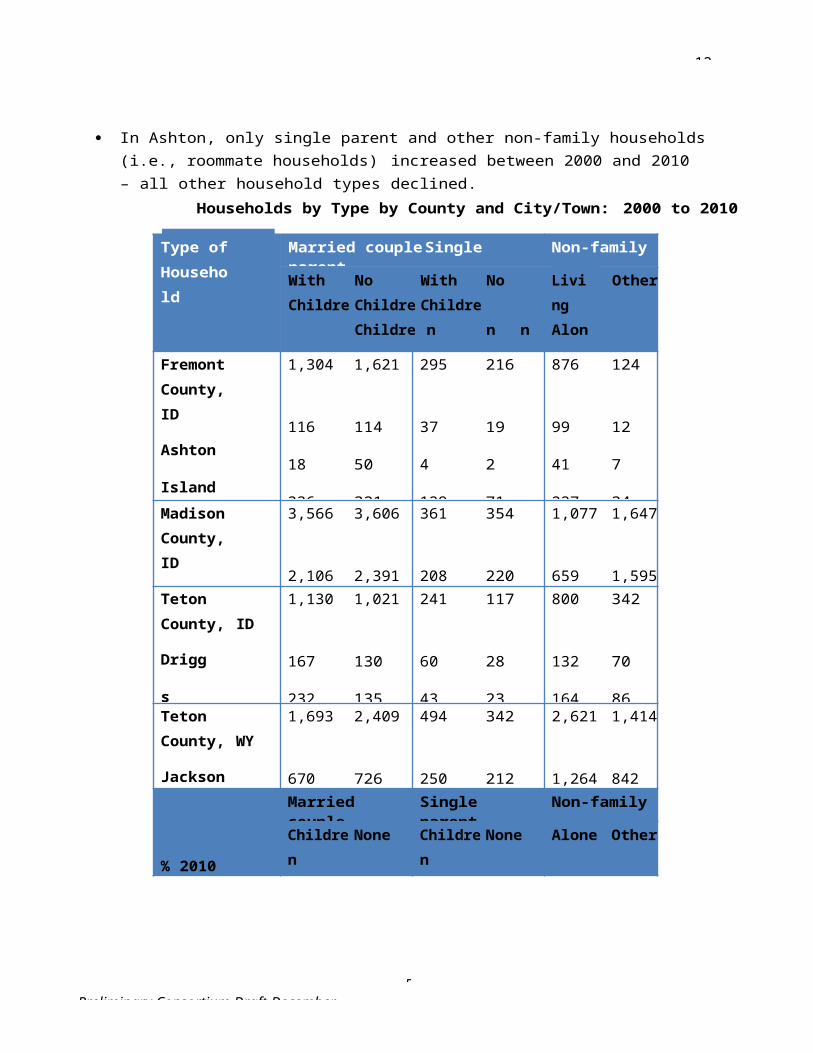
12-31-
7Preliminary Consortium Draft December
Fishing, boating and other river related recreation along the Henry’s Fork, South Fork, and Wyoming stretches of the Snake River provides substantial economic values to local businesses, workers, communities, and visitors. Nearly a half million visitors recreate along the Snake River each year. The non-local visitor spending in Southeast Idaho and Southwest Wyoming generates $52.7 million in direct, indirect, and induced income and supports a total of 1,460 jobs. A substantial portion of the income and jobs come from anglers targeting Yellowstone Cutthroat Trout. The number of jobs would increase to about 2,400 and income to $75 million if river flows and fishing conditions improved to the point where either anglers could catch twice as many fish or fish that were 25 percent larger.(2005 Loomis Report)
Henry’s Fork Basin and Island Park Recreation AreaRecreational opportunities in the Henry’s Fork Basin cater to local residents and visitors from throughout the United States. Proximity to Yellowstone and Grand Teton National Parks contributes to recreational use, but the basin also charms visitors with its own outstanding attractions: Big Springs, Mesa Falls, Harriman State Park, and fishing in Henry’s Lake or the Henry’s Fork. Sightseeing, nature study, fishing, boating, and winter sports attract thousands of people annually to the basin.
Island Park is part of a magnificent landscape. It is located in the Caribou-Targhee National Forest west of the boundary of Yellowstone National Park and southwest from the Town of West Yellowstone, Montana (the west entrance to Yellowstone National Park). From many places one can see the Teton Mountain Range that largely lies within Grand Teton National Park in Wyoming. The combination of its proximity to Yellowstone National Park, the mountain and ridgeline horizons, forested hillsides, Henry's Lake, the Henry's Fork of the Snake River that traverses the area and other landscape features provide a beautiful setting and a strong identity to the area. Island Park's beauty lies at the core of the community’s local values, economic vitality, and aspirations for the future.
Island Park Dam
In the summer, the area is a destination for anglers looking to catch trophy trout or families vacationing at guest cabins and rustic resorts. Others may come to ride ATVs or horses; hike or bike in the mountains; or camp next to a stream or lake. Some come to view the bald eagles, grouse, sandhill cranes, songbirds, raptors, waterfowl, large and small mammals, and wildflowers. In the winter, the area becomes a mecca for snow-related sports enthusiasts. The forest has over 500 miles of snowmobile trails and groomed trails for snowshoeing and Nordic skiing. Fees associated with snowmobiles, ATVs, and other trail uses are an important revenue stream for the region. Fremont is the #1 county in Idaho where people direct their snowmobile license fees.
The hospitality and real estate industries underpin Island Park’s economy. Several resorts and lodges provide a variety of accommodations for tourists including restaurants, cabin and condominium rentals,

Source: YBP Outdoor RecreationProspectus
12-31-
8Preliminary Consortium Draft December
and RV parking. They provide supervised float and horseback riding trips and fly-fishing guide services. In the winter, they rent snowmobiles and winter gear and conduct guided tours. In 2000, it was estimated by the US Census Bureau that 75 percent of the houses were used for short-term rentals (transient rental or houses for rent for less than 30 days). This increased to 85 percent in the 2010 Census. According to the 2012 US Census estimate, this use has risen to 89 percent in the City of Island Park, and to 85.4 percent in the Island Park Census County Division (CCD).(2014 Island Park Comp Plan)
Some of the working cattle ranches nearby also accommodate needs of tourists. Patrons of these ranches can watch rodeos, cowboys doing their jobs, participate in cattle drives, ride horses, fish, or just relax.
Many visitors are fly-fishing enthusiasts who come to fish on the famous Henry’s Fork of the Snake River, Henry's Lake, or many of the other nearby rivers, streams, and smaller lakes. For the fly- fisherman, the area has specialized fishing equipment shops and expert guides. Boating and fishing in the Island Park area contributes to the region through economic benefits, local employment, and income effects. (2005 Loomis Report)
Teton Mountain Range
The high quality of outdoor recreation in the Teton MountainRange, including Teton County, Idaho and Teton County, Wyoming, is a direct result of having a healthy and functioning ecosystem in the area. (YBP Outdoor Recreation Prospectus)
Recreation opportunities in the Teton Mountains include but are not limited to recreation at Jackson Hole Mountain Resort, rock climbing and other activities in Grand Teton National Park, and skiing at Grand Targhee Resort and Snow King Mountain. Grand Targhee Resort also offers mountain biking in the summer and fat biking (Grand Targhee was the first ski resort to create fat bike trails).
The Town of Jackson and Teton County are the southern gateway to Yellowstone National Park, Grand Teton National Park, Bridger-Teton National Forest and the National Elk Refuge. Tourism is the basis of the economy in Jackson and Teton County, Wyoming. The community continues to enhance this sector by pursuing sustainable tourism that is not reliant on growth and consumption. Outdoor recreation tourism and eco-tourism are primary focuses for future planning. (Jackson and Teton County Comp Plan)
In the summer, Teton County, Idaho is a destination for anglers. Driggs has been named the “Flyfishing Hot Spot” by Field and Stream and has been listed in the top 20 Best Fishing Towns in America. The Snake River corridor from Southwestern Wyoming to Southeastern Idaho draws several thousand
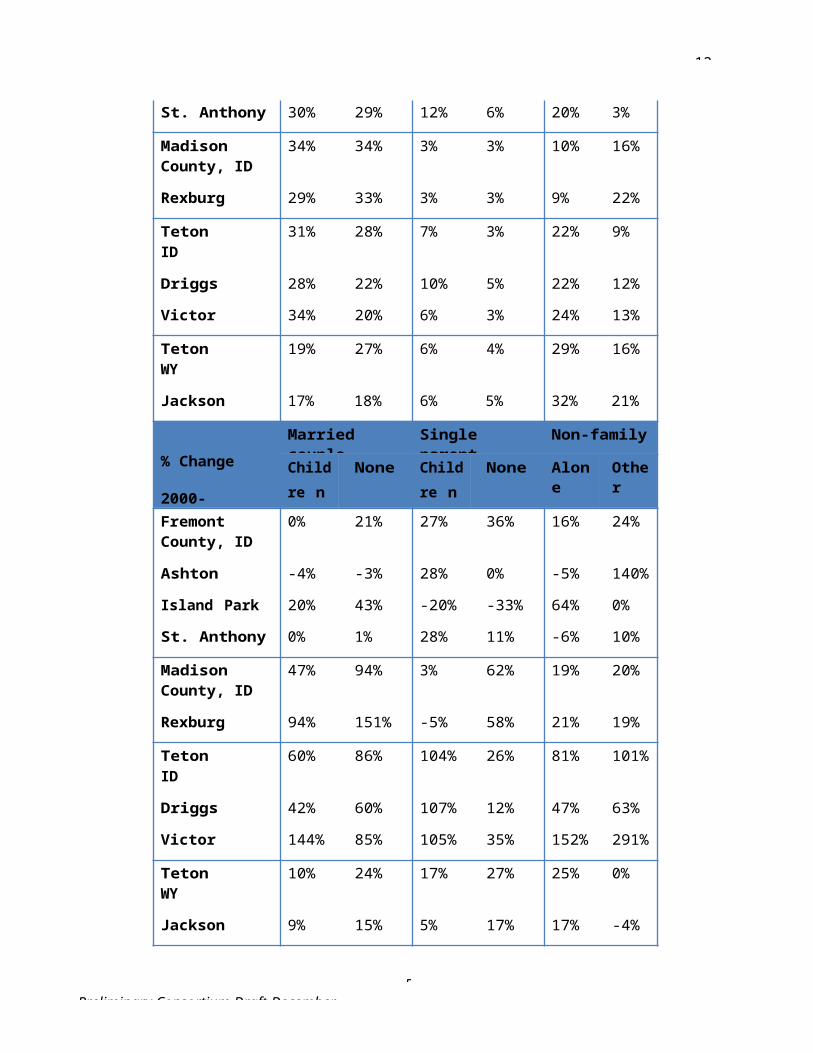
8Preliminary Consortium Draft December
12-31-
visitors each year to enjoy its angling and boating opportunities. A 2005 study documented a total of 460,418 anglers using the Snake River and its tributaries from May through September 2004. The total economic contribution of fishing that summer on the Snake River (including the Henry’s Fork) was estimated to be $86 million with anglers willing to pay another $85 per trip to fish these waters rather than not fish them or fish at other rivers. (YBP Outdoor Recreation Prospectus)
8Preliminary Consortium Draft December
12-31-
With only 19 percent of the four-county region designated as private land, the region’s public lands are the primary attraction for four-season recreation activities. The Snake River and its tributaries, three major ski resorts, miles of summer and winter trails, two Idaho State Parks, and two National Parks provide a variety of outdoor recreational activities within public lands that contribute to quality-of-life for residents and year round attractions for tourist.
12-31-
8Preliminary Consortium Draft December
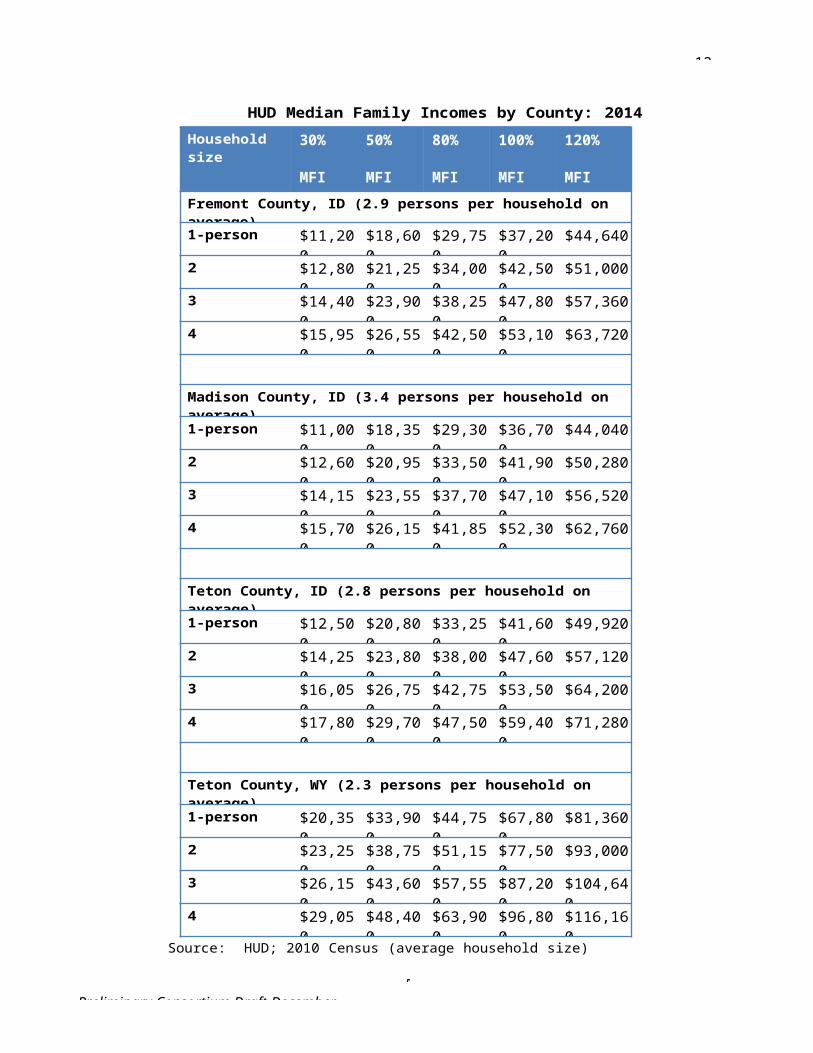
Fat bikes at ski resorts and on snowmobile trails
Photo source:
12-31-
8Preliminary Consortium Draft December
Themes and Strategies
Theme 1: Provide and promote exceptional recreational opportunities for all types of users that are consistent with resource protection as a means for economic development and enhanced quality-of-life.
Biophysical, geologic, and historic resources are the attractors, destinations, and settings for outdoor recreation and must be protected. Outdoor recreation opportunities contribute to enhancing public welfare and increasing the vitality and well-being of the citizens and communities within the region. (GYCC, 2006)
Fishing, boating, and other river related recreation along the Snake River and its tributaries provides substantial economic value to local communities. Nearly a half million visitors recreate along the Snake River each year. (2005 Loomis Report)
Strategies: Ensure that recreation development is
consistent with the natural setting, scenery, and recreation opportunities of the region.
Encourage recreational opportunities as ameans for economic development and enhanced quality of life.
Enhance and improve all-season access to public lands and waterways, except where necessary to protect areas from environmental degradation, negative impact to wildlife habitat, or to protect public safety.
Recognize the need to accommodate different user groups in a way that minimizes user conflicts and resource damage.
Support a diversity of recreation through all four seasons as a mechanism to bring communities together and build acceptance of diverse lifestyles.
Collaborate with Federal, State, and non-governmental agencies to improve recreational opportunities.
Establish mechanisms for funding recreation improvements. Identify and address the effects on the recreation experience from other influences,
often the unintended consequences of apparently unrelated actions. Where feasible, consider establishing minimum stream flows for aquatic life,
recreation, aesthetics, and water quality.
Theme 2: Encourage recreation and tourism development during the shoulder seasons to help create a resilient economy.
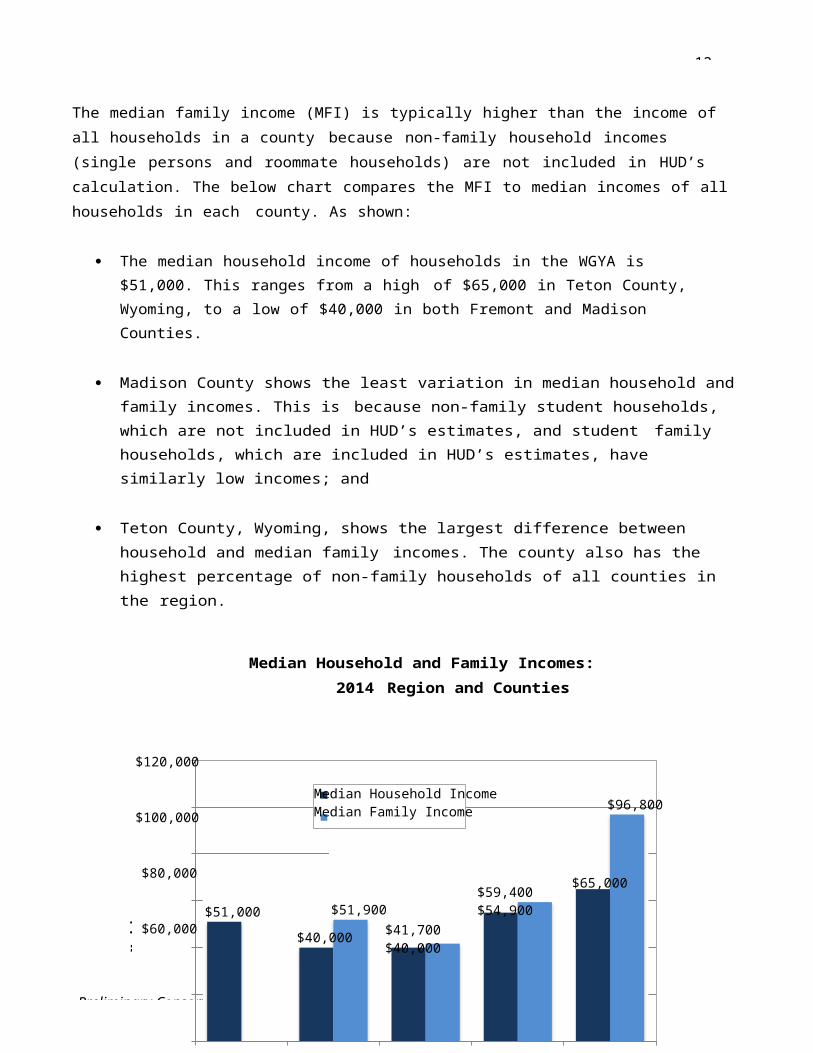
12-31-
8Preliminary Consortium Draft December
For many communities that have a tourism driven economy, the spring and fall or “shoulder” seasons can be a difficult time financially. Many tourist oriented businesses, such as restaurants and retail stores, shut down between the peak winter and summer seasons. Although this may be a welcome break by those who work double time during the busy season, many businesses struggle to make ends meet until the next peak season arrives. By developing and promoting the region for shoulder-season activities, the economy can become more stable and resilient.
Additionally, recreation use is changing in response to population, technology, and social trends. Planning for recreation and tourism development must address these changes and accommodate new types of visitors and recreation opportunities.
Strategies: Sustain river flows and fishing
conditions to expand and capitalize on the economic value of angling tourism.
Develop recreational assets to serve shoulder season activities and enhance tourism in the shoulder seasons.
Market existing recreational assets for new activities and use during the shoulder seasons.
Develop a comprehensive website that encompasses all information about the region and that can be used as atool in recruiting new four-season business/industry to the area.
Develop, enhance and market spring and fall off-season recreation opportunities to contribute to year- round tourism and quality-of-life for residents. This may include indoor facilities that can be used year- round.
Encourage distribution of recreation and tourism-supporting businesses across the region through increased marketing and communication of opportunities for access to the national parks and other recreation areas.
Improve transportation connections between airports, retail centers,
Source: YBP Outdoor Recreation Prospectus
Greater Yellowstone Trail and all of its components - part of the story in the descriptions for themes and strategies
GYT going into Grand Teton Park
Photo source: GYT Update 2014
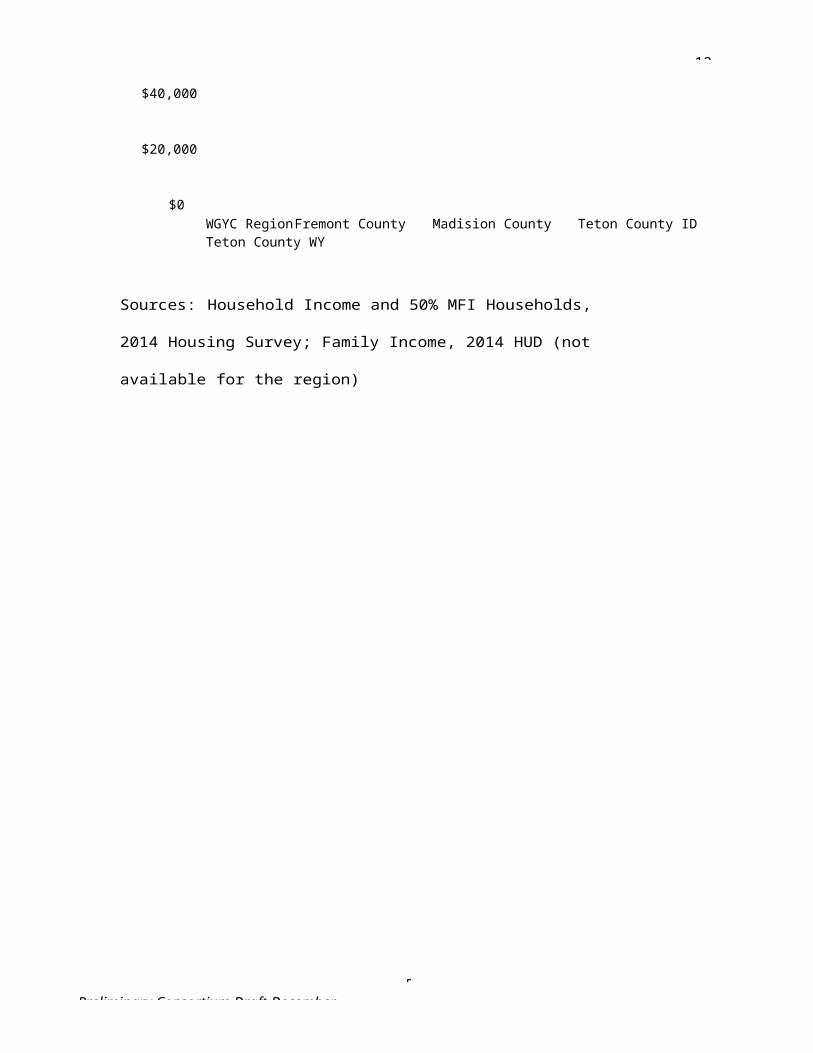
12-31-
8Preliminary Consortium Draft December
gateway communities and area attractions to serve residents and visitors in all four seasons.
Assist businesses and tourist attractions with workforce training, marketing expertise, technology upgrades, financing for expansion/research, new market development, and organizational capacity.
Theme 3: Develop a region-wide trails network and advance economic development scenarios that integrate the trails network concept.
Well connected and integrated trails, pathways, and sidewalks are important for providing access to natural resources and for improving public health through increased physical activity. An integrated multi-modal trails network would fill in the gaps between existing trials in the region.
Strategies: Develop the missing links in the Greater Yellowstone Trail to connect West Yellowstone
with Island Park, Ashton, Tetonia, Driggs, Victor, Wilson, Jackson, Teton Village, Moose, and Jenny Lake.
Encourage coordination within the snowmobile industry to promote tour packages outside the national parks.
Coordinate with the Nordic ski community in a manner similar to that of the snowmobile industry to promote one and two-week destination vacations in the 4-county region.
Create a regional task force to organize and prioritize trail development that will fill the gaps in the regional trail system and provide funding resource information and aid.
Expand public awareness of the regional trail system.
12-31-
8Preliminary Consortium Draft December
Key Indicators
Hunting and Fishing License ValueThis indicator measures the total value of resident and non-resident hunting and fishing licenses.
WhyHunting and fishing are activities that tie many values of the Greater Yellowstone region together. By charging fees for licenses, permits and tags, a primary year round recreation activity is able to perpetuate the acquisition and preservation of habitat and provide ongoing stewardship of public lands. The economic impact of the industry as a whole goes far beyond the fees to support local economies due to the need for supportive services such as outfitting, guides, supply manufacturing and more. The value of licenses specifically illustrates the trend of the industry as a whole as it is based on resident and non-resident purchases that qualify them to engage in hunting and fishing activities. Non- resident licenses in particular are much more expensive than resident licenses and can have a significant influence on the overall value. Monitoring the actual number of licenses issued will help demonstrate expected impact to the economy and to the natural lands where hunting and fishing takes place.
This indicator is also a reflection of forest health and ecosystem productivity as interest in hunting and fishing is tied to abundance of game and the overall experience of wilderness. In addition, the hunting and fishing culture is a significant component of the region’s character and heritage, supporting the type of overall sense of place desired by the majority of residents
Units of MeasureThis indicator is measured as total value of licenses sold in each county. Licenses are issued by authorized vendors and state Fish and Game offices across the state. The data is tracked internally with location information and also in terms of resident status, term of validity (one-year, three-year, lifetime). The indicator is tracked by licenses sold per county annually.
SourceData for this indicator can be obtained from state Fish and Game Licensing departments. In Idaho, the Fish and Game Headquarters License Department in Boise can run queries on license data including where licenses were purchased, where the purchasers live, value and number by county.
12-31-
8Preliminary Consortium Draft December
Trail MilesThis indicator measures the public trail system as it relates to overall population levels.
WhyThe ability to recreate on a year round basis is part of what makes the Greater Yellowstone Region so special. Having the opportunity to find less traveled routes as well as access popular attractions is an important aspect of living here. Recreational trails help direct wilderness traffic and preserve fragile areas from being heavily impacted by off trail users. As population and visitor levels continue to increase, the extent to which the trail network adds additional miles will help define the quality of the recreational experience.
Trail construction provides some economic and recreational opportunities directly during the construction period as well as encouraging visitors to return and enjoy the region’s natural wonders in a relatively managed way once complete. This indicator can help to illustrate the supply of recreational access which can be examined in concert with other regional indicators to develop a more robust sense of how balanced the amount of trails are with the amount of people looking to use them.
Units of MeasureThis indicator is measured in miles of trails per capita by county.
Increasing values for this indicator show that trail development is keeping pace with population growth. Decreasing values for this indicator could suggest that population growth is outpacing investment in trail development or that there are limited opportunities for additional or expanded trails.
SourceData for this indicator includes trail mileage and population. Trail mileage data is available from municipal and county parks and recreation departments or GIS records. GIS data is also available from state and federal agencies that provide and maintain public trails. Resources for trail GIS data include but are not limited to the following.
Idaho Geospatial Data Clearinghouse: htt p: //insid e.ui daho.edu/ind ex .htm l Wyoming Geospatial Hub: http://inside .ui daho.edu/inde x.html National Park Service Integrated Resource Management Applications (IRMA):
https://irma.nps.gov/App/
Population data by county is available annually from the American Fact Finder website provided by the US Census Bureau: http : //fac tfin de r 2 .c ensus .gov .
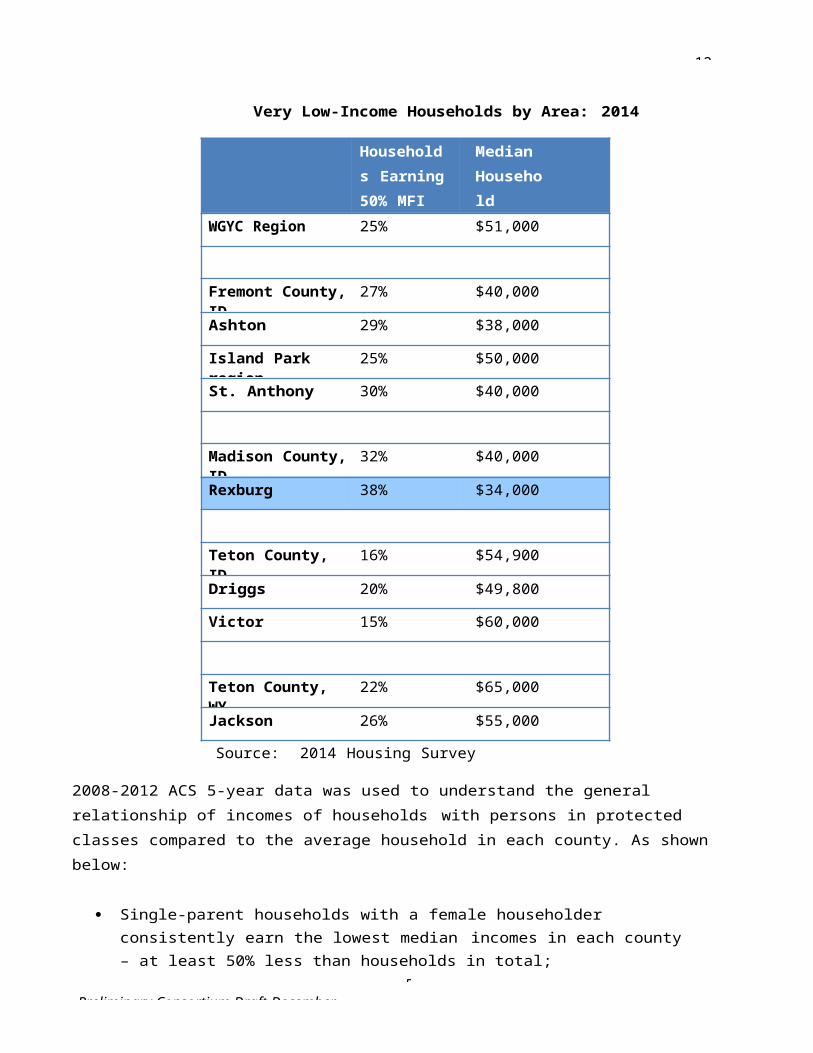
12-31-
8Preliminary Consortium Draft December
Public Land VisitationThis indicator measures the number of visitors to public lands.
WhyThe character of the Greater Yellowstone region is tied to the high proportion of lands preserved in the public trust as state and national parks and other lands, such as national forests and recreation areas.The recreation opportunities, quantity and quality of wildlife, and scenic amenities attract year round visitors. The economic impacts of such visits to the surrounding communities vary, but are significant parts of the overall regional economy. Counting and monitoring the number of visitors to these public lands over time helps to gauge the potential and actual economic, environmental, and social impacts of these visitors.
The number of visitors to these public lands can also be used as a comparative statistic when determining the impact visitors have to overall economic activity in the region. Visitors to public lands impact resources outside of the parks including roads and hospitality services, and the number of visitors serves to reinforce the importance of resource conservation. Continuing to support state and national parks not only attracts more visitors that inject spending in local economies, but also preserves the natural resource function of the parks.
Units of MeasureThis indicator is measured in total visitors. It may be reported in terms of in-state and out-of-state visitors by some agencies.
Increasing values for this indicator demonstrate increasing popularity of and visitation to public lands. Decreasing values might suggest changes in visitor interests, economic conditions, or accessibility of public lands.
SourceData for this indicator is available from public land management agencies including but not limited to the National Park Service, Bureau of Land Management, and state, county, and, and municipal parks and recreation and departments.
Annual visitor use statistics for national parks are available from the Integrated Resource Management Applications site maintained by the National Park Service (see https://irm a. nps.gov/Stats/ ).
Visitation estimates for Forest Service properties are available through the USDA Forest Service National Visitor Use Monitoring Natural Resource Manager (see http://a pps.fs. usda.gov/nrm/nvum/results/ ).
Visitor data for Bureau of Land Management properties are available through the University of Idaho BLM Visitor Survey Portal (see https://w ww.ui daho.edu/cnr/par k -studies-unit/blm/reports ).
Visitor use statistics for state parks and lands are available as follows:
Idaho Parks Visitation Statistics: http://parksandrecreation.idaho.gov/about-parks-recreation

12-31-
8Preliminary Consortium Draft December
Wyoming State Parks Visitation Statistics: http://w y opa rks. state.w y. us/P l anning/VisitorUse.aspx
Note that county, municipal, and other public land visitor use data may not be routinely collected or reported, but should be monitored to the extent possible.
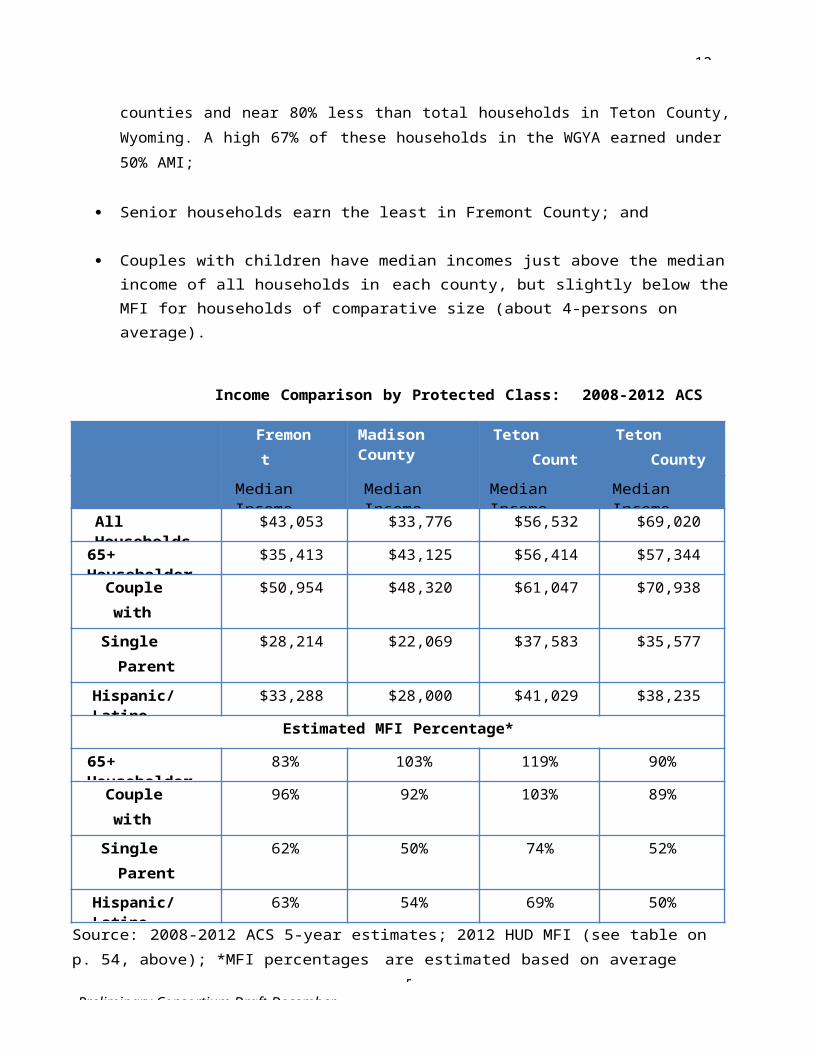
9Preliminary Consortium Draft December
12-31-
SECTION IV. RESILIENT COMMUNITIES
We will respect local autonomy while working together to improve the lives of all our year-round residents and seasonal guests. Livability Principles Addressed:
Support More Transportation Choices Promote Equitable, Affordable Housing Enhance Economic Competitiveness Support Existing Communities Value Communities and Neighborhoods
Chapter 4. Distinctive Major Cities
Regional Context
The two largest cities in the region, Jackson, Wyoming, and Rexburg, Idaho, are each at the center of their own micropolitan areas and also serve as cultural destinations and retail trade centers. Rexburg is an educational center with Brigham Young University-Idaho serving as its primary economic driver.Jackson continues to thrive as a resort community, catering to local, national and international visitors. The cities are both growing and working towards becoming sustainable, resilient communities.
Jackson, WY
The Town of Jackson and Teton County, Wyoming are gateways to Yellowstone National Park, Grand Teton National Park, Bridger-Teton National Forest and the National Elk Refuge.
Source: LDR Diagnosis
The Jackson and Teton County community takes pride in local identity and community character. Natural character is protected through ecosystem stewardship, and physical character is guided by growth management. Retaining a stable spectrum of local employment and housing opportunities preserves its identity as a community of long-term residents who steward the surrounding ecosystem

9Preliminary Consortium Draft December
12-31-
and welcome visitors to do the same. Residents and visitors have become accustomed to a high-quality of life, transportation, educational, social, cultural, and recreational services.
Because of the enormous attraction of the national parks and public lands in the Jackson Hole Valley, it is important to recognize the great variation of population in the valley from season to season, both visitors and seasonal workers. This seasonal fluctuation has implications for services and facilities of the town, county, and private providers, such as the hospital. However, it is difficult to pinpoint exact numbers of visitors and seasonal workers. The Housing Needs Assessment report contains some data, including employee turnover by season and unfilled jobs by season and type. In addition, the Sustaining Jackson Hole reports contain detailed information on the summer, winter, and shoulder season recreational activities and visitors.
Within the Town of Jackson corporate limits, most parcels of land in the town are developed, but significant additional development potential could be permitted under current regulations. In 2007, the town had 458 acres of public land (including parks, schools, libraries, hospitals, and other civic uses). Of the private lands, 1,001 acres were developed and 135 acres were vacant on 145 lots of varying sizes (i.e., only12 percent of land is vacant). Physically, the town can only expand to the south towards South Park due to steep terrain and public lands that limit expansion in other directions. Also, because so little vacant land exists, there is high pressure for redevelopment, especially on valuable parcels downtown close to the town square. The recently adopted Jackson/Teton Comprehensive Plan directs growth away from rural areas to complete neighborhoods and the Town.
(Jackson/Teton County Comprehensive Plan)
Other unique attributes include a healthy economy, high quality recreation and education programs and a focus on Western art. The community also has a strong focus on environmental sustainability. Design guidelines and development regulations have been implemented that encourage environmental sustainability and the “western” aesthetic. The wastewater treatment plant contains solar panels. The former mayor has solar array on his house. A Vertical Harvest project has been implemented in town.The START bus system is a year round public transportation system that is partially funded by the Town of Jackson, Teton County, and federal funds. START shelters and stop signage use alternative energy. A county recycling program has been implemented that is supported and partially funded by tax payers.
Rexburg, ID
The City of Rexburg has a long history of strong public investment into safety, education, recreation, and culture. The City of Rexburg has a strong tradition of safeguarding family values. The community has a vibrant population of young people and much of the emphasis of the community
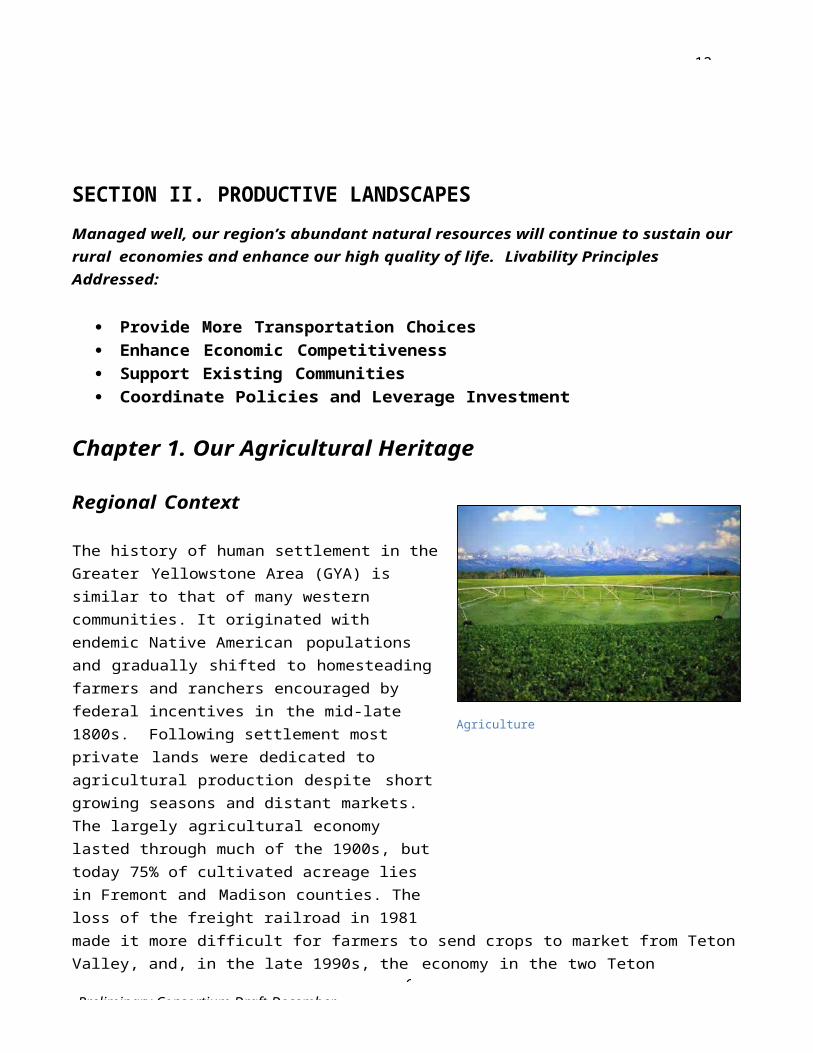
9Preliminary Consortium Draft December
12-31-has been providing opportunities for youth to grow up and develop in a healthy family oriented atmosphere.

12-31-
9Preliminary Consortium Draft December
The community has placed special emphasis on maintaining an environment of public safety and has invested in a strong local police force to maintain that environment.
Education in Rexburg is first rate. Starting in the excellent elementary schools and extending through to high school, students learn from well prepared and disciplined teachers. Education has a long tradition of fine graduates and teachers are known for their dedication to the mission of educating their students. Rexburg has strong educational and vocational programs for persons with disabilities and special needs.
Rexburg has traditionally supported strong recreation programs. These programs involve many sectors of the youth population and have provided an atmosphere of responsibility and growth for our residents.
Rexburg has a geographically and culturally-diverse population as students from 60 countries and most all 50 states attend the University. These students make up approximately half the current population of the City. Rexburg is also the Host City for the Idaho International Summerfest. Dance teams from all over the world share their talents and culture each year during this annual event.
The transition of Ricks College into a four-year university, Brigham Young University-Idaho, will continue to have major impact on the community over next several decades. The change has brought many new students to the area, and the University is working to increase its capacity and ability to educate more students.
Thousands of new multi-family dwellings have been constructed and apartments have continued
to spring up in the city. A perceived housing shortage mushroomed into a perceived overbuild during the housing boom of 2007 and 2008.
Cultural expectations in Rexburg are an interesting study in history and hope for the future. Many in Rexburg feel that the community has always had a strong sense of expectation and hope for the long- term growth of the community. Many of the design and layout criteria included in the original city plat reflect the vision of the pioneers who settled this region as the community has been laid out to provide almost endless expansion capability. Road systems that include conformance to a “grid” layout make it easier and more cost-effective to extend the road system and utilities into new growth areas.
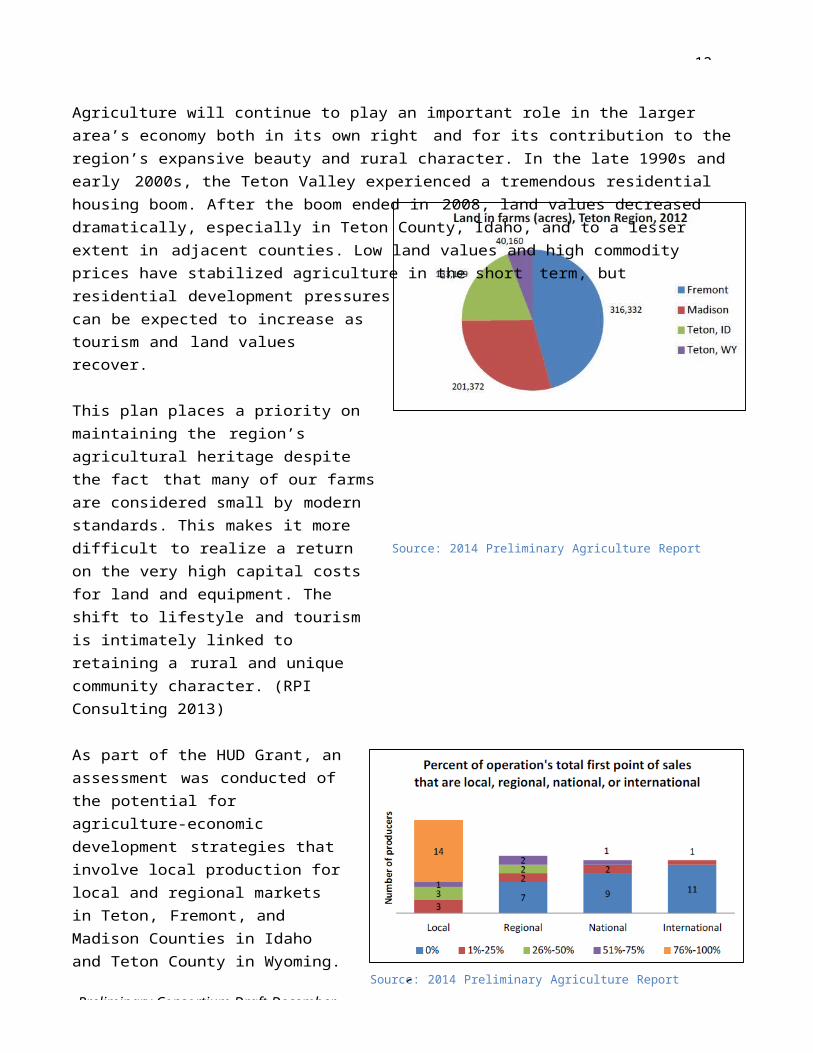
12-31-
9Preliminary Consortium Draft December
Several major components in the City of Rexburg are in the middle of dramatic change. Transportation systems that have in the past been at high levels of service have declined. The City and County recently cooperated in providing funding and data to support a new transportation plan, which has been incorporated into this plan. Population increases have made it possible for new commercial development to spring up and for several local businesses to expand. Commercial developments are anticipated to continue to expand.
New development has made it necessary to annex various areas into the City of Rexburg. The City has annexed more land in the past few years than the total combination of annexations during the entire history of the City. As a result of the pressures of growth, many single-family neighborhoods have begun transitioning to areas of multi-family, including dormitory housing. A positive consequence, largely as a result of this neighborhood transition, has been the formation of neighborhood associations that have organized and are now becoming involved with City government in assessing and making recommendations on issues that impact their areas.
There has also been a renewed interest in the community in investing in the revitalization of the downtown area. This goal is being strongly supported by the City in the form of development of a downtown blueprint or revitalization plan. This effort supports the desires of the community to maintain a nucleated or centristic community where the downtown functions as the core from which the rest of the community radiates. Success of this effort is dependent on the critical grassroots effort and support from the downtown business and property owners to bring rapid public and private investment to bear. (Rexburg Comprehensive Plan)
12-31-
9Preliminary Consortium Draft December
Rexburg, ID, (population 26,520) and Jackson, WY, (population 10,135) are the two largest cities in the four county region. They act as regional hubs and serve their surrounding micropolitan areas.
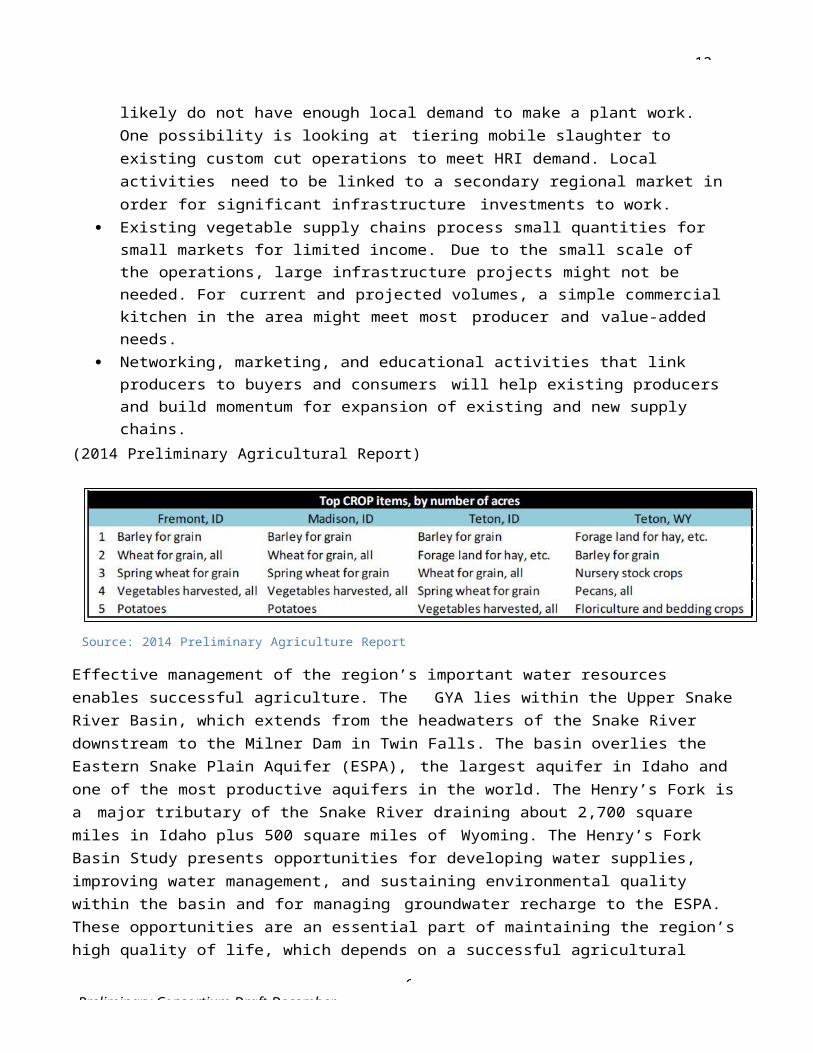
12-31-
The Idaho International Summerfest has grown to become an important regional cultural event.Photo source: folk-dance-festival/
Jackson Hole and Yellowstone Sustainable Destination Program
content/uploads/2014/01/jackson-hole- and-yellowstone-sustainable- destination-program-plan1.pdf
Themes and Strategies
Theme 1: Protect our cultural centers and preserve a character that promotes economic development, tourism, and our quality-of-life.
Cultural heritage is essential to maintaining the unique character of the region. Communities in the region value natural heritage and also strive for vibrant economies. Through the protection of special areas or sites with cultural, historical, or local significance, the region can draw upon the history ofthe communities to guide
future development and preserve community character.
Strategies: Partner with local historians, schools, and
volunteers to create an inventory of significant historic, archaeological, cultural significant and architectural resources.
Protect significant historic, archaeological, and architectural resources and consider regulatory options and official designation from the State Historic Preservation Office to protect the highest priority historic resources.
Explore and facilitate grant opportunities for building restoration, adaptive reuse and historic inventories.
Support the expansion of recreational, cultural, and tourism venues that are focused on improving visitor experience.
Theme 2: Encourage managed growth, access to services, and a healthy economy through sustainable land use practices.
The Town of Jackson and surrounding Teton County decided to update their Land Development Regulations (LDRs) in order to strengthen their ability to implement their jointly-adopted 2012 Comprehensive Plan and remove barriers to more sustainable growth in the town and county. The vision for Jackson and Teton County, Wyoming is to result in a healthy environment,
95
12-31-Preliminary Consortium Draft December 2014

9Preliminary Consortium Draft December
Rexburg has implemented an innovative Infill Development Standard to streamline zone changes as a result of new development.While Jackson has targeted specific areas of change for redevelopment and defined the desired form and
Jackson and Teton County’s Comprehensive Plan ensures that 60 percent of development occurs in complete communities and not in rural areas and that the majority of the workforce must have the option to live in these communities through a progressive housing program. They monitor this annually through an adaptive management program. Currently 70% of people who work in Jackson and Teton County Wyoming also live there. This is rivaled only by the resort Town of Whistler in Canada, who has achieved the same success.
12-31-
community, and economy by achieving all three mutually supportive common values:
• Ecosystem Stewardship• Growth Management• Quality of Life (LDR Diagnosis)
Residents of the City of Rexburg have chosen to live there because they enjoy the current quality of life, aesthetics, recreational opportunities, mix of land uses,and patterns of development that the city provides. The primary vision of the City of Rexburg Comprehensive Plan is to ensure that these qualitiesare maintained, preserved, and enhanced. A key focus of the plan is encouraging infill and redevelopment. The city has recently implemented an Infill Redevelopment Standard Method for identifying re-developed areas with a scoring method. Scores are based on 1) Protect stable non- fragmented single family neighborhoods, 2) Identify vacant and underutilized lots 3) Location of utilities,4) Distance from significant location and amenities,5) Street address, and 6) Historic preservation. (Rexburg Planning Interview)
Strategies: Utilize this plan and companion plans
as a source to incorporate planning policies that can be considered when communities update their planning documents.
Promote compact development in key areas where amenities and utilities are available to reduce cost of services, while limiting densities in hazard prone, rural, natural, and sensitive areas.
Encourage development to be located away from sensitive visual,environmental, and agricultural areas to create an environment that promotes tourism and high quality of life.
Implement joint city and county planning either through joint planning processes, mutual agreements, or concepts including impact zones, and influence areas adjacent to
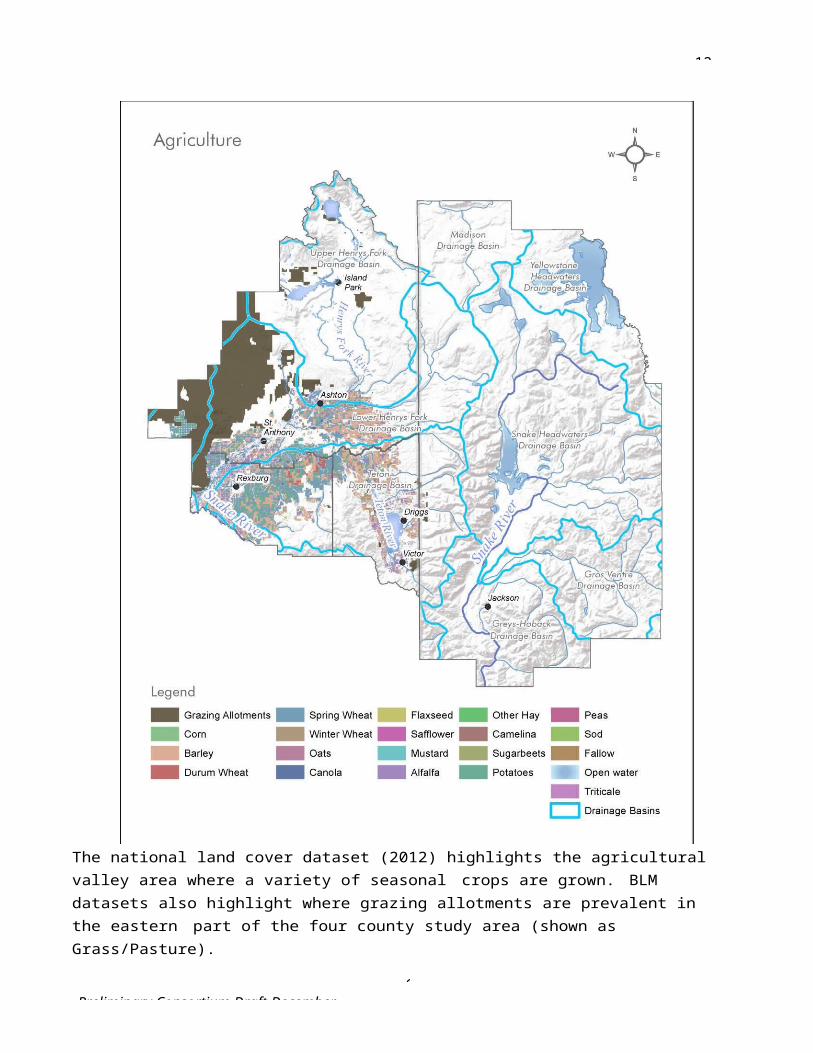
12-31-
9Preliminary Consortium Draft December
each city to ensure compatible planning efforts and the application of consistent regulations in these adjacent areas.
Encourage and pursue economically diverse, innovative, and creative industries that have the option to locate in quality of life communities to keep our economy stable.
Create an attractive environment for businesses and tourists within our cities by providing amenities that support a high quality of life.
Protect, maintain, and enhance the economic bases that support residents by providing a supportive infrastructure system, trained workforce, affordable housing, incentives and joint-marketing.
Support local and inter-city transit options for each City’sworkforce that is frequent, reliable, provides options for shift workers and is connected to secondary transportation systems including local transit, shuttles, and bike/pedestrian facilities.
Theme 3: Improve access to workforce housing through programs that expand the supply and variety of housing types.
Jackson and Teton County, Wyoming, have the most extensive housing production programs and development requirements of all other GYA jurisdictions. These counties still have the tightest rental market, highest priced ownership market, and are struggling to keep pace with rising numbers of jobs. Development and redevelopment constantly threatens to reduce the existing affordable housing stock in the area.
The Town of Jackson, which also has many multi-family units, however, should consider increasing densities given the shortage of land in the area, the strong and continuing demand for workforce housing, and their policy to house 65 percent of their workforce. Jackson has not been meeting its share of workforce housing in light of strong job creation.
Rexburg has the highest densities zoned and permitted in the region. Rexburg, which could likely double in size under current zoning and has had the majority of their development in the 2000’s in large multi-family apartment projects, should look at preserving lower density single family and duplex, or four-plex options to retain a balance. Ownership housing decreased as a percentage of occupied homes by 11 percentage points in the 2000’s. Rexburg needs to preserve lower density housing with more ownership opportunities in light of this trend.(Regional Analysis of Impediments)
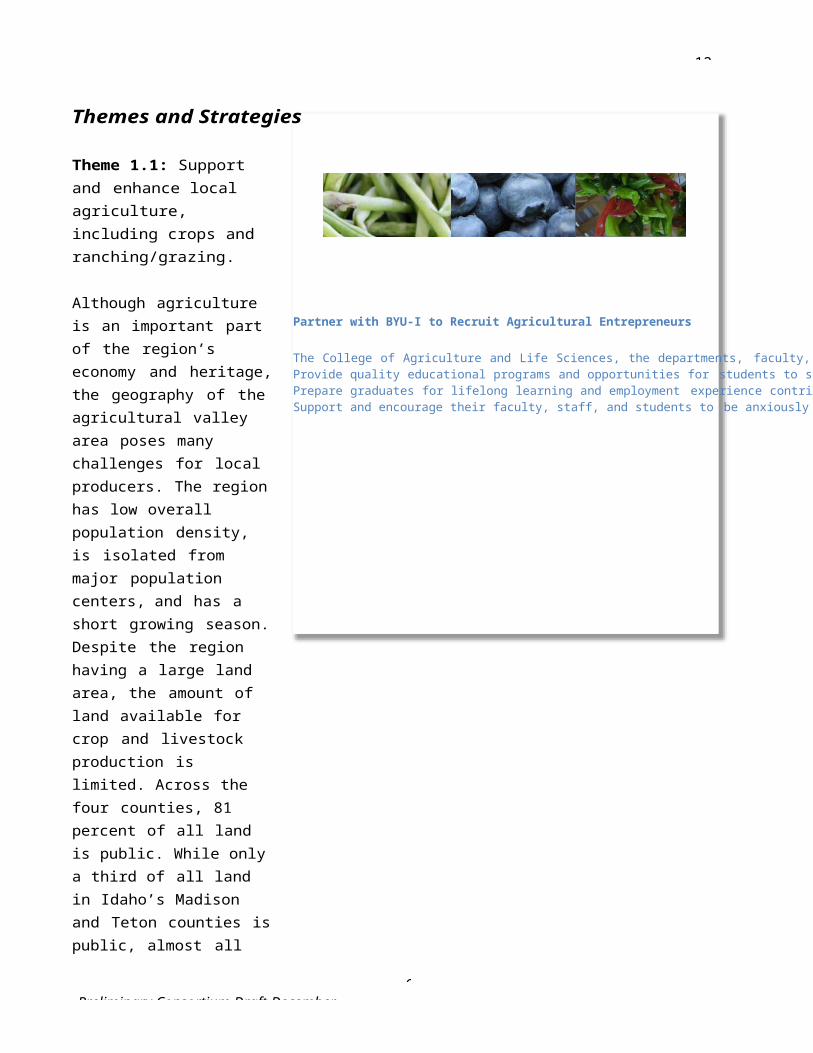
Jackson Reduce, Reuse, Recycle Effort is a community focused effort that has promoted recycling and conservation in the community.
12-31-
9Preliminary Consortium Draft December
Strategies: Locate higher density housing in each city in targeted areas in order to meet workforce
housing needs (e.g. complete neighborhoods). These areas should be located and designed in a way so as not to detract from the overall community character and should be mixed with other housing types.
Require or encourage employers to provide housing for workers on or off-site to accommodate the demand generated by these projects.
Explore incentives to build a variety of denser housing, including density, height bonuses and parking variances.
Encourage large employers to provide housing assistance to their employees. Seek permanent funding sources to offset the cost of providing housing to
families in the most need. Support forms of businesses and zoning codes that allow people to work in the place
they live including live-work opportunities, technology centers, co-location, resource- sharing arrangements, housing above or adjacent to business and home businesses.
Continue to encourage the coordinated activities of the Jackson/Teton Housing Authority and non-profit housing groups in meeting the housing needs for all affordable housing income ranges.
Provide a one-stop-shop organization(s) to be a coordinated and accessible resource for housing in Rexburg and to locate information about properties and options, including low income and market rate rentals.
Theme 4: Support a regional recycling program and encourage multi-sector partnerships and policies to improve and promote waste diversion.
A regional recycling study was conducted in 2014 as part of the HUD grant for a planning period of 2015 through 2030. The study was a feasibility-level consideration of ways to improve recycling for the GYA. The study does not dictate requirements for recycling, but rather offers recommendations for the GYA communities. The drivers ofthe study were to increase recycling on a regional basis, increase the diversion of landfill bound waste, seek long-term cost-effectiveness, and make recycling accessible to all communities. The study revealed that the combined populations of Fremont County, Madison County, Teton County, Idaho, and Teton County, Wyoming are not large enough to support a regional recycling program. A program would need to extend beyond the four counties in order to be successful. Recycling can play an integral role in the overall sustainability and resilience of the region by providing local jobs, extending the life of our limited landfill space, and preserving our environment.
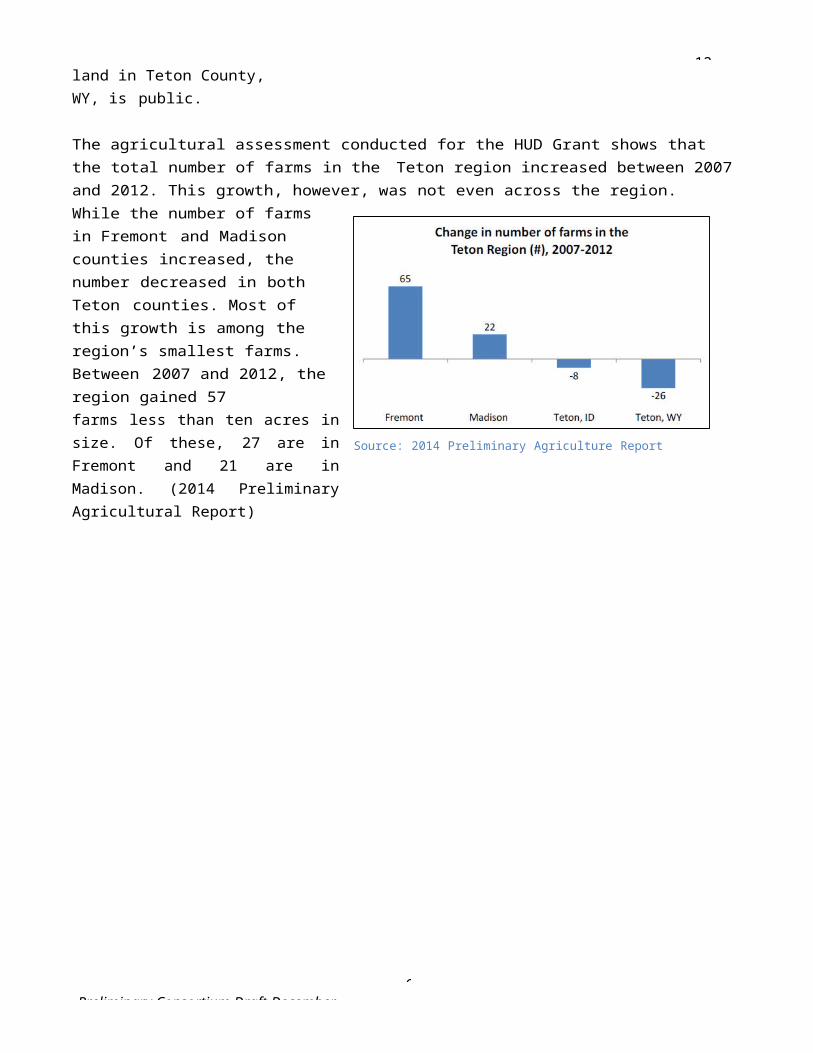
12-31-
9Preliminary Consortium Draft December
(Recycling Study)
Strategies: Evaluate and encourage waste diversion strategies such as composting of organics and
agricultural waste and reuse of construction/demolition materials, in addition to the collection and sale of traditional household recyclables.
Support formation of an organization that could work towards the development of a regional recycling program that takes into account the region beyond the four counties and is financially feasible.
Establish waste diversion goals that are quantifiable and support decision-making by multiple parties.
Implement policies, programs, and ordinances that encourage waste diversion and increase recycling rates in the region.
Collect waste generation and diversion data to support sound business decisions by the private sector to make capital investments.
Verify cost impacts to local governments and waste generators. Evaluate policy needs and implement effective outreach to increase recyclables. Collaborate broadly to maximize the service area and turn the multi-million dollar
missed opportunity into a strong drive for increased diversion and reduces costs.
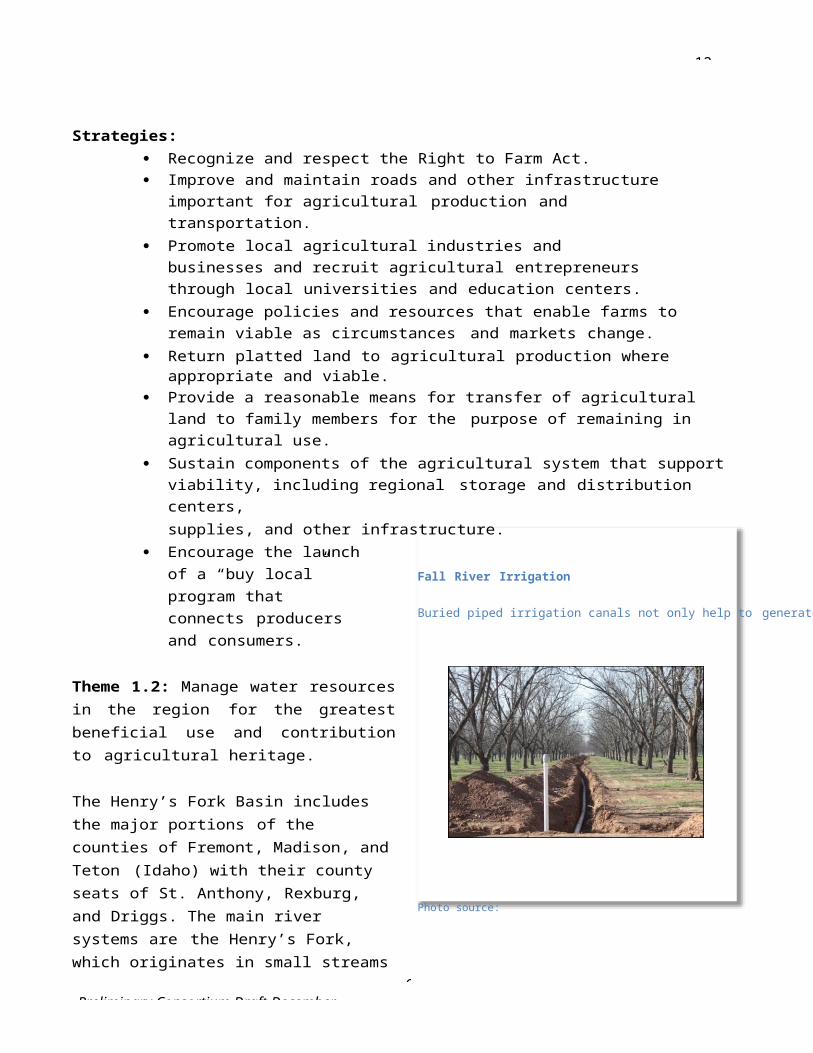
1Preliminary Consortium Draft December
12-31-
Key Indicators
Employment DiversityThis indicator measures the diversity of employment opportunities for each county.
WhyEconomic diversity is an important measure in assessing the total economic potential and performance in a county. Where employment opportunities are highly concentrated in a single sector, the potential for that industry to have a disproportionate impact on the economy is high. With a more diversified base of employment, not only are there more services available to community members, but as a whole the economy can be more resilient to any shocks to the system such as major fire in the park system or mass layoffs due to fluctuations in commodity prices.
This indicator also demonstrates disparities and differences among counties, which may indicate the potential for more sharing of services as well as opportunities for some counties to grow certain employment sectors. The diversity of employment also impacts the type and quantity of workforce training, housing and transportation needed in the region.
Units of MeasureThis indicator is measured as an annual average percent of employment by high-level industry by county.
A diverse economy is one that features a distribution of employment across the various industry categories, and an industry-reliant economy is one that has high levels of employment in one or several specific industries and low levels in the others.
Increasing values for an industry suggest growth in that industry in that county, either through overall growth or importing those jobs from another area. Decreasing values could suggest declining employment in a particular industry, or loss of a particular sector or industry to another area.
SourceData for this indicator is available from the US Bureau of Labor and Statistics Quarterly Census of Employment and Wages (QCEW – see: http://w ww.bl s.gov/c ew / ).
The QCEW Data Viewer provides data by industry at different geographic levels (see: http://w ww.bl s.gov/c ew /apps/dat a_view s/data_vi ew s.htm ). Table 6, “high-level industries, one area” provides estimates by county across 10 general industry groups. Data is available quarterly but can also be reported in annual averages. Note that data is reported as total employment levels, and needs to be converted to a percentage of employment for ease of comparison across counties.
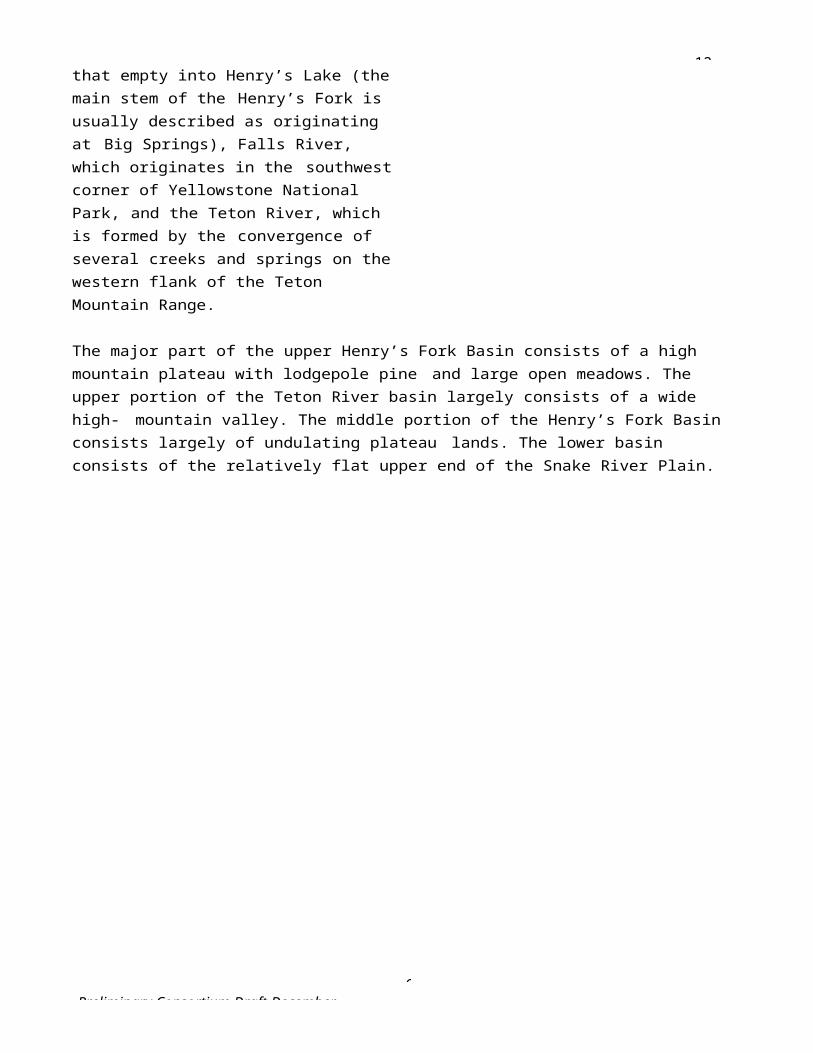
12-31-
1Preliminary Consortium Draft December
Development in City CentersThis indicator measures the amount of development activity occurring in existing municipal boundaries and defined activity center areas.
WhyBy developing within municipal boundaries and in defined city or activity centers, communities leverage existing resources and concentrate development where it can benefit the most people. In addition to using existing infrastructure for services like water and sewer, concentrating development in and near activity centers provides more opportunities for economic activity whether it is more consumers in the case of residential development or more products in the case of commercial development. The continued development of new uses enhances the experience of being located within a municipality and provides additional choices for people to access.
The inverse of development within municipal areas is the developing in more rural or outlying areas. These areas are typically not as well served, require additional infrastructure to be built, and typically result in people spending more time traveling to meet their basic needs. Additional consequences concentrated or sprawling development patterns can include habitat fragmentation and conversion of agricultural lands.
Units of MeasureThis indicator is measured as the percentage of annual building permits for new construction (quantity residential and nonresidential) occurring in established municipal boundaries or defined activity center areas, out of the annual total number of permits in each county.
Increasing values for this indicator suggest that development is becoming more centralized and concentrated. Decreasing values for this indicator could mean that development is occurring in a less coordinated or concentrated manner, which could also mean loss of agricultural land and increased costs to extend services and infrastructure.
SourceData for this indicator is available from municipal and county building departments and GIS property records and municipal boundaries.
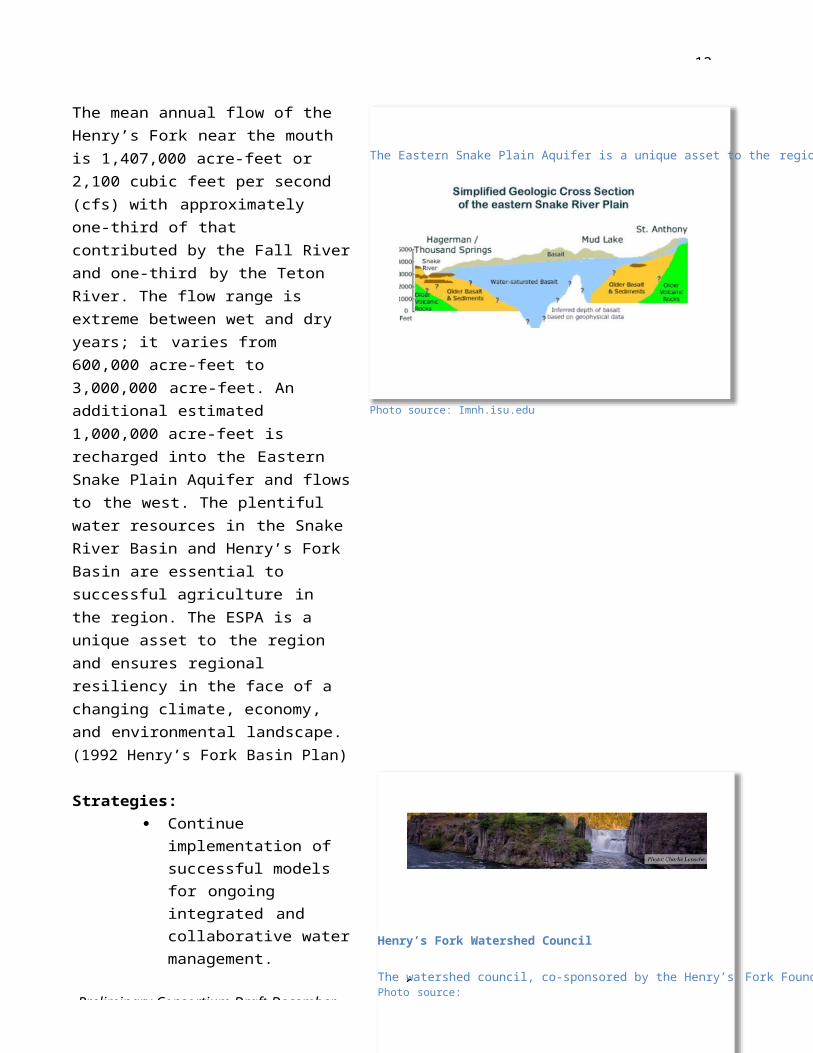
12-31-
Roadway Connectivity IndexThis indicator measures the ratio of road segments (links) to intersections
1Preliminary Consortium Draft December
WhyA well connected road network (higher connectivity index) emphasizes accessibility by providing for direct travel and increased route choice. A connected roadway network helps to disperse traffic over more roads by providing options for motorists to choose the most direct route, or another alternative if congestion delays exist. Road networks with a high connectivity index are also beneficial by providing options for emergency access and route alternatives when construction activities or other delays interrupt a segment.
While not all pedestrian and bicycle routes are on-street facilities, higher roadway connectivity indexes also support pedestrian and bicycle travel because, as with motorists, direct routes and route alternatives for pedestrians and bicyclists are important factors in convenience and safety for these transportation modes.
Units of MeasureThis indicator is measured as a composite index, which is calculated by dividing the number of road segments (links) by the number of intersections (nodes). A connectivity index of 1.4 is generally considered the minimum needed for a walkable community (Source: Ewing, 1996).
Increasing values for this indicator suggest that there are more opportunities for route variation and enhanced traffic dispersion. Decreasing values for this indicator could suggest that there are fewer options for route alternatives, meaning travelers must funnel onto fewer routes, which could lead to increased congestion or trip delays.
SourceData for this indicator is available from municipal and county GIS roadway records.
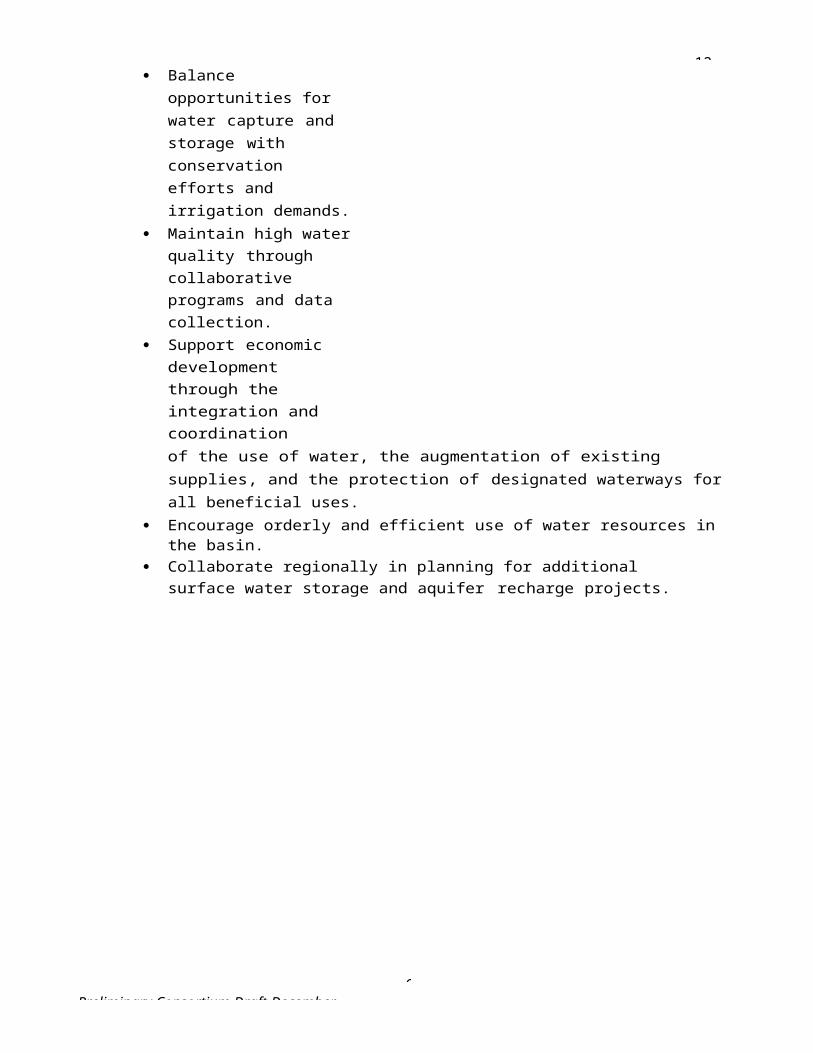
12-31-
1Preliminary Consortium Draft December
Commute TimeThis indicator measures the average commute time for employed persons in each county.
WhyAs a region, there is a significant relationship between where people live and where people work that contributes to quality of life. If people are able to afford and choose to live near where they work, there is more time available for other activities, less strain on the region’s roadway infrastructure, and reduced impacts on the natural environment. Measuring how much time people spend getting from their homes to their jobs provides insight into how both small and large communities are faring and relating to each other in the region.
Many factors come into consideration when deciding where to live, and relation to work is a significant part. This indicator can serve in an indirect manner to illustrate housing affordability as well as environmental factors such as air quality. While it may be a choice to live in a more rural setting, especially in a community that values natural settings, it may also indicate that there are simply no affordable housing options in some of the larger cities. If people are driving further to get to work, they contribute more pollution into the air and end up paying a greater proportion of their income on transportation costs. The region’s economy is interconnected, with some workers needing to drive long- distances between housing and employment. This indicator helps illustrate how inter-dependent the region’s communities are in terms of housing, employment, and transportation opportunities.
Units of MeasureThis indicator is measured in terms of mean travel time to work (in minutes).
Increasing values could suggest that residents are traveling longer distances to work, or that traffic congestion or other delays are slowing their commutes. Decreasing values could suggest that residents are living in closer proximity to places of employment, or that traffic levels or delays are decreasing.
SourceData for this indicator is available from the American Fact Finder website provided by the US Census Bureau: htt p: //fac tfin de r2.c ensus .gov . Data is available by county, through the American Community Survey estimates of economic characteristics, within the “commuting to work” category.
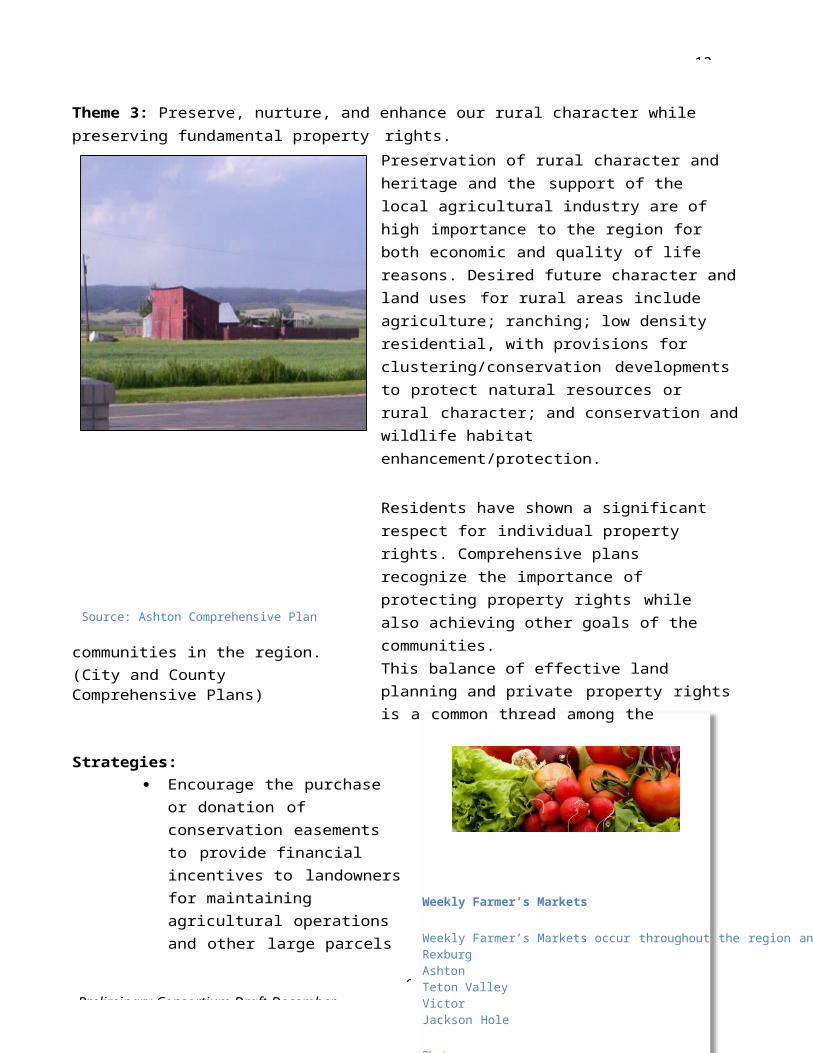
Mountainside Village
Mountainside Village in Victor is a successful pilot project for the Greater Yellowstone Business Partnership.Mountainside Village is a neighborhood as unique as it is authentic, graced by thoughtful design, a spectacular location, and a commitment to fine homebuilding.Photo credit: SelkoPhoto
The Driggs concert series and July 4th Balloon Festival are regional attractions.Photo source: -Valley-Balloon-Rally/
12-31-
1Preliminary Consortium Draft December
Chapter 5. Our Small Cities
Regional Context
This region is an area of sharp contrasts characterized by rural towns, destination resorts, two national parks as well as extensive national forests, farming and ranching. Key challenges of the region’s smaller communities are directly related to housing and economic development.
A Regional Analysis of Impediments, a report that examines fair access to housing and related services, was prepared concurrently with this Housing Needs Assessment utilizing many of the same sources of information. The four counties that comprise the Western Greater Yellowstone region share many characteristics, but contrast sharply when it comes to the cost of housing. Yet these counties are closely aligned in terms of affordability relative to incomes when the cost of utilities andcommuting to work is considered. Economic development, walkability and access to transit service are priorities for the smaller cities. Alternative transit hubs for buses, shared bikes, car sharing, and more bike paths are goals for sustainable land use planning for these communities.(Housing Needs Assessment and Regional Analysis of Impediments)
Driggs
The 2000 Census showed Driggs as the largest city in Teton County, with a population of 1100. After decreasing in population between 1950 and 1970, the City of Driggs population increased in each subsequent decade, with a 3.0 percent annual growth rate between 1990 and 2000.
Growth occurred at a faster rate in the county (7.4 percent annual growth between 1990 and 2000).Total Population in the Driggs Planning Area, outside of the City Limits, increased 11 percent annually between 1990 and 2000, to a total of 286 persons in year 2000. Much of this growth occurred along Ski Hill Road, where city water and sewer lines facilitated pockets of dense residential development (e.g., Teton
12-31-
1Preliminary Consortium Draft December
Creek Resort, Powder Valley/Shadowbrook, and Stoneridge Townhomes). Both the city and county growth rate exceeded the growth rate for the State of Idaho, which was 2.9 percent annually between 1990 and 2000.
Of the persons who moved to a new house in the city between 1995 and 2000, 24 percent left a house in another state and 89 percent of those persons moved from another state in the West. Anecdotal evidence suggests that many people in the 25 to 39 age classes are leaving other resort / ski towns because of the higher cost of living in those towns compared to Driggs. An obvious movement is occurring from Jackson to Driggs and Teton Valley in general, but others are arriving from towns in Colorado as well as Sun Valley, Idaho and other parts of the Northwest. This free movement of working age individuals is supported in part by the increasing ease of telecommuting.
The U.S. Census Bureau issued an estimate of 1197 persons living in Driggs in July 2005.This represents an annual growth rate of 1.76 percent. This estimate is dramatically lower than the 1990 to 2000 trend and is strongly contradicted by local statistics related to population growth, such as residential building permits and new water connections. New residential permits totaled 146 between 2000 and 2005, an increase in housing units of 6.4 percent. When accounting for the 2000 vacancy rate of about 1 in 7 homes, the annual rate of growth in new occupied homes between 2000 and 2005 was 5.6 percent.Representatives from the City believe that 5.5 percent is an accurate estimate of annual population growth since 2000.
The “index of industrial specialization” for Driggs in 2000 was 1,093, compared to the national average of 789. A lower number represents a more diverse economy, so the Driggs economy is considered less diverse than the national average. In 2000, more than a quarter of all male employees were working in the construction sector and 17 percent of all (male and female) employees worked in construction businesses. Growth in the construction sector was significant between 1998 and 2003, with the number of firms more than doubling in five years. Meanwhile, agriculturally related firms dropped to zero. These statistics underscore the shift from an agricultural service economy to one fueled by growth in population and, subsequently, in the real estate and construction industries.
The population of Driggs will continue to change in size, but also in composition, and persons of different ages, family status, incomes and backgrounds will prefer varying types of housing. The Downtown Driggs Community Association (DDCA) is a local non-profit group comprised of business owners, property owners, city staff, and local advocates that is a member of the National Main Street Program, one of first three cities designated under the Idaho program. DDCA is working to share knowledge of the Main Street Program and assist other communities in the region and participated in the National Main Street training and orientation held in Ashton, Idaho in 2014.(Driggs Comprehensive Plan)
Victor
Victor lies within the morning shadow of the Tetons. The Snake River Range rises south from the marshes and fields of the valley to the ridge. Within this broader view are farmsteads and open sage
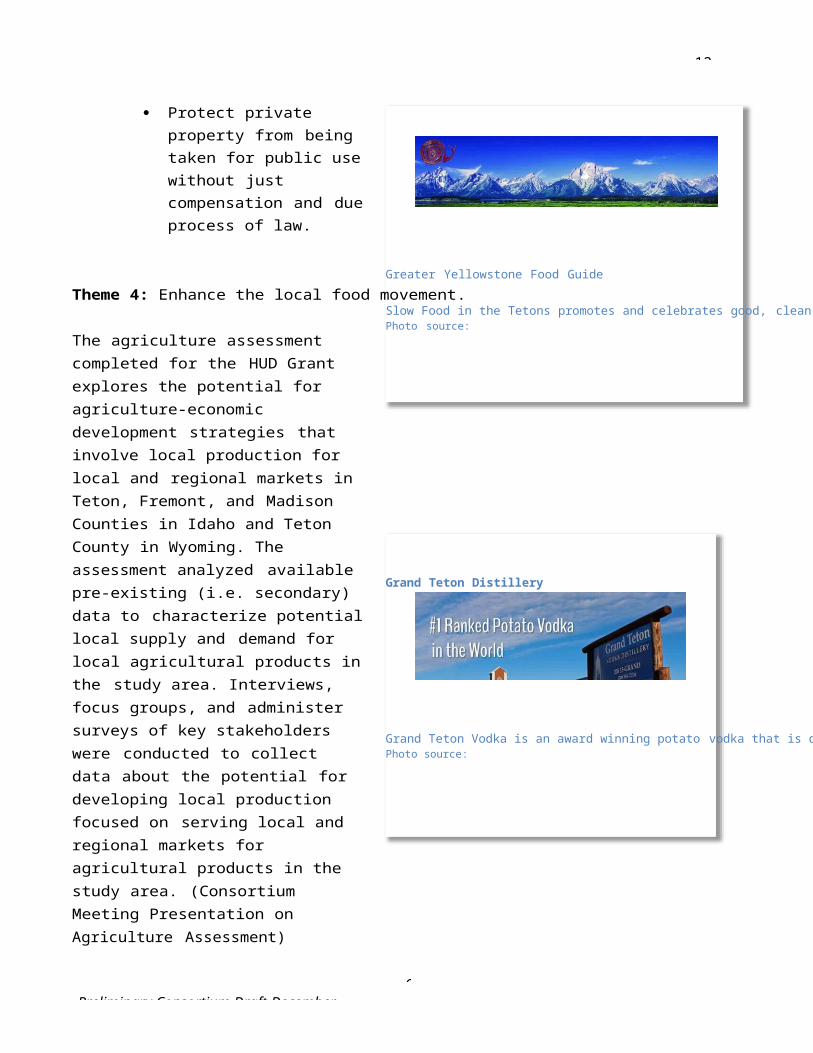
The Music on Main concert series began on a small vacant lot in downtown Driggs and quickly grew to become the most popular venue for free music every week during the summer. It now attracts thousands of spectators from all over the region and is hosted at the Victor City Park on Main Street.Photo source:
The St. Anthony free fisherman breakfast is a successful community event that recognizes the high quality recreational resources in the area.Photo source:
12-31-
1Preliminary Consortium Draft December
brush slopes where elk winter, fields punctuated by cottonwoods where streams wind through, the wide- street village, and willowy wetlands pastures.
Currently there is a large in-migration to the City of Victor. There are large numbers of people moving into the city from many different locations. This is having the net effect of rapidly diversifying the population.
Housing has become an issue in some parts of the city as the availability of affordable housing for agricultural and service industry workers has been limited. Several agencies have been watching the situation and are currently poised to assist communities that have documented housing deficiencies. Currently there appears to be an abundant supply of single family housing lots in the city.
There is a growing concern in the city about the unavailability of high paying technical jobs. Many of the labor force in the City of Victor that increase their skills through formal education are forced to a locationoutside the community to find employment. Families feel like they are exporting their children to far away job markets due to a limited professional job market in the county.
Economic development professionals are working to attract new and to grow existing companies in Victor and the rest of the county that will pay a living wage and allow our local market to take advantage of these highly trained individuals.(Victor Comprehensive Plan)
St. Anthony
St. Anthony is a city in and the county seat of Fremont County, Idaho. The population was 3,542 at the 2010 census, up from 3,342 in 2000. There were 1,118 households, and 857 families residing in the city. Housingin St. Anthony is influenced by Brigham Young University-Idaho (BYU-I) in Rexburg. Housing vacancies are highest in the St. Anthony area during the summer months because of decreased student enrollment at BYU-I. According to property managers, rents may increase in the St. Anthony area during
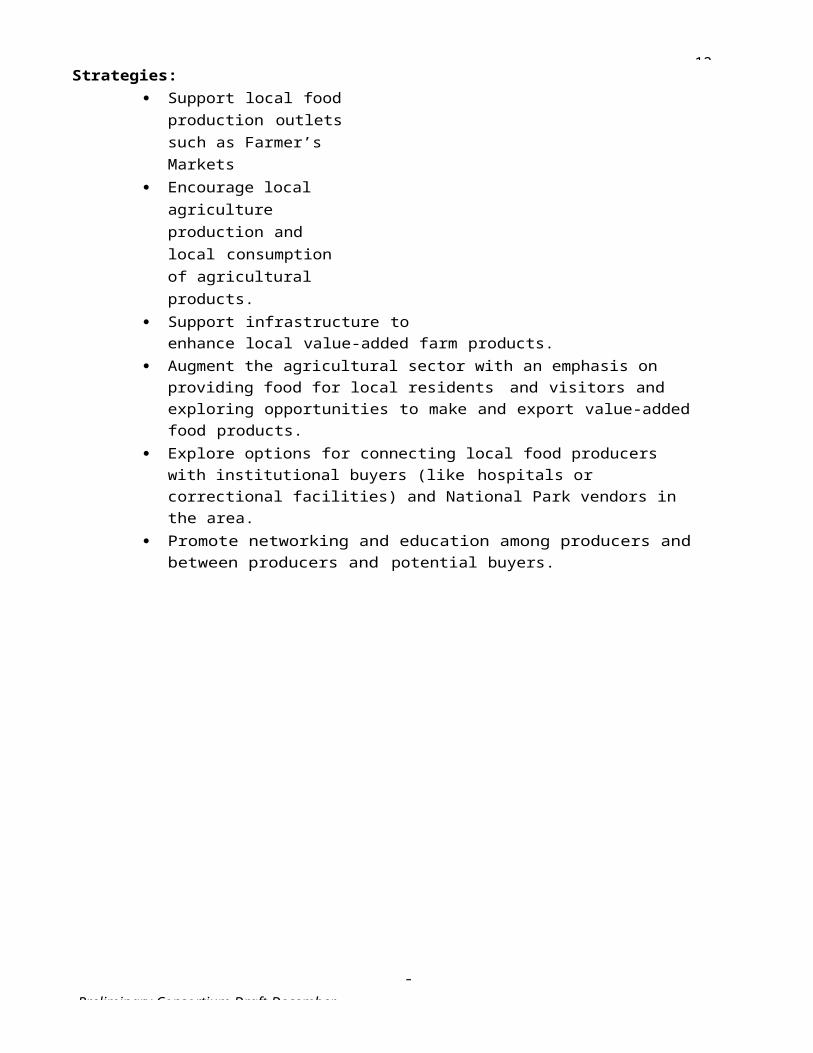
American Dog Derby – Ashton
The Oldest All-American Dog Sled Race
This historic dog sled race runs from Ashton, Idaho to Cascade Corner of Yellowstone Park. It is an exciting winter experience with events for mushers, spectators, and dogs of all sizes.Photo source:
12-31-
1Preliminary Consortium Draft December
the coming year. One hundred seventy (170) households spend more than 30 percent of their income on their housing payment, which is the same number that indicated it was very difficult to find affordable housing that met their needs. Overcrowding is more common with 80 households being overcrowded, which likely stems from the high percentage of households with children. Commuting out of county for work is very common; 680 households include at least one employee who commutes to work in another county. Most out commuters would rather live in Fremont County than in the county where they work, yet 190 households would rather live in a different county, mostly Madison. (Housing Needs Assessment)
The Henry's Fork Greenway has been a successful community effort in St. Anthony. The greenway has two parts, North and South. The north trail entrance is located near River View Cemetery. The south trail entrance is located near the north side of the State Highway 20 overpass. Both trails follow the Henry's Fork of the Snake River. They feature paved trails, biking, hiking, wildlife viewing, and access to the river for fishing. In the winter, the trails can be used for cross country skiing. Many local organizations come together annually to clean and repair the trails. Funding for the projects has come from the City of St.Anthony, private donations, and grants. Currently, two local clubs are organizing fund raisers to improve the south trail. They are planning to erect a historic log cabin replica, a stable, and a statue of a local area mountain man named Andrew Henry. (St. Anthony Website)
A lot of planning is associated with the greenway and the pathways to get to it. The city is planning to complete a loop around the downtown area. The greenway is used year round. The community is now discussing adding a historical piece to the community in the Fun Farm Bridge in hopes that it can be developed as part of the Greenway system. [More needed on Sand Dunes use]
“We are the doorway to the Dunes” Resident quote.”
Ashton
The City of Ashton’s land use designations include commercial, residential, and industrial areas. The City of Ashton is predominantly developed with single-family housing within and near the core of the city and averaging about four dwelling units per acre. Larger parcels of land exist near the city or outside the city boundary line and are currently used for agricultural purposes.
12-31-
1Preliminary Consortium Draft December
Ashton’s population has fluctuated over the years. According to the 1960 U.S. Census, Ashton had an all-time high of 1,292. The population in 2000 was 1,129. The lowest recorded population occurred in 1994 at 1,085. The population change has not been drastic between census years. The City of Ashton’s population has remained relatively stable compared to other communities. Current number of households is approximately 395, with an average household size of 2.79.(Ashton Comprehensive Plan)
One of the main goals outlined for the City of Ashton is to use funds to sustain existing resources or tie into county resources. The city has recently reviewed its development code, primarily sewer and water regulations, to be less stringent in some places and more stringent in others. It is described as a tight community with small businesses and summer/winter recreation opportunities. Ashton recently completed a Main Street road diet to bring four lanes down to two lanes. This has helped to shape and identify the community.
“We don’t want to be 70 years old and still talking about potential. Ashton has been talking about the potential of the community for 34 years.” Quote from resident
City of Island Park
The City of Island Park is located in northern Fremont County, Idaho. The City was created in 1947 in response to the State of Idaho's changes in the liquor laws. With 286 permanent residents according to the 2010 census, the City of Island Park is the county's third largest city (St. Anthony and Ashton are larger). The City is 34.8 miles long and ranges from 1,000 feet to 5,000 feet in width. It encompasses just 6.77 square miles and 25 square miles in the Area of City Impact. Island Park residents proudly boast that their city has the “Longest Main Street in America.” Main Street has significant open space interspersed with lodges, motels, restaurants, lounges, convenience stores, gas stations, tackle shops and recreational vehicle rental businesses.
The city strives to preserve and improve the physical environment of the community as a setting for human activities so as to make it more functional, beautiful, decent, healthful, interesting, and a desirable place to live in, work in, and visit. The area boasts many recreational opportunities and is discussed in more detail in the recreation section of this document.

12-31-
1Preliminary Consortium Draft December
Small established cities that are not within the metropolitan areas of the distinctive cities, but have slightly larger populations than the agricultural communities are.• Driggs, population 1,657• Ashton, population 1,084• St. Anthony population 3,465• Victor population 1,938
1Preliminary Consortium Draft December
Habitat for Humanity
The Idaho Falls affiliate of Habitat for Humanity received a $1.4 million gift from the estate of an Ashton-area farm family for use in the region.Fremont County is the top priority as specified by the donor. Significant improvements have been made to one Ashton home and another home is under construction.
12-31-
Themes and Strategies
Theme 1. Promote managed growth and a healthy economy through investments in town centers.
Rural character is essential to maintaining the distinctive identity of the region. Communities in the region strive for vibrant economies while protecting their natural heritage and community character. The RPSD includes funding to develop an integrated model code template that will implement the sustainability intents articulated by the participating communities. Funding allows for a pilot demonstration of the template with Teton County, Idaho, and the cities of Driggs and Victor serving as the model. The project seeks to prepare new development codes that emphasize mixed-use, compact, and pedestrian friendly city-focused development and best sustainability practices.
Code Studio is working with the communities on the preparation of these updated regulations/code for the cities of Victor and Driggs under a Sustainable Communities Regional Planning Grant from the US Department of Housing and Urban Development.
Strategies: Continue to revitalize our downtowns
and create the appropriate environment and locations for new office and commercial businesses.
Promote walkability in downtown environments by improving the ability to access employment, shopping, and services through walking and biking.
Seek dedicated funding sources for downtowns to support higher level of amenities.
Encourage new development in close proximity to downtowns and rural towncenters to promote vibrant walkable areas and where infrastructure, including central water and sewer, can be provided more efficiently.
Promote infill and development activity using incentives, regulations and code within existing boundaries of downtowns and rural town centers.
Encourage development and densities that are consistent with community character and the preservation of historic building and cultural landmarks.
Encourage downtown zoning that promotes flexibility, density, mixed-use and walkability Provide zoning, regulations and incentives to attract businesses to the area that
target the local, tourism and online markets. Encourage civic buildings to be located in town centers to stimulate economic
development.

The Teton Geotourism Center in Driggs is a tourist destination.
Geotourism is a growing category of travel developed by National Geographic, offering the traveler an ability to experience the culture, heritage, food, art, geology, and music of an area.
12-31-
1Preliminary Consortium Draft December
Encourage higher residential densities to locate in close proximity to downtown to support local businesses.
Coordinate regional marketing campaigns with a focus on local business and small towns.
Consider the establishment of a regional economic development coordinator to promote the economic development in the area.
Actively pursue dedicated funding sources through general funds, establishment of downtown development districts and special districts.
Pursue grant opportunities including participating in state and national Main Street Programs.
Theme 2: Employ economic development strategiesthat support entrepreneurs, create living-wage jobs, and strengthen each city’s overall business climate.
Strategies: Support new forms of businesses that allow our citizens to work in the place they live
including live-work opportunities, technology centers, co-location, resource-sharing arrangements, and home businesses.
Foster a community culture that appreciates and supports entrepreneurs Actively assist existing business owners in their efforts to sustain and expand Inventory and make available a range of business planning and financial assistance tools Improve regional networks among businesses and build bridges with local, state and
federal business-support programs Institute regional and local programs targeted at youth, including mentoring, internship
and apprenticeship programs Establish industrial arts hubs and shared workspaces to inspire innovation and support
creative, business activities in even the smallest cities Cooperate with regional and statewide business recruitment programs to leverage their
resources and increase their awareness of Teton View community offerings
Theme 3: Encourage the development and support of high-quality education and community enrichment activities for all ages.
Strategies: Work with school districts, private schools, and non-profit organizations to
identify funding for expansion and development of education programs.
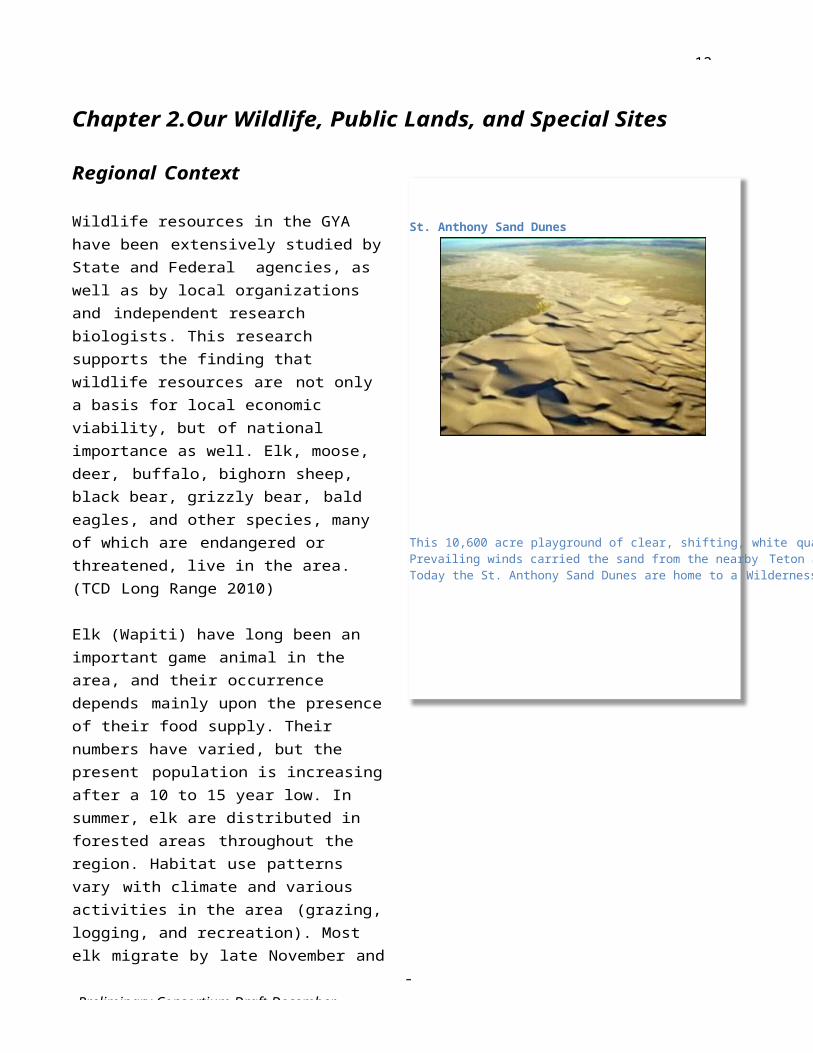
12-31-
1Preliminary Consortium Draft December
Encourage the siting of new schools near existing neighborhood centers to promote walkability.
Develop new educational programs, both online and within our communities that allow additional access to secondary education.
Support the construction of a multi-use recreation facility or network of facilities. Encourage expansion and evolution of community libraries as local community
centers, centers for education and technology, meeting spaces and business centers.
Theme 4: Provide access to affordable and suitable housing and create additional diversity in the housing supply in appropriate, sustainable areas.
It is important that housing efforts be coordinated within the region. Comprehensive plans adopted by communities call for adequate and high quality housing that meets the full range of residents needs with variety in unit type and choice. The City of Rexburg and Madison County recognize the impacts of BYU-I and seek to ensure that housing for employees and seniors is provided within existing neighborhoods and in new developments planned using EPA Smart Growth Principles as a guide. Housing for the workforce in Teton Valley has recently decreasedin supply, is too expensive for many households to afford, is increasing in price, and has not been keeping up with growth in demand. The cities of Driggs and Victor combined are home to just over one-third of Teton Valley households.
Strategies: Support programs that help households with disabilities afford needed renovations. Expand the first-right of refusal purchase regulations for tenants residing in converted
apartments and renovation programs/assistance. Ensure housing for all generations by allowing codes that encourage the retrofitting of
older homes for families and seniors. Continue to encourage collaboration between non-profit housing agencies, government
housing agencies, and employers to develop housing in the communities in which our residents live.
Consider methods to improve the condition and livability of existing homes through grant programs that improve their condition.
Preserve the affordability of key homes in the area through the placement of restrictions, buy-down assistance, and subdivision of lots in some areas within town.
Continue to encourage collaboration among non-profit housing agencies, government housing agencies, and employers to develop housing in the communities.
12-31-
1Preliminary Consortium Draft December
Work with communities such as Jackson and Rexburg to create housing authority affiliates to support lower income families.
Theme 5: Provide quality public services to residents, businesses, and institutions.
Strategies: Integrate public services, utilities and facilities into the fabric of neighborhoods so as to
create a pleasing visual appearance. Encourage undergrounding distribution utility lines where feasible. When possible, manage the timing of residential development so that adequate streets,
water, sewer, drainage facilities, schools, broadband, and other essential services can be economically provided.
Maintain good quality water to meet the present and future domestic, commercial, municipal and industrial water use needs.
Encourage the sequencing of development projects to be built concurrently with infrastructure or services required by the development.
Participate and increase involvement in continued materials recovery discussions that occur on a regional basis.
Work with municipalities and public water systems to ensure safe and adequate drinking water. Preserve the quality of drinking water in the region. Upgraded systems and use of technologies and standards – centralized systems. Protect groundwater, discourage septic. Upgrade systems in Island Park with regard to recreation communities (add to rec section)
Work with municipalities and public water systems to ensure safe and adequate drinking water.
Ensure adequate wastewater treatment. Maintain, protect, and enhance the quality of surface and ground water resources.
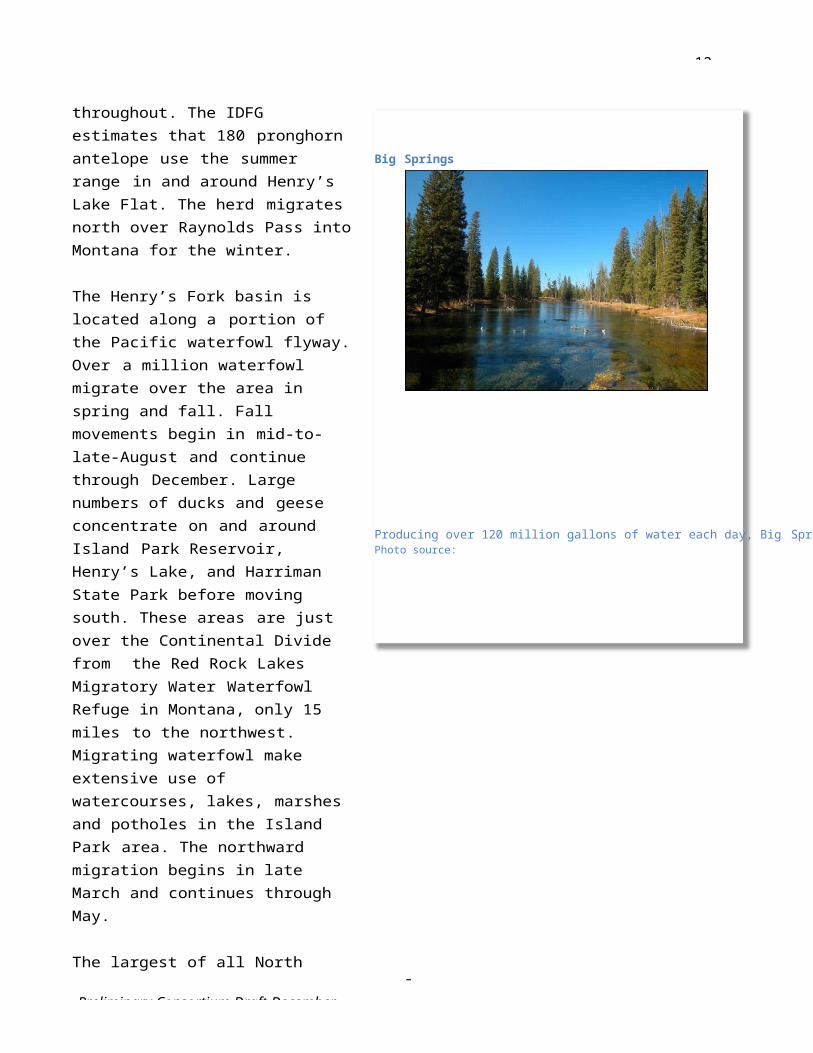
12-31-
1Preliminary Consortium Draft December
Key Indicators
The following indicators from “Our Distinctive Major Cities” also apply to “Our Small Cities:”
Employment Diversity Development in City Centers Roadway Connectivity Index Commute Time
Housing Cost BurdenThis indicator measures the percentage of the population spending 30 percent of their
income or more on housing.
WhyHousing access and affordability is tied to both income (ability to make a living wage) and housing costs themselves. Housing costs typically include rent or mortgage payments, utilities, insurance, and other maintenance and upkeep costs. When households spend more than 30 percent of their income on housing costs, the US Department of Housing and Urban Development (HUD) considers these households as “cost-burdened,” meaning that their housing costs limit their ability to spend income on other items such as food and transportation.
The availability of housing that is not burdensome in terms of costs is important in retaining and attracting employees and employers. If housing at reasonable costs is not available within communities where employees work, often times they will drive longer distances to find more affordable housing.
Factors such as second homeownership and vacancy rates can influence the housing costs in the region. Low vacancy rates mean that housing is in high demand, and few options exist for housing choice.Likewise, vacation or second homes purchased by nonresidents can lead to inflated purchase prices. Since many of these second homes sit unoccupied for large portions of the year, they can decrease opportunities for full-time residents to own or purchase a home.
Units of MeasureThis indicator is measured as a percentage of owner and renter households spending 30 percent or more of their income on housing costs.
Increasing values could suggest that residents are spending more of their incomes on housing costs due to increasing rental or owner housing prices. Decreasing values could suggest that housing costs are decreasing or that incomes are increasing more than housing costs.
SourceData for this indicator is available from the American Fact Finder website provided by the US Census Bureau: htt p: //fac tfin de r2.c ensus .gov . Data is available by county, through the American Community Survey estimates of housing characteristics, within the “selected monthly owner costs as a percentage
12-31-
1Preliminary Consortium Draft December
of household income (SMOCAPI)” and “gross rent as a percentage of household income (GRAPI)” category.
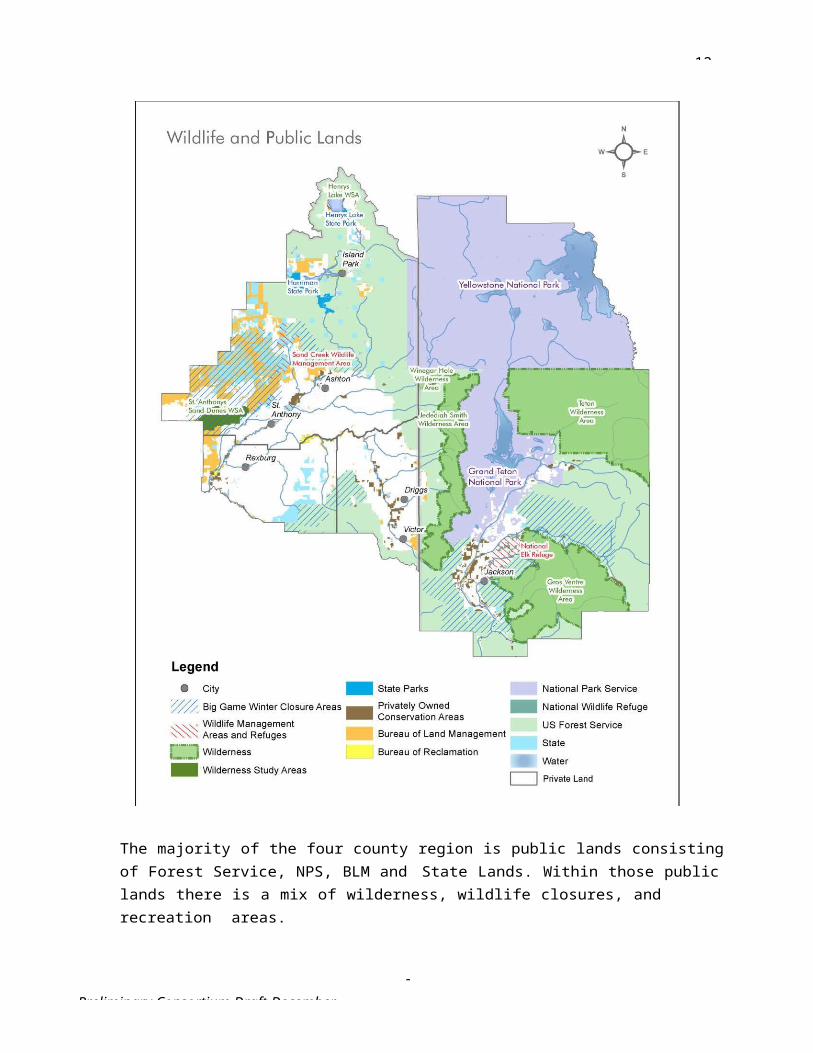
12-31-
1Preliminary Consortium Draft December
Educational AttainmentThis indicator measures the percentage of the population attaining different levels of education
WhyEducational attainment reflects the availability and quality of educational facilities and programs in the region. Students who have to travel long distances may be less likely to attend school or pursue higher levels of education, but the increasing availability of online and distance-learning curriculum has potential to open up new opportunities for remote areas.
Economic development potential and job opportunities are also greatly influenced by educational attainment. Employers typically want to ensure that the skills of the local population align with the jobs offered. Similarly, employment opportunities for residents greatly depends on their education and skill levels.
In tourism-based economies, it is not uncommon for there to be a mismatch between education attainment and the types of jobs available. In many cases, people with higher levels of educational attainment move to resort and tourism-focused communities due to the high quality of life and access to nature and recreation, and then look for job opportunities upon arrival. In such resort and tourism- focused communities, available jobs tend to be in the retail and services sectors, which often require less education than the job seekers possess. This “underemployment” can create many challenges, such as employee turnover and affordability of housing.
Units of MeasureThis indicator is measured as a percentage of the population with a high school degree or higher and the percentage of the population with a bachelor’s degree or higher.
Increasing values could suggest that residents have increasing levels of educational attainment or opportunities for education. Decreasing values could suggest that opportunities for education are limited, not a priority for the population, or that jobs are available in the region that do not require a high school or bachelor’s degree.
SourceData for this indicator is available from the American Fact Finder website provided by the US Census Bureau: htt p: //fac tfin de r2.c ensus .gov . Data is available by county, through the American Community Survey estimates of educational attainment.
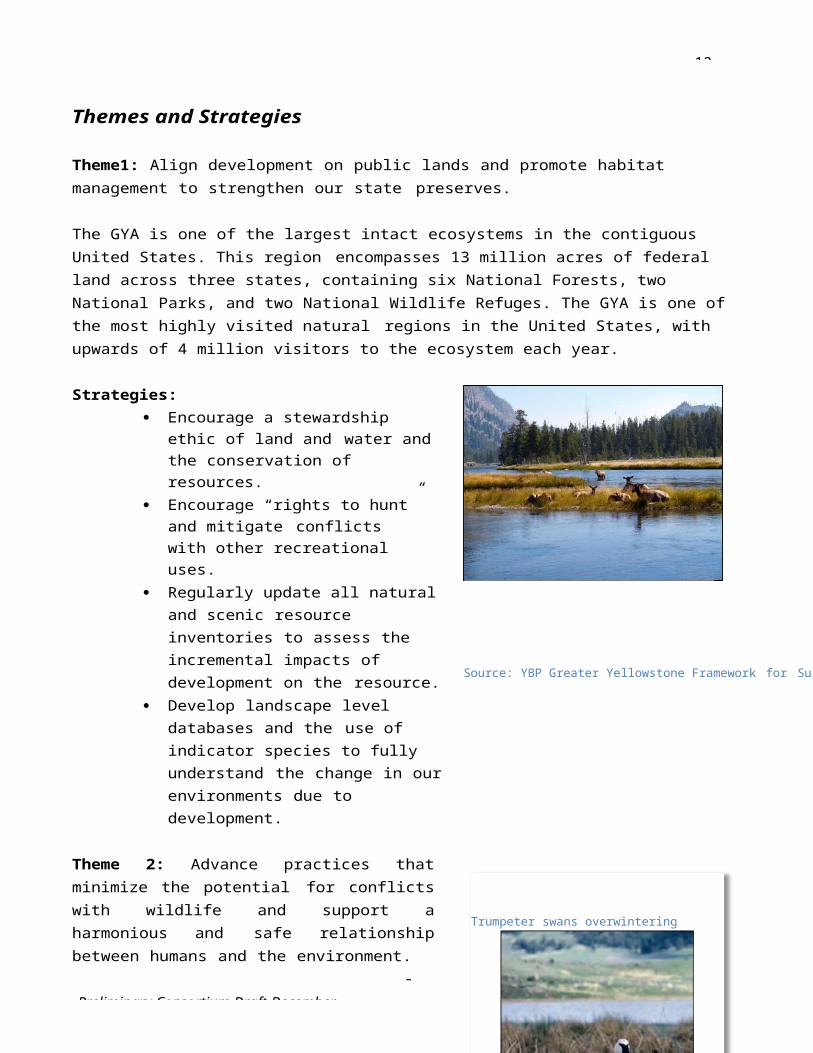
Jackson, Victor and Driggs All Move to Complete Streets
The City of Victor collaborated closely with the Idaho Transportation Department (ITD) to a redesign the intersection of Hwy 33 and Hwy 31 to better reflect the community’s vision using the complete street concept.Complete Streets are streets for everyone. They are designed and operated to enable safe access for all users, including pedestrians, bicyclists, motorists and transit riders of all ages and abilities. Complete Streets make it easy to cross the street, walk to shops, and bicycle to work. They allow buses to run on time and make it safe for people to walk to and from transit stations. In the GYA, complete streets must also be catered to the local environment, which can make a “complete street” in the region distinctive from others across the country.Photo source: Victor Complete Streets Presentation, Brittany Skelton
12-31-
1Preliminary Consortium Draft December
Chapter 6. Vital Connections
Regional Context
Modern public transportation, utility and telecommunication networks are among the critical infrastructure needed to retain our residents and attract new businesses to the Teton Region. Quality health care and educational facilities will become assets to the entire region if telemedicine, mobile integrated health care, and online learning sites can be accommodated on higher-capacity fiber networks. A systems approach is needed to ensure that public services and infrastructure can reach those in the most remote corners of our four counties.
There are a number of regional travel destinations beyond their home cities that residents access for business, shopping, medical services, education and culture, community services and outdoor recreation. A regional public transportation network that would serve residents as well as visitors could be a cost-efficient way to connect the major resorts and national parks through and beyond this four-county region. Students, senior citizens, disabled populations and international visitors are all potential riders who could support an integrated public transit system built on resident and commuter needs.
A multi-modal transportation assessment and development strategy was prepared as part of the 3-year HUD Grant. Its emphasis is on developing a multi-agency strategy for improving mobility across the 4-county region, whether by foot, bike, car or bus. The proposed strategy outlines three separate initiatives that together lay the foundations foran integrated transportation plan that can be implemented individually by local, state and federal
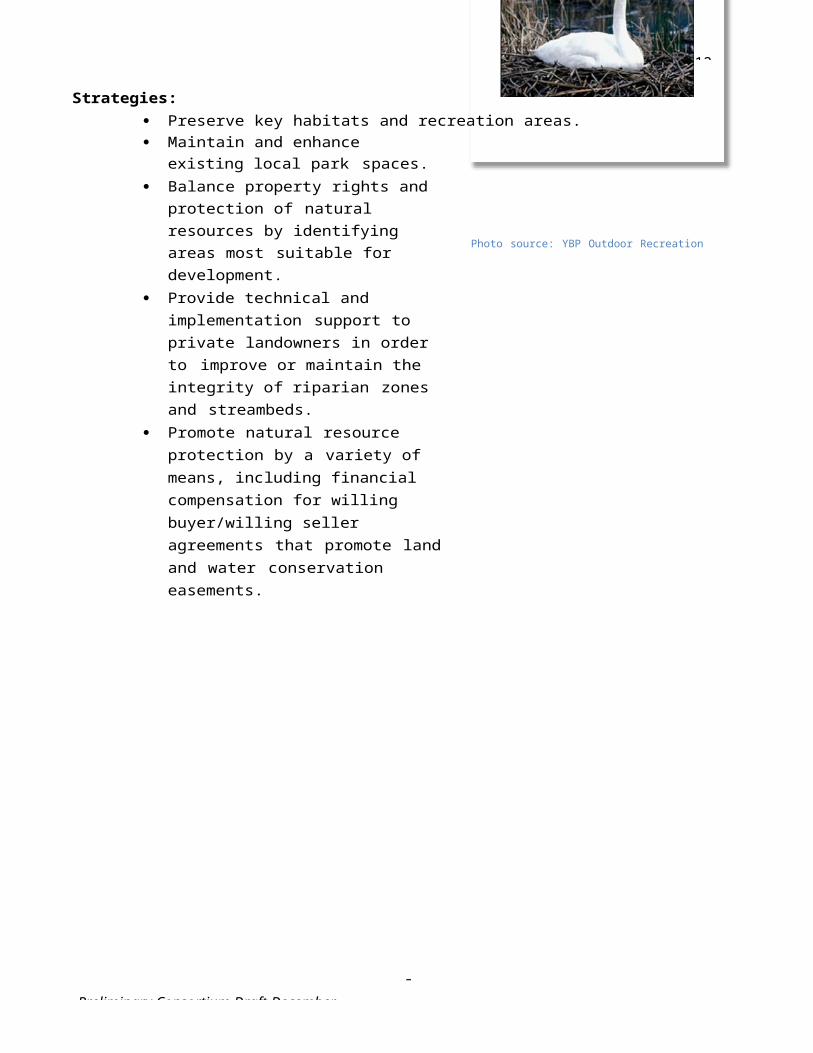
12-31-
1Preliminary Consortium Draft December
governments since no regional transportation entity currently exists.
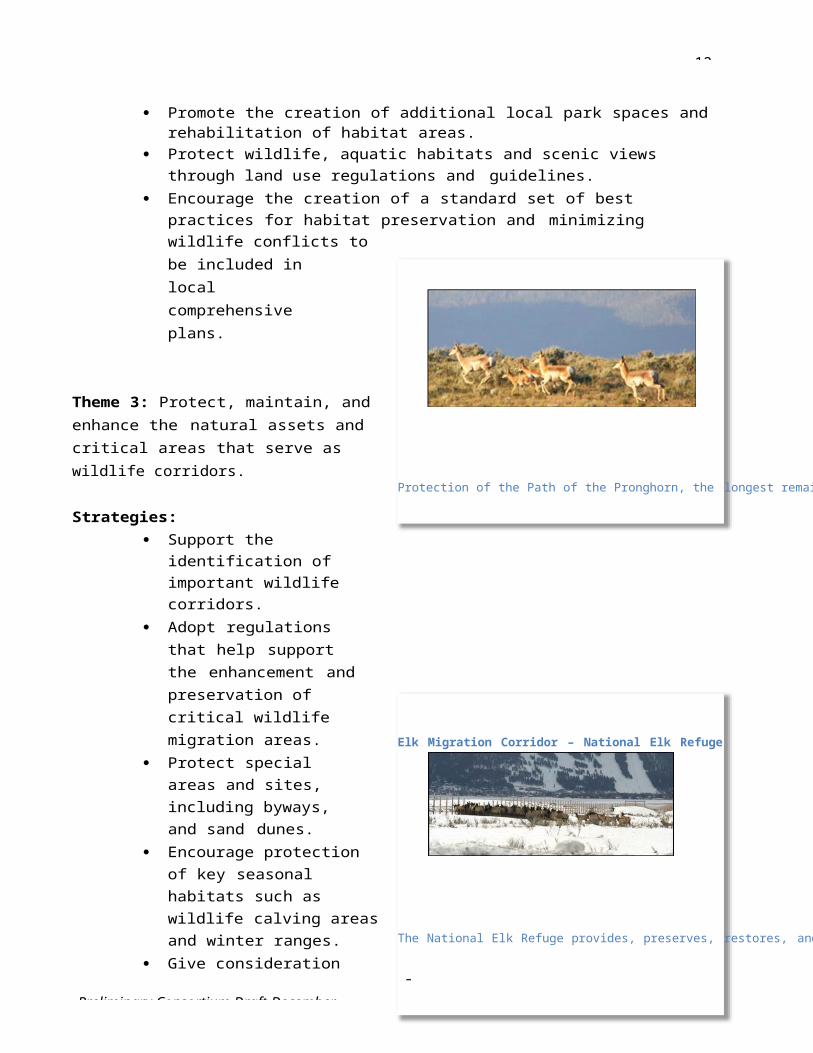
12-31-
1Preliminary Consortium Draft December
A Regional Broadband Study was another HUD-funded study conducted by the City of Rexburg to evaluate what improvements could be made in Internet speed and connectivity. The broadband study includes recommendations for expanding services in Rexburg and potentially adding strategic links between municipalities. A broadband initiative also would be a key component of many communities’ economic development strategies. Options for governance of a regional broadband system include the following:
• Regional Partnership – an independent entity formed by interested municipalities.• Public/Private Partnership – one private sector company partners with localities.• Broadband Cooperative – similar to electric co-ops in the region where the business is
owned by customers who purchase the services.(Broadband Study)
An assessment of alternative energy sources suited to this landscape and climate was also conducted as part of the RPSD process.
Hydropower has been the electric generator of choice in the Henry’s Fork basin as it has for the state of Idaho. The basin contains active hydroelectric generating plants, as well as projects that are actively being pursued. Significant barriers to traditional hydropower development exist as federal law prohibits new projects on the Henry’s Fork River. Additionally, minimum stream flows are in place on Warm River, Teton River, Bitch Creek, and the Henry’s Fork. (Henry’s Fork Basin Plan).
12-31-
1Preliminary Consortium Draft December
Themes and Strategies
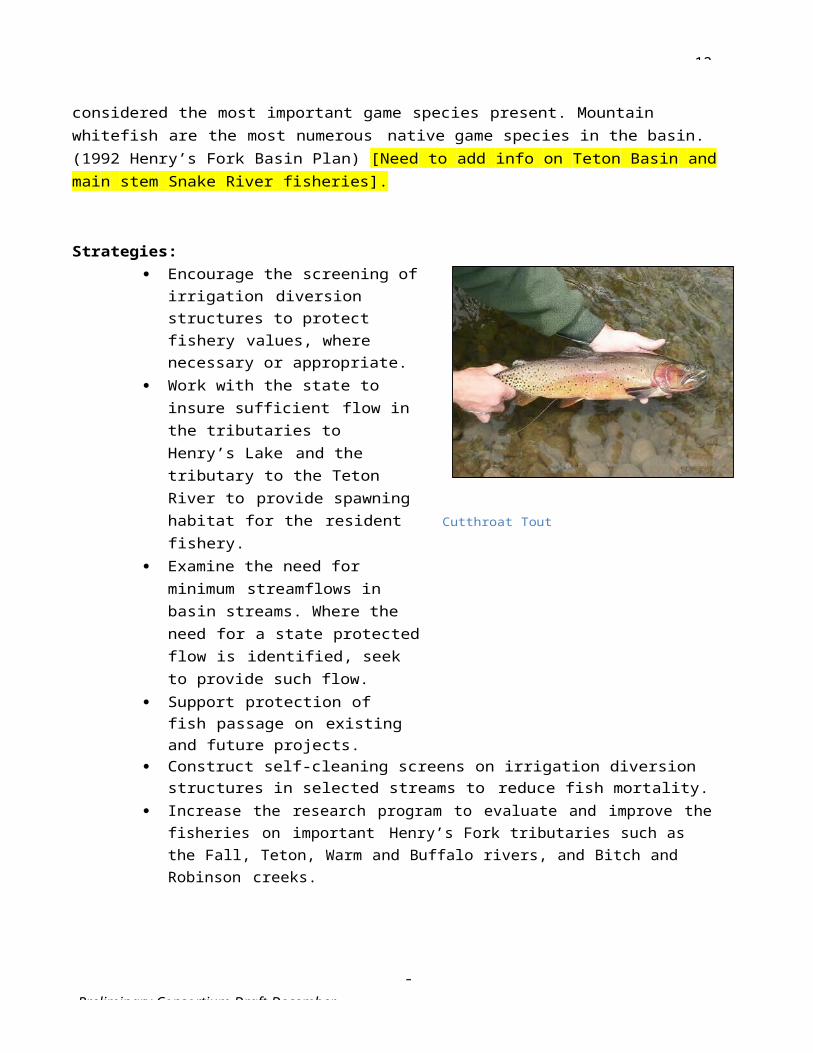
1Preliminary Consortium Draft December
The START bus system in Jackson and Teton County, Wyoming, is the largest public transportation system in the region and provides seasonal transportation to recreation areas. The Integrated Transportation Plan seeks to reduce the use of the automobile by decreasing transit headway times, improving regional transit connections, providing connections to recreational destinations, considering the use of managed lanes, and expanding hours to better serve the workforce.
12-31-
Theme 1: Create and maintain safe, well-connected, multimodal transportation throughout our region.
The multi-modal assessment was prepared with an emphasis on developing a multi-agency strategy for improving mobility across the 4-county region. The proposed strategy outlines three separate initiatives that together lay the foundation for an integrated transportation plan that can be implemented individually by local, state, and federal governments, but most effectively in coordination with one another. The initiatives are as follows:
An incremental approach to developing the region’s public transportation system.
An integrated, recreational trails network with Complete Streets policies for Western Greater Yellowstone.
Collaborative marketing of multi-modal transportation
(Multimodal Assessment)
A coordinated, connected transportation network can help accommodate the accessibility and mobility needs of residents, visitors, and businesses. Improvement in the connectivity of trails, roads, and transportation hubs will assist in the development of regional connections.
Strategies: Provide transportation infrastructure to allow the efficient movement of people and
goods by increasing connectivity and improving safety on our roadways. Integrate alternative modes of transportation as part of future roadway projects,
including transit and bicycles. Expand intercity and commuter bus services to improve connectivity between large city
centers and rural town centers. Advance an integrated public transportation network that links the region’s National
Parks and outdoor recreation areas to city centers, town centers, and transportation and aviation hubs.
Continually assess the existing bus service to ensure ridership is maximized and that the population has good transportation options.
Partner with private transportation operators (e.g. hotel and airport shuttles) to leverage transportation options for visitors and residents.
Explore and implement permanent funding opportunities for local and regional multimodal transportation as well as a larger Regional Transit Authority.
Creative Energies Solar Array in Jackson
Since 2000, Creative Energies has specialized in designing, engineering, and installing commercial and government renewable energy systems across the US. This represents a movement toward decentralized and independent energy systems.
12-31-
1Preliminary Consortium Draft December
Continue to develop a local and regional pathway system to connect all communities within the region to each other and adjacent recreational areas.
Promote development that is of adequate density and design to support the use of alternative modes, including transit.
Encourage pedestrian and bicycle facilities and infrastructure within and through all new developments.
Implement new initiatives to “complete our streets” by slowing traffic, adding crosswalks, widening sidewalks, including bike lanes, and, when appropriate, providing access to transit.
Plan transportation in a holistic fashion by connecting regional trail, transit, and pedestrian facilities.
Theme 2: Encourage development of distributed, small-scale renewable energy sources, and promote green energy purchasing by regional utilities.
Strategies: Encourage and incentivize
opportunities for neighborhood and employment projects that use state of the art construction techniques with energy efficient/renewable technologies.
Encourage and incentivize the use of alternative energy sources to improve our resiliency.
Encourage building types, features, and low impact storm water designsthat reduce our per capita culinary and irrigation water use.
Theme 3: Implement a regional broadband system to improve redundancy, bandwidth, and connectivity.
In 2000, there were an estimated 361 million internet users worldwide. By the end of 2011, that number had grown to 2.2 billion users. This represents a 528.1 percent increase, or 1.8 billion new users in less than 12 years. Almost a third of the population worldwide is now online. (InternetWorldStats.com data)
When people talk about their internet connectivity, they are referring to performance, reliable and fast access to data, and uninterrupted streaming content.
From an economic development perspective, the region faces competitive threats from communities that have already begun making broadband infrastructure investments. Other regions, towns, and cities in Idaho, Wyoming, and elsewhere are already building and operating high performance, low cost fiber
12-31-
1Preliminary Consortium Draft December
networks for public and private benefit. Reliable and fast internet connectivity is important for attracting the growing number of professionals who are able to work from anywhere, and who chose to live and work in a place with high quality-of-life and abundant recreation opportunities. This helps bring money from outside of the region into the region and grow the local economy. (Broadband Study)
Strategies: Encourage public/private partnerships among local governments, service providers,
schools, public safety agencies, water authorities, major businesses, and health care institutions to assist with attracting businesses lowering telecom costs for all partners.
Create new business opportunities for existing private service providers by allowing public entities to provide only basic infrastructure and transport.
Target investments in broadband to promote business growth and job creation. Choose an approach that reduces the cost of telecom services for local governments
and businesses, while simultaneously improving service delivery through a shared regional network.
Develop a colocation facility and data center for the various public and private fiber and wireless networks to reduce costs by aggregating demand, facilitating additional diverse path routing, and providing off-site data storage for local businesses and institutions.
Theme 4: Provide the necessary level of service and meet or exceed national standards to ensure that public health and safety are ensured.
Strategies: Adopt new regulations, ordinances and codes to prevent the unwarranted establishment
of hazardous uses in our communities without appropriate and effective mitigation. Direct development away from naturally hazardous areas or, where feasible, require
site planning or construction techniques to mitigate the hazard. Identify high fire prone areas and minimize risks through thoughtful site selection
and vegetation management Continue participation in the National Flood Insurance Program to allow local residents
potentially affected by flooding to purchase insurance, while supplementing policies to require the protection of stream corridors, discouraging development within the 100 year floodplain, and providing construction standards for any development that is permitted within floodplains.
Encourage adoption of the most recent International Building Code regulations to ensure that new and remodeled structures will survive potential ground shaking events and meet a consistent regional standard.
Create a greater efficiency through the use of technology for emergency response, fire, and other public services.
Encourage the development of tele-medicine programs in local and regional hospitals and employ mobile integrated health care approaches for the most rural counties
Key Indicators
12-31-
1Preliminary Consortium Draft December
Regional Transit ConnectivityThis indicator measures the transit service provided within the region.
WhyThe region’s communities are interconnected with residents and visitors frequently traveling throughout the region to access housing, jobs, services, and recreation. Most of these trips are made in personal automobiles, but regional transit service is in high demand.
Regional transit service allows residents and visitors to spend less of their time and money on driving, and also enables non-drivers to travel throughout the region. Moreover, transit service helps reduce the strain on the region’s infrastructure and environment caused by an abundance of personal automobiles and frequent trips.
Direct routes that connect major destinations are one element of a successful regional transit system. Additionally, the frequency of service is another element that factors into transit system success. Not only do people need to be connected to the locations that they wish to reach, but they need to be able to do so at reasonable times throughout the day, week, and year. Some routes may be most successful with seasonal variations to accommodate changing visitor and employee needs, whereas others may need to be fixed schedules with higher frequencies at peak periods.
Units of MeasureThis indicator is measured in total service miles, which is calculated by multiplying total miles of regional/intra-city transit service routes by the total number of service trips per 24 hour period.
Increasing values for this indicator could mean that the number or length of regional transit routes is expanding or that the frequency of service is increasing. Decreasing values could mean that the number or length of routes was reduced, or that the frequency of service declined.
SourceData for this indicator is available from regional transit providers, including Southern Teton Area Rapid Transit (START, see: htt p: //w ww .startb us.c om/ ) and Targhee Regional Public Transportation Authority (TRPTA, see http://w ww .trpta.org/ ).
12-31-
Broadband ConnectivityThis indicator measures the broadband availability in each
1Preliminary Consortium Draft December
WhyIntegration of and access to broadband and information technology is important for economic growth and regional communications purposes. Not only is access to broadband internet service (wireless or wireline) significant, but so are the connection speeds and technologies used.
Broadband connectivity is especially important at community anchors, such as schools, colleges, libraries, and government facilities. It is also an important consideration in many businesses and industries, including health care, public safety, transportation, and logistics. Household broadband connectivity is becoming increasingly important as well, especially household with school-age children and home-based businesses.
Because of the regional nature of the Western Greater Yellowstone economy, coordination between providers and across technologies is necessary to ensure that broadband gaps or complications do not exist due to jurisdictional boundaries.
Units of MeasureThis indicator is measured as a percent of the population within each county with broadband download speed of at least 25 megabytes per second (Mbps). According to the National Broadband Map, a speed of 25 Mbps, a typical consumer download experience would be:
Book (1 MB in size) - 0.2 seconds Song (4 MB in size) - 0.6 seconds Movie (6144 MB in size) - 16 minutes
As of December 31, 2013, approximately 83.8 percent of the country has access to download speeds of at least 25 Mbps.
Increasing values for this indicator suggest investment in and increased access to broadband infrastructure. Decreasing values would suggest reduction in service availability or possibly shifts to other emerging technologies.
SourceData for this indicator is available from the National Broadband Map (see: http://w ww .broadbandmap.gov/ ). Download speeds county are available by selecting “Analyze the Data” and then “Summarize: View Statistics about My Community.” Next, select the geography “County,” select the appropriate state, and then type the desired county name for analysis.
12-31-
1Preliminary Consortium Draft December
Wildland Urban Interface DevelopmentThis indicator measures development located in forested or defined Wildland Urban Interface (WUI) areas.
WhyThe wildland-urban interface, or WUI, is any area where human-made improvements are built close to, or within, natural terrain and flammable vegetation, and where high potential for wildland fire exists.36 Wildfires are a natural part of the region’s ecosystems and help restore and maintain healthy forests.
Development activity in the WUI presents risks due to the potential for wildfire. This indicator measures how much development has occurred in the WUI. While the majority of the WUI in the region is undeveloped, significant costs arise from protecting structures in WUI areas when wildfires occur.
While efforts to establish defensible space around existing structures in the WUI are helpful in reducing potential losses due to wildfire, proactive planning and policies limiting new development in WUI areas may present greater benefits in terms of reducing future firefighting costs.
Units of MeasureThis indicator is measured as a percentage of the defined Wildland Urban Interface area that is developed. According to Headwaters Economics, “across the West, 84 percent of the WUI is currently undeveloped.”
Increasing values for this indicator could mean that development is occurring within the WUI, placing homes and businesses at greater risk of wildfire potential. Decreasing values for this indicator could suggest that structures have been removed from the WUI, or that the WUI was redefined to encompass a smaller area.
SourceData for this indicator is available from municipal and county GIS records and fire mitigation plans. It is calculated by determining the total estimated developed area within the WUI and dividing that by the entire WUI area.
Estimated county-level data is also available as an interactive map from Headwater Economics (see: http://headwatersecono mic s.org/interac ti ve/w ui -de vel opment-and- wildfire - c osts ).

12-31-
1Preliminary Consortium Draft December
36 Colorado State Forest Service.
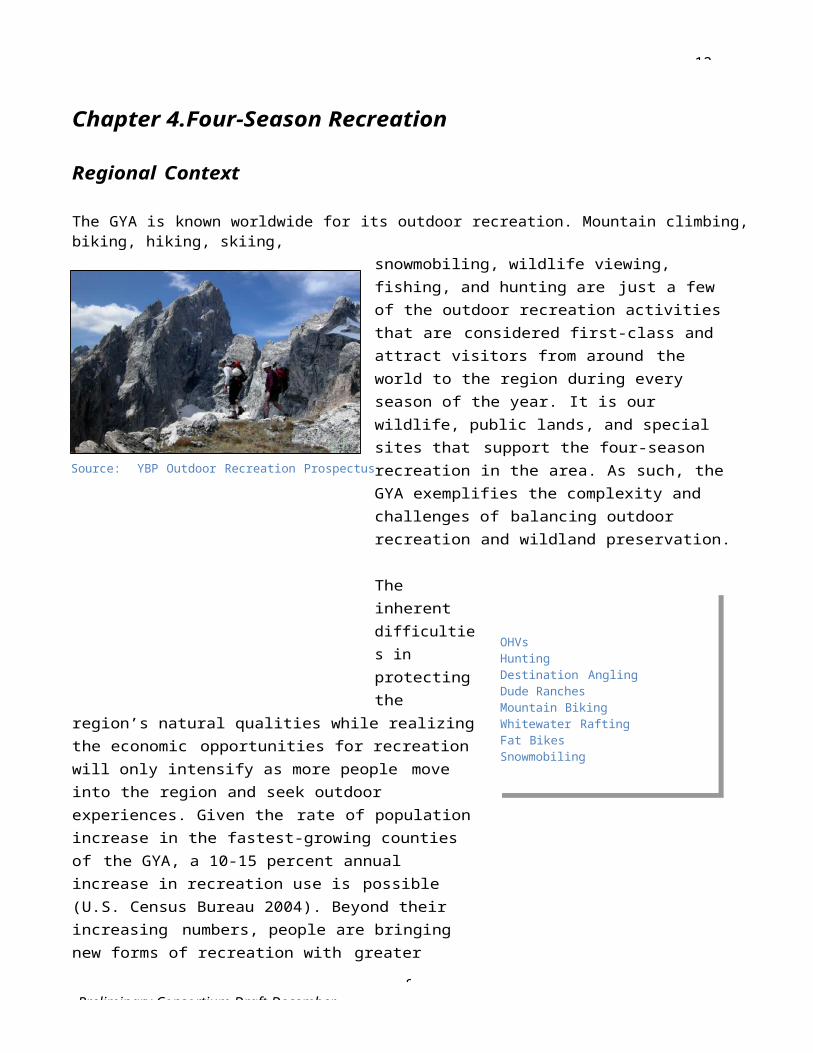
12-31-
1Preliminary Consortium Draft December
SECTION V. REGIONAL INITIATIVES AND COMMUNITY PROJECTSProposed projects largely have come through HUD-funded studies and technical assistance projects. Overviews of each project are being developed that will be posted as they are completed. Consortium members are being asked to add to this list. The list below does not yet include recommendations from the Final Regional Analysis of Impediments (RAI) and other studies that will be finished in January.
A. Roots & Resilience – Agricultural Heritage Regional Initiative
Model Development CodeLocal Food Infrastructure Project (Livestock Processing/Commercial Kitchen)
- REDIFiT grants/loans for integrating rural freight transportation-Intermodal Commerce Authority Local Foods Cooperative for product aggregation, distribution & marketing (e.g. Country Natural Beef) Value-Added AgricultureAquifer Recharge projects Soil Health InitiativeNew Crop Assessments Cooperative Weed Management
Community-Scale Projects:Food Equity ProjectsFarmer’s Market Coordination
B. Wonders & Wildlife – Public Lands and Resources Regional Initiative
Model Development CodeHenry’s Fork Legacy Project – Private land conservation to benefit wildlife
- Migration Corridor protection- Under/Over-road crossings
Increased Wildlife Viewing Opportunities (F)- Network of regional outdoor learning centers- More Watchable Wildlife designations
GYCC Ecosystem Health Projects for 2015- Aquatic Invasive Species- Terrestrial Invasive Species- Whitebark Pine- Wildlife- Water Quality and Flow- Climate Change Adaptation
Implementation of State Wildlife Action Plans
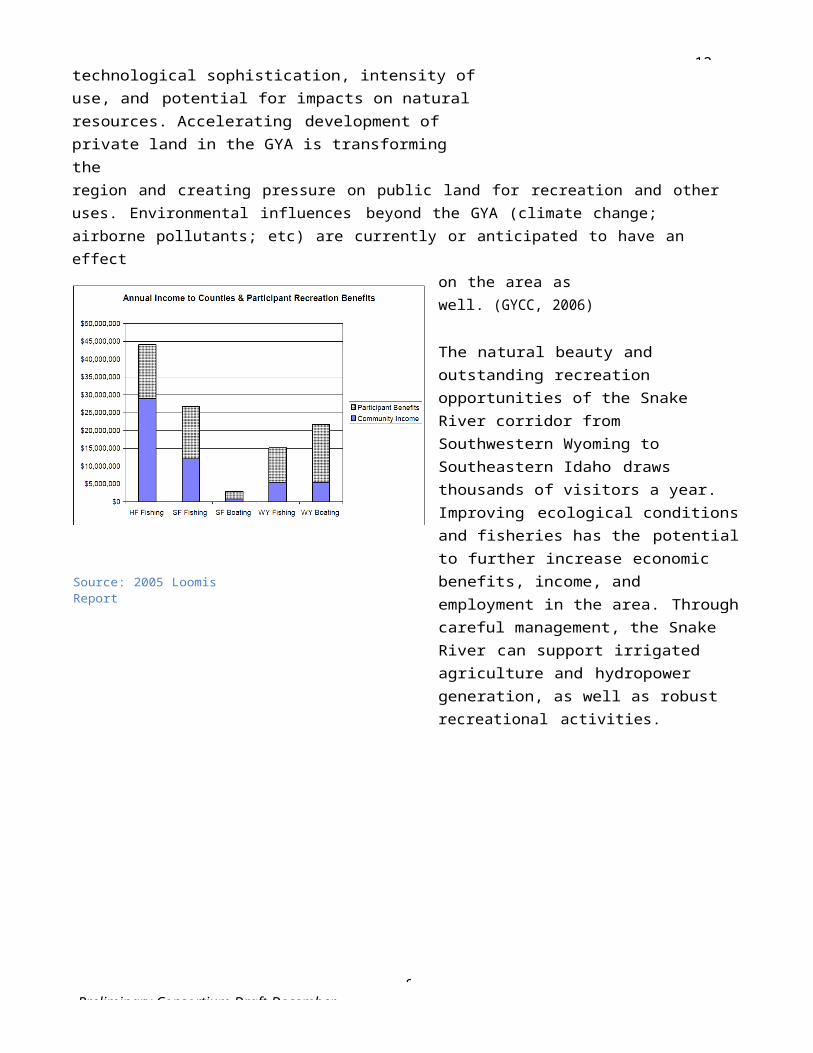
12-31-
1Preliminary Consortium Draft December
- Idaho- Wyoming
12-31-
1Preliminary Consortium Draft December
Individual Park- or Forest-Scale Projects:Wildland-Urban Interface/Sustainable Fire Community (Island Park) Yellowstone Park Transportation PlanLand Management Agency Sustainable Operations
- Alternative Fuels Feasibility Study
C. Adventures for All – Four-Season Recreation Regional Initiative
Develop a Region-Wide Trails Network- Greater Yellowstone Trail – Concept and Action Plan- Launch similar study for bike tourism along Hwy 20 corridor (IF-Rexburg-St. Anthony-Ashton)- Launch similar study for Rexburg-Driggs via national forest?- Coordinated trail mapping- Funding sources – e.g. bike stickers- Accessibility issues- Bike lanes and shoulders in all highway development/resurfacings/seam line attention
o Separate bike paths in congested areas
Four-Season Economic Development- Trail related accommodations; hospitality- Small-Scale Conference/Training Center(s) – EITC- Aligning with Federal Initiatives
BLM Vision: By increasing and improving collaboration with community networks of service providers, the BLM will help communities produce greater well-being and socioeconomic health and will deliver outstanding recreation experiences to visitors while sustaining the distinctive character of public lands recreation settings.
Agritourism Enterprises- Farm & Ranch Recreation Enterprises
Tourism/Recreation Marketing- Enhance Tourism Websites- Multi-modal travel packages in coordination with service providers- Scenic byway promotion
Group Tour and Guided Services Network (F)
Encourage/Accommodate New Technology/Trail Needs- Fat Bikes for Winter Recreation- UTVs
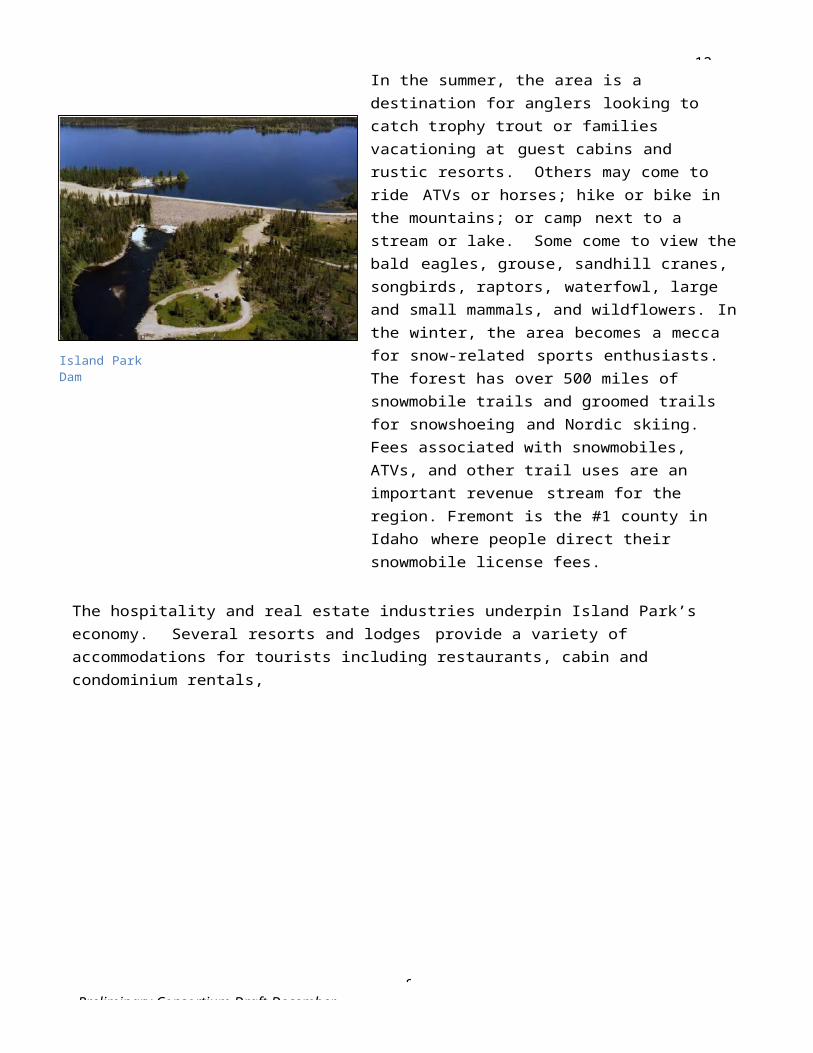
12-31-
1Preliminary Consortium Draft December
Integrated Public Transportation Linking the Region’s National Parks and Outdoor Recreation Areas (cite Buses for Byways)
- Coordination/cooperation with all concessioners- Funding support for connections to/from our national parks- Encourage recreational shuttle development/linkages and market with overall transit system- Survey as part of RPSD public outreach?- Seasonal Travel Pass or Discount Card
Community-Scale Projects:Seasonal Employee Housing (Island Park)/Zoned Densities Grand Targhee Resort – Employee HousingVisitor Information & Island Park Visitor Center (F)
D. Growing Pains – Distinctive Major Cities Regional Initiative
Institutional Capacity-Building for Housing Initiatives Financing Mechanisms for Meeting Housing Needs Rexburg-Jackson Workforce ConnectionModel Development Code (regulations, tools and incentives)
- Accessory Units- Group Home provisions- Zoned Density for Jackson- Zoned Density for Rexburg
Effective Leadership for Regional Recycling Infrastructure- Zero-Waste Resolution and Materials Recovery (Jackson)- University Recycling Program (Rexburg)
Open Access, Multi-Service Network – Wholesale Broadband Cooperative (Madison-Fremont) – page 32
Community-Scale Projects:Housing Programs and Projects
- Homeownership Priority in Rexburg- Senior Housing Needs in Rexburg- Community-Campus Coordination (Rexburg)- Addressing the Tight Rental Market in Jackson
Workforce contrasts – high unemployment among students not calculated – Madison County goes from 6.1% to 23.6% (2012). Jackson has high number of available jobs…too little housing… Job Sharing/transportation strategies?GY-Framework Certification for Teton County/Town of Jackson Joint Land Development Regulations Regional Public Transit Authority (Jackson Area) – Integrated Transportation Plan
- Support of START Bus funding
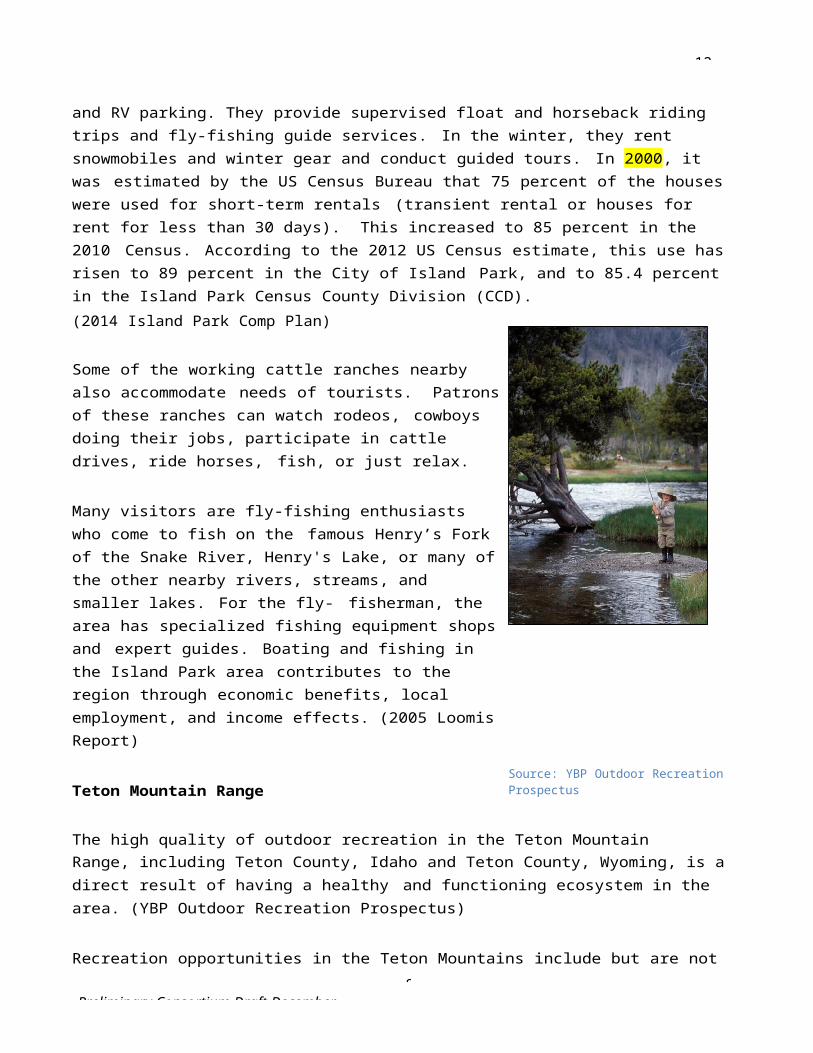
12-31-
1Preliminary Consortium Draft December
City of Rexburg Fixed-Route Transit System (Madison)- Walmart Transit Center/Park & Ride- CTAA Feasibility Study- WE Cars/Zip Cars with bike/ski racks to encourage for recreation use
E. Staying Put – Small Cities Regional Initiative
Neighborhood Revitalization with Habitat for Humanity- Affordable Housing Development- A Brush with Kindness (Paint the Town-type events)
Downtown Development and the National Main Street Program (F)- Adaptive Re-use of Historic Buildings- Apprenticeship and Training angles- Enterprise Hubs/Shared work and learn spaces
Business Recruitment and Supporting Entrepreneurs (St. Anthony-Ashton/Driggs-Victor)- Business Retention & Expansion Program- Nurturing Business Networks- Youth Programs – Entrepreneurship/Technology “Circuit Riders”- Fabrication Labs for Rec-Tech – Industrial Arts (Moran Center)
Walkability, Complete Streets and Wayfinding Improvements- Multi-Modal Hubs and regional transit coordination- Support of TVMAC; consider similar local govt coordination in Fremont- City and county specific recommendations in M2 plan – cite- Shotgun Rides
Adoption of Model/New Development Codes for Smaller Cities- Explore Region-Based Transferrable Development Rights- Group Home provisions- Zoned Densities for St. Anthony and Ashton- Zoned Densities for Driggs and Victor
Mobile Integrated Health Care Network (rural counties) – better equipping our clinics with the right personnel, good communication systems, equipment….
Community-Scale Projects:Henry’s Fork Greenway – Bridge and Trail Expansion – St. Anthony Home Weatherization/Rehabilitation – each city Financial/Downpayment Assistance (Ashton/St. Anthony)Senior Housing Expansion (Ashton/St. Anthony)
Senior RV Park for seasonal residents – S. Fremont
1Preliminary Consortium Draft December
12-31-
School Capacity Challenge (Driggs, Victor, Island Park) A Rental Renaissance (Driggs/Victor)
- Develop Rental Apartments- Encourage Deed-Restricted Accessory Rental Units
Affordable Housing for New Homeowners (Driggs/Victor)- Identify Suitable Land for New Multi-Family Housing- Enact Fee Waivers or Reduction for Affordable Housing- Develop Entry Level Homeownership Opportunities- Pursue Self-Help Housing
Transit-Oriented Development in Teton Valley (Driggs/Victor) Community Endowment for Fremont County (thru ICF?) Organizational Capacity and Valuing Volunteers
- County Volunteer Week- Target volunteer Recruitment form Part-Year Residents and
Retirees Community Review for St. Anthony
F. Better Together – Vital Connections Regional Initiative
Expand Intercity Bus Services to Improve Regional Connectivity- Upper Valley Connector service - Rexburg-Teton Valley-Jackson including mid-day routes- Yellowstone Gateway Connections- Establish Region-wide Mobility Advisory Committee- Rail Diesel Car – Long-Range Planning with other rail providers/advocates to
connect nationwide
Alternative Energy Development and Creative Applications- Home Energy Audits- Neighborhood/Community PV Solar Programs- Small wind – good for rural areas in all four counties;- Geothermal – Binary system with options for greenhouse near Newdale- Micro Hydroelectric – under 100kw – nearly 200 sites identified in 3 Idaho counties (mostly
ag and forest land- Natural Gas – Generation and/or transmission to full region- Biomass – mixed reports on economic viability to use available NF resource
Efficient Travel – Green Fleet, Electric Vehicle and Idle Free campaigns - YTCEC Collaborative Marketing of Multi-Modal Transportation
- One-stop shop/Idaho 511 as tools
12-31-
1Preliminary Consortium Draft December
- Online ticketing portal- Strategic Communications Plan (cite)
Regional Housing Information Center (linking all housing authorities)- Accessible Homes Initiative- LEP Resources Initiative
o The percentage of students in grades 1-12 with Limited English Proficiency will increase their proficiency by one level from 25.0% to 27.0% when comparing the Spring 2014 to the Spring 2015 IELA results. (Fremont)
- Rental information
Region-wide Local Foods Research: Supply Chain/Market Identification Broadband Infrastructure Enhancement
- Create an Open, Multi-Service Network for Wholesale Purposes only- Use Co-op Governance Structure as outlined -
Multi-Jurisdictional Projects:Madison-Fremont Housing AuthorityTeton Valley Housing Authority (Driggs, Victor, Teton County) Materials Recovery Initiatives – Recycling Study; Composting Fair Housing Education and Policy AdoptionMortgage Lending Action Project (Rexburg Micropolitan Area)
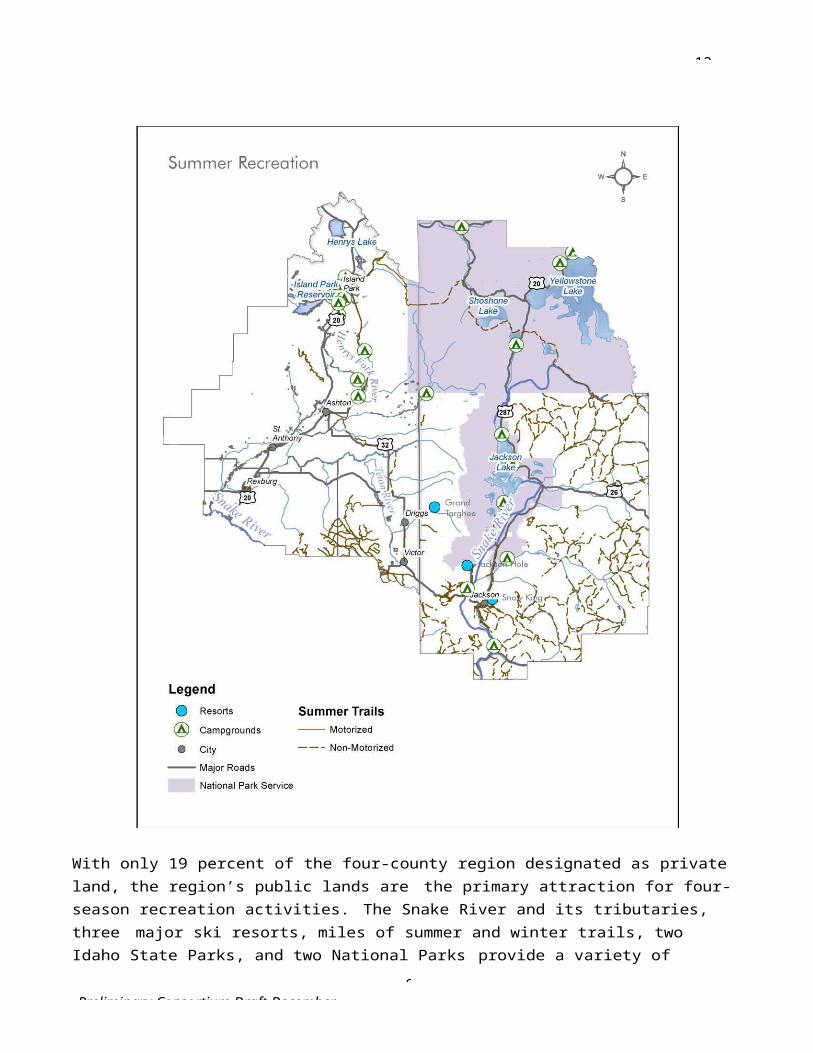
12-31-
1Preliminary Consortium Draft December
System IndicatorsHealthy WatersThis indicator is a composite of three different indicators focused on the health of the region’s waters, including quantity and quality.
WhyWater is important to the entire region for economic, environmental, and social reasons. Additionally, “clean water and air” was the attribute most valued by the region’s residents for contributing to quality of life.
Water sustains the region’s recreation and fisheries. It is also critical for the region’s agriculture and recreation industries. With a changing climate water will be increasingly stressed as precipitation patterns change and drought conditions threaten water availability. Watersheds also cut across counties and water quality is tied to good land use practices.
As such, three primary elements contribute to this “healthy waters” system indicator. It measures overarching conditions and designations that indicate threats to water quantity and quality including composite water supply, groundwater levels, and total miles/area of waters waters impaired by pollutants. Together these indicators can help illustrate when major changes are occurring that threaten the region’s water use and health.
Units of MeasureComponents of this indicator include the following:
Changes in groundwater levels at select representative wells in each county. (Depth in Feet) Surface Water Supply Indices (SWSIs) for the major watershed basins under each county.
These indices measure available surface water supply in relation to historical levels and are calculated by adding spring reservoir carryover (end vs. beginning of the season) and spring streamflow runoff levels. (Average Total Flow in Acre Feet and/or Index Value) Essentially, these indices are measuring trends in basin-level consumption vs. natural supply (snowpack, runoff).
Water quality impairment, which is measured in total acres of water bodies and miles of streams listed as impaired on state water quality reports (303(d)).
For this system indicator, looking at the components separately as well as in relation to each other will help provide a complete picture of water health. For example, water supply as measured by the SWSI provides a clear trendline of water supply over time, but since that may be more affected by such variables as annual precipitation, it is important to also look at groundwater levels to see whether they are both trending the same direction in a given year, or whether there is a disparity. Increasing depths to water table would be indicative of less sustainable overall water use patterns in terms of aquifer recharge, while increasing values for the SWSI would be positive indicators that water management is either being more effective, or that weather patterns are resulting in more moisture. For the water quality component, increasing area/miles of impaired waters could indicate a need for improved pollution management practices.

12-31-
1Preliminary Consortium Draft December
SourceSources for the components of this indicator are identified below.
Idahoo Groundwater Levels:
Data for this component are kept by the Idaho Department of Water Resources and publicly available. Key wells from which to pull data (tables) by basin (Henry’s Fork and Teton River Basins) were identified in collaboration with the Idaho Department of Water Resources. The portal is located at: http://w ww.idwr.id aho.gov/hyd ro.onli ne/gwl/
Fremont: Well # XXX (To be provided.) Madison: Well # XXX (To be provided.) Teton: Well # XXX (To be provided.)
o Surface Water Supply: Data for this component are managed by the National Resource Conservation
Service through the SWSI portal and should be measured with Flow Trend Graphs or SWSI index values for the desired basin at: http://w ww.nrc s.usda.go v/w ps/portal/nrcs/main/id/snow/waterproducts/surfa c e/
Fremont and Madison: Henry’s Fork Basin Teton: Teton River Basin
o Water Quality: Data for this indicator is reported every two years to the United States
Environmental Protection Agency (EPA). The 303(d) listings available in the Integrated Reports at the following website: https://w ww .deq .id aho.gov/wate r - qual ity /sur fac e- w ater/monitoring-assessment/integrated-repo rt.aspx
Wyomingo Groundwater Levels (Teton County): Well # XXX (To be provided.)o Water Supply (Snake): Snake Headwaters Basin
http://w ww.nrc s.usda.go v/w ps/portal/nrcs/main/ wy /snow/waterprodu c ts/surfa c e/ (note: website is currently down 12/19/14)
o Water Quality: http://deq.state .wy.us /wqd/watershed/
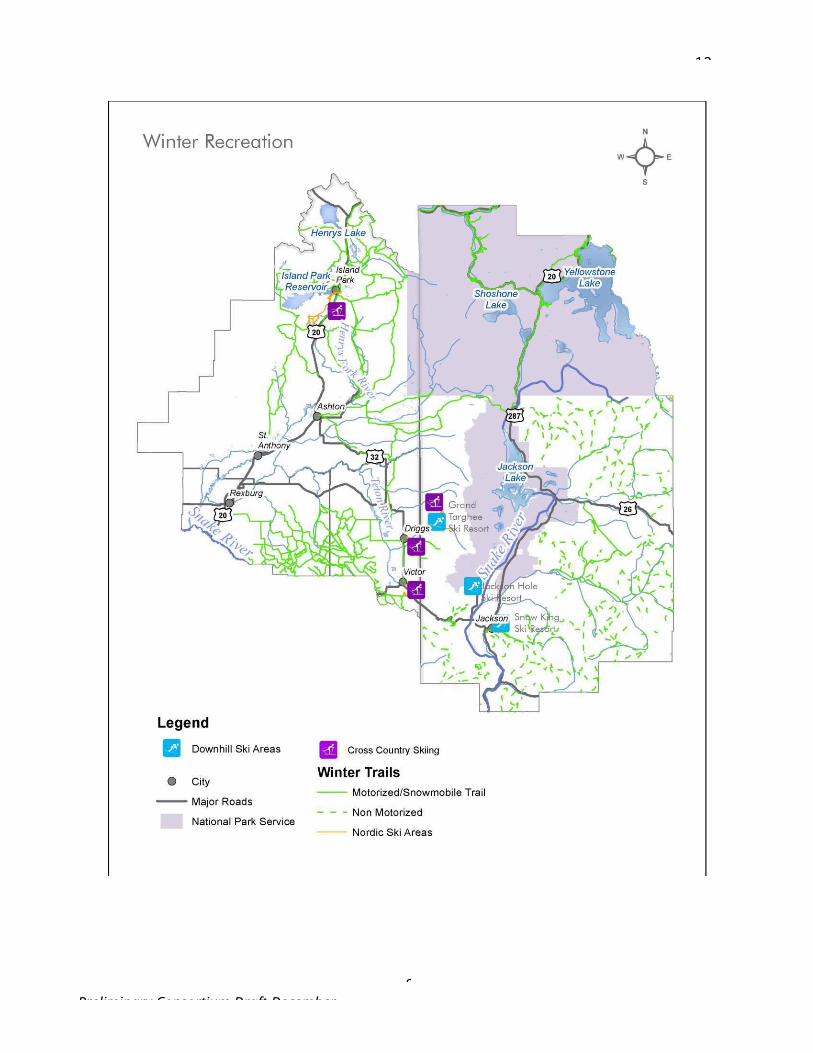
12-31-
1Preliminary Consortium Draft December
Housing and Transportation AffordabilityThis indicator is a composite indicator that includes housing and transportation costs as a percentage of wages.
WhyHousing costs and an ability to earn a good living wage were the top threats to the region identified by quality of life survey participants. Because of the cost of housing, people need to travel long distances from work to home. As a result, there are social impacts including increased isolation and loss of diversity in our small and large cities. From an economic perspective, while not always the case, the reduction in costs paid for housing can be more than offset by the additional costs of commuting.
One of the most significant variables that affects both economic and social impacts is the time spent commuting. Longer commutes take away time that could otherwise be utilized more productively participating in community activities or earning additional income. In addition, the extra impacts of vehicles on the transportation infrastructure can cause more degradation and contribute to environmental damage such as decreased air quality.
This indicator demonstrates the interconnectedness and scale of housing and transportation in individual counties. Since these counties are also closely intertwined, with jobs being in one county and housing in another, the indicator can also indicate disparities between wages and available housing between counties. This indicator can also be tied to transit availability; since transit is typically more affordable than the costs associated with using a personal vehicle that can also help to make the index more affordable.
Units of MeasureThe indicator is measured in terms of a combined housing and transportation percentage. Each county will have a percentage of housing affordability as a function of annual money spent relative to income and the same percentage for transportation costs. The sum of these percentages will result in the Housing and Transportation index for that county.
Increasing values for this indicator could mean that there continues to be less affordable housing proximate to job centers that can pay enough to live in these places. Decreasing values could mean that wages are increasing, home prices and rents are decreasing, consumers are utilizing public transit at a higher rate, or some combination of the above.
SourceData for this indicator is available from the Department of Housing and Urban Development (HUD)at: http://w ww.loc ationaf f ordabi lity.in fo/ and can be analyzed by navigating to the Location Affordability Index page and entering the specific Counties. It is recommended to use the default variables to ensure consistency, but the data can also be altered to look at specific demographic populations.
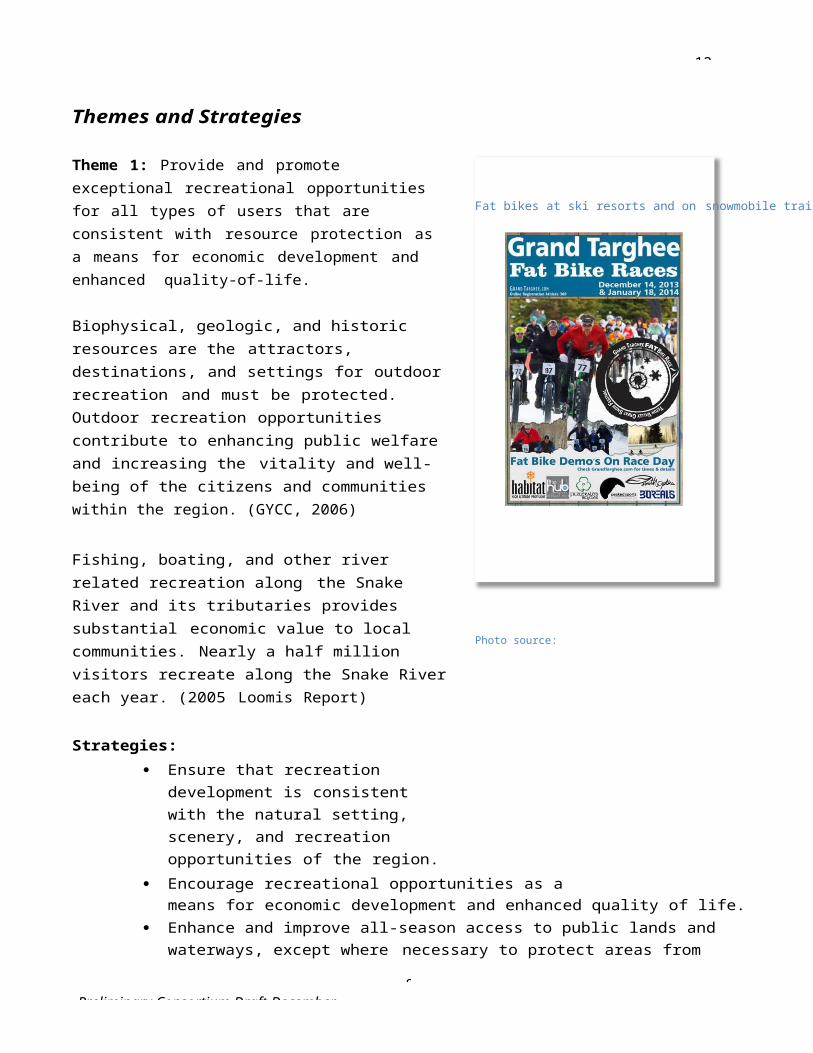
12-31-
1Preliminary Consortium Draft December
Regional Interconnectedness
WhyIn many ways, the four counties are already connected, but in other ways have significant room to collaborate for the benefit of all. This indicator examines the extent to which counties are working together to reach common goals. The number of opportunities that counties are creating to interact as reflected in cross-county intergovernmental agreements and participation in regional meetings demonstrates potential for collaboration. By combining that potential with a measure of the extent to which counties are tracking performance on common sustainability indicators, a broad picture will emerge illustrating how connected the region is.
As governments form intergovernmental agreements (IGAs) to work with each other out of necessity and desire, there is a shared intent for the agreements to result in success. That shared intent tends to build rapport and understanding over time. When representatives from different counties participate in inter-jurisdictional meetings, issues can be aired, common ground can be sought, and resolution attained. As the counties move through their processes to determine which indicators to track more robustly, the extent to which they are mirroring efforts in adjacent counties will result in stronger bonds and more complete information.
This indicator is a baseline of interconnectedness, which can be supplemented with looking at the more qualitative aspects of relationships. In addition to how many time people see each other and agree, the quality of those interactions will help dictate to what extent a spirit of collaboration grows.
Units of MeasureThis indicator is measured as a sum of independent variables. The number of IGAs in place for a given year between multiple counties will be combined with the number of inter-jurisdictional meetings (WYCC meetings, planning boards) attended by multiple counties. The number of indicators will be included when at least two jurisdictions have reported on them. The three numbers will be added into an index.
An increase in the indicator will most likely mean that there is greater collaboration between counties and that there are relatively frequent opportunities for interaction. A decrease could indicate fewer opportunities to interact or that fewer indicators are being tracked over time. Though the total IGAs over the course of the year should account for some of the natural variability in contracting, it is possible that a number could complete at once which may skew the indicator downward.
SourceData for this indicator will be developed internally by each county. The number of IGAs and meetings will be recorded, as will the indicators that are being tracked. These data points should be shared annually and cross-checked to arrive at the final index value.
12-31-
1Preliminary Consortium Draft December