Embed Size (px)
Citation preview
1
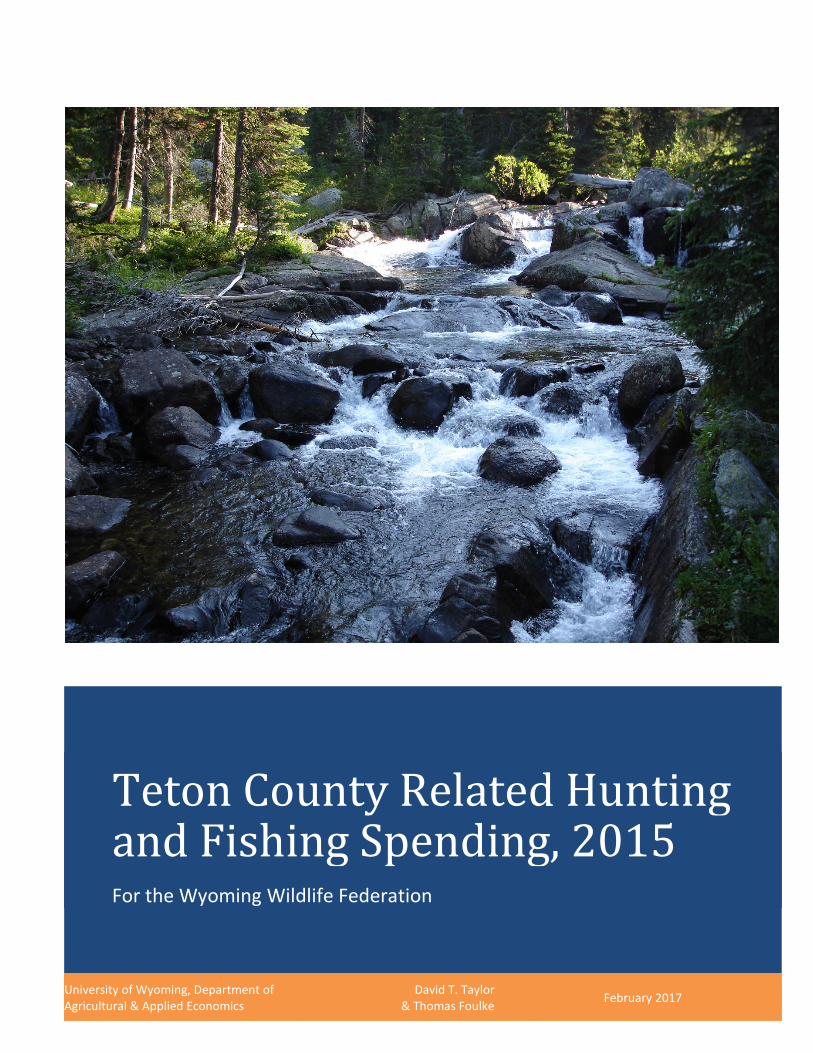
Teton County Related Hunting and Fishing Spending, 2015 For the Wyoming Wildlife Federation
University of Wyoming, Department of Agricultural & Applied Economics
David T. Taylor & Thomas Foulke February 2017

2
3
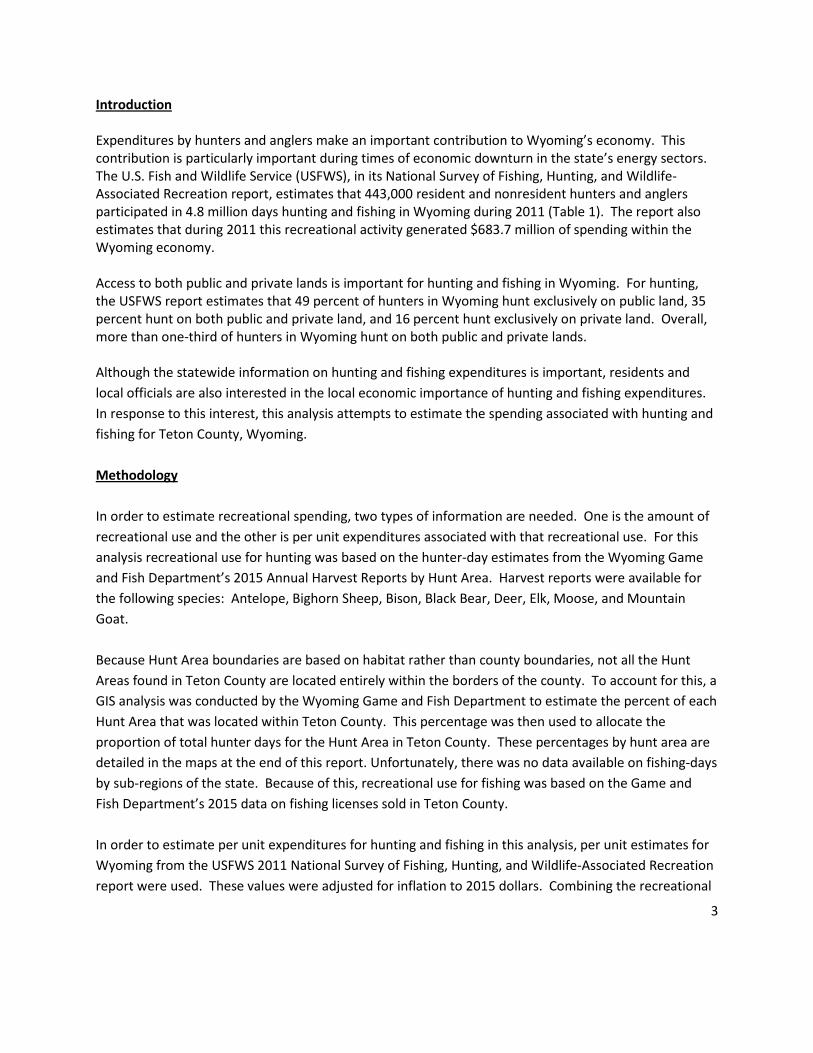
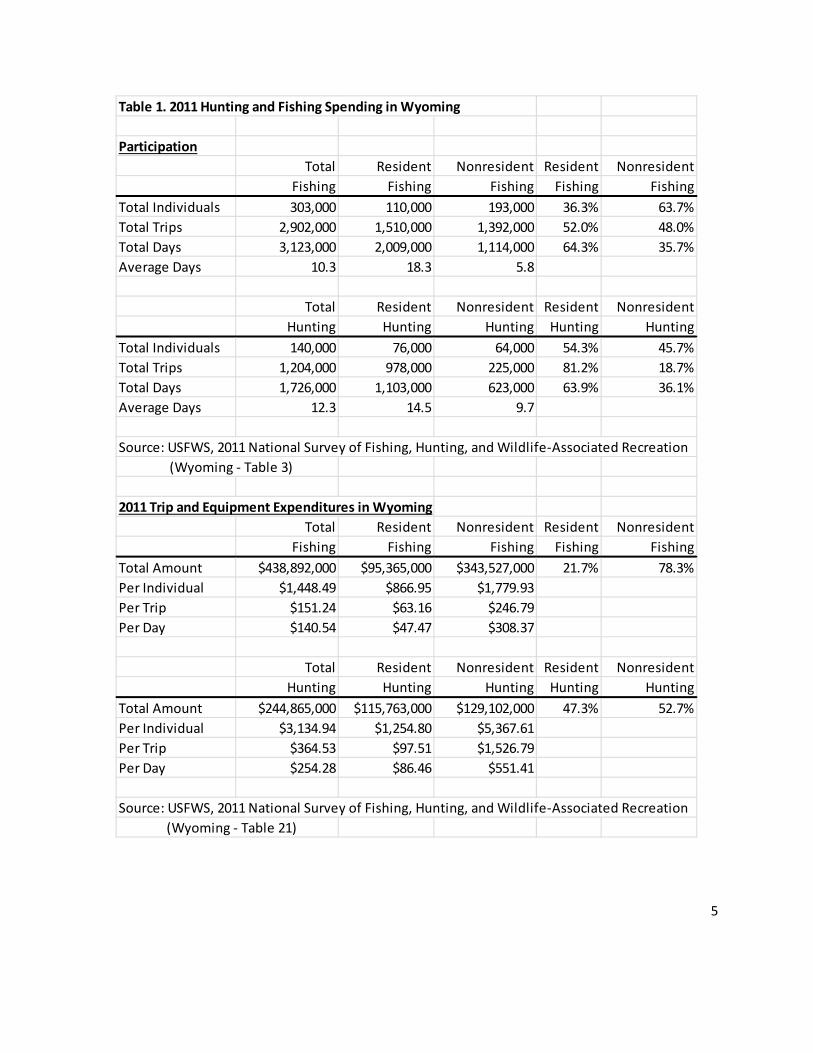
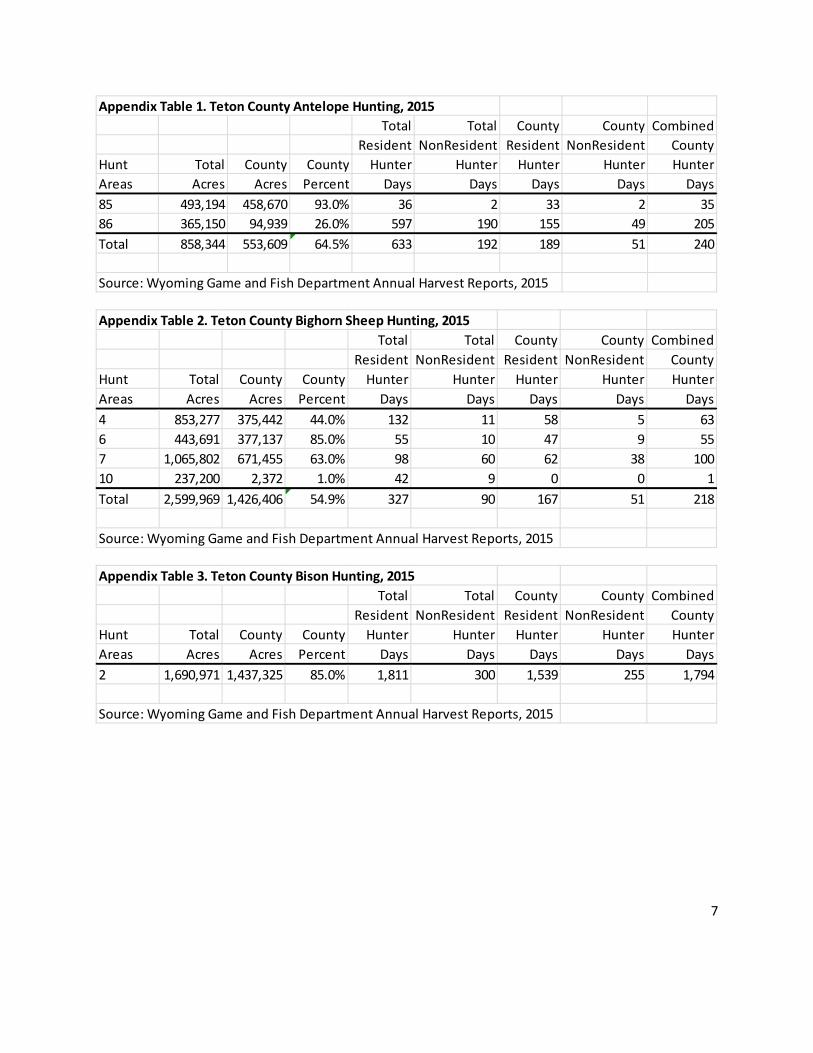
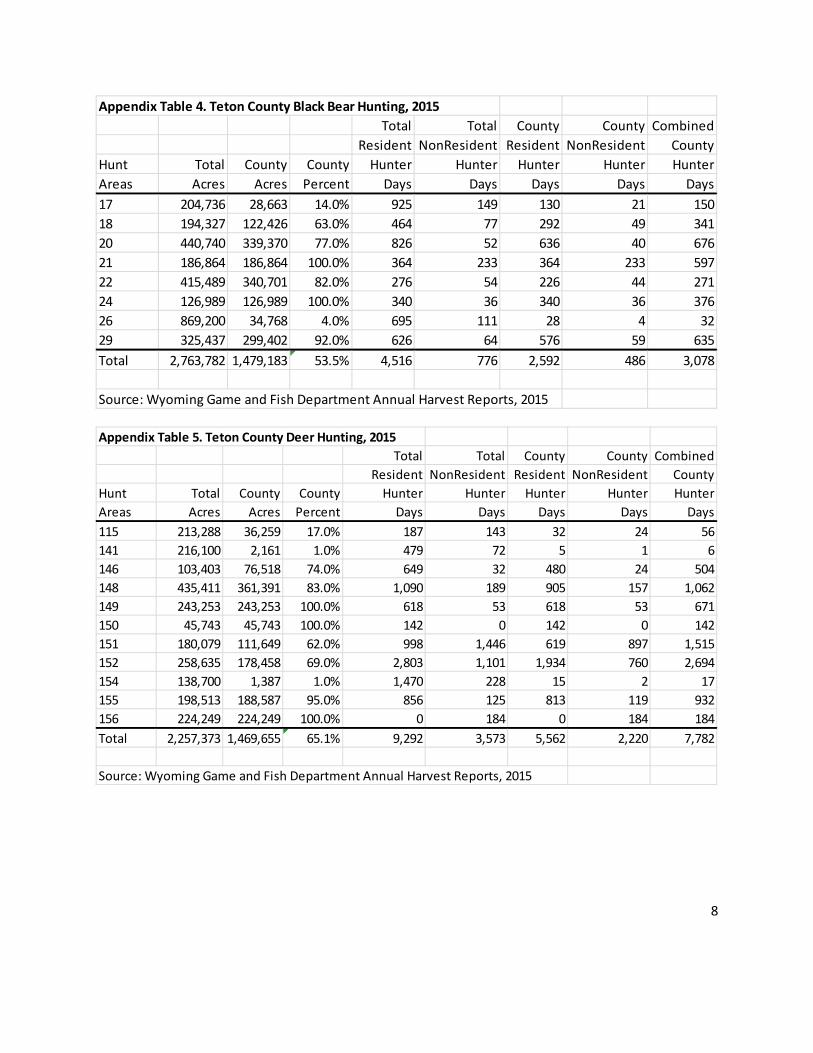
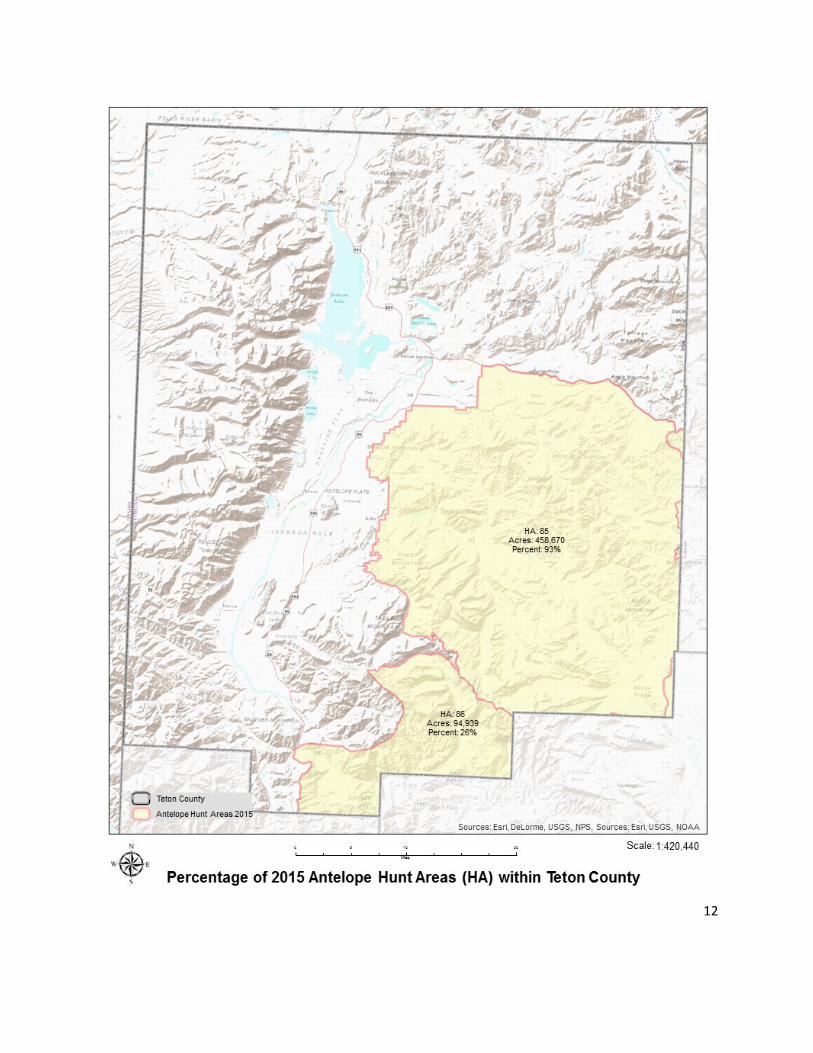
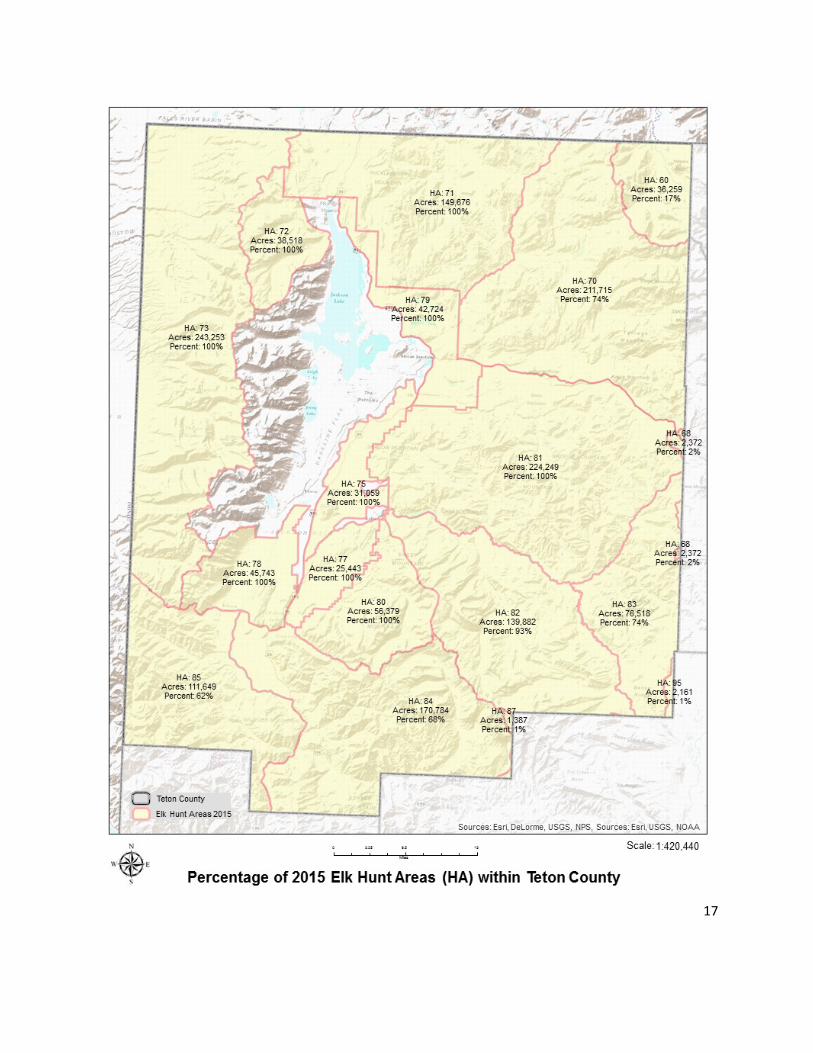
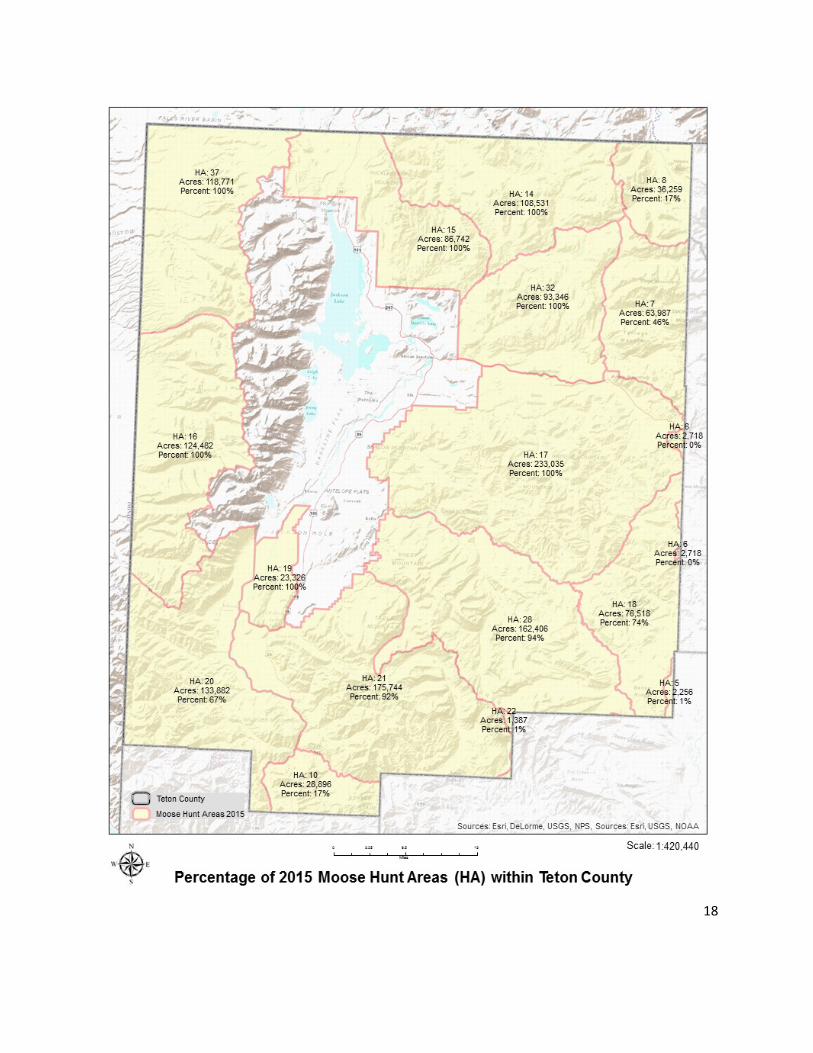
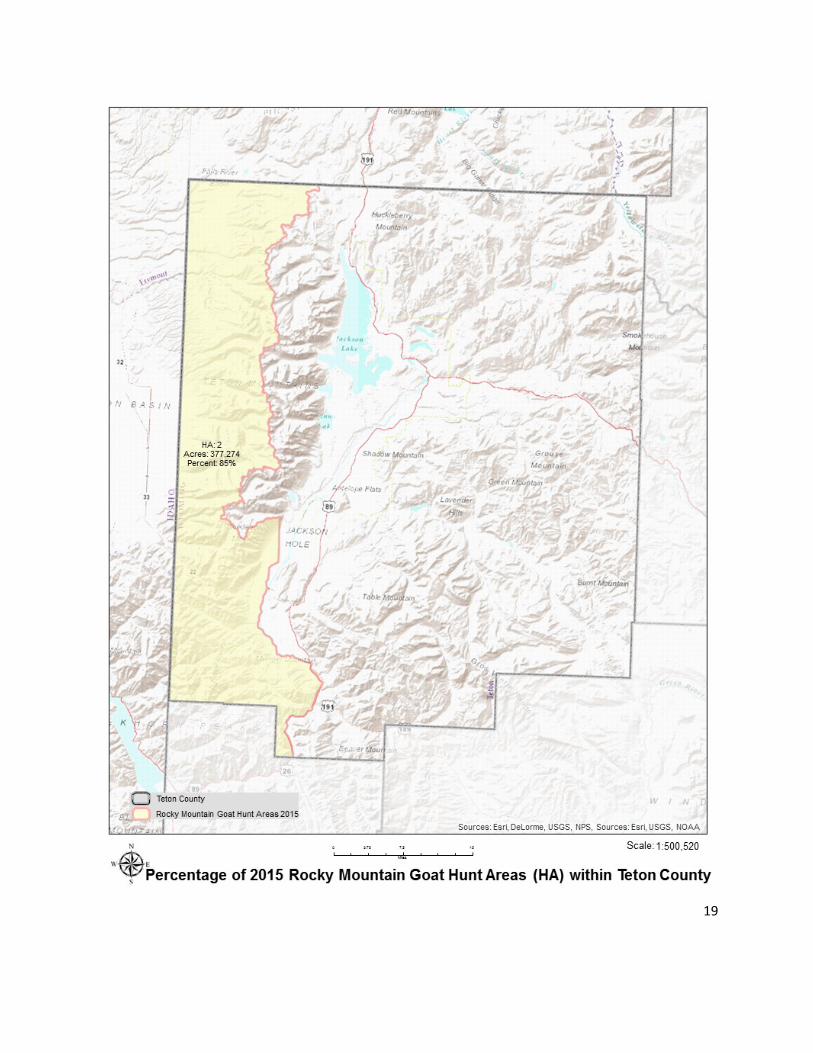
Introduction Expenditures by hunters and anglers make an important contribution to Wyoming’s economy. This contribution is particularly important during times of economic downturn in the state’s energy sectors. The U.S. Fish and Wildlife Service (USFWS), in its National Survey of Fishing, Hunting, and Wildlife-Associated Recreation report, estimates that 443,000 resident and nonresident hunters and anglers participated in 4.8 million days hunting and fishing in Wyoming during 2011 (Table 1). The report also estimates that during 2011 this recreational activity generated $683.7 million of spending within the Wyoming economy. Access to both public and private lands is important for hunting and fishing in Wyoming. For hunting, the USFWS report estimates that 49 percent of hunters in Wyoming hunt exclusively on public land, 35 percent hunt on both public and private land, and 16 percent hunt exclusively on private land. Overall, more than one-third of hunters in Wyoming hunt on both public and private lands. Although the statewide information on hunting and fishing expenditures is important, residents and local officials are also interested in the local economic importance of hunting and fishing expenditures. In response to this interest, this analysis attempts to estimate the spending associated with hunting and fishing for Teton County, Wyoming. Methodology In order to estimate recreational spending, two types of information are needed. One is the amount of recreational use and the other is per unit expenditures associated with that recreational use. For this analysis recreational use for hunting was based on the hunter-day estimates from the Wyoming Game and Fish Department’s 2015 Annual Harvest Reports by Hunt Area. Harvest reports were available for the following species: Antelope, Bighorn Sheep, Bison, Black Bear, Deer, Elk, Moose, and Mountain Goat. Because Hunt Area boundaries are based on habitat rather than county boundaries, not all the Hunt Areas found in Teton County are located entirely within the borders of the county. To account for this, a GIS analysis was conducted by the Wyoming Game and Fish Department to estimate the percent of each Hunt Area that was located within Teton County. This percentage was then used to allocate the proportion of total hunter days for the Hunt Area in Teton County. These percentages by hunt area are detailed in the maps at the end of this report. Unfortunately, there was no data available on fishing-days by sub-regions of the state. Because of this, recreational use for fishing was based on the Game and Fish Department’s 2015 data on fishing licenses sold in Teton County. In order to estimate per unit expenditures for hunting and fishing in this analysis, per unit estimates for Wyoming from the USFWS 2011 National Survey of Fishing, Hunting, and Wildlife-Associated Recreation report were used. These values were adjusted for inflation to 2015 dollars. Combining the recreational
4
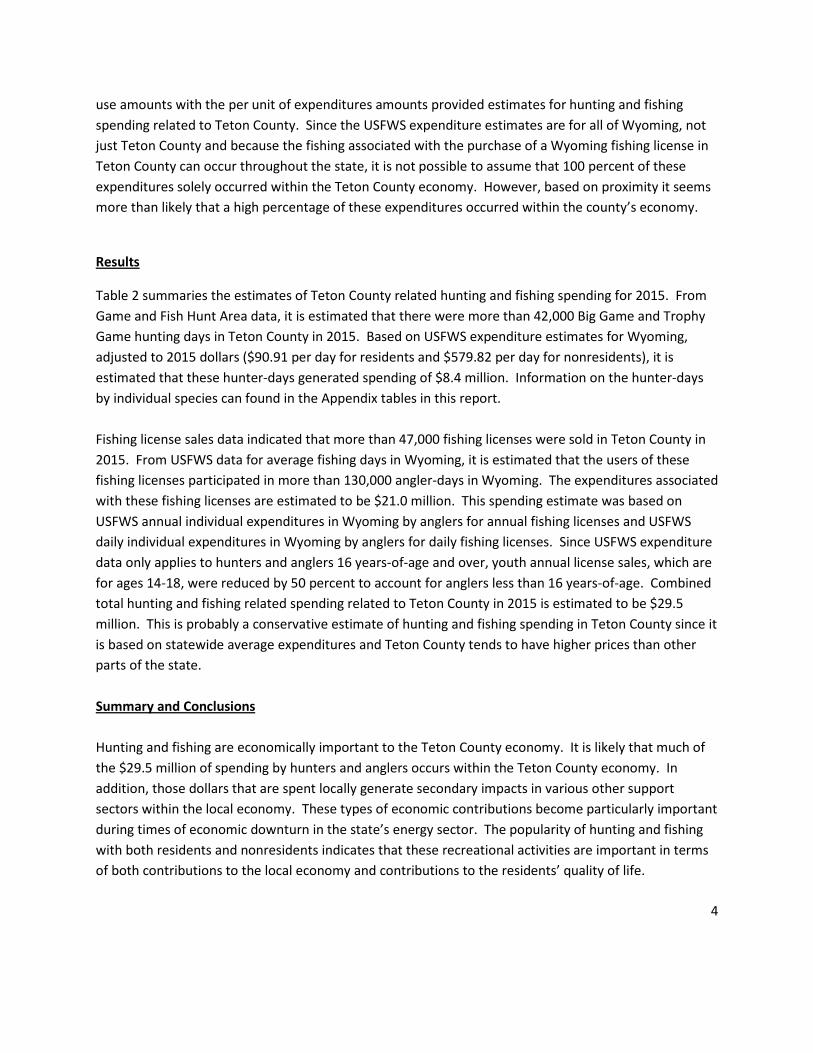
use amounts with the per unit of expenditures amounts provided estimates for hunting and fishing spending related to Teton County. Since the USFWS expenditure estimates are for all of Wyoming, not just Teton County and because the fishing associated with the purchase of a Wyoming fishing license in Teton County can occur throughout the state, it is not possible to assume that 100 percent of these expenditures solely occurred within the Teton County economy. However, based on proximity it seems more than likely that a high percentage of these expenditures occurred within the county’s economy.
Results
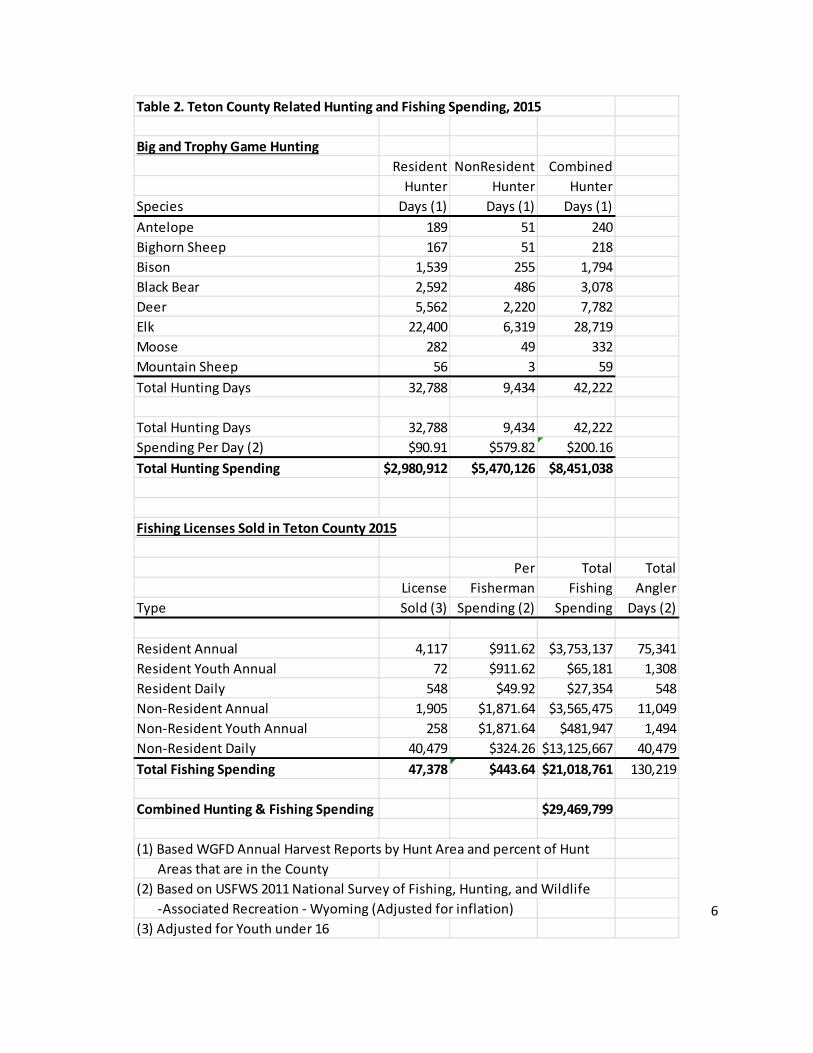
Table 2 summaries the estimates of Teton County related hunting and fishing spending for 2015. From Game and Fish Hunt Area data, it is estimated that there were more than 42,000 Big Game and Trophy Game hunting days in Teton County in 2015. Based on USFWS expenditure estimates for Wyoming, adjusted to 2015 dollars ($90.91 per day for residents and $579.82 per day for nonresidents), it is estimated that these hunter-days generated spending of $8.4 million. Information on the hunter-days by individual species can found in the Appendix tables in this report. Fishing license sales data indicated that more than 47,000 fishing licenses were sold in Teton County in 2015. From USFWS data for average fishing days in Wyoming, it is estimated that the users of these fishing licenses participated in more than 130,000 angler-days in Wyoming. The expenditures associated with these fishing licenses are estimated to be $21.0 million. This spending estimate was based on USFWS annual individual expenditures in Wyoming by anglers for annual fishing licenses and USFWS daily individual expenditures in Wyoming by anglers for daily fishing licenses. Since USFWS expenditure data only applies to hunters and anglers 16 years-of-age and over, youth annual license sales, which are for ages 14-18, were reduced by 50 percent to account for anglers less than 16 years-of-age. Combined total hunting and fishing related spending related to Teton County in 2015 is estimated to be $29.5 million. This is probably a conservative estimate of hunting and fishing spending in Teton County since it is based on statewide average expenditures and Teton County tends to have higher prices than other parts of the state. Summary and Conclusions Hunting and fishing are economically important to the Teton County economy. It is likely that much of the $29.5 million of spending by hunters and anglers occurs within the Teton County economy. In addition, those dollars that are spent locally generate secondary impacts in various other support sectors within the local economy. These types of economic contributions become particularly important during times of economic downturn in the state’s energy sector. The popularity of hunting and fishing with both residents and nonresidents indicates that these recreational activities are important in terms of both contributions to the local economy and contributions to the residents’ quality of life.
5
Table 1. 2011 Hunting and Fishing Spending in Wyoming
ParticipationTotal Resident Nonresident Resident Nonresident
Fishing Fishing Fishing Fishing FishingTotal Individuals 303,000 110,000 193,000 36.3% 63.7%Total Trips 2,902,000 1,510,000 1,392,000 52.0% 48.0%Total Days 3,123,000 2,009,000 1,114,000 64.3% 35.7%Average Days 10.3 18.3 5.8
Total Resident Nonresident Resident NonresidentHunting Hunting Hunting Hunting Hunting
Total Individuals 140,000 76,000 64,000 54.3% 45.7%Total Trips 1,204,000 978,000 225,000 81.2% 18.7%Total Days 1,726,000 1,103,000 623,000 63.9% 36.1%Average Days 12.3 14.5 9.7
Source: USFWS, 2011 National Survey of Fishing, Hunting, and Wildlife-Associated Recreation (Wyoming - Table 3)
2011 Trip and Equipment Expenditures in WyomingTotal Resident Nonresident Resident Nonresident
Fishing Fishing Fishing Fishing FishingTotal Amount $438,892,000 $95,365,000 $343,527,000 21.7% 78.3%Per Individual $1,448.49 $866.95 $1,779.93Per Trip $151.24 $63.16 $246.79Per Day $140.54 $47.47 $308.37
Total Resident Nonresident Resident NonresidentHunting Hunting Hunting Hunting Hunting
Total Amount $244,865,000 $115,763,000 $129,102,000 47.3% 52.7%Per Individual $3,134.94 $1,254.80 $5,367.61Per Trip $364.53 $97.51 $1,526.79Per Day $254.28 $86.46 $551.41
Source: USFWS, 2011 National Survey of Fishing, Hunting, and Wildlife-Associated Recreation (Wyoming - Table 21)
6
Table 2. Teton County Related Hunting and Fishing Spending, 2015
Big and Trophy Game HuntingResident NonResident Combined
Hunter Hunter HunterSpecies Days (1) Days (1) Days (1)Antelope 189 51 240Bighorn Sheep 167 51 218Bison 1,539 255 1,794Black Bear 2,592 486 3,078Deer 5,562 2,220 7,782Elk 22,400 6,319 28,719Moose 282 49 332Mountain Sheep 56 3 59Total Hunting Days 32,788 9,434 42,222
Total Hunting Days 32,788 9,434 42,222Spending Per Day (2) $90.91 $579.82 $200.16Total Hunting Spending $2,980,912 $5,470,126 $8,451,038
Fishing Licenses Sold in Teton County 2015
Per Total TotalLicense Fisherman Fishing Angler
Type Sold (3) Spending (2) Spending Days (2)
Resident Annual 4,117 $911.62 $3,753,137 75,341Resident Youth Annual 72 $911.62 $65,181 1,308Resident Daily 548 $49.92 $27,354 548Non-Resident Annual 1,905 $1,871.64 $3,565,475 11,049Non-Resident Youth Annual 258 $1,871.64 $481,947 1,494Non-Resident Daily 40,479 $324.26 $13,125,667 40,479Total Fishing Spending 47,378 $443.64 $21,018,761 130,219
Combined Hunting & Fishing Spending $29,469,799
(1) Based WGFD Annual Harvest Reports by Hunt Area and percent of Hunt Areas that are in the County(2) Based on USFWS 2011 National Survey of Fishing, Hunting, and Wildlife -Associated Recreation - Wyoming (Adjusted for inflation)(3) Adjusted for Youth under 16
7
Appendix Table 1. Teton County Antelope Hunting, 2015Total Total County County Combined
Resident NonResident Resident NonResident CountyHunt Total County County Hunter Hunter Hunter Hunter HunterAreas Acres Acres Percent Days Days Days Days Days85 493,194 458,670 93.0% 36 2 33 2 3586 365,150 94,939 26.0% 597 190 155 49 205Total 858,344 553,609 64.5% 633 192 189 51 240
Source: Wyoming Game and Fish Department Annual Harvest Reports, 2015
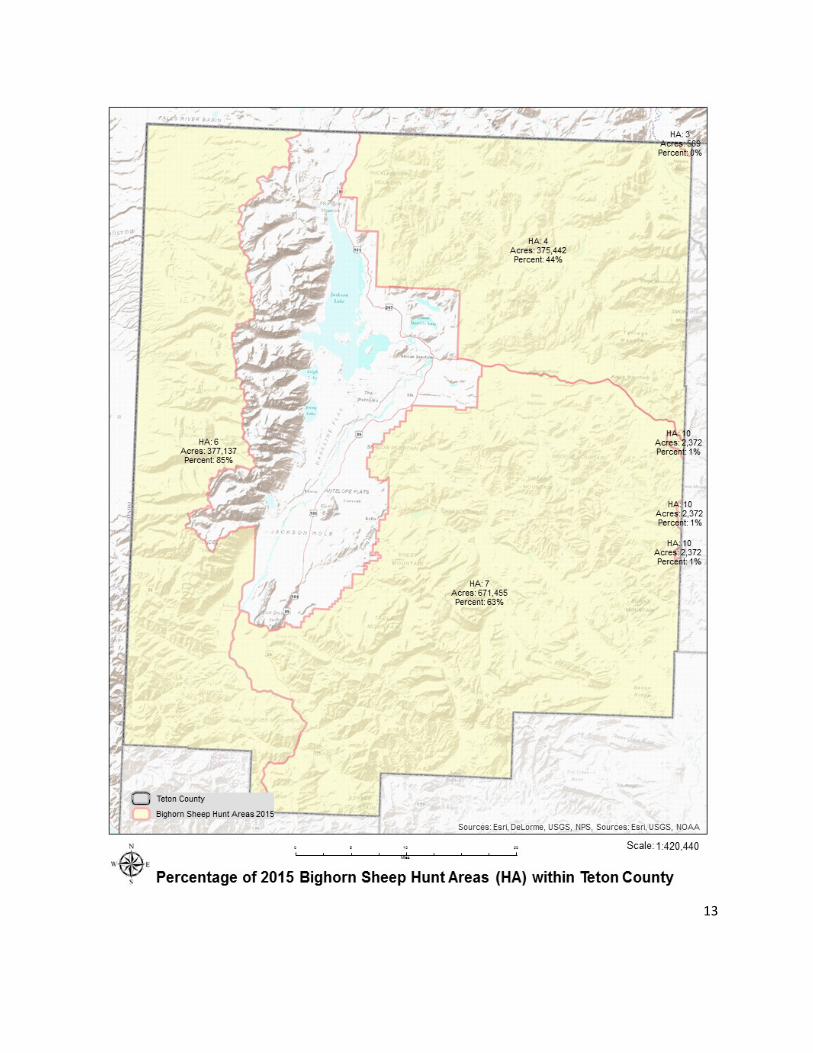
Appendix Table 2. Teton County Bighorn Sheep Hunting, 2015Total Total County County Combined
Resident NonResident Resident NonResident CountyHunt Total County County Hunter Hunter Hunter Hunter HunterAreas Acres Acres Percent Days Days Days Days Days4 853,277 375,442 44.0% 132 11 58 5 636 443,691 377,137 85.0% 55 10 47 9 557 1,065,802 671,455 63.0% 98 60 62 38 10010 237,200 2,372 1.0% 42 9 0 0 1Total 2,599,969 1,426,406 54.9% 327 90 167 51 218
Source: Wyoming Game and Fish Department Annual Harvest Reports, 2015
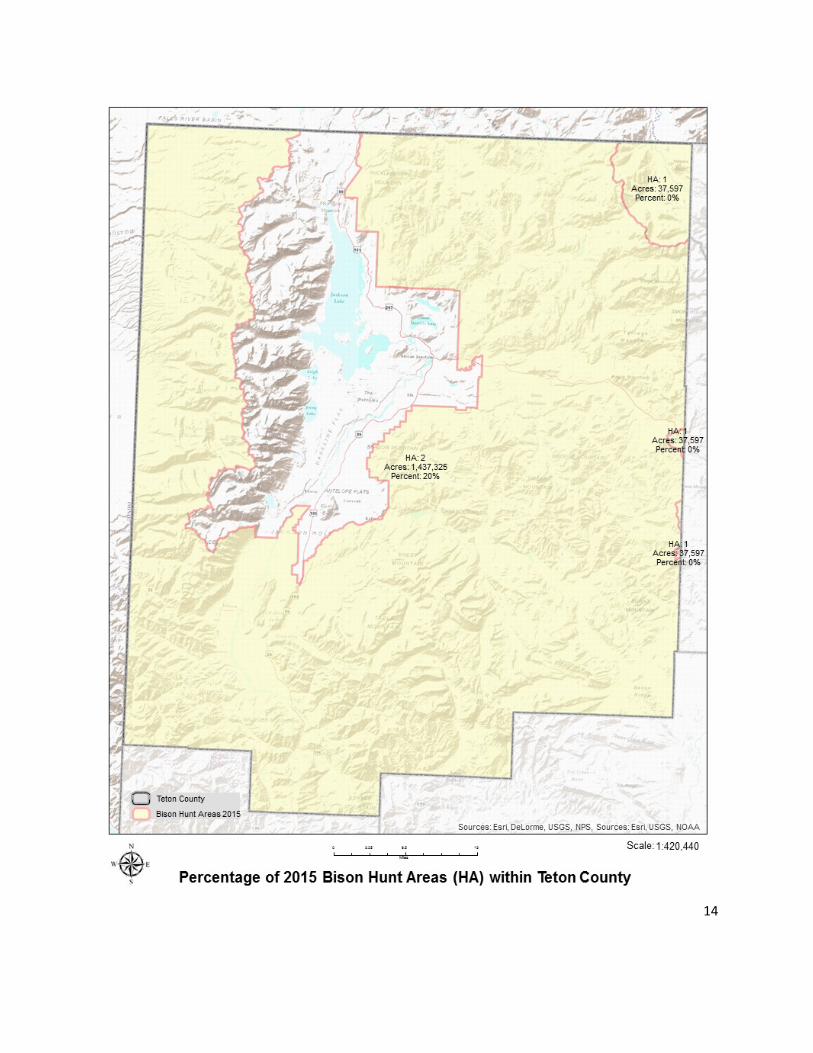
Appendix Table 3. Teton County Bison Hunting, 2015Total Total County County Combined
Resident NonResident Resident NonResident CountyHunt Total County County Hunter Hunter Hunter Hunter HunterAreas Acres Acres Percent Days Days Days Days Days2 1,690,971 1,437,325 85.0% 1,811 300 1,539 255 1,794
Source: Wyoming Game and Fish Department Annual Harvest Reports, 2015
8
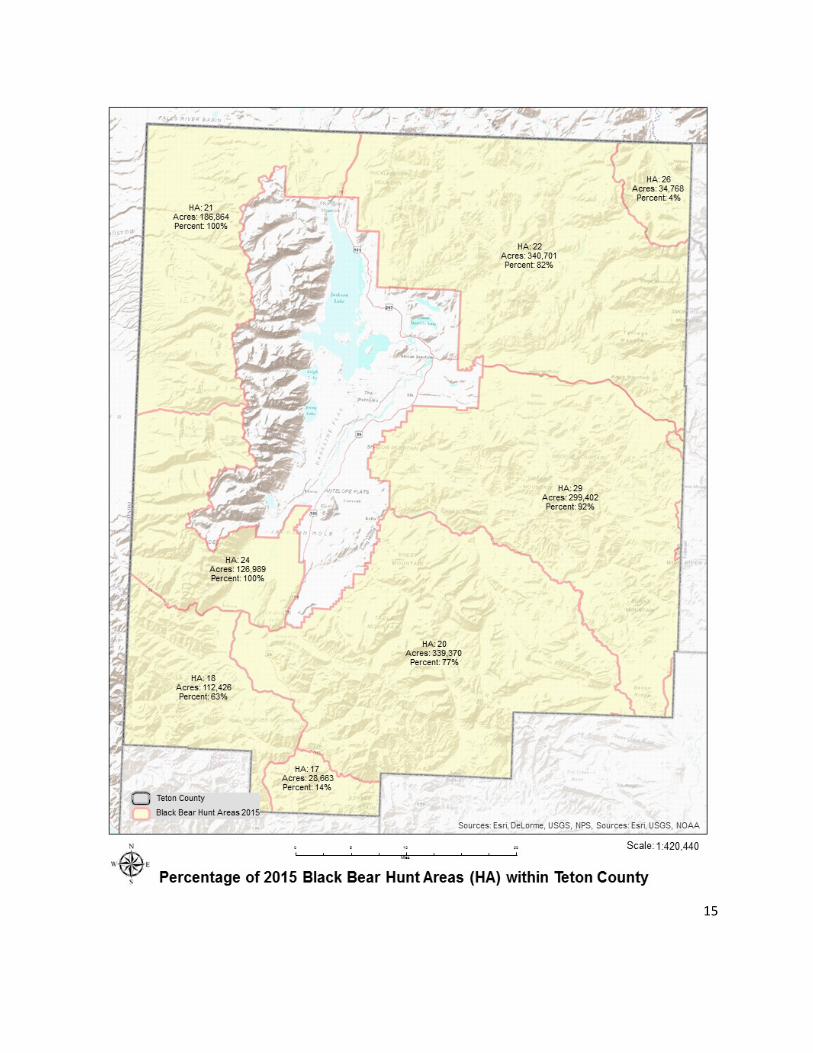
Appendix Table 4. Teton County Black Bear Hunting, 2015Total Total County County Combined
Resident NonResident Resident NonResident CountyHunt Total County County Hunter Hunter Hunter Hunter HunterAreas Acres Acres Percent Days Days Days Days Days17 204,736 28,663 14.0% 925 149 130 21 15018 194,327 122,426 63.0% 464 77 292 49 34120 440,740 339,370 77.0% 826 52 636 40 67621 186,864 186,864 100.0% 364 233 364 233 59722 415,489 340,701 82.0% 276 54 226 44 27124 126,989 126,989 100.0% 340 36 340 36 37626 869,200 34,768 4.0% 695 111 28 4 3229 325,437 299,402 92.0% 626 64 576 59 635Total 2,763,782 1,479,183 53.5% 4,516 776 2,592 486 3,078
Source: Wyoming Game and Fish Department Annual Harvest Reports, 2015
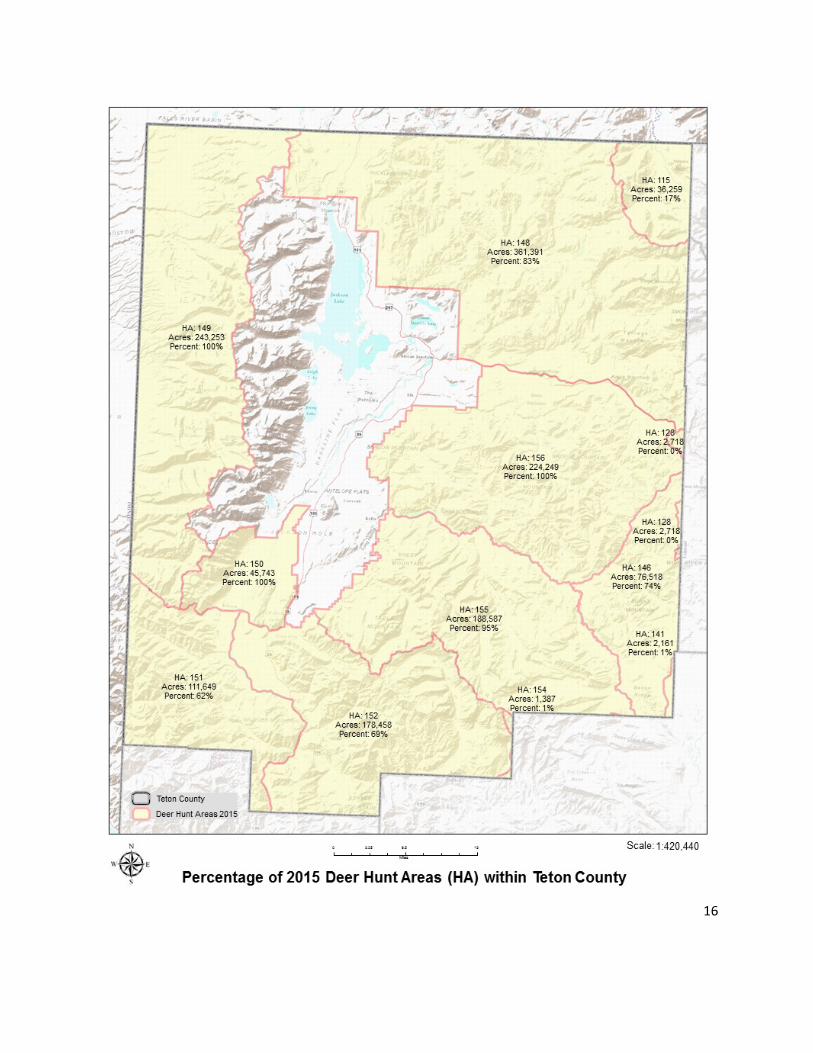
Appendix Table 5. Teton County Deer Hunting, 2015Total Total County County Combined
Resident NonResident Resident NonResident CountyHunt Total County County Hunter Hunter Hunter Hunter HunterAreas Acres Acres Percent Days Days Days Days Days115 213,288 36,259 17.0% 187 143 32 24 56141 216,100 2,161 1.0% 479 72 5 1 6146 103,403 76,518 74.0% 649 32 480 24 504148 435,411 361,391 83.0% 1,090 189 905 157 1,062149 243,253 243,253 100.0% 618 53 618 53 671150 45,743 45,743 100.0% 142 0 142 0 142151 180,079 111,649 62.0% 998 1,446 619 897 1,515152 258,635 178,458 69.0% 2,803 1,101 1,934 760 2,694154 138,700 1,387 1.0% 1,470 228 15 2 17155 198,513 188,587 95.0% 856 125 813 119 932156 224,249 224,249 100.0% 0 184 0 184 184Total 2,257,373 1,469,655 65.1% 9,292 3,573 5,562 2,220 7,782
Source: Wyoming Game and Fish Department Annual Harvest Reports, 2015
9
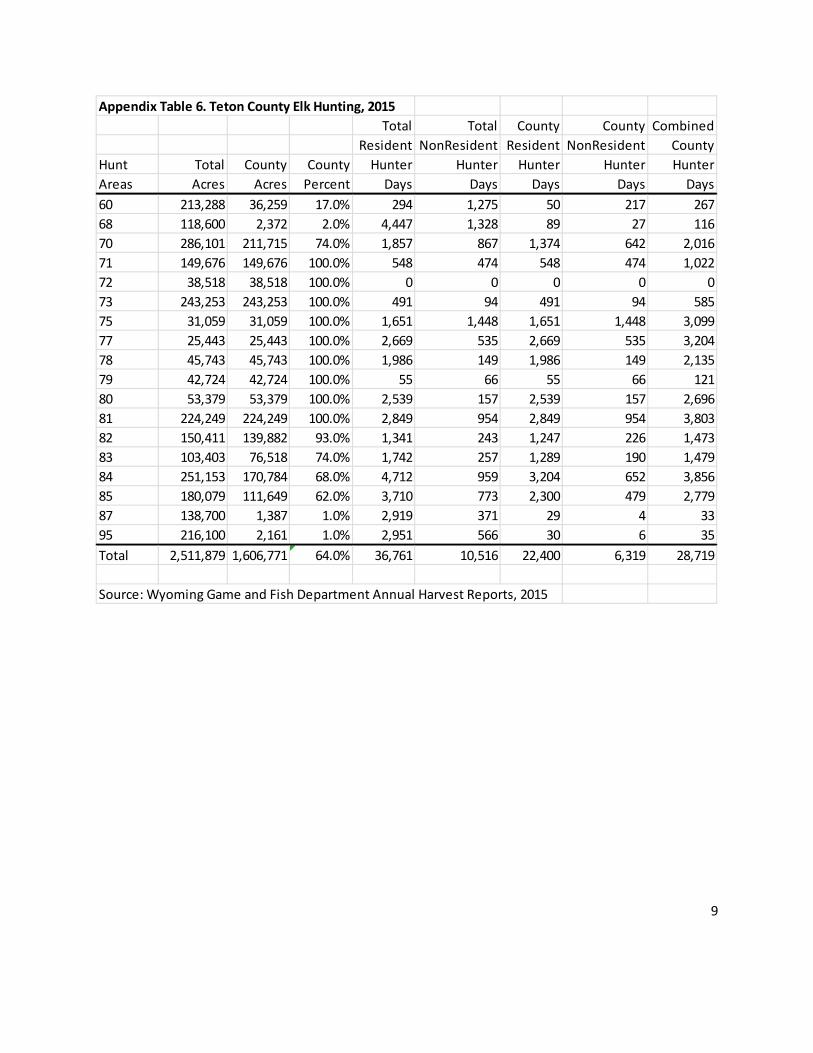
Appendix Table 6. Teton County Elk Hunting, 2015Total Total County County Combined
Resident NonResident Resident NonResident CountyHunt Total County County Hunter Hunter Hunter Hunter HunterAreas Acres Acres Percent Days Days Days Days Days60 213,288 36,259 17.0% 294 1,275 50 217 26768 118,600 2,372 2.0% 4,447 1,328 89 27 11670 286,101 211,715 74.0% 1,857 867 1,374 642 2,01671 149,676 149,676 100.0% 548 474 548 474 1,02272 38,518 38,518 100.0% 0 0 0 0 073 243,253 243,253 100.0% 491 94 491 94 58575 31,059 31,059 100.0% 1,651 1,448 1,651 1,448 3,09977 25,443 25,443 100.0% 2,669 535 2,669 535 3,20478 45,743 45,743 100.0% 1,986 149 1,986 149 2,13579 42,724 42,724 100.0% 55 66 55 66 12180 53,379 53,379 100.0% 2,539 157 2,539 157 2,69681 224,249 224,249 100.0% 2,849 954 2,849 954 3,80382 150,411 139,882 93.0% 1,341 243 1,247 226 1,47383 103,403 76,518 74.0% 1,742 257 1,289 190 1,47984 251,153 170,784 68.0% 4,712 959 3,204 652 3,85685 180,079 111,649 62.0% 3,710 773 2,300 479 2,77987 138,700 1,387 1.0% 2,919 371 29 4 3395 216,100 2,161 1.0% 2,951 566 30 6 35Total 2,511,879 1,606,771 64.0% 36,761 10,516 22,400 6,319 28,719
Source: Wyoming Game and Fish Department Annual Harvest Reports, 2015
10
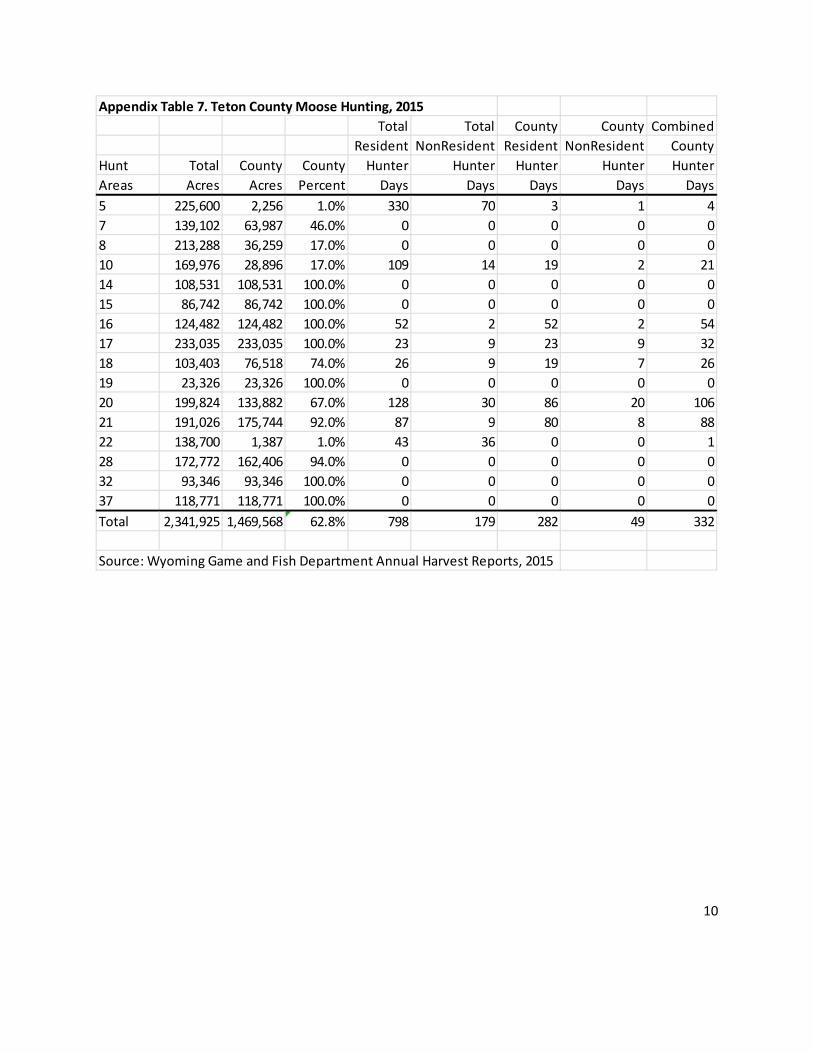
Appendix Table 7. Teton County Moose Hunting, 2015Total Total County County Combined
Resident NonResident Resident NonResident CountyHunt Total County County Hunter Hunter Hunter Hunter HunterAreas Acres Acres Percent Days Days Days Days Days5 225,600 2,256 1.0% 330 70 3 1 47 139,102 63,987 46.0% 0 0 0 0 08 213,288 36,259 17.0% 0 0 0 0 010 169,976 28,896 17.0% 109 14 19 2 2114 108,531 108,531 100.0% 0 0 0 0 015 86,742 86,742 100.0% 0 0 0 0 016 124,482 124,482 100.0% 52 2 52 2 5417 233,035 233,035 100.0% 23 9 23 9 3218 103,403 76,518 74.0% 26 9 19 7 2619 23,326 23,326 100.0% 0 0 0 0 020 199,824 133,882 67.0% 128 30 86 20 10621 191,026 175,744 92.0% 87 9 80 8 8822 138,700 1,387 1.0% 43 36 0 0 128 172,772 162,406 94.0% 0 0 0 0 032 93,346 93,346 100.0% 0 0 0 0 037 118,771 118,771 100.0% 0 0 0 0 0Total 2,341,925 1,469,568 62.8% 798 179 282 49 332
Source: Wyoming Game and Fish Department Annual Harvest Reports, 2015
11
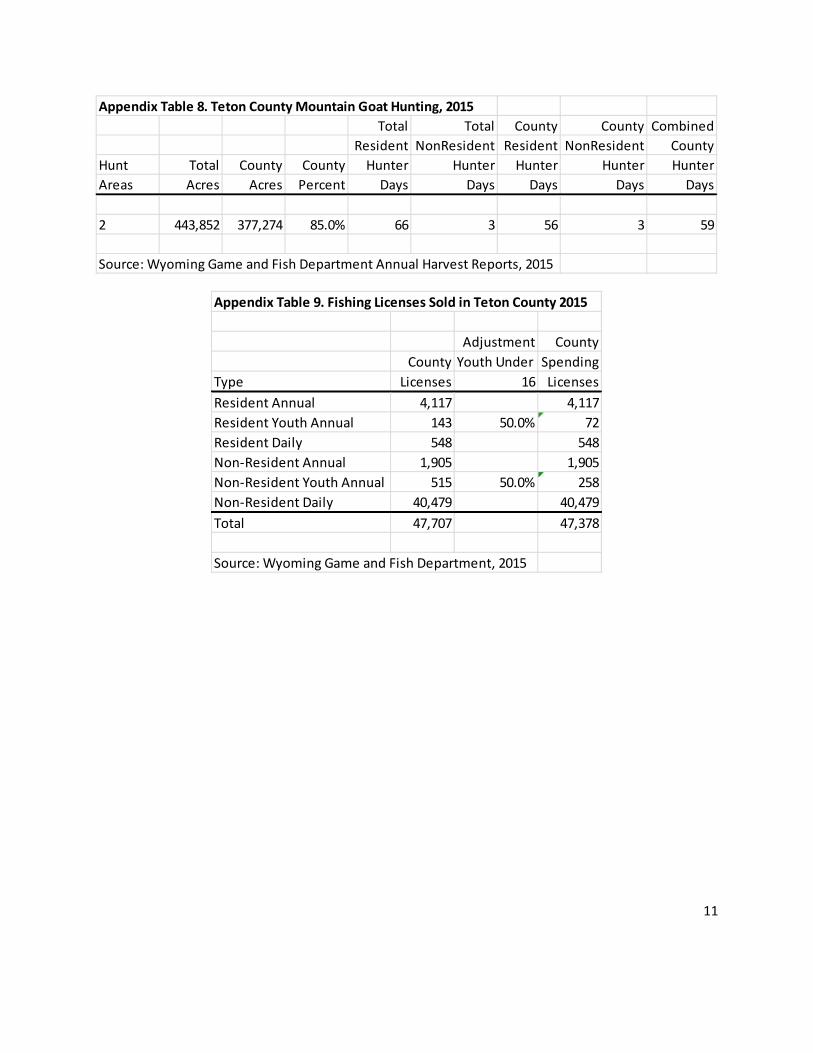
Appendix Table 8. Teton County Mountain Goat Hunting, 2015Total Total County County Combined
Resident NonResident Resident NonResident CountyHunt Total County County Hunter Hunter Hunter Hunter HunterAreas Acres Acres Percent Days Days Days Days Days
2 443,852 377,274 85.0% 66 3 56 3 59
Source: Wyoming Game and Fish Department Annual Harvest Reports, 2015
Appendix Table 9. Fishing Licenses Sold in Teton County 2015
Adjustment CountyCounty Youth Under Spending
Type Licenses 16 LicensesResident Annual 4,117 4,117Resident Youth Annual 143 50.0% 72Resident Daily 548 548Non-Resident Annual 1,905 1,905Non-Resident Youth Annual 515 50.0% 258Non-Resident Daily 40,479 40,479Total 47,707 47,378
Source: Wyoming Game and Fish Department, 2015
12
13
14
15
16
17
18
19

20