Embed Size (px)
Citation preview
Test/QA Plan for Pesticide Spray DRT in a Low Speed Wind Tunnel Version 1.0 May 2009 Page i
TEST/QA PLAN FOR THE VALIDATION OF THE VERIFICATION PROTOCOL FOR LOW SPEED PESTICIDE SPRAY DRIFT REDUCTION TECHNOLOGIES FOR ROW
AND FIELD CROPS
Alion Science & Technology 1000 Park Forty Plaza, Suite 200 Durham, NC 27713 Phone: 919-549-0611 FAX: 919-549-4665 E-mail: [email protected]
RTI International 3040 Cornwallis Road P.O. Box 12194 Research Triangle Park, NC 27709-2194 Phone: 919-541-3742 FAX: 919-541-6936 E-mail: [email protected]
USEPA-ETV 109 T.W. Alexander Drive E434-02 Research Triangle Park, NC 27711 Phone: 919-541-2734 FAX: 919-541-0359 E-mail: [email protected]
This plan has been reviewed and approved by:
Signed by Zora E. Drake May 4, 2009 Z. E. Drake, Technical Leader, Alion Science and Technology Date
Signed by Paulette S. Yongue May 4, 2009 P. S. Yongue, Quality Manager, Alion Science and Technology Date
Signed by Jonathon W. Thornburg May 5, 2009 J. W. Thornburg, Project Leader, RTI International Date
Signed by W. Cary Eaton May 5, 2009 W.C. Eaton, Quality Manager, RTI International Date
Signed by Michael Kosusko May 22, 2009 M. Kosusko, EPA Project Manager Date
Signed by Paul W. Groff May 22, 2009 P. W. Groff, EPA Quality Manager Date
Test/QA Plan for Pesticide Spray DRT in a Low Speed Wind Tunnel Version 1.0 May 2009 Page ii
A2: Table of Contents
List of Figures ................................................................................................................................ iv
List of Tables ................................................................................................................................. iv
List of Acronyms/Abbreviations..................................................................................................... v
Group A: Project Management ....................................................................................................... 1
A4: Project/Task Organization .........................................................................................1
A4.1 Management Responsibilities ........................................................................1
A4.2 Quality Assurance Responsibilities ...............................................................3
A5: Problem Definition/Background ................................................................................4
A6: Project/Task Description ............................................................................................4
A6.1 Description .....................................................................................................4
A6.2 Schedule .........................................................................................................5
A7: Quality Objectives and Criteria .................................................................................6
A8: Special Training/Certifications ..................................................................................9
A9: Documentation and Records ......................................................................................9
Group B: Data Generation and Acquisition for Low Speed Wind Tunnel Tests ........................ 10
B1: Sampling Process Design (Experimental Design) ...................................................10
B2: Sampling Methods for Measurement of Droplet Size, Deposition Flux, and Test Conditions ........................................................................................................11
B2.1 Sampling Locations .....................................................................................11
B2.2 Wind Tunnel Measurement of Spray Drift: Flux Volume ...........................13
B2.3 Wind Tunnel Measurement of Spray Drift: Deposition ..............................14
B2.4 Wind Tunnel Measurement of Spray Drift: Spray Size Distribution ..........14
B2.5 Measurement of Droplet Size Spectrum near the Nozzle (Determination of appropriate reference test system) ...........................................................16
B3: Sample Handling and Custody Requirements .........................................................17
B4: Analytical Methods ..................................................................................................17
B5: Quality Control ........................................................................................................17
B6: Instrument/Equipment Testing, Inspection, and Maintenance ................................18
B7: Instrument/Equipment Calibration and Frequency ..................................................18
B8: Inspection/Acceptance of Supplies and Consumables .............................................19
B9: Non-Direct Measurements .......................................................................................19
B10: Data Management ....................................................................................................19

Test/QA Plan for Pesticide Spray DRT in a Low Speed Wind Tunnel Version 1.0 May 2009 Page iii
B10.1 Data Acquisition and Management ..............................................................19
B10.2 Reporting......................................................................................................20
Group C: Assessments and Oversight Elements ........................................................................... 22
C1: Assessments and Response Actions.........................................................................22
C1.1 Internal Audits .............................................................................................22
C1.2 Audits of Data Quality .................................................................................22
C1.3 External Audits ............................................................................................22
C1.4 Corrective Action .........................................................................................22
C2: Reports to Management ...........................................................................................22
Group D: Data Validation and Usability Elements ....................................................................... 23
D1: Data Review, Verification, and Validation ..............................................................23
D2: Verification and Validation Methods.......................................................................23
D3: Reconciliation with Data Quality Objectives ..........................................................23
Appendix A: Applicable Documents and Procedures .................................................................. 24
1. EPA Documents .......................................................................................................24
2. RTI Documents ........................................................................................................24
3. Alion Science & Technology SOPs .........................................................................24
4. USDA/ARS SOPs ....................................................................................................25
5. Other Documents .....................................................................................................25
Appendix B: Organizational Charts for Testing the Low Speed Pesticide Spray DRT Protocol . 26
Appendix C: Alion SOP-WDE-08-02 – Standard Operating Procedure for the Turner Quantech Digital Filter Fluorometer ..................................................................................................... 27
Appendix D: Alion SOP-WDE-08-03 – Standard Operating Procedure for Analysis of Uranine-Tagged Aerosols ................................................................................................................... 36

Test/QA Plan for Pesticide Spray DRT in a Low Speed Wind Tunnel Version 1.0 May 2009 Page iv
List of Figures
Figure 1. Schedule .......................................................................................................................... 5 Figure 2. Plan view of aerosol wind tunnel. ................................................................................. 12 Figure 3. ETV data management system for Alion. ..................................................................... 20 Figure 4. Organizational chart for the high speed pesticide spray DRT protocol validation. ...... 26
List of Tables
Table 1. Data Quality Indicator Goals (DQIGs) ............................................................................. 6 Table 2. Quality Control Samples for Low Speed Wind Tunnel Tests. ....................................... 18
Test/QA Plan for Pesticide Spray DRT in a Low Speed Wind Tunnel Version 1.0 May 2009 Page v
List of Acronyms/Abbreviations
ADQ audit of data quality
ANSI American National Standards Institute
APCT Center Air Pollution Control Technology Center
ASABE American Society of Agricultural and Biological Engineers
ASAE American Society of Agricultural Engineers (precursor to ASABE)
ASHRAE American Society of Heating, Refrigerating, and Air Conditioning Engineers
ASME American Society of Mechanical Engineers
ASTM ASTM International, formerly American Society for Testing and Materials
ATF aerosol test facility
ºC degrees Celsius
cfm cubic feet per minute
cm centimeter
cP centipoise
CV coefficient of variance
DQIG data quality indicator goal
DQO data quality objective
DRT drift reduction technology
Dv0.x droplet diameter (µm) at which 0.x fraction of the spray volume is contained in smaller droplets
dyne/cm dynes per centimeter
EC emulsifiable concentrates
EPA United States Environmental Protection Agency
ESTE Environmental and Sustainable Technology Evaluations
ETV Environmental Technology Verification
fpm feet per minute
ft foot
gal/acre gallons per acre
gpm gallons per minute
GVP Generic Verification Protocol
HELOS helium neon laser optical system
HETS human exposure test section
HSWT high speed wind tunnel
Hz hertz
in. inches
ISO International Standards Organization
kPa kilopascal
L liter
Test/QA Plan for Pesticide Spray DRT in a Low Speed Wind Tunnel Version 1.0 May 2009 Page vi
Lpm, L/min liters per minute
m meters
mg milligram
min minute
mL milliliter
mm millimeter
mph miles per hour
ms millisecond
m/s meters per second
NIS nonionic surfactant
NIST National Institute of Standards and Technology
µL microliter
µm microns
OPP Office of Pesticide Programs
ORD Office of Research and Development
PE performance evaluation
PES performance evaluation system
PMT photo multiplier tube
psi pounds per square inch
QA quality assurance
QC quality control
QM quality manager
QMP quality management plan
QSM quality system manual
RFU relative fluorescence units
RH relative humidity
Rpm revolutions per minute
RTI Research Triangle Institute
s second
SNR signal to noise ratio
SOP standard operating procedure
TSA technical systems audit
USDA-ARS United States Department of Agriculture – Agricultural Research Service
VMD volume median diameter
v/v volume/volume
Test/QA Plan for Pesticide Spray DRT in a Low Speed Wind Tunnel Version 1.0 May 2009 Page vii
A3: Distribution List
U.S. EPA
Michael Kosusko Paul Groff
RTI International
Jonathan Thornburg, Ph.D. W. Cary Eaton, Ph.D. Jenia Tufts Andrew Dart
Alion Science & Technology
William Ellenson, Ph.D. Zora Drake-Richman Paulette Yongue
Test/QA Plan for Pesticide Spray DRT in a Low Speed Wind Tunnel Version 1.0 May 2009 Page 1
Group A: Project Management
A4: Project/Task Organization
The U.S. Environmental Protection Agency (EPA) Office of Research and Development (ORD) has overall responsibility for the Environmental Technology Verification (ETV) Program and for the Verification of Pesticide Drift Reduction Technologies project under the Environmental and Sustainable Technology Evaluations (ESTE) Program. The EPA’s Office of Pesticide Programs (OPP) is a major contributor to the project.
Management and testing of pesticide drift reduction technologies (DRTs) will be performed in accordance with procedures and protocols defined by a series of Air Pollution Control Technology (APCT) Center quality management documents. The primary source for the APCT Center quality system is EPA’s Policy and Program Requirements for the Mandatory Agency-Wide Quality System, EPA Order 5360.1 A2 (May 2000). The quality system that will govern testing under this plan is in compliance with the following:
� EPA Requirements for Quality Management Plans (EPA QA/R-2) � EPA Environmental Technology Verification Program, Quality Management Plan
(EPA ETV QMP), for the overall ETV program � APCT Center’s Verification Testing of Air Pollution Control Technology—Quality
Management Plan (APCT Center QMP)1 � RTI’s Draft Generic Verification Protocol for the Verification of Pesticide Spray
Drift Reduction Technologies for Row and Field Crops (GVP) � Alion Science & Technology Standard Operating Procedures (SOPs) � This test/quality assurance plan (test/QA plan). � Appendix A lists full citations for these documents. This test/QA plan is in
conformance with EPA Requirements for Quality Assurance Project Plans (EPA QA/R-5), EPA Guidance for Quality Assurance Project Plans (EPA QA/G-5), and the documents listed above.
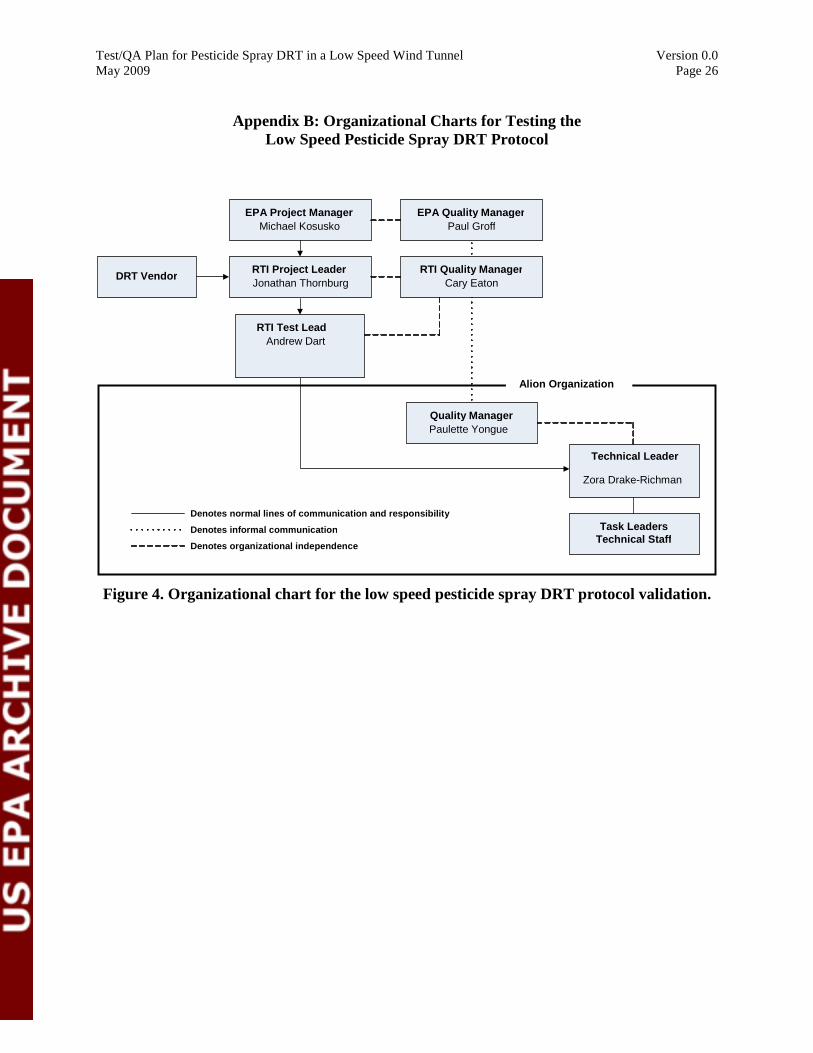
Alion Science & Technology (Alion) will perform the testing, analyze samples/data collected, and report and document the data. RTI will use the data to prepare the project reports and recommend revisions to the GVP. The various QA and management responsibilities are divided among Alion, RTI, and EPA key project personnel as defined below. The lines of authority among key personnel for this project are shown on the project organization chart in Figure 4 (Appendix B).
A4.1 Management Responsibilities
Project management responsibilities are divided among the Alion, RTI, and EPA staff as described below.
1 Each ESTE project is required to have a QMP in place and is allowed to use the QMP of an existing ETV Center. This project has elected to use the QMP from the APCT Center. The verification organization for DRT verifications that occur after completion of this ESTE project is anticipated to be the APCT Center and this document reflects that assumption. This does not preclude other testing organizations from using the protocol.
Test/QA Plan for Pesticide Spray DRT in a Low Speed Wind Tunnel Version 1.0 May 2009 Page 2
A4.1.1 EPA Project Manager
The EPA project manager, Michael Kosusko, has overall technical responsibility for the program. He is responsible for obtaining final approval of GVPs, test/QA plans, and reports, and he recommends the resources necessary to meet project objectives and requirements.
A4.1.2 RTI Project Leader
The RTI project leader is Jonathan Thornburg. He has overall responsibility for liaison with the EPA project manager and technical and administrative oversight of project activities. He prepared this Test/QA plan and technical questions should be directed to him. He will assign task leaders and review project documents, as appropriate.
A4.1.3 RTI Task Leader
The RTI task leader is Jenia Tufts. She has overall responsibility for data review and reporting. She will review the draft report prepared and submitted to RTI by Alion and will prepare the final report for submission to EPA.
A4.1.4 RTI Test Lead
The RTI test lead is Andrew Dart, who will:
� Review test/QA plans, � Provide oversight of test site activities.
A4.1.5 Testing Organization Technical Leaders
As manager of all projects in the ATF, William Ellenson will provide general project oversight.
The Alion technical leader is Zora Drake-Richman, who will:
� Assist the RTI project leader with the test scope, � Review/prepare operating procedures applicable to the testing, � Review test apparatus and procedures prior to commencement of testing, � Oversee testing of the pesticide spray DRT systems, � Review test data/results for attainment of data quality indicator goals (DQIGs) and
reasonableness, � Initiate corrective actions when needed, � Review test results, � Prepare test report, and � Submit test report to the RTI project leader.
Drake-Richman has overall responsibility for technical and administrative activities, and exercises technical leadership to promote quality in project performance. She will also function as liaison to RTI and U.S. EPA in specific technical areas and supervise the activities of project leaders at Alion.
Test/QA Plan for Pesticide Spray DRT in a Low Speed Wind Tunnel Version 1.0 May 2009 Page 3
A4.2 Quality Assurance Responsibilities
QA responsibilities are divided among the EPA, RTI, and Alion personnel as listed below.
A4.2.1 EPA Quality Manager
The EPA quality manager (EPA QM), Paul Groff, will conduct audits of RTI’s QA system and of specific technical activities on the project. He will be available to resolve any QA issues relating to performance and EPA’s QA requirements. Specific functions and duties of the EPA QM include approving the contents of this test/QA plan and subsequent revisions and reviewing QA reports prepared by RTI, including QA evaluations and audits. In addition, the EPA QM will:
� Communicate quality systems requirements, quality procedures, and quality issues to the EPA project manager and the RTI project leader,
� Review and approve this test/QA plan specific to Alion, � Oversee technical systems audits (TSAs) as appropriate, � Review and approve project test reports, and � Provide assistance to project personnel in resolving QA issues.
A4.2.2 RTI Quality Manager
The RTI quality manager (RTI QM), W. Cary Eaton, is organizationally independent of the RTI project leader and is responsible for ensuring that the QA/quality control (QC) procedures described in this test/QA plan are followed. In addition, Eaton will:
� Maintain regular communication with the EPA QM and RTI project staff regarding QA issues,
� Report on the adequacy, status, and effectiveness of the QA program on a regular basis to the RTI project leader,
� Conduct audits of lab activities as necessary and prepare audit reports, � Ensure that corrective action, if necessary, is properly implemented and documented, � Review and approve test/QA plans and SOPs, � Review any TSA reports of Alion testing, � Review the audit of data quality (ADQ) reports of Alion testing, � Review and approve test (including QC) reports, and � Prepare the QA section of the project report.
A4.2.3 Testing Organization Quality Managers
The Alion QM, Paulette Yongue, plays a central role in the introduction, implementation, and consistent application of continuous quality improvement at Alion. She will fulfill the role as quality management representative for the department and conduct audits of all pertinent quality standards to ensure compliance. Yongue will conduct an audit of data quality (ADQ) of a random selection of 10% of the data for all measured parameters at the end of each verification test in accordance with the requirements of sections A9.1 and B4.2 of Environmental Technology Verification Program Quality Management Plan (EPA, 2002a). Yongue will determine if these measurements allow attainment of the DQOs specified in the GVP and the DQI acceptance
Test/QA Plan for Pesticide Spray DRT in a Low Speed Wind Tunnel Version 1.0 May 2009 Page 4
criteria specified in the test/QA plan. She is organizationally independent of the unit generating the data. Yongue will:
� Maintain regular communication with the RTI QM and testing staff regarding QA issues,
� Report on the adequacy, status, and effectiveness of the QA program on a regular basis to the Alion technical leader,
� Conduct audits of lab activities as necessary and prepare audit reports, � Ensure that corrective action, if necessary, is properly implemented and documented, � Review and approve input of the test organization to the test/QA plans and SOPs, � Review and approve test data, documentation and reports submitted to RTI (including
QC), and � Provide input to the QA section of the project report.
A5: Problem Definition/Background
In 2007, U.S. EPA completed a draft protocol for the verification of pesticide spray drift reduction technologies for row and field crops. The Draft Generic Verification Protocol for the Verification of Pesticide Spray Drift Reduction Technologies for Row and Field Crops (http://www.epa.gov/etv/pubs/600etv07021.pdf) was developed by U.S. EPA with input and commentary from stakeholders that included academia, industry, and other government agencies. Before the pesticide spray DRT protocol can be implemented as an approved protocol for use by the ETV APCT Center, the draft protocol requires testing and evaluation. This test/QA plan for low speed wind tunnel testing at the U.S. EPA Aerosol Test Facility describes how the draft protocol for pesticide spray DRTs verification at low speeds, to simulate ground applications, will be validated. Once U.S. EPA approves the final report, U.S. EPA, RTI, vendors, test facilities, and other stakeholders will use the validation report to evaluate the low speed pesticide spray DRT protocol and suggest changes that will provide improvements.
Pesticide spray drift is defined as the movement of spray droplets through the air at the time of application or soon thereafter from the target site to any non- or off-target site, excluding pesticide movements by erosion, migration, volatility, or windblown soil particles after application. Low speed DRTs include nozzle designs and chemical adjuvants. Low speed is defined as a speed of the air in the wind tunnel crossing the nozzle representative of ground application. For this test/QA plan, the pesticide spray DRT protocol will be validated only for nozzle designs. Validation of the protocol through spray liquid formulation modifications to the viscosity, surface tension or other characteristics will not be conducted.
A6: Project/Task Description
A6.1 Description
This test/QA plan describes the test and QA procedures that will validate the Generic Verification Protocol for the Verification of Pesticide Spray Drift Reduction Technologies for Row and Field Crops for spray nozzles in a low speed wind tunnel. This test/QA plan is written to conform to all specifications of EPA Requirements for Quality Assurance Project Plans, EPA QA/R-5, the EPA ETV QMP, and the ETV APCT Center QMP. It describes the quality system
Test/QA Plan for Pesticide Spray DRT in a Low Speed Wind Tunnel Version 1.0 May 2009 Page 5
required of Alion and the procedures applicable to meeting EPA quality requirements that are common to all ETV tests. This document will be reviewed and approved by EPA prior to testing.
This testing will gather information and data for evaluating the applicability of the pesticide spray DRT protocol for successfully testing commercially ready pesticide spray DRT nozzles that will be used for ground spraying applications. All low speed tests will be conducted in the U.S. EPA Aerosol Test Facility located at the U.S. EPA research facility in Research Triangle Park, NC. Alion is an on-site support contractor to U.S. EPA charged with operating and maintaining the Aerosol Test Facility. Alion, under a subcontract with RTI, will operate the low speed wind tunnel. The specific operating conditions used during the testing will be documented as part of the testing process. Table 1 in element A7 presents a summary of measurements that will be made to evaluate the performance of the DRT and document the test conditions.
Two candidate nozzles and a reference nozzle will be tested using the pesticide spray DRT protocol. The AI-11003 VS nozzle (Teejet Technologies, Wheaton, IL) is one candidate nozzle to be tested. This air eduction nozzle will produce a “very coarse” spray, as defined by ASAE S572 (1999), at the operating conditions defined in element B1. This nozzle is used extensively by industry and its performance characteristics have been extensively studied. The ULD 120-04 nozzle (Hypropumps, New York, NY) is the second candidate nozzle to be tested. This dual air eduction nozzle also is extensively used by industry. The ULD 120-04 nozzle will produce a “coarse” spray at the operating conditions defined in element B1. The characteristics of the reference nozzle to be used during the testing are specified in element B1. USDA-ARS will provide the reference nozzle for the LSWT tests.
A report containing results of the pesticide spray DRT protocol validation tests will be prepared by Alion; see element B10.2. RTI will review and approve the report before submittal of the entire data package to U.S. EPA.
A6.2 Schedule
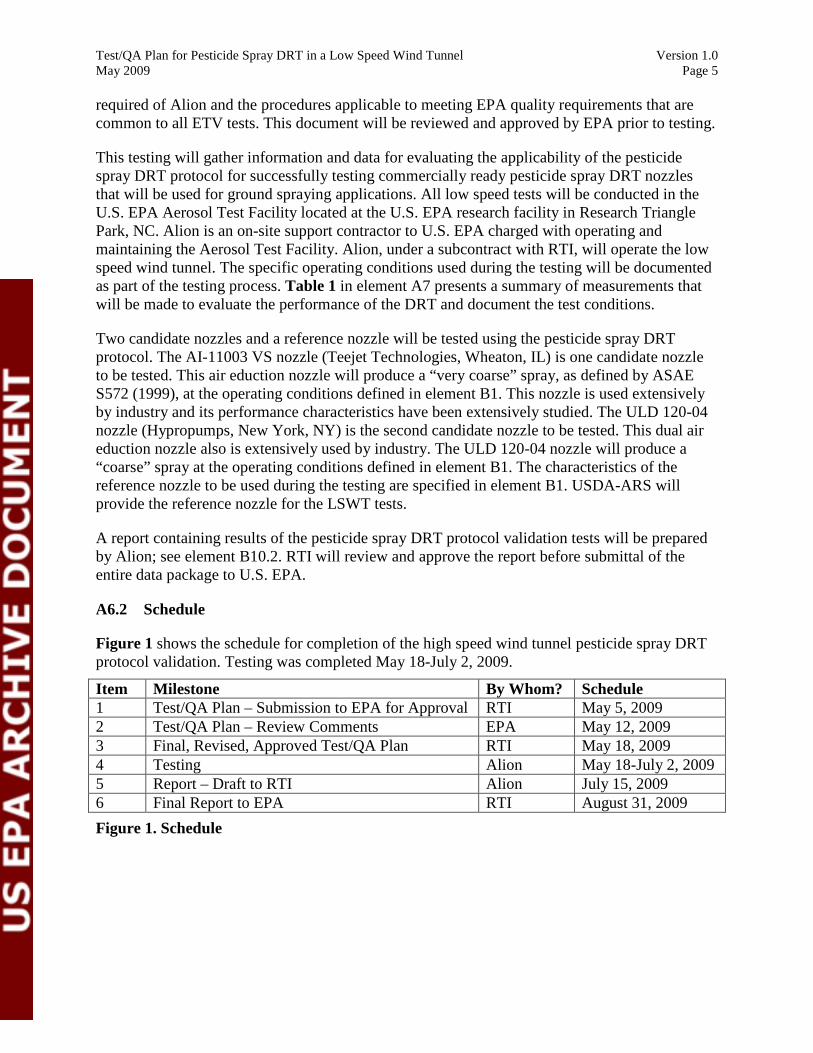
Figure 1 shows the schedule for completion of the high speed wind tunnel pesticide spray DRT protocol validation. Testing was completed May 18-July 2, 2009.
Item Milestone By Whom? Schedule 1 Test/QA Plan – Submission to EPA for Approval RTI May 5, 2009 2 Test/QA Plan – Review Comments EPA May 12, 2009 3 Final, Revised, Approved Test/QA Plan RTI May 18, 2009 4 Testing Alion May 18-July 2, 2009 5 Report – Draft to RTI Alion July 15, 2009 6 Final Report to EPA RTI August 31, 2009
Figure 1. Schedule
Test/QA Plan for Pesticide Spray DRT in a Low Speed Wind Tunnel Version 1.0 May 2009 Page 6
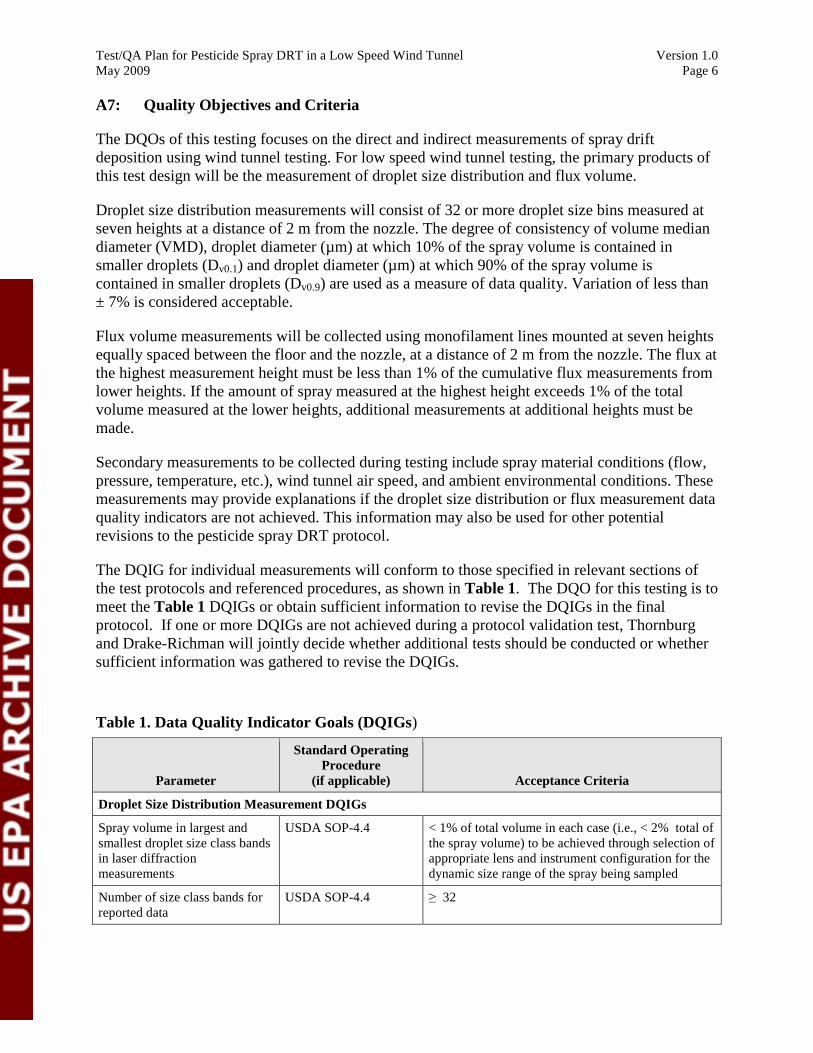
A7: Quality Objectives and Criteria
The DQOs of this testing focuses on the direct and indirect measurements of spray drift deposition using wind tunnel testing. For low speed wind tunnel testing, the primary products of this test design will be the measurement of droplet size distribution and flux volume.
Droplet size distribution measurements will consist of 32 or more droplet size bins measured at seven heights at a distance of 2 m from the nozzle. The degree of consistency of volume median diameter (VMD), droplet diameter (µm) at which 10% of the spray volume is contained in smaller droplets (Dv0.1) and droplet diameter (µm) at which 90% of the spray volume is contained in smaller droplets (Dv0.9) are used as a measure of data quality. Variation of less than ± 7% is considered acceptable.
Flux volume measurements will be collected using monofilament lines mounted at seven heights equally spaced between the floor and the nozzle, at a distance of 2 m from the nozzle. The flux at the highest measurement height must be less than 1% of the cumulative flux measurements from lower heights. If the amount of spray measured at the highest height exceeds 1% of the total volume measured at the lower heights, additional measurements at additional heights must be made.
Secondary measurements to be collected during testing include spray material conditions (flow, pressure, temperature, etc.), wind tunnel air speed, and ambient environmental conditions. These measurements may provide explanations if the droplet size distribution or flux measurement data quality indicators are not achieved. This information may also be used for other potential revisions to the pesticide spray DRT protocol.
The DQIG for individual measurements will conform to those specified in relevant sections of the test protocols and referenced procedures, as shown in Table 1. The DQO for this testing is to meet the Table 1 DQIGs or obtain sufficient information to revise the DQIGs in the final protocol. If one or more DQIGs are not achieved during a protocol validation test, Thornburg and Drake-Richman will jointly decide whether additional tests should be conducted or whether sufficient information was gathered to revise the DQIGs.
Table
1. Data Quality Indicator Goals (DQIGs)
Parameter
Standard Operating Procedure
(if applicable) Acceptance Criteria
Droplet Size Distribution Measurement DQIGs
Spray volume in largest and smallest droplet size class bands in laser diffraction measurements
USDA SOP-4.4 < 1% of total volume in each case (i.e., < 2% total of the spray volume) to be achieved through selection of appropriate lens and instrument configuration for the dynamic size range of the spray being sampled
Number reported
of size data
class bands for USDA SOP-4.4 ≥ 32

Test/QA Plan for Pesticide Spray DRT in a Low Speed Wind Tunnel Version 1.0 May 2009 Page 7
Parameter
Standard Operating Procedure
(if applicable) Acceptance Criteria
Standard deviation around mean Dv0.5 for three replicate droplet size measurements
USDA SOP-4.4 Vary by with the
less than ± 3% same nozzle
for replicate measurements
Measured volume median diameter (VMD), Dv0.1 and Dv0.9 (i.e., the droplet diameter bounding the upper and lower 10% fractions of the spray)
USDA SOP-4.4 Vary by with the
less than ± 7% same nozzle
for replicate measurements
Obscuration for spray measurements across a spray diameter (for laser diffraction systems)
USDA SOP-4.4 < 60% unless corrected for multiple scattering, whereupon the report shall include the measured obscuration, the algorithm used to correct for multiple scattering, and the manufacturer-stated limits of applicability for that algorithm.
Minimum obscuration for sampling to achieve cross-section average spray (e.g., start and end trigger using traverse with laser diffraction systems)
USDA SOP-4.4 2%
Sample size per measurement
replicate USDA SOP-4.4 > >
10,000 5 s for
droplets for particle counting laser diffraction instruments
instruments or
Diode suppression (laser diffraction systems)
n/a Diodes may not be suppressed (no channels may be killed) in sampling. Correct selection of focal length lens, system alignment, avoidance of vibrations, and cleanliness of optical surfaces should prevent the need for diode suppression (data loss). (If the laser is displaced during sampling, all diodes will measure incorrect scattering angles. Diode suppression is not an appropriate solution to such sampling problems.)
Spray nozzle measurement
height n/a Within 5 mm (without airflow)
Nozzle spray angle n/a Variation within ± 5% during test.
Spray liquid pressure operating pressure)
(nozzle ASAE S572 ± 0.5 psi of values specified for reference and evaluation
in the ASAE nozzles.
standard
Spray liquid temperature ASHRAE Standard 41.1 Measured within 0.1 ºC
Spray liquid flow rate ASAE S572 ± 0.04 L/min of values specified in the ASAE standard for reference and evaluation nozzles.
Dynamic surface spray liquid
tension of RTI CAT:46 52 ± 4 ms for water,
dynes/cm at surface lifetime age test fluids with adjuvants. 70 ± 4 if used as test fluid.
of 10 to 20 dynes/cm for
Viscosity of spray liquid RTI CAT:47 1.1 ± 0.1 cP at 20 ºC
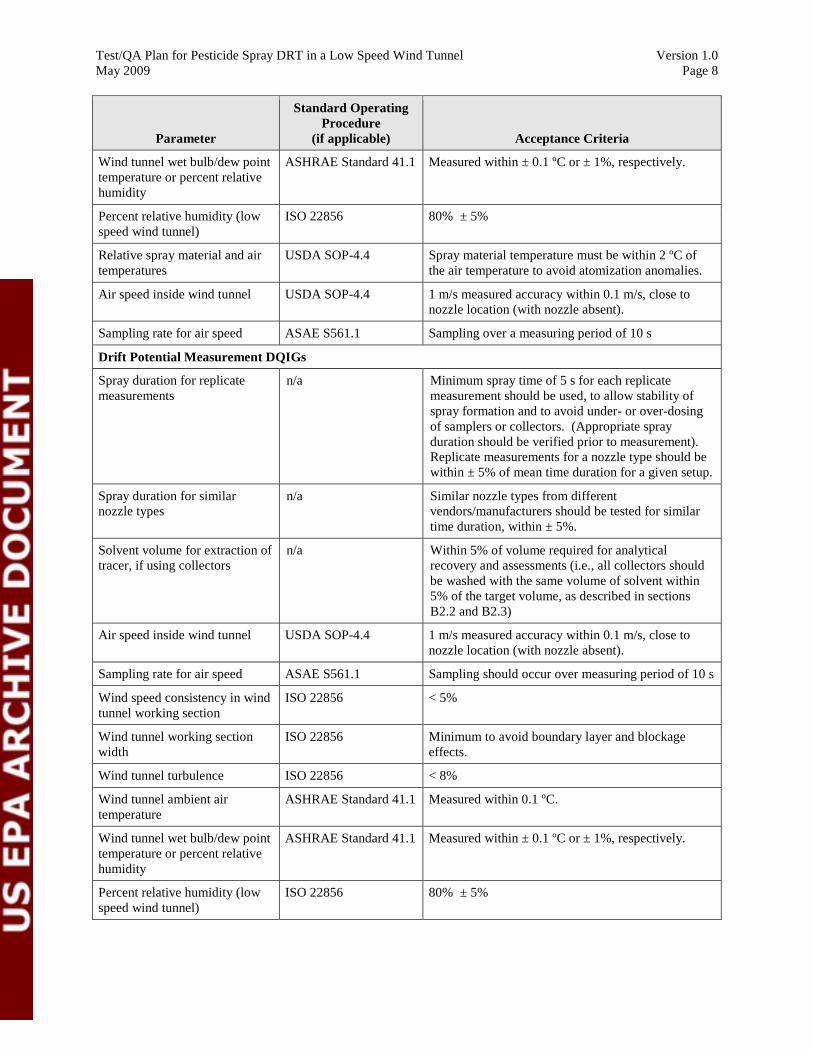
Wind tunnel temperature
ambient air ASHRAE Standard 41.1 Measured within 0.1 ºC.
Test/QA Plan for Pesticide Spray DRT in a Low Speed Wind Tunnel Version 1.0 May 2009 Page 8
Parameter
Standard Operating Procedure
(if applicable) Acceptance Criteria
Wind tunnel temperature humidity
wet bulb/dew point or percent relative
ASHRAE Standard 41.1 Measured within ± 0.1 ºC or ± 1%, respectively.
Percent relative humidity speed wind tunnel)
(low ISO 22856 80% ± 5%
Relative spray temperatures
material and air USDA SOP-4.4 Spray the air
material temperature temperature to avoid
must be within 2 ºC of atomization anomalies.
Air speed inside wind tunnel USDA SOP-4.4 1 m/s measured nozzle location
accuracy within 0.1 m/s, (with nozzle absent).
close to
Sampling rate for air speed ASAE S561.1 Sampling over a measuring period of 10 s
Drift Potential Measurement DQIGs
Spray duration measurements
for replicate n/a Minimum spray time of 5 s for each replicate measurement should be used, to allow stability of spray formation and to avoid under- or over-dosing of samplers or collectors. (Appropriate spray duration should be verified prior to measurement). Replicate measurements for a nozzle type should be within ± 5% of mean time duration for a given setup.
Spray duration nozzle types
for similar n/a Similar nozzle types from different vendors/manufacturers should be tested time duration, within ± 5%.
for similar
Solvent volume for extraction tracer, if using collectors
of n/a Within 5% of volume required for analytical recovery and assessments (i.e., all collectors should be washed with the same volume of solvent within 5% of the target volume, as described in sections B2.2 and B2.3)
Air speed inside wind tunnel USDA SOP-4.4 1 m/s measured nozzle location
accuracy within 0.1 m/s, (with nozzle absent).
close to
Sampling rate for air speed ASAE S561.1 Sampling should occur over measuring period of 10 s
Wind speed consistency tunnel working section
in wind ISO 22856 < 5%
Wind width
tunnel working section ISO 22856 Minimum effects.
to avoid boundary layer and blockage
Wind tunnel turbulence ISO 22856 < 8%
Wind tunnel temperature
ambient air ASHRAE Standard 41.1 Measured within 0.1 ºC.
Wind tunnel temperature humidity
wet bulb/dew point or percent relative
ASHRAE Standard 41.1 Measured within ± 0.1 ºC or ± 1%, respectively.
Percent relative humidity speed wind tunnel)
(low ISO 22856 80% ± 5%
Test/QA Plan for Pesticide Spray DRT in a Low Speed Wind Tunnel Version 1.0 May 2009 Page 9
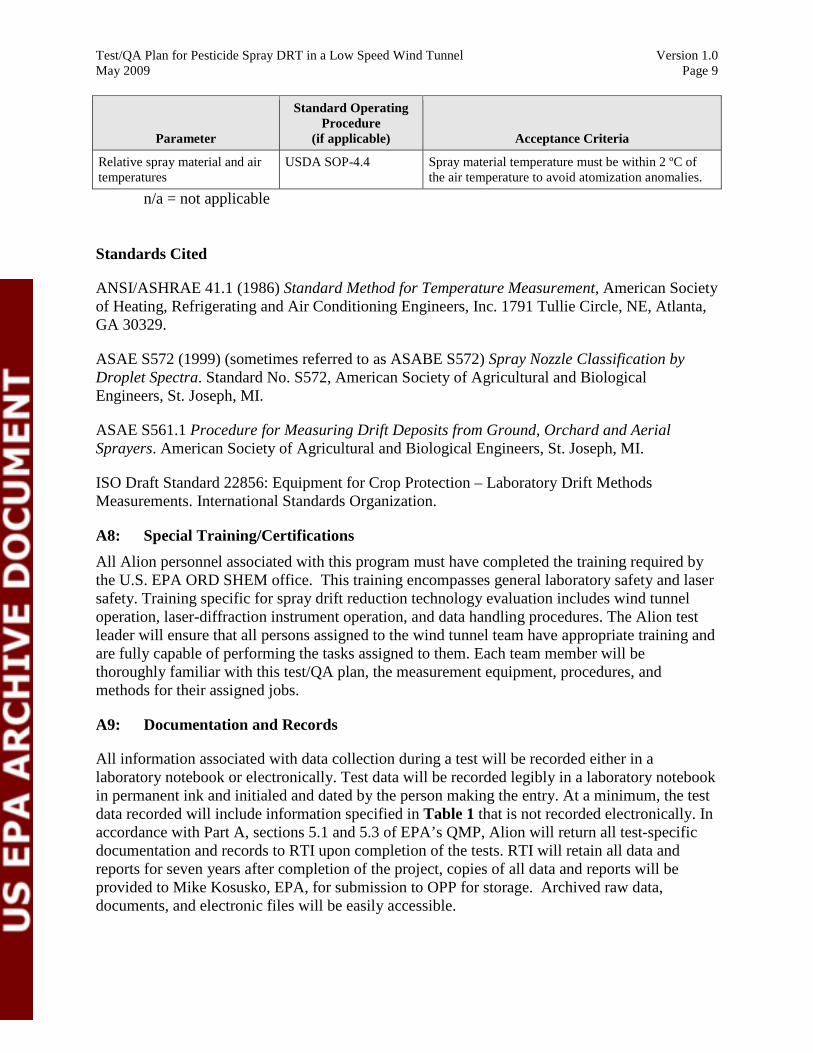
Standard Operating Procedure
Parameter (if applicable) Acceptance Criteria
Relative spray material and air USDA SOP-4.4 Spray material temperature must be within 2 ºC of temperatures the air temperature to avoid atomization anomalies.
n/a = not applicable Standards Cited
ANSI/ASHRAE 41.1 (1986) Standard Method for Temperature Measurement, American Society of Heating, Refrigerating and Air Conditioning Engineers, Inc. 1791 Tullie Circle, NE, Atlanta, GA 30329.
ASAE S572 (1999) (sometimes referred to as ASABE S572) Spray Nozzle Classification by Droplet Spectra. Standard No. S572, American Society of Agricultural and Biological Engineers, St. Joseph, MI.
ASAE S561.1 Procedure for Measuring Drift Deposits from Ground, Orchard and Aerial Sprayers. American Society of Agricultural and Biological Engineers, St. Joseph, MI.
ISO Draft Standard 22856: Equipment for Crop Protection – Laboratory Drift Methods Measurements. International Standards Organization.
A8: Special Training/Certifications
All Alion personnel associated with this program must have completed the training required by the U.S. EPA ORD SHEM office. This training encompasses general laboratory safety and laser safety. Training specific for spray drift reduction technology evaluation includes wind tunnel operation, laser-diffraction instrument operation, and data handling procedures. The Alion test leader will ensure that all persons assigned to the wind tunnel team have appropriate training and are fully capable of performing the tasks assigned to them. Each team member will be thoroughly familiar with this test/QA plan, the measurement equipment, procedures, and methods for their assigned jobs.
A9: Documentation and Records
All information associated with data collection during a test will be recorded either in a laboratory notebook or electronically. Test data will be recorded legibly in a laboratory notebook in permanent ink and initialed and dated by the person making the entry. At a minimum, the test data recorded will include information specified in Table 1 that is not recorded electronically. In accordance with Part A, sections 5.1 and 5.3 of EPA’s QMP, Alion will return all test-specific documentation and records to RTI upon completion of the tests. RTI will retain all data and reports for seven years after completion of the project, copies of all data and reports will be provided to Mike Kosusko, EPA, for submission to OPP for storage. Archived raw data, documents, and electronic files will be easily accessible.
Test/QA Plan for Pesticide Spray DRT in a Low Speed Wind Tunnel Version 0.0 May 2009 Page 10
Group B: Data Generation and Acquisition for Low Speed Wind Tunnel Tests
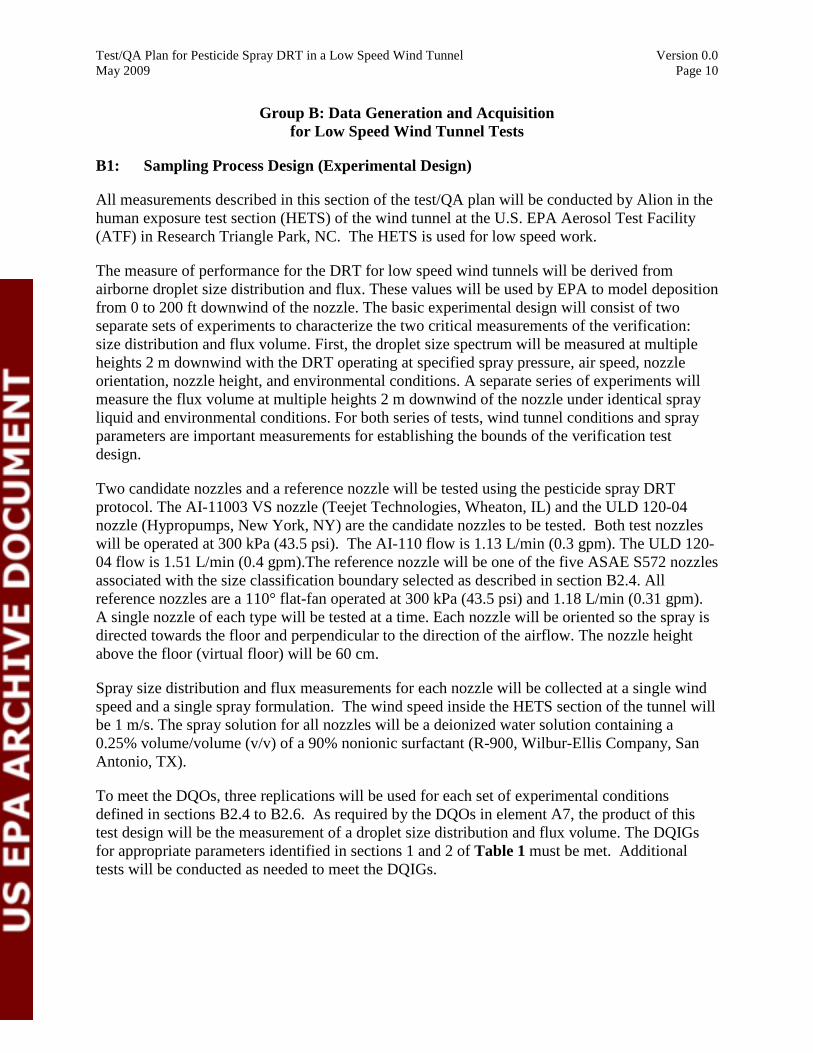
B1: Sampling Process Design (Experimental Design)
All measurements described in this section of the test/QA plan will be conducted by Alion in the human exposure test section (HETS) of the wind tunnel at the U.S. EPA Aerosol Test Facility (ATF) in Research Triangle Park, NC. The HETS is used for low speed work.
The measure of performance for the DRT for low speed wind tunnels will be derived from airborne droplet size distribution and flux. These values will be used by EPA to model deposition from 0 to 200 ft downwind of the nozzle. The basic experimental design will consist of two separate sets of experiments to characterize the two critical measurements of the verification: size distribution and flux volume. First, the droplet size spectrum will be measured at multiple heights 2 m downwind with the DRT operating at specified spray pressure, air speed, nozzle orientation, nozzle height, and environmental conditions. A separate series of experiments will measure the flux volume at multiple heights 2 m downwind of the nozzle under identical spray liquid and environmental conditions. For both series of tests, wind tunnel conditions and spray parameters are important measurements for establishing the bounds of the verification test design.
Two candidate nozzles and a reference nozzle will be tested using the pesticide spray DRT protocol. The AI-11003 VS nozzle (Teejet Technologies, Wheaton, IL) and the ULD 120-04 nozzle (Hypropumps, New York, NY) are the candidate nozzles to be tested. Both test nozzles will be operated at 300 kPa (43.5 psi). The AI-110 flow is 1.13 L/min (0.3 gpm). The ULD 120-04 flow is 1.51 L/min (0.4 gpm).The reference nozzle will be one of the five ASAE S572 nozzles associated with the size classification boundary selected as described in section B2.4. All reference nozzles are a 110° flat-fan operated at 300 kPa (43.5 psi) and 1.18 L/min (0.31 gpm). A single nozzle of each type will be tested at a time. Each nozzle will be oriented so the spray is directed towards the floor and perpendicular to the direction of the airflow. The nozzle height above the floor (virtual floor) will be 60 cm.
Spray size distribution and flux measurements for each nozzle will be collected at a single wind speed and a single spray formulation. The wind speed inside the HETS section of the tunnel will be 1 m/s. The spray solution for all nozzles will be a deionized water solution containing a 0.25% volume/volume (v/v) of a 90% nonionic surfactant (R-900, Wilbur-Ellis Company, San Antonio, TX).
To meet the DQOs, three replications will be used for each set of experimental conditions defined in sections B2.4 to B2.6. As required by the DQOs in element A7, the product of this test design will be the measurement of a droplet size distribution and flux volume. The DQIGs for appropriate parameters identified in sections 1 and 2 of Table 1 must be met. Additional tests will be conducted as needed to meet the DQIGs.
Test/QA Plan for Pesticide Spray DRT in a Low Speed Wind Tunnel Version 0.0 May 2009 Page 11
B2: Sampling Methods for Measurement of Droplet Size, Deposition Flux, and Test Conditions
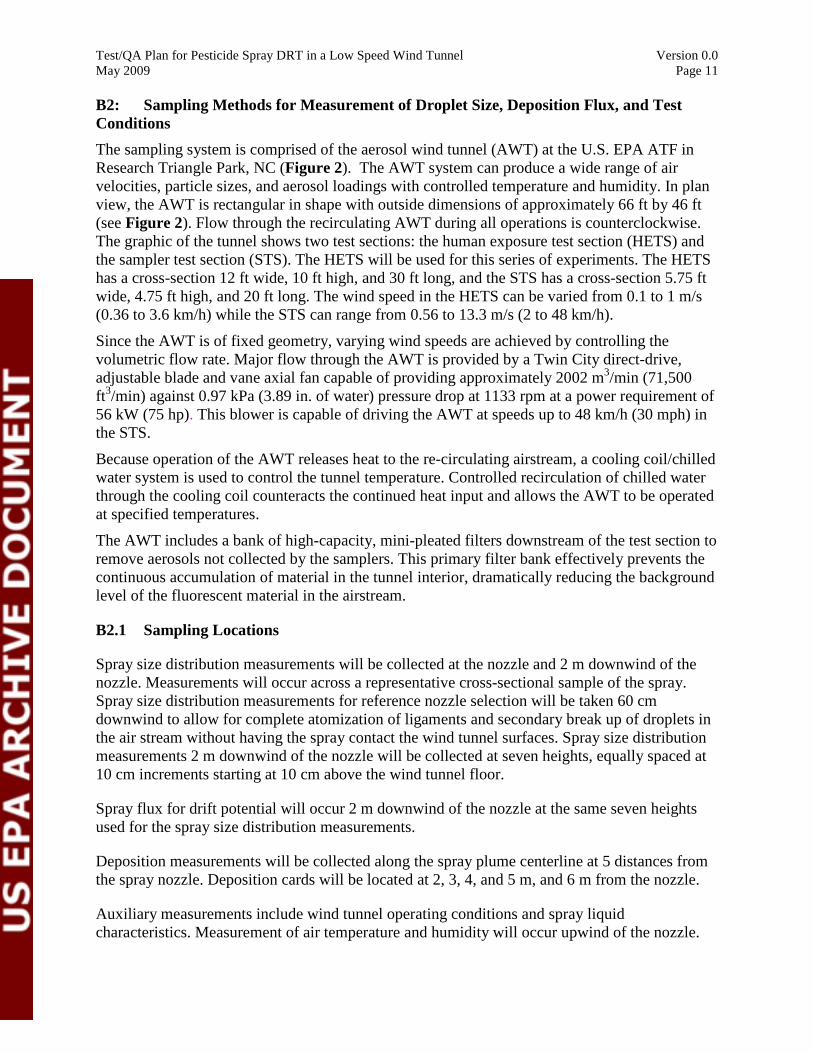
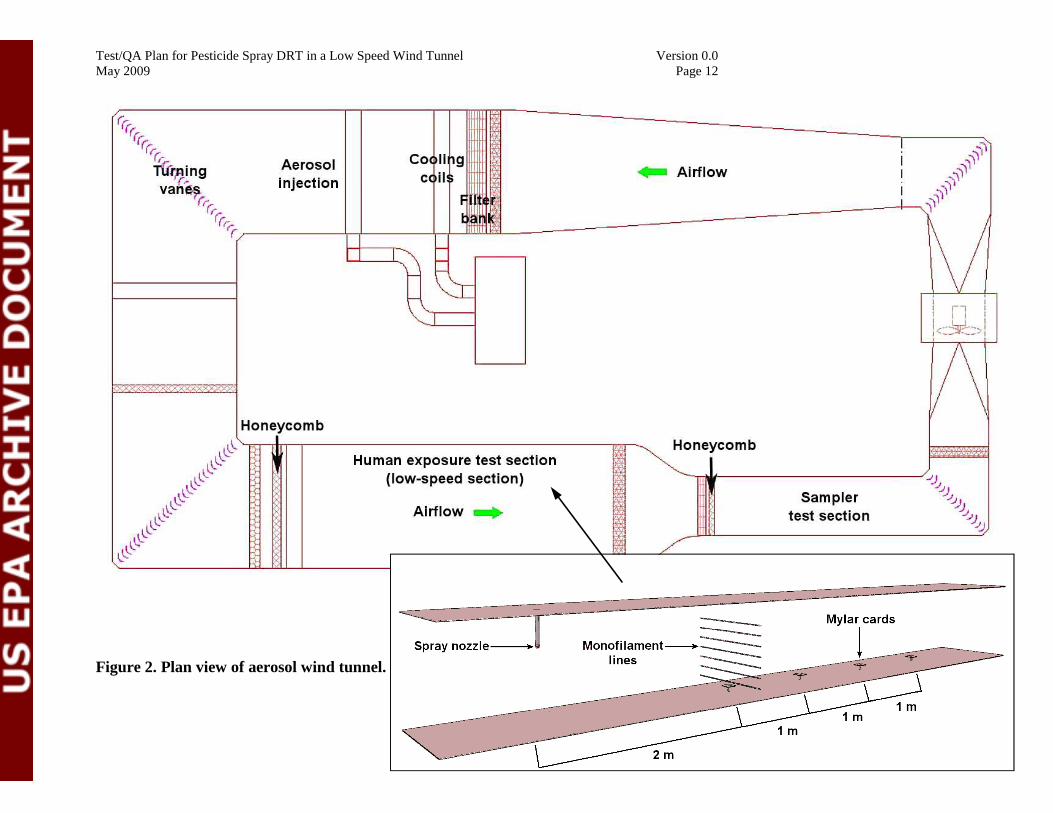
The sampling system is comprised of the aerosol wind tunnel (AWT) at the U.S. EPA ATF in Research Triangle Park, NC (Figure 2). The AWT system can produce a wide range of air velocities, particle sizes, and aerosol loadings with controlled temperature and humidity. In plan view, the AWT is rectangular in shape with outside dimensions of approximately 66 ft by 46 ft (see Figure 2). Flow through the recirculating AWT during all operations is counterclockwise. The graphic of the tunnel shows two test sections: the human exposure test section (HETS) and the sampler test section (STS). The HETS will be used for this series of experiments. The HETS has a cross-section 12 ft wide, 10 ft high, and 30 ft long, and the STS has a cross-section 5.75 ft wide, 4.75 ft high, and 20 ft long. The wind speed in the HETS can be varied from 0.1 to 1 m/s (0.36 to 3.6 km/h) while the STS can range from 0.56 to 13.3 m/s (2 to 48 km/h).
Since the AWT is of fixed geometry, varying wind speeds are achieved by controlling the volumetric flow rate. Major flow through the AWT is provided by a Twin City direct-drive, adjustable blade and vane axial fan capable of providing approximately 2002 m3/min (71,500 ft3/min) against 0.97 kPa (3.89 in. of water) pressure drop at 1133 rpm at a power requirement of 56 kW (75 hp). This blower is capable of driving the AWT at speeds up to 48 km/h (30 mph) in the STS.
Because operation of the AWT releases heat to the re-circulating airstream, a cooling coil/chilled water system is used to control the tunnel temperature. Controlled recirculation of chilled water through the cooling coil counteracts the continued heat input and allows the AWT to be operated at specified temperatures.
The AWT includes a bank of high-capacity, mini-pleated filters downstream of the test section to remove aerosols not collected by the samplers. This primary filter bank effectively prevents the continuous accumulation of material in the tunnel interior, dramatically reducing the background level of the fluorescent material in the airstream.
B2.1 Sampling Locations
Spray size distribution measurements will be collected at the nozzle and 2 m downwind of the nozzle. Measurements will occur across a representative cross-sectional sample of the spray. Spray size distribution measurements for reference nozzle selection will be taken 60 cm downwind to allow for complete atomization of ligaments and secondary break up of droplets in the air stream without having the spray contact the wind tunnel surfaces. Spray size distribution measurements 2 m downwind of the nozzle will be collected at seven heights, equally spaced at 10 cm increments starting at 10 cm above the wind tunnel floor.
Spray flux for drift potential will occur 2 m downwind of the nozzle at the same seven heights used for the spray size distribution measurements.
Deposition measurements will be collected along the spray plume centerline at 5 distances from the spray nozzle. Deposition cards will be located at 2, 3, 4, and 5 m, and 6 m from the nozzle.
Auxiliary measurements include wind tunnel operating conditions and spray liquid characteristics. Measurement of air temperature and humidity will occur upwind of the nozzle.
Test/QA Plan for Pesticide Spray DRT in a Low Speed Wind Tunnel Version 0.0 May 2009 Page 12
Figure 2. Plan view of aerosol wind tunnel.
Test/QA Plan for Pesticide Spray DRT in a Low Speed Wind Tunnel Version 0.0 May 2009 Page 13
Air speed will be measured 7 m downwind of the nozzle at the nozzle height (60 cm). Air speed measurement closer to the nozzle is not possible because the size of the anemometer available for the measurements will induce turbulence that may impact the spray plume characteristics. Spray liquid temperature will be measured in the reservoir tank. Spray pressure will be measured immediately upstream of the nozzle. Spray liquid flow rate will be measured by collecting the spray at the nozzle after the correct pressure is set.
B2.2 Wind Tunnel Measurement of Spray Drift: Flux Volume
The specific steps to be performed during an experiment for determining spray flux volume 2 m from the nozzle are described below.
1. The spraying system will be suspended from a boom within the wind tunnel. The boom is situated to minimize effects on airflow. The test nozzle will be positioned at the specified height, oriented downward toward the floor. The angle of discharge will be confirmed with a protractor and recorded.
2. The test spray nozzle(s) will be mounted at a defined height not less than 600 mm above the wind tunnel floor and not greater than a height 100 mm below the wind tunnel ceiling. Nozzles must be positioned in a place free from edge effects.
3. The spraying system will be primed with spray prior to measurements to ensure that rinsing liquid is removed from the line and the liquid discharging from the nozzle is the actual intended tank mix. The spray nozzles will be “run-in” for 5 min to ensure removal of machining burrs or plastic mold residue.
4. For these experiments, uranine will be the fluorescent tracer added to the spray liquid described in section B1 for easy detection of droplet deposition on the monofilament lines. The minimum uranine concentration will be 13.6 g per gallon (3.6 g per L) of the spray liquid.
5. Spray material conditions will be measured once per test. Flow rate will be measured at the specified operating pressure by collecting the spray from the nozzle into a glass, class A, graduated cylinder over a time of 10 s. Spray pressure will be measured using a calibrated pressure gauge with 0.5 psi sensitivity.
6. The wind tunnel floor will be covered with an artificial turf surface to minimize droplet bounce and mimic stubble vegetation for field conditions.
7. Air speed in the wind tunnel will be 1 m/s ± 0.1 m/s, as measured with a CSAT3 sonic anemometer (Campbell Scientific). The minimum data collection rate will be one measurement per 30 s.
8. To minimize evaporation effects, the relative humidity in the working section of the wind tunnel at the time of measurements will be at least 80 ± 5%. Temperature inside the wind tunnel will be measured at the same location. Temperature and relative humidity are determined using a HMT 330 probe (Vaisala).
Test/QA Plan for Pesticide Spray DRT in a Low Speed Wind Tunnel Version 0.0 May 2009 Page 14
9. Monofilament line approximately 2 mm in diameter will be used as sample collectors. These will be extended horizontally across the wind tunnel at seven heights starting at 10 cm above the floor and spaced in 10 cm increments. Each end of the monofilament line will be supported in enclosed boxes within the AWT to prevent contamination of the unused portion of sampling line.
10. Spray duration for an experiment will be 10 ± 0.5 s.
11. Immediately after an experiment, the exposed monofilament line will be collected into a labeled plastic bag. 30 mL of 0.01N NaOH will be added to the bag to dissolve the uranine into solution. The bag contents will be shaken for 10 s before an aliquot of the liquid is removed for fluorometric analysis (section B4).
12. A 100 mL sample of spray liquid will be collected directly from the spray tank reservoir for viscosity and surface tension analysis, as described in section B4.
B2.3 Wind Tunnel Measurement of Spray Drift: Deposition
Spray drop deposition at multiple horizontal distances from the nozzle will be collected simultaneously with the spray flux volume samples. Deposition sampling onto mylar cards will be used to measure horizontal deposition within the wind tunnel (see element B2.5).
1. Test conditions described in section B2.2 will be followed in addition to the conditions specific to deposition measurements, specified below.
2. Deposition samples will be collected on 10 cm by 10 cm (100 cm2) mylar cards (GE Healthcare Biosciences, VWR part # 95017-735).
3. Mylar cards will be placed directly downwind from the nozzle aligned with the plume centerline on metal support stands located 2, 3, 4, 5 and 6 m downwind of the nozzle. The cards will be at a height of 0.1 m above the wind tunnel floor to avoid boundary layer effects.
4. Immediately after an experiment, the exposed mylar cards will be collected and placed in a labeled plastic bag. 30 mL of 0.01N NaOH will be added to the bag to dissolve the uranine into solution. The bag contents will be shaken for 10 s before an aliquot of the liquid is removed for fluorometric analysis (section B4).
B2.4 Wind Tunnel Measurement of Spray Drift: Spray Size Distribution
Separate experiments from those described in sections B2.2 and B2.3 will be conducted to measure the spray size distribution 2 m from the nozzle. Separate experiments are required because the wind tunnel is not configured to allow simultaneous measurement of spray flux volume, deposition, and size distribution. The experimental procedure to collect the size distribution data is described below.
Test/QA Plan for Pesticide Spray DRT in a Low Speed Wind Tunnel Version 0.0 May 2009 Page 15
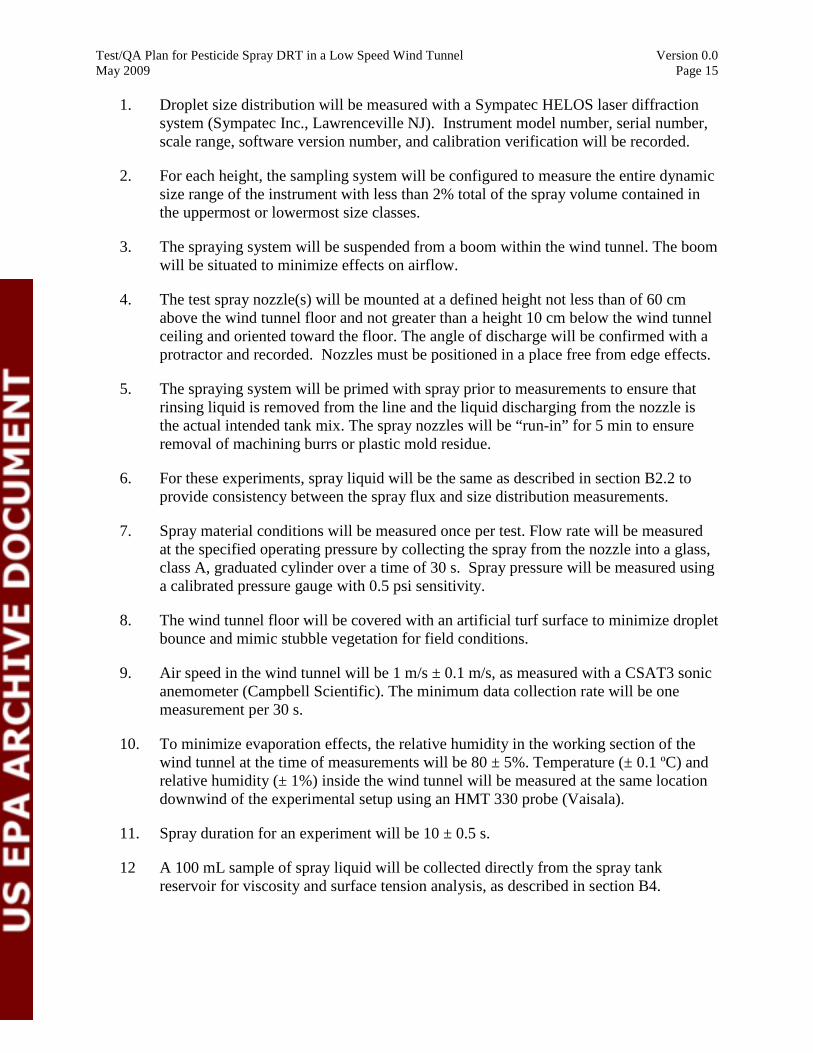
1. Droplet size distribution will be measured with a Sympatec HELOS laser diffraction system (Sympatec Inc., Lawrenceville NJ). Instrument model number, serial number, scale range, software version number, and calibration verification will be recorded.
2. For each height, the sampling system will be configured to measure the entire dynamic size range of the instrument with less than 2% total of the spray volume contained in the uppermost or lowermost size classes.
3. The spraying system will be suspended from a boom within the wind tunnel. The boom will be situated to minimize effects on airflow.
4. The test spray nozzle(s) will be mounted at a defined height not less than of 60 cm above the wind tunnel floor and not greater than a height 10 cm below the wind tunnel ceiling and oriented toward the floor. The angle of discharge will be confirmed with a protractor and recorded. Nozzles must be positioned in a place free from edge effects.
5. The spraying system will be primed with spray prior to measurements to ensure that rinsing liquid is removed from the line and the liquid discharging from the nozzle is the actual intended tank mix. The spray nozzles will be “run-in” for 5 min to ensure removal of machining burrs or plastic mold residue.
6. For these experiments, spray liquid will be the same as described in section B2.2 to provide consistency between the spray flux and size distribution measurements.
7. Spray material conditions will be measured once per test. Flow rate will be measured at the specified operating pressure by collecting the spray from the nozzle into a glass, class A, graduated cylinder over a time of 30 s. Spray pressure will be measured using a calibrated pressure gauge with 0.5 psi sensitivity.
8. The wind tunnel floor will be covered with an artificial turf surface to minimize droplet bounce and mimic stubble vegetation for field conditions.
9. Air speed in the wind tunnel will be 1 m/s ± 0.1 m/s, as measured with a CSAT3 sonic anemometer (Campbell Scientific). The minimum data collection rate will be one measurement per 30 s.
10. To minimize evaporation effects, the relative humidity in the working section of the wind tunnel at the time of measurements will be 80 ± 5%. Temperature (± 0.1 ºC) and relative humidity (± 1%) inside the wind tunnel will be measured at the same location downwind of the experimental setup using an HMT 330 probe (Vaisala).
11. Spray duration for an experiment will be 10 ± 0.5 s.
12 A 100 mL sample of spray liquid will be collected directly from the spray tank reservoir for viscosity and surface tension analysis, as described in section B4.
Test/QA Plan for Pesticide Spray DRT in a Low Speed Wind Tunnel Version 0.0 May 2009 Page 16
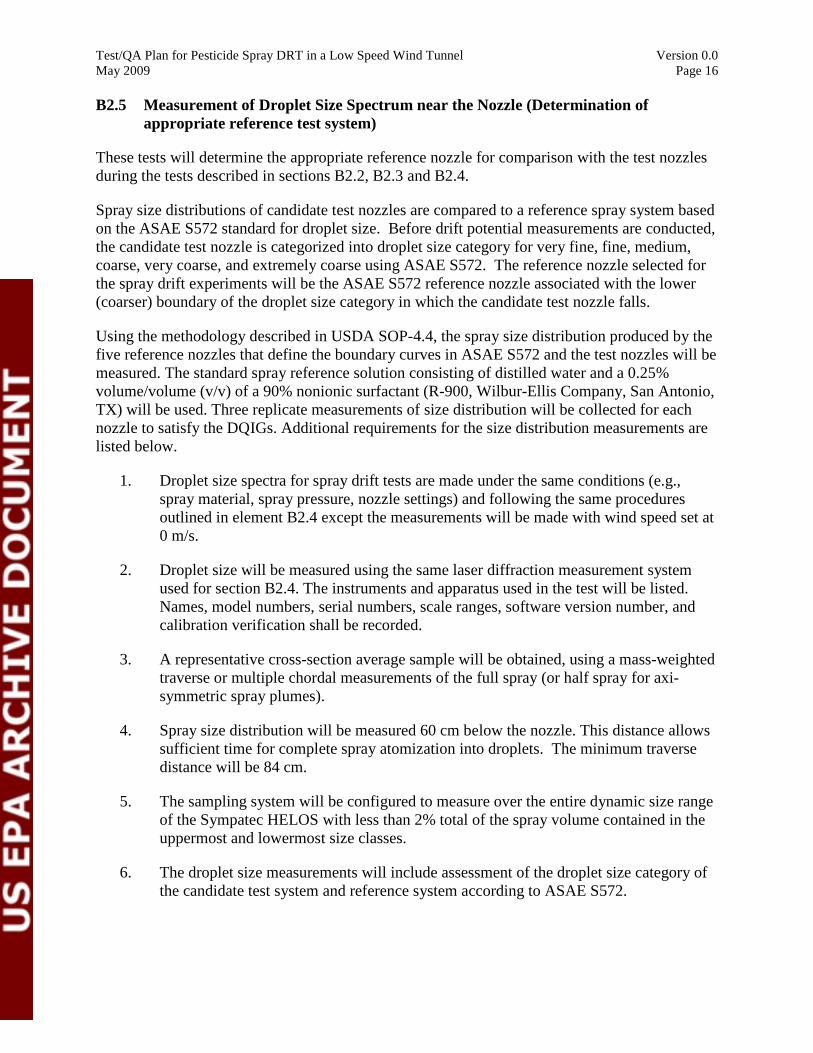
B2.5 Measurement of Droplet Size Spectrum near the Nozzle (Determination of appropriate reference test system)
These tests will determine the appropriate reference nozzle for comparison with the test nozzles during the tests described in sections B2.2, B2.3 and B2.4.
Spray size distributions of candidate test nozzles are compared to a reference spray system based on the ASAE S572 standard for droplet size. Before drift potential measurements are conducted, the candidate test nozzle is categorized into droplet size category for very fine, fine, medium, coarse, very coarse, and extremely coarse using ASAE S572. The reference nozzle selected for the spray drift experiments will be the ASAE S572 reference nozzle associated with the lower (coarser) boundary of the droplet size category in which the candidate test nozzle falls.
Using the methodology described in USDA SOP-4.4, the spray size distribution produced by the five reference nozzles that define the boundary curves in ASAE S572 and the test nozzles will be measured. The standard spray reference solution consisting of distilled water and a 0.25% volume/volume (v/v) of a 90% nonionic surfactant (R-900, Wilbur-Ellis Company, San Antonio, TX) will be used. Three replicate measurements of size distribution will be collected for each nozzle to satisfy the DQIGs. Additional requirements for the size distribution measurements are listed below.
1. Droplet size spectra for spray drift tests are made under the same conditions (e.g., spray material, spray pressure, nozzle settings) and following the same procedures outlined in element B2.4 except the measurements will be made with wind speed set at 0 m/s.
2. Droplet size will be measured using the same laser diffraction measurement system used for section B2.4. The instruments and apparatus used in the test will be listed. Names, model numbers, serial numbers, scale ranges, software version number, and calibration verification shall be recorded.
3. A representative cross-section average sample will be obtained, using a mass-weighted traverse or multiple chordal measurements of the full spray (or half spray for axi-symmetric spray plumes).
4. Spray size distribution will be measured 60 cm below the nozzle. This distance allows sufficient time for complete spray atomization into droplets. The minimum traverse distance will be 84 cm.
5. The sampling system will be configured to measure over the entire dynamic size range of the Sympatec HELOS with less than 2% total of the spray volume contained in the uppermost and lowermost size classes.
6. The droplet size measurements will include assessment of the droplet size category of the candidate test system and reference system according to ASAE S572.
Test/QA Plan for Pesticide Spray DRT in a Low Speed Wind Tunnel Version 0.0 May 2009 Page 17
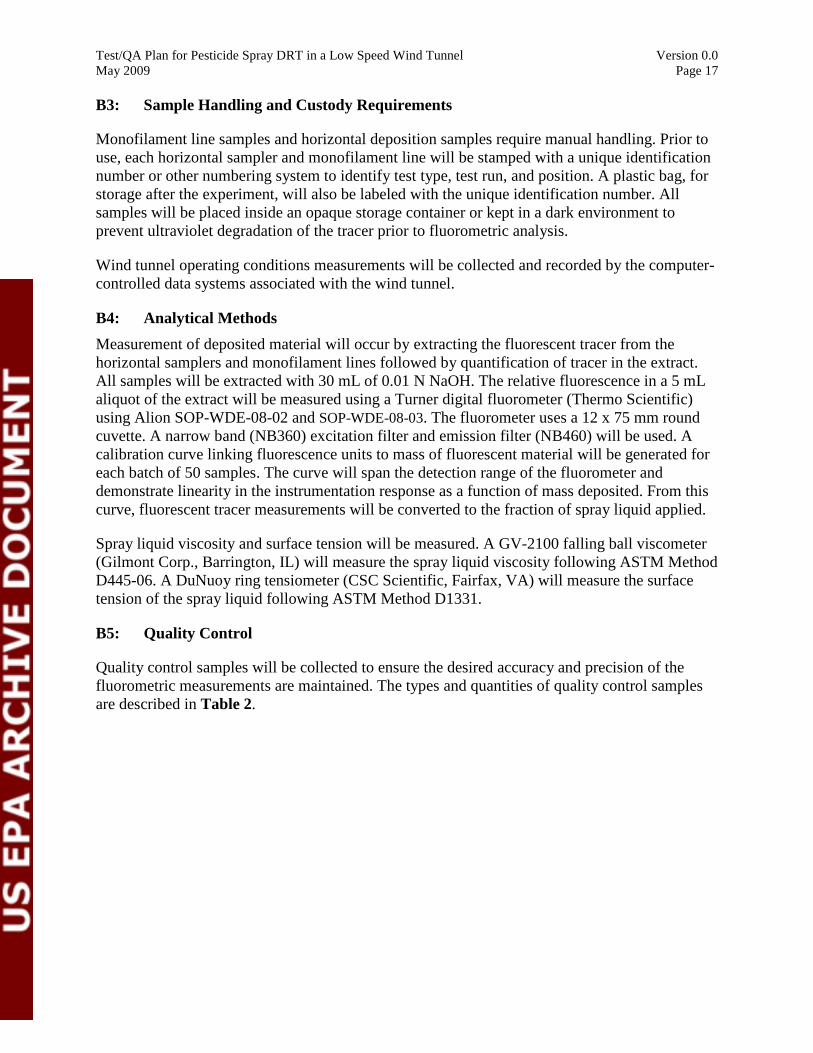
B3: Sample Handling and Custody Requirements
Monofilament line samples and horizontal deposition samples require manual handling. Prior to use, each horizontal sampler and monofilament line will be stamped with a unique identification number or other numbering system to identify test type, test run, and position. A plastic bag, for storage after the experiment, will also be labeled with the unique identification number. All samples will be placed inside an opaque storage container or kept in a dark environment to prevent ultraviolet degradation of the tracer prior to fluorometric analysis.
Wind tunnel operating conditions measurements will be collected and recorded by the computer-controlled data systems associated with the wind tunnel.
B4: Analytical Methods
Measurement of deposited material will occur by extracting the fluorescent tracer from the horizontal samplers and monofilament lines followed by quantification of tracer in the extract. All samples will be extracted with 30 mL of 0.01 N NaOH. The relative fluorescence in a 5 mL aliquot of the extract will be measured using a Turner digital fluorometer (Thermo Scientific) using Alion SOP-WDE-08-02 and SOP-WDE-08-03. The fluorometer uses a 12 x 75 mm round cuvette. A narrow band (NB360) excitation filter and emission filter (NB460) will be used. A calibration curve linking fluorescence units to mass of fluorescent material will be generated for each batch of 50 samples. The curve will span the detection range of the fluorometer and demonstrate linearity in the instrumentation response as a function of mass deposited. From this curve, fluorescent tracer measurements will be converted to the fraction of spray liquid applied.
Spray liquid viscosity and surface tension will be measured. A GV-2100 falling ball viscometer (Gilmont Corp., Barrington, IL) will measure the spray liquid viscosity following ASTM Method D445-06. A DuNuoy ring tensiometer (CSC Scientific, Fairfax, VA) will measure the surface tension of the spray liquid following ASTM Method D1331.
B5: Quality Control
Quality control samples will be collected to ensure the desired accuracy and precision of the fluorometric measurements are maintained. The types and quantities of quality control samples are described in Table 2.
Test/QA Plan for Pesticide Spray DRT in a Low Speed Wind Tunnel Version 0.0 May 2009 Page 18
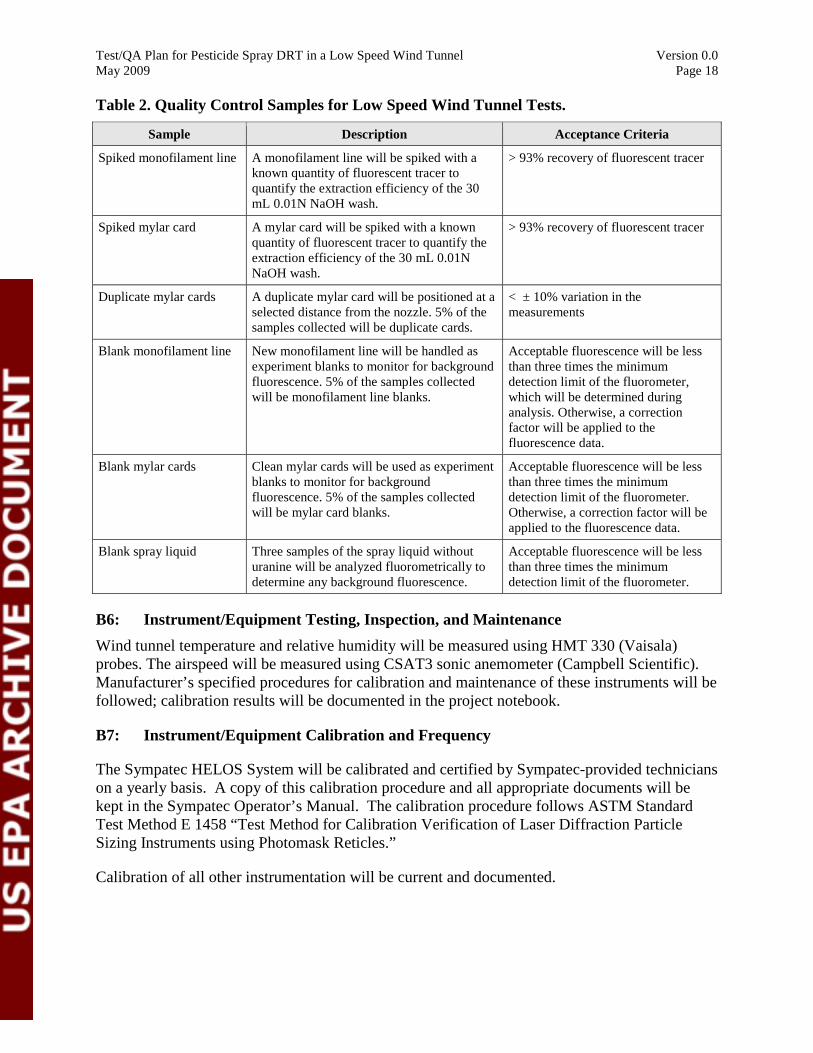
Table 2. Quality Control Samples for Low Speed Wind Tunnel Tests.
Sample Description Acceptance Criteria
Spiked monofilament line A monofilament line will be spiked with a known quantity of fluorescent tracer to quantify the extraction efficiency of the 30 mL 0.01N NaOH wash.
> 93% recovery of fluorescent tracer
Spiked mylar card A mylar card will be spiked with a known quantity of fluorescent tracer to quantify the extraction efficiency of the 30 mL 0.01N NaOH wash.
> 93% recovery of fluorescent tracer
Duplicate mylar cards A duplicate mylar card will be positioned at selected distance from the nozzle. 5% of the samples collected will be duplicate cards.
a < ± 10% variation measurements
in the
Blank monofilament line New monofilament line will be handled as experiment blanks to monitor for background fluorescence. 5% of the samples collected will be monofilament line blanks.
Acceptable fluorescence will be less than three times the minimum detection limit of the fluorometer, which will be determined during analysis. Otherwise, a correction factor will be applied to the fluorescence data.
Blank mylar cards Clean mylar cards will be used as experiment blanks to monitor for background fluorescence. 5% of the samples collected will be mylar card blanks.
Acceptable fluorescence will be less than three times the minimum detection limit of the fluorometer. Otherwise, a correction factor will be applied to the fluorescence data.
Blank spray liquid Three samples of the spray liquid without uranine will be analyzed fluorometrically determine any background fluorescence.
to Acceptable fluorescence will be less than three times the minimum detection limit of the fluorometer.
B6: Instrument/Equipment Testing, Inspection, and Maintenance
Wind tunnel temperature and relative humidity will be measured using HMT 330 (Vaisala) probes. The airspeed will be measured using CSAT3 sonic anemometer (Campbell Scientific). Manufacturer’s specified procedures for calibration and maintenance of these instruments will be followed; calibration results will be documented in the project notebook.
B7: Instrument/Equipment Calibration and Frequency
The Sympatec HELOS System will be calibrated and certified by Sympatec-provided technicians on a yearly basis. A copy of this calibration procedure and all appropriate documents will be kept in the Sympatec Operator’s Manual. The calibration procedure follows ASTM Standard Test Method E 1458 “Test Method for Calibration Verification of Laser Diffraction Particle Sizing Instruments using Photomask Reticles.”
Calibration of all other instrumentation will be current and documented.
Test/QA Plan for Pesticide Spray DRT in a Low Speed Wind Tunnel Version 0.0 May 2009 Page 19
B8: Inspection/Acceptance of Supplies and Consumables
Inspection and acceptance criteria for vendor-supplied or Alion purchased materials and equipment are coordinated by the Alion technical leader.
The primary supplies and consumables for this exercise consist of the horizontal samplers, monofilament lines, and spray liquid materials. Prior to labeling, each sampler will be visually inspected and discarded if any damage is found. The uranine tracer is stable and nonvolatile and the tracer concentration in the spray liquid will allow for adequate sensitivity to measure deposition at all test distances.
B9: Non-Direct Measurements
All data used in this project will be generated by this project. No non-measurement sources, such as computer databases, programs, literature files, and historical databases, will be used.
B10: Data Management
B10.1 Data Acquisition and Management
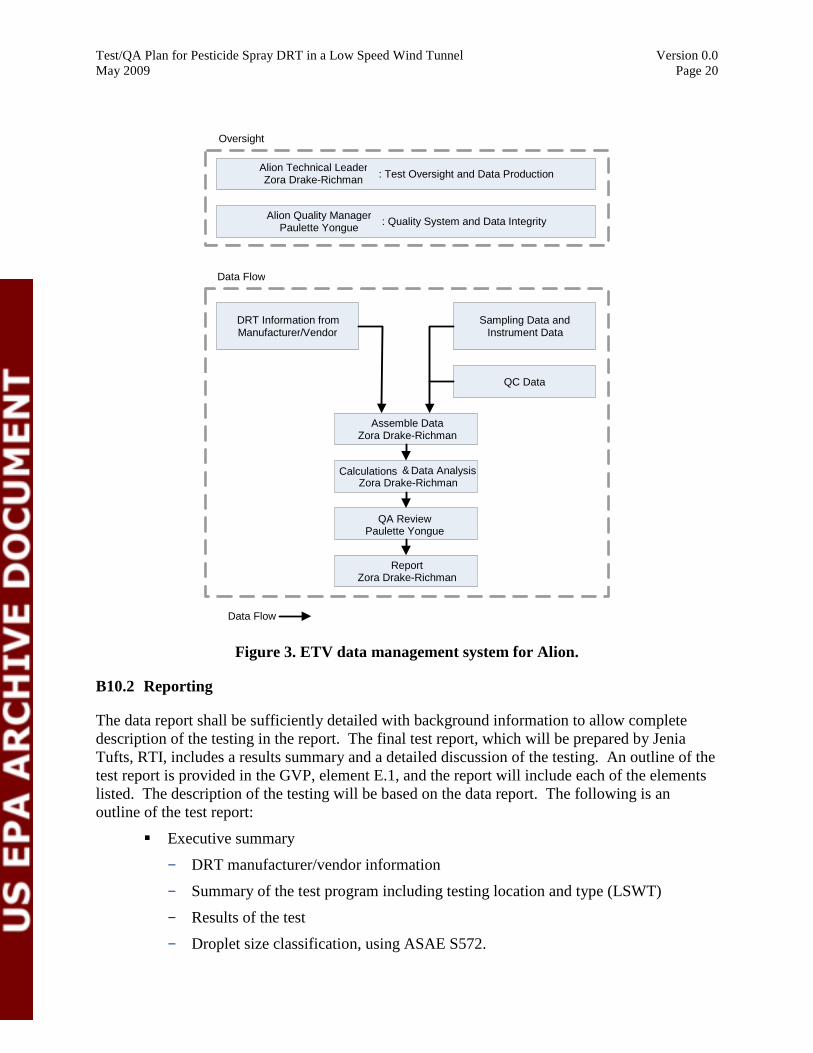
Data acquisition and data management will be performed according to USDA SOP-4.4 and 4.5. The planned data streams, with responsibilities of the Alion technical leader and Alion QM, are depicted in Figure 3. The Alion technical leader is operationally responsible for all aspects of a test. The Alion QM is operationally responsible for all data quality aspects of a test, with primary focus, but not exclusive focus, on the areas indicated in the figure. Alion will conduct a QA analysis and review and develop the data report for submission to RTI. RTI will also conduct a QA analysis and review and develop the final test report for submission to EPA. These data steps are described schematically in Figure 3, and this flow chart includes all data activities from the initial pretest QA steps to the passing of the data to EPA.
The spray droplet size distribution, spray flux, spray deposition, and wind tunnel operating conditions are captured by the data management system. Alion will collect and assemble the data and conduct calculations and data analysis.
Spray flux and deposition are calculated from the output of the fluorometric analysis, the number of relative fluorescence units (RFU) per mL of fluid. Equation (1) shows the formula for conversion of the RFU per mL to the fraction of spray liquid deposited on the monofilament line or mylar card.
( )( )CtQ
VMFFraction = (1)
Where F is the fluorescence per mL reported by the fluorometer, M is the number of grams of uranine per RFU determined by the calibration curve, V is the volume of extraction fluid, Q is the spray material flow rate, t is the spray time, and C is the uranine concentration in the spray liquid.
Test/QA Plan for Pesticide Spray DRT in a Low Speed Wind Tunnel Version 0.0 May 2009 Page 20
Figure 3. ETV data management system for Alion.
B10.2 Reporting
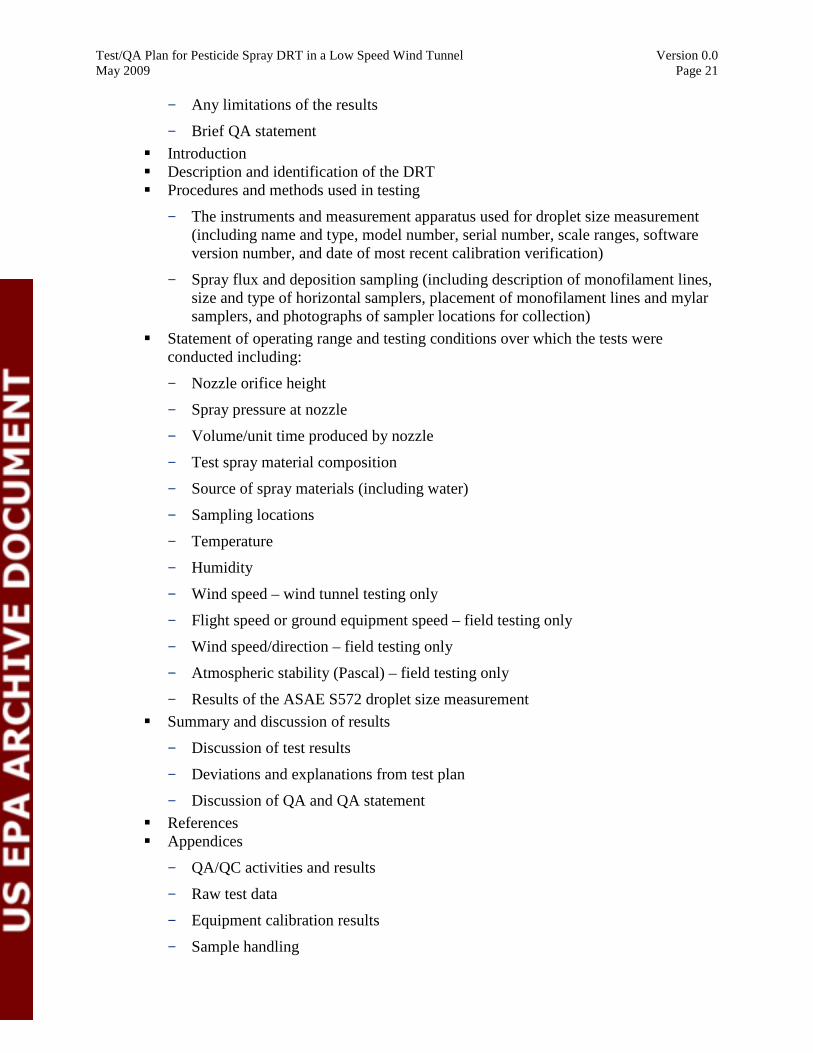
The data report shall be sufficiently detailed with background information to allow complete description of the testing in the report. The final test report, which will be prepared by Jenia Tufts, RTI, includes a results summary and a detailed discussion of the testing. An outline of the test report is provided in the GVP, element E.1, and the report will include each of the elements listed. The description of the testing will be based on the data report. The following is an outline of the test report:
� Executive summary
− DRT manufacturer/vendor information
− Summary of the test program including testing location and type (LSWT)
− Results of the test
− Droplet size classification, using ASAE S572.
Alion Technical LeaderZora Drake-Richman : Test Oversight and Data Production
Alion Quality Manager Paulette Yongue : Quality System and Data Integrity
DRT Information from Manufacturer/Vendor
Sampling Data and Instrument Data
QC Data
Assemble Data Zora Drake-Richman
Calculations & Data Analysis
QA Review Paulette Yongue
Report Zora Drake-Richman
Data Flow
Data Flow
Oversight
Zora Drake-Richman
Test/QA Plan for Pesticide Spray DRT in a Low Speed Wind Tunnel Version 0.0 May 2009 Page 21
− Any limitations of the results
− Brief QA statement
� Introduction � Description and identification of the DRT � Procedures and methods used in testing
− The instruments and measurement apparatus used for droplet size measurement (including name and type, model number, serial number, scale ranges, software version number, and date of most recent calibration verification)
− Spray flux and deposition sampling (including description of monofilament lines, size and type of horizontal samplers, placement of monofilament lines and mylar samplers, and photographs of sampler locations for collection)
� Statement of operating range and testing conditions over which the tests were conducted including:
− Nozzle orifice height
− Spray pressure at nozzle
− Volume/unit time produced by nozzle
− Test spray material composition
− Source of spray materials (including water)
− Sampling locations
− Temperature
− Humidity
− Wind speed – wind tunnel testing only
− Flight speed or ground equipment speed – field testing only
− Wind speed/direction – field testing only
− Atmospheric stability (Pascal) – field testing only
− Results of the ASAE S572 droplet size measurement
� Summary and discussion of results
− Discussion of test results
− Deviations and explanations from test plan
− Discussion of QA and QA statement
� References � Appendices
− QA/QC activities and results
− Raw test data
− Equipment calibration results
− Sample handling
Test/QA Plan for Pesticide Spray DRT in a Low Speed Wind Tunnel Version 0.0 May 2009 Page 22
Group C: Assessments and Oversight Elements
C1: Assessments and Response Actions
C1.1 Internal Audits
Internal audits conducted by Alion will conform to element C1 (Assessments and Response Actions) and C2 (Reports to Management) of EPA QA/R-5.
C1.2 Audits of Data Quality
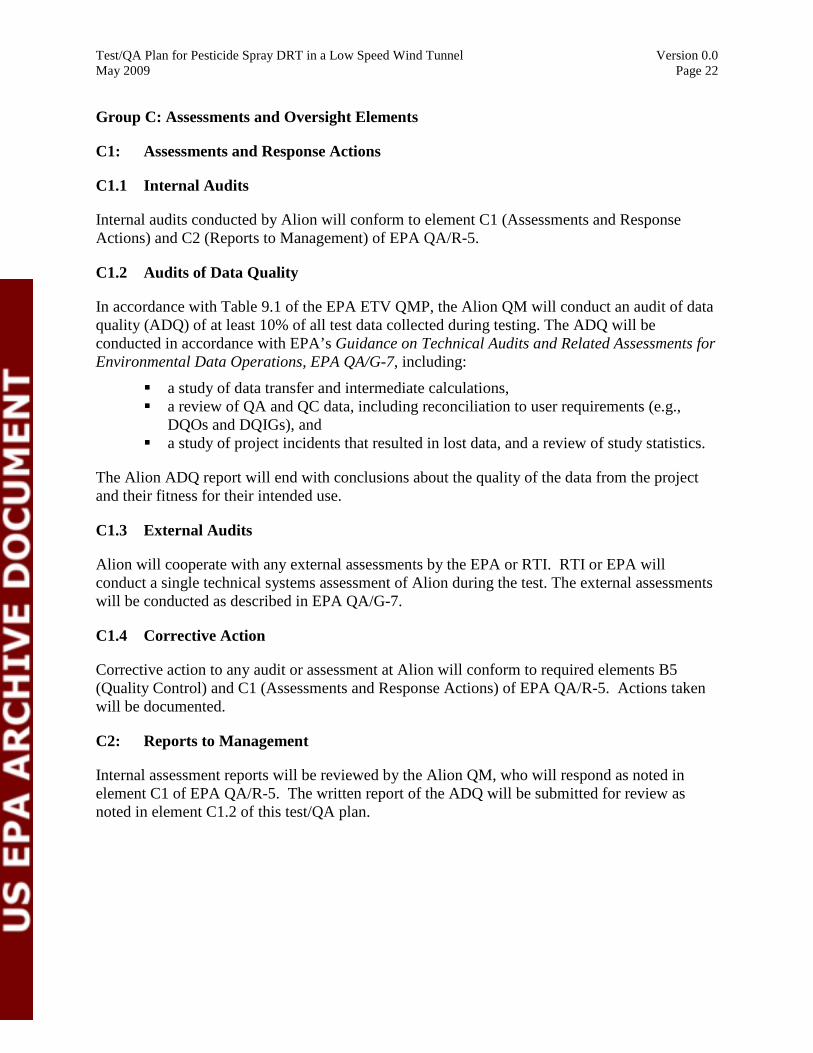
In accordance with Table 9.1 of the EPA ETV QMP, the Alion QM will conduct an audit of data quality (ADQ) of at least 10% of all test data collected during testing. The ADQ will be conducted in accordance with EPA’s Guidance on Technical Audits and Related Assessments for Environmental Data Operations, EPA QA/G-7, including:
� a study of data transfer and intermediate calculations, � a review of QA and QC data, including reconciliation to user requirements (e.g.,
DQOs and DQIGs), and � a study of project incidents that resulted in lost data, and a review of study statistics.
The Alion ADQ report will end with conclusions about the quality of the data from the project and their fitness for their intended use.
C1.3 External Audits
Alion will cooperate with any external assessments by the EPA or RTI. RTI or EPA will conduct a single technical systems assessment of Alion during the test. The external assessments will be conducted as described in EPA QA/G-7.
C1.4 Corrective Action
Corrective action to any audit or assessment at Alion will conform to required elements B5 (Quality Control) and C1 (Assessments and Response Actions) of EPA QA/R-5. Actions taken will be documented.
C2: Reports to Management
Internal assessment reports will be reviewed by the Alion QM, who will respond as noted in element C1 of EPA QA/R-5. The written report of the ADQ will be submitted for review as noted in element C1.2 of this test/QA plan.
Test/QA Plan for Pesticide Spray DRT in a Low Speed Wind Tunnel Version 0.0 May 2009 Page 23
Group D: Data Validation and Usability Elements
D1: Data Review, Verification, and Validation
The Alion QM reviews and validates the data and the draft data report using the site-specific test/QA Plan, test methods, general SOPs, and project-specific SOPs. Data review and validation will primarily occur at the following stages:
� On the Alion test site following each test run by Alion technical leader � On the Alion test site following completion of the test program by technical leader � Before writing the draft data report � During QA review of the draft report and audit of the data quality � The criteria used to review and validate the data will be the QA/QC criteria specified
in each test procedure, protocol, guideline, or method (see Table 1) and the DQIG analysis of the parameter test data. Those individuals responsible for onsite data review and validation are noted in Figure 3, element B10, and above. The Alion technical leader is responsible for verification of data with all written procedures.
� Jenia Tufts of RTI will review the draft data report.
D2: Verification and Validation Methods
The process for validating and verifying data are described in element B of this protocol and conform to required element D2 (Verification and Validation Methods) of EPA QA/R-5.
D3: Reconciliation with Data Quality Objectives
The DQO is defined as meeting the DQIGs in Table 1. This reconciliation step is an integral part of the test program and will be done at the test site. Attainment of the DQO is confirmed by analyzing the test data as described in element A7 and will be completed by Alion at the conclusion of the scheduled test runs.
The reconciliation of the results with the DQO will be evaluated using the data quality assessment process. This process begins with the review of the DQOs and the sampling design to assure that the sampling design and data collection documentation are consistent with those needed to meet the specified DQOs. When the preliminary data are collected, the data will be reviewed to ensure they are consistent with expectations and to identify patterns, relationships, and potential anomalies. The data will be summarized and analyzed using appropriate statistical procedures. The impact of any deviations from procedures will be assessed relative to their impact on data quality and meeting the DQOs. Finally, the quality of the data will be assessed in terms of precision, bias, and statistical significance as they relate to the measurement objectives and the DQO.
Test/QA Plan for Pesticide Spray DRT in a Low Speed Wind Tunnel Version 0.0 May 2009 Page 24
Appendix A: Applicable Documents and Procedures
1. EPA Documents
EPA. Policy and Program Requirements for the Mandatory Agency-wide Quality System. EPA Order 5360.1 A2. U.S. Environmental Protection Agency. May 2000.
EPA. EPA Requirements for Quality Management Plans. EPA QA/R-2, EPA Publication No. EPA/240/B-01/002. U.S. Environmental Protection Agency, Office of Environmental Information. Washington, DC. March 2001.
EPA. Environmental Technology Verification Program, Quality Management Plan. EPA Publication No. EPA/600/R-03/021. Office of Research and Development, U.S. Environmental Protection Agency. Cincinnati, OH. December 2002.
EPA. EPA Requirements for Quality Assurance Project Plans. EPA QA/R-5, EPA Publication No. EPA/240/B-01/003. Office of Environmental Information, U.S. Environmental Protection Agency. March 2001.
EPA. Guidance for Quality Assurance Project Plans. EPA QA/G-5, EPA Publication No. EPA/600/R-98/018. Office of Environmental Information, U.S. Environmental Protection Agency. February 1998.
EPA. Draft Generic Verification Protocol for the Verification of Pesticide Spray Drift Reduction Technologies for Row and Field Crops. Office of Research and Development, U.S. Environmental Protection Agency. April 2007.
EPA. Guidance on Technical Audits and Related Assessments for Environmental Data Operations. EPA QA/G-7, EPA Publication No. EPA/600/R-99/080. Office of Environmental Information, U.S. Environmental Protection Agency. January 2000.
2. RTI Documents
RTI International. Verification Testing of Air Pollution Control Technology - Quality Management Plan, Revision 2.2. RTI International. Research Triangle Park, NC. February 2005. http://www.epa.gov/nrmrl/std/etv/pubs/600etv10011.pdf.
3. Alion Science & Technology SOPs
Alion SOP-WDE-08-02: “Generation of Calibration Curves for the Turner Digital Fluorometer,” March 2009.2 Alion SOP-WDE-08-03: “Extraction of Samples and Measurement of Fluorescence using the Turner Digital Fluorometer,” March 2009.3
2 This Alion SOP is provided as Appendix C. 3 This Alion SOP is provided as Appendix D.
Test/QA Plan for Pesticide Spray DRT in a Low Speed Wind Tunnel Version 0.0 May 2009 Page 25
4. USDA/ARS SOPs4
USDA SOP-4.1: Personnel Records, Training Logs, and Laser Safety. September 2007. USDA SOP-4.2: Measurement of Physical Properties of Liquids. September 2007. USDA SOP-4.3: Reception, Storage, and Distribution of Active Chemicals. September 2007. USDA SOP-4.4: Determining Cross-Section Average Drop-Size Distributions of Sprays. September 2007. USDA SOP-4.5: Corrective and Preventive Actions. September 2007.
5. Other Documents
ANSI/ASHRAE 41.1 (1986) Standard Method for Temperature Measurement, American Society of Heating, Refrigerating and Air Conditioning Engineers, Inc. 1791 Tullie Circle, NE, Atlanta, GA 30329.
ASAE S572 (1999) (sometimes referred to as ASABE S572) Spray Nozzle Classification by Droplet Spectra. Standard No. S572, American Society of Agricultural and Biological Engineers, St. Joseph, MI.
ASAE S561.1 Procedure for Measuring Drift Deposits from Ground, Orchard and Aerial Sprayers. American Society of Agricultural and Biological Engineers, St. Joseph, MI.
ASTM D445-06 Standard Test Method for Kinematic Viscosity of Transparent and Opaque Liquids (and Calculation of Dynamic Viscosity).
ASTM D1331 Standard Test Methods for Surface and Interfacial Tension of Solutions of Surface-Active Agents.
ASTM E 1458 Standard Test Method for Calibration Verification of Laser Diffraction Particle Sizing Instruments Using Photomask Reticles.
ISO Draft Standard 22856: Equipment for Crop Protection – Laboratory Drift Methods Measurements. International Standards Organization.
4 The USDA SOPs can be obtained from Bradley Fritz of USDA-ARS in College Station, TX, at [email protected].
Test/QA Plan for Pesticide Spray DRT in a Low Speed Wind Tunnel Version 0.0 May 2009 Page 26
Appendix B: Organizational Charts for Testing the Low Speed Pesticide Spray DRT Protocol
Figure 4. Organizational chart for the low speed pesticide spray DRT protocol validation.
EPA Project Manager Michael Kosusko
EPA Quality ManagerPaul Groff
DRT Vendor
RTI Test Lead Andrew Dart
Task LeadersTechnical Staff
Alion Organization
RTI Project LeaderJonathan Thornburg
RTI Quality ManagerCary Eaton
Quality ManagerPaulette Yongue
Technical Leader Zora Drake-Richman
Denotes normal lines of communication and responsibility
Denotes informal communication
Denotes organizational independence
Test/QA Plan for Pesticide Spray DRT in a Low Speed Wind Tunnel Version 0.0 May 2009 Page 27
Appendix C: Alion SOP-WDE-08-02 – Standard Operating Procedure for the
Turner Quantech Digital Filter Fluorometer
Test/QA Plan for Pesticide Spray DRT in a Low Speed Wind Tunnel Version 0.0 May 2009 Page 28
Standard Operating Procedure for the Turner Quantech Digital Filter
Fluorometer
SOP-WDE-08-02 January 2008
Prepared for
National Homeland Security Research Center U.S. Environmental Protection Agency Research Triangle Park, NC 27711
Contract EP-D-05-065
Aligned with your needs.
P.O. Box 12313 Research Triangle Park, NC 27709

Test/QA Plan for Pesticide Spray DRT in a Low Speed Wind Tunnel Version 0.0 May 2009 Page 29
Turner Fluorometer SOP-WDE-08-02
Revision 0 nuary 2008 P
Standard Operating Procedure for the Turner Quantech Digital Filter Fluorometer
age 1 of 7
Prepared for
National Homeland Security Research Center U.S. Environmental Protection Agency Research Triangle Park, NC 27711
Ja
Aligned with your needs.
P.O. Box 12313 Research Triangle Park, NC 27709
Prepared by: Date: 1/24/08
Reviewed by: _________________________________________ Date: 1/24/08
Approved by: ________________________________________ Date: 1/24/08

Test/QA Plan for Pesticide Spray DRT in a Low Speed Wind Tunnel Version 0.0 May 2009 Page 30
Turner Fluorometer SOP-WDE-08-02
Revision 0 January 2008
Page 2 of 7
Contents
Section Page
1.0 Scope and Application ........................................................................................................................ 3
2.0 Summary of Method ........................................................................................................................... 3
3.0 Definitions ............................................................................................................................... 3
4.0 Health and Safety Warnings ............................................................................................................... 3
5.0 Cautions .................................................................................................................................... 3
6.0 Interferences ......................................................................................................................................... 3
7.0 Personnel Qualifications ..................................................................................................................... 4
8.0 Apparatus and Materials ..................................................................................................................... 4
9.0 Method Calibration .............................................................................................................................. 4
10.0 Sample Analysis Procedure ................................................................................................................ 7
11.0 Troubleshooting ................................................................................................................................... 7
12.0 Data Analysis and Calculations .......................................................................................................... 7
13.0 Computer Hardware and Software ..................................................................................................... 7
14.0 Data and Records Management .......................................................................................................... 7
15.0 Quality Control and Quality Assurance ............................................................................................. 7
16.0 References ................................................................................................................................ 7
Test/QA Plan for Pesticide Spray DRT in a Low Speed Wind Tunnel Version 0.0 May 2009 Page 31
Turner Fluorometer SOP-WDE-08-02
Revision 0 January 2008
Page 3 of 7
1.0 Scope and Application
This document outlines the procedure used to prepare, calibrate, and verify proper operation of the Turner Quantech digital filter fluorometer.
2.0 Summary of Method
The fluorometric method is used for detecting aerosols by optical fluorescence. The most commonly used fluorescing materials in the aerosol test facility (ATF) are uranine and fluorescein. Calibration standards will be prepared from standard stock solutions of these materials (see SOP-WDE-08-03, Standard Operating Procedure for Analysis of Uranine-Tagged Aerosols, and SOP-4423-03-24, Standard Operating Procedure for the Calibration of the Sequoia-Turner Model 450 Fluorometer—Fluorescein Quantitation).
3.0 Definitions
µL microliter ATF aerosol test facility DI H2O deionized water mL milliliter MSDS Material Safety Data Sheet ng nanogram
4.0 Health and Safety Warnings
4 .1 Read and understand all applicable Material Safety Data Sheets (MSDSs).
4.2 Always keep open chemical containers in fume hoods and wear adequate protective clothing according to the MSDS for each chemical.
4.3 Always label secondary containers.
5.0 Cautions
5 . 1 Always wear clean, dust-free disposable gloves when handling any sample cuvette or labware.
5.2 To minimize risk of contamination, use proper precautions during preparation and use of the 1- and 0.1-ng/mL calibration standards. Containers used for preparation and storage of these standard solutions should be used for no other purpose and should be labeled accordingly.
6.0 Interferences
There are no known interferences with this equipment.
Test/QA Plan for Pesticide Spray DRT in a Low Speed Wind Tunnel Version 0.0 May 2009 Page 32
Turner Fluorometer SOP-WDE-08-02
Revision 0 January 2008
Page 4 of 7
7.0 Personnel Qualifications
Personnel should have sufficient background in operating the equipment to use it without supervision.
8.0 Apparatus and Materials
8 .1 General Equipment
12- by 75-mm disposable cuvettes 7-mL transfer pipettes Disposable gloves 1000-mL volumetric glass flask, Pyrex Class A 100-mL volumetric glass flask, Pyrex Class A Various sizes of volumetric glass pipettes, Pyrex Class A Disposable pipette tips
8. 2 Apparatus
Turner Quantech digital filter fluorometer Excitation filter (NB360) Emission filter (NB460)
8 . 3 Chemicals
Appropriate calibration standards and laboratory blank solutions
9.0 Calibration
For detailed instructions regarding the fluorometer, please see the operating manual supplied with the instrument.
9.1 Setup and Filter Placement
1. Set up the fluorometer on a level surface.
2. Turn on the main power switch located on the back of the unit.
3. Lift the cover on the sample chamber and place the excitation filter (NB360) in the holder directly above the sample cuvette holder and place the emission filter (NB460) in the holder to the left of the cuvette holder (see Figure 1).
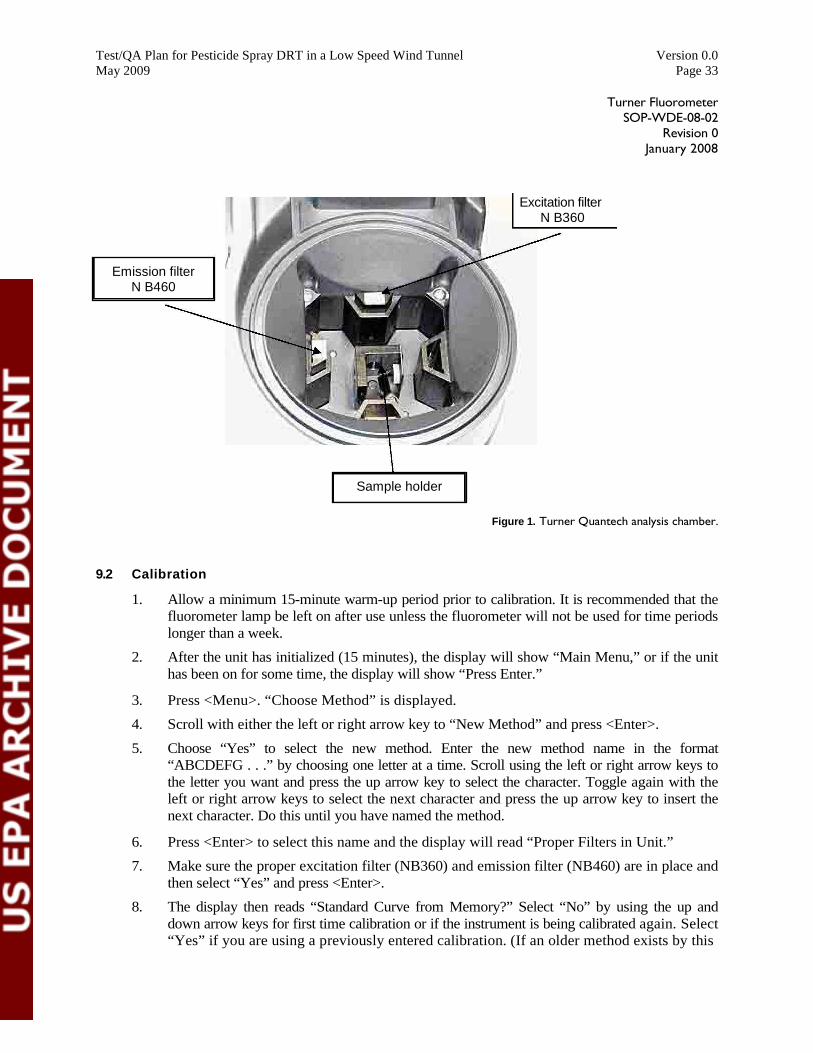
Test/QA Plan for Pesticide Spray DRT in a Low Speed Wind Tunnel Version 0.0 May 2009 Page 33
Turner Fluorometer SOP-WDE-08-02
Revision 0 January 2008
Figure 1. Turner Quantech analysis chamber.
9.2 Calibration
1. Allow a minimum 15-minute warm-up period prior to calibration. It is recommended that the fluorometer lamp be left on after use unless the fluorometer will not be used for time periods longer than a week.
2. After the unit has initialized (15 minutes), the display will show “Main Menu,” or if the unit has been on for some time, the display will show “Press Enter.”
3. Press <Menu>. “Choose Method” is displayed.
4. Scroll with either the left or right arrow key to “New Method” and press <Enter>.
5. Choose “Yes” to select the new method. Enter the new method name in the format “ABCDEFG . . .” by choosing one letter at a time. Scroll using the left or right arrow keys to the letter you want and press the up arrow key to select the character. Toggle again with the left or right arrow keys to select the next character and press the up arrow key to insert the next character. Do this until you have named the method.
6. Press <Enter> to select this name and the display will read “Proper Filters in Unit.”
7. Make sure the proper excitation filter (NB360) and emission filter (NB460) are in place and then select “Yes” and press <Enter>.
8. The display then reads “Standard Curve from Memory?” Select “No” by using the up and down arrow keys for first time calibration or if the instrument is being calibrated again. Select “Yes” if you are using a previously entered calibration. (If an older method exists by this
Excitation filter N B360
Emission filter N B460
Sample holder
Test/QA Plan for Pesticide Spray DRT in a Low Speed Wind Tunnel Version 0.0 May 2009 Page 34
Turner Fluorometer SOP-WDE-08-02
Revision 0 January 2008
Page 6 of 7
name, the new calibration data will be written over the older data.) Press <Enter>.
9. The display responds with “Enter no. of points (2–9).” Since three standards will be used for calibration other than zero, select 3 by using the up or down arrow, then press <Enter>. A 0 ng/mL standard is not considered a point in the above count; however, it will be required later.
10. At this point the display reads “0000.000<Flu>,” where “<Flu>” indicates fluorescence units. Enter the value of the highest concentration standard (e.g., 40 ng/mL). At this point “<Flu>” should be selected as shown by the blinking “>”; if not, toggle using the left or right arrow key and select “<Flu>” until the “>” blinks. Using the up and down arrows, select “ng/mL” as the units. Then using the left arrow, go to the tens digit and select “4” by repeatedly using the up arrow. At this point, the display should read “0040.000<ng/mL>.” Press <Enter>.
11. The display reads “Insert Known Sample 1.” Insert the cuvette with the standard solution and press <Enter>. The display goes through a series of gain selections and eventually reads the sample. Do not leave samples in the sample chamber longer than necessary, as sample temperature will drift and result in errors.
12. The display responds with “000.000<ng/mL>.” Input the value for the second standard (e.g., 10 ng/mL) as in step 10 so that the display reads “010.000<ng/mL>” and press <Enter>. When the display shows “Known Sample 2,” remove the first standard and insert a cuvette with the mid-range standard solution and then press <Enter>.
13. When the display shows “000.000<ng/mL>,” input the value for the third standard (e.g., 2 ng/mL) as in step 10. When the display reads “002.000<ng/mL>,” press <Enter>. When the display shows “Known Sample 3,” remove the second standard and insert a cuvette with the lowest concentration standard solution and press <Enter>.
14. When the display reads “Insert Blank Sample,” remove the standard and insert a cuvette with 0 ng/mL solution.
15. Press <Zero> as the display instructs. After reading this sample, the display should show the coefficient of determination (regression coefficient). The number appears only briefly on screen and then disappears, so pay close attention. This should ideally be “1” and not less than “0.99”. If it is less than 0.99, then either the calibration or standards preparation may have to be repeated. Press <Enter>. The display reads “Insert Unknown Sample.” The “Named” method is now ready.
After calibration is complete, check the calibration by remeasuring all standards. The instrument must read within 3% of their values. A standard resulting in a higher difference may indicate that an error was made in preparing that standard or the stock solution is going bad. If any standard is replaced, the calibration should be repeated. During the measurement of unknown samples, periodically check calibration by remeasuring the midrange standard to ensure there is no drift. If the reading drifts by more than 3% of the standard’s value, recalibrate the instrument.
Test/QA Plan for Pesticide Spray DRT in a Low Speed Wind Tunnel Version 0.0 May 2009 Page 35
Turner Fluorometer SOP-WDE-08-02
Revision 0 January 2008
Page 7 of 7
10.0 Sample Analysis Procedure
Insert the prepared test sample solution (unknown) in a cuvette and press <Enter>. The instrument gives out a reading (ng/mL). If the concentration is too low (less than the low standard), a negative value may result. Also, if the concentration is higher than the high standard, the instrument may read “Out of Range.” Mark all samples that are out of range to run later either as diluted samples or against a different calibration curve.
11.0 Troubleshooting
Refer to the user’s manual for troubleshooting guidelines.
12.0 Data Analysis and Calculations
Use the following calculation to obtain an unknown’s fluorometric content:
Conc (ng/mL) = reading * dilution ratio, Where Conc is the fluorometric concentration of the solution being tested (ng/mL), reading is the reading from the display of the fluorometer (ng/mL), and dilution ratio is any dilution that may have been done prior to measurement.
13.0 Computer Hardware and Software
Spreadsheet software may be used with this method to assist in data analysis.
14.0 Data and Records Management
Records of use and maintenance are to be kept in the operator’s laboratory notebooks.
15.0 Quality Control and Quality Assurance
As noted in the calibration procedure, verification within prescribed standard-dependent limits must be made prior to use of the fluorometer for analytical purposes.
16.0 References
Alion Science and Technology. 2008. Standard Operating Procedure for Analysis of Uranine-Tagged Aerosols, SOP-WDE-08-03. Research Triangle Park, NC.
ManTech Environmental Technology, Inc. Standard Operating Procedure for the Calibration of the Sequoia-Turner Model 450 Fluorometer—Fluorescein Quantitation, SOP-4423-03-24. Research Triangle Park, NC.
Thermo Scientific. February 2007. Turner Digital Filter Fluorometer Operation Manual, Dubuque, Iowa.
Test/QA Plan for Pesticide Spray DRT in a Low Speed Wind Tunnel Version 0.0 May 2009 Page 36
Appendix D: Alion SOP-WDE-08-03 – Standard Operating Procedure for Analysis of Uranine-Tagged Aerosols
Standard Operating Procedure for Analysis of Uranine-Tagged Aerosols
SOP-WDE-08-03 January 2008
Prepared for
National Homeland Security Research Center U.S. Environmental Protection Agency Research Triangle Park, NC 27711
Aligned with your needs.
P.O. Box 12313 Research Triangle Park, NC 27709
Test/QA Plan for Pesticide Spray DRT in a Low Speed Wind Tunnel Version 0.0 May 2009 Page 37
Uranine-Tagged Aerosols SOP-WDE-08-03
Revision 0 January 2008 Page 1 of 8
Prepared for National Homeland Security Research Center
U.S. Environmental Protection Agency Research Triangle Park, NC 27711
Standard Operating Procedure for Analysis of Uranine-Tagged Aerosols
Aligned with your needs.
P.O. Box 12313 Research Triangle Park, NC 27709
Prepared by: Date: 1/24/08
Reviewed by: __________________________________ Date: 1/24/08
Approved by: ___________________________________Date: 1/24/08
Test/QA Plan for Pesticide Spray DRT in a Low Speed Wind Tunnel Version 0.0 May 2009 Page 38
Uranine-Tagged Aerosols SOP-WDE-08-03
Revision 0 January 2008 Page 2 of 8
Contents
Section Page
1.0 Scope and Application......................................................................................................................... 3
2.0 Summary of Method ............................................................................................................................ 3
3.0 Definitions .............................................................................................................................. 3
4.0 Health and Safety Warnings ............................................................................................................... 3
5.0 Cautions ................................................................................................................................... 3
6.0 Interferences ......................................................................................................................................... 4
7.0 Personnel Qualifications ..................................................................................................................... 4
8.0 Apparatus and Materials...................................................................................................................... 4
9.0 Method Calibration .............................................................................................................................. 4
10.0 Sample Generation and Testing .......................................................................................................... 6
11.0 Preservation .......................................................................................................................................... 7
12.0 Sample Analysis Procedure ................................................................................................................ 7
13.0 Troubleshooting ................................................................................................................................... 7
14.0 Data Analysis and Calculations .......................................................................................................... 7
15.0 Computer Hardware and Software ..................................................................................................... 7
16.0 Data and Records Management .......................................................................................................... 7
17.0 Quality Control and Quality Assurance ............................................................................................. 7
18.0 References ................................................................................................................................ 8
Test/QA Plan for Pesticide Spray DRT in a Low Speed Wind Tunnel Version 0.0 May 2009 Page 39
Uranine-Tagged Aerosols SOP-WDE-08-03
Revision 0 January 2008 Page 3 of 8
1.0 Scope and Application
This document outlines the procedures used to prepare calibration standards for and to verify the proper operation of the Turner Quantech digital filter fluorometer for the quantitation of uranine in aqueous alkaline solutions. This procedure is used prior to the quantitation of unknown samples (refer to SOP-WDE-08-02, Standard Operating Procedure for the Turner Quantech Digital Filter Fluorometer, for this procedure).
2.0 Summary of Method
Calibration standards of 100, 5, 1, and 0.1 ng/mL will be prepared from a standard stock solution of 106 ng/mL uranine in 0.01 N NaOH. The 100 ng/mL standard is used to span the instrument daily and the 5, 1, and 0.1 ng/mL standards are used to verify the instrument’s linear response over the entire measurement range.
3.0 Definitions µL microliter DI H2O deionized water g gram mL milliliter mm millimeter MSDS Material Safety Data Sheet N normal solution NaOH sodium hydroxide ng nanogram
4.0 Health and Safety Warnings
4 . 1 Read and understand all applicable Material Safety Data Sheets (MSDSs).
4.2 Always keep open chemical containers in fume hoods and wear adequate protective clothing according to the MSDS for each chemical.
4.3 Always label secondary containers.
5.0 Cautions
5 . 1 Always wear clean, dust-free disposable gloves when handling any sample cuvette or labware.
5.2 Read and follow the manufacturer’s guidelines for proper use of micropipettes used in this procedure.
5.3 To minimize risk of contamination, use proper precautions during preparation and use of the calibration standards. Containers used for preparation and storage of these standard solutions should be used for no other purpose and should be labeled accordingly.
Test/QA Plan for Pesticide Spray DRT in a Low Speed Wind Tunnel Version 0.0 May 2009 Page 40
Uranine-Tagged Aerosols SOP-WDE-08-03
Revision 0 January 2008 Page 4 of 8
6.0 Interferences
There are no known interferences with this equipment.
7.0 Personnel Qualifications
Personnel should have sufficient background in operating the equipment to use it without supervision.
8.0 Apparatus and Materials
8 .1 General Equipment
12- by 75-mm disposable cuvettes 7-mL transfer pipettes Disposable gloves 32-oz amber bottles 20-L LDPE carboy with spigot Volumetric glass pipettes, Pyrex Class A sizes as needed Pipette bulb Weigh boats and/or papers 1000-mL volumetric glass flask, Pyrex Class A 100-mL volumetric glass flask, Pyrex Class A 2-in magnetic stir bars Magnetic stir plate
8.2 Apparatus Fluorometer, Turner Quantech Analytical balance
8.3 Chemicals DI H2O—allow system to run for 15 minutes prior to using NaOH, 0.1 N Uranine, purified grade, Fisher Brand A833-500
9.0 Method Calibration
9.1 Preparation of 0.01 N Sodium Hydroxide 1. Add approximately 5 L of DI H2O to a clean 20-L capacity carboy. 2. Using a 1000-mL graduated cylinder, add 2 L of 0.1 N NaOH to the carboy.
Test/QA Plan for Pesticide Spray DRT in a Low Speed Wind Tunnel Version 0.0 May 2009 Page 41
Uranine-Tagged Aerosols SOP-WDE-08-03
Revision 0 January 2008 Page 5 of 8
3. Dilute the carboy contents to the 20-L line using DI H2O. 4. Cap the carboy and thoroughly mix the contents prior to initial use. 5. Label the carboy with the date, composition, and operator's name.
9.2 Preparation of 1000 pg/mL Uranine in 0.01 N NaOH Stock Solution
1. Zero and calibrate the analytical balance using techniques described in SOP-WDE07-04, Standard Operating Procedure for Operation and Maintenance of the Sartorius CP324S Balance.
2. Place a clean, dry weighing dish on the weighing pan. 3. Tare the balance and ensure that the reading is stable before proceeding. 4. Carefully add uranine to the dish until a reading of 1.000 ± 0.01 g is achieved. Record
the final value and remove the container from the balance. Zero the balance. 5. Using 0.01 N NaOH, transfer the uranine to a clean, dry 1000-mL volumetric flask,
ensuring that the uranine is transferred from all surfaces of the weighing dish to the flask. 6. Gently swirl the container until the uranine has been dissolved. 7. Dilute the container’s contents to 1000 mL using 0.01 N NaOH. 8. Label the flask and record the following information on the label: date, exact
composition (calculated from the mass recorded in step 4), and operator’s name. 9. Carefully insert a clean, 2-in-long magnetic stirrer into the container and place the
container on the stir plate. Stir the solution for approximately 15 minutes using a moderate stir rate.
10. Transfer the solution contents into a clean, prelabeled amber bottle. Tightly cap the container and store it in a cool, dark environment.
Note: This solution has a shelf life of approximately 6 months. At the end of that time period, discard the remaining solution properly.
9.3 Preparation of 1000 ng/mL Uranine in 0.01 N NaOH Intermediate Stock Solution
1. In a clean, dry 1000 mL volumetric flask, add approximately 100 mL of 0.01 N NaOH. Transfer 1 mL of the stock solution to the volumetric flask using a clean, dry volumetric pipette.
2. Gently swirl the volumetric flask. 3. Dilute the container’s contents to 1000 mL using 0.01 N NaOH. 4. Label the flask and record the following information on the label: date, calculated
concentration, and operator’s name. 5. Carefully insert a clean, 2-in-long magnetic stirrer into the container and place the
container on the stir plate. Stir the solution for approximately 15 minutes using a moderate stir rate.
Test/QA Plan for Pesticide Spray DRT in a Low Speed Wind Tunnel Version 0.0 May 2009 Page 42
Uranine-Tagged Aerosols SOP-WDE-08-03
Revision 0 January 2008 Page 6 of 8
6. Transfer the solution contents into a clean, prelabeled amber bottle. Tightly cap the container and store it in a cool, dark environment.
Note: This solution has a shelf life of approximately 3 months. At the end of that time period, discard the remaining solution properly.
9.4 Preparation of the Working Uranine Standard Solutions
Working standards of various concentrations can be prepared from the intermediate stock solution. (Be careful not to exceed the range of the fluorometer.) Prepare at least three working standards to be used to calibrate the fluorometer. 1. Determine the amount of intermediate stock solution to be added to a 100-mL
volumetric flask using the calculations in section 14.0. 2. Add a small amount (~ 25 mL) of 0.01 N NaOH to the volumetric flask. 3. Transfer the calculated amount of intermediate stock solution into the 100-mL
volumetric flask using a glass volumetric pipette. 4. Bring the flask to volume using 0.01 N NaOH. 5. Label the container with the date, composition, and operator’s name. 6. Store the container in a cool, dark environment. 7. Prepare at least two additional working standards at different concentrations using
procedures outlined in steps 1–6. 8. Set up the fluorometer according to procedures outlined in SOP-WDE-08-02,
Standard Operating Procedure for the Turner Quantech Digital Filter Fluorometer. Note: These solutions have a short shelf life and should be discarded within a few hours of preparation. Prepare new working standards daily.
9.5 Calibration of the Turner Quantech Fluorometer
See SOP-WDE-08-02, Standard Operating Procedure for the Turner Quantech Digital Filter Fluorometer.
9.6 Verification of Proper Instrument Operation
Following initial setup, proper instrument operation is verified by measuring the instrument’s response to previously prepared calibration standards. Insert each standard into the fluorometer as “unknown” and allow the fluorometer to determine the concentrations. Read each working standard three times. Proper instrument response is verified if the average of the actual responses is within acceptable limits (± 3%) of the expected response.
10.0 Sample Generation and Testing
This section is not applicable for this method.
Test/QA Plan for Pesticide Spray DRT in a Low Speed Wind Tunnel Version 0.0 May 2009 Page 43
Uranine-Tagged Aerosols SOP-WDE-08-03
Revision 0 January 2008 Page 7 of 8
11.0 Preservation
Sample preservation is not relevant for this method.
12.0 Sample Analysis Procedure
Unknown samples can be analyzed according to the procedures in SOP-WDE-08-02, Standard Operating Procedure for the Turner Quantech Digital Filter Fluorometer.
13.0 Troubleshooting
Refer to the user’s manual for troubleshooting guidelines.
14.0 Data Analysis and Calculations
The following concentration calculations are used:
G/V = g/mL, (1)
Where G is number of grams of material determined gravimetrically, and
V is volume (mL).
V1*C1 = V2*C2, (2)
Where V is volume (mL), and
C is concentration.
15.0 Computer Hardware and Software
Spreadsheet software can be used with this method to assist in data analysis.
16.0 Data and Records Management
Records of calculations, use, and maintenance are to be kept in the operator’s laboratory notebooks.
17.0 Quality Control and Quality Assurance
Calculate the relative standard deviation for the three readings by dividing the sample standard deviation by the mean. If the relative standard deviation is less than or equal to 3%, preparation of the working standards is considered to be correct. If the relative standard deviation exceeds 3%, the samples should be discarded and new standards prepared. Should the problem persist, refer to the manual for troubleshooting guidelines.
As noted in the calibration procedure, verification within prescribed standard-dependent limits must be made prior to use of the fluorometer for analytical purposes.
Test/QA Plan for Pesticide Spray DRT in a Low Speed Wind Tunnel Version 0.0 May 2009 Page 44
Uranine-Tagged Aerosols SOP-WDE-08-03
Revision 0 January 2008 Page 8 of 8
18.0 References
Alion Science and Technology. 2008. Standard Operating Procedure for the Turner Quantech Digital Filter Fluorometer, SOP-WDE-08-02. Research Triangle Park, NC.
Alion Science and Technology. 2007. Standard Operating Procedure for Operation and Maintenance of the Sartorius CP324S Balance, SOP-WDE-07-04. Research Triangle Park, NC.
Thermo Scientific. February 2007. Turner Digital Filter Fluorometer Operation Manual, Dubuque, Iowa.


![Data Validation and Verification [Autosaved] · ON IP DATA VALIDATION, VERIFICATION AND EXCHANGE DATA VALIDATION AND VERIFICATION USING IPOBSD’S TOOLS. Data Quality Vicious Cycle](https://img.pdfslide.us/doc/110x75/5e9d0eaef4fa863d2d614a6c/data-validation-and-verification-autosaved-on-ip-data-validation-verification.jpg)