Embed Size (px)
Citation preview
RUSSELL L HALEY & PETER B. CASE
This article describes a study in which 630 women rated brands ofpackage goods on each of 13 popular scales and compares theratings to find which scales were related and which discriminatedbest among brands. It makes additional observations about validity,response patterns, and scoring.
TESTING THIRTEEN ATTITUDESCALES FOR AGREEMENT
AND BRAND DISCRIMINATION
SCALES for measuring attitude and awareness enjoywide popularity in copy testing and frequent use
in concept testing as predictors of trial rates. As aresult, considerable attention has been paid to in-vestigating the characteristics of attitude scales whichmake them more or less suitable for these roles. Thesecharacteristics include validity, ability to discriminatebetween objects being rated, biases introduced inapplication by respondents, reliability, and sensitivityto advertising stimuli. Although the results reported inthis article pertain only to some of these characteris-tics, we include a brief discussion of each one in orderto put the article into perspective and identify the areaswhere our study makes contributions. The term''attitude scales," as employed here, reflects the broaddefinition commonly used in marketing research—thatis, it means simple questioning methods which seek
Russell I. Haley is Professor of Marketing at The WhittemoreSchool of Business and Economics, University of New Hamp-shire, Durham, NH. Peter B. Case is Specialist—Advertising andMedia Research with the General Electric Company in Fairfield,CT. The authors are indebted to the Advertising ResearchFoundation, its president at the time of the study, Paul E. J.Gerhold, and Ingrid C. Kildegaard, vice president and technicaldirector, who supervised the study and contributed substantiallyto parts of the analysis.
verbal evidence of affective attitude by asking aboutlikes, preferences, buying intentions, awareness, andso on.
The most important characteristic of an attitudescale is validity and the most critical question withrespect to that characteristic is whether a measuredchange in attitude can be related to an observed changein behavior. Most studies dealing with this questionhave attempted to relate attitude change to futurebehavior. Using repeat interview data, for example,Achenbaum (1967) found that nonusers of a brandwho had changed their rating of it from "good" to"excellent" were more likely to become users thanthose who had changed from "good" only to "verygood," the latter were more likely to become usersthan those who had not changed their rating at all, andso on. He found similarly reasonable correspondencebetween changes in ratings and changes in behaviorwith a purchase intent scale, a brand-most-likely-to-buy scale, and top-of-mind brand awareness. DuBois(1958, 1967), using a scale similar to Achenbaum's("one of the best," "good," etc.), found exactly thesame kind of correspondence. But he also found thatchanges in brand use appeared to affect subsequentattitudes. Krugman (1965), and more recently Ehren-berg (1974), have in fact proposed models whichimply that for some products the kind of attitude
20/Journal of Marketing, Fall 1979Journal of MarketingVol. 43 (Fall 1979). 20-32.
change measured by this kind of scale does not occuruntil after there has been a change in behavior. Using adifferent approach, Assael and Day (1968) obtainedattitude (agreement-with-statement scale) and brandawareness measures from a series of special monthlyand bimonthly surveys and related these to brandshares obtained from MRCA and Nielsen. Their timeseries analyses of these aggregate data, while produc-ing some evidence that attitude change followed achange in brand share, led them to conclude that, inthe main, change in attitude preceded change inbehavior. Thus, while relationships between attitudechange and behavior change have been demonstrated,there is disagreement about the exact nature of therelationship. Assael and Day also concluded thatchange in attitude was a better predictor of subsequentchanges in brand share than was change in awareness.
Less meaningful tests of validity, which might becalled tests of attitude-behavior consistency or concur-rent validity, consist of comparing attitude measuresmade at just one point in time with concurrent orsubsequent brand purchase. A number of authors havereported on such tests (Abrams 1966; Axelrod 1968;Bird and Ehrenberg 1970; Gormley 1974) or reviewedthe problem in general (Gross and Niman 1975). Wehave included in this paper a report of our ownfindings from such a test.
The first aim of the study we report here, though,was to test consistency among attitude measuresthemselves rather than between the attitude measuresand behavior. Although tests of consistency amongmeasures may be thought of as a kind of validitytesting (convergent validity), the large number ofattitude scales in use today gives the question of whichscales agree witb each other a special interest of itsown. Several studies which have directly or indirectlyincluded tests of this question have found generallyhigh levels of agreement. Kassarjian and Nakanisbi(1967) found close agreement among a - 2 to + 2Stapel scale, a paired comparison technique, and twoother rating methods. Gormley (1974) reported a highcorrelation between a five-point excellent to poor scaleand a purchase intent scale, and Gruber (1970) found ahigh degree of consistency between a purchase intentscale and a purchase probability scale. Hawkins,Albaum, and Best (1974) found reasonable agreementbetween the distributions of ratings from a Stapel scaleand a semantic differential. The simultaneous testingof a larger number of scales, as in this study, providesa greater opportunity for disagreement to show up thanwhen only a few scales are compared, as our resultswill bear out.
The second major aim of the study reported herewas to compare tbe scales with respect to their ability
to discriminate between brands. Not much researchhas been done on discrimination between brands of thefrequently purchased package goods studied in thisarticle. A central, often discussed question however, iswhether paired comparison and other forced choicemethods discriminate better than scales which rate onebrand at a time. Seaton (1974) cites studies to showthat single object rating methods have discriminated aswell as comparative methods. He notes that althoughdirect comparisons are generally better at distinguish-ing minute physical characteristics of products,perceiving physical differences does not necessarilyimply preferring one product to another. He suggests aweakness of paired comparison may be that it"discovers" a preference where in fact there is none.More recently, Albaum, Best, and Hawkins (1977), ina study designed to demonstrate the interval propertiesofthe Stapel scale, presented data which indicated thatthe Stapel scale discriminated as well as a comparativemeasure among the images of five department stores.
Although response bias was not one ot the primaryobjects of this study, any test of 13 scales cannot helpbut provide insights into the way respondents react toattitude measures. Various sources of response biashave been discussed in previous research. Severalauthors (Abrams 1966; Clancy and Garsen 1970; Goldand Salkind 1974) have noted the tendency of somerespondents to give favorable ratings and of others togive unfavorable ratings. Clancy and Garsen point outthat comparative measures, which do not permitrespondents to rate things at an identical level, arebetter than single object rating methods in coping withthese yeasaying and naysaying response styles. Otherauthors have discussed particular scale characteristicswhich respondents have difficulty handling. Shulman(1973) found that people tend to overuse the extremesof a numerical scale with verbal anchors at the ends,whereas an agreement scale without numbers was lesssubject to this "extremity response bias." Roshwalb(1975), in a discussion with implications for thepurchase probability scale, demonstrated the difficultysome people have estimating subjective probabilities.Still other authors (Falthzik and Jolson 1974; Wildt andMazis 1978; Worcester and Bums 1975) have studiedaspects of scale construction, such as the wording ofverbal labels, tbeir position, and their apparentinterpretation by respondents.
Two other important criteria for attitude mea-sures—test-retest reliability and sensitivity to theeffects of advertising stimuli—were not covered in thestudy we report. Several other studies have appliedthese criteria however. Kassarjian and Nakanishi(1967) found high test-retest correlation for both theStapel scale and the paired comparison technique.
Testing Thirteen Attitude Scales / 21
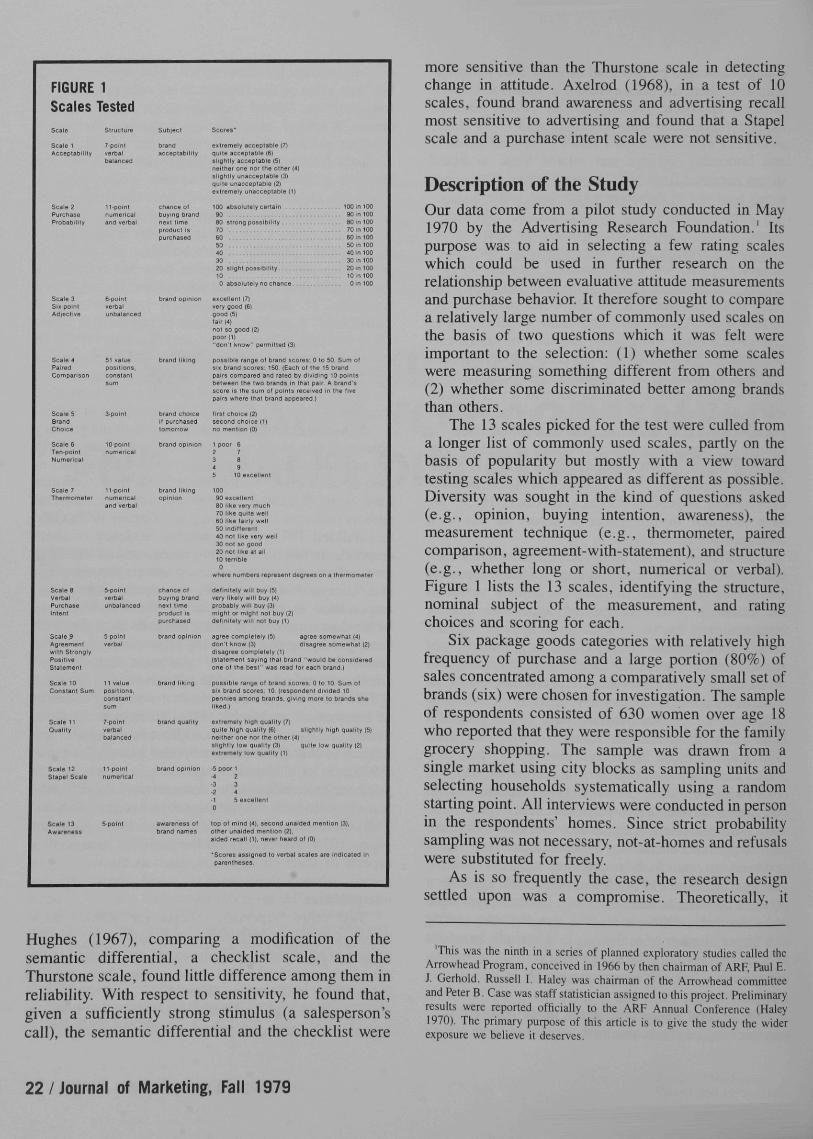
FIGURE 1Scales Tested
7.pointverbalDalanced
Scaie 2 1t pointPurchase numericai
Scale 3 G poiniSiipoinl verbalAdiectivs unbaiar
Scale 4 51 oaluePaired pO3>lioris,CorrparFSOr conslaril
sum
Scale 5 3 pointBrand
Scale 6 lOpoinlTen-poinI numericsNumerical
Scale 7 ii.pDInlTrieritiomeler numerical
and verbal
ScalesVerbalPurchaseInieni
Scale.9Agreeme
PosiliveStaTemen
Scale 10Conalani Su
Scale 11Quality
5-pointverbalunbalances
11 valisepositions.coristani
7.po/niverbalbalance
Scale 12 npo ln lSlapel Scale numsrical
Scale 13AwareriBs
brandacceplablilly
prodjcl Ispurchased
brand likingopinion
chance olbuying brandne'i timeproduci 15purchased
brand oplmcn
e'iremely acceptable (7)quite acceoiable IB)siiflnily accepiable fb)nellder one nor ihe other (4)sliflhily unacceciable (3|quite unacceptable (21eitremely unacceptable 01
100 absolulelycenain . .8080 strong poasibmiy
20 slight pO9Slblllly100 absolutely no chanca
eicellenl (71very good (6)flood (5)lair wnot so good {2|poorHl"don't knew " permitted (3)
possible range ol brand scores: 0 to 50. Sum olsii brand scores- 150 (Each or the 15 brandpairs compared and raled by dividing 10 pofntsbetween ilie two brands In thai pal' A brand'sscore IS the sum 0' polnis received m the fivepairs Mhere thai brand appeared.:
moonlOOmoon 100n 100moomoomoontOO
lirsind choice {1|
10 (
10090 eicellent80 like very much70 like quite welleo like lairly well50 indiliereni40 not like very we30 not so Qood20 not like at all
virhore numbers represent degrees on a thermomeler
dellnilely vfill buy (5)very likely will tjjy (4|probaOl) will bjy 13)might or miflhi not buy (2)dellnilely will not buy (I)
agree completely (5) agree somewhat (4)don'l know (3| disagree somewhal (2)disagree comoletely (1|(siatemeni saying that brand "wouid be consideredone ot the best" was read for each brand )
possibie range of brand scores. 0 to 10 Sum olsn brand scores 10 (respondent divided 10pennies arTTong brands, flivinfl more lo brands sheliked I
e>tremoiy high quality (7|quite high Quality (6|neilTier one nor the olherslightly low quality (3)e«iremely low quality (1|
silflMly hign quality (St)quile low quality (2)
brand opinion -5 poor 1
awareness ol top ol mind 141. second unaiOeO mention |3).brand names other unaided menlion (21,
aided recali (t), never heard ol (0|
more sensitive than the Thurstone scale in detectingchange in attitude. Axelrod (1968), in a test of 10scales, found brand awareness and advertising recallmost sensitive to advertising and found that a Stapelscale and a purchase intent scale were not sensitive.
Description of the StudyOur data come from a pilot study conducted in May1970 by the Advertising Research Foundation.' Itspurpose was to aid in selecting a few rating scaleswhich could be used in further research on therelationship between evaluative attitude measurementsand purchase behavior. It therefore sought to comparea relatively large number of commonly used scales onthe basis of two questions which it was felt wereimportant to the selection: (1) whether some scaleswere measuring something different from others and(2) whether some discriminated better among brandsthan others.
The 13 scales picked for the test were culled froma longer list of commonly used scales, partly on thebasis of popularity but mostly with a view towardtesting scales which appeared as different as possible.Diversity was sought in the kind of questions asked(e.g., opinion, buying intention, awareness), themeasurement technique (e.g., thermometer, pairedcomparison, agreement-with-statement), and structure(e.g., whether long or short, numerical or verbal).Figure 1 lists the 13 scales, identifying the structure,nominal subject of the measurement, and ratingchoices and scoring for each.
Six package goods categories with relatively highfrequency of purchase and a large portion (80%) ofsales concentrated among a comparatively small set ofbrands (six) were chosen for investigation. The sampleof respondents consisted of 630 women over age 18who reported that they were responsible for the familygrocery shopping. The sample was drawn from asingle market using city blocks as sampling units andselecting households systematically using a randomstarting point. All interviews were conducted in personin the respondents' homes. Since strict probabilitysampling was not necessary, not-at-homes and refusalswere substituted for freely.
As is so frequently the case, the research designsettled upon was a compromise. Theoretically, it
Hughes (1967), comparing a modification of thesemantic differential, a checklist scale, and theThurstone scale, found little difference among them inreliability. With respect to sensitivity, he found that,given a sufficiently strong stimulus (a salesperson'scall), the semantic differential and the checklist were
'This was the ninth in a series of planned exploratory studies called theArrowhead Program, conceived in 1966 by then chairman of ARF. Paul E.I Gerhold. Russell I. Haley was chairman of the Arrowhead committeeand Peter B. Case was staff statistician assigned to this project. Preliminaryresults were reported officially to the ARF Annual Conference (Haley1970). The primary purpose of this article is to give the study the widerexposure we believe it deserves.
22/Journal of Marketing, Fall 1979
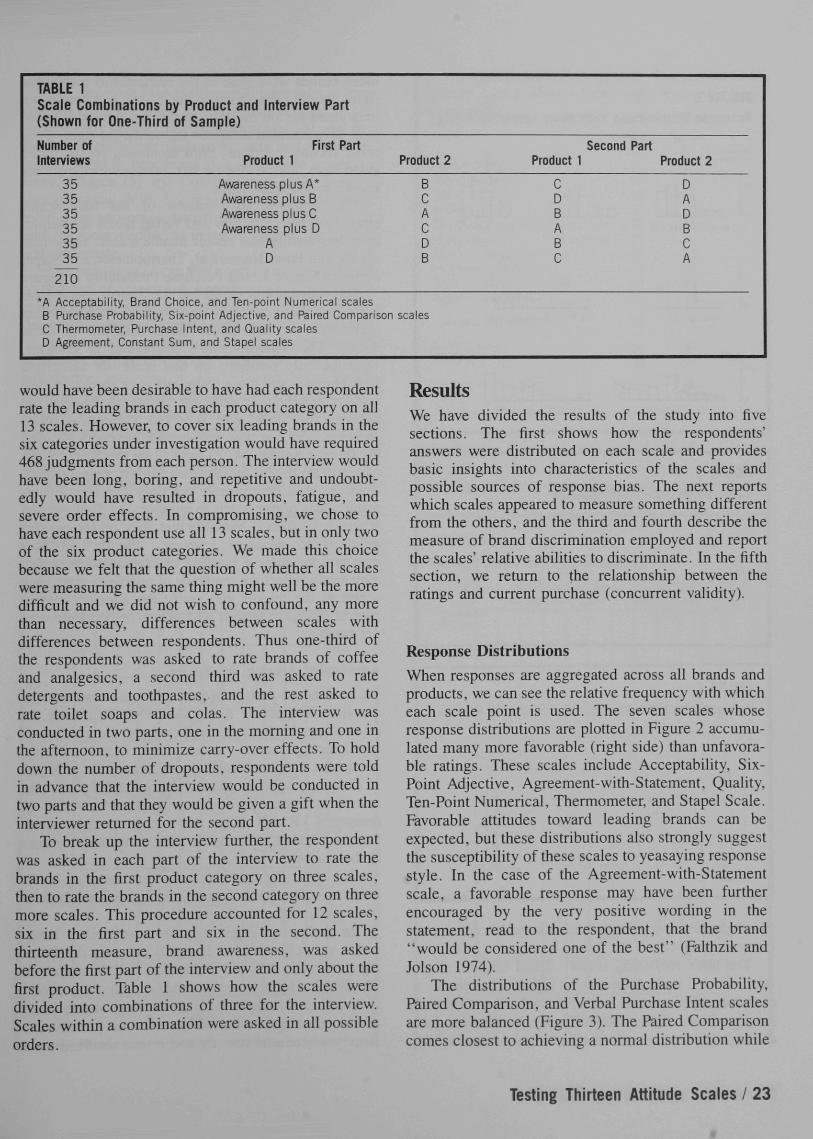
TABLE 1
Scale Combinations by Product and Interview Part
(Shown for One-Third of Sample)
Number of First PartInterviews Product 1
35 Awareness plus A*35 Avvareness plus B35 Awareness plusC35 Awareness plus D35 A35 D
210
*A Acceptability, Brand Choice, and Ten-point Numerical scalesB Purchase Probability, Six-point Adjective, and Paired ComparisonC Thermometer, Purchase Intent, and Quality scalesD Agreement, Constant Sum, and Stapel scales
Product 2
BCACDB
scales
Second PartProduct 1
O Q
CD <
CD O
Product 2
DADBCA
would have been desirable to have had each respondentrate the leading brands in each product category on all13 scales. However, to cover six leading brands in thesix categories under investigation would have required468 judgments from each person. The interview wouldhave been long, boring, and repetitive and undoubt-edly would have resulted in dropouts, fatigue, andsevere order effects. In compromising, we chose tohave each respondent use all 13 scales, but in only twoof the six product categories. We made this choicebecause we felt that the question of whether all scaleswere measuring the same thing might well be the moredifficult and we did not wish to confound, any morethan necessary, differences between scales withdifferences between respondents. Thus one-third ofthe respondents was asked to rate brands of coffeeand analgesics, a second third was asked to ratedetergents and toothpastes, and the rest asked torate toilet soaps and colas. The interview wasconducted in two parts, one in the morning and one inthe afternoon, to minimize carry-over effects. To holddown the number of dropouts, respondents were toldin advance that the interview would be conducted intwo parts and that they would be given a gift when theinterviewer retumed for the second part.
To break up the interview further, the respondentwas asked in each part of the interview to rate thebrands in the first product category on three scales,then to rate the brands in the second category on threemore scales. This procedure accounted for 12 scales,six in the first part and six in the second. Thethirteenth measure, brand awareness, was askedbefore the first part of the interview and only about thefirst product. Table 1 shows how the scales weredivided into combinations of three for the interview.Scales within a combination were asked in all possibleorders.
ResultsWe have divided the results of the study into fivesections. The first shows how the respondents'answers were distributed on each scale and providesbasic insights into characteristics of the scales andpossible sources of response bias. The next reportswhich scales appeared to measure something differentfrom the others, and the third and fourth describe themeasure of brand discrimination employed and reportthe scales' relative abilities to discriminate. In the fifthsection, we return to the relationship between theratings and current purchase (concurrent validity).
Response Distributions
When responses are aggregated across all brands andproducts, we can see the relative frequency with whicheach scale point is used. The seven scales whoseresponse distributions are plotted in Figure 2 accumu-lated many more favorable (right side) than unfavora-ble ratings. These scales include Acceptability, Six-Point Adjective, Agreement-with-Statement, Quality,Ten-Point Numerical, Thermometer, and Stapel Scale.Favorable attitudes toward leading brands can beexpected, but these distributions also strongly suggesttbe susceptibility of these scales to yeasaying responsestyle. In the case of the Agreement-with-Statementscale, a favorable response may have been furtherencouraged by the very positive wording in thestatement, read to the respondent, that the brand"would be considered one of the best" (Falthzik andJolson 1974).
The distributions of the Purchase Probability,Paired Comparison, and Verbal Purchase Intent scalesare more balanced (Figure 3). The Paired Comparisoncomes closest to achieving a normal distribution while
Testing Thirteen Attitude Scales / 23
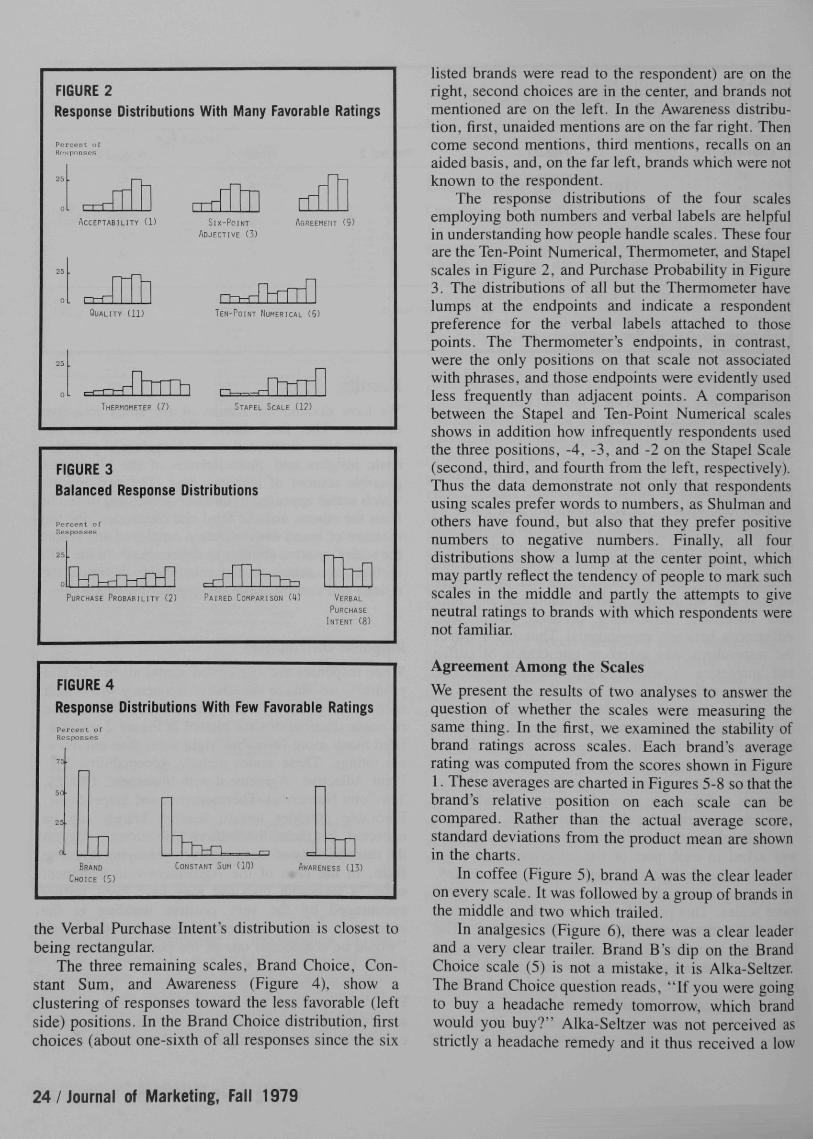
FIGURE 2Response Distributions With Many Favorable Ratings
Percent of
ACCEPTABILITY (1) SIX-POINT AGHEEMEIIT (S)
ADJECTIVE (3)
(11) TEN-POINT NUHERICAL (6)
IHEPMOHETEP U) • TAPEL SCALE
FIGURE 3Balanced Response
Percent ofResponses
25
0 rVn-M^-T-nTlPURCHASE PROBABILITY (2)
Distributions
.-r-rPAIRED COMPARISON W VERBAL
PURCHASE
INTENT (H)
FIGURE 4Response Distributions Witb Few Favorable RatingsPercent ofResponses
BRANDCHOICE (5)
CONSTANT SUM fl AWARENESS (13)
the Verbal Purchase Intent's distribution is closest tobeing rectangular.
The three remaining scales, Brand Choice, Con-stant Sum, and Awareness (Figure 4), sbow aclustering of responses toward the less favorable (leftside) positions. In the Brand Choice distribution, firstchoices (about one-sixth of all responses since the six
listed brands were read to the respondent) are on theright, second choices are in the center, and brands notmentioned are on the left. In the Awareness distribu-tion, first, unaided mentions are on the far right. Thencome second mentions, third mentions, recalls on anaided basis, and, on the far left, brands which were notknown to the respondent.
The response distributions of the four scalesemploying both numbers and verbal labels are helpfulin understanding bow people handle scales. These fourare the Ten-Point Numerical, Thermometer, and Stapelscales in Figure 2, and Purchase Probability in Figure3. The distributions of all but the Thermometer havelumps at the endpoints and indicate a respondentpreference for the verbal labels attached to thosepoints. The Thermometer's endpoints, in contrast,were the only positions on that scale not associatedwith phrases, and those endpoints were evidently usedless frequently than adjacent points. A comparisonbetween the Stapel and Ten-Point Numerical scalesshows in addition how infrequently respondents usedthe three positions, -4, -3 , and -2 on the Stapel Scale(second, third, and fourth from the left, respectively).Thus the data demonstrate not only that respondentsusing scales prefer words to numbers, as Shulman andothers have found, but also that they prefer positivenumbers to negative numbers. Finally, all fourdistributions show a lump at the center point, whichmay partly reflect the tendency of people to mark suchscales in the middle and partly the attempts to giveneutral ratings to brands with which respondents werenot familiar.
Agreement Among the Scales
We present the results of two analyses to answer thequestion of whether the scales were measuring thesame thing. In the first, we examined the stability ofbrand ratings across scales. Each brand's averagerating was computed from the scores shown in Figure1. These averages are charted in Figures 5-8 so that thebrand's relative position on each scale can becompared. Rather than the actual average score,standard deviations from the product mean are shownin the charts.
In coffee (Figure 5), brand A was the clear leaderon every scale. It was followed by a group of brands inthe middle and two which trailed.
In analgesics (Figure 6), there was a clear leaderand a very clear trailer. Brand B's dip on the BrandChoice scale (5) is not a mistake, it is Alka-Seltzer.The Brand Choice question reads, "If you were goingto buy a headache remedy tomorrow, which brandwould you buy?" Alka-Seltzer was not perceived asstrictly a headache remedy and it thus received a low
24/Journal of Marketing, Fall 1979
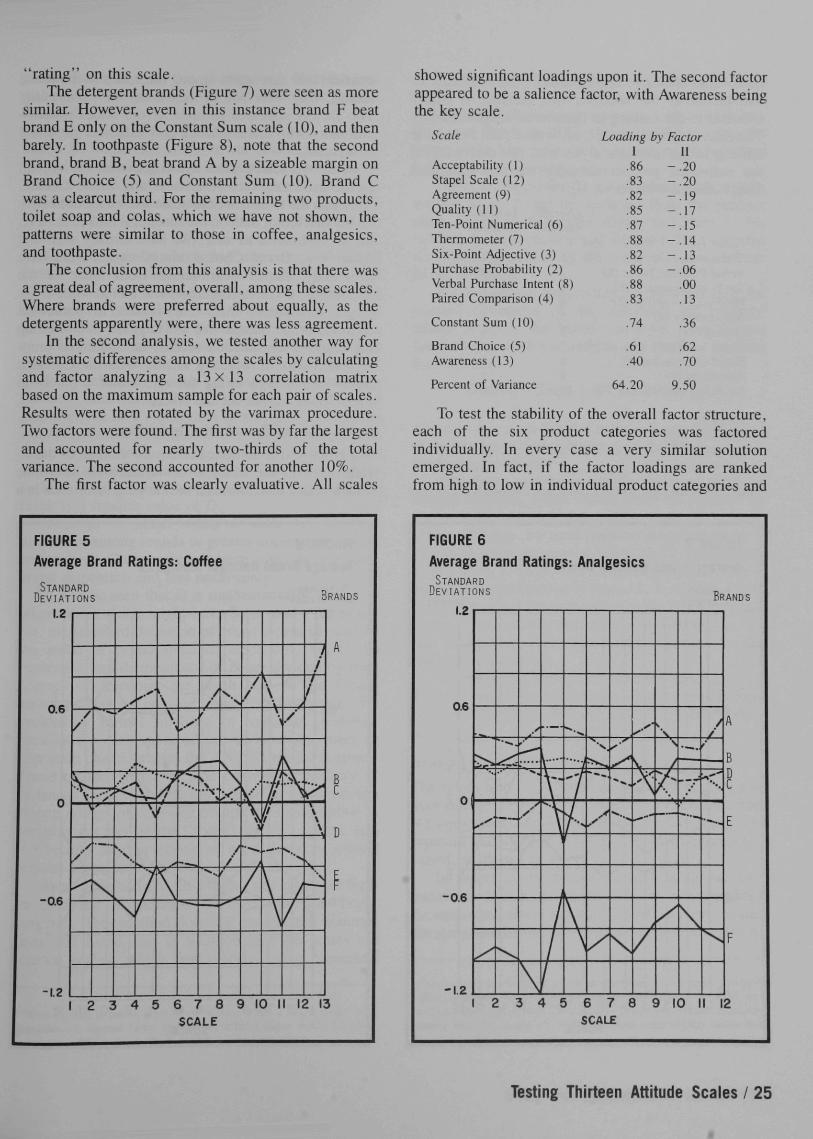
"rating" on this scale.The detergent brands (Figure 7) were seen as more
similar. However, even in this instance brand F beatbrand E only on the Constant Sum scale (10), and thenbarely. In toothpaste (Figure 8), note that the secondbrand, brand B, beat brand A by a sizeable margin onBrand Choice (5) and Constant Sum (10). Brand Cwas a clearcut third. For the ren:iaining two products,toilet soap and colas, which we have not shown, thepatterns were similar to those in coffee, analgesics,and toothpaste.
The conclusion from this analysis is that there wasa great deal of agreement, overall, among these scales.Where brands were preferred about equally, as thedetergents apparently were, there was less agreement.
In the second analysis, we tested another way forsystematic differences among the scales by calculatingand factor analyzing a 13x13 correlation matrixbased on the maximum sample for each pair of scales.Results were then rotated by the varimax procedure.Two factors were found. The first was by far the largestand accounted for nearly two-thirds of the totalvariance. The second accounted for another 10%.
The first factor was clearly evaluative. Alt scales
showed significant loadings upon it. The second factorappeared to be a salience factor, with Awareness beingthe key scale.
FIGURE 5Average Brand Ratings:
STANDDEVIAT
1.2
0.6
0
-0.6
-1.2
ARDION;
/
\ . .
\
\-y—
\
/
\
\1
\
2 3 4 5 6
Coffee
~—
/f
f
\
\
N
sJ
) 7 8 SSCALE
/ \
/
• /
—
\
\
) 10 1
\
r.-V
' • s
/
/
/
/
VV\
's
RANDS
A
B
c
D
1 12 13
Scale
Acceptability (1)Stapel Scale (12)Agreement (9)Quality (11)Ten-Point Numerical (6)Thermometer (7)Six-Point Adjective (3)Purchase Probability (2)Verbal Purchase Intent (8)Faired Comparison (4)
Constant Sum (10)
Brand Choice (5)Awareness (13)
Percent of Variance
Loading by FactorI
.86
.83
.82
.85
.87
.88
.82
.86
.88
.83
.74
.61
.40
64.20
II-.20-.20-.19-.17-.15-.14-.13- 0 6
.00
.13
.36
.62
.70
9,50
To test the stability of the overall factor structure,each of the six product categories was factoredindividually. In every case a very similar solutionemerged. In fact, if the factor loadings are rankedfrom high to low in individual product categories and
FIGURE 6Average Brand Ratings: Analgesics
STANDARDDEVIATIONS
-0.6
-1.2
' ' • • ^ .
\
\
"71
\ '
2 3 4 E
r\\ \
V
/
/
K . • • '
\
) 6 7 8 9 10 1SCALE
BRANDS
/
^'-• " .
A
BDC
E
F
1 12
Testing Thirteen Attitude Scales / 25
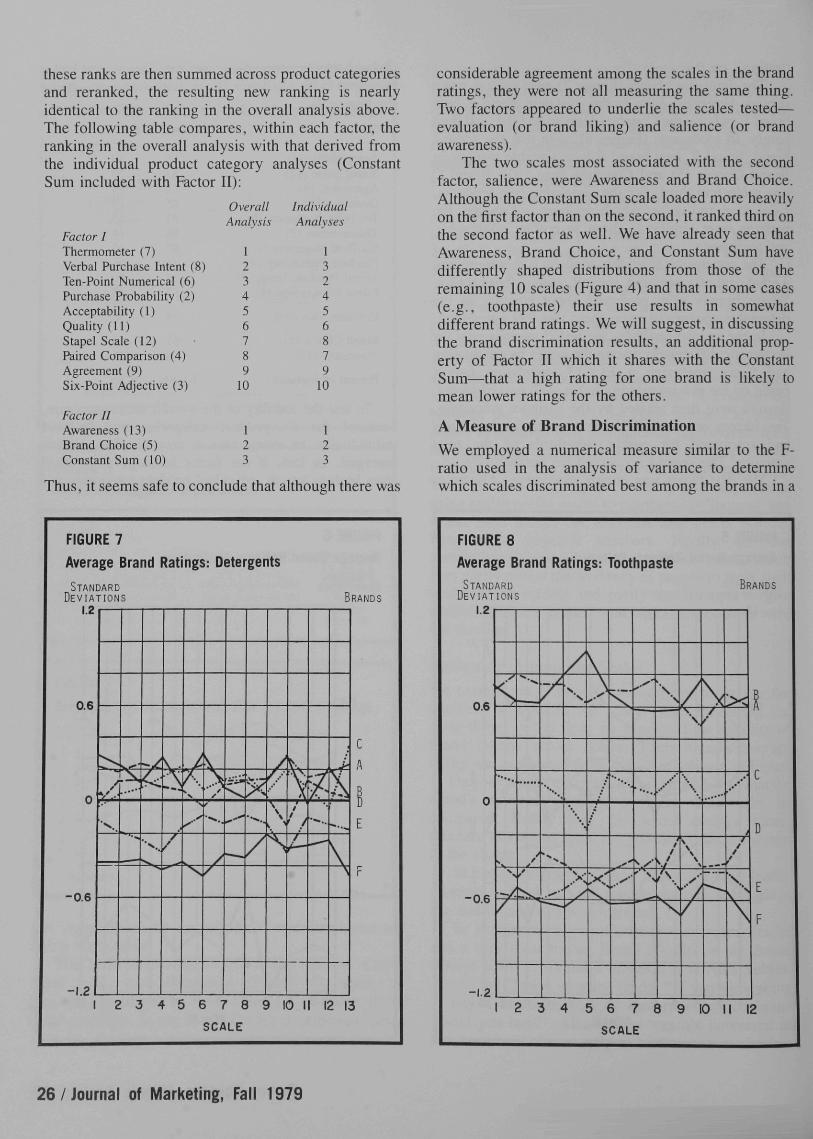
these ranks are then summed across product categoriesand reranked, the resulting new ranking is nearlyidentical to the ranking in the overall analysis above.The following table compares, within each factor, theranking in the overall analysis with that derived fromthe individual product category analyses (ConstantSum included with Factor II):
Factor IThermometer (7)Verbal Purchase Intent (8)Ten-Point Numerical (6)Purchase Probability (2)Acceptability (1)Quality (11)Stapel Scale (12)Faired Comparison (4)Agreement (9)Six-Point Adjective (3)
Factor IIAwareness (13)Brand Choice (5)Constant Sum (10)
OverallAnalysis
123456789
10
123
IndividualAnalyses
132456879
10
123
Thus, it seems safe to conclude that although there was
FIGURE 7
Average Brand
STANDARDDEVIATIONS
0.6
0
-0.6
-1.2
/
2 3 A
Ratings: Detergents
/
/
KN
s
w.—
• - - L >
s' /jfc—
^ 5 6 7 8 9 10 1SCALE
BRANDS
' ^
• - . .
- ^
\
C
A
BD
E
r
12 13
considerable agreement among the scales in the brandratings, they were not ail measuring the same thing.Two factors appeared to underlie the scales tested—evaluation (or brand liking) and salience (or brandawareness).
The two scales most associated with the secondfactor, salience, were Awareness and Brand Choice.Although the Constant Sum scale loaded more heavilyon the first factor than on the second, it ranked third onthe second factor as well. We have already seen thatAwareness, Brand Choice, and Constant Sum havedifferently shaped distributions from those of theremaining 10 scales (Figure 4) and that in some cases(e.g., toothpaste) their use results in somewhatdifferent brand ratings. We will suggest, in discussingthe brand discrimination results, an additional prop-erty of Factor II which it shares with the ConstantSum—that a high rating for one brand is likely tomean lower ratings for the others.
A Measure of Brand Discrimination
We employed a numerical measure similar to the F-ratio used in the analysis of variance to determinewhich scales discriminated best among the brands in a
FIGURE 8
Average Brand Ratings: ToothpasteSTANDARD
DEVIATIONSBRANDS
1.2
0.6<s
-IZ
/ \
2 3 4 5 6 7 8 9 10 II 12
SCALE
26/Journal of Marketing, Fall 1979

product category. In this section, we describe anddiscuss the statistic and in the next section we presentthe results.
Before describing the statistic, which we havecalled D, some discussion of its motivation may behelpful in evaluating it as a measure of discrimination.The statistic is a ratio whose numerator, B, measuresthe dispersion of brand mean scores. Brand dispersionis directly related to a scale's ability to discriminate.Though two scales may be measuring the sameattitude, the scale on which respondents tend to rate allbrands highly would show relatively less branddispersion. Such a scale might not be expected todiscriminate particularly well. The value of B, andtherefore the value of D, would be small in this case.
The denominator, /?, is a measure of uncertainty orlack of consensus among respondents. Uncertainty isinversely related to a scale's ability to discriminate^the more uncertainty, the less discrimination. If somecharacteristic of a scale, such as ambiguous labels forexample, causes respondents with similar attitudes togive very different ratings, the scale could not beexpected to discriminate very well. The value of R forsuch a scale is likely to be relatively large and theresult is a smaller value of D.
Thus D is small when a scale records lessdispersion among brands or greater uncertainty amongrespondents. Conversely it is large when there is morebrand dispersion and less uncertainty.
It will be seen that D is mathematically similar toother ratios which might have been used—for exam-ple, the standard deviation of brand means divided bythe mean of brand standard deviations. Or, if thenumerator and denominator of D are divided by theirdegrees of freedom, the result will be the F-ratioassociated with a one-way analysis of variance. Weavoided a formal analysis of variance, however,because the data appeared not to have a number ofimportant characteristics the ANOVA model assumes.These characteristics include continuity, equality ofvariances about brand means, statistical independenceamong ratings of different brands (this assumption iscertainly not met on the "forced choice" scales), and(for testing the hypothesis of no differences amongbrands) normality.^
As an alternative to the F-ratio, one might performan analysis of variance based simply on brandrankings. This method does not require the assump-tions just listed, nor in addition that the scales areinterval scales, which our analysis using numerical
Were the data to permit analysis of variance at all. a mixed model withrespondents a random factor and brands a fixed factor would be moreappropriate than the fixed effects model our ratio resembles.
scores assumes. We felt that too much informationwould be lost, however, by basing the analysis onrankings only. Moreover, there is evidence (Albaum,Best, and Hawkins 1977) that interval properties forrating scales like those we are testing can be assumedwithout serious consequences.
For brand dispersion B, we computed each brand'saverage score X and its deviation from the productmean M. using the scores shown in Figure 1. Wesquared these deviations and summed them over thesix brands (weighted by the number of respondentsrating the brand).
For respondent uncertainty R, we computed thesquared deviations of the individual respondents'ratings X from the brand's average score X andsummed over both respondents and brands. Thus themeasure was:
= BIR = ^ - Mf
where7= 1 6 indexed brands, /i was the numberof respondents rating brand j , and / = 1, . . ., HJindexed respondents.^
Arguments can be raised in favor of differentscoring methods, which would affect the value of D,and we examined several alternative methods. In termsof current usage, the most frequent procedure by far issimply to assign sequential values to the points used,as in Figure 1. Thus, if a six-point adjective scale isused it is almost invariably scored 6. 5, 4, 3, 2, 1 withthe higher values being assigned to the more desirablescores. Consequently our analysis was based on, andour results are limited to, scoring done in thisconventional manner.
As long as the scales are all scored sequentially, itdoes not matter for this analysis what the actual scoresare. The ratio D has the same value whether a scale isscored, say, - 5 to + 5 or 0-100.
Brand Discrimination Results
The values of D varied more among product categoriesthan among scales. The average value decreased from.41 in toothpaste to .045 in detergents. The range (andstandard deviation) of D within product categories alsovaried, as shown in Table 2.
In reporting the results for each scale, we havetransformed the values of D so that the average value isthe same (and arbitrarily equal to 50) in every productcategory, and so that the standard deviation is also the
^As the study was designed, n, for the Awareness scale equaled 140 on thecoffee, detergent, and toilet soap brands and zero on the other threeproducts, and n^ for ail other scales equaled 105 on every brand. Because ofmissing data, the values of n^ tabulated were often slightly below thesetheoretical values.
Testing Thirteen Attitude Scales / 27
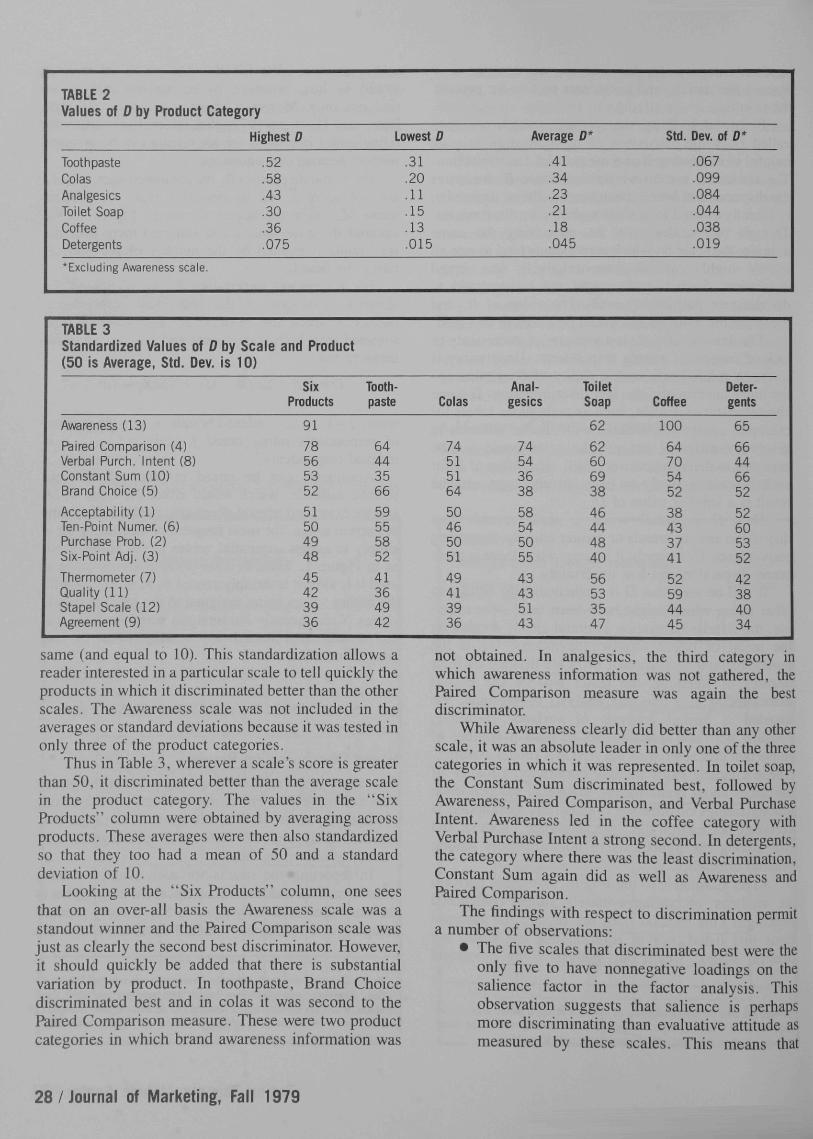
TABLE 2Values of D by Product
ToothpasteColas
AnalgesicsToilet SoapCoffeeDetergents
*Excluding Awareness scale
TABLE 3Standardized Values of
Category
Highest D
.52
.58
.43
.30
.35
.075
D by Scale and(50 is Average, Std. Dev. is 10)
Awareness (13)
Faired Comparison (4)Verbal Purch. Intent (8)Constant Sum (10)Brand Choice (5)
Acceptability (1)Ten-Point Numer. (6)Purchase Prob. (2)Six-Point Adj. (3)
Thermometer (7)Quality (11)Stapel Scale (12)Agreement (9)
Product
SixProducts
91
78565352
51504948
45423936
Lowest
Tooth-paste
64443566
59555852
41364942
.31
.20
.11
.15
.13
.015
D
Colas
74515164
50465051
49413936
Average
Anal-gesics
74543638
58545055
43435143
,41.34.23.21.18.045
D*
ToiletSoap
62
62606938
46444840
56533547
Std.
Coffee
100
6470545238433741
52594445
Dev. ol
.067
.099
.084
.044
.038
.019
D*
Deter-gents
65
66446652
52605352
42384034
same (and equal to 10). This standardization allows areader interested in a particular scale to tell quickly theproducts in which it discriminated better than the otherscales. The Awareness scale was not included in theaverages or standard deviations because it was tested inonly three of the product categories.
Thus in Table 3, wherever a scale's score is greaterthan 50, it discriminated better than the average scalein the product category. The values in the "SixProducts" column were obtained by averaging acrossproducts. These averages were then also standardizedso that they too had a mean of 50 and a standarddeviation of 10.
Looking at the "Six Products'' column, one seesthat on an over-all basis the Awareness scale was astandout winner and the Paired Comparison scale wasjust as clearly the second best discriminator. However,it should quickly be added that there is substantialvariation by product. In toothpaste. Brand Choicediscriminated best and in colas it was second to thePaired Comparison measure. These were two productcategories in which brand awareness information was
not obtained. In analgesics, the third category inwhich awareness information was not gathered, thePaired Comparison measure was again the bestdiscriminator.
While Awareness clearly did better than any otherscale, it was an absolute leader in only one of the threecategories in which it was represented. In toilet soap,the Constant Sum discriminated best, followed byAwareness, Paired Comparison, and Verbal PurchaseIntent. Awareness led in the coffee category withVerbal Purchase Intent a strong second. In detergents,the category where there was the least discrimination.Constant Sum again did as well as Awareness andPaired Comparison.
The findings with respect to discrimination permita number of observations;
• The five scales that discriminated best were theonly five to have nonnegative loadings on thesalience factor in the factor analysis. Thisobservation suggests that salience is perhapsmore discriminating than evaluative attitude asmeasured by these scales. This means that
28/Journal of Marketing, Fall 1979
awareness may be the more important wayconsumers have of sorting out brands. Thus itwould not be unreasonable to expect change inawareness to be the better predictor of subse-quent purchase. Such a point of view is contraryto the findings of Assael and Day (1968) but isconsistent with the viewpoint first articulated byKrugman (1965) and later expanded upon byEhrenberg (1974) that change in perception ismore relevant than change in attitude inpredicting consumer behavior with respect tolow involvement products like those we havestudied here.
• The five scales that discriminated best allrestricted in some way the number of stronglypositive responses. For example, when theAwareness scale was used, only one brandreceived the top of mind score and only one thesecond mention. In the Paired Comparisonscoring, it was difficult for any one brand toreceive a perfect score since to do so it had todominate completely every other major brand.With the type of products studied, this kind ofdominance is very rare. Verbal Purchase Intentalso introduced some restrictions. Since mostpeople buy a single brand on a given purchaseoccasion, giving a "definitely will buy'' ratingfor one brand for the next buying occasion waslikely to reduce chances of parallel ratings forother brands. In the Constant Sum, as morepoints were given to one brand, fewer wereavailable for others. Brand Choice operated likeAwareness and Purchase Intent in that choosingone brand tended to exclude others. Thesecharacteristics can be seen in the responsedistributions ofthe five scales (Figures 3 and 4).These were also the scales with the highestloadings on the salience factor, and the resultstherefore suggest a possible broader interpreta-tion of the salience factor—as reflecting scalingtechniques which limit high ratings.
• Scales that discriminated less well permittedmany brands to be rated positively, resulting inthe response distributions shown in Figure 2.On these scales, it was easy for respondents toassign high ratings to several brands simul-taneously. Yet in doing so, subtle and importantdifferences may have been lost. We believe suchdifferences in preference are not artificialcreations of the "forced choice" measurementmethod, as the argument in Seaton's (1974)review suggests. They appear to be at leastpartly different in awareness. Moreover, ourversion of the Paired Comparison, the most
common kind of comparative measure, did notforce a respondent to choose one brand overanother. It permitted the respondent to give eachbrand in a pair five points, so that she could rateall brands the same, yet it still discriminatedmuch better than most of the other scales.
• The 11-point Purchase Probability scale, thoughamong the scales with a balanced responsedistribution (Figure 3), did not discriminate sowell as the five-point Verbal Purchase Intent.The reason may be that respondents preferredpoints carrying verbal anchors and tended toignore the others. Simply adding points to ascale in the hope of measuring finer distinctionsin attitude may not work. Including more than,say, seven points may in fact lessen the power ofthe scale to discriminate.
• Scales which did not present the respondentwith a uniform stimulus discriminated relativelyless well. An example was the Thermometer,which presented a picture of a thermometer,numbers from zero to 100, as well as anassortment of verbal anchors. Another was theAgreement scale, where a respondent could findherself in the unclear position of agreeing ordisagreeing "somewhat" with a strongly posi-tive statement.
Concurrent Validity
Another finding from this study was how the ratingsrelated to current brand usage—the scales' concurrentvalidity. A scale has concurrent validity if people whorate a brand favorably are more likely to be using itthan people who rate it unfavorably. Going a stepfurther, it is reasonable to expect that the higher therating the greater the likelihood the individual is acurrent user.
To test concurrent validity, we asked each respon-dent at the end of the interview which brand she hadbought last. We then computed the proportion of suchusers among the respondents giving each of thedifferent ratings on the scale. The results for each ofthe 13 scales are shown in Figure 9, where the datahave been aggregated for all 36 brands. Since theproportion for a given rating level was computed bydividing the number of users by the total people givingthat rating, Figure 9 gives, in effect, the average brandshare for each rating level.
•'Small bases caused noticeable random fiuctuation in Ihe proportion forsome scales—for example, Constant Sum. points 6 through 10. andAwareness, "never heard of." The bump at "don't know" on the Six-PointAdjective scale suggests we should have placed that "rating" further to theright.
Testing Thirteen Attitude Scales / 29
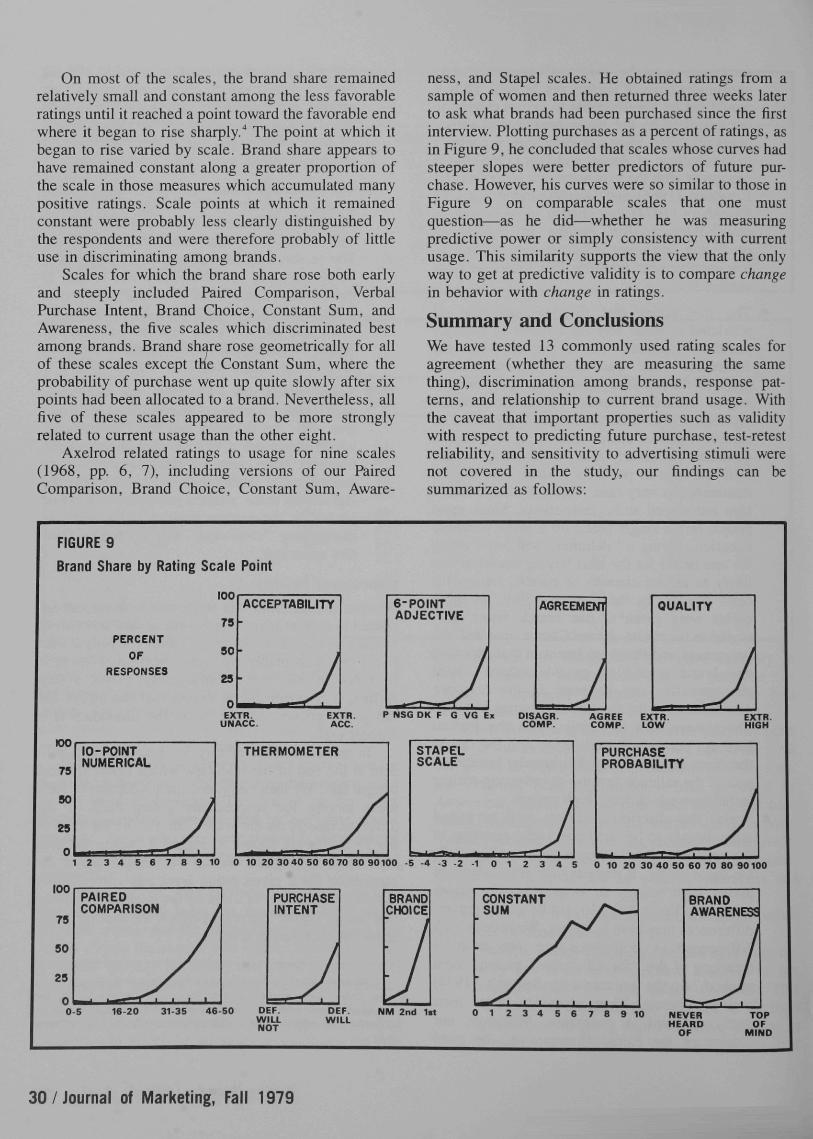
On most of the scales, the brand share remainedrelatively small and constant among the less favorableratings until it reached a point toward the favorable endwhere it began to rise sharply."* The point at which itbegan to rise varied by scale. Brand share appears tohave remained constant along a greater proportion ofthe scale in those measures which accumulated manypositive ratings. Scale points at which it remainedconstant were probably less clearly distinguished bythe respondents and were therefore probably of littleuse in discriminating among brands.
Scales for which the brand share rose both earlyand steeply included Paired Comparison, VerbalPurchase Intent, Brand Choice, Constant Sum, andAwareness, the five scales which discriminated bestamong brands. Brand share rose geometrically for allof these scales except the Constant Sum, where theprobability of purchase went up quite slowly after sixpoints had been allocated to a brand. Nevertheless, allfive of these scales appeared to be more stronglyrelated to current usage than the other eight.
Axelrod related ratings to usage for nine scales(1968, pp. 6, 7), including versions of our PairedComparison, Brand Choice, Constant Sum, Aware-
ness, and Stapel scales. He obtained ratings from asample of women and then retumed three weeks laterto ask what brands had been purchased since the firstinterview. Plotting purchases as a percent of ratings, asin Figure 9, he concluded that scales whose curves hadsteeper slopes were better predictors of future pur-chase. However, his curves were so similar to those inFigure 9 on comparable scales that one mustquestion—as he did—whether he was measuringpredictive power or simply consistency with currentusage. This similarity supports the view that the onlyway to get at predictive validity is to compare changein behavior with change in ratings.
Summary and ConclusionsWe have tested 13 commonly used rating scales foragreement (whether they are measuring the samething), discrimination among brands, response pat-terns, and relationship to current brand usage. Withthe caveat that important properties such as validitywith respect to predicting future purchase, test-retestreliability, and sensitivity to advertising stimuli werenot covered in the study, our findings can besummarized as follows;
FIGURE 9Brand Share by Rating Scale Point
100
PERCENTOF
RESPONSES
75
SO
25
ACCEPTABILITY 6-POINTADJECTIVE
AGREEMD^
EXTR.UNACC.
EXTB.ACC.
P NSG DK F G VG Ex DISAGH.COM P.
QUALITY
AGREE EXTR.COMP. LOW
EXTR.HIGH
THERMOMETER STAPELSCALE
PURCHASEPROBABILITY
1 2 3 4 5 6 7 8 9 1 0 0 1 0 2 0 3 0 4 0 5 0 6 0 7 0 8 0 9 0 1 0 0 5 4 - 3 2 1 0 1 2 3 4 5 0 1 0 2 0 3 0 4 0 5 0 6 0 7 0 8 0 9 0 1 0 0
100PAIREDCOMPARISON
00-5
PURCHASEINTENT
BRANDCHOICE
16-20 31-35 46 50 DEF. DEF.WILL WILLNOT
CONSTANTSUM
NM 2nd 1st
BRANDAWARENESS!
0 1 2 3 4 5 6 7 8 9 10 NEVER TOPHEARD OF
OF MIND
30/Journal of Marketing, Fall 1979
• A factor analysis showed that two scales. BrandAwareness and Brand Choice, were clearlymeasuring something different from the major-ity, and this appeared to be brand salience.
• A third scale, the Constant Sum, was alsostrongly associated with the salience factor,although it was more related to the majority ofscales.
• If two more scales—Paired Comparison andVerbal Purchase Intent—are added to the threejust mentioned, they form a group of five scaleswhichall have nonnegative loadings on the saliencefactor,show the greatest discrimination among brands,andshow the greatest consistency with currentbrand usage.
• The other eight scales—Acceptability. Quality,Agreement with Statement. Six-Point Adjec-tive, Ten-Point Numerical, Thermometer, Sta-pel Scale, and Purchase Probability—all hadnegative loadings on the salience factor andwere highly associated with the larger factorwhich we called evaluation or brand liking.Despite differences in structure and wording.these scales appeared to be measuring the samething.
• The five scales that discriminated best all insome way restricted the number of high ratingsthat could be given, while seven of the eightscales which discriminated less well piled uppositive ratings (Purchase Probability had abalanced distribution). We are led to concludethat scales which force a choice or directlycompare brands (i.e., limit high ratings) dodiscriminate better among brands. Accumula-tion of high ratings may hide subtle differences.
• Respondents tend to choose verbal labels overnumerical labels when both are used on a scale.This tendency apparently resulted in under-useof the numerical points of our PurchaseProbability scale and may have reduced itsability to discriminate. Respondents especiallyavoided the negative numbers of the StapelScale, and we believe this was a factor inmaking it the second least discriminating scale.
Three scales which we found particularh' attractive,keeping in mind the limitations of the study, were:
• Awareness, which of course is the natural
vehicle for measuring salience and whichdiscriminated best or nearly best m each of thethree product categories where it was tested.The results of the study suggest that saliencediscriminates better than e%'aluati\'e attitude.
• The Verbal Purchase Intent, which had a zeroloading on the salience factor and a highloading, along with most of the scales, on theevaluative factor. This unbalanced scale appearsto make efficient use of its five points,distributing responses quite uniformly, and thefive verbal labels would seem to be easy for arespondent to handle. On average, it discrimi-nated third best of all the scales. However.Axelrod (1968) reported that it was not sensitiveto attitude change after exposure to advertising,although in reporting this result he did notelaborate on the kind of advertising tested northe circumstances under which the test wasmade.
• The Paired Comparison, which also had anonnegative loading on the salience factor butwas chiefly associated \\ ith the evaluative factor.It is attractive because of its almost normally-shaped distribution of responses, although theshape ma}' change when fewer brands arecompared. It is equally attractive because of itsvery consistent ability to discriminate amongbrands: it did not rank less than third in anyproduct categor}^ and was second overall.However, having to make 15 comparisons (forsix brands) may limit its practicality in someinter\'iewing situations. Some may also find it adisadvantage that a paired comparison's frameof reference is always the other brands in the setbeing tested. These brands may change fromone time to the next.
The least attractive scale was Agreement with State-ment, which accumulated many favorable responses.appeared to present the respondent with a confusingrating task, and discriminated least well amongbrands.
Finally, we believe that the evident. cur\'ilinearrelationship between attitude scale ratings and usageprobability (shown in the test of concurrent validity)has important implications for scale scoring. Ifsuccessive ratings become geometrically more impor-tant as the scale is ascended, then the normalsequential weighting of scale points wastes a great dealof infonnation. A more appropriate scoring system,and one which is apt to provide more meaningfuldiscrimination between brands, is to assign a weight to
Testing Thirteen Attitude Scales / 31
each scale point that is proportionate to the usage course, vary by product category and by brand withinprobability at that point. The precise weights will, of the product category.
REFERENCESAbrams, Jack (1966), "An Evaluation of Alternative Rating
Devices for Consumer Research," Journal of MarketingResearch, 3 (May), 189-193.
Achenbaum, Alvin A. (1967), "Relevant Measures of ConsumerAttitudes," unpublished paper presented to the AmericanMarketing Association 50th World Congress on Marketing.
Albaum, Gerald, Roger Best, and Del Hawkins (1977). 'TheMeasurement Properties of Semantic Scale Data," Journal ofthe Market Research Society. 19 (January), 21-26.
Assael, Henry and George S. Day (1968), "Attitudes andAwareness as Predictors of Market Share," Journal ofAdvertising Research, 8 (December), 3-10.
Axelrod, Joel N. (1968), "Attitude Measures That PredictPurchase," Journal of Advertising Research, 8 (March), 3-17.
Bird, M. and A. S. C. Ehrenberg (1970), "Consumer Attitudesand Brand Usage," Journal of the Market Research Society, 12(October), 233-247.
Clancy, Kevin J. and Robert Garsen (1970), "Why Some ScalesPredict Better," Journal of Advertising Research, 10 (October),33-38.
DuBois, Cornelius (1958), "The Story of Brand XL," un-published report, Foote, Cone & Belding, Inc.
(1967), "Twelve Brands on a Seesaw," Proceedings,13th Annual Conference, New York: Advertising ResearchFoundation, 11-21.
Ehrenberg, Andrew S. C. (1974), "Repetitive Advertising and theConsumer," Journal of Advertising Research, 14 (April),25-34.
Falthzik, Alfred M. and Marvin A. Joison (1974), "StatementPolarity in Attitude Scales," Journal of Marketing Research,11 (February), 102-105.
Gold, Bertram, and William Salkind (1974), "What Do'Top Box'Scores Measure?" Journal of Advertising Research, 14 (April),19-23.
Gormley, Richard (1974), "A Note on Seven Brand Rating Scales
and Subsequent Purchase," Journal of the Market ResearchSociety, 16 (July), 242-244.
Gross, Steven Jay and C. Michael Niman (1975), "Attitude-Behavior Consistency: A Review," Public Opinion Quarterly.39 (Fall), 358-368.
Gruber, Alin (1970), "Purchase Intent and Purchase Probability,"Journal of Advertising Research, 10 (February), 23-27.
Haley, Russell I. (1970), "We Shot an Arrowhead (#9) Into theAir," Proceedings, 16th Annual Conference, New York:Advertising Research Foundation, 25-30.
Hawkins, Del I., Gerald Albaum, and Roger Best (1974), "StapelScale or Semantic Differential in Marketing Research?"Journal of Marketing Research, 11 (August), 318-322.
Hughes, G. David (1967), "Selecting Scales to Measure AttitudeChange," Journal of Marketing Research, 4 (February), 85-87.
Kassarjian, Harold H. and Masao Nakanishi (1967), "A Study ofSelected Opinion Measurement Techniques," Journal cfMarketing Research, 4 (May), 148-153.
Krugman, Herbert E. (1965), "The Impact of TelevisionAdvertising: Learning Without Involvement," Public OpinionQuarterly. 29 (Fall), 349-356.
Roshwalb, Irving (1975), "A Consideration of ProbabilityEstimates Provided by Respondents," Journal of MarketingResearch. 12 (February), 100-103.
Seaton, Richard (1974), "Why Ratings Are Better Than Compari-sons," Journal of Advertising Research. 14 (February), 45-48.
Shulman, Art (1973), "AComparisonof Two Scales on ExtremityResponse Bias," Public Opinion Quarterly. 37 (Fall), 407-412;discussion by Bertram Gold (1975), Public Opinion Quarterly,39 (Spring), 123-124; reply and rejoinder, 125-127.
Wildt. Albert R. and Michael B. Mazis (1978), "Determinants ofScale Response: Label Versus Position, '^ Journal of MarketingResearch. 15 (May), 261-267.
Worcester, Robert M. and Timothy R. Bums (1975), "A Sta-tistical Examination of the Relative Precision of VerbalScales," Journal of the Market Research Society. 17 (July),181-197.
32/Journal of Marketing, Fall 1979