Embed Size (px)
Citation preview

arX
iv:1
505.
0149
3v1
[as
tro-
ph.G
A]
6 M
ay 2
015
Mon. Not. R. Astron. Soc. 000, 000–000 (0000) Printed 18th September 2018 (MN LATEX style file v2.2)
Testing the Modern Merger Hypothesis via the Assembly of
Massive Blue Elliptical Galaxies in the Local Universe
Tim Haines,1,2 ⋆ † D. H. McIntosh,2 S. F. Sánchez,3 C. Tremonti,1 and G. Rudnick51Department of Astronomy, University of Wisconsin-Madison, 475 N. Charter Street, Madison WI 53706-1582, USA2Department of Physics and Astronomy, University of Missouri - Kansas City, 5110 Rockhill Road, Kansas City, MO 64110, USA3Instituto de Astronomía,Universidad Nacional Autonóma de Mexico, A.P. 70-264, 04510, México,D.F.5Department of Physics and Astronomy, The University of Kansas, Malott room 1082, 1251 Wescoe Hall Drive, Lawrence, KS 66045, USA
18th September 2018
ABSTRACT
The modern merger hypothesis offers a method of forming a new elliptical galaxythrough merging two equal-mass, gas-rich disk galaxies fuelling a nuclear starburstfollowed by efficient quenching and dynamical stabilization. A key prediction of thisscenario is a central concentration of young stars during the brief phase of morpholo-gical transformation from highly-disturbed remnant to new elliptical galaxy. To testthis aspect of the merger hypothesis, we use integral field spectroscopy to track thestellar Balmer absorption and 4000Å break strength indices as a function of galacticradius for 12 massive (M∗ > 1010M⊙), nearby (z 6 0.03), visually-selected plausiblenew ellipticals with blue-cloud optical colours and varying degrees of morphologicalpeculiarities. We find that these index values and their radial dependence correlatewith specific morphological features such that the most disturbed galaxies have thesmallest 4000Å break strengths and the largest Balmer absorption values. Overall,two-thirds of our sample are inconsistent with the predictions of the modern mergerhypothesis. Of these eight, half exhibit signatures consistent with recent minor mergerinteractions. The other half have star formation histories similar to local, quiescentearly-type galaxies. Of the remaining four galaxies, three have the strong morpho-logical disturbances and star-forming optical colours consistent with being remnantsof recent, gas-rich major mergers, but exhibit a weak, central burst consistent withforming ∼ 5% of their stars. The final galaxy possesses spectroscopic signatures ofa strong, centrally-concentrated starburst and quiescent core optical colours indicat-ive of recent quenching (i.e., a post-starburst signature) as prescribed by the modernmerger hypothesis.
Key words: Galaxies: evolution – Galaxies: peculiar – Galaxies: star formation
1 INTRODUCTION
The stellar growth of high-mass (> 1010 M⊙h−2), quies-
cent (non-star-forming) galaxies remains an important topicin galaxy evolution studies. Large and deep redshift sur-veys have conclusively shown that these red galaxies havegrown significantly since at least redshift z ∼ 2 − 3 in
⋆ E-mail:[email protected]† Visiting Astronomer, Kitt Peak National Observatory, NationalOptical Astronomy Observatory, which is operated by the Asso-ciation of Universities for Research in Astronomy, Inc. (AURA)under cooperative agreement with the National Science Founda-tion.The WIYN Observatory is a joint facility of the University of
Wisconsin-Madison, Indiana University, the National Optical As-tronomy Observatory and the University of Missouri.
terms of both their number density (e.g., Bell et al. 2004a;Brown et al. 2007; Martin et al. 2007; Brammer et al. 2009)and average sizes at a fixed stellar mass (Khochfar & Silk2006; Trujillo et al. 2006, 2007; Lee et al. 2013). The ob-served build up of this population and its conserved prepon-derance of early-type galaxy (ETG) morphologies at differ-ent epochs (Bell et al. 2004b; Blanton 2006; Bell et al. 2012)requires a process (or sequence of processes) which both in-creases the number of galaxies with early-type morpholo-gies and quenches star formation. The currently acceptedexplanation for this phenomenon is the so-called blue-to-red migration (Faber et al. 2007; Eliche-Moral et al. 2010;Gonçalves et al. 2012) which posits that the transformationof star-forming (blue) disk galaxies into quiescent, red ETGsis responsible for the increasing population of red sequencegalaxies over cosmic time. One possible, but well-accepted,
c© 0000 RAS

2 T. Haines et al.
mechanism driving the blue-to-red migration is the modernmerger hypothesis (Hopkins et al. 2008b). Under this model,a new massive quiescent elliptical galaxy is built by trans-forming two star-forming disk galaxies into one concentratedquiescent red ETG via a gas-rich major (i.e., nearly equalmass) merger.
Yet, in detail, the red ETG population contains myriadmorphological types in detail from early-type spiral disks, tolenticular (S0) galaxies, to the well-known dichotomy of el-lipticals (e.g., Kormendy 2009), making disentangling whichmigration processes are dominant a daunting task that likelydepends on galaxy morphology, mass, environment, and red-shift. We have made progress in the local universe by fo-cusing on the redward migration of pure-spheroid ellipticalgalaxies (McIntosh et al. 2014, hereafter, M14). This choiceis motivated by the fact that the formation of new ellipticalsis theoretically tied to a single mechanism that both trans-forms disks (e.g., major merging, Toomre & Toomre 1972;Barnes 1992, and references therein) and is hierarchicallymotivated (White & Rees 1978; Kauffmann et al. 1993).
Simulations of gas-rich major mergers provide a keyprediction which allows us to qualitatively identify majormerger remnants. During the merging process, gravitationaltorques deposit cold gas in the centre of the remnant andproduce a centrally-concentrated burst of star formation(Barnes & Hernquist 1991, 1996; Mihos & Hernquist 1996).According to the modern merger hypothesis, this is quicklyfollowed by the ignition of an active galactic nucleus (AGN)which ultimately quenches star formation (Springel et al.2005; Schawinski et al. 2007, 2010) and forms a quiescentelliptical galaxy (Hopkins et al. 2006, 2008a). This is sup-ported by the bluer colours of early-type galaxies host-ing an AGN, compared with their non-active counterparts(Sánchez et al. 2004). The merging process finally producesa relaxed remnant with the structure and kinematics of ob-served moderate-mass spheroidal galaxies (Cox et al. 2006;Naab et al. 2006).
We, therefore, anticipate ellipticals which are plausibleremnants of recent gas-rich mergers to have bluer coloursas compared to their “normal” counterparts on the colour-mass relation due to recent, enhanced star formation. Suchblue ellipticals are rare. For example, Fukugita et al. (2004)found 2 of the 210 ellipticals in their sample of 1600 brightgalaxies from the SDSS at z<0.12 to be blue ellipticals,M14 found 1602 blue ellipticals in their complete sample of63,454 massive
(
M∗ > 1010M⊙h−2
)
galaxies at z<0.08, andLee et al. (2006) found 29 in their sample of 1949 galaxieswith spectroscopic redshifts . 0.4 in the GOODS fields. Des-pite their rarity, these galaxies are important as they buildthe transition from star-forming disks in the blue cloud tomassive, quiescent ellipticals on the red sequence (Bell et al.2007). The robust sample of blue elliptical galaxies seen inM14 provides a good starting point for testing methods todistinguish recent elliptical mass assembly.
Over the last decade, spatially-resolved spectro-scopic surveys such as SAURON (Bacon et al. 2001)and ATLAS3D (Cappellari et al. 2011) have drasticallyenhanced our understanding of the content and structureof cluster and field ellipticals. Likewise, projects suchas PINGS (Rosales-Ortega et al. 2010), TYPHOON(Sturch & Madore 2012), and the CALIFA survey(Sánchez et al. 2012) have provided an unprecedented
level of detail in spiral galaxies. Aside from serendipitousdiscoveries (e.g., Fukugita et al. 2004), little work hasbeen brought forth from the population of blue ellipticalgalaxies. Further, previous studies of these galaxies havebeen limited to evaluating only the central regions (e.g.,Schawinski et al. 2009; Tojeiro et al. 2013) which providesa narrow perspective of the mass assembly history. In thiswork, we propose to analyse the 4000Åbreak strength andBalmer absorption line indices out to ∼ 3 half-light radii(coverage previously only achieved for red elliptical galax-ies, e.g. Weijmans et al. 2009) to examine the spatial starformation histories of this rare, but important populationof elliptical galaxies in the local universe.
Our paper is organized as follows. Section 2 detailsour sample selection, observation setups, and data reduc-tion pipeline. Section 3 outlines our model construction.In Section 4, we provide results from our comparison ofthe spatially-resolved spectra to a suite of star formationhistory (SFH) models. Section 5 contains the discussionof our results. Finally, in Section 6 we provide a sum-mary and conclusions. Throughout this paper we calcu-late comoving distances in the ΛCDM concordance cosmo-logy with Ωm = 0.3, ΩΛ = 0.7, and assume a Hubbleconstant of H0 = 70 km s−1 Mpc−1. Magnitudes fromthe Sloan Digital Sky Survey (York et al. 2000, SDSS)are on the AB system such that mAB = m + ∆mwhere ∆m = (−0.036,+0.012,+0.010,+0.028,+0.040) for(u, g, r, i, z) (Yang et al. 2007).
2 DATA SAMPLE AND OBSERVATIONS
2.1 Sample Selection
To test the prediction of the modern merger hypothesisthat gas-rich major mergers lead to the construction ofmassive ellipticals with temporarily blue colours, we ac-quire observationally-intensive IFU spectroscopy using longexposure times to obtain spatially-resolved spectra bey-ond the bright central bulge. We then use the HδA andHγA Lick indices and the narrow-band 4000Åbreak tomap the recent star formation histories as a function ofgalactic radius for a collection of visually-classified plaus-ible new ellipticals provided in M14. Using the New YorkUniversity Value-Added Galaxy Catalogue (NYU-VAGC,Blanton et al. 2005) based on the SDSS Data Release 4(DR4, Adelman-McCarthy et al. 2006), M14 construct acomplete sample of nearby (0.01 6 z 6 0.08), high-mass(M∗ > 1010M⊙h−2) galaxies. Using the rest frame (g − r)Petrosian colours, the absolute r-band magnitudes, andthe Bell et al. (2003) M/L prescription to measure stel-lar mass, they apply the empirical colour cut 0.1(g − r) 6
0.81+0.1[
log10(Mgal,⋆/M⊙h−2)− 10.0]
to select blue-cloudgalaxies (see Fig. 1) where the colors have been k-correctedto z = 0.1. They isolate early-type (spheroid-dominated)
The stellar masses from M14 are calculated assuming H0 =100h.The morphological classifications of M14 were determined by
manual inspection of the images by people. Here and throughoutthe paper, we use the phrase “visually-classified” to mean classified“by eye.”
c© 0000 RAS, MNRAS 000, 000–000
Testing the Modern Merger Hypothesis 3
galaxies using the common r-band concentration cut ofR90/R50 > 2.6 (Strateva et al. 2001), where R90 (R50) isthe radius inside which 90% (50%) of the light is containedto produce a set of 8403 unusually blue ETGs.
M14 then use visual classification with careful morpho-logical inspection to identify plausible new merger remnantsfrom this set of blue ETGs. Visual inspection further al-lows them to remove contamination by bulge-dominatedspirals (S) and inclined disks (iD), plus galaxies with un-certain morphology (U), and galaxies affected by artefacts.Their final catalogue consists of 1602 massive, blue elliptical(E,85%), peculiar elliptical (pE,8%), and spheroidal post-merger (SPM,7%) galaxies with high classifier-to-classifieragreement, defined as a minimum of three out of four classi-fiers in accord. The details of these identifications and theirrobustness are described in detail in M14. Briefly, the E,pE and SPM types represent three morphological bins thatplausibly span a qualitative time sequence since merging (as-suming that all blue elliptical galaxies are derived from gas-rich major merging). At one extreme (E), galaxies appearto be dynamically relaxed ellipticals with little or no evid-ence of recent tidal activity, contrasted by those at the otherextreme which appear to be freshly coalesced with very dis-turbed morphologies (SPM). In between the two extremes(pE), we find galaxies which appear to be relaxed elliptic-als with either a modest external morphological peculiarity(e.g., a loop or fan feature) or an internal structure like adust lane. We parametrize the level of visual tidal featuresby defining a plausible post-merger type, Tppm, for each blueETG based on the sum of its four classifications weighted asfollows:
Tppm =4
∑
i=1
wc,i (1)
where wc,i is the ith classification such that wc = -1 (S/iD),-0.5 (U), 1 (E), 2 (pE), and 3 (SPM); e.g., Tppm = 8 forfour-way pE agreement. We use negative weights to dis-tinguish definite disks and uncertain classifications from(positive wc ) plausible post-merger systems. We investig-ate a subset of the 8403 blue ETGs from M14 using a re-laxed classifier agreement such that Tppm > 2.0 to produce asample of 1915 E (71%), pE (6%), SPM (6%), plus 17% withcombinations of E+pE+SPM classifications (i.e., classifiersagree that these objects are not S or iD despite disagree-ment over specific plausible post-merger type). For example,nyu100917 appears to be a relatively smooth elliptical witha large loop structure (see Figure 2). The classifiers in M14were evenly split between the pE and SPM classification:falling below the 75% classifier agreement requirement. Us-ing our relaxed classifier allows this galaxy to be included inour sample.
To maximize spatial coverage of the spectra, we requireeach galaxy to fill the FOV of its respective spectrograph(each spectrograph used in this work is∼ 70′′ on a side) inone of two ways: (i) twice the galaxy’s R90 ≃ 70′′ or (ii) thegalaxy has loops, arms, or other structures which extendbeyond its main body to fill the FOV. These requirementsreduce the range of redshifts for our targets to z . 0.03 andprovide a sample of 111 E (57%), pE (11%), SPM (10%),and other (Tppm > 2 , 23%) galaxies. Based on observationalavailability, we select a set of 12 (3 E, 3 pE, 2 SPM, and 4other) which nearly equally sample the morphology space
Figure 1. Colour-mass diagram for the 63454 nearby (0.01 6 z 6
0.08), high-mass (M∗ > 1010M⊙h−2) SDSS DR4 galaxies fromM14 with our sample of 12 blue ellipticals overlaid. The red lineshows the M14 colour cut, symbols represent visual classificationsfrom M14. Refer to Table 1 for letter labels.
while also selecting interesting candidates for unique starformation histories based on a range of morphological detailssuch as circumnuclear blue rings or large dust features. InTable 1, we list physical characteristics and morphologicalclassifications for our sample.
In Fig. 1, we show our sample in the colour-mass planeusing the SDSS (g-r) colours k-corrected to z = 0.1 in theAB magnitude system and the log of the stellar mass in unitsof M⊙h
−2. With the exception of the two low-mass ellipt-icals with smooth morphologies, we find that the low-massgalaxies tend to have the strongest morphological peculi-arities and blue colours consistent with star-forming galax-ies. The more massive galaxies tend to exhibit green val-ley colours and smoother morphologies. We note that allof the peculiar ellipticals have masses between 1010.5 and1011M⊙h
−2, above which extremely few blue galaxies lie(e.g., Baldry et al. 2004).
2.2 Observations
Our final sample of 12 plausible merger remnants wereobserved over three separate runs between January 2010and April 2011. We require moderate resolution (R≃1000)spatially-resolved spectra with wavelength coverage span-ning the 4000Å break and Balmer Hδ and Hγ absorptionindices to obtain SFHs as a function of galactic radius todifferentiate between remnants of major mergers from thoseof other mass assembly mechanisms. The optimal choice forlarge-field, spatially-resolved spectroscopy is an integral fieldunit (IFU) which additionally provides concurrent sky fluxmeasurement to facilitate removal of contaminating sky linesduring reduction.
The first observing run was performed between Janu-ary 18th and January 20th, 2010 at the 3.5-meter CalarAlto observatory in Spain using the Potsdam MultiAper-ture Spectrophotometer (PMAS, Roth et al. 2005) and thePPAK IFU (Kelz et al. 2006). We used the V1200 grat-ing with first order and forward blaze angle centred on4263Å, providing a spectral resolution FWHM of 2.7Å, andan observed wavelength range of 3877Å to 4633Å. Thespectra were binned 2x2, giving an instrumental resolu-tion of 0.75Å/pixel. The 2.7′′ fibres provide a spatial res-olution of 1.63 kpc at z=0.03. Three thirty-minute expos-
c© 0000 RAS, MNRAS 000, 000–000

4 T. Haines et al.
Table 1. Sample
Name zpublished R50 cr g Mr M* Classification† Agreement Tppm ID(1) (2) (3) (4) (5) (6) (7) (8) (9) (10) (11)
nyu100917 0.027 2.9 3.6 15.10 -21.11 10.24 pE/SPM 50 10 Jnyu22318 0.030 5.9 3.0 14.79 -21.72 10.79 pE 75 7 Gnyu535845 0.014 6.2 3.0 13.99 -20.81 10.24 E 75 5 Dnyu541044 0.020(a) 6.0 3.5 13.55 -22.24 10.61 SPM 75 11 Knyu598180 0.018 4.4 2.9 14.58 -20.75 10.19 E 75 5 Cnyu619567 0.029 5.2 3.1 14.16 -22.31 10.85 E/pE 50 6 Fnyu674881 0.022 8.3 3.3 13.79 -22.10 10.80 pE/U 50 3 Anyu719486 0.028 2.4 3.3 15.08 -20.85 10.06 pE/SPM 50 10 Inyu742039 0.025 5.2 3.1 14.16 -21.90 10.70 E 100 4 Bnyu835691 0.026(b) 5.3 3.4 14.42 -21.41 10.40 SPM 75 11 Lnyu916578 0.029 5.1 3.4 14.85 -21.34 10.51 pE 75 5.5 Enyu916757 0.028 6.3 3.1 14.19 -22.11 10.77 pE 75 7 H
Note: For each galaxy in our sample, we list (1) the ID provided in the NYU-VAGC from the SDSS DR4, (2) the spectroscopic redshiftpublished in SDSS or NED (objects with a superscript are from NED), (3) the SDSS r-band Petrosian half-light radius in arcseconds,(4) the concentration index given by the ratio of the SDSS r-band Petrosian R90 (the radius inside which ninety percent of the light iscontained) and the half-light radius (R90/R50), (5) the SDSS g-band apparent magnitude, (6) the extinction- and k-corrected (to z = 0absolute SDSS r-band magnitude, (7) the stellar mass in units of log
(
M⊙ h−2)
, (8) morphological classification (see text for details),(9) classifier agreement percentage, (10) the plausible post-merger type parameter (Equation 1), and (11) the ID used to refer to each
galaxy in figures ordered by increasing Tppm.† All classifications are given where (9) is less than 75 per-cent.
(a) Rothberg & Joseph (2006a) , (b) Falco et al. (1999)
Table 2. Observing Log
Name NED Name RA DEC Source Date AM texp Ag
(1) (2) (3) (4) (5) (6) (7) (8) (9)
nyu100917 MRK 0366 32.8898 13.9171 SparsePak Jan 31, 2011 1.36 9000 1.26nyu22318 NGC 1149 44.3495 -0.3094 SparsePak Feb 2, 2011 1.33 9000 1.05nyu535845 UGC 05026 141.6659 45.8472 PMAS Jan 20, 2010 1.08 5400 0.40nyu541044 NGC 3921 177.7786 55.0788 PMAS Jan 18, 2010 1.05 5100 0.20nyu598180 CGCG 149-037 127.3750 31.6755 SparsePak Feb 2, 2011 1.05 9600 0.68nyu619567 IC 0669 166.8190 6.3025 SparsePak Feb 1, 2011 1.15 9000 0.58nyu674881 NGC 6314 258.1613 23.2701 CALIFA Apr 5, 2011 1.09 6300 0.93nyu719486 MRK 0385 120.8669 25.1027 SparsePak Jan 31, 2011 1.03 9000 0.44nyu742039 UGC 06227 167.8640 47.0355 SparsePak Feb 1, 2011 1.51 9000 0.20nyu835691 UGC 07560 186.7364 48.2770 PMAS Jan 20, 2010 1.02 4600 0.19nyu916578 CGCG 216-016 189.5908 42.2055 SparsePak Jan 31, 2011 1.11 9000 0.25nyu916757 NGC 4985 197.0504 41.6763 SparsePak Jan 31, 2011 1.02 9900 0.29
Note: For each galaxy in our sample, we list (1) the ID provided in the NYU-VAGC from the SDSS DR4, (2) the most commonassociated name in the NASA Extragalactic Database, (3) the right ascension in degrees, (4) the declination in degrees, (5) the IFU on
which that data were acquired, (6) the date of observation, (7) the average airmass of all exposures, (8) the total exposure time inseconds, and (9) the SDSS g-band foreground extinction in magnitudes.
ures were taken of each of the three targets, but nyu541044was shorted by 5 minutes and nyu835691 by 13 minutesto reduce background during twilight (see Table 2). Thesecond observing run was performed between January 31st
and February 2nd, 2011 at the 3.5-meter WIYN telescopeat the Kitt Peak National Observatory in Arizona us-ing the WIYNBench spectrograph and the SparsePak IFU(Bershady et al. 2004). We used the 600 lines/mm gratingwith a blaze angle of 10.1 centred on 5500Å, providing aspectral resolution FWHM of 5Å, and wavelength range of3577Å to 6435Å. The spectra were binned 3x3, giving an in-strumental resolution of 1.4Å/pixel. The 4.7′′ fibres providea spatial resolution of 2.82 kpc at z=0.03. Five thirty-minuteexposures were taken of each of the eight targets with tenand fifteen minutes additional exposure to compensate for
reduced transparency for nyu598180 and nyu916757, re-spectively. The third run was performed as part of the CalarAlto Legacy Integral Field Area (CALIFA) survey on April11, 2011 using the Calar Alto telescope and PMAS with thePPAK IFU. The survey uses a three-pointing dithering withthree exposures of 700s each per dithering with the sameV1200 grating setup used on the previous PMAS observa-tions. In Table 2, we list relevant details from our observinglog.
2.3 Data Reduction
We use the R3D reduction software (Sánchez 2006) to pro-duce a data cube of wavelength- and flux-calibrated spectrafor each galaxy, which we then use to construct annular spec-
c© 0000 RAS, MNRAS 000, 000–000
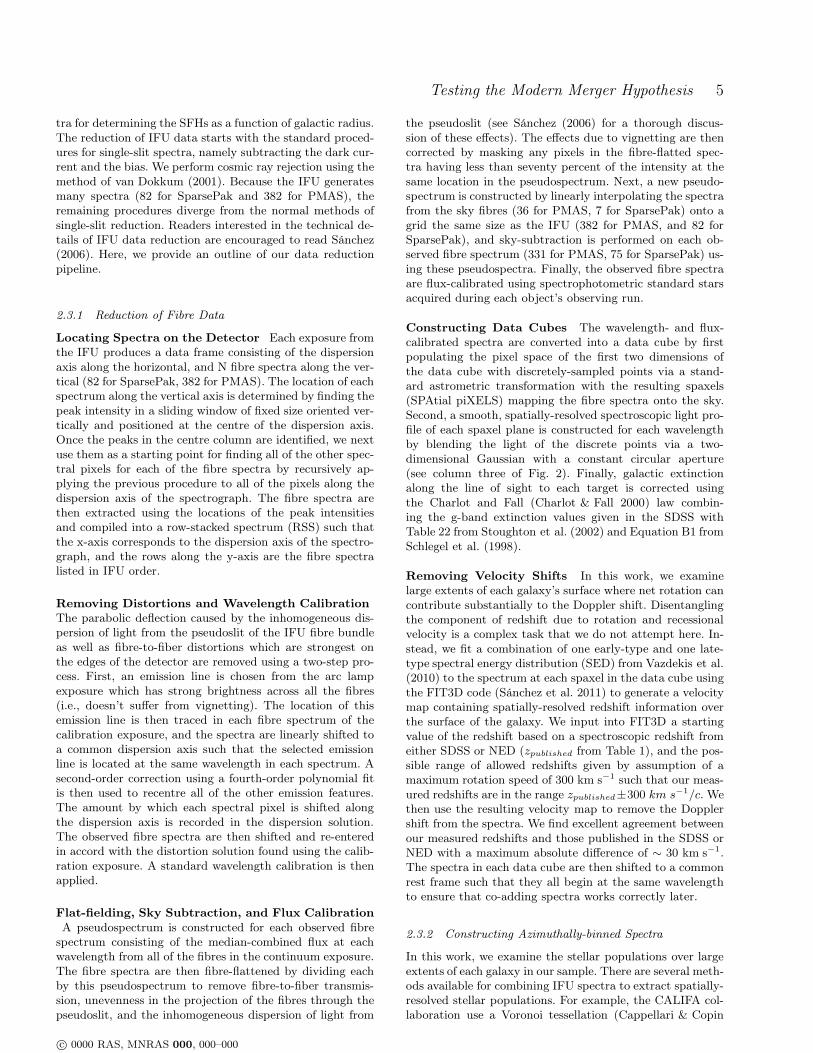
Testing the Modern Merger Hypothesis 5
tra for determining the SFHs as a function of galactic radius.The reduction of IFU data starts with the standard proced-ures for single-slit spectra, namely subtracting the dark cur-rent and the bias. We perform cosmic ray rejection using themethod of van Dokkum (2001). Because the IFU generatesmany spectra (82 for SparsePak and 382 for PMAS), theremaining procedures diverge from the normal methods ofsingle-slit reduction. Readers interested in the technical de-tails of IFU data reduction are encouraged to read Sánchez(2006). Here, we provide an outline of our data reductionpipeline.
2.3.1 Reduction of Fibre Data
Locating Spectra on the Detector Each exposure fromthe IFU produces a data frame consisting of the dispersionaxis along the horizontal, and N fibre spectra along the ver-tical (82 for SparsePak, 382 for PMAS). The location of eachspectrum along the vertical axis is determined by finding thepeak intensity in a sliding window of fixed size oriented ver-tically and positioned at the centre of the dispersion axis.Once the peaks in the centre column are identified, we nextuse them as a starting point for finding all of the other spec-tral pixels for each of the fibre spectra by recursively ap-plying the previous procedure to all of the pixels along thedispersion axis of the spectrograph. The fibre spectra arethen extracted using the locations of the peak intensitiesand compiled into a row-stacked spectrum (RSS) such thatthe x-axis corresponds to the dispersion axis of the spectro-graph, and the rows along the y-axis are the fibre spectralisted in IFU order.
Removing Distortions and Wavelength Calibration
The parabolic deflection caused by the inhomogeneous dis-persion of light from the pseudoslit of the IFU fibre bundleas well as fibre-to-fiber distortions which are strongest onthe edges of the detector are removed using a two-step pro-cess. First, an emission line is chosen from the arc lampexposure which has strong brightness across all the fibres(i.e., doesn’t suffer from vignetting). The location of thisemission line is then traced in each fibre spectrum of thecalibration exposure, and the spectra are linearly shifted toa common dispersion axis such that the selected emissionline is located at the same wavelength in each spectrum. Asecond-order correction using a fourth-order polynomial fitis then used to recentre all of the other emission features.The amount by which each spectral pixel is shifted alongthe dispersion axis is recorded in the dispersion solution.The observed fibre spectra are then shifted and re-enteredin accord with the distortion solution found using the calib-ration exposure. A standard wavelength calibration is thenapplied.
Flat-fielding, Sky Subtraction, and Flux Calibration
A pseudospectrum is constructed for each observed fibrespectrum consisting of the median-combined flux at eachwavelength from all of the fibres in the continuum exposure.The fibre spectra are then fibre-flattened by dividing eachby this pseudospectrum to remove fibre-to-fiber transmis-sion, unevenness in the projection of the fibres through thepseudoslit, and the inhomogeneous dispersion of light from
the pseudoslit (see Sánchez (2006) for a thorough discus-sion of these effects). The effects due to vignetting are thencorrected by masking any pixels in the fibre-flatted spec-tra having less than seventy percent of the intensity at thesame location in the pseudospectrum. Next, a new pseudo-spectrum is constructed by linearly interpolating the spectrafrom the sky fibres (36 for PMAS, 7 for SparsePak) onto agrid the same size as the IFU (382 for PMAS, and 82 forSparsePak), and sky-subtraction is performed on each ob-served fibre spectrum (331 for PMAS, 75 for SparsePak) us-ing these pseudospectra. Finally, the observed fibre spectraare flux-calibrated using spectrophotometric standard starsacquired during each object’s observing run.
Constructing Data Cubes The wavelength- and flux-calibrated spectra are converted into a data cube by firstpopulating the pixel space of the first two dimensions ofthe data cube with discretely-sampled points via a stand-ard astrometric transformation with the resulting spaxels(SPAtial piXELS) mapping the fibre spectra onto the sky.Second, a smooth, spatially-resolved spectroscopic light pro-file of each spaxel plane is constructed for each wavelengthby blending the light of the discrete points via a two-dimensional Gaussian with a constant circular aperture(see column three of Fig. 2). Finally, galactic extinctionalong the line of sight to each target is corrected usingthe Charlot and Fall (Charlot & Fall 2000) law combin-ing the g-band extinction values given in the SDSS withTable 22 from Stoughton et al. (2002) and Equation B1 fromSchlegel et al. (1998).
Removing Velocity Shifts In this work, we examinelarge extents of each galaxy’s surface where net rotation cancontribute substantially to the Doppler shift. Disentanglingthe component of redshift due to rotation and recessionalvelocity is a complex task that we do not attempt here. In-stead, we fit a combination of one early-type and one late-type spectral energy distribution (SED) from Vazdekis et al.(2010) to the spectrum at each spaxel in the data cube usingthe FIT3D code (Sánchez et al. 2011) to generate a velocitymap containing spatially-resolved redshift information overthe surface of the galaxy. We input into FIT3D a startingvalue of the redshift based on a spectroscopic redshift fromeither SDSS or NED (zpublished from Table 1), and the pos-sible range of allowed redshifts given by assumption of amaximum rotation speed of 300 km s−1 such that our meas-ured redshifts are in the range zpublished±300 km s−1/c. Wethen use the resulting velocity map to remove the Dopplershift from the spectra. We find excellent agreement betweenour measured redshifts and those published in the SDSS orNED with a maximum absolute difference of ∼ 30 km s−1.The spectra in each data cube are then shifted to a commonrest frame such that they all begin at the same wavelengthto ensure that co-adding spectra works correctly later.
2.3.2 Constructing Azimuthally-binned Spectra
In this work, we examine the stellar populations over largeextents of each galaxy in our sample. There are several meth-ods available for combining IFU spectra to extract spatially-resolved stellar populations. For example, the CALIFA col-laboration use a Voronoi tessellation (Cappellari & Copin
c© 0000 RAS, MNRAS 000, 000–000
6 T. Haines et al.
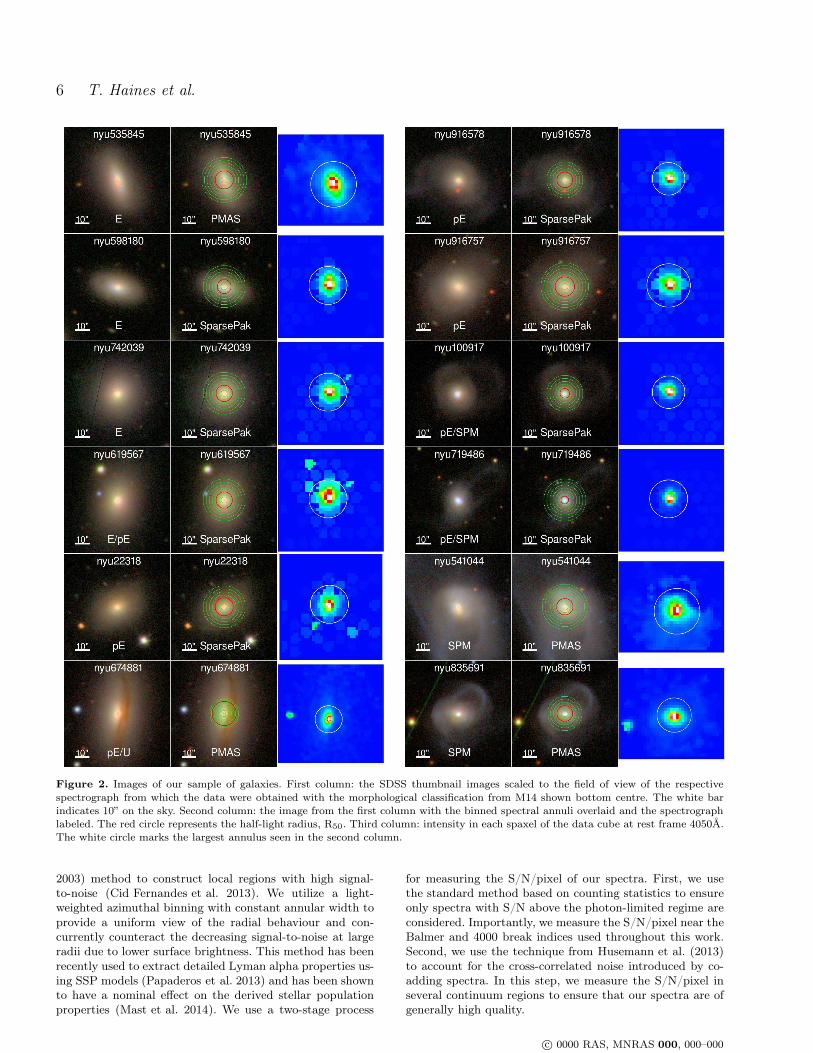
Figure 2. Images of our sample of galaxies. First column: the SDSS thumbnail images scaled to the field of view of the respectivespectrograph from which the data were obtained with the morphological classification from M14 shown bottom centre. The white barindicates 10” on the sky. Second column: the image from the first column with the binned spectral annuli overlaid and the spectrographlabeled. The red circle represents the half-light radius, R50. Third column: intensity in each spaxel of the data cube at rest frame 4050Å.The white circle marks the largest annulus seen in the second column.
2003) method to construct local regions with high signal-to-noise (Cid Fernandes et al. 2013). We utilize a light-weighted azimuthal binning with constant annular width toprovide a uniform view of the radial behaviour and con-currently counteract the decreasing signal-to-noise at largeradii due to lower surface brightness. This method has beenrecently used to extract detailed Lyman alpha properties us-ing SSP models (Papaderos et al. 2013) and has been shownto have a nominal effect on the derived stellar populationproperties (Mast et al. 2014). We use a two-stage process
for measuring the S/N/pixel of our spectra. First, we usethe standard method based on counting statistics to ensureonly spectra with S/N above the photon-limited regime areconsidered. Importantly, we measure the S/N/pixel near theBalmer and 4000 break indices used throughout this work.Second, we use the technique from Husemann et al. (2013)to account for the cross-correlated noise introduced by co-adding spectra. In this step, we measure the S/N/pixel inseveral continuum regions to ensure that our spectra are ofgenerally high quality.
c© 0000 RAS, MNRAS 000, 000–000

Testing the Modern Merger Hypothesis 7
Error Estimate Using Counting Statistics Start-ing with the azimuthally-binned spectra, we utilize thesignal (in counts) and the noise (in counts) at eachwavelength to calculate the S/N/pixel. To do this, wefirst construct a row-stacked spectrum (RSS) of the es-timated Poisson noise via the standard formula noise =√
source+ background+ readout2 where the source andbackground are the raw (i.e., not flux-calibrated) spectrumand sky counts, respectively, and readout is the readoutnoise from the detector. We then convert the raw spectraand the noise RSS into data cubes following the procedureoutlined in Section 2.3.1 and apply the velocity shift cor-rections discussed previously. Finally, for each annulus weconstruct the azimuthal sum of the spaxels in the raw spec-tra data cube and the quadrature sum of the correspondingspaxels from the noise data cube to compute the S/N/pixelin the wavelength regions around the Dn(4000), Hγ, and Hδindices. Because absorption features have intrinsically lessS/N/pixel than equivalent continuum measurements, we re-tain annular spectra with a minimum S/N/pixel of 5 in eachregion around the three indices.
Full Spectral Fitting Our analysis is centres on the equi-valent width measurements of the Balmer Hγ and Hδ in-dices. To measure these accurately, we must first determinethe amount of nebular contamination present in our spec-tra. To measure this, we use the full-spectral fitting codeFIT3D (Sánchez et al. 2011) and a catalogue of thirty SEDsto find a combination which reproduces our spectra in theminimum chi-squared sense. We use the Single Stellar Popu-lation (SSP) SEDs generated from the MILES library usingthe code from Vazdekis et al. (2010) with metallicities of2, 20, and 100 percent solar each spanning a range of tenages from ∼ 70 Myrs to ∼ 14 Gyrs. We first fit our spec-tra with all of the Balmer and forbidden oxygen emissionlines masked. The total velocity dispersion (i.e., stellar andinstrumental) and internal dust extinction are treated asfree parameters and fit in the minimum chi-squared sense.The generated continuum fits are then subtracted from thespectra, and the emission lines are fit.
We fit a single Gaussian to each emission line individu-ally with the line centre, full width half maximum, and peakamplitude treated as free parameters. We attempt to fit allof the Balmer and forbidden oxygen lines masked during thecontinuum fitting, but require that the peak of each emis-sion fit be greater than one sigma of the flux contained in awindow of 20 around the known line centre to prevent fittingnoise. We reject residual sky lines and any remaining cos-mic rays using a windowed boxcar filter to replace the fluxexceeding 3 sigma of the flux in the window with the av-erage of the flux in the window. The emission fits are thensubtracted from the original spectra, and the FIT3D con-tinuum fits are performed again with none of the emissionlines masked. This new continuum fit is then used to per-form the emission line fitting and clipping again to producea set of emission-free spectra.
Constructing Variance Maps During the binning pro-cess spatially coherent, but physically independent spectra
Foreground extinction has already been removed at this point.
are co-added to increase the S/N per pixel. By combining in-dependent spectra, an artificial noise is introduced into thefinal spectrum we wish to use to make our measurements.To trace this spatially-correlated noise, we use the meth-ods of Husemann et al. (2013) to construct a variance map
to estimate the correlated noise at each wavelength usingthe SED fits to our emission-subtracted spectra calculatedabove. The variance map is simply the median-smoothedresiduals from the full spectral fitting. Under the assump-tion that our statistical method provides the “true” meas-ure of the noise in the spectra, the variance map is con-sidered to be a direct measure of the correlated noise in-troduced during the azimuthal binning. We then use thevariance map as the final measure of the error to recom-pute the S/N/pixel. For this final step, we use the threeregions (4040,4060Å, 4150,4200Å, 4380,4430Å) which meas-ure the S/N/pixel in the continuum (rather than in theindices) where there is less change in model-data discrep-ancies to improve our index measurements. Because we aremeasuring only continuum regions here, we require a greaterminimum S/N/pixel than was considered when constructingerror estimates using counting statistics where absorptionfeatures were used to measure the S/N/pixel. Only spectrawith S/N/pixel > 10 are retained for further analysis. Weshow our sample with the annuli overlaid on the SDSS im-ages and the intensity map from the data cube at 4050Å inFig. 2 and the final set of annular spectra for each galaxy inFig. C1.
2.3.3 Index Measurements
Starting with the set of fully reduced and calibratedemission-subtracted annular spectra in Appendix C, wemeasure the HδA and HγA Lick indices and the narrow-band4000Å break as a function of galactic radius. To calculatethe strength of each index, we first define three passbandsaround each index’s line centre: the blue continuum, thecentral region, and the red continuum. The passbands forthe Lick HδA and HγA indices from Worthey & Ottaviani(1997) and the narrow-band 4000Å break (hereafter referredto as Dn(4000)) from Balogh et al. (1999) are shown in Fig.3. To reduce random errors in the outermost annuli of ourgalaxies, we use the average Balmer index 〈HδA,HγA〉 ≡(HδA +HγA) /2 from Sánchez-Blázquez et al. (2006).
In general, differences in Dn(4000) correspond to dif-ferences in the ages of stellar populations on the order ofseveral Gyrs, and differences in Balmer strength correspondto differing fractions of A stars. We show our index measure-ments as a function of galactic radius organized by morpho-logical classification in Fig. 4. Examining the radial trendsof the indices, we find that strongly disturbed galaxies (visu-ally classified as SPM or pE/SPM) exhibit flat or decreasingBalmer absorption at increasing radii with generally increas-ing Dn(4000) values with increasing galactic radius– indicat-ing that the youngest stellar populations are in the galaxies’cores. For the modestly disturbed galaxies (pE) and twoof the smooth ellipticals (E) nyu742039 and nyu619567, wefind generally decreasing Dn(4000) and increasing Balmervalues at increasing radii consistent with their oldest stel-lar populations residing in their cores. We note that mostof the Balmer radial indices are negative and hence not in-dicative of stellar populations containing a large fraction of
c© 0000 RAS, MNRAS 000, 000–000

8 T. Haines et al.
Figure 4. Average stellar Balmer absorption indices, 〈HδA,HγA〉 ≡ (HδA +HγA) /2, and the 4000Å break strength, Dn(4000), as afunction of the SDSS Petrosian r-band half-light radius (R50) organized by morphological classification. Colours represent indices fromthe same galaxy in a single column.
Figure 3. Definitions of the blue continuum (upwards-hatched),central (horizontal-hatched), and red continuum (downwards-hatched) passbands for the Dn(4000) (top), HδA (centre), andHγA (bottom) indices from an example galaxy. The measuredspectrum is shown in black, and the continuum fit is shown inred. Note that the Dn(4000) index definition does not include acentral continuum. The y-axis shows the flux arbitrarily scaled toshow detail, and the x-axis shows the rest frame wavelengths.
A stars. However, there are two exceptions: nyu674881 andnyu916578 have positive Balmer absorption values at theirlargest radii. The final two smooth ellipticals (E) nyu598180and nyu535845 are distinct in that they have positive Balmerabsorption values at nearly all radii and small Dn(4000) val-ues near the range of values exhibited by the SPM galaxies.From Fig. 2, we see that these two galaxies possess blue cir-cumnuclear rings consistent with recent star formation. Asdiscussed in Section 2.1, our choice to include galaxies withinteresting morphological details such as the blue rings seenhere has paid dividends in that we find there need not be
a direct correlation between a galaxy’s general morphologyand its recent star formation history.
3 MODELLING STAR FORMATION
HISTORIES
In this work, we seek to test if the modern merger hypo-thesis can account for the assembly of our sample of plaus-ible new ellipticals with unusually blue optical colours. Spe-cifically, we use the prediction that the blue-to-red migra-tion leaves behind a tell-tale signature via the presence ofa strong, centrally-concentrated burst of star formation inthe merger remnant. This signature can be detected in oursample of plausible new ellipticals by comparing the meas-ured Balmer and Dn (4000) indices (see Section 2.3.3) to asuite of specially-constructed models.
We use the iSEDFit tool from the impro code pack-age to construct a suite of theoretical spectral energy dis-tributions (SEDs) covering many different SFHs (see ap-pendix A of Moustakas et al. 2013, for details). We be-gin construction by characterizing the star formation rate(SFR) as a function of time for an arbitrary stellar pop-ulation using a simple, exponentially-declining SFR suchthat SFR (t) ∝ e−t/τ where τ is the characteristic time. Wethen allow for two possible evolution paths: one in whichthe galaxy continuously forms stars throughout its lifetimeand a second in which the galaxy experiences a burst of starformation superimposed atop a continuously-declining SFH(see Appendix A for details).
The continuous models begin with a large burst of starformation at t = 0 and evolve for ∼ 15 Gyrs with a con-tinuous, exponentially-declining SFR. For these models, weallow a range of e-folding times from 7 Gyrs representativeof normal star-forming late-type galaxies to 0.5 Gyrs signi-fying a quenching of star formation. The burst models start
https://github.com/moustakas/impro
c© 0000 RAS, MNRAS 000, 000–000

Testing the Modern Merger Hypothesis 9
with the same large burst at t = 0 as in the continuous mod-els but add an additional burst of star formation generatingbetween 1% and 25% of the total mass of the galaxy atop theexponentially-declining star formation when the galaxy is∼ 12 Gyrs old. We use e-folding times from 25Myrs to 1Gyrrepresentative of strongly- and weakly-truncated bursts ofstar formation, respectively. These burst models reflect thescenario in which our plausible new ellipticals formed froma recent (z = 0.12) gas-rich merger and evolved to todaywith varying degrees of quenching over a period of evolu-tion on the order of the dynamical merger time (∼ 1 Gyr;Lotz et al. 2008). To produce the final model spectra, weconvolve the constructed SFHs with a set of single stellarpopulation SEDs from Bruzual & Charlot (2003) spanningtheir full range of metallicities from 0.005 Z⊙ to 2.5 Z⊙ withthe Chabrier IMF.
3.1 Index Plane
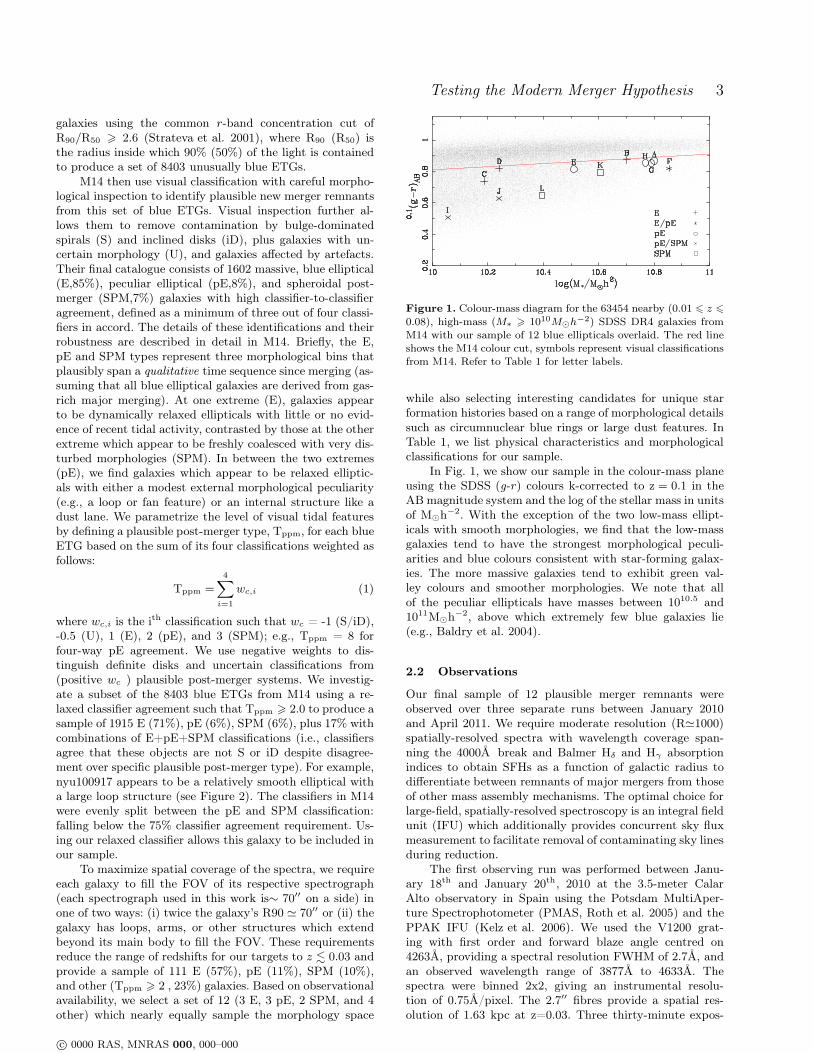
We use the established technique of comparing the 4000Åbreak strength with the Balmer Lick indices HγA andHδA to qualitatively distinguish between galaxies that havea simple, continuous SFH from those that have under-gone a burst of star formation within the last ∼ 1 Gyr(Kauffmann et al. 2003a, K03). Figure 5 shows the indicesmeasured from our continuous models (blue) and our burstmodels (green and red) in the Balmer-Dn(4000) plane. Wenote that though there are parts of parameter space thatcan clearly only be reached by models with bursts, the burstmodels substantially overlap the regions of parameter spacecovered by the suite of continuous models; a result of theage-burst degeneracy. The locus of points extending alongany continuous model track can be explained by a range ofcontinuous SFHs of different e-folding times and luminosity-weighted ages at fixed metallicity. As shown by K03, thislocus is not as sensitive to metallicity as the indices them-selves and acts as a simple diagnostic allowing us to qualitat-ively separate galaxies undergoing continuous star formationfrom those which have undergone a burst of star formationin the last 1−2 Gyrs in which at least 5% of their mass wasformed.
To simplify our analysis, we choose our fiducial burstand continuous models (blue, red, and green model tracksin Fig. 5) to have solar metallicity. We choose solar metal-licity for three reasons: 1) interpretation of the age andchemical composition of composite stellar populations de-termined with line-strength indices depends upon the chem-ical composition of the underlying ’old’ stellar popula-tions (Serra & Trager 2007), 2) SDSS galaxies in our massrange have unresolved metallicities near solar (Gallazzi et al.2005), and 3) local elliptical galaxies have shallow gradientsin their SSP-equivalent chemical compositions (Trager et al.2000a). We note, however, that within both the continuousand burst SFH models, metallicity gradients can plausiblymimic age gradients, and caution against overinterpretingthe model plane.
Points in the plane which lie above the continuousmodels (i.e., have a more positive Balmer absorption in-dex at a fixed Dn(4000)) can be explained by a range ofburst SFHs of different e-folding times, luminosity-weightedages at fixed metallicity, and fraction of new stars formedduring the added burst. Because of this degeneracy we do
not try to precisely constrain model parameters such as e-folding times, etc. Yet, by comparing the data to our chosenmodels sampling the extrema of reasonable e-folding timesand luminosity-weighted ages, we can draw several qualitat-ive conclusions. To do this, we divide the Balmer-Dn(4000)parameter space into four regions by combining the knownproperties of the constructed models with the regions of theBalmer-Dn(4000) plane where K03 found 95% of their sim-ulated galaxies had high probabilities of forming either atleast 5% or exactly none of their stars in a burst within thelast 2Gyrs (see figure 6 in K03 for details).
The first region (Region 1) in the model plane con-tains the radial indices with Dn(4000) . 1.35 that lie on orbelow the continuous SFH models where typical late-typestar-forming galaxies are found. We note that points lyingalong the burst models having ages . 200 Myrs also reside inthis region. This is an example of the well-known age-burstdegeneracy wherein a large burst of star formation occurringlong ago (here, the continuous model) mimics the behaviourof a recent, smaller burst. The second region (Region 2)contains the range 1.35 . Dn(4000) . 1.6 and lies on or be-low the continuous SFH model with a short e-folding time(τ = 2 Gyrs, solid blue lines). In this region, we find galaxieshaving luminosity-weighted ages between ∼ 5 and 9 Gyrs,but note that adding a few percent of new stars by massatop an older population can mimic these ages.
The third region (Region 3) contains the radial in-dices with Dn(4000) & 1.6 and lying in the region where thecontinuous and burst models overlap. At fixed Dn(4000),measurements in this region have Balmer absorption indiceswhich span from the continuous SFHs consistent with oldstellar populations in quiescent ETGs to the 5% burst mod-els with luminosity-weighted ages ? 1Gyrs. Finally, thefourth region (Region 4) spans Dn(4000) . 1.6 and isbracketed above the continuous SFH models. This regionis described by K03 as containing galaxies with a high con-fidence of having undergone a burst of star formation in thelast ∼ 2Gyrs. The individual Balmer-Dn(4000) planes withthe radial indices for each galaxy in our sample are shownin Fig. B1.
3.2 Comparing Models and Data
In Fig. 6, we overlay all of our radial index measurementsfrom all galaxies in our sample atop our full suite of mod-els and find two notable conclusions. First, our measuredindices span nearly the entire model space indicating thatour sample of galaxies possesses a wide range of SFHs (al-though radial information is not recoverable here). Second,our chosen model space completely covers our measured in-dices. This indicates that our choice of model parametersis congruent with the local population of plausible new el-lipticals. We note that many of the points that lie in thefourth region of the plane (i.e., bracketed above the con-tinuous models (blue)) reside below the burst models withburst fractions of 5% (red) and are more consistent withburst models with smaller burst fractions (e.g., ∼ 1%). We
The one outlier near Dn(4000) ≃ 1.7 is shown in Section 4.3 tolikely be a measurement error.
c© 0000 RAS, MNRAS 000, 000–000

10 T. Haines et al.
Figure 5. The stellar Balmer absorption versus 4000Å break strength model plane showing two continuous SFH models (blue), twoburst models in which 25% of the total galaxy mass was formed in a single burst (green), and two burst models with a 5% burst fraction(red). Tick marks denote ages along the model lines. For the continuous models, the ages are 1, 3, 5, 7, 9, and 11 Gyrs. For the burstmodels, the ages (i.e., time since the burst) are 0.2, 0.5, 0.9, 1.5, and 2.5 Gyrs. The four qualitative regions from the text are labelled andorange lines mark their approximate boundaries. The full suite of continuous (top) and burst models (bottom) covering their respectivefull parameter spaces are shown in light grey.
defer to future work to recover detailed star formation his-tories for individual data points.
In Fig. 7, we show the Balmer and Dn(4000) radial in-dices for each of our galaxies organized by the region inwhich most of the indices lie (see Appendix B for individualBalmer/Dn (4000) planes). Galaxies with radial indices intwo different regions of the plane (e.g., nyu916578) are as-signed to the region where their central annuli lie. Compar-ing with Fig. 4, we see that the first and fourth regions ofthe Balmer-Dn(4000) plane contain the most morphologic-ally disturbed galaxies (Tppm > 10) with flat or slightlydecreasing Balmer index gradients and generally increas-ing Dn(4000) indices at large radii. With burst-like SFHsand very young stellar ages in their cores, these galaxies arelikely candidates of recent gas-rich major mergers. If the dy-namical disturbance is due to merging activity as predictedby the modern merger hypothesis, the dichotomy of regionsin the plane where strongly disturbed galaxies lie indicatesthat not all mergers result in starbursts- consistent with pre-dictions from simulations (e.g., Cox et al. 2008). Galaxiesin region 2 have smooth elliptical morphologies (Tppm 6 5)and SFHs consistent with weak, but ongoing, star forma-
tion. Galaxies in region 3 have steep positive Balmer indexgradients and steep negative Dn(4000) gradients indicativeof very old stellar ages in their central regions, implying theyare the least likely to be remnants of recent gas-rich majormergers. Surprisingly, these galaxies exhibit a variety of el-liptical morphologies (4 6 Tppm 6 7) including some withclear signs of interaction (e.g., nyu916578), but possess stel-lar ages much older than those found in the smooth ellipt-icals in region 2.
4 DISSECTING ASSEMBLY HISTORIES
A key prediction of the modern merger hypothesis isthe presence of a strong, centrally-concentrated burst ofstar formation in the merger remnant. We anticipate thisinside-out growth produces a distinct radial SFH whichwe can use to qualitatively differentiate plausible remnantsof major mergers from galaxies undergoing other mass as-sembly mechanisms. Combining our spectroscopic radial in-dex measurements with our qualitatively defined regions ofthe Balmer-Dn(4000) plane (see Section 3.1), we ask the
c© 0000 RAS, MNRAS 000, 000–000
Testing the Modern Merger Hypothesis 11
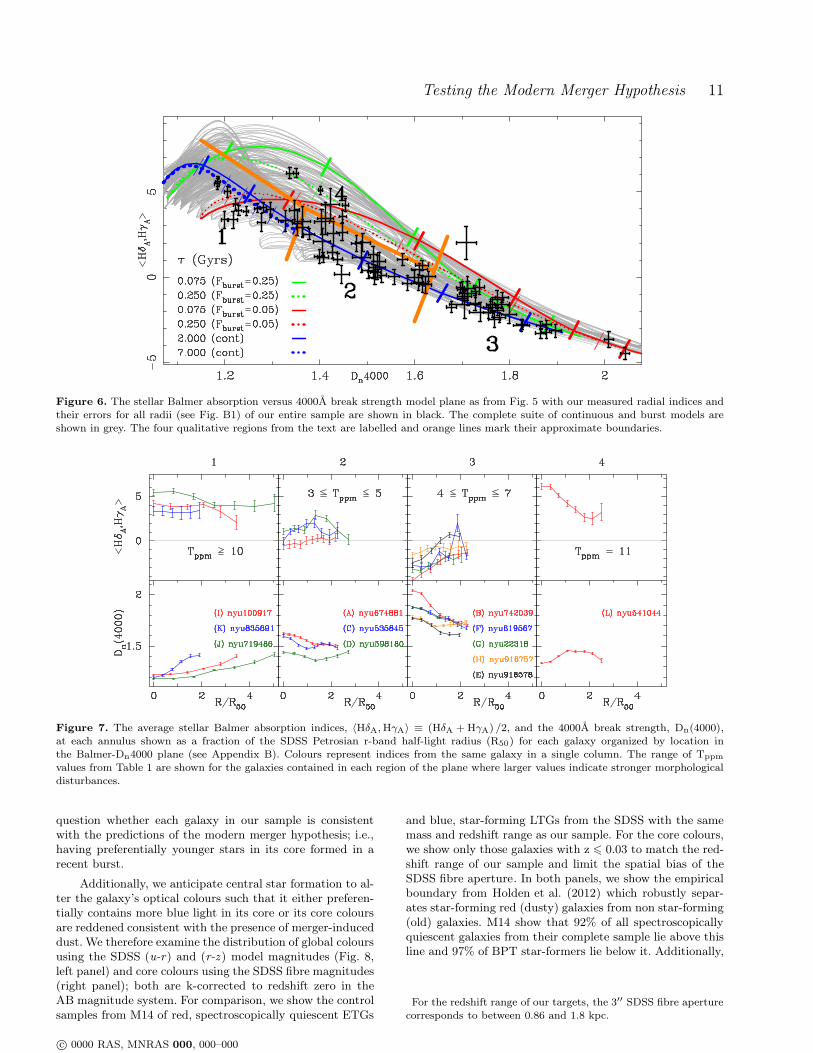
Figure 6. The stellar Balmer absorption versus 4000Å break strength model plane as from Fig. 5 with our measured radial indices andtheir errors for all radii (see Fig. B1) of our entire sample are shown in black. The complete suite of continuous and burst models areshown in grey. The four qualitative regions from the text are labelled and orange lines mark their approximate boundaries.
Figure 7. The average stellar Balmer absorption indices, 〈HδA,HγA〉 ≡ (HδA +HγA) /2, and the 4000Å break strength, Dn(4000),at each annulus shown as a fraction of the SDSS Petrosian r-band half-light radius (R50) for each galaxy organized by location inthe Balmer-Dn4000 plane (see Appendix B). Colours represent indices from the same galaxy in a single column. The range of Tppm
values from Table 1 are shown for the galaxies contained in each region of the plane where larger values indicate stronger morphologicaldisturbances.
question whether each galaxy in our sample is consistentwith the predictions of the modern merger hypothesis; i.e.,having preferentially younger stars in its core formed in arecent burst.
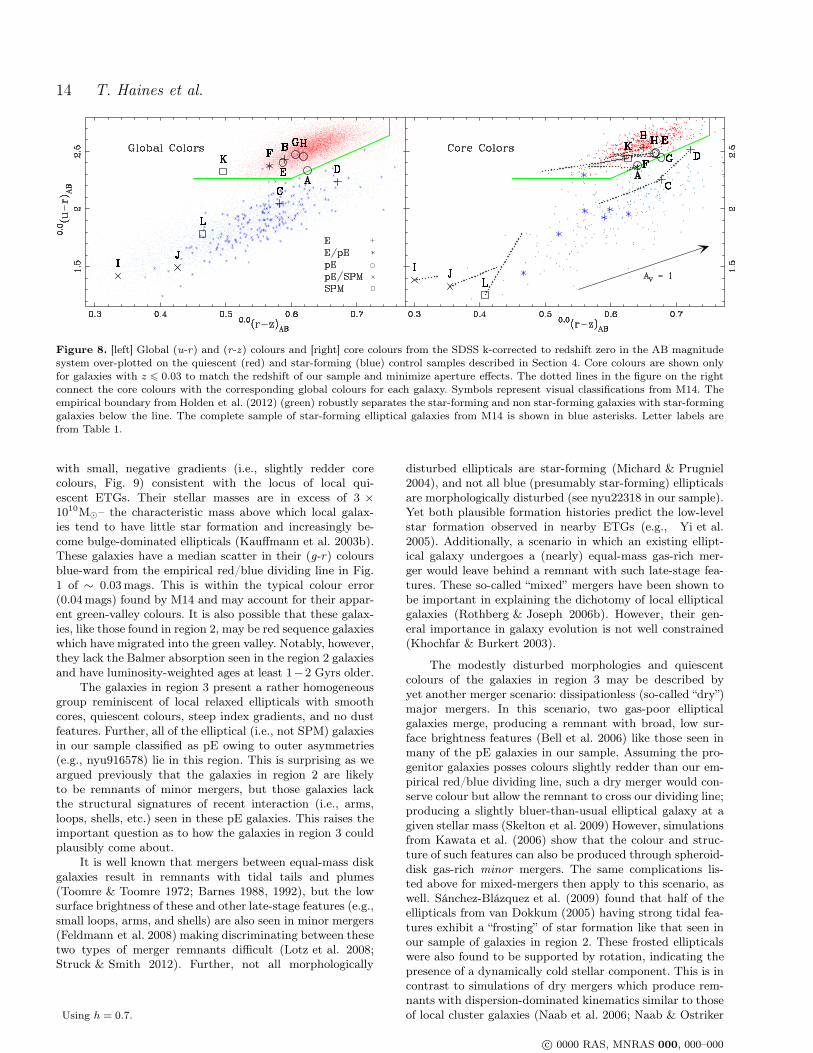
Additionally, we anticipate central star formation to al-ter the galaxy’s optical colours such that it either preferen-tially contains more blue light in its core or its core coloursare reddened consistent with the presence of merger-induceddust. We therefore examine the distribution of global coloursusing the SDSS (u-r) and (r-z) model magnitudes (Fig. 8,left panel) and core colours using the SDSS fibre magnitudes(right panel); both are k-corrected to redshift zero in theAB magnitude system. For comparison, we show the controlsamples from M14 of red, spectroscopically quiescent ETGs
and blue, star-forming LTGs from the SDSS with the samemass and redshift range as our sample. For the core colours,we show only those galaxies with z 6 0.03 to match the red-shift range of our sample and limit the spatial bias of theSDSS fibre aperture. In both panels, we show the empiricalboundary from Holden et al. (2012) which robustly separ-ates star-forming red (dusty) galaxies from non star-forming(old) galaxies. M14 show that 92% of all spectroscopicallyquiescent galaxies from their complete sample lie above thisline and 97% of BPT star-formers lie below it. Additionally,
For the redshift range of our targets, the 3′′ SDSS fibre aperturecorresponds to between 0.86 and 1.8 kpc.
c© 0000 RAS, MNRAS 000, 000–000

12 T. Haines et al.
we overlay the sample of spectroscopically-confirmed star-forming ellipticals from the M14 sample as blue asterisks.
In Fig. 9, we provide quantitative colour gradients inthe SDSS (u-r) and (r-z) colour-colour plane for our galaxiesand the subset of the comparison samples shown in Fig. 8with z 6 0.03. The colour gradients are defined by ∆C =Couter − Ccore where C is one of (u-r) or (r-z). The outercolour Couter is derived by converting the respective SDSSmodel magnitudes into flux, subtracting the flux from theSDSS fibre magnitudes, and converting to a colour. We notethat the colour gradients computed here are not the sameas the tracks shown in the right-hand panel of Fig. 8 whichshow the relative position of each galaxy in the colour-colourplane according to its core and global colours.
4.1 Are starbursts always concurrent with major
mergers?
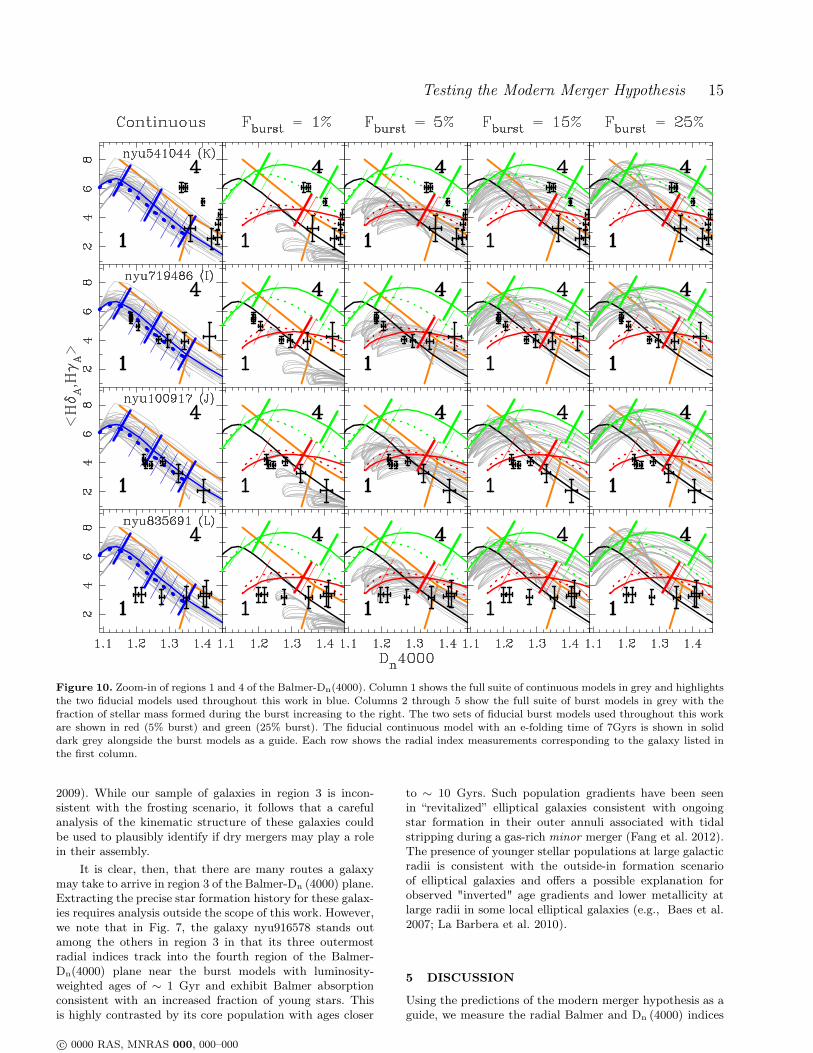
Examining Figs. 4 and 7, we find that only one (nyu541044)of the four galaxies visually classified as SPM or pE/SPM(i.e., Tppm > 10) has radial indices in region 4. In partic-ular, Fig. 10 shows its central indices are consistent withour burst models in which > 15% of its stars formed ina recent burst and have luminosity-weighted ages 6 1Gyr(measured relative to the start of the burst). Surprisingly,this galaxy’s global and core optical colours both lie in thenon star-forming region of colour-colour space as determ-ined by the Holden boundary (Fig. 8). However, its colourgradients lie outside the locus of local ETGs and are moresteeply negative (i.e., redder cores) than ∼ 80% of the localstar-forming LTGs (Fig. 9). This combination of clear burstsignature and quiescent core colours is consistent with post-starburst galaxies which are characterized as having recentlyundergone a large burst of star formation quickly followedby strong quenching.
Indeed, previous spectroscopic study of this galaxy bySchweizer (1996) found this to be the case; although wefind a slightly higher fraction of new stars formed in theburst (> 15% compared to their ∼ 10%) likely attribut-able to the more modern stellar template libraries used inconstructing our burst models. Galaxies with post-starburstsignatures are also referred to as E+A galaxies due to theirspectra appearing as a superposition of an elliptical galaxy(i.e., very little nebular emission) and that of A-type stars(Dressler & Gunn 1983). From Fig. C1, we see the presenceof both an elliptical-like spectrum as well as the Balmer ab-sorption features in our observed spectra for this galaxy. Ad-ditionally, the lack of dust signatures in the optical coloursof this galaxy (Fig. 8) is consistent with local E+A galaxiesbeing quenched post-starbursts rather than starbursts withdust-obscured nebular emission (Goto 2004).
The characteristics of E+A galaxies have been shownto be consistent with the transformation from a gas-rich, star-forming disk galaxy to a gas-poor, quiescent,pressure-supported spheroidal galaxy (Norton et al. 2001),and are hypothesized to come from gas-rich major mer-gers (Wild et al. 2009; Cox et al. 2008; Goto et al. 2008;Pracy et al. 2012). The molecular gas density profile ofthis galaxy (Hibbard & Yun 1999) is consistent with thecentrally-concentrated gas deposition predicted in simula-tions of major mergers (e.g., Barnes & Hernquist 1991).The qualitative luminosity-weighted ages we find in its cent-
ral annuli are consistent with the lifetime of the short(∼ 0.1 − 0.3Grys) E+A signatures seen in simulations(Snyder et al. 2011). Without further spectroscopic meas-urements, we are unable to draw any conclusions regardingthe role of an AGN as the truncation mechanism as pre-dicted by the modern merger hypothesis. Clearly, though,the preponderance of evidence indicates that this galaxy isa strong candidate of being a remnant of a recent, gas-richmajor merger.
The remaining three galaxies with Tppm > 10 havestar-forming global colours with bluer core colours (Fig.8) and steeper positive (i.e., bluer core) colour gradientsthan ∼ 96% of the local population of star-forming LTGs(Fig. 9). These strongly disturbed galaxies have generallylarger Balmer absorption values and smaller 4000Å breakstrengths than all of the other morphology types (Fig.4), and specifically have their largest Balmer and smallestDn(4000) values in their centres– consistent with young,centrally-concentrated stellar populations. These character-istics match the core star formation coincident with strongmorphological disturbances predicted by the modern mer-ger hypothesis and are consistent with these galaxies form-ing via gas-rich major mergers. Unlike nyu541044, however,these galaxies lack any indication of post-starburst signa-tures. Rather, they lie in region 1 (Fig. 7) of the Balmer-Dn(4000) plane and exhibit a dichotomy of plausible SFHsfrom long-lived continuous star formation to a small, recentburst of star formation. As noted in Section 3.1, the overlapbetween the continuous and burst models in this region isa consequence of the well-known age-burst degeneracy. Theintricacies of this effect are outside the scope of this work,yet we can constrain the plausible formation scenarios bycarefully examining region 1 over our suite of models.
In Fig. 10, we show a zoom-in of the Balmer-Dn (4000)plane covering regions 1 and 4 with varying configurationsof the parameter space from our models. Of the three galax-ies which lie in region 1, only nyu835691 exhibits centralindices which are inconsistent with the continuous models.For the two galaxies with central annuli consistent with thefiducial continuous models, we note that these models ex-hibit luminosity-weighted ages in region 1 ranging between1 − 11 Gyrs depending on e-folding time. However, suchlarge ages are in conflict with the predicted lifetimes of thetidal features seen in these galaxies (see below). Althoughour observations do not conclusively exclude the continuousmodels, we note that they are only plausible for these twogalaxies and do not consider them further. Examining theburst models in columns 2 through 5, we see that all threegalaxies are generally inconsistent with the extreme modelshaving burst fractions of 1 and 25%, respectively. For themodels with moderate burst fraction, we see that the ra-dial indices of all three galaxies lie along the model trackswith Fburst = 5% (consistent with the findings of K03 forthis region), but only nyu719486 has central indices alongthe model tracks with the 15% burst fraction.
Focusing on the burst models with Fburst = 5%, we findvery young luminosity-weighted ages (. 200 Myrs, meas-ured relative to the time of the burst) over all metallicitiesand e-folding times. Given that the burst models were con-structed with the burst (and thus the merger) occurring atz = 0.12 and our galaxies have redshifts of z ≃ 0.03, thisleaves an intermission of ∼ 1 Gyr between coalescence of
c© 0000 RAS, MNRAS 000, 000–000
Testing the Modern Merger Hypothesis 13
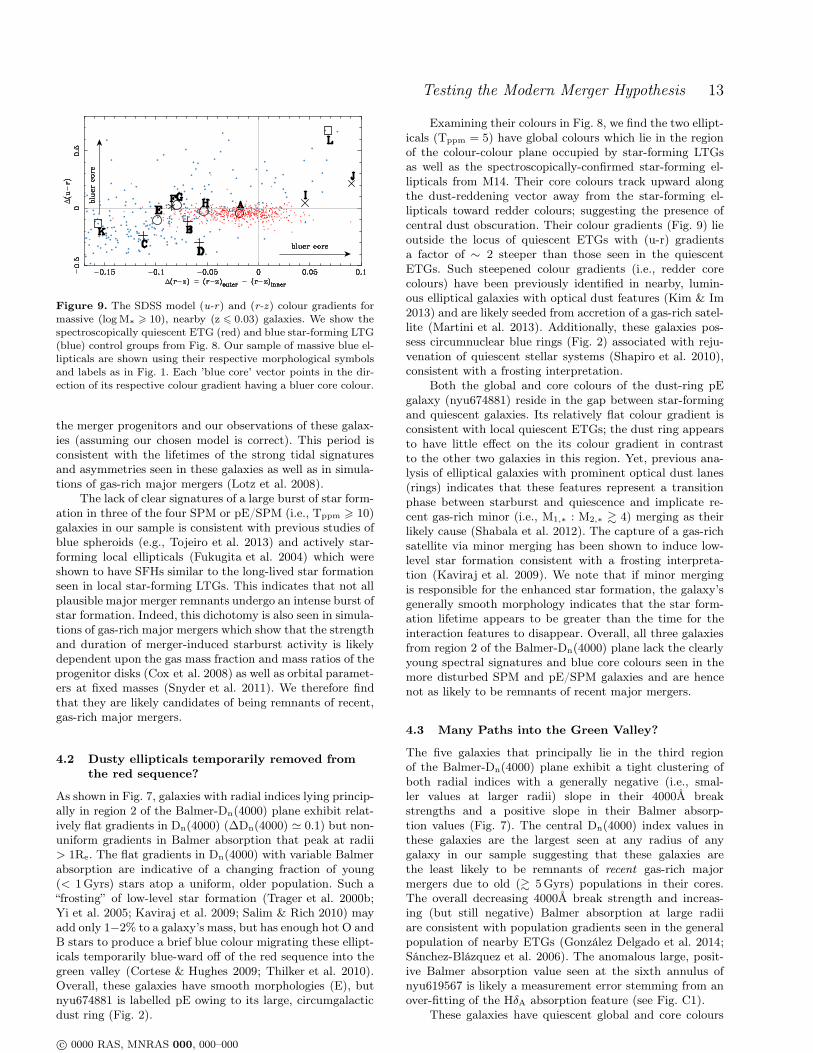
Figure 9. The SDSS model (u-r) and (r-z) colour gradients formassive (logM∗ > 10), nearby (z 6 0.03) galaxies. We show thespectroscopically quiescent ETG (red) and blue star-forming LTG(blue) control groups from Fig. 8. Our sample of massive blue el-lipticals are shown using their respective morphological symbolsand labels as in Fig. 1. Each ’blue core’ vector points in the dir-ection of its respective colour gradient having a bluer core colour.
the merger progenitors and our observations of these galax-ies (assuming our chosen model is correct). This period isconsistent with the lifetimes of the strong tidal signaturesand asymmetries seen in these galaxies as well as in simula-tions of gas-rich major mergers (Lotz et al. 2008).
The lack of clear signatures of a large burst of star form-ation in three of the four SPM or pE/SPM (i.e., Tppm > 10)galaxies in our sample is consistent with previous studies ofblue spheroids (e.g., Tojeiro et al. 2013) and actively star-forming local ellipticals (Fukugita et al. 2004) which wereshown to have SFHs similar to the long-lived star formationseen in local star-forming LTGs. This indicates that not allplausible major merger remnants undergo an intense burst ofstar formation. Indeed, this dichotomy is also seen in simula-tions of gas-rich major mergers which show that the strengthand duration of merger-induced starburst activity is likelydependent upon the gas mass fraction and mass ratios of theprogenitor disks (Cox et al. 2008) as well as orbital paramet-ers at fixed masses (Snyder et al. 2011). We therefore findthat they are likely candidates of being remnants of recent,gas-rich major mergers.
4.2 Dusty ellipticals temporarily removed from
the red sequence?
As shown in Fig. 7, galaxies with radial indices lying princip-ally in region 2 of the Balmer-Dn(4000) plane exhibit relat-ively flat gradients in Dn(4000) (∆Dn(4000) ≃ 0.1) but non-uniform gradients in Balmer absorption that peak at radii> 1Re. The flat gradients in Dn(4000) with variable Balmerabsorption are indicative of a changing fraction of young(< 1Gyrs) stars atop a uniform, older population. Such a“frosting” of low-level star formation (Trager et al. 2000b;Yi et al. 2005; Kaviraj et al. 2009; Salim & Rich 2010) mayadd only 1−2% to a galaxy’s mass, but has enough hot O andB stars to produce a brief blue colour migrating these ellipt-icals temporarily blue-ward off of the red sequence into thegreen valley (Cortese & Hughes 2009; Thilker et al. 2010).Overall, these galaxies have smooth morphologies (E), butnyu674881 is labelled pE owing to its large, circumgalacticdust ring (Fig. 2).
Examining their colours in Fig. 8, we find the two ellipt-icals (Tppm = 5) have global colours which lie in the regionof the colour-colour plane occupied by star-forming LTGsas well as the spectroscopically-confirmed star-forming el-lipticals from M14. Their core colours track upward alongthe dust-reddening vector away from the star-forming el-lipticals toward redder colours; suggesting the presence ofcentral dust obscuration. Their colour gradients (Fig. 9) lieoutside the locus of quiescent ETGs with (u-r) gradientsa factor of ∼ 2 steeper than those seen in the quiescentETGs. Such steepened colour gradients (i.e., redder corecolours) have been previously identified in nearby, lumin-ous elliptical galaxies with optical dust features (Kim & Im2013) and are likely seeded from accretion of a gas-rich satel-lite (Martini et al. 2013). Additionally, these galaxies pos-sess circumnuclear blue rings (Fig. 2) associated with reju-venation of quiescent stellar systems (Shapiro et al. 2010),consistent with a frosting interpretation.
Both the global and core colours of the dust-ring pEgalaxy (nyu674881) reside in the gap between star-formingand quiescent galaxies. Its relatively flat colour gradient isconsistent with local quiescent ETGs; the dust ring appearsto have little effect on the its colour gradient in contrastto the other two galaxies in this region. Yet, previous ana-lysis of elliptical galaxies with prominent optical dust lanes(rings) indicates that these features represent a transitionphase between starburst and quiescence and implicate re-cent gas-rich minor (i.e., M1,∗ : M2,∗ & 4) merging as theirlikely cause (Shabala et al. 2012). The capture of a gas-richsatellite via minor merging has been shown to induce low-level star formation consistent with a frosting interpreta-tion (Kaviraj et al. 2009). We note that if minor mergingis responsible for the enhanced star formation, the galaxy’sgenerally smooth morphology indicates that the star form-ation lifetime appears to be greater than the time for theinteraction features to disappear. Overall, all three galaxiesfrom region 2 of the Balmer-Dn(4000) plane lack the clearlyyoung spectral signatures and blue core colours seen in themore disturbed SPM and pE/SPM galaxies and are hencenot as likely to be remnants of recent major mergers.
4.3 Many Paths into the Green Valley?
The five galaxies that principally lie in the third regionof the Balmer-Dn(4000) plane exhibit a tight clustering ofboth radial indices with a generally negative (i.e., smal-ler values at larger radii) slope in their 4000Å breakstrengths and a positive slope in their Balmer absorp-tion values (Fig. 7). The central Dn(4000) index values inthese galaxies are the largest seen at any radius of anygalaxy in our sample suggesting that these galaxies arethe least likely to be remnants of recent gas-rich majormergers due to old (& 5Gyrs) populations in their cores.The overall decreasing 4000Å break strength and increas-ing (but still negative) Balmer absorption at large radiiare consistent with population gradients seen in the generalpopulation of nearby ETGs (González Delgado et al. 2014;Sánchez-Blázquez et al. 2006). The anomalous large, posit-ive Balmer absorption value seen at the sixth annulus ofnyu619567 is likely a measurement error stemming from anover-fitting of the HδA absorption feature (see Fig. C1).
These galaxies have quiescent global and core colours
c© 0000 RAS, MNRAS 000, 000–000
14 T. Haines et al.
Figure 8. [left] Global (u-r) and (r-z) colours and [right] core colours from the SDSS k-corrected to redshift zero in the AB magnitudesystem over-plotted on the quiescent (red) and star-forming (blue) control samples described in Section 4. Core colours are shown onlyfor galaxies with z 6 0.03 to match the redshift of our sample and minimize aperture effects. The dotted lines in the figure on the rightconnect the core colours with the corresponding global colours for each galaxy. Symbols represent visual classifications from M14. Theempirical boundary from Holden et al. (2012) (green) robustly separates the star-forming and non star-forming galaxies with star-forminggalaxies below the line. The complete sample of star-forming elliptical galaxies from M14 is shown in blue asterisks. Letter labels arefrom Table 1.
with small, negative gradients (i.e., slightly redder corecolours, Fig. 9) consistent with the locus of local qui-escent ETGs. Their stellar masses are in excess of 3 ×10¹⁰M⊙– the characteristic mass above which local galax-ies tend to have little star formation and increasingly be-come bulge-dominated ellipticals (Kauffmann et al. 2003b).These galaxies have a median scatter in their (g-r) coloursblue-ward from the empirical red/blue dividing line in Fig.1 of ∼ 0.03mags. This is within the typical colour error(0.04mags) found by M14 and may account for their appar-ent green-valley colours. It is also possible that these galax-ies, like those found in region 2, may be red sequence galaxieswhich have migrated into the green valley. Notably, however,they lack the Balmer absorption seen in the region 2 galaxiesand have luminosity-weighted ages at least 1−2 Gyrs older.
The galaxies in region 3 present a rather homogeneousgroup reminiscent of local relaxed ellipticals with smoothcores, quiescent colours, steep index gradients, and no dustfeatures. Further, all of the elliptical (i.e., not SPM) galaxiesin our sample classified as pE owing to outer asymmetries(e.g., nyu916578) lie in this region. This is surprising as weargued previously that the galaxies in region 2 are likelyto be remnants of minor mergers, but those galaxies lackthe structural signatures of recent interaction (i.e., arms,loops, shells, etc.) seen in these pE galaxies. This raises theimportant question as to how the galaxies in region 3 couldplausibly come about.
It is well known that mergers between equal-mass diskgalaxies result in remnants with tidal tails and plumes(Toomre & Toomre 1972; Barnes 1988, 1992), but the lowsurface brightness of these and other late-stage features (e.g.,small loops, arms, and shells) are also seen in minor mergers(Feldmann et al. 2008) making discriminating between thesetwo types of merger remnants difficult (Lotz et al. 2008;Struck & Smith 2012). Further, not all morphologically
Using h = 0.7.
disturbed ellipticals are star-forming (Michard & Prugniel2004), and not all blue (presumably star-forming) ellipticalsare morphologically disturbed (see nyu22318 in our sample).Yet both plausible formation histories predict the low-levelstar formation observed in nearby ETGs (e.g., Yi et al.2005). Additionally, a scenario in which an existing ellipt-ical galaxy undergoes a (nearly) equal-mass gas-rich mer-ger would leave behind a remnant with such late-stage fea-tures. These so-called “mixed” mergers have been shown tobe important in explaining the dichotomy of local ellipticalgalaxies (Rothberg & Joseph 2006b). However, their gen-eral importance in galaxy evolution is not well constrained(Khochfar & Burkert 2003).
The modestly disturbed morphologies and quiescentcolours of the galaxies in region 3 may be described byyet another merger scenario: dissipationless (so-called “dry”)major mergers. In this scenario, two gas-poor ellipticalgalaxies merge, producing a remnant with broad, low sur-face brightness features (Bell et al. 2006) like those seen inmany of the pE galaxies in our sample. Assuming the pro-genitor galaxies posses colours slightly redder than our em-pirical red/blue dividing line, such a dry merger would con-serve colour but allow the remnant to cross our dividing line;producing a slightly bluer-than-usual elliptical galaxy at agiven stellar mass (Skelton et al. 2009) However, simulationsfrom Kawata et al. (2006) show that the colour and struc-ture of such features can also be produced through spheroid-disk gas-rich minor mergers. The same complications lis-ted above for mixed-mergers then apply to this scenario, aswell. Sánchez-Blázquez et al. (2009) found that half of theellipticals from van Dokkum (2005) having strong tidal fea-tures exhibit a “frosting” of star formation like that seen inour sample of galaxies in region 2. These frosted ellipticalswere also found to be supported by rotation, indicating thepresence of a dynamically cold stellar component. This is incontrast to simulations of dry mergers which produce rem-nants with dispersion-dominated kinematics similar to thoseof local cluster galaxies (Naab et al. 2006; Naab & Ostriker
c© 0000 RAS, MNRAS 000, 000–000
Testing the Modern Merger Hypothesis 15
Figure 10. Zoom-in of regions 1 and 4 of the Balmer-Dn(4000). Column 1 shows the full suite of continuous models in grey and highlightsthe two fiducial models used throughout this work in blue. Columns 2 through 5 show the full suite of burst models in grey with thefraction of stellar mass formed during the burst increasing to the right. The two sets of fiducial burst models used throughout this workare shown in red (5% burst) and green (25% burst). The fiducial continuous model with an e-folding time of 7Gyrs is shown in soliddark grey alongside the burst models as a guide. Each row shows the radial index measurements corresponding to the galaxy listed inthe first column.
2009). While our sample of galaxies in region 3 is incon-sistent with the frosting scenario, it follows that a carefulanalysis of the kinematic structure of these galaxies couldbe used to plausibly identify if dry mergers may play a rolein their assembly.
It is clear, then, that there are many routes a galaxymay take to arrive in region 3 of the Balmer-Dn (4000) plane.Extracting the precise star formation history for these galax-ies requires analysis outside the scope of this work. However,we note that in Fig. 7, the galaxy nyu916578 stands outamong the others in region 3 in that its three outermostradial indices track into the fourth region of the Balmer-Dn(4000) plane near the burst models with luminosity-weighted ages of ∼ 1 Gyr and exhibit Balmer absorptionconsistent with an increased fraction of young stars. Thisis highly contrasted by its core population with ages closer
to ∼ 10 Gyrs. Such population gradients have been seenin “revitalized” elliptical galaxies consistent with ongoingstar formation in their outer annuli associated with tidalstripping during a gas-rich minor merger (Fang et al. 2012).The presence of younger stellar populations at large galacticradii is consistent with the outside-in formation scenarioof elliptical galaxies and offers a possible explanation forobserved "inverted" age gradients and lower metallicity atlarge radii in some local elliptical galaxies (e.g., Baes et al.2007; La Barbera et al. 2010).
5 DISCUSSION
Using the predictions of the modern merger hypothesis as aguide, we measure the radial Balmer and Dn (4000) indices
c© 0000 RAS, MNRAS 000, 000–000
16 T. Haines et al.
to attempt to distinguish between galaxies originating froma recent, gas-rich major merger and those undergoing someother mass assembly mechanism. In Section 4, we present adetailed analysis combining the radial indices, optical col-ours, and morphological features to examine the star form-ation histories of our sample of galaxies. With those detailsin mind, we show a characteristic “decision” tree (Fig. 11)for our sample which allows us to a posteriori correlate thecharacteristics of each galaxy in our sample with its locationin the qualitatively defined regions of the Balmer-Dn (4000)plane.
We begin by splitting our sample into two groups us-ing the presence of strong outer loops. This cleanly separatesstrongly disturbed spheroidal post merger (SPM) signatures(i.e., Tppm > 10) from ellipticals with smooth or modestlydisturbed morphologies. For the most disturbed galaxies, wefurther examine whether they are consistent with undergo-ing a strong central burst of star formation. As discussed inSection 4.1, the key distinction between galaxies residing inregions 1 and 4 appears to be only the strength of the burstand not the existence of a burst. Further, we find that galax-ies in region 4 appear to be consistent with E+A or post-starburst galaxies. However, we note that our small samplestatistics preclude extending this result further. Galaxies inregion 1 of the index plane are consistent with a dichotomyof star formation histories from long-lived, continuous starformation to a recent, weak burst, forming 6 5% of theirmass in a recent burst.
For the second half of the tree, we find that galaxieswith smooth elliptical morphologies but internal structuressuch as circumnuclear blue rings or dust lanes preferentiallyreside in region 2 of the index plane. Additionally, they pos-sess flat gradients in their 4000Å break strengths, but haveradial Balmer absorption indices consistent with a changingfraction of young stars atop a uniform, older population.As outlined in Section 4.2, previous examination of galax-ies with similar internal structures attribute these featuresto revitalized stellar populations brought on by minor mer-ger events- in agreement with our frosting interpretation.This is in accord with the general idea that minor mer-gers are thought to play a significant role in evolving spher-oidal galaxies for two reasons: (i) the small number of ma-jor mergers in the local universe cannot provide the abund-ance of green-valley ETGs (Darg et al. 2010; Salim & Rich2010; Lotz et al. 2011), and (ii) the observed size evolutionof elliptical galaxies since z ∼ 1 is best explained by growthdominated by minor mergers (Bédorf & Portegies Zwart2013; Bezanson et al. 2009; Hilz et al. 2013; Lee et al. 2013;Naab et al. 2009; Oser et al. 2012).
Moving to the final branch of the decision tree, we an-ticipate finding smooth (i.e., small Tppm values) galaxieswith star formation histories least like those predicted inthe modern merger hypothesis. Indeed, all but one of thegalaxies in region 3 have star formation histories much likelocal quiescent ETGs. However, many of them exhibit ex-ternal structures such as arms or loops, and all of the ellipt-ical (i.e., not SPM) galaxies labelled as pE owing to theseouter asymmetries (e.g., nyu916578) lie in this region. Theone galaxy which runs counter to this general interpret-ation is nyu916578 which exhibits a strong, negative agegradient with stellar populations at its largest radii havingluminosity-weighted ages . 1Gyr. Such “inverted” age gradi-
ents are attributable to gas-rich minor merging. Overall, thegalaxies in region 3 have a scatter in their (g-r) colours ofonly ∼ 0.03 mags blue-ward of the empirical red/blue divid-ing line (Fig. 1) and lack clear indications of ongoing starformation. It is likely that their green valley colours willquickly fade and migrate them onto the red sequence. Ad-ditionally, they possess stellar masses near ∼ 1010.8M⊙h
−2
and extinction- and k-corrected SDSS absolute r-band mag-nitudes between −21 6 Mr 6 −22 (Table 1), placing themclose to the knee of the green valley luminosity functionfound by Gonçalves et al. (2012), consistent with the downs-izing of the red sequence (i.e., the low-mass end of the redsequence is populated at late times).
Previous detailed examination of green valleygalaxies revealed a dichotomy in their morphologies(Schawinski et al. 2014). The presence of both early- andlate-type galaxies in the green valley lends support tothe idea that multiple mass-assembly mechanisms arelikely responsible for galaxy growth over cosmic time. Ourtargeted study of spheroidal galaxies with blue sequencecolours expands on that work, demonstrating a furtherbranching of mass assembly histories even within justearly-type galaxies in the green valley. This indicatesthat the green valley is a rich laboratory for studyingthe transitory phases of galaxy formation and evolution.Our analysis could only be accomplished via the usage ofspatially-resolved spectroscopy and motivates the study ofgreen valley galaxies in large IFU surveys.
6 SUMMARY AND CONCLUSIONS
In this work, we have combined visual morphologies withspatially-resolved spectra and optical colours to character-ize the radial SFHs of a unique sample of plausible new el-lipticals. Utilizing techniques for examining SFHs previouslyused to characterize the central regions of local galaxies (e.g.,K03), we compare the stellar age indices H δ, H γ, and the4000Å break to synthetic SFH models at radii from the coreout to ∼ 2 − 3 half-light radii. We find that these indexvalues and their radial dependence correlate with specificmorphological features such that the most disturbed galax-ies have the smallest 4000Å break strengths and the largestBalmer absorption values. With this new spatial data, weare able to detect the presence of a centrally concentratedstarburst occurring within the last ∼ 1Gyr – allowing usto plausibly discriminate between the construction of new
ellipticals by gas-rich major merging following the modernmerger hypothesis (Hopkins et al. 2008b) and ellipticals un-dergoing other mass assembly mechanisms.
Our main conclusions are as follows.
(i) We find that one-third of our sample possess the strongmorphological disturbances and central star formation con-sistent with being plausible remnants of a recent, gas-richmajor merger. However, only one of them exhibits the char-acteristics of having recently undergone a strong, centrally-concentrated burst of star formation followed by quench-ing. Its quiescent optical colours and strong burst signatureare consistent with its well-known status as an E+A (post-starburst) galaxy. Assuming our small sample comports withthe population of local merger remnants, we infer that themodern merger hypothesis describes the assembly of only
c© 0000 RAS, MNRAS 000, 000–000
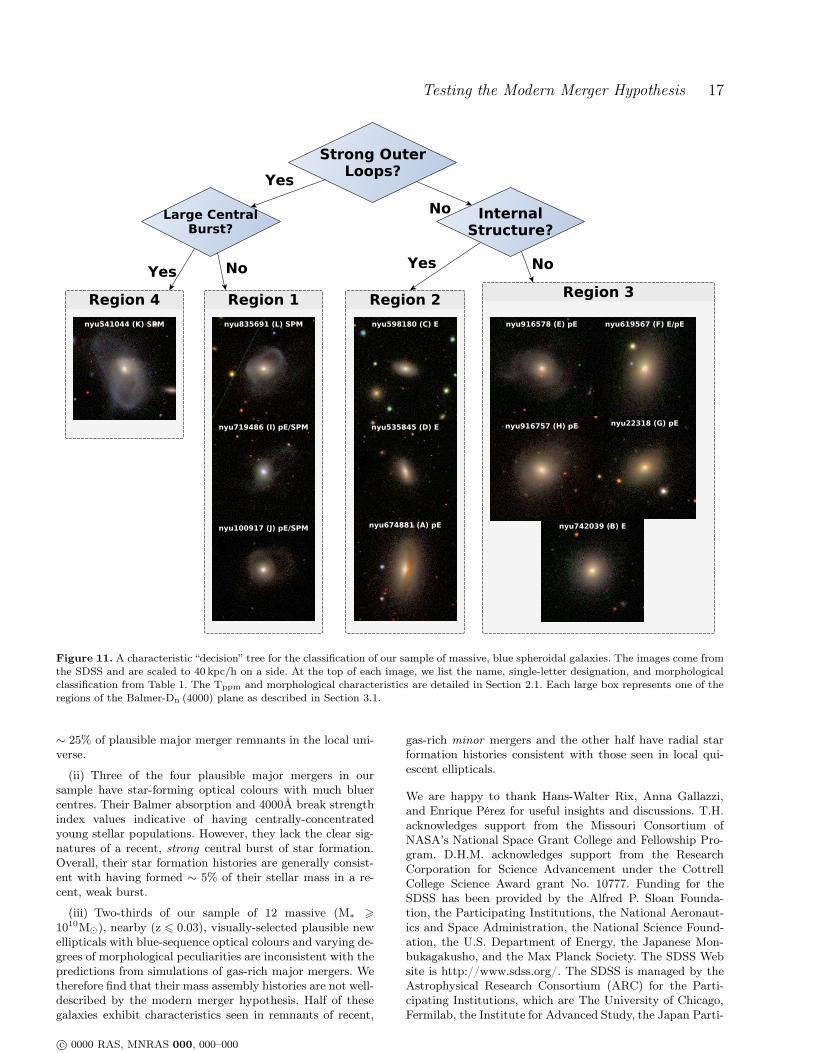
Testing the Modern Merger Hypothesis 17
Figure 11. A characteristic “decision” tree for the classification of our sample of massive, blue spheroidal galaxies. The images come fromthe SDSS and are scaled to 40 kpc/h on a side. At the top of each image, we list the name, single-letter designation, and morphologicalclassification from Table 1. The Tppm and morphological characteristics are detailed in Section 2.1. Each large box represents one of theregions of the Balmer-Dn (4000) plane as described in Section 3.1.
∼ 25% of plausible major merger remnants in the local uni-verse.
(ii) Three of the four plausible major mergers in oursample have star-forming optical colours with much bluercentres. Their Balmer absorption and 4000Å break strengthindex values indicative of having centrally-concentratedyoung stellar populations. However, they lack the clear sig-natures of a recent, strong central burst of star formation.Overall, their star formation histories are generally consist-ent with having formed ∼ 5% of their stellar mass in a re-cent, weak burst.
(iii) Two-thirds of our sample of 12 massive (M∗ >
1010M⊙), nearby (z 6 0.03), visually-selected plausible newellipticals with blue-sequence optical colours and varying de-grees of morphological peculiarities are inconsistent with thepredictions from simulations of gas-rich major mergers. Wetherefore find that their mass assembly histories are not well-described by the modern merger hypothesis. Half of thesegalaxies exhibit characteristics seen in remnants of recent,
gas-rich minor mergers and the other half have radial starformation histories consistent with those seen in local qui-escent ellipticals.
We are happy to thank Hans-Walter Rix, Anna Gallazzi,and Enrique Pérez for useful insights and discussions. T.H.acknowledges support from the Missouri Consortium ofNASA’s National Space Grant College and Fellowship Pro-gram. D.H.M. acknowledges support from the ResearchCorporation for Science Advancement under the CottrellCollege Science Award grant No. 10777. Funding for theSDSS has been provided by the Alfred P. Sloan Founda-tion, the Participating Institutions, the National Aeronaut-ics and Space Administration, the National Science Found-ation, the U.S. Department of Energy, the Japanese Mon-bukagakusho, and the Max Planck Society. The SDSS Website is http://www.sdss.org/. The SDSS is managed by theAstrophysical Research Consortium (ARC) for the Parti-cipating Institutions, which are The University of Chicago,Fermilab, the Institute for Advanced Study, the Japan Parti-
c© 0000 RAS, MNRAS 000, 000–000

18 T. Haines et al.
cipation Group, The Johns Hopkins University, Los AlamosNational Laboratory, the Max-Planck-Institute for Astro-nomy (MPIA), the Max-Planck-Institute for Astrophysics(MPA), New Mexico State University, University of Pitts-burgh, Princeton University, the United States Naval Ob-servatory, and the University of Washington. This researchis (partially) based on data from the MILES project. Thispublication also made use of NASA’s Astrophysics Data Sys-tem Bibliographic Services. Based on observations collec-ted at the Centro Astronómico Hispano Alemán (CAHA) atCalar Alto, operated jointly by the Max-Planck Institut fürAstronomie and the Instituto de Astrofísica de Andalucía(CSIC). This paper is (partially) based on data obtainedby the CALIFA Survey, funded by the Spanish Ministry ofScience under grant ICTS-2009-10 [and add-ons], and theCentro Astronómico Hispano-Alemán.
References
Adelman-McCarthy J. K., et al., 2006, The AstrophysicalJournal Supplemental, 162, 38
Bacon R., et al., 2001, Monthly Notices of the Royal As-tronomical Society, 326, 23
Baes M., Sil’chenko O. K., Moiseev A. V., Manakova E. A.,2007, Astronomy and Astrophysics, 467, 991
Baldry I. K., Glazebrook K., Brinkmann J., Ivezić v.,Lupton R. H., Nichol R. C., Szalay A. S., 2004, The As-trophysical Journal, 600, 681
Balogh M. L., Morris S. L., Yee H. K. C., Carlberg R. G.,Ellingson E., 1999, The Astrophysical Journal, 527, 54
Barnes J. E., 1988, The Astrophysical Journal, 331, 699Barnes J. E., 1992, The Astrophysical Journal, 393, 484Barnes J. E., Hernquist L. E., 1991, The AstrophysicalJournal Letters, 370, L65
Barnes J. E., Hernquist L., 1996, The AstrophysicalJournal, 471, 115
Bédorf J., Portegies Zwart S., 2013, Monthly Notices of theRoyal Astronomical Society, 431, 767
Bell E. F., McIntosh D. H., Katz N., Weinberg M. D., 2003,The Astrophysical Journal Supplement Series, 149, 289
Bell E. F., et al., 2004a, The Astrophysical Journal Letters,600, L11
Bell E. F., et al., 2004b, The Astrophysical Journal, 608,752
Bell E. F., et al., 2006, The Astrophysical Journal, 640, 241Bell E. F., Zheng X. Z., Papovich C., Borch A., Wolf C.,Meisenheimer K., 2007, The Astrophysical Journal, 663,834
Bell E. F., et al., 2012, The Astrophysical Journal, 753, 167Bershady M. A., Andersen D. R., Harker J., Ramsey L. W.,Verheijen M. A. W., 2004, Publications of the Astronom-ical Society of the Pacific, 116, 565
Bezanson R., van Dokkum P. G., Tal T., Marchesini D.,Kriek M., Franx M., Coppi P., 2009, The AstrophysicalJournal, 697, 1290
Blanton M. R., 2006, The Astrophysical Journal, 648, 268Blanton M. R., et al., 2005, The Astronomical Journal, 129,2562
Brammer G. B., et al., 2009, The Astrophysical JournalLetters, 706, L173
Brown M. J. I., Dey A., Jannuzi B. T., Brand K., Benson
A. J., Brodwin M., Croton D. J., Eisenhardt P. R., 2007,The Astrophysical Journal, 654, 858
Bruzual G., Charlot S., 2003, Monthly Notices of the RoyalAstronomical Society, 344, 1000
Cappellari M., Copin Y., 2003, Monthly Notices of theRoyal Astronomical Society, 342, 345
Cappellari M., et al., 2011, Monthly Notices of the RoyalAstronomical Society, 413, 813
Charlot S., Fall S. M., 2000, The Astrophysical Journal,539, 718
Cid Fernandes R., et al., 2013, Astronomy & Astrophysics,557, A86
Cortese L., Hughes T. M., 2009, Monthly Notices of theRoyal Astronomical Society, 400, 1225
Cox T. J., Jonsson P., Primack J. R., Somerville R. S.,2006, Monthly Notices of the Royal Astronomical Society,373, 1013
Cox T. J., Jonsson P., Somerville R. S., Primack J. R.,Dekel A., 2008, Monthly Notices of the Royal Astronom-ical Society, 384, 386
Darg D. W., et al., 2010, Monthly Notices of the RoyalAstronomical Society, 401, 1043
Dressler A., Gunn J. E., 1983, The Astrophysical Journal,270, 7
Eliche-Moral M. C., et al., 2010, Astronomy and Astro-physics, 519, 55
Faber S. M., et al., 2007, The Astrophysical Journal, 665,265
Falco E. E., et al., 1999, Publications of the AstronomicalSociety of the Pacific, 111, 438
Fang J. J., Faber S. M., Salim S., Graves G. J., Rich R. M.,2012, The Astrophysical Journal, 761, 23
Feldmann R., Mayer L., Carollo C. M., 2008, The Astro-physical Journal, 684, 1062
Fukugita M., Nakamura O., Turner E. L., Helmboldt J.,Nichol R. C., 2004, The Astrophysical Journal Letters,601, L127
Gallazzi A., Charlot S., Brinchmann J., White S. D. M.,Tremonti C. A., 2005, Monthly Notices of the Royal As-tronomical Society, 362, 41
Gonçalves T. S., Martin D. C., Menéndez-Delmestre K.,Wyder T. K., Koekemoer A., 2012, The AstrophysicalJournal, 759, 67
González Delgado R. M., et al., 2014, Astronomy & Astro-physics, 562, A47
Goto T., 2004, Astronomy and Astrophysics, 427, 125Goto T., Kawai A., Shimono A., Sugai H., Yagi M., Hat-tori T., 2008, Monthly Notices of the Royal AstronomicalSociety, 386, 1355
Hibbard J. E., Yun M. S., 1999, The Astrophysical JournalLetters, 522, L93
Hilz M., Naab T., Ostriker J. P., 2013, Monthly Notices ofthe Royal Astronomical Society, 429, 2924
Holden B. P., van der Wel A., Rix H.-W., Franx M., 2012,The Astrophysical Journal, 749, 96
Hopkins P. F., Hernquist L., Cox T. J., Robertson B.,Springel V., 2006, The Astrophysical Journal SupplementSeries, 163, 50
Hopkins P. F., Hernquist L., Cox T. J., Kereš D., 2008a,The Astrophysical Journal Supplement Series, 175, 356
Hopkins P. F., Cox T. J., Kereš D., Hernquist L., 2008b,The Astrophysical Journal Supplement Series, 175, 390
c© 0000 RAS, MNRAS 000, 000–000
Testing the Modern Merger Hypothesis 19
Husemann B., et al., 2013, Astronomy and Astrophysics,549, 87
Kauffmann G., White S. D. M., Guiderdoni B., 1993,Monthly Notices of the Royal Astronomical Society, 264,201
Kauffmann G., et al., 2003a, Monthly Notices of the RoyalAstronomical Society, 341, 33
Kauffmann G., et al., 2003b, Monthly Notices of the RoyalAstronomical Society, 341, 54
Kaviraj S., Peirani S., Khochfar S., Silk J., Kay S., 2009,Monthly Notices of the Royal Astronomical Society, 394,1713
Kawata D., Mulchaey J. S., Gibson B. K., Sánchez-Blázquez P., 2006, The Astrophysical Journal, 648, 969
Kelz A., et al., 2006, Publications of the Astronomical So-ciety of the Pacific, 118, 129
Khochfar S., Burkert A., 2003, The Astrophysical JournalLetters, 597, L117
Khochfar S., Silk J., 2006, The Astrophysical Journal Let-ters, 648, L21
Kim D., Im M., 2013, The Astrophysical JournalKormendy J., 2009, in The Elliptical-Spheroidal andElliptical-Elliptical Galaxy Dichotomies. p. 87
La Barbera F., De Carvalho R. R., De La Rosa I. G., GalR. R., Swindle R., Lopes P. A. A., 2010, The AstronomicalJournal, 140, 1528
Lee J. H., Lee M. G., Hwang H. S., 2006, The AstrophysicalJournal, 650, 148
Lee J. H., et al., 2013, The Astrophysical Journal Letters,762, L4
Lotz J. M., Jonsson P., Cox T. J., Primack J. R., 2008,Monthly Notices of the Royal Astronomical Society, 391,1137
Lotz J. M., Jonsson P., Cox T. J., Croton D., PrimackJ. R., Somerville R. S., Stewart K., 2011, The Astrophys-ical Journal, 742, 103
Martin D. C., et al., 2007, The Astrophysical Journal Sup-plement Series, 173, 342
Martini P., Dicken D., Storchi-Bergmann T., 2013, The As-trophysical Journal, 766, 121
Mast D., et al., 2014, Astronomy & Astrophysics, 561, A129McIntosh D. H., et al., 2014, Monthly Notices of the RoyalAstronomical Society, 442, 533
Michard R., Prugniel P., 2004, Astronomy and Astrophys-ics, 423, 833
Mihos J. C., Hernquist L., 1996, The AstrophysicalJournal, 464, 641
Moustakas J., et al., 2013, The Astrophysical Journal, 767,50
Naab T., Ostriker J. P., 2009, The Astrophysical Journal,690, 1452
Naab T., Khochfar S., Burkert A., 2006, The AstrophysicalJournal Letters, 636, L81
Naab T., Johansson P. H., Ostriker J. P., 2009, The Astro-physical Journal Letters, 699, L178
Norton S. A., Gebhardt K., Zabludoff A. I., Zaritsky D.,2001, The Astrophysical Journal, 557, 150
Oser L., Naab T., Ostriker J. P., Johansson P. H., 2012,The Astrophysical Journal, 744, 63
Papaderos P., et al., 2013, Astronomy and Astrophysics,555, L1
Pracy M. B., Owers M. S., Couch W. J., Kuntschner H.,
Bekki K., Briggs F., Lah P., Zwaan M., 2012, MonthlyNotices of the Royal Astronomical Society, 420, 2232
Rosales-Ortega F. F., Kennicutt R. C., Sánchez S. F.,Díaz A. I., Pasquali A., Johnson B. D., Hao C. N., 2010,Monthly Notices of the Royal Astronomical Society, 405,735
Roth M. M., et al., 2005, Publications of the AstronomicalSociety of the Pacific, 117, 620
Rothberg B., Joseph R. D., 2006a, The AstronomicalJournal, 131, 185
Rothberg B., Joseph R. D., 2006b, The AstronomicalJournal, 132, 976
Salim S., Rich R. M., 2010, The Astrophysical Journal Let-ters, 714, L290
Sánchez S. F., 2006, Astronomische Nachrichten, 327, 850Sánchez-Blázquez P., Gorgas J., Cardiel N., 2006, Astro-nomy and Astrophysics, 457, 823
Sánchez-Blázquez P., Gibson B. K., Kawata D., CardielN., Balcells M., 2009, Monthly Notices of the Royal As-tronomical Society, 400, 1264
Sánchez S. F., et al., 2004, The Astrophysical Journal, 614,586
Sánchez S. F., Rosales-Ortega F. F., Kennicutt R. C., John-son B. D., Diaz A. I., Pasquali A., Hao C. N., 2011,Monthly Notices of the Royal Astronomical Society, 410,313
Sánchez S. F., et al., 2012, Astronomy and Astrophysics,538, 8
Schawinski K., Thomas D., Sarzi M., Maraston C., KavirajS., Joo S.-J., Yi S. K., Silk J., 2007, Monthly Notices ofthe Royal Astronomical Society, 382, 1415
Schawinski K., et al., 2009, Monthly Notices of the RoyalAstronomical Society, 396, 818
Schawinski K., Dowlin N., Thomas D., Urry C. M., Ed-mondson E., 2010, The Astrophysical Journal Letters,714, L108
Schawinski K., et al., 2014, Monthly Notices of the RoyalAstronomical Society, 440, 889
Schlegel D. J., Finkbeiner D. P., Davis M., 1998, The As-trophysical Journal, 500, 525
Schweizer F., 1996, The Astronomical Journal, 111, 109Serra P., Trager S. C., 2007, Monthly Notices of the RoyalAstronomical Society, 374, 769
Shabala S. S., et al., 2012, Monthly Notices of the RoyalAstronomical Society, pp no–no
Shapiro K. L., et al., 2010, Monthly Notices of the RoyalAstronomical Society, 402, 2140
Skelton R. E., Bell E. F., Somerville R. S., 2009, The As-trophysical Journal Letters, 699, L9
Snyder G. F., Cox T. J., Hayward C. C., Hernquist L.,Jonsson P., 2011, The Astrophysical Journal, 741, 77
Springel V., Di Matteo T., Hernquist L., 2005, The Astro-physical Journal Letters, 620, L79
Stoughton C., et al., 2002, The Astronomical Journal, 123,485
Strateva I., et al., 2001, The Astronomical Journal, 122,1861
Struck C., Smith B. J., 2012, Monthly Notices of the RoyalAstronomical Society, 422, 2444
Sturch L. K., Madore B. F., 2012, in TYPHOON observa-tions of the Lindsay-Shapley Ring. pp 180–182
Thilker D. A., et al., 2010, The Astrophysical Journal Let-
c© 0000 RAS, MNRAS 000, 000–000

20 T. Haines et al.
ters, 714, L171Tojeiro R., et al., 2013, Monthly Notices of the Royal As-tronomical Society, 432, 359
Toomre A., Toomre J., 1972, The Astrophysical Journal,178, 623
Trager S. C., Faber S. M., Worthey G., González J. J.,2000a, The Astronomical Journal, 119, 1645
Trager S. C., Faber S. M., Worthey G., González J. J.,2000b, The Astronomical Journal, 120, 165
Trujillo I., et al., 2006, The Astrophysical Journal, 650, 18Trujillo I., Conselice C. J., Bundy K., Cooper M. C., Eisen-hardt P., Ellis R. S., 2007, Monthly Notices of the RoyalAstronomical Society, 382, 109
Vazdekis A., Sánchez-Blázquez P., Falcón-Barroso J., Cen-arro A. J., Beasley M. A., Cardiel N., Gorgas J., PeletierR. F., 2010, Monthly Notices of the Royal AstronomicalSociety, 404, 1639
Weijmans A., et al., 2009, Monthly Notices of the RoyalAstronomical Society, 398, 561
White S. D. M., Rees M. J., 1978, Monthly Notices of theRoyal Astronomical Society, 183, 341
Wild V., Walcher C. J., Johansson P. H., Tresse L., CharlotS., Pollo A., Le Fèvre O., de Ravel L., 2009, MonthlyNotices of the Royal Astronomical Society, 395, 144
Worthey G., Ottaviani D. L., 1997, The AstrophysicalJournal Supplement Series, 111, 377
Yang X., Mo H. J., van den Bosch F. C., Pasquali A., LiC., Barden M., 2007, The Astrophysical Journal, 671, 153
Yi S. K., et al., 2005, The Astrophysical Journal Letters,619, L111
York D. G., et al., 2000, The Astronomical Journal, 120,1579
van Dokkum P. G., 2001, Publications of the AstronomicalSociety of the Pacific, 113, 1420
van Dokkum P. G., 2005, The Astronomical Journal, 130,2647
APPENDIX A: CONSTRUCTING BURST
MODELS
A key prediction of the modern merger hypothesis is thatmerging galaxies with favourable gas dynamics undergo acentrally-concentrated burst of star formation. To determ-ine if the SFHs of our observed galaxies are consistent withthis scenario, we construct a suite of synthetic SEDs thatmodel the abrupt change in star formation during the mer-ger process. We begin with a continuous SFH model assum-ing an exponentially-decreasing star-formation rate (SFR),SFRbg (t) = α0e
−t/τ0 , where α0 is the SFR at t = 0 and τ0 isthe characteristic time. Atop this background of continuousstar formation, we add Gaussians of fixed widths and amp-litudes to model the bursts during the merger process. Tomake our models as realistic as possible, we use two bursts:a small-amplitude, large width (i.e., long-lasting) burst rep-resenting star formation induced by tidal interaction, and asecond burst with large-amplitude and small width repres-enting the starburst induced by coalescence (see Figure A1).The modern merger hypothesis also predicts the ignition ofan active galactic nucleus (AGN) that provides a source ofenergetic feedback to quench star formation in the galaxy.To model this AGN, we impose an exponentially-decreasing
SFR once the second burst has reached its peak to quenchthe star formation.
Using ti for the time of tidal interaction and tc for thetime of coalescence, the SFR due to both bursts is given by
SFRb (t) = [Gi +Gc] g (t)
with
Gx (t) = αx exp
− (t− tx)2 /2σ2
x
and
g (t) =
1 t < tc
exp −t/τb t > tc
where tx is one of ti or tc, αx is the burst amplitude att = tx, σx is the width of the respective burst, and τb isthe characteristic time for the exponentially-declining SFRof the burst at coalescence. The fraction of stars formed (bymass) during the burst, Fburst, is defined as
Fburst =stellarmass formed during burst
total stellarmass.
Incorporating our definitions from above, this becomes
Fburst =
´ tft0
SFRb (t) dt´ tft0
SFRbg (t) + SFRb (t) dt
=
´ tft0
[Gi +Gc] g (t) dt´ tft0
[α0 exp −t/τ0+Gi +Gc] g (t) dt(A1)
where SFRbg is the star formation rate of the backgroundmodel. We assume that this background star formation con-tinues during the burst such that the total number of starsformed is the background star formation plus the two bursts.
Clearly, there are many parameters to be tuned in thisformula. We choose to keep constant the widths of thebursts and the characteristic time of the background starformation. Specifically, we assume a total galaxy lifetimetf = tc + 3Gyrs, a characteristic time of τ0 = 2.5Gyrs forthe background star formation, an interaction time of ti =tc − 250Myrs, an interaction burst width of σi = 750Myrs,and a coalescence burst width of σc = 100Myrs. These para-meters are consistent with the results of gas-rich major mer-ger simulations from Cox et al. (2008). Finally, we normalizethe total (background plus bursts) star formation such thata mass of Mtot is formed.
The amplitudes of the Gaussian bursts are independentof time, so we can rearrange the integrals in Equation A1using the substitutions
γ1 =
ˆ tf
t0
exp
− (t− ti)2 /2σ2
i
g (t) dt
γ2 =
ˆ tf
t0
exp
− (t− tc)2 /2σ2
c
g (t) dt
γ3 =
ˆ tf
t0
exp −t/τ0 g (t) dt
to generate a set of simple algebraic expressions to constrainthe peak SFR parameters α0, αc, and αi such that
αiγ1 + αcγ2 = Mtot − α0γ3
αiγ1 + αcγ2 =Fburst
1− Fburstα0γ3
If we assume the peak SFR of the interaction and coalescence
c© 0000 RAS, MNRAS 000, 000–000
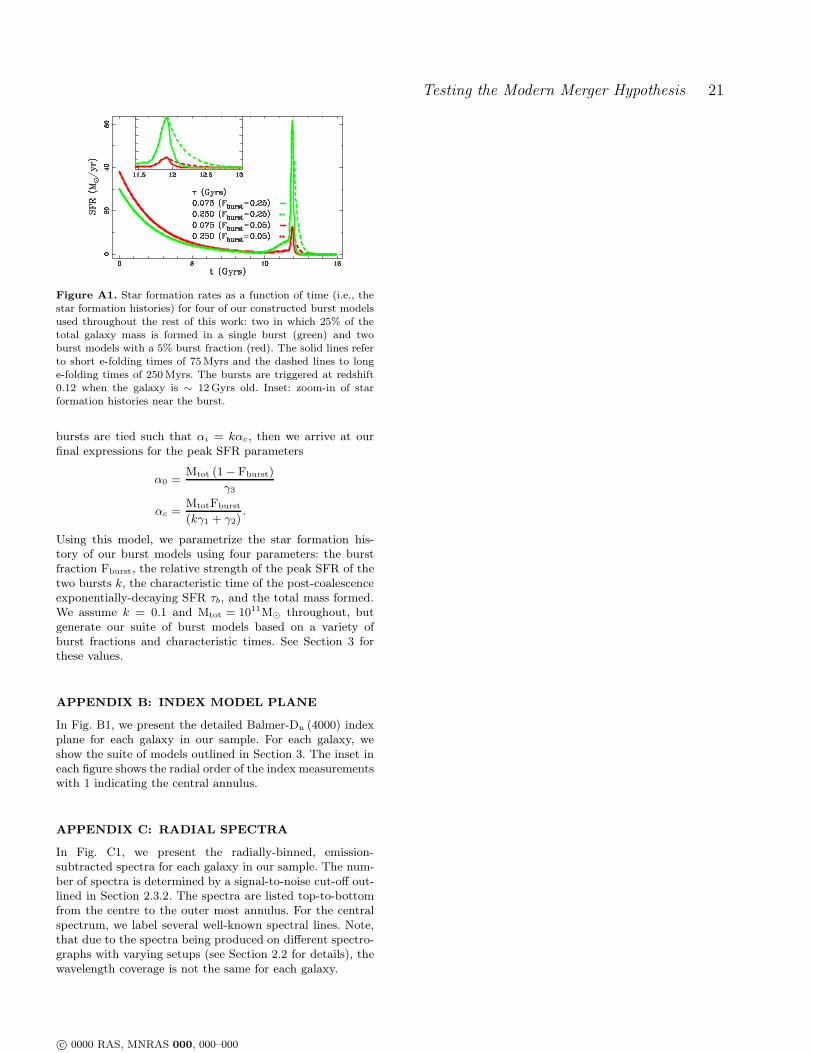
Testing the Modern Merger Hypothesis 21
Figure A1. Star formation rates as a function of time (i.e., thestar formation histories) for four of our constructed burst modelsused throughout the rest of this work: two in which 25% of thetotal galaxy mass is formed in a single burst (green) and twoburst models with a 5% burst fraction (red). The solid lines referto short e-folding times of 75Myrs and the dashed lines to longe-folding times of 250Myrs. The bursts are triggered at redshift0.12 when the galaxy is ∼ 12Gyrs old. Inset: zoom-in of starformation histories near the burst.
bursts are tied such that αi = kαc, then we arrive at ourfinal expressions for the peak SFR parameters
α0 =Mtot (1− Fburst)
γ3
αc =MtotFburst
(kγ1 + γ2).
Using this model, we parametrize the star formation his-tory of our burst models using four parameters: the burstfraction Fburst, the relative strength of the peak SFR of thetwo bursts k, the characteristic time of the post-coalescenceexponentially-decaying SFR τb, and the total mass formed.We assume k = 0.1 and Mtot = 1011M⊙ throughout, butgenerate our suite of burst models based on a variety ofburst fractions and characteristic times. See Section 3 forthese values.
APPENDIX B: INDEX MODEL PLANE
In Fig. B1, we present the detailed Balmer-Dn (4000) indexplane for each galaxy in our sample. For each galaxy, weshow the suite of models outlined in Section 3. The inset ineach figure shows the radial order of the index measurementswith 1 indicating the central annulus.
APPENDIX C: RADIAL SPECTRA
In Fig. C1, we present the radially-binned, emission-subtracted spectra for each galaxy in our sample. The num-ber of spectra is determined by a signal-to-noise cut-off out-lined in Section 2.3.2. The spectra are listed top-to-bottomfrom the centre to the outer most annulus. For the centralspectrum, we label several well-known spectral lines. Note,that due to the spectra being produced on different spectro-graphs with varying setups (see Section 2.2 for details), thewavelength coverage is not the same for each galaxy.
c© 0000 RAS, MNRAS 000, 000–000
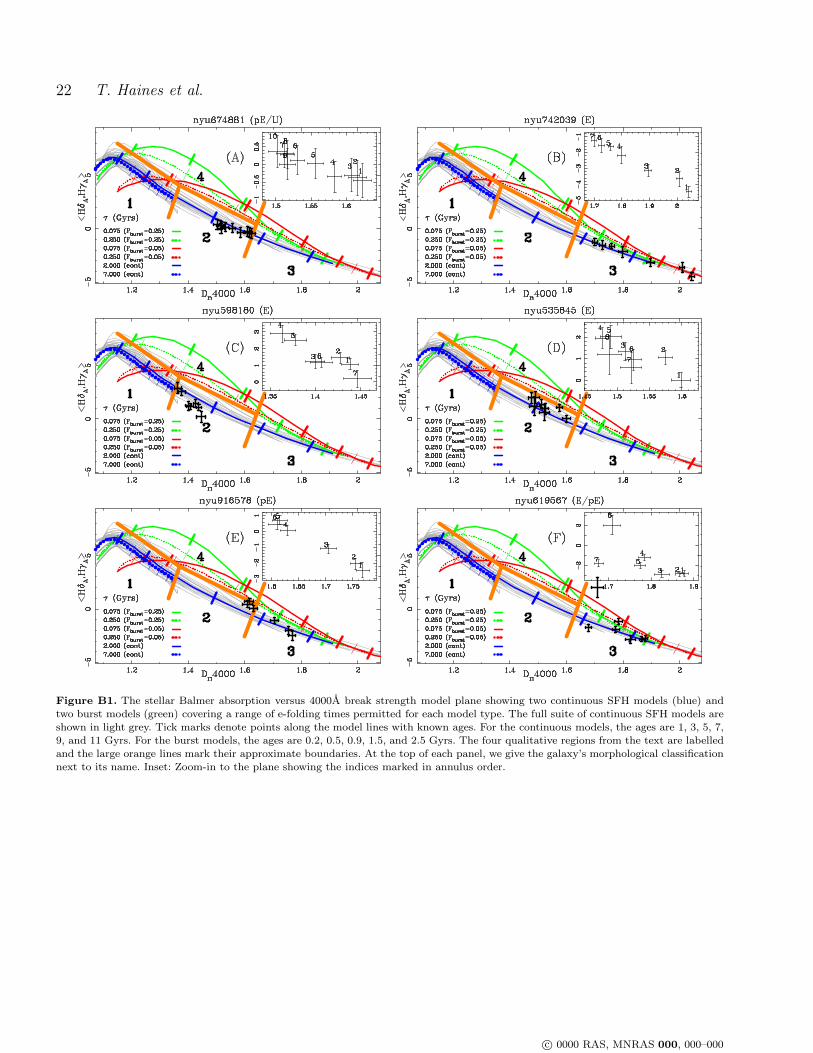
22 T. Haines et al.
Figure B1. The stellar Balmer absorption versus 4000Å break strength model plane showing two continuous SFH models (blue) andtwo burst models (green) covering a range of e-folding times permitted for each model type. The full suite of continuous SFH models areshown in light grey. Tick marks denote points along the model lines with known ages. For the continuous models, the ages are 1, 3, 5, 7,9, and 11 Gyrs. For the burst models, the ages are 0.2, 0.5, 0.9, 1.5, and 2.5 Gyrs. The four qualitative regions from the text are labelledand the large orange lines mark their approximate boundaries. At the top of each panel, we give the galaxy’s morphological classificationnext to its name. Inset: Zoom-in to the plane showing the indices marked in annulus order.
c© 0000 RAS, MNRAS 000, 000–000

Testing the Modern Merger Hypothesis 23
Figure B1. (cont.)
c© 0000 RAS, MNRAS 000, 000–000
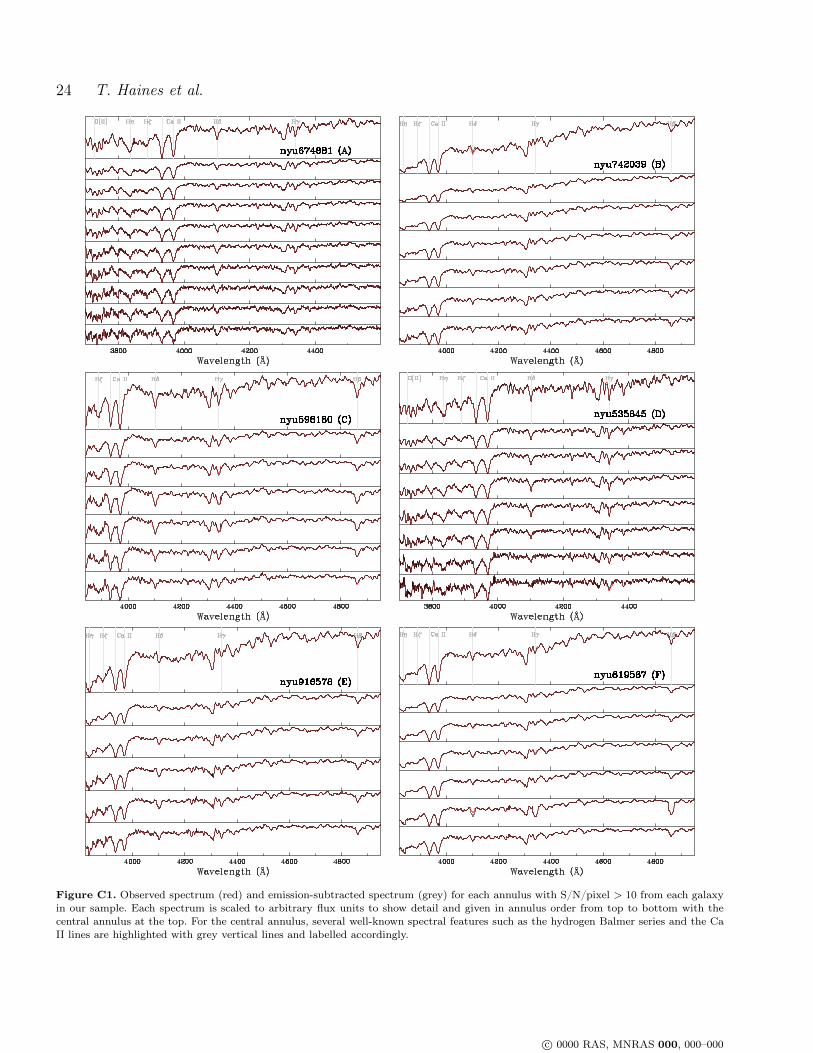
24 T. Haines et al.
Figure C1. Observed spectrum (red) and emission-subtracted spectrum (grey) for each annulus with S/N/pixel > 10 from each galaxyin our sample. Each spectrum is scaled to arbitrary flux units to show detail and given in annulus order from top to bottom with thecentral annulus at the top. For the central annulus, several well-known spectral features such as the hydrogen Balmer series and the CaII lines are highlighted with grey vertical lines and labelled accordingly.
c© 0000 RAS, MNRAS 000, 000–000

Testing the Modern Merger Hypothesis 25
Figure C1. (cont.)
c© 0000 RAS, MNRAS 000, 000–000