Embed Size (px)
Citation preview


Bionatura – Jurnal Ilmu-ilmu Hayati dan Fisik
ISSN 1411 - 0903
Vol. 13, No. 2, Juli 2011 : 157 - 167
ROCK DISCONTINUITY PATTERNS DEVELOPMENT ALONG
CRUSHED ZONES SEPARATED BY FAULT MOVEMENT
Hendarmawan, Hirnawan, F., and Muslim, D.
Faculty of Geological Sciences and Engineering Padjadjaran University
E-mail: [email protected]
ABSTRACT
Multivariate analysis was applied to rock-discontinuities taken from areas, in which folded
and faulted sedimentary rocks occur. The purpose of the analysis is to verify the responses of these
discontinuities to faults, from which the really existing fault can be delineated and mechanism and
intensity of the deformation on Tertiary sediments underlying Quaternary sediments can be revealed
that explain the intensity of neotectonism as the deformation continued on the Quaternary deposits.
The sample parameters consist of strike and dip of both bedding planes and left also right diagonal
joint sets respectively. From every site of two study areas two sample groups were taken from two
rock-blocks separated by a fault. The analyses on the six parameters of the samples exhibit the
contribution of each parameter to the rejection of the hypotheses of no effect of fault can be examined,
which lead into a conclusion about how far does the parameter indicate the existing fault. The
conclusion in Study Area 1 is that both right and left joint sets are significantly affected by reverse
fault, suggesting that these two joint sets in uplifted rock-block were still affected by the folding
process after reverse movement of the fault. Then, in Study Area 2, means of strike of bedding planes
and right joint set significantly differ as a result of left lateral-slip fault certainly moving along a
fractured zone.
Key words: Discontinuity responses to fault, mechanism of deformation, intensity of deformation,
neotectonism
PERKEMBANGAN POLA DISKONTINUITAS BATUAN DI SEPANJANG
ZONA HANCURAN YANG DIPISAHKAN PERGERAKAN SESAR
ABSTRAK
Analisis multivariat digunakan terhadap sampel-sampel diskontinutitas batuan yang diambil dari
wilayah sebaran batuan sedimen terlipat dan tersesarkan. Maksud analisis ini adalah untuk
memverifikasi respons pola diskontinuitas pada batuan atas sesar-sesar, sehingga keberadaan sesar-
sesar itu dapat didelineasi dan mekanisme juga intensitas deformasi pada batuan Tersier ini di bawah
sediment Kuarter dapat diungkapkan yang menjelaskan intensitas neotektonisme sebagaimana
deformasi tersebut menerus pada sedimen Kuarter. Parameter sample-sampel meliputi jurus dan
kemiringan baik bidang perlapisan maupun kelompok/kerabat kekar diagonal kiri dan kanan. Dari
setiap tapak dari dua daerah studi masing-masing dua kelompok sampel diambil dari dua blok batuan
yang masing-masing terpisah oleh sesar. Analisis terhadap enam parameter sampel-sampel itu
menunjukan kontribusi tiap parameter terhadap penolakan hipotesis ketiadaan pengaruh sesar dapat
diperiksa, yang mengarah kepada kesimpulan sampai sejauh mana keberadaan sesar-sesar terkait.
Kesimpulan dari Daerah Studi 1 ialah bahwa baik kelompok kekar diagonal kiri maupun kanan secara
nyata dipengaruhi oleh sesar naik, yang menunjukkan bahwa kedua kelompok kekar itu masih terlibat
proses perlipatan setelah pergerakan sesar naik. Kemudian, di Daerah Studi 2 rata-rata jurus perlapisan
dan rata-rata kekar diagonal kanan dari masing-masing blok batuan sangat berbeda sebagai akibat
pergerakan sesar sinistral di sepanjang zona hancuran.
Kata kunci: Respons diskontinuitas atas sesar, mekanisme deformasi, intensitas deformasi,
Neotektonisme
INTRODUCTION
Bedding-planes, joints and faults,
known as rock discontinuities, are usually
studied by mapping. Data of the
discontinuities are plotted on a topographic
base-map and reconstructed to become a
structural geologic map. This map enables
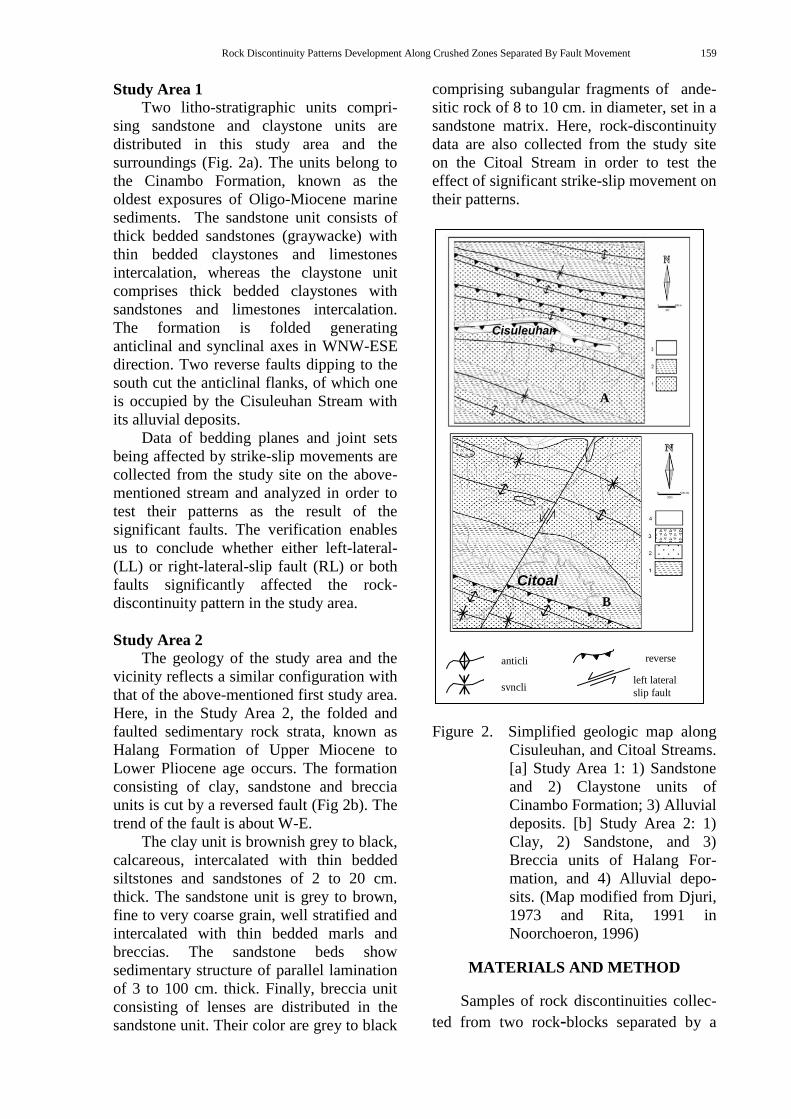
158 Hendarmawan, Hirnawan, F., and Muslim, D.
the geologists to interpret a phenomenon of
a tectonic mechanism, in which the folded
and faulted rock strata involved. Any kind
of fault, its distribution and relation among
the fault, joint sets and bedding- plane
pattern can also be understood by
conventionally applying stress analysis
method and stereographic projection or
Schmidt Net Diagram (De Sitter, 1956;
Moody & Hill, 1956; Hills, 1972; Price &
Cosgrove, 1990; etc.).
In this paper, in order to verify and
measure the bedding-plane and joint pat-
terns in an anticlinal structure generated in
two separated rock-blocks as a results of
reverse and/or strike-slip movement(s) in
term of the effects of faults on bedding
planes and joint sets, a multivariate analysis
of differences between two means is
employed. The objective of this analysis is
to verify and measure the responses of joint
sets and bedding planes to faults, which has
not been able to be computed by using the
above-mentioned diagram.
Geology
The Study Areas 1 and 2 are located in
Sub-district of Ciniru, Regency of Kuning-
an, eastern West Java, Indonesia (Fig.1).
Geology of the area and its vicinity is
characterized by folded and faulted Tertiary
turbidite sedimentary rock strata consisting
of well stratified sandstone and claystone
intercalation of Oligo-Miocene to Lower
Pliocene age. This entire region is cut by
two major reverse fault zones known as
Baribis-Majenang Fault and Citanduy Fault.
The trends of the fault zones and the
anticlinal axes are WNW-ESE and NW-SE.
The geology of each study area and the
vicinity is discussed below.
Figure 1. Locations of the study areas in Geological Structure Map of West Java, Indonesia
(Soehaimi. 1990)

Rock Discontinuity Patterns Development Along Crushed Zones Separated By Fault Movement 159
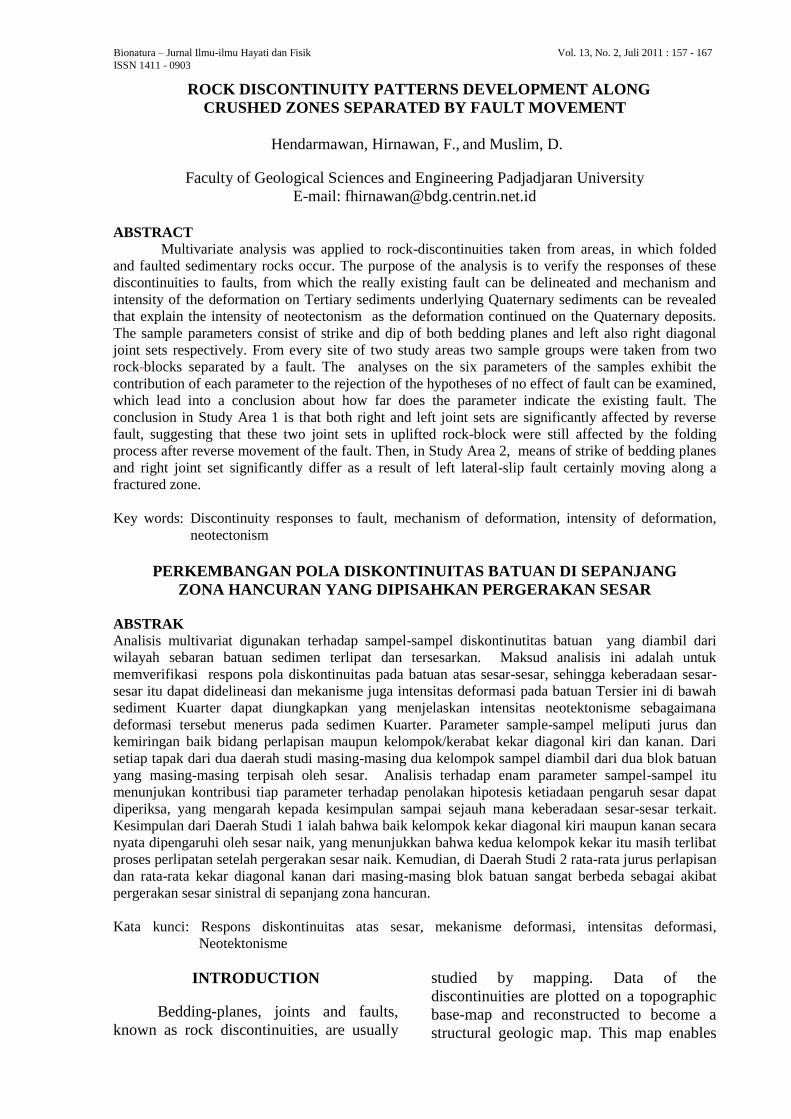
Study Area 1
Two litho-stratigraphic units compri-
sing sandstone and claystone units are
distributed in this study area and the
surroundings (Fig. 2a). The units belong to
the Cinambo Formation, known as the
oldest exposures of Oligo-Miocene marine
sediments. The sandstone unit consists of
thick bedded sandstones (graywacke) with
thin bedded claystones and limestones
intercalation, whereas the claystone unit
comprises thick bedded claystones with
sandstones and limestones intercalation.
The formation is folded generating
anticlinal and synclinal axes in WNW-ESE
direction. Two reverse faults dipping to the
south cut the anticlinal flanks, of which one
is occupied by the Cisuleuhan Stream with
its alluvial deposits.
Data of bedding planes and joint sets
being affected by strike-slip movements are
collected from the study site on the above-
mentioned stream and analyzed in order to
test their patterns as the result of the
significant faults. The verification enables
us to conclude whether either left-lateral-
(LL) or right-lateral-slip fault (RL) or both
faults significantly affected the rock-
discontinuity pattern in the study area.
Study Area 2
The geology of the study area and the
vicinity reflects a similar configuration with
that of the above-mentioned first study area.
Here, in the Study Area 2, the folded and
faulted sedimentary rock strata, known as
Halang Formation of Upper Miocene to
Lower Pliocene age occurs. The formation
consisting of clay, sandstone and breccia
units is cut by a reversed fault (Fig 2b). The
trend of the fault is about W-E.
The clay unit is brownish grey to black,
calcareous, intercalated with thin bedded
siltstones and sandstones of 2 to 20 cm.
thick. The sandstone unit is grey to brown,
fine to very coarse grain, well stratified and
intercalated with thin bedded marls and
breccias. The sandstone beds show
sedimentary structure of parallel lamination
of 3 to 100 cm. thick. Finally, breccia unit
consisting of lenses are distributed in the
sandstone unit. Their color are grey to black
comprising subangular fragments of ande-
sitic rock of 8 to 10 cm. in diameter, set in a
sandstone matrix. Here, rock-discontinuity
data are also collected from the study site
on the Citoal Stream in order to test the
effect of significant strike-slip movement on
their patterns.
Figure 2. Simplified geologic map along
Cisuleuhan, and Citoal Streams.
[a] Study Area 1: 1) Sandstone
and 2) Claystone units of
Cinambo Formation; 3) Alluvial
deposits. [b] Study Area 2: 1)
Clay, 2) Sandstone, and 3)
Breccia units of Halang For-
mation, and 4) Alluvial depo-
sits. (Map modified from Djuri,
1973 and Rita, 1991 in
Noorchoeron, 1996)
MATERIALS AND METHOD
Samples of rock discontinuities collec-
ted from two rock-blocks separated by a
Cisuleuhan
Citoal
anticline
syncline
reverse
fault left lateral
slip fault
A
B
160 Hendarmawan, Hirnawan, F., and Muslim, D.
fault were measured in Study Areas 1 and 2
(Figure 1). The discontinuities generated
in anticlinal flanks (Figure 3) comprise
strike and dip of both bedding planes and
left and right diagonal joints. In these study
areas, in which the anticlinal flanks are cut
by reverse faults strike-slip movements also
maybe occur. They are either left- (LL) or
right-lateral slip faults (RL) or both LL and
RL. For the purpose of inferring which joint
sets significantly differ each other and thus
verify the occurrence of the existing fault
that may be drawn in the geologic map, a
multivariate analysis is employed.
Multivariate Test of Differences
In order to test the differences between
two means of rock discontinuity and
structural patterns, in term of strike and dip
of joints and bedding planes, because of the
effect of fault(s) on them, multivariate test
by Rencher (1995) and Kramer (1972) were
utilized.
In the case of p-variate observation, for
example, from two multivariate popula-
tions, the above-mentioned rock disconti-
nuety data may be arranged as in Table 1. In
this table, the first subscript indicates the
treatment or condition, the second subscript
indicates the experimental element or
number of observation that has been
measured, and the superscript indicates the
characteristic measured. These data may
also be arranged as the p-dimensional
vectors (Kramer, 1972)
Simultaneous Confidence Intervals
In the case of two treatments, involving
unpaired data, when more than one
measurement is made on each experimental
unit, simultaneous confidence intervals
may be constructed for the purpose of
inferring which components of the mean
vectors differ with treatments and thus
contribute to the rejection of Ho : 1 = 2.
This procedure is calculated later in Results
and Discussion by using the sample
evidence from study site in Study Area 1.
RESULTS AND DISCUSSION
Study Area 1
Discontinuity samples taken from two
rock-blocks at study site in Study Area 1,
which are plotted as poles in the Schmidt
Net Diagram (Fig. 4), are arranged as in
Table 1. The data comprises two groups of
discontinuity. Group 1 and 2 consist of six
characteristics, for examples, y1(1)
j, … , y1 (6)
j, and y2 (1)
j, … , y2 (6)
j. The respective
variables, such as given in the table, are
strike and dip of bedding plane, angular
distance of joint (left and right joint sets
LJS and RJS; see Fig. 3) from strike of
bedding plane as the acute angle, and dip of
joint from vertical plane (see Fig. 5). These
variables are calculated as the following
examples (Hirnawan, 1987; see also Table
1): y1(1)
1 = 285
o (strike of bedding plane N
285oE); y1
(2)1= 66
o (dip of bedding plane
66o); y1
(3)1 = 75
o (strike of right joint RJ is
180o; the acute angle from strike of bedding
plane is 75o); y1
(4)1
= 19
o (dip of RJ is 71
o ;
angle from the vertical line is 19o); y1
(5)1=
63o (strike of left joint LJ is 222
o; the acute
angle from strike of bedding plane is
63o);y1
(6)1= 7
o (dip of RJ is 83
o; angle from
the vertical line is 7o).
The hypothesis is Ho: 1= 2. The
covariance matrices for group 1 and 2 being
constructed are presented below.
The determinants areS1= 2.8218 x
109, S2= 7.6764 x 10
8, and S= 3.0870
x 1010
respectively. Based on the
determinants and data in Table 1 the
hypothesis Ho: can be tested as
follow.
According to Kramer (1972) from
equation M = (n1+n2-2)log S - (n11) log
S1 - (n2 -1) log S2 we find M = (30)
(10.48954) - (15) (9.45053) (15) (8.885158)
= 39.65088, and from equation m = 1 –
[1/(n1-1) + 1/(n2-1) – 1/(n1+n2-2)][(2p2+3p-
1)/6(p+1)] we find m = 1 – [1/15 +1/15
– 1/30] [(2(62)+(3)(9)-1)/6(7)] = 0.788095,
then we find from equation 2.3026 mM =
71.953165, and since 2
(21 ; .05) that may be
looked up as T2
(21,) .05 = 32.667, there is
sample evidence to reject the hypothesis Ho;
so, the matrices group 1 and 2 are not equal.
Rock Discontinuity Patterns Development Along Crushed Zones Separated By Fault Movement 161
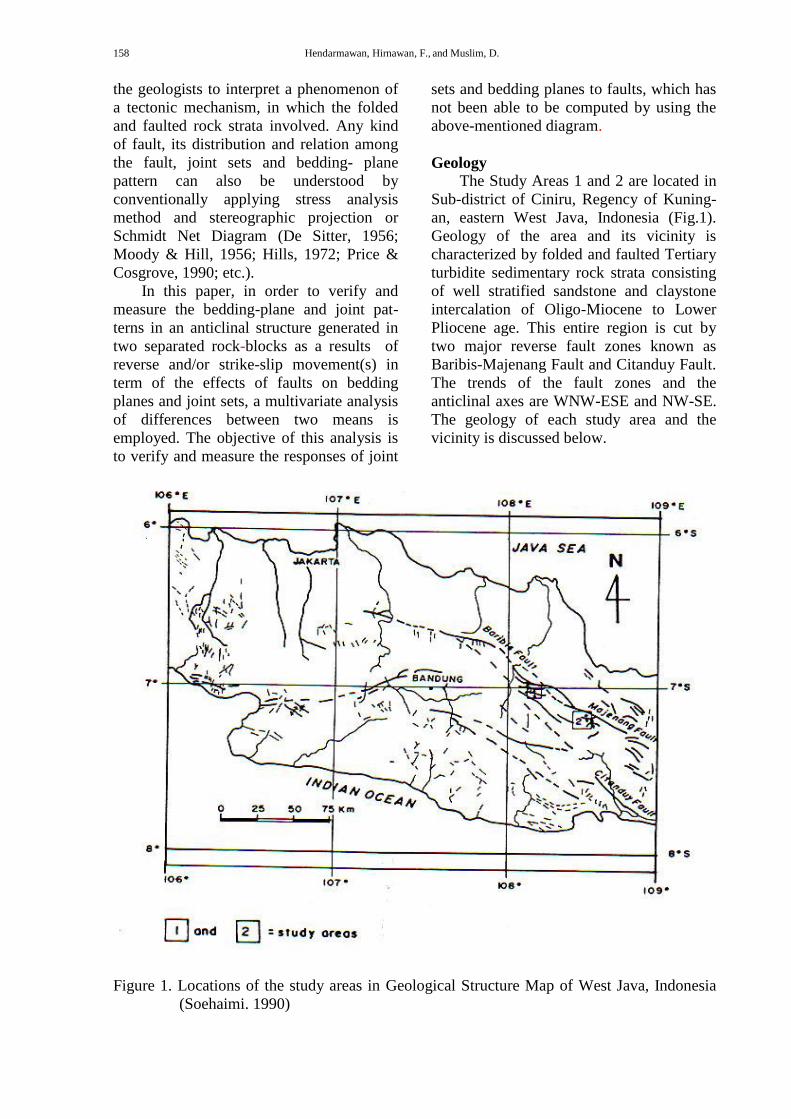
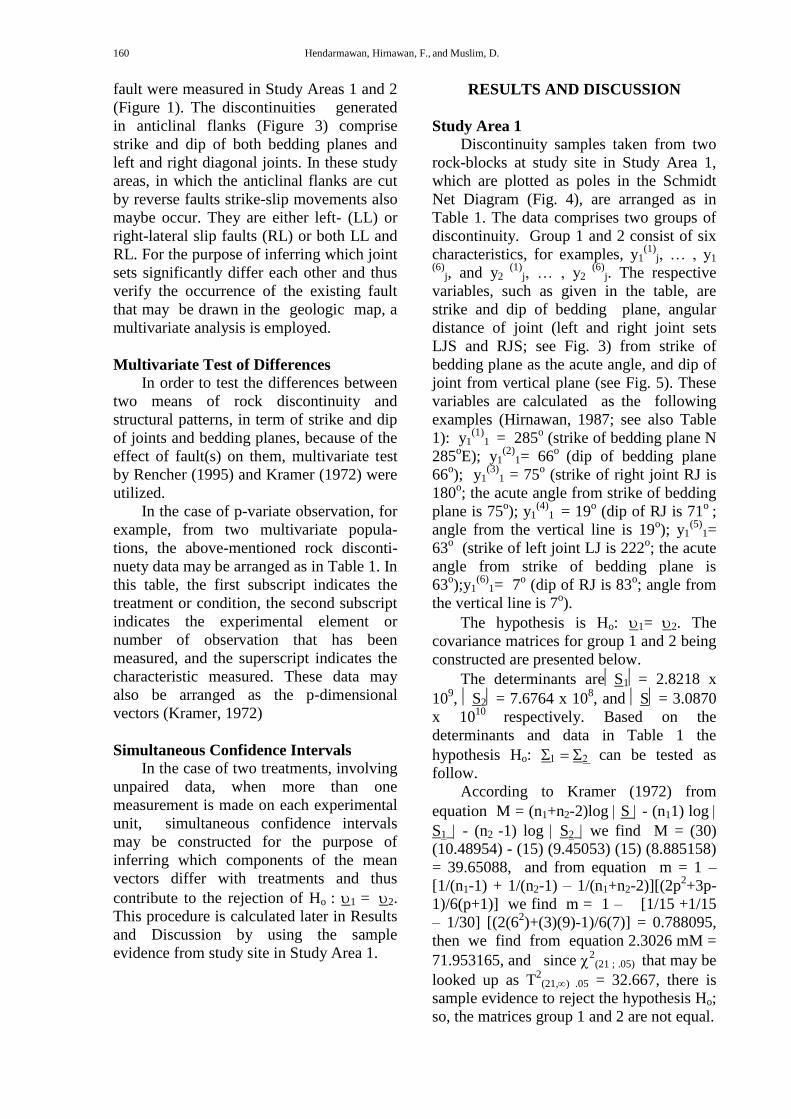
Figure 3. Joint pattern in anticline as a result of folding (after: Billing, 1986; Price &
Cosgrove, 1991; McClay, 1995). 1) longitudinal joints; 2) transverse joints; 3)
diagonal joints. Diagonal joints are of two trends known as left joint set (LJS) and
as right joint set (RJS) which may develop into right lateral-slip fault (dextral) and
left lateral-slip fault (sinistral) respectively (Hills, 1972). The respective 1 and 3
are maximum and minimum principle stresses.
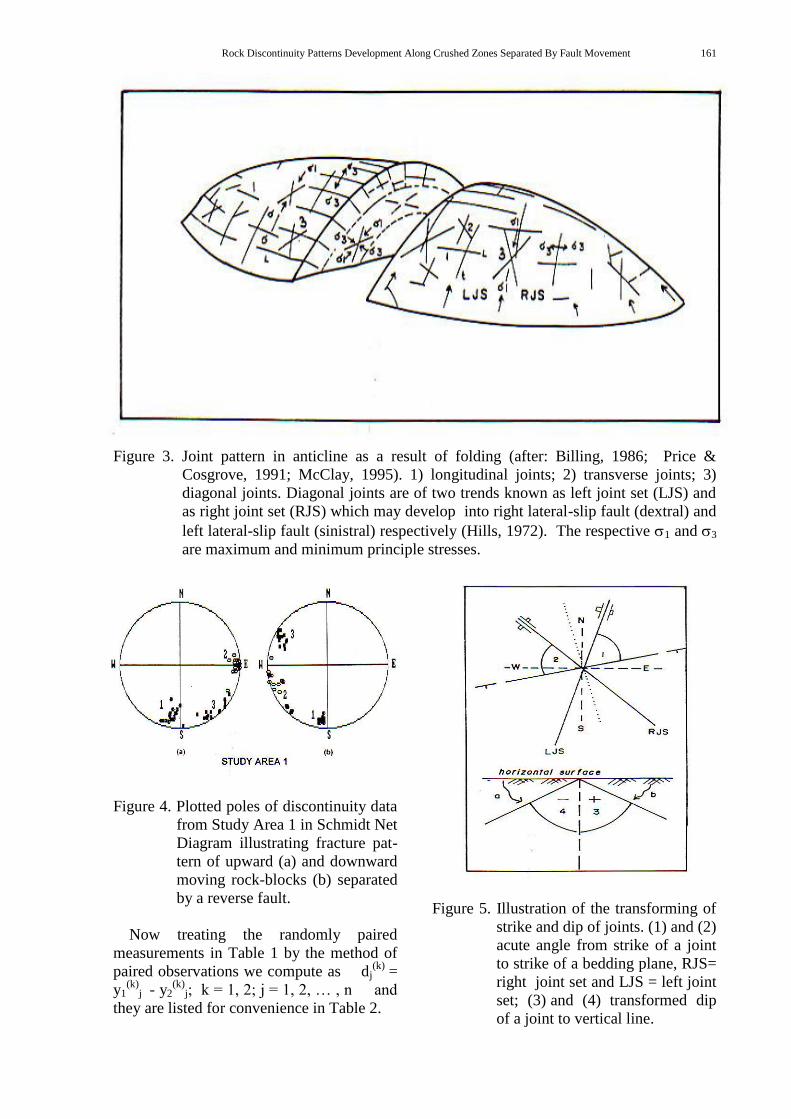
Figure 4. Plotted poles of discontinuity data
from Study Area 1 in Schmidt Net
Diagram illustrating fracture pat-
tern of upward (a) and downward
moving rock-blocks (b) separated
by a reverse fault.
Now treating the randomly paired
measurements in Table 1 by the method of
paired observations we compute as dj(k)
=
y1(k)
j - y2(k)
j; k = 1, 2; j = 1, 2, … , n and
they are listed for convenience in Table 2.
Figure 5. Illustration of the transforming of
strike and dip of joints. (1) and (2)
acute angle from strike of a joint
to strike of a bedding plane, RJS=
right joint set and LJS = left joint
set; (3) and (4) transformed dip
of a joint to vertical line.
162 Hendarmawan, Hirnawan, F., and Muslim, D.
Table 1. Transformed discontinuity data from two rock-blocks separated by reversed fault in
Study Area 1 along Cisuleuhan Stream.
Upward moving rock-block Downward moving rock-block
No Y1(1)
Y1(2)
Y1(3)
Y1(4)
Y1(5)
Y1(6)
No Y2(1)
Y2(2)
Y2(3)
Y2(4)
Y2(5)
Y1(6)
1 285 66 75 19 63 7 1 275 66 77 11 74 41
2 290 71 72 23 62 9 2 279 71 71 18 78 32
3 277 62 89 21 48 9 3 280 62 65 2 68 27
4 282 70 84 27 66 23 4 274 70 80 9 60 30
5 277 56 78 23 39 14 5 276 56 74 12 60 17
6 282 56 82 14 42 21 6 275 51 65 30 66 39
7 276 51 74 24 34 19 7 274 62 66 38 65 25
8 281 62 76 24 36 20 8 276 61 66 37 64 28
9 280 61 77 24 30 33 9 274 68 36 20 59 10
10 288 68 67 35 46 15 10 278 63 37 18 64 11
11 275 50 82 11 57 18 11 278 62 38 19 66 15
12 282 52 73 18 46 25 12 279 67 62 18 69 18
13 285 35 78 27 18 14 13 274 58 58 25 69 38
14 270 41 88 6 60 19 14 274 62 63 14 67 26
15 280 46 79 7 61 14 15 276 63 60 20 65 38
16 274 45 86 10 34 30 16 278 70 68 14 67 25
(Data source : Noorchoeron, 1996)
The covariance matrices for group 1 and 2 mentioned earlier being constructed are:
S1
=
28.067 31.067 -22.867 26.718 4.367 -13.633
31.067 115.000 -23.200 47.083 61.167 -15.567
-22.867 -23.200 37.133 -28.850 10.767 7.033
26.718 47.083 -28.850 64.929 -35.958 -7.742
4.367 61.167 10.767 -35.958 198.783 -38.917
-13.633 -15.567 7.033 -7.742 -38.917 53.183
And
S2 =
4.467 2.800 -3.300 -7.417 4.117 -5.533
2.800 29.133 4.300 -18.817 5.983 -9.667
-3.300 4.300 183.717 -21.642 18.192 84.500
-7.417 -18.817 -21.642 93.262 -4.287 9.050
4.117 5.983 18.192 -4.287 24.096 24.050
-5.533 -9.667 84.500 9.050 24.050 99.133
Then S is found to be
S =
16.267 16.933 -13.088 9.650 4.242 -9.583
16.934 72.067 -9.450 14.133 33.575 -12.617
-13.083 -9.450 110.425 -25.246 14.479 45.767
-9.650 14.133 -25.246 79.096 -20.123 0.654
4.242 33.575 14.479 -20.123 111.440 -7.433
-9.583 -12.617 45.767 0.654 -7.433 76.158
Explanation :
y1(j)
and y2(j)
= variables representing upward and downward moving rock-blocks
y1(1)
and y2(1)
= strike of bedding planes
y1(2)
and y2(2)
= dip of bedding planes
y1(3)
and y2(3)
= acute angle from strike of right joint to strike of bedding plane
y1(4)
and y2(4)
= dip of right joint from vertical line
y1(5)
and y2(5)
= acute angle from strike of left joint to strike of bedding plane
y1(6)
and y2(6)
= dip of left joint from vertical line
Rock Discontinuity Patterns Development Along Crushed Zones Separated By Fault Movement 163
Table 2. Differences dj(1)
, … , and dj(6)
computed from data in Table 1.
No. dj
(1) dj
(2) dj
(3) dj
(4) dj
(5) dj
(6)
1 10.000 0.000 -2.000 8.000 -11.000 -34.000
2 11.000 0.000 1.000 5.000 -16.000 -23.000
3 -3.000 0.000 24.000 19.000 -20.000 -18.000
4 8.000 0.000 4.000 18.000 6.000 -7.000
5 1.000 0.000 4.000 11.000 -21.000 -3.000
6 7.000 5.000 17.000 -16.000 -24.000 -18.000
7 2.000 -11.000 8.000 -14.000 -31.000 -6.000
8 5.000 1.000 10.000 -13.000 -28.000 -8.000
9 6.000 -7.000 41.000 4.000 -29.000 23.000
10 10.000 5.000 30.000 17.000 -18.000 4.000
11 -3.000 -12.000 44.000 -8.000 -9.000 3.000
12 3.000 -15.000 11.000 0.000 -23.000 7.000
13 11.000 -23.000 20.000 2.000 -51.000 -24.000
14 -4.000 -21.000 25.000 -8.000 -7.000 -7.000
15 4.000 -17.000 19.000 -13.000 -4.000 -24.000
16 -4.000 -25.000 18.000 -4.000 -33.000 5.000
Total
Mean
64.000
4.000
-120.000
-7.500
274.000
17.125
8.000
0.500
-319.000
-19.937
-130.000
-8.125
Other computation for finding the covariance matrix are performed as before by using
these calculated differences, leading to the quantities.
S =
29.333 24.000 -25.667 15.467 -7.067 -27.867
24.000 104.933 -35.067 47.800 36.633 -20.467
-25.667 -35.067 181.450 -16.467 -16.675 107.750
15.467 47.800 -16.467 142.267 30.567 5.933
-7.067 38.633 -16.675 30.567 182.996 -23.325
-27.867 -20.467 107.750 5.933 -23.325 217.583
and
S-1
=
0.0535 -0.0110 0.0025 0.0033 0.0058 0.0053
-0.0110 0.0147 0.0013 -0.0029 -0.0030 -0.0009
0.0025 0.0013 0.0084 0.0004 0.0001 -0.0037
-0.0033 -0.0029 0.0004 0.0087 -0.0011 -0.0012
0.0058 -0.0030 0.0001 -0.0011 0.0067 0.0012
0.0053 -0.0009 -0.0037 -0.0012 0.0012 0.0072
from which we compute, for the statistic T
2(p, n-1) = nD
2, the value
T2
(6,15) = 16(4.000, -7.500, 17.125, 0.500, -19.938, -8.125) S-1
= 113.110.
Now T2
(6,15)(0.01) = 48.472, so there is sample evidence for rejecting hypothesis Ho: υ1 =
υ2, meaning that at least there is one variable which contributes to reject the hypothesis. So,
simultaneous confidence intervals should be constructed for inferring which variable(s) of the
mean vectors differ with treatments as a result of the effects of fault(s) movement. From the
equation as
a = c d’- c S c’ [(n1+n2)/n1n2)]T2
(p,n1+n2-2)(α)
b = c d’+ c S c’ [(n1+n2)/n1n2)]T2
(p,n1+n2-2)(α)
4.000
-7.500
17.125
0.500
-19.938
-8.125
164 Hendarmawan, Hirnawan, F., and Muslim, D.
c S c’ = (1,0,0,0,0,0)
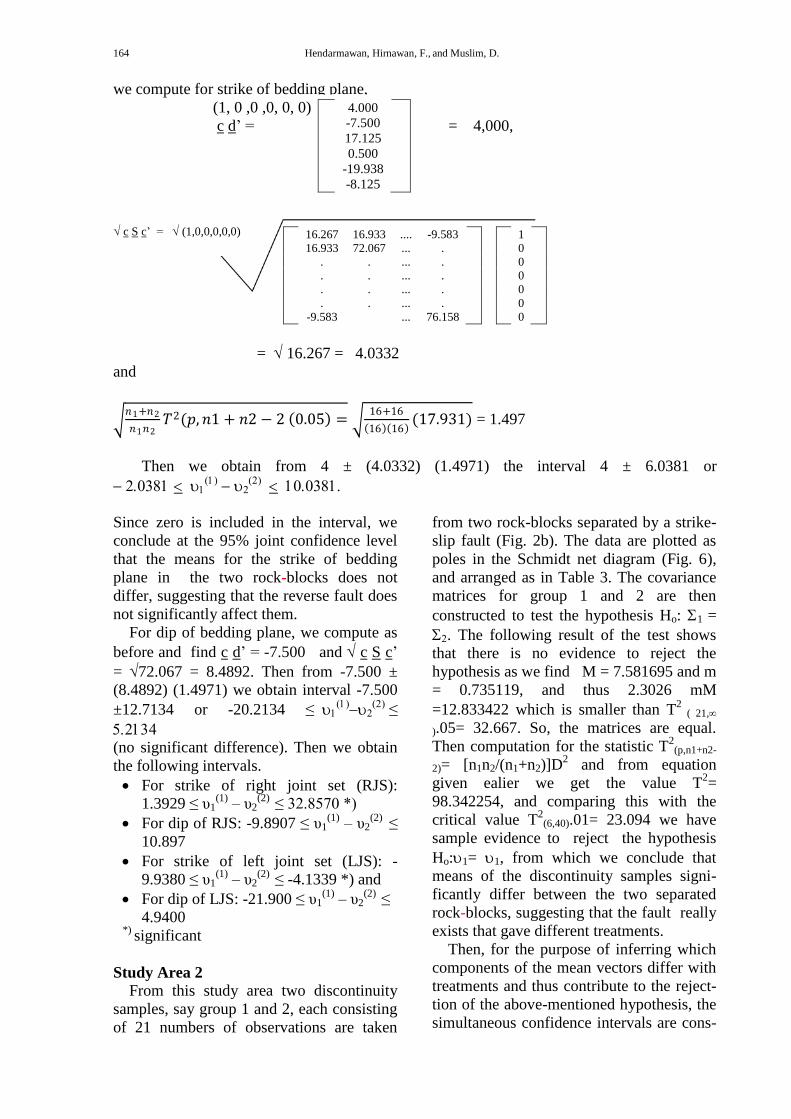
we compute for strike of bedding plane,
(1, 0 ,0 ,0, 0, 0)
c d’ = = 4,000,
16.267 16.933 .... -9.583 1 16.933 72.067 ... . 0 . . ... . 0 . . ... . 0 . . ... . 0 . . ... . 0 -9.583 ... 76.158 0
= 16.267 = 4.0332
and
𝑛1+𝑛2
𝑛1𝑛2𝑇2(𝑝, 𝑛1 + 𝑛2 − 2 0.05 =
16+16
16 16 (17.931) = 1.497
Then we obtain from 4 ± (4.0332) (1.4971) the interval 4 ± 6.0381 or
Since zero is included in the interval, we
conclude at the 95% joint confidence level
that the means for the strike of bedding
plane in the two rock-blocks does not
differ, suggesting that the reverse fault does
not significantly affect them.
For dip of bedding plane, we compute as
before and find c d’ = -7.500 and c S c’
= 72.067 = 8.4892. Then from -7.500 ±
(8.4892) (1.4971) we obtain interval -7.500
±12.7134 or -20.2134 ≤
≤
(no significant difference). Then we obtain
the following intervals.
For strike of right joint set (RJS):
1.3929 ≤ υ1(1)
– υ2(2)
≤ 32.8570 *)
For dip of RJS: -9.8907 ≤ υ1(1)
– υ2(2)
≤
10.897
For strike of left joint set (LJS): -
9.9380 ≤ υ1(1)
– υ2(2)
≤ -4.1339 *) and
For dip of LJS: -21.900 ≤ υ1(1)
– υ2(2)
≤
4.9400 *)
significant
Study Area 2
From this study area two discontinuity
samples, say group 1 and 2, each consisting
of 21 numbers of observations are taken
from two rock-blocks separated by a strike-
slip fault (Fig. 2b). The data are plotted as
poles in the Schmidt net diagram (Fig. 6),
and arranged as in Table 3. The covariance
matrices for group 1 and 2 are then
constructed to test the hypothesis Ho: 1 =
. The following result of the test shows
that there is no evidence to reject the
hypothesis as we find M = 7.581695 and m
= 0.735119, and thus 2.3026 mM
=12.833422 which is smaller than T2
( 21,
).05= 32.667. So, the matrices are equal.
Then computation for the statistic T2
(p,n1+n2-
2)= [n1n2/(n1+n2)]D2 and from equation
given ealier we get the value T2=
98.342254, and comparing this with the
critical value T2
(6,40).01= 23.094 we have
sample evidence to reject the hypothesis
Ho:1= 1, from which we conclude that
means of the discontinuity samples signi-
ficantly differ between the two separated
rock-blocks, suggesting that the fault really
exists that gave different treatments.
Then, for the purpose of inferring which
components of the mean vectors differ with
treatments and thus contribute to the reject-
tion of the above-mentioned hypothesis, the
simultaneous confidence intervals are cons-
4.000
-7.500
17.125
0.500
-19.938
-8.125
Rock Discontinuity Patterns Development Along Crushed Zones Separated By Fault Movement 165
tructed and the given following intervals are
listed as in Table 4.
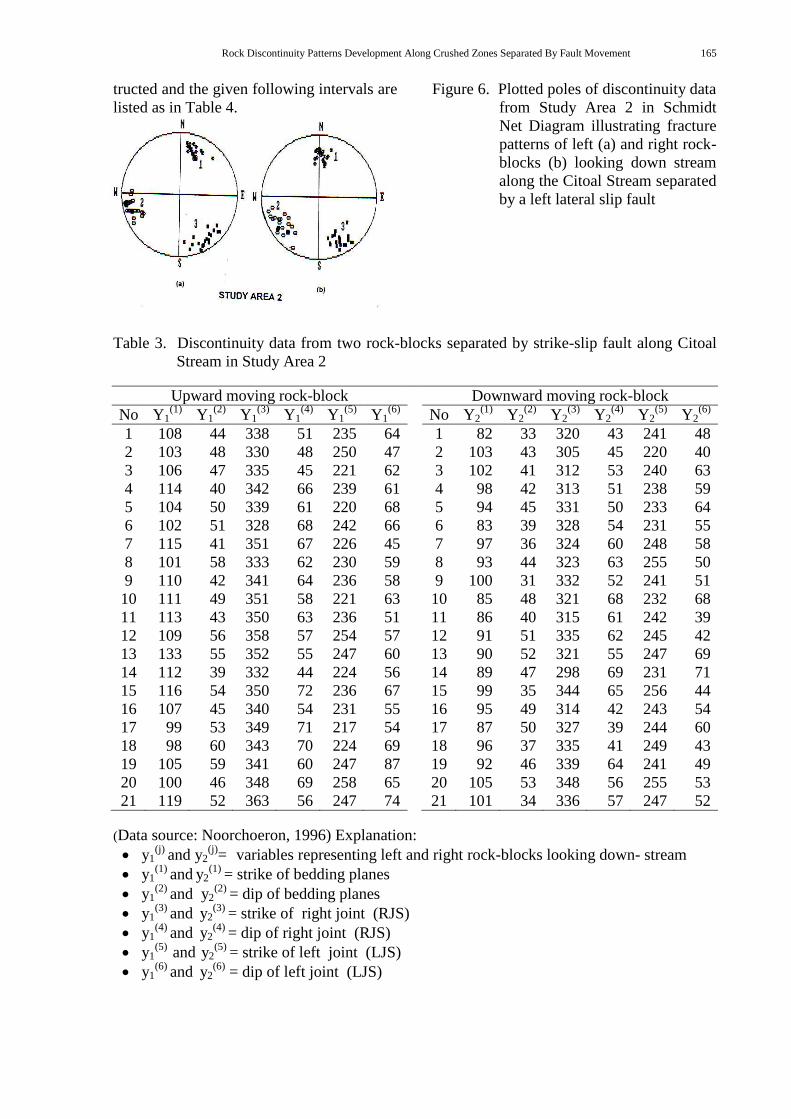
Figure 6. Plotted poles of discontinuity data
from Study Area 2 in Schmidt
Net Diagram illustrating fracture
patterns of left (a) and right rock-
blocks (b) looking down stream
along the Citoal Stream separated
by a left lateral slip fault
Table 3. Discontinuity data from two rock-blocks separated by strike-slip fault along Citoal
Stream in Study Area 2
Upward moving rock-block Downward moving rock-block
No Y1(1)
Y1(2)
Y1(3)
Y1(4)
Y1(5)
Y1(6)
No Y2(1)
Y2(2)
Y2(3)
Y2(4)
Y2(5)
Y2(6)
1 108 44 338 51 235 64 1 82 33 320 43 241 48
2 103 48 330 48 250 47 2 103 43 305 45 220 40
3 106 47 335 45 221 62 3 102 41 312 53 240 63
4 114 40 342 66 239 61 4 98 42 313 51 238 59
5 104 50 339 61 220 68 5 94 45 331 50 233 64
6 102 51 328 68 242 66 6 83 39 328 54 231 55
7 115 41 351 67 226 45 7 97 36 324 60 248 58
8 101 58 333 62 230 59 8 93 44 323 63 255 50
9 110 42 341 64 236 58 9 100 31 332 52 241 51
10 111 49 351 58 221 63 10 85 48 321 68 232 68
11 113 43 350 63 236 51 11 86 40 315 61 242 39
12 109 56 358 57 254 57 12 91 51 335 62 245 42
13 133 55 352 55 247 60 13 90 52 321 55 247 69
14 112 39 332 44 224 56 14 89 47 298 69 231 71
15 116 54 350 72 236 67 15 99 35 344 65 256 44
16 107 45 340 54 231 55 16 95 49 314 42 243 54
17 99 53 349 71 217 54 17 87 50 327 39 244 60
18 98 60 343 70 224 69 18 96 37 335 41 249 43
19 105 59 341 60 247 87 19 92 46 339 64 241 49
20 100 46 348 69 258 65 20 105 53 348 56 255 53
21 119 52 363 56 247 74 21 101 34 336 57 247 52
(Data source: Noorchoeron, 1996) Explanation:
y1(j)
and y2(j)
= variables representing left and right rock-blocks looking down- stream
y1(1)
and y2(1)
= strike of bedding planes
y1(2)
and y2(2)
= dip of bedding planes
y1(3)
and y2(3)
= strike of right joint (RJS)
y1(4)
and y2(4)
= dip of right joint (RJS)
y1(5)
and y2(5)
= strike of left joint (LJS)
y1(6)
and y2(6)
= dip of left joint (LJS)
164 Hendarmawan, Hirnawan, F., and Muslim, D.
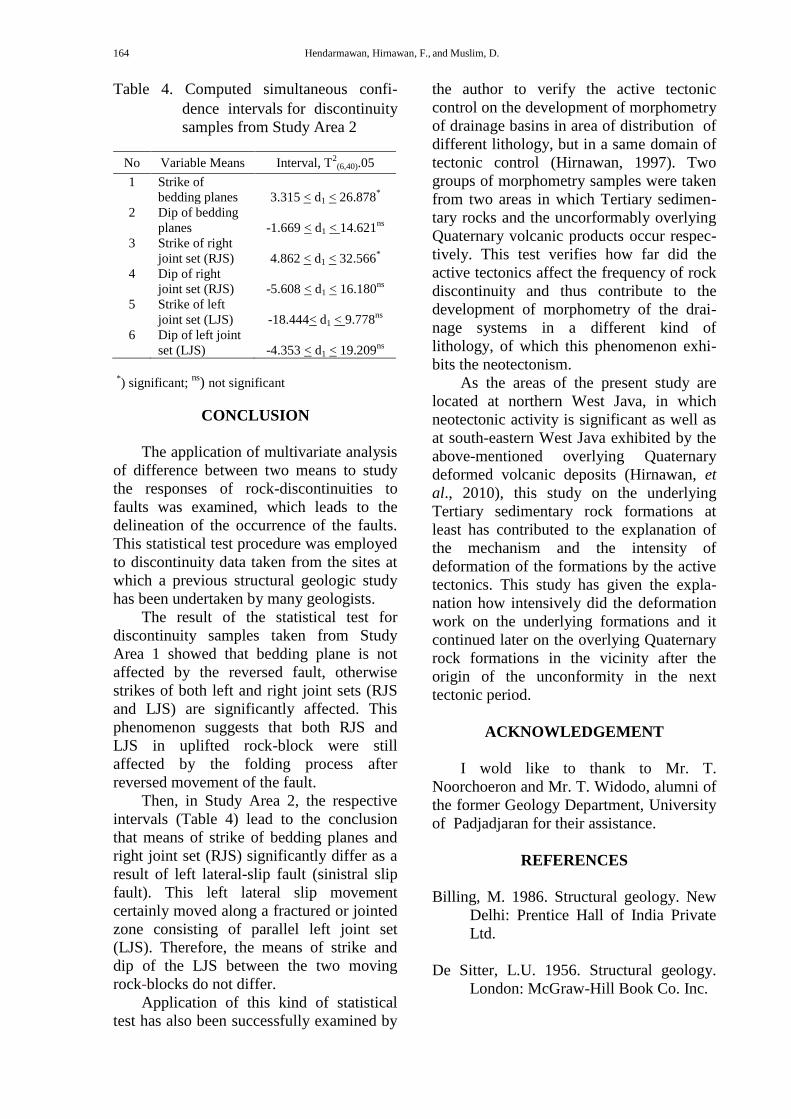
Table 4. Computed simultaneous confi-
dence intervalsfor discontinuity
samples from Study Area 2
No Variable Means Interval, T2
(6,40).05
1 Strike of
bedding planes 3.315 < d1 < 26.878*
2 Dip of bedding
planes -1.669 < d1 < 14.621ns
3 Strike of right
joint set (RJS) 4.862 < d1 < 32.566*
4 Dip of right
joint set (RJS) -5.608 < d1 < 16.180ns
5 Strike of left
joint set (LJS) -18.444< d1 < 9.778ns
6 Dip of left joint
set (LJS) -4.353 < d1 < 19.209ns
*) significant;
ns) not significant
CONCLUSION
The application of multivariate analysis
of difference between two means to study
the responses of rock-discontinuities to
faults was examined, which leads to the
delineation of the occurrence of the faults.
This statistical test procedure was employed
to discontinuity data taken from the sites at
which a previous structural geologic study
has been undertaken by many geologists.
The result of the statistical test for
discontinuity samples taken from Study
Area 1 showed that bedding plane is not
affected by the reversed fault, otherwise
strikes of both left and right joint sets (RJS
and LJS) are significantly affected. This
phenomenon suggests that both RJS and
LJS in uplifted rock-block were still
affected by the folding process after
reversed movement of the fault.
Then, in Study Area 2, the respective
intervals (Table 4) lead to the conclusion
that means of strike of bedding planes and
right joint set (RJS) significantly differ as a
result of left lateral-slip fault (sinistral slip
fault). This left lateral slip movement
certainly moved along a fractured or jointed
zone consisting of parallel left joint set
(LJS). Therefore, the means of strike and
dip of the LJS between the two moving
rock-blocks do not differ.
Application of this kind of statistical
test has also been successfully examined by
the author to verify the active tectonic
control on the development of morphometry
of drainage basins in area of distribution of
different lithology, but in a same domain of
tectonic control (Hirnawan, 1997). Two
groups of morphometry samples were taken
from two areas in which Tertiary sedimen-
tary rocks and the uncorformably overlying
Quaternary volcanic products occur respec-
tively. This test verifies how far did the
active tectonics affect the frequency of rock
discontinuity and thus contribute to the
development of morphometry of the drai-
nage systems in a different kind of
lithology, of which this phenomenon exhi-
bits the neotectonism.
As the areas of the present study are
located at northern West Java, in which
neotectonic activity is significant as well as
at south-eastern West Java exhibited by the
above-mentioned overlying Quaternary
deformed volcanic deposits (Hirnawan, et
al., 2010), this study on the underlying
Tertiary sedimentary rock formations at
least has contributed to the explanation of
the mechanism and the intensity of
deformation of the formations by the active
tectonics. This study has given the expla-
nation how intensively did the deformation
work on the underlying formations and it
continued later on the overlying Quaternary
rock formations in the vicinity after the
origin of the unconformity in the next
tectonic period.
ACKNOWLEDGEMENT
I wold like to thank to Mr. T.
Noorchoeron and Mr. T. Widodo, alumni of
the former Geology Department, University
of Padjadjaran for their assistance.
REFERENCES
Billing, M. 1986. Structural geology. New
Delhi: Prentice Hall of India Private
Ltd.
De Sitter, L.U. 1956. Structural geology.
London: McGraw-Hill Book Co. Inc.
Rock Discontinuity Patterns Development Along Crushed Zones Separated By Fault Movement 165
Hill, E.S.. 1972. Elements of structural
geology. London: Chapman & Hall
Ltd. & Science Paperbacks.
Hirnawan, R.F. 1987. The effect of reversed
fault on strike/dip of bedding planes
and joints in Halang Formation in
Bantarujeg, West Java. RISET –
Geologi dan Pertamb. 8(2):31- 40.
Hirnawan, R.F. 1997. The characteristics of
morphometry of drainage systems in
area of distribution of different
lithology in the same domain of active
tectonic control. BPPT Analisis
Sistem. IV(9): 66-67.
Hirnawan, F., Muslim, D., & Sukiyah, E.
2010. A measure of intense active
tectonism through manifestation of
river basin morphometry development
on Quaternary volcanic deposits: Case
study at Ciremai and Slamet Volca-
noes. Proceeding of the XXIV FIG
International Congress on geodetic
survey, Sydney, Australia, April 11-
16.
Kramer, C.Y. 1972. A first course in
multivariate analysis. Virginia:
Virginia Polytechnics Institute &
State University.
McClay. 1995. The mapping of geological
structures. Geological Society of
London Handbook. New York: John
Wiley & Sons.
Moody, J.D. & Hill, M.J. 1956. Wrench-
fault tectonics. Bulletin of Geological
Society of America, 67(9):1207-1246.
Noorchoeron, T. 1996. Strike and dip of
bedding plane of rocks and joints,
lineaments, and drainage pattern due to
reverse fault in Cinangka area, Regency
of Majalengka, Province of West Java
University of Padjadjaran.
Price, N.J. & Cosgrove, J.W. 1990.
Analysis of geological structures.
Cambridge: Cambridge University
Press.
Rencher, A.C. 1995. Methods of multi-
variate analysis. New York: Wiley
Series in Probability and Mathematical
Statistics.