Embed Size (px)
Citation preview
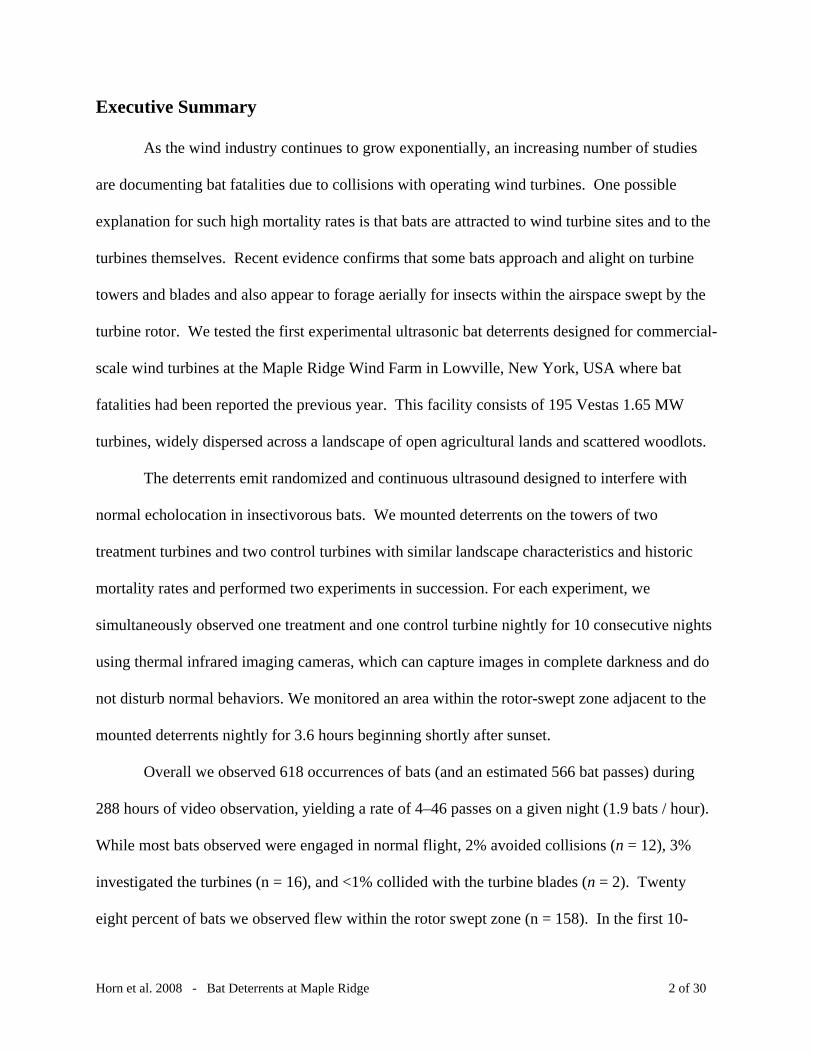
Testing the effectiveness of an experimental acoustic bat deterrent at the Maple Ridge wind farm
Jason W. Horn1, Edward B. Arnett2, Mark Jensen3 and Thomas H. Kunz1
1 Center for Ecology and Conservation Biology, Boston University, Department of Biology, 5 Cummington Street, Boston, MA 02215, USA
2 Bat Conservation International, P.O. Box 162603, Austin, TX 78716, USA
3 Binary Acoustic Technology, 11250 E. Michelle Lane, Tucson, AZ 85748, USA
Report Prepared for:
The Bats and Wind Energy Cooperative and Bat Conservation International, Austin, TX
24 June 2008
Horn et al. 2008 - Bat Deterrents at Maple Ridge 1 of 30
Executive Summary
As the wind industry continues to grow exponentially, an increasing number of studies
are documenting bat fatalities due to collisions with operating wind turbines. One possible
explanation for such high mortality rates is that bats are attracted to wind turbine sites and to the
turbines themselves. Recent evidence confirms that some bats approach and alight on turbine
towers and blades and also appear to forage aerially for insects within the airspace swept by the
turbine rotor. We tested the first experimental ultrasonic bat deterrents designed for commercial-
scale wind turbines at the Maple Ridge Wind Farm in Lowville, New York, USA where bat
fatalities had been reported the previous year. This facility consists of 195 Vestas 1.65 MW
turbines, widely dispersed across a landscape of open agricultural lands and scattered woodlots.
The deterrents emit randomized and continuous ultrasound designed to interfere with
normal echolocation in insectivorous bats. We mounted deterrents on the towers of two
treatment turbines and two control turbines with similar landscape characteristics and historic
mortality rates and performed two experiments in succession. For each experiment, we
simultaneously observed one treatment and one control turbine nightly for 10 consecutive nights
using thermal infrared imaging cameras, which can capture images in complete darkness and do
not disturb normal behaviors. We monitored an area within the rotor-swept zone adjacent to the
mounted deterrents nightly for 3.6 hours beginning shortly after sunset.
Overall we observed 618 occurrences of bats (and an estimated 566 bat passes) during
288 hours of video observation, yielding a rate of 4–46 passes on a given night (1.9 bats / hour).
While most bats observed were engaged in normal flight, 2% avoided collisions (n = 12), 3%
investigated the turbines (n = 16), and <1% collided with the turbine blades (n = 2). Twenty
eight percent of bats we observed flew within the rotor swept zone (n = 158). In the first 10-
Horn et al. 2008 - Bat Deterrents at Maple Ridge 2 of 30
night test, we observed a total of 131 bats ( x = 13.1, SD = 5.5) at the deterrent-treated turbine
versus 244 bats ( x = 24.4, SD = 12.9) at the control turbine - a statistically significant difference
(t = 2.54, p = 0.026). However, during the second test, there was no significant difference in bat
activity between the treatment ( x = 9.5 SD = 8.3) and control ( x = 9.6, SD = 4.8) turbines (t = -
0.003, p = 0.97). We also observed 24 separate instances (n = 56, 10%) of small groups of bats
(2–5 individuals) flying together around turbines, which suggests that the timing of migration
flights may be an important factor in bat fatalities at this and at similar wind facilities. Wind
speed was positively related to bat passes observed (R2 = 0.23, p = 0.01) whereas barometric
pressure was a negative predictor (R2 = 0.33, p = 0.002). Temperature, humidity, rotor speed,
and cloud cover were all non-significant predictors of bat passes. A multivariate regression
analysis showed a significant relationship between two wind measurements, barometric pressure,
and the presence or absence of the deterrent (F = 3.87, R2 = 0.424, p = 0.02).
Our mixed results suggest that a variety of factors influence the effectiveness of an
acoustic deterrent. The acoustic envelope of our deterrent system was probably not large enough
to consistently deter the activity of bats within the large volume of the rotor-swept zone. For
deterrents to be effective, they must operate at ranges that are large enough to encompass an
entire turbine structure. Future studies must also examine the assumptions behind acoustic
deterrence. Although bats are known to avoid ultrasound clutter, little is known about the
behavioral responses of bats to artificial broadband ultrasound emissions. It must be
demonstrated on a full-size scale that bats both can and will avoid large ultrasound fields before
acoustic deterrent systems can be expected to function effectively at wind farms.
Horn et al. 2008 - Bat Deterrents at Maple Ridge 3 of 30

Introduction
As wind energy production has steadily increased worldwide, reports have surfaced on
the effect that operating wind turbines have on bats. Bat injuries and fatalities have been
reported at wind facilities throughout North America (Johnson 2005, Arnett et al. 2008) and
Europe (Ahlen 2003, Bach and Rahmel 2004, Brinkman 2006) in a wide range of habitat
conditions. Fatality rates observed at large commercial wind facilities on forested ridges in the
eastern United States have ranged from 20.8–63.9 bats/turbine/year (Arnett et al. 2008).
Assuming that reported mortality rates are representative and the projected megawatts of wind
energy are developed, the projected number of annual bat fatalities in the mid-Atlantic Highlands
alone could be 33,000–110,000 by the year 2020 (Kunz et al. 2007a). Given these mortality
rates, the accelerating growth of the wind industry (AWEA 2008, EIA 2008), and the possible
decline in populations in many bat species, it seems imperative to begin to develop and evaluate
solutions that can reduce the number of future bat fatalities.
Migratory tree-roosting bats appear to be the most at risk of being killed by wind turbines
Kunz et al. 2007a, Arnett et al. 2008). Several studies report a surge in numbers of bats found
beneath turbines in the autumn, particularly in partly forested or forested areas in North America
(Johnson 2005, Arnett et al. 2008). These studies have naturally raised questions of why and
how these bats are killed, and why bats are most at risk during fall migration and several
hypotheses have been proposed (Kunz et al. 2007a). Bats may be randomly colliding with
turbine blades, and thus seasonal increases in bat mortality may reflect temporary increases in
local populations, perhaps caused by migration patterns (Cryan and Brown 2007). Another
factor may be weather patterns and environmental conditions that are optimal for migration
flights. Kerns et al. (2005) noted that bat fatalities are associated with lower wind speeds and the
Horn et al. 2008 - Bat Deterrents at Maple Ridge 4 of 30
timing of weather fronts. Bats may shift the flight altitudes of their nightly or migration flights
based on weather conditions and cloud cover (Dürr and Bach 2004), which may result in greater
numbers encountering operating wind turbines. Cryan and Brown (2007) observed that
migrating hoary bats (Lasiurus cinereus) were more likely to visit a migration stopover point on
darker nights during periods of low wind, high cloud cover, and lower barometric pressures.
Bats also may be attracted to landscape modification and edges created when wind
facilities are constructed in forested areas (Arnett 2005). Bats may be indirectly attracted to
turbines because insect densities are higher near turbines because of heat production, or rotor
turbulence. Perhaps the most promising attraction hypothesis is that bats may be attracted to
wind turbines in part, because some species that normally seek out large trees to roost in (Kunz
and Lumsden 2003, Barclay et al. 2007) may view the large towers on cleared landscapes or
fields as potential roosting habitat (Ahlen 2003, Arnett 2005, Kunz et al. 2007a). This
hypothesis is supported by observations of bats investigating and alighting on turbine towers and
even the blades themselves when they are stationary (Horn et al. 2008). In contrast to bats that
may incidentally fly through the airspace occupied by an operating wind turbine while on a
migratory flight or while foraging, bats that investigate turbines by repeatedly looping around
and approaching the blades, tower, and nacelle are at higher risk of fatal collisions.
Several mitigation strategies to reduce bat fatalities at wind farms have been proposed.
One strategy is to curtail operation of turbines during short periods when the risk is highest, in
particular low wind periods favorable for increased insect activity and foraging by bats (Arnett
2005). Another strategy is to attempt to deter bats from flying through the rotor-swept zone of
turbines. This approach has promise, especially if bats are attracted to turbines or turbine
structures, whatever the causal mechanism. Reducing fatalities requires a mechanism that acts
Horn et al. 2008 - Bat Deterrents at Maple Ridge 5 of 30
by deterring bat attraction to turbines or turbine sites. Perhaps the most easily constructed and
deployed deterrent mechanism is an acoustic one. The bat species in question depend on
echolocation for pursuing insect prey while in flight, and one hypothesis is that production of
broadband ultrasound emissions in the same frequency range used by bats while echolocating
could cause them to avoid the source of the emissions. Echolocation in bats (Griffin 1960)
functions by comparison of delays and patterns in delays between pulses of ultrasonic sound
produced by bats and the echoes that return to them (Simmons and Stein 1980). Species that
have been found killed at wind turbines emit frequency modulated pulses and are known to avoid
acoustic “clutter” over water (Mackey and Barclay 1989). Recent evidence suggests that if the
bandwidth of the returning echoes is reduced, bats may lose some acuity in their ability to
correctly detect objects in their environment (Simmons et al. 2004). A deterrent device that
emits continuous broadband ultrasonic emissions with randomized pulses in various frequency
ranges may have such an effect.
Spanjer (2006) tested the response of big brown bats (Eptesicus fuscus) to a prototype
eight speaker deterrent emitting broadband white noise at frequencies from 12.5–112.5 kHz and
found that during non-feeding trials, bats landed in the quadrant containing the device
significantly less when it was broadcasting broadband noise. Spanjer (2006) also reported that
during feeding trials, bats never successfully took a tethered mealworm when the device
broadcast sound but captured mealworms near the device in about 1/3 of trials when it was silent.
Szewczak and Arnett (2006) tested the same acoustic deterrent in the field and found that when
placed by the edge of a small pond where nightly bat activity was consistent, activity dropped
significantly on nights when the deterrent was activated. In this study, we tested the
effectiveness of a larger, more powerful version of this deterrent device to reduce nightly bat
Horn et al. 2008 - Bat Deterrents at Maple Ridge 6 of 30
activity. Our objective was to mount the deterring device to operating wind turbines at a facility
where recent bat fatalities had been documented and observe bat activity at treated and untreated
turbines simultaneously.
Study Area
We evaluated the behavioral responses of bats to a prototype broadband ultrasonic bat
deterrent at the Maple Ridge Wind Farm in Lewis County, New York in August 2007. This
facility is located on the Tug Hill plateau west of the Adirondack State Park and adjacent to the
town of Lowville. The landscape is primarily agricultural, with crop fields, grassland, and
pastures separated by small wooded areas and riparian corridors, and elevation ranges from 460–
540 m. The facility consists of 195 Vestas 1.65 MW turbines, and four meteorological towers
(met towers) widely dispersed across the eastern, downwind edge of the plateau. Each turbine
tower is 79 m high and blades of the rotor are 39.6 m long. The rotor-swept area is 4,962 m2 and
reaches from 38–120 m above ground. The rotor can yaw through 360 degrees and the blades
sweep through a volume that is 260,120 m3 (the rotor-swept zone). The speed of the rotor varies
with wind conditions, but the maximum speed is 14.3 revolutions per minute.
Methods
Deterrent Device
Fundamental Theory and Supporting Evidence. The choice of ultrasonic masking
technique for this study, and those performed by Spanjer (2006) and Szewczak and Arnett
(2006), is based on the observation that many species of bats, especially insectivorous bats, use
chirped echolocation calls. We hypothesized that bats use these chirped calls, or chirped
waveforms, for similar reasons that chirped waveforms are often used in high performance radar
systems. First, because chirped waveforms occupy a broad frequency range, they can be
Horn et al. 2008 - Bat Deterrents at Maple Ridge 7 of 30
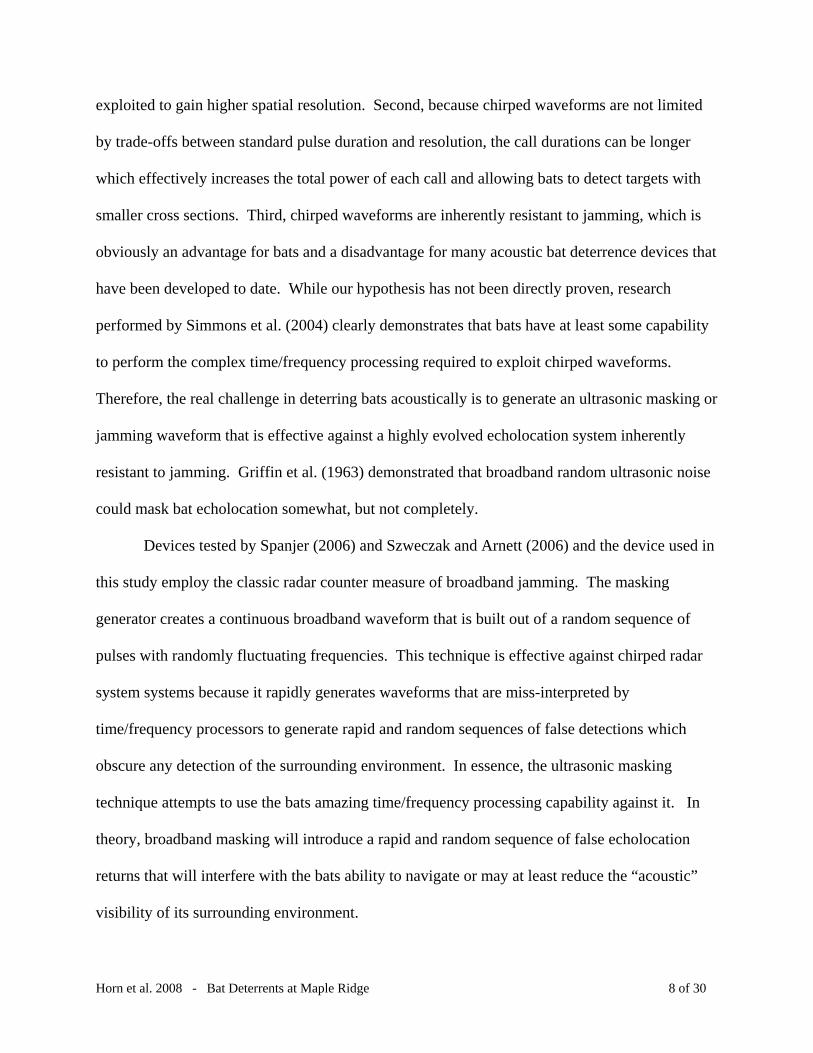
exploited to gain higher spatial resolution. Second, because chirped waveforms are not limited
by trade-offs between standard pulse duration and resolution, the call durations can be longer
which effectively increases the total power of each call and allowing bats to detect targets with
smaller cross sections. Third, chirped waveforms are inherently resistant to jamming, which is
obviously an advantage for bats and a disadvantage for many acoustic bat deterrence devices that
have been developed to date. While our hypothesis has not been directly proven, research
performed by Simmons et al. (2004) clearly demonstrates that bats have at least some capability
to perform the complex time/frequency processing required to exploit chirped waveforms.
Therefore, the real challenge in deterring bats acoustically is to generate an ultrasonic masking or
jamming waveform that is effective against a highly evolved echolocation system inherently
resistant to jamming. Griffin et al. (1963) demonstrated that broadband random ultrasonic noise
could mask bat echolocation somewhat, but not completely.
Devices tested by Spanjer (2006) and Szweczak and Arnett (2006) and the device used in
this study employ the classic radar counter measure of broadband jamming. The masking
generator creates a continuous broadband waveform that is built out of a random sequence of
pulses with randomly fluctuating frequencies. This technique is effective against chirped radar
system systems because it rapidly generates waveforms that are miss-interpreted by
time/frequency processors to generate rapid and random sequences of false detections which
obscure any detection of the surrounding environment. In essence, the ultrasonic masking
technique attempts to use the bats amazing time/frequency processing capability against it. In
theory, broadband masking will introduce a rapid and random sequence of false echolocation
returns that will interfere with the bats ability to navigate or may at least reduce the “acoustic”
visibility of its surrounding environment.
Horn et al. 2008 - Bat Deterrents at Maple Ridge 8 of 30
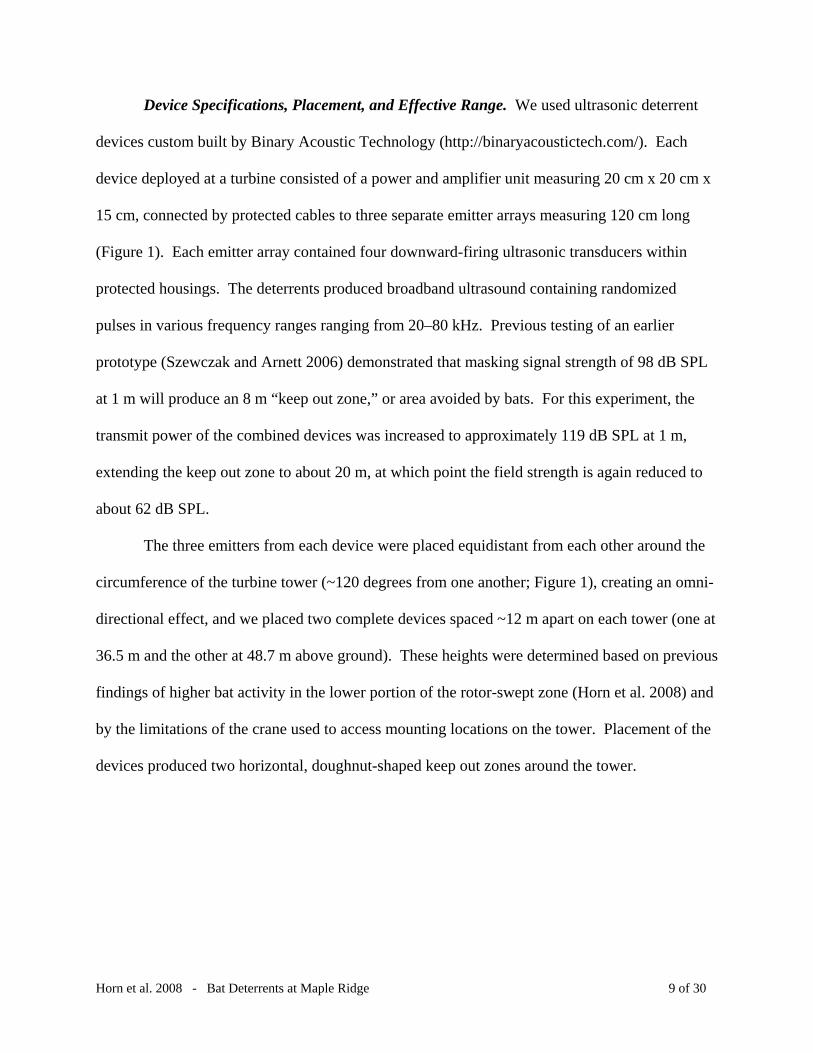
Device Specifications, Placement, and Effective Range. We used ultrasonic deterrent
devices custom built by Binary Acoustic Technology (http://binaryacoustictech.com/). Each
device deployed at a turbine consisted of a power and amplifier unit measuring 20 cm x 20 cm x
15 cm, connected by protected cables to three separate emitter arrays measuring 120 cm long
(Figure 1). Each emitter array contained four downward-firing ultrasonic transducers within
protected housings. The deterrents produced broadband ultrasound containing randomized
pulses in various frequency ranges ranging from 20–80 kHz. Previous testing of an earlier
prototype (Szewczak and Arnett 2006) demonstrated that masking signal strength of 98 dB SPL
at 1 m will produce an 8 m “keep out zone,” or area avoided by bats. For this experiment, the
transmit power of the combined devices was increased to approximately 119 dB SPL at 1 m,
extending the keep out zone to about 20 m, at which point the field strength is again reduced to
about 62 dB SPL.
The three emitters from each device were placed equidistant from each other around the
circumference of the turbine tower (~120 degrees from one another; Figure 1), creating an omni-
directional effect, and we placed two complete devices spaced ~12 m apart on each tower (one at
36.5 m and the other at 48.7 m above ground). These heights were determined based on previous
findings of higher bat activity in the lower portion of the rotor-swept zone (Horn et al. 2008) and
by the limitations of the crane used to access mounting locations on the tower. Placement of the
devices produced two horizontal, doughnut-shaped keep out zones around the tower.
Horn et al. 2008 - Bat Deterrents at Maple Ridge 9 of 30
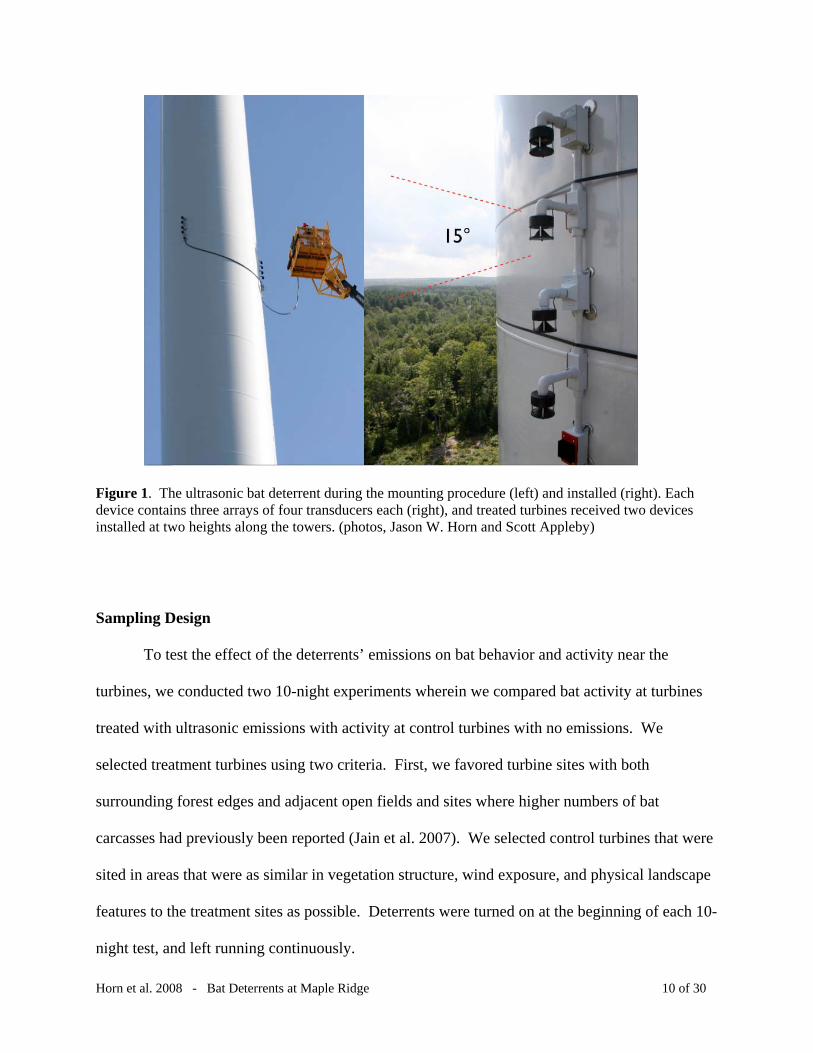
Figure 1. The ultrasonic bat deterrent during the mounting procedure (left) and installed (right). Each device contains three arrays of four transducers each (right), and treated turbines received two devices installed at two heights along the towers. (photos, Jason W. Horn and Scott Appleby)
Sampling Design
To test the effect of the deterrents’ emissions on bat behavior and activity near the
turbines, we conducted two 10-night experiments wherein we compared bat activity at turbines
treated with ultrasonic emissions with activity at control turbines with no emissions. We
selected treatment turbines using two criteria. First, we favored turbine sites with both
surrounding forest edges and adjacent open fields and sites where higher numbers of bat
carcasses had previously been reported (Jain et al. 2007). We selected control turbines that were
sited in areas that were as similar in vegetation structure, wind exposure, and physical landscape
features to the treatment sites as possible. Deterrents were turned on at the beginning of each 10-
night test, and left running continuously.
Horn et al. 2008 - Bat Deterrents at Maple Ridge 10 of 30

Thermal Imaging and Analysis
We monitored the airspace adjacent to the towers for bat activity at both treatment and
control turbines using thermal infrared imaging (Kunz et al. 2007b, Horn et al. 2008). Thermal
infrared cameras provide digital video images by detecting heat emitted by all objects within the
field of view without the need for accessory illumination. We used four FLIR Inc. ThermaCAM
P640 cameras. Each camera has a 24° field of view and produces video images where each
frame measures 640 x 480 pixels. We positioned two cameras at the base of each of the
treatment and control turbines, at a distance of 50 m from the base. The fields of view were
positioned one above the other to create a single large viewable area to the right of the tower
(Figure 2). This view encompassed the right half of the lower portion of the rotor swept zone
(including both the upper and lower deterrents, when present), and an area below the rotor swept
zone. The radiometric thermal infrared video from the cameras was captured directly to hard
disk using FLIR Researcher software on portable ruggedized computers containing 1TB hard
drives. Observation stations including the camera, computers and operator were protected from
weather with portable tents.
We simultaneously monitored nightly bat activity at one treatment (turbine 275) and one
control (turbine 212) turbine for 10 consecutive nights beginning August 8. We began our
recordings 20 minutes after sunset on each night and continued for 3.6 hours. We focused on the
first hours after sunset as bats are often most prevalent around wind turbines during this time
(Horn et al. 2008). At the end of the first 10-night experiment, we moved our cameras and
observation stations to a second treatment (turbine 296) and control turbine (turbine 240) pair
and again recorded for 10 consecutive nights beginning August 19.
Horn et al. 2008 - Bat Deterrents at Maple Ridge 11 of 30
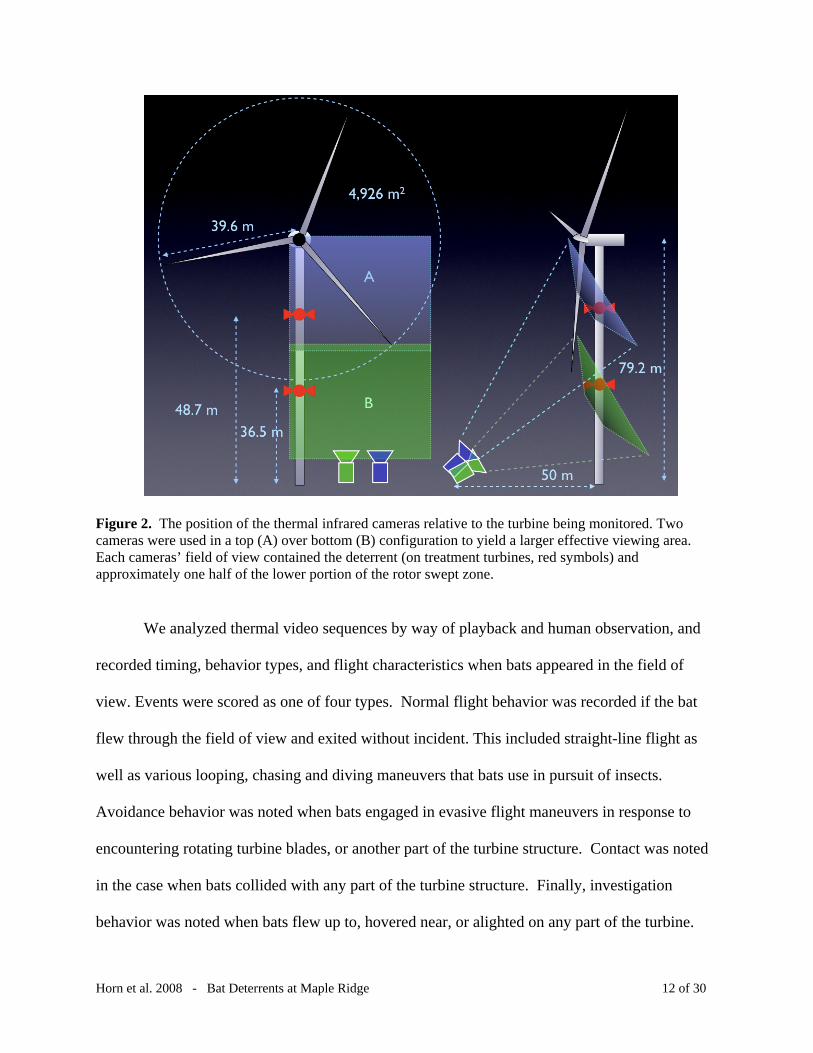
Figure 2. The position of the thermal infrared cameras relative to the turbine being monitored. Two cameras were used in a top (A) over bottom (B) configuration to yield a larger effective viewing area. Each cameras’ field of view contained the deterrent (on treatment turbines, red symbols) and approximately one half of the lower portion of the rotor swept zone.
We analyzed thermal video sequences by way of playback and human observation, and
recorded timing, behavior types, and flight characteristics when bats appeared in the field of
view. Events were scored as one of four types. Normal flight behavior was recorded if the bat
flew through the field of view and exited without incident. This included straight-line flight as
well as various looping, chasing and diving maneuvers that bats use in pursuit of insects.
Avoidance behavior was noted when bats engaged in evasive flight maneuvers in response to
encountering rotating turbine blades, or another part of the turbine structure. Contact was noted
in the case when bats collided with any part of the turbine structure. Finally, investigation
behavior was noted when bats flew up to, hovered near, or alighted on any part of the turbine.
Horn et al. 2008 - Bat Deterrents at Maple Ridge 12 of 30
We categorized flight altitude as either low (below the rotor-swept zone), medium (within the
rotor-swept zone) and high (above the rotor-swept zone). Similarly, we categorized range from
the camera position as close (between the camera and turbine rotor swept zone), medium (within
the rotor swept zone) and distant (beyond the rotor swept zone).
We were conservative when identifying images as containing bats. In addition to bats,
thermal infrared sequences may contain birds, aircraft, and insects at great distance from the
camera. In cases where the identity of an object was not clearly a bat, we used quantitative and
qualitative criteria for identifying bats and bat flight behaviors. First, only objects with wing
beat frequencies between 10 and 15 beats/second were counted. Second, we qualitatively judged
the inertia of the object that was evident during sharp flight maneuvers and only counted objects
that were in the range of expected bat masses. Thirdly, we used surface temperature values, and
rejected objects that were not consistent with the production of metabolic heat. In general, bats
were distinguishable from insects by their motion and temperature profiles, and distinguishable
from birds by their wing beat frequencies, wing and body shapes, and flight maneuvers. In cases
where we did not have confidence in our identifications, we simply discarded the observation.
To prevent double counting of bats that exited the field of view, and then re-appeared in the same
camera’s field of view, or in another camera’s field of view, we carefully noted the heading of
bats when entering and exiting the frame for each observation. We then used these heading
values, whenever possible, to identify multiple bat passes in separate camera views as one pass
made by a single individual. All data were compiled and analyzed using a relational database.
We used a multivariate regression (ANOVA) to analyze relationships between covariates and the
number of bats observed. We summed the number of bats present in 10-minute intervals on all
nights of observation and used this aggregate as the dependent variable in a series of regression
Horn et al. 2008 - Bat Deterrents at Maple Ridge 13 of 30
tests. We tested the relationship between wind heading and the number of bats flying near
turbines using circular statistical models (von Mises distribution). All statistical tests were
performed with the statistical software package R (http://www.r-project.org/).
Results
In the 288 hours of video recordings we captured over the course of 20 nights, we
observed 618 instances of bats in the field of view and 566 individual bat passes. The number of
passes observed ranged from 4–46 on a given night ( x = 26.8, SD = 14.1). 95% of these
observations were simple fly-by events (n = 536), 2% were collision avoidance (n = 12), 3%
were investigation events (n = 16), and <1% were collision events (n = 2, Table 1). We found
that most bats that we observed flew at a low height and close range (n = 223, 39%), at low
height, medium range (n = 110, 19%) and at medium height, medium range (n = 158, 28%,
Table 1). While the thermal imaging cameras were capable of detecting bats both beyond the
range of the turbine and high above it, we did not observe many bats flying above the rotor.
Twenty eight percent of the bats we viewed were within the volume of space swept by the rotor
blades, and 59% were flying below the reach of the blades.
The average occurrence rate of bats was 0.93 bats/turbine/hour. However, bats were
generally more abundant during the earlier part of the recording session and activity gradually
decreased over time (Figure 3). This observation coincides with our expectation that bats would
be more abundant in first hours after sunset. In the first 10-night test, we observed 131 bat
passes ( x = 13.1/night, SD = 5.5) at the deterrent-treated turbine versus 244 ( x = 24.4, SD =
12.9) at the control turbine, a significant difference (t = 2.54, p = 0.03, Table 2, Figure 4).
However, during our second 10-night test there was no significant difference in bat activity
Horn et al. 2008 - Bat Deterrents at Maple Ridge 14 of 30
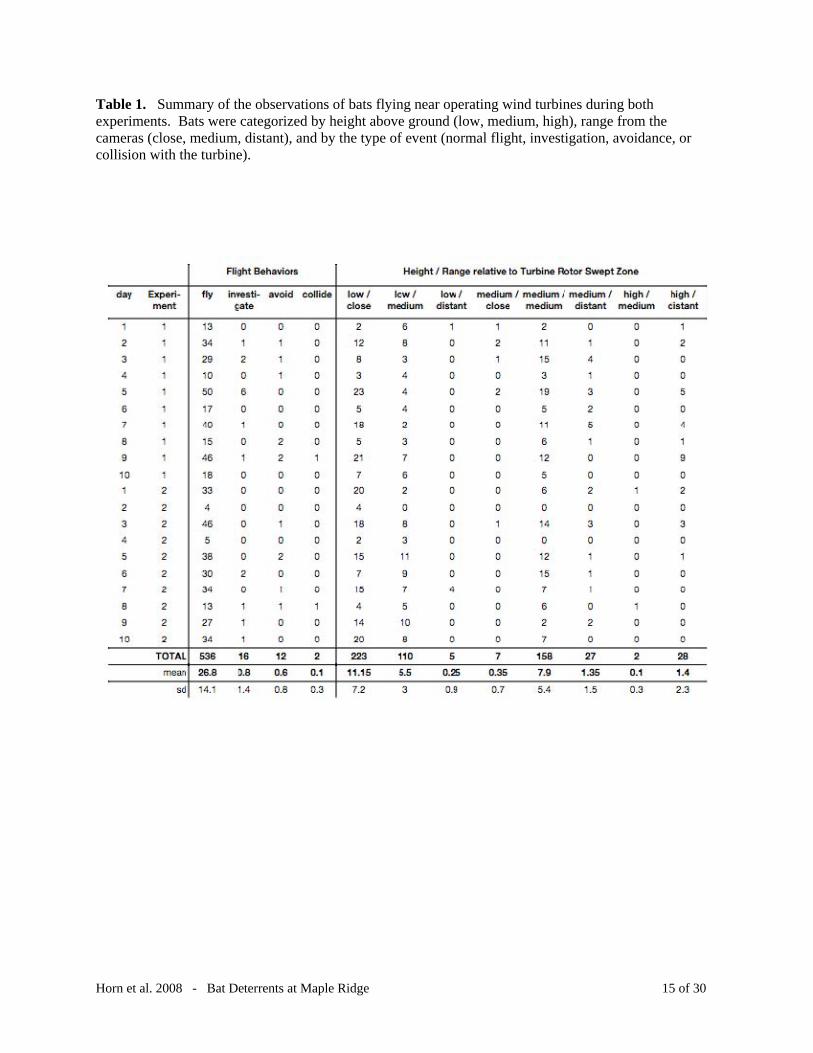
Table 1. Summary of the observations of bats flying near operating wind turbines during both experiments. Bats were categorized by height above ground (low, medium, high), range from the cameras (close, medium, distant), and by the type of event (normal flight, investigation, avoidance, or collision with the turbine).
Horn et al. 2008 - Bat Deterrents at Maple Ridge 15 of 30
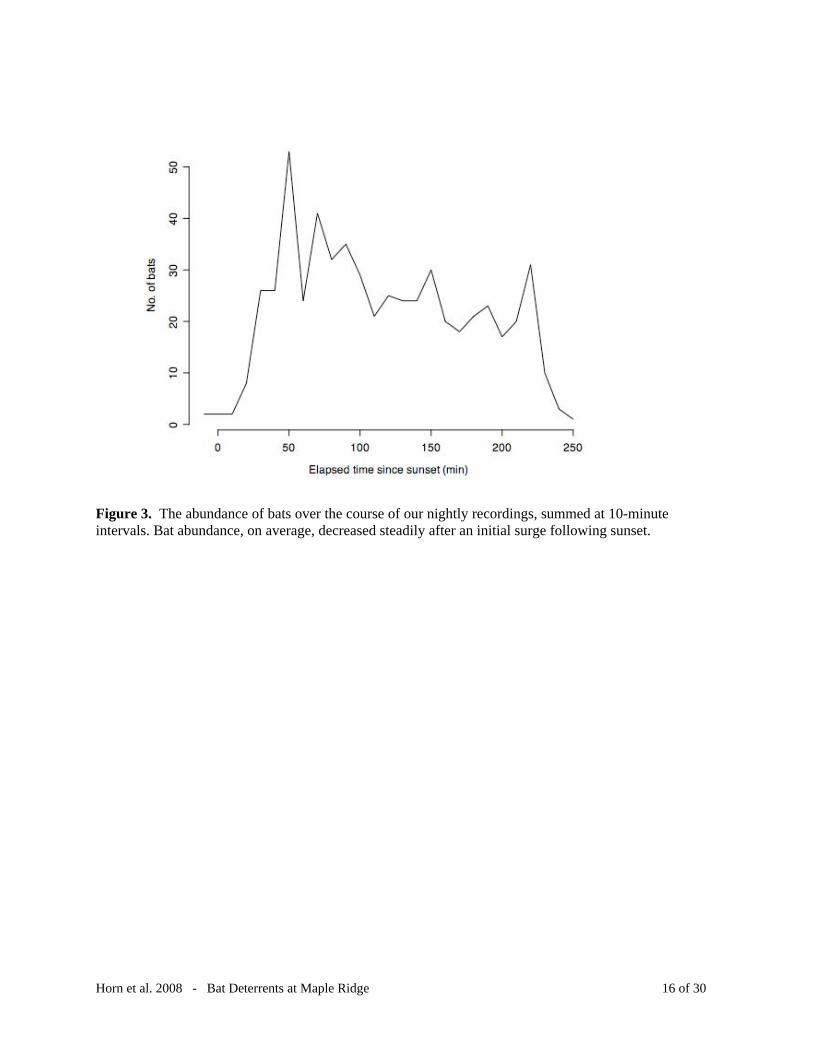
Figure 3. The abundance of bats over the course of our nightly recordings, summed at 10-minute intervals. Bat abundance, on average, decreased steadily after an initial surge following sunset.
Horn et al. 2008 - Bat Deterrents at Maple Ridge 16 of 30
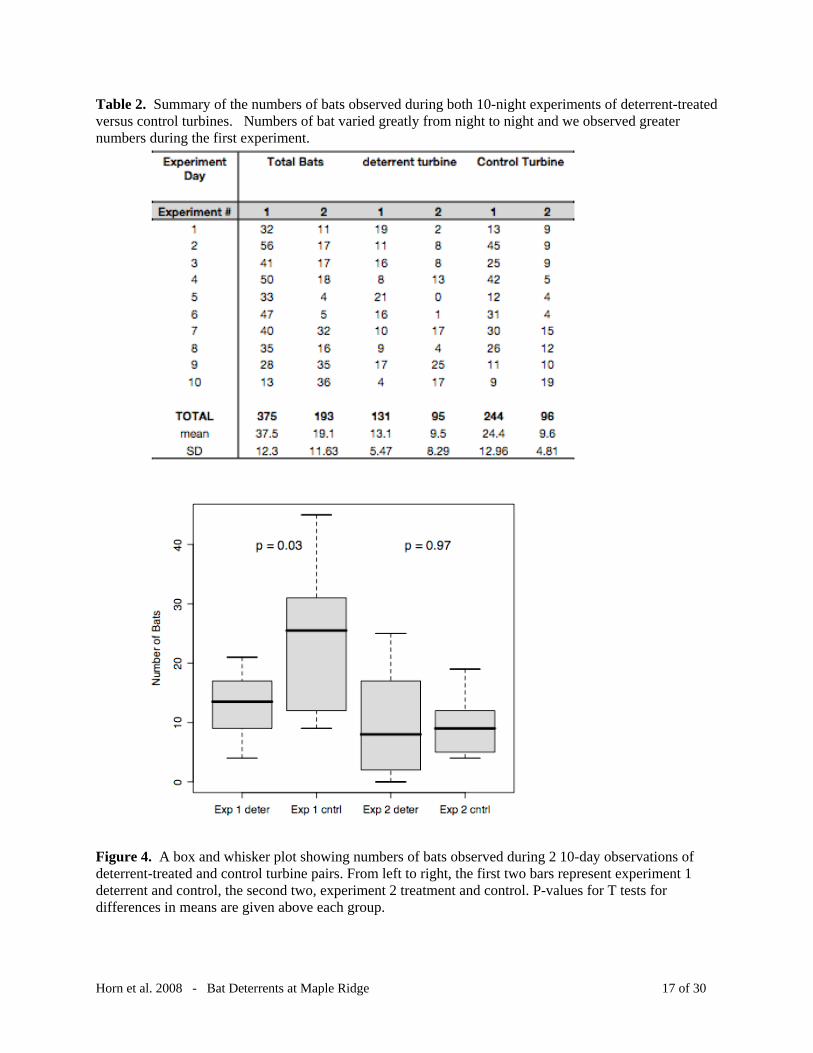
Table 2. Summary of the numbers of bats observed during both 10-night experiments of deterrent-treated versus control turbines. Numbers of bat varied greatly from night to night and we observed greater numbers during the first experiment.
Figure 4. A box and whisker plot showing numbers of bats observed during 2 10-day observations of deterrent-treated and control turbine pairs. From left to right, the first two bars represent experiment 1 deterrent and control, the second two, experiment 2 treatment and control. P-values for T tests for differences in means are given above each group.
Horn et al. 2008 - Bat Deterrents at Maple Ridge 17 of 30
between the treatment ( x = 9.5, SD = 8.3) and control ( x = 9.6, SD = 4.8) turbines (t = -0.003, p
= 0.97, Table 2, Figure 4).
Bat flights were generally one of two types; straight-line flights, and looping, foraging
flights. Although we did not quantify the number and type of maneuvers in each individual
flight, we observed that many of the individuals that occurred in the rotor-swept zone appeared
to be actively foraging. Although we could not directly identify the individual insects that bats
were pursuing, we inferred that many of the sharp turns, quick climbs, dives and erratic
maneuvers that we observed were executed in the course of normal foraging behavior. When
bats investigated the turbines, they often approached the tower and, executing touch-and-go type
behavior, hovered or briefly alighted on it, then flew away. Such investigation events often
involved repeated touch-and-gos on the tower, or the nacelle. We did not observe any direct
investigation or approach to the blades, although a small number of bats reacted to rapidly
approaching blades. The two instances of contact behavior that we witnessed appeared to be
glancing blows by blades on the downswing portion of rotation. It was not clear whether the
blows were fatal, and the bats appeared to fall to the ground (although the ground was not in the
field of view of either camera).
We also observed 24 separate instances of small groups of bats (2–5) flying together in
small flock-like groups; this totaled 56 bats, 10% of the total observed. We identified these
groups by noting that individuals flew on similar trajectories as they passed through the field of
view, often with trailing bats appearing to be following and matching the flight maneuvers of
leading bats. These incidents were not clumped in time, but rather occurred on 13 of the 20
nights that we observed. Bats in these groups were separated by approximately 10–20 m. In the
case of 2-bat groups, one individual often appeared to be chasing the second. Occasionally, two
Horn et al. 2008 - Bat Deterrents at Maple Ridge 18 of 30
bats in such groups would briefly make contact during flight after having executed pursuit-like
maneuvers normally observed during foraging.
We also investigated whether variables such as wind speed, wind heading, humidity and
turbine rotor speed were associated with increased bat activity (Figure 5). Mean rotor speed of
all nacelles had no predictive effect on bat abundance, nor did relative humidity measured at the
met tower. Mean wind speed at the nacelle (R2 = 0.14, p = 0.06) and at the met tower (R2 = 0.23,
p = 0.01) both showed a slight positive relationship with number of bats observed. Barometric
pressure recorded at met towers was slightly negatively associated with bat abundance (R2 =
0.33, p = 0.002). Presence of the deterrent (coded as 1 = treatment and 0 = control) showed no
significant association with bat abundance. A multivariate regression (ANOVA) showed a
significant relationship between these same four variables and the number of bats observed (F =
3.87, R2 = 0.424, p = 0.02)
We examined the relationship between numbers of bats observed nightly (between sunset
+ 20 minutes and sunset + 3.6 hours) and the following mean nightly variables: temperature at
the ground, wind speed at the ground, humidity, barometric pressure, estimates of percentage
cloud cover, and again deterrent coded at 1 or 0. In individual regression tests, only barometric
pressure (R2 = 0.12. p = 0.04) and deterrent (R2 = 0.08, p = 0.09) were significant predictors of
bat activity, while all other variables were non-significant. We also performed a multivariate
regression analysis of these variables which was significant (ANOVA, F = 3.32, R2 = 0.44, p =
0.01), with wind speed, pressure, and deterrent having significant regression coefficients.
Nightly wind headings had a strong westerly and north-westerly component (winds out of the
west and northwest, Figure 6). Mean nightly wind heading was 299.2° +/- SD = 40.03°.
Because wind headings are circular in nature, they cannot be used in regression analysis.
Horn et al. 2008 - Bat Deterrents at Maple Ridge 19 of 30
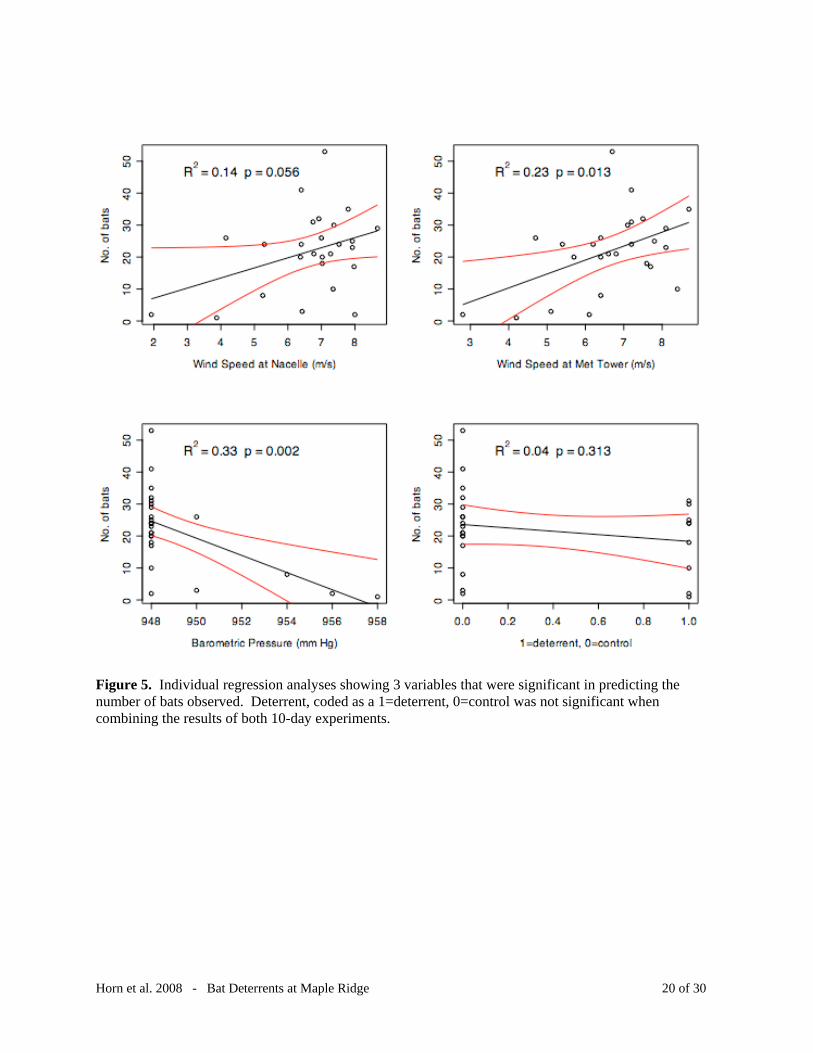
Figure 5. Individual regression analyses showing 3 variables that were significant in predicting the number of bats observed. Deterrent, coded as a 1=deterrent, 0=control was not significant when combining the results of both 10-day experiments.
Horn et al. 2008 - Bat Deterrents at Maple Ridge 20 of 30
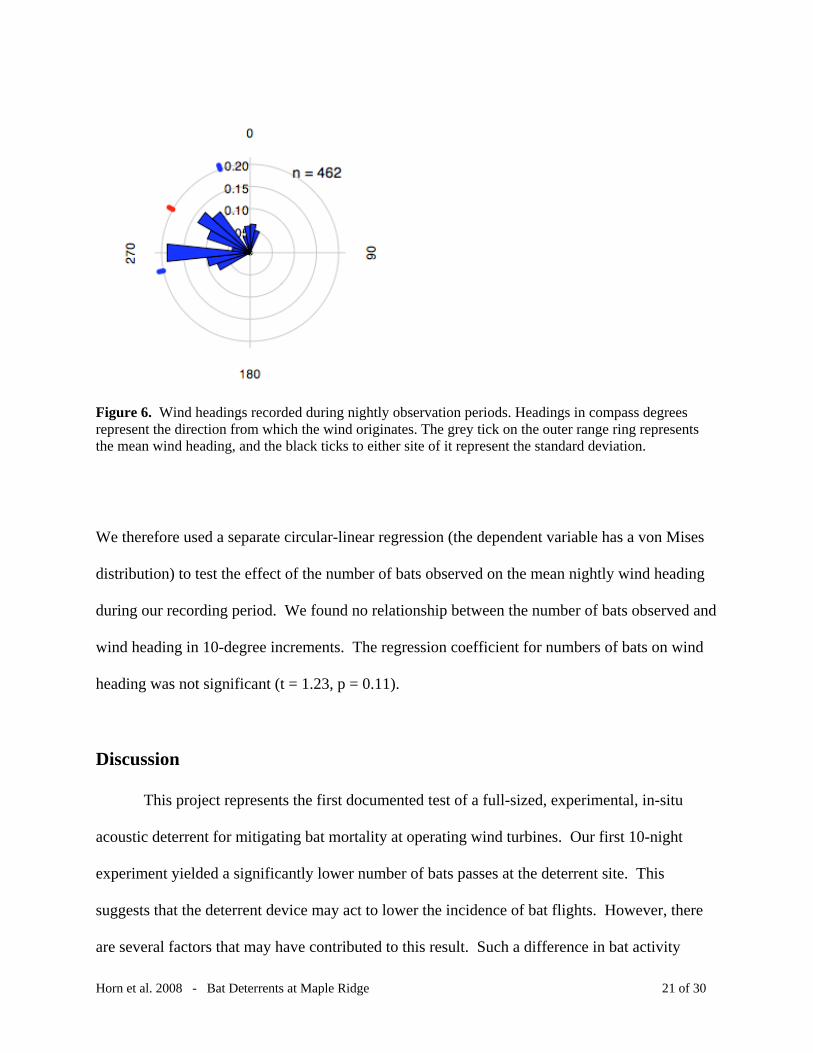
Figure 6. Wind headings recorded during nightly observation periods. Headings in compass degrees represent the direction from which the wind originates. The grey tick on the outer range ring represents the mean wind heading, and the black ticks to either site of it represent the standard deviation.
We therefore used a separate circular-linear regression (the dependent variable has a von Mises
distribution) to test the effect of the number of bats observed on the mean nightly wind heading
during our recording period. We found no relationship between the number of bats observed and
wind heading in 10-degree increments. The regression coefficient for numbers of bats on wind
heading was not significant (t = 1.23, p = 0.11).
Discussion
This project represents the first documented test of a full-sized, experimental, in-situ
acoustic deterrent for mitigating bat mortality at operating wind turbines. Our first 10-night
experiment yielded a significantly lower number of bats passes at the deterrent site. This
suggests that the deterrent device may act to lower the incidence of bat flights. However, there
are several factors that may have contributed to this result. Such a difference in bat activity
Horn et al. 2008 - Bat Deterrents at Maple Ridge 21 of 30

levels may have been pre-existing between these two sites due to habitat differences (although
we did our best to minimize habitat differences through careful site selection), proximity to
nearby roosts, some other underlying pattern such as a preference for an area due to recent
foraging success, or sampling bias. We considered these factors carefully when designing our
experiments. Due to logistical constraints, we could not perform experiments to control for both
environmental conditions (current study design) and site differences (examining the same turbine
site with deterrents alternately switched on or off). Because nightly bat activity at wind turbine
sites, as with normal nightly bat activity, is highly variable with temperature and weather events
(Arnett 2005, Horn et al. 2008), we chose to control for these variables. This may explain why
we did not detect a difference during our second 10-night experiment. Either the effect that we
observed during the first experiment or the lack thereof in the second experiment may be due to
pre-existing site differences that we attempted to control for by selecting sites that had similar
levels of bat mortality in previous years (Jain et al. 2007).
We attempted to explain the effect that environmental factors such as temperature and
wind speed may have on the incidence of bat flight we observed at Maple Ridge. Previous
studies have suggested that increased mortality events at wind facilities may occur just prior to or
following frontal weather systems, and that mortality may also occur more frequently when
prevailing wind speeds are low (Arnett 2005, Arnett et al. 2008). We found a slightly positive,
significant relationship between wind speed and bat activity. However, we found that as
barometric pressure increases, there is a slight decrease in bat activity. Cryan and Brown (2007)
similarly found that low barometric pressure is associated with migration timing in hoary bats.
Our finding that ambient temperature did not correlate with bat activity was surprising, since bat
foraging activity is often positively related to insect activity, which in turn is positively related to
Horn et al. 2008 - Bat Deterrents at Maple Ridge 22 of 30
ambient temperature (Hayes 1997). These results indicate that such relationships may be site
specific. The absence of a relationship with temperature may also indicate that the bats we
observed may be not only individuals from local populations foraging, but also migrating bats en
route, or making stopovers. The number of bats that are observed near turbines at this time of
year may be predicted more by conditions optimal for migration rather than for foraging.
The incidence of bat fatality at wind turbines increases during the fall migration period at
several facilities (Ahlen 2003, Jain et al. 2007, Arnett, et al. 2008). We observed flight behavior
that suggests that some of the bats we observed around wind turbines may have been actively
migrating. Migratory tree-roosting bats have been observed flying in small groups or flocks
during late summer and autumn (Cryan and Veilleux 2007). At the Mountaineer facility (West
Virginia, USA), bats were occasionally observed flying in pairs or small groups (Horn et al.,
2008). In the current study, 10% of the total number of bats we observed were in groups which
suggesting the possibility that these bats may have been migrants.
The underlying assumption of our bat deterrence device is that individuals will avoid
airspace containing ultrasonic emissions because they find it disruptive to normal echolocation,
and therefore their ability to navigate and to locate prey. We assume that as bats encounter a
gradient of increasingly stronger emissions as they approach turbines, they will respond by flying
opposite to that gradient to escape the effect of the emissions. However, at present we do not
know enough about the general responses that various species have upon entering a large field of
ultrasound emissions. It is therefore important to consider our assumptions when interpreting out
results.
Bats may be able to escape a small ultrasound field by simply continuing on their current
(or similar) trajectory. Flying in a straight line may serve to effectively clear the field equally
Horn et al. 2008 - Bat Deterrents at Maple Ridge 23 of 30
well as well as any turning maneuver. This may help to explain why, in small-scale tests,
acoustic deterrents lead to reduced bat activity (Szewczak and Arnett 2006). Bats flying into a
large acoustic field may be disoriented by the emissions, and may not be able to quickly find a
flight path that allows them to move away from their source. If so, bats attempting to escape the
effects of the deterrent may end up venturing further into areas we wish to deter them from. Our
observations included several instances of bats avoiding contact with moving blades by deviating
their flight path. If bats that are within the acoustic envelope are disoriented by ultrasound
emissions, we may actually increase the risk of collisions by hampering their ability to detect
approaching turbine blades. This effect may also help to explain why, in our second treatment
and control test, we did not observe lower bat activity at the deterrent site. Bats that approach a
deterrent area may not be able to immediately avoid it, and hence the incidence of bats, given the
camera’s field of view, may not decrease.
Another important consideration for measuring the effectiveness of ultrasonic deterrents
is that bats may learn from their experience with the deterrent, and modify their behavior over
time. We do not necessarily expect such a system to repel first-time visitors to turbine areas
equipped with deterrents, because they may not yet have had the opportunity to learn from such
an experience. Such individuals might be first-year bats that have left natal roosts, migrant bats
making stopovers along migration routes, or individuals in local populations that have not yet
foraged or explored these areas. Bats’ learning to avoid deterrents is particularly important when
the effective envelope of deterrent emissions only just encapsulates the entire turbine structure,
or part of the turbine. In this case, bats will have to fly in the area of increased strike risk around
the turbine to experience the ultrasound emissions. In our study, the acoustic envelope of the
deterrents was far smaller than the total volume of air occupied by the turbine. Our mixed results
Horn et al. 2008 - Bat Deterrents at Maple Ridge 24 of 30
may be due to our relatively small coverage area. We attempted to match the camera’s field of
view with our estimate of the ultrasound field (both much smaller than the total turbine rotor-
swept volume). However, if bats only experience ultrasound upon entering the field of view, we
would most certainly count then no matter what their subsequent response. Bat deterrence, as
measured by number of individuals observed, would not necessarily go down if most of the bats
were experiencing the field for the first time. If the coverage area had been larger than our field
of view, perhaps we would have demonstrated a stronger effect of the device.
To increase the effectiveness of deterrents, the coverage area must be made larger.
However, more powerful deterrents are technically more difficult to build and mount to the
turbine tower or nacelle. One possible solution would be the use of more powerful deterrents
that operate only in short bursts. Spanjer (2006) suggested that bats may more readily avoid
different sound types, such as erratic pulses of loud, high-frequency or broadband sound, rather
than continuous white noise. She further suggested that such sound spikes would need to occur
at unpredictable intervals, otherwise bats may be able to time their echolocation calls around the
sound spikes.
Over time, bats may learn to avoid all turbines from their experience with those equipped
with deterrents. Conversely, bats may habituate to the presence of ultrasound emissions, and
acoustic deterrents may actually lose their effectiveness over time, although recent experiments
indicate bats did not habitat ate to a device similar to the one we tested (Szewczak and Arnett
2007). Incorporating behavior modification into future deterrent designs may help to increase
their short- and long-term effectiveness. Not only might this help to reduce bat fatalities on a
larger scale, but it may reduce initial cost, facilitate installation, and reduce maintenance over
time.
Horn et al. 2008 - Bat Deterrents at Maple Ridge 25 of 30
Future Work
Future studies of acoustic deterrents should be extended to longer, more comprehensive
monitoring periods. Different sounds and pulse rates also should be tested (Spanjer 2006). To
properly answer the question of what happens when an acoustic deterrent is introduced,
monitoring should be conducted at test sites before, during, and after deterrent testing. In
addition, areas of similar habitat without turbines should be monitored to develop a baseline
understanding of local activity levels and flight behaviors before turbines or deterrents are
introduced. If acoustic deterrents are to be successful, the effect of equipping a wind facility as a
whole must be examined. If facilities are equipped with, for example, deterrent on half its
turbines, will activity levels decrease at those turbines only? Will activity rates and mortality
rates subsequently increase at non-deterrent turbines because the same number of curious bats
will be visiting fewer turbines? Would activity and mortality rates drop because, as suggested
above, bats learn over time to avoid turbines in general? Finally, and most importantly, if
deterrents are effective in reducing bat activity levels we must address the question of whether
this translates into lower mortality rates by conducting ground searches following nightly
monitoring.
Although thermal infrared video is necessary for studies of behavioral interactions of bats
at wind turbines, this approach is time consuming and expensive, requiring large amounts of
digital storage per hour and a minimum of 2 hours to analyze each hour of video. These
constraints make extending research efforts using this valuable technique logistically and
financially difficult, if not impossible. Automation solutions for identifying bat flight behavior
in video sequences must be developed. One such solution that has been used to great effect
when examining bat flight is the use of computer vision techniques to identify and enumerate
Horn et al. 2008 - Bat Deterrents at Maple Ridge 26 of 30

bats from thermal infrared video (Hristov 2005, Betke 2007, 2008, Kunz et al. 2008). This
technique can be easily adapted to the problem of identifying bat flight around wind turbines,
drastically reducing analysis time and project costs, and enabling longer and more
comprehensive studies.
Our results suggest that while there is potential for ultrasonic emissions to repel bat
activity around turbine towers, nacelles, and blades, further development and testing such
devices under a variety of conditions is essential for developing a working, functional system.
Acknowledgements
We wish to thank all the supporters of this research including the Bats and Wind Energy
Cooperative, Bat Conservation International, PPM Energy and Horizon Wind Energy, The
National Fish and Wildlife Foundation, the National Renewable Energy Laboratory, and member
companies of the American Wind Energy Association. We are grateful to all of the staff and
operations crew of the Maple Ridge Wind Farm for their cooperation, with special thanks to Tod
Nash for logistical support and coordinating our experiments with a busy maintenance schedule,
and for helping us safely mount our deterrents. Thanks also to Scott Appleby and Michael
Whitby for field assistance and video analysis. We also wish to recognize Theresa Labriola for
volunteering video analysis time. Manuela Huso assisted with the design and Robert Barclay
and Paul Cryan provided useful comments on an earlier draft of this report.
Literature Cited Ahlen I. 2003. Wind Turbines and bats - a pilot study. Final Report. Swedish National Energy
Administration. SLU Department of Conservation Biology. Uppsala, Sweeden.
Arnett EB, editor. 2005. Relationships between Bats and Wind Turbines in Pennsylvania and West Virginia. An assessment of fatality search protocols, patterns of fatality and behavioral interactions with wind turbines. A final report submitted to the Bats and Wind Energy Cooperative. Bat Conservation International. Austin, Texas, USA.
Horn et al. 2008 - Bat Deterrents at Maple Ridge 27 of 30

Arnett EB, Brown K, Erickson WP, Fielder J, Henry TH, Johnson GD, Kerns J, Kolford RR, Nicholson T, O'Connell T, Piorkowski M, Tankersly R. 2008. Patterns of fatality of bats at wind energy facilities in North America. Journal of Wildlife Management 72: 61-78.
AWEA. 2008. AWEA 2007 Market Report. American Wind Energy Association. <www.awea.org/projects/pdf/Market_Report_Jan08.pdf>.
Bach L, Rahmel U. 2004. Summary of wind turbine impacts on bats–assessment of a conflict. Bremer Beiträge für Naturkunde und Naturschutz 7: 245-252.
Barclay RMR, Bearwald EF, Gruver JC. 2007. Variation in bat and bird fatalities at wind energy facilities: assessing the effects of rotor size and tower height. Canadian Journal of Zoology 85: 381-387.
Betke M, Hirsh D, Bagchi A, Hristov NI, Makris NC, Kunz TH. 2007. Tracking Large Variable Numbers of Objects in Clutter. Proceedings of the IEEE Computer Society Conference on Computer Vision and Pattern Recognition: 8 pp.
Betke M, Hirsch DE, Makris NC, McCracken GF, Procopio M, Hristov NI, Teng S, Bacchi A, Reichard J, Horn JW, Crampton S, Cleveland CJ, Kunz TH. 2008. Thermal imaging reveals significantly smaller Brazilian free-tailed bat colonies than previously estimated. Journal of Mammalogy 89: 18-24.
Brinkmann R, H.Schauer-Weisshahn, Bontadin F. 2006. Survey of possible operational impacts on bats by wind facilities in Southern Germany. Administrative District of Freiburg – Department 56; Conservation and Landscape Management. Germany
Cryan PM, Veilleux JP. 2007. Migration and use of autumn, winter, and spring roosts by tree bats. In: Lacki MJ, Hayes JP, Kurta A, editors. Bats in Forests: Conservation and Management. Johns Hopkins University Press. pp 153-169.
Cryan PM, Brown AC. 2007. Migration of bats past a remote island offers clues toward the problem of bat fatalities at wind turbines. Biological Conservation 139: 1-11.
Dürr T, Bach L. 2004. Bat deaths and wind turbines: a review of current knowledge and of information available in the database for Germany. Brem Beitr Naturk Naturs 7: 253-264.
EIA. 2008. Annual energy outlook 2008 with projections to 2030. U.S. Department of Energy, Energy Information Administration. Washington, D.C., USA. <http://www.eia.doe.gov/oiaf/aeo/index.html>.
Griffin DR. 1960. The echolocation of flying insects by bats. Animal Behaviour 8:141-154.
Griffin, DR., McCue, JJG, Grinnell, AD. 1963. The resistance of bats to jamming. Journal of Experimental Zoology 152: 229-250
Hayes JP. 1997. Temporal variation in activity of bats and the design of echolocation-monitoring studies. J Mammal 78: 514-524.
Horn et al. 2008 - Bat Deterrents at Maple Ridge 28 of 30

Horn JW, Kunz TH, Arnett EB. 2008. Behavioral Responses of Bats to Operating Wind Turbines. Journal of Wildlife Management 72: 123-132.
Hristov NI, Betke M, Kunz TH. 2005. Assessment of Brazilian free-tailed bat (Tadarida brasiliensis) populations using advanced infrared thermal imaging. Integrative and Comparative Biology 45: 955-1214.
Jain, A., P. Kerlinger, R. Curry, and L. Slobodnik. 2007. Annual report for the Maple Ridge wind power project post-construction bird and bat fatality study–2006. Annual report prepared for PPM Energy and Horizon Energy, Curry and Kerlinger LLC, Cape May Point, New Jersey, USA.
Johnson GD. 2005. A review of bat mortality at wind-energy developments in the United States. Bat Research News 46: 45-49.
Kerns J, Erickson WP, Arnett EB 2005. Bat and bird fatality at wind energy facilities in Pennsylvania and West Virginia. Pages 24–95 in E. B. Arnett, editor. Relationships between bats and wind turbines in Pennsylvania and West Virginia: an assessment of bat fatality search protocols, patterns of fatality, and behavioral interactions with wind turbines. A final report submitted to the Bats and Wind Energy Cooperative. Bat Conservation International, Austin, Texas, USA.
Kunz TH, Lumsden LF. 2003. Ecology of cavity and foliage roosting bats. In: Kunz TH, Fenton MB, editors. Bat Ecology. Chicago, Illinois, USA: University of Chicago Press. pp 3-89. Kunz TH, Arnett EB, Erickson WP, Hoar AR, Johnson GD, Larkin RP, Strickland MD, Thresher
RW, Tuttle MD. 2007a. Ecological impacts of wind energy development on bats: questions, research needs, and hypotheses. Frontiers in Ecology and the Environment 5: 315–324.
Kunz TH, Arnett EB, Cooper BA, Erickson WIP, Larkin RP, Mabee T, Morrison ML, Strickland
JD, Szewczak JM. 2007b. Assessing impacts of wind energy development on nocturnally active birds and bats: a guidance document. Journal of Wildlife Management 71: 2449-2486.
Kunz TH, Betke M, et al. 2008. Assessing the abundance of bats. In: Kunz TH, Parsons S,
editors. Ecological and Behavioral Methods for the Study of Bats. Baltimore, in press. Johns Hopkins University Press, Baltimore, USA.
Mackey, RL, Barclay RMR. 1989. The influence of physical clutter and noise on the activity of bats over water. Canadian Journal of Zoology 67:1167-1170.
Simmons JA, Stein R. 1980. Acoustic imaging in bat sonar: Echolocation signals and the evolution of echolocation. Journal of Comparative Physiology A 135:61-84.
Simmons JA, Neretti N, Intrator N, Altes RA, Ferragamo MJ, Sanderson MI. 2004. Delay
Horn et al. 2008 - Bat Deterrents at Maple Ridge 29 of 30

Horn et al. 2008 - Bat Deterrents at Maple Ridge 30 of 30
accuracy in bat sonar is related to the reciprocal of normalized echo bandwidth, or Q. Proceedings of the National Academy of Sciences of the United Stated of America 101:3638-3643.
Spanjer, GR. 2006. Responses of the big brown bat, Eptesicus fuscus, to a proposed acoustic
deterrent device in a lab setting. A report submitted to the Bats and Wind Energy Cooperative and the Maryland Department of Natural Resources. Bat Conservation International. Austin, Texas, USA.
Szewczak JM, Arnett EB. 2006. Ultrasonic emissions from wind turbines as a potential attractant
to bats: a preliminary investigation. Unpublished report. Bat Conservation International, Austin, Texas, USA.
Szewczak JM, Arnett EB. 2007. Field test results of a potential acoustic deterrent to reduce bat
mortaility from wind turbines. Unpublished report. Bat Conservation International, Austin, Texas, USA.