Embed Size (px)
Citation preview

1
Testing methodologies for Global Monitoring Indicators (GEMI) for SDG 6 on Water and
Sanitation
Uganda Report
NOVEMBER 2016
2
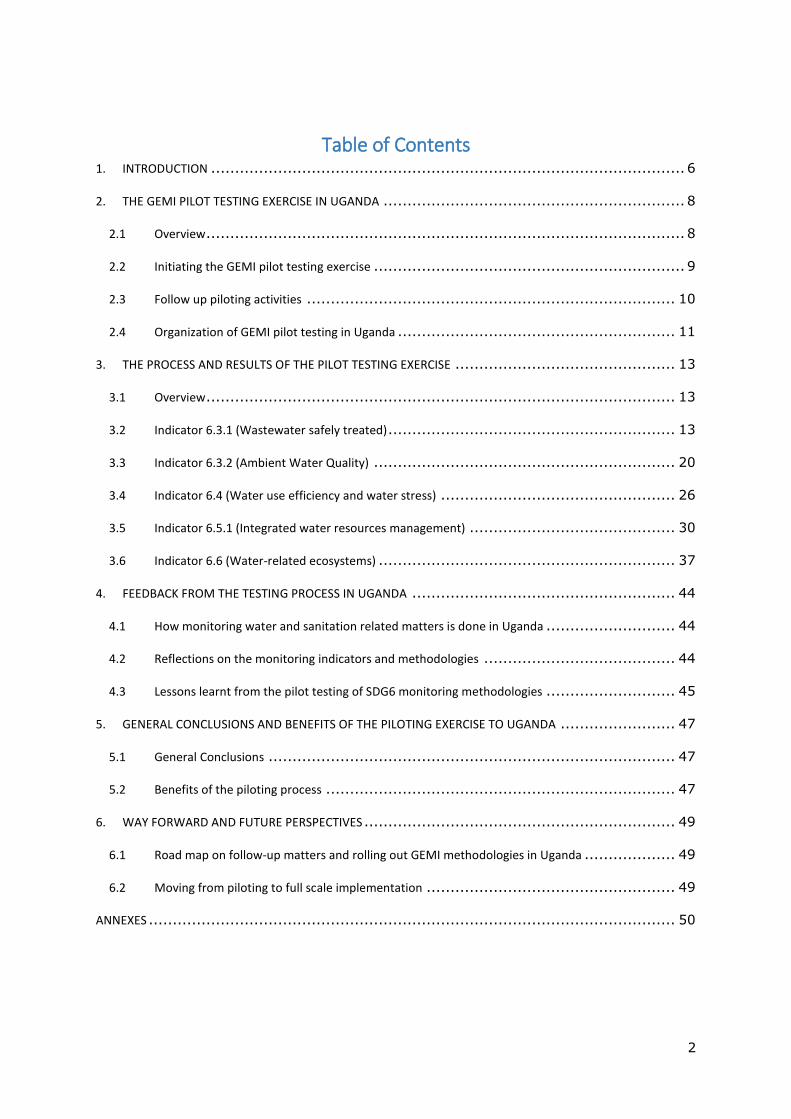
Table of Contents 1. INTRODUCTION ................................................................................................... 6
2. THE GEMI PILOT TESTING EXERCISE IN UGANDA ............................................................... 8
2.1 Overview .................................................................................................... 8
2.2 Initiating the GEMI pilot testing exercise ................................................................. 9
2.3 Follow up piloting activities ............................................................................. 10
2.4 Organization of GEMI pilot testing in Uganda .......................................................... 11
3. THE PROCESS AND RESULTS OF THE PILOT TESTING EXERCISE .............................................. 13
3.1 Overview .................................................................................................. 13
3.2 Indicator 6.3.1 (Wastewater safely treated) ............................................................ 13
3.3 Indicator 6.3.2 (Ambient Water Quality) ............................................................... 20
3.4 Indicator 6.4 (Water use efficiency and water stress) ................................................. 26
3.5 Indicator 6.5.1 (Integrated water resources management) ........................................... 30
3.6 Indicator 6.6 (Water-related ecosystems) .............................................................. 37
4. FEEDBACK FROM THE TESTING PROCESS IN UGANDA ....................................................... 44
4.1 How monitoring water and sanitation related matters is done in Uganda ........................... 44
4.2 Reflections on the monitoring indicators and methodologies ........................................ 44
4.3 Lessons learnt from the pilot testing of SDG6 monitoring methodologies ........................... 45
5. GENERAL CONCLUSIONS AND BENEFITS OF THE PILOTING EXERCISE TO UGANDA ........................ 47
5.1 General Conclusions ..................................................................................... 47
5.2 Benefits of the piloting process ......................................................................... 47
6. WAY FORWARD AND FUTURE PERSPECTIVES ................................................................. 49
6.1 Road map on follow-up matters and rolling out GEMI methodologies in Uganda ................... 49
6.2 Moving from piloting to full scale implementation .................................................... 49
ANNEXES .............................................................................................................. 50
3
Acronyms
BOD Biochemical Oxygen Demand
CSOs Civil Society Organization
DEA Directorate of Environmental Affairs
DEM Digital Elevation models
DO Dissolved Oxygen
DTM Digital Terrain models
DWD Department for Water Development
DWRM Directorate of Water Resources Management
EAC East African Community
EC Electrical conductivity
EU European Union
FAO Food and Agriculture Organization
FSSD Forest Sector Support Department
GEMI Global Expanded Water Monitoring Initiative
GIZ Deutsche Gesellschaft für Internationale Zusammenarbeit
GLAAS Global Analysis and Assessment of Sanitation
GWPEA Global Water Partnership Eastern Africa
IGAD Inter Government Agency on Development
IGRAC International Groundwater Resources Assessment Centre
IRIS Reporting Information System
IUCN International Union for Conservation of Nature
IWMI International Water Management Institute
JMP Joint Monitoring Programme
KCCA Kampala City Council
LVBC Lake Victoria Basin Commission
MDAs Ministries, Departments and Agencies
MDG Millennium Development Goals
NaFRRI National Fisheries Resources Research Institute
NBI Nile Basin Initiative
NEMA National Environment Management Authority
NEMA National Environment Management Authority
NFA National Forest Authority
NGOs Non-Governmental Organizations

4
NWQRL National Water Quality Reference Laboratory
NWSC National water and Sewerage cooperation
PoC Proof of Concept
SDC Swiss Agency for Development and Cooperation
SDG Sustainable Development Goals
TN Total Nitrogen
TP Total phosphate
UBOS Uganda Bureau of Statistics
UNEP United Nations Environment programme
UNESCO United Nations Educational, Scientific and Cultural Organization
UNICEF United Nations Children's Fund
UWA Uganda Wildlife Authority
UWASNET Uganda Water and Sanitation NGO Network
WHO World Health Organization
WMO World Meteorological Organization
WWF World Wide Fund for Nature

5
Acknowledgements
The SDG6 indicator pilot testing exercise in Uganda involved a number of organisations and
people from within Uganda and outside. Special thanks go to the Ministry of Water and
Environment in Uganda for the overall coordination and strategic leadership to the exercise.
The commitment and hard work of the various multi-sectoral task teams for the various
targets and indicators is greatly appreciated. Without this hard work the piloting exercise
would not have been completed successfully and in record time. The contributions of the
many other people who participated in one way or the other in this exercise are greatly
appreciated. The technical guidance and support provided by the UN Water Team from the
beginning of the piloting exercise up to the end contributed immensely to the success of the
exercise. In a special way the financial support provided by United Nations Environment
Program (UNEP) made it possible to engage a support consultant and also hold a number of
workshops during the piloting exercise. On behalf of UN Water, the Global Water
Partnership Eastern Africa provided logistical support to the Ministry of Water and
Environment especially during holding of the many workshops and task team meetings. This
piloting exercise was therefore successfully completed due to the various contributions and
support of the organisations mentioned above and many other people who participated in
data collection for various indicators and also in the various workshops. All this support is
greatly appreciated by the SDG6 piloting team in Uganda.

6
1. INTRODUCTION
Water and sanitation, as absolute necessities for people, planet and prosperity, are at the
very core of sustainable development. Safe drinking water and adequate sanitation and
hygiene are pillars of human health and well-being. The 2030 Agenda for Sustainable
Development includes a dedicated goal on Water and Sanitation (SDG 6) that sets out to
“ensure availability and sustainable management of water and sanitation for all.” SDG 6
expands the MDG focus on drinking Water and Sanitation to cover the entire water cycle,
including the management of water, wastewater and ecosystem resources. With water at
the very core of sustainable development, SDG 6 does not only have strong linkages to all of
the other SDGs, it also underpins them; therefore meeting SDG 6 would go a long way
towards achieving much of the 2030 Agenda.
SDG 6 contains six targets on outcomes across the entire water cycle, and two targets on
the means of implementing the outcome targets.
The targets for Sustainable Development Goal 6 are: 6.1 By 2030, achieve universal and equitable access to safe and affordable drinking water
for all
6.2 By 2030, achieve access to adequate and equitable sanitation and hygiene for all and
end open defecation, paying special attention to the needs of women and girls and
those in vulnerable situations
6.3 By 2030, improve water quality by reducing pollution, eliminating dumping and
minimizing release of hazardous chemicals and materials, halving the proportion of
untreated wastewater and substantially increasing recycling and safe reuse globally
6.4 By 2030, substantially increase water-use efficiency across all sectors and ensure
sustainable withdrawals and supply of freshwater to address water scarcity and
substantially reduce the number of people suffering from water scarcity
6.5 By 2030, implement integrated water resources management at all levels, including
through transboundary cooperation as appropriate
6.6 By 2020, protect and restore water-related ecosystems, including mountains, forests,
wetlands, rivers, aquifers and lakes
Targets 6.1 and 6.2 build on the MDG targets on drinking water and basic sanitation,
providing continuity while expanding their scope and refining definitions. Targets 6.3 to 6.6
address the broader water context that was not explicitly included in the MDG framework,
but whose importance was acknowledged at the Rio+20 Conference, such as water quality
and wastewater management, water scarcity and water-use efficiency, integrated water
resources management, and the protection and restoration of water-related ecosystems.
Targets 6.a and 6.b acknowledge the importance of an enabling environment, addressing
the means of implementation and aiming for international cooperation, capacity-building
and the participation of local communities in water and sanitation management

7
In embarking upon the 2030 Agenda for Sustainable Development with a dedicated goal on
water and sanitation, credible data is needed to underpin sector advocacy, stimulate
political commitment, inform decision making and trigger well-placed investment towards
optimum health, environment and economic gains. Therefore, monitoring is critical to
ensure the success of the SDG 6.
At present, there are several global initiatives that are monitoring different aspects of the
water sector, but a coherent framework is missing. To respond to the monitoring needs of
SDG 6, an Inter-Agency Initiative called “Integrated Monitoring of Water and Sanitation
Related SDG Targets” (GEMI) was established in 2014 under the UN-Water “umbrella”. A
GEMI Steering Committee was also established, consisting of seven United Nations Agencies
working under the coordination of UN-Water. The committee members are UNESCO, UNEP,
UN-HABITAT, WHO, FAO, UNICEF and WMO, and this initiative is financed by the Swiss
Agency for Development Cooperation. GEMI aims to integrate and expand existing efforts to
ensure harmonized monitoring of the entire water cycle.
Focusing on aspects related to water, wastewater and ecosystem resources, GEMI
complements WHO/UNICEF Joint Monitoring Programme for Water Supply and Sanitation
(JMP) and UN-Water Global Analysis and Assessment of Sanitation and Drinking-Water
(GLAAS) efforts on drinking water and sanitation.
The objective of the GEMI initiative is to develop coherent methodologies for monitoring in
an integrated manner water and sanitation related SDG targets. The first phase of this
Initiative has been focussing on the development of a Monitoring Guide for use by
countries, and for the establishment of a global baseline. However, before the
methodologies can be rolled-out globally, they need to be pilot tested in a small number of
countries and be revised as necessary based on lessons learned.
GEMI is currently in its Proof of Concept phase. As a first step within this phase draft
monitoring methodologies were prepared for the indicators relating to SDG targets 6.3-6.6.
The next step was to present and test these methodologies in six countries in order to
collect, collate and integrate feedback with a view to refining and improving them. The six
countries selected to pilot-test the monitoring methodologies for SDG 6 include Uganda and
Senegal in Africa, Peru in Latin America, the Netherlands in Europe, Jordan in the Middle
East and Bangladesh in Asia.
This report details the approach employed to piloting the methodology for monitoring SDG
6 in Uganda, documents the results of the piloting, experiences and lessons learnt and
proposed changes to the methodology before global roll out. It is anticipated that the report
will be useful for Uganda in its move toward full scale monitoring and report on SDG6 and
also other countries which are yet to embark on monitoring SDG6.

8
2. THE GEMI PILOT TESTING EXERCISE IN UGANDA
2.1 Overview
Uganda as one of the six countries selected for such pilot testing of SDG6 indicators held its
first national stakeholders’ workshop on 15 and 16 June 2016 in Kampala, Uganda. This
workshop kick started the process of testing the methodologies for monitoring indicators.
The final workshop was held on 22 and 23 September 2016. The final workshop was
followed by compilation of the Uganda piloting report based on reports by the task teams
for various indicators.
The pilot testing process that took 4 months was led by the Uganda Ministry of Water and
Environment and UN-Water with support from GEMI partners. The process was facilitated
by GWP Eastern Africa. This report therefore provides the process and results of the GEMI
piloting in Uganda.
The key processes during the pilot testing included the following:
• The exercise started with a workshop on 15 and 16 June 2016 that brought together
representatives of various government agencies, NGOs and other stakeholders that
are primarily involved in the Water and Sanitation sector. The workshop was convened
by the Ministry of Water and Environment in Uganda and was facilitated by the team
from UN Water consisting of various UN bodies namely UNEP, UNICEF, FAO, WHO,
IWMI. During this workshop, the stakeholders were briefed about the objectives of the
piloting exercise, methodologies and how it will inform the future global monitoring of
SDG 6.
• Task teams were constituted for each of the SDG targets, team leaders were identified
and formally appointed by the Permanent Secretary of the Ministry of Water and
Environment (PS, MWE). The task teams held a workshop on 5 July 2016 to kick start
the work of the task teams. In their individual teams, the task teams brainstormed and
identified organisations that are implementing activities related to the SDG 6.
• A generic letter was written by the PS, MWE to all the identified Ministries,
Departments and Agencies (MDAs), including CSOs, NGOs, research institutions,
religious and cultural institutions, among others, requesting them to nominate
representatives to the task team. This was an open invitation that provided for the
affected MDAs to further invite other collaborating organisations within their sectors.
• The nominated members were co-opted to the task team, and requested to provide
the necessary information relevant to pilot exercise. The teams thereafter undertook
intensive data collection including holding individual meetings/workshops.
• Various workshops were held during the piloting process. On 26 August 2016 a
progress review workshop was held to expand the task teams and agree on next steps
for finalising pilot testing while a final piloting workshop was held on 22 and 23
September 2016 to review the progress of the piloting activities. A task team

9
workshop was held on 28 October 2016 to review and discuss the final task team
reports.
• The various task teams prepared reports for the different indicators and these were
used to prepare the Uganda Proof of Concept Final Report
2.2 Initiating the GEMI pilot testing exercise
As mentioned before the GEMI pilot testing process in Uganda was initiated on 15 and 16
June 2016 through a startup workshop attended by about 60 participants representing key
water related stakeholders. The support to organize and fund the workshop was provided
by UNEP on behalf of UN Water. Local level organizational support was provided by Global
Water Partnership while the coordination of the workshop was provided by Ministry of
Water and Environment in Uganda. The aim of the workshop was to:
Introduce to participants to SDG 6 targets and indicators
Present the draft monitoring methodology for the different SDG indicators
Kick start the piloting of the SDG 6 indicators
During the start-up workshop agreement was reached by the workshop participants that the
piloting would be undertaken over a 3 months period (1 July-30 Sept 2016). In addition the
meeting agreed that the proposed indicators under GEMI framework would be considered
for piloting and noted that the required data would come from existing sources and/or new
data would be collected during the piloting phase. The meeting reviewed and agreed to the
use of the proposed methodologies in collecting data for the various indicators. The meeting
agreed to constitute Task Teams to spearhead implementation of the methodologies for
each of the indicators and went ahead to propose institutions to constitute these task teams
based on their mandate with respect to the required data. The meeting also agreed on the
institutional arrangements for the piloting process and agreed that the coordination role
would be performed by the Ministry of Water and Environment. Finally, the meeting agreed
that the piloting process will use available resources and capacities in Uganda but GEMI
partners and GWPEA will provide technical support as required.
The proposed timelines for the piloting is presented in Table 1 below.
No What When
1 Week 4 (June 16) form Task Teams (6.3, 6.4, 6.5 &6.6) designate Lead Institutions/Departments for Task Teams
2 Week 1 to 4 (July 16) hold the First Meeting of the Task Teams identify sources of data compile available data (secondary data)
3 Week 1&2 (August 16) collect additional data (primary and secondary data)
4 Week 3&4 (August 16) review and analyze collect data (task teams)
5 Week 1 &2 (Sept 16) compile draft reports (individual Task Teams) preparations for final workshop
6 Week 4 (Sept 16) final piloting workshop

10
7 Week 1 and 2 (Oct 16) Update and finalize task team reports
8 Week 3 and 4 (Oct 16) compilation and submission of overall country report
2.3 Follow up piloting activities
According to the action plan above the whole of July and August 2016 was used by the
various task teams to collect the data for use in testing the various methodologies. The task
teams organized meetings and some organized working sessions to work together to
analyze the data as part of the piloting. Some of the task teams requested and received
technical support from UN Water Partners namely FAO for target 6.4 and from WHO for
Target 6.3.1.
In order to keep track of the progress of the task teams in the piloting process a progress
review workshop was held on 28 August 2016. The specific aim of the workshop was to
review progress of the work of the task teams, agree on next steps for finalization of the
pilot testing and to expand the national inter-sectoral monitoring team for SDG 6
After the task teams had finalised the pilot testing a final GEMI workshop was held on 22
and 23 September 2016 with the following objectives :
• Assess the general progress of pilot testing
• Receive feedback on technical feasibility of the monitoring methodology for different
indicators
• Receive feedback on the institutional setup or process to implement the
methodologies
• Review lessons learned and recommendations for improving methodologies and
implementing them at the global level
• Agree on next steps for finalising the pilot testing
• Provide input into the country roadmap for baseline data collection in 2017-2018
During the final review workshop each task team presented a report on the piloting and this
enabled the workshop participants to make comments and suggestions for consideration as
the final reports are being prepared. During the workshop it was noted that all the task
teams had made very good progress with the piloting and the process was generally
successful. The participants made some comments and suggestions on the task team
reports for consideration. A way forward was proposed after the final GEMI workshop and
this included the following actions:
• Submission of pilot testing reports per SDG6 target by 15 October 2016
• Compilation of Uganda SDG6 piloting report and submission to UN Water by 31
October 2016
• Preparation of an action for implementing recommended actions arising out of the
piloting by 10 November 2016
• Funds mobilization and start of implementation of recommended actions by 15
November 2016
• Baseline data collection by January 2017

11
• Reporting on SDG6 by Uganda by 2018
As part of following up the above action plan a GEMI task team meeting was held on 28
October 2016 to review task team reports with feedback on technical feasibility of the
monitoring methodology for different indicators, institutional setup / process to implement
the methodologies, review lessons learned and recommendations for improving
methodologies and implementing them at the global level and identify follow up actions
from the piloting. During this meeting task team reports were reviewed by all task team
members and final suggestions were made for compilation of the Uganda SDG6 piloting
report.
In general it can be concluded that the SDG6 piloting excercise in Uganda was highly
participatory and comprehensively undertaken by a multi-disciplinary team from various
organisations including government, civil society, academic institutions, religions and
cultural institutions, development partners etc.
2.4 Organization of GEMI pilot testing in Uganda
The GEMI pilot testing was organized by the UN Water. However the overall coordination of
GEMI pilot testing activities in Uganda was provided by the Ministry of Water and Environment.
The Ministry of Water and Environment designated Dr Callist Tindimugaya, Commissioner for
Water Resources Planning and Regulation as the overall coordinator for the piloting exercise.
On behalf of the entire UN-Water Integrated Monitoring Initiative team the United Nations
Environment Program (UNEP) coordinated the piloting activities in Uganda. UNEP worked with
the Ministry of Water and Environment in Uganda to plan for and organize the various
workshops held during the piloting. UNEP also provided funding for the various workshops.
Support to the Ministry of Water and Environment in making local arrangements for the piloting
activities and organizing the various workshops was provided by the Global Water Partnership,
on behalf of UN Water.
To ensure that implementation of the piloting activities was well coordinated, a task team for
each of the targets was set up with each having two senior officials from relevant institutions to
co-lead the piloting activities for a particular target to indicator. The task teams that were
created with the task team coordinators are presented in Annex 3. The task team leaders were
drawn from government agencies with mandates to undertake activities related to the indicator.
The task team leaders were formally appointed in writing by the Permanent Secretary, Ministry
of Water and Environment, who is the technical head of the Ministry, and were given a
responsibility of ensuing that the piloting exercise for their indicator was undertaken in a highly
participatory manner and completed within the 3 months piloting period. This formal
appointment of the task team leaders ensured that the piloting tasks were given serious

12
attention as directed by the technical head of the ministry. Each task team was requested to set
up a multi-disciplinary team representing all relevant organizations. To this effect formal letters
requesting organizations to nominate participants to the various task teams were issued out by
the Permanent Secretary, Ministry of Water and Environment. For officials outside the Ministry
of Water and Environment, requests for appointment of the task team leaders and members
was communicated to the heads of their institution who were also requested to allow their staff
to actively participate in the piloting exercise. Based on this the piloting exercise was given
priority as it had the blessing and support of the heads of the participating institutions.
The overall SDG6 piloting coordinator kept in touch with the task team leaders for purposes of
ensuring that the piloting exercise is on track and that the required to the task team is provided.
The overall coordinator was also responsible for keeping track of the progress of the overall
piloting process with respect to the agreed action plan. Support was provided to the overall
coordinator, as necessary by the Global Water Partnership. This was especially with regard to
organizing the logistics for the various meetings.
Each task team handled a particular indicator or a set of indicators falling under a particular
target. The task teams kept close link with the relevant UN Agencies mandated to support the
piloting of the particular indicators. For example the task team for 6.3.1 kept in touch and was
supported by WHO, the task team for 6.3.2 kept in touch and was supported by UNEP, task team
for 6.4 was supported by FAO, Task team for 6.5.1 was supported by UNEP, task team for 6.5.2
was supported by UNESCO and UNECE while task team for 6.6 was supported by UNEP and
IWMI. The SDG6 piloting organogram for Uganda is presented in Annex 4.

13
3. THE PROCESS AND RESULTS OF THE PILOT TESTING EXERCISE
3.1 Overview
As mentioned earlier pilot testing was undertaken through various task teams set up around
the various indicators. The testing of the methodologies by the task teams as well as
identification of data sources (primary and secondary data) and compiling of the reports
was done per indicator. The task teams were also guided by the review framework (Annex 5)
that was provided by the UN Water. Thus, for consistency the process and results of the
pilot testing are presented per indicator as indicated below.
3.2 Indicator 6.3.1 (Wastewater safely treated)
As part of the review indicator monitoring methodology for 6.3.1 indicator 6.2.1 was also
considered due to the strong linkages.
The Contact person for the 2 indicators are:
1. Richard Matua (Assistant Commissioner, Urban Sanitation and Sewerage Division,
Directorate of Water Development (DWD), Ministry of Water and Environment
(MWE), SDG 6.2 Task team leader) ([email protected])
2. Trinah Kyomugisha (Environmental Health Officer, Urban Sanitation and Sewerage
Division, DWD, MWE, SDG 6.2 Task team) ([email protected])
3. Irene Mugabi (Senior Manager, Water Quality Management, the National Water and
Sewerage Corporation (NWSC), SDG 6 Co-task team leader)
4. Mohammed Babu (Manager Central Laboratory Services, (NWSC), Representative
SDG Target 6.3) ([email protected])
5. Collins Mwesigye (Facilitator SDG 6.2/6.3, World Health Organization (WHO)
Uganda) ([email protected])
a) Technical steps taken in testing the monitoring methodology of the indicator
The technical steps undertaken in testing the methodology of the indicator included the
following:
Data collection/acquisition
Secondary data from municipal wastewater treatment plants run by NWSC (15
towns) was collected and used to test part A of the methodology for 6.3.1
Data from the outlet/effluents of sewerage treatment plants was reviewed.
Note:Wastewater and faecal sludge received at the treatment plants cannot be
segregated as households and non-hazardous waste from commercial activities
(public toilets, Hotels, Restaurants and institutions).

14
Data on transportation of faecal sludge is not readily available.
Some data is available on industrial wastewater at DWRM, however there is need for
a comprehensive inventory of all industrial discharges in the country.
Data quality control
Data used/reviewed is collected by service provider (NWSC). Periodic audits are
conducted by NWSC central lab to verify field data. Standard methods (APHA, 1998)
are used for analysis
The data from the service provider can only be quality assured by an independent
regulator.
Aggregation and analysis
Individual BOD values (monthly) for all plants are used to calculate percentage
compliance and reported as single figure of annual performance. Aggregation as
averages tend to skew the results
Assumptions or modifications made to the draft methodology
The same methodology used in 6.3.2 applies in 6.3.1 for sampling of wastewater and
generation of data in the laboratory.
Strengths foreseen during future implementation:
Relevant institutions for monitoring the indicator are in place.
Wastewater monitoring programs exist in some institutions.
Existence of skilled human capacity
Challenges encountered and/or foreseen during future implementation
Financial constraints:
- to monitor all the parameters in particular pathogens.
- to improve on monitoring e.g. availability of equipment at regional level.
Data sharing among collaborating institutions.
It is difficult to know and monitor whether all the wastewater from the septic tanks
is emptied and transported safely to the wastewater treatment plants.
Based on the current definition of the indicator, there is a potential risk that the
majority of the treatment plants (lagoons) will be categorized as unsafely managed.
It is proposed that even lagoons complying with National Effluent Discharge
standards should be categorized as safely managed.
b) Institutional arrangements made for testing the monitoring methodologies, and for
coordination across government bodies, including the national statistics office
The institutions that were involved in the testing of the methodology are:
Ministry of Water and Environment (DWRM, DWD, NEMA)– lead the team and
provided overall coordination
National Water and Sewerage Corporation – responsible for municipal wastewater
monitoring and faecal sludge data in towns under their jurisdiction.
UBOS – provision of population data.
WHO - providing technical and financial support in testing the monitoring
methodology.

15
Ministry of Health – provision of information on household sanitation with technical
and financial assistance from WHO.
Ministry of Education and Sports – Provision of sanitation data from schools
Kampala City Council Authority – Information of faecal sludge collection and general
sanitation information from Kampala.
Other institutions that will play different roles include: Ministry of Local
Government, Ministry of Internal Affairs (Prisons, Police) and Ministry of Defense
(Army).
Pilot testing of the monitoring methodology was specifically coordinated by 2 staff from
the National Water and Sewerage Corporation namely Dr Irene Mugabi and Dr
Mohammed Babu. NWSC handles waste water management and faecal sludge
management in major towns in Uganda and so has the required data. Pilot testing for
6.2 was coordinated by Eng Richard Matua from the Directorate of Water Development
(DWD) in the Ministry of Water and Environment. DWD is handles faecal sludge
management in small towns in Uganda.
The main strengths with coordinating piloting Indicator 6.2 and 6.3.1 through the
Directorate of Water Development and NWSC is that both organisations provide support
for collection of data relevant to this indicator. In addition both institutions fall within
the same ministry and coordinate closely together during provision of water supply and
sanitation services in urban areas.
In total, more than 40 individual stakeholders were directly introduced to the
methodology framework for indicator 6.2 and indicator 6.3.1 and these include the
following among others:
Makerere University
World Bank
Kampala Capital City Authority
Deutsche Gesellschaft für Internationale Zusammenarbeit (GIZ)
Sanitation Africa (private entrepreneur)
Water for People Uganda
c) Resources and capacity required for the pilot testing
Estimates of person-days – full time employment in institutions mandated to collect
data for monitoring the indicator.
Specific skills – Expertise is required in the areas of water quality, sanitation, water
resources management, statistics, wastewater treatment, public health,
environment management and transporters.
Other resources used for testing: Laboratory facilities, Data processing and storage
equipment, Vehicles for transport.
Any direct or indirect financial costs incurred:
16
o Costs incurred using secondary data included transport costs,
meeting/workshop costs, stationary etc.
o Collection of primary data will include employee salaries, transport costs,
logistics for field work and additional equipment, operation and maintenance costs for
laboratory facilities.
Strengths
Institutional commitment
Availability of other resources and capacity
d) Feedback on the following, as experienced during testing and/or foreseen during
future implementation:
i. Methodology
The methodology could not be tested comprehensively due to data gaps.
It is relevant
Safely managed is difficult to measure for onsite sanitation as containment of
faecal waste cannot be guaranteed e.g. possibility of groundwater
contamination by onsite facilities.
For 6.3.1, the methodology for part A is feasible however challenges were
encountered as indicated in the comments below
The methodology for part B is not well developed. The detailed processes of
monitoring from sampling of wastewater to generation of data has not been
defined. It is recommended that the same methodology used in 6.3.2 applies
in 6.3.1 for sampling of wastewater and generation of data in the laboratory.
Indicator reporting is proposed to be on annual basis yet progressive
monitoring of wastewater treatment systems is on monthly basis. This may
not be representative hence monitoring frequency may be required to be
increased which is an added cost
There may be issues of data availability, access and disaggregation as
mentioned in section b(i) above.
On temporal coverage, it may be difficult to extrapolate coverages because
some events or actions may drastically change (disasters or projects).
The methodology does not cover monitoring non-point pollution e.g. from
agricultural areas.
It is difficult to estimate the proportion of wastewater lost from containment
to disposal.
Leakages are monitored but there is no methodology to estimate/quantify
loses; it could be more relevant if a standardized method is developed.
The percentage of treated wastewater that complies with National Standards
to be provided as averages. The following is observed:
- They maybe differences in performance of the same plant due to
seasonal changes (especially for lagoons) or any other factors
- They may also be differences in performance for different ponds in
different towns even within the same period
17
These differences may skew the averages (in case of outliers) resulting in either
under performance or over performance of the ponds. We would propose we
look at compliance of plants effluent to the required standard other than average
measurement. That is the percentage of samples that complies to the standard
against the total number of samples tested over a period of 1 year. Average
values based on general data will be misleading but averages from plants that
comply can give a better and accurate picture.
Based on the piloting exercise some specific comments have been made on the
methodology as follows:
#1: It is clear to monitor point sources such as wastewater from households and
economic activities. How does the methodology take care of non-point sources
like agriculture? For instance in Uganda, we have a lot of agricultural activities
around the mountain areas that use fertilizers and pesticides. For countries with
extensive agriculture, this may pose a big challenge
#2: Handling of wastewater (domestic in Uganda) is done in two ways: (i)
centralized sewer (ii) on site through septic tanks. For centralized sewers it is
straight forward and can be handled. Although it was nice that the on site will be
handled in target 6.2.1, there are challenges with regards to data e.g. data on the
following may not be available:
- The performance of the septic tanks
- The design types, size, construction materials
- Lined or not lined?
- Presence of soak pits, how do they impact ground water resources and finally
the public
#3: In figure 4 of the methodology, primary treatment (where ponds are classified)
is considered as “not safely managed”. Ponds if operated well can achieve
treatment performance as required by National Discharge Standards hence it is
not fair to categorize them as not safely managed. It is better to gauge
performance against a set standard based on actual collected data, other than
whether a system is secondary or tertiary system as that may be misleading.
#4: They are differences in National Standards as set by different countries. For
instance EU sets BOD levels for filtered samples at 20 mg/l and from advanced
treatment systems. Uganda sets standards at 50 mg/l for unfiltered samples from
primary treatment. This is unrealistic for ponds systems which have algae in the
effluent. We recommend a criteria that will harmonize the different standards for
different technologies from different countries.
ii. Clarity and usefulness of the step-by-step guide
The guide is generally clear
There is need to build capacity at the treatment plant level to optimize the
systems and capture more reliable data

18
Based on the test piloting the following specific comments have been made on
the questionnaire.
#5: T5- It is difficult to estimate the proportion of wastewater lost from the
network especially through leakages. Is there a criteria recommended?
#6: T11- The percentage of treated wastewater that complies with National
Standards to be provided as averages. The following is observed:
- They maybe differences in performance of the same plant due to seasonal
changes (especially for lagoons) or any other factors
- They may also be differences in performance for different ponds in different
towns even within the same period
These differences may skew the averages (in case of outliers) resulting in either
under performance or over performance of the ponds.
We would propose we look at compliance of plants effluent to the required
standard other than average measurement. That is the percentage of samples
that complies to the standard against the total number of samples tested over a
period of 1 year. Average values based on general data will be misleading.
#7: T16: Most sewage sludge received at the treatment plants are of domestic
nature and not segregated between domestic, public toilets or institutions. Item 4
(proportion from sewage sludge) under T16 is not clear
#8: T19 - T19A: There are no National Standards for fecal sludge in Uganda, we
only refer to WHO standards. However, we don’t measure pathogen loads in
sludge and this is a gap in data that needs to be filled.
#9: T21- T23A: The sludge liquid fraction is co-treated with the mainstream
wastewater. Data specific to effluent for the sludge liquid fraction is not available.
iii. Technical support provided by UN technical agencies and others, including external
organizations
Technical support was provided by WHO which sent to Uganda a technical
expert to guide the team in the use of the methodology and analysis of the
collected data. The expert cam to Uganda twice during the piloting process. In
addition ongoing technical and logistical support to the task team was
provided the Uganda WHO office
Technical support from WHO for piloting part A of 6.3.1 was adequate, but
more support will be required during the baseline data collection and analysis
stage.
Technical support for piloting part B of 6.3.1 was not adequate
iv. Likely usefulness of the data obtained using the draft methodologies at national and
subnational levels
The data will be useful in:

19
Policy making and priority setting e.g. the extent of sewerage coverage may
influence priority setting
Decision-making, management of resources and services e.g. allocating of
resources based on the extent of people receiving safe sanitation services
Attracting finance (public, private or donor) and awareness building e.g. the
proportions of unsafely discharged wastewater may capture attention of
environmental quality and ambient water.
v. Link of the monitoring of this indicator to existing processes and to the measurement of
other indicators (at the national, sub-national, regional or global levels)
Monitoring of this indicator directly measures progress of National
Development Plans.
Monitoring of this indicator will also contribute to annual reviews that
measure sector performance.
vi. The most appropriate frequency of measurement of this indicator in Uganda
Every two years
vii. Any other issues to share arising from your experience of pilot testing the indicators not
covered by other questions
None
Specific questions on each indicator methodology
Proportion of wastewater safely treated
a. Is the proposed monitoring framework for wastewater from households and
industries understood by stakeholders in the sector? If no, which parts are not well
understood? No
Methodology of part B is not yet developed hence not fully understood by all
stakeholders including the lead team
Population served is not easy to estimate for commercial facilities.
b. Any data gaps or data quality issues encountered
There are data gaps in microbial indicators for wastewater
c. Any verified regulatory data on off-site wastewater treatment
No
d. Where no official data exists, what reliable sources of data are available for existing
wastewater treatment from on-site facilities
Data on on-site sanitation may be obtained from urban authorities, local
governments and Ministry of Health.
e. Does your country have an inventory of industrial discharges and data on compliance
with permits?
Some data exists but there is no comprehensive inventory of wastewater
discharges
f. What assumption can be applied where data is lacking?

20
Extrapolation of data of wastewater is difficult because some events or actions
may drastically change (disasters or projects).
g. Do you routinely compare the results of water quality monitoring in particular areas
where wastewater discharges are monitored?
Wastewater quality monitoring data is compared and reported routinely in the
Annual Sector Performance Report.
h. Which opportunities exist to integrate and extend existing data collection and
reporting over the next 1-3 years to cover gaps in the proposed methodology?
Presence of existing monitoring programs in the Ministry of Water and
Environment, Utilities, Urban Authorities such as KCCA and UBOS.
Existence of institutions with mandates that include data collection on sanitation,
municipal and industrial wastewater.
Existence of skilled personnel.
3.3 Indicator 6.3.2 (Ambient Water Quality)
The indicator monitoring methodology that was reviewed is 6.3.2
The Government bodies / other institutions involved in the testing include:
1. Directorate of Water Resources Management, Ministry of Water and Environment,
Uganda
The Contact person(s) for the indicator are:
1. Ms. Idrakua Lillian, Ag. Commissioner, Water Quality
2. Mr. John Peter Obubu, Principal Analyst [email protected]
a) The technical steps taken in testing the monitoring methodology of the indicator
The steps taken in the testing of the monitoring methodology for the indicator included
the following:
Process
Holding of task team meeting on 5 July 2016 to kick start the piloting process
Undertaking intensive data collection from various sources
Holding of individual task team meetings/workshops to review the methodology and
the data collected
Provision of follow up technical and logistical support by WHO on behalf of the UN
Water partners
Expansion of the task team to include other organisations outside the Ministry of
Water and Environment
Holding of task team meetings to review the data collected and prepare task team
report.
Data collection/acquisition
21
Secondary data was collected from the national monitoring program of Department
of Water Quality Management was used
For future monitoring of the SGD target, data is also expected to be submitted to
National Water Quality Database by service providers as required by law
Research institutions may also have data collected for specific research questions
Need to agree on how national data will be submitted for GEMI
Data quality control
The National Water Quality Reference Laboratory (NWQRL) of Directorate of Water
Resources Management at Entebbe operates according to ISO/IEC 17025 and is
preparing for accreditation. The quality system covers both sampling and
laboratory work
The NWQRL is planning to institute a local inter-laboratory comparison scheme to
quality assure data from other laboratories in the country.
Aggregation and analysis
Data for 10 stations out of 19 on Lake Victoria Ugandan side for 2014 and 2015 was
used to test the methodology.
Analysis was done for 4 out of 5 parameters. There is no routine monitoring data on
Feacal coliform bacteria for the lake.
Assumptions or modifications made to the draft methodology
Target values suggested in methodology were partially applied because some
proposed target values (e.g EC of 500 μS/cm is too high for some water bodies in
Uganda).
Groundwater and wetlands were not included. Parameters for groundwater
monitoring are drinking water parameters that are problematic in Uganda such as
iron, hardness, chlorides, fluorides etc. The quality of groundwater is better
handled under 6.1.
Targets for water bodies in Uganda will be set based on current or intended water
use, ecosystem health (eutrophication, toxicity to fish e.t.c) and geology of area.
- Modifications include:
Faecal Coliform Bacteria (FCB) were omitted when index was calculated for Lake
Victoria. FCB are not routinely analyzed for ambient water quality in Uganda.
Strengths foreseen during future implementation:
Relevant institutions for monitoring the indicator are in place.
A monitoring program for ambient water quality exist in DWRM.
Well-equipped laboratories that use international method of analysis and standards
exist for monitoring the indicator
Existence of skilled human capacity
Challenges encountered and/or foreseen during future implementation

22
Financial constraints:
- To monitor all the parameters in particular pathogens.
- For regular collection of data. Available funding in the Directorate is inadequate and
flow of funds is irregular to support regular data collection
Data sharing among collaborating institutions.
b) Institutional arrangements made for testing the monitoring methodologies, and for
coordination across government bodies, including the national statistics office
Institutional arrangements were in place prior to PoC phase due to a historical
monitoring program. Key institutions DWRM, Service providers e.g NWSC, KCCA etc
The role of National Statistics Office needs to be defined, as there is currently no
linkage in ambient water quality monitoring
c) Resources and capacity required for the piloting
o Estimates of person-days – 88 person days were required for the testing during
the 3 months. But it’s a full time employment in institutions mandated to collect
data for monitoring the indicator.
o Specific skills – Expertise is required in the area of water quality management in
particular and water resources management in general.
o Other resources used for testing: Laboratory facilities (EC and DO meters,
digestion blocks for TP and TN, spectrophotometer and other laboratory
equipment for preparation of calibration standards) laboratory supplies (safety
equipment e.t.c) and reagents, data processing and storage equipment, vehicles
for transport and sampling.
i. Direct or indirect financial costs incurred
Costs incurred using secondary data collection included transport costs,
meeting/workshop costs, stationery e.t.c.
Cost for collection of primary data will include employee salaries, transport
costs, logistics for field work and additional equipment, operation and
maintenance costs for laboratory facilities.
Each monitoring trip for the 19 stations on Lake Victoria on the Ugandan side
costs at least USD 30,000 in terms of boat hire, fuel and allowances for
experts and boat crew. This does not include cost of standards for calibration
of meters and reagents. Monitoring is therefore at best done twice in a year.
10 transboundary stations have been established on R. Kagera, Nile at Owen
Falls dam, Lake Edward and Albert and River Nile but have never been
operationalized due to lack of funds. USD 40,000 is required to monitor
these stations four times in a year.
The Department of Water Quality Management (DWQM) gets a budget of
only USD 60,000 with which the department may manage to collect data only
once in a year from the 115 monitoring stations located country wide.
23
The principal mandate of DWQM is water quality management including
ambient water quality monitoring. The full capacity of the department is 39
technical staff.
d) What feedback do you have on the following, as experienced during testing and/or
foreseen during future implementation?
i) The methodology
Target values
o To generate target values for all lakes, rivers and streams there is currently
inadequate data for Uganda.
o The only lake in Uganda which had sufficient data for testing the methodology
was Lake Victoria
o Data for other lakes, rivers and streams are incomplete. There is a large dataset
available but there are too many gaps to generate target values and classify
waterbodies.
o A specific recommendation on minimum data requirement for target value
generation would be useful.
o Regional context needs to be taken into account for shared waterbodies for
example, Lake Victoria – targets set by countries should be the same.
o Target values for some parameters between lakes are neither comparable nor
useful. Therefore a lake-specific target value would be necessary. For example
natural electrical conductivity levels vary greatly between the major lakes in
Uganda.
o Meaningful target values for river and stream waterbodies can be set using
values from headwater, un-impacted monitoring stations, but this will take time.
Relevance
o Not all core parameters are relevant for all waterbody types. For example, the
monitoring of dissolved oxygen for groundwater. Other parameters such as
fluoride or metals may be more relevant and useful for groundwater monitoring
for countries, but they are natural in origin, and don’t necessarily measure
human impact. It is recommended that groundwater quality is monitored for 6.1
Flexibility of Methodology
o The Methodology is inflexible due to its insistence on using the core five
parameters. Measuring FCB for surface waters is not really feasible on a national
scale due to the financial resources and time needed to deliver samples to the
laboratory. FCB are only currently analyzed for drinking water samples.
Strengths
o Institutional commitment
o Availability of other resources and capacity
ii) The clarity and usefulness of the step-by-step guide
It is generally clear for an experienced professional in water quality management but
24
o Not necessarily so for someone with less experience in the water sector
o The rationale for the Indicator should be “sellable” to non-technical individuals
o The draft online module is useful for people not involved in the sector, but not
really useful for water quality professionals. It would be useful for beginners
o The proximity to target (PTT) calculation looks complicated although it was not
tested as large amount of data is required. It is recommended that countries be
left to report based on the ‘simple calculation of station percentage averages’.
iii) The technical support provided by UN technical agencies and others, including external
organizations
o UN-Water provided adequate support in terms of documentation and workshops
to assist participants to understand the SDGs
o UNEP through GEMS/Water provided adequate technical support for this
particular target
o WHO provided financial support for meetings and has been part of the piloting
process in Uganda
iv) Likelihood of the data obtained using the draft methodologies to be useful at national and
subnational levels
Data from the DWQM database was used and exercise has helped the department
to see where the gaps are.
v) Link of the monitoring of this indicator to existing processes and to the measurement of
other indicators (at the national, sub-national, regional or global levels)
o Monitoring of this indicator directly measures progress of National Development
Plans.
o Monitoring of this indicator will also contribute to annual reviews that measure
sector performance.
o The indicator measures impact of upstream (catchment) measures for pollution
control
o Data collected under this indicator can be used for monitoring change in rivers
and lakes under 6.6.1
vi) The most appropriate frequency of measurement of this indicator in Uganda
o Data is currently collected continuously and reported nationally on an annual
basis but with a lot of gaps in both spatial and temporal coverage.
o Reporting every three years on the Indicator would be ideal to identify changes
in water quality, without being too onerous on the Directorate.
vii) Any other issues arising from experience of pilot testing the indicators not covered by other
questions
o Prior to the PoC phase Uganda had an established monitoring network with
advanced analytical capability and applied ISO/IEC 17025 in the laboratory.
25
Countries without an established ambient WQ monitoring program will struggle
to achieve the same level of achievement in a short period of time.
o Laboratory Performance evaluation studies would be useful as provided by
GEMS/Water historically.
o A biological monitoring approach would be useful but would take a specific
project to generate baseline data needed to identify key species and pollution
tolerance levels.
o Assistance of GEMS/Water will be required for annual Proficiency Testing
o Training will be required in use of the Indicator Reporting Information System
(IRIS) and GEMStat
o There are data gaps in the DWRM database. A comprehensive screening of
major water bodies for required parameters will be required to fill data gaps and
capture seasonal changes before target values can be set.
o Regular monitoring will require financial support from UN organizations to
governments especially in the developed countries.
o Existence of ambient water quality monitoring station network in Uganda and
its coverage of all or a representative number of water bodies/basins. Any
necessity to develop a new network
There is an existing monitoring network in place, with 115 national water quality
monitoring stations, 19 stations on Lake Victoria and 10 trans-boundary stations.
Data collection from the stations is irregular and network is due for review. It
will not be possible to collect data from all this stations on regular basis. A
selection will be made.
o Existence of ambient water quality target values for the five parameters
necessary to calculate the index. If not, any historical monitoring data that
could be used to determine preliminary target values
A baseline establishment phase will be needed as highlighted above.
Historical data on EC, TP, TN and DO for lake Victoria was used to test the
methodology. Feacal coliform has not been monitored for ambient water
quality.
o Regularity and time sequence of collection of data on ambient water quality
If resources are available and timely released:
Surface water samples are to be collected four times per year (quarterly
basis)
Pollution monitoring generally collected six times per year
Groundwater monitoring generally twice per year
o Availability of data on ambient water quality and through which institution the
data is made available

26
Data are available through the Directorate of Water Resources Management
(DWRM) but also water supply service providers collect data from abstraction
points as a condition of abstraction permits issued by DWRM.
o Any assistance from online training on this indicator for the national efforts
and target audience
On-line training would be useful in the following areas: ISO standards,
laboratory quality systems and also practical short courses on
troubleshooting of equipment and maintenance or day-to-day problems
experienced in the lab which are only understood following years of
experience.
For imparting of skills, hands on training is required other than online
training. The target group would be laboratory and field technicians and
analysts.
Online training would be necessary for data management and analysis.
o Ability of national authorities to calculate a national water quality index, as
outlined in the step by step methodology. Which national authority and
whether the data will be made available in the SDG reporting process
The Directorate of Water Resources Management will be able to calculate
the national water quality index. However, preliminary work on target value
generation needs to take place first.
DWRM calculated the waterbody score for Lake Victoria using historical
monitoring data and target values suggested in the Methodology. This can
also be done following the description of the aggregation method in the
Methodology.
o Any need for the custodian UN agency to assist in providing these data
processing and index calculation services (e.g. through the UNEP GEMS/Water
Data Centre)
This could be an option, but agreement on data sharing and use would need
to be reached between Uganda and UNEP.
A portal system with security and sharing levels set by the country would be
useful.
There is already existing protocol for data sharing in the EAC and NBI regions.
Sharing of data on transboundary water resources has to be agreed on by
Partner States.
3.4 Indicator 6.4 (Water use efficiency and water stress)
The indicator monitoring methodology being reviewed include 6.4.1 and 6.4.2
27
The Government bodies / other institutions involved in the testing were:
Water for Production Department of the Ministry of Water and Environment
Directorate of Water Resources Management of the Ministry of Water and Environment
The Contact person(s) for the indicators are:
a) Eng. Ronald Kasozi, Principle Engineer, Water for Production Department, Ministry of
Water and Environment, Uganda
b) Mr. Edward Martin Rwarinda, Principle Water Officer, Regulation and Planning
Department, Ministry of Water and Environment, Uganda
a) Technical steps taken in testing the monitoring methodology of the indicator
Data was obtained and comparisons made from various sources but majorly from
the line Uganda government institutions which included Ministry of Water and
Environment databases, and Uganda Bureau of Statistics, as well as the Internet
based sources by reputable institutions like the World Bank, FAO AQUASTAT, United
Nations Development Program for development among others.
The parameters for computation of the Water use efficiency are water withdrawal
for agriculture, and its proportion to the total water withdrawn; water withdrawal
for industry and its proportion of total water withdrawal; and water withdrawal for
services as well as its proportion of the total water. On the value added part, the
contribution of each of these sectors to the Gross Domestic Product is computed.
Parameters for water stress are the total freshwater withdrawal, and the total
renewable fresh water resources.
b) Institutional arrangements made for testing the monitoring methodologies, and for
coordination across government bodies, including the national statistics office
The government institutional structure was used in in testing the monitoring
methodology and for coordination of the work of the task team. The institutional
arrangement involved the two relevant departments of the Ministry of Water and
Environment namely Water for Production Department and Water Resources Planning
and Regulation. The MWE coordinated the activities and ensured the active participation
of other relevant institutions.
The government is the primary source of the data and is also the source for the regional
and global data sources. Technical databases are housed in their respective departments
and data was readily made available for use whenever it was required and available.
Water related data was found in the Ministry of Water and Environment, while social
economic data was obtained from the Uganda Bureau of Statistics.

28
Challenges were encountered in the process and possible solutions for addressing them
sought. This provided a learning opportunity for future monitoring of the indicators.
Challenges encountered were:
While data was readily available it was seldom not in the format, quality, quantity
and frequency required.
Inconsistency in the data from various sources
Estimation and use of proxy data on key parameters like water fro industry, Data on
water for livestock in the in water use efficiency.
There is potential risk of double count in computation of water usage by the
different sectors, for example cases where withdrawal for industry is from municipal
water supply.
There may also be undocumented or informal water withdrawals that are not
recorded.
Inadequate institutional capacity and resources to undertake data collection,
compilation and testing of methodology
c) Resources and capacity required for the piloting
There is need for institutional capacity including the resources to adequately monitor the
indicator. These include the human resources to support technical aspects including data
collection, financial resources to support the liaison and communication, including task
team meetings, and setting up and operating databases that are oriented to service the
needs of the indicators monitoring. This includes targeted collection, quality control, and
audits.
d) Feedback on the following, as experienced during testing and/or foreseen during future
implementation:
a. the methodology
The methodology for 6.4.1 is complex and more data is required to undertake sensitivity
analysis. The following issues were noted;
Task team noted that comparing USD to volume of water may not provide a good
indication of the change in efficiency. Need to also to compare volume of water to
volume of water.
Inflation rate affects the denominator but does not change the volume of water. For
example exchange rate of a USD five years ago in Uganda was 1usd to ugx 1800.
Currently 1usd is exchanged for ugx 3378.
Cr is representative of the proportion of crop farming water use. Factoring of
proportion of rain-fed water uses for livestock and aquaculture is necessary
To compare the environmental flows results with the Global environmental flow
calculator developed through recent research that has been carried out (IWMI Tool )
relative to what has been used (Mara and Malaba) studies.
Need to strengthen to roll out proposal especially the institutional role and
inadequacies in data were noted.
29
The Task team was tipped of an ongoing proposal of including another indicator that
focuses on Number of people living in water scarce areas.
b. the clarity and usefulness of the step-by-step guide
The step by step guide was clear and understood by the task team members.
c. the technical support provided by UN technical agencies and others, including
external organisations
FAO provided expert technical support at the start of the piloting process and this
enabled the team to understand the piloting methodology and how to collect the
required data. FAO also provided a local consultant to work with and support the
task team during the piloting process. In additional FAO provided ongoing technical
and logistical support including funds for holding a task team workshop to review
and analyze the date collected during the piloting. Thus, support provided by the
FAO Team was key in ensuring the success of the piloting phase. There were
spontaneous and adequate responses whenever queries were raised.
d. Likely use of the data obtained using the draft methodologies to national and
subnational levels
Yes, the data obtained as well as the analysis important in informing the
policy/decision making at national level with regard to water use efficiency across
the various sectors and also in addressing water scarcity in the country. It will also be
used in in deciding on the appropriate indicators to include in the sector
performance monitoring framework with respect to water use efficiency and water
scarcity.
e. Link of the monitoring of this indicator to existing processes and to the
measurement of other indicators (at the national, sub-national, regional or global
levels)
The monitoring is closely related to existing/ongoing processes at national level.
These include the monitoring of the water withdrawals for the three sectors of
agriculture, industry and services. The monitoring of this indicator is also linked to
the Sector Performance Monitoring Framework for water and environment sector in
Uganda. An indicator on water use efficiency and water scarcity will be included in
the updated sector performance framework that is under preparation.
f. The most appropriate frequency of measurement of this indicator in Uganda
Annual regularity would be appropriate as this coincides with various processes like
Water and environment Sector performance reporting.
g. Any other issues to share arising from experience of pilot testing the indicators not
covered by other questions

30
The monitoring of this indicator should be based on country by country circumstances.
For example the assumption is that irrigated agriculture is the main water consumer for
agriculture, but for countries like Uganda will low limited irrigation it is the livestock that
consumes more water.
h. Specific questions on Change in water use efficiency over time
- Comment on the general definition/formulation of the indicator
Water withdrawal for agriculture should be based on a case by case basis.
- Description of how the proportion of agricultural value produced by rainfed
agriculture (Cr) was assessed
Applied the formula provided based on irrigated land acreage of the arable land.
Level of water stress: freshwater withdrawal as a proportion of available freshwater
resources
- How Environmental Water Requirements were assessed.
From available literature, Uganda does not have policy on environmental flows. The
Environmental flows as a percentage of the flow was derived following the Nile Basin
Initiative (NBI) environmental Flow manual. The Manual provides the estimation for
catchment that is fairly representative of Uganda, i.e. Mara Basin and Malaba river
basins. The conditions of this catchment as well as the level of modification are similar
and can be considered for Uganda. An average of 31.43% was therefore used. In future
work, for specific catchments, the exact figures should be generated.
3.5 Indicator 6.5.1 (Integrated water resources management)
Overview
Target 6.5 of SDG6 is that “By 2030, implement integrated water resources management at
all levels, including through trans-boundary cooperation as appropriate”. The target
supports the equitable and efficient use of water resources, which is essential for social and
economic development, as well as environmental sustainability. The indicator allows
countries to measure incremental progress towards target 6.5.1, focussing on the first part
of the target to ‘implement integrated water resources management at all levels’. It
complements indicator 6.5.2 ‘Proportion of transboundary basin area with an operational
arrangement for water cooperation’, which focuses on the second part of the target
‘including through transboundary cooperation as appropriate’.
The indicator 6.5.1 is determined based on a national survey using a questionnaire on
degree of water resources management implementation to be completed by the relevant

31
national authority or authorities. The survey addresses four main components of integrated
water resources management (IWRM) through four sections:
1. Enabling environment: Creating the conditions that help to support the
implementation of IWRM, which includes the most typical policy, legal and strategic
planning tools for IWRM.
2. Institutions: The range and roles of political, social, economic and administrative
institutions that help to support the implementation of IWRM.
3. Management instruments: The tools and activities that enable decision-makers and
users to make rational and informed choices between alternative actions.
4. Financing: Budgeting and financing made available and used for water resources
development and management from various sources.
The lead agency in piloting this indictor was the Ministry of Water and Environment and the
contact person is Mr. Orijabo Albert, Assistant Commissioner in the Directorate of Water
Resources Management.
a) Technical steps taken in testing the monitoring of the indicator.
Several meetings were held where the task teams were constituted for each indicator
and pertinent stakeholders identified.
The task members had formal and informal consultations during which the
questionnaire tool was administered to the identified stake holders. This involved
the use of various communication platforms like emails, telephone calls and manual
filling.
The filled in questionnaires were then submitted to the secretariat for analysis of the
results.
Challenges:
The team registered some delays from the respondents in filling the questionnaire.
b) Institutional arrangements
Coordination of the piloting process for indicator 6.5.1 was done by the Directorate
of Water Resources Management (DWRM) of the Ministry of Water and
Environment. DWRM is the government agency responsible for promotion of IWRM
in Uganda. A task team for indicator 6.5.1 was therefore led by a senior officer from
DWRM. The task team involved people drawn from a spectrum of sectors and
stakeholders and the team was charged with the responsibility of piloting the
monitoring methodology for the indicator.
Across the various stakeholder categories and sectors, focal point officers from
various water related organisations were identified to support the administration of
the IWRM questionnaire to
Strengths
• The tool provides an opportunity to strengthen linkages between and among
institutions and sectors.
• The tool also provided an opportunity for various institutions to appreciate the SDGs
and link them to their specific sector interests.
c) Resources and capacity required

32
The tool requires technical expertise from the various respondent categories to
make reliable assessments.
Financial resources are required to coordinate the stakeholder engagement
activities.
Support is needed in the statistical analysis of the results including their
interpretation.
Observation
The amount of resources required will significantly depend on the stakeholder’s
engagements and coordination initiatives. It is imperative that linkages and collaborative
mechanisms are strengthened so as to leverage various resources and capacities from
the stakeholder categories for easier monitoring of the indicator.
d) Feedback
(i) Methodology
The methodology used was good and the components used to measure this indicator
are valid although some recommendations need to be considered.
• Need to do first undertake awareness raising in IWRM across sectors and
stakeholders for easier administration of the tool. (There is low awareness
about IWRM)
• Need to have Intensive interactions with respondents during the completion of
the questionnaire to provide them any clarifications to some of the questions.
• Need to have very many respondents to generate meaningful results since the
final result is generated from statistical computations of respondents answers.
(ii) Clarity and usefulness of the step-by-step guide
The provided step by step guide was very useful in the collection and analysis of the
results
Recommendations.
• There is need for more clarity on how to interpret the final result from the
administration of the questionnaire as people can interpret the results
differently
• The analysis of the result should be both qualitative and quantitative.
(iii) Technical support provided by UN technical agencies and others, including national
bodies.
Support was provided by the lead UN agencies in piloting the tool during the startup
workshop and the final piloting workshop.
(iv) Usefulness of the resultant indicator data obtained
The monitoring of this indicator using these four components is useful in a way that:
• The data collected is useful in policy making and priority setting with regard to
implementation of IWRM especially at National level.
• The results assists the country in knowing the level of implementation of IWRM
based on the results from the various stakeholders
33
• It also helps to identify the gaps in implementation of IWRM that need more
consideration
• The results will also help in resource mobilization for implementing the various
aspects of IWRM where the average score is fairly low
Recommendations
There is need to incorporate a component that evaluates the progress or outputs of
IWRM especially at the local level.
(v) Linkage of the Indicator to existing processes and to the measurement of other
indicators
• The linkages with other indicators are low since this tool is more qualitative
while others (MWE Sector Performance Monitoring Framework) quantitative
(Golden and Platinum Indicators); Health Sector (Mortality, Epidemiological)
Education (Enrollment, Infrastructure) consider more quantitative aspects.
• Since IWRM is cross cutting and multi-sectoral, there is need to link this
indicator with other indicators under especially SDG6 since IWRM provide an
enabling environment for achievement of the other targets. .
Observation
• The challenge is that this is the first tool designed to measure this indicator so
there is nothing to compare it with.
(vi) Frequency of measurement
This indicator can best be measured annually.
(vii) General Remarks about the Monitoring Tool
In general, the reasoning behind the four key components of IWRM are sufficiently
clear and the questions are relevant for Uganda and also probably for all other
countries. There is also consistency between the thresholds across various components
and the thresholds support the objectivity of the responses, which can subsequently
facilitate tracking of progress overtime.
The explanations at the beginning of each section and the use of footnotes are
appropriate and the explanation of how to calculate each average section score and the
overall score was also sufficiently clear.
It is recommended that a standing task team be set up at the country level to be
responsible for the whole monitoring process including administering the
questionnaires, compiling responses, analyzing the data and submitting the final report
on indicator 6.5.1.
3.3.4 Indicator 6.5.2 ((Transboundary basin area with an operational arrangement for
water cooperation)
34
The Indicator monitoring methodology being reviewed is for 6.5.2
The Government bodies and other institutions involved in the testing is principally the
Ministry of Water and Environment
The Contact person(s) for this indicator is:
Richard Musota; Principal Water Officer +256 772 520966
[email protected]/[email protected]
a) Technical steps taken in testing the monitoring methodology of the indicator
Clear understanding and defining of surface water basins and groundwater
aquifers is required as a first step.
Delineation of the surface water basins from Digital Elevation models (DEM) or
Digital Terrain models (DTM), or through digitization of the basins from existing
topographic maps, where shape files (layers) on the basins don’t exist. Where
shape files (layers) exist, one simply has to acquire the basin layers from the
relevant host institutions. The layers should have universal geo-referencing
system rather than localized referencing systems since they are to be used in an
international environment.
Delineation of groundwater aquifer systems in the country if they are not
delineated. This is not a straight forward process as it is for surface water basins.
It requires technical assessments that involve collection of substantial amounts of
data and subsequent analysis and groundwater modeling. Information on trans-
boundary aquifers exists on sites like International Groundwater Resources
Assessment Centre (IGRAC), however, primary data needed for this assignment is
not available. Where data/information on aquifers exists in a country, then it
should be obtained from the relevant institutions but one has to ensure that it
has the same geo-referencing system as the surface water basin layers as well as
the country boundary layers.
Obtain well referenced country and all neighbouring countries’ boundary layers.
Working in a Geographical Information System (GIS) environment, separately over
lay the surface water basins’ layer and the groundwater aquifers’ layers over the
country and neighbouring countries’ boundary layer.
Through map calculation in GIS, the area of intersection between the surface
water basin layers and the country boundary layer is determined. Same
procedure is repeated for groundwater aquifer layer and the country boundary
layer. These separately give the trans-boundary basin area and the trans-
boundary aquifer areas within a country. The sum total of the two will give the
area covered by trans-boundary water resources.
Look out for documentation on sharing of the water resources for the determined
trans-boundary basins or aquifers. Documentation should pertain to institutions,
35
agreements, formal communication on cooperation over shared water resources,
data sharing, common projects on the shared water resources.
b) Institutional arrangements made for testing the monitoring methodologies, and for
coordination across government bodies, including the national statistics office
The institutional arrangements included:
Ministry of Water and Environment as the lead Agency provided
data/information on basins and aquifers as well trans-boundary cooperation
arrangements;
National Statistics office provided the Country boundary layers
Ministry of Foreign Affairs provided information on international relations
Ministry in charge of regional cooperation provided information on cooperation
arrangements in the region
Regional and International bodies on water Resources Management provided
various information on Cooperation arrangements and their operationalization
and they include:-
o Nile Basin Initiative(NBI
o Lake Victoria Basin Commission (LVBC)
o Inter Government Agency on Development (IGAD)
International bodies in charge of water resources management provided vital
information on water resources e.g IGRAC
c) Resources and capacity were required
The resources required include: satellite images (DEM, DTM); Remote sensing and
GIS analysis softwares; computers(modeling, database, printing, digitization and
photocopying services); transport for coordination and data collection;
geophysical equipment
Capacities required include: Hydrological and Hydrogeological analysis and
modeling skills; IWRM skills; Remote sensing and GIS skills; legal skills;
International Relations skills.
Estimates of persons days required with the assumption availability of country,
basin and aquifer layers is 50person days.
direct/indirect financial resources incurred with the assumption that that the
country, basin and aquifer layers are already available is $3,000
d) Feedback experienced during testing and/or foreseen during future implementation:
a. the methodology
the methodology proposed is very feasible and practical, it is able to lead to a
measurable outcome and as well to enable its monitoring
Data access on trans-boundary groundwater aquifers was a challenge as well
as information on operationalization of cooperation arrangements
b. the clarity and usefulness of the step-by-step guide

36
the step by step guide is very useful and very clear on its requirements
c. the technical support provided by UN technical agencies and others, including
external organisations
Received very useful guidance at the beginning of the exercise and it enabled
smooth handling of the assignment.
d. Likely usefulness of the data obtained using the draft methodologies at national
and subnational levels
Data on delineation of trans-boundary surface water basins and transboundary
aquifers will continuously be useful at all levels towards measurement of this
indicator in future. Trans-boundary surface water basin layer is a constant
whereas the trans-boundary aquifers are more less a constant but may get
refined with time as technology for groundwater characterization improves.
Data obtained on cooperation arrangements and their operationalization forms
the baseline situation for this indicator and therefore will be very useful at all
levels as a reference point.
e. Link of the monitoring of this indicator to existing processes and to the
measurement of other indicators (at the national, sub-national, regional or global
levels)
There is a fully fledged department for International and Trans-boundary Water
Resources whose performance is measured on cooperation arrangements and
mechanisms for operationalizing the cooperation arrangements
f. The most appropriate frequency of measurement of this indicator in Uganda
The indicator should be measured after every two years. The main area of focus will
be the developments in cooperation arrangements and their operation status
g. Any other issues to share arising from experience of pilot testing the indicators not
covered by other questions?
No
Specific questions on each indicator methodology
Proportion of transboundary basin area with an operational arrangement for water
cooperation
a. Clarify of definitions (i.e. transboundary basin, arrangement for water cooperation,
operationality) or any need for any of them to be defined in further detail
The definitions are very clear, however for trans-boundary basins, there are scenarios where
a country has basins that are shared with neighbouring countries but the country and the
basins as a whole are part of a bigger basin. For example Uganda is 98% within the River Nile
37
Basin, however there are smaller basins in Uganda that are shared with neighbouring
countries and that form part of the River Nile system but there are also internal basins that
are not shared with any neighbouring country but contribute to the bigger River Nile basin.
Clarity will therefore be required at which basin level one considers under such situations
b. Straightforwardness of assessing whether Uganda’s cooperation arrangements are
operational. Any difficulty experience
The cooperation arrangement was pretty easy to determine however the requirements for
operationalizing the cooperation arrangements are too stringent yet data/information on
such requirements is not hosted in one institution and difficult to find.
c. Any significant data gaps detected
There were significant data gaps on determination of trans-boundary aquifers. In addition
copies of treaties, agreements, memoranda and minutes for meetings relating to trans-
boundary water resources cooperation are not readily available in the open domain and has
to be sought from the responsible organisations thus requiring some bit of effort.
d. Any significant level of uncertainty related to any of the components needed for
defining the indicator
No
3.6 Indicator 6.6 (Water-related ecosystems)
Overview
Target 6.6 reads as follows: By 2020 protect and restore water-related ecosystems,
including mountains, forests, wetlands, rivers, aquifers and lakes
Target 6.6 has 2 indictors. Indicator 6.6.1 is on change in the extent of water-related
ecosystems over time
Target 6.6 seeks to halt the degradation and destruction of these ecosystems, and to assist
the recovery of those already degraded and destructed. The target not only includes aquatic
ecosystems such as rivers, lakes and wetlands, but also mountains and forests, which are
important for storing freshwater and for maintaining high water quality.
The indicator tracks changes over time in the extent of water-related ecosystems. It uses the
imminent date of 2020 in order to align with the Aichi Targets of the Convention of
Biodiversity, but will continue beyond that date to align with the rest of the SDG targets set
at 2030.
The monitoring of this indicator seeks to provide data and information to enable
management and protection of water-related ecosystems, so that water-related ecosystem
services continue to be available to society, for the present and future generations.
For the purpose of global monitoring, the indicator focuses on the following ecosystem
categories:
- wetlands (swamps, marshes and peatlands),

38
- open water (rivers and estuaries, lakes, coastal waters and reservoirs) and
- groundwater aquifers
Information on the spatial extent of these ecosystems, the quantity of water within them
and their health, is necessary to provide sufficient information on the need to protect and
restore these ecosystems. Therefore, three principle sub-indicators describing aspects of
these ecosystems are monitored to describe the extent, and these include:
- Their spatial extent
- The quantity of water contained within these ecosystems
- The health or state of these ecosystems
The monitoring of this indicator seeks to provide data and information to enable
management and protection of water-related ecosystems, so that water-related ecosystem
services continue to be available to society
6.6.1 Pilot testing of the Monitoring Methodology for Indicator 6.6.1 in Uganda
a) Technical steps taken in testing the monitoring methodology of Indicator
6.6.1
Whilst one does not need to follow the following steps linearly or even include all of them in
the future monitoring of this particular indicator, the steps hereafter listed indicate a series
of activities that guided the team piloting the monitoring methodology for this particular
indicator.
a) The task team developed a work plan for undertaking the piloting exercise, including
timelines, methodologies for collection of data and resources required accomplish
the task, and these was submitted to the national coordinator.
b) The task team held meetings to critically review the draft monitoring methodology,
indicators and domesticate them to Uganda’s environment.
c) The task team leader, in collaboration with the nominated representatives from the
stakeholder institutions collected the relevant data for the pilot exercise.
d) The data collected was shared with the rest of the teams following up on other SDG 6
targets in three workshops organised by the national coordinator. During the
workshops, the other task teams and the international facilitators critiqued the data
provided and the methods used for collection.
A final report incorporating the comments raised during the workshops was
submitted to the national coordinator for consolidation. b) Institutions involved in the pilot testing of the monitoring methodology
of Indicator 6.6.1
The key institutions that were involved in the piloting of indicator 6.6.1 are:
Directorate of Water Resources Management
Directorate of Environmental Affairs
Policy and Planning Department
Forest Sector Support Department (FSSD), REDD+
National Environment Management Authority (NEMA)
National Forest Authority (NFA)

39
Uganda Wildlife Authority (UWA)
The National Fisheries Resources Research Institute (NaFRRI)
Universities ( particularly Makerere University)
Uganda Water and Sanitation NGO Network (UWASNET)
Environment Alert
World Wide Fund for Nature (WWF) – Uganda Country Office
International Union for Conservation of Nature (IUCN) – Uganda Country Office
Recommendation on stakeholder participation.
It is recommended that because of the many prayers involved in monitoring of the various
aspects related to this indicator, the need for coordination to oversee the monitoring
process should be emphasized for monitoring this indicator c) Capacity and Resources required for monitoring the methodology for
target 6.6.1
Piloting of the methodology required the following resources;
Human resources – multi-skilled and committed professionals
Funds
Logistics (venue for meetings, transport, airtime, etc)
Equipment and stationery.
Time
Reports and archived data
Recommendation on Capacity requirements.
It should be emphasised that data processing for monitoring of this indicator requires a
multi-skilled task team, proficient particularly in water resources and wetlands management
with expertise in analysing both quantity and quality aspects of water resources. The team
should also have someone proficient in GIS and remote sensing.
d) Review of the methodology – Data sources, Experiences and
recommendations
Monitoring Context
This indicator tracks changes over time in the extent of water-related ecosystems.
The monitoring of this indicator seeks to provide data and information to enable
management and protection of water-related ecosystems, so that water-related
ecosystem services continue to be available to society. Information on the spatial
extent of these ecosystems, the quantity of water within them and their health, is
necessary to provide sufficient information on the need to protect and restore these
ecosystems.
The methodology proposes the monitoring of the following ecosystems as shown in
the table below using the respective indices.
Ecosystems Category Extent Indicator Ecosystem health

40
indicator
Wetlands Spatial extent / area Wetland health indices
Lakes and reservoirs Spatial extent / area and
quantity / volume
Lake health indices
Rivers Quantity / stream flow River health indices
Ground water Quantity / depth to water
table
Ground water interaction
with surface water
The following sections describe the applicability of monitoring the various ecosystems using
the stipulated indicators and further expound on the monitoring mechanisms in place that
can be used for monitoring indicator 6.6.1 as a whole.
Ecosystem category Extent indicator Ecosystem health indicator - Review of the Methodology
(i) Monitoring the percentage change relative to the natural or reference
conditions.
Each of the sub-indicators in this 6.6.1 Indicator sets out to determine the percentage of
change in a water-related ecosystem. This can only be done if there is some point of
reference. Whereas the ideal situation is that reporting is done using the “natural” situation
as the reference. It was not possible to get “natural” data as initiatives to monitor most of
the ecosystems were undertaken recently when considerable degradation has been carried
out. To date, there have been three nationwide studies undertaken by the Ministry of Water
and Environment that detail the spatial coverage of wetlands in Uganda. The piloting
recommends the study, undertaken in 1994 to form the baseline for monitoring of this
indicator. For open and ground water resources, the Directorate of Water Resources
Management monitors the quantity and quality of parameters and data is available over a
long period of time. For monitoring of this indicator, the baseline has been taken as 2012.
None of these data represent the resources in their pristine conditions as these are recent
studies which were undertaken after a considerable period of resource management,
development and degradation.
(ii) Spatial extents of Wetlands.
This part of the indicator measures the geographic or spatial extent of wetlands (vegetation
and water dominated ecosystems such as swamps, marshes and peatlands, swamp forests
etc.) as well as inland open water (rivers, floodplains and estuaries, lakes and reservoirs). In
the methodology, it is proposed that this can principally be done by;
Using Earth Observation (remote sensing) and
Ground based surveys
It should be noted that in Uganda, various agencies are already collecting this kind of
data and there was no need to use any of the above methodologies during the
piloting phase. To ensure consistency and interlinkages between the monitoring of
SDGs indicator and other monitoring endeavours, we recommend using the data
already being collected by respective agencies to ensure effective mainstreaming and

41
sustainability. However, there is need to regularly update this data and this might
require some resources to facilitate the data collection.
(iii) Quantities of streamflow in Rivers.
For stream flow monitoring, the methodology proposes using either one or both of the two
methodologies below,
Direct monitoring of the flow in rivers and statistical interpretation of the
change in flow from the “natural” or reference condition. It is recommended
that the median statistic be used for these estimates although local
circumstances may demand that an alternative statistic be used, but this
should be consistently used in that situation.
Modelling the change in flow using one of the global models that make use of
climate and land cover amongst other data to determine both the natural
flow and also the present situation
Already considerable direct measuring and monitoring of data regarding this sub
indicator is being undertaken by the Directorate of Water Resources management.
Particularly for monitoring of this indicator, it is proposed that only data for major
rivers in the country be monitored as essentially the rest of the small rivers end up
feeding into these rivers. Whereas it’s possible to monitor the data using the median
flows, it is recommended that the flows be monitored by their mean values for
consistency with national monitoring / reporting. Quantities of Water in Lakes.
The methodology proposes monitoring of the volume of water in lakes by using either Earth
Observation to measure open water surface area and also water surface height (above sea
level), or ground-based surveys to measure area and bathymetric depth.
Whereas all methodologies are feasible in Uganda, it is worth noting that also, the
Directorate of water resources management collects data and monitors lake levels on a
daily basis for the major lakes in the country. Since bathymetric surveys have not been
undertaken for most of the lakes and accurate rating curves are not approved, it is evident
that monitoring of lake levels is the best available approach that can be adopted for this sub
indicator. Quantity of Ground Water.
As is in the proposed methodology, indeed it is difficult to measure the absolute quantity of
available groundwater, so a proxy to this is the groundwater table i.e. the depth of the
groundwater below the surface. Just like rivers and lakes, the Directorate of Water
resources manages a ground water monitoring network from which data is collected and
synthesised for monitoring of changes in ground water volume in the country. This data is
available from the Directorate and will be used for monitoring of this sub indicator.

42
Ecosystem Health and Water Quality monitoring.
In Uganda, there are scattered efforts aimed at monitoring the health of the ecosystem
health using biodata collection and assessment. The country has no existing standards for
monitoring the health of ecosystems using the biomonitoring methodology. Considering
that the Directorate of Water Resources management runs and maintains a large network
monitoring the quality of water basing on the physical and chemical composition of various
ecosystems, it is proposed that this water quality data be used for monitoring of this
indicator for the meantime. However, efforts should be put in place to ensure that
biomonitoring and assessment standards are put in place for various ecosystems since
biomonitoring better reflects the ecosystem health more than merely monitoring of
chemical water quality parameters for a water resource.
Monitoring Duration
The monitoring methodology recommends monitoring to be undertaken after four years for
monitoring of this indicator. Whereas the piloting team noted that this span is quiet long
and various changes which may be occurring periodically within the ecosystems will not be
captured, the team recommended that national efforts to monitor changes annually should
be promoted. This will ensure that changes that occur in short time spans are not missed
out. Computation of the Indicator
The indicator requires that all data are reported as the percentage of change from natural or
reference condition. The percentage change of each method or sub-indicator needs to be
calculated separately before aggregation into the total 6.6.1 indicator value.
Considering that there is one global indicator for target 6.6, there is need for aggregation of
national data into a single quantitative measure, to be used for global reporting. The task
team concurs with the authors of the methodology who noted a lot of complexities
regarding this aggregation which may lead to unrealistic representation of the ecosystem
changes. As highlighted, some indicators may be more important and merely aggregating
the scores without considering the weight of each indicator may lead to erroneous
reflection of the ecosystem changes.
The methodology proposes the equation below to be used for calculation of the percentage
changes
C(%) = (CI/RC)*100, CI = 0 – (RC – PDC); where
C(%) = Percentage change of the sub-indicator method from the reference
condition.
CI = Change of sub-indicator score from the reference condition
RC = Sub-indicator score obtained for the Reference Condition
PDC = Sub-indicator score obtained for the Present Day Condition
For all the sub indicators, the values of changes that need to be calculated is as in the table
below.

43
Sub indicator Data Produced Units of Measurement
Change in the
spatial extent of
water- related
ecosystems
Quantitative
measure of wetland
extent
% change in area (km2)
Change in
quantity of
water in water
related
ecosystems
Quantitative
measure of river
flow, lake volume
and groundwater
depth
% change in the volume of flow (Mm3)
% change in Lake levels (m)
% change in depth (m) to ground water level
Change in
health of water
in water related
ecosystems
Quantitative
measure of
ecosystem health
% change in Water quality Parameters of Lakes
% change in Water quality Parameters of Rivers
% change in Water quality Parameters of Ground
Water
Using the equation and table above, the calculation of the aggregated score is as shown in
the table below;
Sub indicator Sub
indicator
component
Description % change
of different
ecosystems
% change
of sub
indicators
Change in the
spatial extent
of water-
related
ecosystems
Change in
wetland
area
Calculate % change in total area
from the reference condition
-29.21 -29.21
Change in
quantity of
water in
water related
ecosystems
Change in
River flow
Calculate % change in total flows
from the reference condition
15.17 6.44
Change in
Lake levels
Calculate average of % change in
levels for each lake
-2.3
Change in
groundwater
depth
Calculate average of % change in
depth for each GW monitoring point
-----------
Change in
health of
water in
water related
ecosystems
Change in
River health
Calculate average of % change in
value of each parameter from the
reference condition
8.88 20.13
Change in
Lake health
Calculate average of % change in
value of each parameter from the
reference condition
31.37
Change in
groundwater
health
Calculate average of % change in
value of each parameter from the
reference condition
------------
TOTAL CHANGE (Average) -0.88

44
4. FEEDBACK FROM THE TESTING PROCESS IN UGANDA
4.1 How monitoring water and sanitation related matters is done in Uganda
Uganda developed a Sector Performance Monitoring Framework in late 1990s for use in
decision-making, management of resources and services, follow-up on achievement of the
Millennium Development Goals etc.). This is based on 11 Golden Indicators (water and
sanitation) and 10 Platinum Indicators (environment and natural resources). Indicators for
water generally focus on drinking water and basic sanitation, water quality, and water
storage while those for environment focus on forest and wetland ecosystems. The Uganda
Bureau of Statistics (UBOS) undertakes service delivery surveys based on these indicators.
Indicator monitoring is fully integrated in national planning and budgeting processes,
National Monitoring and Reporting processes and existing institutional frameworks at
various levels to ensure ownership and sustainability. Monitoring therefore is done using
existing human and financial resources and the results are reported annually in Sector
Performance Repprts issued our around September every year.
4.2 Reflections on the monitoring indicators and methodologies
Based on the results of the piloting exercise some reflections on the monitoring indicators as well as the
methodologies themselves can be made as follows:
a) The pilot testing exercise for SDG6 indicators in Uganda was successful and all the
methodologies for the various indicators were pilot tested and found appropriate and
useful. Some suggestions for improving the methodologies were however made per
indicator for consideration during the improvement of the monitoring methodologies.
b) The success of the exercise was largely due to the strong leadership by the Ministry of
Water and Environment and highly committed multi-disciplinary task teams drawn
from various organisations including government, civil society, academic institutions,
religions and cultural institutions, development partners etc.
c) Pilot testing of the various indicators such as on ambient water quality was made
possible due to an already established monitoring network with advanced analytical
capability and applied ISO/IEC 17025 in the laboratory. Countries without an
established ambient WQ monitoring program will struggle to achieve the same level of
achievement in a short period of time.
d) Regular indicator monitoring requires a lot of financial resources that will be difficult to
come by. One way of sustaining this process is to mainstream the activities in existing
processes and institutions
e) Indicator monitoring requires a lot of data that needs to be gathered from various
sources.
45
f) Some indicators and their methodologies are relatively new and quite difficult to
comprehend. Continuous capacity building is therefore necessary for effective data
collection and analysis
4.3 Lessons learnt from the pilot testing of SDG6 monitoring methodologies
A number of lessons have been learnt from the piloting process in Uganda as presented
below:
a) SDG 6 monitoring is a process not an event and requires input of various agencies and
stakeholders. However, this was not readily achieved initially in Uganda but improved
gradually as the piloting proceeded.
b) Indicator monitoring requires resources in terms of staff time, technical support and
financial resources (data collection/analysis and report preparation). Costs are however
expected to decrease over time with institutionalization of the process.
c) Indicator monitoring improves collaboration and coordination among various water
related agencies and stakeholders. The piloting process brought together many water
related agencies and stakeholders some of whom have traditionally not worked
together. This will enhance collaboration beyond the SDG6 piloting.
d) Some data collected during the piloting is already being used to assess progress in areas
previously not monitored due to lack of indicators. These area include Integrated Water
Resources Management, wastewater, water use efficiency and water scarcity.
e) SDG 6 indicators are being considered in the ongoing review of the Water and
Environment Sector Performance Monitoring framework in Uganda. This review started
in April 2016 and will be completed by December 2016.
f) SDG 6 indicator monitoring assists in decision making, resource mobilization, improving
transparency and accountability, etc
g) Success in monitoring needs high level support and recognition by key decision makers
in various agencies and at various levels. The piloting process in Uganda was handled at
the highest level of government right from the Minister of Water and Environment that
openned the start up and final workshops down through the Permanent Secretary of
the Ministry of Water and Environment and various heads of relevant government
ministries, agencies and other stakeholders. The high level support made it possible for
the various task teams drawn from a cross section of stakeholders to do their work
successfully within a very short time.
h) There is need for a clear institutional set-up for the pilot testing with defined roles and
responsibilities of the involved institutions and stakeholders. The institutional set-up for
the pilot testing was agreed during the start-up workshop and the roles and
responsibilities of the involved institutions and stakeholders were also defined. The
Ministry of Water and Environment, which is the government agency responsible for
water and sanitation issues in the country was given overall coordination role for the
piloting. Task teams were set up for each indicators and 2 high level officials from

46
relevant government agencies with responsibility of implementing some aspects of the
indicators were formally appointed as Task Team Leaders. Task Team Leaders were
given responsibility of spearhead pilot testing of the methodologies under their
indicators but with reporting to the overall Coordinator for the SDG6 piloting.
i) Monitoring process needs to be fully institutionalised within respective sector
institutions including national statistics office. The piloting process was institutionalised
through government structures with the coordination role provided by the Ministry of
Water and Environment. Piloting of the various indicators was also institutionalised
within the government agencies responsible for the various indicators taking the lead in
coordinating the piloting process and involvement of other stakeholders. The National
Statistics Office (Uganda National Bureau of Statistics) was actively involved in the
piloting process and the staff provided guidance to the team on the data collection and
analysis methodologies as appropriate.
j) A lot of data on various indicators is available but scattered in various organisations and
documents. Future monitoring of SDG6 indicators will therefore require progressively
improvement in data collection, storage and analysis
k) There is need for Champions of the monitoring process within the relevant agencies.
The piloting process in Uganda was successful due to the deliberate selection of self
driven and committed officials from within the Ministry of Water and Environment and
many other institutions and agencies to coordinate and lead the piloting process. The
close interactions and coordination between the overall coordination team at the
Ministry of Water and Environment and the various task teams was very key in
finalising the piloting process within a very short time.
l) The monitoring process needs to be fully integrated into the National Monitoring and
Reporting process. Monitoring of SDG6 indicators should be fully integrated in the
monitoring and reporting processes of the government. It should be undertaken by the
agencies of government responsible for implementing activities to achieve the various
targets. The process should be fully integrated into those institutions processes in order
to ensure ownership and sustainability.
m) Some indicator methodologies were difficult to comprehend and required technical
capacities not readily available and hence support was required from UN Water which
improved the situation. In future, technical support should be available and provided in
monitoring of some indicators that are new and rather complicated to comprehend.
47
5. GENERAL CONCLUSIONS AND BENEFITS OF THE PILOTING EXERCISE TO UGANDA
5.1 General Conclusions
The pilot testing exercise for SDG6 indicators in Uganda was successfully undertaken. All the
methodologies for the various indicators were pilot tested and in generally they were found
appropriate and useful. A number of suggestions for improving the methodologies were
made per indicator for possible consideration before the global roll out. The exercise was
highly participatory and was undertaken by a multi-disciplinary team from various
organisations including government, civil society, academic institutions, religions and
cultural institutions, development partners etc. A number of lessons have been learnt from the
piloting process in Uganda that will help to inform the global roll out process for SDG6 and also in establishing
an SDG6 baseline in Uganda in preparation for the reporting in 2018.
5.2 Benefits of the piloting process
Beyond testing the methodology for monitoring various SDG6 indicators the piloting process
resulted in a number of benefits as highlighted below:
a. Awareness raising and sensitization: The piloting process contributed to raising
awareness of various stakeholders about the SDGs, particularly SDG6 and its targets
and indicators. It was noted during the piloting process that although many people had
heard about SDGs they did not have details of the various targets and what they mean
to them as responsible or relevant agencies.
b. Review of the water and environment performance indicators: The process provided
an opportunity to review the existing water and environment sector performance
monitoring framework and to identify areas where new indicators are needed or where
existing ones need to be adjusted.
c. Multi-stakeholders’ engagement: The process provided an opportunity for multi-
stakeholder dialogue and engagement. The different stakeholders from water,
environment, energy, food, agriculture, finance, planning, statistics, etc drawn from
government, development partners, civil society, private sector, academic institutions,
religious and cultural institutions etc worked very closely together to test the different
indicator methodologies. This kind of collaboration is expected to continue beyond the
testing phase and beyond SDG6 indicators.

48
d. Momentum created: The piloting process has provided a good momentum to continue
in the rolling out of the methodologies and implementing SDGs commitments.
Stakeholders felt that this good momentum should continue and indeed the different
task teams have indicated that they want to continue working together to move SDG6
indicators into full scale implementation.
e. Linkage with the National systems: GEMI process was linked to the national sector
performance assessment process of Uganda and is being used to review and update the
Sector Performance Monitoring Framework for the Water and Environment Sector in
Uganda.
f. Data availability and capacity limitations: The piloting process brought to the fore the
issue of data availability and capacity for successful implementation of SDG-6. Some
relevant recommendations on how to improve this situation were made by some task
teams and these have been included in the proposed follow up action plan for Uganda.
49
6. WAY FORWARD AND FUTURE PERSPECTIVES
6.1 Road map on follow-up matters and rolling out GEMI methodologies in Uganda
Based on the results of the piloting a road map for follow up activities and roll out of the
GEMI methodologies in Uganda was drawn out as follows:
• Submission of required additional information from task teams – 3 November 2016
• Compilation of Uganda SDG6 piloting report and submission to UN Water- 11
November 2016
• Preparation of an action plan for implementing recommended actions arising out of the
piloting – 20 November 2016
• Funds mobilization and start of implementation of recommended actions- 30
November 2016
• Baseline data collection – January 2017
6.2 Moving from piloting to full scale implementation
Some general recommendations have been made for consideration as the pilot process is
moved into full scale implementation as follows:
i. There is need to ensure that there is clarity of interpretation and definition of the
various indicators
ii. There is need to simplify and revise the indicator methodologies in light of the
experiences from the pilot
iii. There is a need to have high level support and recognition of the monitoring process by
key decision makers at various levels
iv. There is need to ensure that the indicator monitoring is integrated in national planning
and budgeting processes. The existing country monitoring systems should be reviewed
to include SDGs
v. For sustainability indicator monitoring should be integrated into national monitoring
and reporting processes . In addition it should be integrated into existing institutional
and coordination frameworks at various levels to ensure ownership and sustainability
vi. For success of the indicator montoring there is need to identify Champions within the
various agencies
vii. There is need to progressively improve data collection, storage and analysis capacity in
the various instituions to facilite SDG6 monitoring.
viii. A mechanism for ongoing technical support especially for indicators that are relatively
new and for which capacity is not available should be put in place
ix. Financial resources are needed to support uptake of the rather complicated indicators
for which data may not be readily available
x. A national baseline for the different indicators should be established before full scale
implementation is undertaken
50
ANNEXES
Annex 1: List of focal points for piloting monitoring methodology for SDG targets and
Indicators
Overall coordination: Dr. Callist Tindimugaya- Commissioner, Water Resources Planning and
Regulation
6.2 Sanitation: Eng. Richard Matua, Principal Engineer (Urban Water Supply and Sanitation
Department)
6.3 Wastewater and water quality: Ms Lillian Idrakua- Head Water Quality Management
Department and Dr Irene Mugabi- Quality Assurance Manager,National Water and
Sewerage Corporation
6.4 Water use and scarcity: Eng. Ronald Kasozi- Principal Engineer, Water for Production and
Mr. Martin Rwarinda- Principal Water Officer, Water Resources Planning and Regulation
6.5 Integrated Resources Management: Mr. Albert Orijabo- Assistant Commissioner, Water
Resources Planning and Regulation and Mr. Richard Musota- Team Leader, Victoria Water
Management Zone
6.6 Water-related eco-systems: Ms Lucy Iyangu- Assistant Commissioner,Wetlands and Mr.
Leo Mwebembezi -Principal Water Officer, Water Information Management
Support Team: Mr. Collins Mwesigye (World Health Organisation Uganda); Ms Emelda
Berejena (Food and Agriculture Organisation, Uganda), Mr. Kidamariam Jembere (Global
Water Partnership)

51
Annex 2: Organogram of GEMI POC in Uganda

52
Annex 3: Review framework for the pilot testing of the draft monitoring methodologies
for SDG 6 global indicators (completed by each Task Team)
The aim of this review framework is to facilitate the collection of lessons from the pilot
testing, to be used to improve the monitoring methodologies and to streamline the process
of global rollout of the methodologies starting in 2017. The framework questions should be
kept in mind during the process of testing the methodologies, and country target teams are
encouraged, with the support of their respective national coordinator/consultant, to
summarise their findings in a short report for each indicator methodology. These reports
will then form the basis of the final workshops both at the national and global level.
Please complete a separate form for each indicator methodology reviewed.
Indicator monitoring methodology being reviewed: (6.3.1, 6.3.2, 6.4.1, 6.4.2, 6.5.1, 6.5.2,
or 6.6.1)
Government bodies / other institutions involved in the testing:
Contact person(s): (name, position, contact details)
e) What were the technical steps taken in testing the monitoring methodology of the
indicator?
[Steps may include data collection/acquisition, data quality control, aggregation and
analysis, and any assumptions or modifications made to the draft methodology. Consider
any strengths or challenges encountered and/or foreseen during future implementation,
as appropriate.]
f) Which institutional arrangements were made for testing the monitoring methodologies,
and for coordination across government bodies, including the national statistics office?
[These arrangements should consider both formal aspects as well as practical
implementation. Were all the potentially interested stakeholders involved and to what
extent did they participate? Consider any strengths or challenges encountered and/or
foreseen during future implementation, as appropriate.]
g) Which resources and capacity were required?
[This includes for example estimates of person-days, specific skills, specific equipment,
and other resources used for testing, as well as any direct or indirect financial costs
incurred. Consider any strengths or challenges encountered and/or foreseen during future
implementation, as appropriate.]

53
h) What feedback do you have on the following, as experienced during testing and/or
foreseen during future implementation:
a. the methodology
[Considering the relevance, complexity, and feasibility of the methodology (including
the “steps of progressive monitoring”), as well as any challenges with data
availability, data access and data disaggregation, etc. Please refer also to indicator-
specific questions listed in Annex 1]
b. the clarity and usefulness of the step-by-step guide
[Including suggestions on how to improve the guide and what additional resources
that would be useful to practically apply the methodologies, e.g. web courses.]
c. the technical support provided by UN technical agencies and others, including
external organisations
i) Are the data obtained using the draft methodologies likely to be useful at national and
subnational levels?
[this may consider policymaking and priority setting, decision-making, management of
resources and services, attracting finance (public, private or donor), awareness building,
etc]
j) How does the monitoring of this indicator link to existing processes and to the
measurement of other indicators (at the national, sub-national, regional or global levels)?
[Consider also the stakeholders involved in these processes (e.g. external donors, NGOs,
academia, private sector) and to what extent these might be coordinated]
k) Considering feasibility and usefulness, what do you think would be the most appropriate
frequency of measurement of this indicator in your country, e.g. annually, every 2 years,
3 years, etc?
l) Do you wish to share any other issues arising from your experience of pilot testing the
indicators not covered by other questions?
54
ANNEX 1: Specific questions on each indicator methodology
While reflecting on question 4a. above, you may wish to consider some of the following
specific questions for each indicator methodology.
6.3.1 Proportion of wastewater safely treated
e. Is the proposed monitoring framework for wastewater from households and industries
understood by stakeholders in the sector? If no, which parts are not well understood?
f. Were any data gaps or data quality issues encountered? For example,
i. Is there verified regulatory data on off-site treatment wastewater treatment?
ii. Where no official data exists, what reliable sources of data are available for exist
for wastewater from on-site facilities?
iii. Does your country have an inventory of industrial discharges and data on
compliance with permits?
iv. What assumption can be applied where data is lacking?
g. Do you routinely compare the results of water quality monitoring in particular areas
where wastewater discharges are monitored ?
h. Which opportunities exist to integrate and extend existing data collection and reporting
over the next 1-3 years to cover gaps in the proposed methodology?
6.3.2 Proportion of bodies of water with good ambient water quality
a. Is there an existing ambient water quality monitoring station network in place? Does
the network cover all or a representative number of water bodies/basins? Is it
necessary to develop a new network?
b. Are there existing ambient water quality target values for the five parameters necessary
to calculate the index? If not, are there historical monitoring data that could be used to
determine preliminary target values?
c. Are data on ambient water quality regularly collected and in which time sequence?
d. Are data on ambient water quality readily available? Through which institution are the
data made available?
e. Would online training on this indicator be of assistance for the national efforts? If so,
who should be the target audience?
f. Will national authorities be able to calculate a national water quality index, as outlined
in the step by step methodology? If so, which national authority? Will the data be made
available in the SDG reporting process?
g. Alternatively, should the custodian UN agency assist in providing these data processing
and index calculation services (e.g. through the UNEP GEMS/Water Data Centre)?
6.4.1 Change in water use efficiency over time
a. Do you have any comment on the general definition/formulation of the indicator?
b. In the case that you did not use the proposed default method, please describe how you
assessed the proportion of agricultural value produced by rainfed agriculture (Cr)
55
6.4.2 Level of water stress: freshwater withdrawal as a proportion of available freshwater
resources
a. Please describe how you assessed the Environmental Water Requirements
6.5.1 Degree of implementation of integrated water resources management
a. Do you find the reasoning behind the four key components of IWRM sufficiently clear?
b. Do you think any questions would be redundant or not relevant for most countries? If
so, which ones?
c. Are there any specific aspects of IWRM which you think are missing or not dealt with
adequately (bearing in mind that the questions should be applicable to all countries,
should avoid overlap, and be limited in number)?
d. Comparing between questions, do you find the differences between thresholds
reasonably consistent (e.g. is the degree of implementation for 'medium-high' relatively
consistent between questions)?
e. In general, are the threshold descriptions sufficiently clear and succinct?
f. Do the thresholds support the objectivity of the responses, and do you expect them to
facilitate tracking progress over time?
g. Are the explanations at the beginning of each section and the use of footnotes
appropriate?
h. Is the explanation of how to calculate each average section score and the overall score
(in section 5) sufficiently clear?
i. What are your thoughts on the feasibility and appropriateness of the proposed
validation processes as described in sections 2.2 and 4 of the step-by-step monitoring
methodology for 6.5.1?
6.5.2 Proportion of transboundary basin area with an operational arrangement for water
cooperation
e. Are the definitions clear (i.e. transboundary basin, arrangement for water cooperation,
operationality) or would any of them need to be defined in further detail?
f. Was it straightforward to assess whether your country’s cooperation arrangements are
operational? If not, what difficulty did you experience?
g. Were any significant data gaps detected?
h. Is there a significant level of uncertainty related to any of the components needed for
defining the indicator? If yes, please specify?
6.6.1 Change in the extent of water-related ecosystems over time
a. This methodology is based in part on a premise that the “natural” condition is the
“best” and “most sustainable”, and that any departure from this condition, in any
direction, represents a degradation with regard to ecosystem sustainability. What are
your thoughts regarding this premise?
b. Following on the above, did you use “natural” data for the reference condition, or was
later and already-impacted data used?
c. Natural ecosystems are generally variable over time in response to changing seasons
and wet/dry cycles. Do you feel that your results are a true representation of the
56
overall change over time, or might they have been influenced by short-term variation
which masked the long-term change?
d. What are your thoughts regarding on the “steps of progressive monitoring” shown in
Table 2 of the methodology? Which sub-indicators were you able to implement and
what are the prospects for adopting additional indicators in future?
e. Did you use your own country’s Ramsar reporting data for the sub-indicator on spatial
extent?
f. Were you able to access remote sensing data for measurement of wetland extent? Was
this effective and what problems were encountered?
g. Did you have access to long-term hydrological stream flow data for the assessment, or
did you model the flows?
h. Were you able to provide data to indicate the sub-indicator on the health or state of
ecosystems? Please state any obstacles to implementing these methods in your
country.