Embed Size (px)
Citation preview
Testing Isosource: Stable Isotope Analysis of a TropicalFishery with Diverse Organic Matter Sources
Author
P. Benstead, Jonathan, G. March, James, Fry, Brian, C. Ewel, Katherine, M. Pringle,Catherine
Published
2006
Journal Title
Ecology
DOI
https://doi.org/10.1890/05-0721
Copyright Statement
© 2006 Ecological Society of America. The attached file is reproduced here in accordancewith the copyright policy of the publisher. Please refer to the journal's website for access to thedefinitive, published version.
Downloaded from
http://hdl.handle.net/10072/58090
Griffith Research Online
https://research-repository.griffith.edu.au
Ecology, 87(2), 2006, pp. 326-333 ? 2006 by the Ecological Society of America
TESTING ISOSOURCE: STABLE ISOTOPE ANALYSIS OF A TROPICAL FISHERY WITH DIVERSE ORGANIC MATTER SOURCES
Jonathan P. Benstead,124 James G. March,15 Brian Fry,36 Katherine C. Ewel,3-7
and Catherine M. Pringle1
^Institute of Ecology, University of Georgia, Athens, Georgia 30602 USA
2The Ecosystems Center, Marine Biological Laboratory, Woods Hole, Massachusetts 02543 USA
3USDA Forest Service, Institute of Pacific Islands Forestry, 1151 Punchbowl Street, Room 323,
Honolulu, Hawaii 96813 USA
Abstract. We sampled consumers and organic matter sources (mangrove litter, fresh
water swamp-forest litter, seagrasses, seagrass epiphytes, and marine particulate organic matter [MPOM]) from four estuaries on Kosrae, Federated States of Micronesia for stable
isotope (813C and 834S) analysis. Unique mixing solutions cannot be calculated in a dual
isotope, five-endmember scenario, so we tested IsoSource, a recently developed statistical
procedure that calculates ranges in source contributions (i.e., minimum and maximum
possible). Relatively high minimum contributions indicate significant sources, while low
maxima indicate otherwise. Litter from the two forest types was isotopically distinguishable but had low average minimum contributions (0-8% for mangrove litter and 0% for swamp
forest litter among estuaries). Minimum contribution of MPOM was also low, averaging 0-13% among estuaries. Instead, local marine sources dominated contributions to consum
ers. Minimum contributions of seagrasses averaged 8-47% among estuaries (range 0-88%
among species). Minimum contributions of seagrass epiphytes averaged 5-27% among
estuaries (range 0-69% among species). IsoSource enabled inclusion of five organic matter
sources in our dual-isotope analysis, ranking trophic importance as follows: seagrasses >
seagrass epiphytes > MPOM > mangrove forest > freshwater swamp-forest. IsoSource is
thus a useful step toward understanding which of multiple organic matter sources support food webs; more detailed work is necessary to identify unique solutions.
Key words: carbon; food webs; IsoSource; mangrove; Micronesia; mixing models; seagrasses; stable isotope analysis; sulfur.
Introduction
Diversity in primary producers typifies many aquatic
ecosystems, resulting in multiple sources and types of
organic matter entering food webs that present consid
erable challenges to quantitative analysis. Stomach
contents of consumers can provide relatively high-res
olution data on consumer diets, but are less useful for
identifying the ultimate source of energy supporting a
food web (i.e., its trophic base). Since the advent of
affordable stable isotope analysis (SIA), ecologists
have relied on this technique to trace flows of elements
(particularly carbon and nitrogen) through food webs
(Peterson and Fry 1987). SIA sometimes allows the
unequivocal identification of important elemental
sources within food webs. However, SIA is also ham
pered by the presence of multiple potential organic
matter sources. Even if all sources within a food web
can be sampled and analyzed, subsequent use of math
ematical mixing models for calculating contributions
to species is often limited by the number of isotopes
that can be included in the analysis. Data from n isotope
values are needed if n+1 organic matter sources are to
be included in the mixing model. Otherwise, standard
linear mixing models are unable to calculate a unique
solution for source contributions (Phillips 2001).
Only a few elements can routinely be used in SIA
of food webs (e.g., H, C, N, O, and S). Moreover,
ecologists have often been limited by the cost of these
analyses. Consequently, food web studies using data
from n stable isotope values (typically two) have often
restricted their studies to n + 1 organic matter sources
by including only those sources either assumed to be
most important or shown to be through other types of
analyses. Unfortunately, inclusion only of organic mat
ter sources assumed to be dominant may result, at best,
in overestimation of their energetic significance. At
worst, exclusion of some organic matter sources could
lead to misinterpretation of the trophic base and struc
ture of the food web.
Manuscript received 6 May 2005; revised 26 July 2005; ac
cepted 1 August 2005. S. J. Simpson. 4 Present address: Department of Biological Sciences, Uni
versity of Alabama, Tuscaloosa, Alabama 35487 USA.
E-mail: [email protected] 5 Present address: Washington and Jefferson College, Bi
ology Department, Washington, Pennsylvania 15301 USA. 6 Present address: Coastal Ecology Institute and Depart
ment of Oceanography, Louisiana State University, Baton
Rouge, Louisiana 70803 USA. 7 Present address: 2126 NW 7th Lane, Gainesville, Florida
32603 USA.
HUB KB HH Kb
326
February 2006 ISOSOURCE USE IN STABLE ISOTOPE ANALYSES 327
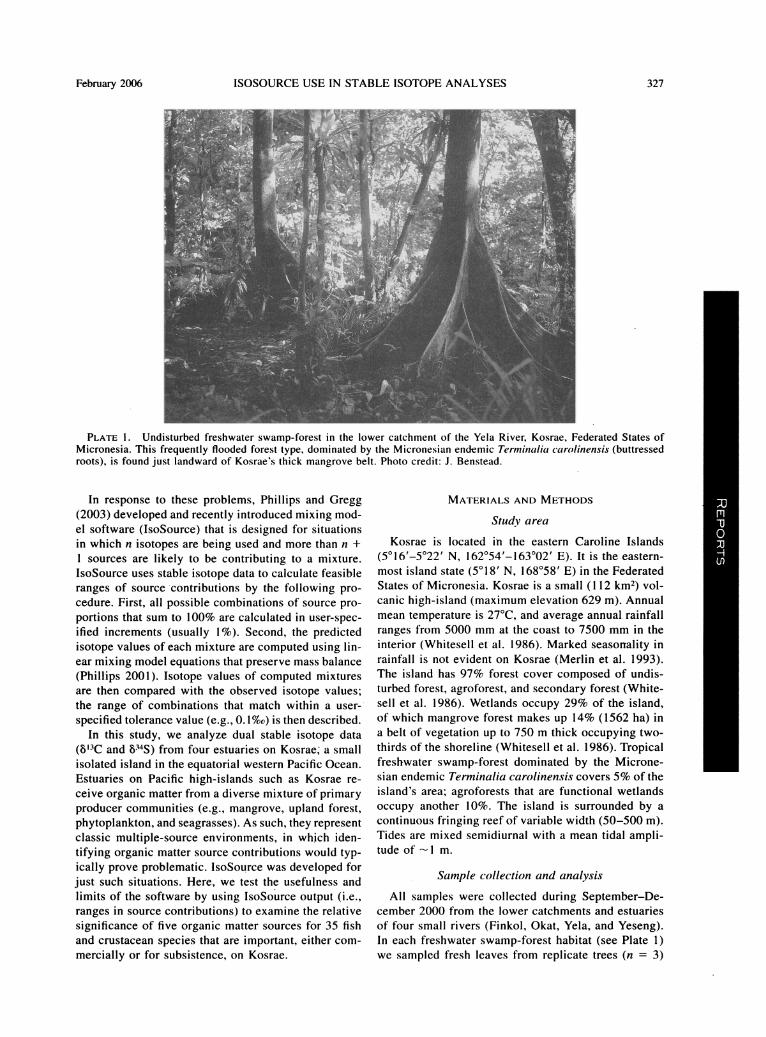
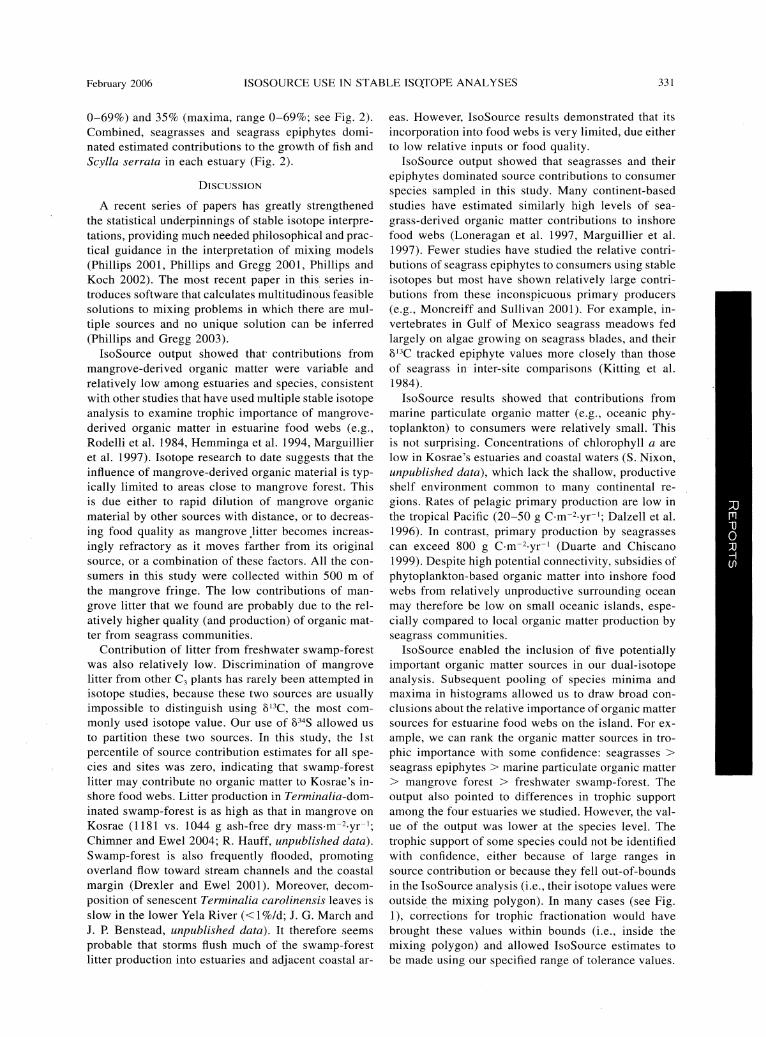
Plate 1. Undisturbed freshwater swamp-forest in the lower catchment of the Yela River, Kosrae, Federated States of
Micronesia. This frequently flooded forest type, dominated by the Micronesian endemic Terminalia carolinensis (buttressed
roots), is found just landward of Kosrae's thick mangrove belt. Photo credit: J. Benstead.
In response to these problems, Phillips and Gregg
(2003) developed and recently introduced mixing mod el software (IsoSource) that is designed for situations in which n isotopes are being used and more than n +
1 sources are likely to be contributing to a mixture.
IsoSource uses stable isotope data to calculate feasible
ranges of source contributions by the following pro
cedure. First, all possible combinations of source pro
portions that sum to 100% are calculated in user-spec
ified increments (usually 1%). Second, the predicted isotope values of each mixture are computed using lin
ear mixing model equations that preserve mass balance
(Phillips 2001). Isotope values of computed mixtures are then compared with the observed isotope values;
the range of combinations that match within a user
specified tolerance value (e.g., 0. \%c) is then described.
In this study, we analyze dual stable isotope data
(8I3C and 834S) from four estuaries on Kosrae, a small
isolated island in the equatorial western Pacific Ocean.
Estuaries on Pacific high-islands such as Kosrae re
ceive organic matter from a diverse mixture of primary
producer communities (e.g., mangrove, upland forest,
phytoplankton, and seagrasses). As such, they represent
classic multiple-source environments, in which iden
tifying organic matter source contributions would typ
ically prove problematic. IsoSource was developed for
just such situations. Here, we test the usefulness and
limits of the software by using IsoSource output (i.e.,
ranges in source contributions) to examine the relative
significance of five organic matter sources for 35 fish
and crustacean species that are important, either com
mercially or for subsistence, on Kosrae.
Materials and Methods
Study area
Kosrae is located in the eastern Caroline Islands
(5?16'-5?22' N, 162?54'-163?02' E). It is the eastern
most island state (5? 18' N, 168?58' E) in the Federated States of Micronesia. Kosrae is a small (112 km2) vol
canic high-island (maximum elevation 629 m). Annual
mean temperature is 27?C, and average annual rainfall
ranges from 5000 mm at the coast to 7500 mm in the interior (Whitesell et al. 1986). Marked seasonally in rainfall is not evident on Kosrae (Merlin et al. 1993).
The island has 97% forest cover composed of undis
turbed forest, agroforest, and secondary forest (White
sell et al. 1986). Wetlands occupy 29% of the island, of which mangrove forest makes up 14% (1562 ha) in a belt of vegetation up to 750 m thick occupying two thirds of the shoreline (Whitesell et al. 1986). Tropical freshwater swamp-forest dominated by the Microne
sian endemic Terminalia carolinensis covers 5% of the
island's area; agroforests that are functional wetlands
occupy another 10%. The island is surrounded by a
continuous fringing reef of variable width (50-500 m).
Tides are mixed semidiurnal with a mean tidal ampli tude of ~1 m.
Sample collection and analysis
All samples were collected during September-De cember 2000 from the lower catchments and estuaries
of four small rivers (Finkol, Okat, Yela, and Yeseng). In each freshwater swamp-forest habitat (see Plate 1)
we sampled fresh leaves from replicate trees (n =
3)
328 JONATHAN P. BENSTEAD ET AL. Ecology, Vol. 87, No. 2
of three dominant tree species: Terminalia carolinen
sis, Barringtonia racemosa, and Horsfieldia nunu. We
also collected three grab samples of mixed-species leaf
litter from stream channels. In mangrove forest, leaves
were collected from all major mangrove tree species
(5-6 species at each site). Where possible, leaves were
gathered from three different individuals in each of three hydrogeomorphic zones: riverine, fringe, and in
terior. We picked several undamaged distal leaves on
low branches (shade leaves). Hereafter, we refer to leaf
material as leaf litter. Replicates {n =
3) of the two
dominant seagrass species {Enhalus acoroides and
IThalassia hemprichii) were collected from different in
dividuals on reef flat areas at each of the sites, where
possible. Seagrasses were transported to the laboratory,
where epiphytes (e.g., attached algae, microorganisms) were removed using a soft toothbrush. Epiphyte slurries
were frozen immediately and transported to the Uni
versity of Georgia. Other organic matter sources were
dried for 72 h at 60?C. Dried seagrasses and tree leaves
were subsequently ground to a fine powder in a ball
mill. Seagrass epiphyte slurries were thawed, filtered
onto GF filters, and dried for 72 h at 55?C. Dried epi phyte material was removed from the filter, transferred
to a vial, and ground with a glass rod.
We lacked appropriate sampling gear for collection
of marine particulate organic matter (MPOM) that was
uncontaminated by terrestrial or coastal detritus. For
this reason, we used published values for MPOM 813C
and ?34S of -22 ? \%o and 19.5 ? l%c, respectively,
in mixing model calculations. 813C of marine phyto
plankton shows low variability around the ?
22%o value
near the equator (Goericke and Fry 1994). The 834S
value we used represents the +21%c of seawater sulfate
minus 1.5%o average fractionation during algal S syn
thesis (Trust and Fry 1992). Fishes from mangrove and reef flat areas were col
lected using a monofilament gill net (30 X 1.5 m; 20
mm mesh size) or by angling. Mangrove crabs {Scylla
serrata) were caught in mangrove habitat either in the
gill net or in baited traps. All taxa were sampled within
500 m of the mouths of the four estuaries. Where pos
sible, we collected three replicates of each species from
each habitat at each focal site (Appendix A). A total
of 35 species of fish and crustacean species were col
lected for isotope analysis (Appendix A). Between
eight and 18 fish species were sampled from each es
tuary. Small fishes (<100 mm total length) and small
crabs (<80 mm carapace width) were frozen whole.
Large fishes were subsampled by removing and freez
ing lateral muscle from the caudal peduncle. A single
chela was removed from large crabs. All consumer
samples were transported frozen to the University of
Georgia, USA. Consumer samples were subsequently
thawed and muscle tissue removed using a clean scal
pel. Muscle samples were dried for 96 h at 55?C and
ground by hand using a pestle and mortar.
Ground samples for 813C and 815N analysis were run
at the Institute of Ecology's Analytical Chemistry Lab
oratory in a Carlo Erba NA 1500 CHN analyzer (Carlo Erba Instrumentazione, Milan, Italy) coupled to a Fin
nigan Delta C isotope ratio mass spectrometer (Thermo
Electron, Waltham, Massachusetts, USA) operating as
a continuous flow system. Reproducibility was moni
tored using a bovine liver standard. Precision was better
than ?0.2%c (1 sd). Samples for 834S analysis were run
at the Environmental Isotope Laboratory at the Uni
versity of Waterloo (Canada) on a Micromass Iso
Chrom continuous flow stable isotope mass spectrom eter (GV Instruments, Manchester, UK) coupled to a
Carlo Erba elemental analyzer. Reproducibility was
monitored using several organic reference standards.
Range in measurement error was estimated at ?0.7
1.0%c. Isotope values are expressed as 813C, 815N, or
834S (with units of %c) according to the following equa
tion:
813C, 8"N, or 834S = l{RsampJRstandaid)
- 1] X 1000
where R = 13C/12C, 15N/14N or 34S/32S. Reference stan
dards were PeeDee Belemnite Carbonate, atmospheric
N2, and Canyon Diablo Troilite for 813C, 815N, and 834S,
respectively.
IsoSource analysis
All five organic matter sources were entered into
IsoSource calculations: mangrove leaf litter, freshwater
swamp-forest leaf litter, seagrasses, seagrass epiphytes,
and marine particulate organic matter (estuary-specific means and standard errors for each category). For man
grove litter, we included dominant tree species at each
site only, combining values from each hydrogeomorph ic sub-habitat. Source increment was set at 1%. Tol
erance was initially set at 0.1%c; if mixture isotope
values were out of bounds (i.e., outside the polygon
delineated by the five food web end members; Phillips 2001), we incrementally increased the tolerance value
by 0.1%c up to a maximum of 0.5%c. Only 813C and
834S were entered into IsoSource calculations because
we wanted to restrict our analysis to two elements (the
most common situation). Moreover, relative uniformity
in the mean 815N values of the five organic matter
sources at each site limited the utility of these data
(Appendix B). Trophic fractionation of C and S iso
topes is relatively small (compared to that of N iso
topes; McCutchan et al. 2003). In addition, we lacked
information about the number of trophic levels between
basal resources and consumers. Consequently, we did
not correct consumer 813C and 834S values for trophic
fractionation.
We restrict our use of IsoSource output to ranges in
source contributions (i.e., minimum to maximum fea
sible; Phillips and Gregg 2003, see Discussion) for each source and consumer species. However, we report rang
es as 1st percentile to 99th percentile of source con
tribution distributions in order to truncate distributions
February 2006 ISOSOURCE USE IN STABLE ISOTOPE ANALYSES 329
25
20
15
10
-5
-10
Yela
Swamp-forest, litter ./'
1
Mangrove litter
MPOM
h?4 .Q-<pO
o?
O .fX.
Seagrasses
.f O I
...?
Seagrass epiphytes
Okat MPOM
.i?B?t.
Seagrasses ...G--P
x6
Swamp-forest litter */ ?o
Mangrove
*. x /
O?y
Seagrass
"M epiphytes
25
20
15
10
5
0
-5
-10
Finkol MPOM
m*.
Swamp-forest / litter /
^ Seagrasses ...9....Q.p
/o
O
?o /o
i/ -j- ""?-e -f^. ,
Mangrove I Seagrass litter
1 epiphytes
-35 -30 -25 -20 -15 -10
Yeseng
Swamp-forest litter /
k i
MPOM
m*. ^.? Seagrasses
-o#^
....x--'" Seagrass
epiphytes
i Mangrove litter
-5 -35
?13C
-30 -25 -20 -15 -10
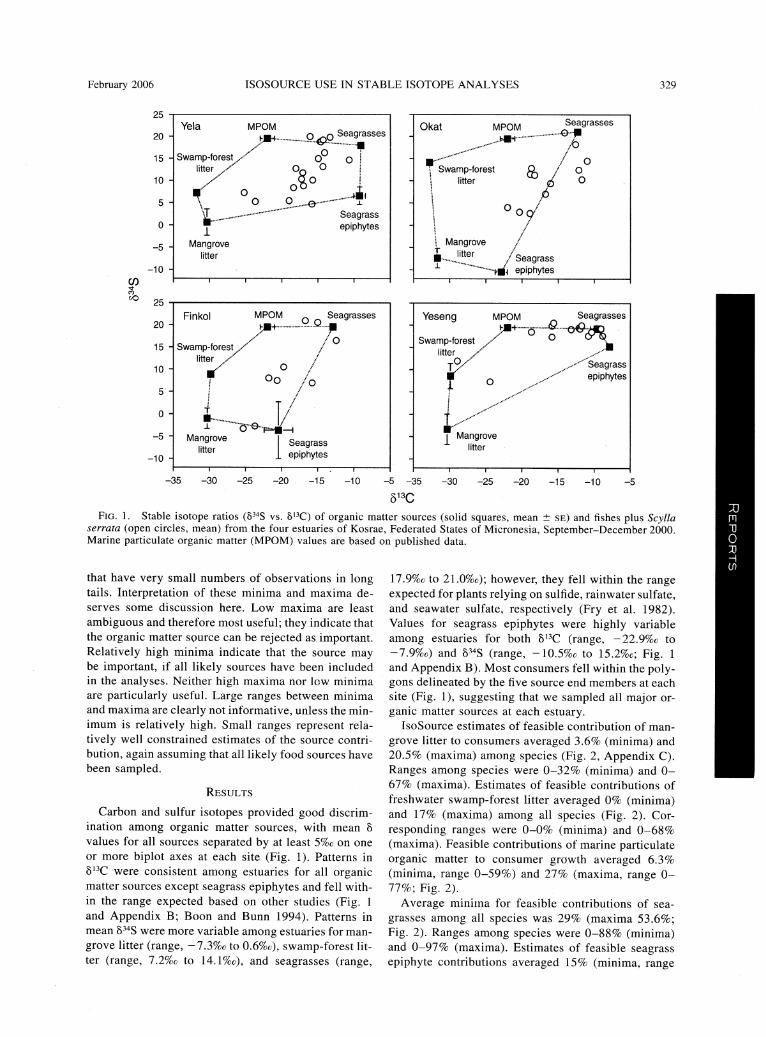
Fig. 1. Stable isotope ratios (834S vs. 813C) of organic matter sources (solid squares, mean ? se) and fishes plus Scylla serrata (open circles, mean) from the four estuaries of Kosrae, Federated States of Micronesia, September-December 2000.
Marine particulate organic matter (MPOM) values are based on published data.
that have very small numbers of observations in long tails. Interpretation of these minima and maxima de
serves some discussion here. Low maxima are least
ambiguous and therefore most useful; they indicate that
the organic matter spurce can be rejected as important.
Relatively high minima indicate that the source may be important, if all likely sources have been included
in the analyses. Neither high maxima nor low minima
are particularly useful. Large ranges between minima
and maxima are clearly not informative, unless the min
imum is relatively high. Small ranges represent rela
tively well constrained estimates of the source contri
bution, again assuming that all likely food sources have
been sampled.
Results
Carbon and sulfur isotopes provided good discrim
ination among organic matter sources, with mean 8
values for all sources separated by at least 5%o on one
or more biplot axes at each site (Fig. 1). Patterns in
813C were consistent among estuaries for all organic matter sources except seagrass epiphytes and fell with
in the range expected based on other studies (Fig. 1
and Appendix B; Boon and Bunn 1994). Patterns in mean 834S were more variable among estuaries for man
grove litter (range, ?
7.3%o to 0.6%o), swamp-forest lit
ter (range, 7.2%o to I4.l%c), and seagrasses (range,
17.9%o to 21.0%o); however, they fell within the range ^^^H expected for plants relying on sulfide, rainwater sulfate, ^^^H and seawater sulfate, respectively (Fry et al. 1982). ^^^H Values for seagrass epiphytes were highly variable
^^^H among estuaries for both 813C (range, -22.9%c to
^^^H -1.9%c) and 834S (range, -10.5%o to 15.2%0; Fig. 1
^^M and Appendix B). Most consumers fell within the poly- ^^^H gons delineated by the five source end members at each
^^^H site (Fig. 1), suggesting that we sampled all major or-
^^^H ganic matter sources at each estuary. ^^^H
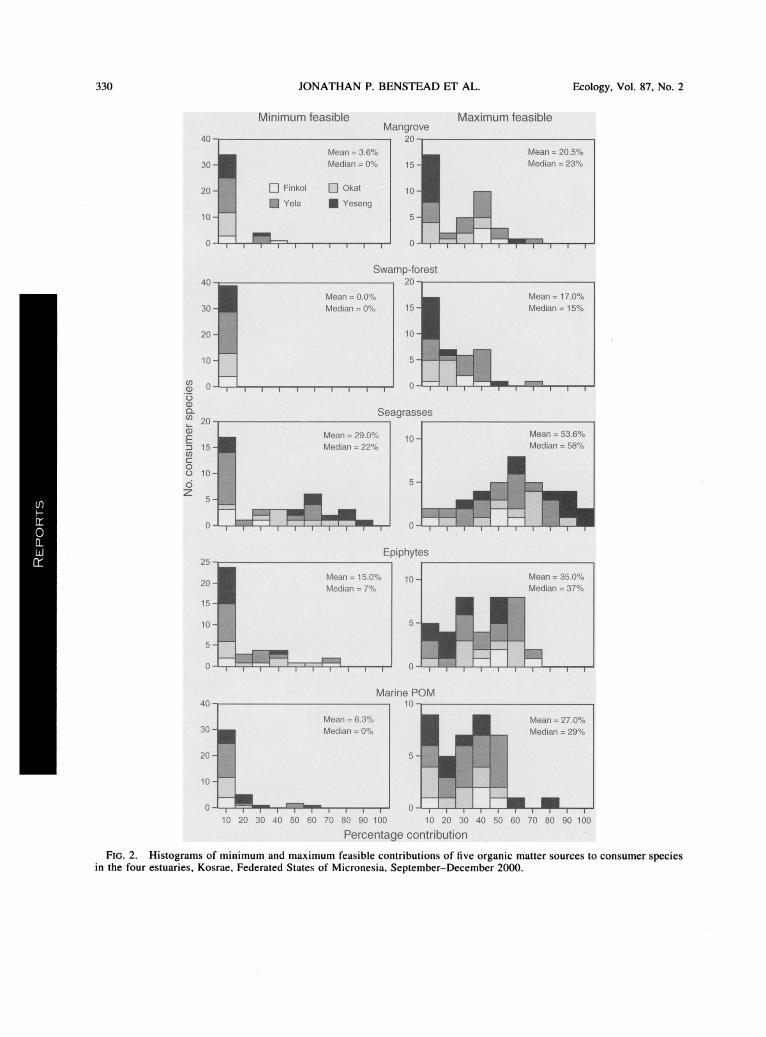
IsoSource estimates of feasible contribution of man- ^^^H
grove litter to consumers averaged 3.6% (minima) and ^^^H
20.5% (maxima) among species (Fig. 2, Appendix C). ^^^H Ranges among species were 0-32% (minima) and 0- HHm 67% (maxima). Estimates of feasible contributions of
freshwater swamp-forest litter averaged 0% (minima) and 17% (maxima) among all species (Fig. 2). Cor
responding ranges were 0-0% (minima) and 0-68%
(maxima). Feasible contributions of marine particulate
organic matter to consumer growth averaged 6.3%
(minima, range 0-59%) and 27% (maxima, range 0
77%; Fig. 2).
Average minima for feasible contributions of sea
grasses among all species was 29% (maxima 53.6%;
Fig. 2). Ranges among species were 0-88% (minima) and 0-97% (maxima). Estimates of feasible seagrass
epiphyte contributions averaged 15% (minima, range
330 JONATHAN P. BENSTEAD ET AL. Ecology, Vol. 87, No. 2
Minimum feasible Mangrove
20
Maximum feasible
Swamp-forest 20
Epiphytes
Marine POM 10
T?r 10 20 30 40 50 60 70 80 90 100 10 20 30 40 50 60 70 80 90 100
Percentage contribution
Fig. 2. Histograms of minimum and maximum feasible contributions of five organic matter sources to consumer species in the four estuaries, Kosrae, Federated States of Micronesia, September-December 2000.
February 2006 ISOSOURCE USE IN STABLE ISQTOPE ANALYSES 331
0-69%) and 35% (maxima, range 0-69%; see Fig. 2).
Combined, seagrasses and seagrass epiphytes domi
nated estimated contributions to the growth of fish and
Scylla serrata in each estuary (Fig. 2).
Discussion
A recent series of papers has greatly strengthened
the statistical underpinnings of stable isotope interpre
tations, providing much needed philosophical and prac
tical guidance in the interpretation of mixing models
(Phillips 2001, Phillips and Gregg 2001, Phillips and Koch 2002). The most recent paper in this series in
troduces software that calculates multitudinous feasible
solutions to mixing problems in which there are mul
tiple sources and no unique solution can be inferred
(Phillips and Gregg 2003). IsoSource output showed that contributions from
mangrove-derived organic matter were variable and
relatively low among estuaries and species, consistent
with other studies that have used multiple stable isotope
analysis to examine trophic importance of mangrove
derived organic matter in estuarine food webs (e.g.,
Rodelli et al. 1984, Hemminga et al. 1994, Marguillier et al. 1997). Isotope research to date suggests that the
influence of mangrove-derived organic material is typ
ically limited to areas close to mangrove forest. This
is due either to rapid dilution of mangrove organic
material by other sources with distance, or to decreas
ing food quality as mangrove Jitter becomes increas
ingly refractory as it moves farther from its original
source, or a combination of these factors. All the con
sumers in this study were collected within 500 m of
the mangrove fringe. The low contributions of man
grove litter that we found are probably due to the rel
atively higher quality (and production) of organic mat
ter from seagrass communities.
Contribution of litter from freshwater swamp-forest was also relatively low. Discrimination of mangrove
litter from other C3 plants has rarely been attempted in
isotope studies, because these two sources are usually
impossible to distinguish using 813C, the most com
monly used isotope value. Our use of 834S allowed us
to partition these two sources. In this study, the 1st
percentile of source contribution estimates for all spe
cies and sites was zero, indicating that swamp-forest litter may contribute no organic matter to Kosrae's in
shore food webs. Litter production in Terminalia-dom
inated swamp-forest is as high as that in mangrove on
Kosrae (1181 vs. 1044 g ash-free dry mass-m~2-yr_1; Chimner and Ewel 2004; R. Hauff, unpublished data).
Swamp-forest is also frequently flooded, promoting overland flow toward stream channels and the coastal
margin (Drexler and Ewel 2001). Moreover, decom
position of senescent Terminalia carolinensis leaves is
slow in the lower Yela River (<l%/d; J. G. March and J. P. Benstead, unpublished data). It therefore seems
probable that storms flush much of the swamp-forest litter production into estuaries and adjacent coastal ar
eas. However, IsoSource results demonstrated that its
incorporation into food webs is very limited, due either
to low relative inputs or food quality.
IsoSource output showed that seagrasses and their
epiphytes dominated source contributions to consumer
species sampled in this study. Many continent-based
studies have estimated similarly high levels of sea
grass-derived organic matter contributions to inshore
food webs (Loneragan et al. 1997, Marguillier et al.
1997). Fewer studies have studied the relative contri
butions of seagrass epiphytes to consumers using stable
isotopes but most have shown relatively large contri
butions from these inconspicuous primary producers ___
(e.g., Moncreiff and Sullivan 2001). For example, in- ^^^1
vertebrates in Gulf of Mexico seagrass meadows fed ^^^|
largely on algae growing on seagrass blades, and their ^^^1
813C tracked epiphyte values more closely than those ^^^|
of seagrass in inter-site comparisons (Kitting et al. ^^^H
^H IsoSource results showed that contributions from ^^^|
marine particulate organic matter (e.g., oceanic phy- ^^^H toplankton) to consumers were relatively small. This
^^^H is not surprising. Concentrations of chlorophyll a are
^^^fl low in Kosrae's estuaries and coastal waters (S. Nixon, ^^^B unpublished data), which lack the shallow, productive ^^^H shelf environment common to many continental re-
^^^H gions. Rates of pelagic primary production are low in
^^^B the tropical Pacific (20-50 g C-m^yr1; Dalzell et al.
Ell 1996). In contrast, primary production by seagrasses Btfl can exceed 800 g C-m~2-yr_1 (Duarte and Chiscano
SSI 1999). Despite high potential connectivity, subsidies of
^RH phytoplankton-based organic matter into inshore food
^^^H webs from relatively unproductive surrounding ocean
^^^H may therefore be low on small oceanic islands, espe- ^^^H cially compared to local organic matter production by ^^^H seagrass communities.
^^^H IsoSource enabled the inclusion of five potentially ^^^H
important organic matter sources in our dual-isotope ^^^H analysis. Subsequent pooling of species minima and
^^^H maxima in histograms allowed us to draw broad con-
^^^H elusions about the relative importance of organic matter
^^^| sources for estuarine food webs on the island. For ex-
^^^B ample, we can rank the organic matter sources in tro-
^^^H phic importance with some confidence: seagrasses >
^^^H seagrass epiphytes > marine particulate organic matter
Hh > mangrove forest > freshwater swamp-forest. The
output also pointed to differences in trophic support
among the four estuaries we studied. However, the val
ue of the output was lower at the species level. The
trophic support of some species could not be identified
with confidence, either because of large ranges in
source contribution or because they fell out-of-bounds
in the IsoSource analysis (i.e., their isotope values were
outside the mixing polygon). In many cases (see Fig.
1), corrections for trophic fractionation would have
brought these values within bounds (i.e., inside the
mixing polygon) and allowed IsoSource estimates to
be made using our specified range of tolerance values.
332 JONATHAN P. BENSTEAD ET AL. Ecology, Vol. 87, No. 2
We restricted our reporting of IsoSource output to
feasible ranges in source contributions. Phillips and
Gregg (2003) stress that this is the correct way to view and report the model output. IsoSource also outputs the
mean for these distributions, among other descriptors such as standard deviation and various percentiles. All
the solutions identified by the model are consistent with
isotopic mass balance; there is no a priori reason to
prefer one solution over another on a strictly isotopic basis. But in a real food web with various food sources,
factors such as availability, palatability, and produc
tivity will vary strongly among organic matter sources,
I and these inequalities will determine the unique solu
tion of what gets eaten and assimilated. IsoSource does
not share the bias of real food webs and so there is no
reason to expect that its distribution means will ac
curately index the unique solutions that scientists seek.
Consequently, mean values describing the average of
all the source contribution estimates should be treated
with utmost caution and never equated with unique solutions to the mixing problem.
IsoSource yields one firm result: minimum and max
imum values for each source contribution. These values
are constrained by mass balance. Reporting minimum
maximum constraints is a safe and often enlightening use of IsoSource output and, importantly, emphasizes
that unique solutions have yet to be found. Information
from multiple species (e.g., in histograms) may allow
relatively firm conclusions about the relative impor tance of sources for the trophic support of a food web.
Another route is to use additional information to further
sort the results, as pointed out by Phillips and Gregg
(2003). Sometimes even very qualitative information
will rapidly narrow the possible range of feasible so
lutions toward the unique solution. Procedures for post
processing IsoSource output to consider other non-iso
topic constraints (e.g., sorting, in which source A must
have a greater contribution than source B) have been
provided at the IsoSource web site.8 Sorting can be a
powerful and rapid way to narrow the range of feasible
solutions toward the unique solution. An example would be in a food web study where stomach content
analyses reliably show that contributions from fish are
greater than contributions from invertebrates, so that
ranking of potential source contributions becomes pos
sible. However, ranking must be accurate and this is
often a difficult challenge. After all, it is because these
contributions are genuinely hard to estimate that ecol
ogists originally turned to isotope tracers.
An important point about natural-abundance isotope
surveys is that they are most powerful in disproving
the importance of certain sources, but are usually very
weak in the converse sense: showing that a source of
interest is highly important. Crossing the line from dis
proof to nailing down a unique solution probably re
quires experimentation in most cases, an additional step
beyond the survey of natural systems. In some cases,
sampling along transects where one source is increas
ingly important, or following seasonal or spatial shifts
in natural isotope distributions, can provide fairly un
ambiguous natural experiments (Finlay et al. 2002,
McCutchan and Lewis 2002). But many times, adding enriched tracer to shift isotope values artificially will
be required to establish the importance of a source
(Wollheim et al. 1999). Fortunately, many ecologists are beginning to combine surveys of the natural isotope distributions with isotope shift experiments, striving to
use both approaches to advantage by disproving the
importance of certain sources in surveys while posi
tively quantifying the importance of other sources in
isotope addition experiments. This kind of additional
information can be used also to help sort the output from the new and elegant IsoSource software, to find
unique solutions for these difficult multiple source
problems. The IsoSource approach is an extremely useful ad
dition to the rapidly growing roster of statistical tech
niques available to those analyzing isotope data. It can
often provide narrow ranges of source contribution es
timates and is particularly useful for showing that a
source is not important for a food web. Used carefully, it represents a step toward understanding which organic
matter sources support food webs; more detailed work
is necessary to identify the unique solution within rang es of feasible solutions.
Acknowledgments
This research was funded through a research joint venture
agreement between the USDA and CMP at the University of
Georgia. We are grateful to Moses Palik, Jason Jack, Rob
Hauff, Sarah March, and Maxwell Salik for assistance in the
field. Erick Waguk, Simpson Abraham, and the staff of Kos
rae's Development Review Commission helped with logistics.
Lynne Parenti identified Oxyeleotris sp. We thank Tom Mad
dox, Bill Mark, and Bob Drimmie for stable isotope analyses. Don Phillips and an anonymous reviewer provided insightful comments on an earlier version of the manuscript.
Literature Cited
Boon, P. I., and S. E. Bunn. 1994. Variations in the stable
carbon isotope composition of aquatic plants and their im
plications for food web analysis. Aquatic Botany 48:99
108.
Chimner, R. A., and K. C. Ewel. 2004. Differences in carbon
fluxes between forested and cultivated Micronesian tropical
peatlands. Wetlands Ecology and Management 12:419
427.
Dalzell, P., T. J. H. Adams, and N. V. C. Polunin. 1996.
Coastal fisheries in the Pacific islands. Oceanography and
Marine Biology: an Annual Review 34:395-531.
Drexler, J. Z., and K. C. Ewel. 2001. Effect of the 1997
1998 ENSO-related drought on hydrology and salinity in a Micronesian wetland complex. Estuaries 24:347-356.
Duarte, C. M., and C. L. Chiscano. 1999. Seagrass biomass
and production: a reassessment. Aquatic Botany 65:159
174.
Finlay, J. C, S. Khandwala, and M. E. Power. 2002. Spatial scales of carbon flow in a river food web. Ecology 83:
1845-1859.
8 (http://www.epa.gov/wed/pages/models/isosource/
isosource.htm)
February 2006 ISOSOURCE USE IN STABLE ISOTOPE ANALYSES 333
Fry, B., R. S. Scalan, J. K. Winters, and P. L. Parker. 1982.
Sulphur uptake by salt grasses, mangroves, and seagrasses in anaerobic sediments. Geochimica et Cosmochimica Acta
46:1121-1124.
Goericke, R., andB. Fry. 1994. Variations of marine plankton 813C with latitude, temperature, and dissolved C02 in the
world ocean. Global Biogeochemical Cycles 8:85-90.
Hemminga, M. A., F. J. Slim, J. Kazungu, G. M. Ganssen, J.
Nieuwenhuize, and N. M. Kruyt. 1994. Carbon outwelling from a mangrove forest with adjacent seagrass beds and
coral reefs (Gazi Bay, Kenya). Marine Ecology Progress Series 106:291-301.
Kitting, C. L? B. Fry, and M. D. Morgan. 1984. Detection
of inconspicuous epiphytic algae supporting food webs in
seagrass meadows. Oecologia 62:145-149.
Loneragan, N. R., S. E. Bunn, and D. M. Kellaway. 1997.
Are mangroves and seagrasses sources of organic carbon
for penaeid prawns in a tropical Australian estuary? A mul
tiple stable-isotope study. Marine Biology 130:289-300.
Marguillier, S., G. van der Velde, F. Dehairs, M. A. Hem
minga, and S. Rajagopal. 1997. Trophic relationships in
an interlinked mangrove-seagrass ecosystem as traced by 8I3C and 815N. Marine Ecology Progress Series 151:115
121.
McCutchan, J. H., Jr., and W M. Lewis, Jr. 2002. Relative
importance of carbon sources for macroinvertebrates in a
Rocky Mountain stream. Limnology and Oceanography 47:
742-752.
McCutchan, J. H., Jr., W. M. Lewis, Jr., C. Kendall, and C.
C. McGrath. 2003. Variation in trophic shift for stable
isotope ratios of carbon, nitrogen, and sulfur. Oikos 102:
378-390.
Merlin, M., R. Taulung, and J. Juvik. 1993. Sahk Kap Ac
Kain In Acn Kosrae (Plants and environments of Kosrae). East-West Center, Honolulu, Hawaii, USA.
Moncreiff, C. A., and M. J. Sullivan. 2001. Trophic impor tance of epiphytic algae in subtropical seagrass beds: ev
idence from multiple stable isotope analyses. Marine Ecol . ogy Progress Series 215:93-106.
Peterson, B. J., and B. Fry. 1987. Stable isotopes in ecosys tem studies. Annual Review of Ecology and Systematics 18:293-320.
Phillips, D. L. 2001. Mixing models in analyses of diet using
multiple stable isotopes: a critique. Oecologia 127:166
170.
Phillips, D. L., and J. W Gregg. 2001. Uncertainty in source
partitioning using stable isotopes. Oecologia 127:171
179.[See also Erratum, Oecologia 128:304.]
Phillips, D. L., and J. W Gregg. 2003. Source partitioning
using stable isotopes: coping with too many sources. Oec
ologia 136:261-269.
Phillips, D. L., and P. L. Koch. 2002. Incorporating concen
tration dependence in stable isotope mixing models. Oec
ologia 130:114-125.
Rodelli, M. R., J. N. Gearing, P. J. Gearing, N. Marshall, and
A. Sasekumar. 1984. Stable isotope ratio as a tracer of
mangrove carbon in Malaysian ecosystems. Oecologia 61:
326-333.
Trust, B. A., and B. Fry. 1992. Stable sulphur isotopes in
plants: a review. Plant, Cell and Environment 15:1105
1110.
Whitesell, C. D., C. D. MacLean, M. C. Falanruw, T. G.
Cole, and A. H. Ambacher. 1986. Vegetation survey of
Kosrae, Federated States of Micronesia. U.S. Forest Ser
vice Resource Bulletin PSW-17. USDA Pacific Southwest
Forest and Range Experiment Station, Berkeley, Califor
nia, USA.
Wollheim, W M., B. J. Peterson, L. A. Deegan, M. Bahr, J.
E. Hobbie, D. Jones, W B. Bowden, A. E. Hershey, G. W
Kling, and M. C. Miller. 1999. A coupled field and mod
eling approach for the analysis of nitrogen cycling in
streams. Journal of the North American Benthological So
ciety 18:199-221.
APPENDIX A
Fish and crustacean species sampled in this study with common names in English and Kosraean, trophic guild, and number
of replicates analyzed for stable isotope ratios from the four estuaries sampled {Ecological Archives E087-018-A1).
APPENDIX B
Mean ?13C, 815N, and 834S values (?se where n > 1) for organic matter sources and consumer species sampled from the
catchments and estuaries of the Finkol, Okat, Yela, and Yeseng rivers, Kosrae, Federated States of Micronesia, September December, 2000 {Ecological Archives E087-018-A2).
APPENDIX C
Ranges of feasible percentage contributions (lst-99th percentile) of five dominant organic matter sources to carbon and
sulfur assimilated by fishes and Scylla serrata from the four estuaries on Kosrae, Federated States of Micronesia, September December, 2000, based on 13C and 834S and IsoSource source partitioning software {Ecological Archives E087-018-A3).
3