Embed Size (px)
Citation preview
1241
Computer-Aided Design & Applications, 17(6), 2020, 1241-1265 © 2020 CAD Solutions, LLC, http://www.cad-journal.net
Testing Implementations of Geometric Dimensioning and
Tolerancing in CAD Software
Robert R. Lipman1 and James J. Filliben2
1National Institute of Standards and Technology (NIST), [email protected] 2National Institute of Standards and Technology (NIST), [email protected]
Corresponding author: Robert R. Lipman, [email protected]
Abstract. Applying geometric and dimensional tolerances (GD&T) to part features in computer-aided design (CAD) software is essential so that the part will function properly and to guide downstream manufacturing and inspection processes. However, it is not well characterized how CAD software implements capabilities for a
designer to apply GD&T to a part. Of course, CAD software vendors do their own internal testing of those capabilities and users evaluate CAD software so that it satisfies their CAD modeling requirements. However, there has never been any
rigorous public-domain testing of CAD software GD&T implementations. To improve that situation, the National Institute of Standards and Technology (NIST) has developed a system to test implementations of GD&T in CAD software. Representative part geometry with GD&T applied to features was modeled in four of the major CAD systems. Errors with semantic representation and graphical presentation of the GD&T were collected and analyzed. The testing methodology, test results, and data analysis demonstrate how well the CAD system GD&T
implementations perform. The testing project results can be used as a basis for future testing, methods, and standards to evaluate defects in GD&T applied to part features.
Keywords: CAD software, testing, tolerance, GD&T, manufacturing DOI: https://doi.org/10.14733/cadaps.2020.1241-1265
1 INTRODUCTION
The geometry and topology of parts modeled in CAD software can be checked for defects. Defect detection might take place when the part is being modeled or after a part is translated to another CAD system. Although the visual appearance of a part might be acceptable; the underlying geometric representation might be a source of problems with subsequent downstream finite element analysis, and manufacturing and inspection processes. This is particularly true in a model-based environment
where the geometric representation is automatically used in those downstream processes [1, 2].
The U.S. Department of Defense standard practice for Technical Data Packages (MIL-STD-31000A)
1242
Computer-Aided Design & Applications, 17(6), 2020, 1241-1265 © 2020 CAD Solutions, LLC, http://www.cad-journal.net
[3], in Appendix C section C.7.1, defines 66 criteria for evaluating the following types of CAD geometry: curves, surfaces, edges, edge loops, faces, shells, and solids. Each criterion defines the “effects of condition on CAD data quality” on design or drafting, data exchange, finite element analysis, and numerically controlled manufacturing. A condition is a specific type of defect for a type
of geometry. For example, in CAD geometry, adjacent curves, line segments, or surfaces might be separated by a gap or may overlap each other when they are expected to perfectly adjoin each other. This type of defect might result in the failure of finite element meshing algorithms, the failure of computer numerically controlled (CNC) tool paths, or create an undesired visual appearance.
However, some of the CAD data quality issues might not result in an obvious problem with the visual appearance of the geometry. An entire market of software to validate CAD geometry has been developed to check that the underlying geometric representation is free from any defects that
might affect its downstream use by analysis, manufacturing, and inspection processes [4]. This
function is commonly referred to as ‘healing’ the CAD geometry. CAD validation software is important to validate translations of CAD models from one software system or format to another. Geometric representation is the internal mathematical representation of points, curves, surfaces, and solids. In some CAD software, a geometry kernel such as ACIS [5] or Parasolid [6] is used for the underlying mathematical representation. A CAD software user views the visual appearance of
the mathematical geometric representations. The visual appearance is known as ‘presentation’ and will be used for the rest of this article.
Another important characteristic about a part modeled in CAD software is product and manufacturing information (PMI). An important aspect of PMI are the annotations, applied to the edges and faces of a part, to specify geometric dimensioning and tolerancing (GD&T) [7]. PMI also includes other non-geometric characteristics such as surface textures, process notes, material specifications, and weld symbols, however, the focus of this research is GD&T. GD&T is used to
specify the limits of imperfection of features of a part so that it will function properly in an assembly
and guide the manufacturing and inspection processes. Several industry standards specify the symbolic language for GD&T as it is applied to two-dimensional (2D) drawings and three-dimensional (3D) models: ASME Y14.5 [8], ASME Y14.41 [9], ISO 1101 [10], and ISO 16792 [11]. Common characteristics of GD&T include geometric tolerances for position, flatness, surface profile, and perpendicularity; dimensional tolerances on diameter and length; and datum targets and datum features. A GD&T symbol has two characteristics: (1) its syntax on a drawing and (2) the semantics
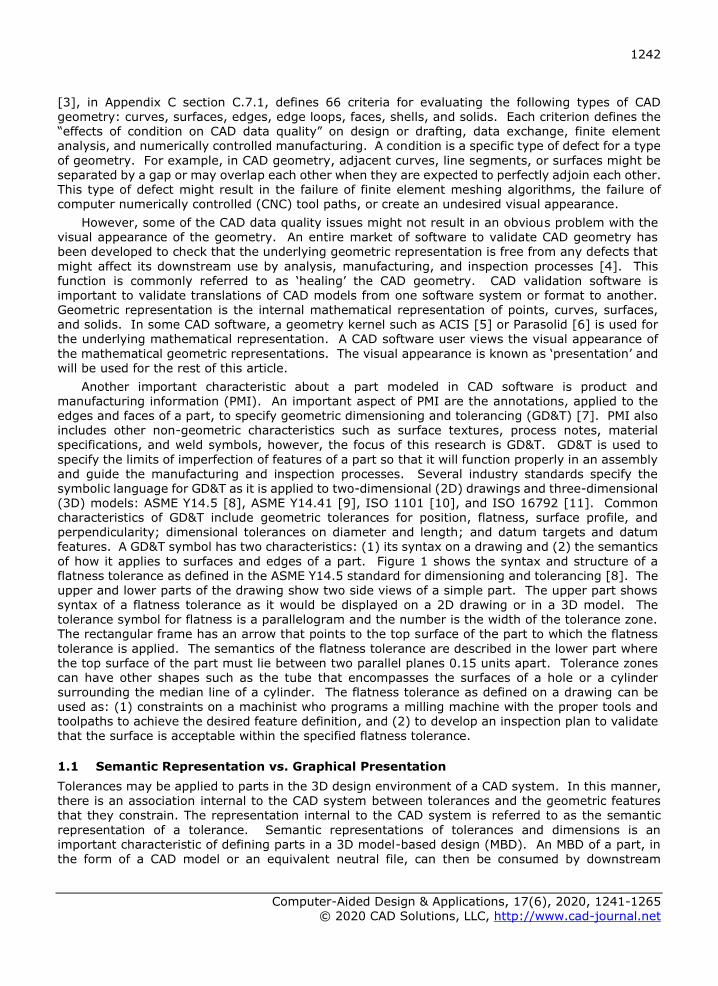
of how it applies to surfaces and edges of a part. Figure 1 shows the syntax and structure of a flatness tolerance as defined in the ASME Y14.5 standard for dimensioning and tolerancing [8]. The upper and lower parts of the drawing show two side views of a simple part. The upper part shows syntax of a flatness tolerance as it would be displayed on a 2D drawing or in a 3D model. The tolerance symbol for flatness is a parallelogram and the number is the width of the tolerance zone. The rectangular frame has an arrow that points to the top surface of the part to which the flatness
tolerance is applied. The semantics of the flatness tolerance are described in the lower part where
the top surface of the part must lie between two parallel planes 0.15 units apart. Tolerance zones can have other shapes such as the tube that encompasses the surfaces of a hole or a cylinder surrounding the median line of a cylinder. The flatness tolerance as defined on a drawing can be used as: (1) constraints on a machinist who programs a milling machine with the proper tools and toolpaths to achieve the desired feature definition, and (2) to develop an inspection plan to validate that the surface is acceptable within the specified flatness tolerance.
1.1 Semantic Representation vs. Graphical Presentation
Tolerances may be applied to parts in the 3D design environment of a CAD system. In this manner, there is an association internal to the CAD system between tolerances and the geometric features that they constrain. The representation internal to the CAD system is referred to as the semantic
representation of a tolerance. Semantic representations of tolerances and dimensions is an important characteristic of defining parts in a 3D model-based design (MBD). An MBD of a part, in
the form of a CAD model or an equivalent neutral file, can then be consumed by downstream
1243
Computer-Aided Design & Applications, 17(6), 2020, 1241-1265 © 2020 CAD Solutions, LLC, http://www.cad-journal.net
machining and inspection planning software. Ideally, this can eliminate the error-prone reentry, and sometimes interpretation, of information in a drawing-based environment [1].
Figure 1: Flatness tolerance syntax and semantics as defined in ASME Y14.5 [8].
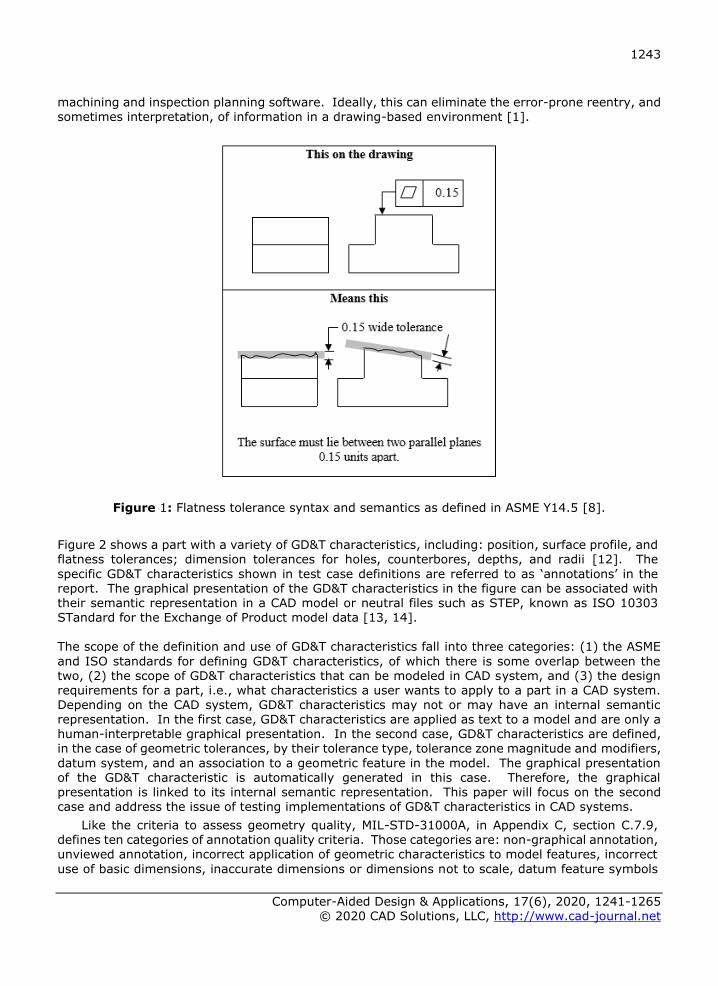
Figure 2 shows a part with a variety of GD&T characteristics, including: position, surface profile, and flatness tolerances; dimension tolerances for holes, counterbores, depths, and radii [12]. The
specific GD&T characteristics shown in test case definitions are referred to as ‘annotations’ in the report. The graphical presentation of the GD&T characteristics in the figure can be associated with their semantic representation in a CAD model or neutral files such as STEP, known as ISO 10303 STandard for the Exchange of Product model data [13, 14]. The scope of the definition and use of GD&T characteristics fall into three categories: (1) the ASME
and ISO standards for defining GD&T characteristics, of which there is some overlap between the two, (2) the scope of GD&T characteristics that can be modeled in CAD system, and (3) the design requirements for a part, i.e., what characteristics a user wants to apply to a part in a CAD system. Depending on the CAD system, GD&T characteristics may not or may have an internal semantic representation. In the first case, GD&T characteristics are applied as text to a model and are only a human-interpretable graphical presentation. In the second case, GD&T characteristics are defined, in the case of geometric tolerances, by their tolerance type, tolerance zone magnitude and modifiers,
datum system, and an association to a geometric feature in the model. The graphical presentation of the GD&T characteristic is automatically generated in this case. Therefore, the graphical presentation is linked to its internal semantic representation. This paper will focus on the second case and address the issue of testing implementations of GD&T characteristics in CAD systems.
Like the criteria to assess geometry quality, MIL-STD-31000A, in Appendix C, section C.7.9, defines ten categories of annotation quality criteria. Those categories are: non-graphical annotation,
unviewed annotation, incorrect application of geometric characteristics to model features, incorrect
use of basic dimensions, inaccurate dimensions or dimensions not to scale, datum feature symbols
1244
Computer-Aided Design & Applications, 17(6), 2020, 1241-1265 © 2020 CAD Solutions, LLC, http://www.cad-journal.net
missing or incorrectly applied, missing or incorrect use of symbols in tolerance blocks and dimensions, view errors, improper use of line types and arrowheads in leaders and dimensions, and errors in tolerance values. Some of the criteria are only related to the presentation of GD&T on 2D drawings or 3D models. Other criteria might apply to the presentation of GD&T and/or its
representation in a CAD system.
Figure 2: Example part with GD&T [12].
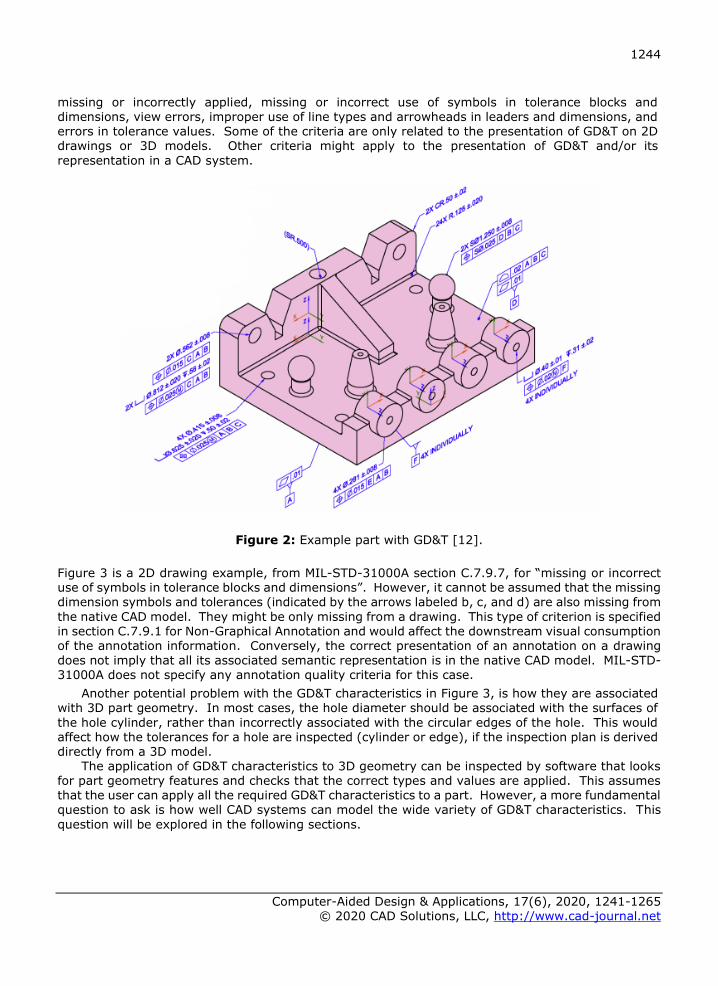
Figure 3 is a 2D drawing example, from MIL-STD-31000A section C.7.9.7, for “missing or incorrect use of symbols in tolerance blocks and dimensions”. However, it cannot be assumed that the missing dimension symbols and tolerances (indicated by the arrows labeled b, c, and d) are also missing from
the native CAD model. They might be only missing from a drawing. This type of criterion is specified in section C.7.9.1 for Non-Graphical Annotation and would affect the downstream visual consumption of the annotation information. Conversely, the correct presentation of an annotation on a drawing
does not imply that all its associated semantic representation is in the native CAD model. MIL-STD-31000A does not specify any annotation quality criteria for this case.
Another potential problem with the GD&T characteristics in Figure 3, is how they are associated with 3D part geometry. In most cases, the hole diameter should be associated with the surfaces of
the hole cylinder, rather than incorrectly associated with the circular edges of the hole. This would affect how the tolerances for a hole are inspected (cylinder or edge), if the inspection plan is derived directly from a 3D model.
The application of GD&T characteristics to 3D geometry can be inspected by software that looks for part geometry features and checks that the correct types and values are applied. This assumes that the user can apply all the required GD&T characteristics to a part. However, a more fundamental question to ask is how well CAD systems can model the wide variety of GD&T characteristics. This
question will be explored in the following sections.
1245
Computer-Aided Design & Applications, 17(6), 2020, 1241-1265 © 2020 CAD Solutions, LLC, http://www.cad-journal.net
Figure 3: 2D drawing example of annotation quality criteria from MIL-STD-31000A [3].
2 TESTING GD&T IN CAD SYSTEMS
2.1 Testing Methodologies
Frechette and Fischer [15] propose several scenarios for testing CAD software to GD&T standards.
All the testing scenarios start with test case definitions like Figure 2. A test case includes the definition of part geometry, GD&T characteristics (defined by either ASME or ISO standards), and the geometric surfaces or edges to which they are applied. The first and simplest scenario tests the CAD software’s capability to model the GD&T in a test case. The second scenario performs a round trip test where the native CAD model is reopened in the same CAD software to test if the presentation of the GD&T characteristics has changed. The third scenario tests derivative neutral files generated by the CAD software. A commonly used neutral file is STEP [13, 14]. This scenario requires that a
reference STEP file is created from the test case in addition to a STEP file exported from the CAD system. The reference STEP file is generated independently of the CAD system and is assumed to be an exact representation of the test case. The reference and CAD system generated STEP files are then compared to each other. The fourth scenario proposes methods to automate the process. In practical terms, some of the scenarios are difficult to perform. Generating reference neutral files for anything but the simplest models could be a very difficult process requiring its own methodology to
declare that the neutral file is indeed a reference neutral file.
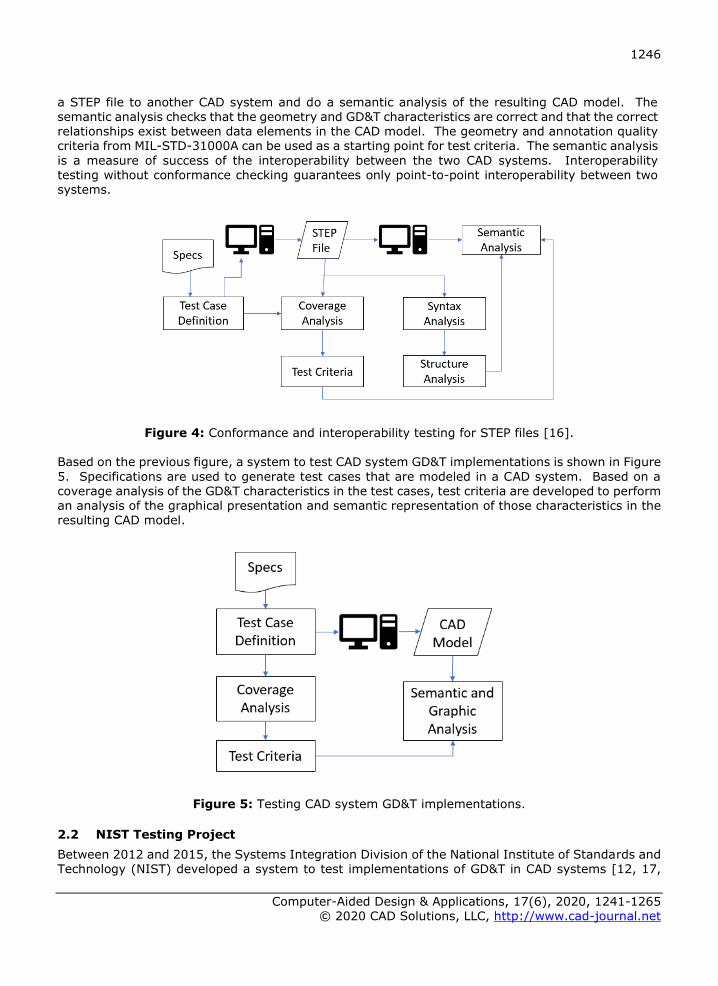
Kindrick et al. [16] describe a conformance and interoperability testing procedure for STEP neutral files. Conformance testing is defined as “the assessment of a product to determine if it behaves as expected while interoperating with a reference system.” Figure 4 is a diagram of the conformance and interoperability testing procedure. Test specifications are used to generate test cases that are modeled in a CAD system from which a STEP file is exported. Coverage analysis measures the test case definitions and STEP file for which GD&T characteristics are covered. Due
to limitations of the CAD system to export all PMI information to a STEP file, there might be a discrepancy between what the coverage analysis reports for the STEP file and the test case specification. Conformance checking of the STEP file checks syntax and structure. This can be thought of as checking the spelling (syntax) and grammar (structure) of a STEP file. The analysis checks that all attributes are of the correct type and that the correct relationships exist between
pieces of information. The analysis can be automated with conformance checking software [7]. Based on the coverage analysis, test criteria can be developed to measure the success of importing
1246
Computer-Aided Design & Applications, 17(6), 2020, 1241-1265 © 2020 CAD Solutions, LLC, http://www.cad-journal.net
a STEP file to another CAD system and do a semantic analysis of the resulting CAD model. The semantic analysis checks that the geometry and GD&T characteristics are correct and that the correct relationships exist between data elements in the CAD model. The geometry and annotation quality criteria from MIL-STD-31000A can be used as a starting point for test criteria. The semantic analysis
is a measure of success of the interoperability between the two CAD systems. Interoperability testing without conformance checking guarantees only point-to-point interoperability between two systems.
Figure 4: Conformance and interoperability testing for STEP files [16].
Based on the previous figure, a system to test CAD system GD&T implementations is shown in Figure
5. Specifications are used to generate test cases that are modeled in a CAD system. Based on a coverage analysis of the GD&T characteristics in the test cases, test criteria are developed to perform an analysis of the graphical presentation and semantic representation of those characteristics in the resulting CAD model.
Figure 5: Testing CAD system GD&T implementations.
2.2 NIST Testing Project
Between 2012 and 2015, the Systems Integration Division of the National Institute of Standards and Technology (NIST) developed a system to test implementations of GD&T in CAD systems [12, 17,
1247
Computer-Aided Design & Applications, 17(6), 2020, 1241-1265 © 2020 CAD Solutions, LLC, http://www.cad-journal.net
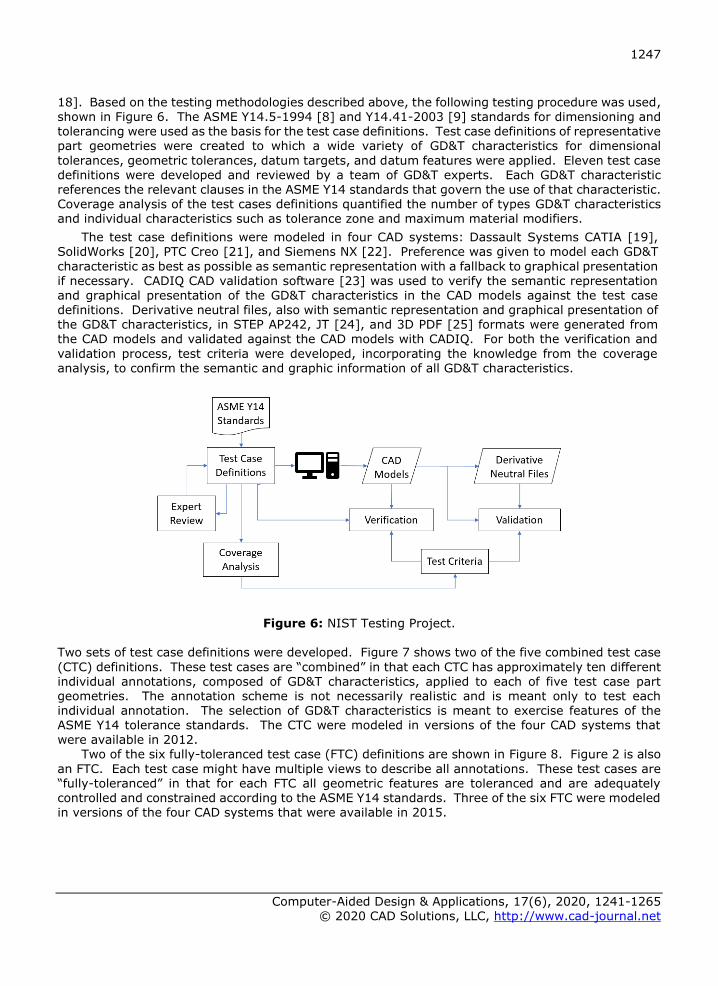
18]. Based on the testing methodologies described above, the following testing procedure was used, shown in Figure 6. The ASME Y14.5-1994 [8] and Y14.41-2003 [9] standards for dimensioning and tolerancing were used as the basis for the test case definitions. Test case definitions of representative part geometries were created to which a wide variety of GD&T characteristics for dimensional
tolerances, geometric tolerances, datum targets, and datum features were applied. Eleven test case definitions were developed and reviewed by a team of GD&T experts. Each GD&T characteristic references the relevant clauses in the ASME Y14 standards that govern the use of that characteristic. Coverage analysis of the test cases definitions quantified the number of types GD&T characteristics and individual characteristics such as tolerance zone and maximum material modifiers.
The test case definitions were modeled in four CAD systems: Dassault Systems CATIA [19], SolidWorks [20], PTC Creo [21], and Siemens NX [22]. Preference was given to model each GD&T
characteristic as best as possible as semantic representation with a fallback to graphical presentation
if necessary. CADIQ CAD validation software [23] was used to verify the semantic representation and graphical presentation of the GD&T characteristics in the CAD models against the test case definitions. Derivative neutral files, also with semantic representation and graphical presentation of the GD&T characteristics, in STEP AP242, JT [24], and 3D PDF [25] formats were generated from the CAD models and validated against the CAD models with CADIQ. For both the verification and
validation process, test criteria were developed, incorporating the knowledge from the coverage analysis, to confirm the semantic and graphic information of all GD&T characteristics.
Figure 6: NIST Testing Project.
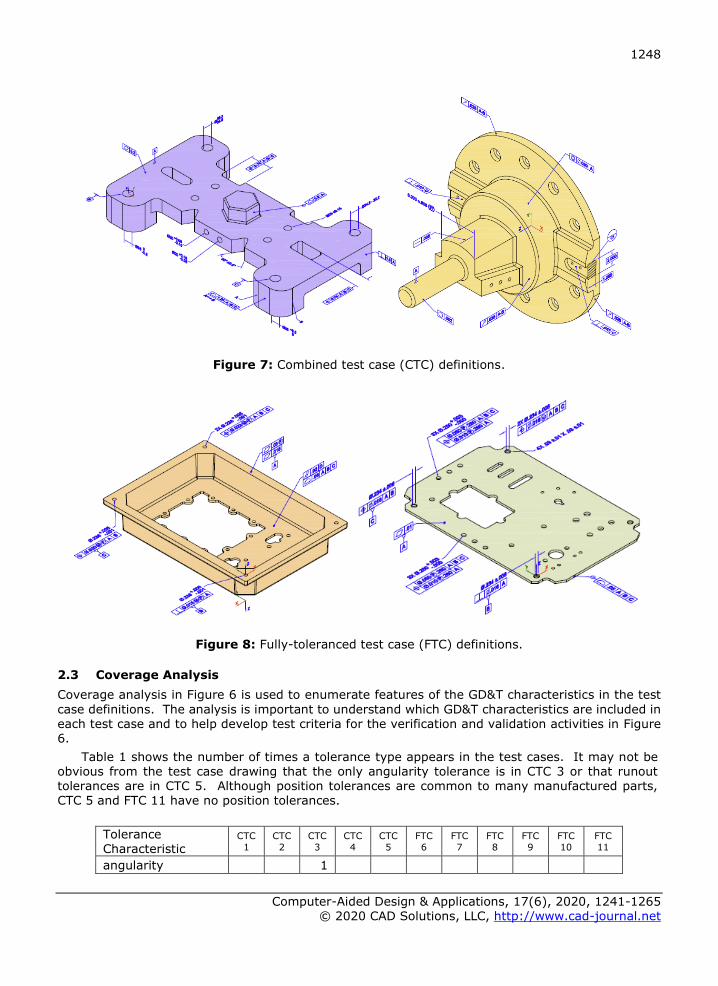
Two sets of test case definitions were developed. Figure 7 shows two of the five combined test case
(CTC) definitions. These test cases are “combined” in that each CTC has approximately ten different individual annotations, composed of GD&T characteristics, applied to each of five test case part geometries. The annotation scheme is not necessarily realistic and is meant only to test each individual annotation. The selection of GD&T characteristics is meant to exercise features of the ASME Y14 tolerance standards. The CTC were modeled in versions of the four CAD systems that were available in 2012.
Two of the six fully-toleranced test case (FTC) definitions are shown in Figure 8. Figure 2 is also
an FTC. Each test case might have multiple views to describe all annotations. These test cases are “fully-toleranced” in that for each FTC all geometric features are toleranced and are adequately controlled and constrained according to the ASME Y14 standards. Three of the six FTC were modeled in versions of the four CAD systems that were available in 2015.
1248
Computer-Aided Design & Applications, 17(6), 2020, 1241-1265 © 2020 CAD Solutions, LLC, http://www.cad-journal.net
Figure 7: Combined test case (CTC) definitions.
Figure 8: Fully-toleranced test case (FTC) definitions.
2.3 Coverage Analysis
Coverage analysis in Figure 6 is used to enumerate features of the GD&T characteristics in the test
case definitions. The analysis is important to understand which GD&T characteristics are included in each test case and to help develop test criteria for the verification and validation activities in Figure 6.
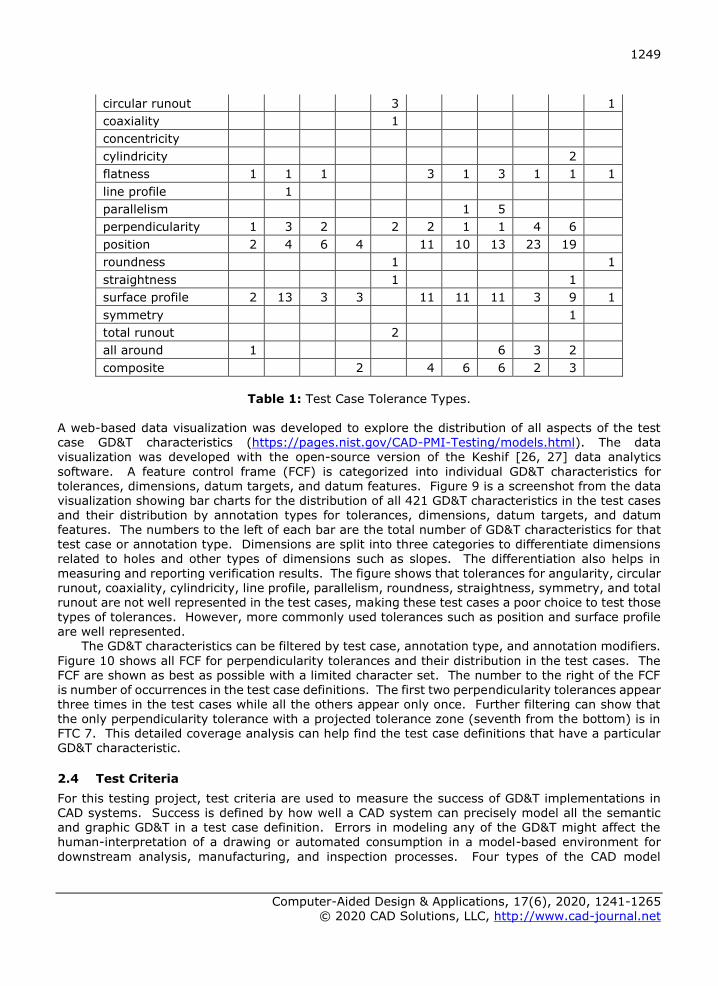
Table 1 shows the number of times a tolerance type appears in the test cases. It may not be obvious from the test case drawing that the only angularity tolerance is in CTC 3 or that runout tolerances are in CTC 5. Although position tolerances are common to many manufactured parts, CTC 5 and FTC 11 have no position tolerances.
Tolerance
Characteristic CTC
1
CTC
2
CTC
3
CTC
4
CTC
5
FTC
6
FTC
7
FTC
8
FTC
9
FTC
10
FTC
11
angularity 1
1249
Computer-Aided Design & Applications, 17(6), 2020, 1241-1265 © 2020 CAD Solutions, LLC, http://www.cad-journal.net
circular runout 3 1
coaxiality 1
concentricity
cylindricity 2
flatness 1 1 1 3 1 3 1 1 1
line profile 1
parallelism 1 5
perpendicularity 1 3 2 2 2 1 1 4 6
position 2 4 6 4 11 10 13 23 19
roundness 1 1
straightness 1 1
surface profile 2 13 3 3 11 11 11 3 9 1
symmetry 1
total runout 2
all around 1 6 3 2
composite 2 4 6 6 2 3
Table 1: Test Case Tolerance Types.
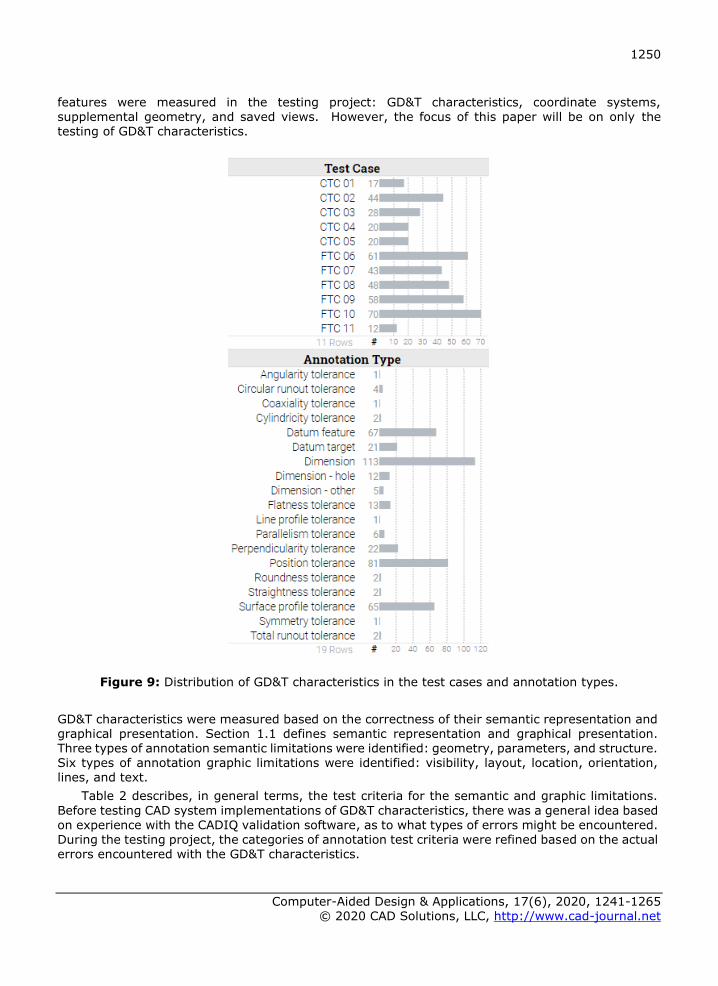
A web-based data visualization was developed to explore the distribution of all aspects of the test case GD&T characteristics (https://pages.nist.gov/CAD-PMI-Testing/models.html). The data visualization was developed with the open-source version of the Keshif [26, 27] data analytics
software. A feature control frame (FCF) is categorized into individual GD&T characteristics for tolerances, dimensions, datum targets, and datum features. Figure 9 is a screenshot from the data visualization showing bar charts for the distribution of all 421 GD&T characteristics in the test cases and their distribution by annotation types for tolerances, dimensions, datum targets, and datum features. The numbers to the left of each bar are the total number of GD&T characteristics for that test case or annotation type. Dimensions are split into three categories to differentiate dimensions related to holes and other types of dimensions such as slopes. The differentiation also helps in
measuring and reporting verification results. The figure shows that tolerances for angularity, circular runout, coaxiality, cylindricity, line profile, parallelism, roundness, straightness, symmetry, and total runout are not well represented in the test cases, making these test cases a poor choice to test those types of tolerances. However, more commonly used tolerances such as position and surface profile are well represented.
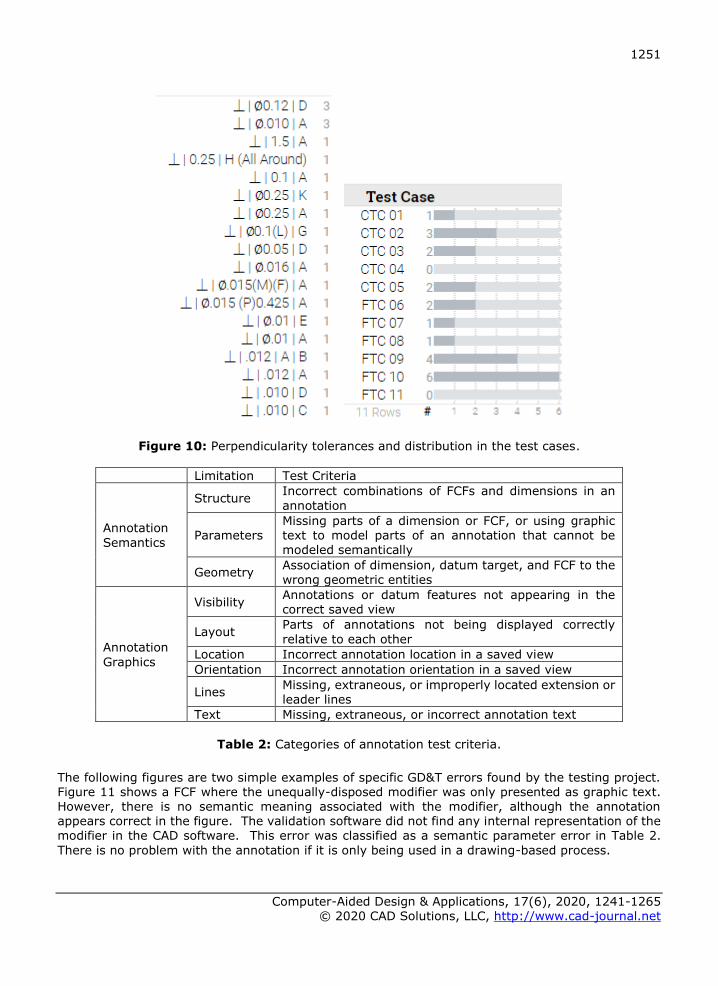
The GD&T characteristics can be filtered by test case, annotation type, and annotation modifiers.
Figure 10 shows all FCF for perpendicularity tolerances and their distribution in the test cases. The FCF are shown as best as possible with a limited character set. The number to the right of the FCF is number of occurrences in the test case definitions. The first two perpendicularity tolerances appear three times in the test cases while all the others appear only once. Further filtering can show that the only perpendicularity tolerance with a projected tolerance zone (seventh from the bottom) is in FTC 7. This detailed coverage analysis can help find the test case definitions that have a particular GD&T characteristic.
2.4 Test Criteria
For this testing project, test criteria are used to measure the success of GD&T implementations in CAD systems. Success is defined by how well a CAD system can precisely model all the semantic and graphic GD&T in a test case definition. Errors in modeling any of the GD&T might affect the human-interpretation of a drawing or automated consumption in a model-based environment for
downstream analysis, manufacturing, and inspection processes. Four types of the CAD model
1250
Computer-Aided Design & Applications, 17(6), 2020, 1241-1265 © 2020 CAD Solutions, LLC, http://www.cad-journal.net
features were measured in the testing project: GD&T characteristics, coordinate systems, supplemental geometry, and saved views. However, the focus of this paper will be on only the testing of GD&T characteristics.
Figure 9: Distribution of GD&T characteristics in the test cases and annotation types.
GD&T characteristics were measured based on the correctness of their semantic representation and graphical presentation. Section 1.1 defines semantic representation and graphical presentation. Three types of annotation semantic limitations were identified: geometry, parameters, and structure. Six types of annotation graphic limitations were identified: visibility, layout, location, orientation, lines, and text.
Table 2 describes, in general terms, the test criteria for the semantic and graphic limitations.
Before testing CAD system implementations of GD&T characteristics, there was a general idea based on experience with the CADIQ validation software, as to what types of errors might be encountered. During the testing project, the categories of annotation test criteria were refined based on the actual
errors encountered with the GD&T characteristics.
1251
Computer-Aided Design & Applications, 17(6), 2020, 1241-1265 © 2020 CAD Solutions, LLC, http://www.cad-journal.net
Figure 10: Perpendicularity tolerances and distribution in the test cases.
Limitation Test Criteria
Annotation
Semantics
Structure Incorrect combinations of FCFs and dimensions in an
annotation
Parameters Missing parts of a dimension or FCF, or using graphic text to model parts of an annotation that cannot be modeled semantically
Geometry Association of dimension, datum target, and FCF to the wrong geometric entities
Annotation
Graphics
Visibility Annotations or datum features not appearing in the correct saved view
Layout Parts of annotations not being displayed correctly
relative to each other
Location Incorrect annotation location in a saved view
Orientation Incorrect annotation orientation in a saved view
Lines Missing, extraneous, or improperly located extension or leader lines
Text Missing, extraneous, or incorrect annotation text
Table 2: Categories of annotation test criteria.
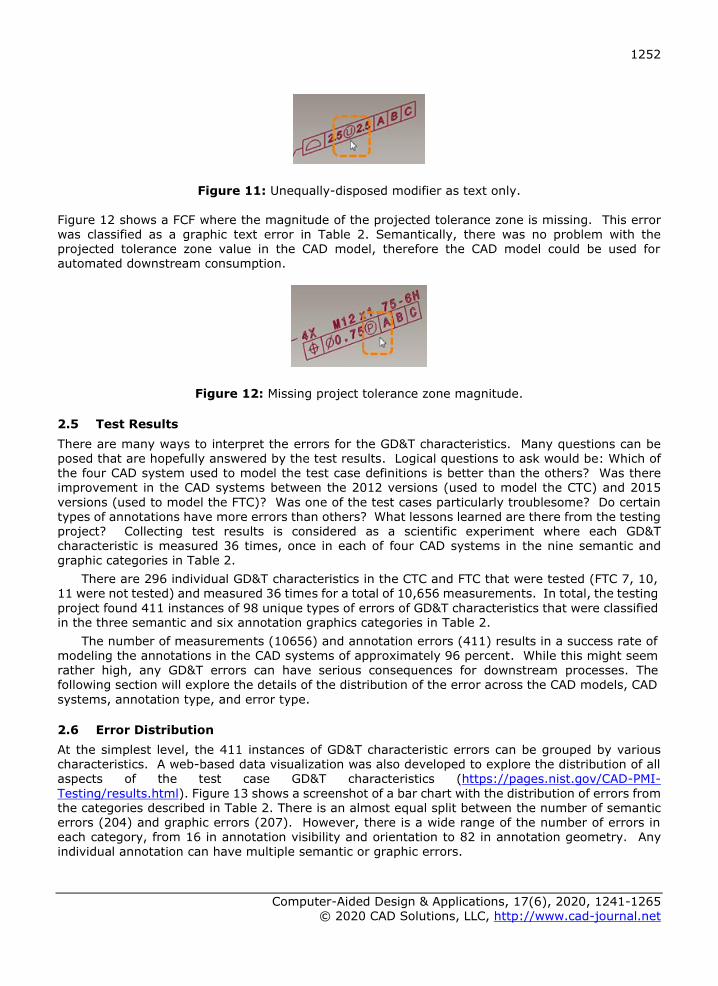
The following figures are two simple examples of specific GD&T errors found by the testing project. Figure 11 shows a FCF where the unequally-disposed modifier was only presented as graphic text. However, there is no semantic meaning associated with the modifier, although the annotation appears correct in the figure. The validation software did not find any internal representation of the modifier in the CAD software. This error was classified as a semantic parameter error in Table 2.
There is no problem with the annotation if it is only being used in a drawing-based process.
1252
Computer-Aided Design & Applications, 17(6), 2020, 1241-1265 © 2020 CAD Solutions, LLC, http://www.cad-journal.net
Figure 11: Unequally-disposed modifier as text only.
Figure 12 shows a FCF where the magnitude of the projected tolerance zone is missing. This error was classified as a graphic text error in Table 2. Semantically, there was no problem with the projected tolerance zone value in the CAD model, therefore the CAD model could be used for automated downstream consumption.
Figure 12: Missing project tolerance zone magnitude.
2.5 Test Results
There are many ways to interpret the errors for the GD&T characteristics. Many questions can be posed that are hopefully answered by the test results. Logical questions to ask would be: Which of
the four CAD system used to model the test case definitions is better than the others? Was there improvement in the CAD systems between the 2012 versions (used to model the CTC) and 2015
versions (used to model the FTC)? Was one of the test cases particularly troublesome? Do certain types of annotations have more errors than others? What lessons learned are there from the testing project? Collecting test results is considered as a scientific experiment where each GD&T characteristic is measured 36 times, once in each of four CAD systems in the nine semantic and graphic categories in Table 2.
There are 296 individual GD&T characteristics in the CTC and FTC that were tested (FTC 7, 10, 11 were not tested) and measured 36 times for a total of 10,656 measurements. In total, the testing
project found 411 instances of 98 unique types of errors of GD&T characteristics that were classified in the three semantic and six annotation graphics categories in Table 2.
The number of measurements (10656) and annotation errors (411) results in a success rate of modeling the annotations in the CAD systems of approximately 96 percent. While this might seem
rather high, any GD&T errors can have serious consequences for downstream processes. The following section will explore the details of the distribution of the error across the CAD models, CAD
systems, annotation type, and error type.
2.6 Error Distribution
At the simplest level, the 411 instances of GD&T characteristic errors can be grouped by various characteristics. A web-based data visualization was also developed to explore the distribution of all aspects of the test case GD&T characteristics (https://pages.nist.gov/CAD-PMI-
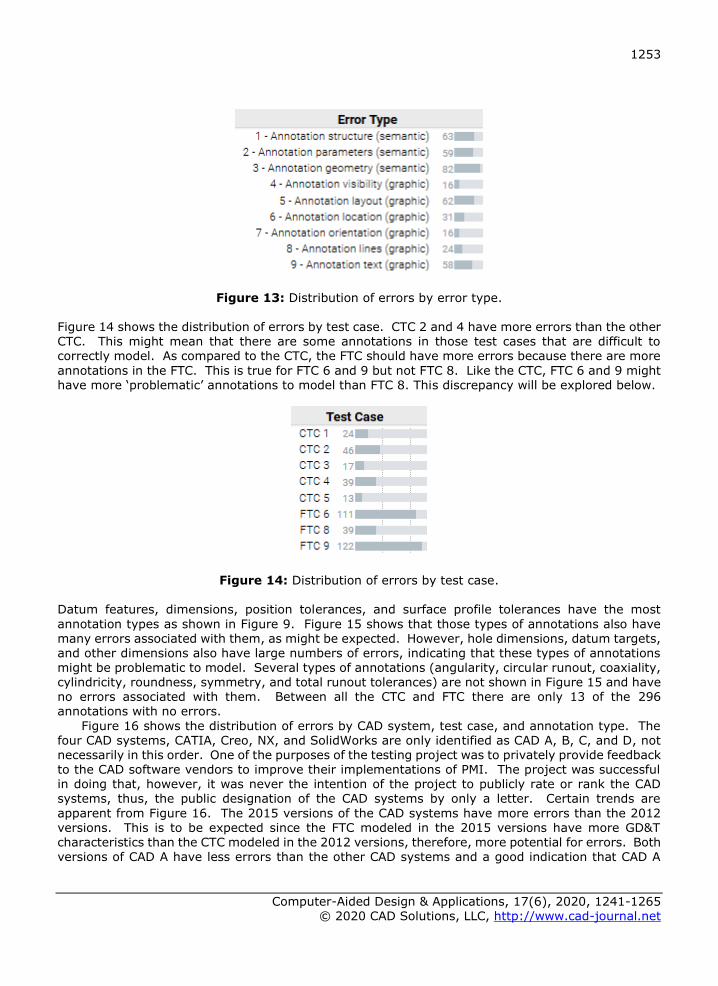
Testing/results.html). Figure 13 shows a screenshot of a bar chart with the distribution of errors from the categories described in Table 2. There is an almost equal split between the number of semantic errors (204) and graphic errors (207). However, there is a wide range of the number of errors in each category, from 16 in annotation visibility and orientation to 82 in annotation geometry. Any
individual annotation can have multiple semantic or graphic errors.
1253
Computer-Aided Design & Applications, 17(6), 2020, 1241-1265 © 2020 CAD Solutions, LLC, http://www.cad-journal.net
Figure 13: Distribution of errors by error type.
Figure 14 shows the distribution of errors by test case. CTC 2 and 4 have more errors than the other CTC. This might mean that there are some annotations in those test cases that are difficult to correctly model. As compared to the CTC, the FTC should have more errors because there are more
annotations in the FTC. This is true for FTC 6 and 9 but not FTC 8. Like the CTC, FTC 6 and 9 might have more ‘problematic’ annotations to model than FTC 8. This discrepancy will be explored below.
Figure 14: Distribution of errors by test case.
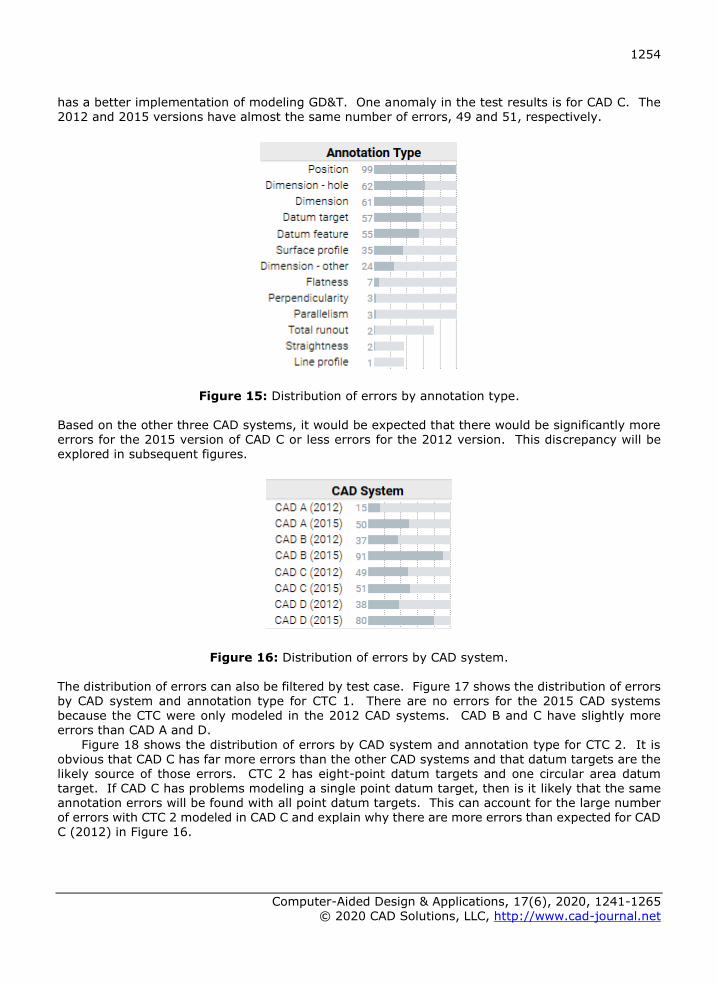
Datum features, dimensions, position tolerances, and surface profile tolerances have the most
annotation types as shown in Figure 9. Figure 15 shows that those types of annotations also have many errors associated with them, as might be expected. However, hole dimensions, datum targets, and other dimensions also have large numbers of errors, indicating that these types of annotations
might be problematic to model. Several types of annotations (angularity, circular runout, coaxiality, cylindricity, roundness, symmetry, and total runout tolerances) are not shown in Figure 15 and have no errors associated with them. Between all the CTC and FTC there are only 13 of the 296 annotations with no errors.
Figure 16 shows the distribution of errors by CAD system, test case, and annotation type. The four CAD systems, CATIA, Creo, NX, and SolidWorks are only identified as CAD A, B, C, and D, not necessarily in this order. One of the purposes of the testing project was to privately provide feedback to the CAD software vendors to improve their implementations of PMI. The project was successful in doing that, however, it was never the intention of the project to publicly rate or rank the CAD systems, thus, the public designation of the CAD systems by only a letter. Certain trends are
apparent from Figure 16. The 2015 versions of the CAD systems have more errors than the 2012 versions. This is to be expected since the FTC modeled in the 2015 versions have more GD&T characteristics than the CTC modeled in the 2012 versions, therefore, more potential for errors. Both
versions of CAD A have less errors than the other CAD systems and a good indication that CAD A
1254
Computer-Aided Design & Applications, 17(6), 2020, 1241-1265 © 2020 CAD Solutions, LLC, http://www.cad-journal.net
has a better implementation of modeling GD&T. One anomaly in the test results is for CAD C. The 2012 and 2015 versions have almost the same number of errors, 49 and 51, respectively.
Figure 15: Distribution of errors by annotation type. Based on the other three CAD systems, it would be expected that there would be significantly more errors for the 2015 version of CAD C or less errors for the 2012 version. This discrepancy will be explored in subsequent figures.
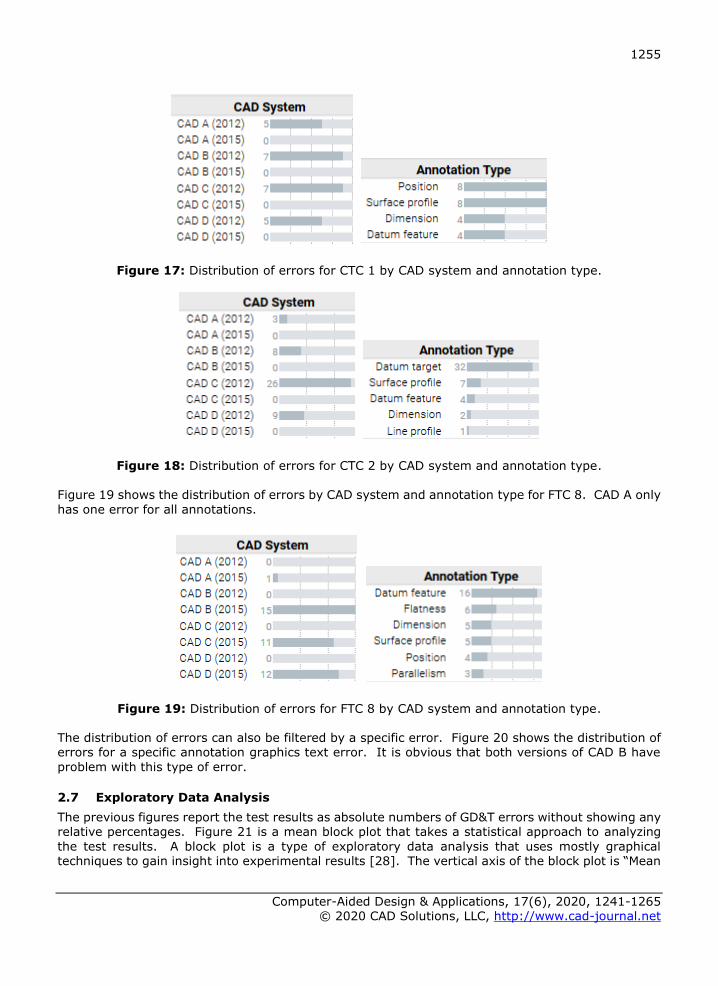
Figure 16: Distribution of errors by CAD system. The distribution of errors can also be filtered by test case. Figure 17 shows the distribution of errors by CAD system and annotation type for CTC 1. There are no errors for the 2015 CAD systems because the CTC were only modeled in the 2012 CAD systems. CAD B and C have slightly more errors than CAD A and D.
Figure 18 shows the distribution of errors by CAD system and annotation type for CTC 2. It is obvious that CAD C has far more errors than the other CAD systems and that datum targets are the likely source of those errors. CTC 2 has eight-point datum targets and one circular area datum target. If CAD C has problems modeling a single point datum target, then is it likely that the same annotation errors will be found with all point datum targets. This can account for the large number of errors with CTC 2 modeled in CAD C and explain why there are more errors than expected for CAD C (2012) in Figure 16.
1255
Computer-Aided Design & Applications, 17(6), 2020, 1241-1265 © 2020 CAD Solutions, LLC, http://www.cad-journal.net
Figure 17: Distribution of errors for CTC 1 by CAD system and annotation type.
Figure 18: Distribution of errors for CTC 2 by CAD system and annotation type.
Figure 19 shows the distribution of errors by CAD system and annotation type for FTC 8. CAD A only
has one error for all annotations.
Figure 19: Distribution of errors for FTC 8 by CAD system and annotation type.
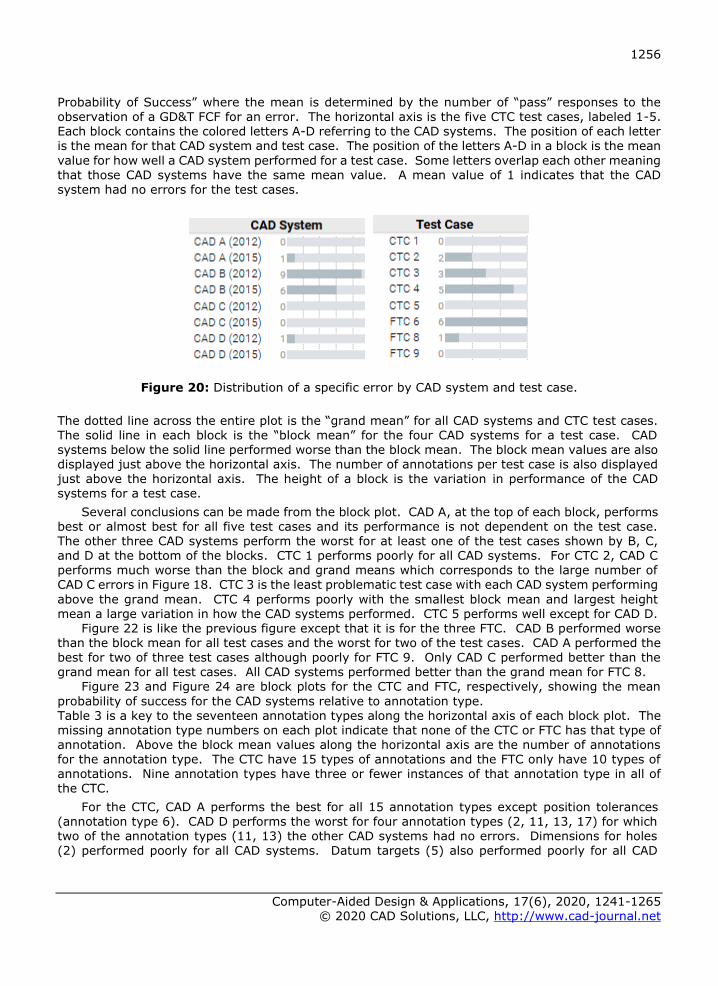
The distribution of errors can also be filtered by a specific error. Figure 20 shows the distribution of errors for a specific annotation graphics text error. It is obvious that both versions of CAD B have
problem with this type of error.
2.7 Exploratory Data Analysis
The previous figures report the test results as absolute numbers of GD&T errors without showing any relative percentages. Figure 21 is a mean block plot that takes a statistical approach to analyzing
the test results. A block plot is a type of exploratory data analysis that uses mostly graphical
techniques to gain insight into experimental results [28]. The vertical axis of the block plot is “Mean
1256
Computer-Aided Design & Applications, 17(6), 2020, 1241-1265 © 2020 CAD Solutions, LLC, http://www.cad-journal.net
Probability of Success” where the mean is determined by the number of “pass” responses to the observation of a GD&T FCF for an error. The horizontal axis is the five CTC test cases, labeled 1-5. Each block contains the colored letters A-D referring to the CAD systems. The position of each letter is the mean for that CAD system and test case. The position of the letters A-D in a block is the mean
value for how well a CAD system performed for a test case. Some letters overlap each other meaning that those CAD systems have the same mean value. A mean value of 1 indicates that the CAD system had no errors for the test cases.
Figure 20: Distribution of a specific error by CAD system and test case.
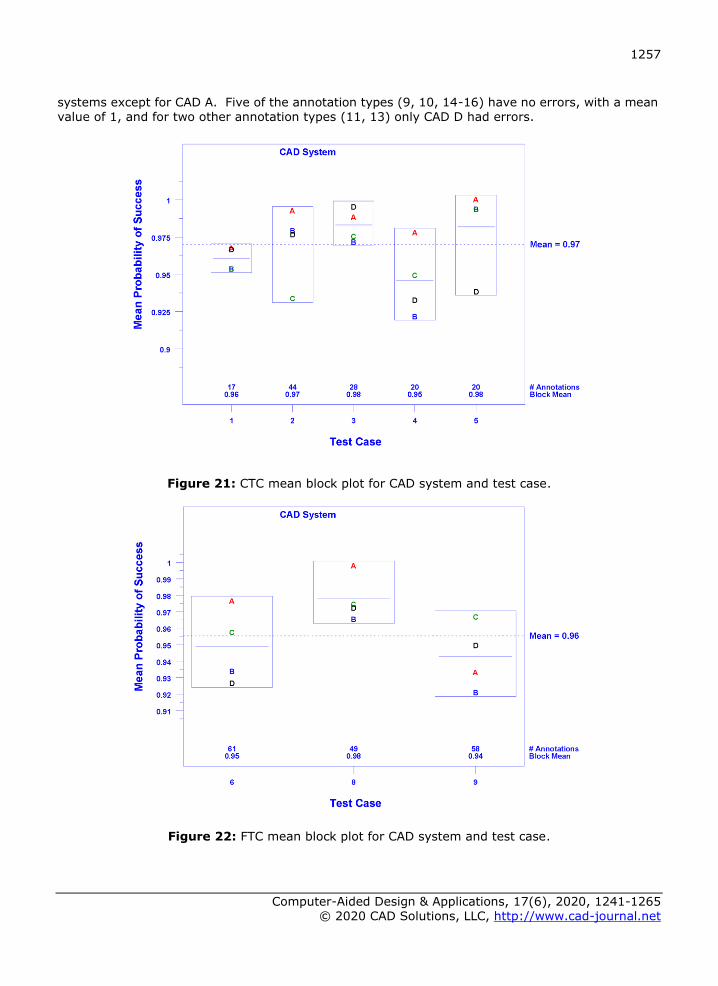
The dotted line across the entire plot is the “grand mean” for all CAD systems and CTC test cases. The solid line in each block is the “block mean” for the four CAD systems for a test case. CAD systems below the solid line performed worse than the block mean. The block mean values are also displayed just above the horizontal axis. The number of annotations per test case is also displayed
just above the horizontal axis. The height of a block is the variation in performance of the CAD systems for a test case.
Several conclusions can be made from the block plot. CAD A, at the top of each block, performs best or almost best for all five test cases and its performance is not dependent on the test case. The other three CAD systems perform the worst for at least one of the test cases shown by B, C, and D at the bottom of the blocks. CTC 1 performs poorly for all CAD systems. For CTC 2, CAD C performs much worse than the block and grand means which corresponds to the large number of CAD C errors in Figure 18. CTC 3 is the least problematic test case with each CAD system performing
above the grand mean. CTC 4 performs poorly with the smallest block mean and largest height mean a large variation in how the CAD systems performed. CTC 5 performs well except for CAD D.
Figure 22 is like the previous figure except that it is for the three FTC. CAD B performed worse than the block mean for all test cases and the worst for two of the test cases. CAD A performed the
best for two of three test cases although poorly for FTC 9. Only CAD C performed better than the grand mean for all test cases. All CAD systems performed better than the grand mean for FTC 8.
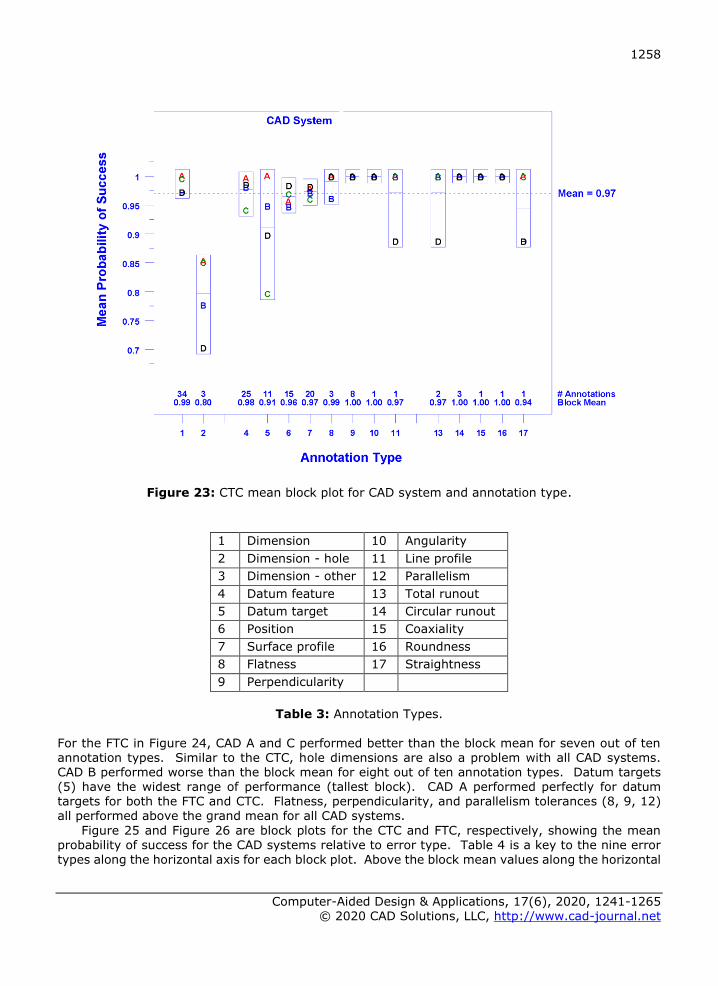
Figure 23 and Figure 24 are block plots for the CTC and FTC, respectively, showing the mean
probability of success for the CAD systems relative to annotation type. Table 3 is a key to the seventeen annotation types along the horizontal axis of each block plot. The missing annotation type numbers on each plot indicate that none of the CTC or FTC has that type of annotation. Above the block mean values along the horizontal axis are the number of annotations for the annotation type. The CTC have 15 types of annotations and the FTC only have 10 types of annotations. Nine annotation types have three or fewer instances of that annotation type in all of the CTC.
For the CTC, CAD A performs the best for all 15 annotation types except position tolerances (annotation type 6). CAD D performs the worst for four annotation types (2, 11, 13, 17) for which two of the annotation types (11, 13) the other CAD systems had no errors. Dimensions for holes
(2) performed poorly for all CAD systems. Datum targets (5) also performed poorly for all CAD
1257
Computer-Aided Design & Applications, 17(6), 2020, 1241-1265 © 2020 CAD Solutions, LLC, http://www.cad-journal.net
systems except for CAD A. Five of the annotation types (9, 10, 14-16) have no errors, with a mean value of 1, and for two other annotation types (11, 13) only CAD D had errors.
Figure 21: CTC mean block plot for CAD system and test case.
Figure 22: FTC mean block plot for CAD system and test case.
1258
Computer-Aided Design & Applications, 17(6), 2020, 1241-1265 © 2020 CAD Solutions, LLC, http://www.cad-journal.net
Figure 23: CTC mean block plot for CAD system and annotation type.
1 Dimension 10 Angularity
2 Dimension - hole 11 Line profile
3 Dimension - other 12 Parallelism
4 Datum feature 13 Total runout
5 Datum target 14 Circular runout
6 Position 15 Coaxiality
7 Surface profile 16 Roundness
8 Flatness 17 Straightness
9 Perpendicularity
Table 3: Annotation Types.
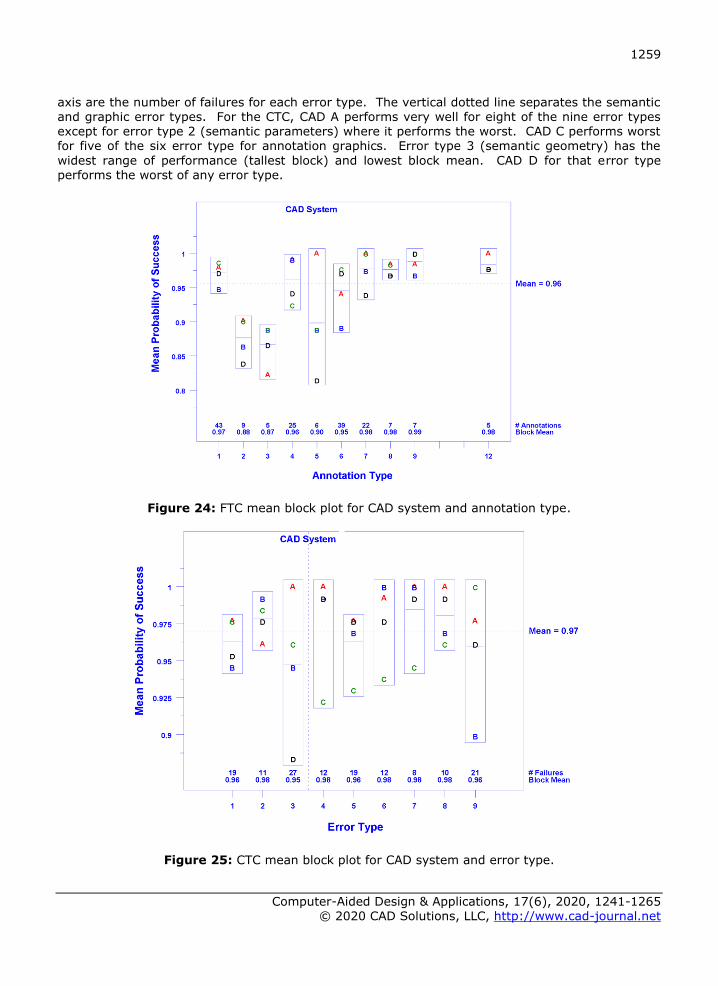
For the FTC in Figure 24, CAD A and C performed better than the block mean for seven out of ten annotation types. Similar to the CTC, hole dimensions are also a problem with all CAD systems. CAD B performed worse than the block mean for eight out of ten annotation types. Datum targets (5) have the widest range of performance (tallest block). CAD A performed perfectly for datum targets for both the FTC and CTC. Flatness, perpendicularity, and parallelism tolerances (8, 9, 12) all performed above the grand mean for all CAD systems.
Figure 25 and Figure 26 are block plots for the CTC and FTC, respectively, showing the mean probability of success for the CAD systems relative to error type. Table 4 is a key to the nine error
types along the horizontal axis for each block plot. Above the block mean values along the horizontal
1259
Computer-Aided Design & Applications, 17(6), 2020, 1241-1265 © 2020 CAD Solutions, LLC, http://www.cad-journal.net
axis are the number of failures for each error type. The vertical dotted line separates the semantic and graphic error types. For the CTC, CAD A performs very well for eight of the nine error types except for error type 2 (semantic parameters) where it performs the worst. CAD C performs worst for five of the six error type for annotation graphics. Error type 3 (semantic geometry) has the
widest range of performance (tallest block) and lowest block mean. CAD D for that error type performs the worst of any error type.
Figure 24: FTC mean block plot for CAD system and annotation type.
Figure 25: CTC mean block plot for CAD system and error type.
1260
Computer-Aided Design & Applications, 17(6), 2020, 1241-1265 © 2020 CAD Solutions, LLC, http://www.cad-journal.net
1 Semantic structure
2 Semantic parameters
3 Semantic geometry
4 Graphic visibility
5 Graphic layout
6 Graphic location
7 Graphic orientation
8 Graphic lines
9 Graphic text
Table 4: Error Types.
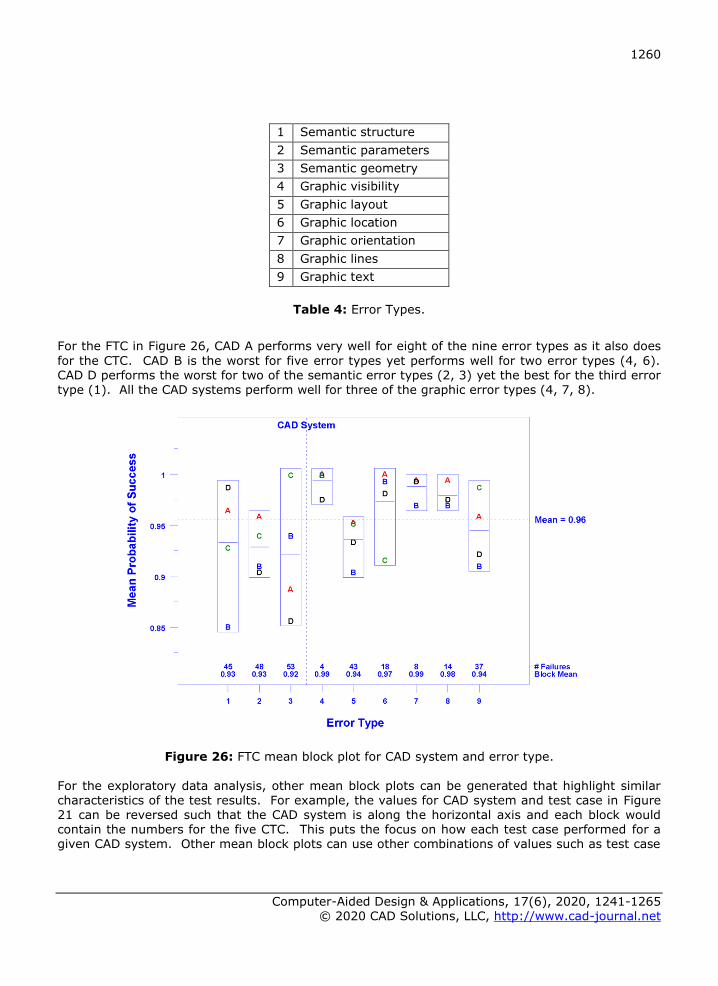
For the FTC in Figure 26, CAD A performs very well for eight of the nine error types as it also does
for the CTC. CAD B is the worst for five error types yet performs well for two error types (4, 6). CAD D performs the worst for two of the semantic error types (2, 3) yet the best for the third error type (1). All the CAD systems perform well for three of the graphic error types (4, 7, 8).
Figure 26: FTC mean block plot for CAD system and error type.
For the exploratory data analysis, other mean block plots can be generated that highlight similar characteristics of the test results. For example, the values for CAD system and test case in Figure 21 can be reversed such that the CAD system is along the horizontal axis and each block would contain the numbers for the five CTC. This puts the focus on how each test case performed for a given CAD system. Other mean block plots can use other combinations of values such as test case
1261
Computer-Aided Design & Applications, 17(6), 2020, 1241-1265 © 2020 CAD Solutions, LLC, http://www.cad-journal.net
and annotation type or error type. More block plot examples are found in the guide to the test results [12].
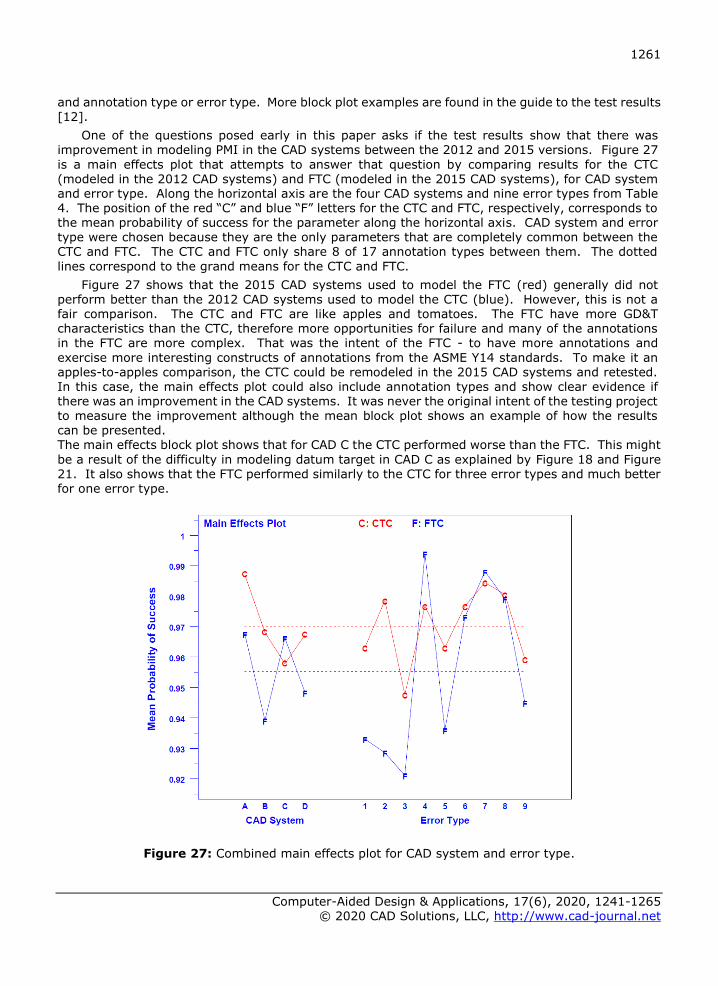
One of the questions posed early in this paper asks if the test results show that there was improvement in modeling PMI in the CAD systems between the 2012 and 2015 versions. Figure 27
is a main effects plot that attempts to answer that question by comparing results for the CTC (modeled in the 2012 CAD systems) and FTC (modeled in the 2015 CAD systems), for CAD system and error type. Along the horizontal axis are the four CAD systems and nine error types from Table 4. The position of the red “C” and blue “F” letters for the CTC and FTC, respectively, corresponds to the mean probability of success for the parameter along the horizontal axis. CAD system and error type were chosen because they are the only parameters that are completely common between the CTC and FTC. The CTC and FTC only share 8 of 17 annotation types between them. The dotted
lines correspond to the grand means for the CTC and FTC.
Figure 27 shows that the 2015 CAD systems used to model the FTC (red) generally did not perform better than the 2012 CAD systems used to model the CTC (blue). However, this is not a fair comparison. The CTC and FTC are like apples and tomatoes. The FTC have more GD&T characteristics than the CTC, therefore more opportunities for failure and many of the annotations in the FTC are more complex. That was the intent of the FTC - to have more annotations and
exercise more interesting constructs of annotations from the ASME Y14 standards. To make it an apples-to-apples comparison, the CTC could be remodeled in the 2015 CAD systems and retested. In this case, the main effects plot could also include annotation types and show clear evidence if there was an improvement in the CAD systems. It was never the original intent of the testing project to measure the improvement although the mean block plot shows an example of how the results can be presented. The main effects block plot shows that for CAD C the CTC performed worse than the FTC. This might
be a result of the difficulty in modeling datum target in CAD C as explained by Figure 18 and Figure
21. It also shows that the FTC performed similarly to the CTC for three error types and much better for one error type.
Figure 27: Combined main effects plot for CAD system and error type.
1262
Computer-Aided Design & Applications, 17(6), 2020, 1241-1265 © 2020 CAD Solutions, LLC, http://www.cad-journal.net
3 CONCLUSIONS
The NIST testing project to measure the capabilities of CAD systems to model GD&T characteristics was successful. Many different types of semantic and graphic annotation errors were identified and communicated to the participating CAD software vendors so that they could improve their
implementations for GD&T characteristics. There are also many lessons learned from the NIST testing project that can be used to improve future testing and usage of the CAD models. The NIST CAD models are available online (https://go.usa.gov/mGVm) and have been downloaded by many end-users as a source of ready-built part geometry with representation GD&T characteristics to test in their model-based workflows.
The premise of the project was to test GD&T characteristics as defined by the ASME Y14 standards [8, 9]. A wide variety of annotations for dimensions, geometric tolerances, datum
features, datum targets, and modifiers were applied to parts with representative geometry. All the
annotations reference the applicable clauses in the ASME Y14 standards that control their usage. However, the annotations are not intended to represent best practice. Simpler strategies for applying GD&T strategies could have been used. Some of the NIST CAD models might be more complex than necessary for a manufacturing company to use in testing how GD&T characteristics are used in the model-based workflows.
There is also an uneven distribution of geometric tolerances caused by types of geometric features they can be applied to. Of course, many parts have position, surface profile, and flatness tolerances, however, of the test case definitions that were modeled, only CTC 5 has roundness, coaxiality, circular runout, and total runout tolerances that are typical of cylindrical geometry. There might be a need for additional cylindrical geometric features to further test the use of those types of tolerances.
The distribution of the tolerances also affects the testing results. CTC 2 has seven point datum
targets. The testing results in Figure 18 and Figure 23 show that CAD C had many errors related to datum targets. It is reasonable to assume that if there is an error with one datum target that the same error will appear in all datum targets. Therefore, the testing results are skewed against CAD C for CTC 2. If there were only one datum target, the results for CAD C and CTC 2 might not be as bad. Future testing projects should consider the distribution of GD&T characteristics that are tested.
Before testing the CAD systems, the full extent of possible semantic and graphic GD&T characteristic errors was not known. During the testing process the nine categories of semantic and
graphic annotation error types in
Table 2 were refined to accommodate the types of errors that were observed. All types of errors were treated equally regardless of the effect on how a GD&T would be used in an automated or human-based downstream consumption by other manufacturing processes. An error related to annotation graphics, such as extraneous spaces or characters, that can be easily accounted for when reading a 2D drawing, carried the same weight as an annotation with incorrect or missing semantic
information about a tolerance. However, missing semantic tolerance information can have severe consequences for the automated downstream use of that information. Errors could be weighted based on the consequences for their use in other process. MIL-STD-31000A Appendix C defines “effects of condition on CAD data quality for manufacturing” that could be a basis for weighting errors.
There was also no consideration for an annotation with multiple semantic or graphic errors. Further analysis with the Keshif data visualization of the datum target errors in CTC 2 show that
there are 19 errors for the seven-point datum target or more than two errors per datum target. The results for some of the CAD systems and test cases would be better if multiple errors for an annotation were only counted as one. However, counting multiple errors as one might obscure the extent of the problems with a particular annotation.
The 98 unique types of annotations, for which there were 411 instances, are categorized into
the nine broad semantic and graphic error types in
1263
Computer-Aided Design & Applications, 17(6), 2020, 1241-1265 © 2020 CAD Solutions, LLC, http://www.cad-journal.net
Table 2. Further analysis of the annotation errors and error types might result in updated error types that are better suited to categorizing the annotation types. For examples, some types of errors might be specific to geometric tolerances while others only related to dimensions. Further analysis with the Keshif data visualization shows that for the 34 unique annotation errors for position
and surface profile tolerances, only five types of errors are in common. The error type categories could also be used to determine a weighting factor related to the consequence of the error when the annotation is used in downstream processes. Updated error type categories could be used as the basis for defining more “annotation quality criteria” in MIL-STD-31000A, Appendix C, Section C.7.9 or some other standard that defines how GD&T characteristics can fail similar to the definitions for how geometry can fail in Appendix C.
If the purpose of the testing is solely to test GD&T characteristics, then the complexity of the
part geometry should be considered. Smaller test parts could be developed that test only a limited
set of annotations. For example, a block with several types of holes some of which would include features such as counterbore, countersink, and depth might be all that is required to test all dimension and tolerance characteristics related to holes. Other test parts might be specific to cylindrical or free-formed surfaces.
Of course, the results for the NIST testing project are a snapshot in time where CAD systems
from 2012 and 2015 were tested. Presumably errors identified by the project have been fixed in newer versions of the CAD systems. The GD&T characteristics in the test case definitions are based on older versions of the ASME Y14 standards. The annotations could be updated for newer versions of those standards. The test case definitions could also be modified for using ISO standards for dimensions and tolerances. The combined test case definitions (CTC) could also be updated so that the parts are fully toleranced like the FTC. The NIST testing project was very costly and time consuming, and resources were not available to update the models as suggested above. More and
simpler test case definitions might make that process less burdensome.
As mentioned above, the NIST CAD models and test case definitions are freely available for download. This has led to the CAD models being used for purposes that were not considered by the testing project. Based on this, one of the biggest drawbacks of the CAD models are their dimensions. The largest dimension for most of the CTC is about one meter and the FTC are a bit smaller. However, they are still too big to be manufactured quickly and at low cost. No consideration was given to make the test case definitions smaller and easily manufactured and inspected. Future
testing projects should consider smaller “hand-held” parts with features that can be easily manufactured and inspected without special tooling or fixturing.
The NIST CAD models have also been used by many manufacturing companies to test their model-based engineering workflows. Other CAD software companies have used them to test how well their software imports GD&T characteristics. International testing forums for STEP [29], JT [30], and 3D PDF [25] have used the NIST CAD models to test the export of those derivative file
formats.
The NIST testing project has also shown how to apply some rigor for developing testing methodologies CAD software and the use of data analytics to dive deeply into the testing results.
4 DISCLAIMER
Any mention of commercial products in the paper is for information only; it does not imply a recommendation or endorsement by NIST.
Robert R. Lipman, https://orcid.org/0000-0002-5182-9412 James J. Filliben, https://orcid.org/0000-0002-2388-3198
1264
Computer-Aided Design & Applications, 17(6), 2020, 1241-1265 © 2020 CAD Solutions, LLC, http://www.cad-journal.net
5 REFERENCES
[1] Hedberg, J.; Lubell, J.; Fischer, L.; Maggiano, L.; Barnard Feeney, A.: Testing the Digital Thread in Support of Model-Based Manufacturing and Inspection, Journal of Computing and Information Science in Engineering, 16(2), 2016. https://doi.org/10.1115/1.4032697
[2] Hartman, N.; Zahner, J.; Hedberg, T.; Barnard Feeney, A.: Extending and Evaluating the Model-based Product Definition, National Institute of Standards and Technology, NIST-GCR 18-015, 2017. https://doi.org/10.6028/NIST.GCR.18-015
[3] MIL-STD-31000A, DoD Standard Practice: Technical Data Packages, U.S. Department of Defense, 2013.
[4] Wong, K.: The CAD Interoperability Monster Still Lurks, Digital Engineering, 2014, https://www.digitalengineering247.com/article/cad-interoperability-monster-still-lurks/.
[5] 3D ACIS Modeler, https://www.spatial.com/products/3d-acis-modeling, Dassault Systemes
Spatial. [6] Parasolid, https://www.plm.automation.siemens.com/global/en/products/plm-
components/parasolid.html, Siemens. [7] Lipman, R.; Lubell, J.: Conformance checking of PMI representation in CAD model STEP data
exchange files, Computer-Aided Design, 66(2015), 2015, 14-23.
https://doi.org/10.1016/j.cad.2015.04.002 [8] ASME Y14.5-1994, Dimensioning and Tolerancing - Engineering Drawing and Related
Documentation Practices, American Society of Mechanical Engineers, New York, 1994. [9] ASME Y14.41-2003, Digital Product Definition Data Practices - Engineering Drawing and
Related Documentation Practices, American Society of Mechanical Engineers, New York, 2003.
[10] ISO 1101:2012, Geometrical product specifications (GPS) – Geometrical tolerancing –
Tolerances of form, orientation, location, and run-out, International Organization for
Standardization, Geneva, Switzerland, 2012. [11] ISO 16792:2006, Technical product documentation - Digital product definition data practices,
International Organization for Standardization, Geneva, Switzerland, 2006. [12] Lipman, R.; Filliben, J.: Guide to the NIST PMI CAD Models and CAD System PMI Modeling
Capability Verification Testing Results, NIST Advanced Manufacturing Series 100-10, 2017. https://doi.org/10.6028/NIST.AMS.100-10
[13] ISO 10303-1:1994, Industrial automation systems and integration - Product data representation and exchange - Part 1: Overview and fundamental principles, International Organization for Standardization, Geneva, Switzerland, 1994.
[14] Pratt, M.: Introduction to ISO 10303 - the STEP standard for product data exchange, Journal of Computing and Information Science in Engineering, 1(1), 2001, 102-103.
[15] Frechette, S.; Jones, A.; Fischer, B.: Strategy for Testing Conformance to Geometric
Dimensioning & Tolerancing Standards, Procedia CIRP, 10(2013), 2013, 211-215.
https://doi.org/10.1016/j.procir.2013.08.033 [16] Kindrick, J.; Sauter, J.; Matthews, R.: Improving conformance and interoperability testing,
StandardView, 4(1), 1996, 61-68. [17] Cheney, D.; Fischer, B.: Measuring the PMI Modeling Capability in CAD Systems: Report 1 -
Combined Test Case Verification, National Institute of Standards and Technology, NIST-GCR 15-997, 2015. https://doi.org/10.6028/NIST.GCR.15-997
[18] Cheney, D.; Fischer, B.: Measuring the PMI Modeling Capability in CAD Systems: Report 3 - Fully-Toleranced Test Case Verification, National Institute of Standards and Technology, NIST-GCR 15-999, 2015. https://doi.org/10.6028/NIST.GCR.15-999
[19] CATIA, https://www.3ds.com/products-services/catia/, Dassault Systemes. [20] SOLIDWORKS, https://www.solidworks.com/, Dassault Systemes. [21] Creo, https://www.ptc.com/en/products/cad/creo, PTC. [22] NX, https://www.plm.automation.siemens.com/global/en/products/nx/, Siemens.
[23] CADIQ, http://www.iti-global.com/cadiq, ITI International TechneGroup.
1265
Computer-Aided Design & Applications, 17(6), 2020, 1241-1265 © 2020 CAD Solutions, LLC, http://www.cad-journal.net
[24] ISO 14306:2012, Industrial automation systems and integration - JT file format specification for 3D visualization, International Organization for Standardization, Geneva, Switzerland, 2012.
[25] 3D PDF Consortium, http://www.3dpdfconsortium.org/.
[26] Yalcin, M. A.; Elmqvist, N.; Bederson, B.: Keshif: Rapid and Expressive Tabular Data Exploration for Novices, IEEE Transactions on Visualization and Computer Graphics, 24(8), 2018, 2339-2352. https://doi.org/10.1109/TVCG.2017.2723393
[27] Yalcin, M. A.: Keshif: Data Made Explorable, https://keshif.me/. [28] Croarkin, C.; Tobias, P.: NIST/SEMATECH e-Handbook of Statistical Methods / Block Plots,
NIST Statistical Engineering Division/SEMATECH, 2012, https://www.itl.nist.gov/div898/handbook/eda/section3/blockplo.htm.
[29] CAx Implementor Forum, https://www.cax-if.org.
[30] JT Implementor Forum, https://www.prostep.org/en/projects/jt-implementor-forum/, prostep ivip.