Embed Size (px)
Citation preview
A Final Report for
TESTING FOR COMPATIBILITY OF STEEL WITH BIODIESEL
SwRI® Project No. 08.13070
Prepared for
Ms. Lorri Grainawi Steel Tank Institute 570 Oakwood Road
Lake Zurich, IL 60047
Prepared by
Marta A. Jakab Steven R. Westbrook
Scott A. Hutzler Southwest Research Institute®
6220 Culebra Rd San Antonio, TX 78238
April 7, 2008
S O U T H W E S T R E S E A R C H I N S T I T U T E ®
SAN ANTONIO WASHINGTON, DC HOUSTON
A Final Report for
TESTING FOR COMPATIBILITY OF STEEL WITH BIODIESEL
SwRI® Project No. 08.13070
Prepared for
Ms. Lorri Grainawi Steel Tank Institute 570 Oakwood Road
Lake Zurich, IL 60047
Prepared by
Marta A. Jakab Steven R. Westbrook
Scott A. Hutzler Southwest Research Institute®
6220 Culebra Rd San Antonio, TX 78238
April 7, 2008
Approved by: Steven D. Marty, P.E., Director Fuels & Lubricants Technology Department
This report must be reproduced in full, unless SwRI approves a summary or abridgement.
iii
TABLE OF CONTENTS 1. OBJECTIVE ............................................................................................................................. 1 2. APPROACH ............................................................................................................................. 1 3. EXPERIMENTAL PROCEDURE ........................................................................................... 2
3.1. Materials .......................................................................................................................... 2 3.1.1. Steel Coupons ...................................................................................................... 2 3.1.2. Test Fuels and Fuel Blends .................................................................................. 2
3.2. Electrochemical Impedance Spectroscopy ...................................................................... 4 4. RESULTS ................................................................................................................................. 5
4.1. Corrosion of Steel Coupons ............................................................................................. 5 4.2. Acid Numbers of Fuel Blends........................................................................................ 14
LIST OF TABLES Table Page 1. Fuel blends tested in the first set of exposures ..........................................................................2 2. Fuel blends tested in the second set of exposures......................................................................3 3. Mass changes of carbon steel test coupons exposed to different soy-based biodiesel and
petroleum diesel fuel blends (set 1). The data reflect the average of two measurements and the standard deviation. ......................................................................................................11
4. Mass changes of carbon steel test coupons exposed to different animal-based biodiesel and petroleum diesel fuel blends (set 2). The data reflect the average of two measurements and the standard deviation................................................................................11
5. Total acid numbers (TAN) in fuel blends before and after exposure of carbon steel. The exposures were carried out at 43°C for 90 days. .....................................................................14
LIST OF FIGURES Figure Page 1. Schematic of corrosion process of steel under acidic conditions ..............................................1 2. Schematic of experimental setup used in electrochemical impedance tests ..............................4 3. Photograph of test setup used in electrochemical tests..............................................................5 4. Photographs of carbon steel specimens exposed to ULSD and soy-based biodiesel blends
with and without the presence of water: (a) 100% biodiesel, no water added; (b) 50% biodiesel + 50%ULSD, no water added; (c) 100% petroleum diesel, no water added; (d) 100% biodiesel, 1 vol% water added; (e) 50% biodiesel + 50% ULSD, 1 vol% water added and (f) 100% ULSD, 1 vol% water added. Exposure time: 2 months................................5
iv
LIST OF FIGURES (continued) Figure Page 5. Photographs of carbon steel specimens exposed to ULSD or 4000 ppm S petroleum
diesel and animal-based biodiesel blends with and without the presence of water: (a) 100% biodiesel, no water added; (b) 50% biodiesel + 50%ULSD, no water added; (c) 20% biodiesel + 80% 4000 ppm S petroleum diesel, no water added; (d) 100% 4000 ppm S petroleum diesel, no water added; (e) 100% biodiesel, 1 vol% water added; (f) 50% biodiesel + 50% ULSD, 1 vol% water added; (g) 20% biodiesel + 80% 4000 ppm S petroleum diesel, 1 vol% water added; (h) 100% 4000 ppm S petroleum diesel, 1 vol% water added. Exposure time: 3 months..........................................................................6
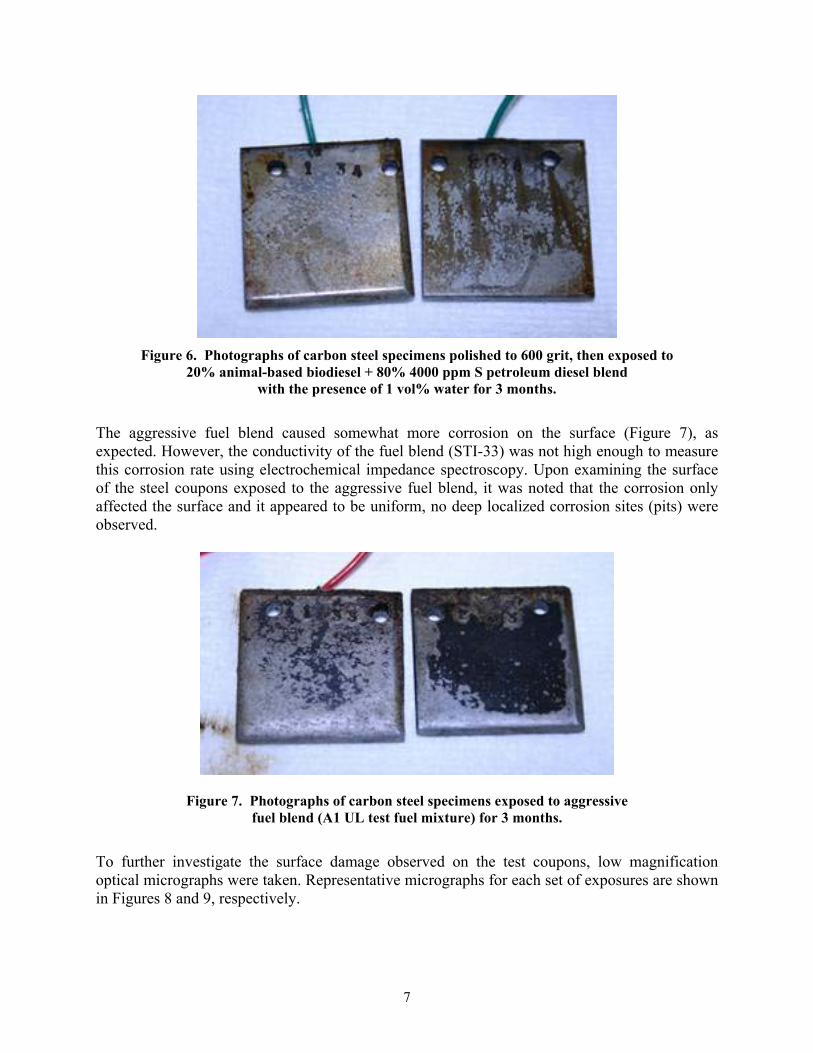
6. Photographs of carbon steel specimens polished to 600 grit, then exposed to 20% animal-based biodiesel + 80% 4000 ppm S petroleum diesel blend with the presence of 1 vol% water for 3 months.........................................................................................................7
7. Photographs of carbon steel specimens exposed to aggressive fuel blend (A1 UL test fuel mixture) for 3 months. ........................................................................................................7
8. Low magnification optical microscope images of carbon steel test coupons exposed to fuel blends: (a) 100% soy-based biodiesel, no water added; (b) 50% biodiesel + 50% ULSD, no water added; (c) 100% ULSD, no water added........................................................8
9. Low magnification optical microscope images of carbon steel test coupons exposed to fuel blends: (a) 100% animal-based biodiesel, no water added; (b) 50% animal-based biodiesel + 50% ULSD, no water added; (c) 5% animal-based biodiesel + 95% 4000 ppm S petroleum diesel, 1 vol% water added; (d) aggressive fuel blend (A1 UL test fuel mixture)......................................................................................................................................9
10. Depth profile of surface of steel specimen exposed to aggressive fuel blend for 3 months. The image was taken by a digital microscope. .......................................................10
11. Corrosion rates calculated from mass changes of steel test coupons as a function of solution chemistry (set 1): (1) 100% soy-based biodiesel, no water added; (2) 50% biodiesel + 50% ULSD, no water added; (3) 20% biodiesel + 80% ULSD, no water added; (4) 5% biodiesel + 95% ULSD, no water added; (5) 100% ULSD, no water added; (6) 100% biodiesel + 1 vol% water; (7) 50% biodiesel + 50% ULSD + 1 vol% water; (8) 20% biodiesel + 80% ULSD + 1 vol% water; (9) 5% biodiesel + 95% ULSD + 1 vol% water; (10) 100% ULSD + 1 vol% water.................................................................12
12. Corrosion rates calculated from mass changes of steel test coupons as a function of solution chemistry (set 2). The data labels correspond to the solution IDs in Table 2. ...........13
13. Acid numbers measured in fuel blends containing soy-based biodiesel before and after 90-day exposure to 46°C, as well as change in acid number...................................................15
14. Acid numbers measured in fuel blends containing animal-based biodiesel before and after 90-day exposure to 46°C, as well as change in acid number. .........................................16
1
1. OBJECTIVE The objective of the study was to measure the corrosion rate of steel in various biodiesels and biodiesel/petroleum diesel blends using a combination of weight-loss determinations after exposure, optical examination of pitting, and electrochemical characterization. Both soy- and animal-based biodiesels were used in the study in order to obtain test results representative of all biodiesel blends. Half of the samples contained water in order to simulate worst-case conditions. The testing was carried out to simulate typical storage tank conditions for a 12-month period.
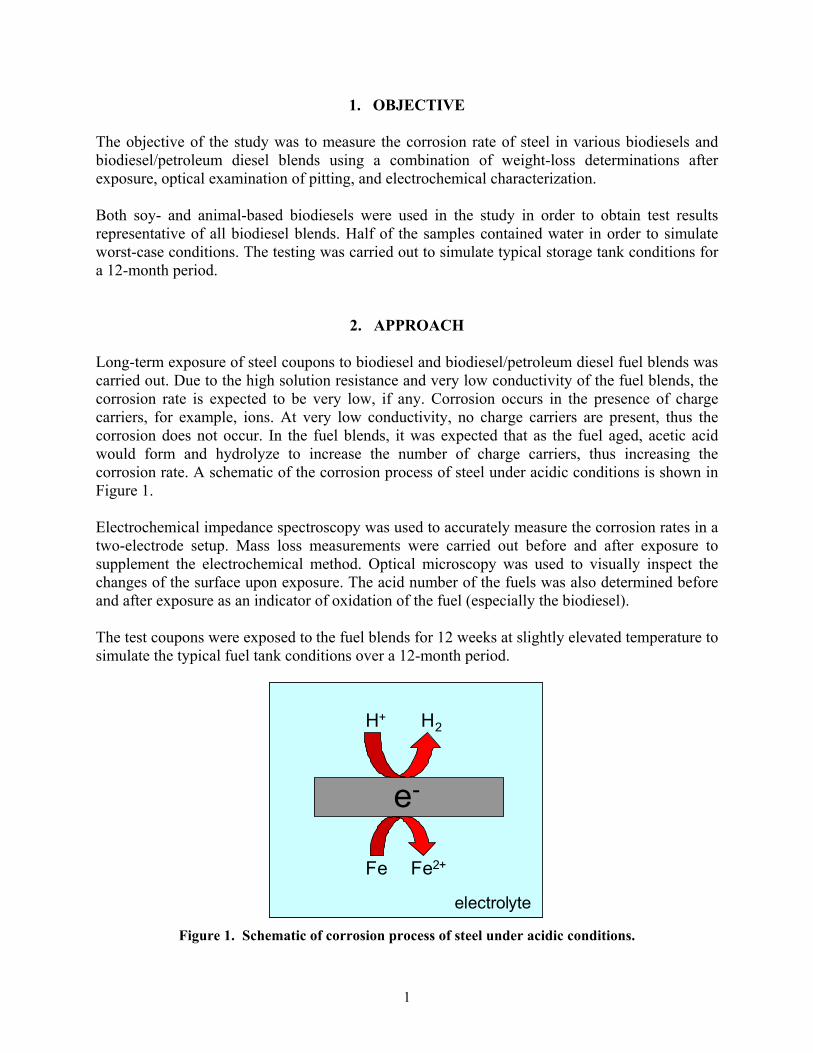
2. APPROACH Long-term exposure of steel coupons to biodiesel and biodiesel/petroleum diesel fuel blends was carried out. Due to the high solution resistance and very low conductivity of the fuel blends, the corrosion rate is expected to be very low, if any. Corrosion occurs in the presence of charge carriers, for example, ions. At very low conductivity, no charge carriers are present, thus the corrosion does not occur. In the fuel blends, it was expected that as the fuel aged, acetic acid would form and hydrolyze to increase the number of charge carriers, thus increasing the corrosion rate. A schematic of the corrosion process of steel under acidic conditions is shown in Figure 1. Electrochemical impedance spectroscopy was used to accurately measure the corrosion rates in a two-electrode setup. Mass loss measurements were carried out before and after exposure to supplement the electrochemical method. Optical microscopy was used to visually inspect the changes of the surface upon exposure. The acid number of the fuels was also determined before and after exposure as an indicator of oxidation of the fuel (especially the biodiesel). The test coupons were exposed to the fuel blends for 12 weeks at slightly elevated temperature to simulate the typical fuel tank conditions over a 12-month period.
H+ H2
e-
Fe Fe2+
electrolyte
H+ H2
e-
Fe Fe2+
electrolyte Figure 1. Schematic of corrosion process of steel under acidic conditions.
2
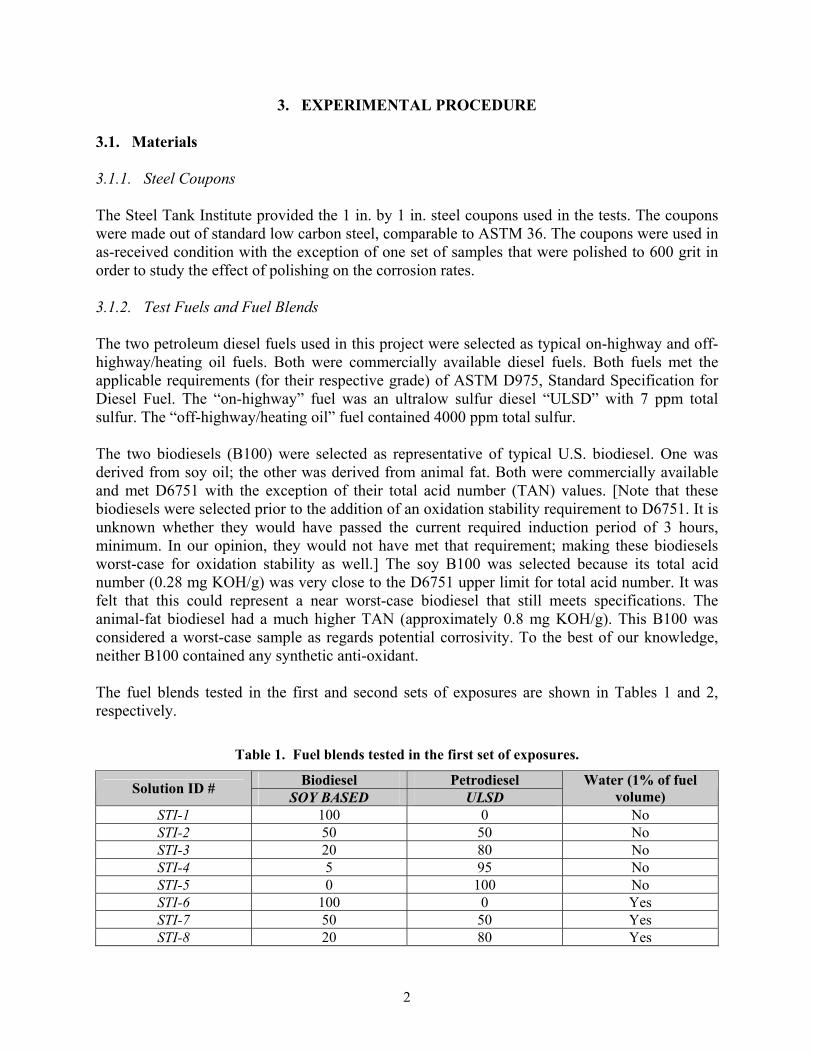
3. EXPERIMENTAL PROCEDURE 3.1. Materials 3.1.1. Steel Coupons The Steel Tank Institute provided the 1 in. by 1 in. steel coupons used in the tests. The coupons were made out of standard low carbon steel, comparable to ASTM 36. The coupons were used in as-received condition with the exception of one set of samples that were polished to 600 grit in order to study the effect of polishing on the corrosion rates. 3.1.2. Test Fuels and Fuel Blends The two petroleum diesel fuels used in this project were selected as typical on-highway and off-highway/heating oil fuels. Both were commercially available diesel fuels. Both fuels met the applicable requirements (for their respective grade) of ASTM D975, Standard Specification for Diesel Fuel. The “on-highway” fuel was an ultralow sulfur diesel “ULSD” with 7 ppm total sulfur. The “off-highway/heating oil” fuel contained 4000 ppm total sulfur. The two biodiesels (B100) were selected as representative of typical U.S. biodiesel. One was derived from soy oil; the other was derived from animal fat. Both were commercially available and met D6751 with the exception of their total acid number (TAN) values. [Note that these biodiesels were selected prior to the addition of an oxidation stability requirement to D6751. It is unknown whether they would have passed the current required induction period of 3 hours, minimum. In our opinion, they would not have met that requirement; making these biodiesels worst-case for oxidation stability as well.] The soy B100 was selected because its total acid number (0.28 mg KOH/g) was very close to the D6751 upper limit for total acid number. It was felt that this could represent a near worst-case biodiesel that still meets specifications. The animal-fat biodiesel had a much higher TAN (approximately 0.8 mg KOH/g). This B100 was considered a worst-case sample as regards potential corrosivity. To the best of our knowledge, neither B100 contained any synthetic anti-oxidant. The fuel blends tested in the first and second sets of exposures are shown in Tables 1 and 2, respectively.
Table 1. Fuel blends tested in the first set of exposures.
Biodiesel Petrodiesel Solution ID # SOY BASED ULSD Water (1% of fuel
volume) STI-1 100 0 No STI-2 50 50 No STI-3 20 80 No STI-4 5 95 No STI-5 0 100 No STI-6 100 0 Yes STI-7 50 50 Yes STI-8 20 80 Yes
3
Biodiesel Petrodiesel Solution ID # SOY BASED ULSD Water (1% of fuel
volume) STI-9 5 95 Yes
STI-10 0 100 Yes STI-11 20 80 No STI-12 5 95 No STI-13 0 100 No STI-14 20 80 Yes STI-15 5 95 Yes STI-16 0 100 Yes
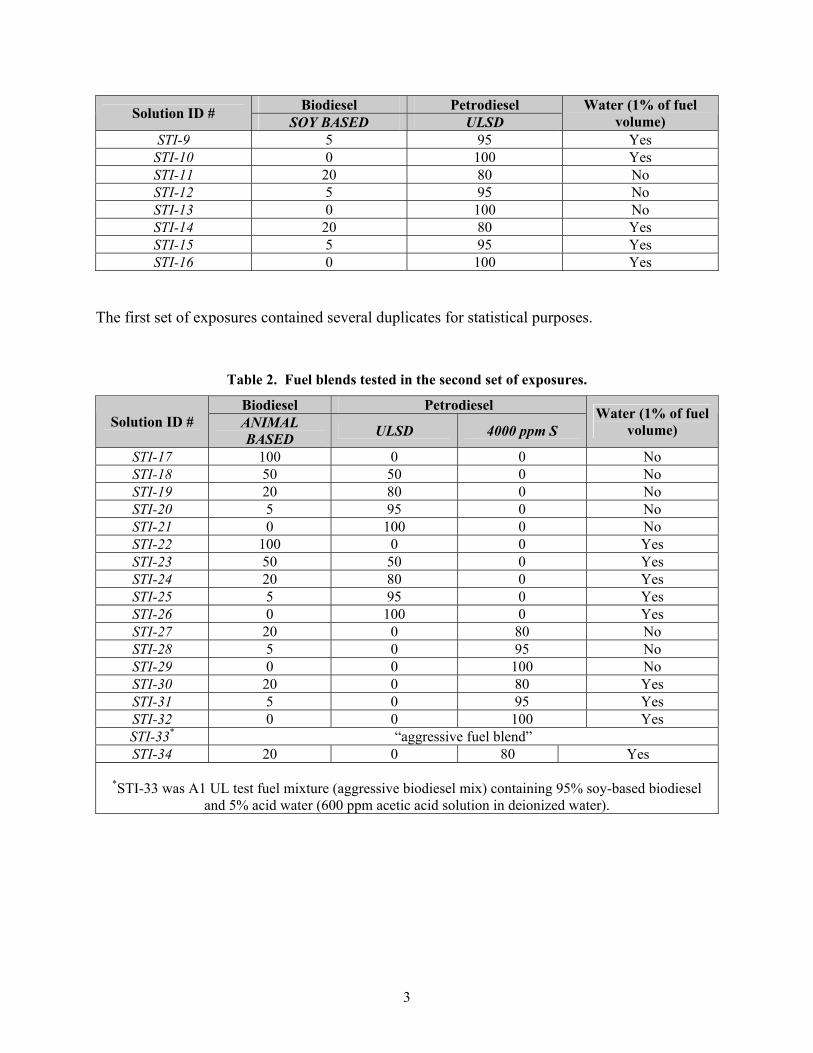
The first set of exposures contained several duplicates for statistical purposes.
Table 2. Fuel blends tested in the second set of exposures.
Biodiesel Petrodiesel Solution ID # ANIMAL
BASED ULSD 4000 ppm S Water (1% of fuel
volume)
STI-17 100 0 0 No STI-18 50 50 0 No STI-19 20 80 0 No STI-20 5 95 0 No STI-21 0 100 0 No STI-22 100 0 0 Yes STI-23 50 50 0 Yes STI-24 20 80 0 Yes STI-25 5 95 0 Yes STI-26 0 100 0 Yes STI-27 20 0 80 No STI-28 5 0 95 No STI-29 0 0 100 No STI-30 20 0 80 Yes STI-31 5 0 95 Yes STI-32 0 0 100 Yes STI-33* “aggressive fuel blend” STI-34 20 0 80 Yes
*STI-33 was A1 UL test fuel mixture (aggressive biodiesel mix) containing 95% soy-based biodiesel and 5% acid water (600 ppm acetic acid solution in deionized water).
4
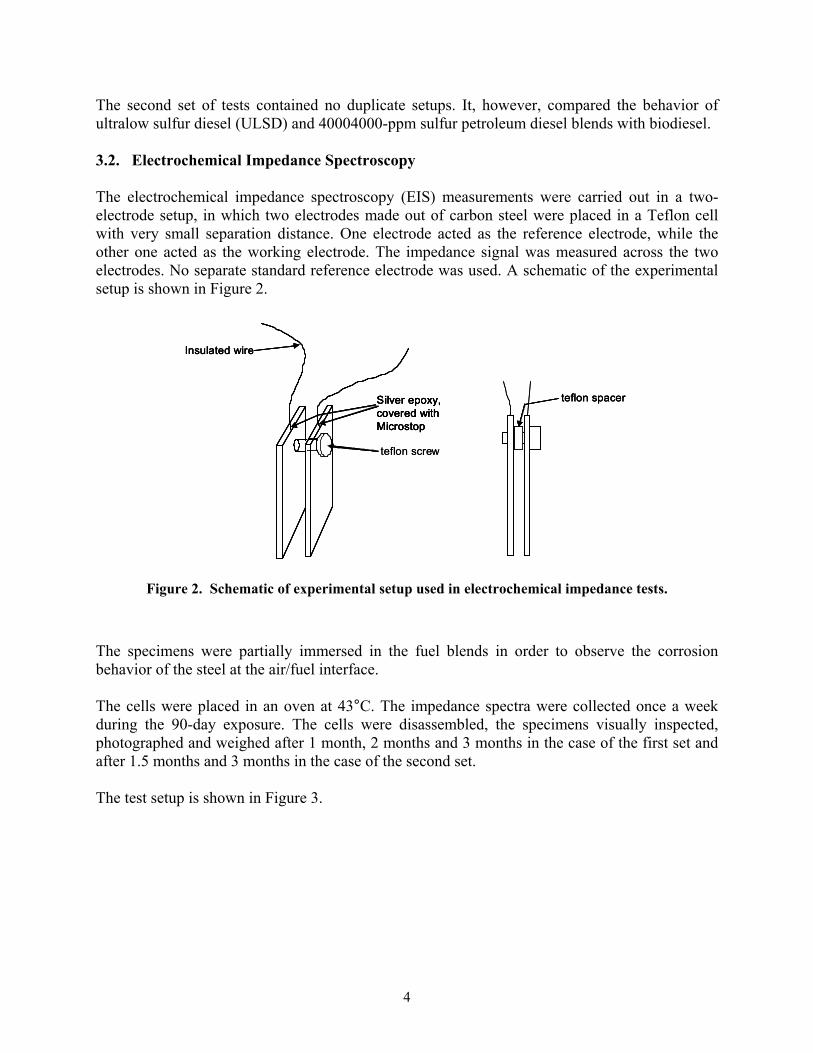
The second set of tests contained no duplicate setups. It, however, compared the behavior of ultralow sulfur diesel (ULSD) and 40004000-ppm sulfur petroleum diesel blends with biodiesel. 3.2. Electrochemical Impedance Spectroscopy The electrochemical impedance spectroscopy (EIS) measurements were carried out in a two-electrode setup, in which two electrodes made out of carbon steel were placed in a Teflon cell with very small separation distance. One electrode acted as the reference electrode, while the other one acted as the working electrode. The impedance signal was measured across the two electrodes. No separate standard reference electrode was used. A schematic of the experimental setup is shown in Figure 2.
teflon screw
Silver epoxy, covered with Microstop
Insulated wire
teflon screw
Silver epoxy, covered with Microstop
Insulated wire
Silver epoxy, covered with Microstop
Silver epoxy, covered with Microstop
Insulated wire
teflon spacerteflon spacerteflon spacer
Figure 2. Schematic of experimental setup used in electrochemical impedance tests.
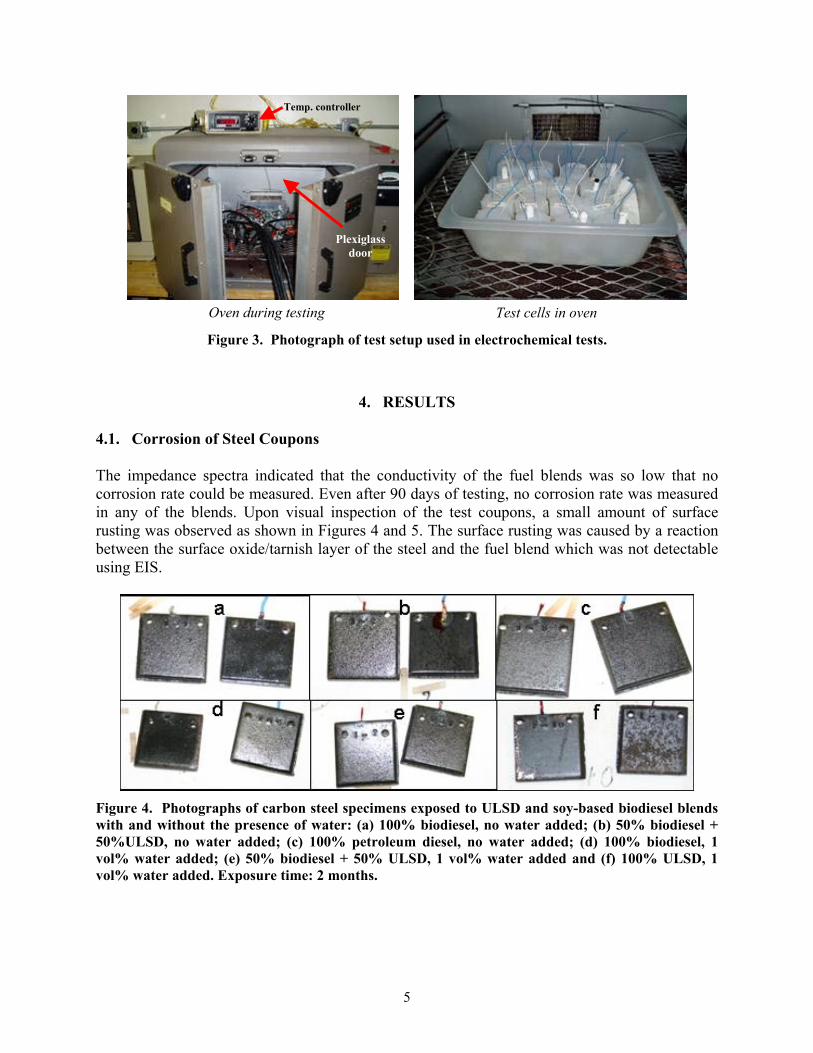
The specimens were partially immersed in the fuel blends in order to observe the corrosion behavior of the steel at the air/fuel interface. The cells were placed in an oven at 43°C. The impedance spectra were collected once a week during the 90-day exposure. The cells were disassembled, the specimens visually inspected, photographed and weighed after 1 month, 2 months and 3 months in the case of the first set and after 1.5 months and 3 months in the case of the second set. The test setup is shown in Figure 3.
5
Test cells in oven Oven during testing
Plexiglass door
Temp. controller
Figure 3. Photograph of test setup used in electrochemical tests.
4. RESULTS 4.1. Corrosion of Steel Coupons The impedance spectra indicated that the conductivity of the fuel blends was so low that no corrosion rate could be measured. Even after 90 days of testing, no corrosion rate was measured in any of the blends. Upon visual inspection of the test coupons, a small amount of surface rusting was observed as shown in Figures 4 and 5. The surface rusting was caused by a reaction between the surface oxide/tarnish layer of the steel and the fuel blend which was not detectable using EIS.
Figure 4. Photographs of carbon steel specimens exposed to ULSD and soy-based biodiesel blends with and without the presence of water: (a) 100% biodiesel, no water added; (b) 50% biodiesel + 50%ULSD, no water added; (c) 100% petroleum diesel, no water added; (d) 100% biodiesel, 1 vol% water added; (e) 50% biodiesel + 50% ULSD, 1 vol% water added and (f) 100% ULSD, 1 vol% water added. Exposure time: 2 months.
6
(c)
(d) (e) (f)
(g) (h)
(a) (b)
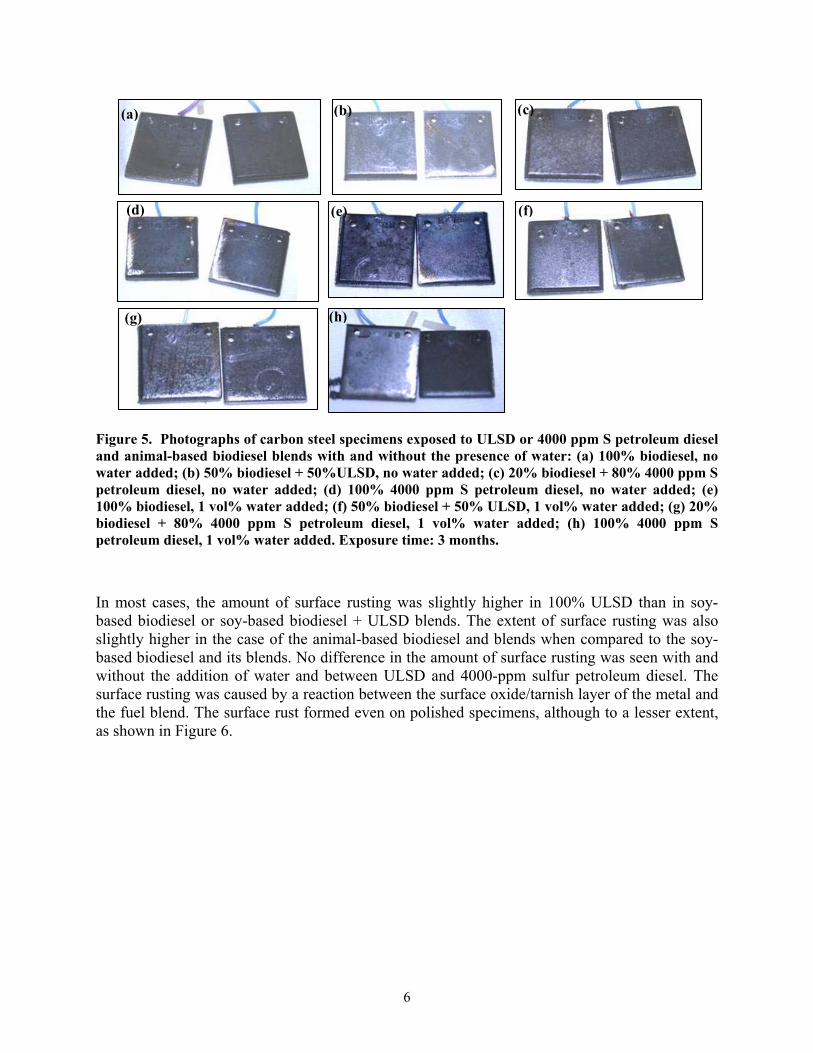
Figure 5. Photographs of carbon steel specimens exposed to ULSD or 4000 ppm S petroleum diesel and animal-based biodiesel blends with and without the presence of water: (a) 100% biodiesel, no water added; (b) 50% biodiesel + 50%ULSD, no water added; (c) 20% biodiesel + 80% 4000 ppm S petroleum diesel, no water added; (d) 100% 4000 ppm S petroleum diesel, no water added; (e) 100% biodiesel, 1 vol% water added; (f) 50% biodiesel + 50% ULSD, 1 vol% water added; (g) 20% biodiesel + 80% 4000 ppm S petroleum diesel, 1 vol% water added; (h) 100% 4000 ppm S petroleum diesel, 1 vol% water added. Exposure time: 3 months.
In most cases, the amount of surface rusting was slightly higher in 100% ULSD than in soy-based biodiesel or soy-based biodiesel + ULSD blends. The extent of surface rusting was also slightly higher in the case of the animal-based biodiesel and blends when compared to the soy-based biodiesel and its blends. No difference in the amount of surface rusting was seen with and without the addition of water and between ULSD and 4000-ppm sulfur petroleum diesel. The surface rusting was caused by a reaction between the surface oxide/tarnish layer of the metal and the fuel blend. The surface rust formed even on polished specimens, although to a lesser extent, as shown in Figure 6.
7
Figure 6. Photographs of carbon steel specimens polished to 600 grit, then exposed to
20% animal-based biodiesel + 80% 4000 ppm S petroleum diesel blend with the presence of 1 vol% water for 3 months.
The aggressive fuel blend caused somewhat more corrosion on the surface (Figure 7), as expected. However, the conductivity of the fuel blend (STI-33) was not high enough to measure this corrosion rate using electrochemical impedance spectroscopy. Upon examining the surface of the steel coupons exposed to the aggressive fuel blend, it was noted that the corrosion only affected the surface and it appeared to be uniform, no deep localized corrosion sites (pits) were observed.
Figure 7. Photographs of carbon steel specimens exposed to aggressive fuel blend (A1 UL test fuel mixture) for 3 months.
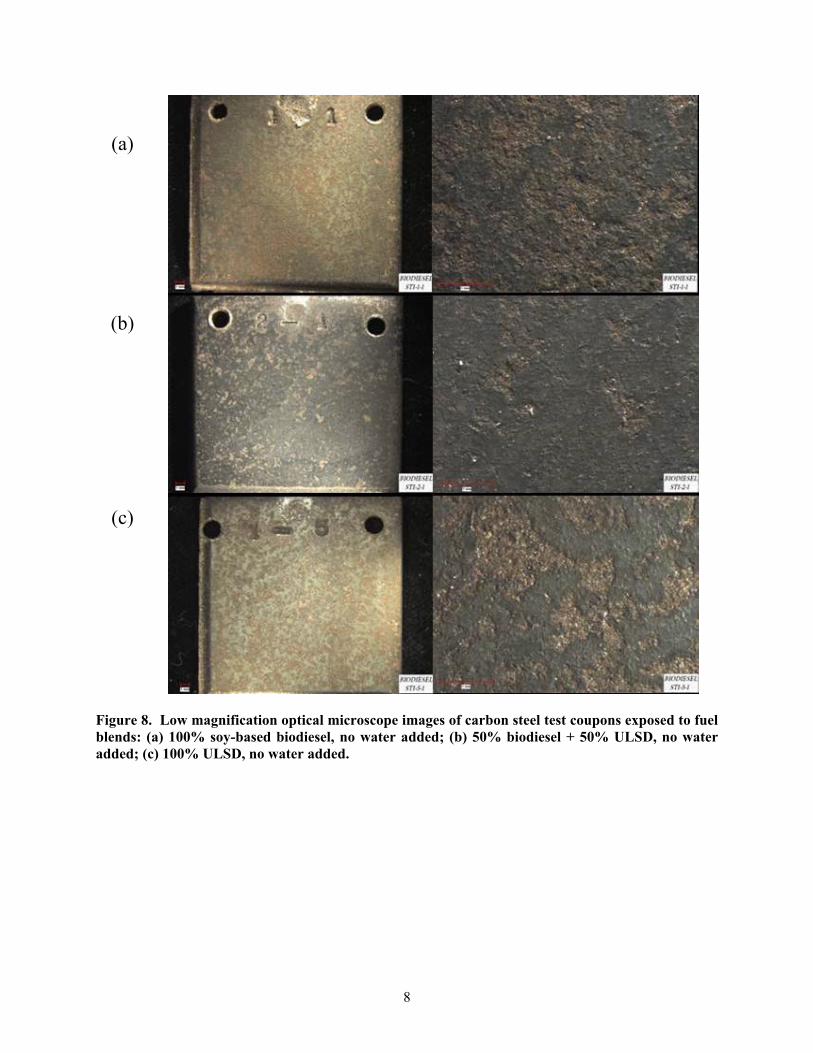
To further investigate the surface damage observed on the test coupons, low magnification optical micrographs were taken. Representative micrographs for each set of exposures are shown in Figures 8 and 9, respectively.
8
(a)
(b)
(c)
Figure 8. Low magnification optical microscope images of carbon steel test coupons exposed to fuel blends: (a) 100% soy-based biodiesel, no water added; (b) 50% biodiesel + 50% ULSD, no water added; (c) 100% ULSD, no water added.
9
toolmark
(a)
(b)
(c)
(d)
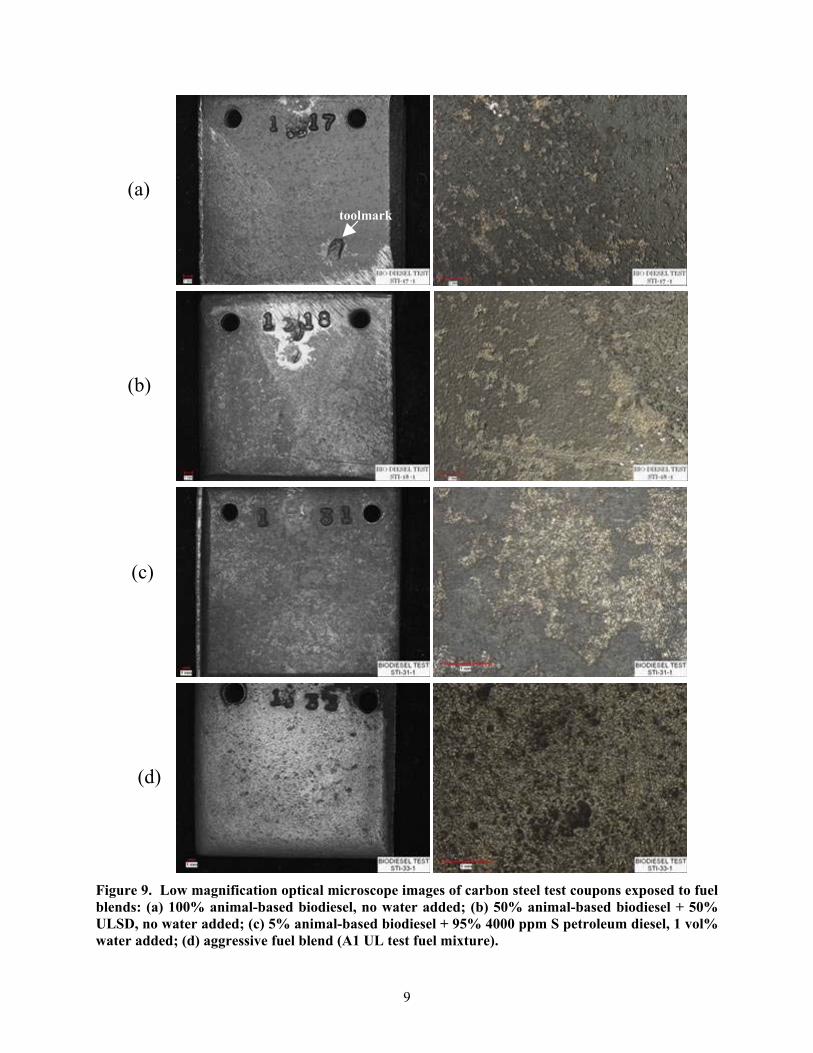
Figure 9. Low magnification optical microscope images of carbon steel test coupons exposed to fuel blends: (a) 100% animal-based biodiesel, no water added; (b) 50% animal-based biodiesel + 50% ULSD, no water added; (c) 5% animal-based biodiesel + 95% 4000 ppm S petroleum diesel, 1 vol% water added; (d) aggressive fuel blend (A1 UL test fuel mixture).
10
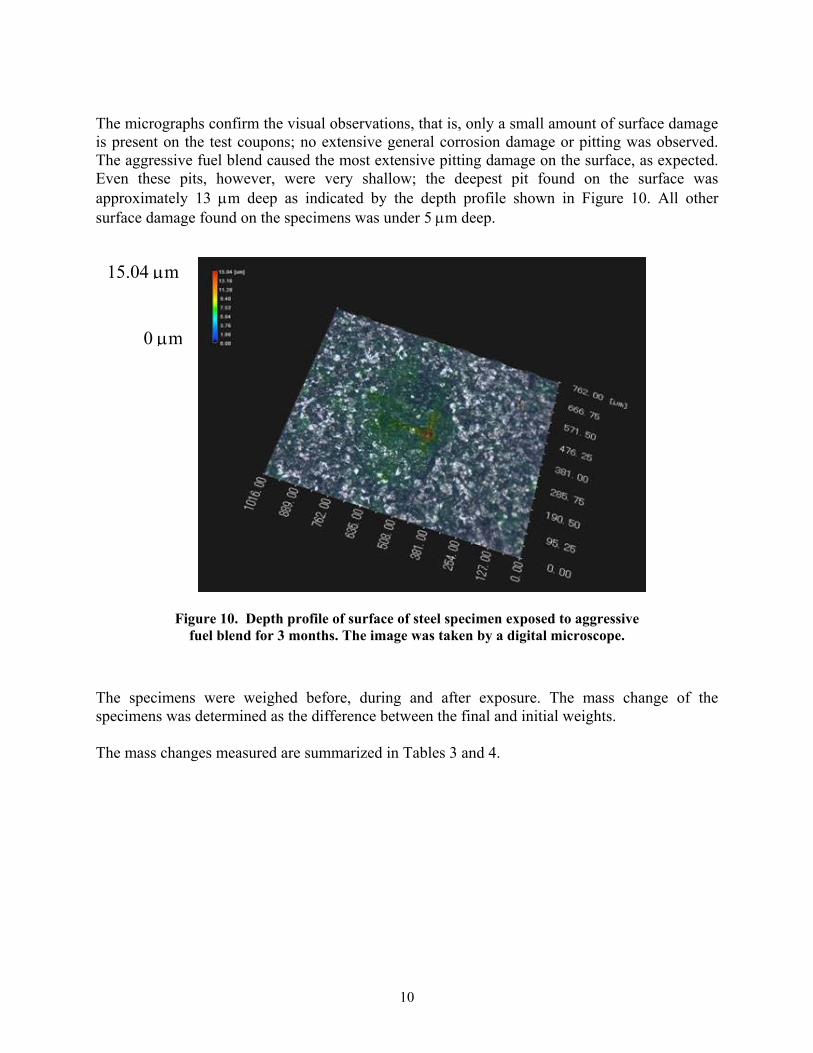
The micrographs confirm the visual observations, that is, only a small amount of surface damage is present on the test coupons; no extensive general corrosion damage or pitting was observed. The aggressive fuel blend caused the most extensive pitting damage on the surface, as expected. Even these pits, however, were very shallow; the deepest pit found on the surface was approximately 13 µm deep as indicated by the depth profile shown in Figure 10. All other surface damage found on the specimens was under 5 µm deep.
15.04 µm
0 µm
Figure 10. Depth profile of surface of steel specimen exposed to aggressive fuel blend for 3 months. The image was taken by a digital microscope.
The specimens were weighed before, during and after exposure. The mass change of the specimens was determined as the difference between the final and initial weights. The mass changes measured are summarized in Tables 3 and 4.
11
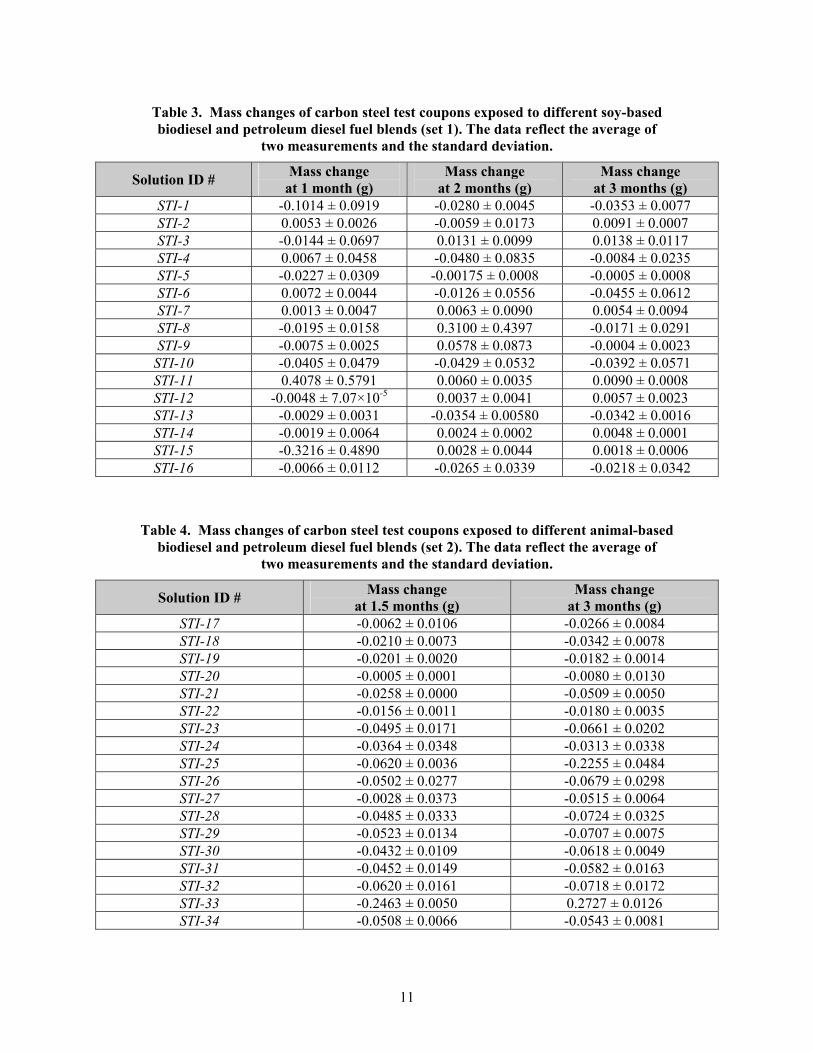
Table 3. Mass changes of carbon steel test coupons exposed to different soy-based biodiesel and petroleum diesel fuel blends (set 1). The data reflect the average of
two measurements and the standard deviation.
Solution ID # Mass change at 1 month (g)
Mass change at 2 months (g)
Mass change at 3 months (g)
STI-1 -0.1014 ± 0.0919 -0.0280 ± 0.0045 -0.0353 ± 0.0077 STI-2 0.0053 ± 0.0026 -0.0059 ± 0.0173 0.0091 ± 0.0007 STI-3 -0.0144 ± 0.0697 0.0131 ± 0.0099 0.0138 ± 0.0117 STI-4 0.0067 ± 0.0458 -0.0480 ± 0.0835 -0.0084 ± 0.0235 STI-5 -0.0227 ± 0.0309 -0.00175 ± 0.0008 -0.0005 ± 0.0008 STI-6 0.0072 ± 0.0044 -0.0126 ± 0.0556 -0.0455 ± 0.0612 STI-7 0.0013 ± 0.0047 0.0063 ± 0.0090 0.0054 ± 0.0094 STI-8 -0.0195 ± 0.0158 0.3100 ± 0.4397 -0.0171 ± 0.0291 STI-9 -0.0075 ± 0.0025 0.0578 ± 0.0873 -0.0004 ± 0.0023
STI-10 -0.0405 ± 0.0479 -0.0429 ± 0.0532 -0.0392 ± 0.0571 STI-11 0.4078 ± 0.5791 0.0060 ± 0.0035 0.0090 ± 0.0008 STI-12 -0.0048 ± 7.07×10⁻⁵ 0.0037 ± 0.0041 0.0057 ± 0.0023 STI-13 -0.0029 ± 0.0031 -0.0354 ± 0.00580 -0.0342 ± 0.0016 STI-14 -0.0019 ± 0.0064 0.0024 ± 0.0002 0.0048 ± 0.0001 STI-15 -0.3216 ± 0.4890 0.0028 ± 0.0044 0.0018 ± 0.0006 STI-16 -0.0066 ± 0.0112 -0.0265 ± 0.0339 -0.0218 ± 0.0342
Table 4. Mass changes of carbon steel test coupons exposed to different animal-based biodiesel and petroleum diesel fuel blends (set 2). The data reflect the average of
two measurements and the standard deviation.
Solution ID # Mass change at 1.5 months (g)
Mass change at 3 months (g)
STI-17 -0.0062 ± 0.0106 -0.0266 ± 0.0084 STI-18 -0.0210 ± 0.0073 -0.0342 ± 0.0078 STI-19 -0.0201 ± 0.0020 -0.0182 ± 0.0014 STI-20 -0.0005 ± 0.0001 -0.0080 ± 0.0130 STI-21 -0.0258 ± 0.0000 -0.0509 ± 0.0050 STI-22 -0.0156 ± 0.0011 -0.0180 ± 0.0035 STI-23 -0.0495 ± 0.0171 -0.0661 ± 0.0202 STI-24 -0.0364 ± 0.0348 -0.0313 ± 0.0338 STI-25 -0.0620 ± 0.0036 -0.2255 ± 0.0484 STI-26 -0.0502 ± 0.0277 -0.0679 ± 0.0298 STI-27 -0.0028 ± 0.0373 -0.0515 ± 0.0064 STI-28 -0.0485 ± 0.0333 -0.0724 ± 0.0325 STI-29 -0.0523 ± 0.0134 -0.0707 ± 0.0075 STI-30 -0.0432 ± 0.0109 -0.0618 ± 0.0049 STI-31 -0.0452 ± 0.0149 -0.0582 ± 0.0163 STI-32 -0.0620 ± 0.0161 -0.0718 ± 0.0172 STI-33 -0.2463 ± 0.0050 0.2727 ± 0.0126 STI-34 -0.0508 ± 0.0066 -0.0543 ± 0.0081
12
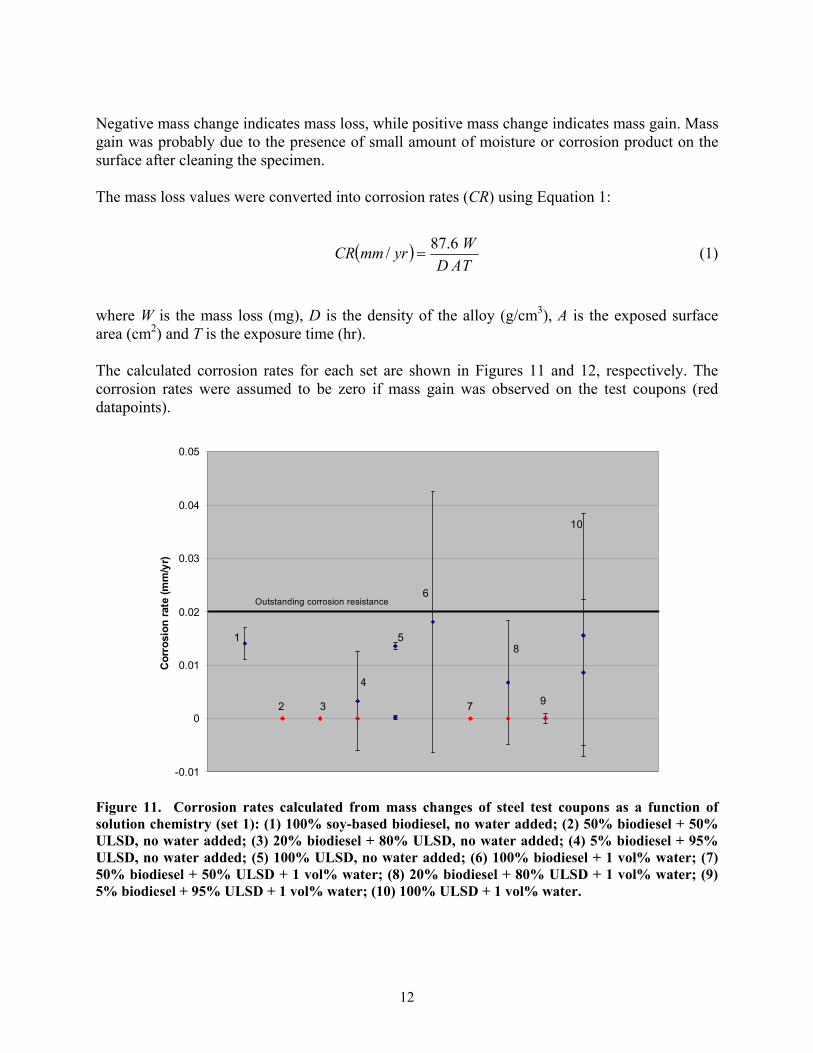
Negative mass change indicates mass loss, while positive mass change indicates mass gain. Mass gain was probably due to the presence of small amount of moisture or corrosion product on the surface after cleaning the specimen. The mass loss values were converted into corrosion rates (CR) using Equation 1:
( )TADWyrmmCR 6.87/ = (1)
where W is the mass loss (mg), D is the density of the alloy (g/cm3), A is the exposed surface area (cm2) and T is the exposure time (hr). The calculated corrosion rates for each set are shown in Figures 11 and 12, respectively. The corrosion rates were assumed to be zero if mass gain was observed on the test coupons (red datapoints).
-0.01
0
0.01
0.02
0.03
0.04
0.05
Cor
rosi
on ra
te (m
m/y
r)
1
2 3
4
5
6
7
8
9
10
Outstanding corrosion resistance
Figure 11. Corrosion rates calculated from mass changes of steel test coupons as a function of solution chemistry (set 1): (1) 100% soy-based biodiesel, no water added; (2) 50% biodiesel + 50% ULSD, no water added; (3) 20% biodiesel + 80% ULSD, no water added; (4) 5% biodiesel + 95% ULSD, no water added; (5) 100% ULSD, no water added; (6) 100% biodiesel + 1 vol% water; (7) 50% biodiesel + 50% ULSD + 1 vol% water; (8) 20% biodiesel + 80% ULSD + 1 vol% water; (9) 5% biodiesel + 95% ULSD + 1 vol% water; (10) 100% ULSD + 1 vol% water.
13
The corrosion rates were not significant in the case of the first set of exposures indicating the lack of corrosion in the system. The average corrosion rates were below 0.02 mm/yr, which corresponded to outstanding relative corrosion resistance for typical ferrous and nickel alloys1. No apparent correlation was found between the corrosion rate and solution chemistry (Figure 11).
STI-20STI-22
STI-24
STI-25
STI-26 STI-32
STI-33
STI-34
STI-31
STI-30STI-29
STI-28
STI-27
STI-23STI-21
STI-19STI-18
STI-17
-0.02
0
0.02
0.04
0.06
0.08
0.1
0.12
Cor
rosi
on ra
te (m
m/y
r)
Outstanding corrosion resistance
Excellent corrosion resistance
Good corrosion resistance
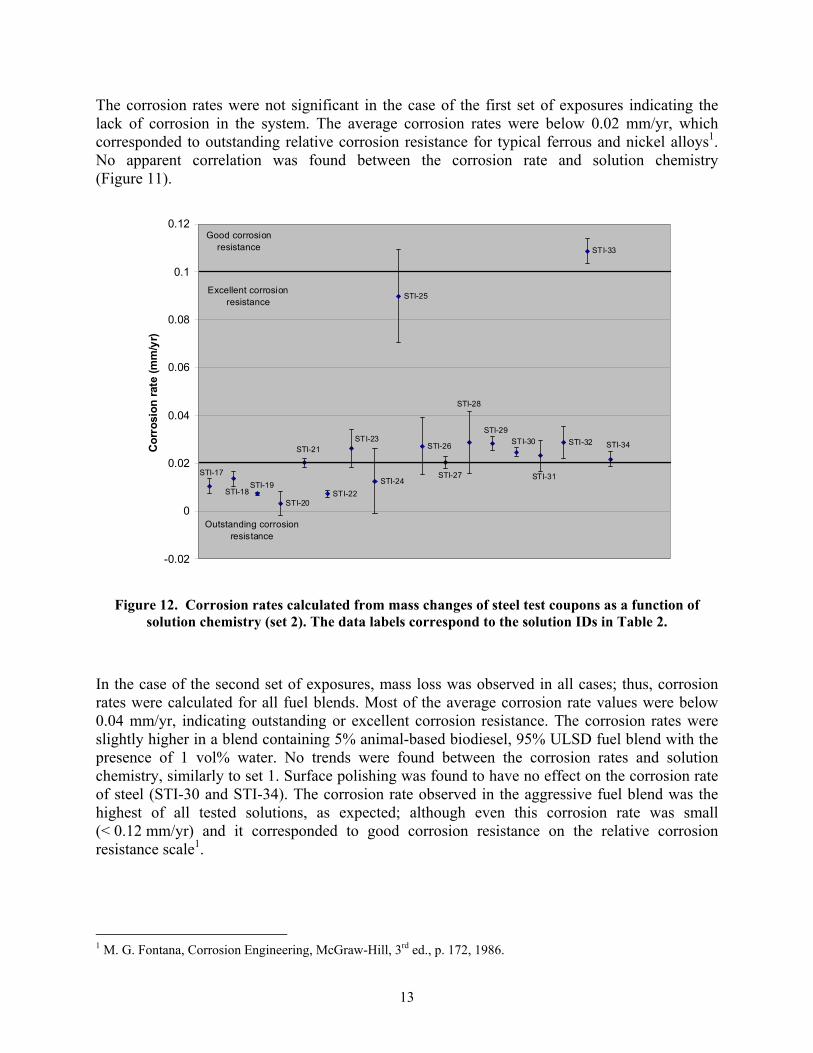
Figure 12. Corrosion rates calculated from mass changes of steel test coupons as a function of solution chemistry (set 2). The data labels correspond to the solution IDs in Table 2.
In the case of the second set of exposures, mass loss was observed in all cases; thus, corrosion rates were calculated for all fuel blends. Most of the average corrosion rate values were below 0.04 mm/yr, indicating outstanding or excellent corrosion resistance. The corrosion rates were slightly higher in a blend containing 5% animal-based biodiesel, 95% ULSD fuel blend with the presence of 1 vol% water. No trends were found between the corrosion rates and solution chemistry, similarly to set 1. Surface polishing was found to have no effect on the corrosion rate of steel (STI-30 and STI-34). The corrosion rate observed in the aggressive fuel blend was the highest of all tested solutions, as expected; although even this corrosion rate was small (< 0.12 mm/yr) and it corresponded to good corrosion resistance on the relative corrosion resistance scale1.
1 M. G. Fontana, Corrosion Engineering, McGraw-Hill, 3rd ed., p. 172, 1986.
14
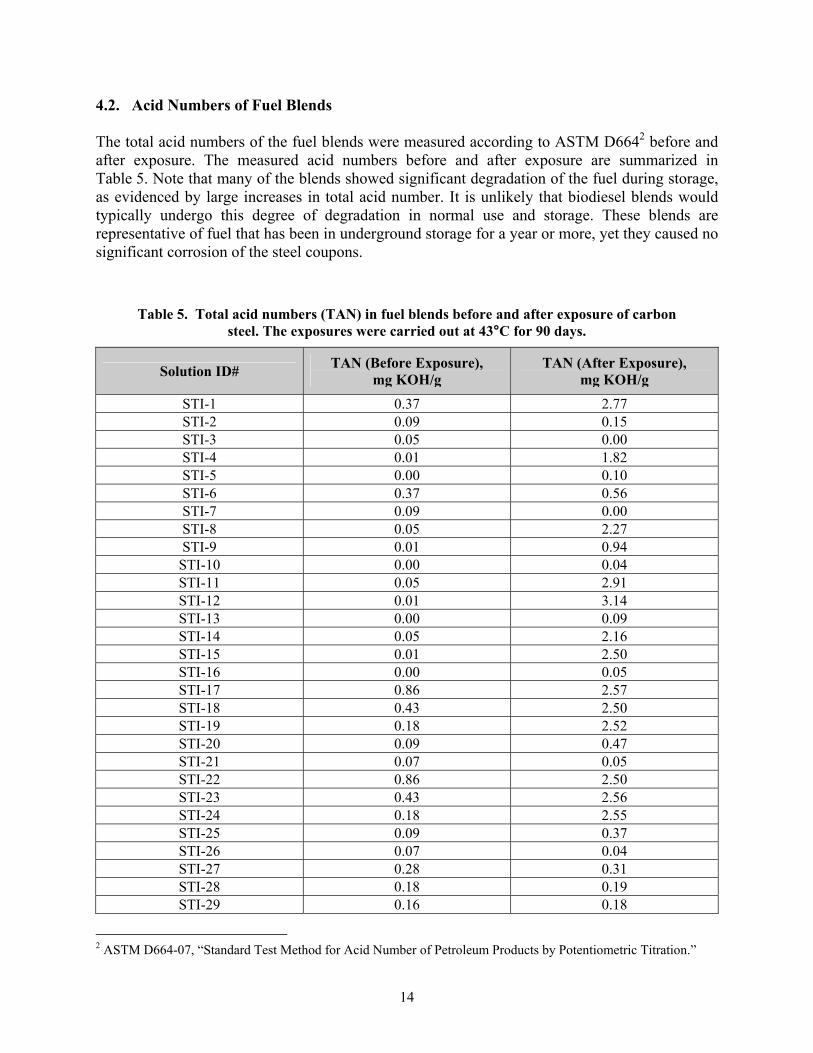
4.2. Acid Numbers of Fuel Blends The total acid numbers of the fuel blends were measured according to ASTM D6642 before and after exposure. The measured acid numbers before and after exposure are summarized in Table 5. Note that many of the blends showed significant degradation of the fuel during storage, as evidenced by large increases in total acid number. It is unlikely that biodiesel blends would typically undergo this degree of degradation in normal use and storage. These blends are representative of fuel that has been in underground storage for a year or more, yet they caused no significant corrosion of the steel coupons.
Table 5. Total acid numbers (TAN) in fuel blends before and after exposure of carbon steel. The exposures were carried out at 43°C for 90 days.
Solution ID# TAN (Before Exposure), mg KOH/g
TAN (After Exposure), mg KOH/g
STI-1 0.37 2.77 STI-2 0.09 0.15 STI-3 0.05 0.00 STI-4 0.01 1.82 STI-5 0.00 0.10 STI-6 0.37 0.56 STI-7 0.09 0.00 STI-8 0.05 2.27 STI-9 0.01 0.94
STI-10 0.00 0.04 STI-11 0.05 2.91 STI-12 0.01 3.14 STI-13 0.00 0.09 STI-14 0.05 2.16 STI-15 0.01 2.50 STI-16 0.00 0.05 STI-17 0.86 2.57 STI-18 0.43 2.50 STI-19 0.18 2.52 STI-20 0.09 0.47 STI-21 0.07 0.05 STI-22 0.86 2.50 STI-23 0.43 2.56 STI-24 0.18 2.55 STI-25 0.09 0.37 STI-26 0.07 0.04 STI-27 0.28 0.31 STI-28 0.18 0.19 STI-29 0.16 0.18
2 ASTM D664-07, “Standard Test Method for Acid Number of Petroleum Products by Potentiometric Titration.”
15
Solution ID# TAN (Before Exposure), mg KOH/g
TAN (After Exposure), mg KOH/g
STI-30 0.28 0.46 STI-31 0.18 0.17 STI-32 0.16 0.15 STI-33 0.94 2.21 STI-34 0.28 2.62
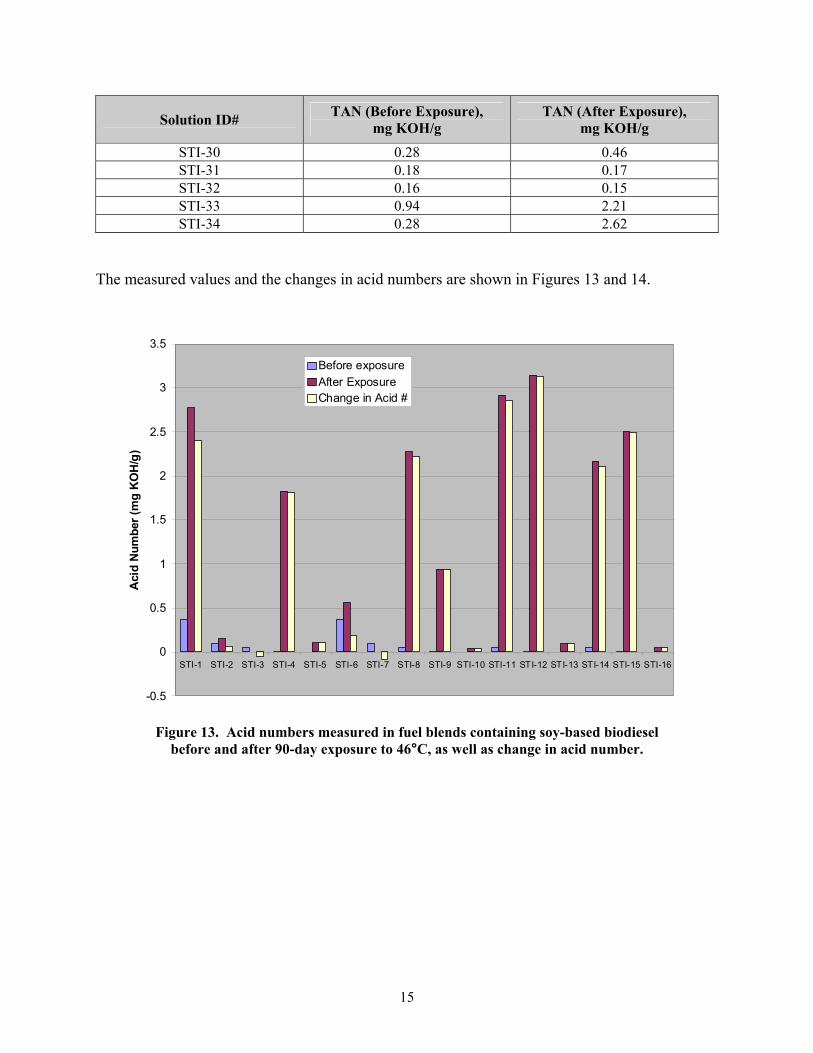
The measured values and the changes in acid numbers are shown in Figures 13 and 14.
-0.5
0
0.5
1
1.5
2
2.5
3
3.5
STI-1 STI-2 STI-3 STI-4 STI-5 STI-6 STI-7 STI-8 STI-9 STI-10 STI-11 STI-12 STI-13 STI-14 STI-15 STI-16
Aci
d N
umbe
r (m
g K
OH
/g)
Before exposureAfter ExposureChange in Acid #
Figure 13. Acid numbers measured in fuel blends containing soy-based biodiesel
before and after 90-day exposure to 46°C, as well as change in acid number.
16
-0.5
0
0.5
1
1.5
2
2.5
3
STI-17
STI-18
STI-19
STI-20
STI-21
STI-22
STI-23
STI-24
STI-25
STI-26
STI-27
STI-28
STI-29
STI-30
STI-31
STI-32
STI-33
STI-34
Aci
d N
umbe
r (m
g K
OH
/g)
Before exposureAfter exposureChange in acid#
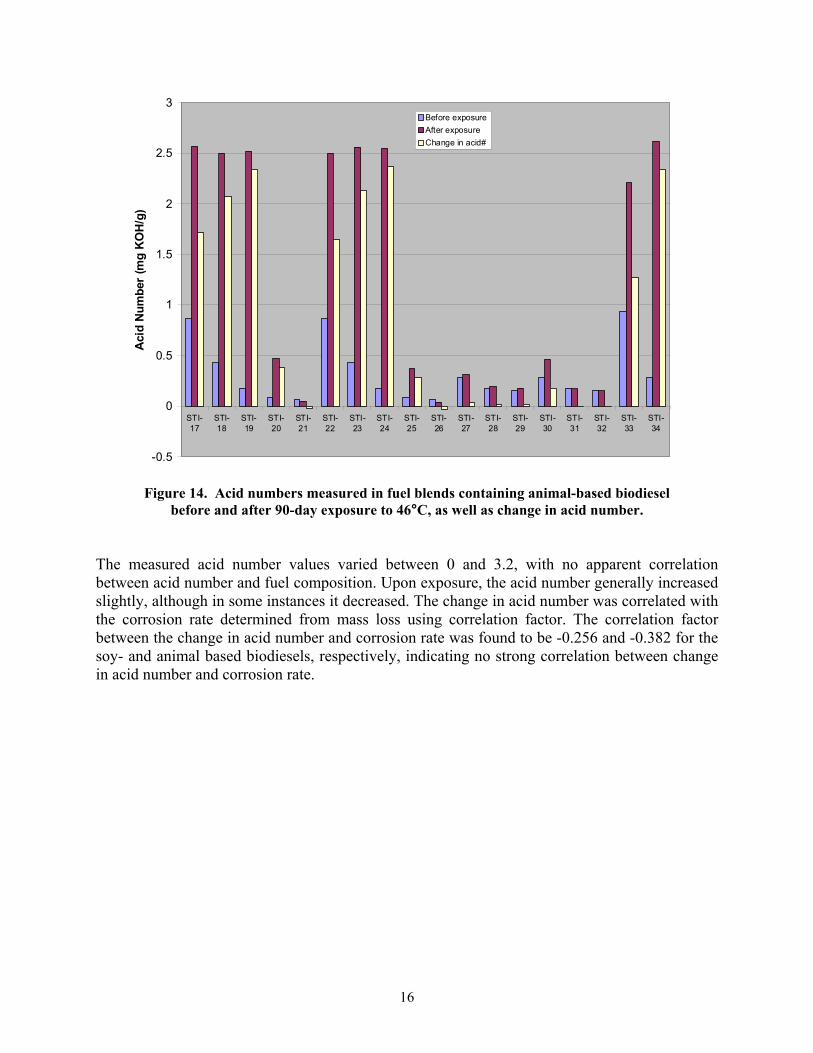
Figure 14. Acid numbers measured in fuel blends containing animal-based biodiesel
before and after 90-day exposure to 46°C, as well as change in acid number. The measured acid number values varied between 0 and 3.2, with no apparent correlation between acid number and fuel composition. Upon exposure, the acid number generally increased slightly, although in some instances it decreased. The change in acid number was correlated with the corrosion rate determined from mass loss using correlation factor. The correlation factor between the change in acid number and corrosion rate was found to be -0.256 and -0.382 for the soy- and animal based biodiesels, respectively, indicating no strong correlation between change in acid number and corrosion rate.


![Doc 128 Execution of Steel Structure en 1090 [Compatibility Mode]](https://img.pdfslide.us/doc/110x75/577cc6881a28aba7119e8561/doc-128-execution-of-steel-structure-en-1090-compatibility-mode.jpg)

![Biodiesel Project [Compatibility Mode]](https://img.pdfslide.us/doc/110x75/577d26a11a28ab4e1ea1bb19/biodiesel-project-compatibility-mode.jpg)