Embed Size (px)
DESCRIPTION
Testing and modeling the diagonal tension strength of rubble stonemasonry panels
Citation preview
This article appeared in a journal published by Elsevier. The attachedcopy is furnished to the author for internal non-commercial researchand education use, including for instruction at the authors institution
and sharing with colleagues.
Other uses, including reproduction and distribution, or selling orlicensing copies, or posting to personal, institutional or third party
websites are prohibited.
In most cases authors are permitted to post their version of thearticle (e.g. in Word or Tex form) to their personal website orinstitutional repository. Authors requiring further information
regarding Elsevier’s archiving and manuscript policies areencouraged to visit:
http://www.elsevier.com/authorsrights

Author's personal copy
Testing and modeling the diagonal tension strength of rubble stone masonry panels
Jelena Milosevic ⇑, Mário Lopes, António Sousa Gago, Rita Bento ICIST, IST, Technical University of Lisbon, Portugal
a r t i c l e i n f o
Article history: Received 10 November 2012 Revised 24 December 2012 Accepted 12 March 2013
Keywords:Masonry buildings Shear strength Experimental tests Diagonal compression test EarthquakeFinite element model Distinct element model
a b s t r a c t
The present paper deals with the experimental study performed by diagonal compression tests on four rubble stone masonry panels (120 cm � 120 cm � 70 cm) within the scope of the research project SEVERES aiming at characterizing the seismic behavior of old masonry buildings. In this research two types of mortar were used, namely two specimens were built with hydraulic lime and other two speci- mens were built with air lim e mortar. The shear strength and the shear modulu s of rubble stone panels were obtained. These results were compared with the values obtained by other authors and suggested by the Italian’s standards. It is important to refer that the experimental research allowed characterizing the mechanical properties of masonry panels, which were built using traditional techniques in order to sim- ulate old buildings in Portugal. Together with the experimental research, (additionally) numerical inter- pretation of the tests is also given in order to simulate the behavior of the panels.
� 2013 Elsevier Ltd. All rights reserved.
1. Introduction
Many cities located in regions of intense seismic activity have asignificant number of old masonry buildings. These buildings are occupied mainly by services and housing, and many have a not negligible architectural value. Therefore, to preserve the architec- tural heritage and decrease the seismic risk in those regions, struc- tural studies should be conducted in order to decide where and how strengthening techniqu es should be used [1].
Lisbon is an area of intense seismic activity, where in 1755, one of the largest earthquakes in history destroyed the city and other towns in the south of Portugal. However, nowadays about 39% of the Lisbon building stock are old buildings built with masonry loadbearing walls and wooden floors, most with an inadequate seismic behavior. Two types of masonry buildings were built in Lis- bon after 1755: (i) the so called ‘‘Pombalino’’ buildings [2,3], built in the decades after the earthqua ke, where specific construction techniques were adopted to enhance the buildings seismic behav- ior, and (ii) the buildings constructed during the expansion of the city at the late nineteenth and early 20th-centur y, known as ’’Gai- oleiro’’ buildings [4], with lower construction quality. Despite the different constructi on techniques of these buildings, the constitu-
tion of their exterior walls is similar: thick rubble masonry walls with limestone and air lime mortar. This type of wall was widely used in the eighteen th and nineteenth centuries in Portugal and in all Mediterrane an’s countries.
For any numerical analysis it is important to know the mechan- ical characteristics of the constituent materials in order to simulate properly the buildings structural behavior. However, there are few studies where values for shear strength parameters of old masonry buildings can be found, which are actually a very relevant param- eter for the evaluation of seismic behavior of masonry buildings.
The work described in this paper, develope d under the frame- work of the research project SEVERES (www.severes.o rg ), aims to characteri ze the seismic behavior of the aforementione d two types of buildings , including experime ntal tests for characteri zation of the shear strength of rubble stone masonry. These tests consist of diagonal compress ion tests (described in this paper), axial com- pression tests and shear tests (triplet and cyclic tests).
The diagonal compression tests followed , as close as possible, the test specifications of ASTM E519-02 standard [5] and similar works where rubble stone masonry panels were tested [6–12].For these tests, four rubble stone masonry panels with dimensions of 120 cm � 120 cm � 70 cm were built (Fig. 1), with two types of mortar: two panels were built with hydraulic lime mortar and the other two with air lime mortar.
The diagonal compression tests were carried out to determine the shear strength of rubble stone masonry panels, the diagonal tensile strength and the shear modulus.
0141-0296/$ - see front matter � 2013 Elsevier Ltd. All rights reserved. http://dx.doi.org/10.1016/j.engstruct.2013.03.019
⇑ Corresponding author. Address: IST DECivil – Av. Rovisco Pais, 1049-001 Lisboa, Portugal. Tel.: +351 927195525; fax: +351 218418200.
E-mail address: [email protected] (J. Milosevic).
Engineering Structures 52 (2013) 581–591
Contents lists available at SciVerse ScienceDi rect
Engin eering Structu res
journal homepage: www.elsevier .com/ locate /engstruct

Author's personal copy
Numerical analyses were also performed to reproduce the experimental tests. Based on experime ntal results nonlinear finiteelement models (smeared crack approach) and distinct element models were calibrated, by means of DIANA [13] and UDEC [14]computer’s codes, respectively .
2. Characterizati on of masonry materials and construction of tests panels
The panels built for this experimental campaign are mainly characterized by roughly cut stone, in order to reproduce the com- mon features of the traditional construction methodology. The stones were carefully chosen to secure theirs best application, leav- ing as few voids as possible. The dimensions of the stones varied and during the construction period, special attention was paid on choosing the larger stones (with the average dimension of the lon- gest edge of 25 cm) as the basic building units, especially for the wall edges. The chosen stones are further locked together by apply- ing the mortar and small stones in order to make the wall solid and stable.
The lime stones that were used to build the panels had the same origin and similar mechanical characteristics as the stones that were used by the old masons. Compressio n tests on this type of stones were done on a previous experimental campaign [15] andthe average values of compressive strength of stone cubic samples (10 cm edge length) are presented in Table 1.
It is worth noting that in most of the old masonry buildings the binding material was air lime, since hydraulic lime was not used frequently, at least in Mediterrane an countries, before the first dec- ades of XX century. In this experimental programme masonry pan- els based on hydraulic lime were used to represent buildings which were built in later period and with the aim of comparing results with panels where air lime was used.
The hydraulic lime was produced by Secil Martingança Com- pany. The air lime was prepared in the laboratory following the tra- ditional preparation methodology: cooked lime stones were added slowly in a big barrel where the appropriate amount of water had been introduced, and boiled until air lime was obtained.
The two types of mortar used in the panel’s construction, were made with a sand/binder ratio of 3/1, in volume, which is similar to the mix proportions of traditional mortars. The mortars
mechanical properties, such as flexural and compress ive strength, were obtained by experimental tests performed simultaneou sly with the diagonal compress ion tests.
For the flexural strength (mortar flexural strength is the mortar tensile strength obtained by bending tests), nine prismatic speci- mens (160 � 40 � 40 mm) were tested according to the EN 1015- 11 standard [16] and the obtained mean value of the flexuralstrength is 0.35 MPa for the hydraulic mortar and 0.25 MPa for the air lime mortar. Compress ion tests were also performed and the obtained compressive strength was 1.47 MPa and 0.56 MPa for the hydraulic mortar and the air lime mortar, respectivel y.
The panels were built in the test position, and supported on the two lower faces during construction, as shown in Fig. 2. The firstpanel was constructed by applying the stones in horizontal layers, whereas the other three panels were built with diagonal stone lay- ers. The intention was to obtain some insight to the influence of the stone arrangement on the shear strength and ductility of the panels.
According to the ASTM E519-02 standard [5] two steel loading shoes, with maximum length of bearing of 1/8 of the length of the specimen edge, were used. Namely, all panels were constructed on the bottom steel element (loading shoe) and before the test of the panel, in order to apply the load, other loading shoe was placed on the top of the panel. To avoid prematu re splitting and failure of panel edges, the space between the specimen and steel plates is filled with appropriate type of mortar.
It is important to say that all panels were built according to the traditional rules by an experienced mason.
3. Diagonal compressi on test
3.1. Test description
The diagonal compress ion test is carried out to determine the diagonal tensile (shear) strength and it is performed in square masonry panels that are tested with the diagonal in the vertical direction and compressed in that direction. The size of the panels is selected as the smallest to be reasonably representative and to allow the use of the usual testing machines. The ASTM standard recomme nds dimension of panels 120 cm � 120 cm, which was adopted in the present work. The thickness is 70 cm, the medium thickness of the external masonry walls of ‘‘Pombalino’’ and ‘‘Gaioleiro’’ buildings.
After constructi on, due to panel’s size and to the nature of mor- tars which were used, air and hydraulic lime mortars, considering the different speed of hardness, the panels were not relocated from the original position and a curing period of 8 months was adopted.
The test setup is composed of two steel loading shoes (Fig. 3)placed on two diagonally opposite corners of the masonry panels. One of the loading shoes supports the panel and it is in contact with the laborator y slab, while the other one is placed on top of
Fig. 1. Panels for diagonal compression tests.
Table 1Compressive strength of stone cubic panels [15].
Cubes average values Ultimate load (kN) Compressive strength (MPa)
478 48 Fig. 2. Evaluation of panels construction.
582 J. Milosevic et al. / Engineering Structures 52 (2013) 581–591

Author's personal copy
the panels, where the 800 kN capacity hydraulic jack applies the vertical load (Fig. 4).
During testing, the vertical load was applied to the panel by ahydraulic jack acting on the top steel shoe and transmitted to the bottom shoe. The shortening of the vertical diagonal and the lengthening of the horizontal diagonal were measured with linear displacemen t transducers (TSV and TSH, respectively), which were placed on both sides of the masonry panels. The total number of channels used for each panel was eight (five transducers were installed on one side of the panel and three transducers were placed on the other side), as depicted in Fig. 5.
3.2. Interpretatio n of the diagonal compression test
One of the most used methodol ogies to evaluate the shear strength of masonry panels based on the results of diagonal com- pression tests is the one proposed on the ASTM specifications [5].According to this the shear stress can be calculated as:
s ¼ 0:707� PAn
ð1Þ
where P is the load applied by the jack and An is the net area of the panel, calculate d as follows:
An ¼wþ h
2
� �� t � n ð2Þ
where w is the panel width, h is the panel height, t is the total thick- ness of the panel and n is percent of the unit’s gross area that is so- lid, expressed as a decimal. In the present work n = 1 was adopted .
The shear strain c is evaluated as:
c ¼ Dvgvþ Dh
ghð3Þ
where Dv is the vertical shortenin g of the panel, Dh is the horizon- tal elonga tion of the panel, and gv and gh are the vertical and hori- zontal gage lengths (see Fig. 5a), respective ly.
Consequentl y, the shear strength s0 (fvo accordin g to Eurocode 6[17]) and the tensile strength ft are defined as:
s0 ¼ ft ¼0:707� Pmax
Anð4Þ
where Pmax is the maximum load applied by the jack. The modulus of rigidity G (modulus of elasticity in shear) is
obtained by:
G ¼ s1=3
c1=3ð5Þ
where s1/3 is the shear stress for a load of 1/3 of the maximum load Pmax and c1/3 is the correspondi ng shear strain.
This issue is further analyzed by using the semi-inverse method used in Strength of Materials. Some plausible hypotheses are used to characterize the stress field inside a homogenous panel under diagonal compression , and based on those hypotheses the shear stress in the wall is related to the applied load. The hypotheses regarding the stress field are the following: for square specimens (h � h) it is admitted that at the horizontal diagonal , perpendicul ar to the load, (i) the vertical component of the stresses rv are equal to the applied load divided by the area, Eq. (6), and (ii) the stress vec- tor is in the direction from each point located at a horizontal distance x from the center of the panel to the top corner where the load is ap- plied, as shown in Fig. 6a, leading to the relation of the horizontal rh(x) and vertical rv components of the stress as defined in Eq. (7).
rv ¼P
hffiffiffi2p� t
ð6Þ
rhðxÞrv
¼ x
hffiffiffi2p
=2ð7Þ
Therefore, at each point of the horizontal diagonal , the horizon- tal component of the stress (outwards) due to each of the applied forces P (at top and bottom of the specimen) is:
rhðxÞ ¼ Px
h2tð8Þ
The total horizontal force N(x), due to both P forces, generate dat a length dx of the diagonal is:
NðxÞ ¼ 2rhðxÞtdx ¼ 2Px
h2 dx ð9Þ
Assumin g that this force spreads at 45 �, at the vertical diagonal it spreads along a length of 2x (Fig. 6b). Therefore the horizontal tensile stress rH(x) in this zone of the vertical axis would be:
rHðxÞ ¼NðxÞ2xt¼ P
h2tdx ð10Þ
Therefore at the intersection of the diagonals, where the tensile stress is higher, triggering cracking and rupture, the total tensile stress rt can be obtained by the sum of the contributions on each part of the horizontal diagonal, as follows:
Fig. 3. Loading shoe.
Fig. 4. Test setup for diagonal compression test (dimensions in [cm]). A – Hydraulic jack, B – load cell, C – loading shoes and D – masonry panel.
J. Milosevic et al. / Engineering Structures 52 (2013) 581–591 583

Author's personal copy
rt ¼Z h
ffiffi2p
=2
0rHðxÞ ¼
Z hffiffi2p
=2
0
P
h2tdx ¼ Pffiffiffi
2p
ht¼ rv ð11Þ
In this case the Mohr’s circle is centered in the origin in the Cartesian system of axis and the value of the shear stress s is equal to the principal tensile stress rt, as shown in Fig. 7.
s ¼ rv ð12Þ
Therefore, from Eqs. (6) and (12) the following expression is obtained
s ¼ rv ¼P
hffiffiffi2p� t¼ 0:707� P
Anð13Þ
The methodology adopted in this work leads to the expression proposed by ASTM [5]. The experiments described in the next sec- tion confirm that the crack developmen t at the panels effectively started at the center of the panel. Apparently this result is on the safe side as the value of s derived in this way is the one associated with the initiation of cracking at the center of the panels, and at this situation the applied load was still slightly below the ultimate.
However , for non-homogenous masonry panels tested by diag- onal compression some authors have recently proposed alternative equation s to estimate the tensile strength ft.
Brignolla et al. [9] modeled numerically diagonal compress ion tests and concluded that for irregular masonry panels, which are the current case, the predictio n of tensile strength from the ASTM approach is unconservative . A new formula for the evaluation of the tensile strength of masonry based on the diagonal compress ion test was then proposed :
ft ¼a� P
Anð14Þ
where a is a coefficient dependent on masonry typology. For irreg- ular masonry the suggeste d value is a = 0.35. The ASTM approach corresp onds to a = 0.707 whereas for the RILEM standard [18] a isequal to 0.5.
Fig. 5. Transducers position: (a) panel front side and (b) panel back side (dimensions in [cm]).
Fig. 6. Internal stresses on the specimens.
Fig. 7. Mohr’s circle at the center of the specimen.
584 J. Milosevic et al. / Engineering Structures 52 (2013) 581–591

Author's personal copy
4. Experimental results
As already mentioned , the four masonry panels were con- structed using two types of mortar, one based on hydraulic lime (panels W1 and W4) and the other based on air lime (panels W2 and W3). The diagonal compress ion tests on the four rubble masonry panels were characterized by similar failure patterns, as presented in Fig. 8. In all tests a main crack developed at the center of the panels, propagated along the vertical towards the upper and bottom corners of the panel and caused the collapse. This crack developed through the mortar with no damage on the stones and divided the panel in two almost symmetrical parts.
The panels collapse was fragile in all cases but, due to the mor- tars mechanical properties, the panels showed different behaviors at collapse. The air lime mortar panels, W2 and W3, disintegrated at collapse whereas in the case of hydraulic mortar panels, W1 and W4, each of the two broken parts remained almost in one piece (Fig. 9).
4.1. Masonry panels with hydraulic lime mortar
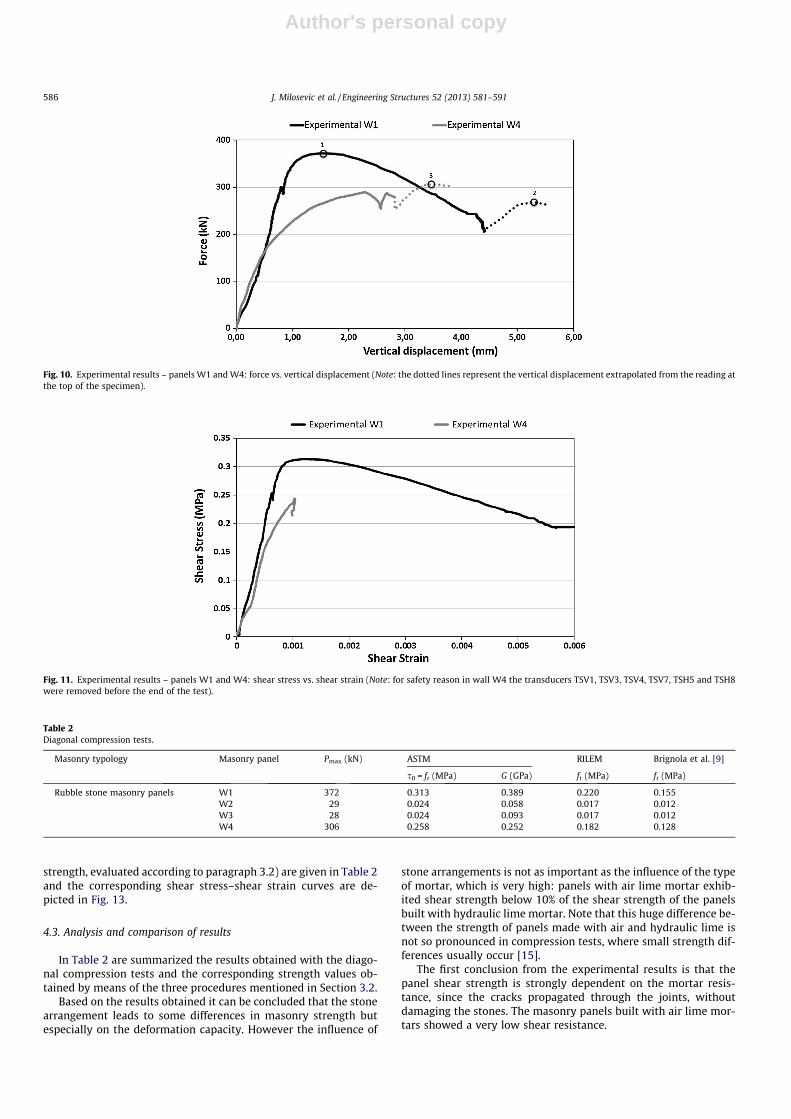
The experimental results for the diagonal compression tests on the hydraulic lime mortar panels are depicted on Fig. 10 , where the load-vertical displacemen t diagram is represented, (verticaldisplacemen t represents the average value of the measurements recorded using LVDTs 3 and 7). As it is shown on this graphic the maximum load for panel W1 was 372 kN (Point 1), with a vertical shortening of 1.55 mm. The collapse occurred later, with a vertical shortening of 5.29 mm and a load of 268 kN (Point 2). In panel W4 the maximum load applied was at the point of collapse, with amagnitude of 306 kN (Point 3) and a vertical displacemen t of 3.47 mm. It is worth noting, that this apparent ‘‘ductile’’ behavior of panel W1 is related to the stone arrangement, since the panel W1 was built with horizontal stone layers, (at 45 � to the external inclined surfaces), whereas the other three panels were built with diagonal layers (45�), to be representative of the real masonry walls.
It is worth to note that, for safety reasons, all transducers (except the transducer placed under the hydraulic jack) were re- moved before the end of the test. The dotted parts of the curves in Fig. 10 were obtained using the measure ments of the transduc- ers under the hydraulic jack, instead of the averages values of the two measureme nts.
The behavior of the tested panels can also be analyzed in terms of shear stress–shear strain curves, as presente d in Fig. 11 , where the shear stress and shear strain were calculated accordin g to ASTM standard [5]. The shear strength, the modulus of rigidity
and the tensile strength of panels from diagonal compression test, evaluated according to Section 3.2, are presented in Table 2.
4.2. Masonry panels with air lime mortar
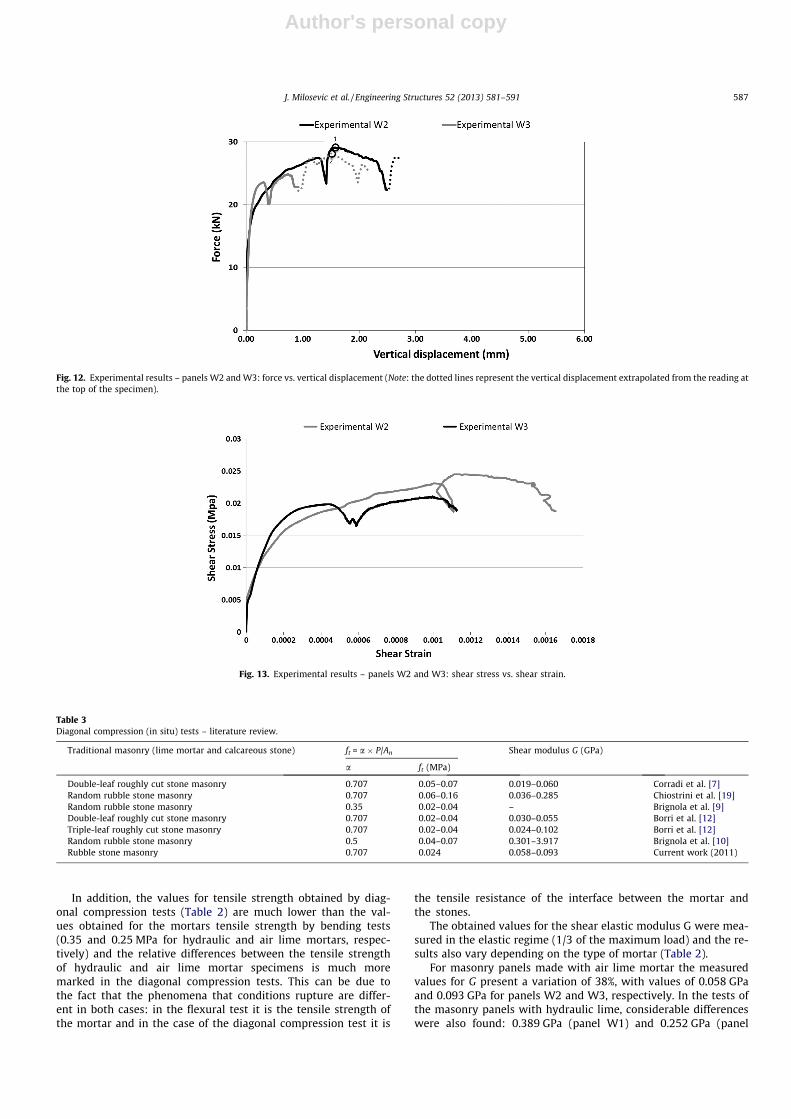
The masonry panels built with air lime mortar showed much lower strength and deformation capacity than the hydraulic mor- tar panels. Collapse load for panel W2 was 29 kN (Point 1), with a vertical shortenin g of 1.58 mm, as it is shown in Fig. 12 , and for panel W3 was 28 kN (Point 2), with a vertical displacement of 1.52 mm, where the vertical displacemen t were obtained as aver- age values of the measurements recorded using LVDTs 3 and 7for both panels.
As in the previous case, the transducers were removed before the end of the test (except the transduc er that was placed under the hydraulic jack) and the dotted part of the lines in Fig. 12 wereobtained using the measureme nt of the transducers under the hydraulic jack.
The similarity of these results, on panels W2 and W3 with the same stone arrangement, and the difference between the previous results, on panels W1 and W4 with different stone arrangem ents, show that the different stone arrangements lead to different strengths and very different deformation capacitie s on masonry panels.
The results of the diagonal compression tests in masonry panels W2 and W3 (shear strength, modulus of rigidity and tensile
Fig. 8. Main crack at the middle of the panels before rupture: (a) and (d) panels made with hydraulic mortar (W1 and W4); (b) and (c) panels made with air lime mortar (W2and W3).
Fig. 9. Collapse of masonry panels: (a) panel W1 made with hydraulic mortar; and (b) panel W3 made with air lime mortar.
J. Milosevic et al. / Engineering Structures 52 (2013) 581–591 585
Author's personal copy
strength, evaluated according to paragraph 3.2) are given in Table 2and the correspondi ng shear stress–shear strain curves are de- picted in Fig. 13 .
4.3. Analysis and comparison of results
In Table 2 are summarized the results obtained with the diago- nal compression tests and the correspondi ng strength values ob- tained by means of the three procedures mentioned in Section 3.2.
Based on the results obtained it can be concluded that the stone arrangement leads to some differenc es in masonry strength but especially on the deformation capacity. However the influence of
stone arrangements is not as important as the influence of the type of mortar, which is very high: panels with air lime mortar exhib- ited shear strength below 10% of the shear strength of the panels built with hydraulic lime mortar. Note that this huge difference be- tween the strength of panels made with air and hydraulic lime is not so pronounced in compression tests, where small strength dif- ferences usually occur [15].
The first conclusion from the experimental results is that the panel shear strength is strongly dependent on the mortar resis- tance, since the cracks propagated through the joints, without damagin g the stones. The masonry panels built with air lime mor- tars showed a very low shear resistance.
Fig. 10. Experimental results – panels W1 and W4: force vs. vertical displacement (Note: the dotted lines represent the vertical displacement extrapolated from the reading at the top of the specimen).
Fig. 11. Experimental results – panels W1 and W4: shear stress vs. shear strain (Note: for safety reason in wall W4 the transducers TSV1, TSV3, TSV4, TSV7, TSH5 and TSH8 were removed before the end of the test).
Table 2Diagonal compression tests.
Masonry typology Masonry panel Pmax (kN) ASTM RILEM Brignola et al. [9]
s0 = ft (MPa) G (GPa) ft (MPa) ft (MPa)
Rubble stone masonry panels W1 372 0.313 0.389 0.220 0.155 W2 29 0.024 0.058 0.017 0.012 W3 28 0.024 0.093 0.017 0.012 W4 306 0.258 0.252 0.182 0.128
586 J. Milosevic et al. / Engineering Structures 52 (2013) 581–591
Author's personal copy
In addition, the values for tensile strength obtained by diag- onal compression tests (Table 2) are much lower than the val- ues obtained for the mortars tensile strength by bending tests (0.35 and 0.25 MPa for hydraulic and air lime mortars, respec- tively) and the relative differenc es between the tensile strength of hydraulic and air lime mortar specimens is much more marked in the diagonal compression tests. This can be due to the fact that the phenomena that conditions rupture are differ- ent in both cases: in the flexural test it is the tensile strength of the mortar and in the case of the diagonal compression test it is
the tensile resistance of the interface between the mortar and the stones.
The obtained values for the shear elastic modulus G were mea- sured in the elastic regime (1/3 of the maximum load) and the re- sults also vary depending on the type of mortar (Table 2).
For masonry panels made with air lime mortar the measure dvalues for G present a variation of 38%, with values of 0.058 GPa and 0.093 GPa for panels W2 and W3, respectively . In the tests of the masonry panels with hydraulic lime, considerabl e differenc es were also found: 0.389 GPa (panel W1) and 0.252 GPa (panel
Fig. 12. Experimental results – panels W2 and W3: force vs. vertical displacement (Note: the dotted lines represent the vertical displacement extrapolated from the reading at the top of the specimen).
Fig. 13. Experimental results – panels W2 and W3: shear stress vs. shear strain.
Table 3Diagonal compression (in situ) tests – literature review.
Traditional masonry (lime mortar and calcareous stone) ft = a � P/An Shear modulus G (GPa)
a ft (MPa)
Double-leaf roughly cut stone masonry 0.707 0.05–0.07 0.019–0.060 Corradi et al. [7]Random rubble stone masonry 0.707 0.06–0.16 0.036–0.285 Chiostrini et al. [19]Random rubble stone masonry 0.35 0.02–0.04 – Brignola et al. [9]Double-leaf roughly cut stone masonry 0.707 0.02–0.04 0.030–0.055 Borri et al. [12]Triple-leaf roughly cut stone masonry 0.707 0.02–0.04 0.024–0.102 Borri et al. [12]Random rubble stone masonry 0.5 0.04–0.07 0.301–3.917 Brignola et al. [10]Rubble stone masonry 0.707 0.024 0.058–0.093 Current work (2011)
J. Milosevic et al. / Engineering Structures 52 (2013) 581–591 587

Author's personal copy
W4), which is explainable by the stone arrangement of the ma- sonry panel W1, built with horizontal layers.
The masonry panels made with air lime mortar showed a shear elastic modulus smaller than the shear elastic modulus obtained for the panel made with hydraulic lime mortar. However, the dif- ference in relative terms is smaller than the difference obtained in the shear strength, which is explained by the fact that shear modulus G is evaluated on the undamaged panel with small dis- placements , where measureme nt errors may have an important influence.
Table 3 summari zes some selected results which were already published in the literature referring to the shear strength and shear modulus by other experimental campaign s where diagonal com- pression tests were also performed. It can be noticed, that the val- ues of the shear strength for air lime mortar and shear modulus obtained in the current experimental research are compara ble with the values from the literature.
It is worth note that most experimental results available in the literature indicate values of the masonry shear strength above the ones derived in the experimental campaign described in this paper using the ASTM proposed formulae, based on the value a = 0.707. This points to the fact that this methodology yields acceptab le con- servative results for the shear strength, the alternatives being even more conservative.
5. Numerical modeling
Experimental tests provide values for mechanical parameters, but those values cannot be directly used in numerical modeling. A calibration process should be done in order to validate the values adopted for the mechanical parameters as well as the numerica lmodels. This calibration process is particularly important when nonlinear material behavior is to be simulated, which is often the case of seismic structural studies on old masonry buildings [20].
There is little informat ion about old masonry buildings mechanical parameters, but even less with regard to its use in numerical models. In the present work two types of numerical models were built to simulate the diagonal compression tests de- scribed in previous paragraphs: nonlinear finite element models [13] and distinct element models [14].
In the finite element models the cracking of masonry (the most important source of non-linear behavior) was simulated by asmeared crack approach . In the case of rubble stone masonry walls, where the location of potential cracks cannot be defined in ad- vance, a smeared model seems to be preferable and more applica- ble for engineering practice than a distinct crack approach. However, it should be noticed that when the complete material degradation is to be modeled, smeared crack models are more unstable than distinct crack models.
The distinct elements method was primary develope d for rock mechanics, but its numerical robustness and its propertie s, namely in the simulatio n of the interactio n between elements (or blocks),make the method also attractive for modeling masonry structure s. The distinct element method allows the explicit modeling of stones and mortar joints, with displacemen ts and rotations of the individ- ual blocks, and, thus, the simulatio n of masonry panel’s failure mechanism s. The use of Voronoi algorithm [21] for elements (blocks) generation allowed reproducing the arbitrary stone arrangements in the masonry panels and made possible the use of distinct element method for rubble stone masonry panels.
5.1. Nonlinear finite element model
The adopted methodology for modeling the masonry panels by the finite element method required the use of nonlinear models to
simulate the masonry non tension resistance. A smeared crack model (Total Strain Crack Model – [13]) based on a fixed stress–strain concept was used. In this model the stress–strain relations are evaluated in a local coordinate system which is fixed upon cracking. In others words, the crack orientation is kept constant during the whole computati on process, which is physically realistic in the current case of study. Nonlinea r geometric effects were not considered in the numerica l simulations and eight-node isopara- metric plane stress elements were used in the mesh generation (Fig. 14 ).
The smeared crack models are defined through the combination of three factors: (1) a tension cut-off failure criterion (constant or linear), (2) the shear transfer through the crack (total, constant or variable shear retention) and (3) the material softening behavior (brittle, linear, multilinear or non-linear). In the present work aconstant tension cut-off criterion was used together with an expo- nential constituti ve law for the softening behavior. For the shear behavior it was adopted constant shear retention (where the shear stiffness was reduced in the crack surface to 10% after cracking)and for the compressive behavior an elastic linear constitutive law was used.
The finite elements mechanical properties for both type of pan- els, namely the density q, Young modulus E, Poisson’s ratio m, ten- sile strength ft, fracture energy Gf1 and shear retention factor b, are presente d in Table 4. For density, Poisson’s ratio and fracture en- ergy typical values adopted in other numerical works [4,22–24]were considered.
For the shear retention factor, a parameter associate d with the shear transference across cracks, the used value was obtained by calibration of the experimental and numerical results. The adopted value (b = 0.1) is a current value used in the simulation of the cracked plain concrete behavior, but is slightly larger than the va- lue used by Rots et al. [22] and Ramos and Lourenço [23]. However the adopted value is coherent with the experimental evidence where the interlocking of the stones allows to an important shear transfere nce after crack occurrence.
The Young’s modulus and tensile strength were also quantifiedby calibration of the numerica l and experimental results. With
Fig. 14. Finite element model mesh.
Table 4Mechanical properties for numerical analysis with finite eleme nt method .
Masonry panel
Density q (kg/m3)
Young modulus E (GPa)
Poisson’s ratio m
Tensile strength ft (MPa)
Fracture energy Gf1
(Nmm/mm 2)
Shear retention factor b
W4 1835 3.27 0.20 0.15 0.1 0.1 W2 1835 3.27 0.20 0.01 0.1 0.1
588 J. Milosevic et al. / Engineering Structures 52 (2013) 581–591
Author's personal copy
those results, which are not far from the typical values, a good match was obtained.
The vertical load was applied monotonically at the top of the panel, as in the experiments , and a displacement controlle d proce- dure was applied to impose the load up to failure, using the regular Newton–Raphson iteration procedure.
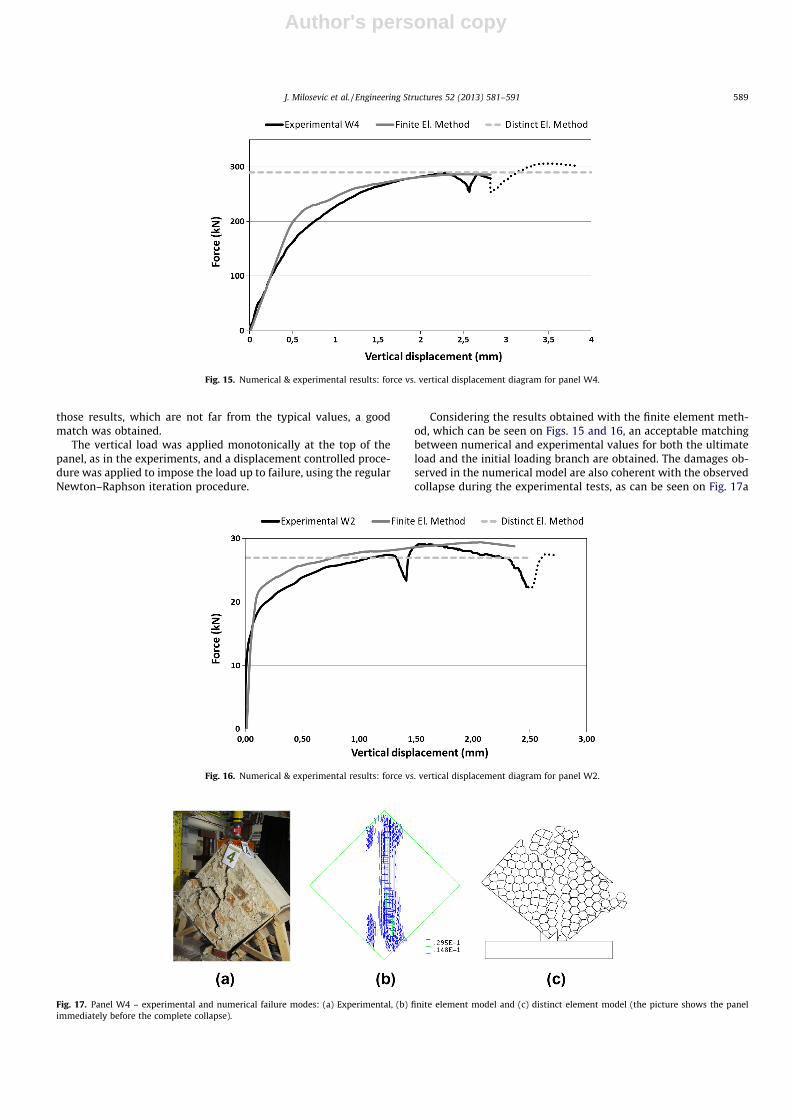
Consideri ng the results obtained with the finite element meth- od, which can be seen on Figs. 15 and 16 , an acceptable matching between numerical and experime ntal values for both the ultimate load and the initial loading branch are obtained. The damages ob- served in the numerical model are also coherent with the observed collapse during the experimental tests, as can be seen on Fig. 17 a
Fig. 15. Numerical & experimental results: force vs. vertical displacement diagram for panel W4.
Fig. 16. Numerical & experimental results: force vs. vertical displacement diagram for panel W2.
Fig. 17. Panel W4 – experimental and numerical failure modes: (a) Experimental, (b) finite element model and (c) distinct element model (the picture shows the panel immediately before the complete collapse).
J. Milosevic et al. / Engineering Structures 52 (2013) 581–591 589
Author's personal copy
and b for hydraulic lime mortar and Fig. 18 a and b for air lime mor- tar. Figs. 15 and 16 also show the ultimate load obtained by the distinct element method referred in Section 5.2.
5.2. Distinct element model
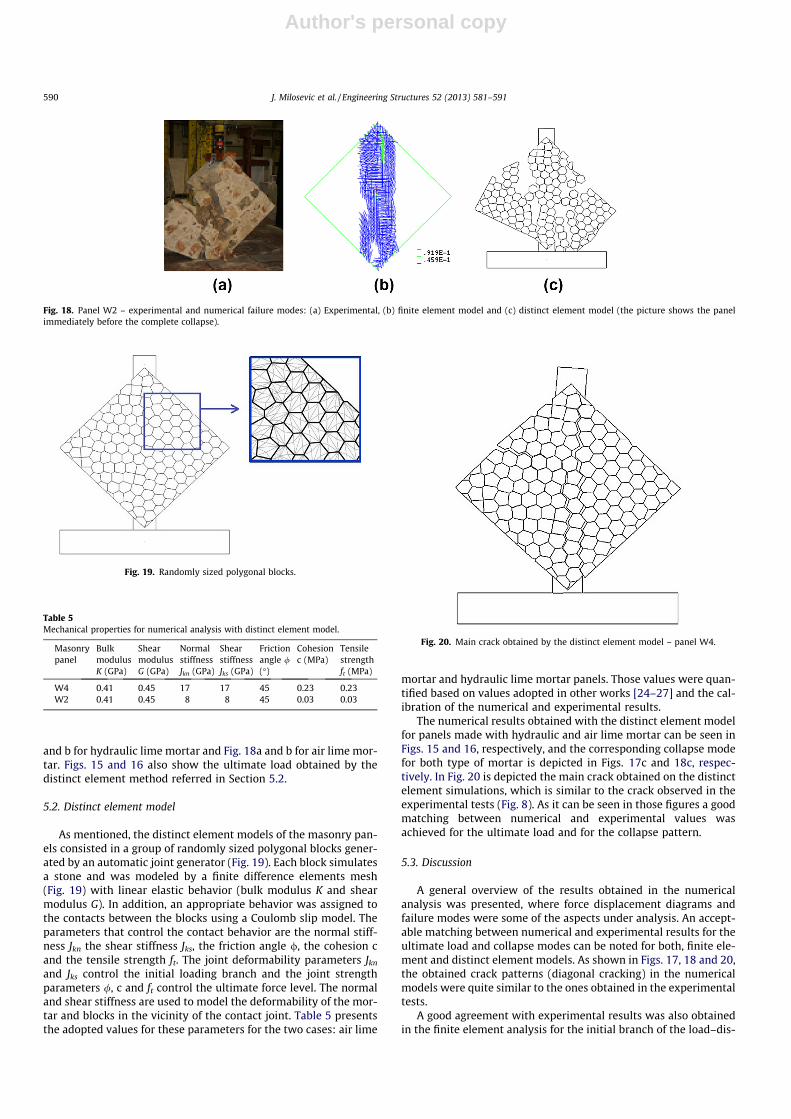
As mentioned, the distinct element models of the masonry pan- els consisted in a group of randomly sized polygonal blocks gener- ated by an automatic joint generator (Fig. 19 ). Each block simulates a stone and was modeled by a finite difference elements mesh (Fig. 19 ) with linear elastic behavior (bulk modulus K and shear modulus G). In addition, an appropriate behavior was assigned to the contacts between the blocks using a Coulomb slip model. The parameters that control the contact behavior are the normal stiff- ness Jkn the shear stiffness Jks, the friction angle /, the cohesion cand the tensile strength ft. The joint deformab ility paramete rs Jkn
and Jks control the initial loading branch and the joint strength parameters /, c and ft control the ultimate force level. The normal and shear stiffness are used to model the deformabili ty of the mor- tar and blocks in the vicinity of the contact joint. Table 5 presentsthe adopted values for these parameters for the two cases: air lime
mortar and hydraulic lime mortar panels. Those values were quan- tified based on values adopted in other works [24–27] and the cal- ibration of the numerical and experime ntal results.
The numerical results obtained with the distinct element model for panels made with hydraulic and air lime mortar can be seen in Figs. 15 and 16 , respectively, and the correspondi ng collapse mode for both type of mortar is depicted in Figs. 17c and 18c, respec- tively. In Fig. 20 is depicted the main crack obtained on the distinct element simulations, which is similar to the crack observed in the experime ntal tests (Fig. 8). As it can be seen in those figures a good matching between numerica l and experimental values was achieved for the ultimate load and for the collapse pattern.
5.3. Discussio n
A general overview of the results obtained in the numerical analysis was presente d, where force displacement diagrams and failure modes were some of the aspects under analysis. An accept- able matching between numerical and experimental results for the ultimate load and collapse modes can be noted for both, finite ele- ment and distinct element models. As shown in Figs. 17, 18 and 20 ,the obtained crack patterns (diagonal cracking) in the numerica lmodels were quite similar to the ones obtained in the experime ntal tests.
A good agreement with experime ntal results was also obtained in the finite element analysis for the initial branch of the load–dis-
Fig. 18. Panel W2 – experimental and numerical failure modes: (a) Experimental, (b) finite element model and (c) distinct element model (the picture shows the panel immediately before the complete collapse).
Fig. 19. Randomly sized polygonal blocks.
Table 5Mechanical properties for numerical analysis with distinct element model.
Masonry panel
Bulk modulus K (GPa)
Shear modulus G (GPa)
Normal stiffness Jkn (GPa)
Shear stiffness Jks (GPa)
Friction angle /(�)
Cohesion c (MPa)
Tensile strength ft (MPa)
W4 0.41 0.45 17 17 45 0.23 0.23 W2 0.41 0.45 8 8 45 0.03 0.03
Fig. 20. Main crack obtained by the distinct element model – panel W4.
590 J. Milosevic et al. / Engineering Structures 52 (2013) 581–591
Author's personal copy
placement curve. In the distinct element analysis this curve cannot be obtained directly (since equilibrium is established for full loads and not at load increments), which represents a clear advantage of the finite element method. However, modeling with finite element models was much more demanding in the sense that the numerical convergence required a continuous review of the convergence criteria.
Since the location of the potential cracks are unknown in rubble stone masonry, the smeared crack approach is more appropriate for modeling large rubble stone masonry panels than the distinct crack approach or the distinct element method. However, the use of the Voronoi algorithm to randomly generate the blocks in the distinct element model allows the use of a distinct methodol ogy in a smeared sense.
6. Conclusions
For the structura l assessment of old buildings with load bearing masonry walls and for the eventual design of strengthening solu- tions it is required an accurate simulation of its structura l behavior. For this it is essential to know the materials mechanical character- istics, which is not always possible due to the lack of experimental data. For the seismic assessment, where the shear behavior of ma- sonry walls is an extremely important aspect, the difficulties are even greater because there are very few data on the shear strength of rubble stone masonry walls. This work aims to contribute to fillthis gap, evaluating of the shear strength for traditional rubble stone masonry panels via diagonal compression tests.
Masonry panels were specially built for the experimental pro- gram using materials and the techniques similar to what was used in old buildings. Four 1.20 m � 1.20 m � 0.7 m panels were built and tested – two with air lime mortar and two with hydraulic lime mortar.
The tested masonry panels showed a fragile behavior with low values of shear strength, especiall y in the case of the models made with air lime mortar (s0,ASTM = 0.024 MPa), as the panels with hydraulic mortar reached s0,ASTM = 0.313 MPa and s0,ASTM = 0.258 -MPa. It was noted that the mortar compositi on (air or hydraulic lime) has an important influence on shear strength. The tests showed also that an appropriate stone arrangement can increase the ductility of the panel. It can be noticed that the experimental results for shear strength obtained for panels with air lime mortar and calculated according to the ASTM procedure (s0,ASTM = 0.024 -MPa) are close to the values of the Italian’s Standard [28](s0 = 0.02 MPa to 0.032 MPa).
The tests were numerically simulated by nonlinear finite ele- ments models (smeared crack concept) and distinct elements mod- els, which demonstrat ed their ability to simulate the masonry behavior in shear. Both numerica l procedures gave results with agood matching to the experimental results and the collapse pat- terns were similar to the experimental ones. With the finite ele- ments models the complete load–displacement curve was obtained, whereas with the distinct element method only the max- imum applied load can be achieved. However , it must be noted that in order to obtain convergence in all analysis steps, the finiteelement models required much more attention from the operator than in case of distinct elements models. The simulatio n of rubble stone masonry panels by the distinct element method was achieved due to the use of the Voronoi algorithm in the blocks generation.
Acknowled gments
The authors acknowledge the financial contributi on of the FCT (Fundação para a Ciência e a Tecnologia ) project SEVERES: ‘‘Seismic
Vulnerabi lity of Old Masonry Buildings ’’. The work was carried out at the Instituto de Engenharia de Estruturas , Território e Construção(ICIST), using the laboratory and computational facilities of the Department of Civil Engineeri ng, Architecture and Georesouces of Instituto Superior Técnico (IST) in Lisbon, Portugal.
References
[1] ICOMOS: recommendations for the analysis, conservation and structural restoration of architectural heritage. ICOMOS, International scientificcommittee for analysis and restoration of structures of architectural heritage; 2003.
[2] Cardoso R, Lopes ML, Bento R. Seismic evaluation of old masonry buildings. Part I: Method description and application to a case-study. Eng Struct 2005;27:2024–35.
[3] Bento R, Lopes ML, Cardoso R. Seismic evaluation of old masonry buildings. Part II: Analysis of strengthening solutions. Eng Struct 2005;27:2014–23.
[4] Mendes N, Lourenço PB. Seismic assessment of masonry ‘‘Gaioleiro’’ buildings in Lisbon, Portugal. J Earthq Eng 2010;14:80–101.
[5] ASTM: ASTM E 519-02 standard test method for diagonal tension (Shear) in masonry assemblages. ASTM International, West Conshohocken, PA; 2002.
[6] Corradi M, Borri A, Vignoli A. Strengthening techniques tested on masonry structures struck by the Umbria-Marche earthquake of 1997–1998. Constr Build Mater 2002;16:229–39.
[7] Corradi M, Borri A, Vignoli A. Experimental study on the determination of strength of masonry walls. Constr Build Mater 2003;17:325–37.
[8] Corradi M, Tedeschi C, Binda L, Borri A. Experimental evaluation of shear and compression strength of masonry wall before and after reinforcement: deep repointing. Constr Build Mater 2008;22:463–72.
[9] Brignola A, Frumento S, Lagomarsino S, Podestà S. Identification of shear parameters of masonry panels through the in-situ diagonal compression test. Int J Archit Heritage 2008;3:52–73.
[10] Brignola A, Podestà S, Lagomarsino S. Experimental results of shear strength and stiffness of existing masonry walls. New Delhi: Structural Analysis of Historical Constructions; 2006.
[11] Borri A, Castori G, Corradi M. Shear behavior of masonry panels strengthened by high strength steel cords. Constr Build Mater 2010;22:463–72.
[12] Borri A, Castori G, Corradi M, Speranzini E. Shear behaviour of unreinforced and reinforced masonry panels subjected to in situ diagonal compression tests. Constr Build Mater 2011;25:4403–14.
[13] DIANA: DIsplacement method ANAlyser, release 9.1 [CD–ROM]. Delft, The Netherlands: TNO DIANA BV; 2005.
[14] ITASCA: UDEC version 4.01 – User’s guide. Itasca Consulting Group, Inc., Minneapolis, USA; 2011.
[15] Carvalho J. Mechanical characterization of loadbearing masonry stone through non-destructive testing. Master’s thesis, Instituto Superior Técnico, Lisbon; 2008 [in Portuguese].
[16] CEN: 1015-11, 1999. Methods of test for mortar for masonry – Part 11: Determination of flexural and compressive strength of hardened mortar; 1999.
[17] EC 6: Eurocode 6 Design of masonry structures. Part 1 – 1: General rules for buildings – rules for reinforced and unreinforced masonry 1995. ENV 1996-1- 1; 1995.
[18] RILEM TC.: 76-LUM Diagonal tensile strength tests of small wall specimens. In: RILEM, recommendations for the testing and use of constructions materials. London: E& FN SPON; 1994. p. 488–9.
[19] Chiostrini S, Galano L, Vignoli A. On the determination of strength of ancient masonry walls via experimental tests. In: Proceedings of the twelfth world conference on earthquake engineering (CD-ROM), Auckland, New Zealand; 2000. Paper No. 2564.
[20] Lourenço PB. Computations on historic masonry structures. Prog Struct Eng Mater 2002;4–3:301–19.
[21] Klein R. Concrete and abstract voronoi diagrams. Lecture notes in computer science. Springer-Verlag, vol. 200; 1989.
[22] Rots JG, Belletti B, Boonpichetvong M, Invernizzi S. Event by event strategies for modeling amsterdam masonry structures. Structural analysis of historical constructions, New Delhi; 2006.
[23] Ramos LF, Lourenço PB. Advanced numerical analysis of historical centers: acase study in Lisbon. Eng Struct 2004;26:1295–310.
[24] Gago AS. Análise Estrutural de Arcos, Abóbadas e Cúpulas – Contributo para oestudo do património construído (in portuguese), PhD Thesis, Faculty of Engineering, IST-UTL Tecnhical University of Lisbon, Lisbon; 2004. <http://www.civil.ist.utl.pt/~gago/Artigos/tese_PhD_AS Gago.pdf >.
[25] Gago AS, Alfaiate J, Lamas A. The effect of the infill in arched structures: analytical and numerical modeling. Eng Struct 2011;33–5:1450–8.
[26] Azevedo J, Sincraian G, Lemos JV. Seismic behavior of blocky masonry structures. Earthq Spectra 2000;16–2:337–65.
[27] Lemos JV. Discrete element modeling of the seismic behavior of stone masonry arches. In: Pande GN, Middleton J, Kralj B, editors. Computer methods in structural masonry – 4. E & FN Spon, London; 1998. p. 220–7.
[28] NTC08. Ministero delle Infrastrutture e dei Transporti – Nuove Norme Tecniche per le Costruzioni. Italian Ministry of Infrastructures and Transportation, G.U. n.29 – S.O. n.30, February, 4th 2008, Rome, Italy; 2008 [in Italian].
J. Milosevic et al. / Engineering Structures 52 (2013) 581–591 591