Embed Size (px)
Citation preview
1
TESTING AND MODELING OF SEDIMENTATIONBy Randal W. Samstag, P.E., B.C.E.E.
Randal W. Samstag Civil and Sanitary Engineer (CSE)
Sedimentation tanks or clarifiers are crucial components of almost all wastewater treatment
plants (WWTP). Gravity tanks for primary sedimentation are widely recognized as the most
economical means of removal of particulate biochemical oxygen demand and suspended solids
for large plants. Although membrane separation is becoming more economical than in the past,
gravity clarifiers are still the most energy-efficient means of separation of activated sludge
treatment organisms. While use of sedimentation tanks is widespread, it is only recently that
scientific analysis has been applied to optimization of tank design. The design of mixing in
activated sludge aeration tanks can also benefit from a scientific approach to analysis of
sedimentation including testing and multi-dimensional modeling.
The following overview discusses the approach taken by Randal W. Samstag CSE to field
testing and modeling of wastewater sedimentation and aeration tanks to optimize design and
operation. In this discussion, the emphasis is primarily on secondary sedimentation, but the
techniques described here are equally useful for analysis of primary sedimentation and
activated sludge aeration tanks.
FIELD TESTING
It is common for consultants to do “stress testing” of clarifiers. The most common form of this
test is simply to record the effluent suspended solids from the clarifier during a period of high
flow testing. This gives a “black box” picture of the performance of the clarifier, but it does not
provide any information regarding processes beneath the surface of the tank. For that, we need
“glass box” testing and simulation modeling. Why would we want information about processes
below the surface? The answer is that if our interest is to improve the geometry of activated
sludge clarifiers and aeration tanks, the influence of the geometric details beneath the surface is
crucial. What diameter should the feed well be for a given installation? What is the best
configuration for the feed well? How deep should the tanks be? What is the best effluent launder
configuration? How much do these details affect the effluent concentration? How sensitive is the
clarifier to transient loading impacts? What type of mixing in an activated sludge aeration tank is
most efficient? Answers to these questions can be provided, but trustworthy answers can only
be based on detailed modeling validated by field test.
With field test results from an operating clarifier or aeration tank, we can start to answer these
questions. These field data can give us a picture of processes under the surface that can be
used to validate modeling results. The validated model can then be used to investigate the
influence of changes in geometric features on long-term performance.
2
The kinds of tests that can most help with evaluation of sedimentation problems include:
Long column settling tests
Dye tracer testing
Flow pattern / solids distribution tests
Field velocity measurements
The first of these tests provides verification of the settling velocity of the tank feed sludge at the
time of the tests. The second test provides a comparative measure of the overall mixing
characteristic of the tank. As such, this is a “black box” test. The last two tests provide a more
“glass box” evaluation of the performance of the tanks beneath the water surface.
Settling Tests
Settling Velocity Curves
1
10
100
1,000
10,000
0 1,000 2,000 3,000 4,000 5,000 6,000
Initial Concentration (mg/L)
Se
ttlin
gR
ate
(gp
d/s
f)
Generic Formula A, SVI = 225 Generic Formula B, SSV = 225
Generic Formula C, SVI = 200 Generic Formula D, SSV = 200
Plant A, SVI = 225 Plant B, SVI = 225
Plant C, SVI = 200 Plant D, SVI = 200
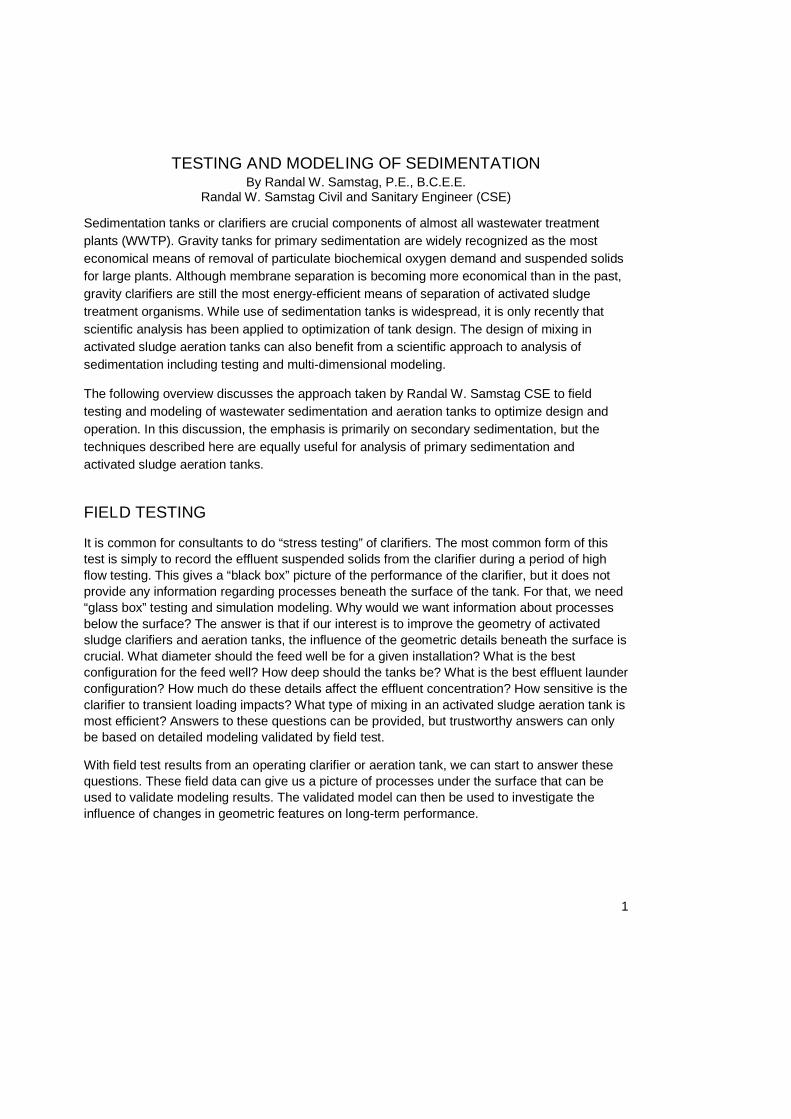
Figure 1 Predicted settling rates from SVI formulas vary widely
Sedimentation is a dynamic, multi-dimensional process. Obvious factors that affect performance
are the flow rate and solids concentration in the tank feed. In addition to these, the three-
dimensional details of the settling tank can dramatically affect performance. It cannot be denied,
however, that the most important factor in sedimentation performance is the settling rate of the
suspended solids in the feed. For activated sludge, the sludge volume index (SVI) is the widely
used measure of the ability of an activated sludge to settle. SVI cannot be used to determine the
capacity of an activated sludge tank directly, but in recent years, empirical formulas have been
developed to approximate settling velocity as a function of SVI. These are useful formula, when
no other data but SVI is available, but actual settling rates can vary significantly from the values
predicted by these generic formulas. Figure 1 shows a comparison of settling rates as a function
of initial suspended solids concentration from a number of different sites, each with
approximately the same SVI. It is seen that for an initial suspended solids concentration of
2,000 mg/L the settling rate from the field tests varied from a minimum of approximately 600
3
gallons per day per square foot (gpd/sf) (1.0 meters per hour – m/h) to a maximum of 2,500
gpd/sf (5 m/h), a factor of five. Comparing settling formulae it is seen that three of the formulae
give similar predictions of settling velocity of approximately 1,000 gpd/sf (1.7 m/h), while the
fourth model predicts a much higher value of approximately 2,000 gpd/sf (3.4 m/h). These
results indicate the extreme variability of settling behavior and the importance of measuring
settling velocity in the field. In practice, filling a clear cylindrical column with activated sludge at
different initial solids concentrations and measuring the settling velocity of the solids interface
layer is crucial for proper characterization of sedimentation behavior. Mr. Samstag has
experience with these measurements from dozens of tests at client WWTP.
Dye Tracer Testing
0
0.2
0.4
0.6
0.8
1
1.2
1.4
0.00 0.50 1.00 1.50 2.00 2.50 3.00 3.50
C/C
o
Experimental Data 12/04/03
N= 1.1Crosby Data
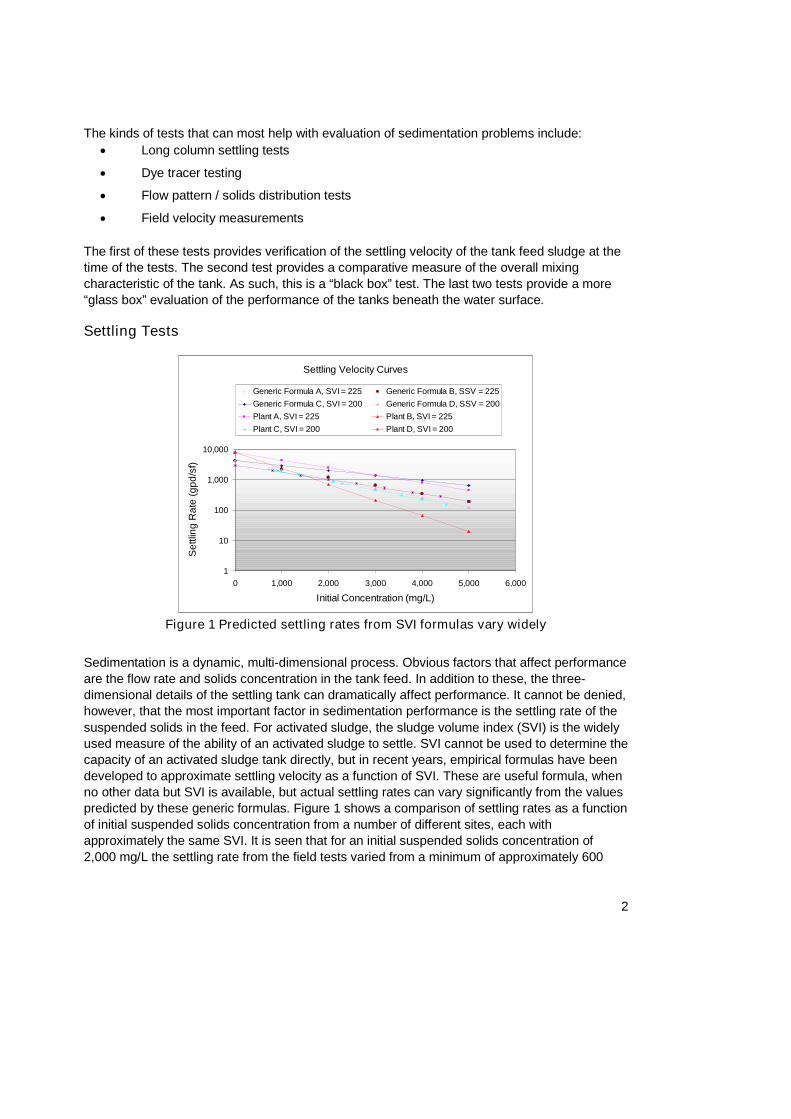
Figure 2 Slug dye test data is used for reference to other tanks and flow balancing
A traditional test for the evaluating the hydraulic performance of sedimentation tanks has been
the dye tracer test. In this test, a slug of dye is added to the inlet to the tank and concentrations
of the dye are measured in the tank effluent until the dye is exhausted. In a completely mixed
tank, the effluent dye concentration will decay from the instantaneous flash mix concentration
continuously over time. For a ideally plug flow tank, the dye will all arrive at the effluent at the
same time at exactly the time for one hydraulic residence time for the tank. Comparison of dye
profiles for tanks of different geometry can be used to give a rough indication of tank
performance. A more plug flow characteristic is generally thought to be desirable for
sedimentation tanks, but most sedimentation tanks exhibit complete mix behavior at high flows.
Figure 2 shows results from a tank tested by Mr. Samstag compared to results measured by
Robert Crosby in a test of a tank with different geometry. The test tank shows a relatively more
4
completely mixed character than the Crosby data. This test is most useful for comparison with
other sites and with older literature, but it can also be used as part of model calibration and
validation. Multi-point tests of this type can be used to diagnose flow distribution problems in
tank effluent launders.
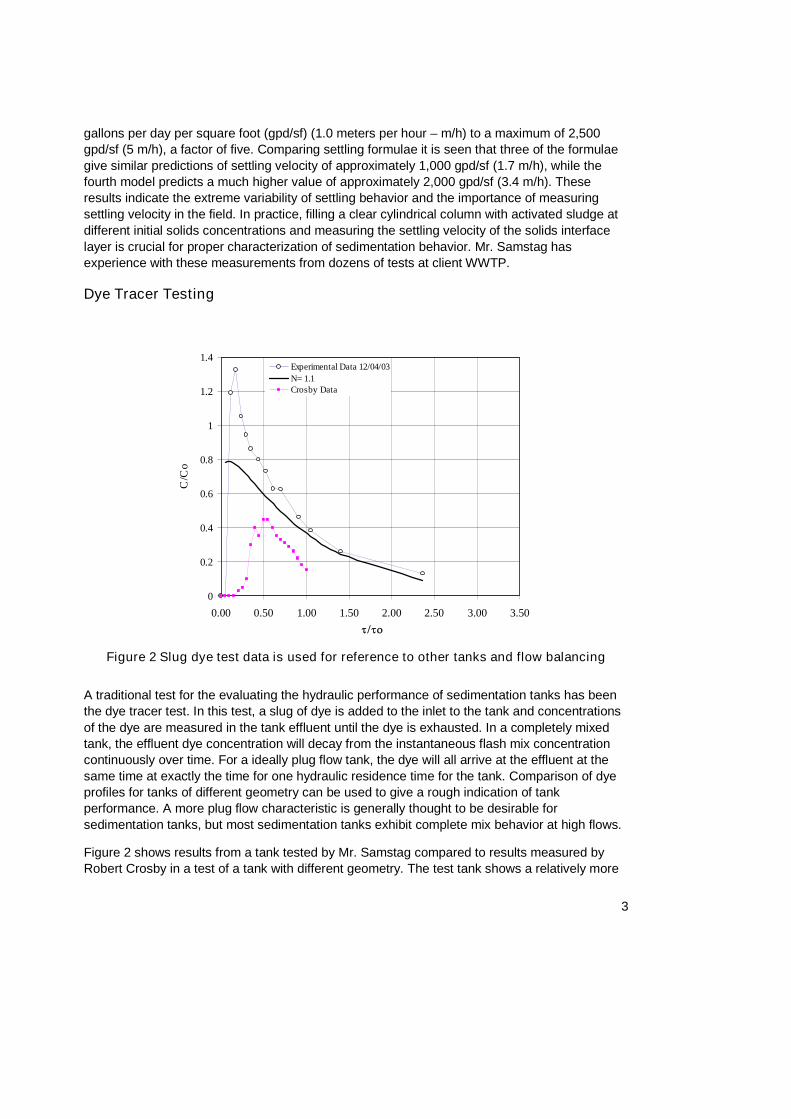
Figure 3 presents results of flow-through dye testing of a four-pass aeration tank. Here the dye
testing found that the residence time distribution (RTD) for the tank was in excess of the RTD
predicted from chlorine contact studies for a tank with a similar length to width ratio. The
conclusion drawn from these tests was that the full-floor, fine bubble aeration system installed in
this aeration tank has the effect of holding up dye transport. It was concluded here that the dye
hold-up was produced by individual circulation cells produced by the aeration diffuser discs. Mr.
Samstag has performed similar RTD testing of tanks with racetrack configuration and of baffled
tanks with internal recirculation. By knowing the hydraulic characteristics of individual tank
configurations we can more realistically model the biological treatment performance of different
tank configurations using tanks-in-series biological treatment models.
COMPARISON OF EXPERIMENTAL DATA AND TANKS IN SERIES
MODEL PREDICTIONS
0.0
0.5
1.0
1.5
2.0
2.5
3.0
3.5
4.0
0.00 50.00 100.00 150.00 200.00 250.00
Time (min)
C/C
Experimental Data Best Fit (N=53) N=30 N=70
Figure 3 Residence time distribution tests from a four-pass aeration tank
5
Flow Pattern / Solids Distribution Tests
Flocculator Skirt
C
2'-10"
2'-10"
2'-10"
2'-10"
2'-10"
20 mg/L
100 mg/L
200 mg/L
300 mg/L
400 mg/L
500 mg/L
600 mg/L
700 mg/L
800 mg/L
900 mg/L
1000 mg/L
1100 mg/L
1200 mg/L
1300 mg/L
1400 mg/L
1500 mg/L
70'
Floor Slope : 1/4":1 ft
MLSS Start = 2590 mg/L
MLSS @ Finish = 2710 mg/L
14' 0"
14'9"
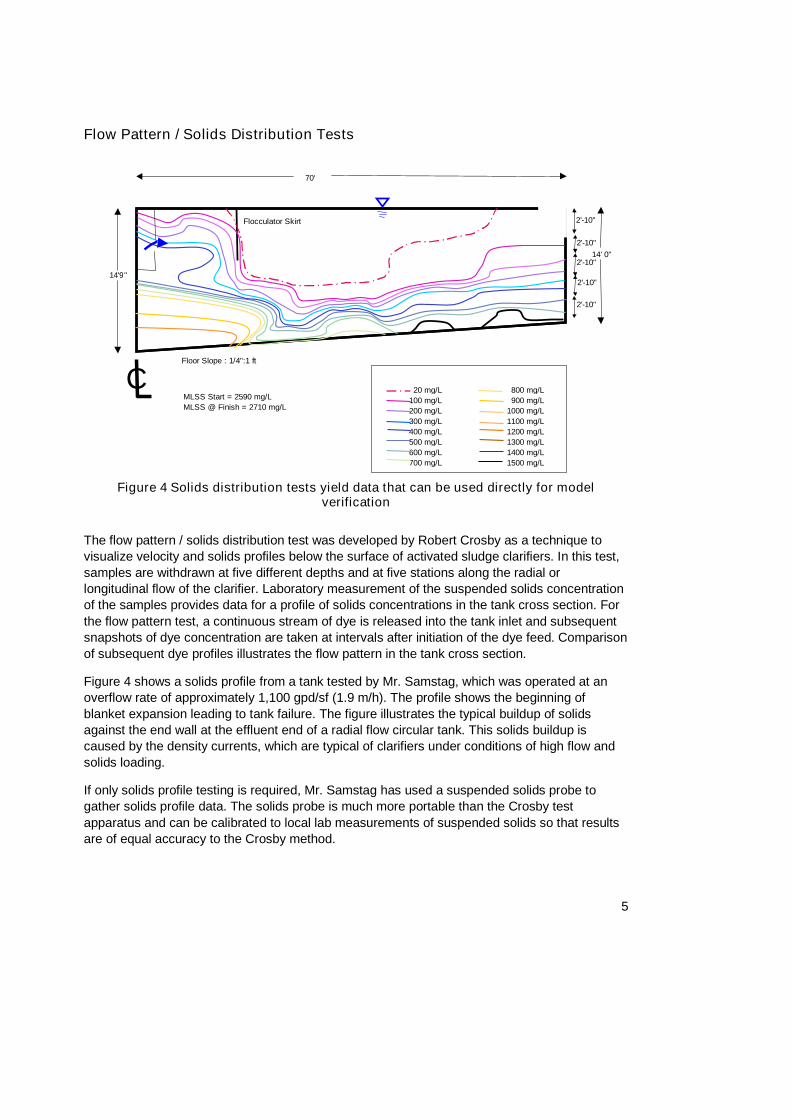
Figure 4 Solids distribution tests yield data that can be used directly for modelverification
The flow pattern / solids distribution test was developed by Robert Crosby as a technique to
visualize velocity and solids profiles below the surface of activated sludge clarifiers. In this test,
samples are withdrawn at five different depths and at five stations along the radial or
longitudinal flow of the clarifier. Laboratory measurement of the suspended solids concentration
of the samples provides data for a profile of solids concentrations in the tank cross section. For
the flow pattern test, a continuous stream of dye is released into the tank inlet and subsequent
snapshots of dye concentration are taken at intervals after initiation of the dye feed. Comparison
of subsequent dye profiles illustrates the flow pattern in the tank cross section.
Figure 4 shows a solids profile from a tank tested by Mr. Samstag, which was operated at an
overflow rate of approximately 1,100 gpd/sf (1.9 m/h). The profile shows the beginning of
blanket expansion leading to tank failure. The figure illustrates the typical buildup of solids
against the end wall at the effluent end of a radial flow circular tank. This solids buildup is
caused by the density currents, which are typical of clarifiers under conditions of high flow and
solids loading.
If only solids profile testing is required, Mr. Samstag has used a suspended solids probe to
gather solids profile data. The solids probe is much more portable than the Crosby test
apparatus and can be calibrated to local lab measurements of suspended solids so that results
are of equal accuracy to the Crosby method.
6
Field Velocity Measurements
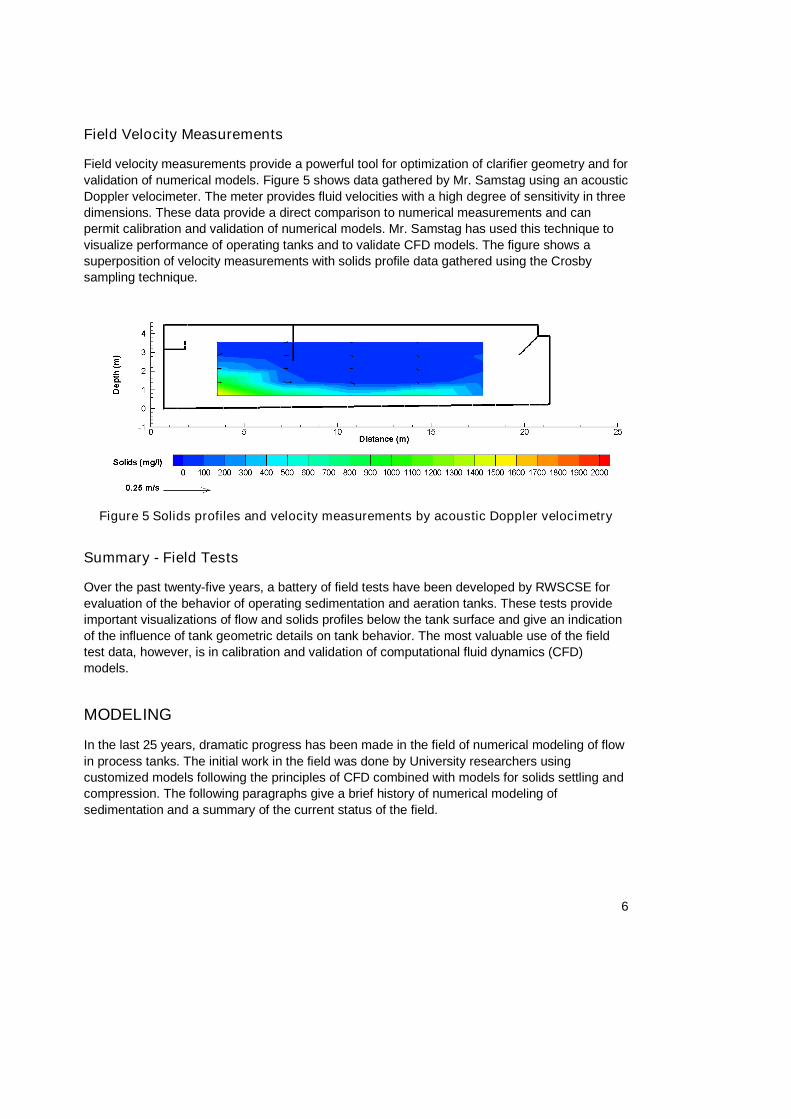
Field velocity measurements provide a powerful tool for optimization of clarifier geometry and for
validation of numerical models. Figure 5 shows data gathered by Mr. Samstag using an acoustic
Doppler velocimeter. The meter provides fluid velocities with a high degree of sensitivity in three
dimensions. These data provide a direct comparison to numerical measurements and can
permit calibration and validation of numerical models. Mr. Samstag has used this technique to
visualize performance of operating tanks and to validate CFD models. The figure shows a
superposition of velocity measurements with solids profile data gathered using the Crosby
sampling technique.
Figure 5 Solids profiles and velocity measurements by acoustic Doppler velocimetry
Summary - Field Tests
Over the past twenty-five years, a battery of field tests have been developed by RWSCSE for
evaluation of the behavior of operating sedimentation and aeration tanks. These tests provide
important visualizations of flow and solids profiles below the tank surface and give an indication
of the influence of tank geometric details on tank behavior. The most valuable use of the field
test data, however, is in calibration and validation of computational fluid dynamics (CFD)
models.
MODELING
In the last 25 years, dramatic progress has been made in the field of numerical modeling of flow
in process tanks. The initial work in the field was done by University researchers using
customized models following the principles of CFD combined with models for solids settling and
compression. The following paragraphs give a brief history of numerical modeling of
sedimentation and a summary of the current status of the field.
7
CFD Modeling History
CFD modeling divides a two or three-dimensional computational field into a discrete grid of cells
or elements and solves the equations of continuity and momentum transport over the field by
finite difference, finite element, or finite volume numerical techniques. This permits prediction of
the velocity field across the computational domain. Once the velocity field has been established,
transport equations for solids concentration can provide predictions of solids distribution.
The first applications of CFD to fluid flow were probably conducted at the Los Alamos
Laboratories during and after the Second World War. Harlow and Welsh developed the marker
and cell (MAC) computer code at Los Alamos. This technique relied on transformation of the
velocity and pressure fields into a vorticity transport equation and a potential equation for the
fluid stream function. This vorticity / stream function technique is efficient only for two-
dimensional domains.
In the decade of the 1970s researchers at Imperial College in London, England developed
computer codes using so-called primitive variables, directly solving for velocity and pressure
fields. A significant breakthrough at Imperial College during this period was the development of
the k-epsilon model for simulation of the effects of turbulence on fluid flow. Since almost all flow
in clarifier tanks is turbulent, this breakthrough permitted more accurate prediction of tank
velocity profiles. The primitive variables technique is directly extendable to three-dimensional
domains and is the basis for almost all current commercial CFD packages.
Sedimentation Tank CFD Modeling
Applications of CFD to the sedimentation problem began in the 1980s by several researchers.
The one researcher who has continued to make significant contributions in this field is J. A.
McCorquodale, now teaching at the University of New Orleans. Beginning in the 1980s,
McCorquodale and his students have developed a series of models for primary and secondary
sedimentation. The earliest models used a vorticity / stream function numerical technique and a
simple solids transport model. These early models were “neutral density.” In other words, they
did not model the effects of density currents in the flow field. As such, these models were
adequate for simulation of the performance of primary sedimentation tanks, where solids
concentrations in the majority of the flow field are relatively low, but they were not able to
accurately characterize performance of activated sludge clarifiers, where density influences are
crucial.
The next development by McCorquodale was to model the effect of solids concentration on the
density profile of the tank and incorporate the influence of the density field on fluid flow. This
density coupling of the momentum and solids transport models permits more realistic modeling
of activated sludge clarifiers, where solids concentrations are high enough to produce
pronounced density-driven effects. The first activated sludge model of this type, developed by
McCorquodale and his student E.M. Yuen at the University of Windsor, fitted the turbulence field
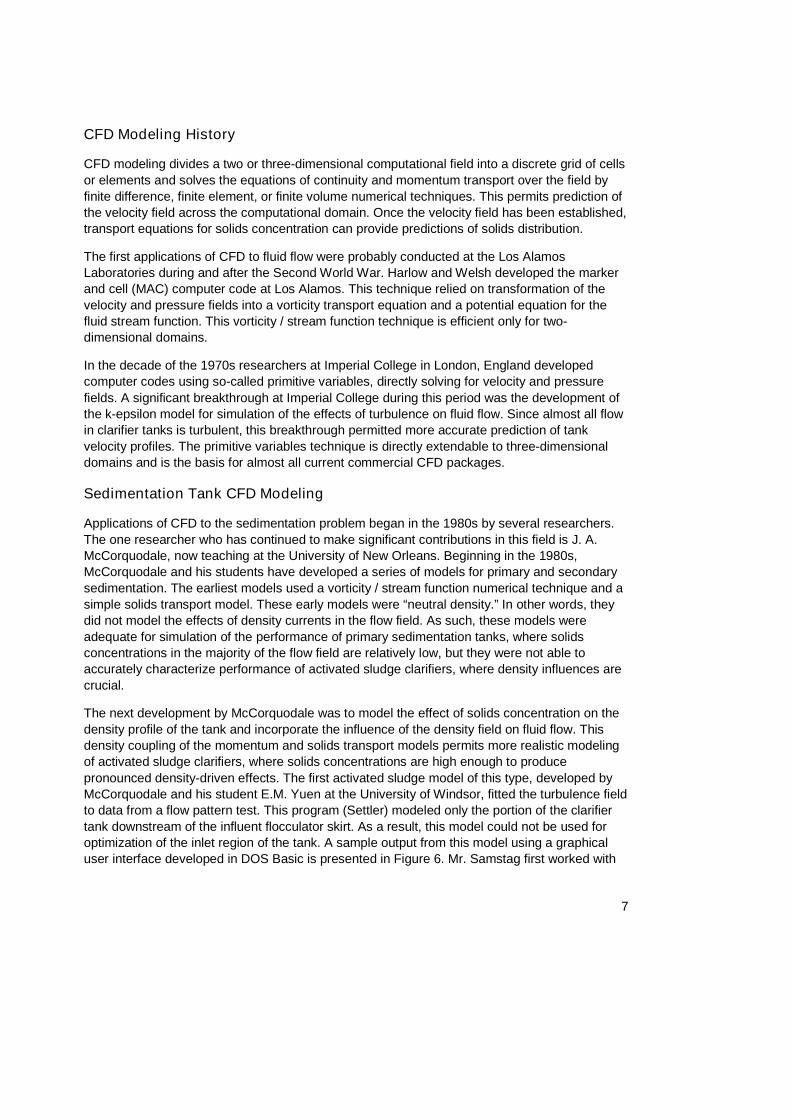
to data from a flow pattern test. This program (Settler) modeled only the portion of the clarifier
tank downstream of the influent flocculator skirt. As a result, this model could not be used for
optimization of the inlet region of the tank. A sample output from this model using a graphical
user interface developed in DOS Basic is presented in Figure 6. Mr. Samstag first worked with
8
Dr. McCorquodale using the Settler model to evaluate the performance of secondary clarifiers
for a major upgrade of a Pacific Northwest WWTP.
Figure 6 Early models did not include inlet conditions
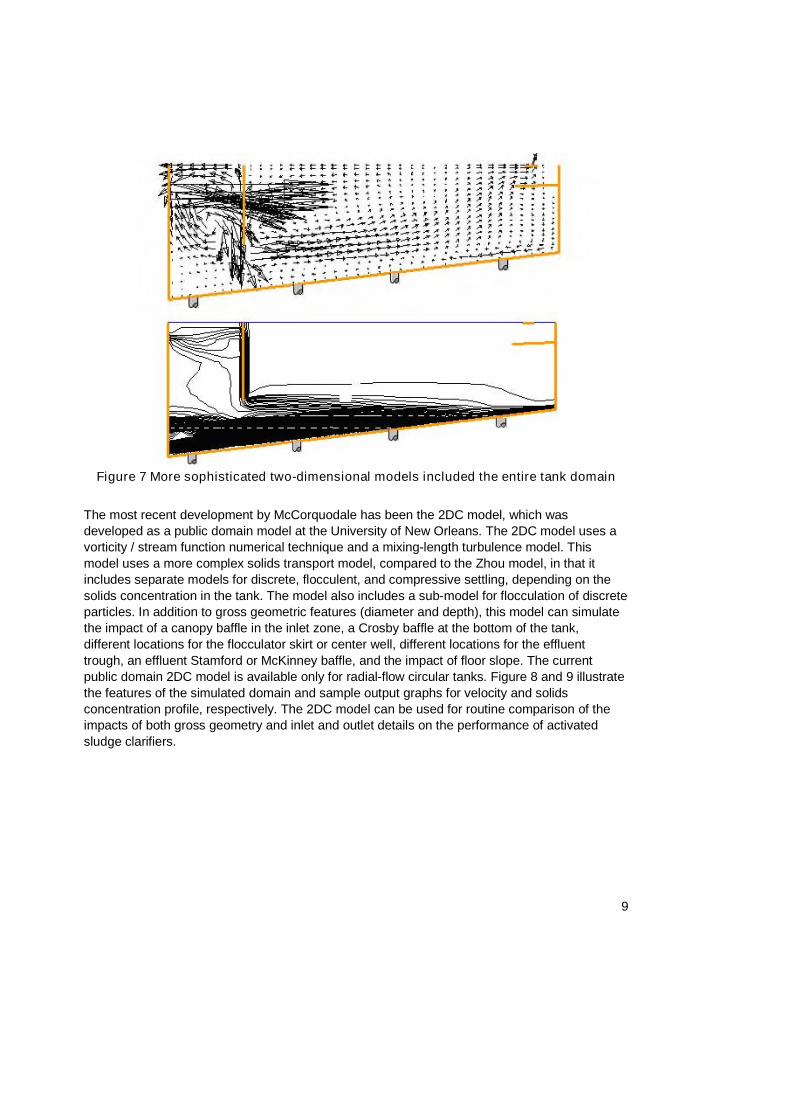
McCorquodale and Siping Zhou developed the next most significant clarifier model in the 1990s.
This model used the primitive variables technique with a k-epsilon turbulence model. The k-
epsilon model allows simulation of large-scale turbulent influences on the flow field without the
need for calibrating data, since values for effective turbulence are computed as part of the
model. Zhou’s model is still in use today as evidenced by its use on a number of projects by
Carollo Engineers, including work for Reno and Denver Metro. Figure 7 shows the graphical
output from the Zhou model as it was used for the Reno project. This model includes the inlet
region of the tank and therefore can be used to optimize the diameter and depth of the
flocculator skirt or center well.
9
Figure 7 More sophisticated two-dimensional models included the entire tank domain
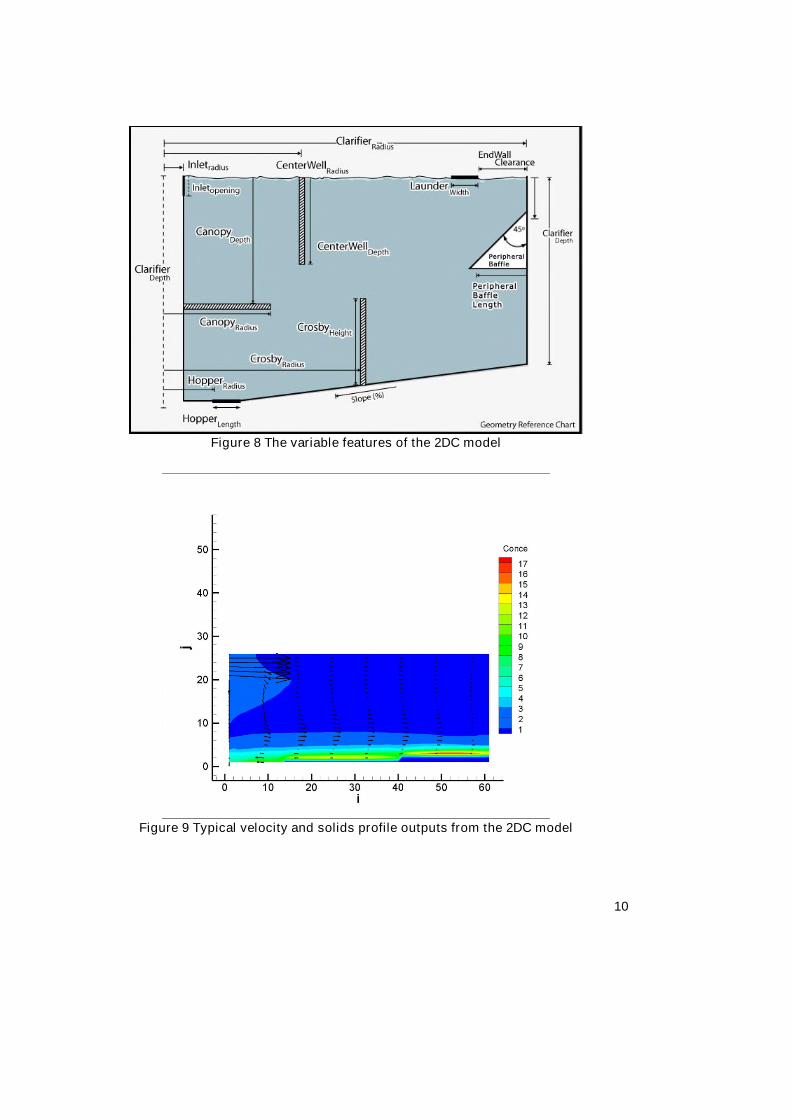
The most recent development by McCorquodale has been the 2DC model, which was
developed as a public domain model at the University of New Orleans. The 2DC model uses a
vorticity / stream function numerical technique and a mixing-length turbulence model. This
model uses a more complex solids transport model, compared to the Zhou model, in that it
includes separate models for discrete, flocculent, and compressive settling, depending on the
solids concentration in the tank. The model also includes a sub-model for flocculation of discrete
particles. In addition to gross geometric features (diameter and depth), this model can simulate
the impact of a canopy baffle in the inlet zone, a Crosby baffle at the bottom of the tank,
different locations for the flocculator skirt or center well, different locations for the effluent
trough, an effluent Stamford or McKinney baffle, and the impact of floor slope. The current
public domain 2DC model is available only for radial-flow circular tanks. Figure 8 and 9 illustrate
the features of the simulated domain and sample output graphs for velocity and solids
concentration profile, respectively. The 2DC model can be used for routine comparison of the
impacts of both gross geometry and inlet and outlet details on the performance of activated
sludge clarifiers.
10
Figure 8 The variable features of the 2DC model
Figure 9 Typical velocity and solids profile outputs from the 2DC model
11
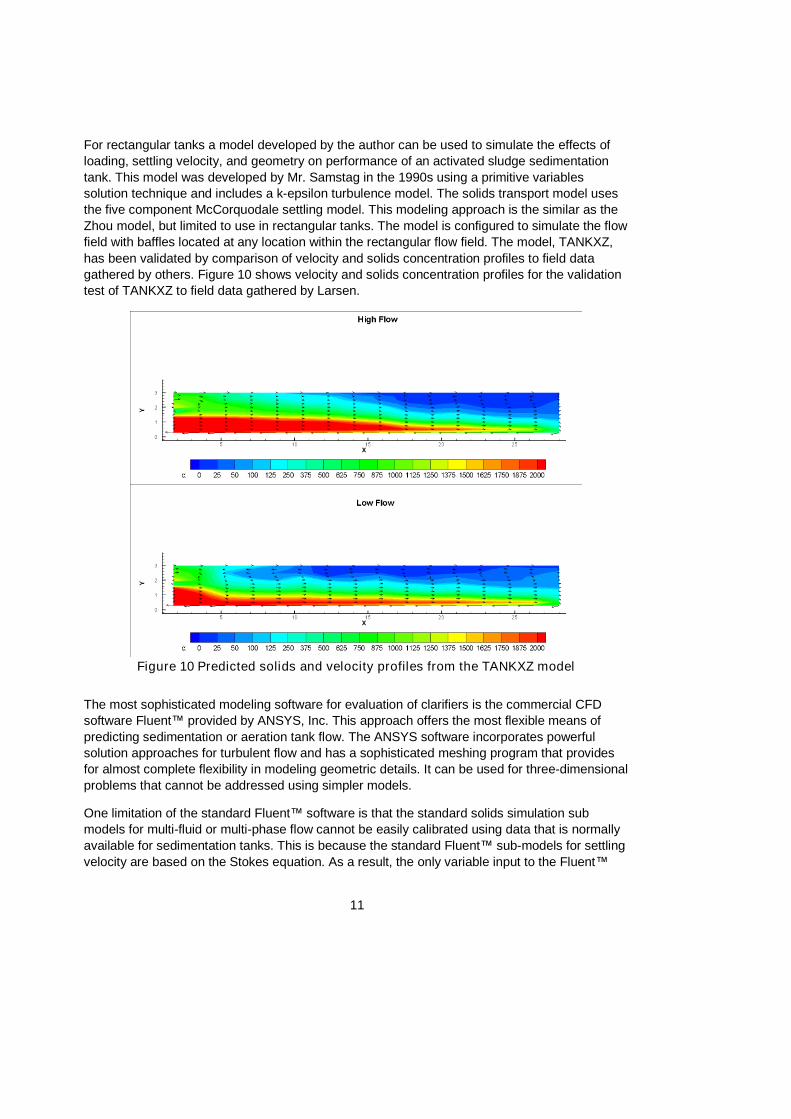
For rectangular tanks a model developed by the author can be used to simulate the effects of
loading, settling velocity, and geometry on performance of an activated sludge sedimentation
tank. This model was developed by Mr. Samstag in the 1990s using a primitive variables
solution technique and includes a k-epsilon turbulence model. The solids transport model uses
the five component McCorquodale settling model. This modeling approach is the similar as the
Zhou model, but limited to use in rectangular tanks. The model is configured to simulate the flow
field with baffles located at any location within the rectangular flow field. The model, TANKXZ,
has been validated by comparison of velocity and solids concentration profiles to field data
gathered by others. Figure 10 shows velocity and solids concentration profiles for the validation
test of TANKXZ to field data gathered by Larsen.
Figure 10 Predicted solids and velocity profiles from the TANKXZ model
The most sophisticated modeling software for evaluation of clarifiers is the commercial CFD
software Fluent™ provided by ANSYS, Inc. This approach offers the most flexible means of
predicting sedimentation or aeration tank flow. The ANSYS software incorporates powerful
solution approaches for turbulent flow and has a sophisticated meshing program that provides
for almost complete flexibility in modeling geometric details. It can be used for three-dimensional
problems that cannot be addressed using simpler models.
One limitation of the standard Fluent™ software is that the standard solids simulation sub
models for multi-fluid or multi-phase flow cannot be easily calibrated using data that is normally
available for sedimentation tanks. This is because the standard Fluent™ sub-models for settling
velocity are based on the Stokes equation. As a result, the only variable input to the Fluent™
12
solids modeling packages is particle diameter. This data could potentially be measured in
activated sludge aeration tanks and clarifiers by particle analyzers, but there is little history of
use of this approach in analysis of sedimentation. In contrast to this, the Vesilind equation for
settling velocity calibrated to zone settling tests has been widely used and understood to
provide meaningful results. Furthermore, particle size data measured by others has shown that
a large variation in particle size is typical. In addition, particle size changes as a result of
flocculation in the tank. The only standard input for the Fluent™ mixture model is a single
particle size; so a customized model is required to represent known behavior.
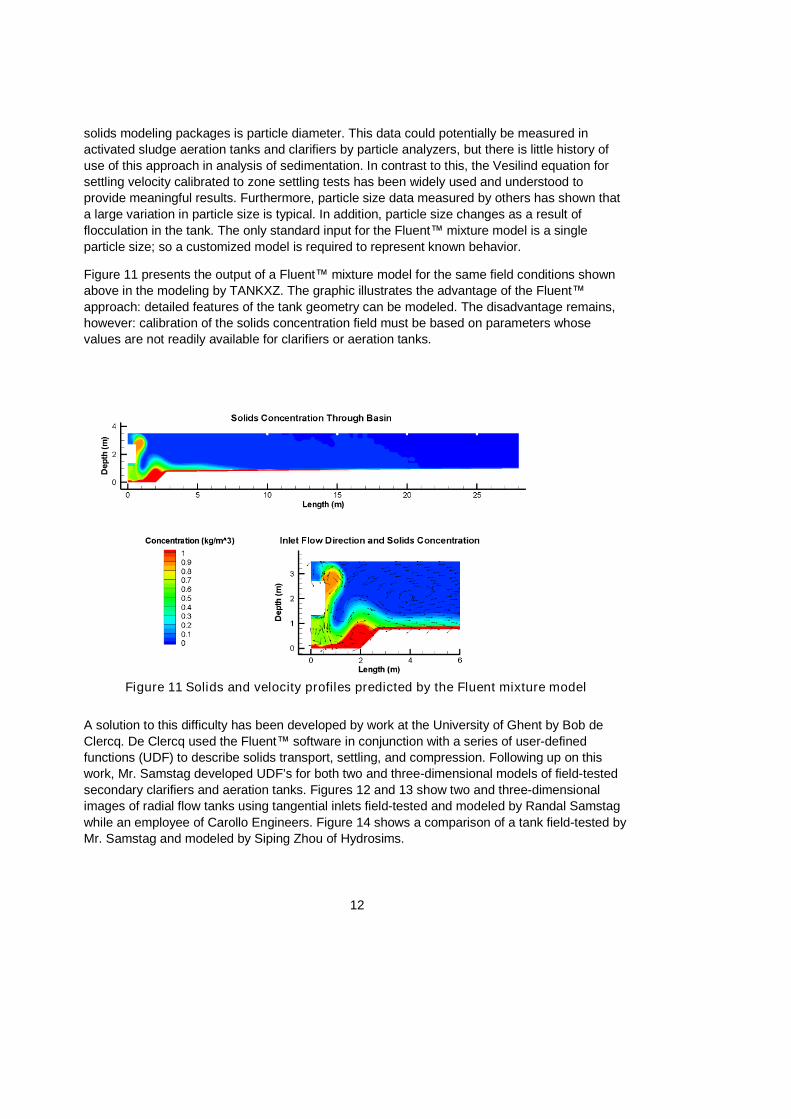
Figure 11 presents the output of a Fluent™ mixture model for the same field conditions shown
above in the modeling by TANKXZ. The graphic illustrates the advantage of the Fluent™
approach: detailed features of the tank geometry can be modeled. The disadvantage remains,
however: calibration of the solids concentration field must be based on parameters whose
values are not readily available for clarifiers or aeration tanks.
Figure 11 Solids and velocity profiles predicted by the Fluent mixture model
A solution to this difficulty has been developed by work at the University of Ghent by Bob de
Clercq. De Clercq used the Fluent™ software in conjunction with a series of user-defined
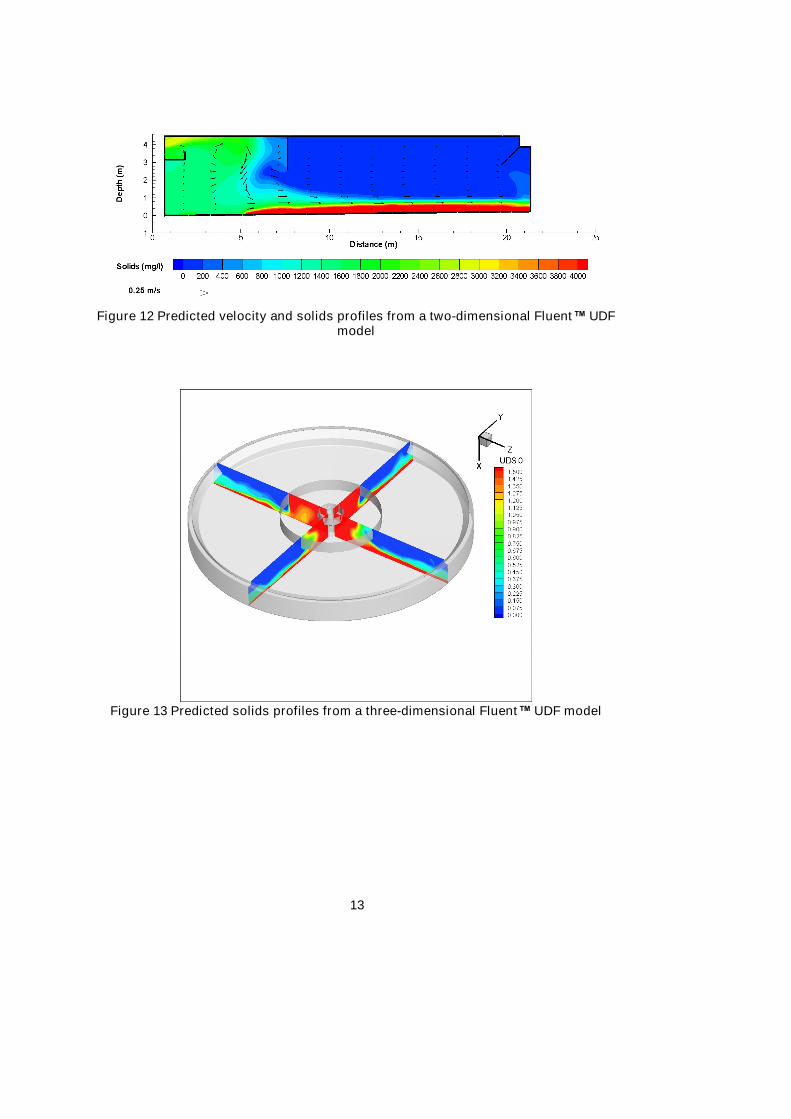
functions (UDF) to describe solids transport, settling, and compression. Following up on this
work, Mr. Samstag developed UDF’s for both two and three-dimensional models of field-tested
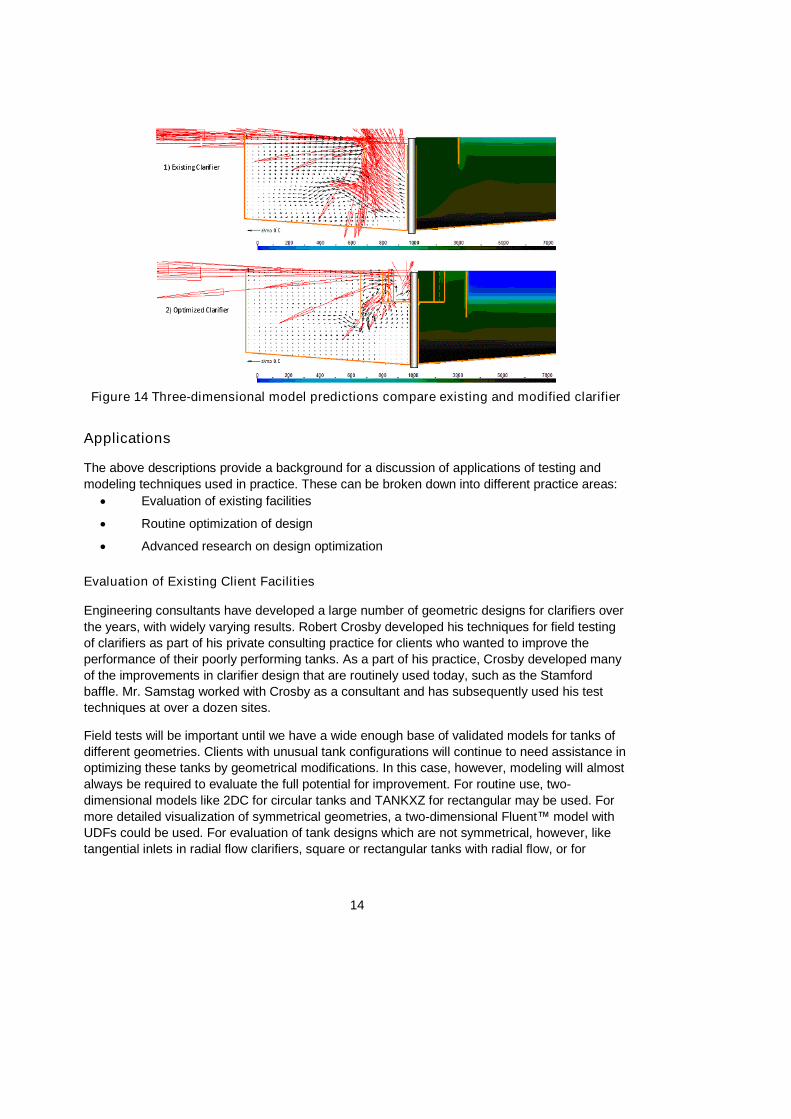
secondary clarifiers and aeration tanks. Figures 12 and 13 show two and three-dimensional
images of radial flow tanks using tangential inlets field-tested and modeled by Randal Samstag
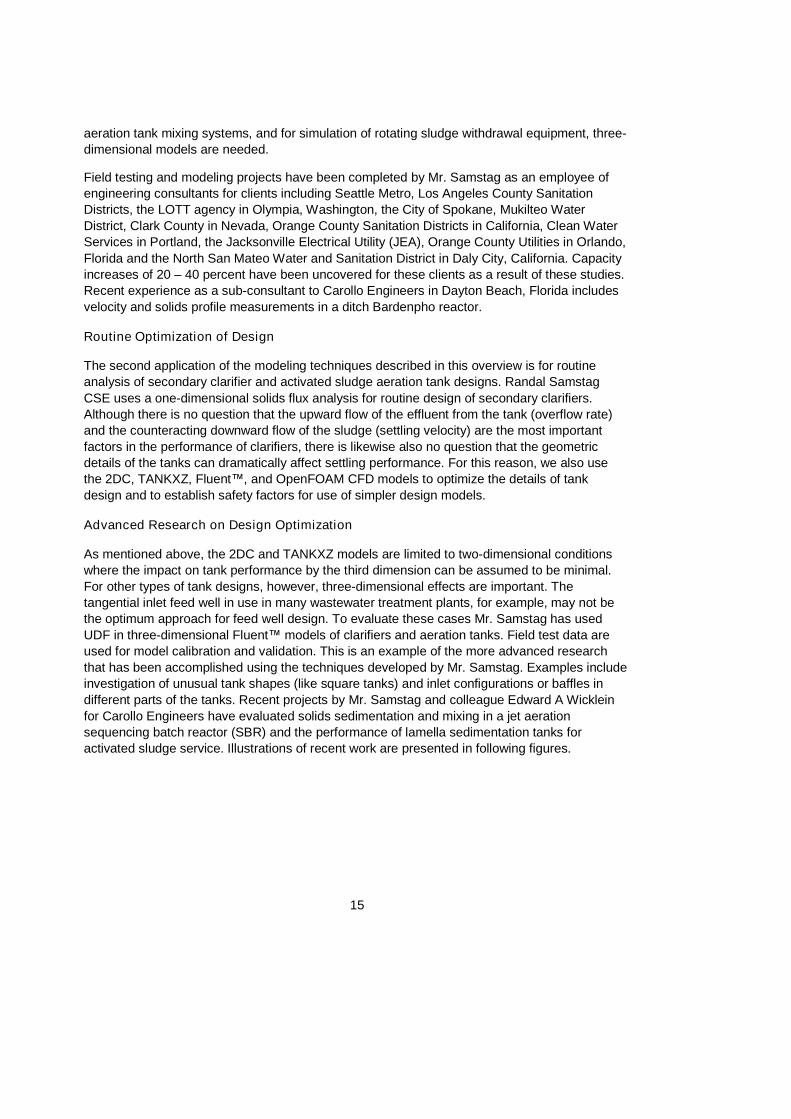
while an employee of Carollo Engineers. Figure 14 shows a comparison of a tank field-tested by
Mr. Samstag and modeled by Siping Zhou of Hydrosims.
13
Figure 12 Predicted velocity and solids profiles from a two-dimensional Fluent™ UDFmodel
Figure 13 Predicted solids profiles from a three-dimensional Fluent™ UDF model
14
Figure 14 Three-dimensional model predictions compare existing and modified clarifier
Applications
The above descriptions provide a background for a discussion of applications of testing and
modeling techniques used in practice. These can be broken down into different practice areas:
Evaluation of existing facilities
Routine optimization of design
Advanced research on design optimization
Evaluation of Existing Client Facilities
Engineering consultants have developed a large number of geometric designs for clarifiers over
the years, with widely varying results. Robert Crosby developed his techniques for field testing
of clarifiers as part of his private consulting practice for clients who wanted to improve the
performance of their poorly performing tanks. As a part of his practice, Crosby developed many
of the improvements in clarifier design that are routinely used today, such as the Stamford
baffle. Mr. Samstag worked with Crosby as a consultant and has subsequently used his test
techniques at over a dozen sites.
Field tests will be important until we have a wide enough base of validated models for tanks of
different geometries. Clients with unusual tank configurations will continue to need assistance in
optimizing these tanks by geometrical modifications. In this case, however, modeling will almost
always be required to evaluate the full potential for improvement. For routine use, two-
dimensional models like 2DC for circular tanks and TANKXZ for rectangular may be used. For
more detailed visualization of symmetrical geometries, a two-dimensional Fluent™ model with
UDFs could be used. For evaluation of tank designs which are not symmetrical, however, like
tangential inlets in radial flow clarifiers, square or rectangular tanks with radial flow, or for
15
aeration tank mixing systems, and for simulation of rotating sludge withdrawal equipment, three-
dimensional models are needed.
Field testing and modeling projects have been completed by Mr. Samstag as an employee of
engineering consultants for clients including Seattle Metro, Los Angeles County Sanitation
Districts, the LOTT agency in Olympia, Washington, the City of Spokane, Mukilteo Water
District, Clark County in Nevada, Orange County Sanitation Districts in California, Clean Water
Services in Portland, the Jacksonville Electrical Utility (JEA), Orange County Utilities in Orlando,
Florida and the North San Mateo Water and Sanitation District in Daly City, California. Capacity
increases of 20 – 40 percent have been uncovered for these clients as a result of these studies.
Recent experience as a sub-consultant to Carollo Engineers in Dayton Beach, Florida includes
velocity and solids profile measurements in a ditch Bardenpho reactor.
Routine Optimization of Design
The second application of the modeling techniques described in this overview is for routine
analysis of secondary clarifier and activated sludge aeration tank designs. Randal Samstag
CSE uses a one-dimensional solids flux analysis for routine design of secondary clarifiers.
Although there is no question that the upward flow of the effluent from the tank (overflow rate)
and the counteracting downward flow of the sludge (settling velocity) are the most important
factors in the performance of clarifiers, there is likewise also no question that the geometric
details of the tanks can dramatically affect settling performance. For this reason, we also use
the 2DC, TANKXZ, Fluent™, and OpenFOAM CFD models to optimize the details of tank
design and to establish safety factors for use of simpler design models.
Advanced Research on Design Optimization
As mentioned above, the 2DC and TANKXZ models are limited to two-dimensional conditions
where the impact on tank performance by the third dimension can be assumed to be minimal.
For other types of tank designs, however, three-dimensional effects are important. The
tangential inlet feed well in use in many wastewater treatment plants, for example, may not be
the optimum approach for feed well design. To evaluate these cases Mr. Samstag has used
UDF in three-dimensional Fluent™ models of clarifiers and aeration tanks. Field test data are
used for model calibration and validation. This is an example of the more advanced research
that has been accomplished using the techniques developed by Mr. Samstag. Examples include
investigation of unusual tank shapes (like square tanks) and inlet configurations or baffles in
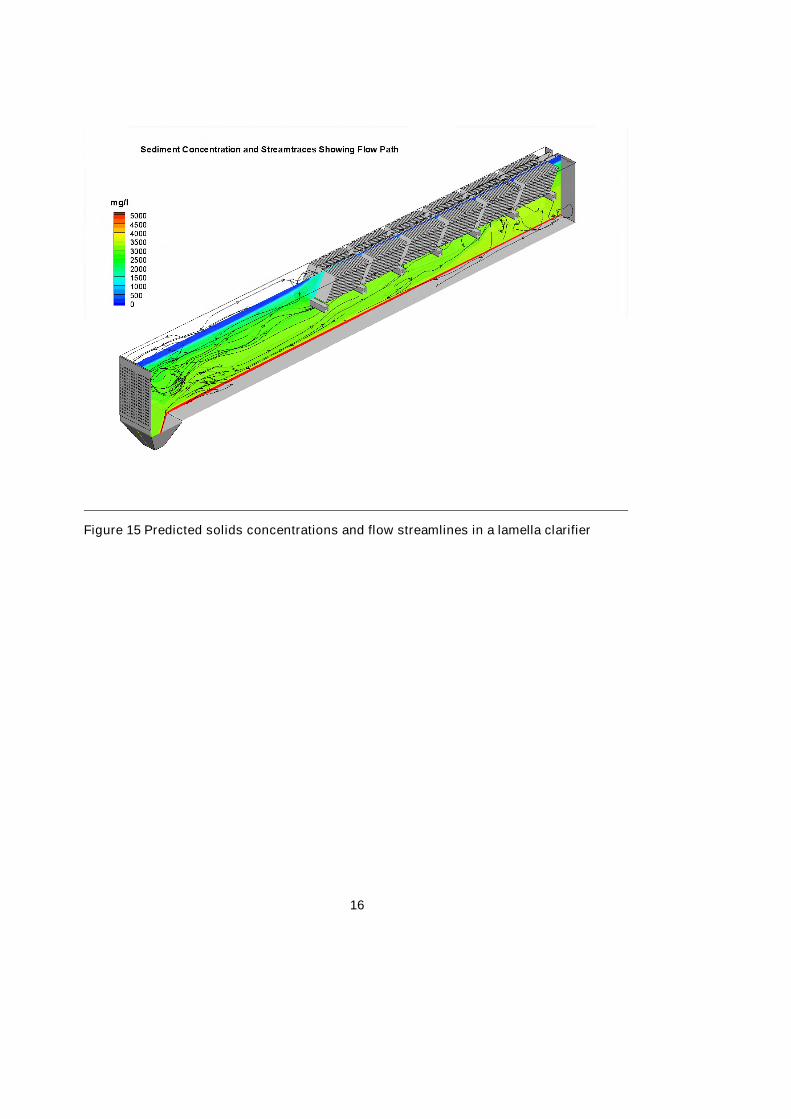
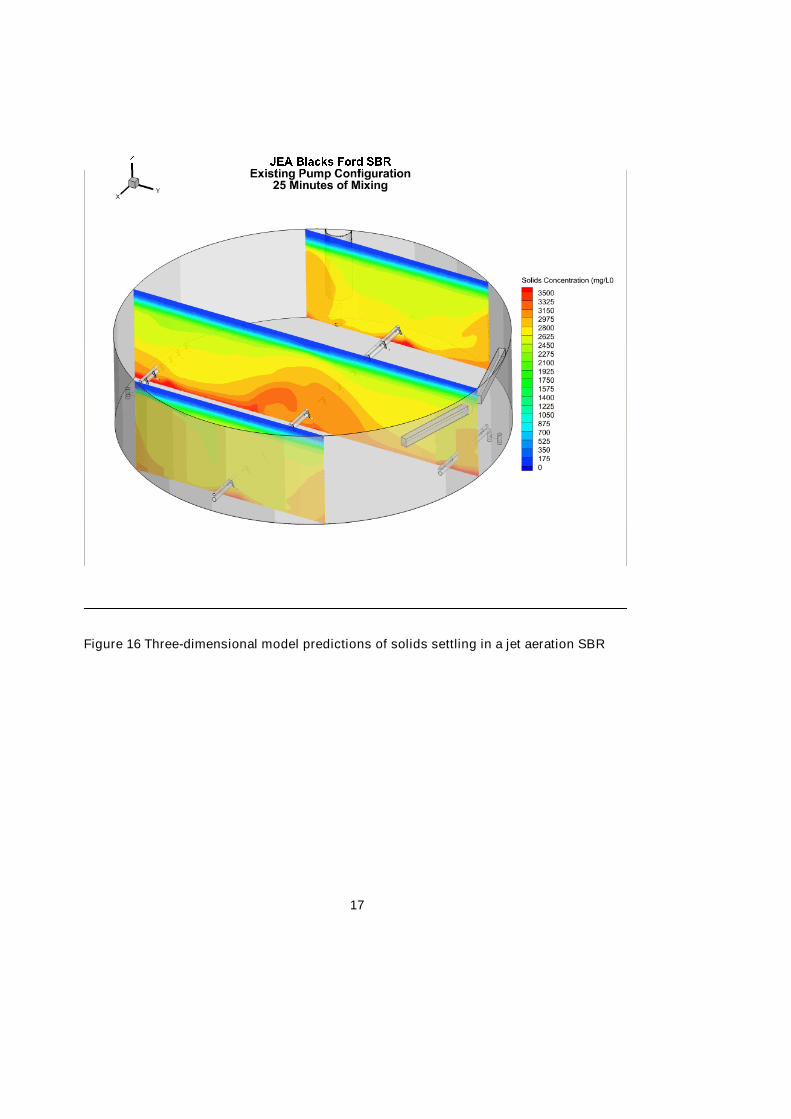
different parts of the tanks. Recent projects by Mr. Samstag and colleague Edward A Wicklein
for Carollo Engineers have evaluated solids sedimentation and mixing in a jet aeration
sequencing batch reactor (SBR) and the performance of lamella sedimentation tanks for
activated sludge service. Illustrations of recent work are presented in following figures.
16
Figure 15 Predicted solids concentrations and flow streamlines in a lamella clarifier
17
Figure 16 Three-dimensional model predictions of solids settling in a jet aeration SBR
18
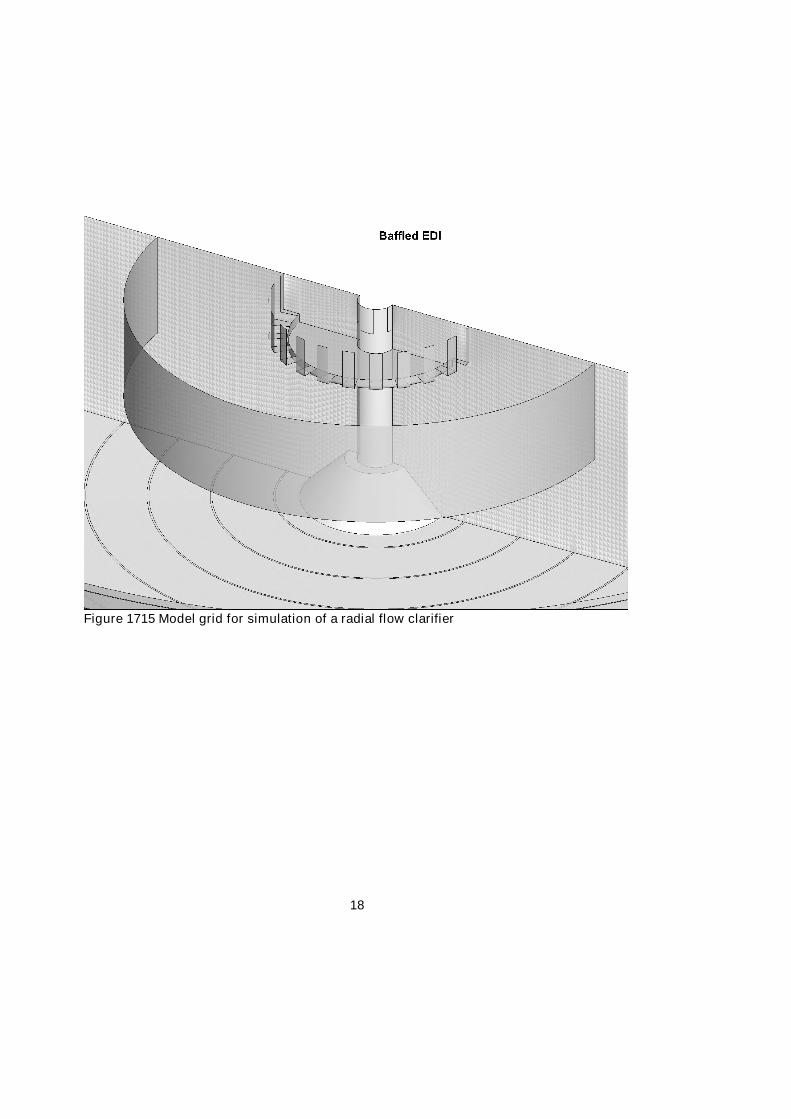
Figure 1715 Model grid for simulation of a radial flow clarifier
19
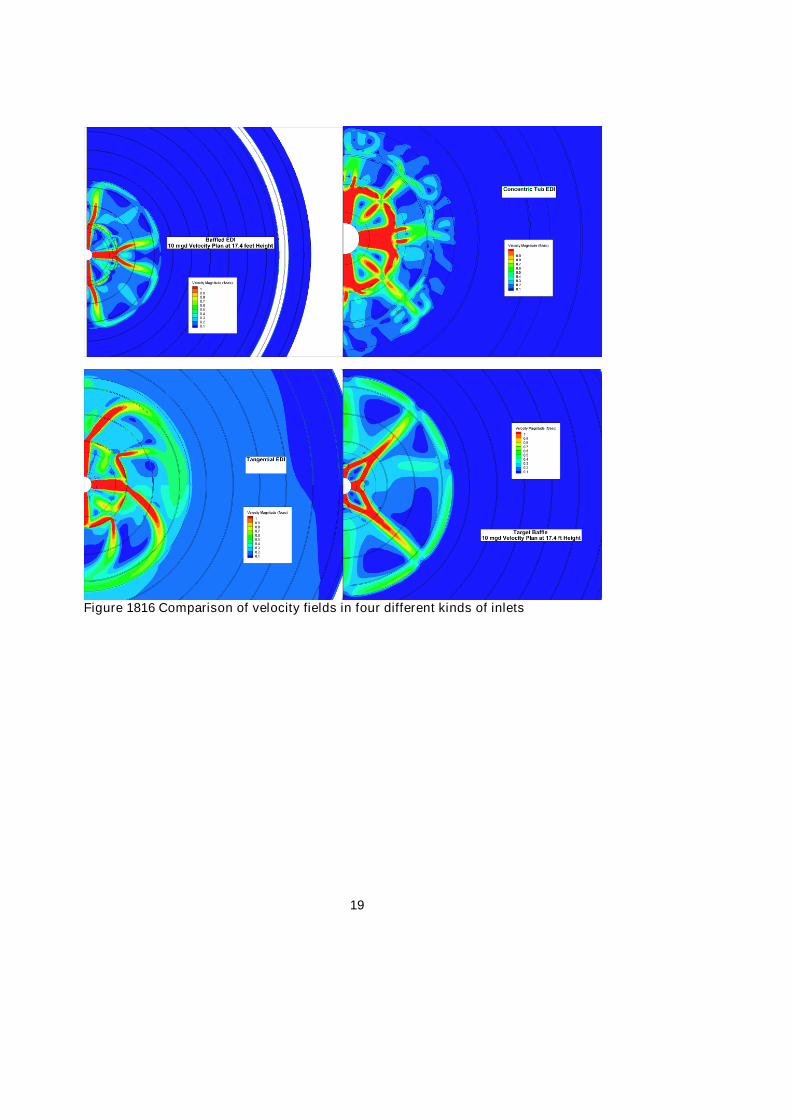
Figure 1816 Comparison of velocity fields in four different kinds of inlets

20
CONCLUSIONS
Techniques developed by Randal Samstag for field test and modeling of sedimentation and
aeration tanks have been discussed. Randal W. Samstag CSE has expertise to perform
complete field tests and modeling of sedimentation tanks and activated sludge aeration tanks.
This expertise will continue to be applied to:
Field testing and modeling of poorly performing tanks
Improving standard new designs
Advanced research for the designs of tomorrow