Embed Size (px)
Citation preview
1
Proceedings of the 2nd Marine Energy Technology Symposium METS2014
April 15-18, 2014, Seattle, WA
TESTING AND ACCELERATED AGING OF CONDUCTIVE ANTIFOULING PAINTS FOR MARINE APPLICATIONS
Malachi Bunn1
Oregon State University Corvallis, OR, U.S.A.
Dr. Alex Yokochi Oregon State University
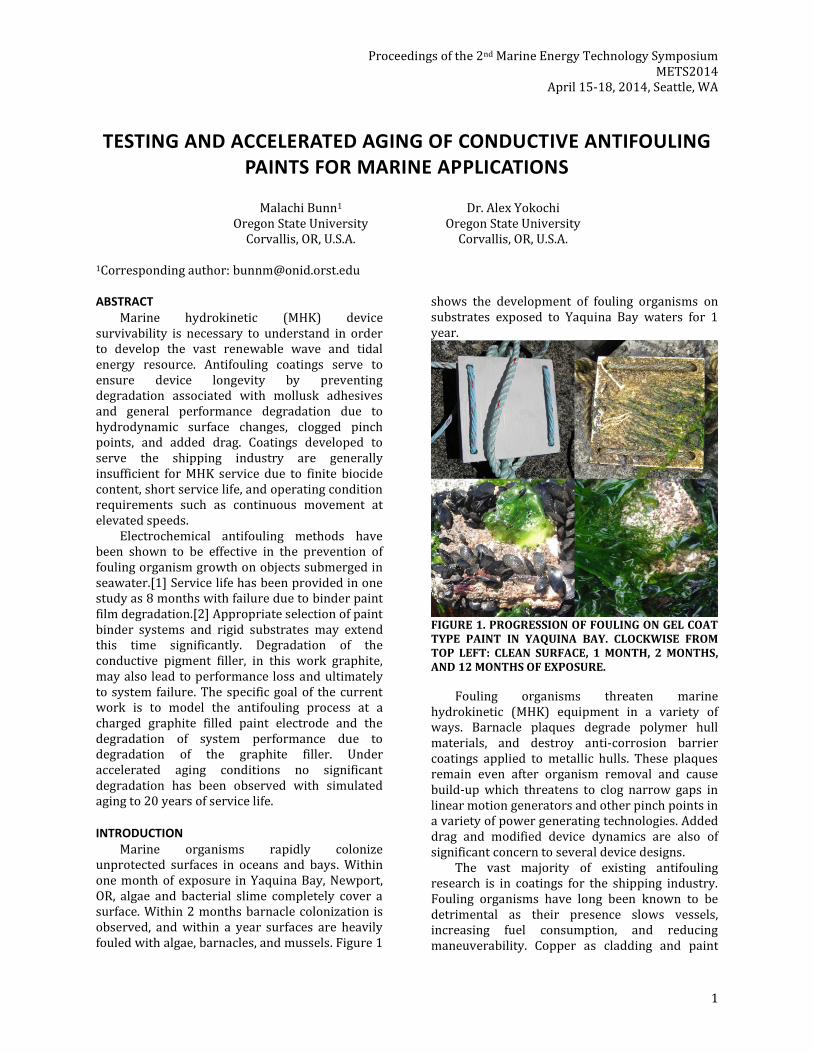
Corvallis, OR, U.S.A. 1Corresponding author: [email protected] ABSTRACT Marine hydrokinetic (MHK) device survivability is necessary to understand in order to develop the vast renewable wave and tidal energy resource. Antifouling coatings serve to ensure device longevity by preventing degradation associated with mollusk adhesives and general performance degradation due to hydrodynamic surface changes, clogged pinch points, and added drag. Coatings developed to serve the shipping industry are generally insufficient for MHK service due to finite biocide content, short service life, and operating condition requirements such as continuous movement at elevated speeds. Electrochemical antifouling methods have been shown to be effective in the prevention of fouling organism growth on objects submerged in seawater.[1] Service life has been provided in one study as 8 months with failure due to binder paint film degradation.[2] Appropriate selection of paint binder systems and rigid substrates may extend this time significantly. Degradation of the conductive pigment filler, in this work graphite, may also lead to performance loss and ultimately to system failure. The specific goal of the current work is to model the antifouling process at a charged graphite filled paint electrode and the degradation of system performance due to degradation of the graphite filler. Under accelerated aging conditions no significant degradation has been observed with simulated aging to 20 years of service life. INTRODUCTION Marine organisms rapidly colonize unprotected surfaces in oceans and bays. Within one month of exposure in Yaquina Bay, Newport, OR, algae and bacterial slime completely cover a surface. Within 2 months barnacle colonization is observed, and within a year surfaces are heavily fouled with algae, barnacles, and mussels. Figure 1
shows the development of fouling organisms on substrates exposed to Yaquina Bay waters for 1 year.
FIGURE 1. PROGRESSION OF FOULING ON GEL COAT TYPE PAINT IN YAQUINA BAY. CLOCKWISE FROM TOP LEFT: CLEAN SURFACE, 1 MONTH, 2 MONTHS, AND 12 MONTHS OF EXPOSURE.
Fouling organisms threaten marine hydrokinetic (MHK) equipment in a variety of ways. Barnacle plaques degrade polymer hull materials, and destroy anti-corrosion barrier coatings applied to metallic hulls. These plaques remain even after organism removal and cause build-up which threatens to clog narrow gaps in linear motion generators and other pinch points in a variety of power generating technologies. Added drag and modified device dynamics are also of significant concern to several device designs. The vast majority of existing antifouling research is in coatings for the shipping industry. Fouling organisms have long been known to be detrimental as their presence slows vessels, increasing fuel consumption, and reducing maneuverability. Copper as cladding and paint
2
filler played a major role in fouling prevention until the development of organo-tin biocide paints in the 1960’s.[3] Following the ban on tin based paints in 2003 due to environmental concerns, copper paints have experienced resurgence. Alternative technologies are still sought due to cost and environmental concerns. Biocide-free self-polishing and foul release “slick” coatings have been developed. Key weaknesses for these technologies are limited service life and the need for continuous water sheer to remove attached organisms, respectively. Electrochemical methods for fouling prevention have been introduced as a concept but have not yet been widely implemented. These methods use electricity to drive oxidation of chloride ubiquitous in the environment, creating short lived strongly oxidizing species which sterilize the surface and return to their original state short distances from the protected surface. This provides the framework for a potentially very effective and environmentally friendly antifouling system. Operating expense and system reliability have been cited as system limitations.[3] With the continuously decreasing cost of electronic components and the ready supply of electrical energy inherent to MHK devices these concerns may be over-estimated. Current research aims to revisit this technology and inform the debate on available and acceptable antifouling technologies. In previous research prevention of fouling on charged surfaces has been attributed to direct electron transfer to organisms, electromagnetic repulsion affecting cell membranes, and electrochemical oxidation of chloride found ubiquitously in seawater.[1, 2, 4, 5] Given the electrochemical potentials used in previous studies, it is clear that electrochemical oxidation of chloride was induced. Equation 1 is the reaction of interest, written in the standard reduction reaction notation. Oxidized chlorine species, likely hypochlorite as shown, are undoubtedly the source of antifouling efficacy.
Paint binder degradation is well understood in the industry, with established test methods and vast industry experience.[6] The current work is therefore focused on studying the degradation of the electrically conductive graphite filler which could be used in electrochemical antifouling systems. Electrochemistry Background The Tafel equation, Equation 2, is used to model the rate of electrically catalyzed chemical reactions at a charged surface.
(
) (2)
Here is the electric current density due to chemical reaction – dividing by nF gives the reaction rate, is the exchange current density – the equilibrium reaction current which flows with no net reaction, is a dimensionless charge transfer coefficient which must be between 0 and 1, is the number of electrons involved in the reaction, is Faraday’s Constant, is the over-potential – the voltage supplied in excess of the equilibrium potential in order to drive the reaction, R is the gas constant, and T is the absolute temperature. The charge transfer coefficient and exchange current density determine “how good” an electrode is for performing a given electrochemical reaction. They are characteristics of the chemical reaction being driven and the electrode surface catalyzing the reaction paired as a system. From a mathematical viewpoint it is clear that high exchange current density and a charge transfer coefficient near 1 are desired to increase reaction rate with the lowest power consumption. Physical interpretation of the charge transfer coefficient is the amount of applied energy which goes to reducing the activation energy barrier of the limiting reaction step. This is depicted in Figure 2.
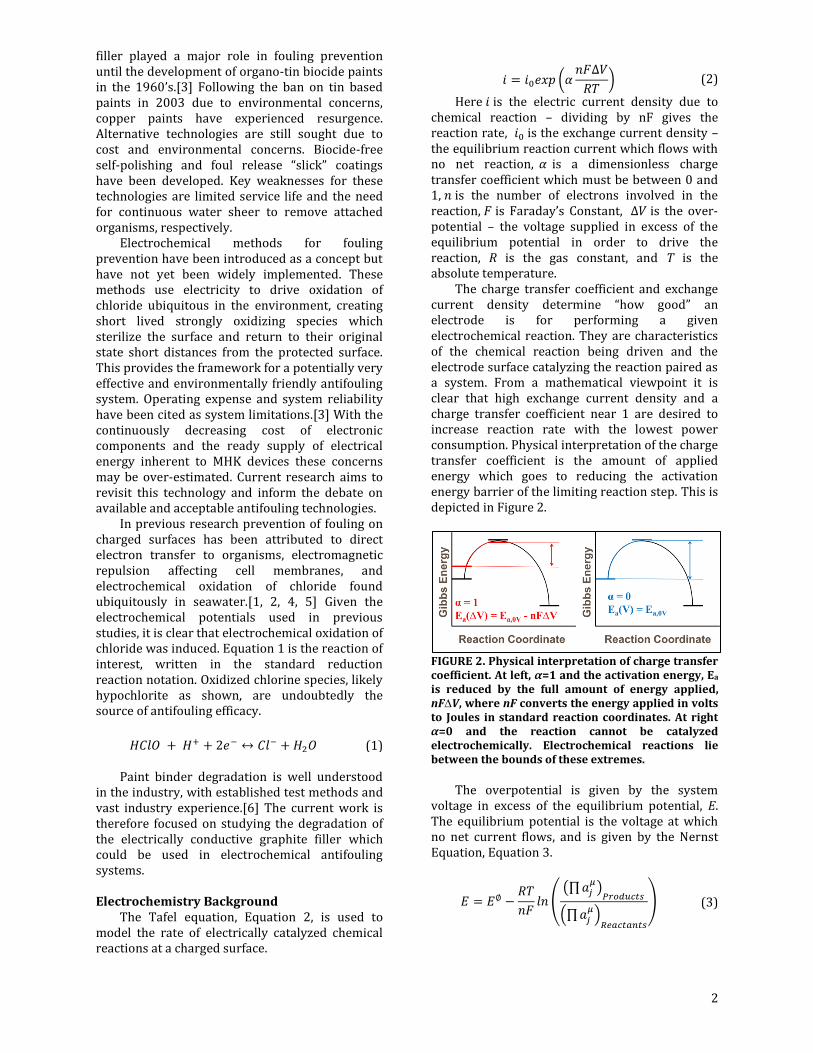
FIGURE 2. Physical interpretation of charge transfer coefficient. At left, α=1 and the activation energy, Ea is reduced by the full amount of energy applied, nF∆V, where nF converts the energy applied in volts to Joules in standard reaction coordinates. At right α=0 and the reaction cannot be catalyzed electrochemically. Electrochemical reactions lie between the bounds of these extremes.
The overpotential is given by the system voltage in excess of the equilibrium potential, E. The equilibrium potential is the voltage at which no net current flows, and is given by the Nernst Equation, Equation 3.
(
(∏ )
(∏ )
) (3)
(1)
3
Where is the equilibrium cell potential, is the standard cell potential, is the activity of
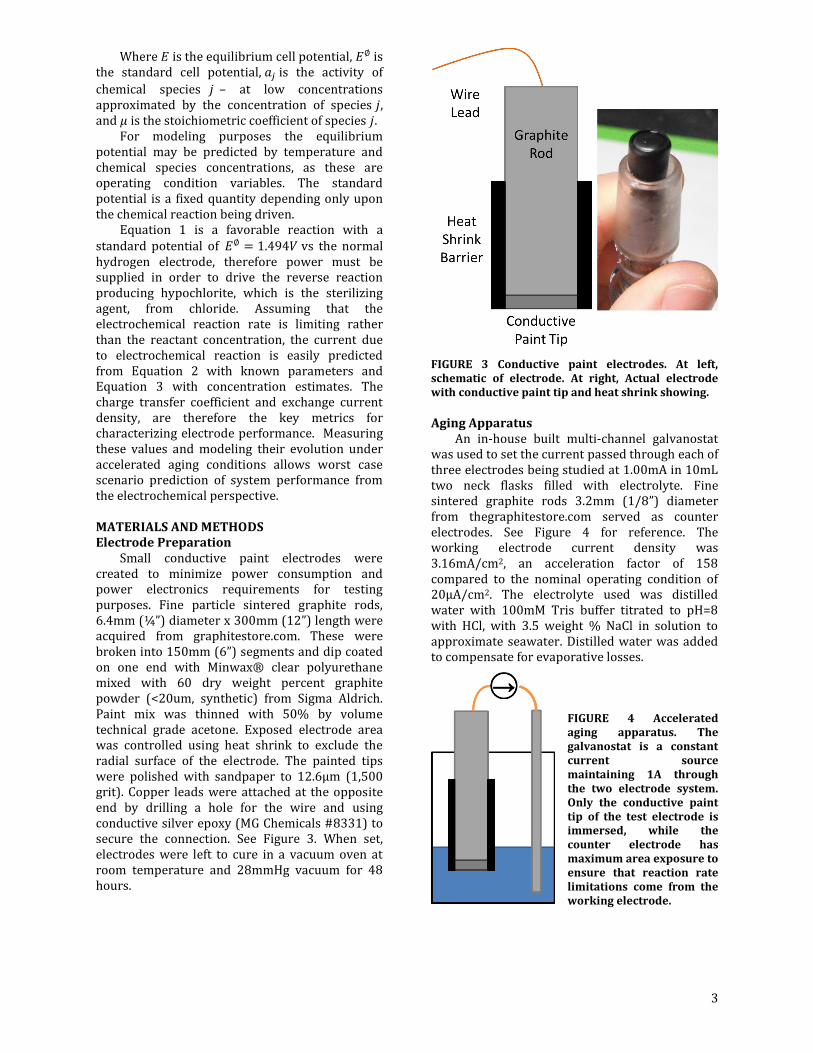
chemical species – at low concentrations approximated by the concentration of species , and is the stoichiometric coefficient of species . For modeling purposes the equilibrium potential may be predicted by temperature and chemical species concentrations, as these are operating condition variables. The standard potential is a fixed quantity depending only upon the chemical reaction being driven. Equation 1 is a favorable reaction with a standard potential of vs the normal hydrogen electrode, therefore power must be supplied in order to drive the reverse reaction producing hypochlorite, which is the sterilizing agent, from chloride. Assuming that the electrochemical reaction rate is limiting rather than the reactant concentration, the current due to electrochemical reaction is easily predicted from Equation 2 with known parameters and Equation 3 with concentration estimates. The charge transfer coefficient and exchange current density, are therefore the key metrics for characterizing electrode performance. Measuring these values and modeling their evolution under accelerated aging conditions allows worst case scenario prediction of system performance from the electrochemical perspective. MATERIALS AND METHODS Electrode Preparation Small conductive paint electrodes were created to minimize power consumption and power electronics requirements for testing purposes. Fine particle sintered graphite rods, 6.4mm (¼”) diameter x 300mm (12”) length were acquired from graphitestore.com. These were broken into 150mm (6”) segments and dip coated on one end with Minwax® clear polyurethane mixed with 60 dry weight percent graphite powder (<20um, synthetic) from Sigma Aldrich. Paint mix was thinned with 50% by volume technical grade acetone. Exposed electrode area was controlled using heat shrink to exclude the radial surface of the electrode. The painted tips were polished with sandpaper to 12.6µm (1,500 grit). Copper leads were attached at the opposite end by drilling a hole for the wire and using conductive silver epoxy (MG Chemicals #8331) to secure the connection. See Figure 3. When set, electrodes were left to cure in a vacuum oven at room temperature and 28mmHg vacuum for 48 hours.
FIGURE 3 Conductive paint electrodes. At left, schematic of electrode. At right, Actual electrode with conductive paint tip and heat shrink showing.
Aging Apparatus An in-house built multi-channel galvanostat was used to set the current passed through each of three electrodes being studied at 1.00mA in 10mL two neck flasks filled with electrolyte. Fine sintered graphite rods 3.2mm (1/8”) diameter from thegraphitestore.com served as counter electrodes. See Figure 4 for reference. The working electrode current density was 3.16mA/cm2, an acceleration factor of 158 compared to the nominal operating condition of 20µA/cm2. The electrolyte used was distilled water with 100mM Tris buffer titrated to pH=8 with HCl, with 3.5 weight % NaCl in solution to approximate seawater. Distilled water was added to compensate for evaporative losses.
FIGURE 4 Accelerated aging apparatus. The galvanostat is a constant current source maintaining 1A through the two electrode system. Only the conductive paint tip of the test electrode is immersed, while the counter electrode has maximum area exposure to ensure that reaction rate limitations come from the working electrode.
4
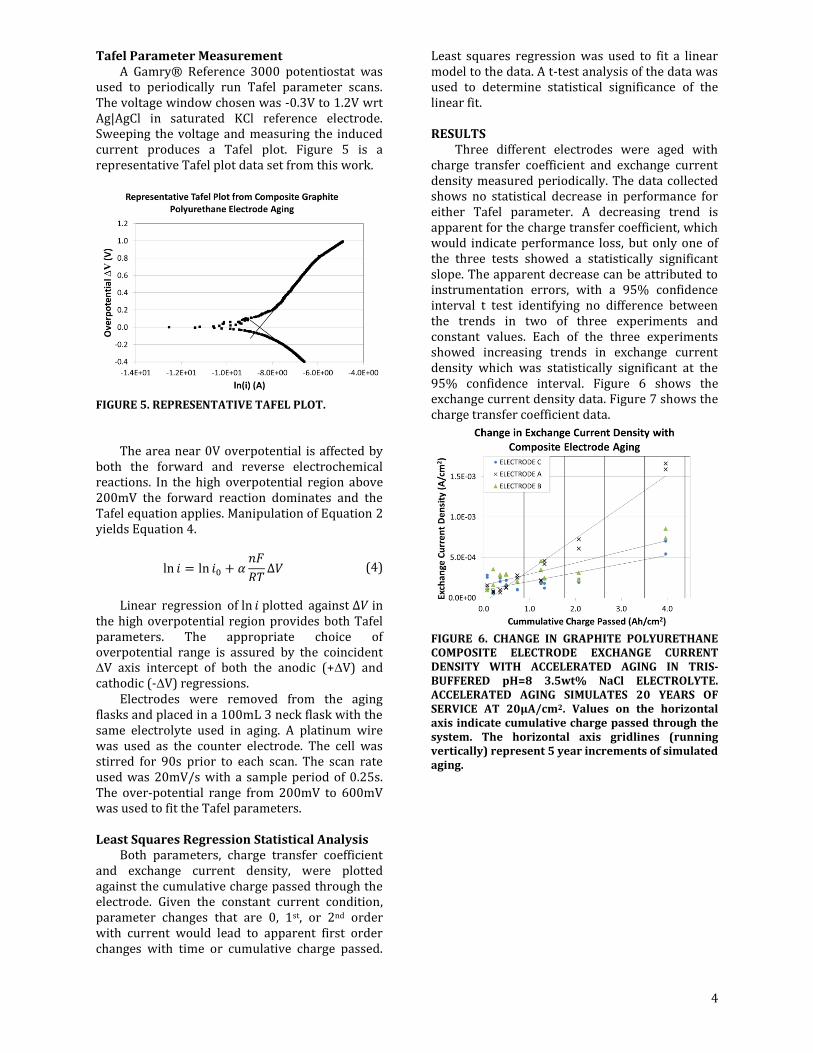
Tafel Parameter Measurement A Gamry® Reference 3000 potentiostat was used to periodically run Tafel parameter scans. The voltage window chosen was -0.3V to 1.2V wrt Ag|AgCl in saturated KCl reference electrode. Sweeping the voltage and measuring the induced current produces a Tafel plot. Figure 5 is a representative Tafel plot data set from this work.
FIGURE 5. REPRESENTATIVE TAFEL PLOT. The area near 0V overpotential is affected by both the forward and reverse electrochemical reactions. In the high overpotential region above 200mV the forward reaction dominates and the Tafel equation applies. Manipulation of Equation 2 yields Equation 4.
(4)
Linear regression of plotted against in the high overpotential region provides both Tafel parameters. The appropriate choice of overpotential range is assured by the coincident ∆V axis intercept of both the anodic (+∆V) and cathodic (-∆V) regressions. Electrodes were removed from the aging flasks and placed in a 100mL 3 neck flask with the same electrolyte used in aging. A platinum wire was used as the counter electrode. The cell was stirred for 90s prior to each scan. The scan rate used was 20mV/s with a sample period of 0.25s. The over-potential range from 200mV to 600mV was used to fit the Tafel parameters. Least Squares Regression Statistical Analysis Both parameters, charge transfer coefficient and exchange current density, were plotted against the cumulative charge passed through the electrode. Given the constant current condition, parameter changes that are 0, 1st, or 2nd order with current would lead to apparent first order changes with time or cumulative charge passed.
Least squares regression was used to fit a linear model to the data. A t-test analysis of the data was used to determine statistical significance of the linear fit. RESULTS Three different electrodes were aged with charge transfer coefficient and exchange current density measured periodically. The data collected shows no statistical decrease in performance for either Tafel parameter. A decreasing trend is apparent for the charge transfer coefficient, which would indicate performance loss, but only one of the three tests showed a statistically significant slope. The apparent decrease can be attributed to instrumentation errors, with a 95% confidence interval t test identifying no difference between the trends in two of three experiments and constant values. Each of the three experiments showed increasing trends in exchange current density which was statistically significant at the 95% confidence interval. Figure 6 shows the exchange current density data. Figure 7 shows the charge transfer coefficient data.
FIGURE 6. CHANGE IN GRAPHITE POLYURETHANE COMPOSITE ELECTRODE EXCHANGE CURRENT DENSITY WITH ACCELERATED AGING IN TRIS-BUFFERED pH=8 3.5wt% NaCl ELECTROLYTE. ACCELERATED AGING SIMULATES 20 YEARS OF SERVICE AT 20µA/cm2. Values on the horizontal axis indicate cumulative charge passed through the system. The horizontal axis gridlines (running vertically) represent 5 year increments of simulated aging.

5
FIGURE 7. CHANGE IN GRAPHITE POLYURETHANE COMPOSITE ELECTRODE CHARGE TRANSFER COEFFICIENT WITH ACCELERATED AGING IN TRIS-BUFFERED pH=8 3.5wt% NaCl ELECTROLYTE. ACCELERATED AGING SIMULATES 20 YEARS OF SERVICE AT 20µA/cm2. Values on the horizontal axis indicate cumulative charge passed through the system. The horizontal axis gridlines (running vertically) represent 5 year increments of simulated aging.
CONCLUSIONS While a decreasing trend in charge transfer coefficient may be apparent, the data collected has too much variation to draw firm conclusions regarding a trend. The analytical process needs to be modified for future work to minimize measurement uncertainty. Even with the uncertainty, it is apparent that reduction by about 60% is a worst case scenario. The result of such loss would be 150% increase in overpotential used to drive the system, neglecting improvements gained from the exchange current density. It is important to bear in mind this is an increase in overpotential, not overall system potential. The increase in exchange current density indicates increasing performance of the electrochemical antifouling system with time. This unexpected result will contribute to lower required overpotential to maintain system performance. Degradation of graphite electrodes at moderate voltage in a model seawater solution is shown to be negligible for an aging period equivalent to 20 years of service at 20µA/cm2. This indicates that the electrochemical performance of graphite filler in conductive paint electrodes is not likely a significant source of performance loss for electrochemical antifouling systems. The current work has been done in buffered NaCl model seawater for first estimates. Further studies are needed in more advanced model seawater containing bromide ions. Bromide
oxidation in zinc bromide flow cell batteries is known to cause degradation of graphite electrodes. While bromide is present at much lower levels of about 67ppm in seawater compared to several molar concentrations in batteries, determining any potential contribution to degradation is a critical next step. ACKNOWLEDGEMENTS The authors acknowledge support for this work from the US Department of Energy (Award Number DE-FG36-08GO18179) for the Northwest National Marine Renewable Energy Center (NNMREC), and the State of Oregon Capital Funding Program. REFERENCES [1] T. Matsunaga, T. Nakayama, H. Wake, M.
Takahashi, M. Okochi, and N. Nakamura, "Prevention of marine biofouling using a conductive paint electrode," Biotechnol. Bioeng., vol. 59, pp. 374-378, // 1998.
[2] T. Nakayama, H. Wake, K. Ozawa, N. Nakamura, and T. Matsunaga, "Electrochemical prevention of marine biofouling on a novel titanium-nitride-coated plate formed by radio-frequency arc spraying," Appl. Microbiol. Biotechnol., vol. 50, pp. 502-508, // 1998.
[3] L. Adamson and N. Brown, "Focus on IMO: Anti-fouling systems," I. M. Organization, Ed., ed, 2003.
[4] R. E. Perez-Roa, M. A. Anderson, D. Rittschof, C. G. Hunt, and D. R. Noguera, "Involvement of reactive oxygen species in the electrochemical inhibition of barnacle (Amphibalanus amphitrite) settlement," Biofouling, vol. 25, pp. 563-71, // 2009.
[5] J.-R. Huang, W.-T. Lin, R. Huang, C.-Y. Lin, and J.-K. Wu, "Marine biofouling inhibition by polyurethane conductive coatings used for fishing net," J. Coat. Technol. Res., vol. 7, pp. 111-117, // 2010.
[6] Paint and Coating Testing Manual : 15th edition of the Gardner-Sward handbook: ASTM International, 2012.