Embed Size (px)
Citation preview
Courtesy of
Test SystemInstructions

1.800.362.38601.888.362.2576 Faxwww.good-lite.com �
Test Instructions
Contents
Lea Adaptation TestsCone Adaptation Test (#252900) . . . . . . . . . . . . . . . . . . . . . . . . . . . . . . . . . . . . . . . . . . . . . . . 3
Lea Cognitive Vision Tests3-D Puzzle (#251600) . . . . . . . . . . . . . . . . . . . . . . . . . . . . . . . . . . . . . . . . . . . . . . . . . . . . . . . 6
Heidi Fixation Targets (#253000, #253100) . . . . . . . . . . . . . . . . . . . . . . . . . . . . . . . . . . . . . . 7
Lea Gratings (#253300) . . . . . . . . . . . . . . . . . . . . . . . . . . . . . . . . . . . . . . . . . . . . . . . . . . . . . . 7
Heidi Expressions Test Game (#254500) . . . . . . . . . . . . . . . . . . . . . . . . . . . . . . . . . . . . . . . . 11
Hiding Heidi Low Contrast Face Test (#253500) . . . . . . . . . . . . . . . . . . . . . . . . . . . . . . . . . 12
Lea Rectangles Game (#254600) . . . . . . . . . . . . . . . . . . . . . . . . . . . . . . . . . . . . . . . . . . . . . . 14
Lea Mailbox Game (#254700) . . . . . . . . . . . . . . . . . . . . . . . . . . . . . . . . . . . . . . . . . . . . . . . . 15
Lea Color Vision TestsTo The Tester . . . . . . . . . . . . . . . . . . . . . . . . . . . . . . . . . . . . . . . . . . . . . . . . . . . . . . . . . . . . . 16
Color Vision . . . . . . . . . . . . . . . . . . . . . . . . . . . . . . . . . . . . . . . . . . . . . . . . . . . . . . . . . . . . . . 16
Clinical Evaluation of Color Vision . . . . . . . . . . . . . . . . . . . . . . . . . . . . . . . . . . . . . . . . . . . . 16
Testing Procedures . . . . . . . . . . . . . . . . . . . . . . . . . . . . . . . . . . . . . . . . . . . . . . . . . . . . . . . . . 18
Acquired colour vision defect tested with different sorting tests . . . . . . . . . . . . . . . . . . . . . . 20
Interpretation of Panel 16 Test Results . . . . . . . . . . . . . . . . . . . . . . . . . . . . . . . . . . . . . . . . . . 21
Lea Contrast Sensitivity TestsIntroduction . . . . . . . . . . . . . . . . . . . . . . . . . . . . . . . . . . . . . . . . . . . . . . . . . . . . . . . . . . . . . . 22
What is Contrast Sensitivity? . . . . . . . . . . . . . . . . . . . . . . . . . . . . . . . . . . . . . . . . . . . . . . . . . 22
What is Contrast? . . . . . . . . . . . . . . . . . . . . . . . . . . . . . . . . . . . . . . . . . . . . . . . . . . . . . . . . . . 22
Which Luminance Level Should Be Used? . . . . . . . . . . . . . . . . . . . . . . . . . . . . . . . . . . . . . . . 23
Measurement of Contrast Sensitivity . . . . . . . . . . . . . . . . . . . . . . . . . . . . . . . . . . . . . . . . . . . 23
Test Procedure When Using Low Contrast Visual Acuity Charts . . . . . . . . . . . . . . . . . . . . . 23
Test Procedure When Using Low Contrast Tests with One Symbol Size . . . . . . . . . . . . . . . . 24
Lea Low Contrast Gratings . . . . . . . . . . . . . . . . . . . . . . . . . . . . . . . . . . . . . . . . . . . . . . . . . . 25
Grating Acuity Test at Low Contrast Levels . . . . . . . . . . . . . . . . . . . . . . . . . . . . . . . . . . . . . 25
The Range of Normal Contrast Sensitivity . . . . . . . . . . . . . . . . . . . . . . . . . . . . . . . . . . . . . . . 27
The Types of Contrast Sensitivity Changes . . . . . . . . . . . . . . . . . . . . . . . . . . . . . . . . . . . . . . 28
Lower Visual Acuity May Mean Better Vision . . . . . . . . . . . . . . . . . . . . . . . . . . . . . . . . . . . . 28
Hiding Heidi Low Contrast Face Test (#253500) . . . . . . . . . . . . . . . . . . . . . . . . . . . . . . . . . 29
Heidi Expressions Test Game (#254500) . . . . . . . . . . . . . . . . . . . . . . . . . . . . . . . . . . . . . . . . 30
Summary . . . . . . . . . . . . . . . . . . . . . . . . . . . . . . . . . . . . . . . . . . . . . . . . . . . . . . . . . . . . . . . . 31
1.800.362.38601.888.362.2576 Fax www.good-lite.com�
Test Instructions
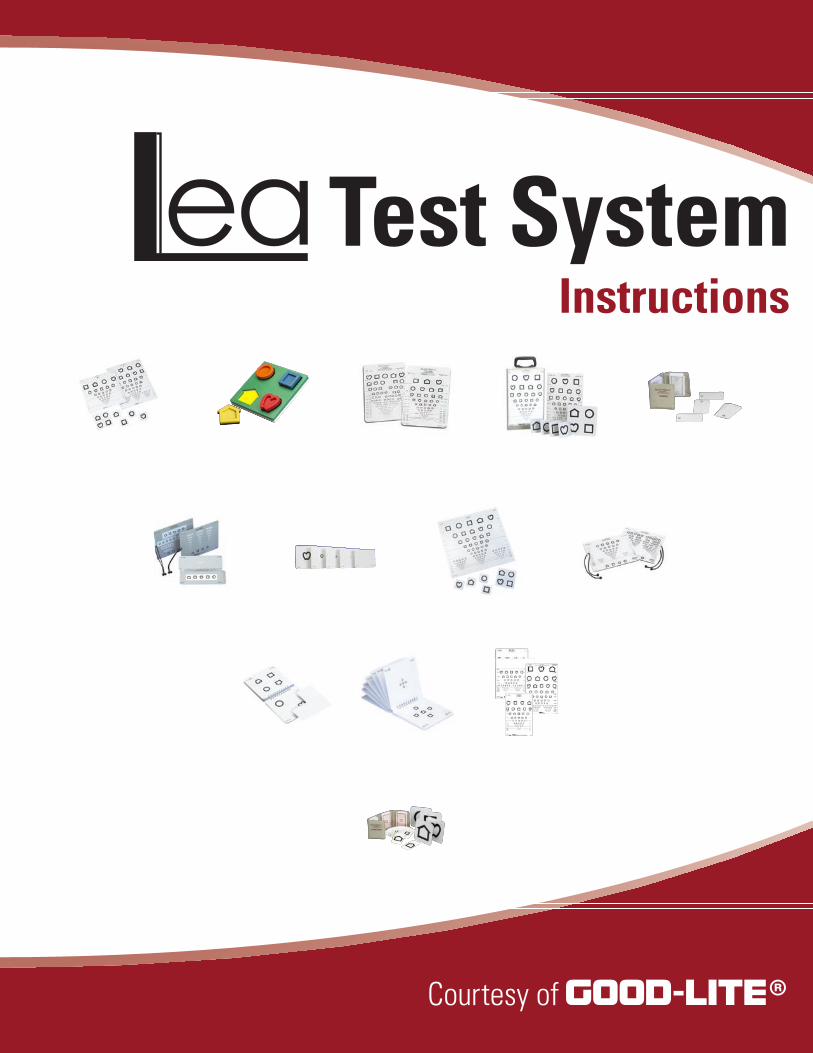
Lea Numbers TestsIntroduction . . . . . . . . . . . . . . . . . . . . . . . . . . . . . . . . . . . . . . . . . . . . . . . . . . . . . . . . . . . . . . 32
15 Line “ETDRS” Style Translucent Distance Chart (#270200) 3 Meter Translucent Distance Chart (#271200) 4 Meter Translucent Distance Chart (#271300) . . . . . . . . . . . . . . . . . . . . . . . . . . . . . . . . . . 32
Near Vision Card with 16" (40 cm) Measuring Cord (#270900) Pocket Near Card (#271000) . . . . . . . . . . . . . . . . . . . . . . . . . . . . . . . . . . . . . . . . . . . . . . . . . 33
3 Meter Folding Distance Chart (#271100) . . . . . . . . . . . . . . . . . . . . . . . . . . . . . . . . . . . . . . 34
Colenbrander Number Low Vision Chart (#272100) . . . . . . . . . . . . . . . . . . . . . . . . . . . . . . . 35
Lea Symbols TestsIntroduction . . . . . . . . . . . . . . . . . . . . . . . . . . . . . . . . . . . . . . . . . . . . . . . . . . . . . . . . . . . . . . 36
15 Line Folding Distance Chart (#250100) 10 Line Folding Distance Chart (#250200) . . . . . . . . . . . . . . . . . . . . . . . . . . . . . . . . . . . . . . 37
15 Line Translucent Distance Chart (#250300) . . . . . . . . . . . . . . . . . . . . . . . . . . . . . . . . . . . 38
13 Line Translucent Distance Chart (#250400) 12 Line Translucent Distance Chart (#252400, #255100) . . . . . . . . . . . . . . . . . . . . . . . . . . . 39
Single Symbol Book (#250600) . . . . . . . . . . . . . . . . . . . . . . . . . . . . . . . . . . . . . . . . . . . . . . . 40
Crowded Symbol Book (#250700) . . . . . . . . . . . . . . . . . . . . . . . . . . . . . . . . . . . . . . . . . . . . . 40
Near Vision Card with 16" (40 cm) Measuring Cord (#250800) . . . . . . . . . . . . . . . . . . . . . . 41
Near Vision Pocket Card (#250900) . . . . . . . . . . . . . . . . . . . . . . . . . . . . . . . . . . . . . . . . . . . 43
Domino Cards (#251500) . . . . . . . . . . . . . . . . . . . . . . . . . . . . . . . . . . . . . . . . . . . . . . . . . . . . 43
3-D Puzzle (#251600) . . . . . . . . . . . . . . . . . . . . . . . . . . . . . . . . . . . . . . . . . . . . . . . . . . . . . . 45
Amblyopia Screening Tests Near Vision Screener with 16 inch/40 cm Cord (#252000) Distance Vision Screener Book, 10 feet/3 meter (#259900) . . . . . . . . . . . . . . . . . . . . . . . . . . 46
Playing Cards (#252500) . . . . . . . . . . . . . . . . . . . . . . . . . . . . . . . . . . . . . . . . . . . . . . . . . . . . 48
Single Presentation Flash Cards (#252700) . . . . . . . . . . . . . . . . . . . . . . . . . . . . . . . . . . . . . . 49
Colenbrander Lea Symbols Low Vision Chart (#258000) . . . . . . . . . . . . . . . . . . . . . . . . . . . 50

1.800.362.38601.888.362.2576 Faxwww.good-lite.com �
Adaptation Tests
Cone Adaptation Test (#252900)We can see in bright daylight and in twilight. In daylight vision (photopic vision) we use cone cells, activity in the cone pathway inhibits the rod pathway. When the luminance level becomes lower, input from cone cells decreases and input from rod cells increases (mesopic vision). When the luminance level decreases further, the cone cells’ contribution to vision stops, colors disap-pear, the image is in different shades of grey because rod cells do not convey color differences (scotopic vision). When we enter a darker place it takes a few seconds before we start seeing colors at the lower luminance level. This is called cone adaptation time.
In retinal degenerations cone cell adaptation time may become longer than normal quite early. Therefore the Cone Adaptation Test can be used for screening of retinitis pigmentosa and follow-up of retinal function.
The test consists of fifteen 5 x 5 cm (� x � in) red, blue and white plastic chips designed to help parents, teachers and doctors be-come aware of a child’s visual difficulties in twilight. The test situation is not a formal test of night vision, but gives useful infor-mation on visual adaptation to lighting changes.
When we enter a room that is darker than the room where we were, during a few seconds, the room looks dark and then we start seeing comfortably. This rapid adaptation to a lower luminance level is possible because cone cells adapt quickly within the range of their adaptation capability. Rod cell adaptation to very dim light is much slower.
In every day life we need to change our adaptation in the adapta-tion range of cone cells more often than in the range of rod cells. Actually, in cities children and many adult persons rarely are in pure scotopic conditions, i.e. where only rod cells function. There is a wide range of luminance levels where both cone and rod cells function. In that range cone adaptation is important because it is faster than the rod adaptation. If colours can be perceived we are within the range of cone cell function. Therefore perception of colours can be used to assess the speed of cone cell adaptation. This was first suggested by Thornton.
Instructions
�. If the child is able to sort colors, mix up the chips on a dark colored table or cloth and direct him or her to put them into three separate groups: red, blue and white. Explain that next time they should be sorted into these three groups as soon as possible after the lights have been dimmed.
�. Dim the lights so the child can still see the colors without difficulty and ask the child to sort the chips. Mix the chips again and turn up the lights to the usual room illumination. Tell the child that next time the lights will be very dim but the chips should be sorted as before.
�. Now dim the lights to a level where you can barely see the colors of the chips after an adaptation period of a few (4-5) seconds. The child will pick the white chips first because they
are the easiest to see and then will try to separate the blue chips from the red chips. If the child makes a mistake, never say anything about it. Mix the chips while in the dark and then turn up the lights to normal room illumination and repeat the play situation. If the child has difficulties in the twilight level of illumination, increase the illumination until the colors can be recognized within a few seconds. This is the minimum level of illumination that is adequate for comfortable visual communication and activities of daily life.
4. It may be that the child could start to perform in the test at the twilight level of illumination, if given more time. Include this in your observations. Do something that makes waiting in the dark pleasant, like telling a story for about �5-�0 minutes. This is a good test situation for follow-up of the condition. At the same time it demonstrates the child’s (person’s) disability to function in situations where (s)he should find something from a darker place, like a closet. Nobody can wait for �5-�0 minutes to start seeing objects in a closet. Such a person needs an extra light in the closet and a good torch/flash light.
You may use normal twilight situations like coming in from an evening walk and not turning on the room lights, but starting with the play situation immediately at that low luminance level.
Remember, changes in night and twilight vision occur so slowly that the child does not notice them. This simple play situation helps to keep you aware of the child’s present visual adaptation level to lighting changes. This includes both speed of adaptation and the final adaptation level reached after a few seconds or longer adap-tation to the dark. Remember to report your observations to the child’s eye doctor.
This simple test situation can be made to a more formal test by standardizing the luminance levels. In the beginning of the test ask the child (person) to look at a white surface for one minute. Use always the same white surface and the same lamp at the same distance so the adaptation to high luminance level is equal in all measurements. Define the mesopic luminance level in similar way, i.e. use a small light in a corner of the room behind the child and the same dark cloth each time. Cone Ad

1.800.362.38601.888.362.2576 Fax www.good-lite.com4
Cognitive Vision Tests
Lea Cognitive Vision Tests
Introduction
Visual information undergoes several neural processes before it is perceived as images. When vision changes, the changes may oc-cur either in the image quality due to disorders of the eyes and/or visual pathways or picture perception is disturbed because of loss of function in some of the specific analytic functions in the vi-sual cortices. Among visually impaired children the number with brain damage related visual impairment is increasing in all coun-tries. Many children have disorders in both the anterior visual pathways, anterior to the lateral geniculate nucleus (LGN), and the posterior visual pathways and cortical and subcortical visual functions. This short overview of the visual pathways is an intro-duction to the use of tests for cognitive visual functions.
Visual pathways from the eyes to the brain have several routes with different functions. The greatest number of nerve fibers in the optic nerve, approximately 80%, belong to the parvocellu-lar pathway that transfers all color information and high contrast black&white information. About �0 percent of the fibers form the magnocellular pathway that transfers all motion information and low contrast black & white information. There are other neurons transferring information to different subcortical structures that are not directly involved with visual perception.
Visual information that is used in the parietal lobe differs from that used in the temporal lobe. One aspect is easy to demonstrate: move your hand quickly in front of your eyes - you see the move-ment of an object that can be recognized vaguely as your hand, you saw no details and have no visual memory of the phenomenon you just watched. The typical features of visual information used in the parietal lobe are perception of objects in motion and very short memory so that the numerous individual images would not block the function.
Visual functions for orientation in egocentric space and eye-hand coordination most often use visual information in motion, real or relative, i.e. the observer, the eyes or the head are moving when observing a non-moving object. During normal visual function-ing information processing in the parietal lobe is synchronized with the information processing in the temporal lobe. If the ven-tral stream functions including form perception are disturbed and the dorsal stream functions remain intact, the child/person does not bump into objects, orientation in space may be good, grasping objects clearly based on visual cues and yet the child or person does not learn to recognize visual forms. The person is sighted in some functions, blind in others, a “sighted blind person”.
Since there are parallel pathways (the retinocalcarine and the tec-tal pathway) to the dorsal stream, but only one pathway (the reti-nocalcarine pathway to the ventral stream) it is possible that visual functions in the ventral stream are extinguished when those in the dorsal stream remain normal or much less impaired. Cortical lesions after infections may be patchy, sometimes affecting only one cognitive visual function like recognition of facial features. Likewise, subcortical lesions may sometimes affect only one func-tion. Accommodation is one of the functions that may be affected without changes in convergence or miosis, even if all three func-tions are closely related in the Edinger-Westphal nucleus.
If damage to the nerve fibers in the pathway between the lateral geniculate nucleus and the primary visual cortex is patchy and involves only part of the macular fibers visual acuity and con-trast sensitivity may be normal when measured with single symbol tests. However, when visual acuity is measured with line tests with the same symbols, it may be several lines less than the single sym-bol value. This phenomenon is called ‘increased crowding phe-nomenon’ and occurs in both eyes of the child or adult and not in one eye as in the usual amblyopia, ‘lazy eye’.
In the primary visual cortex and the specific cell groups that pro-cess the information further, the different structures of the image, like color, orientation of lines and motion, are separated from each other (Figure 2). They are brought together in the higher func-tions and thus we do see colour on the object and not next to its form. After long standing blindness, restoration of sight through surgery may lead to strange perceptual phenomena like seeing the color floating above the object.
If cell groups that take care of specific processing are damaged, they cannot be replaced by other cell groups. Therefore it is im-portant that all cognitive visual functions are assessed, from see-ing the orientation of lines and size of objects to different recogni-tions functions and more complicated perceptual tasks. If a child has lost recognition of facial features only (s)he may be misunder-stood when (s)he does not greet people whom (s)he knows well. Likewise children who do not perceive facial expressions may be taken as autistic when they cannot function in a group of toddlers whose communication is through body language. These children need to have an interpreter who explains what is going on in the group and the play situations should be well structured and not noisy. These children are blind in communication situations and should be treated as such.
| | | | | | | | | | | | | | | | | | | | | | | | | |
DS
V1
OA
VS
OTCH
ON
M| || | |
| | || | |
| | | || | | | | | | | | | | | | | | | | | | | | | | | | | | | | | | | | | | | | | | | | | | |
LGN
SC PU
Figure 1. Visual pathways from the eyes to the brain have two main routes: 1. the retinocalcarine pathway via the lateral geniculate nucleus (LGN) to the primary visual cortex (V1) and from there upwards as the dorsal stream to the parietal cortex or downwards as the ventral stream to the inferotemporal lobe; 2. the tectal pathway via superior colliculus (CS) and pulvinar (PU) to the parietal visual functions.

1.800.362.38601.888.362.2576 Faxwww.good-lite.com 5
Cognitive Vision Tests
Visual form perception may be lost but forms may be perceived and learned through tactile and haptic exploration. The child may be able to grasp objects with normal eye-hand-coordination (dor-sal stream function) and yet may not learn to visually compare the sizes of these objects (ventral stream function). Often these children are felt ‘to see when they want to see’ but most often this interpretation is erroneous - there is loss of a specific function in visual perception.
Tests for cognitive vision were designed for early diagnosis of some usual cognitive problems. They can be used as toys in day care, nursery and at home to support early assessment and early intervention of children with visual impairment.
Factors affecting the test situations
When observing or assessing a certain visual function the tester needs to be aware of other functions that may not be normal and that may interfere with the child’s performance in a task. In a number of test situations the expected response is a motor re-sponse, following movement or a quick saccade. To perform such a motor response depends on several prerequisites:
• the child is able to direct attention to the test stimulus
• the child can plan following movements or saccades
• the child does have the motor functions to execute the plan
• the test stimulus is within the visual field of the child
• the test stimulus is presented within the visual sphere of the child
• the position of the child does not inhibit the response
These prerequisites are especially important in all preferential-look-ing situations. The size and quality of the visual field need to be known. Otherwise we might interpret a weak response as a result of poor attention. Attention and motivation to look at a stimulus vary even within a normal visual field: objects with high contrast, bright colour or shining surface often cause a stronger response than some less visible objects. However, large low contrast pictures in motion often seem to interest infants and young children.
The type of fixation needs to be known. If a child has eccentric fixation, (s)he seems to look past the stimulus when looking at it. Some children have roving eye movements without stops for fixation. It may be necessary to use video films for more careful observation on what the child has been looking at. If a child has strabismus it may be difficult to know which eye is used for fixa-tion. In that case covering one eye at a time may solve the prob-lem. If eye movements are irregular, it is advisable to discuss with the child’s ophthalmologist their effect on the test situations.
Since a child’s way of fixating may change over time it should be described in each report and recorded on video when possible.
Visual sphere
All examinations and play situations need to be within the child’s visual sphere. Although this is self evident it is not always followed in assessment of vision. Measurements should not be close to the outer limit of the visual sphere but well within it. If it is large enough measurements may be made at several distances from the child.
If a child’s visual sphere has not been measured before, it can be assessed as one of the first things in the beginning of an assess-ment. The tester’s face is a good stimulus. Other easily available stimuli are colorful toys. Hiding Heidi pictures measure visual sphere for communication but also depict visual sphere for obser-vation of the environment.
Visual field
If a child’s visual field has not been measured its size can be rough-ly assessed using confrontation techniques. These do not reveal the structure of the visual field in more detail. There may be sco-tomas, patchy loss within the visual field. Small scotomas in the central visual field may disturb reading, especially when the child is learning to read. When the scotoma is so small that only one or two letters fall within it, the child is not aware of it. It is ‘filled in’ by visual information from the surrounding areas. Older children may notice bending of lines toward each other in Amsler chart but that cannot be noticed when watching the environment.
All tests need to be presented within the visual field of a child. Tests like grating acuity cards or Lea Gratings or Hiding Heidi cards can be presented vertically if there is hemianopia, loss of one half of the visual field, or in the upper part of the visual field when the lower part of the visual field does not function.
Visual attention
Attention deficits may be limited to one half of the visual field, often at the side of hemiplegia. In a infant this may look like hemianopia. However, if the infant is regularly stimulated on this functionally blind side some visual function may appear and at the age of two years there may be no measurable difference in the function of the two field halves. In that case there never was hemianopia but poor attention to visual information.
dorsal stream
ventral stre
am
PP PO
ST TP
IT
V4
V5 V3 V2 V1
Figure 2. Simplified diagram of visual pathways from V1 to higher visual functions.

1.800.362.38601.888.362.2576 Fax www.good-lite.com�
Cognitive Vision Tests
Following movements and saccades
When following movements or saccades are expected as a response their quality needs to be tested first. As stimuli one can use large playthings like Lilly & Gogo dolls or the child’s favorite toys. If eye movements have not yet differentiated from the head movements, head movements are accepted as following (tracking) movements and saccades.
Saccades can be observed in a play situation like the following: The tester entices the child to look at her/his face. When the child is fixating on the tester’s face an interesting stimulus like the Lilly finger puppet is presented next to the testers face. If the child shifts fixation to the doll, it is shown to the child for a short while. Then the child is made aware of the tester again and when the child is looking at the tester, the Gogo finger puppet is presented on the other side of the face. If there is a difference in the saccades to right and left it is discussed with the child’s ophthalmologist. If saccades up and down are symmetric tests are presented in verti-cal direction.
It should be kept in mind that large saccades observed in play situ-ations are different from the minute saccades used during reading. Then the planning and excecution of saccades occurs at the same time as the child/person is using sensory functions to perceive both the word to be read and simultaneously the location of the next word, whereupon the saccade should land.
Illumination and position
A child’s needs in terms of luminance level and posture are con-sidered during testing. Testing is usually started in an optimal posture. Later observations are made in all the postures where the child is positioned during the day.
Video recordings
During an intensive play situation it is not possible to simultane-ously observe the responses of a child. Another person may func-tion as the observer or the play situation is recorded on video for later analysis by the vision team, early intervention team and by the child’s neurologist. When testing an infant or a child who does not move a recording can be made by the tester by placing the video camera on a tripod. If the camera can be connected to a TV behind the child the tester can check that the child is positioned within the picture area and does not get outside the picture.
Eye movements during reading can be recorded with eye trackers if the child has good enough head control and fixation so that calibration of the test is accurate. Children who have poor head control and great problems with eye movements and crowding, are best examined by video recording eye movements using a mir-ror and transparent texts.
3-D Puzzle (#251600)The LEA 3-D Puzzle is designed for training and assessment of normal infants, young children and older children and adults at early developmental levels. The puzzle is also a tool in neuropsy-chological assessment of patients with brain damage. If the child cannot grasp the puzzle pieces but can grasp a champagne bottle cork, glue a small flat magnet on the cork and a small flat piece of metal on the puzzle piece.
The aim in the play training of infants and young children is to help them to develop the concept same/different as a prerequi-site for measurement of visual acuity much earlier than is possible without training with this educational toy.
A �0-�� month-old infant will put the puzzle pieces in his/her mouth and bang the floor or the table with them. Give only the square and the round puzzle pieces at this stage and also during the next stage when the child starts to drop or to throw the puzzle pieces, often throwing the puzzle board also. This is a recognized phase in the normal development of auditory space, the child is not mischievous. Since the board is heavy, it may break something if thrown with force so watch the child and rescue the board be-fore it is thrown or catch it in midair.
At the next level the child starts to study the cut-outs of the puzzle and may by chance put the round, orange puzzle piece in the or-ange cut-out, later the blue square puzzle piece into the blue cut-out. When the child repeats this activity and starts to do it with obvious intention, let him/her try the apple and house puzzle piec-es that require better motor skills than the circle and the square.
When the child can place all four colored pieces in their cut-outs introduce the black and white side starting again with the circle and the square. When the child masters placing the black-and-white puzzle pieces in their cut-outs, introduce the concept of pictures representing objects by drawing around the puzzle pieces and studying with the child the resulting picture and the fact that the piece can be placed on it. When the child starts to place the

1.800.362.38601.888.362.2576 Faxwww.good-lite.com �
Cognitive Vision Tests
puzzle pieces on these big pictures, introduce smaller pictures of these forms. When the child starts to place the puzzle pieces on the smaller pictures (s)he is ready to be tested using single sym-bol tests, either the Lea Playing Cards or the Lea Domino Cards. This development usually happens between �8 and �4 months and thus visual acuity can be measured more than a year earlier than has been customary.
Training of the concept similar/different follows the same pattern in the early habilitation of vision impaired infants and in assess-ment of vision of children with multiple impairments. Children with brain damage related visual impairment may learn to match colors but may have much greater difficulties in learning to match forms, or may be unable to learn it due to specific loss of per-ception of geometric forms. Some children may learn to match the black-and-white forms during a half an hour play therapy but forget the concept as soon as the activity ends. They are unable to store the new knowledge from their working memory to their long-term memory.
During play it is also possible to observe such functions as ori-entation in egocentric space and eye-hand coordination. A child may have problems in turning the puzzle pieces to fit the cut-outs. In such a situation enough time needs to be allowed if the child has motor problems to assess whether there are problems in visual planning or visual feed-back during the task or whether the slow motor performance is a pure motor problem.
Since video recordings are helpful in the assessment of cognitive visual problems, sequences from assessments of children with dif-ferent types of brain damage are collected in the CD (#�80�00). They show great variation in responses of children with brain damage during this matching game and are thus useful in teach-ing teachers and therapists as well as other categories of workers related to vision impaired children. Very short sequences are also at “My Sight is Important”.
Heidi Fixation Targets (#253000, #253100)The smallest fixation stick (#�5�000) in the test materials has a picture of a smiling face 5cm (� in) in diameter. This kind of happily smiling face was chosen based on the studies by Robert Fanz. Normally developing infants respond to it, follow it with combined eye and head movements at the age of three months. On the reverse side of the face there is a grating. In the examina-tion of young infants turning the fixation stick gives the infant ‘something new’ to look at when the picture has been hidden for a few seconds. This fixation stick was designed in the early 80’s and has been used by thousands of public health nurses and doctors.
On the other end of the fixation stick there are small pictures of a bunny and of a giraffe. They are designed for the health control at the age of � years and later to have something that the child needs to accommodate carefully on to see the details of the images. By asking the child for example “Does the bunny have one or two ears? Does it move its tail? Does it look like the giraffe has four ears? Did you know that giraffes have horns between their ears?
etc” one can keep the child’s fixation on this accommodative tar-get while assessing the alignment of the eyes.
On the handle of the fixation stick there are also pictures to be used in the measurement of the size of the pupils and the diameter of the corneas.
The larger (�� cm, 5 in) fixation picture (#�5��00) is for the assess-ment of severely visually impaired and multi-impaired children to define how far the infant or child responds to a high contrast face picture. This way there is a standardized picture for comparison of the child’s behavior in different environments.
Lea Gratings (#253300)In adults visual acuity is measured as “recognition acuity,” which uses standard line tests. This type of test cannot be used in exam-ining infants and children with multiple handicaps. Visual acuity in these individuals is measured with grating acuity tests.
In this grating acuity test, the infant or child detects the presence of parallel lines of decreasing width, a task simpler than recogniz-ing optotypes. When a striped pattern is presented in front of an infant simultaneously with a gray surface of the same size and lu-minance, the infant is likely to look at the striped pattern because there is more to see than on a gray surface.
The Lea Gratings test uses paddles to present gratings. The handle allows the tester to hold the test easily.
The gratings are defined by the frequency, i.e., the number of pairs of black-and-white stripes or cycles, within one degree of vi-sual angle. When grating is printed on a surface, it can be defined also as the number of cycles per centimeter of surface.
When a grating is held at 5�cm (~ � feet) distance from the in-fant’s face, one centimeter equals one degree of visual angle. This is a convenient test distance because number of cycles/cm corre-sponds to grating acuity as cycles per degree.
Infants and children at an early developmental level may not re-spond to stimuli placed at 5�cm distance. Their visual sphere may be limited to less than � 0cm (~ � foot). When the gratings are
1.800.362.38601.888.362.2576 Fax www.good-lite.com8
Cognitive Vision Tests
held at half the 5�cm distance, the number of cycles per degree (cpd) is half of that at 5�cm. If the infant’s response can be elic-ited only at �5cm (~ �/� foot), �/4 of the original distance, the frequency of the grating is �/4 of the value printed on the test. If the child responds to the stimuli at about � meter (exactly ��4cm or ~ 4 feet), the grating acuity values are twice the value printed on the test.
In the examination of infants it is advisable to choose test dis-tances that are parts or multiples of 5�cm, i.e. �8cm, 4�cm, 85cm or ��5cm. Longer distances are rarely used.
Instructions
Make sure the background setting (including your clothing) is either evenly light gray or even dark color to avoid patterns that could distract the infant. If the infant’s visual sphere is limited, the surrounding visual information does not affect the child. However, these children are often disturbed by even weak noises and uncomfortable or unusual body postures.
Start with the coarsest grating. Show the infant the grating simul-taneously with the gray stimulus. Then show every other grating in succession. This is made easy by placing the 4.0cpcm grating facing the table, the � cpcm grating facing the 8 cpcm grating (which is on the opposite side of the 4 cpcm grating). The top paddle is placed with the 0.�5 cpcm grating facing the � cpcm grating (on the other side of the � cpcm grat-ing). When you have shown a grating place the paddle on the table with the grating fac-ing upwards. This way the grating on the other side of the paddle is ready for presentation.
If the infant responds to the 0.�5 and the �.0cpcm grating, but not to the 4.0cpcm grating, present the �.0cpcm grating. The threshold is found quickly before habituation occurs. If the infant or child seems to lose interest, show a face figure (#�5��00 Large paddle, or #�5��00 Medium paddle) or colorful toys to moti-vate him or her to respond again.
Presentation of the Stimuli
The measurement is based on observing the child’s eye move-ments when the grating paddles are presented to the child. The test situation can arranged as a play situation for example so that the parents show the paddles and the child points to the parent who has the grating.
Children with brain damage in the cortical areas that handle mo-tion perception or in pathways leading to these areas may show responses that reveal their abnormal perception of movement. When the grey sur-face and the grating are moved in opposite directions, some children look confused and do not follow the movement of the grating but make a quick shift of gaze to the grating when it stops. This may be a sign of difficulties in seeing moving objects. On the other hand, some children have normal tracking movements, either eye movements or a combination of eye and head movements, but look surprised and confused when the grating stops. They may not have visual functions to perceive objects that stand still. Both obser-vations need to be confirmed in other test situations.
When grating acuity has been measured the result needs to be expressed in cycles per degree (cpd) Some tests express the result as optotype (Snellen) acuity values. In visually impaired children it is impossible to predict what the optotype acuity might be when only the grating acuity can be measured.
Why do we need to use “cycles per degree”, why not the visual acuity values?
Grating acuity tests measure function of the visual field in a much larger area than do the optotype tests (letters, numbers, symbols), i.e. the tests measure function of different retinal areas. Recogni-
57cm to the camera
114cm to the camera
1.0
CP
CM
1.0 CP
CM
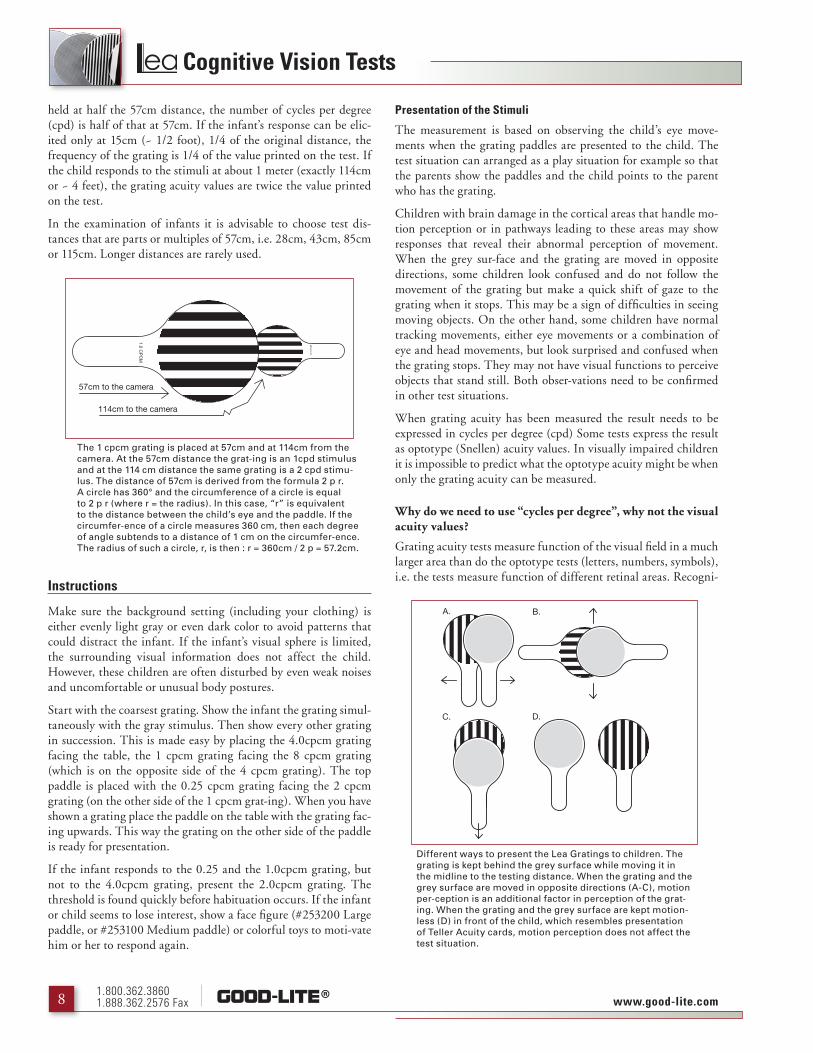
The 1 cpcm grating is placed at 57cm and at 114cm from the camera. At the 57cm distance the grat-ing is an 1cpd stimulus and at the 114 cm distance the same grating is a 2 cpd stimu-lus. The distance of 57cm is derived from the formula 2 p r. A circle has 360° and the circumference of a circle is equal to 2 p r (where r = the radius). In this case, “r” is equivalent to the distance between the child’s eye and the paddle. If the circumfer-ence of a circle measures 360 cm, then each degree of angle subtends to a distance of 1 cm on the circumfer-ence. The radius of such a circle, r, is then : r = 360cm / 2 p = 57.2cm.
A. B.
C. D.
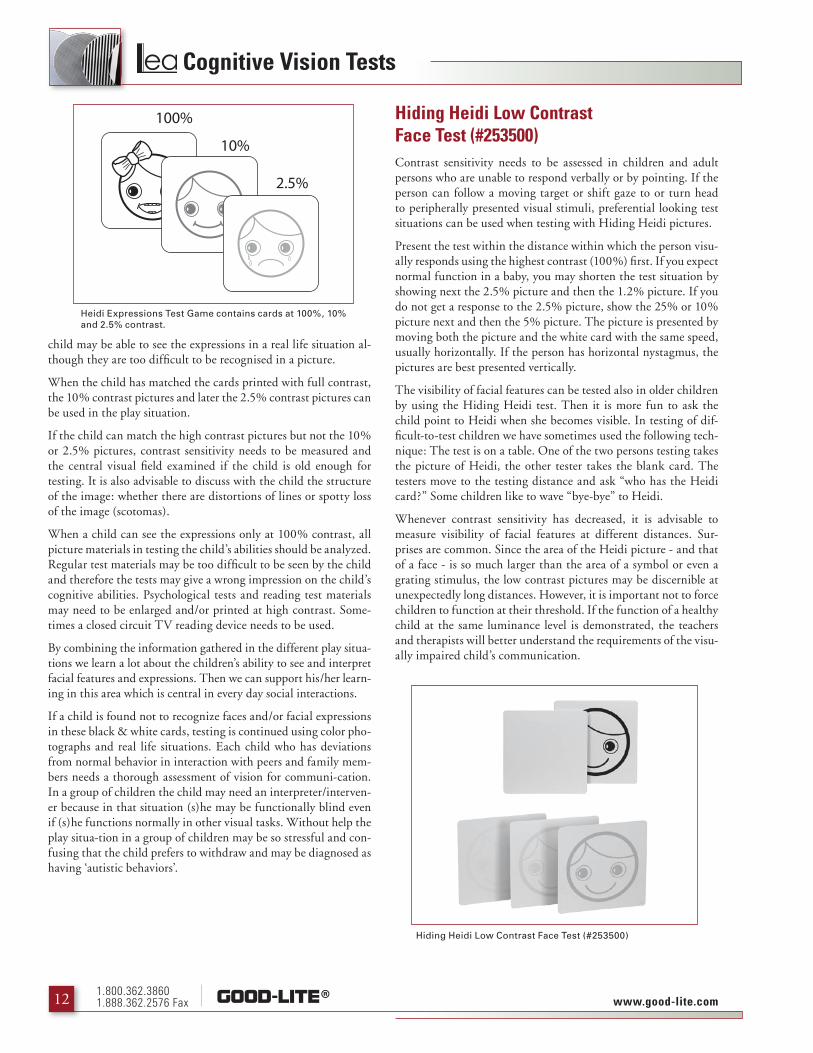
Different ways to present the Lea Gratings to children. The grating is kept behind the grey surface while moving it in the midline to the testing distance. When the grating and the grey surface are moved in opposite directions (A-C), motion per-ception is an additional factor in perception of the grat-ing. When the grating and the grey surface are kept motion-less (D) in front of the child, which resembles presentation of Teller Acuity cards, motion perception does not affect the test situation.

1.800.362.38601.888.362.2576 Faxwww.good-lite.com �
Cognitive Vision Tests
tion of an optotype, except E and C, is a much higher and more demanding visual task than resolving straight lines. The responses come from different functions of the brain. Therefore there is no correct way of converting grating acuity values to optotype acuity values. Physically, resolution of a �0 cpd grating requires the same resolution as an �.0, �0/�0, �/� Snellen-E. However, this is true only in normal adult foveal vision, and even there it is not exactly the same. Outside the fovea toward the periphery, grating acuity decreases more slowly than do optotype acuities.
In low vision the relationship between grating acuity and optotype acuity varies as much as: between �:� i.e. the two values are equal, and �:�0, i.e. grating acuity is �0 times better than the optotype acuity. Knowing the type of lesion, an experienced clinician can make a fairly accurate guess what the optotype acuity could be. However, the error may be sizeable. Therefore it is not wise to convert grating acuity values into opto-type acuity values.
When explaining the results to people who are not familiar with grating acuity measurements, you can show the grating that the infant or child responded to and say: “As you saw, your child could respond to these fine lines at this distance. This kind of grating is called .. (e.g. � cycles per cm, which means that there are two pairs of lines in each centimeter of the surface). When this kind of grating was shown at approximate-ly 5�cm distance, there are four lines, two cycles per degree.” If you explain grating acuity this well, the people will understand grating acuity much better than they will ever understand optotype acuities. (How many of the readers can explain what a certain optotype acuity value means?)
What to do when the parents and the fellow teachers do not understand the “cpd”?
They do not understand the optotype acuity value either if you do not show how big an optotype is e.g. a 0.�, �0/��, �/�8 opto-type. Similarly, you can show the grating that the infant or child responded to and say: “As you saw, your child could respond to so fine lines at this distance. This kind of grating is called .. (e.g. � cycles per cm, which means that there are two pairs of lines in each centimeter of the surface). When this kind of grating was shown at approximately 5�cm distance, there are four lines, two cycles per degree.”
If you explain grating acuity this well, the parents understand grating acuity much better than they will ever understand op-totype acuities. (How many of the readers can explain, what a certain optotype acuity value means?)
What is normal at different ages?
The illustration below shows the range of normalcy at different ages. Values that are clearly below the lower line are highly likely to be deviant (except when the infant or child was tired or fuzzy). Values that are above the upper line are likely to be good normal values. Values within the range of normal are normal but do not mean that vision would be developing normally.
Grating acuity alone is a poor depictor of visual function.
Therefore, never say that the child’s vision was measured to be normal. Say that “grating acuity value was within the range of normal, other observations and measurements are needed to give
AGE (weeks)
0 10 20 30 40 50 60
20
10
5
2
1
0.5
VIS
UA
L A
CU
ITY
(cyc
/deg
)

1.800.362.38601.888.362.2576 Fax www.good-lite.com�0
Cognitive Vision Tests
a more complete picture of the child’s visual function”.
Prerequisites For Measurement Of Grating Acuity
During the measurement of grating acuity, we expect the infant/child to respond with smooth tracking or rapid eye turn to the grating when it is presented. This response requires that:
�. The infant or child sees the grating in that part of the visual field;
�. The infant or child can direct his or her attention to the stimulus;
�. The infant or child has the ability to plan tracking or the saccade toward the target;
4. The infant or child has the motor function of the eye muscles to execute the plan; and
5. The stimulus is presented within the visual sphere of the infant or child.
To evaluate the response correctly, several functions of the infant or child have to be known:
1: Visual Sphere
Use the high contrast face figures to measure how far the stimuli can be moved back before the infant or child loses interest. Always test well within the child’s visual sphere.
2: Fixation
The normal response to look at something is to look straight at it, also called “central fixation.” If the central part of the visual field is not functioning properly, there is central scotoma. The infant or child uses an extrafoveal area for viewing and seems to look past the stimulus, although actually looking at it. Therefore, it’s important to know what kind of fixation the infant or child uses.
3: Visual Field
The infant’s visual field is measured previous to the grating acuity measurement. If there is visual field restriction on one side, make sure the gratings are presented within the child’s visual field.
4: Saccades
When the infant or child is expected to make a swift saccadic movement as the response, the ability to perform saccades must be present. This is tested with interesting playthings of the same size and interest value presented on both sides of the midline. The infant or child is enticed to look at the tester’s face. When the fixation is in the midline, one of the objects is presented at about �0-�0cm from the midline, or closer when necessary. Note the latency, speed and accuracy of the saccadic movement. The infant or child is again enticed to look at the tester’s face after which the other object is presented on the other side. If there is a dif-ference in the qualities of the saccades toward the two stimuli, motor functions should be evaluated more closely with the child’s ophthalmologist after the attentional component is tested.
5: Visual Attention
In children with attention problems, test the symmetry of visual attention at the same time the infant or child is being tested for saccadic movement. If there is asymmetry in the saccadic move-ment, assess whether the response becomes symmetric by increas-ing the size of the stimulus on the side of weaker response. For example, present the smallest fixation stick (#�5��00) on the bet-ter functioning side and the medium size stick (#�5�000) on the less functioning side and observe whether the responses become equal.
In an extreme case, the largest fixation stick (#�5��00) is used along with the smallest fixation stick before equal saccadic re-sponses are elicited. If the horizontal halves are unequal or when there is horizontal nystagmus, test whether responses to the verti-cally presented stimuli are more symmetric.
Grating acuity at different distances
On each grating paddle the frequency of the printed grating is given as cycles per centimeter (cpcm). At the distance of 5� cm (��.5”), � centimeter equals � degree of visual angle*. Thus, only at that distance the cycles per degree value of each grating is equal to the cpcm printed on the paddle. For example, at 5�cm, the 0.�5
Distance in CM (Inches)Cycles Per Centimeter (cpcm): Printed On Paddles
0.25 0.50 1.00 2.00 4.00 8.00
29 cm (11.5”) 0.12 cpd 0.25 cpd 0.50 cpd 1.00 cpd 2.00 cpd 4.00 cpd
57 cm (22.5”) 0.25 cpd 0.50 cpd 1.00 cpd 2.00 cpd 4.00 cpd 8.00 cpd
86 cm (34”) 0.40 cpd 0.75 cpd 1.50 cpd 3.00 cpd 6.00 cpd 12.00 cpd
Grating Acuity Reported in Cycles Per Degree

1.800.362.38601.888.362.2576 Faxwww.good-lite.com ��
Cognitive Vision Tests
cpcm paddle is equal to 0.�5 cpd. When the paddle is brought closer, the number of cycles per degree decreases. When used at a distance longer than 5�cm, the number of cpd increases. In the table below, cpd values are calculated at some common distances. If another distance is used, the cpd results can be calculated using this formula:
*NOTE: This is derived from the formula below. A circle has ��0° and the circumference of a circle is equal to � p r (where r = the radius). In this case, “r” is equivalent to the distance between the child’s eye and the paddle. If the circumference of a circle measures ��0 cm, then each degree of angle subtends to a dis-tance of � cm on the circumference. The radius of such a circle is then calculated as follows:
Heidi Expressions Test Game (#254500)Heidi Expressions Test Game has been developed to improve early evaluation of vision for communication. Among the visually im-paired children there are some who cannot see expressions and/or do not recognize people by their faces. These children may have nearly normal results in routine vision tests (large visual field and normal or near normal visual acuity.) Other visually impaired children may have this deficit in visual recognition as a part of more extensive loss of visual functions.
Many children have Cerebral Palsy, which, however, may be so mild that it has not required special treatment.
If the child’s difficulties are not known and understood, his/her behavior may cause misunderstandings and needless negative experiences in social interactions. Therefore, testing of a child’s
ability to see differences between different facial expressions is an important part of functional visual assessment.
Visually impaired children have two different kinds of problems in learning to recognize faces and to interpret facial expressions:
�. they do not see expressions well enough to interpret them (=pathway problem) or
�. they have brain damage in the area of face recognition and therefore do not recognize differences in people’s faces and may also have difficulties in interpreting expressions (=cognitive visual problem).
It is possible to observe which type of problem the child has dur-ing the Heidi Expressions test game . In some cases the child may have poor quality of image and poor facial recognition.
Play situation:
The Heidi Expressions Test Game can be used from the age of �0-�� months when teaching the child how people look when they have the six basic expressions depicted on the cards. Matching the cards gives a natural situation to discuss the different expressions.
Depending on the child’s age and communication level the match-ing game is varied. First the cards can be looked at and the expres-sions discussed. The tester and the child may make the expres-sions themselves. With an older child it is possible to reflect upon the causes why Heidi might be glad, sad, serious or weeping.
During this discussion it is possible to observe whether the child has to look very close on the cards and the tester’s face to see the expressions or whether the child seems to have difficulties in un-derstanding the concept of facial expressions. In the latter case tactile information is used as additional information. It may be that the child needs to feel the facial features to perceive the ex-pression and to recognize them.
Drawing pictures of faces can be combined to the Heidi Expressions Test Game. Draw the circle and the eyes and ask the child “Which expression does Heidi have this time?”. The child may draw the mouth or the tears assisted by the tester when needed. This is another effective way to make the child aware of the structure of expressions. At the same time it can be used to create picture perception as such, to teach the child to understand how a picture represents an object. The expressions can also be created by using pipe cleaners for the mouth and buttons for the eyes glued on a small paper plate as an activity in nursery or kindergarten. The child’s creations can be used to observe which features the child uses in the recognition of his/her picture.
When the child seems to understand the six different basic ex-pressions, the cards can be matched. First only six cards are chosen, for example the smiling Heidis and the weeping Hei-dis. If the child does not have cognitive visual functions for fa-cial recognition, he/she may match the faces with the bow as equal. This needs to be discussed with the child by showing once more on the tester’s face how the different expressions look. The
Heidi Expressions test game contains six different basic expressions (see under the heading.) Each expression is on two exactly identical cards and on a third card which has one additional feature, a bow on Heidi’s hair. In this picture are the sets of three cards depicting smiling Heidi and sad Heidi.
1.800.362.38601.888.362.2576 Fax www.good-lite.com��
Cognitive Vision Tests
child may be able to see the expressions in a real life situation al-though they are too difficult to be recognised in a picture.
When the child has matched the cards printed with full contrast, the �0% contrast pictures and later the �.5% contrast pictures can be used in the play situation.
If the child can match the high contrast pictures but not the �0% or �.5% pictures, contrast sensitivity needs to be measured and the central visual field examined if the child is old enough for testing. It is also advisable to discuss with the child the structure of the image: whether there are distortions of lines or spotty loss of the image (scotomas).
When a child can see the expressions only at �00% contrast, all picture materials in testing the child’s abilities should be analyzed. Regular test materials may be too difficult to be seen by the child and therefore the tests may give a wrong impression on the child’s cognitive abilities. Psychological tests and reading test materials may need to be enlarged and/or printed at high contrast. Some-times a closed circuit TV reading device needs to be used.
By combining the information gathered in the different play situa-tions we learn a lot about the children’s ability to see and interpret facial features and expressions. Then we can support his/her learn-ing in this area which is central in every day social interactions.
If a child is found not to recognize faces and/or facial expressions in these black & white cards, testing is continued using color pho-tographs and real life situations. Each child who has deviations from normal behavior in interaction with peers and family mem-bers needs a thorough assessment of vision for communi-cation. In a group of children the child may need an interpreter/interven-er because in that situation (s)he may be functionally blind even if (s)he functions normally in other visual tasks. Without help the play situa-tion in a group of children may be so stressful and con-fusing that the child prefers to withdraw and may be diagnosed as having ‘autistic behaviors’.
Hiding Heidi Low Contrast Face Test (#253500)Contrast sensitivity needs to be assessed in children and adult persons who are unable to respond verbally or by pointing. If the person can follow a moving target or shift gaze to or turn head to peripherally presented visual stimuli, preferential looking test situations can be used when testing with Hiding Heidi pictures.
Present the test within the distance within which the person visu-ally responds using the highest contrast (�00%) first. If you expect normal function in a baby, you may shorten the test situation by showing next the �.5% picture and then the �.�% picture. If you do not get a response to the �.5% picture, show the �5% or �0% picture next and then the 5% picture. The picture is presented by moving both the picture and the white card with the same speed, usually horizontally. If the person has horizontal nystagmus, the pictures are best presented vertically.
The visibility of facial features can be tested also in older children by using the Hiding Heidi test. Then it is more fun to ask the child point to Heidi when she becomes visible. In testing of dif-ficult-to-test children we have sometimes used the following tech-nique: The test is on a table. One of the two persons testing takes the picture of Heidi, the other tester takes the blank card. The testers move to the testing distance and ask “who has the Heidi card?” Some children like to wave “bye-bye” to Heidi.
Whenever contrast sensitivity has decreased, it is advisable to measure visibility of facial features at different distances. Sur-prises are common. Since the area of the Heidi picture - and that of a face - is so much larger than the area of a symbol or even a grating stimulus, the low contrast pictures may be discernible at unexpectedly long distances. However, it is important not to force children to function at their threshold. If the function of a healthy child at the same luminance level is demonstrated, the teachers and therapists will better understand the requirements of the visu-ally impaired child’s communication.
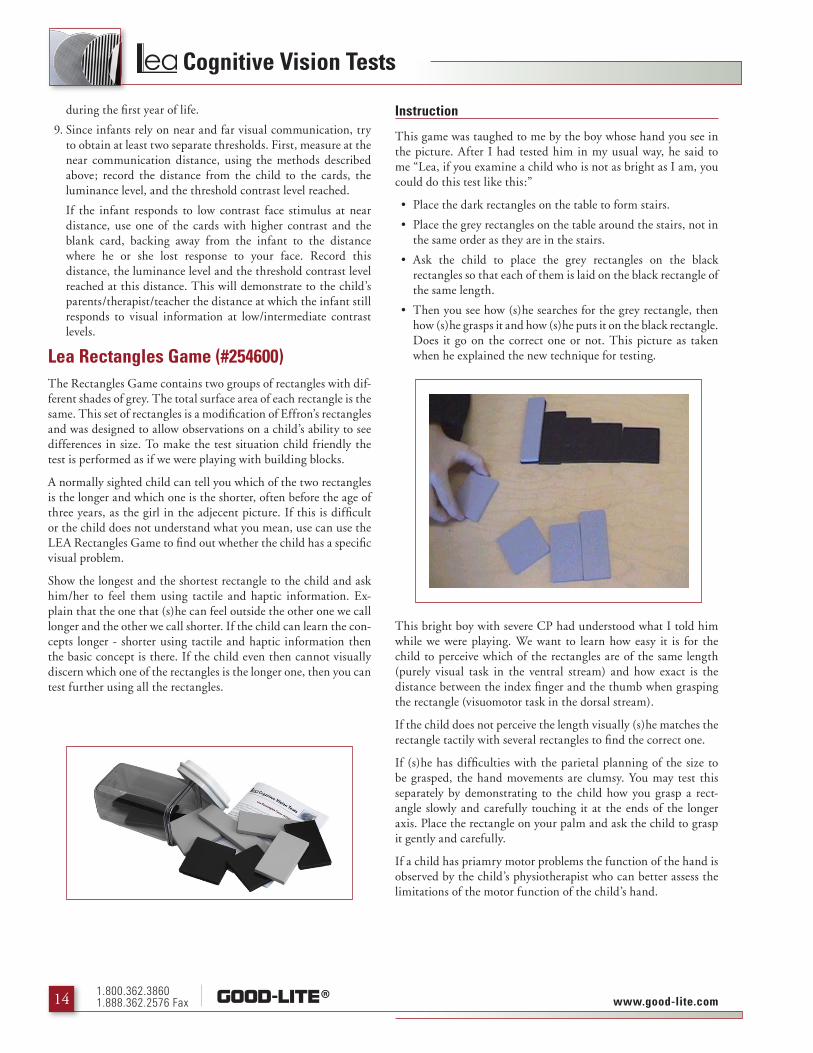
Hiding Heidi Low Contrast Face Test (#253500)
Heidi Expressions Test Game contains cards at 100%, 10% and 2.5% contrast.

1.800.362.38601.888.362.2576 Faxwww.good-lite.com ��
Cognitive Vision Tests
The ability to detect objects of low contrast is an important com-ponent of the visual system. Determining the levels of contrast that an infant can detect, helps planning information for inter-vention and provides a baseline to evaluate future changes. Devia-tions from usual behavior may indicate disorders that leave vision at high contrast levels unaffected.
Visual communication is the most important way of communi-cating during the first year of life. Expressions on faces are medi-ated by faint shadows and changes of the contours of the mouth and eyes. Most facial expressions are in low contrast, so an infant’s reaction to the Hiding Heidi Low Contrast Cards offers useful in-formation. The cards can also be used with multihandicapped people.
If an infant only responds to high contrasts, the people in his or her life should be aware of this problem and make their faces more visible. This can be done by wearing lip and eye liners, bright lipstick and eyeglasses with dark frames.
Instructions
Even though “infant” is referenced in the following instructions, the directions also apply for young children and multihandi-capped people.
�. Stack the Hiding Heidi Low Contrast Cards sequentially with the �.5%, �0% and �00% faces downward, in that order. Since the �5%, 5% and �.�5% faces are on the opposite side, they will face up.
�. Position the infant so he or she faces the examiner and in the optimal position for best visual performance. Support his or her head so involuntary motor movements least affect the infant’s performance. The infant can look over the parent’s shoulder while being held, sit in their lap or in the child’s buggy. Consider the infant’s most comfortable position. If possible, select the best time of day when the infant is most alert. Note any differences in performance when not taking the above into consideration.
�. Before observation of the infant’s responses to the Hiding Heidi faces, familiarize yourself with the infant’s usual response pattern and look for: the head turning toward an interesting visual object, eye widening, breathing, quieting, eyebrow arching, smiling, babbling to or reaching for an object. This will help detect if there are variations of these patterns as the infant fixates on the Hiding Heidi faces. Familiarize and prepare the infant for locating Hiding Heidi in whatever way is appropriate to his or her level.
4. During your communication with the infant, notice how far you can back away from the infant without losing his or her attention to your face. Record this distance, so you can later document changes in the infant’s visual sphere.
5. Leave the stack of cards within your reach, out of the infant’s sight. When presenting the cards, place them in front of your
chest. Present the face cards, one at a time, with the blank card in front of the face card. Encourage the infant to look toward the midline by talking to him or her just above the cards, or play Peek-A-Boo with the blank card in front of your face in an attempt to get the infant’s attention.
�. Use two cards for each presentation. One card is always the blank card, the other, one of the six Hiding Heidi faces. Hide the stimulus card behind the blank card. Then ask the child “Where is Heidi hiding?”, while moving the blank card off to one side and the stimulus card off to the other side. Both cards should leave the midline at the same speed. Stimulus cards should be moved to the right and/or left in a random order.
The cards are presented in the following order: �00%, �0%, �.5% and �.�5%. If the infant does not react to the �0% card, present the �5% card. If the infant then reacts to the �5% card, proceed with the �0% card and lower the contrast cards until a threshold level is reached. If the infant does not react to the �.5% card, present the 5% and other cards, as above, until a threshold level is reached. If the child responds to the �.�5% face, the contrast threshold at that distance is below �.�5%. Record that as <�.�5%.
The purpose of this order of presentation is to find the infant’s contrast threshold as quickly and as accurately as possible. Avoid repeated presentation of the same stimulus card, as this causes habituation.
The tester may notice that an infant does not follow the movement of the Heidi-picture with eye move-ments or with combined eye-head movements but makes a quick shift of gaze to the picture when it stops. Another child may follow the movement but looks puzzled when the movement stops and looks at the tester as if asking “Where did the picture disappear to?” These observations need to be reported to the child’s neurologist because they may mean that the child has problems in motion perception (= perception of movement or perception of objects that stand still).
In the examination of older children the child may prefer waving to Heidi “bye-bye” instead of simply point-ing. Also, the presentation may be varied by letting the parents show the cards: They hold the cards behind their back while moving to the testing distance. There they present the Heidi card and the blank card at the same time and ask “Who has the Heidi picture?”.
�. If the infant does not respond to the low contrast cards, bring them closer. Note the distance. If the infant still does not respond to a horizontal presentation of the face cards, slide the cards in a vertical presentation.
8. Initially present the cards in usual illumination level (average room lighting). If the infant does not respond, increase or decrease the luminance level by utilizing a lamp with controlled lighting that allows you to vary the luminance level. Record the optimal luminance level for communication repeatedly
1.800.362.38601.888.362.2576 Fax www.good-lite.com�4
Cognitive Vision Tests
during the first year of life.
�. Since infants rely on near and far visual communication, try to obtain at least two separate thresholds. First, measure at the near communication distance, using the methods described above; record the distance from the child to the cards, the luminance level, and the threshold contrast level reached.
If the infant responds to low contrast face stimulus at near distance, use one of the cards with higher contrast and the blank card, backing away from the infant to the distance where he or she lost response to your face. Record this distance, the luminance level and the threshold contrast level reached at this distance. This will demonstrate to the child’s parents/therapist/teacher the distance at which the infant still responds to visual information at low/intermediate contrast levels.
Lea Rectangles Game (#254600)The Rectangles Game contains two groups of rectangles with dif-ferent shades of grey. The total surface area of each rectangle is the same. This set of rectangles is a modification of Effron’s rectangles and was designed to allow observations on a child’s ability to see differences in size. To make the test situation child friendly the test is performed as if we were playing with building blocks.
A normally sighted child can tell you which of the two rectangles is the longer and which one is the shorter, often before the age of three years, as the girl in the adjecent picture. If this is difficult or the child does not understand what you mean, use can use the LEA Rectangles Game to find out whether the child has a specific visual problem.
Show the longest and the shortest rectangle to the child and ask him/her to feel them using tactile and haptic information. Ex-plain that the one that (s)he can feel outside the other one we call longer and the other we call shorter. If the child can learn the con-cepts longer - shorter using tactile and haptic information then the basic concept is there. If the child even then cannot visually discern which one of the rectangles is the longer one, then you can test further using all the rectangles.
Instruction
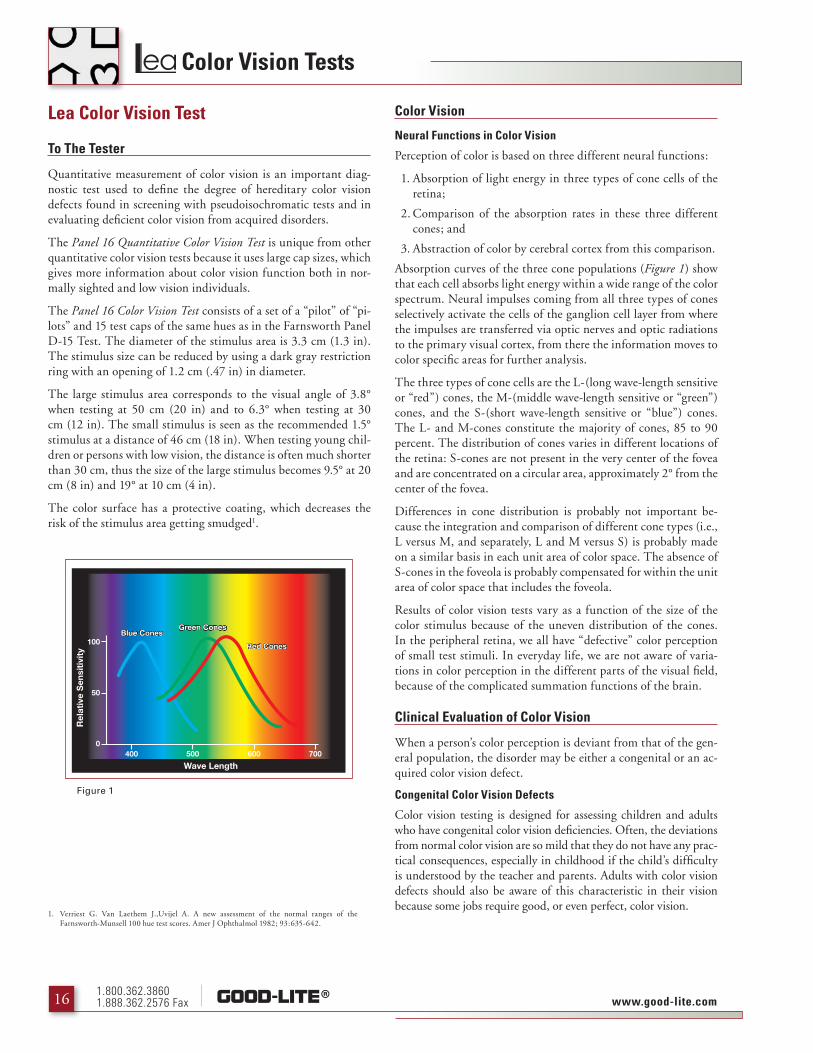
This game was taughed to me by the boy whose hand you see in the picture. After I had tested him in my usual way, he said to me “Lea, if you examine a child who is not as bright as I am, you could do this test like this:”
• Place the dark rectangles on the table to form stairs.
• Place the grey rectangles on the table around the stairs, not in the same order as they are in the stairs.
• Ask the child to place the grey rectangles on the black rectangles so that each of them is laid on the black rectangle of the same length.
• Then you see how (s)he searches for the grey rectangle, then how (s)he grasps it and how (s)he puts it on the black rectangle. Does it go on the correct one or not. This picture as taken when he explained the new technique for testing.
This bright boy with severe CP had understood what I told him while we were playing. We want to learn how easy it is for the child to perceive which of the rectangles are of the same length (purely visual task in the ventral stream) and how exact is the distance between the index finger and the thumb when grasping the rectangle (visuomotor task in the dorsal stream).
If the child does not perceive the length visually (s)he matches the rectangle tactily with several rectangles to find the correct one.
If (s)he has difficulties with the parietal planning of the size to be grasped, the hand movements are clumsy. You may test this separately by demonstrating to the child how you grasp a rect-angle slowly and carefully touching it at the ends of the longer axis. Place the rectangle on your palm and ask the child to grasp it gently and carefully.
If a child has priamry motor problems the function of the hand is observed by the child’s physiotherapist who can better assess the limitations of the motor function of the child’s hand.

1.800.362.38601.888.362.2576 Faxwww.good-lite.com �5
Cognitive Vision Tests
A child grasping a rectangle has correct distance between the fin-gers before touching it, i.e. there must be proper visual guidance of the hand movements.
Damage to different cortical functions have be circumscribed. A child may have loss of one function of two rather similar functions because they are located in different areas of the visual cortices.
Lea Mailbox Game (#254700)The Mailbox Game was designed for assessment of visual recog-nition of line directions. Some children and adults with brain le-sions may be able to turn a ‘letter’ (the plastic card simulating a letter) in correct orientation when the task is to drop it through the slot, yet are unable to tell the direction of the slot when no hand function is involved. ‘The hand sees but not the eyes.’
Instruction
If a child or an older person seems to have problems in understand-ing what is meant with different directions/ orientations, explore the slot of the Lea Mailbox Game in vertical, horizontal and tilted positions using tactile and kinestetic information. The person is taught the concepts ‘vertical’, ‘horizontal’ and ‘tilted’/’oblique’.
• Find out with the child how to place his/her hand or a ruler along the slot in different orientations to observe that wrist and finger movements are normal or at least good enough to allow turning of the hand or a ruler into different orientations.
• Give the white card to the child in an orientation different from the orientation of the mailbox’ slot and ask the child to drop the ‘letter’ through the ‘mailbox’ opening. The movements of the wrist and fingers are observed carefully. If the envelope is turned in correct orientation when approaching the slot there is visual information available for planning the wrist and finger
movements (a parietal lobe function). When this is possible go on with a purely visual task.
• Show the mailbox at about half a meter distance (�0 in) and ask the child to place his/her hand, a ruler or a pencil in the same orientation as the slot (Figure). If this is not possible even after several trials or is in part incorrect, purely visual analysis of orientation of lines is difficult or impossible (temporal lobe function). - Many children find this task not meaningful and try to drop the object through the slot as previously. In that case use an adult (pretending not to know what to do) to turn the object and ask the child to tell, when it is in the same orientation as the slot.
If basic recognition of orientation is affected, perception of geo-metric forms and line drawings may be difficult and needs to be assessed.
If the child does not have the concept of direction of lines, use the visuotactile broad black lines on the lightbox and drive small cars on them turning the lines in different directions. Then drive the cars on flat dark lines. When the child can move the car along the line, turn the lines �0 degrees. If the child continues moving the car in the previous direction, the function is based on motor memory and not visual information.
1.800.362.38601.888.362.2576 Fax www.good-lite.com��
Color Vision Tests
Lea Color Vision Test
To The Tester
Quantitative measurement of color vision is an important diag-nostic test used to define the degree of hereditary color vision defects found in screening with pseudoisochromatic tests and in evaluating deficient color vision from acquired disorders.
The Panel 16 Quantitative Color Vision Test is unique from other quantitative color vision tests because it uses large cap sizes, which gives more information about color vision function both in nor-mally sighted and low vision individuals.
The Panel 16 Color Vision Test consists of a set of a “pilot” of “pi-lots” and �5 test caps of the same hues as in the Farnsworth Panel D-�5 Test. The diameter of the stimulus area is �.� cm (�.� in). The stimulus size can be reduced by using a dark gray restriction ring with an opening of �.� cm (.4� in) in diameter.
The large stimulus area corresponds to the visual angle of �.8° when testing at 50 cm (�0 in) and to �.�° when testing at �0 cm (�� in). The small stimulus is seen as the recommended �.5° stimulus at a distance of 4� cm (�8 in). When testing young chil-dren or persons with low vision, the distance is often much shorter than �0 cm, thus the size of the large stimulus becomes �.5° at �0 cm (8 in) and ��° at �0 cm (4 in).
The color surface has a protective coating, which decreases the risk of the stimulus area getting smudged�.
Color Vision
Neural Functions in Color Vision
Perception of color is based on three different neural functions:
�. Absorption of light energy in three types of cone cells of the retina;
�. Comparison of the absorption rates in these three different cones; and
�. Abstraction of color by cerebral cortex from this comparison.
Absorption curves of the three cone populations (Figure 1) show that each cell absorbs light energy within a wide range of the color spectrum. Neural impulses coming from all three types of cones selectively activate the cells of the ganglion cell layer from where the impulses are transferred via optic nerves and optic radiations to the primary visual cortex, from there the information moves to color specific areas for further analysis.
The three types of cone cells are the L-(long wave-length sensitive or “red”) cones, the M-(middle wave-length sensitive or “green”) cones, and the S-(short wave-length sensitive or “blue”) cones. The L- and M-cones constitute the majority of cones, 85 to �0 percent. The distribution of cones varies in different locations of the retina: S-cones are not present in the very center of the fovea and are concentrated on a circular area, approximately �° from the center of the fovea.
Differences in cone distribution is probably not important be-cause the integration and comparison of different cone types (i.e., L versus M, and separately, L and M versus S) is probably made on a similar basis in each unit area of color space. The absence of S-cones in the foveola is probably compensated for within the unit area of color space that includes the foveola.
Results of color vision tests vary as a function of the size of the color stimulus because of the uneven distribution of the cones. In the peripheral retina, we all have “defective” color perception of small test stimuli. In everyday life, we are not aware of varia-tions in color perception in the different parts of the visual field, because of the complicated summation functions of the brain.
Clinical Evaluation of Color Vision
When a person’s color perception is deviant from that of the gen-eral population, the disorder may be either a congenital or an ac-quired color vision defect.
Congenital Color Vision Defects
Color vision testing is designed for assessing children and adults who have congenital color vision deficiencies. Often, the deviations from normal color vision are so mild that they do not have any prac-tical consequences, especially in childhood if the child’s difficulty is understood by the teacher and parents. Adults with color vision defects should also be aware of this characteristic in their vision because some jobs require good, or even perfect, color vision.
�. Verriest G. Van Laethem J.,Uvijel A. A new assessment of the normal ranges of the Farnsworth-Munsell �00 hue test scores. Amer J Ophthalmol ��8�; ��:��5-�4�.
Figure 1
Wave Length
Rel
ativ
e S
ensi
tivi
ty
400 500 600 700
100
50
0
Blue ConesGreen Cones
Red Cones

1.800.362.38601.888.362.2576 Faxwww.good-lite.com ��
Color Vision Tests
In congenital color vision defects, the abnormality is usually in the structure and function of a cone pigment (rarely in more than one). Red-green color vision defects are X-chromosomally inher-ited, thus more common in males (8%) than in females (0.4%).
A normally sighted person sees all colors of the spectrum (Figure 2) whereas a person with a red-green defect (Figure 3) has a gray-ish confusion area (In brackets in Figure 3) within which he or she does not see the difference between some shades of red and green and misses them.
A. Colored surfaces in this figure represent all spectral colors, saturated at the outer end of the spokes.
B. This illustration depicts how the picture in Figure 2 is seen by a person with a deutan defect. Green tones and the opponent tones of purple-red are seen as dull and therefore easily confused with each other. Since these colors are on the opposite sides of the color circle, there is an “axis” of deficiency across the color circle. The color space of this person is blue-yellow with confusion of colors in the red-green axis. Individual variations in confusions of hue are great.
Color vision defects are generally screened using pseudoisochro-matic Ishihara-type tests. They are designed to be highly sensitive and usually miss only a few mild cases. Some individuals who do not have a color vision defect may fail color vision screening tests. Therefore, the degree of color vision deficiency should be evaluated using quantitative tests. Statements or diagnosis of color deficiency should never be based on screening tests alone. Widely used sorting tests of the Farnsworth Panel D-�5 type are not sensi-tive to acuity loss and contrast sensitivity loss.
Deutan Defect
A. The caps are arranged so that “closely similar” caps are next to each other (Figure 4).
B. Results drawn on the recording sheet show crossings in the deutan axis (Figure 5).
In sorting tests, the color defective person arranges the caps in an order different from that of a person with normal color vi-sion. Colors that look similar to the person with a color defect are placed next to each other.
In clinical evaluation of adult subjects the size of the stimulus should be �.5° of angle. This means a working distance of 50 cm (��.5 in) with most tests. If the subject bends closer, the stimulus area increases. Standard evaluation is done with the small stimu-
Figures � & � are reproduced with permission from Anders Hedin, MD.
C
ON
F U S I O N A R E A
C O N F U S I ON
AR
EA
Figure 3
Figure 2
Figure 4
PILOT

1.800.362.38601.888.362.2576 Fax www.good-lite.com�8
Color Vision Tests
lus size. Subjects with mild color vision defects may discriminate and sort colors normally when large stimuli are used. For func-tional purposes, it is of interest to test with large size caps as well. When testing children, it is helpful to start with the large stimuli and proceed testing with small cap sizes.
Acquired Color Vision Defects
Color vision defects (also called dyschromatopsias) that are caused by diseases or trauma may affect cone cells, inner retinal layers, optic nerve fibers or the visual cortex. The structural and func-tional changes may be patchy or diffuse and may affect vision in one eye more than in the other eye. For diagnostic purposes, the eyes are tested separately. For functional purposes, binocular measurements are more informative.
Macular lesions often cause a defect with the blue-yellow, or tritan, axis since there are fewer S-cones than L- and M-cones, and they are concentrated around the edge of the fovea. However, when the lesion is small or patchy, either there is no axis present or it varies from day to day.
Screening tests that are designed for revealing red-green defects do not pick up acquired defects in the blue-yellow axis. A few screening tests have plates for the blue-yellow defects.
Results in quantitative testing vary as a function of stimulus size. This is more pronounced in acquired color vision defects than in congenital color vision defects. Results from testing with small stimuli depict function in the preferred retinal locus used for fixa-tion, whereas results from testing with large stimuli give informa-tion on color perception in everyday life.
Color of an adjacent surface may alter the perceived brightness and hue of nearby color surfaces. This causes an additional confusing factor in assessing vision for ADL (Activities of Daily Living).
In diagnostic evaluation the tester should be aware of the fact that
reduced retinal illuminance due to cloudiness of the cornea, lens or vitreous distorts test results. In such cases, increased illumi-nation may decrease the degree of the defect or make it disap-pear. Illumination should be either natural, overcast daylight at a window facing the northern sky (in Northern Hemisphere) or artificial light with color temperature of ���4 K (Standard Illu-minant C).
Testing Procedures
Older Children And Adults
Adult testing techniques are used when children or adults are asked to choose a cap that is closest in colour to the previously chosen cap. This is surprisingly easy for children. Generally, even five-year-old children with normal colour vision are able to ar-range the whole test quickly and with no hesitation (Figure 6 ). A child or an adult person may train the test situation with the colour vision game. During the games the colour confusion areas will be noticed. The degree of deficiency must be then investi-gated using the Panel �� test.
Note that the crossing from cap #� to cap #�5 is accepted as nor-mal because of the relatively large difference between caps #� and #8.
Figure 5
TRITAN
DE
UTA
N
PR
OTA
N
“PILOT”
1
23
4 5
6
7
8
9
10
1112
13
14
15
Figure 6
TRITAN
DE
UTA
N
PR
OTA
N
“PILOT”
1
23
4 5
6
7
8
9
10
1112
13
14
15
Figure 7
TRITAN
DE
UTA
N
PR
OTA
N
“PILOT”
1
23
4 5
6
7
8
9
10
1112
13
14
15
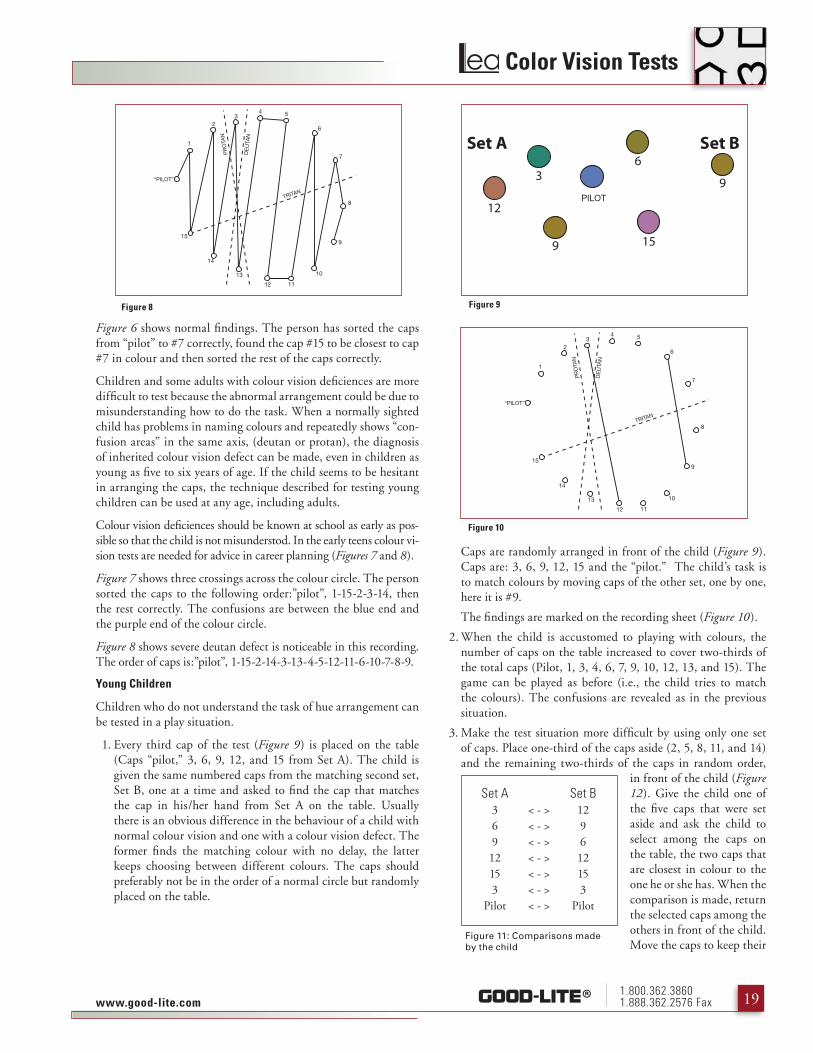
1.800.362.38601.888.362.2576 Faxwww.good-lite.com ��
Color Vision Tests
Figure 6 shows normal findings. The person has sorted the caps from “pilot” to #� correctly, found the cap #�5 to be closest to cap #� in colour and then sorted the rest of the caps correctly.
Children and some adults with colour vision deficiences are more difficult to test because the abnormal arrangement could be due to misunderstanding how to do the task. When a normally sighted child has problems in naming colours and repeatedly shows “con-fusion areas” in the same axis, (deutan or protan), the diagnosis of inherited colour vision defect can be made, even in children as young as five to six years of age. If the child seems to be hesitant in arranging the caps, the technique described for testing young children can be used at any age, including adults.
Colour vision deficiences should be known at school as early as pos-sible so that the child is not misunderstod. In the early teens colour vi-sion tests are needed for advice in career planning (Figures 7 and 8).
Figure 7 shows three crossings across the colour circle. The person sorted the caps to the following order:”pilot”, �-�5-�-�-�4, then the rest correctly. The confusions are between the blue end and the purple end of the colour circle.
Figure 8 shows severe deutan defect is noticeable in this recording. The order of caps is:”pilot”, �-�5-�-�4-�-��-4-5-��-��-�-�0-�-8-�.
Young Children
Children who do not understand the task of hue arrangement can be tested in a play situation.
�. Every third cap of the test (Figure 9) is placed on the table (Caps “pilot,” �, �, �, ��, and �5 from Set A). The child is given the same numbered caps from the matching second set, Set B, one at a time and asked to find the cap that matches the cap in his/her hand from Set A on the table. Usually there is an obvious difference in the behaviour of a child with normal colour vision and one with a colour vision defect. The former finds the matching colour with no delay, the latter keeps choosing between different colours. The caps should preferably not be in the order of a normal circle but randomly placed on the table.
Caps are randomly arranged in front of the child (Figure 9). Caps are: �, �, �, ��, �5 and the “pilot.” The child’s task is to match colours by moving caps of the other set, one by one, here it is #�.
The findings are marked on the recording sheet (Figure 10).
�. When the child is accustomed to playing with colours, the number of caps on the table increased to cover two-thirds of the total caps (Pilot, �, �, 4, �, �, �, �0, ��, ��, and �5). The game can be played as before (i.e., the child tries to match the colours). The confusions are revealed as in the previous situation.
�. Make the test situation more difficult by using only one set of caps. Place one-third of the caps aside (�, 5, 8, ��, and �4) and the remaining two-thirds of the caps in random order,
in front of the child (Figure 12). Give the child one of the five caps that were set aside and ask the child to select among the caps on the table, the two caps that are closest in colour to the one he or she has. When the comparison is made, return the selected caps among the others in front of the child. Move the caps to keep their
Figure 8
TRITAN
DE
UTA
N
PR
OTA
N
“PILOT”
1
23
4 5
6
7
8
9
10
1112
13
14
15
Figure 10
TRITAN
DE
UTA
N
PR
OTA
N
“PILOT”
1
23
4 5
6
7
8
9
10
1112
13
14
15
Figure 9
12 PILOT
6
159
93
Set A Set B
Figure 11: Comparisons made by the child
Set A Set B3 < - > 126 < - > 99 < - > 612 < - > 1215 < - > 153 < - > 3
Pilot < - > Pilot

1.800.362.38601.888.362.2576 Fax www.good-lite.com�0
Color Vision Tests
order random. The matched cap is set aside and the next cap is given to the child. A child may use a cap more than once. The child has matched #� with #� and #�5; #5 with #� and #��; #8 with #� and #�; #�� with #� and #��; and #�4 with #� and #�� (Figure 13). The findings are recorded on the recording sheet (Figure 14).
By not arranging the whole circle at once in this play situation, colour confusions are found as short sequences of the circle. By varying the thirds of the caps on the table, the axis confusions can be easily found. When tested with the large stimulus, the degree of the defect may be different from the results of testing with a small stimulus�,�.
Testing can also be made easier by using the following technique: Show the person that ‘I would arrange these colours in this order’ and place the caps one after the other in the correct order. Then say ‘ this was my way of arranging, lets sort the caps together’. Place the Pilot cap at the left edge of the test area and say ‘ this is always the first cap’. Then take it and move it above the other caps that are mixed on the table and ask ‘which one of these caps has nearly the same colour?’. When the child chooses one - cor-rect or incorrect - place the Pilot on its place and use the chosen cap the same way as the Pilot cap to find the next cap. Go on like this until all caps are sorted. If one or two caps are left over, tell the child ‘these we forgot to sort, where would you place them?’. When the child/person does not need to concentrate on the motor functions, sorting the colours becomes easier.
Acquired colour vision defect tested with different sort-ing tests
Acquired patchy defects of central visual field cause varying losses of colour vision in different parts of the central visual field and re-sult in different kinds of confusions, when either the saturation (the amount of colour mixed with white) or the size of the test is varied.
A person who makes several major errors that give rise to lines crossing the color circle on Lanthony’s Desaturated Test (weak pastels colors mixed with white, Figure 15) may perform better on the regular Panel D-�5 or Panel �� small stimulus testing (Figure 16 ) and still better on the Panel �� test when large stimuli are
Figure 13
23
5
6
12
7
8
9
9
1112
1314
315
Figure 14
TRITAN
DE
UTA
N
PR
OTA
N
“PILOT”
1
23
4 5
6
7
8
9
10
1112
13
14
15
Figure 15
PILOT 5 1 4 3 2 6 15 7 12 14 11 10 13 8 9
TRITAN
DE
UTA
N
PR
OTA
N
“PILOT”
1
23
4 5
6
7
8
9
10
1112
13
14
15
Figure 16
PILOT 2 5 1 3 4 7 6 15 14 9 8 13 11 10 12
TRITAN
DE
UTA
N
PR
OTA
N
“PILOT”
1
23
4 5
6
7
8
9
10
1112
13
14
15
13
6
7
1
3
9
12
PILOT 15
4
10
Figure 12
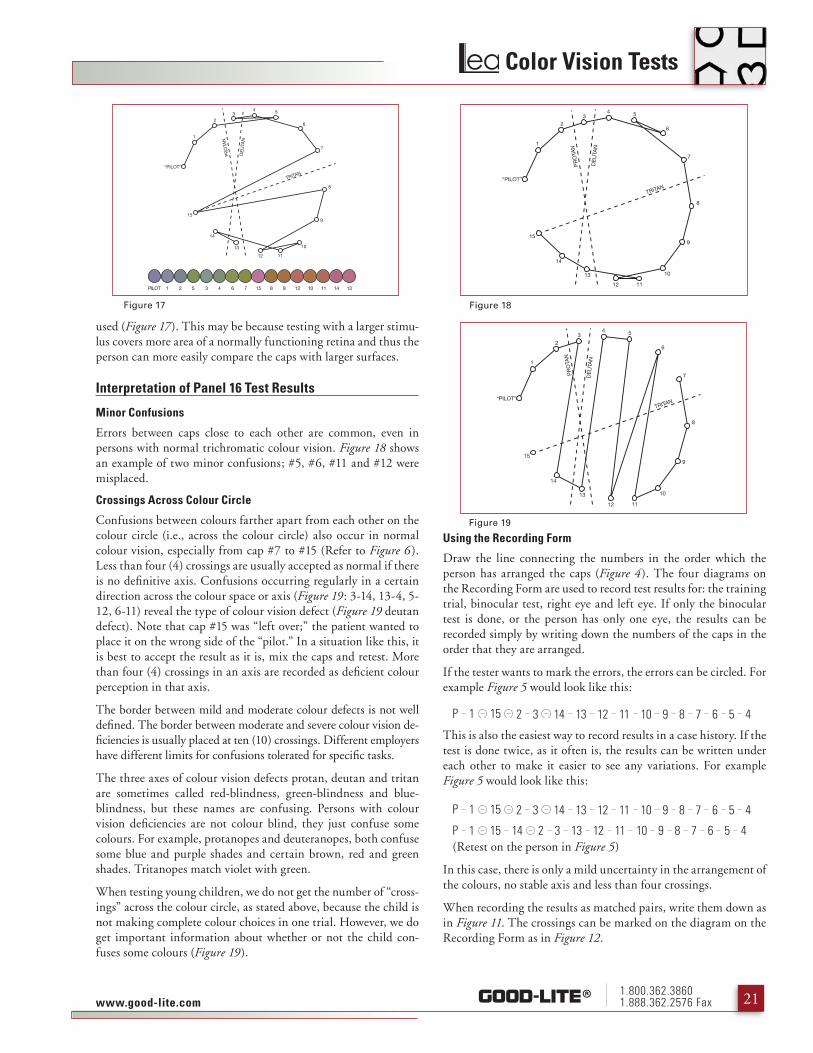
1.800.362.38601.888.362.2576 Faxwww.good-lite.com ��
Color Vision Tests
used (Figure 17). This may be because testing with a larger stimu-lus covers more area of a normally functioning retina and thus the person can more easily compare the caps with larger surfaces.
Interpretation of Panel 16 Test Results
Minor Confusions
Errors between caps close to each other are common, even in persons with normal trichromatic colour vision. Figure 18 shows an example of two minor confusions; #5, #�, #�� and #�� were misplaced.
Crossings Across Colour Circle
Confusions between colours farther apart from each other on the colour circle (i.e., across the colour circle) also occur in normal colour vision, especially from cap #� to #�5 (Refer to Figure 6 ). Less than four (4) crossings are usually accepted as normal if there is no definitive axis. Confusions occurring regularly in a certain direction across the colour space or axis (Figure 19 : �-�4, ��-4, 5-��, �-��) reveal the type of colour vision defect (Figure 19 deutan defect). Note that cap #�5 was “left over;” the patient wanted to place it on the wrong side of the “pilot.” In a situation like this, it is best to accept the result as it is, mix the caps and retest. More than four (4) crossings in an axis are recorded as deficient colour perception in that axis.
The border between mild and moderate colour defects is not well defined. The border between moderate and severe colour vision de-ficiencies is usually placed at ten (�0) crossings. Different employers have different limits for confusions tolerated for specific tasks.
The three axes of colour vision defects protan, deutan and tritan are sometimes called red-blindness, green-blindness and blue-blindness, but these names are confusing. Persons with colour vision deficiencies are not colour blind, they just confuse some colours. For example, protanopes and deuteranopes, both confuse some blue and purple shades and certain brown, red and green shades. Tritanopes match violet with green.
When testing young children, we do not get the number of “cross-ings” across the colour circle, as stated above, because the child is not making complete colour choices in one trial. However, we do get important information about whether or not the child con-fuses some colours (Figure 19).
Using the Recording Form
Draw the line connecting the numbers in the order which the person has arranged the caps (Figure 4). The four diagrams on the Recording Form are used to record test results for: the training trial, binocular test, right eye and left eye. If only the binocular test is done, or the person has only one eye, the results can be recorded simply by writing down the numbers of the caps in the order that they are arranged.
If the tester wants to mark the errors, the errors can be circled. For example Figure 5 would look like this:
P 1 15 2 3 14 13 12 11 10 9 8 7 6 5 4
This is also the easiest way to record results in a case history. If the test is done twice, as it often is, the results can be written under each other to make it easier to see any variations. For example Figure 5 would look like this:
P 1 15 2 3 14 13 12 11 10 9 8 7 6 5 4
P 1 15 14 2 3 13 12 11 10 9 8 7 6 5 4 (Retest on the person in Figure 5)
In this case, there is only a mild uncertainty in the arrangement of the colours, no stable axis and less than four crossings.
When recording the results as matched pairs, write them down as in Figure 11. The crossings can be marked on the diagram on the Recording Form as in Figure 12.
Figure 17
PILOT 1 2 5 3 4 6 7 15 8 9 12 10 11 14 13
TRITAN
DE
UTA
N
PR
OTA
N
“PILOT”
1
23
4 5
6
7
8
9
10
1112
13
14
15
Figure 18
TRITAN
DE
UTA
N
PR
OTA
N
“PILOT”
1
23
4 5
6
7
8
9
10
1112
13
14
15
Figure 19
TRITAN
DE
UTA
N
PR
OTA
N
“PILOT”
1
23
4 5
6
7
8
9
10
1112
13
14
15
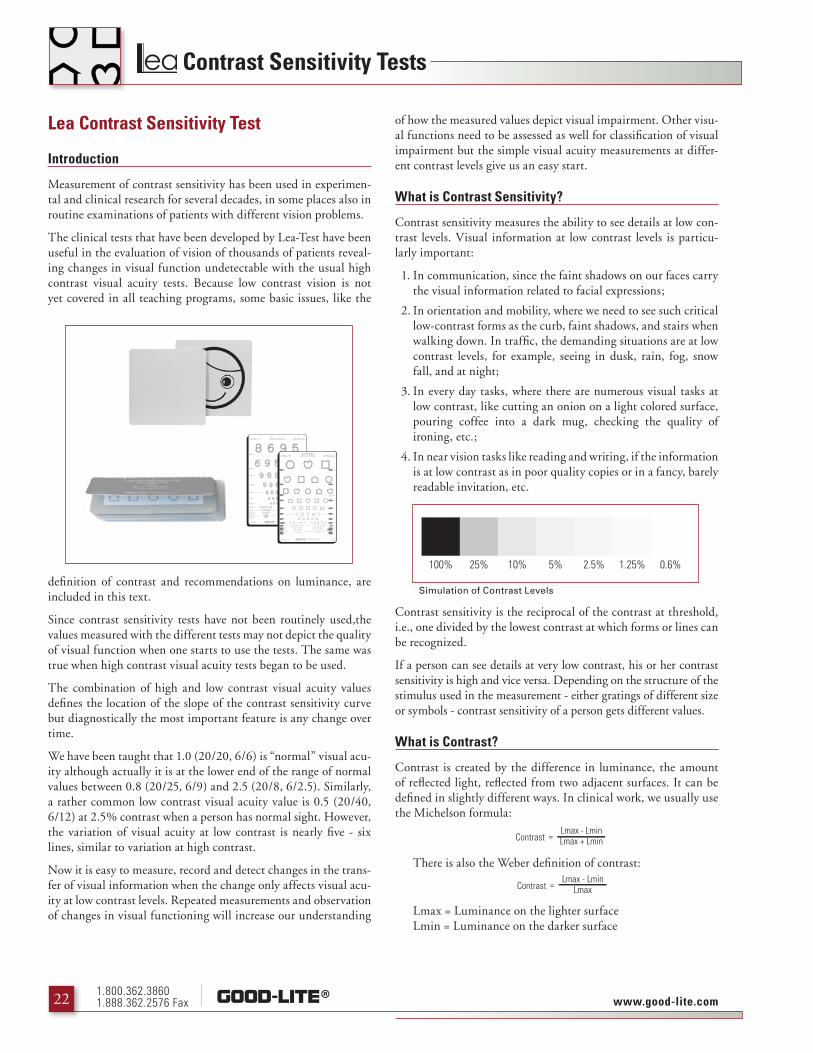
1.800.362.38601.888.362.2576 Fax www.good-lite.com��
Contrast Sensitivity Tests
Lea Contrast Sensitivity Test
Introduction
Measurement of contrast sensitivity has been used in experimen-tal and clinical research for several decades, in some places also in routine examinations of patients with different vision problems.
The clinical tests that have been developed by Lea-Test have been useful in the evaluation of vision of thousands of patients reveal-ing changes in visual function undetectable with the usual high contrast visual acuity tests. Because low contrast vision is not yet covered in all teaching programs, some basic issues, like the
definition of contrast and recommendations on luminance, are included in this text.
Since contrast sensitivity tests have not been routinely used,the values measured with the different tests may not depict the quality of visual function when one starts to use the tests. The same was true when high contrast visual acuity tests began to be used.
The combination of high and low contrast visual acuity values defines the location of the slope of the contrast sensitivity curve but diagnostically the most important feature is any change over time.
We have been taught that �.0 (�0/�0, �/�) is “normal” visual acu-ity although actually it is at the lower end of the range of normal values between 0.8 (�0/�5, �/�) and �.5 (�0/8, �/�.5). Similarly, a rather common low contrast visual acuity value is 0.5 (�0/40, �/��) at �.5% contrast when a person has normal sight. However, the variation of visual acuity at low contrast is nearly five - six lines, similar to variation at high contrast.
Now it is easy to measure, record and detect changes in the trans-fer of visual information when the change only affects visual acu-ity at low contrast levels. Repeated measurements and observation of changes in visual functioning will increase our understanding
of how the measured values depict visual impairment. Other visu-al functions need to be assessed as well for classification of visual impairment but the simple visual acuity measurements at differ-ent contrast levels give us an easy start.
What is Contrast Sensitivity?
Contrast sensitivity measures the ability to see details at low con-trast levels. Visual information at low contrast levels is particu-larly important:
�. In communication, since the faint shadows on our faces carry the visual information related to facial expressions;
�. In orientation and mobility, where we need to see such critical low-contrast forms as the curb, faint shadows, and stairs when walking down. In traffic, the demanding situations are at low contrast levels, for example, seeing in dusk, rain, fog, snow fall, and at night;
�. In every day tasks, where there are numerous visual tasks at low contrast, like cutting an onion on a light colored surface, pouring coffee into a dark mug, checking the quality of ironing, etc.;
4. In near vision tasks like reading and writing, if the information is at low contrast as in poor quality copies or in a fancy, barely readable invitation, etc.
Contrast sensitivity is the reciprocal of the contrast at threshold, i.e., one divided by the lowest contrast at which forms or lines can be recognized.
If a person can see details at very low contrast, his or her contrast sensitivity is high and vice versa. Depending on the structure of the stimulus used in the measurement - either gratings of different size or symbols - contrast sensitivity of a person gets different values.
What is Contrast?
Contrast is created by the difference in luminance, the amount of reflected light, reflected from two adjacent surfaces. It can be defined in slightly different ways. In clinical work, we usually use the Michelson formula:
There is also the Weber definition of contrast:
Lmax = Luminance on the lighter surface Lmin = Luminance on the darker surface
Phone: 630-529-9720 Fax: 630-529-9293
Phone: 800-362-3860 Fax: 888-362-2576
www.good-lite.com
GOOD-LITE�The Quality Always Shines Through #271200
Developed by Lea Hyvärinen, M.D.FOR TESTING AT 10 FEET (3 METERS)
ACTUAL SIZE10 FOOT 3 METER
EQUIVALENT20 FOOT 6 METER
LETTERSIZE
DECI-MAL
LogMAR
Licensed by Ltd.www.lea-test.fi
1050
315 15M
1040
312 12M
1032
39.5 9.5M
1025
37.5 7.5M
1020
36 6M
1016
34.8 4.8M
1012.5
33.8 3.8M
1010
33 3M
108
32.4 2.4M
106.3
31.9 1.9M
105
31.5 1.5M
104
31.2 1.2M
1063
319 19M 20
125638 .16 0.8
20100
630 .20 0.7
2080
624 .25 0.6
2063
619 .32 0.5
2050
615 .40 0.4
2040
612 .50 0.3
2032
69.5 .63 0.2
2025
67.5 .80 0.1
2020
66 1.0 0.0
2016
64.8 1.25 -0.1
2012.5
63.8 1.6 -0.2
2010
63 2.0 -0.3
208
62.4 2.5 -0.4
Phone: 630-529-9720 Fax: 630-529-9293
Phone: 800-362-3860 Fax: 888-362-2576
www.good-lite.com
GOOD-LITE�The Quality Always Shines Through #252400
Developed by Lea Hyvärinen, M.D.FOR TESTING AT 10 FEET (3 METERS)
ACTUAL SIZE10 FOOT 3 METER
EQUIVALENT20 FOOT 6 METER
LETTERSIZE
DECI-MAL
LogMAR
Licensed by Ltd.www.lea-test.fi
1063
319 19M
1050
315 15M
1040
312 12M
20125
638 .16 0.8
20100
630 .20 0.7
2080
624 .25 0.6
1032
39.5 9.5M
1025
37.5 7.5M
1020
36 6M
1016
34.8 4.8M
1012.5
33.8 3.8M
1010
33 3M
108
32.4 2.4M
106.3
31.9 1.9M
105
31.5 1.5M
104
31.2 1.2M
2063
619 .32 0.5
2050
615 .40 0.4
2040
612 .50 0.3
2032
69.5 .63 0.2
2025
67.5 .80 0.1
2020
66 1.0 0.0
2012.5
63.8 1.6 -0.2
2010
63 2.0 -0.3
208
62.4 2.5 -0.4
2016
64.8 1.25 -0.1
Simulation of Contrast Levels

1.800.362.38601.888.362.2576 Faxwww.good-lite.com ��
Contrast Sensitivity Tests
When the darker surface is black and reflects no light, the ratio is �. Contrast is usually expressed as percent, then the ratio is multi-plied by �00. The maximum contrast is thus �00% contrast. The symbols of the visual acuity charts are close to the maximum con-trast. If the lowest contrast perceived is 5%, contrast sensitivity is �00/5=�0. If the lowest contrast perceived by a person is 0.�%, contrast sensitivity is �00/0.�=��0.
There is no international recommendation on how contrast of visual acuity charts should be defined. Therefore there are differ-ences in the contrast of tests of different manufacturers.
Which Luminance Level Should Be Used?
An international recommendation does not exist on the lumi-nance level for contrast sensitivity testing, but there is a recom-mendation for visual acuity testing. It recommends a luminance level equal or higher than 85 candelas per square meter.
In the United States and in a number of other countries, measure-ment of visual acuity for research purposes is done by using the back illuminated ETDRS light box with the luminance level ad-justable from ��0 to less than � cd/m² by using layers of filters. In the small light box the maximum luminance level is ��5 cd/m².
Measurement of Contrast Sensitivity
Measurement of contrast sensitivity resembles audiometry: a pure tone audiogram depicts which are the weakest pure tones at dif-ferent frequencies that the person can hear. Contrast Sensitivity Curve or visuogram shows the faintest contrasts perceived by
the person. If the stimulus is a sine wave grating, then the curve depicts similar function as does the pure tone audiogram. If the stimuli are optotypes (letters, numbers or pediatric symbols), rec-ognition is required and the test resembles speech audiometry. As in audiometry, the result of the contrast sensitivity measurement is not one single value but a diagram.
Contrast sensitivity curve
Visual acuity is plotted along the horizontal axis and contrast sen-sitivity along the vertical axis (Figure A). The size of the symbols decreases along the horizontal axis and they become paler and paler in the vertical direction (Figure B). The boundary between symbols perceived and those that are too small or too pale and thus not seen, is depicted by a curve, called Contrast Sensitivity Curve. Its declining right-hand slope is the most interesting part of the curve in clinical cases. To define the slope of the contrast sensitivity curve, we need two or three measurements. The first one defines the point at the x-axis, the visual acuity value deter-mined in the usual way. The second is the definition of the upper end of the straight part of the slope usually located in the �-5% contrast area. An additional measurement at lower contrast is of-ten of interest.
The threshold values can be measured with two different tech-niques when using optotype tests:
�. By using low contrast vis ual acuity charts, or
�. By using tests with one symbol size and several contrast levels.
Test Procedure When Using Low Contrast Visual Acuity Charts
Testing is identical to the measurement of visual acuity at high contrast level, i.e., we measure the smallest size of the optotypes that the person can recognize. The threshold is defined as the line on which at least � out of the 5 optotypes are correctly recognized. The �.5% test is the most practical test in clinical use. The re-sulting threshold point on the curve is far enough from the high contrast value so that the declination of the slope of the curve can be defined. In severe low vision, the test must be quite close, which may require use of reading lenses.
Move quickly down the chart and ask the person to identify the first or the last symbol on each line. When the person hesitates or
100
10
10.08 0.1 0.3 1.020630
20200
2063
2020
VISUAL ACUITY
CO
NT
RA
ST
SE
NS
ITIV
ITY
High ContrastLarge Objects
High ConstrastFine Details
ObjectNot Seen
LowContrastObjects
Visual Acuity
CONTRAST SENSITIVITY CU
RVE
Figure A
0.03 0.10 0.32 0.63 1.25
1.2%
2.5%
5%
10%
25%
100%
CO
NT
RA
ST
Figure B

1.800.362.38601.888.362.2576 Fax www.good-lite.com�4
Contrast Sensitivity Tests
makes an error, recede one line and ask the person to read the entire line. To record the result carefully, record the number of op-totypes read correctly, i.e., if on the �.5% chart one of the symbols was read incorrectly on line �0/�� (�/�8, 0.�) record the visual acuity value as �0/�� (-�) at �.5%.
Contrast Sensitivity Measured By Using Low Contrast Visual Acuity Charts
Test results are marked on the recording sheet at the level used (see example below) going along that level toward the right until the visual acuity value, measured at that contrast (A’ at �.�%, B’ at �.5%), is reached. If the person’s visual acuity was �0/�0 (�/�, �.0), the line connecting these three points, A’, B’ and X, depicts the slope of the contrast sensitivity curve of this person. Record the results as �0/50 (�/�5, 0.4) at �.5% and �0/�00 (�/�0, 0.�) at �.�%.
Test Procedure When Using Low Contrast Tests with One Symbol Size
In this test type the �0M size is convenient because at the most common testing distance of � meter, it corresponds to visual acu-ity 0.� (�0/�00, �/�0), at � meters to 0.� (�0/�00, �/�0), at 4 meters 0.4 (�0/50, �/�5) and at 0.� meter distance 0.0� (�0/�00, �/�80) covering the low contrast visual acuity range of most per-sons with visual problems. The contrast levels of the test lines on the five pages are �5%, �0%, 5%, �.5% and �.�%.
The same diagram that was used when testing with the low con-trast visual acuity charts, can be used also for reporting of the
results from testing with tests with one symbol size. The number of correct answers is read on the left vertical axis and the cross is placed corresponding to the distance used when testing.
Luminance variation affects the threshold values in many disor-ders and even in normally sighted individuals. It is difficult to ar-range high enough luminance on the test in a regular room except by directing a light source toward the test. Then the amount of light falling on the test is dependent on the distance of the test from the light source. For reliable follow-up measurements, the test should be at a fixed distance from the light source. In field surveys, the variation in the results caused by variation in illumi-nation needs to be taken into consideration.
The surface of the low contrast charts is easily damaged. Avoid touching the white test surface. If a person needs to point with his/her finger at the optotype to fixate on it, use tube gauze or a white glove to cover the finger.
• If the person has not seen the contrast tests before, explain that you are using a low contrast test the same four symbols that were used in the high contrast testing (“ the same pictures that we just looked at and you gave the names...”).
Phone: 630-529-9720 Fax: 630-529-9293
Phone: 800-362-3860 Fax: 888-362-2576
www.good-lite.com
GOOD-LITE�The Quality Always Shines Through #252400
Developed by Lea Hyvärinen, M.D.FOR TESTING AT 10 FEET (3 METERS)
ACTUAL SIZE10 FOOT 3 METER
EQUIVALENT20 FOOT 6 METER
LETTERSIZE
DECI-MAL
LogMAR
Licensed by Ltd.www.lea-test.fi
1063
319 19M
1050
315 15M
1040
312 12M
20125
638 .16 0.8
20100
630 .20 0.7
2080
624 .25 0.6
1032
39.5 9.5M
1025
37.5 7.5M
1020
36 6M
1016
34.8 4.8M
1012.5
33.8 3.8M
1010
33 3M
108
32.4 2.4M
106.3
31.9 1.9M
105
31.5 1.5M
104
31.2 1.2M
2063
619 .32 0.5
2050
615 .40 0.4
2040
612 .50 0.3
2032
69.5 .63 0.2
2025
67.5 .80 0.1
2020
66 1.0 0.0
2012.5
63.8 1.6 -0.2
2010
63 2.0 -0.3
208
62.4 2.5 -0.4
2016
64.8 1.25 -0.1
Phone: 630-529-9720 Fax: 630-529-9293
Phone: 800-362-3860 Fax: 888-362-2576
www.good-lite.com
GOOD-LITE�The Quality Always Shines Through #271200
Developed by Lea Hyvärinen, M.D.FOR TESTING AT 10 FEET (3 METERS)
ACTUAL SIZE10 FOOT 3 METER
EQUIVALENT20 FOOT 6 METER
LETTERSIZE
DECI-MAL
LogMAR
Licensed by Ltd.www.lea-test.fi
1050
315 15M
1040
312 12M
1032
39.5 9.5M
1025
37.5 7.5M
1020
36 6M
1016
34.8 4.8M
1012.5
33.8 3.8M
1010
33 3M
108
32.4 2.4M
106.3
31.9 1.9M
105
31.5 1.5M
104
31.2 1.2M
1063
319 19M 20
125638 .16 0.8
20100
630 .20 0.7
2080
624 .25 0.6
2063
619 .32 0.5
2050
615 .40 0.4
2040
612 .50 0.3
2032
69.5 .63 0.2
2025
67.5 .80 0.1
2020
66 1.0 0.0
2016
64.8 1.25 -0.1
2012.5
63.8 1.6 -0.2
2010
63 2.0 -0.3
208
62.4 2.5 -0.4
Translucent Low contrast visual acuity charts for the small light box. The optotypes are printed at 2.5% (the old 25%, 10%, 5%, and 1.25% contrast charts are still available). Low contrast chart is available also for the ETDRS cabinet.
A. Translucent 2.5%Low Contrast Symbols Chart (#253800)
B. Translucent 2.5%Low Contrast Numbers Chart (#271600)
B
A
LOW CONTRAST TEST RECORDING FORMxx=OD oo=OS
patient:________________________________date_________________
Distance of the test# ofsymbolsread
166.5"
208"
2510"
3012"
4016"
50cm20"
1 m40"
2 m80"
3 m10'
4 m13
5 m16.4'
10 m33'
contrastsensitivity
thresholdcontrast
0.6%
1.25%
2.5%
5%
10%
25%
100%
30
25
20
15
10
5
0
High contrastvisual acuity
200160
125
100
80
63
50
40
32
25
20
16
12.5
10
8
6.3
5
4
3.2
2
1.6
1.25
1
2.5
3
10
6
20
/190
/600
/380
/1250
0.016
0.5
/150
/500
/300
/1000
0.02
0.6
/120
/400
/240
/800
0.025
0.8
/95
/320
/190
/630
0.032
1.0
/75
/250
/150
/500
0.04
1.2
/60
/200
/120
/400
0.05
1.5
/48
/160
/95
/320
0.063
2
/38
/125
/75
/250
0.08
2.4
/30
/100
/60
/200
0.1
3
/24
/80
/48
/160
0.125
4
/19
/63
/38
/125
0.16
5
/15
/50
/30
/100
0.2
6
/12
/40
/24
/80
0.25
8
/9.5
/32
/19
/63
0.32
10
/7.5
/25
/15
/50
0.4
12
/6
/20
/12
/40
0.5
15
/4.8
/16
/9.5
/32
0.63
19
/3.8
/12.5
/7.5
/25
0.80
24
/3
/10
/6
/20
1.0
30
/2.4
/8
/4.8
/16
1.25
38
/1.9
/6.3
/3.8
/12.5
1.6
48
/1.5
/5
/3
/10
2.0
60
Snellen V.A. (m)
Snellen V.A. (ft)
Snellen V.A. (m)
Snellen V.A. (ft)
Decimal V.A.
Cycles/degree
A
B
x
Example of using the Low Contrast Test Recording Form
Low Contrast Flip Charts (#251100)
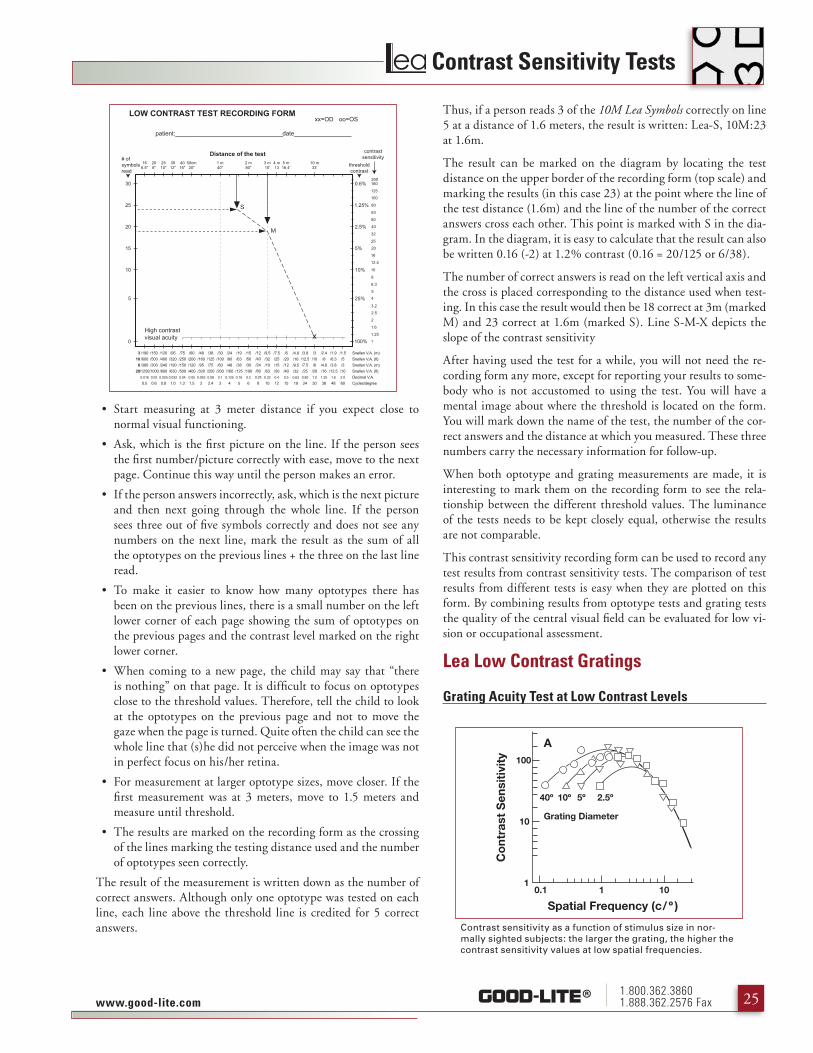
1.800.362.38601.888.362.2576 Faxwww.good-lite.com �5
Contrast Sensitivity Tests
• Start measuring at � meter distance if you expect close to normal visual functioning.
• Ask, which is the first picture on the line. If the person sees the first number/picture correctly with ease, move to the next page. Continue this way until the person makes an error.
• If the person answers incorrectly, ask, which is the next picture and then next going through the whole line. If the person sees three out of five symbols correctly and does not see any numbers on the next line, mark the result as the sum of all the optotypes on the previous lines + the three on the last line read.
• To make it easier to know how many optotypes there has been on the previous lines, there is a small number on the left lower corner of each page showing the sum of optotypes on the previous pages and the contrast level marked on the right lower corner.
• When coming to a new page, the child may say that “there is nothing” on that page. It is difficult to focus on optotypes close to the threshold values. Therefore, tell the child to look at the optotypes on the previous page and not to move the gaze when the page is turned. Quite often the child can see the whole line that (s)he did not perceive when the image was not in perfect focus on his/her retina.
• For measurement at larger optotype sizes, move closer. If the first measurement was at � meters, move to �.5 meters and measure until threshold.
• The results are marked on the recording form as the crossing of the lines marking the testing distance used and the number of optotypes seen correctly.
The result of the measurement is written down as the number of correct answers. Although only one optotype was tested on each line, each line above the threshold line is credited for 5 correct answers.
Thus, if a person reads � of the 10M Lea Symbols correctly on line 5 at a distance of �.� meters, the result is written: Lea-S, �0M:�� at �.�m.
The result can be marked on the diagram by locating the test distance on the upper border of the recording form (top scale) and marking the results (in this case ��) at the point where the line of the test distance (�.�m) and the line of the number of the correct answers cross each other. This point is marked with S in the dia-gram. In the diagram, it is easy to calculate that the result can also be written 0.�� (-�) at �.�% contrast (0.�� = �0/��5 or �/�8).
The number of correct answers is read on the left vertical axis and the cross is placed corresponding to the distance used when test-ing. In this case the result would then be �8 correct at �m (marked M) and �� correct at �.�m (marked S). Line S-M-X depicts the slope of the contrast sensitivity
After having used the test for a while, you will not need the re-cording form any more, except for reporting your results to some-body who is not accustomed to using the test. You will have a mental image about where the threshold is located on the form. You will mark down the name of the test, the number of the cor-rect answers and the distance at which you measured. These three numbers carry the necessary information for follow-up.
When both optotype and grating measurements are made, it is interesting to mark them on the recording form to see the rela-tionship between the different threshold values. The luminance of the tests needs to be kept closely equal, otherwise the results are not comparable.
This contrast sensitivity recording form can be used to record any test results from contrast sensitivity tests. The comparison of test results from different tests is easy when they are plotted on this form. By combining results from optotype tests and grating tests the quality of the central visual field can be evaluated for low vi-sion or occupational assessment.
Lea Low Contrast Gratings
Grating Acuity Test at Low Contrast Levels
LOW CONTRAST TEST RECORDING FORMxx=OD oo=OS
patient:________________________________date_________________
Distance of the test# ofsymbolsread
166.5"
208"
2510"
3012"
4016"
50cm20"
1 m40"
2 m80"
3 m10'
4 m13
5 m16.4'
10 m33'
contrastsensitivity
thresholdcontrast
0.6%
1.25%
2.5%
5%
10%
25%
100%
30
25
20
15
10
5
0
High contrastvisual acuity
200160
125
100
80
63
50
40
32
25
20
16
12.5
10
8
6.3
5
4
3.2
2
1.6
1.25
1
2.5
3
10
6
20
/190
/600
/380
/1250
0.016
0.5
/150
/500
/300
/1000
0.02
0.6
/120
/400
/240
/800
0.025
0.8
/95
/320
/190
/630
0.032
1.0
/75
/250
/150
/500
0.04
1.2
/60
/200
/120
/400
0.05
1.5
/48
/160
/95
/320
0.063
2
/38
/125
/75
/250
0.08
2.4
/30
/100
/60
/200
0.1
3
/24
/80
/48
/160
0.125
4
/19
/63
/38
/125
0.16
5
/15
/50
/30
/100
0.2
6
/12
/40
/24
/80
0.25
8
/9.5
/32
/19
/63
0.32
10
/7.5
/25
/15
/50
0.4
12
/6
/20
/12
/40
0.5
15
/4.8
/16
/9.5
/32
0.63
19
/3.8
/12.5
/7.5
/25
0.80
24
/3
/10
/6
/20
1.0
30
/2.4
/8
/4.8
/16
1.25
38
/1.9
/6.3
/3.8
/12.5
1.6
48
/1.5
/5
/3
/10
2.0
60
Snellen V.A. (m)
Snellen V.A. (ft)
Snellen V.A. (m)
Snellen V.A. (ft)
Decimal V.A.
Cycles/degree
S
M
x
Spatial Frequency (c/ º )
Co
ntra
st S
ensi
tivi
ty 100
10
10.1 1 10
Grating Diameter
A
40º 10º 5º 2.5º
Contrast sensitivity as a function of stimulus size in nor-mally sighted subjects: the larger the grating, the higher the contrast sensitivity values at low spatial frequencies.

1.800.362.38601.888.362.2576 Fax www.good-lite.com��
Contrast Sensitivity Tests
Grating tests have been used to measure contrast sensitivity since the �0’s. These computer controlled grating tests have not become widely used in clinical medicine because they are expensive and require an experienced technician to use them. However, studies with them have taught us some important principles in measure-ment of contrast sensitivity in cases of low vision. The most im-portant finding is that contrast sensitivity values in nearly all cases of low vision are different when measured with gratings of differ-ent sizes: the larger the grating, the higher the contrast sensitivity value. This is particularly common in cases of central scotoma that ‘eats up’ some of the stimulus and thus the effective stimulus is smaller than the physical stimulus.
Small grating stimuli would often give a misleading picture of visual function at low contrast. Therefore it is wise to make one measurement with a large grating stimulus to learn about the sub-ject’s ability to see low contrast information. On the other hand, it is interesting to evaluate the function of the fixation area by using a smaller stimulus. This is possible by covering the grating
stimulus with a grey folder that leaves either one fourth or one tenth of the stimulus visible.
Lea Low Contrast Gratings measure contrast sensitivity at � con-trast levels, �00%, �0% and �.5% using � grating frequencies: 0.5cpcm, �cpcm and 8cpcm. The grey folder covers part of the grating and leaves visible either one forth or one tenth of the stim-ulus. With this simple technique it is possible to find out the ef-fect of stimulus size on the threshold values. When the grating is turned into a new orientation it is covered with a grey surface.
Instructions
Start with the high contrast grating. Show the gratings at a dis-tance of �.5m starting with the 0.5cpcm grating. Turn the grat-ings in different orientations before exposing them from behind the grey cover. Do not move the grating when presenting it. Ask the person to respond by showing the orientation of the lines with his/her hand or with the ruler that is included in the test. Thresh-old value is reached when three out of five presentations lead to correct response.
If the broadest lines could not be seen at �.5m distance, move closer until they are seen. Step back a little, turn the grating be-hind the cover and present it again. If a person has uncorrected astigmatism, grating will be seen at different distances when pre-sented in different orientations. Thus you learn about the person’s refractive error while measuring grating acuity.
If the broadest lines were seen at a distance of �.�m, grating acuity is � cpd (0.5cpcm equals 0.5cpd at 5�cm, �cpd at ��4cm and �cpd at ��0cm). This is a low value.
Spatial Frequency (c/ deg)
Co
ntra
st S
ensi
tivi
ty 100
10
10.1 1 10
B
RR
RE
RE
L
L
10º
5º
2.5º
x x
Contrast sensitivity curves in case of macular degenera-tion, L = the normal left eye, R = the right eye with dry macular degeneration. Contrast sensitivity measured with 10 degree stimulus is nearly as good as in the normal left eye, whereas when measured with 5 degree stimulus it is one fifth of the maximum value of the 10 degree curve and when measured with 2.5 degree stimulus the maximum value is only one twentieth of the 10 degree maximum.
Spatial Frequency (c/ deg)
Co
ntra
st S
ensi
tivi
ty 100
10
10.1 1 10
C
20º 10º
5º
2.5º
xx
Contrast sensitivity curves of a person with optic atrophy in both eyes. With the 2.5 degree stimulus contrast sensi-tivity is barely measurable, yet with the 20 degree stimulus the values at low spatial frequencies are normal.
.57 1.14 1.72 2.29 2.85 3.43
3.5
3.0
2.5
2.0
1.5
1.0
0.5
A. 0.5 cpcm nomogram
0.5 1.0 1.5 2.0 2.5 3.0 3.5.57 1.14 1.72 2.29 2.85 3.43
15
12
10
8.0
6.0
4.0
2.0
B. 2.0 cpcm nomogram
0.5 1.0 1.5 2.0 2.5 3.0 3.5
.57 1.14 1.72 2.29 2.85 3.43
56
48
40
32
24
16
8.0
C. 8.0 cpcm nomogram
0.5 1.0 1.5 2.0 2.5 3.0 3.5.57 1.14 1.72 2.29 2.85 3.43
1.87
2.5
3.75
5
7.5
10
20
D. diameter of stimulus is degrees
0.5 1.0 1.5 2.0 2.5 3.0 3.5
Nomograms: Grating acuity (cpd) as a function of testing distance, A. 0.5cpcm grating, B. 2.0cpcm grating and C. 8.0cpcm grating. D. Diameter of the stimulus as a function of testing distance.

1.800.362.38601.888.362.2576 Faxwww.good-lite.com ��
Contrast Sensitivity Tests
When testing normally sighted persons one starts by showing the finest grating at about �.5m distance, moves backward until the lines cannot be discerned and then moves toward the person until they become visible again. At this distance make the presentations while slightly changing the distance in order to find the thresh-old value. Test first with the large stimulus and then with the two smaller ones.
The distance needs to be measured accurately. It is easy to mea-sure if the person sits with his/her head supported on the head rest of a corneal microscope and a tape measure is fixed on the head rest. When the distance is measured the result can be read on the corresponding nomogram (Diagram A). For example, if a person saw the 8cpcm grating at �.�5m distance, grating acuity is ��cpd with a �0 degree stimulus (the grating is �0cm in diameter, thus �0 degrees at 5�.�cm and �0 degrees at ��5cm distance, Diagram B).
Grating acuity at the lower contrast levels is measured similar to the measurement at high contrast level.
It takes some time to get accustomed to locating the correct value on the nomogram. It is best to mark down the result on a diagram immediately. If an error is made in one of the measurements the resulting curve looks strange. Then the strange value should be measured again. If the approximate multiple values of 5�.� cm are used (��5, ��0, ��0, �85 and �40) grating acuity is easier to calculate. It is �,�,4,5,or � times the cpcm value of the grating or between two of these values. This helps in locating the exact value on the nomogram. The result is marked on the answer sheet the same way as the values measured with optotype tests. Grating frequencies are on the bottom line.
The Range of Normal Contrast Sensitivity
Among the normally sighted people, both visual acuity and con-trast sensitivity have a wide range of variation. In visual acuity, �0/�5 (�/�, 0.8) is a low normal value; the highest normal values are three times higher, �0/8 (�/�.5, �.5). Similarly, the range of normal variation in contrast sensitivity values is great. Therefore, a value within the range of normal may or may not mean that that particular person has normal contrast sensitivity. If his or her con-trast sensitivity was previously high, it may decrease to less than one-half or one-third of its original value and still be “normal.”
A change in contrast sensitivity is the diagnostically important feature that will be watched in the future. Because of the large variation in the normal values, we need to have an older value to compare with to notice a change.
Ideally, contrast sensitivity and visual acuity should be measured when children leave their high school/ secondary school or in young adulthood. These values should be recorded and saved
as part of the basic information related to each person’s health. A change warrants an examination to find out the cause of the change. Although the most common cause would be a small change in the refractive power of the eye, which is a benign find-ing, repeating the measurement of contrast sensitivity would be beneficial as a part of routine health examinations to rule out changes in the visual pathways.
Measurement of contrast sensitivity would also help us to better understand the complaints of a person whose visual acuity at high contrast has not changed but whose vision has decreased at low contrast levels. Then we would not annoy him/her by saying that his/her vision is as good as before, a situation which is now expe-rienced by all too many patients/clients.
If occupational tasks require good visual function at low contrast
Distance of the test# ofsymbolsread
166.5"
208"
2510"
3012"
4016"
50cm20"
1 m40"
2 m80"
3 m10'
4 m13
5 m16.4'
10 m33'
contrastsensitivity
thresholdcontrast
0.6%
1.25%
2.5%
5%
10%
25%
100%
30
25
20
15
10
5
0
High contrastvisual acuity
200160
125
100
80
63
50
40
32
25
20
16
12.5
10
8
6.3
5
4
3.2
2
1.6
1.25
1
2.5
3
10
6
20
/190
/600
/380
/1250
0.016
0.5
/150
/500
/300
/1000
0.02
0.6
/120
/400
/240
/800
0.025
0.8
/95
/320
/190
/630
0.032
1.0
/75
/250
/150
/500
0.04
1.2
/60
/200
/120
/400
0.05
1.5
/48
/160
/95
/320
0.063
2
/38
/125
/75
/250
0.08
2.4
/30
/100
/60
/200
0.1
3
/24
/80
/48
/160
0.125
4
/19
/63
/38
/125
0.16
5
/15
/50
/30
/100
0.2
6
/12
/40
/24
/80
0.25
8
/9.5
/32
/19
/63
0.32
10
/7.5
/25
/15
/50
0.4
12
/6
/20
/12
/40
0.5
15
/4.8
/16
/9.5
/32
0.63
19
/3.8
/12.5
/7.5
/25
0.80
24
/3
/10
/6
/20
1.0
30
/2.4
/8
/4.8
/16
1.25
38
/1.9
/6.3
/3.8
/12.5
1.6
48
/1.5
/5
/3
/10
2.0
60
Snellen V.A. (m)
Snellen V.A. (ft)
Snellen V.A. (m)
Snellen V.A. (ft)
Decimal V.A.
Cycles/degree
x
x
x
H
G
F
Result of a measurement at the three contrast levels. The person saw the 8cpcm grating at 270cm at high contrast, which corresponds 38cpd (F). The 10% contrast 8cpcm grating was seen at 110cm distance, which corresponds to 15cpd (G). The 2.5% contrast 2cpcm grating was seen at 174cm distance, which corresponds to 6cpd (H). The line H-G-F depicts the slope of the contrast sensitivity curve. It is Type III curve.
0.1 1.03 30 cpd
100
10
Visual Acuity/Grating Acuity
Co
ntra
st S
ensi
tivi
ty A
A
Norm
al
The range of normal variation in both visual acuity values (horizontal arrow) and in contrast sensitivity (vertical arrow) is great. If a person’s contrast sensitivity was previously A and has then decreased to A’, the value is still within the range of normal values but is highly pathologic to this person.

1.800.362.38601.888.362.2576 Fax www.good-lite.com�8
Contrast Sensitivity Tests
levels, visual acuity alone does not select the most suitable persons for that particular task. For example, if the task is to notice air-planes approaching within low clouds, these planes are best seen by a person with good visual acuity in the contrast range of �-5%. Since the declination of the slope varies even in normal individu-als, it is possible that a person with lower visual acuity at high con-trast has better function at the lower contrast levels than a person who has higher visual acuity at high contrast. This is important to remember in all such occupational tasks that require exceptionally good visual function at low contrast levels.
The Types of Contrast Sensitivity Changes
Usually the loss of visual function is roughly equal at high and at low contrast levels. The slope of the curve moves toward the left without a change in the declination (Type I). When there is a small circumscribed lesion in the center of the macula, visual acuity may decrease several lines, yet in the low contrast vision
there is slight or no loss (Type II). Type III change in the transfer of visual information is characterized by moderate to no loss of visual acuity at high contrast and a greater loss of visual func-tion at low contrast. This is often caused by diabetic retinopathy, cataract, glaucoma, or optic neuritis, to mention some of the most common causes.
Clinically, it is well known that there can be three people with different types of contrast sensitivity losses even when they have similar visual fields and visual acuity values. They can have very different functional vision. The three people whose contrast sen-sitivity curves are in figure all have visual acuity of �0/�� (�/�8, 0.�). Person A has high normal function at low contrasts and functions like a normally sighted person. Person B has somewhat decreased low contrast function and the typical behavior of a person with low vision (bringing texts closer and moving slightly slower on stairs, etc). Person C has lost visual functions at low contrast and is severely visually impaired. Of these three people with the same visual acuity, one is normally sighted, one has low vision and one is severely visually impaired.
Lower Visual Acuity May Mean Better Vision
If occupational tasks require good visual function at low contrast levels, visual acuity alone does not select the most suitable persons for that particular task. For example, if the task is to notice air-planes approaching within the low clouds, these planes are best seen by a person with good visual acuity in the contrast range of �-5%. Since the declination of the slope varies even in normal individuals, it is possible that a person with lower visual acuity at high contrast has better function at the lower contrast levels than a person who has higher visual acuity at high contrast. This is important to remember in all such occupational tasks that require exceptionally good visual function at low contrast levels.
Variation in the declination of the slope in normal subjects.
6/60 (20/200)0.13
6/6 (20/20)1.030
100
10
Visual Acuity/Grating Acuity
Co
ntra
st S
ensi
tivi
ty
Types of changes in contrast sensitivity.
6/60 (20/200)0.13
6/6 (20/20)1.030
100
10
Visual Acuity/Grating Acuity
Co
ntra
st S
ensi
tivi
ty
Norm
al
Type II
Type I
Type III
Contrast sensitivity curves of three persons with visual acuity 20/63 (6/18, 0.3).
6/60 (20/200)0.13
6/6 (20/20)1.030
100
10
Visual Acuity/Grating Acuity
Co
ntra
st S
ensi
tivi
ty
Norm
al
A
B
C
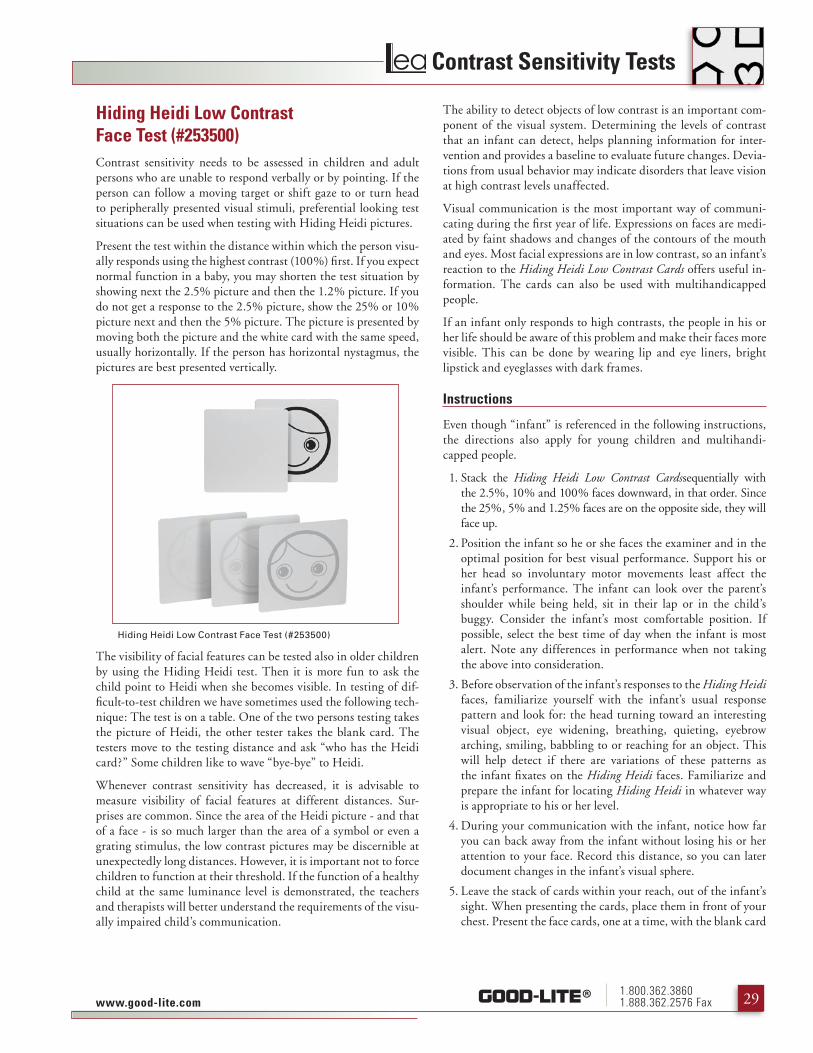
1.800.362.38601.888.362.2576 Faxwww.good-lite.com ��
Contrast Sensitivity Tests
Hiding Heidi Low Contrast Face Test (#253500)Contrast sensitivity needs to be assessed in children and adult persons who are unable to respond verbally or by pointing. If the person can follow a moving target or shift gaze to or turn head to peripherally presented visual stimuli, preferential looking test situations can be used when testing with Hiding Heidi pictures.
Present the test within the distance within which the person visu-ally responds using the highest contrast (�00%) first. If you expect normal function in a baby, you may shorten the test situation by showing next the �.5% picture and then the �.�% picture. If you do not get a response to the �.5% picture, show the �5% or �0% picture next and then the 5% picture. The picture is presented by moving both the picture and the white card with the same speed, usually horizontally. If the person has horizontal nystagmus, the pictures are best presented vertically.
The visibility of facial features can be tested also in older children by using the Hiding Heidi test. Then it is more fun to ask the child point to Heidi when she becomes visible. In testing of dif-ficult-to-test children we have sometimes used the following tech-nique: The test is on a table. One of the two persons testing takes the picture of Heidi, the other tester takes the blank card. The testers move to the testing distance and ask “who has the Heidi card?” Some children like to wave “bye-bye” to Heidi.
Whenever contrast sensitivity has decreased, it is advisable to measure visibility of facial features at different distances. Sur-prises are common. Since the area of the Heidi picture - and that of a face - is so much larger than the area of a symbol or even a grating stimulus, the low contrast pictures may be discernible at unexpectedly long distances. However, it is important not to force children to function at their threshold. If the function of a healthy child at the same luminance level is demonstrated, the teachers and therapists will better understand the requirements of the visu-ally impaired child’s communication.
The ability to detect objects of low contrast is an important com-ponent of the visual system. Determining the levels of contrast that an infant can detect, helps planning information for inter-vention and provides a baseline to evaluate future changes. Devia-tions from usual behavior may indicate disorders that leave vision at high contrast levels unaffected.
Visual communication is the most important way of communi-cating during the first year of life. Expressions on faces are medi-ated by faint shadows and changes of the contours of the mouth and eyes. Most facial expressions are in low contrast, so an infant’s reaction to the Hiding Heidi Low Contrast Cards offers useful in-formation. The cards can also be used with multihandicapped people.
If an infant only responds to high contrasts, the people in his or her life should be aware of this problem and make their faces more visible. This can be done by wearing lip and eye liners, bright lipstick and eyeglasses with dark frames.
Instructions
Even though “infant” is referenced in the following instructions, the directions also apply for young children and multihandi-capped people.
�. Stack the Hiding Heidi Low Contrast Cardssequentially with the �.5%, �0% and �00% faces downward, in that order. Since the �5%, 5% and �.�5% faces are on the opposite side, they will face up.
�. Position the infant so he or she faces the examiner and in the optimal position for best visual performance. Support his or her head so involuntary motor movements least affect the infant’s performance. The infant can look over the parent’s shoulder while being held, sit in their lap or in the child’s buggy. Consider the infant’s most comfortable position. If possible, select the best time of day when the infant is most alert. Note any differences in performance when not taking the above into consideration.
�. Before observation of the infant’s responses to the Hiding Heidi faces, familiarize yourself with the infant’s usual response pattern and look for: the head turning toward an interesting visual object, eye widening, breathing, quieting, eyebrow arching, smiling, babbling to or reaching for an object. This will help detect if there are variations of these patterns as the infant fixates on the Hiding Heidi faces. Familiarize and prepare the infant for locating Hiding Heidi in whatever way is appropriate to his or her level.
4. During your communication with the infant, notice how far you can back away from the infant without losing his or her attention to your face. Record this distance, so you can later document changes in the infant’s visual sphere.
5. Leave the stack of cards within your reach, out of the infant’s sight. When presenting the cards, place them in front of your chest. Present the face cards, one at a time, with the blank card
Hiding Heidi Low Contrast Face Test (#253500)

1.800.362.38601.888.362.2576 Fax www.good-lite.com�0
Contrast Sensitivity Tests
in front of the face card. Encourage the infant to look toward the midline by talking to him or her just above the cards, or play Peek-A-Boo with the blank card in front of your face in an attempt to get the infant’s attention.
�. Use two cards for each presentation. One card is always the blank card, the other, one of the six Hiding Heidi faces. Hide the stimulus card behind the blank card. Then ask the child “Where is Heidi hiding?”, while moving the blank card off to one side and the stimulus card off to the other side. Both cards should leave the midline at the same speed. Stimulus cards should be moved to the right and/or left in a random order.
The cards are presented in the following order: �00%, �0%, �.5% and �.�5%. If the infant does not react to the �0% card, present the �5% card. If the infant then reacts to the �5% card, proceed with the �0% card and lower the contrast cards until a threshold level is reached. If the infant does not react to the �.5% card, present the 5% and other cards, as above, until a threshold level is reached. If the child responds to the �.�5% face, the contrast threshold at that distance is below �.�5%. Record that as <�.�5%.
The purpose of this order of presentation is to find the infant’s contrast threshold as quickly and as accurately as possible. Avoid repeated presentation of the same stimulus card, as this causes habituation.
The tester may notice that an infant does not follow the movement of the Heidi-picture with eye move-ments or with combined eye-head movements but makes a quick shift of gaze to the picture when it stops. Another child may follow the movement but looks puzzled when the movement stops and looks at the tester as if asking “Where did the picture disappear to?” These observations need to be reported to the child’s neurologist because they may mean that the child has problems in motion perception (= perception of movement or perception of objects that stand still).
In the examination of older children the child may prefer waving to Heidi “bye-bye” instead of simply point-ing. Also, the presentation may be varied by letting the parents show the cards: They hold the cards behind their back while moving to the testing distance. There they present the Heidi card and the blank card at the same time and ask “Who has the Heidi picture?”.
�. If the infant does not respond to the low contrast cards, bring them closer. Note the distance. If the infant still does not respond to a horizontal presentation of the face cards, slide the cards in a vertical presentation.
8. Initially present the cards in usual illumination level (average room lighting). If the infant does not respond, increase or decrease the luminance level by utilizing a lamp with controlled lighting that allows you to vary the luminance level. Record the optimal luminance level for communication repeatedly during the first year of life.
�. Since infants rely on near and far visual communication, try to obtain at least two separate thresholds. First, measure at the near
communication distance, using the methods described above; record the distance from the child to the cards, the luminance level, and the threshold contrast level reached.
If the infant responds to low contrast face stimulus at near distance, use one of the cards with higher contrast and the blank card, backing away from the infant to the distance where he or she lost response to your face. Record this distance, the luminance level and the threshold contrast level reached at this distance. This will demonstrate to the child’s parents/therapist/teacher the distance at which the infant still responds to visual information at low/intermediate contrast levels.
Heidi Expressions Test Game (#254500)Heidi Expressions Test Game has been developed to improve early evaluation of vision for communication. Among the visually im-paired children there are some who cannot see expressions and/or do not recognize people by their faces. These children may have nearly normal results in routine vision tests (large visual field and normal or near normal visual acuity.) Other visually impaired children may have this deficit in visual recognition as a part of more extensive loss of visual functions.
Many children have Cerebral Palsy, which, however, may be so mild that it has not required special treatment.
If the child’s difficulties are not known and understood, his/her be-havior may cause misunderstandings and needless negative experi-ences in social interactions. Therefore, testing of a child’s ability to see differences between different facial expressions is an important part of functional visual assessment.
Visually impaired children have two different kinds of problems in learning to recognize faces and to interpret facial expressions:
�. they do not see expressions well enough to interpret them (=pathway problem) or
�. they have brain damage in the area of face recognition and therefore do not recognize differences in people’s faces and may
Heidi Expressions test game contains six different basic expressions (see under the heading.) Each expression is on two exactly identical cards and on a third card which has one additional feature, a bow on Heidi’s hair. In this picture are the sets of three cards depicting smiling Heidi and sad Heidi.

1.800.362.38601.888.362.2576 Faxwww.good-lite.com ��
Contrast Sensitivity Tests
also have difficulties in interpreting expressions (=cognitive visual problem).
It is possible to observe which type of problem the child has during the Heidi Expressions test game . In some cases the child may have poor quality of image and poor facial recognition.
Play situation:
The Heidi Expressions Test Game can be used from the age of �0-�� months when teaching the child how people look when they have the six basic expressions depicted on the cards. Matching the cards gives a natural situation to discuss the different expressions.
Depending on the child’s age and communication level the match-ing game is varied. First the cards can be looked at and the expres-sions discussed. The tester and the child may make the expressions themselves. With an older child it is possible to reflect upon the causes why Heidi might be glad, sad, serious or weeping.
During this discussion it is possible to observe whether the child has to look very close on the cards and the tester’s face to see the expressions or whether the child seems to have difficulties in under-standing the concept of facial expressions. In the latter case tactile information is used as additional information. It may be that the child needs to feel the facial features to perceive the expression and to recognize them.
Drawing pictures of faces can be combined to the Heidi Expressions Test Game. Draw the circle and the eyes and ask the child “Which expression does Heidi have this time?”. The child may draw the mouth or the tears assisted by the tester when needed. This is anoth-er effective way to make the child aware of the structure of expres-sions. At the same time it can be used to create picture perception as such, to teach the child to understand how a picture represents an object. The expressions can also be created by using pipe cleaners for the mouth and buttons for the eyes glued on a small paper plate as an activity in nursery or kindergarten. The child’s creations can be used to observe which features the child uses in the recognition of his/her picture.
When the child seems to understand the six different basic expres-sions, the cards can be matched. First only six cards are chosen, for example the smiling Heidis and the weeping Heidis. If the child does not have cognitive visual functions for facial recognition, he/she may match the faces with the bow as equal. This needs to be discussed with the child by showing once more on the tester’s face how the different expressions look. The child may be able to see the expressions in a real life situation although they are too difficult to be recognised in a picture.
When the child has matched the cards printed with full contrast, the �0% contrast pictures and later the �.5% contrast pictures can be used in the play situation.
If the child can match the high contrast pictures but not the �0% or �.5% pictures, contrast sensitivity needs to be measured and the central visual field examined if the child is old enough for testing. It is also advisable to discuss with the child the structure of the im-age: whether there are distortions of lines or spotty loss of the image
(scotomas).
When a child can see the expressions only at �00% contrast, all picture materials in testing the child’s abilities should be analyzed. Regular test materials may be too difficult to be seen by the child and therefore the tests may give a wrong impression on the child’s cognitive abilities. Psychological tests and reading test materials may need to be enlarged and/or printed at high contrast. Sometimes a
closed circuit TV reading device needs to be used.
By combining the information gathered in the different play situa-tions we learn a lot about the children’s ability to see and interpret facial features and expressions. Then we can support his/her learn-ing in this area which is central in every day social interactions.
If a child is found not to recognize faces and/or facial expressions in these black & white cards, testing is continued using color photo-graphs and real life situations. Each child who has deviations from normal behavior in interaction with peers and family members needs a thorough assessment of vision for communi-cation. In a group of children the child may need an interpreter/intervener because in that situation (s)he may be functionally blind even if (s)he func-tions normally in other visual tasks. Without help the play situa-tion in a group of children may be so stressful and confusing that the child prefers to withdraw and may be diagnosed as having ‘autistic behaviors’.
Summary
Assessment of visual function at low contrast adds an important di-mension in the evaluation of a person’s capabilities. It should be a part of evaluation of vision in occupational health and in low vision services as well as in all diagnostic work. With the easy-to-use opto-type tests, it is possible to assess visibility of low contrast details. A person’s ability to see low contrast lines requires grating tests, which presently are under construction.
Heidi Expressions game contains cards at 100%, 10% and 2.5% contrast.

1.800.362.38601.888.362.2576 Fax www.good-lite.com��
www.good-lite.com
GOOD-LITE� #271000
20/400 6/120 8.0 M .05
20/200 6/60 4.0 M .10
20/160 6/48 3.2 M .12
20/320 6/95 6.3 M .063
20/250 6/75 5.0 M .08
20/125 6/38 2.5 M .16
20/100 6/30 2.0 M .20
20/80 6/24 1.6 M .2520/63 6/19 1.25 M .32
20/50 6/15 1.0 M .40
20/40 6/12 .80 M .50
20/32 6/9.5 .63 M .63
20/25 6/7.5 .50 M .80
20/20 6/6 .40 M 1.0
20/16 6/4.8 .32 M 1.25
20/12.5 6/3.8 .25 M 1.6
20/10 6/3 .20 M 2.0
Developed by Lea Hyvärinen, M.D.FOR TESTING AT 16 INCHES (40 CM)
DISTANCEEQUIVALENTSFOOT METER
LETTERSIZE
50% CROWDING
Licensed by Ltd.www.lea-test.fi
DECIMALDeveloped by Lea Hyvärinen, M.D.
FOR TESTING AT 16 INCHES (40 CM)
DISTANCEEQUIVALENTSFOOT METER
LETTERSIZE DECIMAL
20/400 6/120 8.0 M .05
20/200 6/60 4.0 M .10
20/160 6/48 3.2 M .12
20/320 6/95 6.3 M .063
20/250 6/75 5.0 M .08
20/125 6/38 2.5 M .16
20/100 6/30 2.0 M .20
20/80 6/24 1.6 M .25
20/63 6/19 1.25 M .32
20/50 6/15 1.0 M .4020/40 6/12 .80 M .5020/32 6/9.5 .63 M .6320/25 6/7.5 .50 M .8020/20 6/6 .40 M 1.020/16 6/4.8 .32 M 1.2520/12.5 6/3.8 .25 M 1.620/10 6/3 .20 M 2.0
Numbers Numbers
Lea Numbers
Introduction
Lea Numbers Tests were developed for international studies in oc-cupational health and school health services. Letters like the Sloan letters are used in the Western world and in the old colonies of west-ern empires but not in a large part of the rest of the world whereas numbers are the same world over. The four numbers 5,�,8 and � were chosen because they could be designed to blur equally.
The experiences that the previous manufacturer, Precision Vi-sion, and I had had in desiging the symbol optotypes helped us when the number optotypes for occupational health were created. However, numerous hours were spent refining the details of each number. Fortunately, we nowadays have the facilities to exchange information via fax, phone and computers thus reducing the time needed in this type of industrial designing. The Lea Numbers were designed to have equal legibility, to blur equally. This makes the threshold value much narrower than in older tests where such easy numbers as �, 4 and � are used.
In clinical use of visual acuity tests letters and numbers are gener-ally used instead of the reference optotype Landolt C or “Ring” although there are countries were Landolt C is used even in pae-diatric testing. Letter and number optotypes require recognition of the form.
The round numbers 5,�,8 and � are more difficult to recognise than it is to detect where the space is in the Landolt C. Calibration of the size of the number optotypes was done by Juvi Mustonen, O.D. and Risto Näsänen Ph.D. at the Vision Laboratory of the Department of Physiology, Helsinki University, Finland.
Assessment of visual acuity usually follows measurement of refrac-tive error, first without, then with correcting lenses, monocularly and binocularly.
15 Line “ETDRS” Style Translucent Distance Chart (#270200)
3 Meter Translucent Distance Chart (#271200)
4 Meter Translucent Distance Chart (#271300)For the small lightbox there are tests for both � meter (�0 foot, #����00) and 4 meter (�� foot, #����00) distance with two groups of numbers on the lower lines. The use of a covering card is easy on the lightbox since it can be held between the test and the frame of the lightbox.
Instruction
• First test binocularly. Briefly point to the first optotype in each or every other line in descending order and ask the person to identify it. Make sure that the covering card is not too close to the line to be read and does not create a shadow.
• Move down until the child/person hesitates or misidentifies a number.
• Move back up one line and ask the person to identify all numbers on that line. If this is successful move down and ask the person to read the line where the error was made.
• Visual acuity is recorded as the last line on which at least � out of 5 numbers were identified correctly. If only � numbers were correctly recognized the value is that of the previous line +�, i.e. if the person read � correct on the �0/�5 (�/8, 0.8) line, visual acuity is �0/�0 (+�) (�/� (+�), 0.�� (+�).
• After binocular testing test each eye separately.
15 Line “ETDRS” Style Translucent Distance Chart (#270200)
A. 4 Meter Translucent Distance Chart (#271300)
B. 3 Meter Translucent Distance Chart (#271200)
A
B

1.800.362.38601.888.362.2576 Faxwww.good-lite.com ��
If a chart is used at a distance other than the usual � or 4 meters (�0 or �� feet), measure and record the viewing distance and the symbol size (the M value) or the visual acuity value printed at the threshold line.
To determine the visual acuity use one of the following formulas:
OR
M-unit, metric unit is the distance in meters at which the refer-ence optotype C is seen at a visual angle of 5’.
Near Vision Card with 16” (40 cm) Measuring Cord (#270900) Pocket Near Card (#271000)
Instructions
When examining normally sighted children or adults, hold the card at 40cm (�� in), the length of the cord. Let the visually im-paired children use their preferred distance and head posture dur-ing the first testing, later measure at 40cm (�� in) if the child also uses that distance in visual tasks.
• Start with binocular testing, using the center grouping of symbols.
• Point to each of the four numbers on the top line, observe the baseline responses for comprehension, speed and accuracy.
• Cover the top line with a white card. Make sure that the card does not cause shadow on the line to be read.
• Ask the child/adult to identify only the first number on the line below the covering card.
• Repeat this procedure for each or each other line (moving quickly down the chart to avoid tiring the child) until the child/adult hesitates or misidentifies a symbol.
• Move back up one line and ask the child/adult to identify all the optotypes on that line.
• If the child identifies all numbers correctly go to the next lower line and ask the child/person to identify all the numbers on that line.
• The visual acuity is recorded as the last line on which at least � of the 5 optotypes are read correctly. Always test until the threshold line.
• If the chart is held at �� inches (40cm) the visual acuity value is found in the margin adjacent to that line.
• After binocular testing, proceed with testing each eye separately. In screening, use two pairs of plano glasses for occlusion of the child’s eyes or a pair of symmetric glasses that can be used for covering both eyes, one at a time. This is the least disturbing type of occluder.
• For monocular testing, follow the same procedure as for binocular testing.
• Older children and adults may be tested using the reverse side of the near vision card where the numbers are spaced more closely, as if in words or sentences. The close spacing of the symbols on this test makes it a sensitive test for detection of increased crowding effect. In children with brain damage there may be great differences between visual acuity values measured with line test and the more crowded tests. Single symbol acuity may be normal or near normal.
• Visual acuity measured with crowded symbols is closely equal to the smallest text size that the child/person is able to read. It is NOT the size of the texts to be used in learning and at work because nobody likes to read at the level of threshold. We usually read texts that are �-�0 times larger than the threshold size.
www.good-lite.com
GOOD-LITE� #271000
20/400 6/120 8.0 M .05
20/200 6/60 4.0 M .10
20/160 6/48 3.2 M .12
20/320 6/95 6.3 M .063
20/250 6/75 5.0 M .08
20/125 6/38 2.5 M .16
20/100 6/30 2.0 M .20
20/80 6/24 1.6 M .2520/63 6/19 1.25 M .32
20/50 6/15 1.0 M .40
20/40 6/12 .80 M .50
20/32 6/9.5 .63 M .63
20/25 6/7.5 .50 M .80
20/20 6/6 .40 M 1.0
20/16 6/4.8 .32 M 1.25
20/12.5 6/3.8 .25 M 1.6
20/10 6/3 .20 M 2.0
Developed by Lea Hyvärinen, M.D.FOR TESTING AT 16 INCHES (40 CM)
DISTANCEEQUIVALENTSFOOT METER
LETTERSIZE
50% CROWDING
Licensed by Ltd.www.lea-test.fi
DECIMALDeveloped by Lea Hyvärinen, M.D.
FOR TESTING AT 16 INCHES (40 CM)
DISTANCEEQUIVALENTSFOOT METER
LETTERSIZE DECIMAL
20/400 6/120 8.0 M .05
20/200 6/60 4.0 M .10
20/160 6/48 3.2 M .12
20/320 6/95 6.3 M .063
20/250 6/75 5.0 M .08
20/125 6/38 2.5 M .16
20/100 6/30 2.0 M .20
20/80 6/24 1.6 M .25
20/63 6/19 1.25 M .32
20/50 6/15 1.0 M .4020/40 6/12 .80 M .5020/32 6/9.5 .63 M .6320/25 6/7.5 .50 M .8020/20 6/6 .40 M 1.020/16 6/4.8 .32 M 1.2520/12.5 6/3.8 .25 M 1.620/10 6/3 .20 M 2.0
Numbers Numbers
Near Vision Card with 16” (40 cm) Cord (#270900)
Pocket Near Card (#271000)
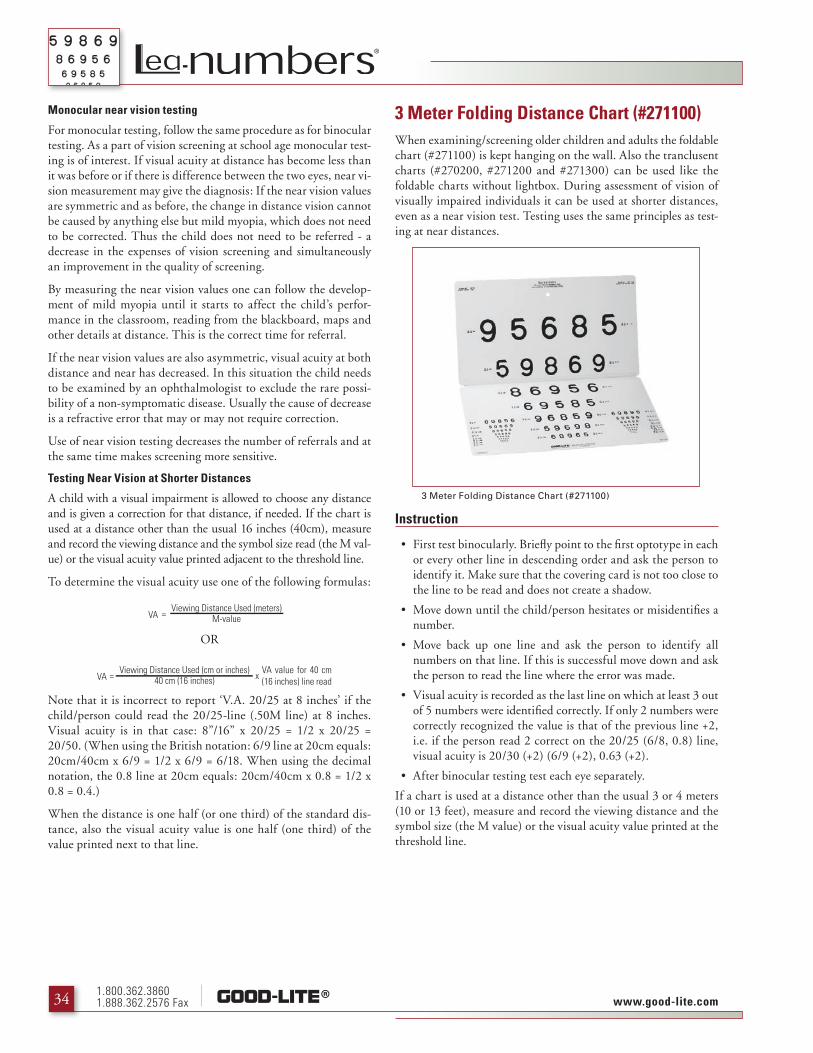
1.800.362.38601.888.362.2576 Fax www.good-lite.com�4
www.good-lite.com
GOOD-LITE� #271000
20/400 6/120 8.0 M .05
20/200 6/60 4.0 M .10
20/160 6/48 3.2 M .12
20/320 6/95 6.3 M .063
20/250 6/75 5.0 M .08
20/125 6/38 2.5 M .16
20/100 6/30 2.0 M .20
20/80 6/24 1.6 M .2520/63 6/19 1.25 M .32
20/50 6/15 1.0 M .40
20/40 6/12 .80 M .50
20/32 6/9.5 .63 M .63
20/25 6/7.5 .50 M .80
20/20 6/6 .40 M 1.0
20/16 6/4.8 .32 M 1.25
20/12.5 6/3.8 .25 M 1.6
20/10 6/3 .20 M 2.0
Developed by Lea Hyvärinen, M.D.FOR TESTING AT 16 INCHES (40 CM)
DISTANCEEQUIVALENTSFOOT METER
LETTERSIZE
50% CROWDING
Licensed by Ltd.www.lea-test.fi
DECIMALDeveloped by Lea Hyvärinen, M.D.
FOR TESTING AT 16 INCHES (40 CM)
DISTANCEEQUIVALENTSFOOT METER
LETTERSIZE DECIMAL
20/400 6/120 8.0 M .05
20/200 6/60 4.0 M .10
20/160 6/48 3.2 M .12
20/320 6/95 6.3 M .063
20/250 6/75 5.0 M .08
20/125 6/38 2.5 M .16
20/100 6/30 2.0 M .20
20/80 6/24 1.6 M .25
20/63 6/19 1.25 M .32
20/50 6/15 1.0 M .4020/40 6/12 .80 M .5020/32 6/9.5 .63 M .6320/25 6/7.5 .50 M .8020/20 6/6 .40 M 1.020/16 6/4.8 .32 M 1.2520/12.5 6/3.8 .25 M 1.620/10 6/3 .20 M 2.0
Numbers Numbers
Monocular near vision testing
For monocular testing, follow the same procedure as for binocular testing. As a part of vision screening at school age monocular test-ing is of interest. If visual acuity at distance has become less than it was before or if there is difference between the two eyes, near vi-sion measurement may give the diagnosis: If the near vision values are symmetric and as before, the change in distance vision cannot be caused by anything else but mild myopia, which does not need to be corrected. Thus the child does not need to be referred - a decrease in the expenses of vision screening and simultaneously an improvement in the quality of screening.
By measuring the near vision values one can follow the develop-ment of mild myopia until it starts to affect the child’s perfor-mance in the classroom, reading from the blackboard, maps and other details at distance. This is the correct time for referral.
If the near vision values are also asymmetric, visual acuity at both distance and near has decreased. In this situation the child needs to be examined by an ophthalmologist to exclude the rare possi-bility of a non-symptomatic disease. Usually the cause of decrease is a refractive error that may or may not require correction.
Use of near vision testing decreases the number of referrals and at the same time makes screening more sensitive.
Testing Near Vision at Shorter Distances
A child with a visual impairment is allowed to choose any distance and is given a correction for that distance, if needed. If the chart is used at a distance other than the usual �� inches (40cm), measure and record the viewing distance and the symbol size read (the M val-ue) or the visual acuity value printed adjacent to the threshold line.
To determine the visual acuity use one of the following formulas:
OR
Note that it is incorrect to report ‘V.A. �0/�5 at 8 inches’ if the child/person could read the �0/�5-line (.50M line) at 8 inches. Visual acuity is in that case: 8”/��” x �0/�5 = �/� x �0/�5 = �0/50. (When using the British notation: �/� line at �0cm equals: �0cm/40cm x �/� = �/� x �/� = �/�8. When using the decimal notation, the 0.8 line at �0cm equals: �0cm/40cm x 0.8 = �/� x 0.8 = 0.4.)
When the distance is one half (or one third) of the standard dis-tance, also the visual acuity value is one half (one third) of the value printed next to that line.
3 Meter Folding Distance Chart (#271100)When examining/screening older children and adults the foldable chart (#����00) is kept hanging on the wall. Also the tranclusent charts (#��0�00, #����00 and #����00) can be used like the foldable charts without lightbox. During assessment of vision of visually impaired individuals it can be used at shorter distances, even as a near vision test. Testing uses the same principles as test-ing at near distances.
Instruction
• First test binocularly. Briefly point to the first optotype in each or every other line in descending order and ask the person to identify it. Make sure that the covering card is not too close to the line to be read and does not create a shadow.
• Move down until the child/person hesitates or misidentifies a number.
• Move back up one line and ask the person to identify all numbers on that line. If this is successful move down and ask the person to read the line where the error was made.
• Visual acuity is recorded as the last line on which at least � out of 5 numbers were identified correctly. If only � numbers were correctly recognized the value is that of the previous line +�, i.e. if the person read � correct on the �0/�5 (�/8, 0.8) line, visual acuity is �0/�0 (+�) (�/� (+�), 0.�� (+�).
• After binocular testing test each eye separately.
If a chart is used at a distance other than the usual � or 4 meters (�0 or �� feet), measure and record the viewing distance and the symbol size (the M value) or the visual acuity value printed at the threshold line.
3 Meter Folding Distance Chart (#271100)

1.800.362.38601.888.362.2576 Faxwww.good-lite.com �5
www.good-lite.com
GOOD-LITE� #271000
20/400 6/120 8.0 M .05
20/200 6/60 4.0 M .10
20/160 6/48 3.2 M .12
20/320 6/95 6.3 M .063
20/250 6/75 5.0 M .08
20/125 6/38 2.5 M .16
20/100 6/30 2.0 M .20
20/80 6/24 1.6 M .2520/63 6/19 1.25 M .32
20/50 6/15 1.0 M .40
20/40 6/12 .80 M .50
20/32 6/9.5 .63 M .63
20/25 6/7.5 .50 M .80
20/20 6/6 .40 M 1.0
20/16 6/4.8 .32 M 1.25
20/12.5 6/3.8 .25 M 1.6
20/10 6/3 .20 M 2.0
Developed by Lea Hyvärinen, M.D.FOR TESTING AT 16 INCHES (40 CM)
DISTANCEEQUIVALENTSFOOT METER
LETTERSIZE
50% CROWDING
Licensed by Ltd.www.lea-test.fi
DECIMALDeveloped by Lea Hyvärinen, M.D.
FOR TESTING AT 16 INCHES (40 CM)
DISTANCEEQUIVALENTSFOOT METER
LETTERSIZE DECIMAL
20/400 6/120 8.0 M .05
20/200 6/60 4.0 M .10
20/160 6/48 3.2 M .12
20/320 6/95 6.3 M .063
20/250 6/75 5.0 M .08
20/125 6/38 2.5 M .16
20/100 6/30 2.0 M .20
20/80 6/24 1.6 M .25
20/63 6/19 1.25 M .32
20/50 6/15 1.0 M .4020/40 6/12 .80 M .5020/32 6/9.5 .63 M .6320/25 6/7.5 .50 M .8020/20 6/6 .40 M 1.020/16 6/4.8 .32 M 1.2520/12.5 6/3.8 .25 M 1.620/10 6/3 .20 M 2.0
Numbers Numbers
To determine the visual acuity use one of the following formulas:
OR
M-unit, metric unit is the distance in meters at which the refer-ence optotype C is seen at a visual angle of 5’.
Colenbrander Number Low Vision Chart (#272100)The Lea Numbers Test for Low Vision (#����00) is designed for examination of severely visually impaired children and adults. The largest optotypes are 50M in size corresponding to �/50 (�0/�000, �/�00, 0.0�) and the smallest optotypes are �M in size corresponding �/� (�0/�0, �/�, �.0) at a distance of one meter. The test comes with a one meter cord to maintain the proper test-ing distance.
Instruction
• Start testing binocularly. Point to the first symbol in each line in descending order.
• Move down until the child/person hesitates or misidentifies a symbol.
• Move back up one line and ask the child/person to identify all the symbols on that line.
• If the child/person identifies all symbols correctly go to the next line with smaller symbols and ask the child to identify all symbols on that line.
• If the child/person skips a symbol ask him/her to try again while briefly pointing to that symbol.
• A child/person with fixation problems may skip symbols
within a line of symbols.
• Visual acuity is recorded as the last line on which at least � of the 5 symbols are identified correctly. The visual acuity value is found in the margin adjacent to that line.
• After obtaining good responses with binocular testing, proceed by testing each eye separately.
• When testing monocularly, use the first symbol of each line or every second line for one eye and the last symbol of each line for the other eye to determine on which line to start testing close to the threshold value.
• If the client has profound low vision, the lowest rows of the test can be used as a near vision test. The distance of �5cm is the most practical distance because calculation of the visual acuity values is simple. They are ¼ of the value printed next to the last line read. (To calculate ¼ of a Snellen value, you multiply the denominator by 4.)
M-unit, metric unit is the distance in meters at which the refer-ence optotype C is seen at a visual angle of 5’.
Colenbrander Number Low Vision Chart (#272100)
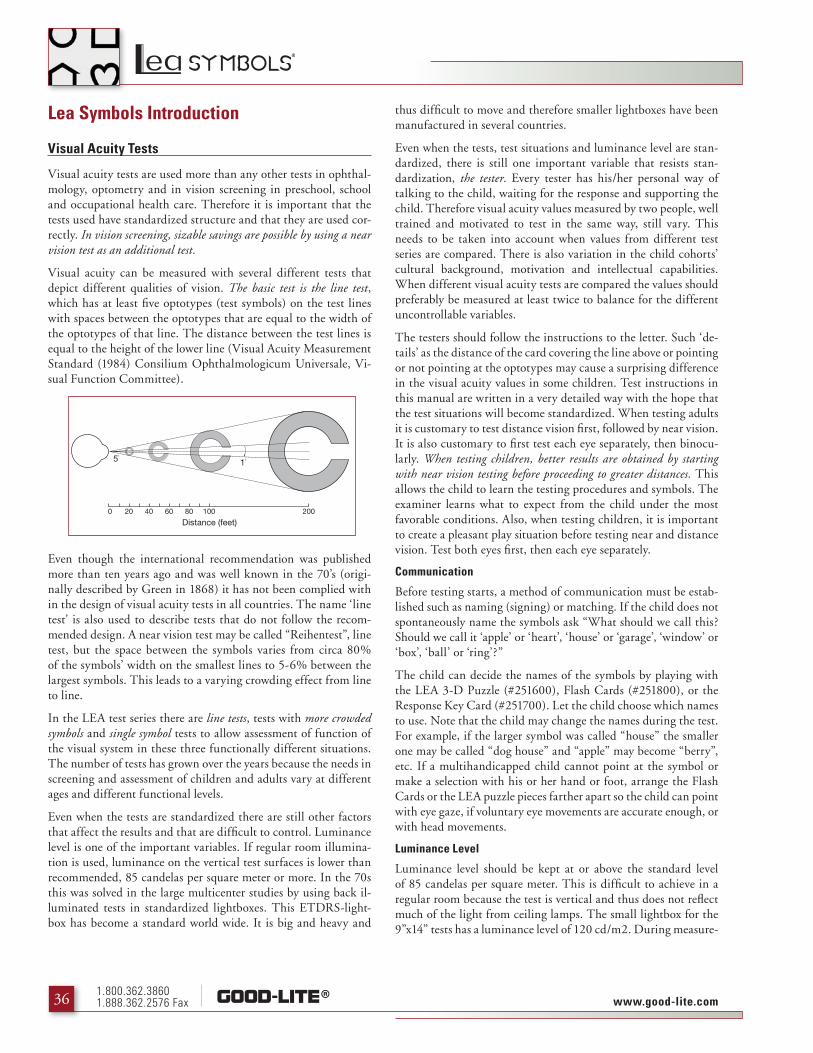
1.800.362.38601.888.362.2576 Fax www.good-lite.com��
Lea Symbols Introduction
Visual Acuity Tests
Visual acuity tests are used more than any other tests in ophthal-mology, optometry and in vision screening in preschool, school and occupational health care. Therefore it is important that the tests used have standardized structure and that they are used cor-rectly. In vision screening, sizable savings are possible by using a near vision test as an additional test.
Visual acuity can be measured with several different tests that depict different qualities of vision. The basic test is the line test, which has at least five optotypes (test symbols) on the test lines with spaces between the optotypes that are equal to the width of the optotypes of that line. The distance between the test lines is equal to the height of the lower line (Visual Acuity Measurement Standard (��84) Consilium Ophthalmologicum Universale, Vi-sual Function Committee).
Even though the international recommendation was published more than ten years ago and was well known in the �0’s (origi-nally described by Green in �8�8) it has not been complied with in the design of visual acuity tests in all countries. The name ‘line test’ is also used to describe tests that do not follow the recom-mended design. A near vision test may be called “Reihentest”, line test, but the space between the symbols varies from circa 80% of the symbols’ width on the smallest lines to 5-�% between the largest symbols. This leads to a varying crowding effect from line to line.
In the LEA test series there are line tests, tests with more crowded symbols and single symbol tests to allow assessment of function of the visual system in these three functionally different situations. The number of tests has grown over the years because the needs in screening and assessment of children and adults vary at different ages and different functional levels.
Even when the tests are standardized there are still other factors that affect the results and that are difficult to control. Luminance level is one of the important variables. If regular room illumina-tion is used, luminance on the vertical test surfaces is lower than recommended, 85 candelas per square meter or more. In the �0s this was solved in the large multicenter studies by using back il-luminated tests in standardized lightboxes. This ETDRS-light-box has become a standard world wide. It is big and heavy and
thus difficult to move and therefore smaller lightboxes have been manufactured in several countries.
Even when the tests, test situations and luminance level are stan-dardized, there is still one important variable that resists stan-dardization, the tester. Every tester has his/her personal way of talking to the child, waiting for the response and supporting the child. Therefore visual acuity values measured by two people, well trained and motivated to test in the same way, still vary. This needs to be taken into account when values from different test series are compared. There is also variation in the child cohorts’ cultural background, motivation and intellectual capabilities. When different visual acuity tests are compared the values should preferably be measured at least twice to balance for the different uncontrollable variables.
The testers should follow the instructions to the letter. Such ‘de-tails’ as the distance of the card covering the line above or pointing or not pointing at the optotypes may cause a surprising difference in the visual acuity values in some children. Test instructions in this manual are written in a very detailed way with the hope that the test situations will become standardized. When testing adults it is customary to test distance vision first, followed by near vision. It is also customary to first test each eye separately, then binocu-larly. When testing children, better results are obtained by starting with near vision testing before proceeding to greater distances. This allows the child to learn the testing procedures and symbols. The examiner learns what to expect from the child under the most favorable conditions. Also, when testing children, it is important to create a pleasant play situation before testing near and distance vision. Test both eyes first, then each eye separately.
Communication
Before testing starts, a method of communication must be estab-lished such as naming (signing) or matching. If the child does not spontaneously name the symbols ask “What should we call this? Should we call it ‘apple’ or ‘heart’, ‘house’ or ‘garage’, ‘window’ or ‘box’, ‘ball’ or ‘ring’?”
The child can decide the names of the symbols by playing with the LEA �-D Puzzle (#�5��00), Flash Cards (#�5�800), or the Response Key Card (#�5��00). Let the child choose which names to use. Note that the child may change the names during the test. For example, if the larger symbol was called “house” the smaller one may be called “dog house” and “apple” may become “berry”, etc. If a multihandicapped child cannot point at the symbol or make a selection with his or her hand or foot, arrange the Flash Cards or the LEA puzzle pieces farther apart so the child can point with eye gaze, if voluntary eye movements are accurate enough, or with head movements.
Luminance Level
Luminance level should be kept at or above the standard level of 85 candelas per square meter. This is difficult to achieve in a regular room because the test is vertical and thus does not reflect much of the light from ceiling lamps. The small lightbox for the �”x�4” tests has a luminance level of ��0 cd/m�. During measure-
0 20 40 60 80 100 200
Distance (feet)
5l
1l
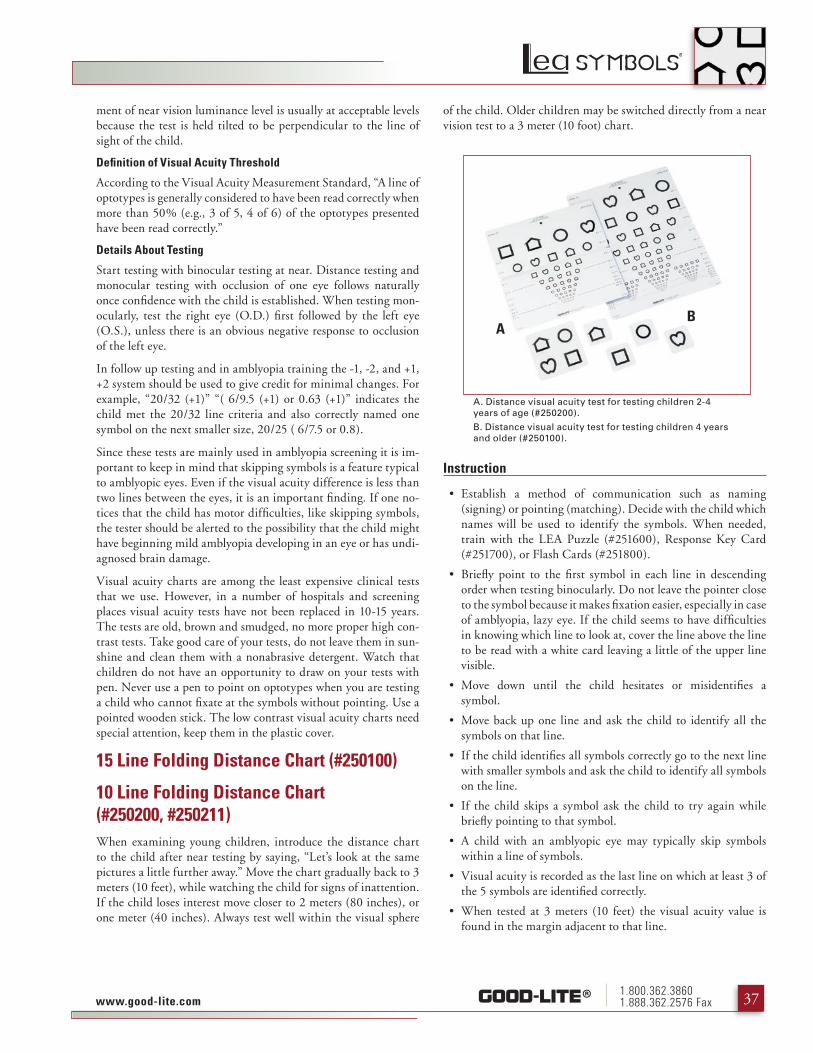
1.800.362.38601.888.362.2576 Faxwww.good-lite.com ��
ment of near vision luminance level is usually at acceptable levels because the test is held tilted to be perpendicular to the line of sight of the child.
Definition of Visual Acuity Threshold
According to the Visual Acuity Measurement Standard, “A line of optotypes is generally considered to have been read correctly when more than 50% (e.g., � of 5, 4 of �) of the optotypes presented have been read correctly.”
Details About Testing
Start testing with binocular testing at near. Distance testing and monocular testing with occlusion of one eye follows naturally once confidence with the child is established. When testing mon-ocularly, test the right eye (O.D.) first followed by the left eye (O.S.), unless there is an obvious negative response to occlusion of the left eye.
In follow up testing and in amblyopia training the -�, -�, and +�, +� system should be used to give credit for minimal changes. For example, “�0/�� (+�)” “( �/�.5 (+�) or 0.�� (+�)” indicates the child met the �0/�� line criteria and also correctly named one symbol on the next smaller size, �0/�5 ( �/�.5 or 0.8).
Since these tests are mainly used in amblyopia screening it is im-portant to keep in mind that skipping symbols is a feature typical to amblyopic eyes. Even if the visual acuity difference is less than two lines between the eyes, it is an important finding. If one no-tices that the child has motor difficulties, like skipping symbols, the tester should be alerted to the possibility that the child might have beginning mild amblyopia developing in an eye or has undi-agnosed brain damage.
Visual acuity charts are among the least expensive clinical tests that we use. However, in a number of hospitals and screening places visual acuity tests have not been replaced in �0-�5 years. The tests are old, brown and smudged, no more proper high con-trast tests. Take good care of your tests, do not leave them in sun-shine and clean them with a nonabrasive detergent. Watch that children do not have an opportunity to draw on your tests with pen. Never use a pen to point on optotypes when you are testing a child who cannot fixate at the symbols without pointing. Use a pointed wooden stick. The low contrast visual acuity charts need special attention, keep them in the plastic cover.
15 Line Folding Distance Chart (#250100)
10 Line Folding Distance Chart (#250200, #250211)When examining young children, introduce the distance chart to the child after near testing by saying, “Let’s look at the same pictures a little further away.” Move the chart gradually back to � meters (�0 feet), while watching the child for signs of inattention. If the child loses interest move closer to � meters (80 inches), or one meter (40 inches). Always test well within the visual sphere
of the child. Older children may be switched directly from a near vision test to a � meter (�0 foot) chart.
Instruction
• Establish a method of communication such as naming (signing) or pointing (matching). Decide with the child which names will be used to identify the symbols. When needed, train with the LEA Puzzle (#�5��00), Response Key Card (#�5��00), or Flash Cards (#�5�800).
• Briefly point to the first symbol in each line in descending order when testing binocularly. Do not leave the pointer close to the symbol because it makes fixation easier, especially in case of amblyopia, lazy eye. If the child seems to have difficulties in knowing which line to look at, cover the line above the line to be read with a white card leaving a little of the upper line visible.
• Move down until the child hesitates or misidentifies a symbol.
• Move back up one line and ask the child to identify all the symbols on that line.
• If the child identifies all symbols correctly go to the next line with smaller symbols and ask the child to identify all symbols on the line.
• If the child skips a symbol ask the child to try again while briefly pointing to that symbol.
• A child with an amblyopic eye may typically skip symbols within a line of symbols.
• Visual acuity is recorded as the last line on which at least � of the 5 symbols are identified correctly.
• When tested at � meters (�0 feet) the visual acuity value is found in the margin adjacent to that line.
AB
A. Distance visual acuity test for testing children 2-4 years of age (#250200).
B. Distance visual acuity test for testing children 4 years and older (#250100).

1.800.362.38601.888.362.2576 Fax www.good-lite.com�8
• After obtaining good responses with binocular testing, proceed by testing each eye separately.
• When testing monocularly, use the first symbol of each line or every second line for one eye and the last symbol of each line for the other eye to determine on which li ne to start testing.
Testing at Different Distances
If the chart is used at a distance other than the usual � meters (�0 feet), measure and record the viewing distance and the symbol size (the M value) or the visual acuity value printed at the thresh-old line.
To determine the visual acuity use one of the following formulas:
OR
Note that it is incorrect to report ‘V.A. �0/�5 at 5feet’ if the child could read the �0/�5-line (�.8M line) at 5 feet. Visual acuity is in that case: 5’/�0’ x �0/�5 = �/� x �0/�5 = �0/50. (When using the British notation: �/� line at �50cm equals: �.5m/�m x �/� = �/� x �/� = �/�8. When using the decimal notation 0.8 at �.5m equals: �.5m/�m x 0.8 = �/� x 0.8 = 0.4)
When the distance is one half (or one third) of the standard dis-tance, the visual acuity value is also one half (one third) of the value printed next to that line.
M-unit, metric unit is the distance in meters at which the refer-ence optotype C is seen at a visual angle of 5’.
15 Line Translucent Distance Chart (#250300)The distance visual acuity test for the large Illumina-tor Cabinet is manufactured for � meter test distance.
Instruction
• Establish a method of communication such as naming (signing) or pointing (matching). Decide with the child which names will be used to identify the symbols. When needed, train with the LEA Puzzle (#�5��00), Response Key Card (#�5��00), or Flash Cards (#�5�800).
• Briefly point to the first symbol in each line in descending order when testing binocularly. Do not leave the pointer close to the symbol because it makes fixation easier, especially in case of amblyopia, lazy eye. If the child seems to have difficulties in knowing which line to look at, cover the line above the line to be read with a white card leaving a little of the upper line visible.
• Move down until the child hesitates or misidentifies a symbol.
• Move back up one line and ask the child to identify all the symbols on that line.
• If the child identifies all symbols correctly go to the next line with smaller symbols and ask the child to identify all symbols on the line.
• If the child skips a symbol ask the child to try again while briefly pointing to that symbol.
• A child with an amblyopic eye may typically skip symbols within a line of symbols.
• Visual acuity is recorded as the last line on which at least � of the 5 symbols are identified correctly.
• When tested at � meters (�0 feet) the visual acuity value is found in the margin adjacent to that line.
• After obtaining good responses with binocular testing, proceed by testing each eye separately.
• When testing monocularly, use the first symbol of each line or every second line for one eye and the last symbol of each line for the other eye to determine on which line to start testing.
Testing at Different Distances
If the chart is used at a distance other than the usual � meters (�0 feet), measure and record the viewing distance and the symbol size (the M value) or the visual acuity value printed at the thresh-old line.
To determine the visual acuity use one of the following formulas:
OR
Note that it is incorrect to report ‘V.A. �0/�5 at 5feet’ if the child could read the �0/�5-line (�.8M line) at 5 feet. Visual acuity is in that case: 5’/�0’ x �0/�5 = �/� x �0/�5 = �0/50. (When using the British notation: �/� line at �50cm equals: �.5m/�m x �/� = �/� x �/� = �/�8. When using the decimal notation 0.8 at �.5m equals: �.5m/�m x 0.8 = �/� x 0.8 = 0.4)
Chart for 3 meters (10 feet) testing distance fits the ETDRS Cabinet. (#250300)

1.800.362.38601.888.362.2576 Faxwww.good-lite.com ��
When the distance is one half (or one third) of the standard dis-tance, the visual acuity value is also one half (one third) of the value printed next to that line.
13 Line Translucent Distance Chart (#250400, #252400, 250411)
12 Line Translucent Distance Chart (#255100)Standard illumination is a prerequisite for standardized measure-ments of visual acuity. Illuminator cabinets have been used more than �5 years to guarantee even illumination of visual acuity tests. They are most often used at the maximum illumination but can also be used even at low mesopic luminance levels by reducing the luminance level with filters in front of the test. It is easy to hold the covering card above the line to be read by sliding it between the test and the frame of the lightbox.
Lea Symbols distance visual acuity tests are manufactured for both the small lightbox and the large EDTRS style illuminator cabinet. For the small lightbox there are tests for � meter (�0 feet) test distance, test #�50400 and test #�5�400 and for 4 meter (�� feet) test distance, test #�55�00.
The Lea Symbols distance visual acuity test for the small light-box is manufactured for both � meters (�0 feet) (#�5�400) and 4 meters (�� feet) (#�55�00) with either two groups of the smaller symbol lines or with only one group of symbols (#�50400).
Instruction
• Establish a method of communication such as naming (signing) or pointing (matching). Decide with the child which names will be used to identify the symbols. When needed, train with the LEA Puzzle (#�5��00), Response Key Card (#�5��00), or Flash Cards (#�5�800).
• Briefly point to the first symbol in each line in descending order when testing binocularly. Do not leave the pointer close to the symbol because it makes fixation easier, especially in case of amblyopia, lazy eye. If the child seems to have difficulties in knowing which line to look at, cover the line above the line to be read with a white card leaving a little of the upper line visible.
• Move down until the child hesitates or misidentifies a symbol.
• Move back up one line and ask the child to identify all the symbols on that line.
• If the child identifies all symbols correctly go to the next line with smaller symbols and ask the child to identify all symbols on the line.
• If the child sk ips a symbol ask the child to try again while briefly pointing to that symbol.
• A child with an amblyopic eye may typically skip symbols within a line of symbols.
• Visual acuity is recorded as the last line on which at least � of the 5 symbols are identified correctly.
• When tested at � meters (�0 feet) the visual acuity value is found in the margin adjacent to that line.
• After obtaining good responses with binocular testing, proceed by testing each eye separately.
• When testing monocularly, use the first symbol of each line or every second line for one eye and the last symbol of each line for the other eye to determine on which line to start testing.
Testing at Different Distances
If the chart is used at a distance other than the usual � meters (�0 feet), measure and record the viewing distance and the symbol size (the M value) or the visual acuity value printed at the threshold line.
To determine the visual acuity use one of the following formulas:
OR
Note that it is incorrect to report ‘V.A. �0/�5 at 5feet’ if the child could read the �0/�5-line (�.8M line) at 5 feet. Visual acuity is in that case: 5’/�0’ x �0/�5 = �/� x �0/�5 = �0/50. (When
A. Translucent 3 Meter Distance Visual Acuity Test (#250400).
B. Translucent 3 Meter Distance Visual Acuity Test w/ Two Groups of Small Symbol Lines (#252400).

1.800.362.38601.888.362.2576 Fax www.good-lite.com40
Single Symbol Book (#250600)The Single Symbol Book is used if the child/adult cannot perform in testing with line tests. It is also used if one wants to determine what is the smallest size of optotypes recognised by a child/adult with amblyopia or impaired vision.
Instructions
• Establish a method of communication such as naming (signing) or pointing (matching). Decide with the child which names will be used to identify the symbols. When needed, train with the Lea Puzzle (#�5��00), Response Key Card (#�5��00), or Flash Cards (#�5�800).
• If only two out of four symbols are identified correctly, show one of the symbols a second time to give a fifth choice. The visual acuity threshold is defined as the level (smallest symbol size) at which the child can correctly identify at least three out of five symbols.
• If the child/adult correctly identifies two of the five symbols, report visual acuity as that of the previous larger symbol size. To get more information for follow-up examinations, write down (+�) after the visual acuity value to record that two symbols were identified correctly in the next smaller size. For example, “�0/��(+�)” indicates the child/adult passed the �0/�� line and also correctly named two �0/�5 symbols.
• When testing visually impaired children /adults, the test is often used as a single symbol near vision test instead of the Lea Symbols Domino or Playing Cards.
Testing at Different Distances:
If the test is used at a distance other than the usual � meters (�0 feet), measure and record the viewing distance and the symbol size (the value M).
OR
Examples:
If the viewing distance used was � feet (�80 cm) and the smallest optotypes correctly recognized were on line �0/50 (0.4).
OR
Note that it is incorrect to report ‘ V.A. �0/�5 at 5 feet’ if the child could read the �0/�5 (�0/��.5)-line (�.8M line) at 5 feet. Visual acuity is in that case: 5’/�0’ x �0/�5 = �/� x �0/�5 = �0/50. (When using the British notation: �/� line at �50cm equals: �.5m/�m x �/� = �/� x �/� = �/�8. When using the decimal notation 0.8 line at �.5m equals �.5m/�m x 0.8 = �/� x 0.8 = 0.4)
When the distance is one half (or one third) of the standard dis-tance, the visual acuity value is also one half (one third) of the value printed next to that line.
If you do not want to do the calculations, report the result as M-unit value, i.e. in the previous case �.8M at 5 feet (�.5m). Visual acuity is easy to calculate based on these values:
The calculation is based on metric measurements. The correspond-ing visual acuity values in the American and in the British notation you most often find also on the visual acuity chart. If the exactly corresponding value is not printed on the chart, calculate it as fol-lows: For example 0.0�= �/�00= [�x�/�00x�]=��/�00 or �0/�00; or for the British notation: 0.0�=�/�00=�/8� (�x�00/�=8�).
You multiply both the numerator and the denominator with the number that makes the numerator equal or closely equal to �0 or �.
Crowded Symbol Book (#250700)The Crowded Symbol Book is a variant of line test for children/adults who cannot concentrate on looking at a chart. The sym-bols are arranged so that the center symbol is surrounded on all four sides by symbols of similar size. The interaction between the center symbol and the surrounding symbols is approximately the same as in a line test. The test has a convenient size and is easy to handle when screening or when used during home visits and other similar test situations. It is usually the first line test that can be used to measure visual acuity of a young, amblyopic child’s eye thus revealing the effect of crowding.

1.800.362.38601.888.362.2576 Faxwww.good-lite.com 4�
Instructions
• First establish a method of communication such as naming (signing) or pointing (matching). Decide with the child which names will be used to identify the symbols. Train with the use of the Response Key Card (#�5��00), Training Cards (#�5��00), or Flash Cards (#�5�800). The �-dimensional Lea Puzzle may be needed to make the participation in the test situation motivating enough.
• Show the largest symbol size at near distance and then move backward � meters (�0 feet), while watching for signs of inattention. If the child’s attention/visual sphere is limited, move closer the child. Always measure well within the child’s visual sphere.
• Show one page in each symbol size, and ask the child to identify only the symbol on the left. Continue until the child hesitates or gives a wrong answer. Turn back to the previous symbol size pages and show all four pages, one at a time. Ask the child what the symbol on the left is and then what the next picture is (the one in the middle).
• If the child responds correctly to three out of the four middle symbols on the four pages, go on to the pages with the next smaller size symbols.
• If the child responds correctly to two out of the four middle symbols on the four pages, flip back to one of the previously read pages of the same symbol size and give a fifth choice. The visual acuity threshold is defined as the last level (symbol size) where at least three out of five middle symbols were identified correctly.
• If the child correctly identifies only two of the five symbols, report visual acuity as that of the previous larger symbol size. To get more information for follow-up examinations, write down (+�) after visual acuity value to record that the child identified two middle symbols correctly in the next smaller size. For example, “�0/��(+�)” indicates the child passed the �0/�� line and also correctly named two middle symbols on the �0/�5 line.
Testing at Different Distances:
If the test is used at a distance other than the usual � meters (�0 feet), measure and record the viewing distance and the symbol size (the value M).
OR
Examples:
If the viewing distance used was � feet (�80 cm) and the smallest optotypes correctly recognized were on line �0/50 (0.4).
OR
Note that it is incorrect to report ‘ V.A. �0/�5 at 5 feet’ if the child could read the �0/�5 (�0/��.5)-line (�.8M line) at 5 feet. Visual acuity is in that case: 5’/�0’ x �0/�5 = �/� x �0/�5 = �0/50. (When using the British notation: �/� line at �50cm equals: �.5m/�m x �/� = �/� x �/� = �/�8. When using the decimal notation 0.8 line at �.5m equals �.5m/�m x 0.8 = �/� x 0.8 = 0.4)
When the distance is one half (or one third) of the standard dis-tance, the visual acuity value is also one half (one third) of the value printed next to that line.
If you do not want to do the calculations, report the result as M-unit value, i.e. in the previous case �.8M at 5 feet (�.5m). Visual acuity is easy to calculate based on these values:
The calculation is based on metric measurements. The correspond-ing visual acuity values in the American and in the British notation you most often find also on the visual acuity chart. If the exactly corresponding value is not printed on the chart, calculate it as fol-lows: For example 0.0�= �/�00= [�x�/�00x�]=��/�00 or �0/�00; or for the British notation: 0.0�=�/�00=�/8� (�x�00/�=8�).
You multiply both the numerator and the denominator with the number that makes the numerator equal or closely equal to �0 or �.
Near Vision Card with 16” (40 cm) Measuring Cord (#250800, 251000)Near vision is functionally more important than distance vision in the life of a young child. The child is also more accustomed in using vision at near than at greater distances. Therefore introduc-tion of the test situation at near familiarizes the child with the test situation. You learn also about the child’s functional vision: In the rare case of myopia you will find that the child has useful vision at

1.800.362.38601.888.362.2576 Fax www.good-lite.com4�
near and parents will not be alarmed when the child does not see well during the distance visual acuity test.
When examining normally sighted children, hold the card at 40cm (�� in), the length of the cord. Let visually impaired chil-dren use their preferred distance and head posture during the first testing, later measure at 40cm (�� in) if the child also uses that distance in visual tasks.
The more crowded test with 50% and �5% spacing between the optotypes is a sensitive test to detect the increased crowding phe-nomenon. 50% spacing means that the space between the opto-types is one half of the width of the optotypes. Short video of the test situation with the line test side is at Follow-up of vision development >> At the age of three years >> sequence #�.
Instruction
• Establish a method of communication such as naming (signing) or pointing (matching). Decide with the child which names will be used to identify the symbols. When needed, train with the LEA Puzzle (#�5��00), Response Key Card (#�5��00), or Flash Cards (#�5�800).
• Start with binocular testing, using the center grouping of symbols.
• Point to each of the four symbols (circle, house, apple, square) on the top line, observe the baseline responses for comprehension, speed and accuracy.
• Cover the top line with a white card (the reverse side of a flash card may be used). It is best not to cover the top line completely, but to leave the bottom half of the symbols exposed. (This maintains the “contour interaction” effect of the standardized chart layout. If this confuses the child, cover the top line completely.)
• Ask the child to identify only the first symbol on the line below the covering card.
• Repeat this procedure for each or every second line (moving quickly down the chart to avoid tiring the child) until the child hesitates or misidentifies a symbol.
• Move back up one line and ask the child to identify all the symbols on that line.
• If the child identifies all symbols correctly go to the next line down and ask the child to identify all the symbols on that line.
• If the child skips a symbol, ask the child to try again while briefly pointing to that symbol.
• The visual acuity is recorded as the last line on which at least � of the 5 symbols are read correctly. Always test until the threshold line.
• If the chart is held at 40cm (�� in) the visual acuity value is found in the margin adjacent to that line.
• After binocular testing, proceed with testing each eye separately. When the right eye is covered ask the child to identify the symbols grouped on the lower left of the card (lower right when the left eye is covered). Use two pairs of plano glasses for occlusion of the child’s eyes or a pair of symmetric glasses that can be used for covering both eyes, one at a time. This is the least disturbing type of occluder for children.
• For monocular testing, follow the same procedure as for binocular testing.
• Older children may be tested using the reverse side of the near vision card where the same symbols are spaced more closely, as if in words or sentences. The testing procedure is the same as for binocular testing on the front of the card. The close spacing of the symbols on this test makes it a sensitive test for the detection of mild amblyopia. In children with brain damage there may be great differences between visual acuity values measured with the line test and the more crowded tests. - A four year old patient of mine once looked very surprised when I showed her the more crowded side of the test and said “It is impossible to look at those pictures. They hug each other.” That sentence depicts the difficulty in keeping the details apart from each other when the posterior pathways are damaged. Single symbol acuity may be normal or near normal.
• Visual acuity measured with crowded symbols approximates the smallest text size that the child will be able to read. It is NOT equivalent to the print size used in learning because nobody likes to read at the level of threshold. We usually read texts that are �-�0 times larger than the threshold size.
• The test is supplied with training cards and a response key. For convenience, the test has a response key line at the bottom.
Monocular near vision testing
Monocular near vision values are important in the follow-up of amblyopia treatment. Visual acuity values often improve first at near and later at distance. Before the age of three years it is usu-

1.800.362.38601.888.362.2576 Faxwww.good-lite.com 4�
ally easier to measure monocular near vision values than distance visual acuity values.
As a part of vision screening monocular testing is of interest at the age of �-� years. If visual acuity at distance has become less than it was at age 4 or if there is difference between the two eyes, near vision measurement may give the following diagnosis: If the near vision values are symmetric and as before the change in distance vision cannot be caused by anything else but mild myopia, which does not need to be corrected. The child does not need to be re-ferred. This leads to a decrease in the expenses of vision screening and simultaneously an improvement in the quality of screening.
Testing Near Vision at Shorter Distances
A child with a visual impairment is allowed to choose any distance and is given a correction for that distance, if needed. If the chart is used at a distance other than the usual 40cm (�� in)+, measure and record the viewing distance and the symbol size read (the M value) or the visual acuity value printed adjacent to the threshold line.
To determine the visual acuity use one of the following formulas:
Note that it is incorrect to report “V.A. �0/�5 at 8 inches” if the child could read the �0/�5-line (.50M line) at 8 inches. Visual acuity is in that case: 8”/��” x �0/�5 = �/� x �0/�5 = �0/50. (When using the British notation: �/� line at �0cm equals: �0cm/40cm x �/� = �/� x �/� = �/�8. When using the decimal notation 0.8 line at �0cm equals: �0cm/40cm x 0.8 = �/� x 0.8 = 0.4.)
When the distance is one half (or one third) of the standard dis-tance, the visual acuity value is also one half (one third) of the value printed next to that line.
If you do not want to do the calculations, report the result as M-unit value, i.e. in the previous case .50M at 8” (�0cm). Visual acu-ity is easy to calculate based on these values: VA = 0.�m/.50M = �/5=4/�0=0.4 or �/5=�0/50 or �/5=�/�5 the closest being �/�8.
The calculation is based on metric measurements. The corre-sponding visual acuity values in the American and in the British notation you can also find on the visual acuity chart. If the exactly corresponding value is not printed on the chart, calculate it as fol-lows: For example 0.0�= �/�00= [�x�/�00x�]=��/�00 or �0/�00; or for the British notation: 0.0�=�/�00=�/8� (�x�00/�=8�)
You multiply both the numerator and the denominator with the number that makes the numerator equal or closely equal to �0 or �.
Near Vision Pocket Card (#250900)When you want to measure visual acuity values quickly and less exactly than with the Near Vision Card (#�50800) with its cord to hold the test at the standard distance, you can use the Pocket Near Card and hold it at approximately 40cm (�� inches). The name pocket card refers to the original use of this test during rounds at the hospitals.
• You decide together with the child which names the child wants to give to the four symbols or - if the child does not want to or cannot talk - choose pointing at the large symbols on the responce cards.
• To measure the functionally most important binocular vision you show the card at the distance of 40cm (�� inches) and ask the child what is the first symbol on the largest row, then the symbol on the second, third and fourth row, and so on until the child makes an error. The easiest way to make sure that the child knows which row to look at is to cover the line above with the white side of your business card. ( In the rare case when the child is markedly myopic and thus accustomed to looking at a close distance, test at a distance of �0cm. The visual acuity value is then one half of the value printed at the line that the child can read.)
• When the child makes an error, move back one line and ask the child to read the whole line. Support the child by saying: You read this first one so fine, what was it. The child may answer “house”. Then you ask: What is this picture next to the house. You may briefly point to the next symbol but do not leave the pointing finger at the symbol because it makes it easier to fixate on the symbol. By confirming what the child has said, you motivate the child to perform close to the threshold.
• Visual acuity is the value of the line on which the child correctly reads at least three out of the five symbols.
• If you need to know visual acuity of both eyes separately, you need to cover one eye to be able to test the other eye. This may be a problem in the younger age group and may even require training at home before it is possible. When the eye can be covered without fuss you can test the other eye and get a reliable result.
Domino Cards (#251500)The set contains 48 domino-like cards with a large symbol at one end and a small symbol at the other end. The paper cards measure 4 x � cm (�.� x �.�5 in). The set is divided into three packs of ��
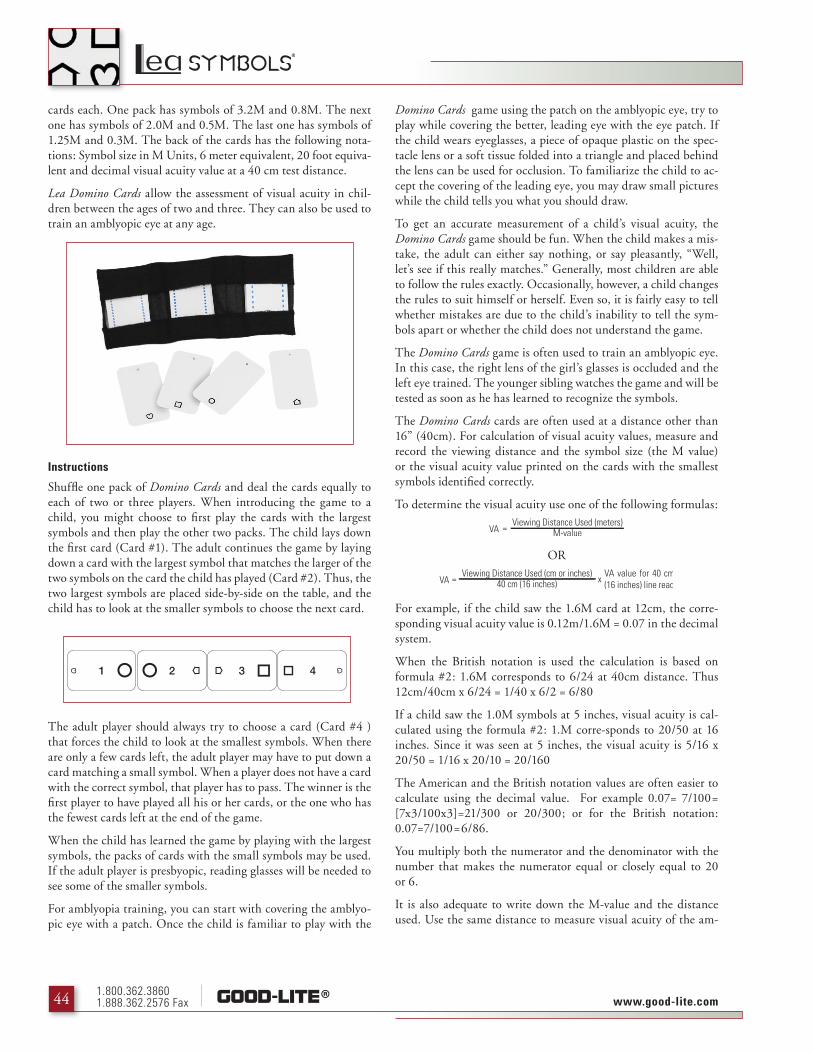
1.800.362.38601.888.362.2576 Fax www.good-lite.com44
cards each. One pack has symbols of �.�M and 0.8M. The next one has symbols of �.0M and 0.5M. The last one has symbols of �.�5M and 0.�M. The back of the cards has the following nota-tions: Symbol size in M Units, � meter equivalent, �0 foot equiva-lent and decimal visual acuity value at a 40 cm test distance.
Lea Domino Cards allow the assessment of visual acuity in chil-dren between the ages of two and three. They can also be used to train an amblyopic eye at any age.
Instructions
Shuffle one pack of Domino Cards and deal the cards equally to each of two or three players. When introducing the game to a child, you might choose to first play the cards with the largest symbols and then play the other two packs. The child lays down the first card (Card #�). The adult continues the game by laying down a card with the largest symbol that matches the larger of the two symbols on the card the child has played (Card #�). Thus, the two largest symbols are placed side-by-side on the table, and the child has to look at the smaller symbols to choose the next card.
The adult player should always try to choose a card (Card #4 ) that forces the child to look at the smallest symbols. When there are only a few cards left, the adult player may have to put down a card matching a small symbol. When a player does not have a card with the correct symbol, that player has to pass. The winner is the first player to have played all his or her cards, or the one who has the fewest cards left at the end of the game.
When the child has learned the game by playing with the largest symbols, the packs of cards with the small symbols may be used. If the adult player is presbyopic, reading glasses will be needed to see some of the smaller symbols.
For amblyopia training, you can start with covering the amblyo-pic eye with a patch. Once the child is familiar to play with the
Domino Cards game using the patch on the amblyopic eye, try to play while covering the better, leading eye with the eye patch. If the child wears eyeglasses, a piece of opaque plastic on the spec-tacle lens or a soft tissue folded into a triangle and placed behind the lens can be used for occlusion. To familiarize the child to ac-cept the covering of the leading eye, you may draw small pictures while the child tells you what you should draw.
To get an accurate measurement of a child’s visual acuity, the Domino Cards game should be fun. When the child makes a mis-take, the adult can either say nothing, or say pleasantly, “Well, let’s see if this really matches.” Generally, most children are able to follow the rules exactly. Occasionally, however, a child changes the rules to suit himself or herself. Even so, it is fairly easy to tell whether mistakes are due to the child’s inability to tell the sym-bols apart or whether the child does not understand the game.
The Domino Cards game is often used to train an amblyopic eye. In this case, the right lens of the girl’s glasses is occluded and the left eye trained. The younger sibling watches the game and will be tested as soon as he has learned to recognize the symbols.
The Domino Cards cards are often used at a distance other than ��” (40cm). For calculation of visual acuity values, measure and record the viewing distance and the symbol size (the M value) or the visual acuity value printed on the cards with the smallest symbols identified correctly.
To determine the visual acuity use one of the following formulas:
OR
For example, if the child saw the �.�M card at ��cm, the corre-sponding visual acuity value is 0.��m/�.�M = 0.0� in the decimal system.
When the British notation is used the calculation is based on formula #�: �.�M corresponds to �/�4 at 40cm distance. Thus ��cm/40cm x �/�4 = �/40 x �/� = �/80
If a child saw the �.0M symbols at 5 inches, visual acuity is cal-culated using the formula #�: �.M corre-sponds to �0/50 at �� inches. Since it was seen at 5 inches, the visual acuity is 5/�� x �0/50 = �/�� x �0/�0 = �0/��0
The American and the British notation values are often easier to calculate using the decimal value. For example 0.0�= �/�00= [�x�/�00x�]=��/�00 or �0/�00; or for the British notation: 0.0�=�/�00=�/8�.
You multiply both the numerator and the denominator with the number that makes the numerator equal or closely equal to �0 or �.
It is also adequate to write down the M-value and the distance used. Use the same distance to measure visual acuity of the am-
2 3 41

1.800.362.38601.888.362.2576 Faxwww.good-lite.com 45
blyopic and the leading eye. Then comparison of the acuity values is easy: the difference in visual acuity values as lines of the visual acuity chart is equal to the difference in M-values. Since an am-blyopic eye usually sees individual symbols better than symbols in a line test the values measured with the Domino Cards show a smaller difference between the eyes than there might be.
To keep the viewing distance constant, you may pretend not see-ing the smaller symbol of your card. Show the card to the child at the distance of ��” (40cm). If the child bends forward move the card accordingly. Do not use a ruler to measure the distance but use your arm as the measure stick.
3-D Puzzle (#251600)The LEA 3-D Puzzle is designed for training and assessment of normal infants, young children and older children and adults at early developmental levels. The puzzle is also a tool in neuropsy-chological assessment of patients with brain damage. If the child cannot grasp the puzzle pieces but can grasp a champagne bottle cork, glue a small flat magnet on the cork and a small flat piece of metal on the puzzle piece.
The aim in the play training of infants and young children is to help them to develop the concept same/different as a prerequi-site for measurement of visual acuity much earlier than is possible without training with this educational toy.
A �0-�� month-old infant will put the puzzle pieces in his/her mouth and bang the floor or the table with them. Give only the square and the round puzzle pieces at this stage and also during the next stage when the child starts to drop or to throw the puzzle pieces, often throwing the puzzle board also. This is a recognized phase in the normal development of auditory space, the child is not mischievous. Since the board is heavy, it may break something if thrown with force so watch the child and rescue the board be-fore it is thrown or catch it in midair.
At the next level the child starts to study the cut-outs of the puz-zle and may by chance put the round, orange puzzle piece in the orange cut-out, later the blue square puzzle piece into the blue cut-out. When the child repeats this activity and starts to do it
with obvious intention, let him/her try the apple and house puz-zle pieces that require better motor skills than the circle and the square.
When the child can place all four colored pieces in their cut-outs introduce the black and white side starting again with the circle and the square. When the child masters placing the black-and-white puzzle pieces in their cut-outs, introduce the concept of pictures representing objects by drawing around the puzzle pieces and studying with the child the resulting picture and the fact that the piece can be placed on it. When the child starts to place the puzzle pieces on these big pictures, introduce smaller pictures of these forms. When the child starts to place the puzzle pieces on the smaller pictures (s)he is ready to be tested using single sym-bol tests, either the Lea Playing Cards or the Lea Domino Cards. This development usually happens between �8 and �4 months and thus visual acuity can be measured more than a year earlier than has been customary.
Training of the concept similar/different follows the same pattern in the early habilitation of vision impaired infants and in assess-ment of vision of children with multiple impairments. Children with brain damage related visual impairment may learn to match colors but may have much greater difficulties in learning to match forms, or may be unable to learn it due to specific loss of per-ception of geometric forms. Some children may learn to match the black-and-white forms during a half an hour play therapy but forget the concept as soon as the activity ends. They are unable to store the new knowledge from their working memory to their long-term memory.
During play it is also possible to observe such functions as ori-entation in egocentric space and eye-hand coordination. A child may have problems in turning the puzzle pieces to fit the cut-outs. In such a situation enough time needs to be allowed if the child has motor problems to assess whether there are problems in visual planning or visual feed-back during the task or whether the slow motor performance is a pure motor problem.
Since video recordings are helpful in the assessment of cognitive visual problems, sequences from assessments of children with dif-ferent types of brain damage are collected in the CD (#�80�00). They show great variation in responses of children with brain damage during this matching game and are thus useful in teach-ing teachers and therapists as well as other categories of workers related to vision impaired children. Very short sequences are also at “My Sight is Important”.
Instructions
• Start on the colorful side of the puzzle board and puzzle pieces. If the child has not seen the puzzle before, hold the puzzle within the reach of the child, place the round piece on the board and go on chatting with the child and his/her mother on other subjects while watching the child’s response. Give the child time to examine the puzzle piece and the cut-outs. Do not suggest placing the piece in the cut-out. If the child

1.800.362.38601.888.362.2576 Fax www.good-lite.com4�
places the round puzzle piece in its cut-out, say “there it went” without making more noice about it, take the round puzzle piece and place the square puzzle piece in the middle of the puzzle board. If it is placed in the correct cut-out, take it and give the “apple” saying “what about this, where does it go” and if it is placed correctly, give the “house”.
• When assessing an older child who is likely to be able to match colors, ask simply ‘Have you played with this puzzle before?’
• Watch the eye-hand coordination and turning of the puzzle pieces to learn about visual guidance of motor functions and how much the child uses tactile information to find the correct orientation of the puzzle pieces.
• If a child has major motor difficulties, play the usual way first and then so that the child does not look at the puzzle but uses tactile information and visual memory of the structure of the board.
• If the child does not start matching the puzzle pieces (s)he will need more exposure in play situations. It is better for the child him/herself to figure out matching or to observe another child playing instead of being taught that the pieces can be placed in the cut-outs.
• When the child can place the puzzle pieces in the cut-outs on the colorful side, turn the board and let the child find out what to do with the black-and-white pieces. You might say ‘There is an other side of this game.’ The child usually grasps a puzzle piece, turns the colorful side up and then places it in its cut-out, maybe using visual memory of the location. To find out that, turn the board �0 or �80 degrees while the child is reaching for the next puzzle piece. Next time when you play the game, turn the board 45, �0 or �80 degrees while turning it from the colorful side to the black-and-white side.
To record the child’s ways of solving the problems in this test situ-ation, keep a video camera running. To disturb as little as pos-sible, place the camera on a tripod farther away and choose the frame large enough to show both the face and the hands of the child. Soft music can be used to cover the sound of the camera. If you can connect the camera to a TV behind the child you can watch that the child does not lean outside the picture area or you can widen the picture area.
When a child places the puzzle pieces in their colourful cut-outs with ease but has obvious difficulty when matching the black-and-white-forms, play the computer game Lea Puzzle to find out whether forms can be perceived when colours are used but the colours of the forms differ. The child cannot use colour matching but has to perceive the form to match.
Amblyopia Screening Tests Near Vision Screener with 16 inch/40 cm Cord (#252000)
Distance Vision Screener Book, 10 feet/3 meter (#259900)The most effective vision screening for detecting lazy eye uses near and distance test. When testing children younger than 4 years, testing is a lot easier if children have had an opportunity to play with the test symbols before the test situation. This can be arranged by including the test symbols in the information sent or given to parents as an invitation to participate in the screening examination. Parents can play the Lea Symbols game at the Lea-Test homepage. Just prior to the testing children can play with the Lea Puzzle that effectively decreases fears and introduces the test situation as a play situation.
Near vision is functionally more important than distance vision in the life of a young child. The child is also more accustomed in using vision at near than at greater distances. Therefore introduc-tion of the test at near familiarizes the child with the test situa-tion. Young children are easier to test at near than at distance of � meters (�0 feet). In the rare case of myopia you will find that the child has useful vision at near and parents (and you) will not be alarmed when the child does not see well during the distance test.
The target population of amblyopia screening, like any screening, are symptom free children. If a child has symptoms of any kind (strabismus, squeezing eyes during testing, head tilt or turn, itchy or red eyes etc.), (s)he is referred for treatment independent of visual acuity values.
The Lea Symbols Amblyopia Screeners look different than the other Lea Symbols test. The grey background was chosen for two rea-sons: �. in developing countries dust will not show on the test during the day, in the evening the tests can be washed, �. since there is less white surface, the test does not dazzle photophobic children.
The test lines are wider apart in the near vision screener card than in the standard test (#�50800). It makes it easier for both the tester and the child to know on which line to read. Therefore test-ing becomes more relaxed and is faster. In the distance tests there is only one line visible on each page and there are two pages of each size. This way if the child makes several errors on a certain line but immediately corrects some of them, the tester can ask the child to read the other line of the same size.
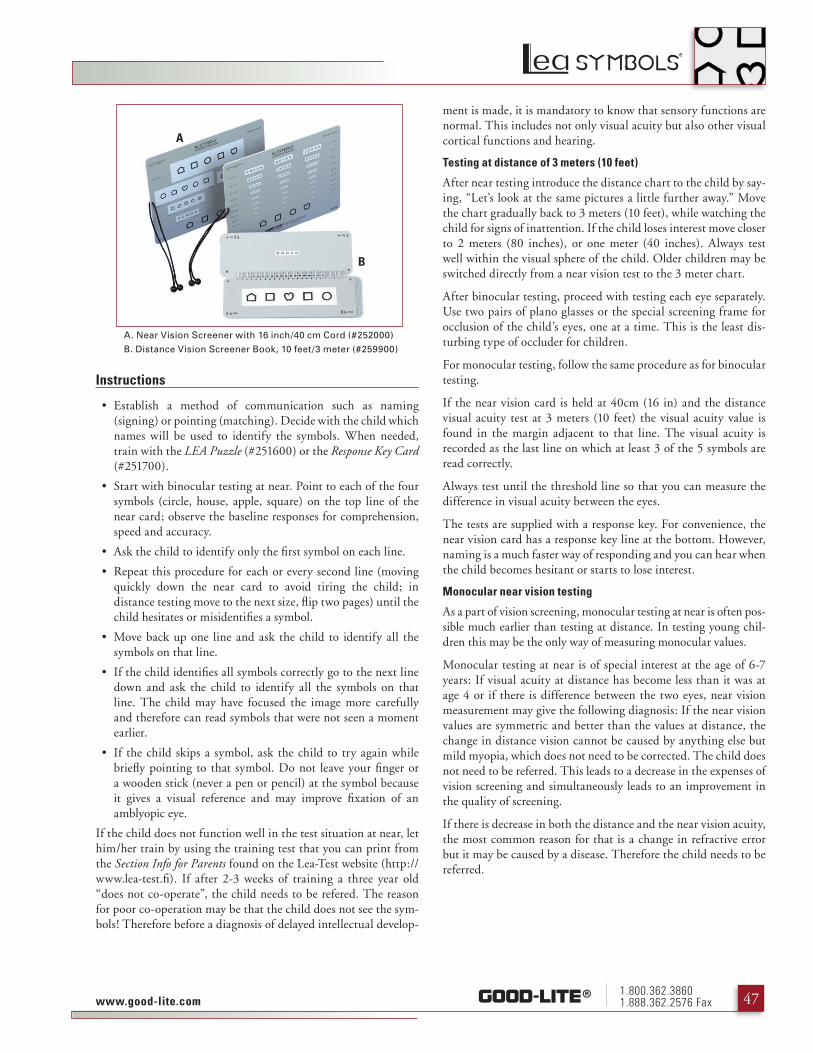
1.800.362.38601.888.362.2576 Faxwww.good-lite.com 4�
Instructions
• Establish a method of communication such as naming (signing) or pointing (matching). Decide with the child which names will be used to identify the symbols. When needed, train with the LEA Puzzle (#�5��00) or the Response Key Card (#�5��00).
• Start with binocular testing at near. Point to each of the four symbols (circle, house, apple, square) on the top line of the near card; observe the baseline responses for comprehension, speed and accuracy.
• Ask the child to identify only the first symbol on each line.
• Repeat this procedure for each or every second line (moving quickly down the near card to avoid tiring the child; in distance testing move to the next size, flip two pages) until the child hesitates or misidentifies a symbol.
• Move back up one line and ask the child to identify all the symbols on that line.
• If the child identifies all symbols correctly go to the next line down and ask the child to identify all the symbols on that line. The child may have focused the image more carefully and therefore can read symbols that were not seen a moment earlier.
• If the child skips a symbol, ask the child to try again while briefly pointing to that symbol. Do not leave your finger or a wooden stick (never a pen or pencil) at the symbol because it gives a visual reference and may improve fixation of an amblyopic eye.
If the child does not function well in the test situation at near, let him/her train by using the training test that you can print from the Section Info for Parents found on the Lea-Test website (http://www.lea-test.fi). If after �-� weeks of training a three year old “does not co-operate”, the child needs to be refered. The reason for poor co-operation may be that the child does not see the sym-bols! Therefore before a diagnosis of delayed intellectual develop-
ment is made, it is mandatory to know that sensory functions are normal. This includes not only visual acuity but also other visual cortical functions and hearing.
Testing at distance of 3 meters (10 feet)
After near testing introduce the distance chart to the child by say-ing, “Let’s look at the same pictures a little further away.” Move the chart gradually back to � meters (�0 feet), while watching the child for signs of inattention. If the child loses interest move closer to � meters (80 inches), or one meter (40 inches). Always test well within the visual sphere of the child. Older children may be switched directly from a near vision test to the � meter chart.
After binocular testing, proceed with testing each eye separately. Use two pairs of plano glasses or the special screening frame for occlusion of the child’s eyes, one at a time. This is the least dis-turbing type of occluder for children.
For monocular testing, follow the same procedure as for binocular testing.
If the near vision card is held at 40cm (�� in) and the distance visual acuity test at � meters (�0 feet) the visual acuity value is found in the margin adjacent to that line. The visual acuity is recorded as the last line on which at least � of the 5 symbols are read correctly.
Always test until the threshold line so that you can measure the difference in visual acuity between the eyes.
The tests are supplied with a response key. For convenience, the near vision card has a response key line at the bottom. However, naming is a much faster way of responding and you can hear when the child becomes hesitant or starts to lose interest.
Monocular near vision testing
As a part of vision screening, monocular testing at near is often pos-sible much earlier than testing at distance. In testing young chil-dren this may be the only way of measuring monocular values.
Monocular testing at near is of special interest at the age of �-� years: If visual acuity at distance has become less than it was at age 4 or if there is difference between the two eyes, near vision measurement may give the following diagnosis: If the near vision values are symmetric and better than the values at distance, the change in distance vision cannot be caused by anything else but mild myopia, which does not need to be corrected. The child does not need to be referred. This leads to a decrease in the expenses of vision screening and simultaneously leads to an improvement in the quality of screening.
If there is decrease in both the distance and the near vision acuity, the most common reason for that is a change in refractive error but it may be caused by a disease. Therefore the child needs to be referred.
A. Near Vision Screener with 16 inch/40 cm Cord (#252000)
B. Distance Vision Screener Book, 10 feet/3 meter (#259900)
A
B

1.800.362.38601.888.362.2576 Fax www.good-lite.com48
Pass/fail criteria
Pass/fail limits are used in a number of amblyopia screenings. It decreases the sensitivity of the test.
If the child has visual acuity 0.8 (�0/�5, �/�) in one eye and 0.5(�0/40, �/��) in the other eye, the difference in visual acuity values between the eyes will not be detected if a pass/fail criteria of 0.5 (�0/40, �/��) is used.
At the age of four years, most western countries use a pass/fail criteria of 0.5 (�0/40, �/��) for binocular visual acuity to detect large refractive errors and previously undetected cases of binocu-lar visual impairment that might affect the child’s general devel-opment.
On the other hand, a pass/fail limit of 0.8 (�0/�5, �/�) at the age of six years does not seem to pick many children who have refrac-tive errors that should be corrected.
In school age the passing limit should not be one single visual acuity value but based on the vision needs of a particular child: If the child is in the shortest or the middle third of the class and if (s)he can sit close to the podium, binocular visual acuity of 0.� - 0.� (�0/�00 - �0/�0, �/�0 - �/�8) may cause no difficulty in the class room. On the other hand if the child is tall and is required to sit far from the blackboard, visual acuity of 0.8 (�0/�5, �/�) may be required for normal working in the classroom. If children are referred at a time when they have only mild myopia, the referral expenses are high. In many places children are prescribed these weak glasses that they do not need. This is a sizeable extra cost to the families.
It should be clearly remembered that vision screening after the age of 8-� years is arranged to find those children who may need glasses in order to see well in the classroom. We are not looking for amblyopia or diseases and therefore the deciding fact is whether the child sees well enough in the classroom or not.
There is one more question that needs to be stressed: age normal visual acuity values in vision screening do not guarantee that vi-sion is normal. Brain damage related vision loss (CVI), retinal degeneration or optic nerve lesions may not affect visual acuity at high contrast but may have caused loss of vision at low contrast or visual field defects or disabling losses of visual perception. The symptoms of brain damage and eye or pathway disorder related changes should be better known because today it may take years before a child is referred to intervention and receives services of special education.
Playing Cards (#252500)Of the three sets of cards included in the test materials, the Play-ing Cards is the easiest in measuring the visual acuity of very young children. It functions also as regular teaching material when learning the concepts of similar/different, big/small, big-ger/smaller.
Suggestions for the Play Situation
If the child has difficulties in picture perception use the Lea 3-D Puzzle (#�5��00) first, then compare the �-D symbols with the pictures of the symbols drawn by tracing around the puzzle pieces or with the pictures on the Flash Cards (#�5��00) before using the Playing Cards for sorting games:
Level I: Sorting each symbol type separately
All Playing Cards with the symbol “house” are stacked one by one next to the “house” flash card. Then do the same with the “apple,” “ball,” and “box.”
Level II. Sorting two or more symbols
• Give the child a mix of two different symbol shapes in all different sizes and have him/her sort them by matching them up with the corresponding flash card.
• If the number of cards is too much for the child, choose three to four of the biggest sizes of both symbols. Next time you play you can choose smaller sizes.
• Repeat Step � and add a third symbol and the matching flash card. Then repeat, adding the fourth symbol.
• Instead of placing the playing cards into stacks, make neat rows of cards next to the flash card(s).
• Sort the cards within the row in the order from the biggest to the smallest.
In each game situation, make sure you do not use symbols that are too small for the child to see. Later you can introduce a smaller size by having the child look at it from a shorter distance and/or with a magnifying device.
If the child wants to play with the �-D forms in the middle of the game, allow that, because the child may need tactile confirma-tion.
Visual Acuity
During the game, it becomes obvious which size of symbols is the smallest the child can respond to, thus giving you approximate vi-sual acuity value. To determine the child’s visual acuity you need to measure the distance at which the smallest symbol is seen. Use your hand to measure the distance rather than a ruler so as not to disturb the play situation.
You can also measure visual acuity by asking the child to place the corresponding Lea Puzzle piece on the card that you place in front of the child.
If you use the Lea Playing Cards as a game playing “pairs”, the child may be motivated to get quite close to the recognition threshold.
The M size, i.e. the actual size of the symbol, is printed on the back of the playing cards. The following tables give you the visual acuity values when measured at ��, 8 or 4 inches (at 40cm, �0cm or �0cm).
If the child recognized the �.0M symbols at a distance different from the three distances given in the table, for example at 5”, the
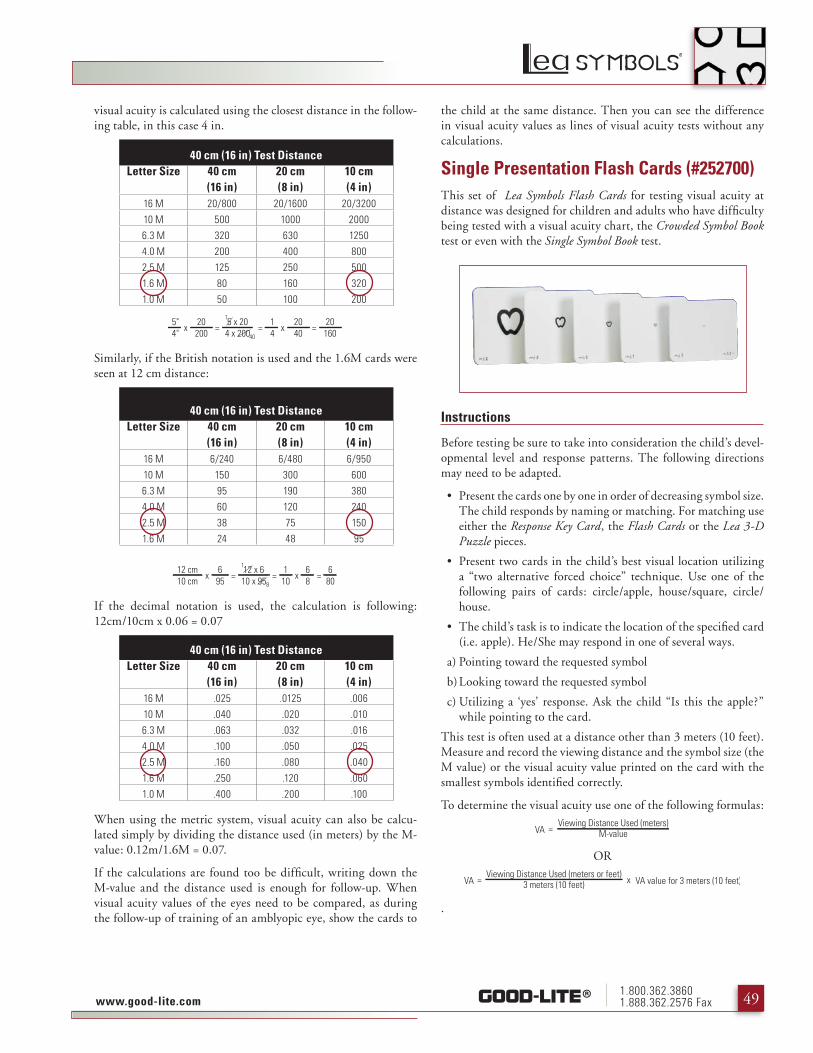
1.800.362.38601.888.362.2576 Faxwww.good-lite.com 4�
visual acuity is calculated using the closest distance in the follow-ing table, in this case 4 in.
40 cm (16 in) Test DistanceLetter Size 40 cm
(16 in)20 cm (8 in)
10 cm (4 in)
16 M 20/800 20/1600 20/320010 M 500 1000 20006.3 M 320 630 12504.0 M 200 400 8002.5 M 125 250 5001.6 M 80 160 3201.0 M 50 100 200
Similarly, if the British notation is used and the �.�M cards were seen at �� cm distance:
40 cm (16 in) Test DistanceLetter Size 40 cm
(16 in)20 cm (8 in)
10 cm (4 in)
16 M 6/240 6/480 6/95010 M 150 300 6006.3 M 95 190 3804.0 M 60 120 2402.5 M 38 75 1501.6 M 24 48 95
If the decimal notation is used, the calculation is following: ��cm/�0cm x 0.0� = 0.0�
40 cm (16 in) Test DistanceLetter Size 40 cm
(16 in)20 cm (8 in)
10 cm (4 in)
16 M .025 .0125 .00610 M .040 .020 .0106.3 M .063 .032 .0164.0 M .100 .050 .0252.5 M .160 .080 .0401.6 M .250 .120 .0601.0 M .400 .200 .100
When using the metric system, visual acuity can also be calcu-lated simply by dividing the distance used (in meters) by the M-value: 0.��m/�.�M = 0.0�.
If the calculations are found too be difficult, writing down the M-value and the distance used is enough for follow-up. When visual acuity values of the eyes need to be compared, as during the follow-up of training of an amblyopic eye, show the cards to
the child at the same distance. Then you can see the difference in visual acuity values as lines of visual acuity tests without any calculations.
Single Presentation Flash Cards (#252700)This set of Lea Symbols Flash Cards for testing visual acuity at distance was designed for children and adults who have difficulty being tested with a visual acuity chart, the Crowded Symbol Book test or even with the Single Symbol Book test.
Instructions
Before testing be sure to take into consideration the child’s devel-opmental level and response patterns. The following directions may need to be adapted.
• Present the cards one by one in order of decreasing symbol size. The child responds by naming or matching. For matching use either the Response Key Card, the Flash Cards or the Lea 3-D Puzzle pieces.
• Present two cards in the child’s best visual location utilizing a “two alternative forced choice” technique. Use one of the following pairs of cards: circle/apple, house/square, circle/house.
• The child’s task is to indicate the location of the specified card (i.e. apple). He/She may respond in one of several ways.
a) Pointing toward the requested symbol
b) Looking toward the requested symbol
c) Utilizing a ‘yes’ response. Ask the child “Is this the apple?” while pointing to the card.
This test is often used at a distance other than � meters (�0 feet). Measure and record the viewing distance and the symbol size (the M value) or the visual acuity value printed on the card with the smallest symbols identified correctly.
To determine the visual acuity use one of the following formulas:
OR
.

1.800.362.38601.888.362.2576 Fax www.good-lite.com50
Note that it is incorrect to report ‘ V.A. �0/�5 at �.5feet’ if the child could read the �0/�5 (�0/��.5)-line (�.8M -line) at �.5 feet. Visual acuity is in that case: �.5’/�0’ x �0/�5 = �/4 x �0/�5 = �0/�00. (When using the British notation: �/� line at �5cm equals: 0.�5m/�m x �/� = �/4 x �/� = �/��. When using the decimal notation 0.8 line at 0.�5m equals 0.�5m/�m x 0.8 = �/4 x 0.8 = 0.�)
When the distance is one half (or one fourth) of the standard dis-tance, also the visual acuity value is one half (one fourth) of the value printed next to that line.
If you do not want to do the calculations, report the result as M-value, i.e. in the previous case �.8M at �.5 feet (0.�5m).
Examples:
If the viewing distance used was � feet (�80 cm) and the smallest optotypes correctly recognized were on line �0/50 (0.4).
OR
Colenbrander Lea Symbols Low Vision Chart (#258000)The Colenbrander Lea Symbols Low Vision Chart (#�58000) is de-signed for examination of severely visually impaired children and adults. The largest symbols are 50M in size corresponding to �/50 (�0/�000, �/�00, 0.0�) and the smallest symbols are �M in size corresponding �/� (�0/�0, �/�, �.0) at a distance of one meter. The test comes with a one meter cord to maintain the proper test-ing distance.
Instruction
• When examining young children, introduce the distance chart to the child after near testing by saying, “Let’s look at the same pictures a little further away.”
• Point to the first symbol in each line in descending order when testing binocularly.
• Move down until the child hesitates or misidentifies a symbol.
• Move back up one line and ask the child to identify all the symbols on that line.
• If the child identifies all symbols correctly go to the next line with smaller symbols and ask the child to identify all symbols on that line.
• If the child skips a symbol ask the child to try again while briefly pointing to that symbol.
• A child with fixation problems may skip symbols within a line of symbols.
• Visual acuity is recorded as the last line on which at least � of
the 5 symbols are identified correctly. The visual acuity value is found in the margin adjacent to that line.
• After obtaining good responses with binocular testing, proceed by testing each eye separately.
• When testing monocularly, use the first symbol of each line or every second line for one eye and the last symbol of each line for the other eye to determine on which line to start testing close to the threshold value.
• If the child has profound low vision, the lowest rows of the test can be used as a near vision test. The distance of �5cm is the most practical distance because calculation of the visual acuity values is simple. They are ¼ of the value printed next to the last line read. (To calculate ¼ of a Snellen value, you multiply the denominator by 4.)