Embed Size (px)
Citation preview
8/10/2019 Test Stress Banca Española 2014
http://slidepdf.com/reader/full/test-stress-banca-espanola-2014 1/240
Bank Name ES - Banco Santander, S.A.
LEI Code 5493006QMFDDMYWIAM13
ES
NUK_WL_NR_XX
version
1809014
No restructuring
2014 EU-wide Stress Test
http://www.economiaciudadana.org/

8/10/2019 Test Stress Banca Española 2014
http://slidepdf.com/reader/full/test-stress-banca-espanola-2014 2/240
Actual figures as of 31 December 2013 mln EUR, % Actual figures as of 31 December 2013 mln EUR, %
Operating profit before impairments 22,620 Operating profit before impairments 22,620
Impairment losses on financial and non-financial assets in the banking book 14,922 Impairment losses on financial and non-financial assets in the banking book 14,922
Common Equity Tier 1 capital (1) 56,086 Common Equity Tier 1 capital (1) 56,086
Total Risk Exposure (1) 540,248
Total Risk Exposure (1) 540,248
Common Equity Tier 1 ratio, % (1) 10.4% Common Equity Tier 1 ratio, % (1) 10.4%
Outcome of the adverse scenario as of 31 December 2016 mln EUR, % Outcome of the baseline scenario as of 31 December 2016 mln EUR, %
3 yr cumulative operating profit before impairments 38,788 3 yr cumulative operating profit before impairments 51,192
3 yr cumulative impairment losses on financial and non-financial assets in the banking book 36,661 3 yr cumulative impairment losses on financial and non-financial assets in the banking book 25,991
3 yr cumulative losses from the stress in the trading book 2,758 3 yr cumulative losses from the stress in the trading book 2,209
Valuation losses due to sovereign shock after tax and prudential filters 1,424 Common Equity Tier 1 capital (1) 66,063
Common Equity Tier 1 capital (1) 50,426 Total Risk Exposure (1) 551,008
Total Risk Exposure (1) 563,935 Common Equity Tier 1 ratio, % (1) 12.0%
Common Equity Tier 1 ratio, % (1) 8.9%
Memorandum items mln EUR
Memorandum items mln EUR Common EU wide CET1 Threshold (8.0%) 44,081
Common EU wide CET1 Threshold (5.5%) 31,016
Total amount of instruments with mandatory conversion into ordinary shares upon a fixed date in
the 2014 -2016 period (cumulative conversions) (2)0
Total Additional Tier 1 and Tier 2 instruments eligible as regulatory capital under the CRR provisions
that convert into Common Equity Tier 1 or are written down upon a trigger event (3)4,102
Of which: eligible instruments whose trigger is above CET1 capital ratio in the adverse
scenario (3)0
(2) Conversions not considered for CET1 computation
(3) Excluding instruments with mandatory conversion into ordinary shares upon a fixed date in the 2014 -2016 period
(1) According to CRR/CRD4 definition transitional arrangements as per reporting date. Figures as of 31/12/2013 computed as of first day of application:
01/01/2014.
2014 EU-wide Stress Test 2014 EU-wide Stress TestSummary Baseline Scenario
ES - Banco Santander, S.A.
(1) According to CRR/CRD4 definition transitional arrangements as per reporting date. Figures as of 31/12/2013 computed as of first day of application:
01/01/2014.
Summary Adverse Scenario
ES - Banco Santander, S.A.
http://www.economiaciudadana.org/

8/10/2019 Test Stress Banca Española 2014
http://slidepdf.com/reader/full/test-stress-banca-espanola-2014 3/240
2014 EU-wide Stress TestCredit Risk
(mln EUR, %)
No n-d ef aul t ed De fau lt e d No n-d ef aul t ed De fau lt e d No n-d ef aul t ed De fau lt e d No n-d ef aul t e d De fau lt e d No n-d ef aul t ed De fau lt e d No n-d ef aul t e d De fau lt e d No n-d ef aul t ed De fau lt e d No n-d ef aul t ed De fau lt e d No n-d ef aul t ed De fau lt e dImpairment
rate
Stockof
ProvisionsCoverage Ratio -
Default Stock
Impairment
rate
Stockof
Provisions
Coverage
Ratio-Default
Stock
Impairment
rate
Stockof
Provisions
Coverage
Ratio -Default
Stock
Impairment rateStockof
Provisions
Coverage
Ratio-Default
Stock
Impairment
rate
Stockof
Provisions
Coverage
Ratio-Default
Stock
Impairment
rate
Stockof
Provisions
Coverage
Ratio -Default
Stock
Central banksandcentral governments 0 0 15,341 112 136,572 9 0 0 4,371 22 3,102 14 0 0 88 32 0 5 0.18% 28 39.92% 0.18% 57 40.05% 0.18% 85 40.17% 0.90% 145 38.69% 0.92% 290 39.40% 0.94% 435 40.10%
Institutions 2,504 0 36,842 21 24,233 3 690 0 9,954 3 5,864 1 1 0 36 9 5 0 0.02% 64 21.35% 0.02% 75 19.01% 0.02% 87 18.07% 0.04% 75 20.82% 0.04% 95 19.13% 0.04% 115 18.34%
Corporates 13,741 473 128,396 15,978 99,084 3,426 8,867 0 69,378 2,024 94,198 2,571 58 221 1,307 8,507 1,313 2,969 0.95% 16,678 47.67% 0.84% 18,678 45.62% 0.73% 20,434 44.30% 1.13% 17,349 48.40% 1.50% 21,288 47.27% 1.22% 24,137 45.74%
Corporates -Of Which:SpecialisedLending 0 0 0 0 21,532 1,263 0 0 0 0 20,684 3 0 0 0 0 404 674 0.36% 1,156 32.98% 0.32% 1,224 31.83% 0.31% 1,311 31.81% 0.46% 1,224 35.01% 0.56% 1,344 33.68% 0.46% 1,468 33.43%
Corporates -Of Which:SME 3,319 44 22,999 4,086 6,270 291 2,486 0 13,778 480 4,401 323 13 23 566 2,037 184 843 2.52% 4,495 49.59% 2.20% 5,163 47.05% 1.82% 5,679 45.33% 2.79% 4,597 49.62% 3.62% 5,788 48.18% 3.09% 6,630 46.50%
Retail 0 0 285,654 8,857 177,444 4,931 0 0 57,161 829 106,360 5,382 0 0 1,810 2,803 2,799 4,954 1.50% 19,392 46.07% 1.39% 25,669 47.48% 1.28% 31,711 48.65% 1.74% 21,067 48.39% 1.81% 29,314 49.57% 1.65% 37,147 50.27%
Retail -Securedon real estateproperty 59.0% 0 0 259,700 7,479 59,233 2,087 0 0 44,115 563 20,473 2,067 0 0 993 1,658 554 776 0.19% 4,651 21.21% 0.16% 5,195 19.63% 0.14% 5,645 18.36% 0.33% 5,306 23.25% 0.36% 6,532 22.08% 0.34% 7,695 21.12%
Retail -Securedon real estate property- Of
h i h : S E46.3% 0 0 2,002 586 3,068 91 0 0 390 34 1,519 91 0 0 24 233 197 163 1.00% 668 41.64% 0.82% 708 38.16% 0.73% 742 35.60% 1.09% 673 41.53% 1.35% 746 38.93% 1.34% 817 37.40%
Retail -Securedon real estate property- Of
h i h: n n - E59.2% 0 0 257,698 6,893 56,165 1,996 0 0 43,725 529 18,954 1,976 0 0 969 1,425 357 612 0.18% 3,983 19.56% 0.15% 4,487 18.21% 0.13% 4,903 17.09% 0.32% 4,634 21.90% 0.34% 5,785 20.97% 0.33% 6,879 20.12%
Retail -QualifyingRevolving 0 0 9,599 136 14,111 292 0 0 3,202 33 10,182 333 0 0 143 79 464 693 5.34% 2,651 82.53% 5.30% 3,833 86.10% 5.15% 5,040 90.15% 5.61% 2,716 82.87% 6.29% 4,115 86.72% 6.16% 5,544 90.98%
Retail -OtherRetail 0 0 16,355 1,241 104,100 2,552 0 0 9,845 233 75,705 2,981 0 0 675 1,066 1,781 3,486 4.20% 12,090 64.14% 4.04% 16,641 64.28% 3.87% 21,026 65.20% 4.71% 13,045 69.12% 4.98% 18,667 69.83% 4.61% 23,907 71.19%
Retail -Other Retail -Of Which:SME 0 0 4,462 571 16,351 511 0 0 2,229 124 8,559 605 0 0 227 523 377 552 6.44% 3,020 70.16% 5.70% 4,100 70.48% 5.16% 5,023 70.52% 6.49% 3,029 70.16% 6.81% 4,336 71.84% 5.84% 5,402 72.60%
Retail -Other Retail -Of Which:non-SME 0 0 11,893 670 87,749 2,041 0 0 7,616 109 67,145 2,376 0 0 448 543 1,404 2,933 3.73% 9,070 62.34% 3.70% 12,542 62.47% 3.61% 16,003 63.68% 4.34% 10,016 68.81% 4.61% 14,331 69.25% 4.37% 18,505 70.79%
Equity 1,351 0 1,817 0 2,340 0 4,546 0 5,045 0 2,063 0 0 0 41 0 0 0 0.00% 41 - 0.00% 41 - 0.00% 41 - 0.00% 41 - 0.00% 41 - 0.00% 41 -
Securitisation 2,420 0 0 0 2,438 0 2,110 0 0 0 1,460 0 17 0 0 0 27 0
Othernon-credit obligation assets 0 0 0 0 61,654 5,057 0 0 0 0 49,081 5,284 0 0 0 0 229 64
TOTAL 20,016 473 468,049 24,968 503,765 13,427 16,213 0 145,911 2,878 262,127 13,251 76 221 3,283 11,351 4,374 7,992 1.19% 36,203 46.79% 1.09% 44,520 46.59% 0.99% 52,357 46.75% 1.41% 38,676 48.28% 1.56% 51,028 48.40% 1.37% 61,874 48.19%
Securitisation andre-securitisations positions deductedfrom capital * 92 0 0 0 45 0 0 0 0 0 0 0
(mln EUR, %)No n-d ef aul t ed De fau lt e d No n-d ef aul t ed De fau lt e d No n-d ef aul t ed De fau lt e d No n-d ef aul t e d De fau lt e d No n-d ef aul t ed De fau lt e d No n-d ef aul t e d De fau lt e d No n-d ef aul t ed De fau lt e d No n-d ef aul t ed De fau lt e d No n-d ef aul t ed De fau lt e d
Impairment
rate
Stockof
ProvisionsCoverage Ratio -
Default Stock
Impairment
rate
Stockof
Provisions
Coverage
Ratio-DefaultStock
Impairment
rate
Stockof
Provisions
Coverage
Ratio -DefaultStock
Impairment rateStockof
Provisions
Coverage
Ratio-DefaultStock
Impairment
rate
Stockof
Provisions
Coverage
Ratio-DefaultStock
Impairment
rate
Stockof
Provisions
Coverage
Ratio -DefaultStock
Central banksandcentral governments 0 0 15,094 111 36,079 9 0 0 4,087 21 41 14 0 0 87 32 0 5 0.20% 23 39.78% 0.20% 46 39.88% 0.20% 69 39.98% 1.03% 121 38.95% 1.06% 242 39.48% 1.09% 363 40.00%
Institutions 0 0 28,103 19 2,296 3 0 0 7,297 3 585 0 0 0 34 9 1 0 0.01% 47 33.83% 0.01% 49 30.53% 0.01% 52 28.66% 0.04% 53 28.08% 0.03% 60 25.66% 0.02% 66 24.64%
Corporates 0 0 76,090 15,036 15,857 1,118 0 0 44,468 1,850 15,109 584 0 0 1,217 8,215 582 506 1.43% 11,832 48.99% 1.16% 12,855 46.95% 0.94% 13,648 45.50% 1.63% 12,086 49.41% 1.96% 14,096 48.34% 1.66% 15,470 46.74%
Corporates -Of Which:SpecialisedLending 0 0 0 0 11,166 656 0 0 0 0 10,882 3 0 0 0 0 344 403 0.55% 807 38.88% 0.48% 860 39.46% 0.45% 909 39.90% 0.66% 861 42.85% 0.77% 946 43.72% 0.67% 1,018 44.30%
Corporates -Of Which:SME 0 0 20,490 3,779 988 8 0 0 11,790 430 733 8 0 0 513 1,964 12 42 2.59% 3,087 45.99% 2.12% 3,503 43.05% 1.65% 3,803 41.12% 2.89% 3,151 45.88% 3.50% 3,872 43.19% 3.14% 4,416 41.57%
Retail 0 0 75,210 4,060 4,330 55 0 0 20,715 462 2,264 70 0 0 1,284 1,953 53 76 0.67% 3,898 43.37% 0.55% 4,328 40.47% 0.48% 4,693 38.38% 1.10% 4,365 42.87% 1.09% 5,218 39.16% 0.93% 5,913 36.75%
Retail -Securedon real estateproperty 56.7% 0 0 59,957 3,161 2,717 37 0 0 13,840 289 1,095 50 0 0 618 1,128 29 19 0.45% 2,075 32.47% 0.34% 2,281 30.22% 0.26% 2,436 28.36% 0.98% 2,535 34.06% 0.94% 3,107 31.38% 0.74% 3,538 29.33%
Retail -Securedon real estate property- Of
h i h : S E49.2% 0 0 2,002 586 0 0 0 0 390 34 0 0 0 0 24 233 0 0 2.04% 298 38.98% 1.71% 330 38.22% 1.54% 358 37.37% 2.11% 300 39.20% 2.50% 354 39.72% 2.55% 402 39.89%
Retail -Securedon real estate property- Of
h i h: n n - E57.1% 0 0 57,955 2,574 2,717 37 0 0 13,451 255 1,095 50 0 0 594 895 29 19 0.40% 1,776 31.23% 0.29% 1,950 28.83% 0.22% 2,078 26.88% 0.95% 2,236 33.33% 0.89% 2,753 30.40% 0.68% 3,136 28.22%
Retail -QualifyingRevolving 0 0 3,750 38 547 3 0 0 742 9 8 3 0 0 72 41 2 20 1.31% 191 68.04% 1.21% 242 61.68% 1.16% 289 58.88% 1.38% 194 67.54% 1.51% 258 60.92% 1.38% 314 58.29%
Retail -OtherRetail 0 0 11,503 861 1,066 14 0 0 6,132 163 1,161 17 0 0 593 784 22 38 1.55% 1,633 75.31% 1.43% 1,805 68.40% 1.39% 1,968 64.08% 1.58% 1,636 75.42% 1.69% 1,853 68.95% 1.71% 2,061 65.08%
Retail -Other Retail -Of Which:SME 0 0 3,771 427 285 1 0 0 1,908 92 149 1 0 0 209 415 5 13 1.20% 690 84.46% 1.00% 730 77.09% 0.89% 764 71.52% 1.25% 692 84.81% 1.48% 763 78.53% 1.51% 827 74.01%
Retail -Other Retail -Of Which:non-SME 0 0 7,732 434 781 13 0 0 4,224 72 1,011 16 0 0 384 369 18 25 1.72% 942 68.84% 1.63% 1,076 63.07% 1.64% 1,204 59.90% 1.73% 943 68.80% 1.79% 1,090 62.95% 1.81% 1,234 59.87%
Equity 1,128 0 1,743 0 175 0 3,771 0 4,837 0 175 0 0 0 39 0 0 0 0.00% 39 - 0.00% 39 - 0.00% 39 - 0.00% 39 - 0.00% 39 - 0.00% 39 -
Securitisation 1,185 0 0 0 51 0 767 0 0 0 17 0 10 0 0 0 26 0
Othernon-credit obligation assets 0 0 0 0 20,598 4,203 0 0 0 0 22,605 4,262 0 0 0 0 163 0
TOTAL 2,313 0 196,240 19,226 79,385 5,388 4,538 0 81,405 2,336 40,796 4,930 10 0 2,661 10,209 825 587 0.88% 15,839 47.69% 0.72% 17,316 45.35% 0.59% 18,501 43.65% 1.18% 16,664 47.60% 1.31% 19,655 45.59% 1.11% 21,851 43.60%Securitisation andre-securitisations positions deductedfrom capital * 11 0 0 0 0 0 0 0 0 0 0 0
(mln EUR, %)No n-d ef aul t ed De fau lt e d No n-d ef aul t ed De fau lt e d No n-d ef aul t ed De fau lt e d No n-d ef aul t e d De fau lt e d No n-d ef aul t ed De fau lt e d No n-d ef aul t e d De fau lt e d No n-d ef aul t ed De fau lt e d No n-d ef aul t ed De fau lt e d No n-d ef aul t ed De fau lt e d
Impairment
rate
Stockof
ProvisionsCoverage Ratio -
Default Stock
Impairment
rate
Stockof
Provisions
CoverageRatio-Default
Stock
Impairment
rate
Stockof
Provisions
CoverageRatio -Default
Stock
Impairment rateStockof
Provisions
CoverageRatio-Default
Stock
Impairment
rate
Stockof
Provisions
CoverageRatio-Default
Stock
Impairment
rate
Stockof
Provisions
CoverageRatio -Default
Stock Central banksandcentral governments 0 0 0 0 34,890 0 0 0 0 0 0 0 0 0 0 0 0 0 - 0 - - 0 - - 0 - - 0 - - 0 - - 0 -
Institutions 0 0 7,681 0 2,476 0 0 0 1,897 0 750 0 0 0 1 0 0 0 0.01% 2 20.70% 0.01% 3 20.70% 0.01% 3 20.70% 0.03% 4 20.70% 0.03% 6 20.70% 0.02% 7 20.70%
Corporates 4,414 128 17,740 0 21,915 499 3,435 0 4,413 0 21,261 260 13 83 4 0 122 375 0.25% 707 32.08% 0.24% 811 27.14% 0.25% 917 24.48% 0.31% 733 30.86% 0.38% 900 25.45% 0.39% 1,062 22.87%
Corporates -Of Which:SpecialisedLending 0 0 0 0 6,533 307 0 0 0 0 6,207 0 0 0 0 0 41 228 0.07% 273 32.35% 0.06% 277 27.05% 0.06% 281 23.65% 0.09% 275 31.18% 0.09% 283 24.86% 0.09% 288 20.99%
Corporates -Of Which:SME 2,219 38 0 0 682 39 1,634 0 0 0 439 39 3 22 0 0 2 52 0.36% 89 37.10% 0.34% 99 29.50% 0.36% 109 25.25% 0.42% 92 35.37% 0.50% 106 26.97% 0.54% 121 22.72%
Retail 0 0 192,547 3,849 9,455 311 0 0 32,381 235 6,560 409 0 0 421 392 237 174 0.25% 1,725 15.84% 0.25% 2,217 17.33% 0.25% 2,705 18.25% 0.28% 1,812 16.42% 0.35% 2,525 18.15% 0.39% 3,309 18.96%
Retail -Securedon real estateproperty 61.6% 0 0 184,842 3,745 1,581 85 0 0 27,315 206 744 85 0 0 318 332 160 113 0.05% 1,024 9.33% 0.05% 1,115 8.41% 0.05% 1,204 7.85% 0.07% 1,074 9.77% 0.09% 1,254 8.96% 0.10% 1,453 8.42%
Retail -Securedon real estate property- Of
hi h: E54.0% 0 0 0 0 1,476 0 0 0 0 0 707 0 0 0 0 0 160 0 0.00% 160 10.85% 0.00% 160 10.85% 0.00% 160 10.85% 0.00% 160 10.85% 0.00% 160 10.85% 0.00% 160 10.85%
Retail -Securedon real estate property- Of
h i h : n n -S E61.6% 0 0 184,842 3,745 105 85 0 0 27,315 206 37 85 0 0 318 332 0 113 0.05% 864 9.31% 0.05% 955 8.35% 0.05% 1,044 7.76% 0.07% 914 9.75% 0.09% 1,094 8.90% 0.10% 1,293 8.35%
Retail -QualifyingRevolving 0 0 5,390 64 2,908 28 0 0 2,350 17 2,181 49 0 0 66 20 35 42 1.97% 326 72.02% 2.00% 488 78.87% 1.97% 645 81.98% 2.37% 359 74.12% 3.45% 638 82.39% 4.22% 966 85.92%
Retail -OtherRetail 0 0 2,315 40 4,966 199 0 0 2,716 12 3,635 275 0 0 37 40 42 19 3.24% 375 55.43% 3.41% 614 65.80% 3.61% 856 70.96% 3.29% 379 55.70% 3.64% 634 66.46% 3.83% 890 71.61%
Retail -Other Retail -Of Which:SME 0 0 0 0 460 0 0 0 0 0 256 0 0 0 0 0 0 0 0.08% 0 2.08% 0.08% 1 2.09% 0.09% 1 2.09% 0.08% 0 2.09% 0.09% 1 2.09% 0.09% 1 2.09%
Retail -Other Retail -Of Which:non-SME 0 0 2,315 40 4,507 199 0 0 2,716 12 3,380 275 0 0 37 40 42 19 3.45% 374 57.24% 3.64% 613 68.68% 3.85% 855 74.46% 3.50% 378 57.53% 3.88% 633 69.40% 4.08% 889 75.18%
Equity 6 0 0 0 29 0 22 0 0 0 29 0 0 0 0 0 0 0 0.00% 0 - 0.00% 0 - 0.00% 0 - 0.00% 0 - 0.00% 0 - 0.00% 0 -
Securitisation 1,148 0 0 0 0 0 1,251 0 0 0 0 0 7 0 0 0 0 0
Othernon-credit obligation assets 0 0 0 0 10,940 0 0 0 0 0 3,000 0 0 0 0 0 0 0
TOTAL 5,568 128 217,967 3,849 79,706 810 4,707 0 38,692 235 31,600 669 20 83 426 392 359 549 0.24% 2,434 19.19% 0.24% 3,031 19.42% 0.24% 3,625 19.61% 0.27% 2,548 19.49% 0.34% 3,431 19.78% 0.38% 4,379 19.83%
Securitisation andre-securitisations positions deductedfrom capital * 81 0 0 0 0 0 0 0 0 0 0 0
(mln EUR, %)No n-d ef aul t ed De fau lt e d No n-d ef aul t ed De fau lt e d No n-d ef aul t ed De fau lt e d No n-d ef aul t e d De fau lt e d No n-d ef aul t ed De fau lt e d No n-d ef aul t e d De fau lt e d No n-d ef aul t ed De fau lt e d No n-d ef aul t ed De fau lt e d No n-d ef aul t ed De fau lt e d
Impairment
rate
Stockof
ProvisionsCoverage Ratio -
Default Stock
Impairment
rate
Stockof
Provisions
CoverageRatio-Default
Stock
Impairment
rate
Stockof
Provisions
CoverageRatio -Default
Stock
Impairment rateStockof
Provisions
CoverageRatio-Default
Stock
Impairment
rate
Stockof
Provisions
CoverageRatio-Default
Stock
Impairment
rate
Stockof
Provisions
CoverageRatio -Default
Stock Central banksandcentral governments 0 0 0 0 29,867 0 0 0 0 0 157 0 0 0 0 0 0 0 0.22% 0 45.44% 0.22% 1 45.55% 0.22% 1 45.67% 0.79% 2 44.88% 0.80% 4 45.28% 0.82% 5 45.68%
Institutions 0 0 0 0 4,472 0 0 0 0 0 1,488 0 0 0 0 0 2 0 0.00% 2 52.37% 0.00% 2 47.65% 0.00% 2 45.18% 0.00% 2 51.15% 0.00% 2 46.06% 0.00% 2 43.47%
Corporates 0 0 18,519 198 16,201 477 0 0 10,463 31 14,601 525 0 0 0 0 371 1,135 1.44% 2,011 60.63% 1.48% 2,515 59.18% 1.29% 2,938 58.22% 1.72% 2,129 61.42% 3.04% 3,258 62.96% 2.05% 3,911 61.50%
Corporates -Of Which:SpecialisedLending 0 0 0 0 674 0 0 0 0 0 660 0 0 0 0 0 6 0 0.49% 10 45.72% 0.44% 12 45.72% 0.43% 15 45.72% 0.80% 12 50.30% 0.84% 17 50.30% 0.44% 20 50.30%
Corporates -Of Which:SME 0 0 0 0 2,818 209 0 0 0 0 1,990 234 0 0 0 0 150 605 7.23% 964 77.91% 7.45% 1,158 79.87% 6.77% 1,316 80.76% 7.76% 989 79.27% 12.91% 1,383 88.11% 10.07% 1,604 88.80%
Retail 0 0 0 0 36,791 1,139 0 0 0 0 24,134 1,335 0 0 0 0 901 1,728 9.03% 5,956 76.48% 8.90% 8,890 80.40% 8.56% 11,786 84.84% 10.31% 6,700 86.72% 11.21% 10,390 91.33% 10.48% 13,875 96.26%
Retail -Securedon real estateproperty 78.6% 0 0 0 0 4,175 65 0 0 0 0 1,236 56 0 0 0 0 34 37 0.21% 81 28.71% 0.17% 88 24.08% 0.11% 92 20.83% 0.33% 86 29.65% 0.45% 106 27.10% 0.45% 124 25.35%
Retail -Securedon real estate property- Of
hi h: E0.0% 0 0 0 0 0 0 0 0 0 0 0 0 0 0 0 0 0 0 - 0 - - 0 - - 0 - - 0 - - 0 - - 0 -
Retail -Securedon real estate property- Of
h i h: n n - E78.6% 0 0 0 0 4,175 65 0 0 0 0 1,236 56 0 0 0 0 34 37 0.21% 81 28.71% 0.17% 88 24.08% 0.11% 92 20.83% 0.33% 86 29.65% 0.45% 106 27.10% 0.45% 124 25.35%
Retail -QualifyingRevolving 0 0 0 0 5,837 168 0 0 0 0 4,379 184 0 0 0 0 274 510 10.66% 1,410 93.02% 11.00% 1,990 99.16% 10.92% 2,607 106.66% 10.87% 1,422 93.21% 11.96% 2,051 99.60% 11.56% 2,711 107.70%
Retail -OtherRetail 0 0 0 0 26,779 906 0 0 0 0 18,518 1,095 0 0 0 0 592 1,180 10.05% 4,465 74.06% 9.95% 6,812 77.86% 9.68% 9,087 81.92% 11.74% 5,192 87.06% 12.93% 8,234 91.57% 12.20% 11,040 96.16%
Retail -Other Retail -Of Which:SME 0 0 0 0 7,063 48 0 0 0 0 3,600 53 0 0 0 0 207 144 15.11% 1,418 88.39% 14.21% 2,249 88.75% 13.59% 2,917 88.82% 15.11% 1,418 88.39% 16.99% 2,416 90.58% 15.48% 3,155 90.85%
Retail -Other Retail -Of Which:non-SME 0 0 0 0 19,716 858 0 0 0 0 14,918 1,042 0 0 0 0 386 1,036 8.24% 3,047 68.90% 8.54% 4,564 73.41% 8.47% 6,170 79.00% 10.53% 3,773 86.58% 11.58% 5,818 91.99% 11.20% 7,885 98.46%
Equity 0 0 0 0 914 0 0 0 0 0 914 0 0 0 0 0 0 0 0.00% 0 - 0.00% 0 - 0.00% 0 - 0.00% 0 - 0.00% 0 - 0.00% 0 -
Securitisation 0 0 0 0 488 0 0 0 0 0 891 0 0 0 0 0 0 0
Othernon-credit obligation assets 0 0 0 0 12,637 85 0 0 0 0 10,925 89 0 0 0 0 2 15
TOTAL 0 0 18,519 198 101,370 1,701 0 0 10,463 31 53,111 1,949 0 0 0 0 1,276 2,878 4.99% 7,969 71.90% 4.77% 11,407 74.76% 4.37% 14,727 78.05% 5.72% 8,832 79.16% 6.57% 13,654 82.65% 5.59% 17,793 85.85%
Securitisation andre-securitisations positions deductedfrom capital * 0 0 0 0 44 0 0 0 0 0 0 0
(mln EUR, %)No n-d ef aul t ed De fau lt e d No n-d ef aul t ed De fau lt e d No n-d ef aul t ed De fau lt e d No n-d ef aul t e d De fau lt e d No n-d ef aul t ed De fau lt e d No n-d ef aul t e d De fau lt e d No n-d ef aul t ed De fau lt e d No n-d ef aul t ed De fau lt e d No n-d ef aul t ed De fau lt e d
Impairment
rate
Stockof
ProvisionsCoverage Ratio -
Default Stock
Impairment
rate
Stockof
Provisions
CoverageRatio-Default
Stock
Impairment
rate
Stockof
Provisions
CoverageRatio -Default
Stock
Impairment rateStockof
Provisions
CoverageRatio-Default
Stock
Impairment
rate
Stockof
Provisions
CoverageRatio-Default
Stock
Impairment
rate
Stockof
Provisions
CoverageRatio -Default
Stock Central banksandcentral governments 0 0 0 0 2,020 0 0 0 0 0 144 0 0 0 0 0 0 0 0.01% 0 43.41% 0.01% 0 43.41% 0.01% 0 43.42% 0.01% 0 42.31% 0.01% 0 42.31% 0.01% 0 42.32%
Institutions 0 0 0 0 3,199 0 0 0 0 0 558 0 0 0 0 0 0 0 0.08% 1 14.57% 0.08% 3 14.57% 0.08% 4 14.57% 0.09% 2 14.57% 0.10% 3 14.57% 0.10% 5 14.57%
Corporates 0 0 3,136 0 7,303 132 0 0 1,339 0 7,061 158 0 0 10 0 36 129 1.04% 283 44.52% 1.05% 389 43.00% 1.04% 492 42.25% 1.15% 300 46.08% 1.25% 427 44.47% 1.13% 538 43.72%
Corporates -Of Which:SpecialisedLending 0 0 0 0 82 0 0 0 0 0 82 0 0 0 0 0 0 0 1.03% 1 39.85% 1.05% 2 39.88% 1.04% 3 39.89% 1.15% 1 41.34% 1.24% 2 41.39% 1.13% 3 41.37%
Corporates -Of Which:SME 0 0 0 0 222 13 0 0 0 0 145 15 0 0 0 0 1 14 1.04% 17 49.63% 1.05% 19 48.22% 1.04% 21 47.16% 1.15% 17 51.49% 1.25% 20 49.90% 1.13% 23 48.80%
Retail 0 0 0 0 17,182 1,229 0 0 0 0 9,214 1,364 0 0 0 0 279 380 1.91% 988 28.44% 1.88% 1,294 30.19% 1.74% 1,575 31.10% 1.98% 999 28.99% 2.19% 1,382 32.66% 2.05% 1,831 37.19%
Retail -Securedon real estateproperty 40.3% 0 0 0 0 8,555 584 0 0 0 0 2,927 587 0 0 0 0 31 55 0.35% 115 9.19% 0.20% 132 8.48% 0.06% 145 7.86% 0.51% 130 10.81% 0.77% 217 15.43% 0.79% 355 21.92%
Retail -Securedon real estate property- Of
hi h: E36.1% 0 0 0 0 714 41 0 0 0 0 257 41 0 0 0 0 30 6 0.46% 39 12.80% 0.18% 40 11.22% 0.00% 41 10.14% 0.77% 42 15.64% 1.26% 53 21.42% 1.30% 67 27.45%
Retail -Securedon real estate property- Of
h i h : n n -S E40.7% 0 0 0 0 7,841 543 0 0 0 0 2,670 546 0 0 0 0 1 49 0.34% 76 8.84% 0.21% 91 8.19% 0.06% 104 7.61% 0.49% 88 10.34% 0.73% 165 14.79% 0.74% 287 21.29%
Retail -QualifyingRevolving 0 0 0 0 1,672 15 0 0 0 0 1,254 15 0 0 0 0 89 11 5.69% 195 64.78% 5.95% 286 66.66% 5.87% 367 67.43% 5.63% 194 64.70% 6.04% 286 66.68% 5.65% 369 68.36%
Retail -OtherRetail 0 0 0 0 6,956 629 0 0 0 0 5,034 761 0 0 0 0 159 315 2.93% 678 36.36% 3.06% 876 37.87% 3.02% 1,063 38.93% 2.90% 675 36.32% 3.10% 878 37.93% 2.91% 1,107 41.01%
Retail -Other Retail -Of Which:SME 0 0 0 0 2,370 251 0 0 0 0 1,182 333 0 0 0 0 34 92 2.43% 184 29.09% 2.55% 241 30.22% 2.52% 295 31.19% 2.39% 184 29.06% 2.60% 241 30.26% 2.40% 318 34.11%
Retail -Other Retail -Of Which:non-SME 0 0 0 0 4,586 378 0 0 0 0 3,852 428 0 0 0 0 124 223 3.19% 493 40.44% 3.32% 636 42.14% 3.28% 768 43.22% 3.16% 492 40.40% 3.36% 637 42.21% 3.17% 789 44.82%
Equity 0 0 0 0 43 0 0 0 0 0 43 0 0 0 0 0 0 0 0.00% 0 - 0.00% 0 - 0.00% 0 - 0.00% 0 - 0.00% 0 - 0.00% 0 -
Securitisation 0 0 0 0 0 0 0 0 0 0 0 0 0 0 0 0 0 0Othernon-credit obligation assets 0 0 0 0 2,349 29 0 0 0 0 1,060 44 0 0 0 0 0 0
TOTAL 0 0 3,136 0 32,095 1,389 0 0 1,339 0 18,080 1,565 0 0 10 0 314 509 1.46% 1,272 31.16% 1.44% 1,686 32.50% 1.34% 2,071 33.18% 1.54% 1,301 31.97% 1.69% 1,812 34.89% 1.55% 2,374 38.39%
Securitisation andre-securitisations positions deductedfrom capital * 0 0 0 0 0 0 0 0 0 0 0 0
(mln EUR, %)No n-d ef aul t ed De fau lt e d No n-d ef aul t ed De fau lt e d No n-d ef aul t ed De fau lt e d No n-d ef aul t e d De fau lt e d No n-d ef aul t ed De fau lt e d No n-d ef aul t e d De fau lt e d No n-d ef aul t ed De fau lt e d No n-d ef aul t ed De fau lt e d No n-d ef aul t ed De fau lt e d
Impairment
rate
Stockof
ProvisionsCoverage Ratio -
Default Stock
Impairment
rate
Stockof
Provisions
CoverageRatio-Default
Stock
Impairment
rate
Stockof
Provisions
CoverageRatio -Default
Stock
Impairment rateStockof
Provisions
CoverageRatio-Default
Stock
Impairment
rate
Stockof
Provisions
CoverageRatio-Default
Stock
Impairment
rate
Stockof
Provisions
CoverageRatio -Default
Stock Central banksandcentral governments 0 0 0 0 7,642 0 0 0 0 0 241 0 0 0 0 0 0 0 0.05% 1 42.58% 0.05% 2 42.61% 0.05% 3 42.63% 0.10% 2 42.64% 0.10% 4 42.69% 0.10% 7 42.74%
Institutions 2,504 0 0 0 227 0 690 0 0 0 106 0 1 0 0 0 0 0 0.22% 7 14.02% 0.22% 13 14.06% 0.21% 19 14.08% 0.25% 8 14.03% 0.28% 15 14.06% 0.31% 24 14.09%
Corporates 9,327 345 0 0 2,662 87 5,432 0 0 0 2,500 5 45 139 0 0 8 6 0.32% 237 34.98% 0.32% 275 36.33% 0.33% 373 45.68% 0.37% 251 37.12% 0.41% 300 38.77% 0.33% 410 49.65%
Corporates -Of Which:SpecialisedLending 0 0 0 0 1,284 82 0 0 0 0 1,123 0 0 0 0 0 6 6 0.31% 16 10.03% 0.29% 19 12.85% 0.28% 46 35.85% 0.50% 19 12.69% 0.57% 26 17.54% 0.35% 59 43.13%
Corporates -Of Which:SME 1,100 6 0 0 0 0 851 0 0 0 0 0 11 1 0 0 0 0 0.45% 17 35.83% 0.46% 22 38.11% 0.48% 29 42.44% 0.47% 17 36.03% 0.51% 23 38.39% 0.42% 29 43.20%
Retail 0 0 0 0 10,186 251 0 0 0 0 4,969 226 0 0 0 0 93 230 4.64% 795 62.77% 4.28% 1,203 65.99% 4.12% 1,634 69.82% 4.85% 817 63.26% 5.03% 1,296 66.76% 4.57% 1,782 70.62%
Retail -Securedon real estateproperty 53.9% 0 0 0 0 4,870 134 0 0 0 0 1,417 109 0 0 0 0 10 95 0.42% 126 32.03% 0.29% 140 27.10% 0.20% 149 23.38% 0.46% 128 31.97% 0.52% 152 27.18% 0.60% 186 25.53%
Retail -Securedon real estate property- Of
hi h: E0.0% 0 0 0 0 0 0 0 0 0 0 0 0 0 0 0 0 0 0 - 0 - - 0 - - 0 - - 0 - - 0 - - 0 -
Retail -Securedon real estate property- Of
h i h: n n - E53.9% 0 0 0 0 4,870 134 0 0 0 0 1,417 109 0 0 0 0 10 95 0.42% 126 32.03% 0.29% 140 27.10% 0.20% 149 23.38% 0.46% 128 31.97% 0.52% 152 27.18% 0.60% 186 25.53%
Retail -QualifyingRevolving 0 0 0 0 2,211 51 0 0 0 0 1,658 51 0 0 0 0 40 59 10.71% 336 83.59% 10.64% 544 88.60% 10.87% 759 93.95% 11.38% 350 84.42% 12.47% 594 90.00% 10.54% 803 95.32%
Retail -OtherRetail 0 0 0 0 3,105 66 0 0 0 0 1,894 66 0 0 0 0 43 76 6.94% 334 71.48% 6.53% 519 74.52% 6.55% 727 80.11% 7.09% 339 71.84% 7.45% 550 75.84% 7.68% 793 82.51%
Retail -Other Retail -Of Which:SME 0 0 0 0 1,651 34 0 0 0 0 803 34 0 0 0 0 0 40 4.01% 106 58.27% 3.91% 166 59.32% 3.93% 243 65.21% 4.01% 106 58.27% 3.94% 167 59.34% 4.03% 250 66.49%
Retail -Other Retail -Of Which:non-SME 0 0 0 0 1,454 32 0 0 0 0 1,091 32 0 0 0 0 43 36 10.26% 228 81.81% 9.67% 353 86.00% 9.85% 484 91.29% 10.59% 233 82.24% 11.67% 383 87.41% 12.39% 544 93.42%
Equity 109 0 0 0 18 0 379 0 0 0 18 0 0 0 0 0 0 0 0.00% 0 - 0.00% 0 - 0.00% 0 - 0.00% 0 - 0.00% 0 - 0.00% 0 -
Securitisation 0 0 0 0 0 0 0 0 0 0 0 0 0 0 0 0 0 0
Othernon-credit obligation assets 0 0 0 0 2,918 24 0 0 0 0 2,213 31 0 0 0 0 0 0
TOTAL 11,941 345 0 0 23,653 361 6,502 0 0 0 10,047 262 46 139 0 0 101 235 1.91% 1,041 52.95% 1.72% 1,493 56.60% 1.62% 2,029 62.00% 2.02% 1,078 53.85% 2.04% 1,615 57.68% 1.77% 2,222 63.26%
Securitisation andre-securitisations positions deductedfrom capital * 0 0 0 0 0 0 0 0 0 0 0 0
as of 31/12/2016 as of 31/12/2014 as of 31/12/2015 as of 31/12/2016
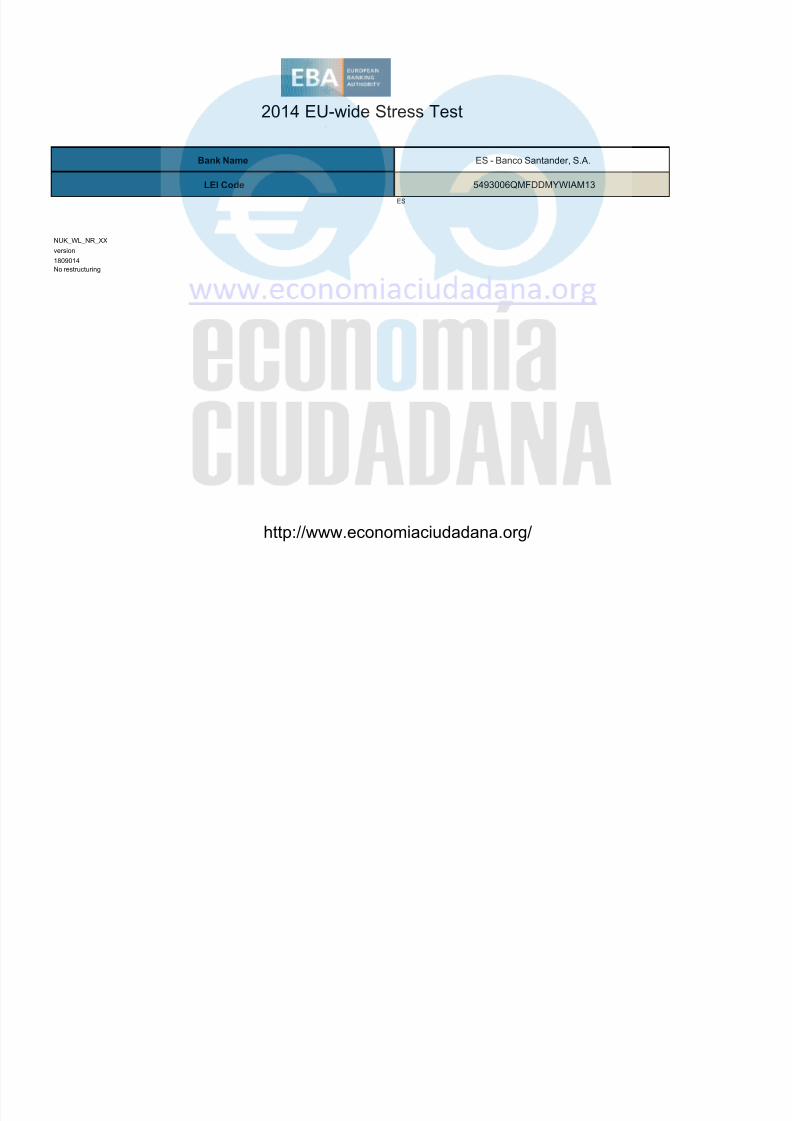
Mexico
F-IRB A-IRB STA a s of 3 1/ 12 /2 01 4 a s of 3 1/ 12 /2 01 5LTV %(asof
31/12/2013)
Exposure values (as of 31/12/2013) Risk exposure amounts (as of 31/12/2013) Value adjustments and provisions (as of 31/12/2013) Baseline Scenario Adverse Scenario
F-IRB A-IRB STA F-IRB A-IRB STA
LTV %(asof
31/12/2013)
Exposure values (as of 31/12/2013) Risk exposure amounts (as of 31/12/2013) Value adjustments and provisions (as of 31/12/2013) Baseline Scenario Adverse Scenario
F-IRB A-IRB STA F-IRB A-IRB STA F-IRB a sof 31 /12 /2 01 4 a so f3 1/ 12 /2 01 5 a sof 31 /12 /2 01 6 A-IRB STA a sof 31 /1 2/ 20 14 a so f3 1/ 12 /2 01 5 a sof 31 /12 /2 01 6
LTV %(asof
31/12/2013)
Exposure values (as of 31/12/2013) Risk exposure amounts (as of 31/12/2013) Value adjustments and provisions (as of 31/12/2013) Baseline Scenario Adverse Scenario
F-IRB A-IRB STA F-IRB A-IRB STA F-IRB A-IRB a s of 3 1/ 12 /2 01 5 a s of 3 1/ 12 /2 01 6STA as of 31/12/2014 as of 31/12/2015 as of 31/12/2016 as of 31/12/2014
Risk exposureamounts(as of31/12/2013)
Baseline Scenario Adverse Scenario
F-IRB A-IRB STA F-IRB A-IRB STA F-IRB A-IRB STA as of 31/12/2014 as of 31/12/2015 as of 31/12/2016 as of 31/12/2014 as of 31/12/2015 as of 31/12/2016
asof 31/12/2016
Spain
LTV %(asof
31/12/2013)
E xp os ur e va lu es ( as of 3 1/ 12 /2 01 3) R is k e xp os ur e am ou nt s (a s of 3 1/ 12 /2 01 3) V al ue a dj us tm en ts a nd pr ov is io ns ( as o f3 1/ 12 /2 01 3)
AdverseScenario
F-IRB A-IRB STA F-IRB A-IRB STA F-IRB A-IRB STA as of 31/12/2014 as of 31/12/2015 as of 31/12/2016 as of 31/12/2014 as of 31/12/2015 as of 31/12/2016LTV %(asof 31/12/2013)
Exposurevalues(as of31/12/2013)
ES - Banco Santander, S.A.
(*)Referstothepart ofSecuritizationexposurethat isdeductedfrom capital andisnot includedinRWA
Valueadjustmentsand provisions(asof 31/12/2013) BaselineScenario
LTV %(asof
31/12/2013)
Exposure values (as of 31/12/2013) Risk exposure amounts (as of 31/12/2013) Value adjustments and provisions (as of 31/12/2013) Adverse Scenario
F-IRB A-IRB STA F-IRB A-IRB STA F-IRB A-IRB STA
BaselineScenario
as of 31/12/2014 as of 31/12/2015 as of 31/12/2016 as of 31/12/2014 as of 31/12/2015
(*)Referstothepart ofSecuritizationexposurethat isdeductedfrom capital andisnot includedinRWA
(*)Referstothepart ofSecuritizationexposurethat isdeductedfrom capital andisnot includedinRWA
(*)Referstothepart ofSecuritizationexposurethat isdeductedfrom capital andisnot includedinRWA
(*)Referstothepart ofSecuritizationexposurethat isdeductedfrom capital andisnot includedinRWA
(*)Referstothepart ofSecuritizationexposurethat isdeductedfrom capital andisnot includedinRWA
United Kingdom
Brazil
Chile
http://www.economiaciudadana.org/
8/10/2019 Test Stress Banca Española 2014
http://slidepdf.com/reader/full/test-stress-banca-espanola-2014 4/240
2014 EU-wide Stress TestCredit Risk
31 1 13) 31 1 13) 31 1 13)
(mln EU
R, %)No n-d ef aul t ed De fau lt e d No n-d ef aul t ed De fau lt e d No n-d ef aul t ed De fau lt e d No n-d ef aul t e d De fau lt e d No n-d ef aul t ed De fau lt e d No n-d ef aul t e d De fau lt e d No n-d ef aul t ed De fau lt e d No n-d ef aul t ed De fau lt e d No n-d ef aul t ed De fau lt e d
Impairment
rate
Stockof
ProvisionsCoverage Ratio -
Default Stock
Impairment
rate
Stockof
Provisions
CoverageRatio-Default
Stock
Impairment
rate
Stockof
Provisions
CoverageRatio -Default
Stock
Impairment rateStockof
Provisions
CoverageRatio-Default
Stock
Impairment
rate
Stockof
Provisions
CoverageRatio-Default
Stock
Impairment
rate
Stockof
Provisions
CoverageRatio -Default
Stock Central banksandcentral governments 0 0 0 0 7,568 0 0 0 0 0 257 0 0 0 0 0 0 0 0.01% 0 40.86% 0.01% 0 40.87% 0.01% 0 40.87% 0.01% 0 39.82% 0.01% 0 39.83% 0.01% 0 39.83%
Institutions 0 0 0 0 6,316 0 0 0 0 0 1,126 0 0 0 0 0 0 0 0.01% 1 21.48% 0.01% 1 21.68% 0.01% 2 21.75% 0.04% 2 21.76% 0.03% 4 21.83% 0.02% 5 21.85%
Corporates 0 0 6,750 0 15,909 265 0 0 4,020 0 16,004 268 0 0 0 0 0 160 0.20% 206 32.39% 0.18% 246 28.32% 0.18% 286 25.55% 0.57% 383 48.38% 0.92% 587 41.16% 0.88% 777 37.92%
Corporates -Of Which:SpecialisedLending 0 0 0 0 1,120 0 0 0 0 0 1,120 0 0 0 0 0 0 0 0.04% 0 27.58% 0.05% 1 25.80% 0.06% 2 24.50% 0.21% 2 37.92% 0.51% 8 36.48% 0.39% 12 35.61%
Corporates -Of Which:SME 0 0 0 0 0 0 0 0 0 0 0 0 0 0 0 0 0 0 - 0 - - 0 - - 0 - - 0 - - 0 - - 0 -
Retail 0 0 0 0 31,179 528 0 0 0 0 15,732 531 0 0 0 0 344 443 2.41% 1,549 49.87% 2.24% 2,215 50.37% 2.01% 2,785 50.52% 2.90% 1,708 50.73% 3.13% 2,637 51.46% 2.79% 3,407 51.25%
Retail -Securedon real estateproperty 61.1% 0 0 0 0 17,020 324 0 0 0 0 5,074 327 0 0 0 0 203 134 0.16% 364 29.75% 0.21% 400 30.09% 0.20% 434 30.20% 0.33% 393 30.96% 0.53% 482 32.05% 0.66% 591 32.74%
Retail -Securedon real estate property- Of
hi h: E0.0% 0 0 0 0 0 0 0 0 0 0 0 0 0 0 0 0 0 0 - 0 - - 0 - - 0 - - 0 - - 0 - - 0 -
Retail -Securedon real estate property- Of
h i h: n n - E61.1% 0 0 0 0 17,020 324 0 0 0 0 5,074 327 0 0 0 0 203 134 0.16% 364 29.75% 0.21% 400 30.09% 0.20% 434 30.20% 0.33% 393 30.96% 0.53% 482 32.05% 0.66% 591 32.74%
Retail -QualifyingRevolving 0 0 0 0 146 0 0 0 0 0 109 0 0 0 0 0 5 2 6.73% 17 77.67% 6.85% 26 77.52% 6.70% 34 77.12% 7.77% 18 77.61% 8.02% 29 77.49% 7.32% 37 77.12%
Retail -OtherRetail 0 0 0 0 14,013 203 0 0 0 0 10,548 203 0 0 0 0 136 308 5.10% 1,169 55.46% 4.91% 1,789 54.50% 4.62% 2,317 54.13% 5.97% 1,297 56.37% 6.62% 2,126 56.01% 5.98% 2,779 55.67%
Retail -Other Retail -Of Which:SME 0 0 0 0 0 0 0 0 0 0 0 0 0 0 0 0 0 0 - 0 - - 0 - - 0 - - 0 - - 0 - - 0 -
Retail -Other Retail -Of Which:non-SME 0 0 0 0 14,013 203 0 0 0 0 10,548 203 0 0 0 0 136 308 5.10% 1,169 55.46% 4.91% 1,789 54.50% 4.62% 2,317 54.13% 5.97% 1,297 56.37% 6.62% 2,126 56.01% 5.98% 2,779 55.67%
Equity 47 0 0 0 646 0 164 0 0 0 369 0 0 0 0 0 0 0 0.00% 0 - 0.00% 0 - 0.00% 0 - 0.00% 0 - 0.00% 0 - 0.00% 0 -
Securitisation 0 0 0 0 1,675 0 0 0 0 0 507 0 0 0 0 0 1 0
Othernon-credit obligation assets 0 0 0 0 5,760 47 0 0 0 0 4,224 70 0 0 0 0 60 0
TOTAL 47 0 6,750 0 69,052 840 164 0 4,020 0 38,218 869 0 0 0 0 406 604 1.32% 1,756 46.24% 1.21% 2,462 46.20% 1.07% 3,072 45.86% 1.72% 2,093 50.12% 1.94% 3,228 48.92% 1.73% 4,189 47.81%
Securitisation andre-securitisations positions deductedfrom capital * 0 0 0 0 0 0 0 0 0 0 0 0
(mln EUR, %)No n-d ef aul t ed De fau lt e d No n-d ef aul t ed De fau lt e d No n-d ef aul t ed De fau lt e d No n-d ef aul t e d De fau lt e d No n-d ef aul t ed De fau lt e d No n-d ef aul t e d De fau lt e d No n-d ef aul t ed De fau lt e d No n-d ef aul t ed De fau lt e d No n-d ef aul t ed De fau lt e d
Impairment
rate
Stockof
ProvisionsCoverage Ratio -
Default Stock
Impairment
rate
Stockof
Provisions
CoverageRatio-Default
Stock
Impairment
rate
Stockof
Provisions
CoverageRatio -Default
Stock
Impairment rateStockof
Provisions
CoverageRatio-Default
Stock
Impairment
rate
Stockof
Provisions
CoverageRatio-Default
Stock
Impairment
rate
Stockof
Provisions
CoverageRatio -Default
Stock Central banksandcentral governments 0 0 247 0 6,117 0 0 0 284 0 34 0 0 0 1 0 0 0 0.62% 4 39.36% 0.63% 7 39.68% 0.64% 11 39.99% 3.39% 20 36.39% 3.74% 39 38.17% 4.12% 59 40.00%
Institutions 0 0 1,057 2 190 0 0 0 760 0 84 0 0 0 1 0 0 0 0.01% 1 2.70% 0.01% 1 3.56% 0.01% 1 3.98% 0.02% 1 3.28% 0.02% 2 4.01% 0.03% 2 4.36%
Corporates 0 0 6,161 744 2,227 304 0 0 4,675 143 2,010 112 0 0 76 292 21 63 1.05% 542 31.56% 1.01% 627 31.43% 1.02% 707 31.27% 1.25% 583 33.59% 1.40% 703 33.72% 1.50% 822 33.66%
Corporates -Of Which:SpecialisedLending 0 0 0 0 632 218 0 0 0 0 581 0 0 0 0 0 7 38 0.55% 49 15.78% 0.45% 51 16.47% 0.62% 55 17.36% 0.85% 54 17.74% 1.21% 62 19.49% 0.89% 67 20.62%
Corporates -Of Which:SME 0 0 2,509 307 425 0 0 0 1,989 50 213 0 0 0 53 73 7 0 1.20% 170 24.23% 1.17% 204 24.62% 1.17% 235 24.74% 1.37% 177 25.03% 1.52% 222 25.85% 1.70% 268 26.24%
Retail 0 0 17,897 948 928 39 0 0 4,065 133 655 51 0 0 106 458 13 48 0.62% 807 45.34% 0.65% 958 42.50% 0.65% 1,082 40.02% 0.72% 872 48.78% 0.83% 1,077 46.84% 0.85% 1,251 45.05%
Retail -Securedon real estateproperty 63.6% 0 0 14,901 574 53 21 0 0 2,959 68 25 32 0 0 57 198 0 0 0.39% 377 35.66% 0.45% 475 35.03% 0.46% 549 33.36% 0.47% 435 41.51% 0.60% 574 42.29% 0.66% 691 41.69%
Retail -Securedon real estate property- Of
h i h : S E0.0% 0 0 0 0 1 1 0 0 0 0 0 2 0 0 0 0 0 0 0.00% 0 0.00% 0.00% 0 0.00% 0.00% 0 0.00% 0.00% 0 0.00% 0.00% 0 0.00% 0.00% 0 0.00%
Retail -Securedon real estate property- Of
h i h: n n - E63.6% 0 0 14,901 574 52 20 0 0 2,959 68 25 31 0 0 57 198 0 0 0.39% 377 35.71% 0.45% 475 35.06% 0.46% 549 33.38% 0.47% 435 41.55% 0.60% 574 42.32% 0.66% 691 41.72%
Retail -QualifyingRevolving 0 0 458 35 0 0 0 0 109 7 0 0 0 0 5 19 0 0 1.79% 32 45.13% 1.72% 39 41.44% 1.62% 46 39.51% 1.88% 32 45.10% 1.90% 41 41.35% 2.02% 49 39.46%
Retail -OtherRetail 0 0 2,538 339 875 18 0 0 997 58 629 19 0 0 45 241 13 48 1.48% 397 60.87% 1.42% 444 55.29% 1.39% 487 51.82% 1.63% 404 60.72% 1.72% 462 55.00% 1.60% 511 51.51%
Retail -Other Retail -Of Which:SME 0 0 691 144 140 3 0 0 321 33 78 4 0 0 17 108 0 12 2.20% 155 67.25% 2.18% 172 62.56% 2.20% 189 59.45% 2.42% 157 66.84% 2.52% 177 62.15% 2.47% 195 59.01%
Retail -Other Retail -Of Which:non-SME 0 0 1,846 195 735 14 0 0 676 25 551 15 0 0 27 133 13 36 1.25% 242 57.18% 1.18% 271 51.31% 1.13% 298 47.76% 1.38% 247 57.19% 1.46% 285 51.17% 1.33% 316 47.61%
Equity 0 0 0 0 105 0 0 0 0 0 105 0 0 0 0 0 0 0 0.00% 0 - 0.00% 0 - 0.00% 0 - 0.00% 0 - 0.00% 0 - 0.00% 0 -
Securitisation 87 0 0 0 0 0 92 0 0 0 0 0 0 0 0 0 0 0
Othernon-credit obligation assets 0 0 0 0 1,984 251 0 0 0 0 2,249 252 0 0 0 0 0 0
TOTAL 87 0 25,362 1,695 11,552 594 92 0 9,784 276 5,137 415 0 0 184 750 34 111 0.72% 1,354 38.63% 0.73% 1,593 37.34% 0.73% 1,801 36.04% 0.90% 1,476 41.25% 1.02% 1,821 40.53% 1.06% 2,134 39.68%
Securitisation andre-securitisations positions deductedfrom capital * 0 0 0 0 0 0 0 0 0 0 0 0
(mln EUR, %)No n-d ef aul t ed De fau lt e d No n-d ef aul t ed De fau lt e d No n-d ef aul t ed De fau lt e d No n-d ef aul t e d De fau lt e d No n-d ef aul t ed De fau lt e d No n-d ef aul t e d De fau lt e d No n-d ef aul t ed De fau lt e d No n-d ef aul t ed De fau lt e d No n-d ef aul t ed De fau lt e d
Impairment
rate
Stockof
ProvisionsCoverage Ratio -
Default Stock
Impairment
rate
Stockof
Provisions
Coverage
Ratio-Default
Stock
Impairment
rate
Stockof
Provisions
Coverage
Ratio -Default
Stock
Impairment rateStockof
Provisions
Coverage
Ratio-Default
Stock
Impairment
rate
Stockof
Provisions
Coverage
Ratio-Default
Stock
Impairment
rate
Stockof
Provisions
Coverage
Ratio -Default
Stock Central banksandcentral governments 0 0 0 0 1,194 0 0 0 0 0 0 0 0 0 0 0 0 0 - 0 - - 0 - - 0 - - 0 - - 0 - - 0 -
Institutions 0 0 0 0 711 0 0 0 0 0 142 0 0 0 0 0 0 0 0.01% 0 21.08% 0.01% 0 21.08% 0.01% 0 21.08% 0.04% 0 21.08% 0.03% 0 21.08% 0.02% 1 21.08%
Corporates 0 0 0 0 3,179 136 0 0 0 0 3,179 182 0 0 0 0 14 22 0.16% 41 15.73% 0.15% 46 17.21% 0.14% 83 34.71% 0.20% 46 18.34% 0.21% 53 20.37% 0.21% 102 42.92%
Corporates -Of Which:SpecialisedLending 0 0 0 0 0 0 0 0 0 0 0 0 0 0 0 0 0 0 - 0 - - 0 - - 0 - - 0 - - 0 - - 0 -
Corporates -Of Which:SME 0 0 0 0 0 0 0 0 0 0 0 0 0 0 0 0 0 0 - 0 - - 0 - - 0 - - 0 - - 0 - - 0 -
Retail 0 0 0 0 26,639 215 0 0 0 0 17,700 220 0 0 0 0 264 750 0.67% 1,191 69.00% 0.66% 1,365 64.23% 0.65% 1,534 61.23% 0.76% 1,275 74.42% 0.81% 1,487 68.86% 0.88% 1,714 65.10%
Retail -Securedon real estateproperty 69.5% 0 0 0 0 6,142 57 0 0 0 0 2,328 51 0 0 0 0 3 33 0.31% 54 30.74% 0.30% 73 28.59% 0.30% 91 27.49% 0.44% 74 41.22% 0.52% 106 37.99% 0.64% 144 36.27%
Retail -Securedon real estate property- Of
hi h: E0.0% 0 0 0 0 0 0 0 0 0 0 0 0 0 0 0 0 0 0 - 0 - - 0 - - 0 - - 0 - - 0 - - 0 -
Retail -Securedon real estate property- Of
h i h: n n - E69.5% 0 0 0 0 6,142 57 0 0 0 0 2,328 51 0 0 0 0 3 33 0.31% 54 30.74% 0.30% 73 28.59% 0.30% 91 27.49% 0.44% 74 41.22% 0.52% 106 37.99% 0.64% 144 36.27%
Retail -QualifyingRevolving 0 0 0 0 0 0 0 0 0 0 0 0 0 0 0 0 0 0 - 0 - - 0 - - 0 - - 0 - - 0 - - 0 -
Retail -OtherRetail 0 0 0 0 20,496 158 0 0 0 0 15,372 169 0 0 0 0 261 717 0.77% 1,137 74.47% 0.77% 1,292 70.15% 0.76% 1,444 67.34% 0.85% 1,200 79.30% 0.90% 1,381 74.43% 0.95% 1,570 71.17%
Retail -Other Retail -Of Which:SME 0 0 0 0 0 0 0 0 0 0 0 0 0 0 0 0 0 0 - 0 - - 0 - - 0 - - 0 - - 0 - - 0 -
Retail -Other Retail -Of Which:non-SME 0 0 0 0 20,496 158 0 0 0 0 15,372 169 0 0 0 0 261 717 0.77% 1,137 74.47% 0.77% 1,292 70.15% 0.76% 1,444 67.34% 0.85% 1,200 79.30% 0.90% 1,381 74.43% 0.95% 1,570 71.17%
Equity 0 0 0 0 5 0 0 0 0 0 5 0 0 0 0 0 0 0 0.00% 0 - 0.00% 0 - 0.00% 0 - 0.00% 0 - 0.00% 0 - 0.00% 0 -
Securitisation 0 0 0 0 0 0 0 0 0 0 0 0 0 0 0 0 0 0
Othernon-credit obligation assets 0 0 0 0 516 0 0 0 0 0 411 0 0 0 0 0 0 0
TOTAL 0 0 0 0 32,245 351 0 0 0 0 21,438 403 0 0 0 0 278 772 0.60% 1,233 62.96% 0.59% 1,411 59.66% 0.59% 1,617 58.93% 0.68% 1,321 68.07% 0.73% 1,540 64.18% 0.79% 1,817 63.20%
Securitisation andre-securitisations positions deductedfrom capital * 0 0 0 0 0 0 0 0 0 0 0 0
(mln EUR, %)No n-d ef aul t ed De fau lt e d No n-d ef aul t ed De fau lt e d No n-d ef aul t ed De fau lt e d No n-d ef aul t e d De fau lt e d No n-d ef aul t ed De fau lt e d No n-d ef aul t e d De fau lt e d No n-d ef aul t ed De fau lt e d No n-d ef aul t ed De fau lt e d No n-d ef aul t ed De fau lt e d
Impairment
rate
Stockof
ProvisionsCoverage Ratio -
Default Stock
Impairment
rate
Stockof
Provisions
Coverage
Ratio-Default
Stock
Impairment
rate
Stockof
Provisions
Coverage
Ratio -Default
Stock
Impairment rateStockof
Provisions
Coverage
Ratio-Default
Stock
Impairment
rate
Stockof
Provisions
Coverage
Ratio-Default
Stock
Impairment
rate
Stockof
Provisions
Coverage
Ratio -Default
Stock Central banksandcentral governments 0 0 0 0 5,900 0 0 0 0 0 8 0 0 0 0 0 0 0 0.06% 0 39.43% 0.06% 0 39.46% 0.06% 0 39.49% 0.20% 0 39.39% 0.20% 0 39.49% 0.20% 0 39.59%
Institutions 0 0 0 0 1,340 0 0 0 0 0 341 0 0 0 0 0 0 0 0.01% 0 20.87% 0.01% 0 20.87% 0.01% 0 20.87% 0.03% 0 20.87% 0.03% 0 20.87% 0.02% 1 20.87%
Corporates 0 0 0 0 7,974 361 0 0 0 0 6,944 425 0 0 0 0 105 440 0.45% 592 53.05% 0.45% 651 53.07% 0.47% 689 51.29% 0.72% 612 51.33% 0.90% 701 49.45% 0.57% 744 47.57%
Corporates -Of Which:SpecialisedLending 0 0 0 0 0 0 0 0 0 0 0 0 0 0 0 0 0 0 - 0 - - 0 - - 0 - - 0 - - 0 - - 0 -
Corporates -Of Which:SME 0 0 0 0 197 7 0 0 0 0 167 9 0 0 0 0 0 16 1.88% 20 54.72% 1.87% 23 48.28% 1.83% 26 44.65% 2.10% 22 60.04% 2.35% 26 52.27% 2.67% 31 47.66%
Retail 0 0 0 0 12,903 237 0 0 0 0 7,116 228 0 0 0 0 157 578 1.85% 988 65.25% 1.83% 1,216 62.08% 1.90% 1,444 60.24% 2.06% 1,025 65.41% 2.36% 1,318 61.55% 2.27% 1,591 59.78%
Retail -Securedon real estateproperty 52.4% 0 0 0 0 7,277 119 0 0 0 0 3,052 103 0 0 0 0 62 118 0.69% 230 46.07% 0.64% 276 44.42% 0.62% 319 43.46% 0.88% 246 46.28% 1.01% 317 44.31% 1.00% 387 43.24%
Retail -Securedon real estate property- Of
h i h : S E29.6% 0 0 0 0 437 10 0 0 0 0 232 10 0 0 0 0 0 24 1.58% 31 65.76% 1.44% 37 63.57% 1.43% 43 62.13% 1.73% 31 65.47% 2.07% 40 62.70% 1.74% 47 61.31%
Retail -Securedon real estate property- Of
h i h: n n - E53.8% 0 0 0 0 6,840 109 0 0 0 0 2,820 93 0 0 0 0 62 94 0.63% 199 43.20% 0.59% 239 41.83% 0.57% 277 41.04% 0.82% 214 43.66% 0.94% 277 42.04% 0.96% 340 41.21%
Retail -QualifyingRevolving 0 0 0 0 119 1 0 0 0 0 90 1 0 0 0 0 0 34 2.97% 39 95.18% 3.14% 43 90.86% 3.43% 47 87.21% 3.17% 40 96.98% 3.53% 44 92.29% 3.56% 49 89.82%
Retail -OtherRetail 0 0 0 0 5,507 117 0 0 0 0 3,975 123 0 0 0 0 95 426 3.35% 719 71.89% 3.44% 898 68.13% 3.71% 1,078 65.91% 3.61% 739 72.49% 4.20% 956 68.26% 4.08% 1,155 66.56%
Retail -Other Retail -Of Which:SME 0 0 0 0 1,241 62 0 0 0 0 674 66 0 0 0 0 13 172 4.98% 246 67.24% 4.87% 301 64.33% 5.16% 354 62.56% 5.45% 252 66.84% 7.03% 331 63.26% 6.54% 394 61.59%
Retail -Other Retail -Of Which:non-SME 0 0 0 0 4,266 55 0 0 0 0 3,301 57 0 0 0 0 82 255 2.87% 472 74.97% 3.04% 597 70.44% 3.32% 724 67.82% 3.07% 487 76.28% 3.41% 626 71.53% 3.45% 761 69.68%
Equity 0 0 0 0 213 0 0 0 0 0 213 0 0 0 0 0 0 0 0.00% 0 - 0.00% 0 - 0.00% 0 - 0.00% 0 - 0.00% 0 - 0.00% 0 -
Securitisation 0 0 0 0 0 0 0 0 0 0 0 0 0 0 0 0 0 0
Othernon-credit obligation assets 0 0 0 0 992 16 0 0 0 0 656 23 0 0 0 0 0 0
TOTAL 0 0 0 0 29,322 614 0 0 0 0 15,279 676 0 0 0 0 262 1,017 1.25% 1,580 60.15% 1.23% 1,867 58.70% 1.27% 2,133 57.13% 1.48% 1,637 59.39% 1.71% 2,020 56.82% 1.53% 2,336 55.38%Securitisation andre-securitisations positions deductedfrom capital * 0 0 0 0 0 0 0 0 0 0 0 0
(mln EUR, %)No n-d ef aul t ed De fau lt e d No n-d ef aul t ed De fau lt e d No n-d ef aul t ed De fau lt e d No n-d ef aul t e d De fau lt e d No n-d ef aul t ed De fau lt e d No n-d ef aul t e d De fau lt e d No n-d ef aul t ed De fau lt e d No n-d ef aul t ed De fau lt e d No n-d ef aul t ed De fau lt e d
Impairment
rate
Stockof
ProvisionsCoverage Ratio -
Default Stock
Impairment
rate
Stockof
Provisions
Coverage
Ratio-DefaultStock
Impairment
rate
Stockof
Provisions
Coverage
Ratio -DefaultStock
Impairment rateStockof
Provisions
Coverage
Ratio-DefaultStock
Impairment
rate
Stockof
Provisions
Coverage
Ratio-DefaultStock
Impairment
rate
Stockof
Provisions
Coverage
Ratio -DefaultStock
Central banksandcentral governments 0 0 0 0 0 0 0 0 0 0 0 0 0 0 0 0 0 0 - 0 - - 0 - - 0 - - 0 - - 0 - - 0 -
Institutions 0 0 0 0 0 0 0 0 0 0 0 0 0 0 0 0 0 0 - 0 - - 0 - - 0 - - 0 - - 0 - - 0 -
Corporates 0 0 0 0 0 0 0 0 0 0 0 0 0 0 0 0 0 0 - 0 - - 0 - - 0 - - 0 - - 0 - - 0 -
Corporates -Of Which:SpecialisedLending 0 0 0 0 0 0 0 0 0 0 0 0 0 0 0 0 0 0 - 0 - - 0 - - 0 - - 0 - - 0 - - 0 -
Corporates -Of Which:SME 0 0 0 0 0 0 0 0 0 0 0 0 0 0 0 0 0 0 - 0 - - 0 - - 0 - - 0 - - 0 - - 0 -
Retail 0 0 0 0 0 0 0 0 0 0 0 0 0 0 0 0 0 0 - 0 - - 0 - - 0 - - 0 - - 0 - - 0 -
Retail -Securedon real estateproperty 0.0% 0 0 0 0 0 0 0 0 0 0 0 0 0 0 0 0 0 0 - 0 - - 0 - - 0 - - 0 - - 0 - - 0 -
Retail -Securedon real estate property- Of
hi h: E0.0% 0 0 0 0 0 0 0 0 0 0 0 0 0 0 0 0 0 0 - 0 - - 0 - - 0 - - 0 - - 0 - - 0 -
Retail -Securedon real estate property- Of
h i h : n n -S E0.0% 0 0 0 0 0 0 0 0 0 0 0 0 0 0 0 0 0 0 - 0 - - 0 - - 0 - - 0 - - 0 - - 0 -
Retail -QualifyingRevolving 0 0 0 0 0 0 0 0 0 0 0 0 0 0 0 0 0 0 - 0 - - 0 - - 0 - - 0 - - 0 - - 0 -
Retail -OtherRetail 0 0 0 0 0 0 0 0 0 0 0 0 0 0 0 0 0 0 - 0 - - 0 - - 0 - - 0 - - 0 - - 0 -
Retail -Other Retail -Of Which:SME 0 0 0 0 0 0 0 0 0 0 0 0 0 0 0 0 0 0 - 0 - - 0 - - 0 - - 0 - - 0 - - 0 -
Retail -Other Retail -Of Which:non-SME 0 0 0 0 0 0 0 0 0 0 0 0 0 0 0 0 0 0 - 0 - - 0 - - 0 - - 0 - - 0 - - 0 -
Equity 0 0 0 0 0 0 0 0 0 0 0 0 0 0 0 0 0 0 - 0 - - 0 - - 0 - - 0 - - 0 - - 0 -
Securitisation 0 0 0 0 0 0 0 0 0 0 0 0 0 0 0 0 0 0
Othernon-credit obligation assets 0 0 0 0 0 0 0 0 0 0 0 0 0 0 0 0 0 0
TOTAL 0 0 0 0 0 0 0 0 0 0 0 0 0 0 0 0 0 0 - 0 - - 0 - - 0 - - 0 - - 0 - - 0 -Securitisation andre-securitisations positions deductedfrom capital * 0 0 0 0 0 0 0 0 0 0 0 0
LTV %(asof
31/12/2013)
Exposure values (as of 31/12/2013) Risk exposure amounts (as of 31/12/2013) Value adjustments and provisions (as of 31/12/2013) Baseline Scenario Adverse Scenario
F-IRB A-IRB STA F-IRB A-IRB STA as of 31/12/2016 as of 31/12/2014 as of 31/12/2015 as of 31/12/2016F-IRB A-IRB STA a s of 3 1/ 12 /2 01 4 a s of 3 1/ 12 /2 01 5
LTV %(asof 31/12/2013)
Exposure values (as of 31/12/2013) Risk exposure amounts (as of 31/12/2013) Value adjustments and provisions (as of 31/12/2013) Baseline Scenario Adverse Scenario
F-IRB A-IRB STA F-IRB A-IRB STA F-IRB a sof 31 /12 /2 01 4 a so f3 1/ 12 /2 01 5 a sof 31 /12 /2 01 6 A-IRB STA a sof 31 /1 2/ 20 14 a so f3 1/ 12 /2 01 5 a sof 31 /12 /2 01 6
LTV %(asof
31/12/2013)
Exposure values (as of 31/12/2013) Risk exposure amounts (as of 31/12/2013) Value adjustments and provisions (as of 31/12/2013) Baseline Scenario Adverse Scenario
F-IRB A-IRB STA F-IRB A-IRB STA F-IRB A-IRB a s of 3 1/ 12 /2 01 5 a s of 3 1/ 12 /2 01 6STA as of 31/12/2014 as of 31/12/2015 as of 31/12/2016 as of 31/12/2014
AdverseScenario
F-IRB A-IRB STA F-IRB A-IRB STA F-IRB A-IRB STA as of 31/12/2014 as of 31/12/2015 as of 31/12/2016 as of 31/12/2014 as of 31/12/2015 as of 31/12/2016LTV %(asof
31/12/2013)
E xp os ur e va lu es ( as of 3 1/ 12 /2 01 3) R is k e xp os ur e am ou nt s (a s of 3 1/ 12 /2 01 3) V al ue a dj us tm en ts a nd pr ov is io ns ( as o f3 1/ 12 /2 01 3)
AdverseScenario
F-IRB A-IRB STA F-IRB A-IRB STA F-IRB A-IRB STA as of 31/12/2014 as of 31/12/2015 as of 31/12/2016 as of 31/12/2014 as of 31/12/2015 as of 31/12/2016LTV %(asof
31/12/2013)
E xp os ur e va lu es ( as of 3 1/ 12 /2 01 3) R is k e xp os ur e am ou nt s (a s of 3 1/ 12 /2 01 3)
BaselineScenario
Valueadjustmentsand provisions(asof 31/12/2013) BaselineScenario
(*)Referstothepart ofSecuritizationexposurethat isdeductedfrom capital andisnot includedinRWA
(*)Referstothepart ofSecuritizationexposurethat isdeductedfrom capital andisnot includedinRWA
(*)Referstothepart ofSecuritizationexposurethat isdeductedfrom capital andisnot includedinRWA
(*)Referstothepart ofSecuritizationexposurethat isdeductedfrom capital andisnot includedinRWA
(*)Referstothepart ofSecuritizationexposurethat isdeductedfrom capital andisnot includedinRWA
United States
Portugal
Germany
Please, select the country
Poland
http://www.economiaciudadana.org/

8/10/2019 Test Stress Banca Española 2014
http://slidepdf.com/reader/full/test-stress-banca-espanola-2014 5/240
2014 EU-wide Stress Test
P&L
(mln EUR) 31/12/2014 31/12/2015 31/12/2016 31/12/2014 31/12/2015 31/12/2016
Net interest income 27,671 27,668 26,728 25,480 25,878 22,747 19,988
Net trading income 660 1,102 1,322 385 937 1,213
of which trading losses from stress scenarios -1,105 -663 -442 -1,379 -828 -552
Other operating income 3,130 -571 -571 -571 -571 -571 -571
Operating profit before impairments 22,620 17,567 17,326 16,299 15,278 12,978 10,532
Impairment of financial assets (-) -14,495 -9,376 -8,323 -7,841 -11,883 -12,382 -10,866
Impairment of financial assets other than instruments designated at fair value
through P&L (-)-14,262 -9,374 -8,322 -7,841 -11,852 -12,363 -10,854
Impairment Financial assets designated at fair value through P&L (-) -234 -2 -1 -1 -31 -19 -13
Impairment on non financial assets (-) -427 -225 -135 -90 -765 -459 -306
Operating profit after impairments from stress scenarios 7,698 7,966 8,867 8,367 2,630 137 -640
Other Income and expenses 100 0 0 0 0 0 0
Pre-Tax profit 7,797 7,966 8,867 8,367 2,630 137 -640
Tax -2,276 -2,390 -2,660 -2,510 -789 -41 0
Net income 5,522 5,576 6,207 5,857 1,841 96 -640
Attributable to owners of the parent 4,370 4,554 5,285 5,132 1,041 -451 -961
of which carried over to capital through retained earnings 3,526 3,643 4,228 4,106 833 -451 -961
of which distributed as dividends 844 911 1,057 1,026 208 0 0
In the figures above, the original (official published) 2013 P&L figures may have been adjusted as part of the ECB Comprehensive Assessment join-up calculation.
31/12/2013
Baseline Scenario Adverse Scenario
http://www.economiaciudadana.org/

8/10/2019 Test Stress Banca Española 2014
http://slidepdf.com/reader/full/test-stress-banca-espanola-2014 6/240
2014 EU-wide Stress Test
RWA
(mln EUR)as of 31/12/2013 as of 31/12/2014 as of 31/12/2015 as of 31/12/2016 as of 31/12/2014 as of 31/12/2015 as of 31/12/2016
Risk exposure amount for credit risk 442,467 447,108 450,128 453,127 450,657 455,336 458,398
Risk exposure amount Securitisation and re-securitisations 5,656 7,834 8,565 9,051 10,008 12,041 13,377
Risk exposure amount Other credit risk 436,810 439,274 441,563 444,075 440,648 443,295 445,021
Risk exposure amount for market risk 31,546 31,646 31,646 31,646 39,363 39,363 39,301
Risk exposure amount for operational risk 65,943 65,943 65,943 65,943 65,943 65,943 65,943
Transitional floors for Risk exposure amount 293 293 293 293 293 293 293
AQR adjustments (for SSM countries only) 0 0 0 0 0 0 0
Total Risk exposure amount 540,248 544,990 548,010 551,008 556,256 560,935 563,935
Baseline Scenario Adverse Scenario
http://www.economiaciudadana.org/
8/10/2019 Test Stress Banca Española 2014
http://slidepdf.com/reader/full/test-stress-banca-espanola-2014 7/240
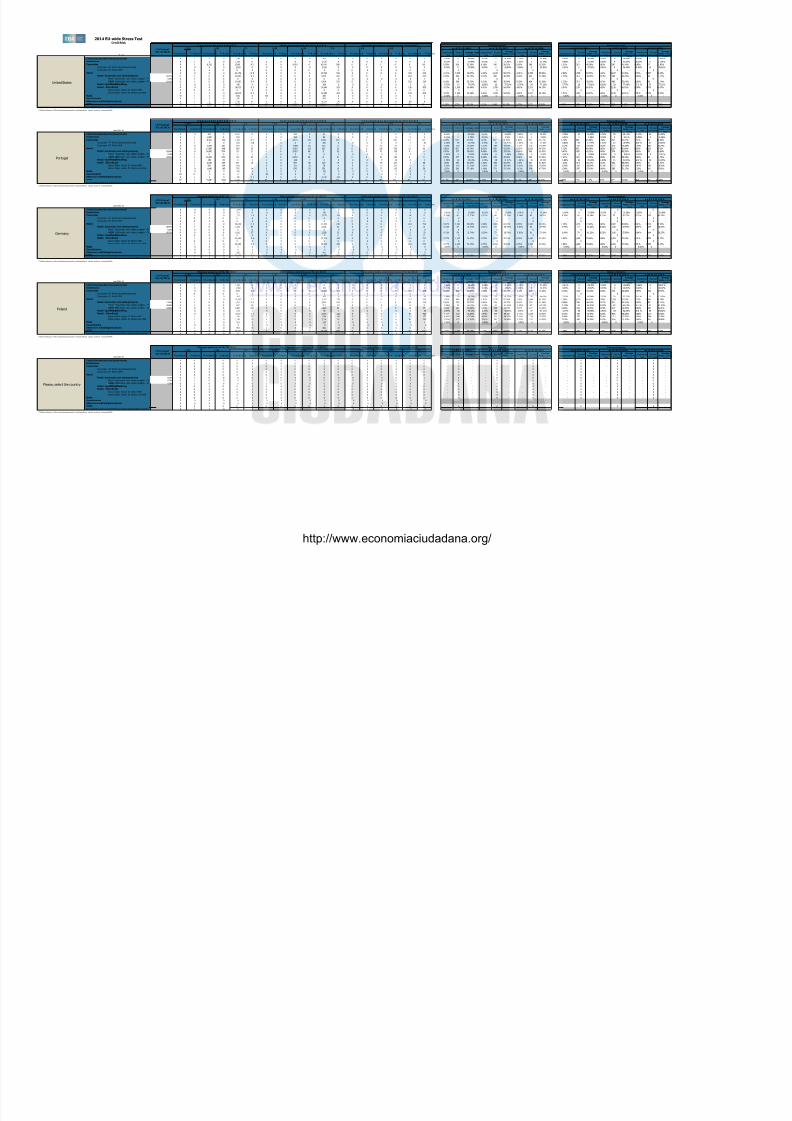
(mln EUR) as of 31/12/2013 31/12/2014 31/12/2015 31/12/2016 31/12/2014 31/12/2015 31/12/2016
Banking Book 4,884
Trading Book (excl. correlation trading positions under CRM) 810
Correlation Trading Portfolio (CRM) 0
Total 5,694
Banking Book 3,571 5,274 5,766 6,093 7,106 8,697 9,740
Trading Book (excl. correlation trading positions under CRM) 2,086 2,560 2,798 2,958 2,902 3,344 3,637
Total 5,656 7,834 8,565 9,051 10,008 12,041 13,377Hold to Maturity porfolio 0 0 0 0 0 0 0
Available for Sale porfolio 43 50 55 59 54 65 73
Held for trading portfolio
Total 43 50 55 59 54 65 73
2014 EU-wide Stress Test
Impairments
Baseline scenario Adverse scenario
Exposure values
Risk exposure values
Securitisation
http://www.economiaciudadana.org/

8/10/2019 Test Stress Banca Española 2014
http://slidepdf.com/reader/full/test-stress-banca-espanola-2014 8/240
2014 EU-wide Stress Test - Sovereign Exposure
(mln EUR)
[ 0 - 3M [ 2 0 2 2 0 0 0 0 0 0 0 0 0 0
[ 3M - 1Y [ 27 0 27 0 0 27 0 0 0 0 0 0 0 0
[ 1Y - 2Y [ 0 0 -26 0 0 -26 0 0 100 -6 0 0 0 0
[ 2Y - 3Y [ 1 0 1 0 0 1 0 0 0 0 0 0 0 0
[3Y - 5Y [ 43 0 5 0 0 5 0 0 0 0 0 0 0 0
[5Y - 10Y [ 28 0 -39 0 0 -39 0 0 0 0 0 0 0 0
[10Y - more 50 0 20 0 0 20 0 0 0 0 0 0 0 0
Tot 151 0 -11 2 0 -13 0 0 100 -6 0 0 0 0
[ 0 - 3M [ 42 0 42 10 0 32 0 0 0 0 29 0 -29 0
[ 3M - 1Y [ 18 0 18 0 0 18 0 0 0 0 0 0 0 0
[ 1Y - 2Y [ 0 0 -28 0 0 -28 0 0 0 0 0 0 0 0
[ 2Y - 3Y [ 10 0 -220 0 0 -220 0 0 0 0 191 5 -42 -1
[3Y - 5Y [ 39 0 7 0 0 7 0 0 0 0 0 0 0 0
[5Y - 10Y [ 52 0 20 0 0 20 0 0 0 0 0 0 0 0
[10Y - more 24 0 -8 0 0 -8 0 0 0 0 0 0 0 0
Tot 185 0 -169 10 0 -179 0 0 0 0 220 5 -71 -1
[ 0 - 3M [ 0 0 0 0 0 0 0 0 0 0 0 0 0 0
[ 3M - 1Y [ 0 0 0 0 0 0 0 0 0 0 0 0 0 0
[ 1Y - 2Y [ 0 0 0 0 0 0 0 0 0 0 0 0 0 0
[ 2Y - 3Y [ 0 0 0 0 0 0 0 0 0 0 0 0 0 0
[3Y - 5Y [ 0 0 0 0 0 0 0 0 0 0 0 0 0 0[5Y - 10Y [ 0 0 0 0 0 0 0 0 0 0 0 0 0 0
[10Y - more 0 0 0 0 0 0 0 0 0 0 0 0 0 0
Tot 0 0 0 0 0 0 0 0 0 0 0 0 0 0
[ 0 - 3M [ 0 0 0 0 0 0 0 0 0 0 0 0 0 0
[ 3M - 1Y [ 0 0 0 0 0 0 0 0 0 0 0 0 0 0
[ 1Y - 2Y [ 0 0 0 0 0 0 0 0 0 0 0 0 0 0
[ 2Y - 3Y [ 0 0 0 0 0 0 0 0 0 0 0 0 0 0
[3Y - 5Y [ 0 0 0 0 0 0 0 0 0 0 0 0 0 0
[5Y - 10Y [ 0 0 0 0 0 0 0 0 0 0 0 0 0 0
[10Y - more 0 0 0 0 0 0 0 0 0 0 0 0 0 0
Tot 0 0 0 0 0 0 0 0 0 0 0 0 0 0
[ 0 - 3M [ 5 0 5 0 0 5 0 0 0 0 0 0 0 0
[ 3M - 1Y [ 0 0 0 0 0 0 0 0 0 0 0 0 0 0
[ 1Y - 2Y [ 0 0 0 0 0 0 0 0 0 0 0 0 0 0
[ 2Y - 3Y [ 0 0 0 0 0 0 0 0 0 0 0 0 0 0
[3Y - 5Y [ 0 0 0 0 0 0 0 0 0 0 22 0 -22 0
[5Y - 10Y [ 0 0 0 0 0 0 0 0 0 0 0 0 0 0
[10Y - more 0 0 0 0 0 0 0 0 0 0 0 0 0 0
Tot 5 0 5 0 0 5 0 0 0 0 22 0 -22 0
[ 0 - 3M [ 0 0 0 0 0 0 0 0 0 0 0 0 0 0
[ 3M - 1Y [ 0 0 0 0 0 0 0 0 0 0 0 0 0 0
[ 1Y - 2Y [ 0 0 0 0 0 0 0 0 0 0 0 0 0 0
[ 2Y - 3Y [ 0 0 0 0 0 0 0 0 0 0 0 0 0 0[3Y - 5Y [ 0 0 0 0 0 0 0 0 0 0 0 0 0 0
[5Y - 10Y [ 0 0 0 0 0 0 0 0 0 0 0 0 0 0
[10Y - more 0 0 0 0 0 0 0 0 0 0 0 0 0 0
Tot 0 0 0 0 0 0 0 0 0 0 0 0 0 0
[ 0 - 3M [ 0 0 0 0 0 0 110 1 0 0 0 0 0 0
[ 3M - 1Y [ 2 0 2 0 0 2 210 5 0 0 0 0 0 0
[ 1Y - 2Y [ 0 0 -17 0 0 -17 450 8 0 0 0 0 0 0
[ 2Y - 3Y [ 5 0 5 0 0 5 0 0 361 -2 0 0 0 0
[3Y - 5Y [ 2 0 -2 0 0 -2 0 0 0 0 22 0 -22 0
[5Y - 10Y [ 48 0 23 0 0 23 150 21 0 0 0 0 0 0
[10Y - more 9 0 2 0 0 2 0 0 0 0 0 0 0 0
Tot 66 0 13 0 0 13 920 35 361 -2 22 0 -22 0
[ 0 - 3M [ 5 0 5 0 0 5 0 0 0 0 104 0 -104 0
[ 3M - 1Y [ 50 0 -112 0 0 -112 2 0 0 0 243 1 -36 0
[ 1Y - 2Y [ 121 0 -174 70 0 -244 1 0 0 0 360 1 -36 0
[ 2Y - 3Y [ 58 0 -363 0 0 -363 3 0 0 0 426 1 -103 -1
[3Y - 5Y [ 118 0 -196 0 0 -196 2 0 0 0 59 0 15 0
[5Y - 10Y [ 147 0 -82 0 0 -82 30 0 0 0 0 0 0 0
[10Y - more 110 0 6 0 0 6 394 0 0 0 0 0 0 0
Tot 609 0 -916 70 0 -986 430 0 0 0 1,192 3 -265 -1
Residual Maturity Country / Region
GROSS DIRECT LONG
EXPOSURES(accounting value gross
of provisions)
(1)
NET DIRECT POSITIONS (gross exposures (long) net of cash short
positions of sovereign debt to other counterpaties only where there
is a maturity matching)
(1)
DIRECT SOVEREIGN EXPOSURES IN DERIVATIVES (1)
of which: loans
and advances
of which: AFS
banking book
of which: FVO
(designated at fair
value through
profit&loss)
banking book
of which: Financial
assets held for
trading
(2)
Derivatives with positive fair value at
31/12/2013
Derivatives with negative fair value at
31/12/2013
Derivatives with positive fair value
at 31/12/2013
Derivatives with negative fair
value at 31/12/2013
VALUES AS OF 31/12/2013 VALUES AS OF 31/12/2013 VALUES AS OF 31/12/2013
INDIRECT SOVEREIGN EXPOSURES (3) (on and off balance sheet)
Fair-value at
31/12/2013 (+)Notional value
Fair-value at
31/12/2013 (-)Notional value
Fair-value at
31/12/2013 (+)Notional value
Fair-value at 31/12/2013
(-)
Austria
Belgium
Bulgaria
Cyprus
Notional value
Czech Republic
Denmark
Estonia
Finland
France
http://www.economiaciudadana.org/

8/10/2019 Test Stress Banca Española 2014
http://slidepdf.com/reader/full/test-stress-banca-espanola-2014 9/240
2014 EU-wide Stress Test - Sovereign Exposure
(mln EUR)
Residual Maturity Country / Region
GROSS DIRECT LONG
EXPOSURES(accounting value gross
of provisions)
(1)
NET DIRECT POSITIONS (gross exposures (long) net of cash short
positions of sovereign debt to other counterpaties only where there
is a maturity matching)
(1)
DIRECT SOVEREIGN EXPOSURES IN DERIVATIVES (1)
of which: loans
and advances
of which: AFS
banking book
of which: FVO(designated at fair
value through
profit&loss)
banking book
of which: Financial
assets held for
trading
(2)
Derivatives with positive fair value at
31/12/2013
Derivatives with negative fair value at
31/12/2013
Derivatives with positive fair value
at 31/12/2013
Derivatives with negative fair
value at 31/12/2013
VALUES AS OF 31/12/2013 VALUES AS OF 31/12/2013 VALUES AS OF 31/12/2013
INDIRECT SOVEREIGN EXPOSURES (3) (on and off balance sheet)
Fair-value at
31/12/2013 (+)Notional value
Fair-value at
31/12/2013 (-)Notional value
Fair-value at
31/12/2013 (+)Notional value
Fair-value at 31/12/2013
(-)Notional value
[ 0 - 3M [ 18 0 18 0 0 18 0 0 0 0 163 0 -163 0
[ 3M - 1Y [ 188 0 187 0 0 187 0 0 0 0 0 0 0 0
[ 1Y - 2Y [ 424 0 -425 0 0 -425 110 4 0 0 0 0 0 0
[ 2Y - 3Y [ 294 0 177 0 0 177 150 12 0 0 36 0 -54 0
[3Y - 5Y [ 617 0 -94 0 0 -94 0 0 0 0 22 0 -22 0
[5Y - 10Y [ 482 0 -56 0 0 -56 0 0 771 -71 0 0 0 0
[10Y - more 60 0 14 0 0 14 350 68 50 -5 0 0 0 0
Tot 2,083 0 -179 0 0 -179 610 84 821 -76 222 1 -240 -1
[ 0 - 3M [ 0 0 0 0 0 0 0 0 0 0 0 0 0 0
[ 3M - 1Y [ 0 0 0 0 0 0 0 0 0 0 0 0 0 0
[ 1Y - 2Y [ 0 0 0 0 0 0 0 0 0 0 0 0 0 0
[ 2Y - 3Y [ 0 0 0 0 0 0 0 0 0 0 0 0 0 0
[3Y - 5Y [ 0 0 0 0 0 0 0 0 0 0 0 0 0 0
[5Y - 10Y [ 0 0 0 0 0 0 0 0 0 0 0 0 0 0
[10Y - more 0 0 0 0 0 0 0 0 0 0 0 0 0 0
Tot 0 0 0 0 0 0 0 0 0 0 0 0 0 0
[ 0 - 3M [ 0 0 0 0 0 0 59 1 131 -2 0 0 0 0
[ 3M - 1Y [ 0 0 0 0 0 0 0 0 0 0 -3 0 3 0
[ 1Y - 2Y [ 0 0 0 0 0 0 0 0 0 0 0 0 0 0
[ 2Y - 3Y [ 0 0 0 0 0 0 0 0 0 0 0 0 0 0
[3Y - 5Y [ 0 0 0 0 0 0 0 0 0 0 0 0 0 0
[5Y - 10Y [ 0 0 0 0 0 0 0 0 0 0 0 0 0 0
[10Y - more 0 0 0 0 0 0 0 0 0 0 0 0 0 0
Tot 0 0 0 0 0 0 59 1 131 -2 -3 0 3 0
[ 0 - 3M [ 0 0 0 0 0 0 0 0 0 0 0 0 0 0
[ 3M - 1Y [ 0 0 0 0 0 0 0 0 0 0 0 0 0 0
[ 1Y - 2Y [ 0 0 0 0 0 0 0 0 0 0 0 0 0 0
[ 2Y - 3Y [ 0 0 0 0 0 0 0 0 0 0 0 0 0 0
[3Y - 5Y [ 0 0 0 0 0 0 0 0 0 0 0 0 0 0
[5Y - 10Y [ 0 0 0 0 0 0 0 0 0 0 0 0 0 0
[10Y - more 0 0 0 0 0 0 0 0 0 0 0 0 0 0
Tot 0 0 0 0 0 0 0 0 0 0 0 0 0 0
[ 0 - 3M [ 0 0 0 0 0 0 370 6 0 0 0 0 0 0
[ 3M - 1Y [ 0 0 0 0 0 0 1,000 16 108 -1 0 0 0 0
[ 1Y - 2Y [ 0 0 0 0 0 0 600 23 0 0 4 0 -4 0
[ 2Y - 3Y [ 0 0 0 0 0 0 750 34 0 0 0 0 0 0
[3Y - 5Y [ 0 0 0 0 0 0 1,350 100 0 0 0 0 0 0
[5Y - 10Y [ 0 0 0 0 0 0 744 22 0 0 0 0 0 0
[10Y - more 0 0 0 0 0 0 0 0 0 0 0 0 0 0
Tot 0 0 0 0 0 0 4,814 200 108 -1 4 0 -4 0
[ 0 - 3M [ 50 0 50 0 0 50 0 0 0 0 0 0 0 0
[ 3M - 1Y [ 1,324 0 1,249 0 0 1,249 0 0 0 0 193 1 -270 -1
[ 1Y - 2Y [ 647 0 94 0 0 94 0 0 0 0 87 1 -160 -1
[ 2Y - 3Y [ 276 0 39 77 0 -38 0 0 0 0 -71 3 91 0[3Y - 5Y [ 148 0 36 0 0 36 0 0 0 0 -18 0 115 0
[5Y - 10Y [ 146 0 -78 0 0 -78 0 0 0 0 0 0 0 0
[10Y - more 56 0 -5 0 0 -5 0 0 0 0 0 0 0 0
Tot 2,648 0 1,387 77 0 1,310 0 0 0 0 191 5 -224 -3
[ 0 - 3M [ 0 0 0 0 0 0 0 0 0 0 0 0 0 0
[ 3M - 1Y [ 0 0 0 0 0 0 0 0 0 0 0 0 0 0
[ 1Y - 2Y [ 0 0 0 0 0 0 0 0 0 0 0 0 0 0
[ 2Y - 3Y [ 0 0 0 0 0 0 0 0 0 0 0 0 0 0
[3Y - 5Y [ 0 0 0 0 0 0 0 0 0 0 0 0 0 0
[5Y - 10Y [ 0 0 0 0 0 0 0 0 0 0 0 0 0 0
[10Y - more 0 0 0 0 0 0 0 0 0 0 0 0 0 0
Tot 0 0 0 0 0 0 0 0 0 0 0 0 0 0
Latvia
Germany
Greece
Hungary
Iceland
Ireland
Italy
Croatia
Liechtenstein
http://www.economiaciudadana.org/

8/10/2019 Test Stress Banca Española 2014
http://slidepdf.com/reader/full/test-stress-banca-espanola-2014 10/240
2014 EU-wide Stress Test - Sovereign Exposure
(mln EUR)
Residual Maturity Country / Region
GROSS DIRECT LONG
EXPOSURES(accounting value gross
of provisions)
(1)
NET DIRECT POSITIONS (gross exposures (long) net of cash short
positions of sovereign debt to other counterpaties only where there
is a maturity matching)
(1)
DIRECT SOVEREIGN EXPOSURES IN DERIVATIVES (1)
of which: loans
and advances
of which: AFS
banking book
of which: FVO(designated at fair
value through
profit&loss)
banking book
of which: Financial
assets held for
trading
(2)
Derivatives with positive fair value at
31/12/2013
Derivatives with negative fair value at
31/12/2013
Derivatives with positive fair value
at 31/12/2013
Derivatives with negative fair
value at 31/12/2013
VALUES AS OF 31/12/2013 VALUES AS OF 31/12/2013 VALUES AS OF 31/12/2013
INDIRECT SOVEREIGN EXPOSURES (3) (on and off balance sheet)
Fair-value at
31/12/2013 (+)Notional value
Fair-value at
31/12/2013 (-)Notional value
Fair-value at
31/12/2013 (+)Notional value
Fair-value at 31/12/2013
(-)Notional value
[ 0 - 3M [ 0 0 0 0 0 0 0 0 0 0 0 0 0 0
[ 3M - 1Y [ 0 0 0 0 0 0 0 0 0 0 0 0 0 0
[ 1Y - 2Y [ 0 0 0 0 0 0 0 0 0 0 0 0 0 0
[ 2Y - 3Y [ 0 0 0 0 0 0 0 0 0 0 0 0 0 0
[3Y - 5Y [ 0 0 0 0 0 0 0 0 0 0 0 0 0 0
[5Y - 10Y [ 0 0 0 0 0 0 0 0 0 0 0 0 0 0
[10Y - more 0 0 0 0 0 0 0 0 0 0 0 0 0 0
Tot 0 0 0 0 0 0 0 0 0 0 0 0 0 0
[ 0 - 3M [ 0 0 0 0 0 0 0 0 0 0 0 0 0 0
[ 3M - 1Y [ 0 0 0 0 0 0 0 0 0 0 0 0 0 0
[ 1Y - 2Y [ 0 0 0 0 0 0 0 0 0 0 0 0 0 0
[ 2Y - 3Y [ 0 0 0 0 0 0 0 0 0 0 0 0 0 0
[3Y - 5Y [ 0 0 0 0 0 0 0 0 0 0 0 0 0 0[5Y - 10Y [ 0 0 0 0 0 0 0 0 0 0 0 0 0 0
[10Y - more 0 0 0 0 0 0 0 0 0 0 0 0 0 0
Tot 0 0 0 0 0 0 0 0 0 0 0 0 0 0
[ 0 - 3M [ 20 0 20 0 0 20 742 17 500 -12 30 0 -30 0
[ 3M - 1Y [ 19 0 19 0 0 19 1,122 19 917 -13 4 0 -4 0
[ 1Y - 2Y [ 62 0 46 0 0 46 2,802 107 2,753 -95 0 0 0 0
[ 2Y - 3Y [ 70 0 60 0 0 60 1,496 91 0 0 0 0 0 0
[3Y - 5Y [ 49 0 -13 0 0 -13 12,333 932 1,750 -105 11 0 -11 0
[5Y - 10Y [ 75 0 41 0 0 41 0 0 6,635 -598 0 0 0 0
[10Y - more 3 0 -58 0 0 -58 0 0 3,431 -513 0 0 0 0
Tot 297 0 115 0 0 115 18,495 1,166 15,986 -1,337 45 0 -45 0
[ 0 - 3M [ 96 0 96 96 0 0 0 0 0 0 0 0 0 0
[ 3M - 1Y [ 0 0 0 0 0 0 0 0 0 0 0 0 0 0
[ 1Y - 2Y [ 0 0 0 0 0 0 0 0 0 0 0 0 0 0
[ 2Y - 3Y [ 0 0 0 0 0 0 0 0 0 0 0 0 0 0
[3Y - 5Y [ 0 0 0 0 0 0 0 0 0 0 0 0 0 0
[5Y - 10Y [ 0 0 0 0 0 0 0 0 0 0 0 0 0 0
[10Y - more 0 0 0 0 0 0 0 0 0 0 0 0 0 0
Tot 96 0 96 96 0 0 0 0 0 0 0 0 0 0
[ 0 - 3M [ 1,424 3 1,424 1,373 0 48 101 1 0 0 0 0 0 0
[ 3M - 1Y [ 494 1 494 474 0 17 0 0 0 0 0 0 0 0
[ 1Y - 2Y [ 567 1 567 497 0 70 83 8 0 0 0 0 0 0
[ 2Y - 3Y [ 249 7 249 221 0 21 0 0 0 0 0 0 0 0
[3Y - 5Y [ 917 10 893 863 0 20 0 0 0 0 0 0 0 0
[5Y - 10Y [ 1,079 8 1,053 1,037 0 3 0 0 0 0 0 0 0 0
[10Y - more 349 6 349 305 0 38 0 0 0 0 0 0 0 0
Tot 5,079 36 5,030 4,770 0 216 184 9 0 0 0 0 0 0
[ 0 - 3M [ 327 43 327 278 0 6 0 0 0 0 0 0 0 0
[ 3M - 1Y [ 774 24 774 634 0 117 8 0 16 0 -7 0 7 0
[ 1Y - 2Y [ 59 17 59 17 0 25 0 0 0 0 -163 2 145 -2
[ 2Y - 3Y [ 109 109 109 0 0 0 0 0 0 0 0 0 0 0[3Y - 5Y [ 663 162 663 501 0 0 0 0 0 0 0 0 0 0
[5Y - 10Y [ 774 127 774 647 0 0 0 0 0 0 0 0 0 0
[10Y - more 102 101 102 0 0 1 10 0 14 0 0 0 0 0
Tot 2,808 583 2,808 2,076 0 149 18 0 30 0 -170 2 152 -2
[ 0 - 3M [ 0 0 0 0 0 0 0 0 0 0 0 0 0 0
[ 3M - 1Y [ 0 0 0 0 0 0 0 0 0 0 0 0 0 0
[ 1Y - 2Y [ 0 0 0 0 0 0 0 0 0 0 0 0 0 0
[ 2Y - 3Y [ 0 0 0 0 0 0 0 0 0 0 0 0 0 0
[3Y - 5Y [ 0 0 0 0 0 0 0 0 0 0 0 0 0 0
[5Y - 10Y [ 0 0 0 0 0 0 0 0 0 0 0 0 0 0
[10Y - more 0 0 0 0 0 0 0 0 0 0 0 0 0 0
Tot 0 0 0 0 0 0 0 0 0 0 0 0 0 0
Lithuania
Luxembourg
Malta
Netherlands
Norway
Poland
Portugal
Romania
Slovakia
http://www.economiaciudadana.org/

8/10/2019 Test Stress Banca Española 2014
http://slidepdf.com/reader/full/test-stress-banca-espanola-2014 11/240
2014 EU-wide Stress Test - Sovereign Exposure
(mln EUR)
Residual Maturity Country / Region
GROSS DIRECT LONG
EXPOSURES(accounting value gross
of provisions)
(1)
NET DIRECT POSITIONS (gross exposures (long) net of cash short
positions of sovereign debt to other counterpaties only where there
is a maturity matching)
(1)
DIRECT SOVEREIGN EXPOSURES IN DERIVATIVES (1)
of which: loans
and advances
of which: AFS
banking book
of which: FVO(designated at fair
value through
profit&loss)
banking book
of which: Financial
assets held for
trading
(2)
Derivatives with positive fair value at
31/12/2013
Derivatives with negative fair value at
31/12/2013
Derivatives with positive fair value
at 31/12/2013
Derivatives with negative fair
value at 31/12/2013
VALUES AS OF 31/12/2013 VALUES AS OF 31/12/2013 VALUES AS OF 31/12/2013
INDIRECT SOVEREIGN EXPOSURES (3) (on and off balance sheet)
Fair-value at
31/12/2013 (+)Notional value
Fair-value at
31/12/2013 (-)Notional value
Fair-value at
31/12/2013 (+)Notional value
Fair-value at 31/12/2013
(-)Notional value
[ 0 - 3M [ 0 0 0 0 0 0 0 0 0 0 0 0 0 0
[ 3M - 1Y [ 0 0 0 0 0 0 0 0 0 0 0 0 0 0
[ 1Y - 2Y [ 0 0 0 0 0 0 0 0 0 0 0 0 0 0
[ 2Y - 3Y [ 0 0 0 0 0 0 0 0 0 0 0 0 0 0
[3Y - 5Y [ 0 0 0 0 0 0 0 0 0 0 0 0 0 0
[5Y - 10Y [ 0 0 0 0 0 0 0 0 0 0 0 0 0 0
[10Y - more 0 0 0 0 0 0 0 0 0 0 0 0 0 0
Tot 0 0 0 0 0 0 0 0 0 0 0 0 0 0
[ 0 - 3M [ 1,035 869 1,035 0 123 43 1,656 32 1,444 -17 0 0 0 0
[ 3M - 1Y [ 3,331 475 3,312 0 67 2,579 499 11 361 -2 0 0 0 0
[ 1Y - 2Y [ 1,771 344 1,474 131 49 128 753 29 191 -5 0 0 0 0
[ 2Y - 3Y [ 4,384 2,183 4,154 1,702 308 -89 1,158 42 372 -22 0 0 0 0
[3Y - 5Y [ 6,436 3,266 5,841 2,507 461 -473 2,324 128 553 -20 0 0 0 0
[5Y - 10Y [ 17,841 2,561 17,607 13,717 362 968 2,433 108 1,910 -434 0 0 0 0
[10Y - more 5,647 2,022 4,943 3,087 285 -452 1,643 267 1,332 -271 0 0 0 0
Tot 40,446 11,720 38,367 21,144 1,655 2,704 10,466 617 6,162 -771 0 0 0 0
[ 0 - 3M [ 0 0 0 0 0 0 0 0 0 0 0 0 0 0
[ 3M - 1Y [ 0 0 0 0 0 0 0 0 0 0 0 0 0 0
[ 1Y - 2Y [ 0 0 0 0 0 0 0 0 0 0 0 0 0 0
[ 2Y - 3Y [ 0 0 0 0 0 0 0 0 0 0 0 0 0 0
[3Y - 5Y [ 0 0 0 0 0 0 0 0 0 0 0 0 0 0[5Y - 10Y [ 0 0 0 0 0 0 0 0 0 0 0 0 0 0
[10Y - more 0 0 0 0 0 0 0 0 0 0 0 0 0 0
Tot 0 0 0 0 0 0 0 0 0 0 0 0 0 0
[ 0 - 3M [ 204 0 -510 204 0 -714 0 0 12 0 0 0 0 0
[ 3M - 1Y [ 99 0 -110 0 0 -110 0 0 0 0 0 0 0 0
[ 1Y - 2Y [ 5 0 -172 0 0 -172 18 1 0 0 47 1 -47 -1
[ 2Y - 3Y [ 2,322 0 1,862 1,958 0 -96 10 1 0 0 36 1 -36 -1
[3Y - 5Y [ 889 0 307 874 0 -567 0 0 0 0 0 0 0 0
[5Y - 10Y [ 1,287 0 1,185 741 0 444 0 0 0 0 0 0 0 0
[10Y - more 506 0 -160 0 0 -160 30 5 0 0 0 0 0 0
Tot 5,312 0 2,402 3,777 0 -1,375 58 7 12 0 83 2 -83 -2
[ 0 - 3M [ 0 0 0 0 0 0 0 0 0 0 0 0 0 0
[ 3M - 1Y [ 0 0 0 0 0 0 0 0 0 0 0 0 0 0
[ 1Y - 2Y [ 0 0 0 0 0 0 0 0 0 0 0 0 0 0
[ 2Y - 3Y [ 0 0 0 0 0 0 0 0 0 0 0 0 0 0
[3Y - 5Y [ 0 0 0 0 0 0 0 0 0 0 0 0 0 0
[5Y - 10Y [ 0 0 0 0 0 0 0 0 0 0 0 0 0 0
[10Y - more 0 0 0 0 0 0 0 0 0 0 0 0 0 0
Tot 0 0 0 0 0 0 0 0 0 0 0 0 0 0
[ 0 - 3M [ 599 0 599 599 0 0 0 0 0 0 0 0 0 0
[ 3M - 1Y [ 0 0 0 0 0 0 0 0 0 0 0 0 0 0
[ 1Y - 2Y [ 0 0 0 0 0 0 0 0 0 0 0 0 0 0
[ 2Y - 3Y [ 0 0 0 0 0 0 0 0 0 0 0 0 0 0
[3Y - 5Y [ 0 0 0 0 0 0 0 0 0 0 0 0 0 0
[5Y - 10Y [ 0 0 0 0 0 0 0 0 0 0 0 0 0 0
[10Y - more 0 0 0 0 0 0 0 0 0 0 0 0 0 0
Tot 599 0 599 599 0 0 0 0 0 0 0 0 0 0
[ 0 - 3M [ 4,453 0 4,453 0 0 4,453 0 0 0 0 0 0 0 0
[ 3M - 1Y [ 108 0 108 0 0 108 0 0 0 0 0 0 0 0
[ 1Y - 2Y [ 0 0 0 0 0 0 0 0 0 0 0 0 0 0
[ 2Y - 3Y [ 0 0 0 0 0 0 0 0 0 0 0 0 0 0
[3Y - 5Y [ 0 0 0 0 0 0 0 0 0 0 0 0 0 0
[5Y - 10Y [ 0 0 0 0 0 0 0 0 0 0 0 0 0 0
[10Y - more 0 0 0 0 0 0 0 0 0 0 0 0 0 0
Tot 4,561 0 4,561 0 0 4,561 0 0 0 0 0 0 0 0
[ 0 - 3M [ 795 4 795 761 0 30 0 0 0 0 100 0 -100 0
[ 3M - 1Y [ 28 2 28 26 0 0 0 0 0 0 0 0 0 0
[ 1Y - 2Y [ 466 1 381 0 0 379 0 0 0 0 -75 0 75 0
[ 2Y - 3Y [ 21 9 9 1 0 0 0 0 0 0 -50 0 50 0
[3Y - 5Y [ 36 14 28 0 0 15 0 0 0 0 0 0 0 0
[5Y - 10Y [ 652 11 193 81 0 102 0 0 0 0 0 0 0 0
[10Y - more 1,243 8 1,237 1,220 0 -6 0 0 0 0 0 0 0 0
Tot 3,241 49 2,671 2,089 0 519 0 0 0 0 -25 0 25 0
Spain
Slovenia
Sweden
United Kingdom
Australia
Canada
Hong Kong
Japan
U.S.
http://www.economiaciudadana.org/

8/10/2019 Test Stress Banca Española 2014
http://slidepdf.com/reader/full/test-stress-banca-espanola-2014 12/240
2014 EU-wide Stress Test - Sovereign Exposure
(mln EUR)
Residual Maturity Country / Region
GROSS DIRECT LONG
EXPOSURES(accounting value gross
of provisions)
(1)
NET DIRECT POSITIONS (gross exposures (long) net of cash short
positions of sovereign debt to other counterpaties only where there
is a maturity matching)
(1)
DIRECT SOVEREIGN EXPOSURES IN DERIVATIVES (1)
of which: loans
and advances
of which: AFS
banking book
of which: FVO(designated at fair
value through
profit&loss)
banking book
of which: Financial
assets held for
trading
(2)
Derivatives with positive fair value at
31/12/2013
Derivatives with negative fair value at
31/12/2013
Derivatives with positive fair value
at 31/12/2013
Derivatives with negative fair
value at 31/12/2013
VALUES AS OF 31/12/2013 VALUES AS OF 31/12/2013 VALUES AS OF 31/12/2013
INDIRECT SOVEREIGN EXPOSURES (3) (on and off balance sheet)
Fair-value at
31/12/2013 (+)Notional value
Fair-value at
31/12/2013 (-)Notional value
Fair-value at
31/12/2013 (+)Notional value
Fair-value at 31/12/2013
(-)Notional value
[ 0 - 3M [ 0 0 0 0 0 0 0 0 0 0 0 0 0 0
[ 3M - 1Y [ 0 0 0 0 0 0 0 0 0 0 0 0 0 0
[ 1Y - 2Y [ 0 0 0 0 0 0 0 0 0 0 0 0 0 0
[ 2Y - 3Y [ 0 0 0 0 0 0 0 0 0 0 0 0 0 0
[3Y - 5Y [ 0 0 0 0 0 0 0 0 0 0 0 0 0 0
[5Y - 10Y [ 0 0 0 0 0 0 0 0 0 0 0 0 0 0
[10Y - more 0 0 0 0 0 0 0 0 0 0 0 0 0 0
Tot 0 0 0 0 0 0 0 0 0 0 0 0 0 0
[ 0 - 3M [ 407 0 407 0 0 407 0 0 0 0 0 0 0 0
[ 3M - 1Y [ 244 0 244 0 0 244 0 0 0 0 0 0 0 0
[ 1Y - 2Y [ 0 0 0 0 0 0 0 0 0 0 0 0 0 0
[ 2Y - 3Y [ 0 0 0 0 0 0 0 0 0 0 0 0 0 0
[3Y - 5Y [ 0 0 0 0 0 0 0 0 0 0 0 0 0 0
[5Y - 10Y [ 0 0 0 0 0 0 0 0 0 0 0 0 0 0
[10Y - more 0 0 0 0 0 0 0 0 0 0 0 0 0 0
Tot 652 0 652 0 0 652 0 0 0 0 0 0 0 0
[ 0 - 3M [ 0 0 0 0 0 0 0 0 0 0 0 0 0 0
[ 3M - 1Y [ 4 0 4 4 0 0 0 0 0 0 0 0 0 0
[ 1Y - 2Y [ 0 0 0 0 0 0 0 0 0 0 0 0 0 0
[ 2Y - 3Y [ 0 0 0 0 0 0 0 0 0 0 0 0 0 0
[3Y - 5Y [ 0 0 0 0 0 0 0 0 0 0 0 0 0 0[5Y - 10Y [ 0 0 0 0 0 0 0 0 0 0 0 0 0 0
[10Y - more 0 0 0 0 0 0 0 0 0 0 0 0 0 0
Tot 4 0 4 4 0 0 0 0 0 0 0 0 0 0
[ 0 - 3M [ 0 0 0 0 0 0 0 0 0 0 0 0 0 0
[ 3M - 1Y [ 0 0 0 0 0 0 0 0 0 0 0 0 0 0
[ 1Y - 2Y [ 0 0 0 0 0 0 0 0 0 0 0 0 0 0
[ 2Y - 3Y [ 0 0 0 0 0 0 0 0 0 0 0 0 0 0
[3Y - 5Y [ 0 0 0 0 0 0 0 0 0 0 0 0 0 0
[5Y - 10Y [ 0 0 0 0 0 0 0 0 0 0 0 0 0 0
[10Y - more 0 0 0 0 0 0 0 0 0 0 0 0 0 0
Tot 0 0 0 0 0 0 0 0 0 0 0 0 0 0
[ 0 - 3M [ 5,097 264 3,453 495 1 2,693 515 3 763 -20 0 0 -73 0
[ 3M - 1Y [ 4,418 144 4,009 866 1 2,998 168 2 2,938 -116 138 1 -645 -4
[ 1Y - 2Y [ 4,710 105 3,760 2,012 0 1,643 41 0 17 0 155 5 -1,479 -13
[ 2Y - 3Y [ 5,621 664 3,752 709 2 2,377 192 22 41 0 -564 24 -1,216 -21
[3Y - 5Y [ 8,153 994 7,617 5,467 4 1,153 68 6 298 -16 86 9 -90 -7
[5Y - 10Y [ 3,361 779 2,703 1,634 3 287 19 7 0 0 0 0 0 0
[10Y - more 2,964 615 2,779 1,736 2 425 8 0 68 -2 0 0 0 0
Tot 34,324 3,566 28,074 12,919 13 11,576 1,010 40 4,125 -155 -185 39 -3,503 -45
[ 0 - 3M [ 8 7 8 0 0 0 0 0 0 0 0 0 0 0
[ 3M - 1Y [ 4 4 4 0 0 0 0 0 0 0 0 0 0 0
[ 1Y - 2Y [ 3 3 3 0 0 0 0 0 0 0 0 0 0 0
[ 2Y - 3Y [ 19 18 19 0 1 0 0 0 0 0 0 0 0 0
[3Y - 5Y [ 29 27 29 0 1 0 0 0 0 0 0 0 0 0
[5Y - 10Y [ 22 22 22 0 1 0 0 0 0 0 0 0 0 0
[10Y - more 18 17 18 0 1 0 0 0 0 0 0 0 0 0
Tot 103 99 103 0 4 0 0 0 0 0 0 0 0 0
[ 0 - 3M [ 4 4 4 0 0 0 0 0 0 0 0 0 0 0
[ 3M - 1Y [ 2 2 2 0 0 0 0 0 0 0 0 0 0 0
[ 1Y - 2Y [ 2 1 2 0 0 0 0 0 0 0 0 0 0 0
[ 2Y - 3Y [ 10 9 10 0 0 0 0 0 0 0 0 0 0 0
[3Y - 5Y [ 14 14 14 0 1 0 0 0 0 0 0 0 0 0
[5Y - 10Y [ 11 11 11 0 0 0 0 0 0 0 0 0 0 0
[10Y - more 9 9 9 0 0 0 0 0 0 0 0 0 0 0Tot 52 49 52 0 2 0 0 0 0 0 0 0 0 0
Notes and definitions
(1) The exposures reported cover only exposures to central, regional and local governments on immediate borrower basis, and do not include exposures to other counterparts with full or partial government guarantees
(2) The banks disclose the exposures in the "Financial assets held for trading" portfolio after offsetting the cash short positions having the same maturities.
(3) The exposures reported include the positions towards counterparts (other than sovereign) on sovereign credit risk (i.e. CDS, financial guarantees) booked in all the accounting portfolio (on-off balance sheet).'Irrespective of the denomination and or accounting classification of the positions the economic substance over the form must be used as a criteria for the identification of the exposures to be included in this column. This item does not include exposures to counterparts (other than sovereign) with full or partial government guarantees by central, regional and local governments
Latin America and the
Caribbean
Africa
Others
Middle East
China
Switzerland
Other advanced economies
non EEA
Other Central and eastern
Europe countries non EEA
http://www.economiaciudadana.org/

8/10/2019 Test Stress Banca Española 2014
http://slidepdf.com/reader/full/test-stress-banca-espanola-2014 13/240
2014 EU-wide Stress TestCapital
(mln EUR) CRR/ CRDIV DEFINITION OFCAPITAL Asof31/12/2013 Asof31/12/2014 Asof31/12/2015 Asof31/12/2016 Asof31/12/2014 Asof31/12/2015 Asof31/12/2016 COREP CODE REGULATION
A OWN FUNDS 63,219 67,718 71,329 74,605 64,111 62,226 58,967 C A 1 {1 } A rt ic le s 4 (1 18 ) a nd 7 2 of C RR
A.1COMMON EQUITYTIER 1CAPITAL(net ofdeductionsandafter applying
transitional adjustments)56,086 60,368 63,248 66,063 56,762 54,146 50,426 C A 1 {1 .1 .1 } A rt ic le 5 0 of C RR
A.1.1Capitalinstrumentseligible asCET1Capital(including share premium and net own
capitalinstruments)42,390 42,390 42,390 42,390 42,390 42,390 42,390 CA1 {1.1.1.1}
Articles 26(1) points (a) and(b), 27to29, 36(1) point (f)
and42ofCRR
A.1.1.1 Ofwhich: CET1instrumentssubscribed byGovernment 0 0 0 0 0 0 0 - -
A.1.2 Retained earnings 41,782 45,425 49,653 53,759 42,615 42,164 41,202 CA1 {1.1.1.2} Articles 26(1) point (c), 26(2) and36 (1) points (a) and(l)
ofCRR
A.1.3 Accumulated other comprehensive income -15,386 -15,275 -15,045 -15,025 -16,647 -15,675 -16,123 CA1 {1.1.1.3} Articles 4(100), 26(1) point (d) and 36 (1) point (l) of CRR
A.1.3.1 Ofwhich: arising from unrealised gains/lossesfrom Sovereign exposure in AFS
portfolio-379 -379 -379 -379 -2,740 -2,081 -2,373 - -
A.1.3.2 Ofwhich: arising from unrealised gains/lossesfrom the rest ofAFS portfolio 425 384 291 229 -35 -309 -493 - -
A.1.4 Other Reserves 0 0 0 0 0 0 0 CA1 {1.1.1.4} Articles 4(117) and 26(1) point (e) of CRR
A.1.5 Fundsfor generalbanking risk 0 0 0 0 0 0 0 CA1 {1.1.1.5} Articles 4(112), 26(1) point (f) and 36 (1) point (l) of CRR
A.1.6 Minorityinterest given recognition in CET1capital 6,012 6,390 6,733 7,003 6,308 6,511 6,630 CA1 {1.1.1.7} Article 84 of CRR
A.1.7 AdjustmentstoCET1 due toprudentialfiltersexcluding those from unrealised
gains/lossesfrom AFS portfolio326 326 326 326 326 326 326 CA1 {1.1.1.9} Articles 32 to 35 of and 36 (1) point (l) of CRR
A.1.8 AdjustmentstoCET1 due toprudentialfiltersfrom unrealised gains/lossesfrom
Sovereign Exposure in AFS portfolio379 303 227 152 2,192 1,249 949 -
A.1.9 (-)Intangible assets(including Goodwill) -26,739 -25,974 -25,209 -24,444 -25,974 -25,209 -24,444CA1{1.1.1.10+
1.1.1.11}
Articles 4(113), 36(1) point (b) and37of CRR. Articles
4(115), 36(1) point (b) and37point (a) of CCR
A.1.10(-)DTAs that relyon future profitabilityand donot arise from temporary
differencesnet ofassociated DTLs-4,828 -4,801 -4,760 -4,749 -4,720 -4,642 -4,649 CA1 {1.1.1.12} Articles 36(1) point (c) and 38 of CRR
A.1.11 (-)IRB shortfallofcredit riskadjustmentsto expected losses 0 0 0 0 0 0 0 CA1 {1.1.1.13} Articles 36(1) point (d), 40 and 159 of CRR
A.1.12 (-)Defined benefit pension fund assets -148 -158 -201 -334 -338 -1,045 -1,620 CA1 {1.1.1.14} Articles 4(109), 36(1) point (e) and 41 of CRR
A.1.13 (-)Reciprocalcrossholdingsin CET1Capital 0 0 0 0 0 0 0 CA1 {1.1.1.15} Articles 4(122), 36(1) point (g) and 44 of CRR
A.1.14 (-)Excessdeduction from AT1itemsover AT1Capital 0 0 0 0 0 0 0 CA1 {1.1.1.16} Article 36(1) point (j) of CRR
A.1.15(-)Deductionsrelated toassets which can alternativelybe subject toa 1.250%risk
weight-70 -70 -70 -70 -70 -70 -70
CA1{1.1.1.17to
1.1.1.21}
Articles 4(36), 36(1) point (k) (i) and89to 91ofCRR;
Articles 36(1) point (k) (ii), 243(1) point (b), 244(1) point
(b) and258of CRR;Articles 36(1) point k) (iii) and379(3)
ofCRR;Art icles 36(1) point k) (iv) and153(8) ofCRRand
A.1.15.1 Ofwhich: from securitisation positions(-) 0 0 0 0 0 0 0 CA1 {1.1.1.18.1} Articles 36(1) point (k) (ii), 243(1) point (b), 244(1) point
(b) and258of CRR
A.1.16(-)Holdingsof CET1capitalinstrumentsof financialsector entitieswhere the
institiution does not have a significant investment0 0 0 0 0 0 0 CA1 {1.1.1.22}
Articles 4(27), 36(1) point (h);43to46, 49(2) and (3) and
79ofCRR
A.1.17(-)Deductible DTAsthat rely on future profitabilityand arise from temporary
differences-2,320 -1,813 -1,242 -754 -2,962 -2,945 -3,267 CA1 {1.1.1.23}
Articles 36(1) point (c) and38;Articles 48(1) point (a) and
48(2) ofCRR
A.1.18(-)Holdingsof CET1capitalinstrumentsof financialsector entitieswhere the
institiution has a significant investment0 0 0 0 0 0 0 CA1 {1.1.1.24}
Articles 4(27);36(1) point (i);43, 45;47; 48(1) point (b);
49(1) to(3) and79of CRR
A.1.19 (-)Amount exceding the 17.65%threshold 0 0 0 0 0 0 0 CA1 {1.1.1.25} Article 470 of CRR
A.1.20 Transitionaladjustments 14,688 13,625 10,445 7,810 13,642 11,092 9,102CA1{1.1.1.6+ 1.1.8+
1.1.26}-
A.1.20.1 Transitionaladjustmentsdue tograndfathered CET1Capitalinstruments(+/-) 0 0 0 0 0 0 0 CA1 {1.1.1.6}
Articles 483(1) to(3), and484to487of CRR
A.1.20.2 Transitionaladjustmentsdue toadditionalminorityinterests(+/-) 2,242 2,348 1,832 1,258 2,325 1,786 1,207 CA1 {1.1.1.8}
Articles 479and480of CRR
A.1.20.3Other transitionaladjustmentsto CET1Capitalexcl. adjustmentsfor Sovereign
exposure in AFS (+/-)12,446 11,277 8,613 6,551 11,317 9,306 7,894 CA1 {1.1.1.26}
Articles 469to472, 478and 481ofCRR
A.2 ADDITIONAL TIER 1CAPITAL (net ofdeductionsand after transitional
adjustments)30 562 1,292 1,756 562 1,292 1,755 C A 1 {1 .1 .2 } A rt ic le 6 1 of C RR
A.2.1 Ofwhich:(+) Other existing support government measures 0 0 0 0 0 0 0 - -
A.3 TIER1 CAPITAL(netofdeductionsandafter transitional adjustments) 56,115 60,930 64,540 67,819 57,324 55,437 52,182 C A1 { 1. 1} A rt ic le 2 5 of C RR
A.4 TIER2 CAPITAL(netofdeductionsandafter transitional adjustments) 7,104 6,787 6,789 6,786 6,787 6,789 6,785 C A1 { 1. 2} A rt ic le 7 1 of C RR
B T OT AL R IS K EX PO SU RE A M OU NT 540,248 544,990 548,010 551,008 556,256 560,935 563,935 C A 2 {1 } A rt ic le s 92 (3 ), 95 , 96 a n d 98 o f CR R
B.1ofwhich:stemming from exposuresthat fallbelow the 10%/ 15%limitsfor
CET1deduction (+)18,466 0 0 0 0 0 0
Articles 36(1) points (a) and(i);Article 38a ndArticle 48of
CRR
B. 2 ofwh ich :s temmi ng f r om fr om CVAcap ita l r eq ui r ements (+) 1,625 0 0 0 0 0 0 Article 381to386 ofCRR
B.3ofwhich:stemming from higher asset correlation parameter against exposures
tolarge financialinstitutionsunder IRB the IRB approachesto credit risk(+)0 0 0 0 0 0 0 Articles 153(2) ofCRR
B.4ofwhich:stemming from the application ofthe supporting factor to increase
lending toSMEs(-)-7,785 0 0 0 0 0 0 Recital (44) ofCRR
B.5
ofwhich:stemming from the effect of exposuresthat were previouslypart of
RiskExposure amount and receive a deduction treatment under CRR/CRDIV (-
)
0 0 0 0 0 0 0 -
B.6 ofwhich:otherssubject tothe discretion ofNationalCompetent Authorities 0 0 0 0 0 0 0 Article 124to164 ofCRR
C.1 Co mm onE q ui tyTi er 1Cap i tal r ati o 10.38% 11.08% 11.54% 11.99% 10.20% 9.65% 8.94% CA3 {1} -
C .2 T ie r 1 C ap it al ra ti o 10.39% 11.18% 11.78% 12.31% 10.31% 9.88% 9.25% CA3 { 3} -
C .3 T ot al C ap it al r at io 11.70% 12.43% 13.02% 13.54% 11.53% 11.09% 10.46% CA3 { 5} -
D Co mm onE q ui tyTi er 1Cap i tal Thresho ld 43,599 43,841 44,081 30,594 30,851 31,016
ETotalamount of instrumentswith mandatoryconversion intoordinarysharesupon
a fixed date in the 2014 -2016period (cumulative conversions)(1)0 0 0 0 0 0
F
TotalAdditionalTier 1and Tier 2 instrumentseligible asregulatorycapitalunder
the CRR provisionsthat convert into Common EquityTier 1or are written down
upon a trigger event (2)
4,102 4,102 4,102
F.1Ofwhich: eligible instrumentswhose trigger isabove CET1capitalratio in the
adverse scenario(2)0 0 0
G FullyLoadedCommonEquityTier 1Capital ratio (3) 10.57% 7.33%
(1)Conversionsnot considered for CET1 computation (2)Excluding instrumentsincluded in E (3)Memorandum item based on a fullyimplemented CRR/CRD IV definition of Common EquityTier 1 capitalincluding 60%ofunrealised gains/lossesfrom Sovereign Exposure in AFS portfolio
Memorandumitems
Baseline Scenario Adverse Scenario
OWN FUNDS
OWN FUNDS
REQUIREMENTS
CAPITALRATIOS(%) -
Transitional period
http://www.economiaciudadana.org/

8/10/2019 Test Stress Banca Española 2014
http://slidepdf.com/reader/full/test-stress-banca-espanola-2014 14/240
2014 EU-wide Stress Test - Restructuring scenarios
(mln EUR)
2013 0 0
2014 0 0 0 0
2015 0 0 0 0
2016 0 0 0 0
Total 0 0 0 0
Effects of mandatory restructuring plans publicly announced before 31 December 2013 and formally agreed with the European Commission.
Baseline scenario Adverse scenarioNarrative description of the transactions. (type, date of
completion/commitment, portfolios, subsidiaries, branches)CET1 impact
Risk exposure
amount impactCET1 impact
Risk exposure
amount impact
http://www.economiaciudadana.org/

8/10/2019 Test Stress Banca Española 2014
http://slidepdf.com/reader/full/test-stress-banca-espanola-2014 15/240
2014 EU-wide Stress Test
Outcome of the Stress Test based on the Restructuring plan for banks whose plan was formally agreed with the European Commission after 31 December 2013
(mln EUR)
As of
31/12/2013
As of
31/12/2014
As of
31/12/2015
As of
31/12/2016
As of
31/12/2014
As of
31/12/2015
As of
31/12/2016
COMMON EQUITY TIER 1 CAPITAL (net of deductions and after applying transitional adjustments)
TOTAL RISK EXPOSURE AMOUNT
COMMON EQUITY TIER 1 RATIO #DIV/0! #DIV/0! #DIV/0! #DIV/0! #DIV/0! #DIV/0! #DIV/0!
Baseline scenario Adverse scenario
http://www.economiaciudadana.org/

8/10/2019 Test Stress Banca Española 2014
http://slidepdf.com/reader/full/test-stress-banca-espanola-2014 16/240
2014 EU-wide Stress Test
Impact on CommonEquity Tier 1
Million EUR
Raising of capital instruments eligible as CET1 capital (+) 0
Repayment of CET1 capital, buybacks (-) 0
Conversion to CET1 of hybrid instruments becoming effective between 1 January and 30 September 2014 (+) 0
Impact on Additional
Tier 1 and Tier 2
Million EUR Net issuance of Additional Tier 1 and T2 Instruments with a trigger at or above bank's post stress test CET1 ratio in the adverse
scenario during the stress test horizon (+/-)0
Net issuance of Additional Tier 1 and T2 Instrument with a trigger below bank's post stress test CET1 ratio in the adverse
scenario during the stress test horizon (+/-)4,192
Million EUR
Realized fines/litigation costs from 1 January to 30 September 2014 (net of provisions) (-) 0
Other material losses and provisions from 1 January to 30 September 2014 (-) 0
Major Capital Measures from 1 January to 30 September 2014
Losses
Net issuance of Additional Tier 1 and T2 Instruments
Issuance of CET 1 Instruments
Major Capital Measures Impacting Tier 1 and Tier 2 Eligible Capital from 1 January 2014 to 30 September 2014
http://www.economiaciudadana.org/

8/10/2019 Test Stress Banca Española 2014
http://slidepdf.com/reader/full/test-stress-banca-espanola-2014 17/240
Bank Name ES - Banco Bilbao Vizcaya Argentaria, S.A.
LEI Code K8MS7FD7N5Z2WQ51AZ71
ES
NUK_WL_NR_XX
version
1809014
No restructuring
2014 EU-wide Stress Test
http://www.economiaciudadana.org/

8/10/2019 Test Stress Banca Española 2014
http://slidepdf.com/reader/full/test-stress-banca-espanola-2014 18/240
Actual figures as of 31 December 2013 mln EUR, % Actual figures as of 31 December 2013 mln EUR, %
Operating profit before impairments 9,266 Operating profit before impairments 9,266
Impairment losses on financial and non-financial assets in the banking book 7,748 Impairment losses on financial and non-financial assets in the banking book 7,748
Common Equity Tier 1 capital (1) 36,383 Common Equity Tier 1 capital (1) 36,383
Total Risk Exposure (1) 345,041 Total Risk Exposure (1) 345,041
Common Equity Tier 1 ratio, % (1) 10.5% Common Equity Tier 1 ratio, % (1) 10.5%
Outcome of the adverse scenario as of 31 December 2016 mln EUR, % Outcome of the baseline scenario as of 31 December 2016 mln EUR, %
3 yr cumulative operating profit before impairments 17,981 3 yr cumulative operating profit before impairments 20,065
3 yr cumulative impairment losses on financial and non-financial assets in the banking book 15,880 3 yr cumulative impairment losses on financial and non-financial assets in the banking book 11,004
3 yr cumulative losses from the stress in the trading book 2,079 3 yr cumulative losses from the stress in the trading book 1,630
Valuation losses due to sovereign shock after tax and prudential filters 736 Common Equity Tier 1 capital (1) 38,028
Common Equity Tier 1 capital (1) 34,196 Total Risk Exposure (1) 358,592
Total Risk Exposure (1) 381,341 Common Equity Tier 1 ratio, % (1) 10.6%
Common Equity Tier 1 ratio, % (1) 9.0%
Memorandum items mln EUR
Memorandum items mln EUR Common EU wide CET1 Threshold (8.0%) 28,687
Common EU wide CET1 Threshold (5.5%) 20,974
Total amount of instruments with mandatory conversion into ordinary shares upon a fixed date in
the 2014 -2016 period (cumulative conversions) (2)0
Total Additional Tier 1 and Tier 2 instruments eligible as regulatory capital under the CRR provisionsthat convert into Common Equity Tier 1 or are written down upon a trigger event (3)0
Of which: eligible instruments whose trigger is above CET1 capital ratio in the adverse
scenario (3)0
(2) Conversions not considered for CET1 computation
(3) Excluding instruments with mandatory conversion into ordinary shares upon a fixed date in the 2014 -2016 period
(1) According to CRR/CRD4 definition transitional arrangements as per reporting date. Figures as of 31/12/2013 computed as of first day of application:
01/01/2014.
2014 EU-wide Stress Test 2014 EU-wide Stress TestSummary Baseline Scenario
ES - Banco Bilbao Vizcaya Argentaria, S.A.
(1) According to CRR/CRD4 definition transitional arrangements as per reporting date. Figures as of 31/12/2013 computed as of first day of application:
01/01/2014.
Summary Adverse Scenario
ES - Banco Bilbao Vizcaya Argentaria, S.A.
http://www.economiaciudadana.org/
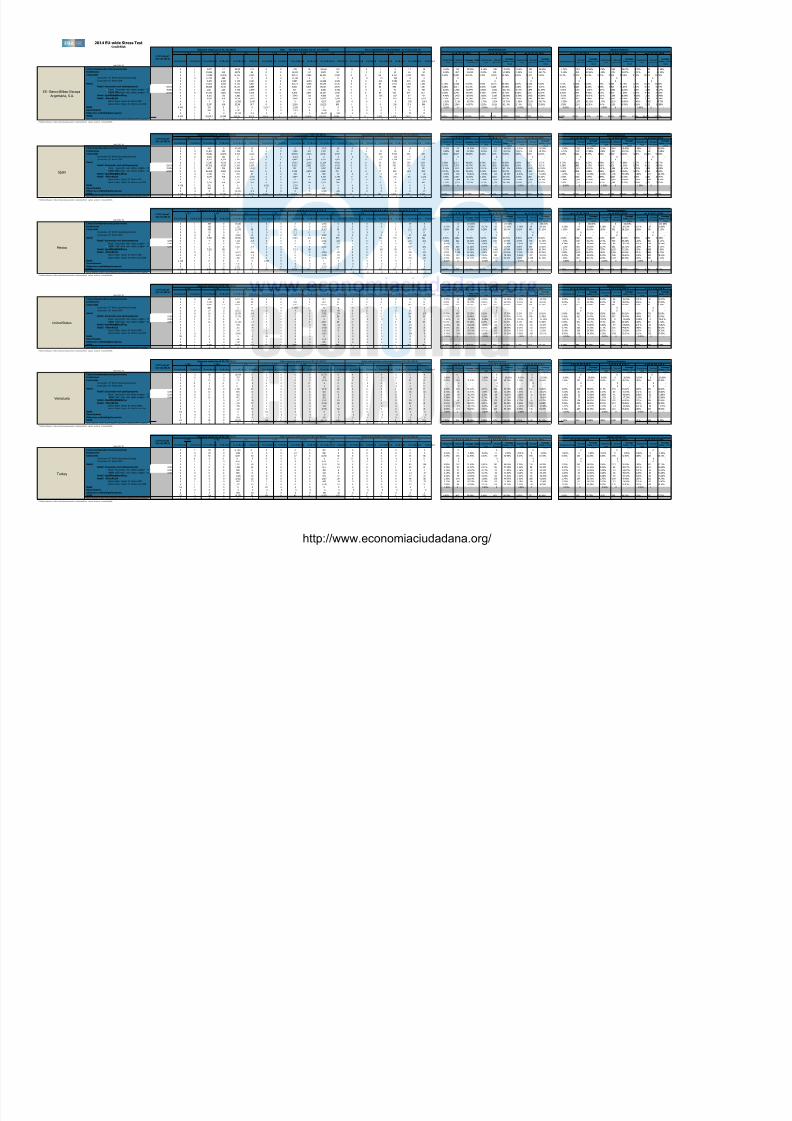
8/10/2019 Test Stress Banca Española 2014
http://slidepdf.com/reader/full/test-stress-banca-espanola-2014 19/240
2014 EU-wide Stress TestCredit Risk
(mln EUR, %)
No n-d ef aul t ed De fau lt e d No n-d ef aul t ed De fau lt e d No n-d ef aul t ed De fau lt e d No n-d ef aul t e d De fau lt e d No n-d ef aul t ed De fau lt e d No n-d ef aul t e d De fau lt e d No n-d ef aul t ed De fau lt e d No n-d ef aul t ed De fau lt e d No n-d ef aul t ed De fau lt e dImpairment
rate
Stockof
ProvisionsCoverage Ratio -
Default Stock
Impairment
rate
Stockof
Provisions
Coverage
Ratio-Default
Stock
Impairment
rate
Stockof
Provisions
Coverage
Ratio -Default
Stock
Impairment rateStockof
Provisions
Coverage
Ratio-Default
Stock
Impairment
rate
Stockof
Provisions
Coverage
Ratio-Default
Stock
Impairment
rate
Stockof
Provisions
Coverage
Ratio -Default
Stock
Central banksandcentral governments 0 0 3,077 37 96,387 125 0 0 178 36 20,666 122 0 0 2 0 77 18 0.14% 113 29.50% 0.14% 158 32.39% 0.14% 203 34.02% 0.73% 314 37.65% 0.76% 554 38.67% 0.75% 786 39.06%
Institutions 0 0 85,346 212 18,750 86 0 0 13,441 167 5,679 94 0 0 42 34 26 34 0.05% 267 31.26% 0.03% 301 27.89% 0.02% 318 26.07% 0.10% 313 27.61% 0.15% 476 23.57% 0.07% 551 22.33%
Corporates 0 0 79,189 10,455 69,552 2,551 0 0 48,140 7,084 66,706 2,509 0 0 550 6,167 1,225 928 0.44% 10,991 55.05% 0.40% 11,601 53.26% 0.35% 12,127 51.93% 0.63% 11,279 55.14% 0.81% 12,548 52.99% 0.70% 13,576 51.73%
Corporates -Of Which:SpecialisedLending 0 0 11,722 468 0 0 0 0 11,167 0 0 0 0 0 35 265 11 0 - 0 - - 0 - - 0 - - 0 - - 0 - - 0 -
Corporates -Of Which:SME 0 0 9,470 6,340 19,005 2,101 0 0 9,097 4,453 18,228 2,035 0 0 212 3,580 515 419 - 0 - - 0 - - 0 - - 0 - - 0 - - 0 -
Retail 0 0 83,013 4,696 93,552 5,657 0 0 20,129 3,269 50,159 6,125 0 0 489 1,077 1,572 3,398 1.10% 11,626 51.98% 0.95% 13,271 50.36% 0.87% 14,748 49.22% 1.45% 12,238 53.04% 1.59% 15,085 51.76% 1.28% 17,225 50.52%
Retail -Securedon real estateproperty 63.1% 0 0 68,364 4,106 50,180 2,889 0 0 9,621 3,015 19,010 3,574 0 0 82 594 746 1,383 0.28% 5,011 41.76% 0.20% 5,255 39.18% 0.18% 5,475 37.23% 0.46% 5,228 42.24% 0.55% 5,929 39.67% 0.41% 6,413 37.64%
Retail -Securedon real estate property- Of
h i h : S E70.8% 0 0 1,013 225 6,140 1,879 0 0 315 173 2,668 2,466 0 0 2 41 72 467 0.62% 1,765 62.94% 0.56% 1,806 61.93% 0.55% 1,845 61.07% 0.91% 1,786 63.01% 1.25% 1,892 62.20% 1.06% 1,965 61.17%
Retail -Securedon real estate property- Of
h i h: n n - E62.5% 0 0 67,352 3,881 44,040 1,010 0 0 9,306 2,842 16,342 1,108 0 0 80 553 674 917 0.26% 3,245 34.04% 0.18% 3,449 31.75% 0.16% 3,631 30.07% 0.43% 3,442 34.96% 0.51% 4,037 33.09% 0.37% 4,448 31.50%
Retail -QualifyingRevolving 0 0 9,101 172 6,082 105 0 0 7,540 110 4,598 102 0 0 365 167 87 97 4.46% 1,453 68.76% 3.86% 2,007 66.69% 3.54% 2,482 65.64% 5.15% 1,559 70.59% 5.05% 2,290 68.89% 4.05% 2,817 67.48%
Retail -OtherRetail 0 0 5,547 418 37,290 2,663 0 0 2,968 144 26,552 2,450 0 0 41 316 739 1,917 2.20% 5,162 63.29% 2.06% 6,009 60.53% 1.99% 6,790 58.78% 2.87% 5,451 64.88% 3.37% 6,866 63.08% 2.95% 7,995 61.68%
Retail -Other Retail -Of Which:SME 0 0 0 0 11,903 1,696 0 0 0 0 8,327 1,650 0 0 0 0 200 1,009 1.93% 2,198 62.07% 1.72% 2,394 59.71% 1.60% 2,569 58.07% 2.55% 2,272 63.12% 3.17% 2,630 60.98% 2.47% 2,892 59.73%
Retail -Other Retail -Of Which:non-SME 0 0 5,547 418 25,386 967 0 0 2,968 144 18,225 800 0 0 41 316 539 908 2.30% 2,964 64.37% 2.20% 3,616 61.14% 2.14% 4,221 59.24% 2.99% 3,180 66.38% 3.44% 4,236 64.56% 3.14% 5,103 62.89%
Equity 8,443 0 375 0 0 0 12,147 0 1,338 0 0 0 0 0 0 0 0 0 0.00% 0 - 0.00% 0 - 0.00% 0 - 0.00% 0 - 0.00% 0 - 0.00% 0 -
Securitisation 0 0 910 0 4,783 0 0 0 1,189 0 1,726 0 0 0 0 0 0 0
Othernon-credit obligation assets 0 0 0 0 27,139 256 0 0 0 0 28,037 245 0 0 0 0 70 75
TOTAL 8,443 0 251,911 15,400 310,164 8,675 12,147 0 84,414 10,556 172,973 9,096 0 0 1,083 7,279 2,970 4,453 0.58% 22,996 52.84% 0.49% 25,331 50.99% 0.44% 27,395 49.71% 0.82% 24,145 53.07% 0.93% 28,663 50.90% 0.76% 32,137 49.54%
Securitisation andre-securitisations positions deductedfrom capital * 0 0 0 0 0 0 0 0 0 0 0 0
(mln EUR, %) No n-d ef aul t ed De fau lt e d No n-d ef aul t ed De fau lt e d No n-d ef aul t ed De fau lt e d No n-d ef aul t e d De fau lt e d No n-d ef aul t ed De fau lt e d No n-d ef aul t e d De fau lt e d No n-d ef aul t ed De fau lt e d No n-d ef aul t ed De fau lt e d No n-d ef aul t ed De fau lt e d
Impairment
rate
Stockof
ProvisionsCoverage Ratio -
Default Stock
Impairment
rate
Stockof
Provisions
Coverage
Ratio-DefaultStock
Impairment
rate
Stockof
Provisions
Coverage
Ratio -DefaultStock
Impairment rate
Stockof
Provisions
Coverage
Ratio-DefaultStock
Impairment
rate
Stockof
Provisions
Coverage
Ratio-DefaultStock
Impairment
rate
Stockof
Provisions
Coverage
Ratio -DefaultStock
Central banksandcentral governments 0 0 413 0 47,909 55 0 0 15 0 3,070 60 0 0 1 0 10 0 0.20% 70 40.00% 0.20% 113 40.00% 0.20% 157 40.00% 1.06% 261 40.00% 1.06% 489 40.00% 1.06% 711 40.00%
Institutions 0 0 41,817 204 7,506 57 0 0 7,986 167 1,347 62 0 0 32 26 6 7 0.08% 188 31.58% 0.05% 212 29.24% 0.01% 218 28.78% 0.17% 232 27.88% 0.28% 367 24.01% 0.11% 418 23.38%
Corporates 0 0 48,181 10,033 8,814 2,116 0 0 30,951 7,015 8,646 2,097 0 0 494 5,936 366 476 0.52% 8,927 55.68% 0.42% 9,175 54.56% 0.32% 9,357 53.82% 0.85% 9,122 55.77% 0.99% 9,697 54.44% 0.65% 10,060 53.66%
Corporates -Of Which:SpecialisedLending 0 0 4,631 162 0 0 0 0 4,328 0 0 0 0 0 16 106 0 0 - 0 - - 0 - - 0 - - 0 - - 0 - - 0 -
Corporates -Of Which:SME 0 0 9,312 6,336 3,341 1,889 0 0 8,947 4,450 3,339 1,851 0 0 212 3,579 309 227 - 0 - - 0 - - 0 - - 0 - - 0 - - 0 -
Retail 0 0 75,187 4,528 24,442 4,215 0 0 12,595 3,155 11,104 4,953 0 0 126 922 289 2,079 0.38% 6,332 48.66% 0.29% 6,623 46.90% 0.24% 6,857 45.57% 0.71% 6,661 49.52% 0.78% 7,427 48.08% 0.57% 7,973 46.97%
Retail -Securedon real estateproperty 63.1% 0 0 67,912 4,089 14,966 2,360 0 0 9,431 3,002 5,376 3,103 0 0 82 591 228 819 0.19% 3,724 42.77% 0.13% 3,829 40.98% 0.10% 3,913 39.61% 0.38% 3,885 43.17% 0.42% 4,230 41.24% 0.27% 4,452 39.80%
Retail -Securedon real estate property- Of
h i h : S E70.8% 0 0 993 224 2,803 1,818 0 0 292 173 1,007 2,402 0 0 2 41 4 397 0.15% 1,571 63.27% 0.11% 1,575 62.72% 0.08% 1,578 62.26% 0.37% 1,579 63.25% 0.45% 1,596 62.51% 0.31% 1,608 61.95%
Retail -Securedon real estate property- Of
h i h: n n - E62.5% 0 0 66,918 3,865 12,163 543 0 0 9,139 2,829 4,368 701 0 0 79 550 223 422 0.19% 2,153 33.62% 0.13% 2,254 32.09% 0.10% 2,335 30.96% 0.38% 2,306 34.60% 0.42% 2,634 33.52% 0.27% 2,844 32.53%
Retail -QualifyingRevolving 0 0 1,740 21 758 61 0 0 200 9 569 57 0 0 3 16 1 40 0.60% 100 59.61% 0.50% 112 56.38% 0.45% 123 54.08% 1.03% 111 61.94% 1.03% 136 60.18% 0.86% 157 58.78%
Retail -OtherRetail 0 0 5,534 418 8,717 1,793 0 0 2,964 144 5,159 1,793 0 0 41 316 60 1,220 1.48% 2,507 60.20% 1.26% 2,681 58.16% 1.04% 2,821 56.66% 2.58% 2,665 61.94% 2.89% 3,060 61.18% 2.35% 3,365 60.41%
Retail -Other Retail -Of Which:SME 0 0 0 0 4,317 1,445 0 0 0 0 2,641 1,445 0 0 0 0 7 751 1.82% 1,489 62.11% 1.60% 1,555 60.48% 1.14% 1,600 59.39% 2.88% 1,535 63.33% 3.56% 1,681 62.66% 2.84% 1,790 62.00%
Retail -Other Retail -Of Which:non-SME 0 0 5,534 418 4,400 348 0 0 2,964 144 2,517 348 0 0 41 316 53 469 1.33% 1,018 57.25% 1.11% 1,126 54.88% 1.00% 1,221 53.11% 2.45% 1,130 59.92% 2.61% 1,380 59.32% 2.14% 1,575 58.57%
Equity 4,738 0 375 0 0 0 6,261 0 1,338 0 0 0 0 0 0 0 0 0 0.00% 0 - 0.00% 0 - 0.00% 0 - 0.00% 0 - 0.00% 0 - 0.00% 0 -
Securitisation 0 0 910 0 229 0 0 0 1,189 0 637 0 0 0 0 0 0 0
Othernon-credit obligation assets 0 0 0 0 10,441 230 0 0 0 0 6,909 221 0 0 0 0 0 17
TOTAL 4,738 0 166,883 14,765 99,340 6,673 6,261 0 54,074 10,337 31,713 7,394 0 0 652 6,885 670 2,580 0.33% 15,517 51.98% 0.26% 16,123 50.40% 0.20% 16,589 49.31% 0.65% 16,276 51.94% 0.73% 17,980 49.83% 0.52% 19,163 48.66%Securitisation andre-securitisations positions deductedfrom capital * 0 0 0 0 0 0 0 0 0 0 0 0
(mln EUR, %)No n-d ef aul t ed De fau lt e d No n-d ef aul t ed De fau lt e d No n-d ef aul t ed De fau lt e d No n-d ef aul t e d De fau lt e d No n-d ef aul t ed De fau lt e d No n-d ef aul t e d De fau lt e d No n-d ef aul t ed De fau lt e d No n-d ef aul t ed De fau lt e d No n-d ef aul t ed De fau lt e d
Impairment
rate
Stockof
ProvisionsCoverage Ratio -
Default Stock
Impairment
rate
Stockof
Provisions
CoverageRatio-Default
Stock
Impairment
rate
Stockof
Provisions
CoverageRatio -Default
Stock
Impairment rateStockof
Provisions
CoverageRatio-Default
Stock
Impairment
rate
Stockof
Provisions
CoverageRatio-Default
Stock
Impairment
rate
Stockof
Provisions
CoverageRatio -Default
Stock Central banksandcentral governments 0 0 347 0 17,682 0 0 0 2 0 1,153 0 0 0 0 0 27 0 - 0 100.00% - 0 100.00% - 0 100.00% - 0 100.00% - 0 100.00% - 0 100.00%
Institutions 0 0 185 0 2,210 0 0 0 24 0 1,059 0 0 0 0 0 8 0 0.27% 15 20.00% 0.17% 19 20.00% 0.19% 24 20.00% 0.30% 16 20.00% 0.26% 22 20.00% 0.26% 28 20.00%
Corporates 0 0 569 0 11,708 88 0 0 393 0 10,507 56 0 0 1 0 112 127 0.80% 340 41.40% 0.59% 410 38.54% 0.62% 483 37.20% 0.85% 346 40.96% 0.80% 443 38.22% 0.83% 540 37.39%
Corporates -Of Which:SpecialisedLending 0 0 23 0 0 0 0 0 2 1 0 0 0 0 0 0 0 1 1 0 - 0 - - 0 - - 0 - - 0 - - 0 - - 0 -
Corporates -Of Which:SME 0 0 31 0 3,903 71 0 0 47 0 3,502 44 0 0 0 0 47 102 - 0 - - 0 - - 0 - - 0 - - 0 - - 0 -
Retail 0 0 7,359 151 15,586 834 0 0 7,343 101 8,321 576 0 0 362 151 407 522 4.00% 2,882 65.28% 3.23% 3,568 62.20% 3.08% 4,179 60.22% 4.52% 3,002 66.50% 4.10% 3,867 63.21% 3.55% 4,556 61.06%
Retail -Securedon real estateproperty 0.0% 0 0 7 0 9,106 268 0 0 4 0 3,462 224 0 0 0 0 201 291 1.26% 622 38.36% 0.90% 699 34.09% 0.94% 776 31.49% 1.53% 647 39.29% 1.44% 769 35.28% 1.46% 886 33.20%
Retail -Securedon real estate property- Of
hi h: E0.0% 0 0 0 0 569 20 0 0 0 0 336 17 0 0 0 0 14 10 4.02% 62 75.42% 2.86% 77 72.47% 3.01% 93 70.68% 4.74% 66 78.96% 4.12% 88 76.30% 3.98% 108 74.18%
Retail -Securedon real estate property- Of
h i h : n n -S E0.0% 0 0 7 0 8,537 248 0 0 4 0 3,126 207 0 0 0 0 187 281 1.08% 560 36.10% 0.77% 622 31.70% 0.80% 683 29.02% 1.32% 581 36.86% 1.27% 682 32.71% 1.29% 779 30.59%
Retail -QualifyingRevolving 0 0 7,351 151 7 0 0 0 7,339 101 5 0 0 0 362 151 0 0 7.37% 1,061 71.86% 6.24% 1,468 69.74% 5.80% 1,808 68.74% 8.33% 1,131 73.62% 7.77% 1,632 71.23% 6.25% 1,985 70.00%
Retail -OtherRetail 0 0 1 0 6,473 566 0 0 0 0 4,854 352 0 0 0 0 206 231 4.00% 1,199 85.76% 3.29% 1,401 82.95% 3.34% 1,595 80.95% 4.38% 1,224 86.97% 3.95% 1,465 84.26% 3.81% 1,684 82.07%
Retail -Other Retail -Of Which:SME 0 0 0 0 1,613 119 0 0 0 0 1,209 74 0 0 0 0 22 88 3.10% 251 81.08% 2.49% 289 78.20% 2.56% 327 76.13% 3.57% 259 82.82% 3.22% 308 80.41% 3.10% 353 78.31%
Retail -Other Retail -Of Which:non-SME 0 0 1 0 4,860 447 0 0 0 0 3,645 277 0 0 0 0 185 143 4.30% 948 87.27% 3.56% 1,111 84.42% 3.60% 1,268 82.40% 4.65% 965 88.32% 4.19% 1,157 85.46% 4.05% 1,331 83.21%
Equity 1,116 0 0 0 0 0 1,353 0 0 0 0 0 0 0 0 0 0 0 0.00% 0 - 0.00% 0 - 0.00% 0 - 0.00% 0 - 0.00% 0 - 0.00% 0 -
Securitisation 0 0 0 0 7 0 0 0 0 0 0 58 0 0 0 0 0 0 0
Othernon-credit obligation assets 0 0 0 0 6,292 0 0 0 0 0 2,519 0 0 0 0 0 0 0
TOTAL 1,116 0 8,460 151 53,549 922 1,353 0 7,763 101 23,618 632 0 0 363 151 554 649 2.64% 3,237 61.49% 2.07% 3,997 58.40% 1.96% 4,686 56.43% 2.96% 3,364 62.43% 2.65% 4,331 59.07% 2.29% 5,124 56.97%
Securitisation andre-securitisations positions deductedfrom capital * 0 0 0 0 0 0 0 0 0 0 0 0
(mln EUR, %)No n-d ef aul t ed De fau lt e d No n-d ef aul t ed De fau lt e d No n-d ef aul t ed De fau lt e d No n-d ef aul t e d De fau lt e d No n-d ef aul t ed De fau lt e d No n-d ef aul t e d De fau lt e d No n-d ef aul t ed De fau lt e d No n-d ef aul t ed De fau lt e d No n-d ef aul t ed De fau lt e d
Impairment
rate
Stockof
ProvisionsCoverage Ratio -
Default Stock
Impairment
rate
Stockof
Provisions
CoverageRatio-Default
Stock
Impairment
rate
Stockof
Provisions
CoverageRatio -Default
Stock
Impairment rateStockof
Provisions
CoverageRatio-Default
Stock
Impairment
rate
Stockof
Provisions
CoverageRatio-Default
Stock
Impairment
rate
Stockof
Provisions
CoverageRatio -Default
Stock Central banksandcentral governments 0 0 591 0 6,172 66 0 0 1 0 991 58 0 0 0 0 24 15 0.00% 26 18.47% 0.00% 26 18.40% 0.00% 26 18.34% 0.00% 26 18.40% 0.00% 26 18.34% 0.00% 26 18.27%
Institutions 0 0 1,770 0 2,456 28 0 0 781 0 413 31 0 0 4 0 6 24 0.02% 35 44.13% 0.01% 35 43.03% 0.01% 36 42.15% 0.02% 35 43.78% 0.07% 39 39.90% 0.06% 41 37.05%
Corporates 0 0 4,056 12 23,973 91 0 0 2,757 0 22,804 95 0 0 8 3 197 19 0.14% 325 42.63% 0.10% 354 39.55% 0.09% 379 37.78% 0.22% 347 47.06% 0.48% 487 42.68% 0.35% 582 39.66%
Corporates -Of Which:SpecialisedLending 0 0 881 12 0 0 0 0 1 ,697 0 0 0 0 0 5 3 0 0 - 0 - - 0 - - 0 - - 0 - - 0 - - 0 -
Corporates -Of Which:SME 0 0 27 0 8,553 48 0 0 4 0 8,136 48 0 0 0 0 66 5 - 0 - - 0 - - 0 - - 0 - - 0 - - 0 -
Retail 0 0 16 0 15,554 204 0 0 3 0 7,783 174 0 0 0 0 296 105 0.39% 467 35.25% 0.31% 515 37.35% 0.29% 559 38.61% 0.49% 482 37.42% 0.83% 626 43.91% 0.68% 733 45.18%
Retail -Securedon real estateproperty 0.0% 0 0 15 0 11,128 117 0 0 3 0 4,327 89 0 0 0 0 66 66 0.22% 156 30.99% 0.15% 173 32.20% 0.14% 188 32.88% 0.30% 165 33.42% 0.63% 243 39.95% 0.48% 301 41.64%
Retail -Securedon real estate property- Of
hi h: E0.0% 0 0 0 0 0 0 0 0 0 0 0 0 0 0 0 0 0 0 0.21% 0 34.14% 0.15% 0 35.51% 0.14% 0 36.15% 0.27% 0 37.72% 0.57% 0 53.12% 0.45% 0 49.26%
Retail -Securedon real estate property- Of
h i h: n n - E0.0% 0 0 14 0 11,128 117 0 0 3 0 4,327 89 0 0 0 0 66 66 0.22% 156 30.99% 0.15% 173 32.20% 0.14% 188 32.88% 0.30% 165 33.42% 0.63% 243 39.94% 0.48% 301 41.64%
Retail -QualifyingRevolving 0 0 1 0 549 13 0 0 0 0 549 13 0 0 0 0 24 11 2.05% 50 63.64% 1.82% 60 63.91% 1.75% 69 64.00% 2.25% 51 64.97% 3.02% 67 65.80% 2.76% 81 65.81%
Retail -OtherRetail 0 0 1 0 3,877 74 0 0 0 0 2,908 72 0 0 0 0 206 28 0.65% 261 35.38% 0.56% 282 38.09% 0.53% 302 39.61% 0.77% 265 37.33% 1.11% 315 44.87% 0.96% 351 45.52%
Retail -Other Retail -Of Which:SME 0 0 0 0 1,441 73 0 0 0 0 1,081 71 0 0 0 0 73 28 0.42% 107 29.72% 0.34% 112 30.62% 0.31% 116 31.26% 0.53% 109 30.78% 0.87% 121 33.29% 0.72% 131 34.31%
Retail -Other Retail -Of Which:non-SME 0 0 1 0 2,436 1 0 0 0 0 1,827 1 0 0 0 0 134 0 0.79% 154 50.61% 0.69% 170 50.32% 0.66% 186 50.11% 0.91% 156 54.33% 1.25% 194 61.21% 1.11% 220 57.92%
Equity 99 0 0 0 0 0 316 0 0 0 0 0 0 0 0 0 0 0 0.00% 0 - 0.00% 0 - 0.00% 0 - 0.00% 0 - 0.00% 0 - 0.00% 0 -
Securitisation 0 0 0 0 4,484 0 0 0 0 0 1,031 0 0 0 0 0 0 0
Othernon-credit obligation assets 0 0 0 0 2,290 0 0 0 0 0 845 0 0 0 0 0 0 0
TOTAL 99 0 6,434 12 54,930 389 316 0 3,542 0 33,868 357 0 0 12 3 522 163 0.20% 852 36.61% 0.15% 930 37.03% 0.14% 999 37.22% 0.27% 890 39.27% 0.52% 1,177 41.91% 0.40% 1,383 41.34%
Securitisation andre-securitisations positions deductedfrom capital * 0 0 0 0 0 0 0 0 0 0 0 0
(mln EUR, %)No n-d ef aul t ed De fau lt e d No n-d ef aul t ed De fau lt e d No n-d ef aul t ed De fau lt e d No n-d ef aul t e d De fau lt e d No n-d ef aul t ed De fau lt e d No n-d ef aul t e d De fau lt e d No n-d ef aul t ed De fau lt e d No n-d ef aul t ed De fau lt e d No n-d ef aul t ed De fau lt e d
Impairment
rate
Stockof
ProvisionsCoverage Ratio -
Default Stock
Impairment
rate
Stockof
Provisions
CoverageRatio-Default
Stock
Impairment
rate
Stockof
Provisions
CoverageRatio -Default
Stock
Impairment rateStockof
Provisions
CoverageRatio-Default
Stock
Impairment
rate
Stockof
Provisions
CoverageRatio-Default
Stock
Impairment
rate
Stockof
Provisions
CoverageRatio -Default
Stock Central banksandcentral governments 0 0 58 0 10,829 0 0 0 0 0 10,772 0 0 0 0 0 0 0 - 0 - - 0 - - 0 - - 0 - - 0 - - 0 -
Institutions 0 0 3 0 727 0 0 0 1 0 379 0 0 0 0 0 0 0 0.00% 0 - 0.00% 0 20.00% 0.00% 0 20.00% 0.00% 0 20.00% 0.00% 0 20.00% 0.00% 0 20.00%
Corporates 0 0 15 0 3,732 52 0 0 6 0 3,678 52 0 0 0 0 81 44 0.83% 184 58.93% 1.74% 248 49.75% 1.74% 309 46.66% 1.16% 197 55.97% 2.87% 311 49.13% 2.87% 408 45.99%
Corporates -Of Which:SpecialisedLending 0 0 0 0 0 0 0 0 0 0 0 0 0 0 0 0 0 0 - 0 - - 0 - - 0 - - 0 - - 0 - - 0 -
Corporates -Of Which:SME 0 0 0 0 0 0 0 0 0 0 0 0 0 0 0 0 0 0 - 0 - - 0 - - 0 - - 0 - - 0 - - 0 -
Retail 0 0 15 0 6,819 87 0 0 5 0 4,845 85 0 0 0 0 135 73 2.39% 410 58.23% 3.39% 631 54.43% 3.31% 832 52.84% 2.95% 448 58.90% 4.44% 738 54.41% 4.32% 991 52.52%
Retail -Securedon real estateproperty 0.0% 0 0 13 0 896 11 0 0 4 0 403 11 0 0 0 0 18 10 0.71% 35 36.93% 1.49% 48 30.39% 1.47% 61 28.42% 1.03% 38 35.15% 2.47% 63 31.19% 2.42% 82 28.84%
Retail -Securedon real estate property- Of
hi h: E0.0% 0 0 0 0 423 5 0 0 0 0 201 5 0 0 0 0 9 5 1.13% 19 48.39% 2.39% 29 43.17% 2.35% 38 41.49% 1.65% 22 47.39% 3.95% 41 46.99% 3.88% 55 43.89%
Retail -Securedon real estate property- Of
h i h : n n -S E0.0% 0 0 13 0 472 6 0 0 4 0 202 6 0 0 0 0 9 5 0.34% 16 26.74% 0.71% 19 19.15% 0.70% 22 16.95% 0.49% 17 24.30% 1.17% 22 17.33% 1.15% 27 15.66%
Retail -QualifyingRevolving 0 0 1 0 1,417 18 0 0 0 0 1,062 18 0 0 0 0 28 15 3.09% 98 66.90% 4.28% 156 63.76% 4.17% 208 62.25% 3.82% 108 68.82% 5.50% 182 64.69% 5.32% 246 62.84%
Retail -OtherRetail 0 0 1 0 4,506 57 0 0 0 0 3,380 56 0 0 0 0 89 48 2.51% 277 58.59% 3.50% 427 55.45% 3.43% 563 54.08% 3.06% 302 59.60% 4.51% 493 55.84% 4.39% 663 54.29%
Retail -Other Retail -Of Which:SME 0 0 0 0 299 4 0 0 0 0 224 4 0 0 0 0 6 3 1.37% 14 47.31% 2.04% 20 43.24% 2.02% 26 41.68% 1.70% 15 47.17% 2.74% 23 42.89% 2.69% 30 41.36%
Retail -Other Retail -Of Which:non-SME 0 0 1 0 4,207 53 0 0 0 0 3,155 52 0 0 0 0 83 45 2.59% 263 59.25% 3.61% 407 56.15% 3.53% 538 54.79% 3.16% 287 60.33% 4.64% 470 56.60% 4.52% 633 55.06%
Equity 63 0 0 0 0 0 120 0 0 0 0 0 0 0 0 0 0 0 0.00% 0 - 0.00% 0 - 0.00% 0 - 0.00% 0 - 0.00% 0 - 0.00% 0 -
Securitisation 0 0 0 0 0 0 0 0 0 0 0 0 0 0 0 0 0 0
Othernon-credit obligation assets 0 0 0 0 916 6 0 0 0 0 437 5 0 0 0 0 0 0
TOTAL 63 0 92 0 23,023 144 120 0 12 0 20,111 142 0 0 0 0 216 116 1.71% 594 58.42% 2.59% 879 53.17% 2.53% 1,140 51.16% 2.15% 645 58.08% 3.59% 1,050 52.83% 3.49% 1,399 50.53%Securitisation andre-securitisations positions deductedfrom capital * 0 0 0 0 0 0 0 0 0 0 0 0
(mln EUR, %)No n-d ef aul t ed De fau lt e d No n-d ef aul t ed De fau lt e d No n-d ef aul t ed De fau lt e d No n-d ef aul t e d De fau lt e d No n-d ef aul t ed De fau lt e d No n-d ef aul t e d De fau lt e d No n-d ef aul t ed De fau lt e d No n-d ef aul t ed De fau lt e d No n-d ef aul t ed De fau lt e d
Impairment
rate
Stockof
ProvisionsCoverage Ratio -
Default Stock
Impairment
rate
Stockof
Provisions
CoverageRatio-Default
Stock
Impairment
rate
Stockof
Provisions
CoverageRatio -Default
Stock
Impairment rateStockof
Provisions
CoverageRatio-Default
Stock
Impairment
rate
Stockof
Provisions
CoverageRatio-Default
Stock
Impairment
rate
Stockof
Provisions
CoverageRatio -Default
Stock Central banksandcentral governments 0 0 121 0 4 ,756 0 0 0 2 0 957 0 0 0 0 0 0 0 - 0 - - 0 - - 0 - - 0 - - 0 - - 0 -
Institutions 0 0 39 0 1,098 0 0 0 13 0 256 0 0 0 0 0 0 0 0.01% 0 1.00% 0.01% 0 1.05% 0.01% 0 1.03% 0.01% 0 1.00% 0.01% 0 1.03% 0.01% 0 1.02%
Corporates 0 0 53 0 6,244 30 0 0 27 0 6,240 32 0 0 0 0 53 68 0.29% 155 62.94% 0.32% 175 52.98% 0.32% 195 47.70% 0.45% 164 61.28% 0.48% 194 52.43% 0.46% 222 48.13%
Corporates -Of Which:SpecialisedLending 0 0 0 0 0 0 0 0 0 0 0 0 0 0 0 0 0 0 - 0 - - 0 - - 0 - - 0 - - 0 - - 0 -
Corporates -Of Which:SME 0 0 0 0 6 05 0 0 0 0 0 6 05 0 0 0 0 0 0 0 - 0 - - 0 - - 0 - - 0 - - 0 - - 0 -
Retail 0 0 0 0 5,185 48 0 0 0 0 3,403 54 0 0 0 0 85 108 0.80% 247 55.69% 0.81% 287 48.04% 0.78% 326 44.26% 1.05% 260 56.83% 1.06% 313 50.24% 1.00% 362 47.11%
Retail -Securedon real estateproperty 0.0% 0 0 0 0 1,496 13 0 0 0 0 614 14 0 0 0 0 23 29 0.15% 53 63.07% 0.17% 56 57.99% 0.16% 58 54.33% 0.27% 55 63.34% 0.29% 60 59.07% 0.28% 64 56.25%
Retail -Securedon real estate property- Of
hi h: E0.0% 0 0 0 0 600 5 0 0 0 0 300 6 0 0 0 0 9 11 0.15% 21 63.07% 0.17% 22 57.99% 0.16% 23 54.33% 0.27% 22 63.34% 0.29% 24 59.07% 0.28% 26 56.25%
Retail -Securedon real estate property- Of
h i h: n n - E0.0% 0 0 0 0 896 8 0 0 0 0 314 8 0 0 0 0 14 17 0.15% 32 63.07% 0.17% 33 57.99% 0.16% 35 54.33% 0.27% 33 63.34% 0.29% 36 59.07% 0.28% 38 56.25%
Retail -QualifyingRevolving 0 0 0 0 1,266 10 0 0 0 0 973 11 0 0 0 0 17 22 0.50% 49 61.85% 0.52% 56 53.02% 0.52% 62 48.29% 0.66% 51 62.32% 0.68% 59 54.42% 0.66% 68 50.36%
Retail -OtherRetail 0 0 0 0 2,422 26 0 0 0 0 1,817 29 0 0 0 0 46 58 1.35% 144 52.14% 1.38% 176 44.87% 1.33% 206 41.60% 1.74% 154 53.71% 1.75% 194 47.46% 1.67% 231 44.73%
Retail -Other Retail -Of Which:SME 0 0 0 0 891 13 0 0 0 0 668 14 0 0 0 0 23 29 0.17% 60 81.03% 0.19% 62 75.68% 0.18% 64 71.46% 0.25% 61 80.17% 0.27% 63 74.56% 0.26% 66 70.43%
Retail -Other Retail -Of Which:non-SME 0 0 0 0 1,531 13 0 0 0 0 1,148 14 0 0 0 0 23 29 2.04% 84 42.90% 2.11% 114 38.32% 2.10% 142 36.50% 2.61% 93 45.58% 2.67% 131 41.83% 2.62% 165 40.36%
Equity 53 0 0 0 0 0 103 0 0 0 0 0 0 0 0 0 0 0 0.00% 0 - 0.00% 0 - 0.00% 0 - 0.00% 0 - 0.00% 0 - 0.00% 0 -
Securitisation 0 0 0 0 0 0 0 0 0 0 0 0 0 0 0 0 0 0
Othernon-credit obligation assets 0 0 0 0 976 18 0 0 0 0 194 16 0 0 0 0 0 0
TOTAL 53 0 214 0 18,258 95 103 0 42 0 11,052 102 0 0 0 0 139 176 0.47% 402 56.88% 0.49% 463 48.08% 0.47% 521 43.68% 0.65% 425 56.78% 0.67% 508 49.03% 0.63% 585 45.37%
Securitisation andre-securitisations positions deductedfrom capital * 0 0 0 0 0 0 0 0 0 0 0 0
as of 31/12/2016 as of 31/12/2014 as of 31/12/2015 as of 31/12/2016
Turkey
F-IRB A-IRB STA a s of 3 1/ 12 /2 01 4 a s of 3 1/ 12 /2 01 5LTV %(asof
31/12/2013)
Exposure values (as of 31/12/2013) Risk exposure amounts (as of 31/12/2013) Value adjustments and provisions (as of 31/12/2013) Baseline Scenario Adverse Scenario
F-IRB A-IRB STA F-IRB A-IRB STA
LTV %(asof
31/12/2013)
Exposure values (as of 31/12/2013) Risk exposure amounts (as of 31/12/2013) Value adjustments and provisions (as of 31/12/2013) Baseline Scenario Adverse Scenario
F-IRB A-IRB STA F-IRB A-IRB STA F-IRB a sof 31 /12 /2 01 4 a so f3 1/ 12 /2 01 5 a sof 31 /12 /2 01 6 A-IRB STA a sof 31 /1 2/ 20 14 a so f3 1/ 12 /2 01 5 a sof 31 /12 /2 01 6
LTV %(asof
31/12/2013)
Exposure values (as of 31/12/2013) Risk exposure amounts (as of 31/12/2013) Value adjustments and provisions (as of 31/12/2013) Baseline Scenario Adverse Scenario
F-IRB A-IRB STA F-IRB A-IRB STA F-IRB A-IRB a s of 3 1/ 12 /2 01 5 a s of 3 1/ 12 /2 01 6STA as of 31/12/2014 as of 31/12/2015 as of 31/12/2016 as of 31/12/2014
Risk exposureamounts(as of31/12/2013)
Baseline Scenario Adverse Scenario
F-IRB A-IRB STA F-IRB A-IRB STA F-IRB A-IRB STA as of 31/12/2014 as of 31/12/2015 as of 31/12/2016 as of 31/12/2014 as of 31/12/2015 as of 31/12/2016
asof 31/12/2016
Spain
LTV %(asof
31/12/2013)
E xp os ur e va lu es ( as of 3 1/ 12 /2 01 3) R is k e xp os ur e am ou nt s (a s of 3 1/ 12 /2 01 3) V al ue a dj us tm en ts a nd pr ov is io ns ( as o f3 1/ 12 /2 01 3)
AdverseScenario
F-IRB A-IRB STA F-IRB A-IRB STA F-IRB A-IRB STA as of 31/12/2014 as of 31/12/2015 as of 31/12/2016 as of 31/12/2014 as of 31/12/2015 as of 31/12/2016LTV %(asof
31/12/2013)
Exposurevalues(as of31/12/2013)
ES - Banco Bilbao Vizcaya
Argentaria, S.A.
(*)Referstothepart ofSecuritizationexposurethat isdeductedfrom capital andisnot includedinRWA
Valueadjustmentsand provisions(asof 31/12/2013) BaselineScenario
LTV %(asof
31/12/2013)
Exposure values (as of 31/12/2013) Risk exposure amounts (as of 31/12/2013) Value adjustments and provisions (as of 31/12/2013) Adverse Scenario
F-IRB A-IRB STA F-IRB A-IRB STA F-IRB A-IRB STA
BaselineScenario
as of 31/12/2014 as of 31/12/2015 as of 31/12/2016 as of 31/12/2014 as of 31/12/2015
(*)Referstothepart ofSecuritizationexposurethat isdeductedfrom capital andisnot includedinRWA
(*)Referstothepart ofSecuritizationexposurethat isdeductedfrom capital andisnot includedinRWA
(*)Referstothepart ofSecuritizationexposurethat isdeductedfrom capital andisnot includedinRWA
(*)Referstothepart ofSecuritizationexposurethat isdeductedfrom capital andisnot includedinRWA
(*)Referstothepart ofSecuritizationexposurethat isdeductedfrom capital andisnot includedinRWA
Mexico
United States
Venezuela
http://www.economiaciudadana.org/

8/10/2019 Test Stress Banca Española 2014
http://slidepdf.com/reader/full/test-stress-banca-espanola-2014 20/240

8/10/2019 Test Stress Banca Española 2014
http://slidepdf.com/reader/full/test-stress-banca-espanola-2014 21/240
2014 EU-wide Stress Test
P&L
(mln EUR) 31/12/2014 31/12/2015 31/12/2016 31/12/2014 31/12/2015 31/12/2016
Net interest income 14,613 14,279 13,433 13,637 14,613 13,166 12,586
Net trading income -171 155 318 -395 21 229
of which trading losses from stress scenarios -815 -489 -326 -1,040 -624 -416
Other operating income -699 -701 -763 -890 -704 -814 -949
Operating profit before impairments 9,266 6,994 6,414 6,657 6,907 5,785 5,289
Impairment of financial assets (-) -6,705 -6,590 -2,342 -2,072 -7,752 -4,555 -3,534
Impairment of financial assets other than instruments designated at fair value
through P&L (-)-6,669 -6,590 -2,342 -2,072 -7,752 -4,555 -3,534
Impairment Financial assets designated at fair value through P&L (-) -36 0 0 0 0 0 0
Impairment on non financial assets (-) -1,043 0 0 0 -20 -12 -8
Operating profit after impairments from stress scenarios 1,518 403 4,072 4,585 -865 1,218 1,748
Other Income and expenses 544 930 926 928 930 926 928
Pre-Tax profit 2,061 1,334 4,998 5,513 65 2,144 2,676
Tax 244 -400 -1,499 -1,654 -20 -643 -803
Net income 2,305 933 3,499 3,859 46 1,501 1,873
Attributable to owners of the parent 1,552 295 3,001 3,365 -499 1,275 1,666
of which carried over to capital through retained earnings 819 200 1,703 1,614 -499 954 1,248
of which distributed as dividends 733 95 1,298 1,751 0 321 418
In the figures above, the original (official published) 2013 P&L figures may have been adjusted as part of the ECB Comprehensive Assessment join-up calculation.
31/12/2013
Baseline Scenario Adverse Scenario
http://www.economiaciudadana.org/

8/10/2019 Test Stress Banca Española 2014
http://slidepdf.com/reader/full/test-stress-banca-espanola-2014 22/240
2014 EU-wide Stress Test
RWA
(mln EUR)as of 31/12/2013 as of 31/12/2014 as of 31/12/2015 as of 31/12/2016 as of 31/12/2014 as of 31/12/2015 as of 31/12/2016
Risk exposure amount for credit risk 289,273 298,807 300,763 302,290 307,697 318,167 321,186
Risk exposure amount Securitisation and re-securitisations 3,001 4,165 4,864 5,328 6,908 9,252 10,812
Risk exposure amount Other credit risk 286,271 294,641 295,900 296,962 300,789 308,915 310,374
Risk exposure amount for market risk 25,212 25,356 25,503 25,745 29,210 29,357 29,599
Risk exposure amount for operational risk 30,256 30,256 30,256 30,256 30,256 30,256 30,256
Transitional floors for Risk exposure amount 0 0 0 0 0 0 0
AQR adjustments (for SSM countries only) 300 300 300 300 300 300 300
Total Risk exposure amount 345,041 354,719 356,823 358,592 367,463 378,080 381,341
Baseline Scenario Adverse Scenario
http://www.economiaciudadana.org/

8/10/2019 Test Stress Banca Española 2014
http://slidepdf.com/reader/full/test-stress-banca-espanola-2014 23/240
(mln EUR) as of 31/12/2013 31/12/2014 31/12/2015 31/12/2016 31/12/2014 31/12/2015 31/12/2016
Banking Book 5,619
Trading Book (excl. correlation trading positions under CRM) 224
Correlation Trading Portfolio (CRM) 0
Total 5,844
Banking Book 2,915 4,019 4,681 5,121 6,658 8,905 10,400
Trading Book (excl. correlation trading positions under CRM) 86 147 183 207 249 347 412
Total 3,001 4,165 4,864 5,328 6,908 9,252 10,812
Hold to Maturity porfolio 0 0 0 0 0 0 0
Available for Sale porfolio 542 556 562 571 568 606 665
Held for trading portfolio
Total 542 556 562 571 568 606 665
2014 EU-wide Stress Test
Impairments
Baseline scenario Adverse scenario
Exposure values
Risk exposure values
Securitisation
http://www.economiaciudadana.org/

8/10/2019 Test Stress Banca Española 2014
http://slidepdf.com/reader/full/test-stress-banca-espanola-2014 24/240
2014 EU-wide Stress Test - Sovereign Exposure
(mln EUR)
[ 0 - 3M [ 2 0 2 0 0 2 0 0 0 0 0 0 0 0
[ 3M - 1Y [ 1 0 1 0 0 1 0 0 0 0 3 0 4 0
[ 1Y - 2Y [ 0 0 0 0 0 0 0 0 0 0 87 0 87 0
[ 2Y - 3Y [ 6 0 6 4 0 1 0 0 0 0 15 0 7 0
[3Y - 5Y [ 0 0 0 0 0 0 0 0 0 0 0 0 0 0
[5Y - 10Y [ 7 0 1 0 0 1 0 0 0 0 0 0 0 0
[10Y - more 2 0 2 0 0 2 0 0 0 0 0 0 0 0
Tot 17 0 10 4 0 6 0 0 0 0 104 0 98 0
[ 0 - 3M [ 3 0 3 0 0 3 0 0 0 0 0 0 0 0
[ 3M - 1Y [ 96 0 17 4 0 14 0 0 0 0 1 0 1 0
[ 1Y - 2Y [ 115 0 108 19 0 89 0 0 0 0 65 0 65 0
[ 2Y - 3Y [ 7 0 -47 0 0 -47 0 0 0 0 22 0 22 0
[3Y - 5Y [ 44 0 37 15 0 22 0 0 0 0 192 2 240 -1
[5Y - 10Y [ 11 0 -80 0 0 -80 0 0 0 0 532 14 597 -7
[10Y - more 52 33 44 0 0 11 0 0 0 0 0 0 0 0
Tot 327 33 82 38 0 11 0 0 0 0 811 17 924 -9
[ 0 - 3M [ 0 0 0 0 0 0 0 0 0 0 0 0 0 0
[ 3M - 1Y [ 0 0 0 0 0 0 0 0 0 0 0 0 0 0
[ 1Y - 2Y [ 0 0 0 0 0 0 0 0 0 0 0 0 0 0
[ 2Y - 3Y [ 0 0 0 0 0 0 0 0 0 0 0 0 0 0
[3Y - 5Y [ 0 0 0 0 0 0 0 0 0 0 0 0 0 0
[5Y - 10Y [ 0 0 0 0 0 0 0 0 0 0 0 0 0 0[10Y - more 0 0 0 0 0 0 0 0 0 0 0 0 0 0
Tot 0 0 0 0 0 0 0 0 0 0 0 0 0 0
[ 0 - 3M [ 0 0 0 0 0 0 0 0 0 0 0 0 0 0
[ 3M - 1Y [ 0 0 0 0 0 0 0 0 0 0 0 0 0 0
[ 1Y - 2Y [ 0 0 0 0 0 0 0 0 0 0 0 0 0 0
[ 2Y - 3Y [ 0 0 0 0 0 0 0 0 0 0 0 0 0 0
[3Y - 5Y [ 0 0 0 0 0 0 0 0 0 0 0 0 0 0
[5Y - 10Y [ 0 0 0 0 0 0 0 0 0 0 0 0 0 0
[10Y - more 0 0 0 0 0 0 0 0 0 0 0 0 0 0
Tot 0 0 0 0 0 0 0 0 0 0 0 0 0 0
[ 0 - 3M [ 0 0 0 0 0 0 0 0 0 0 0 0 0 0
[ 3M - 1Y [ 0 0 0 0 0 0 0 0 0 0 0 0 0 0
[ 1Y - 2Y [ 0 0 0 0 0 0 0 0 0 0 0 0 0 0
[ 2Y - 3Y [ 0 0 0 0 0 0 0 0 0 0 22 0 22 0
[3Y - 5Y [ 0 0 0 0 0 0 0 0 0 0 0 0 0 0
[5Y - 10Y [ 0 0 0 0 0 0 0 0 0 0 0 0 0 0
[10Y - more 0 0 0 0 0 0 0 0 0 0 0 0 0 0
Tot 1 0 1 0 0 1 0 0 0 0 22 0 22 0
[ 0 - 3M [ 39 0 29 0 0 29 0 0 0 0 47 0 44 0
[ 3M - 1Y [ 627 0 601 0 0 601 0 0 0 0 12 0 13 0
[ 1Y - 2Y [ 154 0 154 0 0 154 0 0 0 0 183 0 246 0
[ 2Y - 3Y [ 0 0 -220 0 0 -220 0 0 0 0 1 0 3 0
[3Y - 5Y [ 10 0 -12 0 0 -12 0 0 0 0 65 1 123 -1
[5Y - 10Y [ 35 0 -6 0 0 -6 0 0 0 0 10 1 40 -1
[10Y - more 10 0 -3 0 0 -3 0 0 0 0 0 0 0 0
Tot 874 0 543 0 0 543 0 0 0 0 318 2 468 -2
Residual Maturity Country / Region
GROSS DIRECT LONG
EXPOSURES(accounting value gross
of provisions)
(1)
NET DIRECT POSITIONS (gross exposures (long) net of cash short
positions of sovereign debt to other counterpaties only where there
is a maturity matching)
(1)
DIRECT SOVEREIGN EXPOSURES IN DERIVATIVES (1)
of which: loans
and advances
of which: AFS
banking book
of which: FVO
(designated at fair
value through
profit&loss)
banking book
of which: Financialassets held for
trading
(2)
Derivatives with positive fair value at
31/12/2013
Derivatives with negative fair value at
31/12/2013
Derivatives with positive fair value
at 31/12/2013
Derivatives with negative fair
value at 31/12/2013
VALUES AS OF 31/12/2013 VALUES AS OF 31/12/2013 VALUES AS OF 31/12/2013
INDIRECT SOVEREIGN EXPOSURES (3) (on and off balance sheet)
Fair-value at
31/12/2013 (+)Notional value
Fair-value at
31/12/2013 (-)Notional value
Fair-value at
31/12/2013 (+)Notional value
Fair-value at 31/12/2013
(-)
Austria
Belgium
Bulgaria
Cyprus
Notional value
Czech Republic
Denmark
Estonia
Finland
France
http://www.economiaciudadana.org/

8/10/2019 Test Stress Banca Española 2014
http://slidepdf.com/reader/full/test-stress-banca-espanola-2014 25/240
2014 EU-wide Stress Test - Sovereign Exposure
(mln EUR)
Residual Maturity Country / Region
GROSS DIRECT LONG
EXPOSURES(accounting value gross
of provisions)
(1)
NET DIRECT POSITIONS (gross exposures (long) net of cash short
positions of sovereign debt to other counterpaties only where there
is a maturity matching)
(1)
DIRECT SOVEREIGN EXPOSURES IN DERIVATIVES (1)
of which: loans
and advances
of which: AFS
banking book
of which: FVO
(designated at fairvalue through
profit&loss)
banking book
of which: Financialassets held for
trading
(2)
Derivatives with positive fair value at
31/12/2013
Derivatives with negative fair value at
31/12/2013
Derivatives with positive fair value
at 31/12/2013
Derivatives with negative fair
value at 31/12/2013
VALUES AS OF 31/12/2013 VALUES AS OF 31/12/2013 VALUES AS OF 31/12/2013
INDIRECT SOVEREIGN EXPOSURES (3) (on and off balance sheet)
Fair-value at
31/12/2013 (+)Notional value
Fair-value at
31/12/2013 (-)Notional value
Fair-value at
31/12/2013 (+)Notional value
Fair-value at 31/12/2013
(-)Notional value
[ 0 - 3M [ 41 0 39 0 0 39 0 0 0 0 163 0 163 0
[ 3M - 1Y [ 612 0 578 0 0 578 0 0 0 0 0 0 0 0
[ 1Y - 2Y [ 6 0 -412 0 0 -412 0 0 0 0 131 0 131 0
[ 2Y - 3Y [ 94 0 -30 0 0 -30 0 0 0 0 0 0 0 0
[3Y - 5Y [ 42 0 -9 0 0 -9 0 0 0 0 219 0 255 -1
[5Y - 10Y [ 247 0 136 0 0 136 0 0 0 0 0 0 0 0
[10Y - more 22 0 21 0 0 21 0 0 0 0 0 0 0 0
Tot 1,064 0 322 0 0 322 0 0 0 0 512 0 549 -1
[ 0 - 3M [ 0 0 0 0 0 0 0 0 0 0 0 0 0 0
[ 3M - 1Y [ 0 0 0 0 0 0 0 0 0 0 0 0 0 0
[ 1Y - 2Y [ 0 0 0 0 0 0 0 0 0 0 0 0 0 0
[ 2Y - 3Y [ 0 0 0 0 0 0 0 0 0 0 0 0 0 0
[3Y - 5Y [ 0 0 0 0 0 0 0 0 0 0 0 0 0 0
[5Y - 10Y [ 0 0 0 0 0 0 0 0 0 0 0 0 0 0
[10Y - more 0 0 0 0 0 0 0 0 0 0 0 0 0 0
Tot 0 0 0 0 0 0 0 0 0 0 0 0 0 0
[ 0 - 3M [ 0 0 0 0 0 0 0 0 0 0 0 0 0 0
[ 3M - 1Y [ 0 0 0 0 0 0 0 0 0 0 0 0 0 0
[ 1Y - 2Y [ 0 0 0 0 0 0 0 0 0 0 0 0 0 0
[ 2Y - 3Y [ 0 0 0 0 0 0 0 0 0 0 0 0 0 0
[3Y - 5Y [ 0 0 0 0 0 0 0 0 0 0 0 0 0 0
[5Y - 10Y [ 0 0 0 0 0 0 0 0 0 0 0 0 0 0[10Y - more 0 0 0 0 0 0 0 0 0 0 0 0 0 0
Tot 0 0 0 0 0 0 0 0 0 0 0 0 0 0
[ 0 - 3M [ 0 0 0 0 0 0 0 0 0 0 0 0 0 0
[ 3M - 1Y [ 0 0 0 0 0 0 0 0 0 0 0 0 0 0
[ 1Y - 2Y [ 0 0 0 0 0 0 0 0 0 0 1 0 3 0
[ 2Y - 3Y [ 20 0 20 20 0 0 0 0 0 0 0 0 0 0
[3Y - 5Y [ 6 0 6 6 0 0 0 0 0 0 0 0 0 0
[5Y - 10Y [ 39 0 39 39 0 0 0 0 0 0 0 0 0 0
[10Y - more 0 0 0 0 0 0 0 0 0 0 0 0 0 0
Tot 65 0 65 65 0 0 0 0 0 0 1 0 3 0
[ 0 - 3M [ 0 0 0 0 0 0 0 0 0 0 0 0 0 0
[ 3M - 1Y [ 0 0 0 0 0 0 0 0 0 0 0 0 0 0
[ 1Y - 2Y [ 0 0 0 0 0 0 0 0 0 0 0 0 0 0
[ 2Y - 3Y [ 0 0 0 0 0 0 0 0 0 0 0 0 0 0
[3Y - 5Y [ 0 0 0 0 0 0 0 0 0 0 0 0 0 0
[5Y - 10Y [ 0 0 0 0 0 0 0 0 0 0 0 0 0 0
[10Y - more 0 0 0 0 0 0 0 0 0 0 0 0 0 0
Tot 0 0 0 0 0 0 0 0 0 0 0 0 0 0
[ 0 - 3M [ 0 0 0 0 0 0 0 0 0 0 11 0 11 0
[ 3M - 1Y [ 0 0 0 0 0 0 0 0 0 0 11 0 11 0
[ 1Y - 2Y [ 0 0 0 0 0 0 0 0 0 0 0 0 0 0
[ 2Y - 3Y [ 0 0 0 0 0 0 0 0 0 0 0 0 0 0
[3Y - 5Y [ 0 0 0 0 0 0 0 0 0 0 0 0 0 0
[5Y - 10Y [ 0 0 0 0 0 0 0 0 0 0 0 0 0 0
[10Y - more 0 0 0 0 0 0 0 0 0 0 0 0 0 0
Tot 0 0 0 0 0 0 0 0 0 0 22 0 22 0
[ 0 - 3M [ 71 6 47 0 0 41 0 0 0 0 0 0 0 0
[ 3M - 1Y [ 275 0 228 6 0 222 0 0 0 0 8 0 7 0
[ 1Y - 2Y [ 495 4 220 359 0 -143 0 0 0 0 794 1 855 -1
[ 2Y - 3Y [ 1,121 4 1,019 1,117 0 -102 0 0 0 0 216 0 197 0
[3Y - 5Y [ 495 0 454 426 0 29 0 0 0 0 194 2 245 -3
[5Y - 10Y [ 500 77 295 283 0 -64 0 0 0 0 325 15 392 -20
[10Y - more 557 0 504 500 0 4 0 0 0 0 21 1 54 -1
Tot 3,514 91 2,769 2,691 0 -13 0 0 0 0 1,558 19 1,751 -25
[ 0 - 3M [ 0 0 0 0 0 0 0 0 0 0 0 0 0 0
[ 3M - 1Y [ 0 0 0 0 0 0 0 0 0 0 0 0 0 0
[ 1Y - 2Y [ 0 0 0 0 0 0 0 0 0 0 0 0 0 0
[ 2Y - 3Y [ 0 0 0 0 0 0 0 0 0 0 0 0 0 0
[3Y - 5Y [ 0 0 0 0 0 0 0 0 0 0 0 0 0 0
[5Y - 10Y [ 0 0 0 0 0 0 0 0 0 0 0 0 0 0
[10Y - more 0 0 0 0 0 0 0 0 0 0 0 0 0 0
Tot 0 0 0 0 0 0 0 0 0 0 0 0 0 0
Latvia
Germany
Greece
Hungary
Iceland
Ireland
Italy
Croatia
Liechtenstein
http://www.economiaciudadana.org/

8/10/2019 Test Stress Banca Española 2014
http://slidepdf.com/reader/full/test-stress-banca-espanola-2014 26/240
2014 EU-wide Stress Test - Sovereign Exposure
(mln EUR)
Residual Maturity Country / Region
GROSS DIRECT LONG
EXPOSURES(accounting value gross
of provisions)
(1)
NET DIRECT POSITIONS (gross exposures (long) net of cash short
positions of sovereign debt to other counterpaties only where there
is a maturity matching)
(1)
DIRECT SOVEREIGN EXPOSURES IN DERIVATIVES (1)
of which: loans
and advances
of which: AFS
banking book
of which: FVO
(designated at fairvalue through
profit&loss)
banking book
of which: Financialassets held for
trading
(2)
Derivatives with positive fair value at
31/12/2013
Derivatives with negative fair value at
31/12/2013
Derivatives with positive fair value
at 31/12/2013
Derivatives with negative fair
value at 31/12/2013
VALUES AS OF 31/12/2013 VALUES AS OF 31/12/2013 VALUES AS OF 31/12/2013
INDIRECT SOVEREIGN EXPOSURES (3) (on and off balance sheet)
Fair-value at
31/12/2013 (+)Notional value
Fair-value at
31/12/2013 (-)Notional value
Fair-value at
31/12/2013 (+)Notional value
Fair-value at 31/12/2013
(-)Notional value
[ 0 - 3M [ 0 0 0 0 0 0 0 0 0 0 0 0 0 0
[ 3M - 1Y [ 0 0 0 0 0 0 0 0 0 0 0 0 0 0
[ 1Y - 2Y [ 0 0 0 0 0 0 0 0 0 0 0 0 0 0
[ 2Y - 3Y [ 0 0 0 0 0 0 0 0 0 0 0 0 0 0
[3Y - 5Y [ 0 0 0 0 0 0 0 0 0 0 0 0 0 0
[5Y - 10Y [ 0 0 0 0 0 0 0 0 0 0 0 0 0 0
[10Y - more 0 0 0 0 0 0 0 0 0 0 0 0 0 0
Tot 0 0 0 0 0 0 0 0 0 0 0 0 0 0
[ 0 - 3M [ 0 0 -28 0 0 -28 0 0 0 0 0 0 0 0
[ 3M - 1Y [ 0 0 -1 0 0 -1 0 0 0 0 0 0 0 0
[ 1Y - 2Y [ 0 0 0 0 0 0 0 0 0 0 0 0 0 0
[ 2Y - 3Y [ 0 0 -3 0 0 -3 0 0 0 0 0 0 0 0
[3Y - 5Y [ 0 0 -19 0 0 -19 0 0 0 0 0 0 0 0
[5Y - 10Y [ 0 0 -89 0 0 -89 0 0 0 0 0 0 0 0
[10Y - more 0 0 -62 0 0 -62 0 0 0 0 0 0 0 0
Tot 0 0 -203 0 0 -203 0 0 0 0 0 0 0 0
[ 0 - 3M [ 0 0 0 0 0 0 0 0 0 0 0 0 0 0
[ 3M - 1Y [ 0 0 0 0 0 0 0 0 0 0 0 0 0 0
[ 1Y - 2Y [ 0 0 0 0 0 0 0 0 0 0 0 0 0 0
[ 2Y - 3Y [ 0 0 0 0 0 0 0 0 0 0 0 0 0 0
[3Y - 5Y [ 0 0 0 0 0 0 0 0 0 0 0 0 0 0
[5Y - 10Y [ 0 0 0 0 0 0 0 0 0 0 0 0 0 0[10Y - more 0 0 0 0 0 0 0 0 0 0 0 0 0 0
Tot 0 0 0 0 0 0 0 0 0 0 0 0 0 0
[ 0 - 3M [ 15 0 1 4 0 -3 0 0 0 0 0 0 0 0
[ 3M - 1Y [ 1,046 0 1,012 0 0 1,012 0 0 0 0 0 0 0 0
[ 1Y - 2Y [ 3 0 -105 0 0 -105 0 0 0 0 0 0 0 0
[ 2Y - 3Y [ 61 0 23 0 0 23 0 0 0 0 0 0 0 0
[3Y - 5Y [ 4 0 2 0 0 2 0 0 0 0 73 0 207 0
[5Y - 10Y [ 11 0 6 2 0 3 0 0 0 0 0 0 0 0
[10Y - more 8 0 -6 0 0 -6 0 0 0 0 0 0 0 0
Tot 1,149 0 934 6 0 927 0 0 0 0 73 0 207 0
[ 0 - 3M [ 0 0 0 0 0 0 0 0 0 0 0 0 0 0
[ 3M - 1Y [ 0 0 0 0 0 0 0 0 0 0 0 0 0 0
[ 1Y - 2Y [ 0 0 0 0 0 0 0 0 0 0 0 0 0 0
[ 2Y - 3Y [ 0 0 0 0 0 0 0 0 0 0 0 0 0 0
[3Y - 5Y [ 0 0 0 0 0 0 0 0 0 0 0 0 0 0
[5Y - 10Y [ 0 0 0 0 0 0 0 0 0 0 0 0 0 0
[10Y - more 0 0 0 0 0 0 0 0 0 0 0 0 0 0
Tot 0 0 0 0 0 0 0 0 0 0 0 0 0 0
[ 0 - 3M [ 0 0 0 0 0 0 0 0 0 0 0 0 0 0
[ 3M - 1Y [ 11 0 11 11 0 0 0 0 0 0 0 0 0 0
[ 1Y - 2Y [ 4 0 4 4 0 0 0 0 0 0 0 0 0 0
[ 2Y - 3Y [ 77 0 77 77 0 0 0 0 0 0 0 0 0 0
[3Y - 5Y [ 0 0 0 0 0 0 0 0 0 0 0 0 0 0
[5Y - 10Y [ 90 0 90 90 0 0 0 0 0 0 0 0 0 0
[10Y - more 4 0 4 4 0 0 0 0 0 0 0 0 0 0
Tot 187 0 187 187 0 0 0 0 0 0 0 0 0 0
[ 0 - 3M [ 0 0 0 0 0 0 0 0 0 0 0 0 0 0
[ 3M - 1Y [ 320 302 320 0 0 18 0 0 0 0 75 0 75 0
[ 1Y - 2Y [ 6 0 6 0 0 6 0 0 0 0 33 0 33 0
[ 2Y - 3Y [ 7 0 2 0 0 2 0 0 0 0 0 0 0 0
[3Y - 5Y [ 5 0 5 0 0 5 0 0 0 0 75 3 75 -3
[5Y - 10Y [ 41 0 40 19 0 21 0 0 0 0 0 0 0 0
[10Y - more 6 0 1 0 0 1 0 0 0 0 0 0 0 0
Tot 386 302 375 19 0 53 0 0 0 0 183 3 183 -3
[ 0 - 3M [ 1 0 1 1 0 0 0 0 0 0 0 0 0 0
[ 3M - 1Y [ 3 3 0 0 0 0 0 0 0 0 0 0 0 0
[ 1Y - 2Y [ 7 0 7 1 0 6 0 0 0 0 0 0 0 0
[ 2Y - 3Y [ 16 0 16 0 0 16 0 0 0 0 0 0 0 0
[3Y - 5Y [ 17 0 17 16 0 1 0 0 0 0 0 0 0 0
[5Y - 10Y [ 40 1 39 39 0 0 0 0 0 0 0 0 0 0
[10Y - more 0 0 0 0 0 0 0 0 0 0 0 0 0 0
Tot 83 4 79 57 0 23 0 0 0 0 0 0 0 0
[ 0 - 3M [ 0 0 0 0 0 0 0 0 0 0 0 0 0 0
[ 3M - 1Y [ 0 0 0 0 0 0 0 0 0 0 0 0 0 0
[ 1Y - 2Y [ 0 0 0 0 0 0 0 0 0 0 0 0 0 0
[ 2Y - 3Y [ 0 0 0 0 0 0 0 0 0 0 0 0 0 0
[3Y - 5Y [ 0 0 0 0 0 0 0 0 0 0 0 0 0 0
[5Y - 10Y [ 0 0 0 0 0 0 0 0 0 0 0 0 0 0
[10Y - more 0 0 0 0 0 0 0 0 0 0 0 0 0 0
Tot 0 0 0 0 0 0 0 0 0 0 0 0 0 0
Lithuania
Luxembourg
Malta
Netherlands
Norway
Poland
Portugal
Romania
Slovakia
http://www.economiaciudadana.org/

8/10/2019 Test Stress Banca Española 2014
http://slidepdf.com/reader/full/test-stress-banca-espanola-2014 27/240
2014 EU-wide Stress Test - Sovereign Exposure
(mln EUR)
Residual Maturity Country / Region
GROSS DIRECT LONG
EXPOSURES(accounting value gross
of provisions)
(1)
NET DIRECT POSITIONS (gross exposures (long) net of cash short
positions of sovereign debt to other counterpaties only where there
is a maturity matching)
(1)
DIRECT SOVEREIGN EXPOSURES IN DERIVATIVES (1)
of which: loans
and advances
of which: AFS
banking book
of which: FVO
(designated at fairvalue through
profit&loss)
banking book
of which: Financialassets held for
trading
(2)
Derivatives with positive fair value at
31/12/2013
Derivatives with negative fair value at
31/12/2013
Derivatives with positive fair value
at 31/12/2013
Derivatives with negative fair
value at 31/12/2013
VALUES AS OF 31/12/2013 VALUES AS OF 31/12/2013 VALUES AS OF 31/12/2013
INDIRECT SOVEREIGN EXPOSURES (3) (on and off balance sheet)
Fair-value at
31/12/2013 (+)Notional value
Fair-value at
31/12/2013 (-)Notional value
Fair-value at
31/12/2013 (+)Notional value
Fair-value at 31/12/2013
(-)Notional value
[ 0 - 3M [ 0 0 0 0 0 0 0 0 0 0 0 0 0 0
[ 3M - 1Y [ 0 0 0 0 0 0 0 0 0 0 0 0 0 0
[ 1Y - 2Y [ 0 0 0 0 0 0 0 0 0 0 0 0 0 0
[ 2Y - 3Y [ 0 0 0 0 0 0 0 0 0 0 0 0 0 0
[3Y - 5Y [ 0 0 0 0 0 0 0 0 0 0 0 0 0 0
[5Y - 10Y [ 0 0 0 0 0 0 0 0 0 0 0 0 0 0
[10Y - more 0 0 0 0 0 0 0 0 0 0 0 0 0 0
Tot 0 0 0 0 0 0 0 0 0 0 0 0 0 0
[ 0 - 3M [ 6,431 5,627 6,431 45 0 759 202 9 600 -1 0 0 0 0
[ 3M - 1Y [ 5,384 3,407 5,169 801 0 961 231 2 71 -2 0 0 0 0
[ 1Y - 2Y [ 2,942 716 2,502 1,712 0 74 825 17 550 -5 0 0 0 0
[ 2Y - 3Y [ 6,850 974 6,772 5,679 0 118 271 8 44 -3 0 0 0 0
[3Y - 5Y [ 12,809 3,379 12,682 8,133 0 693 420 24 20 0 0 0 0 0
[5Y - 10Y [ 11,741 4,015 11,737 5,469 0 1,467 904 76 512 -29 0 0 0 0
[10Y - more 6,861 4,048 6,498 2,501 0 -51 966 170 75 -8 173 0 48 -25
Tot 53,019 22,165 51,791 24,339 0 4,022 3,819 306 1,872 -48 173 0 48 -25
[ 0 - 3M [ 0 0 0 0 0 0 0 0 0 0 0 0 0 0
[ 3M - 1Y [ 0 0 0 0 0 0 0 0 0 0 0 0 0 0
[ 1Y - 2Y [ 0 0 0 0 0 0 0 0 0 0 0 0 0 0
[ 2Y - 3Y [ 0 0 0 0 0 0 0 0 0 0 0 0 0 0
[3Y - 5Y [ 0 0 0 0 0 0 0 0 0 0 0 0 0 0
[5Y - 10Y [ 0 0 0 0 0 0 0 0 0 0 0 0 0 0[10Y - more 0 0 0 0 0 0 0 0 0 0 0 0 0 0
Tot 0 0 0 0 0 0 0 0 0 0 0 0 0 0
[ 0 - 3M [ 0 0 0 0 0 0 0 0 0 0 0 0 0 0
[ 3M - 1Y [ 0 0 0 0 0 0 9 9 41 -22 0 0 0 0
[ 1Y - 2Y [ 0 0 0 0 0 0 0 0 0 0 73 0 92 0
[ 2Y - 3Y [ 0 0 0 0 0 0 0 0 0 0 0 0 0 0
[3Y - 5Y [ 0 0 0 0 0 0 0 0 0 0 199 4 197 -1
[5Y - 10Y [ 0 0 0 0 0 0 0 0 0 0 0 0 0 0
[10Y - more 0 0 0 0 0 0 0 0 0 0 0 0 0 0
Tot 0 0 0 0 0 0 9 9 41 -22 272 4 289 -1
[ 0 - 3M [ 0 0 0 0 0 0 0 0 0 0 0 0 0 0
[ 3M - 1Y [ 0 0 0 0 0 0 0 0 0 0 0 0 0 0
[ 1Y - 2Y [ 0 0 0 0 0 0 0 0 0 0 28 0 55 0
[ 2Y - 3Y [ 0 0 0 0 0 0 0 0 0 0 0 0 0 0
[3Y - 5Y [ 0 0 0 0 0 0 0 0 0 0 80 2 78 0
[5Y - 10Y [ 0 0 0 0 0 0 0 0 0 0 0 0 0 0
[10Y - more 0 0 0 0 0 0 0 0 0 0 0 0 0 0
Tot 0 0 0 0 0 0 0 0 0 0 107 2 133 0
[ 0 - 3M [ 0 0 0 0 0 0 0 0 0 0 0 0 0 0
[ 3M - 1Y [ 0 0 0 0 0 0 0 0 0 0 0 0 0 0
[ 1Y - 2Y [ 0 0 0 0 0 0 0 0 0 0 0 0 0 0
[ 2Y - 3Y [ 0 0 0 0 0 0 0 0 0 0 0 0 0 0
[3Y - 5Y [ 0 0 0 0 0 0 0 0 0 0 0 0 0 0
[5Y - 10Y [ 0 0 0 0 0 0 0 0 0 0 0 0 0 0
[10Y - more 8 0 8 8 0 0 0 0 0 0 0 0 0 0
Tot 8 0 8 8 0 0 0 0 0 0 0 0 0 0
[ 0 - 3M [ 0 0 0 0 0 0 0 0 0 0 0 0 0 0
[ 3M - 1Y [ 37 0 37 37 0 0 0 0 0 0 0 0 0 0
[ 1Y - 2Y [ 0 0 0 0 0 0 0 0 0 0 0 0 0 0
[ 2Y - 3Y [ 0 0 0 0 0 0 0 0 0 0 0 0 0 0
[3Y - 5Y [ 0 0 0 0 0 0 0 0 0 0 0 0 0 0
[5Y - 10Y [ 0 0 0 0 0 0 0 0 0 0 0 0 0 0[10Y - more 0 0 0 0 0 0 0 0 0 0 0 0 0 0
Tot 37 0 37 37 0 0 0 0 0 0 0 0 0 0
[ 0 - 3M [ 0 0 0 0 0 0 0 0 0 0 0 0 0 0
[ 3M - 1Y [ 0 0 0 0 0 0 0 0 0 0 0 0 0 0
[ 1Y - 2Y [ 0 0 0 0 0 0 0 0 0 0 20 0 39 0
[ 2Y - 3Y [ 0 0 0 0 0 0 0 0 0 0 0 0 0 0
[3Y - 5Y [ 0 0 0 0 0 0 0 0 0 0 39 1 38 0
[5Y - 10Y [ 0 0 0 0 0 0 0 0 0 0 0 0 0 0
[10Y - more 0 0 0 0 0 0 0 0 0 0 0 0 0 0
Tot 0 0 0 0 0 0 0 0 0 0 59 1 77 0
[ 0 - 3M [ 471 0 471 80 0 391 0 0 0 0 0 0 0 0
[ 3M - 1Y [ 19 0 19 19 0 0 0 0 0 0 0 0 0 0
[ 1Y - 2Y [ 2,204 2,059 2,197 141 0 -5 0 0 0 0 0 0 0 0
[ 2Y - 3Y [ 19 0 11 19 0 -8 20 1 0 0 0 0 0 0
[3Y - 5Y [ 87 0 47 20 0 -25 0 0 0 0 0 0 0 0
[5Y - 10Y [ 352 0 338 155 0 21 31 2 0 0 0 0 0 0
[10Y - more 2,072 891 2,067 993 0 0 0 0 0 0 0 0 0 0
Tot 5,224 2,950 5,150 1,427 0 373 52 2 0 0 0 0 0 0
Spain
Slovenia
Sweden
United Kingdom
Australia
Canada
Hong Kong
Japan
U.S.
http://www.economiaciudadana.org/

8/10/2019 Test Stress Banca Española 2014
http://slidepdf.com/reader/full/test-stress-banca-espanola-2014 28/240
2014 EU-wide Stress Test - Sovereign Exposure
(mln EUR)
Residual Maturity Country / Region
GROSS DIRECT LONG
EXPOSURES(accounting value gross
of provisions)
(1)
NET DIRECT POSITIONS (gross exposures (long) net of cash short
positions of sovereign debt to other counterpaties only where there
is a maturity matching)
(1)
DIRECT SOVEREIGN EXPOSURES IN DERIVATIVES (1)
of which: loans
and advances
of which: AFS
banking book
of which: FVO
(designated at fairvalue through
profit&loss)
banking book
of which: Financialassets held for
trading
(2)
Derivatives with positive fair value at
31/12/2013
Derivatives with negative fair value at
31/12/2013
Derivatives with positive fair value
at 31/12/2013
Derivatives with negative fair
value at 31/12/2013
VALUES AS OF 31/12/2013 VALUES AS OF 31/12/2013 VALUES AS OF 31/12/2013
INDIRECT SOVEREIGN EXPOSURES (3) (on and off balance sheet)
Fair-value at
31/12/2013 (+)Notional value
Fair-value at
31/12/2013 (-)Notional value
Fair-value at
31/12/2013 (+)Notional value
Fair-value at 31/12/2013
(-)Notional value
[ 0 - 3M [ 0 0 0 0 0 0 0 0 0 0 0 0 0 0
[ 3M - 1Y [ 7 0 7 0 0 7 0 0 0 0 0 0 0 0
[ 1Y - 2Y [ 0 0 0 0 0 0 0 0 0 0 51 1 102 0
[ 2Y - 3Y [ 0 0 0 0 0 0 0 0 0 0 44 0 44 0
[3Y - 5Y [ 0 0 0 0 0 0 0 0 0 0 421 9 437 0
[5Y - 10Y [ 0 0 0 0 0 0 0 0 0 0 0 0 0 0
[10Y - more 0 0 0 0 0 0 0 0 0 0 0 0 0 0
Tot 7 0 7 0 0 7 0 0 0 0 515 10 582 0
[ 0 - 3M [ 0 0 0 0 0 0 0 0 0 0 0 0 0 0
[ 3M - 1Y [ 0 0 0 0 0 0 0 0 0 0 0 0 0 0
[ 1Y - 2Y [ 0 0 0 0 0 0 0 0 0 0 0 0 0 0
[ 2Y - 3Y [ 0 0 0 0 0 0 0 0 0 0 0 0 0 0
[3Y - 5Y [ 0 0 0 0 0 0 0 0 0 0 0 0 0 0
[5Y - 10Y [ 0 0 0 0 0 0 0 0 0 0 0 0 0 0
[10Y - more 0 0 0 0 0 0 0 0 0 0 0 0 0 0
Tot 0 0 0 0 0 0 0 0 0 0 0 0 0 0
[ 0 - 3M [ 0 0 0 0 0 0 0 0 0 0 0 0 0 0
[ 3M - 1Y [ 27 0 27 3 0 24 0 0 0 0 0 0 0 0
[ 1Y - 2Y [ 0 0 0 0 0 0 0 0 0 0 0 0 0 0
[ 2Y - 3Y [ 0 0 0 0 0 0 0 0 0 0 87 0 65 0
[3Y - 5Y [ 0 0 0 0 0 0 0 0 0 0 87 0 87 0
[5Y - 10Y [ 0 0 0 0 0 0 0 0 0 0 0 0 0 0[10Y - more 0 0 0 0 0 0 0 0 0 0 0 0 0 0
Tot 27 0 27 3 0 24 0 0 0 0 174 1 152 -1
[ 0 - 3M [ 67 0 67 66 0 1 0 0 0 0 0 0 0 0
[ 3M - 1Y [ 561 0 561 554 0 7 0 0 0 0 0 0 0 0
[ 1Y - 2Y [ 271 0 271 270 0 1 0 0 0 0 0 0 0 0
[ 2Y - 3Y [ 297 0 297 296 0 1 0 0 0 0 0 0 0 0
[3Y - 5Y [ 384 0 384 384 0 1 0 0 0 0 0 0 0 0
[5Y - 10Y [ 1,125 0 1,125 1,124 0 2 0 0 0 0 0 0 0 0
[10Y - more 53 0 53 52 0 1 0 0 0 0 0 0 0 0
Tot 2,758 0 2,758 2,745 0 13 0 0 0 0 0 0 0 0
[ 0 - 3M [ 0 0 0 0 0 0 0 0 0 0 0 0 0 0
[ 3M - 1Y [ 0 0 0 0 0 0 0 0 0 0 0 0 0 0
[ 1Y - 2Y [ 0 0 0 0 0 0 0 0 0 0 0 0 0 0
[ 2Y - 3Y [ 0 0 0 0 0 0 0 0 0 0 0 0 0 0
[3Y - 5Y [ 0 0 0 0 0 0 0 0 0 0 45 1 62 0
[5Y - 10Y [ 0 0 0 0 0 0 0 0 0 0 0 0 0 0
[10Y - more 0 0 0 0 0 0 0 0 0 0 0 0 0 0
Tot 0 0 0 0 0 0 0 0 0 0 45 1 62 0
[ 0 - 3M [ 556 0 540 129 0 412 14 3 497 0 61 61 0 0
[ 3M - 1Y [ 4,361 0 4,118 1,555 0 2,564 75 15 384 0 34 1 8 -9
[ 1Y - 2Y [ 3,269 421 3,187 1,541 0 764 55 10 1,267 0 0 0 4 0
[ 2Y - 3Y [ 3,282 0 3,219 608 0 2,595 55 8 692 -1 68 0 68 0
[3Y - 5Y [ 5,526 54 5,155 2,973 0 2,128 115 12 19 0 58 0 61 0
[5Y - 10Y [ 5,152 0 4,858 1,712 0 2,112 185 7 93 -2 7 0 4 0
[10Y - more 7,473 5,867 6,448 236 0 345 0 0 174 -10 0 0 0 0
Tot 29,619 6,342 27,525 8,754 0 10,919 499 55 3,128 -13 228 63 145 -9
[ 0 - 3M [ 0 0 0 0 0 0 0 0 0 0 0 0 0 0
[ 3M - 1Y [ 0 0 0 0 0 0 0 0 0 0 0 0 0 0
[ 1Y - 2Y [ 0 0 0 0 0 0 0 0 0 0 0 0 0 0
[ 2Y - 3Y [ 0 0 0 0 0 0 0 0 0 0 0 0 0 0
[3Y - 5Y [ 0 0 0 0 0 0 0 0 0 0 0 0 0 0
[5Y - 10Y [ 0 0 0 0 0 0 0 0 0 0 0 0 0 0[10Y - more 0 0 0 0 0 0 0 0 0 0 0 0 0 0
Tot 0 0 0 0 0 0 0 0 0 0 0 0 0 0
[ 0 - 3M [ 328 0 328 0 0 328 0 0 0 0 0 0 0 0
[ 3M - 1Y [ 35 0 35 0 0 35 0 0 0 0 1 0 2 0
[ 1Y - 2Y [ 31 9 21 0 0 12 0 0 0 0 0 0 0 0
[ 2Y - 3Y [ 36 0 11 0 0 11 0 0 0 0 0 0 0 0
[3Y - 5Y [ 59 19 57 3 0 35 0 0 0 0 0 0 0 0
[5Y - 10Y [ 130 0 121 2 0 119 0 0 0 0 0 0 0 0
[10Y - more 145 76 107 2 0 29 0 0 0 0 0 0 0 0Tot 763 104 680 7 0 569 0 0 0 0 1 0 2 0
Notes and definitions
(1) The exposures reported cover only exposures to central, regional and local governments on immediate borrower basis, and do not include exposures to other counterparts with full or partial government guarantees
(2) The banks disclose the exposures in the "Financial assets held for trading" portfolio after offsetting the cash short positions having the same maturities.
(3) The exposures reported include the positions towards counterparts (other than sovereign) on sovereign credit risk (i.e. CDS, financial guarantees) booked in all the accounting portfolio (on-off balance sheet).'Irrespective of the denomination and or accounting classification of the positions the economic substance over the form must be used as a criteria for the identification of the exposures to be included in this column. This item does not include exposures to counterparts (other than sovereign) with full or partial government guarantees by central, regional and local governments
Latin America and the
Caribbean
Africa
Others
Middle East
China
Switzerland
Other advanced economies
non EEA
Other Central and eastern
Europe countries non EEA
http://www.economiaciudadana.org/
2014 EU id S T

8/10/2019 Test Stress Banca Española 2014
http://slidepdf.com/reader/full/test-stress-banca-espanola-2014 29/240
2014 EU-wide Stress TestCapital
(mln EUR) CRR/ CRDIV DEFINITION OFCAPITAL Asof31/12/2013 Asof31/12/2014 Asof31/12/2015 Asof31/12/2016 Asof31/12/2014 Asof31/12/2015 Asof31/12/2016 COREP CODE REGULATION
A OWN FUNDS 45,028 44,957 45,998 46,591 43,581 43,298 42,705 C A 1 {1 } A rt ic le s 4 (1 18 ) a nd 7 2 of C RR
A.1COMMON EQUITYTIER 1CAPITAL(net ofdeductionsandafter applying
transitional adjustments)36,383 36,321 37,238 38,028 34,988 34,613 34,196 C A 1 {1 .1 .1 } A rt ic le 5 0 of C RR
A.1.1Capitalinstrumentseligible asCET1Capital(including share premium and net own
capitalinstruments)24,692 24,692 24,692 24,692 24,692 24,692 24,692 CA1 {1.1.1.1}
Articles 26(1) points (a) and(b), 27to29, 36(1) point (f)
and42ofCRR
A.1.1.1 Ofwhich: CET1instrumentssubscribed byGovernment 0 0 0 0 0 0 0 - -
A.1.2 Retained earnings 756 956 2,659 4,273 257 1,211 2,459 CA1 {1.1.1.2} Articles 26(1) point (c), 26(2) and36 (1) points (a) and(l)
ofCRR
A.1.3 Accumulated other comprehensive income -3,658 -4,210 -4,430 -4,577 -7,181 -6,940 -7,509 CA1 {1.1.1.3} Articles 4(100), 26(1) point (d) and 36 (1) point (l) of CRR
A.1.3.1 Ofwhich: arising from unrealised gains/lossesfrom Sovereign exposure in AFS
portfolio510 510 510 510 -1,863 -1,043 -1,226 - -
A.1.3.2 Ofwhich: arising from unrealised gains/lossesfrom the rest ofAFS portfolio 186 -367 -587 -733 -964 -1,543 -1,928 - -
A.1.4 Other Reserves 19,935 19,935 19,935 19,935 19,935 19,935 19,935 CA1 {1.1.1.4} Articles 4(117) and 26(1) point (e) of CRR
A.1.5 Fundsfor generalbanking risk 0 0 0 0 0 0 0 CA1 {1.1.1.5} Articles 4(112), 26(1) point (f) and 36 (1) point (l) of CRR
A.1.6 Minorityinterest given recognition in CET1capital 934 934 934 934 934 934 934 CA1 {1.1.1.7} Article 84 of CRR
A.1.7 AdjustmentstoCET1 due toprudentialfiltersexcluding those from unrealised
gains/lossesfrom AFS portfolio-186 367 352 293 771 926 771 CA1 {1.1.1.9} Articles 32 to 35 of and 36 (1) point (l) of CRR
A.1.8 AdjustmentstoCET1 due toprudentialfiltersfrom unrealised gains/lossesfrom
Sovereign Exposure in AFS portfolio-510 -510 -306 -204 1,490 626 490 -
A.1.9 (-)Intangible assets(including Goodwill) -8,034 -8,034 -8,034 -8,034 -8,034 -8,034 -8,034CA1{1.1.1.10+
1.1.1.11}
Articles 4(113), 36(1) point (b) and37of CRR. Articles
4(115), 36(1) point (b) and37point (a) of CCR
A.1.10(-)DTAs that relyon future profitabilityand donot arise from temporary
differencesnet ofassociated DTLs-1,057 -1,057 -1,057 -1,057 -1,057 -1,057 -1,057 CA1 {1.1.1.12} Articles 36(1) point (c) and 38 of CRR
A.1.11 (-)IRB shortfallofcredit riskadjustmentsto expected losses 0 0 0 0 -39 -57 -5 CA1 {1.1.1.13} Articles 36(1) point (d), 40 and 159 of CRR
A.1.12 (-)Defined benefit pension fund assets 0 0 0 0 0 0 0 CA1 {1.1.1.14} Articles 4(109), 36(1) point (e) and 41 of CRR
A.1.13 (-)Reciprocalcrossholdingsin CET1Capital 0 0 0 0 0 0 0 CA1 {1.1.1.15} Articles 4(122), 36(1) point (g) and 44 of CRR
A.1.14 (-)Excessdeduction from AT1itemsover AT1Capital 0 0 0 0 0 0 0 CA1 {1.1.1.16} Article 36(1) point (j) of CRR
A.1.15(-)Deductionsrelated toassets which can alternativelybe subject toa 1.250%risk
weight-126 -126 -126 -126 -126 -126 -126
CA1{1.1.1.17to
1.1.1.21}
Articles 4(36), 36(1) point (k) (i) and89to 91ofCRR;
Articles 36(1) point (k) (ii), 243(1) point (b), 244(1) point
(b) and258of CRR;Articles 36(1) point k) (iii) and379(3)
ofCRR;Art icles 36(1) point k) (iv) and153(8) ofCRRand
A.1.15.1 Ofwhich: from securitisation positions(-) -73 -73 -73 -73 -73 -73 -73 CA1 {1.1.1.18.1} Articles 36(1) point (k) (ii), 243(1) point (b), 244(1) point
(b) and258of CRR
A.1.16(-)Holdingsof CET1capitalinstrumentsof financialsector entitieswhere the
institiution does not have a significant investment0 0 0 0 0 0 0 CA1 {1.1.1.22}
Articles 4(27), 36(1) point (h);43to46, 49(2) and (3) and
79ofCRR
A.1.17(-)Deductible DTAsthat rely on future profitabilityand arise from temporary
differences0 0 0 0 0 0 0 CA1 {1.1.1.23}
Articles 36(1) point (c) and38;Articles 48(1) point (a) and
48(2) ofCRR
A.1.18(-)Holdingsof CET1capitalinstrumentsof financialsector entitieswhere the
institiution has a significant investment-252 -274 -124 0 -643 -520 -443 CA1 {1.1.1.24}
Articles 4(27);36(1) point (i);43, 45;47; 48(1) point (b);
49(1) to(3) and79of CRR
A.1.19 (-)Amount exceding the 17.65%threshold -630 -647 -533 -396 -930 -836 -777 CA1 {1.1.1.25} Article 470 of CRR
A.1.20 Transitionaladjustments 4,518 4,296 3,277 2,295 4,918 3,859 2,865CA1{1.1.1.6+ 1.1.8+
1.1.26}-
A.1.20.1 Transitionaladjustmentsdue tograndfathered CET1Capitalinstruments(+/-) 0 0 0 0 0 0 0 CA1 {1.1.1.6}
Articles 483(1) to(3), and484to487of CRR
A.1.20.2 Transitionaladjustmentsdue toadditionalminorityinterests(+/-) 1,043 780 517 255 780 517 255 CA1 {1.1.1.8}
Articles 479and480of CRR
A.1.20.3Other transitionaladjustmentsto CET1Capitalexcl. adjustmentsfor Sovereign
exposure in AFS (+/-)3,475 3,516 2,759 2,041 4,138 3,341 2,610 CA1 {1.1.1.26}
Articles 469to472, 478and 481ofCRR
A.2 ADDITIONAL TIER 1CAPITAL (net ofdeductionsand after transitional
adjustments)973 969 1,219 1,450 947 1,182 1,423 C A 1 {1 .1 .2 } A rt ic le 6 1 of C RR
A.2.1 Ofwhich:(+) Other existing support government measures 0 0 0 0 0 0 0 - -
A.3 TIER1 CAPITAL(netofdeductionsandafter transitional adjustments) 37,356 37,290 38,457 39,479 35,935 35,795 35,619 C A1 { 1. 1} A rt ic le 2 5 of C RR
A.4 TIER2 CAPITAL(netofdeductionsandafter transitional adjustments) 7,672 7,667 7,540 7,113 7,646 7,504 7,085 C A1 { 1. 2} A rt ic le 7 1 of C RR
B T OT AL R IS K EX PO SU RE A M OU NT 345,041 354,719 356,823 358,592 367,463 378,080 381,341 C A 2 {1 } A rt ic le s 92 (3 ), 95 , 96 a n d 98 o f CR R
B.1ofwhich:stemming from exposuresthat fallbelow the 10%/ 15%limitsfor
CET1deduction (+)0 0 0 0 0 0 0
Articles 36(1) points (a) and(i);Article 38a ndArticle 48of
CRR
B. 2 ofwh ich :s temmi ng f r om fr om CVAcap ita l r eq ui r ements (+) 0 0 0 0 0 0 0 Article 381to386 ofCRR
B.3ofwhich:stemming from higher asset correlation parameter against exposures
tolarge financialinstitutionsunder IRB the IRB approachesto credit risk(+)0 0 0 0 0 0 0 Articles 153(2) ofCRR
B.4ofwhich:stemming from the application ofthe supporting factor to increase
lending toSMEs(-)0 0 0 0 0 0 0 Recital (44) ofCRR
B.5
ofwhich:stemming from the effect of exposuresthat were previouslypart of
RiskExposure amount and receive a deduction treatment under CRR/CRDIV (-
)
0 0 0 0 0 0 0 -
B.6 ofwhich:otherssubject tothe discretion ofNationalCompetent Authorities 0 0 0 0 0 0 0 Article 124to164 ofCRR
C.1 Co mm onE q ui tyTi er 1Cap i tal r ati o 10.54% 10.24% 10.44% 10.60% 9.52% 9.15% 8.97% CA3 {1} -
C .2 T ie r 1 C ap it al ra ti o 10.83% 10.51% 10.78% 11.01% 9.78% 9.47% 9.34% CA3 {3} -
C .3 T ot al C ap it al r at io 13.05% 12.67% 12.89% 12.99% 11.86% 11.45% 11.20% CA3 { 5} -
D Co mm onE q ui tyTi er 1Cap i tal Thresho ld 28,378 28,546 28,687 20,210 20,794 20,974
ETotalamount of instrumentswith mandatoryconversion intoordinarysharesupon
a fixed date in the 2014 -2016period (cumulative conversions)(1)0 0 0 0 0 0
F
TotalAdditionalTier 1and Tier 2 instrumentseligible asregulatorycapitalunder
the CRR provisionsthat convert into Common EquityTier 1or are written down
upon a trigger event (2)
0 0 0
F.1Ofwhich: eligible instrumentswhose trigger isabove CET1capitalratio in the
adverse scenario(2)0 0 0
G FullyLoadedCommonEquityTier 1Capital ratio (3) 9.96% 8.22%
(1)Conversionsnot considered for CET1 computation (2)Excluding instrumentsincluded in E (3)Memorandum item based on a fullyimplemented CRR/CRD IV definition of Common EquityTier 1 capitalincluding 60%ofunrealised gains/lossesfrom Sovereign Exposure in AFS portfolio
Memorandumitems
Baseline Scenario Adverse Scenario
OWN FUNDS
OWN FUNDS
REQUIREMENTS
CAPITALRATIOS(%) -
Transitional period
http://www.economiaciudadana.org/

8/10/2019 Test Stress Banca Española 2014
http://slidepdf.com/reader/full/test-stress-banca-espanola-2014 30/240
2014 EU-wide Stress Test - Restructuring scenarios
(mln EUR)
2013 0 0
2014 0 0 0 02015 0 0 0 0
2016 0 0 0 0
Total 0 0 0 0
Effects of mandatory restructuring plans publicly announced before 31 December 2013 and formally agreed with the European Commission.
Baseline scenario Adverse scenarioNarrative description of the transactions. (type, date of
completion/commitment, portfolios, subsidiaries, branches)CET1 impact
Risk exposure
amount impactCET1 impact
Risk exposure
amount impact
http://www.economiaciudadana.org/

8/10/2019 Test Stress Banca Española 2014
http://slidepdf.com/reader/full/test-stress-banca-espanola-2014 31/240
2014 EU-wide Stress Test
Outcome of the Stress Test based on the Restructuring plan for banks whose plan was formally agreed with the European Commission after 31 December 2013
(mln EUR)
As of
31/12/2013
As of
31/12/2014
As of
31/12/2015
As of
31/12/2016
As of
31/12/2014
As of
31/12/2015
As of
31/12/2016
COMMON EQUITY TIER 1 CAPITAL (net of deductions and after applying transitional adjustments)
TOTAL RISK EXPOSURE AMOUNT
COMMON EQUITY TIER 1 RATIO #DIV/0! #DIV/0! #DIV/0! #DIV/0! #DIV/0! #DIV/0! #DIV/0!
Baseline scenario Adverse scenario
http://www.economiaciudadana.org/

8/10/2019 Test Stress Banca Española 2014
http://slidepdf.com/reader/full/test-stress-banca-espanola-2014 32/240
2014 EU-wide Stress Test
Impact on Common
Equity Tier 1
Million EUR
Raising of capital instruments eligible as CET1 capital (+) 0
Repayment of CET1 capital, buybacks (-) 0
Conversion to CET1 of hybrid instruments becoming effective between 1 January and 30 September 2014 (+) 0
Impact on Additional
Tier 1 and Tier 2
Million EUR
Net issuance of Additional Tier 1 and T2 Instruments with a trigger at or above bank's post stress test CET1 ratio in the adverse
scenario during the stress test horizon (+/-)0
Net issuance of Additional Tier 1 and T2 Instrument with a trigger below bank's post stress test CET1 ratio in the adverse
scenario during the stress test horizon (+/-)1,500
Million EUR
Realized fines/litigation costs from 1 January to 30 September 2014 (net of provisions) (-) 0
Other material losses and provisions from 1 January to 30 September 2014 (-) 0
Major Capital Measures from 1 January to 30 September 2014
Losses
Net issuance of Additional Tier 1 and T2 Instruments
Issuance of CET 1 Instruments
Major Capital Measures Impacting Tier 1 and Tier 2 Eligible Capital from 1 January 2014 to 30 September 2014
http://www.economiaciudadana.org/

8/10/2019 Test Stress Banca Española 2014
http://slidepdf.com/reader/full/test-stress-banca-espanola-2014 33/240
Bank Name ES - Caja de Ahorros y Pensiones de Barcelona
LEI Code 7CUNS533WID6K7DGFI87
ES
NUK_WL_NR_XX
version
1809014
No restructuring
2014 EU-wide Stress Test
http://www.economiaciudadana.org/

8/10/2019 Test Stress Banca Española 2014
http://slidepdf.com/reader/full/test-stress-banca-espanola-2014 34/240
Actual figures as of 31 December 2013 mln EUR, % Actual figures as of 31 December 2013 mln EUR, %Operating profit before impairments 740 Operating profit before impairments 740
Impairment losses on financial and non-financial assets in the banking book 5,445 Impairment losses on financial and non-financial assets in the banking book 5,445
Common Equity Tier 1 capital (1) 17,544 Common Equity Tier 1 capital (1) 17,544
Total Risk Exposure (1) 170,679 Total Risk Exposure (1) 170,679
Common Equity Tier 1 ratio, % (1) 10.3% Common Equity Tier 1 ratio, % (1) 10.3%
Outcome of the adverse scenario as of 31 December 2016 mln EUR, % Outcome of the baseline scenario as of 31 December 2016 mln EUR, %
3 yr cumulative operating profit before impairments 2,751 3 yr cumulative operating profit before impairments 3,550
3 yr cumulative impairment losses on financial and non-financial assets in the banking book 7,186 3 yr cumulative impairment losses on financial and non-financial assets in the banking book 2,523
3 yr cumulative losses from the stress in the trading book 400 3 yr cumulative losses from the stress in the trading book 327
Valuation losses due to sovereign shock after tax and prudential filters -34 Common Equity Tier 1 capital (1) 20,056
Common Equity Tier 1 capital (1) 16,474 Total Risk Exposure (1) 173,474
Total Risk Exposure (1) 176,317 Common Equity Tier 1 ratio, % (1) 11.6%
Common Equity Tier 1 ratio, % (1) 9.3%
Memorandum items mln EUR Memorandum items mln EUR Common EU wide CET1 Threshold (8.0%) 13,878
Common EU wide CET1 Threshold (5.5%) 9,697
Total amount of instruments with mandatory conversion into ordinary shares upon a fixed date inthe 2014 -2016 period (cumulative conversions) (2)
1,923
Total Additional Tier 1 and Tier 2 instruments eligible as regulatory capital under the CRR provisions
that convert into Common Equity Tier 1 or are written down upon a trigger event (3)
0
Of which: eligible instruments whose trigger is above CET1 capital ratio in the adversescenario (3)
0
(2) Conversions not considered for CET1 computation
(3) Excluding instruments with mandatory conversion into ordinary shares upon a fixed date in the 2014 -2016 period
(1) According to CRR/CRD4 definition transitional arrangements as per reporting date. Figures as of 31/12/2013 computed as of first day of application:
01/01/2014.
2014 EU-wide Stress Test 2014 EU-wide Stress TestSummary Baseline Scenario
ES - Caja de Ahorros y Pensiones de Barcelona
(1) According to CRR/CRD4 definition transitional arrangements as per reporting date. Figures as of 31/12/2013 computed as of first day of application:
01/01/2014.
Summary Adverse Scenario
ES - Caja de Ahorros y Pensiones de Barcelona
http://www.economiaciudadana.org/
2014 EU-wide Stress TestCreditRisk

8/10/2019 Test Stress Banca Española 2014
http://slidepdf.com/reader/full/test-stress-banca-espanola-2014 35/240
Credit Risk
(mln EUR, %)
Non-defaulted Defaulted Non-defaulted Defaulted Non-defaulted Defaulted Non-defaulted Defaulted Non-defaulted Defaulted Non-defaulted Defaulted Non-defaulted Defaulted Non-defaulted Defaulted Non-defaulted Defaulted Impairmentrate
Stockof Provisions
Coverage Ratio -Default Stock
Impairmentrate
Stockof Provisions
Coverage
Ratio-Default
Stock
Impairmentrate
Stockof Provisions
Coverage
Ratio -Default
Stock
Impairment rateStockof
Provisions
Coverage
Ratio-Default
Stock
Impairmentrate
Stockof Provisions
Coverage
Ratio-Default
Stock
Impairmentrate
Stockof Provisions
Coverage
Ratio -Default
Stock
Central banksandcentral governments 0 0 0 0 48,658 192 0 0 0 0 1,832 280 0 0 0 0 32 5 0.30% 127 22.53% 0.30% 216 28.58% 0.29% 305 31.50% 0.97% 332 32.12% 0.97% 620 35.55% 0.97% 900 36.88%Institutions 0 0 0 0 8,692 0 0 0 0 0 1,749 0 0 0 0 0 2 0 0.12% 12 22.52% 0.14% 24 22.51% 0.15% 36 22.51% 0.19% 18 22.51% 0.31% 43 22.51% 0.30% 66 22.51%Corporates 0 0 35,923 14,135 19,325 1,463 0 0 27,628 1,321 14,938 942 0 0 1,352 6,564 1,924 1,536 1.10% 11,730 44.85% 0.78% 11,966 43.30% 0.60% 12,153 42.25% 1.72% 12,788 48.74% 1.56% 13,612 47.68% 1.20% 14,041 46.23%
Corporates - OfWhich:SpecialisedLending 0 0 0 0 7,866 322 0 0 0 0 6,727 244 0 0 0 0 103 342 0.64% 494 46.30% 0.52% 532 43.63% 0.44% 565 42.02% 1.12% 579 50.94% 1.33% 678 46.54% 1.14% 760 44.39%Corporates -OfWhich: SME 0 0 11,603 8,260 1,641 446 0 0 6,452 729 1,557 196 0 0 549 3,442 934 390 1.72% 5,436 40.74% 1.18% 5,513 39.77% 0.91% 5,574 39.07% 2.65% 5,891 44.53% 2.19% 6,214 44.72% 1.65% 6,341 43.88%
Retail 0 0 110,888 8,395 13,631 745 0 0 24,808 698 5,451 560 0 0 710 2,039 1,309 412 0.62% 5,188 24.71% 0.40% 5,592 23.67% 0.30% 5,893 23.08% 0.98% 5,827 27.64% 0.78% 6,680 26.89% 0.60% 7,294 26.35%Retail -Securedon real estateproperty 54.3% 0 0 98,505 7,874 9,591 648 0 0 20,363 672 3,708 457 0 0 590 1,737 1,005 322 0.59% 4,203 21.97% 0.35% 4,511 20.93% 0.25% 4,723 20.28% 0.95% 4,722 24.51% 0.72% 5,400 23.77% 0.53% 5,868 23.19%
Retail -Securedon real estate property-Of h i h : S E
46.8% 0 0 7,191 2,285 297 128 0 0 2,677 198 221 74 0 0 97 620 407 64 1.18% 1,263 26.52% 0.80% 1,310 25.60% 0.63% 1,345 24.89% 1.82% 1,358 28.84% 1.54% 1,474 28.57% 1.20% 1,542 27.90%Retail -Securedon real estate property-Of
h i h: n n - E54.8% 0 0 91,313 5,589 9,294 520 0 0 17,686 474 3,486 382 0 0 493 1,117 598 257 0.54% 2,940 20.55% 0.32% 3,201 19.59% 0.22% 3,378 19.01% 0.88% 3,364 23.21% 0.65% 3,926 22.50% 0.49% 4,326 22.02%
Retail -QualifyingRevolving 0 0 3,109 14 102 2 0 0 839 0 87 1 0 0 1 9 17 3 0.37% 45 80.26% 0.33% 56 78.96% 0.32% 66 77.81% 0.46% 51 94.31% 0.51% 67 92.59% 0.50% 83 92.51%Retail -OtherRetail 0 0 9,274 507 3,938 95 0 0 3,606 26 1,656 102 0 0 118 293 287 88 0.91% 941 58.06% 0.77% 1,026 55.41% 0.70% 1,104 53.80% 1.35% 1,054 66.36% 1.37% 1,214 63.38% 1.14% 1,343 61.64%
Retail -OtherRetail -OfWhich:SME 0 0 3,843 306 695 27 0 0 1,579 22 378 8 0 0 47 185 105 68 1.19% 450 55.70% 0.97% 487 51.85% 0.87% 520 49.42% 1.85% 506 62.38% 1.85% 578 57.70% 1.50% 634 54.94%Retail -OtherRetail -OfWhich:non-SME 0 0 5,432 201 3,243 68 0 0 2,027 4 1,278 94 0 0 72 108 181 20 0.76% 490 61.28% 0.66% 539 60.17% 0.61% 584 59.54% 1.10% 548 71.82% 1.13% 635 71.12% 0.96% 709 70.72%
Equity 19,038 0 0 0 0 0 43,992 0 0 0 0 0 0 0 0 0 0 0 0.00% 0 - 0.00% 0 - 0.00% 0 - 1.58% 244 90.00% 1.58% 484 90.00% 1.58% 719 90.00%Securitisation 0 0 118 0 301 0 0 0 3 0 245 0 0 0 0 0 25 0Othernon-credit obligation assets 0 0 0 0 19,062 8,393 0 0 0 0 20,626 9,681 0 0 0 0 877 6,078TOTAL 19,038 0 146,930 22,530 109,669 10,794 43,992 0 52,438 2,019 44,840 11,464 0 0 2,061 8,603 4,170 8,032 0.63% 17,057 36.48% 0.44% 17,798 34.73% 0.34% 18,386 33.66% 1.17% 19,208 40.15% 1.02% 21,438 38.92% 0.84% 23,022 37.83%Securitisation andre-securitisations positions deductedfrom capital * 0 0 0 0 0 0 0 0 0 0 0 0
(mln EUR, %)Non-defaulted Defaulted Non-defaulted Defaulted Non-defaulted Defaulted Non-defaulted Defaulted Non-defaulted Defaulted Non-defaulted Defaulted Non-defaulted Defaulted Non-defaulted Defaulted Non-defaulted Defaulted Impairment
rateStockof
ProvisionsCoverage Ratio -
Default Stock
Impairmentrate
Stockof Provisions
Coverage
Ratio-Default
Stock
Impairmentrate
Stockof Provisions
Coverage
Ratio -Default
Stock
Impairment rateStockof
Provisions
Coverage
Ratio-Default
Stock
Impairmentrate
Stockof Provisions
Coverage
Ratio-Default
Stock
Impairmentrate
Stockof Provisions
Coverage
Ratio -Default
Stock Central banksandcentral governments
0 0 0 0 48,237 192 0 0 0 0 1,831 280 0 0 0 0 31 5 0.30% 126 22.49% 0.30% 215 28.55% 0.29% 303 31.48% 0.97% 331 32.10% 0.97% 618 35.54% 0.97% 899 36.87%Institutions 0 0 0 0 7,734 0 0 0 0 0 1,528 0 0 0 0 0 2 0 0.11% 10 22.52% 0.13% 20 22.51% 0.14% 30 22.51% 0.18% 15 22.51% 0.29% 36 22.51% 0.28% 55 22.51%Corporates 0 0 34,971 14,115 18,676 1,489 0 0 26,047 1,314 13,042 903 0 0 1,304 6,330 1,868 1,491 1.12% 11,348 43.51% 0.79% 11,584 42.08% 0.61% 11,769 41.10% 1.74% 12,374 47.34% 1.56% 13,181 46.44% 1.19% 13,600 45.10%
Corporates - OfWhich:SpecialisedLending 0 0 0 0 7,189 314 0 0 0 0 5,499 210 0 0 0 0 100 330 0.62% 473 46.38% 0.49% 507 43.84% 0.41% 535 42.31% 1.06% 551 51.19% 1.24% 636 47.00% 1.04% 705 44.90%Corporates -OfWhich: SME 0 0 11,585 8,259 1,674 459 0 0 6,234 727 1,542 191 0 0 529 3,321 901 377 1.72% 5,253 39.40% 1.18% 5,333 38.52% 0.90% 5,394 37.88% 2.65% 5,696 43.11% 2.19% 6,017 43.37% 1.64% 6,146 42.61%
Retail 0 0 110,870 8,395 13,671 753 0 0 24,530 692 5,359 544 0 0 693 1,967 1,268 402 0.62% 5,095 24.42% 0.40% 5,501 23.42% 0.30% 5,802 22.86% 0.98% 5,731 27.34% 0.78% 6,587 26.65% 0.60% 7,203 26.14%Retail -Securedon real estateproperty 53.6% 0 0 98,504 7,874 9,625 654 0 0 20,110 666 3,617 441 0 0 578 1,676 971 314 0.59% 4,134 21.78% 0.35% 4,444 20.77% 0.25% 4,657 20.13% 0.95% 4,653 24.32% 0.72% 5,333 23.62% 0.53% 5,803 23.06%
Retail -Securedon real estate property-Of h i h : S E
46.6% 0 0 7,191 2,285 311 130 0 0 2,672 198 221 74 0 0 94 599 393 62 1.18% 1,222 25.71% 0.80% 1,269 24.87% 0.63% 1,305 24.21% 1.82% 1,316 28.00% 1.54% 1,431 27.82% 1.20% 1,500 27.23%Retail -Securedon real estate property-Of
h i h: n n - E54.2% 0 0 91,313 5,588 9,314 524 0 0 17,437 468 3,396 367 0 0 484 1,077 578 252 0.54% 2,912 20.55% 0.32% 3,174 19.60% 0.22% 3,352 19.01% 0.88% 3,337 23.22% 0.65% 3,902 22.50% 0.49% 4,304 22.02%
Retail -QualifyingRevolving 0 0 3,109 14 103 2 0 0 834 0 87 1 0 0 1 8 17 3 0.37% 44 78.73% 0.33% 54 77.89% 0.32% 65 76.98% 0.46% 50 92.53% 0.51% 66 91.43% 0.50% 82 91.62%Retail -OtherRetail 0 0 9,256 507 3,944 97 0 0 3,586 26 1,655 102 0 0 115 283 281 85 0.91% 917 56.54% 0.77% 1,002 54.18% 0.70% 1,081 52.75% 1.36% 1,028 64.74% 1.37% 1,188 62.15% 1.14% 1,317 60.63%
Retail -OtherRetail -OfWhich:SME 0 0 3,842 306 699 29 0 0 1,578 22 378 8 0 0 45 178 102 66 1.19% 437 54.10% 0.97% 474 50.55% 0.87% 506 48.30% 1.85% 491 60.71% 1.85% 564 56.44% 1.50% 620 53.88%Retail -OtherRetail -OfWhich:non-SME 0 0 5,414 201 3,245 68 0 0 2,008 4 1,278 94 0 0 70 104 179 19 0.76% 480 59.89% 0.66% 529 59.06% 0.61% 574 58.60% 1.10% 537 70.29% 1.13% 624 69.97% 0.96% 698 69.77%
Equity 17,603 0 0 0 0 0 41,505 0 0 0 0 0 0 0 0 0 0 0 0.00% 0 - 0.00% 0 - 0.00% 0 - 1.66% 232 90.00% 1.66% 459 90.00% 1.66% 683 90.00%Securitisation 0 0 118 0 301 0 0 0 3 0 245 0 0 0 0 0 25 0Othernon-credit obligation assets 0 0 0 0 19,062 8,393 0 0 0 0 20,626 9,681 0 0 0 0 877 6,078TOTAL 17,603 0 145,960 22,509 107,681 10,827 41,505 0 50,580 2,006 42,631 11,409 0 0 1,997 8,296 4,071 7,975 0.64% 16,579 35.57% 0.44% 17,319 33.93% 0.35% 17,905 32.93% 1.17% 18,683 39.20% 1.02% 20,881 38.12% 0.84% 22,440 37.12%Securitisation andre-securitisations positions deductedfrom capital * 0 0 0 0 0 0 0 0 0 0 0 0
(mln EUR, %)Non-defaulted Defaulted Non-defaulted Defaulted Non-defaulted Defaulted Non-defaulted Defaulted Non-defaulted Defaulted Non-defaulted Defaulted Non-defaulted Defaulted Non-defaulted Defaulted Non-defaulted Defaulted Impairment
rateStockof
ProvisionsCoverage Ratio -
Default Stock
Impairmentrate
Stockof Provisions
CoverageRatio-Default
Stock
Impairmentrate
Stockof Provisions
CoverageRatio -Default
Stock
Impairment rateStockof
Provisions
CoverageRatio-Default
Stock
Impairmentrate
Stockof Provisions
CoverageRatio-Default
Stock
Impairmentrate
Stockof Provisions
CoverageRatio -Default
Stock Central banksandcentral governments 0 0 0 0 0 0 0 0 0 0 0 0 0 0 0 0 0 0 - 0 - - 0 - - 0 - - 0 - - 0 - - 0 -Institutions 0 0 0 0 0 0 0 0 0 0 0 0 0 0 0 0 0 0 - 0 - - 0 - - 0 - - 0 - - 0 - - 0 -Corporates 0 0 0 0 0 0 0 0 0 0 0 0 0 0 0 0 0 0 - 0 - - 0 - - 0 - - 0 - - 0 - - 0 -
Corporates - OfWhich:SpecialisedLending 0 0 0 0 0 0 0 0 0 0 0 0 0 0 0 0 0 0 - 0 - - 0 - - 0 - - 0 - - 0 - - 0 -Corporates -OfWhich: SME 0 0 0 0 0 0 0 0 0 0 0 0 0 0 0 0 0 0 - 0 - - 0 - - 0 - - 0 - - 0 - - 0 -
Retail 0 0 0 0 0 0 0 0 0 0 0 0 0 0 0 0 0 0 - 0 - - 0 - - 0 - - 0 - - 0 - - 0 -Retail -Securedon real estateproperty 0.0% 0 0 0 0 0 0 0 0 0 0 0 0 0 0 0 0 0 0 - 0 - - 0 - - 0 - - 0 - - 0 - - 0 -
Retail -Securedon real estate property-Of hi h: E
0.0% 0 0 0 0 0 0 0 0 0 0 0 0 0 0 0 0 0 0 - 0 - - 0 - - 0 - - 0 - - 0 - - 0 -Retail -Securedon real estate property-Of
h i h : n n -S E0.0% 0 0 0 0 0 0 0 0 0 0 0 0 0 0 0 0 0 0 - 0 - - 0 - - 0 - - 0 - - 0 - - 0 -
Retail -QualifyingRevolving 0 0 0 0 0 0 0 0 0 0 0 0 0 0 0 0 0 0 - 0 - - 0 - - 0 - - 0 - - 0 - - 0 -Retail -OtherRetail 0 0 0 0 0 0 0 0 0 0 0 0 0 0 0 0 0 0 - 0 - - 0 - - 0 - - 0 - - 0 - - 0 -
Retail -OtherRetail -OfWhich:SME 0 0 0 0 0 0 0 0 0 0 0 0 0 0 0 0 0 0 - 0 - - 0 - - 0 - - 0 - - 0 - - 0 -Retail -OtherRetail -OfWhich:non-SME 0 0 0 0 0 0 0 0 0 0 0 0 0 0 0 0 0 0 - 0 - - 0 - - 0 - - 0 - - 0 - - 0 -
Equity 0 0 0 0 0 0 0 0 0 0 0 0 0 0 0 0 0 0 - 0 - - 0 - - 0 - - 0 - - 0 - - 0 -Securitisation 0 0 0 0 0 0 0 0 0 0 0 0 0 0 0 0 0 0Othernon-credit obligation assets 0 0 0 0 0 0 0 0 0 0 0 0 0 0 0 0 0 0TOTAL 0 0 0 0 0 0 0 0 0 0 0 0 0 0 0 0 0 0 - 0 - - 0 - - 0 - - 0 - - 0 - - 0 -Securitisation andre-securitisations positions deductedfrom capital * 0 0 0 0 0 0 0 0 0 0 0 0
(mln EUR, %)Non-defaulted Defaulted Non-defaulted Defaulted Non-defaulted Defaulted Non-defaulted Defaulted Non-defaulted Defaulted Non-defaulted Defaulted Non-defaulted Defaulted Non-defaulted Defaulted Non-defaulted Defaulted
Impairmentrate
Stockof Provisions
Coverage Ratio -
Default Stock
Impairmentrate
Stockof Provisions
CoverageRatio-Default
Stock
Impairmentrate
Stockof Provisions
CoverageRatio -Default
Stock Impairment rate
Stockof Provisions
CoverageRatio-Default
Stock
Impairmentrate
Stockof Provisions
CoverageRatio-Default
Stock
Impairmentrate
Stockof Provisions
CoverageRatio -Default
Stock
Central banksandcentral governments 0 0 0 0 0 0 0 0 0 0 0 0 0 0 0 0 0 0 - 0 - - 0 - - 0 - - 0 - - 0 - - 0 -Institutions 0 0 0 0 0 0 0 0 0 0 0 0 0 0 0 0 0 0 - 0 - - 0 - - 0 - - 0 - - 0 - - 0 -Corporates 0 0 0 0 0 0 0 0 0 0 0 0 0 0 0 0 0 0 - 0 - - 0 - - 0 - - 0 - - 0 - - 0 -
Corporates - OfWhich:SpecialisedLending 0 0 0 0 0 0 0 0 0 0 0 0 0 0 0 0 0 0 - 0 - - 0 - - 0 - - 0 - - 0 - - 0 -Corporates -OfWhich: SME 0 0 0 0 0 0 0 0 0 0 0 0 0 0 0 0 0 0 - 0 - - 0 - - 0 - - 0 - - 0 - - 0 -
Retail 0 0 0 0 0 0 0 0 0 0 0 0 0 0 0 0 0 0 - 0 - - 0 - - 0 - - 0 - - 0 - - 0 -Retail -Securedon real estateproperty 0.0% 0 0 0 0 0 0 0 0 0 0 0 0 0 0 0 0 0 0 - 0 - - 0 - - 0 - - 0 - - 0 - - 0 -
Retail -Securedon real estate property-Of hi h: E
0.0% 0 0 0 0 0 0 0 0 0 0 0 0 0 0 0 0 0 0 - 0 - - 0 - - 0 - - 0 - - 0 - - 0 -Retail -Securedon real estate property-Of
h i h: n n - E0.0% 0 0 0 0 0 0 0 0 0 0 0 0 0 0 0 0 0 0 - 0 - - 0 - - 0 - - 0 - - 0 - - 0 -
Retail -QualifyingRevolving 0 0 0 0 0 0 0 0 0 0 0 0 0 0 0 0 0 0 - 0 - - 0 - - 0 - - 0 - - 0 - - 0 -Retail -OtherRetail 0 0 0 0 0 0 0 0 0 0 0 0 0 0 0 0 0 0 - 0 - - 0 - - 0 - - 0 - - 0 - - 0 -
Retail -OtherRetail -OfWhich:SME 0 0 0 0 0 0 0 0 0 0 0 0 0 0 0 0 0 0 - 0 - - 0 - - 0 - - 0 - - 0 - - 0 -Retail -OtherRetail -OfWhich:non-SME 0 0 0 0 0 0 0 0 0 0 0 0 0 0 0 0 0 0 - 0 - - 0 - - 0 - - 0 - - 0 - - 0 -
Equity 0 0 0 0 0 0 0 0 0 0 0 0 0 0 0 0 0 0 - 0 - - 0 - - 0 - - 0 - - 0 - - 0 -Securitisation 0 0 0 0 0 0 0 0 0 0 0 0 0 0 0 0 0 0Othernon-credit obligation assets 0 0 0 0 0 0 0 0 0 0 0 0 0 0 0 0 0 0TOTAL 0 0 0 0 0 0 0 0 0 0 0 0 0 0 0 0 0 0 - 0 - - 0 - - 0 - - 0 - - 0 - - 0 -Securitisation andre-securitisations positions deductedfrom capital * 0 0 0 0 0 0 0 0 0 0 0 0
(mln EUR, %)Non-defaulted Defaulted Non-defaulted Defaulted Non-defaulted Defaulted Non-defaulted Defaulted Non-defaulted Defaulted Non-defaulted Defaulted Non-defaulted Defaulted Non-defaulted Defaulted Non-defaulted Defaulted
Impairmentrate
Stockof Provisions
Coverage Ratio -
Default Stock
Impairmentrate
Stockof Provisions
CoverageRatio-Default
Stock
Impairmentrate
Stockof Provisions
CoverageRatio -Default
Stock Impairment rate
Stockof Provisions
CoverageRatio-Default
Stock
Impairmentrate
Stockof Provisions
CoverageRatio-Default
Stock
Impairmentrate
Stockof Provisions
CoverageRatio -Default
Stock
Central banksandcentral governments 0 0 0 0 0 0 0 0 0 0 0 0 0 0 0 0 0 0 - 0 - - 0 - - 0 - - 0 - - 0 - - 0 -Institutions 0 0 0 0 0 0 0 0 0 0 0 0 0 0 0 0 0 0 - 0 - - 0 - - 0 - - 0 - - 0 - - 0 -Corporates 0 0 0 0 0 0 0 0 0 0 0 0 0 0 0 0 0 0 - 0 - - 0 - - 0 - - 0 - - 0 - - 0 -
Corporates - OfWhich:SpecialisedLending 0 0 0 0 0 0 0 0 0 0 0 0 0 0 0 0 0 0 - 0 - - 0 - - 0 - - 0 - - 0 - - 0 -Corporates -OfWhich: SME 0 0 0 0 0 0 0 0 0 0 0 0 0 0 0 0 0 0 - 0 - - 0 - - 0 - - 0 - - 0 - - 0 -
Retail 0 0 0 0 0 0 0 0 0 0 0 0 0 0 0 0 0 0 - 0 - - 0 - - 0 - - 0 - - 0 - - 0 -Retail -Securedon real estateproperty 0.0% 0 0 0 0 0 0 0 0 0 0 0 0 0 0 0 0 0 0 - 0 - - 0 - - 0 - - 0 - - 0 - - 0 -
Retail -Securedon real estate property-Of hi h: E
0.0% 0 0 0 0 0 0 0 0 0 0 0 0 0 0 0 0 0 0 - 0 - - 0 - - 0 - - 0 - - 0 - - 0 -Retail -Securedon real estate property-Of
h i h : n n -S E0.0% 0 0 0 0 0 0 0 0 0 0 0 0 0 0 0 0 0 0 - 0 - - 0 - - 0 - - 0 - - 0 - - 0 -
Retail -QualifyingRevolving 0 0 0 0 0 0 0 0 0 0 0 0 0 0 0 0 0 0 - 0 - - 0 - - 0 - - 0 - - 0 - - 0 -Retail -OtherRetail 0 0 0 0 0 0 0 0 0 0 0 0 0 0 0 0 0 0 - 0 - - 0 - - 0 - - 0 - - 0 - - 0 -
Retail -OtherRetail -OfWhich:SME 0 0 0 0 0 0 0 0 0 0 0 0 0 0 0 0 0 0 - 0 - - 0 - - 0 - - 0 - - 0 - - 0 -Retail -OtherRetail -OfWhich:non-SME 0 0 0 0 0 0 0 0 0 0 0 0 0 0 0 0 0 0 - 0 - - 0 - - 0 - - 0 - - 0 - - 0 -
Equity 0 0 0 0 0 0 0 0 0 0 0 0 0 0 0 0 0 0 - 0 - - 0 - - 0 - - 0 - - 0 - - 0 -Securitisation 0 0 0 0 0 0 0 0 0 0 0 0 0 0 0 0 0 0Othernon-credit obligation assets 0 0 0 0 0 0 0 0 0 0 0 0 0 0 0 0 0 0TOTAL 0 0 0 0 0 0 0 0 0 0 0 0 0 0 0 0 0 0 - 0 - - 0 - - 0 - - 0 - - 0 - - 0 -Securitisation andre-securitisations positions deductedfrom capital * 0 0 0 0 0 0 0 0 0 0 0 0
(mln EUR, %)Non-defaulted Defaulted Non-defaulted Defaulted Non-defaulted Defaulted Non-defaulted Defaulted Non-defaulted Defaulted Non-defaulted Defaulted Non-defaulted Defaulted Non-defaulted Defaulted Non-defaulted Defaulted
Impairmentrate
Stockof Provisions
Coverage Ratio -Default Stock
Impairmentrate
Stockof Provisions
CoverageRatio-Default
Stock
Impairmentrate
Stockof Provisions
CoverageRatio -Default
Stock Impairment rate
Stockof Provisions
CoverageRatio-Default
Stock
Impairmentrate
Stockof Provisions
CoverageRatio-Default
Stock
Impairmentrate
Stockof Provisions
CoverageRatio -Default
Stock
Central banksandcentral governments 0 0 0 0 0 0 0 0 0 0 0 0 0 0 0 0 0 0 - 0 - - 0 - - 0 - - 0 - - 0 - - 0 -Institutions 0 0 0 0 0 0 0 0 0 0 0 0 0 0 0 0 0 0 - 0 - - 0 - - 0 - - 0 - - 0 - - 0 -Corporates 0 0 0 0 0 0 0 0 0 0 0 0 0 0 0 0 0 0 - 0 - - 0 - - 0 - - 0 - - 0 - - 0 -
Corporates - OfWhich:SpecialisedLending 0 0 0 0 0 0 0 0 0 0 0 0 0 0 0 0 0 0 - 0 - - 0 - - 0 - - 0 - - 0 - - 0 -Corporates -OfWhich: SME 0 0 0 0 0 0 0 0 0 0 0 0 0 0 0 0 0 0 - 0 - - 0 - - 0 - - 0 - - 0 - - 0 -
Retail 0 0 0 0 0 0 0 0 0 0 0 0 0 0 0 0 0 0 - 0 - - 0 - - 0 - - 0 - - 0 - - 0 -Retail -Securedon real estateproperty 0.0% 0 0 0 0 0 0 0 0 0 0 0 0 0 0 0 0 0 0 - 0 - - 0 - - 0 - - 0 - - 0 - - 0 -
Retail -Securedon real estate property-Of hi h: E
0.0% 0 0 0 0 0 0 0 0 0 0 0 0 0 0 0 0 0 0 - 0 - - 0 - - 0 - - 0 - - 0 - - 0 -Retail -Securedon real estate property-Of
h i h: n n - E0.0% 0 0 0 0 0 0 0 0 0 0 0 0 0 0 0 0 0 0 - 0 - - 0 - - 0 - - 0 - - 0 - - 0 -
Retail -QualifyingRevolving 0 0 0 0 0 0 0 0 0 0 0 0 0 0 0 0 0 0 - 0 - - 0 - - 0 - - 0 - - 0 - - 0 -Retail -OtherRetail 0 0 0 0 0 0 0 0 0 0 0 0 0 0 0 0 0 0 - 0 - - 0 - - 0 - - 0 - - 0 - - 0 -
Retail -OtherRetail -OfWhich:SME 0 0 0 0 0 0 0 0 0 0 0 0 0 0 0 0 0 0 - 0 - - 0 - - 0 - - 0 - - 0 - - 0 -Retail -OtherRetail -OfWhich:non-SME 0 0 0 0 0 0 0 0 0 0 0 0 0 0 0 0 0 0 - 0 - - 0 - - 0 - - 0 - - 0 - - 0 -
Equity 0 0 0 0 0 0 0 0 0 0 0 0 0 0 0 0 0 0 - 0 - - 0 - - 0 - - 0 - - 0 - - 0 -Securitisation 0 0 0 0 0 0 0 0 0 0 0 0 0 0 0 0 0 0Othernon-credit obligation assets 0 0 0 0 0 0 0 0 0 0 0 0 0 0 0 0 0 0TOTAL 0 0 0 0 0 0 0 0 0 0 0 0 0 0 0 0 0 0 - 0 - - 0 - - 0 - - 0 - - 0 - - 0 -Securitisation andre-securitisations positions deductedfrom capital * 0 0 0 0 0 0 0 0 0 0 0 0
as of 31/12/2016 as of 31/12/2014 as of 31/12/2015 as of 31/12/2016
0
F-IRB A-IRB STA a s of 3 1/ 12 /2 01 4 a s of 3 1/ 12 /2 01 5LTV %(asof
31/12/2013)
Exposure values (as of 31/12/2013) Risk exposure amounts (as of 31/12/2013) Value adjustments and provisions (as of 31/12/2013) Baseline Scenario Adverse Scenario
F-IRB A-IRB STA F-IRB A-IRB STA
LTV %(asof
31/12/2013)
Exposure values (as of 31/12/2013) Risk exposure amounts (as of 31/12/2013) Value adjustments and provisions (as of 31/12/2013) Baseline Scenario Adverse Scenario
F-IRB A-IRB STA F-IRB A-IRB STA F-IRB a sof 31 /12 /2 01 4 a so f3 1/ 12 /2 01 5 a sof 31 /12 /2 01 6 A-IRB STA a sof 31 /1 2/ 20 14 a so f3 1/ 12 /2 01 5 a sof 31 /12 /2 01 6
LTV %(asof
31/12/2013)
Exposure values (as of 31/12/2013) Risk exposure amounts (as of 31/12/2013) Value adjustments and provisions (as of 31/12/2013) Baseline Scenario Adverse Scenario
F-IRB A-IRB STA F-IRB A-IRB STA F-IRB A-IRB a s of 3 1/ 12 /2 01 5 a s of 3 1/ 12 /2 01 6STA as of 31/12/2014 as of 31/12/2015 as of 31/12/2016 as of 31/12/2014
Risk exposureamounts(as of31/12/2013)
Baseline Scenario Adverse Scenario
F-IRB A-IRB STA F-IRB A-IRB STA F-IRB A-IRB STA as of 31/12/2014 as of 31/12/2015 as of 31/12/2016 as of 31/12/2014 as of 31/12/2015 as of 31/12/2016
asof 31/12/2016
Spain
LTV %(asof
31/12/2013)
E xp os ur e va lu es ( as of 3 1/ 12 /2 01 3) R is k e xp os ur e am ou nt s (a s of 3 1/ 12 /2 01 3) V al ue a dj us tm en ts a nd pr ov is io ns ( as o f3 1/ 12 /2 01 3)
AdverseScenario
F-IRB A-IRB STA F-IRB A-IRB STA F-IRB A-IRB STA as of 31/12/2014 as of 31/12/2015 as of 31/12/2016 as of 31/12/2014 as of 31/12/2015 as of 31/12/2016LTV %(asof
31/12/2013)
Exposurevalues(as of31/12/2013)
ES - Caja de Ahorros yPensiones de Barcelona
(*)Referstothepart ofSecuritizationexposurethat isdeductedfrom capital andisnot includedinRWA
Valueadjustmentsand provisions(asof 31/12/2013) BaselineScenario
LTV %(asof
31/12/2013)
Exposure values (as of 31/12/2013) Risk exposure amounts (as of 31/12/2013) Value adjustments and provisions (as of 31/12/2013) Adverse Scenario
F-IRB A-IRB STA F-IRB A-IRB STA F-IRB A-IRB STA
BaselineScenario
as of 31/12/2014 as of 31/12/2015 as of 31/12/2016 as of 31/12/2014 as of 31/12/2015
(*)Referstothepart ofSecuritizationexposurethat isdeductedfrom capital andisnot includedinRWA
(*)Referstothepart ofSecuritizationexposurethat isdeductedfrom capital andisnot includedinRWA
(*)Referstothepart ofSecuritizationexposurethat isdeductedfrom capital andisnot includedinRWA
(*)Referstothepart ofSecuritizationexposurethat isdeductedfrom capital andisnot includedinRWA
(*)Referstothepart ofSecuritizationexposurethat isdeductedfrom capital andisnot includedinRWA
0
0
0
http://www.economiaciudadana.org/
2014 EU-wide Stress TestCredit Risk
31 1 13) 31 1 13) 31 1 13)
AdverseScenario
F IRB A IRB STA F IRB A IRB STA F IRB A IRB STA f 31/12/2014 f 31/12/2015 f 31/12/2016 f 31/12/2014 f 31/12/2015 f 31/12/2016
E xp os ur e va lu es ( as of 3 1/ 12 /2 01 3) R is k e xp os ur e am ou nt s (a s of 3 1/ 12 /2 01 3) Valueadjustmentsand provisions(asof 31/12/2013) BaselineScenario

8/10/2019 Test Stress Banca Española 2014
http://slidepdf.com/reader/full/test-stress-banca-espanola-2014 36/240
(mln EUR, %)Non-defaulted Defaulted Non-defaulted Defaulted Non-defaulted Defaulted Non-defaulted Defaulted Non-defaulted Defaulted Non-defaulted Defaulted Non-defaulted Defaulted Non-defaulted Defaulted Non-defaulted Defaulted
Impairmentrate
Stockof Provisions
Coverage Ratio -
Default Stock
Impairmentrate
Stockof Provisions
CoverageRatio-Default
Stock
Impairmentrate
Stockof Provisions
CoverageRatio -Default
Stock Impairment rate
Stockof Provisions
CoverageRatio-Default
Stock
Impairmentrate
Stockof Provisions
CoverageRatio-Default
Stock
Impairmentrate
Stockof Provisions
CoverageRatio -Default
Stock
Central banksandcentral governments 0 0 0 0 0 0 0 0 0 0 0 0 0 0 0 0 0 0 - 0 - - 0 - - 0 - - 0 - - 0 - - 0 -Institutions 0 0 0 0 0 0 0 0 0 0 0 0 0 0 0 0 0 0 - 0 - - 0 - - 0 - - 0 - - 0 - - 0 -Corporates 0 0 0 0 0 0 0 0 0 0 0 0 0 0 0 0 0 0 - 0 - - 0 - - 0 - - 0 - - 0 - - 0 -
Corporates - OfWhich:SpecialisedLending 0 0 0 0 0 0 0 0 0 0 0 0 0 0 0 0 0 0 - 0 - - 0 - - 0 - - 0 - - 0 - - 0 -Corporates -OfWhich: SME 0 0 0 0 0 0 0 0 0 0 0 0 0 0 0 0 0 0 - 0 - - 0 - - 0 - - 0 - - 0 - - 0 -
Retail 0 0 0 0 0 0 0 0 0 0 0 0 0 0 0 0 0 0 - 0 - - 0 - - 0 - - 0 - - 0 - - 0 -Retail -Securedon real estateproperty 0.0% 0 0 0 0 0 0 0 0 0 0 0 0 0 0 0 0 0 0 - 0 - - 0 - - 0 - - 0 - - 0 - - 0 -
Retail -Securedon real estate property-Of hi h: E
0.0% 0 0 0 0 0 0 0 0 0 0 0 0 0 0 0 0 0 0 - 0 - - 0 - - 0 - - 0 - - 0 - - 0 -Retail -Securedon real estate property-Of
h i h: n n - E0.0% 0 0 0 0 0 0 0 0 0 0 0 0 0 0 0 0 0 0 - 0 - - 0 - - 0 - - 0 - - 0 - - 0 -
Retail -QualifyingRevolving 0 0 0 0 0 0 0 0 0 0 0 0 0 0 0 0 0 0 - 0 - - 0 - - 0 - - 0 - - 0 - - 0 -Retail -OtherRetail 0 0 0 0 0 0 0 0 0 0 0 0 0 0 0 0 0 0 - 0 - - 0 - - 0 - - 0 - - 0 - - 0 -
Retail -OtherRetail -OfWhich:SME 0 0 0 0 0 0 0 0 0 0 0 0 0 0 0 0 0 0 - 0 - - 0 - - 0 - - 0 - - 0 - - 0 -Retail -OtherRetail -OfWhich:non-SME 0 0 0 0 0 0 0 0 0 0 0 0 0 0 0 0 0 0 - 0 - - 0 - - 0 - - 0 - - 0 - - 0 -
Equity 0 0 0 0 0 0 0 0 0 0 0 0 0 0 0 0 0 0 - 0 - - 0 - - 0 - - 0 - - 0 - - 0 -Securitisation 0 0 0 0 0 0 0 0 0 0 0 0 0 0 0 0 0 0Othernon-credit obligation assets 0 0 0 0 0 0 0 0 0 0 0 0 0 0 0 0 0 0TOTAL 0 0 0 0 0 0 0 0 0 0 0 0 0 0 0 0 0 0 - 0 - - 0 - - 0 - - 0 - - 0 - - 0 -Securitisation andre-securitisations positions deductedfrom capital * 0 0 0 0 0 0 0 0 0 0 0 0
(mln EUR, %)Non-defaulted Defaulted Non-defaulted Defaulted Non-defaulted Defaulted Non-defaulted Defaulted Non-defaulted Defaulted Non-defaulted Defaulted Non-defaulted Defaulted Non-defaulted Defaulted Non-defaulted Defaulted
Impairmentrate
Stockof Provisions
Coverage Ratio -Default Stock
Impairmentrate
Stockof Provisions
CoverageRatio-Default
Stock
Impairmentrate
Stockof Provisions
CoverageRatio -Default
Stock Impairment rate
Stockof Provisions
CoverageRatio-Default
Stock
Impairmentrate
Stockof Provisions
CoverageRatio-Default
Stock
Impairmentrate
Stockof Provisions
CoverageRatio -Default
Stock
Central banksandcentral governments 0 0 0 0 0 0 0 0 0 0 0 0 0 0 0 0 0 0 - 0 - - 0 - - 0 - - 0 - - 0 - - 0 -Institutions 0 0 0 0 0 0 0 0 0 0 0 0 0 0 0 0 0 0 - 0 - - 0 - - 0 - - 0 - - 0 - - 0 -Corporates 0 0 0 0 0 0 0 0 0 0 0 0 0 0 0 0 0 0 - 0 - - 0 - - 0 - - 0 - - 0 - - 0 -
Corporates - OfWhich:SpecialisedLending 0 0 0 0 0 0 0 0 0 0 0 0 0 0 0 0 0 0 - 0 - - 0 - - 0 - - 0 - - 0 - - 0 -Corporates -OfWhich: SME 0 0 0 0 0 0 0 0 0 0 0 0 0 0 0 0 0 0 - 0 - - 0 - - 0 - - 0 - - 0 - - 0 -
Retail 0 0 0 0 0 0 0 0 0 0 0 0 0 0 0 0 0 0 - 0 - - 0 - - 0 - - 0 - - 0 - - 0 -Retail -Securedon real estateproperty 0.0% 0 0 0 0 0 0 0 0 0 0 0 0 0 0 0 0 0 0 - 0 - - 0 - - 0 - - 0 - - 0 - - 0 -
Retail -Securedon real estate property-Of h i h : S E
0.0% 0 0 0 0 0 0 0 0 0 0 0 0 0 0 0 0 0 0 - 0 - - 0 - - 0 - - 0 - - 0 - - 0 -Retail -Securedon real estate property-Of
h i h: n n - E0.0% 0 0 0 0 0 0 0 0 0 0 0 0 0 0 0 0 0 0 - 0 - - 0 - - 0 - - 0 - - 0 - - 0 -
Retail -QualifyingRevolving 0 0 0 0 0 0 0 0 0 0 0 0 0 0 0 0 0 0 - 0 - - 0 - - 0 - - 0 - - 0 - - 0 -Retail -OtherRetail 0 0 0 0 0 0 0 0 0 0 0 0 0 0 0 0 0 0 - 0 - - 0 - - 0 - - 0 - - 0 - - 0 -
Retail -OtherRetail -OfWhich:SME 0 0 0 0 0 0 0 0 0 0 0 0 0 0 0 0 0 0 - 0 - - 0 - - 0 - - 0 - - 0 - - 0 -Retail -OtherRetail -OfWhich:non-SME 0 0 0 0 0 0 0 0 0 0 0 0 0 0 0 0 0 0 - 0 - - 0 - - 0 - - 0 - - 0 - - 0 -
Equity 0 0 0 0 0 0 0 0 0 0 0 0 0 0 0 0 0 0 - 0 - - 0 - - 0 - - 0 - - 0 - - 0 -Securitisation 0 0 0 0 0 0 0 0 0 0 0 0 0 0 0 0 0 0Othernon-credit obligation assets 0 0 0 0 0 0 0 0 0 0 0 0 0 0 0 0 0 0TOTAL 0 0 0 0 0 0 0 0 0 0 0 0 0 0 0 0 0 0 - 0 - - 0 - - 0 - - 0 - - 0 - - 0 -Securitisation andre-securitisations positions deductedfrom capital * 0 0 0 0 0 0 0 0 0 0 0 0
(mln EUR, %)Non-defaulted Defaulted Non-defaulted Defaulted Non-defaulted Defaulted Non-defaulted Defaulted Non-defaulted Defaulted Non-defaulted Defaulted Non-defaulted Defaulted Non-defaulted Defaulted Non-defaulted Defaulted Impairment
rateStockof
ProvisionsCoverage Ratio -
Default Stock
Impairmentrate
Stockof Provisions
Coverage
Ratio-Default
Stock
Impairmentrate
Stockof Provisions
Coverage
Ratio -Default
Stock
Impairment rateStockof
Provisions
Coverage
Ratio-Default
Stock
Impairmentrate
Stockof Provisions
Coverage
Ratio-Default
Stock
Impairmentrate
Stockof Provisions
Coverage
Ratio -Default
Stock
Central banksandcentral governments 0 0 0 0 0 0 0 0 0 0 0 0 0 0 0 0 0 0 - 0 - - 0 - - 0 - - 0 - - 0 - - 0 -Institutions 0 0 0 0 0 0 0 0 0 0 0 0 0 0 0 0 0 0 - 0 - - 0 - - 0 - - 0 - - 0 - - 0 -Corporates 0 0 0 0 0 0 0 0 0 0 0 0 0 0 0 0 0 0 - 0 - - 0 - - 0 - - 0 - - 0 - - 0 -
Corporates - OfWhich:SpecialisedLending 0 0 0 0 0 0 0 0 0 0 0 0 0 0 0 0 0 0 - 0 - - 0 - - 0 - - 0 - - 0 - - 0 -Corporates -OfWhich: SME 0 0 0 0 0 0 0 0 0 0 0 0 0 0 0 0 0 0 - 0 - - 0 - - 0 - - 0 - - 0 - - 0 -
Retail 0 0 0 0 0 0 0 0 0 0 0 0 0 0 0 0 0 0 - 0 - - 0 - - 0 - - 0 - - 0 - - 0 -Retail -Securedon real estateproperty 0.0% 0 0 0 0 0 0 0 0 0 0 0 0 0 0 0 0 0 0 - 0 - - 0 - - 0 - - 0 - - 0 - - 0 -
Retail -Securedon real estate property-Of hi h: E
0.0% 0 0 0 0 0 0 0 0 0 0 0 0 0 0 0 0 0 0 - 0 - - 0 - - 0 - - 0 - - 0 - - 0 -Retail -Securedon real estate property-Of
h i h: n n - E0.0% 0 0 0 0 0 0 0 0 0 0 0 0 0 0 0 0 0 0 - 0 - - 0 - - 0 - - 0 - - 0 - - 0 -
Retail -QualifyingRevolving 0 0 0 0 0 0 0 0 0 0 0 0 0 0 0 0 0 0 - 0 - - 0 - - 0 - - 0 - - 0 - - 0 -Retail -OtherRetail 0 0 0 0 0 0 0 0 0 0 0 0 0 0 0 0 0 0 - 0 - - 0 - - 0 - - 0 - - 0 - - 0 -
Retail -OtherRetail -OfWhich:SME 0 0 0 0 0 0 0 0 0 0 0 0 0 0 0 0 0 0 - 0 - - 0 - - 0 - - 0 - - 0 - - 0 -Retail -OtherRetail -OfWhich:non-SME 0 0 0 0 0 0 0 0 0 0 0 0 0 0 0 0 0 0 - 0 - - 0 - - 0 - - 0 - - 0 - - 0 -
Equity 0 0 0 0 0 0 0 0 0 0 0 0 0 0 0 0 0 0 - 0 - - 0 - - 0 - - 0 - - 0 - - 0 -Securitisation 0 0 0 0 0 0 0 0 0 0 0 0 0 0 0 0 0 0Othernon-credit obligation assets 0 0 0 0 0 0 0 0 0 0 0 0 0 0 0 0 0 0TOTAL 0 0 0 0 0 0 0 0 0 0 0 0 0 0 0 0 0 0 - 0 - - 0 - - 0 - - 0 - - 0 - - 0 -Securitisation andre-securitisations positions deductedfrom capital * 0 0 0 0 0 0 0 0 0 0 0 0
(mln EUR, %)Non-defaulted Defaulted Non-defaulted Defaulted Non-defaulted Defaulted Non-defaulted Defaulted Non-defaulted Defaulted Non-defaulted Defaulted Non-defaulted Defaulted Non-defaulted Defaulted Non-defaulted Defaulted Impairment
rateStockof
ProvisionsCoverage Ratio -
Default Stock
Impairmentrate
Stockof Provisions
Coverage
Ratio-Default
Stock
Impairmentrate
Stockof Provisions
Coverage
Ratio -Default
Stock
Impairment rateStockof
Provisions
Coverage
Ratio-Default
Stock
Impairmentrate
Stockof Provisions
Coverage
Ratio-Default
Stock
Impairmentrate
Stockof Provisions
Coverage
Ratio -Default
Stock
Central banksandcentral governments 0 0 0 0 0 0 0 0 0 0 0 0 0 0 0 0 0 0 - 0 - - 0 - - 0 - - 0 - - 0 - - 0 -
Institutions 0 0 0 0 0 0 0 0 0 0 0 0 0 0 0 0 0 0 - 0 - - 0 - - 0 - - 0 - - 0 - - 0 -Corporates 0 0 0 0 0 0 0 0 0 0 0 0 0 0 0 0 0 0 - 0 - - 0 - - 0 - - 0 - - 0 - - 0 -
Corporates - OfWhich:SpecialisedLending 0 0 0 0 0 0 0 0 0 0 0 0 0 0 0 0 0 0 - 0 - - 0 - - 0 - - 0 - - 0 - - 0 -Corporates -OfWhich: SME 0 0 0 0 0 0 0 0 0 0 0 0 0 0 0 0 0 0 - 0 - - 0 - - 0 - - 0 - - 0 - - 0 -
Retail 0 0 0 0 0 0 0 0 0 0 0 0 0 0 0 0 0 0 - 0 - - 0 - - 0 - - 0 - - 0 - - 0 -Retail -Securedon real estateproperty 0.0% 0 0 0 0 0 0 0 0 0 0 0 0 0 0 0 0 0 0 - 0 - - 0 - - 0 - - 0 - - 0 - - 0 -
Retail -Securedon real estate property-Of h i h : S E
0.0% 0 0 0 0 0 0 0 0 0 0 0 0 0 0 0 0 0 0 - 0 - - 0 - - 0 - - 0 - - 0 - - 0 -Retail -Securedon real estate property-Of
h i h: n n - E0.0% 0 0 0 0 0 0 0 0 0 0 0 0 0 0 0 0 0 0 - 0 - - 0 - - 0 - - 0 - - 0 - - 0 -
Retail -QualifyingRevolving 0 0 0 0 0 0 0 0 0 0 0 0 0 0 0 0 0 0 - 0 - - 0 - - 0 - - 0 - - 0 - - 0 -Retail -OtherRetail 0 0 0 0 0 0 0 0 0 0 0 0 0 0 0 0 0 0 - 0 - - 0 - - 0 - - 0 - - 0 - - 0 -
Retail -OtherRetail -OfWhich:SME 0 0 0 0 0 0 0 0 0 0 0 0 0 0 0 0 0 0 - 0 - - 0 - - 0 - - 0 - - 0 - - 0 -Retail -OtherRetail -OfWhich:non-SME 0 0 0 0 0 0 0 0 0 0 0 0 0 0 0 0 0 0 - 0 - - 0 - - 0 - - 0 - - 0 - - 0 -
Equity 0 0 0 0 0 0 0 0 0 0 0 0 0 0 0 0 0 0 - 0 - - 0 - - 0 - - 0 - - 0 - - 0 -Securitisation 0 0 0 0 0 0 0 0 0 0 0 0 0 0 0 0 0 0Othernon-credit obligation assets 0 0 0 0 0 0 0 0 0 0 0 0 0 0 0 0 0 0TOTAL 0 0 0 0 0 0 0 0 0 0 0 0 0 0 0 0 0 0 - 0 - - 0 - - 0 - - 0 - - 0 - - 0 -Securitisation andre-securitisations positions deductedfrom capital * 0 0 0 0 0 0 0 0 0 0 0 0
(mln EUR, %)Non-defaulted Defaulted Non-defaulted Defaulted Non-defaulted Defaulted Non-defaulted Defaulted Non-defaulted Defaulted Non-defaulted Defaulted Non-defaulted Defaulted Non-defaulted Defaulted Non-defaulted Defaulted Impairment
rateStockof
ProvisionsCoverage Ratio -
Default Stock
Impairmentrate
Stockof Provisions
Coverage
Ratio-Default
Stock
Impairmentrate
Stockof Provisions
Coverage
Ratio -Default
Stock
Impairment rateStockof
Provisions
Coverage
Ratio-Default
Stock
Impairmentrate
Stockof Provisions
Coverage
Ratio-Default
Stock
Impairmentrate
Stockof Provisions
Coverage
Ratio -Default
Stock
Central banksandcentral governments 0 0 0 0 0 0 0 0 0 0 0 0 0 0 0 0 0 0 - 0 - - 0 - - 0 - - 0 - - 0 - - 0 -Institutions 0 0 0 0 0 0 0 0 0 0 0 0 0 0 0 0 0 0 - 0 - - 0 - - 0 - - 0 - - 0 - - 0 -Corporates 0 0 0 0 0 0 0 0 0 0 0 0 0 0 0 0 0 0 - 0 - - 0 - - 0 - - 0 - - 0 - - 0 -
Corporates - OfWhich:SpecialisedLending 0 0 0 0 0 0 0 0 0 0 0 0 0 0 0 0 0 0 - 0 - - 0 - - 0 - - 0 - - 0 - - 0 -Corporates -OfWhich: SME 0 0 0 0 0 0 0 0 0 0 0 0 0 0 0 0 0 0 - 0 - - 0 - - 0 - - 0 - - 0 - - 0 -
Retail 0 0 0 0 0 0 0 0 0 0 0 0 0 0 0 0 0 0 - 0 - - 0 - - 0 - - 0 - - 0 - - 0 -Retail -Securedon real estateproperty 0.0% 0 0 0 0 0 0 0 0 0 0 0 0 0 0 0 0 0 0 - 0 - - 0 - - 0 - - 0 - - 0 - - 0 -
Retail -Securedon real estate property-Of hi h: E
0.0% 0 0 0 0 0 0 0 0 0 0 0 0 0 0 0 0 0 0 - 0 - - 0 - - 0 - - 0 - - 0 - - 0 -Retail -Securedon real estate property-Of
h i h : n n -S E0.0% 0 0 0 0 0 0 0 0 0 0 0 0 0 0 0 0 0 0 - 0 - - 0 - - 0 - - 0 - - 0 - - 0 -
Retail -QualifyingRevolving 0 0 0 0 0 0 0 0 0 0 0 0 0 0 0 0 0 0 - 0 - - 0 - - 0 - - 0 - - 0 - - 0 -Retail -OtherRetail 0 0 0 0 0 0 0 0 0 0 0 0 0 0 0 0 0 0 - 0 - - 0 - - 0 - - 0 - - 0 - - 0 -
Retail -OtherRetail -OfWhich:SME 0 0 0 0 0 0 0 0 0 0 0 0 0 0 0 0 0 0 - 0 - - 0 - - 0 - - 0 - - 0 - - 0 -Retail -OtherRetail -OfWhich:non-SME 0 0 0 0 0 0 0 0 0 0 0 0 0 0 0 0 0 0 - 0 - - 0 - - 0 - - 0 - - 0 - - 0 -
Equity 0 0 0 0 0 0 0 0 0 0 0 0 0 0 0 0 0 0 - 0 - - 0 - - 0 - - 0 - - 0 - - 0 -Securitisation 0 0 0 0 0 0 0 0 0 0 0 0 0 0 0 0 0 0Othernon-credit obligation assets 0 0 0 0 0 0 0 0 0 0 0 0 0 0 0 0 0 0TOTAL 0 0 0 0 0 0 0 0 0 0 0 0 0 0 0 0 0 0 - 0 - - 0 - - 0 - - 0 - - 0 - - 0 -Securitisation andre-securitisations positions deductedfrom capital * 0 0 0 0 0 0 0 0 0 0 0 0
LTV %(asof
31/12/2013)
Exposure values (as of 31/12/2013) Risk exposure amounts (as of 31/12/2013) Value adjustments and provisions (as of 31/12/2013) Baseline Scenario Adverse Scenario
F-IRB A-IRB STA F-IRB A-IRB STA as of 31/12/2016 as of 31/12/2014 as of 31/12/2015 as of 31/12/2016F-IRB A-IRB STA a s of 3 1/ 12 /2 01 4 a s of 3 1/ 12 /2 01 5
LTV %(asof
31/12/2013)
Exposure values (as of 31/12/2013) Risk exposure amounts (as of 31/12/2013) Value adjustments and provisions (as of 31/12/2013) Baseline Scenario Adverse Scenario
F-IRB A-IRB STA F-IRB A-IRB STA F-IRB a sof 31 /12 /2 01 4 a so f3 1/ 12 /2 01 5 a sof 31 /12 /2 01 6 A-IRB STA a sof 31 /1 2/ 20 14 a so f3 1/ 12 /2 01 5 a sof 31 /12 /2 01 6
LTV %(asof
31/12/2013)
Exposure values (as of 31/12/2013) Risk exposure amounts (as of 31/12/2013) Value adjustments and provisions (as of 31/12/2013) Baseline Scenario Adverse Scenario
F-IRB A-IRB STA F-IRB A-IRB STA F-IRB A-IRB a s of 3 1/ 12 /2 01 5 a s of 3 1/ 12 /2 01 6STA as of 31/12/2014 as of 31/12/2015 as of 31/12/2016 as of 31/12/2014
AdverseScenario
F-IRB A-IRB STA F-IRB A-IRB STA F-IRB A-IRB STA as of 31/12/2014 as of 31/12/2015 as of 31/12/2016 as of 31/12/2014 as of 31/12/2015 as of 31/12/2016LTV %(asof
31/12/2013)
E xp os ur e va lu es ( as of 3 1/ 12 /2 01 3) R is k e xp os ur e am ou nt s (a s of 3 1/ 12 /2 01 3) V al ue a dj us tm en ts a nd pr ov is io ns ( as o f3 1/ 12 /2 01 3)
F-IRB A-IRB STA F-IRB A-IRB STA F-IRB A-IRB STA as of 31/12/2014 as of 31/12/2015 as of 31/12/2016 as of 31/12/2014 as of 31/12/2015 as of 31/12/2016LTV %(asof
31/12/2013)
BaselineScenario
(*)Referstothepart ofSecuritizationexposurethat isdeductedfrom capital andisnot includedinRWA
(*)Referstothepart ofSecuritizationexposurethat isdeductedfrom capital andisnot includedinRWA
(*)Referstothepart ofSecuritizationexposurethat isdeductedfrom capital andisnot includedinRWA
(*)Referstothepart ofSecuritizationexposurethat isdeductedfrom capital andisnot includedinRWA
(*)Referstothepart ofSecuritizationexposurethat isdeductedfrom capital andisnot includedinRWA
0
0
0
0
0
http://www.economiaciudadana.org/
2014 EU id St T t

8/10/2019 Test Stress Banca Española 2014
http://slidepdf.com/reader/full/test-stress-banca-espanola-2014 37/240
2014 EU-wide Stress Test
P&L
(mln EUR) 31/12/2014 31/12/2015 31/12/2016 31/12/2014 31/12/2015 31/12/2016
Net interest income 3,203 3,203 3,203 3,203 3,155 3,203 3,203
Net trading income -163 -98 -65 -199 -120 -80
of which trading losses from stress scenarios -164 -98 -65 -200 -120 -80
Other operating income 322 -248 -248 -248 -314 -314 -314
Operating profit before impairments 740 1,109 1,191 1,250 833 912 1,005
Impairment of financial assets (-) -4,214 -1,185 -746 -592 -3,344 -2,246 -1,596
Impairment of financial assets other than instruments designated at fair value
through P&L (-)-4,214 -1,185 -746 -592 -3,344 -2,246 -1,596
Impairment Financial assets designated at fair value through P&L (-) 0 0 0 0 0 0 0
Impairment on non financial assets (-) -1,231 0 0 0 0 0 0
Operating profit after impairments from stress scenarios -4,705 -76 445 658 -2,511 -1,333 -590
Other Income and expenses 4,119 1,526 1,696 1,962 1,261 1,402 1,584
Pre-Tax profit -586 1,450 2,141 2,620 -1,250 69 994
Tax 1,488 193 37 -27 896 542 346
Net income 902 1,643 2,178 2,593 -354 611 1,340
Attributable to owners of the parent 745 1,222 1,576 1,871 -119 517 1,003
of which carried over to capital through retained earnings 395 872 1,226 1,521 -469 167 653
of which distributed as dividends 350 350 350 350 350 350 350
In the figures above, the original (official published) 2013 P&L figures may have been adjusted as part of the ECB Comprehensive Assessment join-up calculation.
31/12/2013
Baseline Scenario Adverse Scenario
http://www.economiaciudadana.org/

8/10/2019 Test Stress Banca Española 2014
http://slidepdf.com/reader/full/test-stress-banca-espanola-2014 38/240
2014 EU-wide Stress Test
RWA
(mln EUR)as of 31/12/2013 as of 31/12/2014 as of 31/12/2015 as of 31/12/2016 as of 31/12/2014 as of 31/12/2015 as of 31/12/2016
Risk exposure amount for credit risk 154,753 155,577 156,125 156,592 156,033 157,093 158,135
Risk exposure amount Securitisation and re-securitisations 248 526 554 571 591 658 701
Risk exposure amount Other credit risk 154,505 155,051 155,572 156,021 155,442 156,436 157,434
Risk exposure amount for market risk 5,027 5,027 5,027 5,027 6,631 6,723 6,784
Risk exposure amount for operational risk 10,899 11,591 11,745 11,855 11,074 11,223 11,397
Transitional floors for Risk exposure amount 0 0 0 0 0 0 0
AQR adjustments (for SSM countries only) 0 0 0 0 0 0 0
Total Risk exposure amount 170,679 172,194 172,897 173,474 173,738 175,039 176,317
Baseline Scenario Adverse Scenario
http://www.economiaciudadana.org/

8/10/2019 Test Stress Banca Española 2014
http://slidepdf.com/reader/full/test-stress-banca-espanola-2014 39/240
(mln EUR) as of 31/12/2013 31/12/2014 31/12/2015 31/12/2016 31/12/2014 31/12/2015 31/12/2016
Banking Book 419
Trading Book (excl. correlation trading positions under CRM) 0
Correlation Trading Portfolio (CRM) 0
Total 419
Banking Book 248 526 554 571 591 658 701
Trading Book (excl. correlation trading positions under CRM) 0 0 0 0 0 0 0
Total 248 526 554 571 591 658 701
Hold to Maturity porfolio 11 19 25 29 28 44 56
Available for Sale porfolio 0 0 0 0 0 0 0
Held for trading portfolioTotal 11 19 25 29 28 44 56
2014 EU-wide Stress Test
Impairments
Baseline scenario Adverse scenario
Exposure values
Risk exposure values
Securitisation
http://www.economiaciudadana.org/
2014 EU-wide Stress Test - Sovereign Exposure

8/10/2019 Test Stress Banca Española 2014
http://slidepdf.com/reader/full/test-stress-banca-espanola-2014 40/240
(mln EUR)
[ 0 - 3M [ 0 0 0 0 0 0 0 0 0 0 0 0 0 0[ 3M - 1Y [ 0 0 0 0 0 0 0 0 0 0 0 0 0 0[ 1Y - 2Y [ 0 0 0 0 0 0 0 0 0 0 0 0 0 0[ 2Y - 3Y [ 0 0 0 0 0 0 0 0 0 0 0 0 0 0[3Y - 5Y [ 0 0 0 0 0 0 0 0 0 0 0 0 0 0[5Y - 10Y [ 0 0 0 0 0 0 0 0 0 0 0 0 0 0[10Y - more 0 0 0 0 0 0 0 0 0 0 0 0 0 0
Tot 0 0 0 0 0 0 0 0 0 0 0 0 0 0
[ 0 - 3M [ 0 0 0 0 0 0 0 0 0 0 0 0 0 0[ 3M - 1Y [ 10 0 10 0 0 10 0 0 0 0 0 0 0 0[ 1Y - 2Y [ 0 0 0 0 0 0 0 0 0 0 0 0 0 0[ 2Y - 3Y [ 0 0 0 0 0 0 0 0 0 0 0 0 0 0[3Y - 5Y [ 0 0 0 0 0 0 0 0 0 0 0 0 0 0[5Y - 10Y [ 0 0 0 0 0 0 0 0 0 0 0 0 0 0[10Y - more 0 0 0 0 0 0 0 0 0 0 0 0 0 0
Tot 10 0 10 0 0 10 0 0 0 0 0 0 0 0
[ 0 - 3M [ 0 0 0 0 0 0 0 0 0 0 0 0 0 0[ 3M - 1Y [ 0 0 0 0 0 0 0 0 0 0 0 0 0 0[ 1Y - 2Y [ 0 0 0 0 0 0 0 0 0 0 0 0 0 0[ 2Y - 3Y [ 0 0 0 0 0 0 0 0 0 0 0 0 0 0[3Y - 5Y [ 0 0 0 0 0 0 0 0 0 0 0 0 0 0[5Y - 10Y [ 0 0 0 0 0 0 0 0 0 0 0 0 0 0
[10Y - more 0 0 0 0 0 0 0 0 0 0 0 0 0 0Tot 0 0 0 0 0 0 0 0 0 0 0 0 0 0
[ 0 - 3M [ 0 0 0 0 0 0 0 0 0 0 0 0 0 0[ 3M - 1Y [ 0 0 0 0 0 0 0 0 0 0 0 0 0 0[ 1Y - 2Y [ 0 0 0 0 0 0 0 0 0 0 0 0 0 0[ 2Y - 3Y [ 0 0 0 0 0 0 0 0 0 0 0 0 0 0[3Y - 5Y [ 0 0 0 0 0 0 0 0 0 0 0 0 0 0[5Y - 10Y [ 0 0 0 0 0 0 0 0 0 0 0 0 0 0[10Y - more 0 0 0 0 0 0 0 0 0 0 0 0 0 0
Tot 0 0 0 0 0 0 0 0 0 0 0 0 0 0
[ 0 - 3M [ 0 0 0 0 0 0 0 0 0 0 0 0 0 0[ 3M - 1Y [ 0 0 0 0 0 0 0 0 0 0 0 0 0 0[ 1Y - 2Y [ 0 0 0 0 0 0 0 0 0 0 0 0 0 0[ 2Y - 3Y [ 0 0 0 0 0 0 0 0 0 0 0 0 0 0[3Y - 5Y [ 0 0 0 0 0 0 0 0 0 0 0 0 0 0[5Y - 10Y [ 0 0 0 0 0 0 0 0 0 0 0 0 0 0
[10Y - more 0 0 0 0 0 0 0 0 0 0 0 0 0 0Tot 0 0 0 0 0 0 0 0 0 0 0 0 0 0
[ 0 - 3M [ 0 0 0 0 0 0 0 0 0 0 0 0 0 0[ 3M - 1Y [ 0 0 0 0 0 0 0 0 0 0 0 0 0 0[ 1Y - 2Y [ 0 0 0 0 0 0 0 0 0 0 0 0 0 0[ 2Y - 3Y [ 0 0 0 0 0 0 0 0 0 0 0 0 0 0[3Y - 5Y [ 0 0 0 0 0 0 0 0 0 0 0 0 0 0[5Y - 10Y [ 0 0 0 0 0 0 0 0 0 0 0 0 0 0[10Y - more 0 0 0 0 0 0 0 0 0 0 0 0 0 0
Tot 0 0 0 0 0 0 0 0 0 0 0 0 0 0
[ 0 - 3M [ 0 0 0 0 0 0 0 0 0 0 0 0 0 0[ 3M - 1Y [ 200 0 200 0 0 200 0 0 0 0 0 0 0 0[ 1Y - 2Y [ 0 0 0 0 0 0 0 0 0 0 0 0 0 0[ 2Y - 3Y [ 349 0 349 349 0 0 0 0 0 0 0 0 0 0[3Y - 5Y [ 2 0 1 0 0 1 0 0 0 0 0 0 0 0[5Y - 10Y [ 0 0 0 0 0 0 0 0 0 0 0 0 0 0[10Y - more 0 0 0 0 0 0 0 0 0 0 0 0 0 0
Tot 552 0 551 349 0 201 0 0 0 0 0 0 0 0
Residual Maturity Country / Region
GROSS DIRECT LONG
EXPOSURES(accounting value grossof provisions)
(1)
NET DIRECT POSITIONS (gross exposures (long) net of cash short
positions of sovereign debt to other counterpaties only where there
is a maturity matching)
(1)
DIRECT SOVEREIGN EXPOSURES IN DERIVATIVES (1)
of which: loansand advances
of which: AFSbanking book
of which: FVO
(designated at fairvalue throughprofit&loss)
banking book
of which: Financial
assets held fortrading
(2)
Derivatives with positive fair value at
31/12/2013
Derivatives with negative fair value at
31/12/2013
Derivatives with positive fair value
at 31/12/2013
Derivatives with negative fair
value at 31/12/2013
VALUES AS OF 31/12/2013 VALUES AS OF 31/12/2013 VALUES AS OF 31/12/2013
INDIRECT SOVEREIGN EXPOSURES (3) (on and off balance sheet)
Fair-value at31/12/2013 (+)
Notional value Fair-value at31/12/2013 (-)
Notional value Fair-value at31/12/2013 (+)
Notional value Fair-value at 31/12/2013(-)
Austria
Belgium
Bulgaria
Cyprus
Notional value
Czech Republic
Denmark
Estonia
Finland
France
http://www.economiaciudadana.org/
2014 EU-wide Stress Test - Sovereign Exposure

8/10/2019 Test Stress Banca Española 2014
http://slidepdf.com/reader/full/test-stress-banca-espanola-2014 41/240
(mln EUR)
Residual Maturity Country / Region
GROSS DIRECT LONG
EXPOSURES(accounting value grossof provisions)
(1)
NET DIRECT POSITIONS (gross exposures (long) net of cash short
positions of sovereign debt to other counterpaties only where there
is a maturity matching)
(1)
DIRECT SOVEREIGN EXPOSURES IN DERIVATIVES (1)
of which: loansand advances
of which: AFSbanking book
of which: FVO
(designated at fair
value throughprofit&loss)
banking book
of which: Financial
assets held fortrading
(2)
Derivatives with positive fair value at
31/12/2013
Derivatives with negative fair value at
31/12/2013
Derivatives with positive fair value
at 31/12/2013
Derivatives with negative fair
value at 31/12/2013
VALUES AS OF 31/12/2013 VALUES AS OF 31/12/2013 VALUES AS OF 31/12/2013
INDIRECT SOVEREIGN EXPOSURES (3) (on and off balance sheet)
Fair-value at31/12/2013 (+)
Notional value Fair-value at31/12/2013 (-)
Notional value Fair-value at31/12/2013 (+)
Notional value Fair-value at 31/12/2013(-)
Notional value
[ 0 - 3M [ 0 0 0 0 0 0 0 0 0 0 0 0 0 0[ 3M - 1Y [ 0 0 0 0 0 0 0 0 0 0 0 0 0 0[ 1Y - 2Y [ 0 0 0 0 0 0 0 0 0 0 0 0 0 0[ 2Y - 3Y [ 72 0 72 72 0 0 0 0 0 0 0 0 0 0[3Y - 5Y [ 0 0 0 0 0 0 0 0 0 0 0 0 0 0[5Y - 10Y [ 0 0 0 0 0 0 0 0 0 0 0 0 0 0[10Y - more 0 0 0 0 0 0 0 0 0 0 0 0 0 0
Tot 73 0 73 72 0 0 0 0 0 0 0 0 0 0
[ 0 - 3M [ 0 0 0 0 0 0 0 0 0 0 0 0 0 0[ 3M - 1Y [ 0 0 0 0 0 0 0 0 0 0 0 0 0 0[ 1Y - 2Y [ 0 0 0 0 0 0 0 0 0 0 0 0 0 0[ 2Y - 3Y [ 0 0 0 0 0 0 0 0 0 0 0 0 0 0[3Y - 5Y [ 0 0 0 0 0 0 0 0 0 0 0 0 0 0[5Y - 10Y [ 0 0 0 0 0 0 0 0 0 0 0 0 0 0[10Y - more 0 0 0 0 0 0 0 0 0 0 0 0 0 0
Tot 0 0 0 0 0 0 0 0 0 0 0 0 0 0
[ 0 - 3M [ 0 0 0 0 0 0 0 0 0 0 0 0 0 0[ 3M - 1Y [ 0 0 0 0 0 0 0 0 0 0 0 0 0 0[ 1Y - 2Y [ 0 0 0 0 0 0 0 0 0 0 0 0 0 0[ 2Y - 3Y [ 0 0 0 0 0 0 0 0 0 0 0 0 0 0[3Y - 5Y [ 0 0 0 0 0 0 0 0 0 0 0 0 0 0[5Y - 10Y [ 0 0 0 0 0 0 0 0 0 0 0 0 0 0
[10Y - more 0 0 0 0 0 0 0 0 0 0 0 0 0 0Tot 0 0 0 0 0 0 0 0 0 0 0 0 0 0
[ 0 - 3M [ 0 0 0 0 0 0 0 0 0 0 0 0 0 0[ 3M - 1Y [ 0 0 0 0 0 0 0 0 0 0 0 0 0 0[ 1Y - 2Y [ 0 0 0 0 0 0 0 0 0 0 0 0 0 0[ 2Y - 3Y [ 0 0 0 0 0 0 0 0 0 0 0 0 0 0[3Y - 5Y [ 0 0 0 0 0 0 0 0 0 0 0 0 0 0[5Y - 10Y [ 0 0 0 0 0 0 0 0 0 0 0 0 0 0[10Y - more 0 0 0 0 0 0 0 0 0 0 0 0 0 0
Tot 0 0 0 0 0 0 0 0 0 0 0 0 0 0
[ 0 - 3M [ 3 0 3 0 0 3 0 0 0 0 0 0 0 0[ 3M - 1Y [ 36 0 19 0 0 19 0 0 0 0 0 0 0 0[ 1Y - 2Y [ 13 0 0 0 0 0 0 0 0 0 0 0 0 0[ 2Y - 3Y [ 27 0 27 0 0 27 0 0 0 0 0 0 0 0[3Y - 5Y [ 11 0 54 0 0 54 0 0 0 0 0 0 0 0[5Y - 10Y [ 10 0 10 0 0 10 0 0 0 0 0 0 0 0
[10Y - more 1 0 1 0 0 1 0 0 0 0 0 0 0 0Tot 100 0 114 0 0 114 0 0 0 0 0 0 0 0
[ 0 - 3M [ 0 0 0 0 0 0 0 0 0 0 0 0 0 0[ 3M - 1Y [ 0 0 0 0 0 0 0 0 0 0 0 0 0 0[ 1Y - 2Y [ 0 0 0 0 0 0 0 0 0 0 0 0 0 0[ 2Y - 3Y [ 0 0 0 0 0 0 0 0 0 0 0 0 0 0[3Y - 5Y [ 0 0 0 0 0 0 0 0 0 0 0 0 0 0[5Y - 10Y [ 0 0 0 0 0 0 0 0 0 0 0 0 0 0[10Y - more 0 0 0 0 0 0 0 0 0 0 0 0 0 0
Tot 0 0 0 0 0 0 0 0 0 0 0 0 0 0
Latvia
Germany
Greece
Hungary
Iceland
Ireland
Italy
Croatia
Liechtenstein
http://www.economiaciudadana.org/
2014 EU-wide Stress Test - Sovereign Exposure

8/10/2019 Test Stress Banca Española 2014
http://slidepdf.com/reader/full/test-stress-banca-espanola-2014 42/240
(mln EUR)
Residual Maturity Country / Region
GROSS DIRECT LONG
EXPOSURES(accounting value grossof provisions)
(1)
NET DIRECT POSITIONS (gross exposures (long) net of cash short
positions of sovereign debt to other counterpaties only where there
is a maturity matching)
(1)
DIRECT SOVEREIGN EXPOSURES IN DERIVATIVES (1)
of which: loansand advances of which: AFSbanking book
of which: FVO
(designated at fair
value throughprofit&loss)
banking book
of which: Financial
assets held fortrading(2)
Derivatives with positive fair value at
31/12/2013
Derivatives with negative fair value at
31/12/2013
Derivatives with positive fair value
at 31/12/2013
Derivatives with negative fair
value at 31/12/2013
VALUES AS OF 31/12/2013 VALUES AS OF 31/12/2013 VALUES AS OF 31/12/2013
INDIRECT SOVEREIGN EXPOSURES (3) (on and off balance sheet)
Fair-value at31/12/2013 (+) Notional value Fair-value at31/12/2013 (-)Notional value Fair-value at31/12/2013 (+) Notional value Fair-value at 31/12/2013(-) Notional value
[ 0 - 3M [ 0 0 0 0 0 0 0 0 0 0 0 0 0 0[ 3M - 1Y [ 0 0 0 0 0 0 0 0 0 0 0 0 0 0[ 1Y - 2Y [ 0 0 0 0 0 0 0 0 0 0 0 0 0 0[ 2Y - 3Y [ 0 0 0 0 0 0 0 0 0 0 0 0 0 0[3Y - 5Y [ 0 0 0 0 0 0 0 0 0 0 0 0 0 0[5Y - 10Y [ 0 0 0 0 0 0 0 0 0 0 0 0 0 0[10Y - more 0 0 0 0 0 0 0 0 0 0 0 0 0 0
Tot 0 0 0 0 0 0 0 0 0 0 0 0 0 0
[ 0 - 3M [ 0 0 0 0 0 0 0 0 0 0 0 0 0 0[ 3M - 1Y [ 0 0 0 0 0 0 0 0 0 0 0 0 0 0[ 1Y - 2Y [ 0 0 0 0 0 0 0 0 0 0 0 0 0 0[ 2Y - 3Y [ 0 0 0 0 0 0 0 0 0 0 0 0 0 0[3Y - 5Y [ 0 0 0 0 0 0 0 0 0 0 0 0 0 0[5Y - 10Y [ 0 0 0 0 0 0 0 0 0 0 0 0 0 0
[10Y - more 0 0 0 0 0 0 0 0 0 0 0 0 0 0Tot 0 0 0 0 0 0 0 0 0 0 0 0 0 0
[ 0 - 3M [ 0 0 0 0 0 0 0 0 0 0 0 0 0 0[ 3M - 1Y [ 0 0 0 0 0 0 0 0 0 0 0 0 0 0[ 1Y - 2Y [ 0 0 0 0 0 0 0 0 0 0 0 0 0 0[ 2Y - 3Y [ 0 0 0 0 0 0 0 0 0 0 0 0 0 0[3Y - 5Y [ 0 0 0 0 0 0 0 0 0 0 0 0 0 0[5Y - 10Y [ 1 0 0 0 0 0 0 0 0 0 0 0 0 0[10Y - more 0 0 0 0 0 0 0 0 0 0 0 0 0 0
Tot 1 0 0 0 0 0 0 0 0 0 0 0 0 0
[ 0 - 3M [ 0 0 0 0 0 0 0 0 0 0 0 0 0 0[ 3M - 1Y [ 0 0 0 0 0 0 0 0 0 0 0 0 0 0[ 1Y - 2Y [ 0 0 0 0 0 0 0 0 0 0 0 0 0 0[ 2Y - 3Y [ 0 0 0 0 0 0 0 0 0 0 0 0 0 0[3Y - 5Y [ 0 0 0 0 0 0 0 0 0 0 0 0 0 0[5Y - 10Y [ 0 0 0 0 0 0 0 0 0 0 0 0 0 0[10Y - more 0 0 0 0 0 0 0 0 0 0 0 0 0 0
Tot 0 0 0 0 0 0 0 0 0 0 0 0 0 0
[ 0 - 3M [ 0 0 0 0 0 0 0 0 0 0 0 0 0 0[ 3M - 1Y [ 0 0 0 0 0 0 0 0 0 0 0 0 0 0[ 1Y - 2Y [ 0 0 0 0 0 0 0 0 0 0 0 0 0 0[ 2Y - 3Y [ 0 0 0 0 0 0 0 0 0 0 0 0 0 0[3Y - 5Y [ 0 0 0 0 0 0 0 0 0 0 0 0 0 0[5Y - 10Y [ 0 0 0 0 0 0 0 0 0 0 0 0 0 0
[10Y - more 0 0 0 0 0 0 0 0 0 0 0 0 0 0Tot 0 0 0 0 0 0 0 0 0 0 0 0 0 0
[ 0 - 3M [ 0 0 0 0 0 0 0 0 0 0 0 0 0 0[ 3M - 1Y [ 0 0 0 0 0 0 0 0 0 0 0 0 0 0[ 1Y - 2Y [ 0 0 0 0 0 0 0 0 0 0 0 0 0 0[ 2Y - 3Y [ 0 0 0 0 0 0 0 0 0 0 0 0 0 0[3Y - 5Y [ 0 0 0 0 0 0 0 0 0 0 0 0 0 0[5Y - 10Y [ 0 0 0 0 0 0 0 0 0 0 0 0 0 0[10Y - more 0 0 0 0 0 0 0 0 0 0 0 0 0 0
Tot 0 0 0 0 0 0 0 0 0 0 0 0 0 0
Lithuania
Luxembourg
Malta
Netherlands
Norway
Poland
Portugal
Romania
Slovakia
http://www.economiaciudadana.org/
2014 EU-wide Stress Test - Sovereign Exposure

8/10/2019 Test Stress Banca Española 2014
http://slidepdf.com/reader/full/test-stress-banca-espanola-2014 43/240
(mln EUR)
Residual Maturity Country / Region
GROSS DIRECT LONG
EXPOSURES(accounting value grossof provisions)
(1)
NET DIRECT POSITIONS (gross exposures (long) net of cash short
positions of sovereign debt to other counterpaties only where there
is a maturity matching)
(1)
DIRECT SOVEREIGN EXPOSURES IN DERIVATIVES (1)
of which: loansand advances of which: AFSbanking book
of which: FVO
(designated at fair
value throughprofit&loss)
banking book
of which: Financial
assets held fortrading(2)
Derivatives with positive fair value at
31/12/2013
Derivatives with negative fair value at
31/12/2013
Derivatives with positive fair value
at 31/12/2013
Derivatives with negative fair
value at 31/12/2013
VALUES AS OF 31/12/2013 VALUES AS OF 31/12/2013 VALUES AS OF 31/12/2013
INDIRECT SOVEREIGN EXPOSURES (3) (on and off balance sheet)
Fair-value at31/12/2013 (+) Notional value Fair-value at31/12/2013 (-)Notional value Fair-value at31/12/2013 (+) Notional value Fair-value at 31/12/2013(-) Notional value
[ 0 - 3M [ 0 0 0 0 0 0 0 0 0 0 0 0 0 0[ 3M - 1Y [ 0 0 0 0 0 0 0 0 0 0 0 0 0 0[ 1Y - 2Y [ 0 0 0 0 0 0 0 0 0 0 0 0 0 0[ 2Y - 3Y [ 0 0 0 0 0 0 0 0 0 0 0 0 0 0[3Y - 5Y [ 0 0 0 0 0 0 0 0 0 0 0 0 0 0[5Y - 10Y [ 0 0 0 0 0 0 0 0 0 0 0 0 0 0[10Y - more 0 0 0 0 0 0 0 0 0 0 0 0 0 0
Tot 0 0 0 0 0 0 0 0 0 0 0 0 0 0
[ 0 - 3M [ 3,099 1,260 2,667 824 0 0 251 23 250 -2 0 0 0 0[ 3M - 1Y [ 7,059 1,798 6,813 1,093 0 0 6 0 0 0 0 0 0 0[ 1Y - 2Y [ 11,675 509 11,531 6,463 0 262 21 1 0 0 0 0 0 0[ 2Y - 3Y [ 3,513 747 3,442 1,483 0 81 0 0 0 0 0 0 0 0[3Y - 5Y [ 6,106 1,893 3,739 1,663 0 0 68 2 45 -1 0 0 0 0[5Y - 10Y [ 6,570 2,167 5,782 3,454 0 25 70 5 252 -23 0 0 0 0[10Y - more 2,466 1,792 2,096 368 0 0 2 0 2 0 0 0 0 0
Tot 40,487 10,166 36,070 15,348 0 368 419 30 549 -26 0 0 0 0
[ 0 - 3M [ 0 0 0 0 0 0 0 0 0 0 0 0 0 0[ 3M - 1Y [ 0 0 0 0 0 0 0 0 0 0 0 0 0 0[ 1Y - 2Y [ 0 0 0 0 0 0 0 0 0 0 0 0 0 0[ 2Y - 3Y [ 0 0 0 0 0 0 0 0 0 0 0 0 0 0[3Y - 5Y [ 0 0 0 0 0 0 0 0 0 0 0 0 0 0[5Y - 10Y [ 0 0 0 0 0 0 0 0 0 0 0 0 0 0
[10Y - more 0 0 0 0 0 0 0 0 0 0 0 0 0 0Tot 0 0 0 0 0 0 0 0 0 0 0 0 0 0
[ 0 - 3M [ 0 0 0 0 0 0 0 0 0 0 0 0 0 0[ 3M - 1Y [ 0 0 0 0 0 0 0 0 0 0 0 0 0 0[ 1Y - 2Y [ 0 0 0 0 0 0 0 0 0 0 0 0 0 0[ 2Y - 3Y [ 0 0 0 0 0 0 0 0 0 0 0 0 0 0[3Y - 5Y [ 0 0 0 0 0 0 0 0 0 0 0 0 0 0[5Y - 10Y [ 0 0 0 0 0 0 0 0 0 0 0 0 0 0[10Y - more 0 0 0 0 0 0 0 0 0 0 0 0 0 0
Tot 0 0 0 0 0 0 0 0 0 0 0 0 0 0
[ 0 - 3M [ 0 0 0 0 0 0 0 0 0 0 0 0 0 0[ 3M - 1Y [ 0 0 0 0 0 0 0 0 0 0 0 0 0 0[ 1Y - 2Y [ 0 0 0 0 0 0 0 0 0 0 0 0 0 0[ 2Y - 3Y [ 0 0 0 0 0 0 0 0 0 0 0 0 0 0[3Y - 5Y [ 0 0 0 0 0 0 0 0 0 0 0 0 0 0[5Y - 10Y [ 0 0 0 0 0 0 0 0 0 0 0 0 0 0[10Y - more 0 0 0 0 0 0 0 0 0 0 0 0 0 0
Tot 0 0 0 0 0 0 0 0 0 0 0 0 0 0
[ 0 - 3M [ 0 0 0 0 0 0 0 0 0 0 0 0 0 0[ 3M - 1Y [ 0 0 0 0 0 0 0 0 0 0 0 0 0 0[ 1Y - 2Y [ 0 0 0 0 0 0 0 0 0 0 0 0 0 0[ 2Y - 3Y [ 0 0 0 0 0 0 0 0 0 0 0 0 0 0[3Y - 5Y [ 0 0 0 0 0 0 0 0 0 0 0 0 0 0[5Y - 10Y [ 0 0 0 0 0 0 0 0 0 0 0 0 0 0
[10Y - more 0 0 0 0 0 0 0 0 0 0 0 0 0 0Tot 0 0 0 0 0 0 0 0 0 0 0 0 0 0
[ 0 - 3M [ 0 0 0 0 0 0 0 0 0 0 0 0 0 0[ 3M - 1Y [ 0 0 0 0 0 0 0 0 0 0 0 0 0 0[ 1Y - 2Y [ 0 0 0 0 0 0 0 0 0 0 0 0 0 0[ 2Y - 3Y [ 0 0 0 0 0 0 0 0 0 0 0 0 0 0[3Y - 5Y [ 0 0 0 0 0 0 0 0 0 0 0 0 0 0[5Y - 10Y [ 0 0 0 0 0 0 0 0 0 0 0 0 0 0[10Y - more 0 0 0 0 0 0 0 0 0 0 0 0 0 0
Tot 0 0 0 0 0 0 0 0 0 0 0 0 0 0
[ 0 - 3M [ 0 0 0 0 0 0 0 0 0 0 0 0 0 0[ 3M - 1Y [ 0 0 0 0 0 0 0 0 0 0 0 0 0 0[ 1Y - 2Y [ 0 0 0 0 0 0 0 0 0 0 0 0 0 0[ 2Y - 3Y [ 0 0 0 0 0 0 0 0 0 0 0 0 0 0[3Y - 5Y [ 0 0 0 0 0 0 0 0 0 0 0 0 0 0[5Y - 10Y [ 0 0 0 0 0 0 0 0 0 0 0 0 0 0[10Y - more 0 0 0 0 0 0 0 0 0 0 0 0 0 0
Tot 0 0 0 0 0 0 0 0 0 0 0 0 0 0
Spain
Slovenia
Sweden
United Kingdom
Australia
Canada
Hong Kong
Japan
U.S.
http://www.economiaciudadana.org/
2014 EU-wide Stress Test - Sovereign Exposure
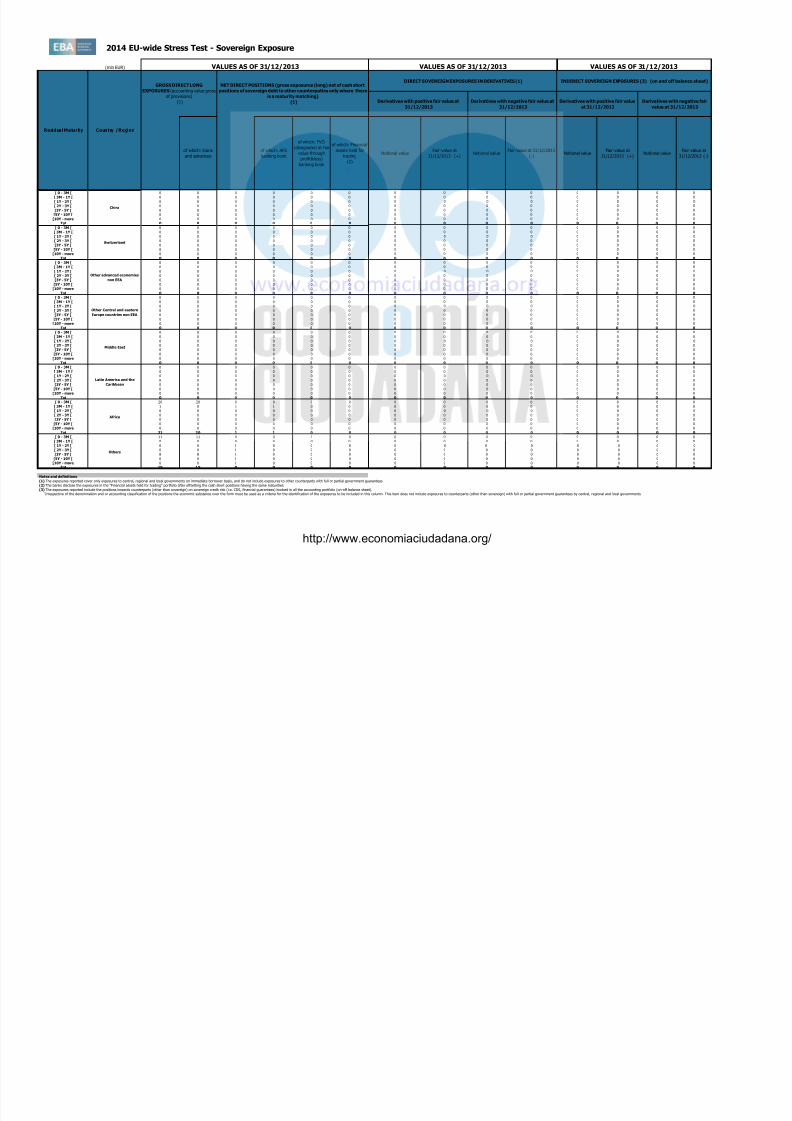
8/10/2019 Test Stress Banca Española 2014
http://slidepdf.com/reader/full/test-stress-banca-espanola-2014 44/240
(mln EUR)
Residual Maturity Country / Region
GROSS DIRECT LONG
EXPOSURES(accounting value grossof provisions)
(1)
NET DIRECT POSITIONS (gross exposures (long) net of cash short
positions of sovereign debt to other counterpaties only where there
is a maturity matching)
(1)
DIRECT SOVEREIGN EXPOSURES IN DERIVATIVES (1)
of which: loansand advances of which: AFSbanking book
of which: FVO
(designated at fair
value throughprofit&loss)
banking book
of which: Financial
assets held fortrading(2)
Derivatives with positive fair value at
31/12/2013
Derivatives with negative fair value at
31/12/2013
Derivatives with positive fair value
at 31/12/2013
Derivatives with negative fair
value at 31/12/2013
VALUES AS OF 31/12/2013 VALUES AS OF 31/12/2013 VALUES AS OF 31/12/2013
INDIRECT SOVEREIGN EXPOSURES (3) (on and off balance sheet)
Fair-value at31/12/2013 (+) Notional value Fair-value at31/12/2013 (-)Notional value Fair-value at31/12/2013 (+) Notional value Fair-value at 31/12/2013(-) Notional value
[ 0 - 3M [ 0 0 0 0 0 0 0 0 0 0 0 0 0 0[ 3M - 1Y [ 0 0 0 0 0 0 0 0 0 0 0 0 0 0[ 1Y - 2Y [ 0 0 0 0 0 0 0 0 0 0 0 0 0 0[ 2Y - 3Y [ 0 0 0 0 0 0 0 0 0 0 0 0 0 0[3Y - 5Y [ 0 0 0 0 0 0 0 0 0 0 0 0 0 0[5Y - 10Y [ 0 0 0 0 0 0 0 0 0 0 0 0 0 0[10Y - more 0 0 0 0 0 0 0 0 0 0 0 0 0 0
Tot 0 0 0 0 0 0 0 0 0 0 0 0 0 0
[ 0 - 3M [ 0 0 0 0 0 0 0 0 0 0 0 0 0 0[ 3M - 1Y [ 0 0 0 0 0 0 0 0 0 0 0 0 0 0[ 1Y - 2Y [ 0 0 0 0 0 0 0 0 0 0 0 0 0 0[ 2Y - 3Y [ 0 0 0 0 0 0 0 0 0 0 0 0 0 0[3Y - 5Y [ 0 0 0 0 0 0 0 0 0 0 0 0 0 0[5Y - 10Y [ 0 0 0 0 0 0 0 0 0 0 0 0 0 0
[10Y - more 0 0 0 0 0 00 0 0 0 0 0 0 0
Tot 0 0 0 0 0 0 0 0 0 0 0 0 0 0
[ 0 - 3M [ 0 0 0 0 0 0 0 0 0 0 0 0 0 0[ 3M - 1Y [ 0 0 0 0 0 0 0 0 0 0 0 0 0 0[ 1Y - 2Y [ 0 0 0 0 0 0 0 0 0 0 0 0 0 0[ 2Y - 3Y [ 0 0 0 0 0 0 0 0 0 0 0 0 0 0[3Y - 5Y [ 0 0 0 0 0 0 0 0 0 0 0 0 0 0[5Y - 10Y [ 0 0 0 0 0 0 0 0 0 0 0 0 0 0[10Y - more 0 0 0 0 0 0 0 0 0 0 0 0 0 0
Tot 0 0 0 0 0 0 0 0 0 0 0 0 0 0
[ 0 - 3M [ 20 20 0 0 0 0 0 0 0 0 0 0 0 0[ 3M - 1Y [ 1 0 1 1 0 0 0 0 0 0 0 0 0 0[ 1Y - 2Y [ 0 0 0 0 0 0 0 0 0 0 0 0 0 0[ 2Y - 3Y [ 0 0 0 0 0 0 0 0 0 0 0 0 0 0[3Y - 5Y [ 0 0 0 0 0 0 0 0 0 0 0 0 0 0[5Y - 10Y [ 0 0 0 0 0 0 0 0 0 0 0 0 0 0
[10Y - more 0 0 0 0 0 0 0 0 0 0 0 0 0 0Tot 21 20 1 1 0 0 0 0 0 0 0 0 0 0
[ 0 - 3M [ 11 11 0 0 0 0 0 0 0 0 0 0 0 0[ 3M - 1Y [ 0 0 0 0 0 0 0 0 0 0 0 0 0 0[ 1Y - 2Y [ 0 0 0 0 0 0 0 0 0 0 0 0 0 0[ 2Y - 3Y [ 0 0 0 0 0 0 0 0 0 0 0 0 0 0[3Y - 5Y [ 8 8 0 0 0 0 0 0 0 0 0 0 0 0[5Y - 10Y [ 0 0 0 0 0 0 0 0 0 0 0 0 0 0[10Y - more 0 0 0 0 0 0 0 0 0 0 0 0 0 0
Tot 19 19 0 0 0 0 0 0 0 0 0 0 0 0
Notes and definitions
(1) The exposures reported cover only exposures to central, regional and local governments on immediate borrower basis, and do not include exposures to other counterparts with full or partial government guarantees(2) The banks disclose the exposures in the "Financial assets held for trading" portfolio after offsetting the cash short positions having the same maturities.(3) The exposures reported include the positions towards counterparts (other than sovereign) on sovereign credit risk (i.e. CDS, financial guarantees) booked in all the accounting portfolio (on-off balance sheet).
'Irrespective of the denomination and or accounting classification of the positions the economic substance over the form must be used as a criteria for the identification of the exposures to be included in this column. This item does not include exposures to counterparts (other than sovereign) with full or partial government guarantees by central, regional and local governments
Latin America and the
Caribbean
Africa
Others
Middle East
China
Switzerland
Other advanced economies
non EEA
Other Central and eastern
Europe countries non EEA
http://www.economiaciudadana.org/
2014 EU-wide Stress TestCapital
Baseline Scenario Adverse Scenario
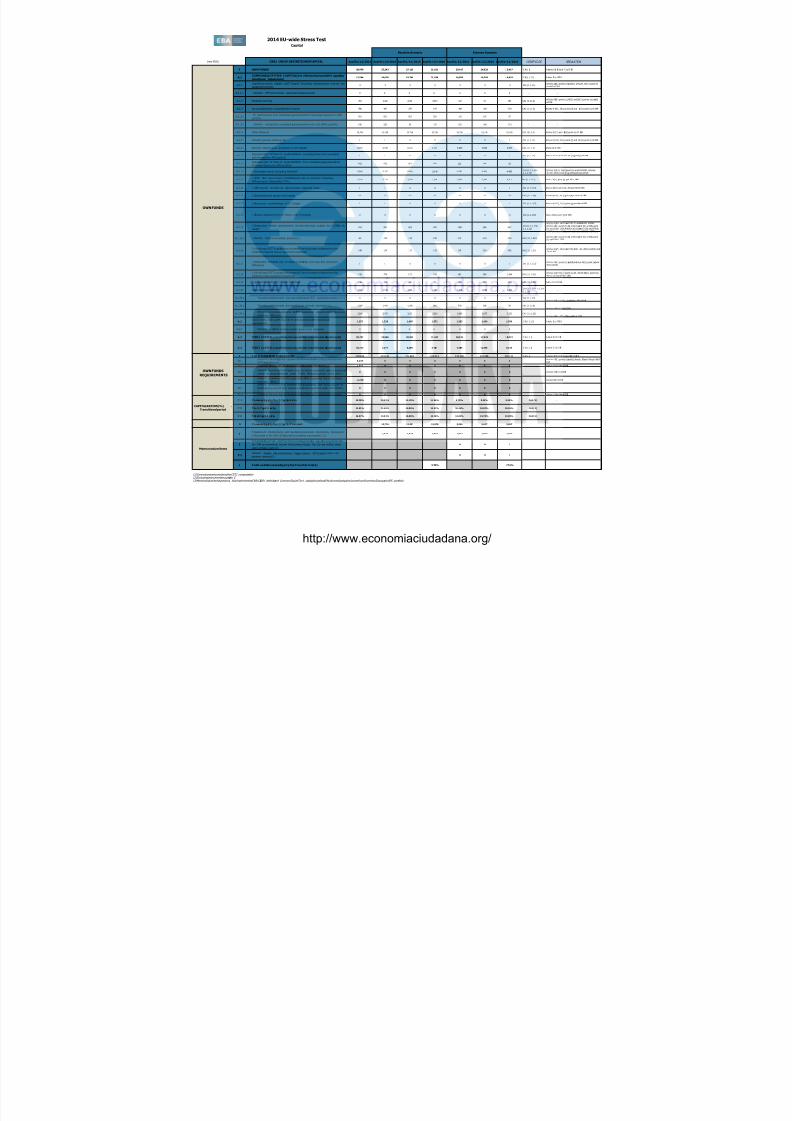
8/10/2019 Test Stress Banca Española 2014
http://slidepdf.com/reader/full/test-stress-banca-espanola-2014 45/240
(mln EUR) CRR/ CRDIV DEFINITION OFCAPITAL Asof31/12/2013 Asof31/12/2014 Asof31/12/2015 Asof31/12/2016 Asof31/12/2014 Asof31/12/2015 Asof31/12/2016 COREP CODE REGULATION
A OWN FUNDS 28,970 27,243 27,120 26,811 25,417 24,026 23,417 C A1 { 1} A rt ic le s 4 (1 18 ) a nd 7 2 of C RR
A.1COMMON EQUITYTIER 1CAPITAL(net ofdeductionsandafter applying
transitional adjustments)17,544 18,638 19,346 20,056 16,850 16,206 16,474 C A1 { 1. 1. 1} A rt ic le 50 o f CR R
A.1.1Capitalinstruments eligible asCET1Capital (including share premium and net own
capitalinstruments)3 3 3 3 3 3 3 CA1 {1.1.1.1}
Articles 26(1) points (a) and(b), 27to29, 36(1) point (f)and42ofCRR
A.1.1.1 Ofwhich: CET1instruments subscribed byGovernment 0 0 0 0 0 0 0 - -
A.1.2 Retained earnings 353 1,225 2,451 3,972 -117 51 704 CA1 {1.1.1.2} Articles 26(1) point (c), 26(2) and36(1) points (a) and(l)ofCRR
A.1.3 Accumulated other comprehensive income 788 467 275 147 -284 -323 -552 CA1 {1.1.1.3} Articles 4(100), 26(1) point (d) and 36 (1) point (l) of CRR
A.1.3.1 Of which:arising from unrealised gains/lossesfrom Sovereign exposure in AFS
portfolio503 503 503 503 -122 107 57 - -
A.1.3.2 Ofwhich: arising from unrealised gains/lossesfrom the rest ofAFS portfolio 548 228 36 -93 102 -166 -345 - -
A.1.4 Other Reserves 15,756 15,756 15,756 15,756 15,756 15,756 15,756 CA1 {1.1.1.4} Articles 4(117) and 26(1) point (e) of CRR
A.1.5 Fundsfor general banking risk 0 0 0 0 0 0 0 CA1 {1.1.1.5} Articles 4(112), 26(1) point (f) and 36 (1) point (l) of CRR
A.1.6 Minority interest given recognition in CET1capital 6,073 6,098 6,114 6,117 6,650 6,693 6,533 CA1 {1.1.1.7} Article 84 of CRR
A.1.7 Adjustmentsto CET1due to prudentialfilters excluding those from unrealised
gains/lossesfrom AFS portfolio0 0 0 0 0 0 0 CA1 {1.1.1.9} Articles 32 to 35 of and 36 (1) point (l) of CRR
A.1.8 Adjustmentsto CET1due to prudentialfilters from unrealised gains/lossesfrom
Sovereign Exposure in AFS portfolio-503 -503 -302 -201 122 -64 -23 -
A.1.9 (-)Intangible assets (including Goodwill) -5,841 -5,741 -5,641 -5,540 -5,741 -5,641 -4,988CA1{1.1.1.10+1.1.1.11}
Articles 4(113), 36(1) point (b) and37ofCRR. Articles4(115), 36(1) point (b) and37point (a) ofCCR
A.1.10(-)DTAs that relyon future profitabilityand don ot arise from temporary
differencesnet ofassociated DTLs-2,341 -2,341 -2,341 -2,341 -2,341 -2,341 -2,341 CA1 {1.1.1.12} Articles 36(1) point (c) and 38 of CRR
A.1.11 (-)IRB shortfall ofcredit risk adjustmentsto expected losses 0 0 0 0 0 0 0 CA1 {1.1.1.13} Articles 36(1) point (d), 40 and 159 of CRR
A.1.12 (-)Defined benefit pension fund assets -12 -12 -12 -12 -12 -12 -12 CA1 {1.1.1.14} Articles 4(109), 36(1) point (e) and 41 of CRR
A.1.13 (-)Reciprocal crossholdings in CET1Capital 0 0 0 0 0 0 0 CA1 {1.1.1.15} Articles 4(122), 36(1) point (g) and 44 of CRR
A.1.14 (-)Excess deduction from AT1items over AT1Capital 0 0 0 0 0 0 0 CA1 {1.1.1.16} Article 36(1) point (j) of CRR
A.1.15(-)Deductions related toassetswhich can alternativelybe subject toa 1.250%ri sk
weight-253 -291 -291 -293 -289 -286 -287
CA1{1.1.1.17to1.1.1.21}
Articles 4(36), 36(1) point (k) (i) and89to91 ofCRR; Articles 36(1) point (k) (ii), 243(1) point (b), 244(1) point(b) and258of CRR;Articles 36(1) point k) (iii) and379(3)ofCRR;Articles 36(1) point k) (iv) and153(8) ofCRRand
A.1.15.1 Ofwhich: from securitisation positions(-) -84 -120 -120 -120 -120 -120 -120 CA1 {1.1.1.18.1} Articles 36(1) point (k) (ii), 243(1) point (b), 244(1) point(b) and258of CRR
A.1.16(-)HoldingsofCET1capitalinstrumentsoff inancialsector entitieswhere the
institiution doesnot have a significant investment-145 -124 -127 -115 -245 -294 -296 CA1 {1.1.1.22}
Articles 4(27), 36(1) point (h);43to 46, 49(2) and(3) and79ofCRR
A.1.17(-)Deductible DTAsthat rely on future profitability and arise from temporary
differences0 0 0 0 0 0 0 CA1 {1.1.1.23}
Articles 36(1) point (c) and38;Articles 48(1) point (a) and48(2) ofCRR
A.1.18(-)HoldingsofCET1capitalinstrumentsoff inancialsector entitieswhere the
institiution hasa significant investment-718 -736 -822 -918 -867 -988 -1,064 CA1 {1.1.1.24}
Articles 4(27);36(1) point (i);43, 45;47;48(1) point (b);49(1) to(3) and79of CRR
A.1.19 (-)Amount exceding the 17.65% threshold -136 -100 -48 0 -221 -229 -189 CA1 {1.1.1.25} Article 470 of CRR
A.1.20 Transitionaladjustments 4,522 4,939 4,331 3,481 4,438 3,883 3,230
CA1{1.1.1.6+ 1.1.8+
1.1.26} -
A.1.20.1 Transitionaladjustments due tograndfathered CET1 Capitalinstruments (+/-) 0 0 0 0 0 0 0 CA1 {1.1.1.6} Articles 483(1) to(3), and484to 487ofCRR
A.1.20.2 Transitionaladjustments due toadditional minority interests(+/-) 1,304 1,483 1,198 849 539 208 78 CA1 {1.1.1.8} Articles 479and 480ofCRR
A.1.20.3Other transitionaladjustments toCET1 Capitalexcl. adjustmentsfor Sovereign
exposure in AFS (+/-)3,218 3,455 3,133 2,633 3,900 3,675 3,152 CA1 {1.1.1.26}
Articles 469to 472, 478and481of CRR
A.2 ADDITIONAL TIER 1CAPITAL (net of deductionsand after transitional
adjustments)1,253 1,328 1,485 1,571 1,283 1,424 1,599 C A1 { 1. 1. 2} A rt ic le 61 o f CR R
A.2.1 Ofwhich: (+)Other existing support government measures 0 0 0 0 0 0 0 - -
A.3 TIER1 CAPITAL(netofdeductionsandafter transitional adjustments) 18,797 19,966 20,831 21,627 18,133 17,629 18,073 C A1 { 1. 1} A rt ic le 25 of C RR
A.4 TIER2 CAPITAL(netofdeductionsandafter transitional adjustments) 10,173 7,277 6,289 5,184 7,284 6,396 5,344 C A1 { 1. 2} A rt ic le 71 of C RR
B T OT AL R IS K EX PO SU RE A M OU NT 170,679 172,194 172,897 173,474 173,738 175,039 176,317 C A2 { 1} A rt ic le s 92 (3 ), 9 5, 9 6 an d 98 o f CR R
B.1ofwhich:stemming from exposuresthat fallbelow the 10%/15%limitsfor
CET1deduction (+)6,229 0 0 0 0 0 0
Articles 36(1) points (a) and(i);Article 38and Article 48of CRR
B .2 o f wh ic h:s te mming f rom from CVAcap i ta l re qui re me nts ( + ) 1,017 0 0 0 0 0 0 Article 381to386ofCRR
B.3ofwhich: stemming from higher asset correlation parameter against exposures
tolarge financialinstitutions under IRB the IRB approachesto credit risk(+)0 0 0 0 0 0 0 Articles 153(2) ofCRR
B.4ofwhich: stemming from the application ofthe supporting factor toincrease
lending to SMEs(-)-3,279 0 0 0 0 0 0 Recital (44) ofCRR
B.5ofwhich: stemming from the effect ofexposuresthat were previouslypart of
RiskExposure amount and receive a deduction treatment under CRR/CRDIV (-
)
0 0 0 0 0 0 0 -
B .6 o f wh ic h:o the rs s ub je c t t o t he d isc ret ion o f Na t iona lCompete nt Author i t ie s 0 0 0 0 0 0 0 Article 124to164ofCRR
C.1 Co mm onE q ui tyTi er 1Cap i tal r ati o 10.28% 10.82% 11.19% 11.56% 9.70% 9.26% 9.34% CA3 {1} -
C .2 T ie r 1 C ap it al ra ti o 11.01% 11.60% 12.05% 12.47% 10.44% 10.07% 10.25% CA3 { 3} -
C .3 T ot al C ap it al r at io 16.97% 15.82% 15.69% 15.46% 14.63% 13.73% 13.28% CA3 { 5} -
D Co mm onE q ui tyTi er 1Cap i tal Thresho ld 13,776 13,832 13,878 9,556 9,627 9,697
ETotalamount ofinstruments with mandatoryconversion intoordinary sharesupon
a fixed date in the 2014-2016period (cumulative conversions) (1)1,923 1,923 1,923 1,923 1,923 1,923
F
TotalAdditionalTier 1 and Tier 2instrumentseligible as regulatorycapitalunder
the CRR provisionsthat convert intoCommon Equity Tier 1or are written down
upon a trigger event (2)
0 0 0
F.1Ofwhich: eligible instrumentswhose trigger isabove CET1capital ratioin the
adverse scenario(2)0 0 0
G FullyLoadedCommonEquityTier 1Capital ratio (3) 9.55% 7.51%
(1)Conversionsnot considered for CET1 computation (2)Excluding instrumentsincluded in E (3)Memorandum item based on a fullyimplemented CRR/CRD IV definition of Common EquityTier 1 capitalincluding 60%ofunrealised gains/lossesfrom Sovereign Exposure in AFS portfolio
Memorandumitems
OWN FUNDS
OWN FUNDS
REQUIREMENTS
CAPITALRATIOS(%) -
Transitional period
http://www.economiaciudadana.org/
2014 EU id St T t R t t i i
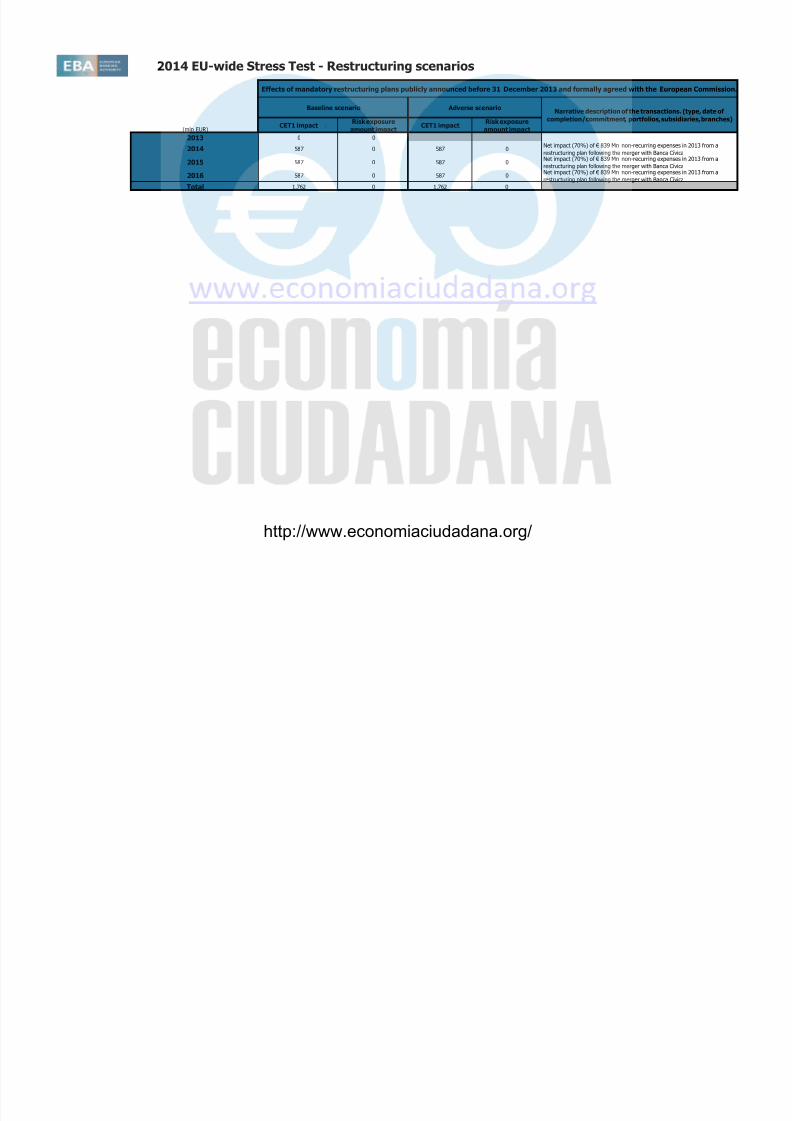
8/10/2019 Test Stress Banca Española 2014
http://slidepdf.com/reader/full/test-stress-banca-espanola-2014 46/240
2014 EU-wide Stress Test - Restructuring scenarios
(mln EUR)
2013 0 0
2014 587 0 587 0Net impact (70%) of € 839 Mn non-recurring expenses in 2013 from a
restructuring plan following the merger with Banca Cívica2015 587 0 587 0
Net impact (70%) of € 839 Mn non-recurring expenses in 2013 from a
restructuring plan following the merger with Banca Cívica
2016 587 0 587 0Net impact (70%) of € 839 Mn non-recurring expenses in 2013 from a
restructuring plan following the merger with Banca Cívica
Total 1,762 0 1,762 0
Effects of mandatory restructuring plans publicly announced before 31 December 2013 and formally agreed with the European Commission.
Baseline scenario Adverse scenarioNarrative description of the transactions. (type, date of
completion/commitment, portfolios, subsidiaries, branches)CET1 impact
Risk exposure
amount impactCET1 impact
Risk exposure
amount impact
http://www.economiaciudadana.org/

8/10/2019 Test Stress Banca Española 2014
http://slidepdf.com/reader/full/test-stress-banca-espanola-2014 47/240
2014 EU wide Stress Test

8/10/2019 Test Stress Banca Española 2014
http://slidepdf.com/reader/full/test-stress-banca-espanola-2014 48/240
2014 EU-wide Stress Test
Impact on Common
Equity Tier 1Million EUR
Raising of capital instruments eligible as CET1 capital (+) 0
Repayment of CET1 capital, buybacks (-) 0
Conversion to CET1 of hybrid instruments becoming effective between 1 January and 30 September 2014 (+) 1,923
Impact on Additional
Tier 1 and Tier 2
Million EUR
Net issuance of Additional Tier 1 and T2 Instruments with a trigger at or above bank's post stress test CET1 ratio in the adversescenario during the stress test horizon (+/-)
0
Net issuance of Additional Tier 1 and T2 Instrument with a trigger below bank's post stress test CET1 ratio in the adverse
scenario during the stress test horizon (+/-)0
Million EUR
Realized fines/litigation costs from 1 January to 30 September 2014 (net of provisions) (-) 0
Other material losses and provisions from 1 January to 30 September 2014 (-) 0
Major Capital Measures from 1 January to 30 September 2014
Losses
Net issuance of Additional Tier 1 and T2 Instruments
Issuance of CET 1 Instruments
Major Capital Measures Impacting Tier 1 and Tier 2 Eligible Capital from 1 January 2014 to 30 September 2014
http://www.economiaciudadana.org/

8/10/2019 Test Stress Banca Española 2014
http://slidepdf.com/reader/full/test-stress-banca-espanola-2014 49/240
Bank Name ES - Kutxabank, S.A.
LEI Code 549300U4LIZV0REEQQ46
ES
NUK_WL_NR_XX
version
1809014
No restructuring
2014 EU-wide Stress Test
http://www.economiaciudadana.org/
2014 EU-wide Stress Test 2014 EU-wide Stress Test

8/10/2019 Test Stress Banca Española 2014
http://slidepdf.com/reader/full/test-stress-banca-espanola-2014 50/240
Actual figures as of 31 December 2013 mln EUR, % Actual figures as of 31 December 2013 mln EUR, %
Operating profit before impairments 447 Operating profit before impairments 447
Impairment losses on financial and non-financial assets in the banking book 373 Impairment losses on financial and non-financial assets in the banking book 373
Common Equity Tier 1 capital (1) 4,375 Common Equity Tier 1 capital (1) 4,375
Total Risk Exposure (1) 36,027 Total Risk Exposure (1) 36,027
Common Equity Tier 1 ratio, % (1) 12.1% Common Equity Tier 1 ratio, % (1) 12.1%
Outcome of the adverse scenario as of 31 December 2016 mln EUR, % Outcome of the baseline scenario as of 31 December 2016 mln EUR, %
3 yr cumulative operating profit before impairments 684 3 yr cumulative operating profit before impairments 979
3 yr cumulative impairment losses on financial and non-financial assets in the banking book 780 3 yr cumulative impairment losses on financial and non-financial assets in the banking book 402
3 yr cumulative losses from the stress in the trading book 6 3 yr cumulative losses from the stress in the trading book 2
Valuation losses due to sovereign shock after tax and prudential filters -7 Common Equity Tier 1 capital (1) 4,739
Common Equity Tier 1 capital (1) 4,283 Total Risk Exposure (1) 36,042
Total Risk Exposure (1) 36,062 Common Equity Tier 1 ratio, % (1) 13.1%
Common Equity Tier 1 ratio, % (1) 11.9%
Memorandum items mln EUR
Memorandum items mln EUR Common EU wide CET1 Threshold (8.0%) 2,883
Common EU wide CET1 Threshold (5.5%) 1,983
Total amount of instruments with mandatory conversion into ordinary shares upon a fixed date in
the 2014 -2016 period (cumulative conversions) (2)0
Total Additional Tier 1 and Tier 2 instruments eligible as regulatory capital under the CRR provisions
that convert into Common Equity Tier 1 or are written down upon a trigger event (3)0
Of which: eligible instruments whose trigger is above CET1 capital ratio in the adverse
scenario (3)0
(2) Conversions not considered for CET1 computation
(3) Excluding instruments with mandatory conversion into ordinary shares upon a fixed date in the 2014 -2016 period
(1) According to CRR/CRD4 definition transitional arrangements as per reporting date. Figures as of 31/12/2013 computed as of first day of application:
01/01/2014.
Summary Baseline Scenario
ES - Kutxabank, S.A.
(1) According to CRR/CRD4 definition transitional arrangements as per reporting date. Figures as of 31/12/2013 computed as of first day of application:
01/01/2014.
Summary Adverse Scenario
ES - Kutxabank, S.A.
http://www.economiaciudadana.org/
2014 EU-wide Stress TestCredit Risk
(mln EUR, %)
No n-d ef aul t ed De fau lt e d No n-d ef aul t ed De fau lt e d No n-d ef aul t ed De fau lt e d No n-d ef aul t e d De fau lt e d No n-d ef aul t ed De fau lt e d No n-d ef aul t e d De fau lt e d No n-d ef aul t ed De fau lt e d No n-d ef aul t ed De fau lt e d No n-d ef aul t ed De fau lt e dImpairment
rate
Stockof
ProvisionsCoverage Ratio -
Default Stock
Impairment
rate
Stockof
Provisions
Coverage
Ratio-Default
Stock
Impairment
rate
Stockof
Provisions
Coverage
Ratio -Default
Stock
Impairment rateStockof
Provisions
Coverage
Ratio-Default
Stock
Impairment
rate
Stockof
Provisions
Coverage
Ratio-Default
Stock
Impairment
rate
Stockof
Provisions
Coverage
Ratio -Default
Stock
Central banksandcentral governments 0 0 0 0 3 557 19 0 0 0 0 14 28 0 0 0 0 0 0 0 00% 0 0 00% 0 00% 0 0 00% 0 00% 0 0 00% 0 74% 18 40 00% 0 74% 28 40 00% 0 74% 38 40 00%
asof 31/12/2016
LTV %(asof
31/12/2013)
Exposure values (as of 31/12/2013) Risk exposure amounts (as of 31/12/2013) Value adjustments and provisions (as of 31/12/2013) Adverse Scenario
F-IRB A-IRB STA F-IRB A-IRB STA F-IRB A-IRB STA
BaselineScenario
as of 31/12/2014 as of 31/12/2015 as of 31/12/2016 as of 31/12/2014 as of 31/12/2015
8/10/2019 Test Stress Banca Española 2014
http://slidepdf.com/reader/full/test-stress-banca-espanola-2014 51/240
Central banksandcentral governments 0 0 0 0 3,557 19 0 0 0 0 14 28 0 0 0 0 0 0 0.00% 0 0.00% 0.00% 0 0.00% 0.00% 0 0.00% 0.74% 18 40.00% 0.74% 28 40.00% 0.74% 38 40.00%
Institutions 0 0 0 0 2,491 21 0 0 0 0 1,480 14 0 0 0 0 7 7 0.00% 14 25.58% 0.00% 14 21.42% 0.00% 14 18.55% 0.00% 14 18.49% 0.00% 14 13.69% 0.00% 14 11.26%
Corporates 0 0 0 0 6,395 3,318 0 0 0 0 5,460 1,573 0 0 0 0 586 1,816 0.43% 2,430 53.62% 0.44% 2,457 52.71% 0.41% 2,483 51.96% 0.68% 2,445 53.48% 0.99% 2,507 52.13% 1.03% 2,572 51.10%
Corporates -Of Which:SpecialisedLending 0 0 0 0 0 0 0 0 0 0 0 0 0 0 0 0 0 0 - 0 - - 0 - - 0 - - 0 - - 0 - - 0 -
Corporates -Of Which:SME 0 0 0 0 3,927 3,012 0 0 0 0 3,278 1,432 0 0 0 0 567 1,638 0.26% 2,215 53.30% 0.26% 2,225 52.38% 0.24% 2,234 51.61% 0.49% 2,224 53.09% 0.67% 2,249 51.63% 0.69% 2,276 50.42%
Retail 0 0 0 0 36,230 2,196 0 0 0 0 15,087 1,526 0 0 0 0 38 734 0.30% 880 30.49% 0.27% 977 28.74% 0.25% 1,066 27.53% 0.45% 933 31.26% 0.40% 1,076 30.02% 0.37% 1,208 29.22%
Retail -Securedon real estateproperty 45.2% 0 0 0 0 31,803 1,463 0 0 0 0 12,229 1,089 0 0 0 0 18 373 0.19% 451 23.75% 0.17% 504 22.67% 0.16% 555 21.90% 0.26% 475 24.79% 0.26% 557 24.33% 0.25% 636 24.00%
Retail -Securedon real estate property- Of
h i h : S E30.8% 0 0 0 0 922 208 0 0 0 0 236 158 0 0 0 0 5 62 1.08% 77 28.41% 1.02% 86 27.41% 0.97% 94 26.73% 1.51% 81 29.32% 1.59% 95 28.87% 1.46% 107 28.58%
Retail -Securedon real estate property- Of
h i h: n n - E46.0% 0 0 0 0 30,882 1,255 0 0 0 0 11,993 931 0 0 0 0 13 311 0.16% 373 22.99% 0.15% 418 21.90% 0.14% 461 21.13% 0.23% 394 24.04% 0.22% 462 23.58% 0.22% 529 23.26%
Retail -QualifyingRevolving 0 0 0 0 190 18 0 0 0 0 143 2 0 0 0 0 0 17 0.57% 18 78.50% 0.54% 19 70.45% 0.53% 20 64.71% 0.67% 18 78.92% 0.67% 19 70.91% 0.66% 20 65.27%
Retail -OtherRetail 0 0 0 0 4,236 715 0 0 0 0 2,715 435 0 0 0 0 20 344 1.14% 412 42.62% 1.05% 454 39.55% 0.98% 492 37.57% 1.81% 440 42.07% 1.51% 500 39.41% 1.36% 551 37.93%
Retail -Other Retail -Of Which:SME 0 0 0 0 2,488 612 0 0 0 0 1,390 383 0 0 0 0 18 283 1.66% 342 40.89% 1.55% 378 37.92% 1.46% 409 36.02% 2.75% 369 40.30% 2.30% 420 37.77% 2.09% 464 36.39%
Retail -Other Retail -Of Which:non-SME 0 0 0 0 1,748 103 0 0 0 0 1,325 52 0 0 0 0 2 61 0.40% 70 53.55% 0.38% 76 50.05% 0.36% 83 47.60% 0.47% 71 54.30% 0.48% 79 51.14% 0.48% 88 48.86%
Equity 0 0 0 0 3,405 0 0 0 0 0 3,766 0 0 0 0 0 0 0 0.00% 0 - 0.00% 0 - 0.00% 0 - 0.00% 0 - 0.00% 0 - 0.00% 0 -
Securitisation 0 0 0 0 31 0 0 0 0 0 62 0 0 0 0 0 23 0
Othernon-credit obligation assets 0 0 0 0 4,836 0 0 0 0 0 4,173 0 0 0 0 0 1 0
TOTAL 0 0 0 0 56,947 5,554 0 0 0 0 30,042 3,141 0 0 0 0 655 2,556 0.28% 3,324 43.15% 0.26% 3,448 41.10% 0.24% 3,562 39.52% 0.45% 3,410 43.33% 0.45% 3,625 41.35% 0.43% 3,831 39.97%
Securitisation andre-securitisations positions deductedfrom capital * 0 0 0 0 0 0 0 0 0 0 0 0
(mln EUR, %)No n-d ef aul t ed De fau lt e d No n-d ef aul t ed De fau lt e d No n-d ef aul t ed De fau lt e d No n-d ef aul t e d De fau lt e d No n-d ef aul t ed De fau lt e d No n-d ef aul t e d De fau lt e d No n-d ef aul t ed De fau lt e d No n-d ef aul t ed De fau lt e d No n-d ef aul t ed De fau lt e d
Impairment
rate
Stockof
ProvisionsCoverage Ratio -
Default Stock
Impairment
rate
Stockof
Provisions
Coverage
Ratio-DefaultStock
Impairment
rate
Stockof
Provisions
Coverage
Ratio -DefaultStock
Impairment rateStockof
Provisions
Coverage
Ratio-DefaultStock
Impairment
rate
Stockof
Provisions
Coverage
Ratio-DefaultStock
Impairment
rate
Stockof
Provisions
Coverage
Ratio -DefaultStock
Central banksandcentral governments 0 0 0 0 3,557 19 0 0 0 0 14 28 0 0 0 0 0 0 0.00% 0 0.00% 0.00% 0 0.00% 0.00% 0 0.00% 0.74% 18 40.00% 0.74% 28 40.00% 0.74% 38 40.00%
Institutions 0 0 0 0 2,200 21 0 0 0 0 1,324 14 0 0 0 0 7 7 0.00% 14 26.23% 0.00% 14 22.31% 0.00% 14 19.53% 0.00% 14 19.47% 0.00% 14 14.69% 0.00% 14 12.19%
Corporates0 0 0 0 6,323 3,318 0 0 0 0 5,392 1,573 0 0 0 0 584 1,816 0.43% 2,427 53.64% 0.44% 2,454 52.73% 0.41% 2,479 51.99% 0.68% 2,443 53.49% 0.99% 2,503 52.15% 1.03% 2,568 51.13%Corporates -Of Which:SpecialisedLending 0 0 0 0 0 0 0 0 0 0 0 0 0 0 0 0 0 0 - 0 - - 0 - - 0 - - 0 - - 0 - - 0 -
Corporates -Of Which:SME 0 0 0 0 3,877 3,012 0 0 0 0 3,231 1,432 0 0 0 0 567 1,638 0.26% 2,215 53.31% 0.25% 2,224 52.40% 0.24% 2,233 51.65% 0.48% 2,223 53.10% 0.66% 2,248 51.65% 0.68% 2,274 50.46%
Retail 0 0 0 0 35,915 2,165 0 0 0 0 14,902 1,509 0 0 0 0 38 724 0.30% 870 30.49% 0.27% 965 28.73% 0.25% 1,053 27.51% 0.45% 922 31.27% 0.40% 1,064 30.01% 0.37% 1,194 29.20%
Retail -Securedon real estateproperty 45.2% 0 0 0 0 31,662 1,436 0 0 0 0 12,174 1,074 0 0 0 0 18 365 0.19% 443 23.68% 0.17% 496 22.60% 0.16% 546 21.83% 0.26% 467 24.73% 0.26% 549 24.28% 0.25% 627 23.95%
Retail -Securedon real estate property- Of
h i h : S E30.8% 0 0 0 0 920 208 0 0 0 0 236 158 0 0 0 0 5 62 1.08% 77 28.42% 1.02% 86 27.43% 0.97% 94 26.74% 1.51% 81 29.34% 1.59% 95 28.88% 1.46% 107 28.59%
Retail -Securedon real estate property- Of
h i h: n n - E46.0% 0 0 0 0 30,742 1,229 0 0 0 0 11,939 916 0 0 0 0 13 303 0.16% 365 22.89% 0.15% 410 21.80% 0.14% 452 21.04% 0.23% 386 23.96% 0.22% 454 23.51% 0.22% 520 23.19%
Retail -QualifyingRevolving 0 0 0 0 190 18 0 0 0 0 142 2 0 0 0 0 0 17 0.57% 18 78.40% 0.54% 19 70.33% 0.53% 20 64.58% 0.67% 18 78.82% 0.67% 19 70.80% 0.66% 20 65.15%
Retail -OtherRetail 0 0 0 0 4,064 711 0 0 0 0 2,586 432 0 0 0 0 20 342 1.17% 409 42.65% 1.08% 451 39.58% 1.00% 488 37.60% 1.86% 437 42.08% 1.55% 496 39.42% 1.39% 547 37.94%
Retail -Other Retail -Of Which:SME 0 0 0 0 2,483 610 0 0 0 0 1,385 382 0 0 0 0 18 282 1.66% 341 40.86% 1.55% 377 37.90% 1.46% 408 36.00% 2.75% 368 40.28% 2.30% 419 37.75% 2.09% 463 36.37%
Retail -Other Retail -Of Which:non-SME 0 0 0 0 1,581 100 0 0 0 0 1,200 50 0 0 0 0 2 60 0.40% 68 54.32% 0.38% 74 50.89% 0.36% 80 48.46% 0.47% 69 55.03% 0.48% 77 51.91% 0.48% 84 49.63%
Equity 0 0 0 0 3,405 0 0 0 0 0 3,766 0 0 0 0 0 0 0 0.00% 0 - 0.00% 0 - 0.00% 0 - 0.00% 0 - 0.00% 0 - 0.00% 0 -
Securitisation 0 0 0 0 31 0 0 0 0 0 62 0 0 0 0 0 23 0
Othernon-credit obligation assets 0 0 0 0 4,836 0 0 0 0 0 4,073 0 0 0 0 0 1 0
TOTAL 0 0 0 0 56,268 5,523 0 0 0 0 29,534 3,124 0 0 0 0 653 2,547 0.28% 3,311 43.23% 0.26% 3,433 41.18% 0.24% 3,546 39.60% 0.45% 3,397 43.42% 0.45% 3,609 41.43% 0.44% 3,813 40.05%Securitisation andre-securitisations positions deductedfrom capital * 0 0 0 0 0 0 0 0 0 0 0 0
(mln EUR, %)No n-d ef aul t ed De fau lt e d No n-d ef aul t ed De fau lt e d No n-d ef aul t ed De fau lt e d No n-d ef aul t e d De fau lt e d No n-d ef aul t ed De fau lt e d No n-d ef aul t e d De fau lt e d No n-d ef aul t ed De fau lt e d No n-d ef aul t ed De fau lt e d No n-d ef aul t ed De fau lt e d
Impairment
rate
Stockof
ProvisionsCoverage Ratio -
Default Stock
Impairment
rate
Stockof
Provisions
CoverageRatio-Default
Stock
Impairment
rate
Stockof
Provisions
CoverageRatio -Default
Stock
Impairment rateStockof
Provisions
CoverageRatio-Default
Stock
Impairment
rate
Stockof
Provisions
CoverageRatio-Default
Stock
Impairment
rate
Stockof
Provisions
CoverageRatio -Default
Stock Central banksandcentral governments 0 0 0 0 0 0 0 0 0 0 0 0 0 0 0 0 0 0 - 0 - - 0 - - 0 - - 0 - - 0 - - 0 -
Institutions 0 0 0 0 0 0 0 0 0 0 0 0 0 0 0 0 0 0 - 0 - - 0 - - 0 - - 0 - - 0 - - 0 -
Corporates 0 0 0 0 0 0 0 0 0 0 0 0 0 0 0 0 0 0 - 0 - - 0 - - 0 - - 0 - - 0 - - 0 -
Corporates -Of Which:SpecialisedLending 0 0 0 0 0 0 0 0 0 0 0 0 0 0 0 0 0 0 - 0 - - 0 - - 0 - - 0 - - 0 - - 0 -
Corporates -Of Which:SME 0 0 0 0 0 0 0 0 0 0 0 0 0 0 0 0 0 0 - 0 - - 0 - - 0 - - 0 - - 0 - - 0 -
Retail 0 0 0 0 0 0 0 0 0 0 0 0 0 0 0 0 0 0 - 0 - - 0 - - 0 - - 0 - - 0 - - 0 -
Retail -Securedon real estateproperty 0.0% 0 0 0 0 0 0 0 0 0 0 0 0 0 0 0 0 0 0 - 0 - - 0 - - 0 - - 0 - - 0 - - 0 -
Retail -Securedon real estate property- Of
hi h: E0.0% 0 0 0 0 0 0 0 0 0 0 0 0 0 0 0 0 0 0 - 0 - - 0 - - 0 - - 0 - - 0 - - 0 -
Retail -Securedon real estate property- Of
h i h : n n -S E0.0% 0 0 0 0 0 0 0 0 0 0 0 0 0 0 0 0 0 0 - 0 - - 0 - - 0 - - 0 - - 0 - - 0 -
Retail -QualifyingRevolving 0 0 0 0 0 0 0 0 0 0 0 0 0 0 0 0 0 0 - 0 - - 0 - - 0 - - 0 - - 0 - - 0 -
Retail -OtherRetail 0 0 0 0 0 0 0 0 0 0 0 0 0 0 0 0 0 0 - 0 - - 0 - - 0 - - 0 - - 0 - - 0 -
Retail -Other Retail -Of Which:SME 0 0 0 0 0 0 0 0 0 0 0 0 0 0 0 0 0 0 - 0 - - 0 - - 0 - - 0 - - 0 - - 0 -
Retail -Other Retail -Of Which:non-SME 0 0 0 0 0 0 0 0 0 0 0 0 0 0 0 0 0 0 - 0 - - 0 - - 0 - - 0 - - 0 - - 0 -
Equity 0 0 0 0 0 0 0 0 0 0 0 0 0 0 0 0 0 0 - 0 - - 0 - - 0 - - 0 - - 0 - - 0 -
Securitisation 0 0 0 0 0 0 0 0 0 0 0 0 0 0 0 0 0 0
Othernon-credit obligation assets 0 0 0 0 0 0 0 0 0 0 0 0 0 0 0 0 0 0
TOTAL 0 0 0 0 0 0 0 0 0 0 0 0 0 0 0 0 0 0 - 0 - - 0 - - 0 - - 0 - - 0 - - 0 -
Securitisation andre-securitisations positions deductedfrom capital * 0 0 0 0 0 0 0 0 0 0 0 0
(mln EUR, %)No n-d ef aul t ed De fau lt e d No n-d ef aul t ed De fau lt e d No n-d ef aul t ed De fau lt e d No n-d ef aul t e d De fau lt e d No n-d ef aul t ed De fau lt e d No n-d ef aul t e d De fau lt e d No n-d ef aul t ed De fau lt e d No n-d ef aul t ed De fau lt e d No n-d ef aul t ed De fau lt e d Impairment
rateStockof
ProvisionsCoverage Ratio -
Default Stock Impairment
rateStockof
Provisions
CoverageRatio-Default
Stock
Impairmentrate
Stockof Provisions
CoverageRatio -Default
Stock
Impairment rate Stockof Provisions
CoverageRatio-Default
Stock
Impairmentrate
Stockof Provisions
CoverageRatio-Default
Stock
Impairmentrate
Stockof Provisions
CoverageRatio -Default
Stock Central banksandcentral governments 0 0 0 0 0 0 0 0 0 0 0 0 0 0 0 0 0 0 - 0 - - 0 - - 0 - - 0 - - 0 - - 0 -
Institutions 0 0 0 0 0 0 0 0 0 0 0 0 0 0 0 0 0 0 - 0 - - 0 - - 0 - - 0 - - 0 - - 0 -
Corporates 0 0 0 0 0 0 0 0 0 0 0 0 0 0 0 0 0 0 - 0 - - 0 - - 0 - - 0 - - 0 - - 0 -
Corporates -Of Which:SpecialisedLending 0 0 0 0 0 0 0 0 0 0 0 0 0 0 0 0 0 0 - 0 - - 0 - - 0 - - 0 - - 0 - - 0 -
Corporates -Of Which:SME 0 0 0 0 0 0 0 0 0 0 0 0 0 0 0 0 0 0 - 0 - - 0 - - 0 - - 0 - - 0 - - 0 -
Retail 0 0 0 0 0 0 0 0 0 0 0 0 0 0 0 0 0 0 - 0 - - 0 - - 0 - - 0 - - 0 - - 0 -
Retail -Securedon real estateproperty 0.0% 0 0 0 0 0 0 0 0 0 0 0 0 0 0 0 0 0 0 - 0 - - 0 - - 0 - - 0 - - 0 - - 0 -
Retail -Securedon real estate property- Of
hi h: E0.0% 0 0 0 0 0 0 0 0 0 0 0 0 0 0 0 0 0 0 - 0 - - 0 - - 0 - - 0 - - 0 - - 0 -
Retail -Securedon real estate property- Of
h i h: n n - E0.0% 0 0 0 0 0 0 0 0 0 0 0 0 0 0 0 0 0 0 - 0 - - 0 - - 0 - - 0 - - 0 - - 0 -
Retail -QualifyingRevolving 0 0 0 0 0 0 0 0 0 0 0 0 0 0 0 0 0 0 - 0 - - 0 - - 0 - - 0 - - 0 - - 0 -
Retail -OtherRetail 0 0 0 0 0 0 0 0 0 0 0 0 0 0 0 0 0 0 - 0 - - 0 - - 0 - - 0 - - 0 - - 0 -
Retail -Other Retail -Of Which:SME 0 0 0 0 0 0 0 0 0 0 0 0 0 0 0 0 0 0 - 0 - - 0 - - 0 - - 0 - - 0 - - 0 -
Retail -Other Retail -Of Which:non-SME 0 0 0 0 0 0 0 0 0 0 0 0 0 0 0 0 0 0 - 0 - - 0 - - 0 - - 0 - - 0 - - 0 -
Equity 0 0 0 0 0 0 0 0 0 0 0 0 0 0 0 0 0 0 - 0 - - 0 - - 0 - - 0 - - 0 - - 0 -
Securitisation 0 0 0 0 0 0 0 0 0 0 0 0 0 0 0 0 0 0
Othernon-credit obligation assets 0 0 0 0 0 0 0 0 0 0 0 0 0 0 0 0 0 0
TOTAL 0 0 0 0 0 0 0 0 0 0 0 0 0 0 0 0 0 0 - 0 - - 0 - - 0 - - 0 - - 0 - - 0 -
Securitisation andre-securitisations positions deductedfrom capital * 0 0 0 0 0 0 0 0 0 0 0 0
(mln EUR, %)No n-d ef aul t ed De fau lt e d No n-d ef aul t ed De fau lt e d No n-d ef aul t ed De fau lt e d No n-d ef aul t e d De fau lt e d No n-d ef aul t ed De fau lt e d No n-d ef aul t e d De fau lt e d No n-d ef aul t ed De fau lt e d No n-d ef aul t ed De fau lt e d No n-d ef aul t ed De fau lt e d
Impairment
rate
Stockof
ProvisionsCoverage Ratio -
Default Stock
Impairment
rate
Stockof
Provisions
CoverageRatio-Default
Stock
Impairment
rate
Stockof
Provisions
CoverageRatio -Default
Stock
Impairment rateStockof
Provisions
CoverageRatio-Default
Stock
Impairment
rate
Stockof
Provisions
CoverageRatio-Default
Stock
Impairment
rate
Stockof
Provisions
CoverageRatio -Default
Stock Central banksandcentral governments 0 0 0 0 0 0 0 0 0 0 0 0 0 0 0 0 0 0 - 0 - - 0 - - 0 - - 0 - - 0 - - 0 -
Institutions 0 0 0 0 0 0 0 0 0 0 0 0 0 0 0 0 0 0 - 0 - - 0 - - 0 - - 0 - - 0 - - 0 -
Corporates 0 0 0 0 0 0 0 0 0 0 0 0 0 0 0 0 0 0 - 0 - - 0 - - 0 - - 0 - - 0 - - 0 -
Corporates -Of Which:SpecialisedLending 0 0 0 0 0 0 0 0 0 0 0 0 0 0 0 0 0 0 - 0 - - 0 - - 0 - - 0 - - 0 - - 0 -
Corporates -Of Which:SME 0 0 0 0 0 0 0 0 0 0 0 0 0 0 0 0 0 0 - 0 - - 0 - - 0 - - 0 - - 0 - - 0 -
Retail 0 0 0 0 0 0 0 0 0 0 0 0 0 0 0 0 0 0 - 0 - - 0 - - 0 - - 0 - - 0 - - 0 -
Retail -Securedon real estateproperty 0.0% 0 0 0 0 0 0 0 0 0 0 0 0 0 0 0 0 0 0 - 0 - - 0 - - 0 - - 0 - - 0 - - 0 -
Retail -Securedon real estate property- Of
hi h: E0.0% 0 0 0 0 0 0 0 0 0 0 0 0 0 0 0 0 0 0 - 0 - - 0 - - 0 - - 0 - - 0 - - 0 -
Retail -Securedon real estate property- Of
h i h : n n -S E0.0% 0 0 0 0 0 0 0 0 0 0 0 0 0 0 0 0 0 0 - 0 - - 0 - - 0 - - 0 - - 0 - - 0 -
Retail -QualifyingRevolving 0 0 0 0 0 0 0 0 0 0 0 0 0 0 0 0 0 0 - 0 - - 0 - - 0 - - 0 - - 0 - - 0 -
Retail -OtherRetail 0 0 0 0 0 0 0 0 0 0 0 0 0 0 0 0 0 0 - 0 - - 0 - - 0 - - 0 - - 0 - - 0 -
Retail -Other Retail -Of Which:SME 0 0 0 0 0 0 0 0 0 0 0 0 0 0 0 0 0 0 - 0 - - 0 - - 0 - - 0 - - 0 - - 0 -
Retail -Other Retail -Of Which:non-SME 0 0 0 0 0 0 0 0 0 0 0 0 0 0 0 0 0 0 - 0 - - 0 - - 0 - - 0 - - 0 - - 0 -
Equity 0 0 0 0 0 0 0 0 0 0 0 0 0 0 0 0 0 0 - 0 - - 0 - - 0 - - 0 - - 0 - - 0 -
Securitisation 0 0 0 0 0 0 0 0 0 0 0 0 0 0 0 0 0 0
Othernon-credit obligation assets 0 0 0 0 0 0 0 0 0 0 0 0 0 0 0 0 0 0
TOTAL 0 0 0 0 0 0 0 0 0 0 0 0 0 0 0 0 0 0 - 0 - - 0 - - 0 - - 0 - - 0 - - 0 -
Securitisation andre-securitisations positions deductedfrom capital * 0 0 0 0 0 0 0 0 0 0 0 0
(mln EUR, %)No n-d ef aul t ed De fau lt e d No n-d ef aul t ed De fau lt e d No n-d ef aul t ed De fau lt e d No n-d ef aul t e d De fau lt e d No n-d ef aul t ed De fau lt e d No n-d ef aul t e d De fau lt e d No n-d ef aul t ed De fau lt e d No n-d ef aul t ed De fau lt e d No n-d ef aul t ed De fau lt e d
Impairment
rate
Stockof
ProvisionsCoverage Ratio -
Default Stock
Impairment
rate
Stockof
Provisions
CoverageRatio-Default
Stock
Impairment
rate
Stockof
Provisions
CoverageRatio -Default
Stock
Impairment rateStockof
Provisions
CoverageRatio-Default
Stock
Impairment
rate
Stockof
Provisions
CoverageRatio-Default
Stock
Impairment
rate
Stockof
Provisions
CoverageRatio -Default
Stock Central banksandcentral governments 0 0 0 0 0 0 0 0 0 0 0 0 0 0 0 0 0 0 - 0 - - 0 - - 0 - - 0 - - 0 - - 0 -
Institutions 0 0 0 0 0 0 0 0 0 0 0 0 0 0 0 0 0 0 - 0 - - 0 - - 0 - - 0 - - 0 - - 0 -
Corporates 0 0 0 0 0 0 0 0 0 0 0 0 0 0 0 0 0 0 - 0 - - 0 - - 0 - - 0 - - 0 - - 0 -
Corporates -Of Which:SpecialisedLending 0 0 0 0 0 0 0 0 0 0 0 0 0 0 0 0 0 0 - 0 - - 0 - - 0 - - 0 - - 0 - - 0 -
Corporates -Of Which:SME 0 0 0 0 0 0 0 0 0 0 0 0 0 0 0 0 0 0 - 0 - - 0 - - 0 - - 0 - - 0 - - 0 -
Retail 0 0 0 0 0 0 0 0 0 0 0 0 0 0 0 0 0 0 - 0 - - 0 - - 0 - - 0 - - 0 - - 0 -
Retail -Securedon real estateproperty 0.0% 0 0 0 0 0 0 0 0 0 0 0 0 0 0 0 0 0 0 - 0 - - 0 - - 0 - - 0 - - 0 - - 0 -
Retail -Securedon real estate property- Of
hi h: E0.0% 0 0 0 0 0 0 0 0 0 0 0 0 0 0 0 0 0 0 - 0 - - 0 - - 0 - - 0 - - 0 - - 0 -
Retail -Securedon real estate property- Of
h i h: n n - E0.0% 0 0 0 0 0 0 0 0 0 0 0 0 0 0 0 0 0 0 - 0 - - 0 - - 0 - - 0 - - 0 - - 0 -
Retail -QualifyingRevolving 0 0 0 0 0 0 0 0 0 0 0 0 0 0 0 0 0 0 - 0 - - 0 - - 0 - - 0 - - 0 - - 0 -
Retail -OtherRetail 0 0 0 0 0 0 0 0 0 0 0 0 0 0 0 0 0 0 - 0 - - 0 - - 0 - - 0 - - 0 - - 0 -
Retail -Other Retail -Of Which:SME 0 0 0 0 0 0 0 0 0 0 0 0 0 0 0 0 0 0 - 0 - - 0 - - 0 - - 0 - - 0 - - 0 -
Retail -Other Retail -Of Which:non-SME 0 0 0 0 0 0 0 0 0 0 0 0 0 0 0 0 0 0 - 0 - - 0 - - 0 - - 0 - - 0 - - 0 -
Equity 0 0 0 0 0 0 0 0 0 0 0 0 0 0 0 0 0 0 - 0 - - 0 - - 0 - - 0 - - 0 - - 0 -
Securitisation 0 0 0 0 0 0 0 0 0 0 0 0 0 0 0 0 0 0
Othernon-credit obligation assets 0 0 0 0 0 0 0 0 0 0 0 0 0 0 0 0 0 0
TOTAL 0 0 0 0 0 0 0 0 0 0 0 0 0 0 0 0 0 0 - 0 - - 0 - - 0 - - 0 - - 0 - - 0 -
Securitisation andre-securitisations positions deductedfrom capital * 0 0 0 0 0 0 0 0 0 0 0 0
as of 31/12/2016 as of 31/12/2014 as of 31/12/2015 as of 31/12/2016
Please, select the country
F-IRB A-IRB STA a s of 3 1/ 12 /2 01 4 a s of 3 1/ 12 /2 01 5LTV %(asof
31/12/2013)
Exposure values (as of 31/12/2013) Risk exposure amounts (as of 31/12/2013) Value adjustments and provisions (as of 31/12/2013) Baseline Scenario Adverse Scenario
F-IRB A-IRB STA F-IRB A-IRB STA
LTV %(asof
31/12/2013)
Exposure values (as of 31/12/2013) Risk exposure amounts (as of 31/12/2013) Value adjustments and provisions (as of 31/12/2013) Baseline Scenario Adverse Scenario
F-IRB A-IRB STA F-IRB A-IRB STA F-IRB a sof 31 /12 /2 01 4 a so f3 1/ 12 /2 01 5 a sof 31 /12 /2 01 6 A-IRB STA a sof 31 /1 2/ 20 14 a so f3 1/ 12 /2 01 5 a sof 31 /12 /2 01 6
LTV %(asof
31/12/2013)
Exposure values (as of 31/12/2013) Risk exposure amounts (as of 31/12/2013) Value adjustments and provisions (as of 31/12/2013) Baseline Scenario Adverse Scenario
F-IRB A-IRB STA F-IRB A-IRB STA F-IRB A-IRB a s of 3 1/ 12 /2 01 5 a s of 3 1/ 12 /2 01 6STA as of 31/12/2014 as of 31/12/2015 as of 31/12/2016 as of 31/12/2014
Risk exposureamounts(as of31/12/2013)
Baseline Scenario Adverse Scenario
F-IRB A-IRB STA F-IRB A-IRB STA F-IRB A-IRB STA as of 31/12/2014 as of 31/12/2015 as of 31/12/2016 as of 31/12/2014 as of 31/12/2015 as of 31/12/2016
Spain
LTV %(asof
31/12/2013)
E xp os ur e va lu es ( as of 3 1/ 12 /2 01 3) R is k e xp os ur e am ou nt s (a s of 3 1/ 12 /2 01 3) V al ue a dj us tm en ts a nd pr ov is io ns ( as o f3 1/ 12 /2 01 3)
AdverseScenario
F-IRB A-IRB STA F-IRB A-IRB STA F-IRB A-IRB STA as of 31/12/2014 as of 31/12/2015 as of 31/12/2016 as of 31/12/2014 as of 31/12/2015 as of 31/12/2016LTV %(asof
31/12/2013)
Exposurevalues(as of31/12/2013)
ES - Kutxabank, S.A.
(*)Referstothepart ofSecuritizationexposurethat isdeductedfrom capital andisnot includedinRWA
Valueadjustmentsand provisions(asof 31/12/2013) BaselineScenario
(*)Referstothepart ofSecuritizationexposurethat isdeductedfrom capital andisnot includedinRWA
(*)Referstothepart ofSecuritizationexposurethat isdeductedfrom capital andisnot includedinRWA
(*)Referstothepart ofSecuritizationexposurethat isdeductedfrom capital andisnot includedinRWA
(*)Referstothepart ofSecuritizationexposurethat isdeductedfrom capital andisnot includedinRWA
(*)Referstothepart ofSecuritizationexposurethat isdeductedfrom capital andisnot includedinRWA
Please, select the country
Please, select the country
Please, select the country
http://www.economiaciudadana.org/
2014 EU-wide Stress TestCredit Risk
31 1 13) 31 1 13) 31 1 13)
(mln EU
R, %)No n-d ef aul t ed De fau lt e d No n-d ef aul t ed De fau lt e d No n-d ef aul t ed De fau lt e d No n-d ef aul t e d De fau lt e d No n-d ef aul t ed De fau lt e d No n-d ef aul t e d De fau lt e d No n-d ef aul t ed De fau lt e d No n-d ef aul t ed De fau lt e d No n-d ef aul t ed De fau lt e d
Impairment
rate
Stockof
ProvisionsCoverage Ratio -
Default Stock
Impairment
rate
Stockof
Provisions
CoverageRatio-Default
Stock
Impairment
rate
Stockof
Provisions
CoverageRatio -Default
Stock
Impairment rateStockof
Provisions
CoverageRatio-Default
Stock
Impairment
rate
Stockof
Provisions
CoverageRatio-Default
Stock
Impairment
rate
Stockof
Provisions
CoverageRatio -Default
Stock Central banksandcentral governments 0 0 0 0 0 0 0 0 0 0 0 0 0 0 0 0 0 0 - 0 - - 0 - - 0 - - 0 - - 0 - - 0 -
Institutions 0 0 0 0 0 0 0 0 0 0 0 0 0 0 0 0 0 0 - 0 - - 0 - - 0 - - 0 - - 0 - - 0 -
Corporates 0 0 0 0 0 0 0 0 0 0 0 0 0 0 0 0 0 0 - 0 - - 0 - - 0 - - 0 - - 0 - - 0 -
Corporates -Of Which:SpecialisedLending 0 0 0 0 0 0 0 0 0 0 0 0 0 0 0 0 0 0 - 0 - - 0 - - 0 - - 0 - - 0 - - 0 -
Corporates -Of Which:SME 0 0 0 0 0 0 0 0 0 0 0 0 0 0 0 0 0 0 - 0 - - 0 - - 0 - - 0 - - 0 - - 0 -
AdverseScenario
F-IRB A-IRB STA F-IRB A-IRB STA F-IRB A-IRB STA as of 31/12/2014 as of 31/12/2015 as of 31/12/2016 as of 31/12/2014 as of 31/12/2015 as of 31/12/2016LTV %(asof
31/12/2013)
E xp os ur e va lu es ( as of 3 1/ 12 /2 01 3) R is k e xp os ur e am ou nt s (a s of 3 1/ 12 /2 01 3) Valueadjustmentsand provisions(asof 31/12/2013) BaselineScenario

8/10/2019 Test Stress Banca Española 2014
http://slidepdf.com/reader/full/test-stress-banca-espanola-2014 52/240
Corporates Of Which:SME 0 0 0 0 0 0 0 0 0 0 0 0 0 0 0 0 0 0 - 0 - - 0 - - 0 - - 0 - - 0 - - 0 -
Retail 0 0 0 0 0 0 0 0 0 0 0 0 0 0 0 0 0 0 - 0 - - 0 - - 0 - - 0 - - 0 - - 0 -
Retail -Securedon real estateproperty 0.0% 0 0 0 0 0 0 0 0 0 0 0 0 0 0 0 0 0 0 - 0 - - 0 - - 0 - - 0 - - 0 - - 0 -
Retail -Securedon real estate property- Of
hi h: E0.0% 0 0 0 0 0 0 0 0 0 0 0 0 0 0 0 0 0 0 - 0 - - 0 - - 0 - - 0 - - 0 - - 0 -
Retail -Securedon real estate property- Of
h i h: n n - E0.0% 0 0 0 0 0 0 0 0 0 0 0 0 0 0 0 0 0 0 - 0 - - 0 - - 0 - - 0 - - 0 - - 0 -
Retail -QualifyingRevolving 0 0 0 0 0 0 0 0 0 0 0 0 0 0 0 0 0 0 - 0 - - 0 - - 0 - - 0 - - 0 - - 0 -
Retail -OtherRetail 0 0 0 0 0 0 0 0 0 0 0 0 0 0 0 0 0 0 - 0 - - 0 - - 0 - - 0 - - 0 - - 0 -
Retail -Other Retail -Of Which:SME 0 0 0 0 0 0 0 0 0 0 0 0 0 0 0 0 0 0 - 0 - - 0 - - 0 - - 0 - - 0 - - 0 -
Retail -Other Retail -Of Which:non-SME 0 0 0 0 0 0 0 0 0 0 0 0 0 0 0 0 0 0 - 0 - - 0 - - 0 - - 0 - - 0 - - 0 -
Equity 0 0 0 0 0 0 0 0 0 0 0 0 0 0 0 0 0 0 - 0 - - 0 - - 0 - - 0 - - 0 - - 0 -
Securitisation 0 0 0 0 0 0 0 0 0 0 0 0 0 0 0 0 0 0
Othernon-credit obligation assets 0 0 0 0 0 0 0 0 0 0 0 0 0 0 0 0 0 0
TOTAL 0 0 0 0 0 0 0 0 0 0 0 0 0 0 0 0 0 0 - 0 - - 0 - - 0 - - 0 - - 0 - - 0 -
Securitisation andre-securitisations positions deductedfrom capital * 0 0 0 0 0 0 0 0 0 0 0 0
(mln EUR, %)No n-d ef aul t ed De fau lt e d No n-d ef aul t ed De fau lt e d No n-d ef aul t ed De fau lt e d No n-d ef aul t e d De fau lt e d No n-d ef aul t ed De fau lt e d No n-d ef aul t e d De fau lt e d No n-d ef aul t ed De fau lt e d No n-d ef aul t ed De fau lt e d No n-d ef aul t ed De fau lt e d
Impairment
rate
Stockof
ProvisionsCoverage Ratio -
Default Stock
Impairment
rate
Stockof
Provisions
CoverageRatio-Default
Stock
Impairment
rate
Stockof
Provisions
CoverageRatio -Default
Stock
Impairment rateStockof
Provisions
CoverageRatio-Default
Stock
Impairment
rate
Stockof
Provisions
CoverageRatio-Default
Stock
Impairment
rate
Stockof
Provisions
CoverageRatio -Default
Stock Central banksandcentral governments 0 0 0 0 0 0 0 0 0 0 0 0 0 0 0 0 0 0 - 0 - - 0 - - 0 - - 0 - - 0 - - 0 -
Institutions 0 0 0 0 0 0 0 0 0 0 0 0 0 0 0 0 0 0 - 0 - - 0 - - 0 - - 0 - - 0 - - 0 -
Corporates 0 0 0 0 0 0 0 0 0 0 0 0 0 0 0 0 0 0 - 0 - - 0 - - 0 - - 0 - - 0 - - 0 -
Corporates -Of Which:SpecialisedLending 0 0 0 0 0 0 0 0 0 0 0 0 0 0 0 0 0 0 - 0 - - 0 - - 0 - - 0 - - 0 - - 0 -
Corporates -Of Which:SME 0 0 0 0 0 0 0 0 0 0 0 0 0 0 0 0 0 0 - 0 - - 0 - - 0 - - 0 - - 0 - - 0 -
Retail 0 0 0 0 0 0 0 0 0 0 0 0 0 0 0 0 0 0 - 0 - - 0 - - 0 - - 0 - - 0 - - 0 -
Retail -Securedon real estateproperty 0.0% 0 0 0 0 0 0 0 0 0 0 0 0 0 0 0 0 0 0 - 0 - - 0 - - 0 - - 0 - - 0 - - 0 -
Retail -Securedon real estate property- Of
h i h : S E 0.0% 0 0 0 0 0 0 0 0 0 0 0 0 0 0 0 0 0 0 - 0 - - 0 - - 0 - - 0 - - 0 - - 0 -Retail -Securedon real estate property- Of
h i h: n n - E0.0% 0 0 0 0 0 0 0 0 0 0 0 0 0 0 0 0 0 0 - 0 - - 0 - - 0 - - 0 - - 0 - - 0 -
Retail -QualifyingRevolving 0 0 0 0 0 0 0 0 0 0 0 0 0 0 0 0 0 0 - 0 - - 0 - - 0 - - 0 - - 0 - - 0 -
Retail -OtherRetail 0 0 0 0 0 0 0 0 0 0 0 0 0 0 0 0 0 0 - 0 - - 0 - - 0 - - 0 - - 0 - - 0 -
Retail -Other Retail -Of Which:SME 0 0 0 0 0 0 0 0 0 0 0 0 0 0 0 0 0 0 - 0 - - 0 - - 0 - - 0 - - 0 - - 0 -
Retail -Other Retail -Of Which:non-SME 0 0 0 0 0 0 0 0 0 0 0 0 0 0 0 0 0 0 - 0 - - 0 - - 0 - - 0 - - 0 - - 0 -
Equity 0 0 0 0 0 0 0 0 0 0 0 0 0 0 0 0 0 0 - 0 - - 0 - - 0 - - 0 - - 0 - - 0 -
Securitisation 0 0 0 0 0 0 0 0 0 0 0 0 0 0 0 0 0 0
Othernon-credit obligation assets 0 0 0 0 0 0 0 0 0 0 0 0 0 0 0 0 0 0
TOTAL 0 0 0 0 0 0 0 0 0 0 0 0 0 0 0 0 0 0 - 0 - - 0 - - 0 - - 0 - - 0 - - 0 -
Securitisation andre-securitisations positions deductedfrom capital * 0 0 0 0 0 0 0 0 0 0 0 0
(mln EUR, %)No n-d ef aul t ed De fau lt e d No n-d ef aul t ed De fau lt e d No n-d ef aul t ed De fau lt e d No n-d ef aul t e d De fau lt e d No n-d ef aul t ed De fau lt e d No n-d ef aul t e d De fau lt e d No n-d ef aul t ed De fau lt e d No n-d ef aul t ed De fau lt e d No n-d ef aul t ed De fau lt e d
Impairment
rate
Stockof
ProvisionsCoverage Ratio -
Default Stock
Impairment
rate
Stockof
Provisions
Coverage
Ratio-Default
Stock
Impairment
rate
Stockof
Provisions
Coverage
Ratio -Default
Stock
Impairment rateStockof
Provisions
Coverage
Ratio-Default
Stock
Impairment
rate
Stockof
Provisions
Coverage
Ratio-Default
Stock
Impairment
rate
Stockof
Provisions
Coverage
Ratio -Default
Stock Central banksandcentral governments 0 0 0 0 0 0 0 0 0 0 0 0 0 0 0 0 0 0 - 0 - - 0 - - 0 - - 0 - - 0 - - 0 -
Institutions 0 0 0 0 0 0 0 0 0 0 0 0 0 0 0 0 0 0 - 0 - - 0 - - 0 - - 0 - - 0 - - 0 -
Corporates 0 0 0 0 0 0 0 0 0 0 0 0 0 0 0 0 0 0 - 0 - - 0 - - 0 - - 0 - - 0 - - 0 -
Corporates -Of Which:SpecialisedLending 0 0 0 0 0 0 0 0 0 0 0 0 0 0 0 0 0 0 - 0 - - 0 - - 0 - - 0 - - 0 - - 0 -
Corporates -Of Which:SME 0 0 0 0 0 0 0 0 0 0 0 0 0 0 0 0 0 0 - 0 - - 0 - - 0 - - 0 - - 0 - - 0 -
Retail 0 0 0 0 0 0 0 0 0 0 0 0 0 0 0 0 0 0 - 0 - - 0 - - 0 - - 0 - - 0 - - 0 -
Retail -Securedon real estateproperty 0.0% 0 0 0 0 0 0 0 0 0 0 0 0 0 0 0 0 0 0 - 0 - - 0 - - 0 - - 0 - - 0 - - 0 -
Retail -Securedon real estate property- Of
hi h: E0.0% 0 0 0 0 0 0 0 0 0 0 0 0 0 0 0 0 0 0 - 0 - - 0 - - 0 - - 0 - - 0 - - 0 -
Retail -Securedon real estate property- Of
h i h: n n - E0.0% 0 0 0 0 0 0 0 0 0 0 0 0 0 0 0 0 0 0 - 0 - - 0 - - 0 - - 0 - - 0 - - 0 -
Retail -QualifyingRevolving 0 0 0 0 0 0 0 0 0 0 0 0 0 0 0 0 0 0 - 0 - - 0 - - 0 - - 0 - - 0 - - 0 -
Retail -OtherRetail 0 0 0 0 0 0 0 0 0 0 0 0 0 0 0 0 0 0 - 0 - - 0 - - 0 - - 0 - - 0 - - 0 -
Retail -Other Retail -Of Which:SME 0 0 0 0 0 0 0 0 0 0 0 0 0 0 0 0 0 0 - 0 - - 0 - - 0 - - 0 - - 0 - - 0 -
Retail -Other Retail -Of Which:non-SME 0 0 0 0 0 0 0 0 0 0 0 0 0 0 0 0 0 0 - 0 - - 0 - - 0 - - 0 - - 0 - - 0 -
Equity 0 0 0 0 0 0 0 0 0 0 0 0 0 0 0 0 0 0 - 0 - - 0 - - 0 - - 0 - - 0 - - 0 -
Securitisation 0 0 0 0 0 0 0 0 0 0 0 0 0 0 0 0 0 0
Othernon-credit obligation assets 0 0 0 0 0 0 0 0 0 0 0 0 0 0 0 0 0 0
TOTAL 0 0 0 0 0 0 0 0 0 0 0 0 0 0 0 0 0 0 - 0 - - 0 - - 0 - - 0 - - 0 - - 0 -
Securitisation andre-securitisations positions deductedfrom capital * 0 0 0 0 0 0 0 0 0 0 0 0
(mln EUR, %)No n-d ef aul t ed De fau lt e d No n-d ef aul t ed De fau lt e d No n-d ef aul t ed De fau lt e d No n-d ef aul t e d De fau lt e d No n-d ef aul t ed De fau lt e d No n-d ef aul t e d De fau lt e d No n-d ef aul t ed De fau lt e d No n-d ef aul t ed De fau lt e d No n-d ef aul t ed De fau lt e d
Impairment
rate
Stockof
ProvisionsCoverage Ratio -
Default Stock
Impairment
rate
Stockof
Provisions
Coverage
Ratio-Default
Stock
Impairment
rate
Stockof
Provisions
Coverage
Ratio -Default
Stock
Impairment rateStockof
Provisions
Coverage
Ratio-Default
Stock
Impairment
rate
Stockof
Provisions
Coverage
Ratio-Default
Stock
Impairment
rate
Stockof
Provisions
Coverage
Ratio -Default
Stock Central banksandcentral governments 0 0 0 0 0 0 0 0 0 0 0 0 0 0 0 0 0 0 - 0 - - 0 - - 0 - - 0 - - 0 - - 0 -
Institutions 0 0 0 0 0 0 0 0 0 0 0 0 0 0 0 0 0 0 - 0 - - 0 - - 0 - - 0 - - 0 - - 0 -
Corporates 0 0 0 0 0 0 0 0 0 0 0 0 0 0 0 0 0 0 - 0 - - 0 - - 0 - - 0 - - 0 - - 0 -
Corporates -Of Which:SpecialisedLending 0 0 0 0 0 0 0 0 0 0 0 0 0 0 0 0 0 0 - 0 - - 0 - - 0 - - 0 - - 0 - - 0 -Corporates -Of Which:SME 0 0 0 0 0 0 0 0 0 0 0 0 0 0 0 0 0 0 - 0 - - 0 - - 0 - - 0 - - 0 - - 0 -
Retail 0 0 0 0 0 0 0 0 0 0 0 0 0 0 0 0 0 0 - 0 - - 0 - - 0 - - 0 - - 0 - - 0 -
Retail -Securedon real estateproperty 0.0% 0 0 0 0 0 0 0 0 0 0 0 0 0 0 0 0 0 0 - 0 - - 0 - - 0 - - 0 - - 0 - - 0 -
Retail -Securedon real estate property- Of
h i h : S E0.0% 0 0 0 0 0 0 0 0 0 0 0 0 0 0 0 0 0 0 - 0 - - 0 - - 0 - - 0 - - 0 - - 0 -
Retail -Securedon real estate property- Of
h i h: n n - E0.0% 0 0 0 0 0 0 0 0 0 0 0 0 0 0 0 0 0 0 - 0 - - 0 - - 0 - - 0 - - 0 - - 0 -
Retail -QualifyingRevolving 0 0 0 0 0 0 0 0 0 0 0 0 0 0 0 0 0 0 - 0 - - 0 - - 0 - - 0 - - 0 - - 0 -
Retail -OtherRetail 0 0 0 0 0 0 0 0 0 0 0 0 0 0 0 0 0 0 - 0 - - 0 - - 0 - - 0 - - 0 - - 0 -
Retail -Other Retail -Of Which:SME 0 0 0 0 0 0 0 0 0 0 0 0 0 0 0 0 0 0 - 0 - - 0 - - 0 - - 0 - - 0 - - 0 -
Retail -Other Retail -Of Which:non-SME 0 0 0 0 0 0 0 0 0 0 0 0 0 0 0 0 0 0 - 0 - - 0 - - 0 - - 0 - - 0 - - 0 -
Equity 0 0 0 0 0 0 0 0 0 0 0 0 0 0 0 0 0 0 - 0 - - 0 - - 0 - - 0 - - 0 - - 0 -
Securitisation 0 0 0 0 0 0 0 0 0 0 0 0 0 0 0 0 0 0
Othernon-credit obligation assets 0 0 0 0 0 0 0 0 0 0 0 0 0 0 0 0 0 0
TOTAL 0 0 0 0 0 0 0 0 0 0 0 0 0 0 0 0 0 0 - 0 - - 0 - - 0 - - 0 - - 0 - - 0 -Securitisation andre-securitisations positions deductedfrom capital * 0 0 0 0 0 0 0 0 0 0 0 0
(mln EUR, %)No n-d ef aul t ed De fau lt e d No n-d ef aul t ed De fau lt e d No n-d ef aul t ed De fau lt e d No n-d ef aul t e d De fau lt e d No n-d ef aul t ed De fau lt e d No n-d ef aul t e d De fau lt e d No n-d ef aul t ed De fau lt e d No n-d ef aul t ed De fau lt e d No n-d ef aul t ed De fau lt e d
Impairment
rate
Stockof
ProvisionsCoverage Ratio -
Default Stock
Impairment
rate
Stockof
Provisions
Coverage
Ratio-DefaultStock
Impairment
rate
Stockof
Provisions
Coverage
Ratio -DefaultStock
Impairment rateStockof
Provisions
Coverage
Ratio-DefaultStock
Impairment
rate
Stockof
Provisions
Coverage
Ratio-DefaultStock
Impairment
rate
Stockof
Provisions
Coverage
Ratio -DefaultStock
Central banksandcentral governments 0 0 0 0 0 0 0 0 0 0 0 0 0 0 0 0 0 0 - 0 - - 0 - - 0 - - 0 - - 0 - - 0 -
Institutions 0 0 0 0 0 0 0 0 0 0 0 0 0 0 0 0 0 0 - 0 - - 0 - - 0 - - 0 - - 0 - - 0 -
Corporates 0 0 0 0 0 0 0 0 0 0 0 0 0 0 0 0 0 0 - 0 - - 0 - - 0 - - 0 - - 0 - - 0 -
Corporates -Of Which:SpecialisedLending 0 0 0 0 0 0 0 0 0 0 0 0 0 0 0 0 0 0 - 0 - - 0 - - 0 - - 0 - - 0 - - 0 -
Corporates -Of Which:SME 0 0 0 0 0 0 0 0 0 0 0 0 0 0 0 0 0 0 - 0 - - 0 - - 0 - - 0 - - 0 - - 0 -
Retail 0 0 0 0 0 0 0 0 0 0 0 0 0 0 0 0 0 0 - 0 - - 0 - - 0 - - 0 - - 0 - - 0 -
Retail -Securedon real estateproperty 0.0% 0 0 0 0 0 0 0 0 0 0 0 0 0 0 0 0 0 0 - 0 - - 0 - - 0 - - 0 - - 0 - - 0 -
Retail -Securedon real estate property- Of
hi h: E0.0% 0 0 0 0 0 0 0 0 0 0 0 0 0 0 0 0 0 0 - 0 - - 0 - - 0 - - 0 - - 0 - - 0 -
Retail -Securedon real estate property- Of
h i h : n n -S E0.0% 0 0 0 0 0 0 0 0 0 0 0 0 0 0 0 0 0 0 - 0 - - 0 - - 0 - - 0 - - 0 - - 0 -
Retail -QualifyingRevolving 0 0 0 0 0 0 0 0 0 0 0 0 0 0 0 0 0 0 - 0 - - 0 - - 0 - - 0 - - 0 - - 0 -
Retail -OtherRetail 0 0 0 0 0 0 0 0 0 0 0 0 0 0 0 0 0 0 - 0 - - 0 - - 0 - - 0 - - 0 - - 0 -
Retail -Other Retail -Of Which:SME 0 0 0 0 0 0 0 0 0 0 0 0 0 0 0 0 0 0 - 0 - - 0 - - 0 - - 0 - - 0 - - 0 -
Retail -Other Retail -Of Which:non-SME 0 0 0 0 0 0 0 0 0 0 0 0 0 0 0 0 0 0 - 0 - - 0 - - 0 - - 0 - - 0 - - 0 -
Equity 0 0 0 0 0 0 0 0 0 0 0 0 0 0 0 0 0 0 - 0 - - 0 - - 0 - - 0 - - 0 - - 0 -
Securitisation 0 0 0 0 0 0 0 0 0 0 0 0 0 0 0 0 0 0
Othernon-credit obligation assets 0 0 0 0 0 0 0 0 0 0 0 0 0 0 0 0 0 0
TOTAL 0 0 0 0 0 0 0 0 0 0 0 0 0 0 0 0 0 0 - 0 - - 0 - - 0 - - 0 - - 0 - - 0 -Securitisation andre-securitisations positions deductedfrom capital * 0 0 0 0 0 0 0 0 0 0 0 0
LTV %(asof
31/12/2013)
Exposure values (as of 31/12/2013) Risk exposure amounts (as of 31/12/2013) Value adjustments and provisions (as of 31/12/2013) Baseline Scenario Adverse Scenario
F-IRB A-IRB STA F-IRB A-IRB STA as of 31/12/2016 as of 31/12/2014 as of 31/12/2015 as of 31/12/2016F-IRB A-IRB STA a s of 3 1/ 12 /2 01 4 a s of 3 1/ 12 /2 01 5
LTV %(asof
31/12/2013)
Exposure values (as of 31/12/2013) Risk exposure amounts (as of 31/12/2013) Value adjustments and provisions (as of 31/12/2013) Baseline Scenario Adverse Scenario
F-IRB A-IRB STA F-IRB A-IRB STA F-IRB a sof 31 /12 /2 01 4 a so f3 1/ 12 /2 01 5 a sof 31 /12 /2 01 6 A-IRB STA a sof 31 /1 2/ 20 14 a so f3 1/ 12 /2 01 5 a sof 31 /12 /2 01 6
LTV %(asof
31/12/2013)
Exposure values (as of 31/12/2013) Risk exposure amounts (as of 31/12/2013) Value adjustments and provisions (as of 31/12/2013) Baseline Scenario Adverse Scenario
F-IRB A-IRB STA F-IRB A-IRB STA F-IRB A-IRB a s of 3 1/ 12 /2 01 5 a s of 3 1/ 12 /2 01 6STA as of 31/12/2014 as of 31/12/2015 as of 31/12/2016 as of 31/12/2014
AdverseScenario
F-IRB A-IRB STA F-IRB A-IRB STA F-IRB A-IRB STA as of 31/12/2014 as of 31/12/2015 as of 31/12/2016 as of 31/12/2014 as of 31/12/2015 as of 31/12/2016LTV %(asof
31/12/2013)
E xp os ur e va lu es ( as of 3 1/ 12 /2 01 3) R is k e xp os ur e am ou nt s (a s of 3 1/ 12 /2 01 3) V al ue a dj us tm en ts a nd pr ov is io ns ( as o f3 1/ 12 /2 01 3) BaselineScenario
(*)Referstothepart ofSecuritizationexposurethat isdeductedfrom capital andisnot includedinRWA
(*)Referstothepart ofSecuritizationexposurethat isdeductedfrom capital andisnot includedinRWA
(*)Referstothepart ofSecuritizationexposurethat isdeductedfrom capital andisnot includedinRWA
(*)Referstothepart ofSecuritizationexposurethat isdeductedfrom capital andisnot includedinRWA
(*)Referstothepart ofSecuritizationexposurethat isdeductedfrom capital andisnot includedinRWA
Please, select the country
Please, select the country
Please, select the country
Please, select the country
Please, select the country
http://www.economiaciudadana.org/
2014 EU-wide Stress Test
P&L31/12/2013
Baseline Scenario Adverse Scenario

8/10/2019 Test Stress Banca Española 2014
http://slidepdf.com/reader/full/test-stress-banca-espanola-2014 53/240
(mln EUR) 31/12/2014 31/12/2015 31/12/2016 31/12/2014 31/12/2015 31/12/2016
Net interest income 721 603 667 713 543 608 586
Net trading income 3 3 3 1 2 3
of which trading losses from stress scenarios -1 -1 0 -3 -2 -1
Other operating income 24 -34 -35 -35 -49 -50 -50
Operating profit before impairments 447 264 335 380 187 259 238
Impairment of financial assets (-) -78 -136 -124 -114 -223 -214 -207
Impairment of financial assets other than instruments designated at fair value
through P&L (-)-78 -136 -124 -114 -223 -214 -207
Impairment Financial assets designated at fair value through P&L (-) 0 0 0 0 0 0 0
Impairment on non financial assets (-) -295 -18 -5 -4 -59 -44 -32
Operating profit after impairments from stress scenarios 74 110 205 261 -95 0 -1
Other Income and expenses 23 42 38 45 37 34 41
Pre-Tax profit 96 152 244 306 -58 34 39
Tax 12 -5 -32 -49 49 29 30
Net income 108 147 211 257 -9 64 69
Attributable to owners of the parent 108 146 211 257 -9 63 69
of which carried over to capital through retained earnings 81 110 158 193 -9 48 52
of which distributed as dividends 27 37 53 64 0 16 17
In the figures above, the original (official published) 2013 P&L figures may have been adjusted as part of the ECB Comprehensive Assessment join-up calculation.
31/12/2013
http://www.economiaciudadana.org/
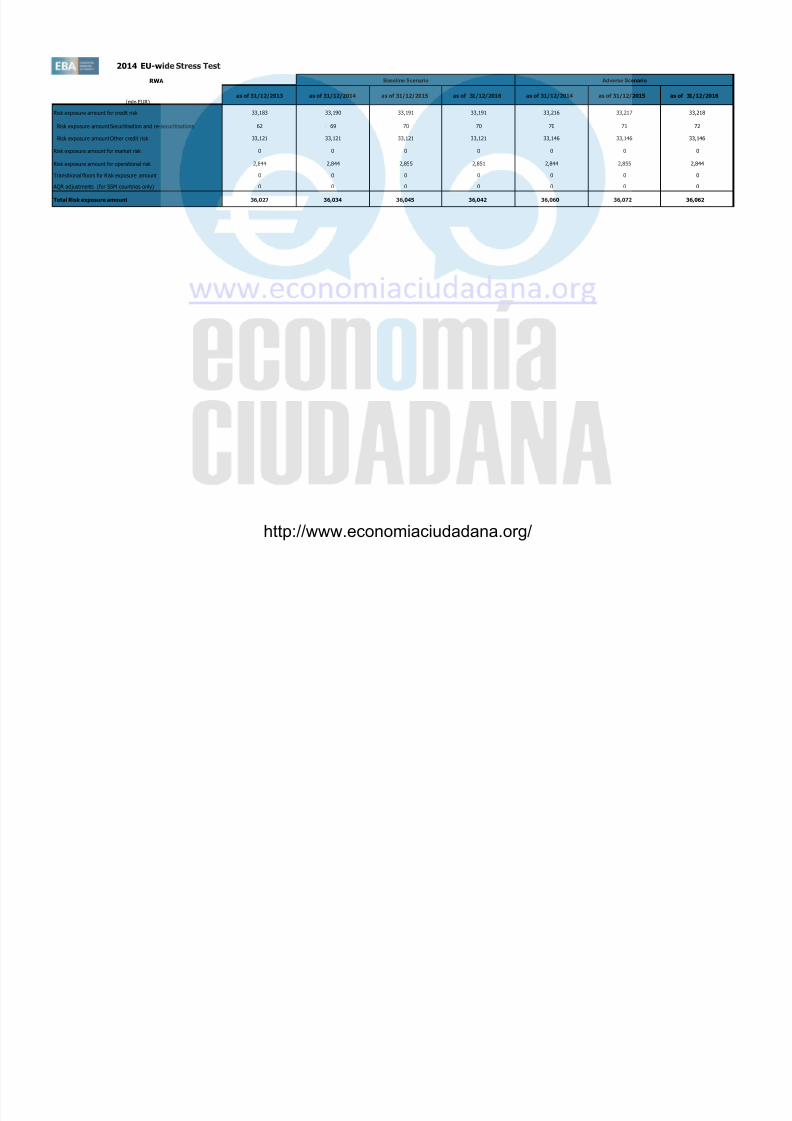
8/10/2019 Test Stress Banca Española 2014
http://slidepdf.com/reader/full/test-stress-banca-espanola-2014 54/240
2014 EU-wide Stress TestBaseline scenario Adverse scenarioSecuritisation
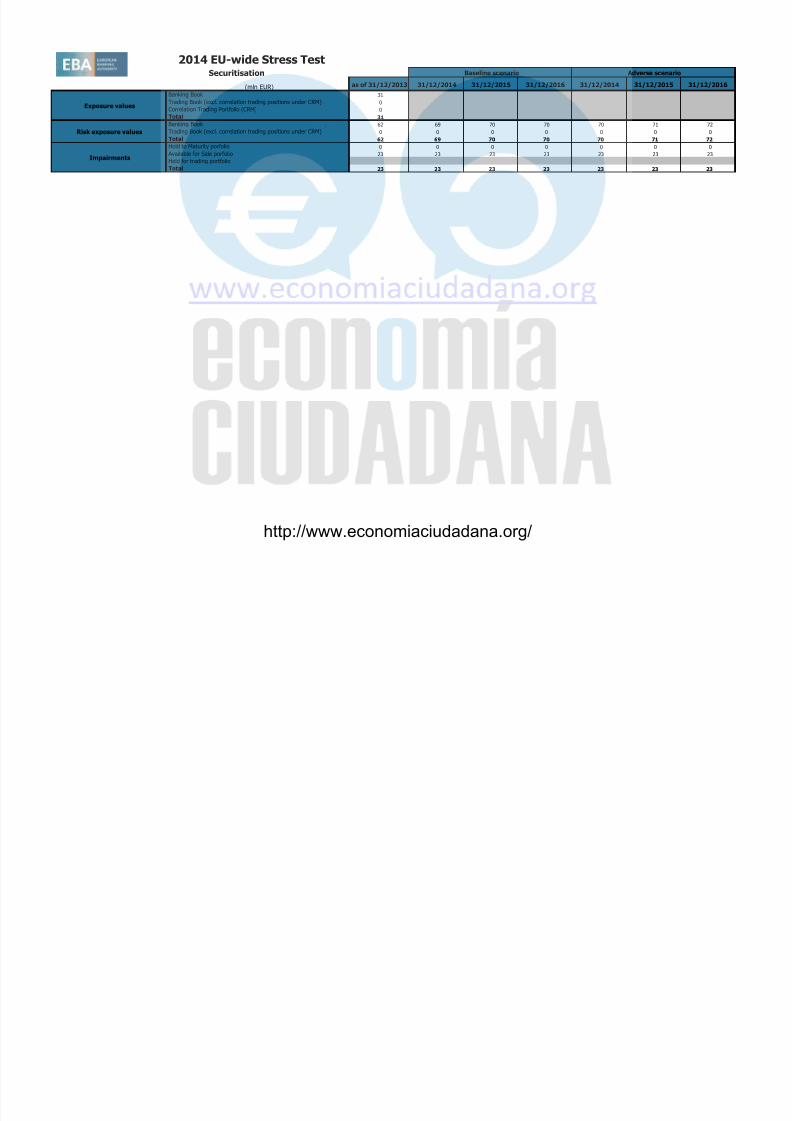
8/10/2019 Test Stress Banca Española 2014
http://slidepdf.com/reader/full/test-stress-banca-espanola-2014 55/240
(mln EUR) as of 31/12/2013 31/12/2014 31/12/2015 31/12/2016 31/12/2014 31/12/2015 31/12/2016
Banking Book 31
Trading Book (excl. correlation trading positions under CRM) 0
Correlation Trading Portfolio (CRM) 0
Total 31
Banking Book 62 69 70 70 70 71 72
Trading Book (excl. correlation trading positions under CRM) 0 0 0 0 0 0 0
Total 62 69 70 70 70 71 72
Hold to Maturity porfolio 0 0 0 0 0 0 0
Available for Sale porfolio 23 23 23 23 23 23 23Held for trading portfolio
Total 23 23 23 23 23 23 23
Impairments
Baseline scenario Adverse scenario
Exposure values
Risk exposure values
Securitisation
http://www.economiaciudadana.org/
2014 EU-wide Stress Test - Sovereign Exposure
(mln EUR) VALUES AS OF 31/12/2013 VALUES AS OF 31/12/2013 VALUES AS OF 31/12/2013

8/10/2019 Test Stress Banca Española 2014
http://slidepdf.com/reader/full/test-stress-banca-espanola-2014 56/240
[ 0 - 3M [ 0 0 0 0 0 0 0 0 0 0 0 0 0 0
[ 3M - 1Y [ 0 0 0 0 0 0 0 0 0 0 0 0 0 0
[ 1Y - 2Y [ 0 0 0 0 0 0 0 0 0 0 0 0 0 0
[ 2Y - 3Y [ 0 0 0 0 0 0 0 0 0 0 0 0 0 0
[3Y - 5Y [ 0 0 0 0 0 0 0 0 0 0 0 0 0 0
[5Y - 10Y [ 0 0 0 0 0 0 0 0 0 0 0 0 0 0
[10Y - more 0 0 0 0 0 0 0 0 0 0 0 0 0 0
Tot 0 0 0 0 0 0 0 0 0 0 0 0 0 0
[ 0 - 3M [ 0 0 0 0 0 0 0 0 0 0 0 0 0 0
[ 3M - 1Y [ 0 0 0 0 0 0 0 0 0 0 0 0 0 0
[ 1Y - 2Y [ 0 0 0 0 0 0 0 0 0 0 0 0 0 0
[ 2Y - 3Y [ 0 0 0 0 0 0 0 0 0 0 0 0 0 0
[3Y - 5Y [ 0 0 0 0 0 0 0 0 0 0 0 0 0 0
[5Y - 10Y [ 0 0 0 0 0 0 0 0 0 0 0 0 0 0
[10Y - more 0 0 0 0 0 0 0 0 0 0 0 0 0 0
Tot 0 0 0 0 0 0 0 0 0 0 0 0 0 0[ 0 - 3M [ 0 0 0 0 0 0 0 0 0 0 0 0 0 0
[ 3M - 1Y [ 0 0 0 0 0 0 0 0 0 0 0 0 0 0
[ 1Y - 2Y [ 0 0 0 0 0 0 0 0 0 0 0 0 0 0
[ 2Y - 3Y [ 0 0 0 0 0 0 0 0 0 0 0 0 0 0
[3Y - 5Y [ 0 0 0 0 0 0 0 0 0 0 0 0 0 0
[5Y - 10Y [ 0 0 0 0 0 0 0 0 0 0 0 0 0 0
[10Y - more 0 0 0 0 0 0 0 0 0 0 0 0 0 0
Tot 0 0 0 0 0 0 0 0 0 0 0 0 0 0
[ 0 - 3M [ 0 0 0 0 0 0 0 0 0 0 0 0 0 0
[ 3M - 1Y [ 0 0 0 0 0 0 0 0 0 0 0 0 0 0
[ 1Y - 2Y [ 0 0 0 0 0 0 0 0 0 0 0 0 0 0
[ 2Y - 3Y [ 0 0 0 0 0 0 0 0 0 0 0 0 0 0
[3Y - 5Y [ 0 0 0 0 0 0 0 0 0 0 0 0 0 0
[5Y - 10Y [ 0 0 0 0 0 0 0 0 0 0 0 0 0 0
[10Y - more 0 0 0 0 0 0 0 0 0 0 0 0 0 0
Tot 0 0 0 0 0 0 0 0 0 0 0 0 0 0
Residual Maturity Country / Region
GROSS DIRECT LONG
EXPOSURES(accounting value gross
of provisions)
(1)
NET DIRECT POSITIONS (gross exposures (long) net of cash short
positions of sovereign debt to other counterpaties only where there
is a maturity matching)
(1)
DIRECT SOVEREIGN EXPOSURES IN DERIVATIVES (1)
of which: loans
and advances
of which: AFS
banking book
of which: FVO
(designated at fair
value through
profit&loss)
banking book
of which: Financial
assets held for
trading(2)
Derivatives with positive fair value at
31/12/2013
Derivatives with negative fair value at
31/12/2013
Derivatives with positive fair value
at 31/12/2013
Derivatives with negative fair
value at 31/12/2013
INDIRECT SOVEREIGN EXPOSURES (3) (on and off balance sheet)
Fair-value at
31/12/2013 (+)Notional value
Fair-value at
31/12/2013 (-)Notional value
Fair-value at
31/12/2013 (+)Notional value
Fair-value at 31/12/2013
(-)
Austria
Belgium
Bulgaria
Cyprus
Notional value
Czech Republic
Denmark
Estonia
Finland
France
http://www.economiaciudadana.org/
2014 EU-wide Stress Test - Sovereign Exposure
(mln EUR) VALUES AS OF 31/12/2013 VALUES AS OF 31/12/2013 VALUES AS OF 31/12/2013

8/10/2019 Test Stress Banca Española 2014
http://slidepdf.com/reader/full/test-stress-banca-espanola-2014 57/240
Residual Maturity Country / Region
GROSS DIRECT LONG
EXPOSURES(accounting value gross
of provisions)
(1)
NET DIRECT POSITIONS (gross exposures (long) net of cash short
positions of sovereign debt to other counterpaties only where there
is a maturity matching)
(1)
DIRECT SOVEREIGN EXPOSURES IN DERIVATIVES (1)
of which: loans
and advances
of which: AFS
banking book
of which: FVO
(designated at fair
value through
profit&loss)
banking book
of which: Financial
assets held for
trading(2)
Derivatives with positive fair value at
31/12/2013
Derivatives with negative fair value at
31/12/2013
Derivatives with positive fair value
at 31/12/2013
Derivatives with negative fair
value at 31/12/2013
INDIRECT SOVEREIGN EXPOSURES (3) (on and off balance sheet)
Fair-value at
31/12/2013 (+)
Notional valueFair-value at
31/12/2013 (-)
Notional valueFair-value at
31/12/2013 (+)
Notional valueFair-value at 31/12/2013
(-)
Notional value
[ 0 - 3M [ 0 0 0 0 0 0 0 0 0 0 0 0 0 0
[ 3M - 1Y [ 0 0 0 0 0 0 0 0 0 0 0 0 0 0
[ 1Y - 2Y [ 0 0 0 0 0 0 0 0 0 0 0 0 0 0
[ 2Y - 3Y [ 0 0 0 0 0 0 0 0 0 0 0 0 0 0
[3Y - 5Y [ 0 0 0 0 0 0 0 0 0 0 0 0 0 0
[5Y - 10Y [ 0 0 0 0 0 0 0 0 0 0 0 0 0 0
[10Y - more 0 0 0 0 0 0 0 0 0 0 0 0 0 0
Tot 0 0 0 0 0 0 0 0 0 0 0 0 0 0
[ 0 - 3M [ 0 0 0 0 0 0 0 0 0 0 0 0 0 0
[ 3M - 1Y [ 0 0 0 0 0 0 0 0 0 0 0 0 0 0
[ 1Y - 2Y [ 0 0 0 0 0 0 0 0 0 0 0 0 0 0
[ 2Y - 3Y [ 0 0 0 0 0 0 0 0 0 0 0 0 0 0
[3Y - 5Y [ 0 0 0 0 0 0 0 0 0 0 0 0 0 0
[5Y - 10Y [ 0 0 0 0 0 0 0 0 0 0 0 0 0 0
[10Y - more 0 0 0 0 0 0 0 0 0 0 0 0 0 0
Tot 0 0 0 0 0 0 0 0 0 0 0 0 0 0[ 0 - 3M [ 0 0 0 0 0 0 0 0 0 0 0 0 0 0
[ 3M - 1Y [ 0 0 0 0 0 0 0 0 0 0 0 0 0 0
[ 1Y - 2Y [ 0 0 0 0 0 0 0 0 0 0 0 0 0 0
[ 2Y - 3Y [ 0 0 0 0 0 0 0 0 0 0 0 0 0 0
[3Y - 5Y [ 0 0 0 0 0 0 0 0 0 0 0 0 0 0
[5Y - 10Y [ 0 0 0 0 0 0 0 0 0 0 0 0 0 0
[10Y - more 0 0 0 0 0 0 0 0 0 0 0 0 0 0
Tot 0 0 0 0 0 0 0 0 0 0 0 0 0 0
[ 0 - 3M [ 0 0 0 0 0 0 0 0 0 0 0 0 0 0
[ 3M - 1Y [ 0 0 0 0 0 0 0 0 0 0 0 0 0 0
[ 1Y - 2Y [ 0 0 0 0 0 0 0 0 0 0 0 0 0 0
[ 2Y - 3Y [ 0 0 0 0 0 0 0 0 0 0 0 0 0 0
[3Y - 5Y [ 0 0 0 0 0 0 0 0 0 0 0 0 0 0
[5Y - 10Y [ 0 0 0 0 0 0 0 0 0 0 0 0 0 0
[10Y - more 0 0 0 0 0 0 0 0 0 0 0 0 0 0
Tot 0 0 0 0 0 0 0 0 0 0 0 0 0 0
Latvia
Germany
Greece
Hungary
Iceland
Ireland
Italy
Croatia
Liechtenstein
http://www.economiaciudadana.org/
2014 EU-wide Stress Test - Sovereign Exposure
(mln EUR) VALUES AS OF 31/12/2013 VALUES AS OF 31/12/2013 VALUES AS OF 31/12/2013

8/10/2019 Test Stress Banca Española 2014
http://slidepdf.com/reader/full/test-stress-banca-espanola-2014 58/240
Residual Maturity Country / Region
GROSS DIRECT LONG
EXPOSURES(accounting value gross
of provisions)
(1)
NET DIRECT POSITIONS (gross exposures (long) net of cash short
positions of sovereign debt to other counterpaties only where there
is a maturity matching)
(1)
DIRECT SOVEREIGN EXPOSURES IN DERIVATIVES (1)
of which: loans
and advances
of which: AFS
banking book
of which: FVO
(designated at fair
value through
profit&loss)banking book
of which: Financial
assets held for
trading(2)
Derivatives with positive fair value at
31/12/2013
Derivatives with negative fair value at
31/12/2013
Derivatives with positive fair value
at 31/12/2013
Derivatives with negative fair
value at 31/12/2013
INDIRECT SOVEREIGN EXPOSURES (3) (on and off balance sheet)
Fair-value at
31/12/2013 (+)
Notional valueFair-value at
31/12/2013 (-)
Notional valueFair-value at
31/12/2013 (+)
Notional valueFair-value at 31/12/2013
(-)
Notional value
[ 0 - 3M [ 0 0 0 0 0 0 0 0 0 0 0 0 0 0
[ 3M - 1Y [ 0 0 0 0 0 0 0 0 0 0 0 0 0 0
[ 1Y - 2Y [ 0 0 0 0 0 0 0 0 0 0 0 0 0 0
[ 2Y - 3Y [ 0 0 0 0 0 0 0 0 0 0 0 0 0 0
[3Y - 5Y [ 0 0 0 0 0 0 0 0 0 0 0 0 0 0
[5Y - 10Y [ 0 0 0 0 0 0 0 0 0 0 0 0 0 0
[10Y - more 0 0 0 0 0 0 0 0 0 0 0 0 0 0
Tot 0 0 0 0 0 0 0 0 0 0 0 0 0 0
[ 0 - 3M [ 0 0 0 0 0 0 0 0 0 0 0 0 0 0
[ 3M - 1Y [ 0 0 0 0 0 0 0 0 0 0 0 0 0 0
[ 1Y - 2Y [ 0 0 0 0 0 0 0 0 0 0 0 0 0 0
[ 2Y - 3Y [ 0 0 0 0 0 0 0 0 0 0 0 0 0 0
[3Y - 5Y [ 0 0 0 0 0 0 0 0 0 0 0 0 0 0
[5Y - 10Y [ 0 0 0 0 0 0 0 0 0 0 0 0 0 0
[10Y - more 0 0 0 0 0 0 0 0 0 0 0 0 0 0
Tot 0 0 0 0 0 0 0 0 0 0 0 0 0 0
[ 0 - 3M [ 0 0 0 0 0 0 0 0 0 0 0 0 0 0
[ 3M - 1Y [ 0 0 0 0 0 0 0 0 0 0 0 0 0 0
[ 1Y - 2Y [ 0 0 0 0 0 0 0 0 0 0 0 0 0 0
[ 2Y - 3Y [ 0 0 0 0 0 0 0 0 0 0 0 0 0 0
[3Y - 5Y [ 0 0 0 0 0 0 0 0 0 0 0 0 0 0
[5Y - 10Y [ 0 0 0 0 0 0 0 0 0 0 0 0 0 0
[10Y - more 0 0 0 0 0 0 0 0 0 0 0 0 0 0
Tot 0 0 0 0 0 0 0 0 0 0 0 0 0 0
[ 0 - 3M [ 0 0 0 0 0 0 0 0 0 0 0 0 0 0
[ 3M - 1Y [ 0 0 0 0 0 0 0 0 0 0 0 0 0 0
[ 1Y - 2Y [ 0 0 0 0 0 0 0 0 0 0 0 0 0 0
[ 2Y - 3Y [ 0 0 0 0 0 0 0 0 0 0 0 0 0 0
[3Y - 5Y [ 0 0 0 0 0 0 0 0 0 0 0 0 0 0
[5Y - 10Y [ 0 0 0 0 0 0 0 0 0 0 0 0 0 0
[10Y - more 0 0 0 0 0 0 0 0 0 0 0 0 0 0
Tot 0 0 0 0 0 0 0 0 0 0 0 0 0 0
[ 0 - 3M [ 0 0 0 0 0 0 0 0 0 0 0 0 0 0
[ 3M - 1Y [ 0 0 0 0 0 0 0 0 0 0 0 0 0 0
[ 1Y - 2Y [ 0 0 0 0 0 0 0 0 0 0 0 0 0 0
[ 2Y - 3Y [ 0 0 0 0 0 0 0 0 0 0 0 0 0 0
[3Y - 5Y [ 0 0 0 0 0 0 0 0 0 0 0 0 0 0
[5Y - 10Y [ 0 0 0 0 0 0 0 0 0 0 0 0 0 0
[10Y - more 0 0 0 0 0 0 0 0 0 0 0 0 0 0
Tot 0 0 0 0 0 0 0 0 0 0 0 0 0 0
[ 0 - 3M [ 0 0 0 0 0 0 0 0 0 0 0 0 0 0
[ 3M - 1Y [ 0 0 0 0 0 0 0 0 0 0 0 0 0 0
[ 1Y - 2Y [ 0 0 0 0 0 0 0 0 0 0 0 0 0 0
[ 2Y - 3Y [ 0 0 0 0 0 0 0 0 0 0 0 0 0 0
[3Y - 5Y [ 0 0 0 0 0 0 0 0 0 0 0 0 0 0
[5Y - 10Y [ 0 0 0 0 0 0 0 0 0 0 0 0 0 0
[10Y - more 0 0 0 0 0 0 0 0 0 0 0 0 0 0
Tot 0 0 0 0 0 0 0 0 0 0 0 0 0 0
[ 0 - 3M [ 0 0 0 0 0 0 0 0 0 0 0 0 0 0
[ 3M - 1Y [ 0 0 0 0 0 0 0 0 0 0 0 0 0 0
[ 1Y - 2Y [ 0 0 0 0 0 0 0 0 0 0 0 0 0 0
[ 2Y - 3Y [ 0 0 0 0 0 0 0 0 0 0 0 0 0 0
[3Y - 5Y [ 0 0 0 0 0 0 0 0 0 0 0 0 0 0
[5Y - 10Y [ 0 0 0 0 0 0 0 0 0 0 0 0 0 0
[10Y - more 0 0 0 0 0 0 0 0 0 0 0 0 0 0
Tot 0 0 0 0 0 0 0 0 0 0 0 0 0 0[ 0 - 3M [ 0 0 0 0 0 0 0 0 0 0 0 0 0 0
[ 3M - 1Y [ 0 0 0 0 0 0 0 0 0 0 0 0 0 0
[ 1Y - 2Y [ 0 0 0 0 0 0 0 0 0 0 0 0 0 0
[ 2Y - 3Y [ 0 0 0 0 0 0 0 0 0 0 0 0 0 0
[3Y - 5Y [ 0 0 0 0 0 0 0 0 0 0 0 0 0 0
[5Y - 10Y [ 0 0 0 0 0 0 0 0 0 0 0 0 0 0
[10Y - more 0 0 0 0 0 0 0 0 0 0 0 0 0 0
Tot 0 0 0 0 0 0 0 0 0 0 0 0 0 0
[ 0 - 3M [ 0 0 0 0 0 0 0 0 0 0 0 0 0 0
[ 3M - 1Y [ 0 0 0 0 0 0 0 0 0 0 0 0 0 0
[ 1Y - 2Y [ 0 0 0 0 0 0 0 0 0 0 0 0 0 0
[ 2Y - 3Y [ 0 0 0 0 0 0 0 0 0 0 0 0 0 0
[3Y - 5Y [ 0 0 0 0 0 0 0 0 0 0 0 0 0 0
[5Y - 10Y [ 0 0 0 0 0 0 0 0 0 0 0 0 0 0
[10Y - more 0 0 0 0 0 0 0 0 0 0 0 0 0 0
Tot 0 0 0 0 0 0 0 0 0 0 0 0 0 0
Lithuania
Luxembourg
Malta
Netherlands
Norway
Poland
Portugal
Romania
Slovakia
http://www.economiaciudadana.org/
2014 EU-wide Stress Test - Sovereign Exposure
(mln EUR)
DIRECT SOVEREIGN EXPOSURESIN DERIVATIVES(1)
VALUES AS OF 31/12/2013 VALUES AS OF 31/12/2013 VALUES AS OF 31/12/2013
INDIRECT SOVEREIGN EXPOSURES (3) ( d ff b l h t)

8/10/2019 Test Stress Banca Española 2014
http://slidepdf.com/reader/full/test-stress-banca-espanola-2014 59/240
Residual Maturity Country / Region
GROSS DIRECT LONG
EXPOSURES(accounting value gross
of provisions)
(1)
NET DIRECT POSITIONS (gross exposures (long) net of cash short
positions of sovereign debt to other counterpaties only where there
is a maturity matching)
(1)
DIRECT SOVEREIGN EXPOSURES IN DERIVATIVES (1)
of which: loans
and advances
of which: AFS
banking book
of which: FVO
(designated at fair
value through
profit&loss)banking book
of which: Financial
assets held for
trading(2)
Derivatives with positive fair value at
31/12/2013
Derivatives with negative fair value at
31/12/2013
Derivatives with positive fair value
at 31/12/2013
Derivatives with negative fair
value at 31/12/2013
INDIRECT SOVEREIGN EXPOSURES (3) (on and off balance sheet)
Fair-value at
31/12/2013 (+)
Notional valueFair-value at
31/12/2013 (-)
Notional valueFair-value at
31/12/2013 (+)
Notional valueFair-value at 31/12/2013
(-)
Notional value
[ 0 - 3M [ 0 0 0 0 0 0 0 0 0 0 0 0 0 0
[ 3M - 1Y [ 0 0 0 0 0 0 0 0 0 0 0 0 0 0
[ 1Y - 2Y [ 0 0 0 0 0 0 0 0 0 0 0 0 0 0
[ 2Y - 3Y [ 0 0 0 0 0 0 0 0 0 0 0 0 0 0
[3Y - 5Y [ 0 0 0 0 0 0 0 0 0 0 0 0 0 0
[5Y - 10Y [ 0 0 0 0 0 0 0 0 0 0 0 0 0 0
[10Y - more 0 0 0 0 0 0 0 0 0 0 0 0 0 0
Tot 0 0 0 0 0 0 0 0 0 0 0 0 0 0
[ 0 - 3M [ 780 703 780 77 0 0 0 0 0 0 0 0 0 0
[ 3M - 1Y [ 834 288 834 547 0 0 0 0 0 0 0 0 0 0
[ 1Y - 2Y [ 744 158 744 586 0 0 0 0 0 0 0 0 0 0
[ 2Y - 3Y [ 612 89 612 524 0 0 0 0 81 0 0 0 0 0
[3Y - 5Y [ 401 238 401 163 0 0 0 0 0 0 0 0 0 0
[5Y - 10Y [ 509 248 509 217 0 0 10 0 0 0 0 0 0 0
[10Y - more 56 55 56 1 0 0 0 0 0 0 0 0 0 0
Tot 3,936 1,779 3,936 2,114 0 0 10 0 81 0 0 0 0 0
[ 0 - 3M [ 0 0 0 0 0 0 0 0 0 0 0 0 0 0
[ 3M - 1Y [ 0 0 0 0 0 0 0 0 0 0 0 0 0 0
[ 1Y - 2Y [ 0 0 0 0 0 0 0 0 0 0 0 0 0 0
[ 2Y - 3Y [ 0 0 0 0 0 0 0 0 0 0 0 0 0 0
[3Y - 5Y [ 0 0 0 0 0 0 0 0 0 0 0 0 0 0
[5Y - 10Y [ 0 0 0 0 0 0 0 0 0 0 0 0 0 0
[10Y - more 0 0 0 0 0 0 0 0 0 0 0 0 0 0
Tot 0 0 0 0 0 0 0 0 0 0 0 0 0 0
[ 0 - 3M [ 0 0 0 0 0 0 0 0 0 0 0 0 0 0
[ 3M - 1Y [ 0 0 0 0 0 0 0 0 0 0 0 0 0 0
[ 1Y - 2Y [ 0 0 0 0 0 0 0 0 0 0 0 0 0 0
[ 2Y - 3Y [ 0 0 0 0 0 0 0 0 0 0 0 0 0 0
[3Y - 5Y [ 0 0 0 0 0 0 0 0 0 0 0 0 0 0
[5Y - 10Y [ 0 0 0 0 0 0 0 0 0 0 0 0 0 0
[10Y - more 0 0 0 0 0 0 0 0 0 0 0 0 0 0
Tot 0 0 0 0 0 0 0 0 0 0 0 0 0 0[ 0 - 3M [ 0 0 0 0 0 0 0 0 0 0 0 0 0 0
[ 3M - 1Y [ 0 0 0 0 0 0 0 0 0 0 0 0 0 0
[ 1Y - 2Y [ 0 0 0 0 0 0 0 0 0 0 0 0 0 0
[ 2Y - 3Y [ 0 0 0 0 0 0 0 0 0 0 0 0 0 0
[3Y - 5Y [ 0 0 0 0 0 0 0 0 0 0 0 0 0 0
[5Y - 10Y [ 0 0 0 0 0 0 0 0 0 0 0 0 0 0
[10Y - more 0 0 0 0 0 0 0 0 0 0 0 0 0 0
Tot 0 0 0 0 0 0 0 0 0 0 0 0 0 0
[ 0 - 3M [ 0 0 0 0 0 0 0 0 0 0 0 0 0 0
[ 3M - 1Y [ 0 0 0 0 0 0 0 0 0 0 0 0 0 0
[ 1Y - 2Y [ 0 0 0 0 0 0 0 0 0 0 0 0 0 0
[ 2Y - 3Y [ 0 0 0 0 0 0 0 0 0 0 0 0 0 0
[3Y - 5Y [ 0 0 0 0 0 0 0 0 0 0 0 0 0 0
[5Y - 10Y [ 0 0 0 0 0 0 0 0 0 0 0 0 0 0
[10Y - more 0 0 0 0 0 0 0 0 0 0 0 0 0 0
Tot 0 0 0 0 0 0 0 0 0 0 0 0 0 0
Spain
Slovenia
Sweden
United Kingdom
Australia
Canada
Hong Kong
Japan
U.S.
http://www.economiaciudadana.org/
2014 EU-wide Stress Test - Sovereign Exposure
(mln EUR)
DIRECT SOVEREIGN EXPOSURESIN DERIVATIVES(1)
VALUES AS OF 31/12/2013 VALUES AS OF 31/12/2013 VALUES AS OF 31/12/2013
INDIRECT SOVEREIGN EXPOSURES (3) (on and off balance sheet)

8/10/2019 Test Stress Banca Española 2014
http://slidepdf.com/reader/full/test-stress-banca-espanola-2014 60/240
Residual Maturity Country / Region
GROSS DIRECT LONG
EXPOSURES(accounting value gross
of provisions)
(1)
NET DIRECT POSITIONS (gross exposures (long) net of cash short
positions of sovereign debt to other counterpaties only where there
is a maturity matching)
(1)
DIRECT SOVEREIGN EXPOSURES IN DERIVATIVES (1)
of which: loans
and advances
of which: AFS
banking book
of which: FVO
(designated at fair
value through
profit&loss)banking book
of which: Financial
assets held for
trading(2)
Derivatives with positive fair value at
31/12/2013
Derivatives with negative fair value at
31/12/2013
Derivatives with positive fair value
at 31/12/2013
Derivatives with negative fair
value at 31/12/2013
INDIRECT SOVEREIGN EXPOSURES (3) (on and off balance sheet)
Fair-value at
31/12/2013 (+)
Notional valueFair-value at
31/12/2013 (-)
Notional valueFair-value at
31/12/2013 (+)
Notional valueFair-value at 31/12/2013
(-)
Notional value
[ 0 - 3M [ 0 0 0 0 0 0 0 0 0 0 0 0 0 0
[ 3M - 1Y [ 0 0 0 0 0 0 0 0 0 0 0 0 0 0
[ 1Y - 2Y [ 0 0 0 0 0 0 0 0 0 0 0 0 0 0
[ 2Y - 3Y [ 0 0 0 0 0 0 0 0 0 0 0 0 0 0
[3Y - 5Y [ 0 0 0 0 0 0 0 0 0 0 0 0 0 0
[5Y - 10Y [ 0 0 0 0 0 0 0 0 0 0 0 0 0 0
[10Y - more 0 0 0 0 0 0 0 0 0 0 0 0 0 0
Tot 0 0 0 0 0 0 0 0 0 0 0 0 0 0
[ 0 - 3M [ 0 0 0 0 0 0 0 0 0 0 0 0 0 0[ 3M - 1Y [ 0 0 0 0 0 0 0 0 0 0 0 0 0 0
[ 1Y - 2Y [ 0 0 0 0 0 0 0 0 0 0 0 0 0 0
[ 2Y - 3Y [ 0 0 0 0 0 0 0 0 0 0 0 0 0 0
[3Y - 5Y [ 0 0 0 0 0 0 0 0 0 0 0 0 0 0
[5Y - 10Y [ 0 0 0 0 0 0 0 0 0 0 0 0 0 0
[10Y - more 0 0 0 0 0 0 0 0 0 0 0 0 0 0
Tot 0 0 0 0 0 0 0 0 0 0 0 0 0 0
[ 0 - 3M [ 0 0 0 0 0 0 0 0 0 0 0 0 0 0
[ 3M - 1Y [ 0 0 0 0 0 0 0 0 0 0 0 0 0 0
[ 1Y - 2Y [ 0 0 0 0 0 0 0 0 0 0 0 0 0 0
[ 2Y - 3Y [ 0 0 0 0 0 0 0 0 0 0 0 0 0 0
[3Y - 5Y [ 0 0 0 0 0 0 0 0 0 0 0 0 0 0
[5Y - 10Y [ 0 0 0 0 0 0 0 0 0 0 0 0 0 0
[10Y - more 0 0 0 0 0 0 0 0 0 0 0 0 0 0
Tot 0 0 0 0 0 0 0 0 0 0 0 0 0 0
[ 0 - 3M [ 0 0 0 0 0 0 0 0 0 0 0 0 0 0
[ 3M - 1Y [ 0 0 0 0 0 0 0 0 0 0 0 0 0 0
[ 1Y - 2Y [ 0 0 0 0 0 0 0 0 0 0 0 0 0 0
[ 2Y - 3Y [ 0 0 0 0 0 0 0 0 0 0 0 0 0 0
[3Y - 5Y [ 0 0 0 0 0 0 0 0 0 0 0 0 0 0
[5Y - 10Y [ 0 0 0 0 0 0 0 0 0 0 0 0 0 0
[10Y - more 0 0 0 0 0 0 0 0 0 0 0 0 0 0
Tot 0 0 0 0 0 0 0 0 0 0 0 0 0 0[ 0 - 3M [ 0 0 0 0 0 0 0 0 0 0 0 0 0 0
[ 3M - 1Y [ 0 0 0 0 0 0 0 0 0 0 0 0 0 0
[ 1Y - 2Y [ 0 0 0 0 0 0 0 0 0 0 0 0 0 0
[ 2Y - 3Y [ 0 0 0 0 0 0 0 0 0 0 0 0 0 0
[3Y - 5Y [ 0 0 0 0 0 0 0 0 0 0 0 0 0 0
[5Y - 10Y [ 0 0 0 0 0 0 0 0 0 0 0 0 0 0
[10Y - more 0 0 0 0 0 0 0 0 0 0 0 0 0 0Tot 0 0 0 0 0 0 0 0 0 0 0 0 0 0
Notes and definitions
(1) The exposures reported cover only exposures to central, regional and local governments on immediate borrower basis, and do not include exposures to other counterparts with full or partial government guarantees
(2) The banks disclose the exposures in the "Financial assets held for trading" portfolio after offsetting the cash short positions having the same maturities.
(3) The exposures reported include the positions towards counterparts (other than sovereign) on sovereign credit risk (i.e. CDS, financial guarantees) booked in all the accounting portfolio (on-off balance sheet).'Irrespective of the denomination and or accounting classification of the positions the economic substance over the form must be used as a criteria for the identification of the exposures to be included in this column. This item does not include exposures to counterparts (other than sovereign) with full or partial government guarantees by central, regional and local governments
Latin America and the
Caribbean
Africa
Others
Middle East
China
Switzerland
Other advanced economies
non EEA
Other Central and eastern
Europe countries non EEA
http://www.economiaciudadana.org/
2014 EU-wide Stress TestCapital
(mln EUR) CRR/ CRDIV DEFINITION OFCAPITAL Asof31/12/2013 Asof31/12/2014 Asof31/12/2015 Asof31/12/2016 Asof31/12/2014 Asof31/12/2015 Asof31/12/2016 COREP CODE REGULATION
A OWN FUNDS 4,375 4,485 4,610 4,739 4,357 4,337 4,283 C A 1 {1 } A rt ic le s 4 (1 18 ) a nd 7 2 of C RR
A.1COMMON EQUITYTIER 1CAPITAL(net ofdeductionsandafter applying
transitional adjustments)4,375 4,485 4,610 4,739 4,357 4,337 4,283 C A 1 {1 .1 .1 } A rt ic le 5 0 of C RR
C it li t t li ibl CET1C it l(i l di h i d t
Baseline Scenario Adverse Scenario

8/10/2019 Test Stress Banca Española 2014
http://slidepdf.com/reader/full/test-stress-banca-espanola-2014 61/240
A.1.1Capitalinstrumentseligible asCET1Capital(including share premium and net own
capitalinstruments)4,546 4,546 4,546 4,546 4,546 4,546 4,546 CA1 {1.1.1.1}
Articles 26(1) points (a) and(b), 27to29, 36(1) point (f)
and42ofCRR
A.1.1.1 Ofwhich: CET1instrumentssubscribed byGovernment 0 0 0 0 0 0 0 - -
A.1.2 Retained earnings 81 191 349 542 72 119 171 CA1 {1.1.1.2} Articles 26(1) point (c), 26(2) and36 (1) points (a) and(l)
ofCRR
A.1.3 Accumulated other comprehensive income 223 107 57 23 24 -51 -119 CA1 {1.1.1.3} Articles 4(100), 26(1) point (d) and 36 (1) point (l) of CRR
A.1.3.1 Ofwhich: arising from unrealised gains/lossesfrom Sovereign exposure in AFS
portfolio48 48 48 48 2 19 12 - -
A.1.3.2 Ofwhich: arising from unrealised gains/lossesfrom the rest ofAFS portfolio 192 76 25 -8 38 -54 -115 - -
A.1.4 Other Reserves 23 23 23 23 23 23 23 CA1 {1.1.1.4} Articles 4(117) and 26(1) point (e) of CRR
A.1.5 Fundsfor generalbanking risk 0 0 0 0 0 0 0 CA1 {1.1.1.5} Articles 4(112), 26(1) point (f) and 36 (1) point (l) of CRR
A.1.6 Minorityinterest given recognition in CET1capital 0 0 0 0 0 0 0 CA1 {1.1.1.7} Article 84 of CRR
A.1.7 AdjustmentstoCET1 due toprudentialfiltersexcluding those from unrealised
gains/lossesfrom AFS portfolio
-4 -4 -4 -4 -4 -4 -4 CA1 {1.1.1.9} Articles 32 to 35 of and 36 (1) point (l) of CRR
A.1.8 AdjustmentstoCET1 due toprudentialfiltersfrom unrealised gains/lossesfrom
Sovereign Exposure in AFS portfolio-38 -38 -29 -19 -2 -11 -5 -
A.1.9 (-)Intangible assets(including Goodwill) -302 -302 -302 -302 -302 -302 -302CA1{1.1.1.10+
1.1.1.11}
Articles 4(113), 36(1) point (b) and37of CRR. Articles
4(115), 36(1) point (b) and37point (a) of CCR
A.1.10(-)DTAs that relyon future profitabilityand donot arise from temporary
differencesnet ofassociated DTLs-455 -455 -455 -455 -455 -455 -455 CA1 {1.1.1.12} Articles 36(1) point (c) and 38 of CRR
A.1.11 (-)IRB shortfallofcredit riskadjustmentsto expected losses 0 0 0 0 0 0 0 CA1 {1.1.1.13} Articles 36(1) point (d), 40 and 159 of CRR
A.1.12 (-)Defined benefit pension fund assets 0 0 0 0 0 0 0 CA1 {1.1.1.14} Articles 4(109), 36(1) point (e) and 41 of CRR
A.1.13 (-)Reciprocalcrossholdingsin CET1Capital 0 0 0 0 0 0 0 CA1 {1.1.1.15} Articles 4(122), 36(1) point (g) and 44 of CRR
A.1.14 (-)Excessdeduction from AT1itemsover AT1Capital 0 0 0 0 0 0 0 CA1 {1.1.1.16} Article 36(1) point (j) of CRR
A.1.15(-)Deductionsrelated toassets which can alternativelybe subject toa 1.250%risk
weight0 0 0 0 0 0 0
CA1{1.1.1.17to
1.1.1.21}
Articles 4(36), 36(1) point (k) (i) and89to 91ofCRR;
Articles 36(1) point (k) (ii), 243(1) point (b), 244(1) point
(b) and258of CRR;Articles 36(1) point k) (iii) and379(3)
ofCRR;Art icles 36(1) point k) (iv) and153(8) ofCRRand
A.1.15.1 Ofwhich: from securitisation positions(-) 0 0 0 0 0 0 0 CA1 {1.1.1.18.1} Articles 36(1) point (k) (ii), 243(1) point (b), 244(1) point
(b) and258of CRR
A.1.16(-)Holdingsof CET1capitalinstrumentsof financialsector entitieswhere the
institiution does not have a significant investment0 0 0 0 0 0 0 CA1 {1.1.1.22}
Articles 4(27), 36(1) point (h);43to46, 49(2) and (3) and
79ofCRR
A.1.17(-)Deductible DTAsthat rely on future profitabilityand arise from temporary
differences0 0 0 0 0 0 0 CA1 {1.1.1.23}
Articles 36(1) point (c) and38;Articles 48(1) point (a) and
48(2) ofCRR
A.1.18(-)Holdingsof CET1capitalinstrumentsof financialsector entitieswhere the
institiution has a significant investment0 0 0 0 0 0 0 CA1 {1.1.1.24}
Articles 4(27);36(1) point (i);43, 45;47; 48(1) point (b);
49(1) to(3) and79of CRR
A.1.19 (-)Amount exceding the 17.65%threshold 0 0 0 0 0 0 0 CA1 {1.1.1.25} Article 470 of CRR
A.1.20 Transitionaladjustments 302 418 425 386 455 472 428CA1{1.1.1.6+ 1.1.8+
1.1.26}-
A.1.20.1 Transitionaladjustmentsdue tograndfathered CET1Capitalinstruments(+/-) 0 0 0 0 0 0 0 CA1 {1.1.1.6}
Articles 483(1) to(3), and484to487of CRR
A.1.20.2 Transitionaladjustmentsdue toadditionalminorityinterests(+/-) 38 38 31 18 38 31 18 CA1 {1.1.1.8}
Articles 479and480of CRR
A.1.20.3Other transitionaladjustmentsto CET1Capitalexcl. adjustmentsfor Sovereign
exposure in AFS (+/-)263 379 394 367 417 442 410 CA1 {1.1.1.26}
Articles 469to472, 478and 481ofCRR
A.2 ADDITIONAL TIER 1CAPITAL (net ofdeductionsand after transitional
adjustments)0 0 0 0 0 0 0 C A 1 {1 .1 .2 } A rt ic le 6 1 of C RR
A.2.1 Ofwhich:(+) Other existing support government measures 0 0 0 0 0 0 0 - -
A.3 TIER1 CAPITAL(netofdeductionsandafter transitional adjustments) 4,375 4,485 4,610 4,739 4,357 4,337 4,283 C A1 { 1. 1} A rt ic le 2 5 of C RR
A.4 TIER2 CAPITAL(netofdeductionsandafter transitional adjustments) 0 0 0 0 0 0 0 C A1 { 1. 2} A rt ic le 7 1 of C RR
B T OT AL R IS K EX PO SU RE A M OU NT 36,027 36,034 36,045 36,042 36,060 36,072 36,062 C A 2 {1 } A rt ic le s 92 (3 ), 95 , 96 a n d 98 o f CR R
B.1ofwhich:stemming from exposuresthat fallbelow the 10%/ 15%limitsfor
CET1deduction (+)1,358 0 0 0 0 0 0
Articles 36(1) points (a) and(i);Article 38a ndArticle 48of
CRR
B. 2 ofwh ich :s temmi ng f r om fr om CVAcap ita l r eq ui r ements (+) 100 0 0 0 0 0 0 Article 381to386 ofCRR
B.3ofwhich:stemming from higher asset correlation parameter against exposures
tolarge financialinstitutionsunder IRB the IRB approachesto credit risk(+)0 0 0 0 0 0 0 Articles 153(2) ofCRR
B.4ofwhich:stemming from the application ofthe supporting factor to increase
lending toSMEs(-)-680 0 0 0 0 0 0 Recital (44) ofCRR
B.5
ofwhich:stemming from the effect of exposuresthat were previouslypart of
RiskExposure amount and receive a deduction treatment under CRR/CRDIV (-
)
0 0 0 0 0 0 0 -
B.6 ofwhich:otherssubject tothe discretion ofNationalCompetent Authorities 0 0 0 0 0 0 0 Article 124to164 ofCRR
C.1 Co mm onE q ui tyTi er 1Cap i tal r ati o 12.14% 12.45% 12.79% 13.15% 12.08% 12.02% 11.88% CA3 { 1} -
C .2 T ie r 1 C ap it al ra ti o 12.14% 12.45% 12.79% 13.15% 12.08% 12.02% 11.88% CA3 { 3} -
C .3 T ot al C ap it al r at io 12.14% 12.45% 12.79% 13.15% 12.08% 12.02% 11.88% CA3 { 5} -
D Co mm onE q ui tyTi er 1Cap i tal Thresho ld 2,883 2,884 2,883 1,983 1,984 1,983
E
Totalamount of instrumentswith mandatoryconversion intoordinarysharesupon
a fixed date in the 2014 -2016period (cumulative conversions)(1) 0 0 0 0 0 0
F
TotalAdditionalTier 1and Tier 2 instrumentseligible asregulatorycapitalunder
the CRR provisionsthat convert into Common EquityTier 1or are written down
upon a trigger event (2)
0 0 0
F.1Ofwhich: eligible instrumentswhose trigger isabove CET1capitalratio in the
adverse scenario(2)0 0 0
G FullyLoadedCommonEquityTier 1Capital ratio (3) 12.08% 10.69%
(1)Conversionsnot considered for CET1 computation (2)Excluding instrumentsincluded in E (3)Memorandum item based on a fullyimplemented CRR/CRD IV definition of Common EquityTier 1 capitalincluding 60%ofunrealised gains/lossesfrom Sovereign Exposure in AFS portfolio
Memorandumitems
OWN FUNDS
OWN FUNDS
REQUIREMENTS
CAPITALRATIOS(%) -
Transitional period
http://www.economiaciudadana.org/
2014 EU-wide Stress Test - Restructuring scenarios
8/10/2019 Test Stress Banca Española 2014
http://slidepdf.com/reader/full/test-stress-banca-espanola-2014 62/240
(mln EUR)
2013 0 0
2014 0 0 0 0
20150 0 0 0
2016 0 0 0 0
Total 0 0 0 0
Effects of mandatory restructuring plans publicly announced before 31 December 2013 and formally agreed with the European Commission.
Baseline scenario Adverse scenarioNarrative description of the transactions. (type, date of
completion/commitment, portfolios, subsidiaries, branches)CET1 impact
Risk exposure
amount impactCET1 impact
Risk exposure
amount impact
http://www.economiaciudadana.org/

8/10/2019 Test Stress Banca Española 2014
http://slidepdf.com/reader/full/test-stress-banca-espanola-2014 63/240

8/10/2019 Test Stress Banca Española 2014
http://slidepdf.com/reader/full/test-stress-banca-espanola-2014 64/240

8/10/2019 Test Stress Banca Española 2014
http://slidepdf.com/reader/full/test-stress-banca-espanola-2014 65/240
Bank Name ES - Bankinter, S.A.
LEI Code VWMYAEQSTOPNV0SUGU82
ES
NUK_WL_NR_XX
version
1809014
No restructuring
2014 EU-wide Stress Test
http://www.economiaciudadana.org/

8/10/2019 Test Stress Banca Española 2014
http://slidepdf.com/reader/full/test-stress-banca-espanola-2014 66/240
2014 EU-wide Stress TestCredit Risk
(mln EUR, %)
No n-d ef aul t ed De fau lt e d No n-d ef aul t ed De fau lt e d No n-d ef aul t ed De fau lt e d No n-d ef aul t e d De fau lt e d No n-d ef aul t ed De fau lt e d No n-d ef aul t e d De fau lt e d No n-d ef aul t ed De fau lt e d No n-d ef aul t ed De fau lt e d No n-d ef aul t ed De fau lt e dImpairment
rate
Stockof
ProvisionsCoverage Ratio -
Default Stock
Impairment
rate
Stockof
Provisions
Coverage
Ratio-Default
Stock
Impairment
rate
Stockof
Provisions
Coverage
Ratio -Default
Stock
Impairment rateStockof
Provisions
Coverage
Ratio-Default
Stock
Impairment
rate
Stockof
Provisions
Coverage
Ratio-Default
Stock
Impairment
rate
Stockof
Provisions
Coverage
Ratio -Default
Stock
Central banksandcentral governments 0 0 0 0 6,788 0 0 0 0 0 837 0 0 0 0 0 0 0 0.37% 22 39.55% 0.36% 43 39.52% 0.36% 64 39.49% 0.82% 49 39.97% 0.82% 96 39.96% 0.81% 142 39.93%
Institutions 0 0 0 0 3,239 127 0 0 0 0 968 191 0 0 0 0 0 0 0.35% 10 6.51% 0.35% 19 11.11% 0.34% 29 14.54% 0.80% 22 12.35% 0.80% 44 18.85% 0.79% 66 22.82%
Corporates 239 82 45 6 11,991 701 310 0 67 3 10,208 841 2 25 0 3 44 561 1.46% 977 45.07% 1.05% 1,102 43.88% 0.82% 1,200 43.10% 1.95% 1,070 47.93% 1.97% 1,323 48.19% 1.49% 1,490 47.48%
Corporates -Of Which:SpecialisedLending 239 82 0 0 61 17 310 0 0 0 92 18 2 25 0 0 2 8 - 0 - - 0 - - 0 - - 0 - - 0 - - 0 -
Corporates -Of Which:SME 0 0 0 0 6,169 364 0 0 0 0 4,680 418 0 0 0 0 10 265 - 0 - - 0 - - 0 - - 0 - - 0 - - 0 -
Retail 0 0 18,124 1,012 2,991 202 0 0 3,401 550 1,744 231 0 0 8 212 3 94 0.57% 539 28.45% 0.45% 633 27.75% 0.39% 719 27.49% 0.79% 618 30.83% 0.73% 783 30.97% 0.62% 907 30.40%
Retail -Securedon real estateproperty 54.5% 0 0 15,617 725 1,969 27 0 0 2,236 462 938 31 0 0 5 62 1 4 0.29% 209 18.34% 0.24% 251 18.05% 0.21% 292 18.19% 0.43% 252 20.73% 0.39% 328 21.04% 0.33% 383 20.60%
Retail -Securedon real estate property- Of
h i h S E55.7% 0 0 1,071 224 20 1 0 0 460 193 12 1 0 0 2 25 0 1 1.89% 93 26.49% 1.54% 110 26.53% 1.35% 124 26.83% 2.36% 101 28.01% 2.50% 135 30.57% 2.05% 154 30.36%
asof 31/12/2016
LTV %(asof
31/12/2013)
Exposure values (as of 31/12/2013) Risk exposure amounts (as of 31/12/2013) Value adjustments and provisions (as of 31/12/2013) Adverse Scenario
F-IRB A-IRB STA F-IRB A-IRB STA F-IRB A-IRB STA
BaselineScenario
as of 31/12/2014 as of 31/12/2015 as of 31/12/2016 as of 31/12/2014 as of 31/12/2015

8/10/2019 Test Stress Banca Española 2014
http://slidepdf.com/reader/full/test-stress-banca-espanola-2014 67/240
h i h : S ERetail -Securedon real estate property- Of
h i h: n n - E54.4% 0 0 14,546 501 1,949 27 0 0 1,777 269 926 30 0 0 3 37 1 4 0.19% 116 14.98% 0.16% 141 14.69% 0.14% 168 14.89% 0.30% 150 17.88% 0.26% 193 17.48% 0.23% 230 17.13%
Retail -QualifyingRevolving 0 0 0 0 485 14 0 0 0 0 369 15 0 0 0 0 1 34 2.79% 48 69.81% 2.03% 58 69.14% 2.13% 67 68.71% 3.45% 54 74.40% 3.26% 69 74.38% 3.25% 84 73.95%
Retail -OtherRetail 0 0 2,507 287 537 161 0 0 1,165 88 437 185 0 0 3 150 1 55 1.84% 282 40.43% 1.46% 325 39.72% 1.22% 359 39.14% 2.47% 312 43.14% 2.39% 386 43.71% 1.99% 440 43.35%
Retail -Other Retail -Of Which:SME 0 0 2,030 241 84 51 0 0 880 85 86 57 0 0 3 114 0 28 2.10% 205 43.12% 1.64% 238 42.09% 1.37% 265 41.35% 2.76% 224 45.53% 2.71% 281 45.78% 2.23% 322 45.29%
Retail -Other Retail -Of Which:non-SME 0 0 477 46 453 110 0 0 285 2 352 129 0 0 0 36 1 27 1.26% 77 35.05% 1.04% 87 34.68% 0.89% 95 34.31% 1.81% 88 38.35% 1.67% 105 39.22% 1.47% 118 38.97%
Equity 0 0 0 0 166 0 0 0 0 0 207 0 0 0 0 0 0 0 0.00% 0 - 0.00% 0 - 0.00% 0 - 0.00% 0 - 0.00% 0 - 0.00% 0 -
Securitisation 612 0 0 0 47 0 422 0 0 0 32 0 4 0 0 0 0 0
Othernon-credit obligation assets 0 0 0 0 1,557 0 0 0 0 0 1,942 0 0 0 0 0 0 0
TOTAL 851 82 18,170 1,018 26,779 1,031 733 0 3,468 553 15,938 1,264 6 25 8 216 47 655 0.78% 1,548 35.75% 0.60% 1,798 35.00% 0.50% 2,012 34.58% 1.13% 1,760 38.28% 1.10% 2,248 38.73% 0.90% 2,605 38.22%
Securitisation andre-securitisations positions deductedfrom capital * 0 0 0 0 0 0 0 0 0 0 0 0
(mln EUR, %)No n-d ef aul t ed De fau lt e d No n-d ef aul t ed De fau lt e d No n-d ef aul t ed De fau lt e d No n-d ef aul t e d De fau lt e d No n-d ef aul t ed De fau lt e d No n-d ef aul t e d De fau lt e d No n-d ef aul t ed De fau lt e d No n-d ef aul t ed De fau lt e d No n-d ef aul t ed De fau lt e d
Impairment
rate
Stockof
ProvisionsCoverage Ratio -
Default Stock
Impairment
rate
Stockof
Provisions
Coverage
Ratio-DefaultStock
Impairment
rate
Stockof
Provisions
Coverage
Ratio -DefaultStock
Impairment rateStockof
Provisions
Coverage
Ratio-DefaultStock
Impairment
rate
Stockof
Provisions
Coverage
Ratio-DefaultStock
Impairment
rate
Stockof
Provisions
Coverage
Ratio -DefaultStock
Central banksandcentral governments 0 0 0 0 6,788 0 0 0 0 0 837 0 0 0 0 0 0 0 0.37% 22 39.55% 0.36% 43 39.52% 0.36% 64 39.49% 0.82% 49 39.97% 0.82% 96 39.96% 0.81% 142 39.93%
Institutions 0 0 0 0 3,239 127 0 0 0 0 968 191 0 0 0 0 0 0 0.35% 10 6.51% 0.35% 19 11.11% 0.34% 29 14.54% 0.80% 22 12.35% 0.80% 44 18.85% 0.79% 66 22.82%
Corporates 239 82 45 6 11,991 701 310 0 67 3 10,208 841 2 25 0 3 44 561 1.46% 977 45.07% 1.05% 1,102 43.88% 0.82% 1,200 43.10% 1.95% 1,070 47.93% 1.97% 1,323 48.19% 1.49% 1,490 47.48%
Corporates -Of Which:SpecialisedLending 239 82 0 0 61 17 310 0 0 0 92 18 2 25 0 0 2 8 - 0 - - 0 - - 0 - - 0 - - 0 - - 0 -
Corporates -Of Which:SME 0 0 0 0 6,169 364 0 0 0 0 4,680 418 0 0 0 0 10 265 - 0 - - 0 - - 0 - - 0 - - 0 - - 0 -Retail 0 0 18,124 1,012 2,991 202 0 0 3,401 550 1,744 231 0 0 8 212 3 94 0.57% 539 28.45% 0.45% 633 27.75% 0.39% 719 27.49% 0.79% 618 30.83% 0.73% 783 30.97% 0.62% 907 30.40%
Retail -Securedon real estateproperty 54.5% 0 0 15,617 725 1,969 27 0 0 2,236 462 938 31 0 0 5 62 1 4 0.29% 209 18.34% 0.24% 251 18.05% 0.21% 292 18.19% 0.43% 252 20.73% 0.39% 328 21.04% 0.33% 383 20.60%
Retail -Securedon real estate property- Of
h i h : S E55.7% 0 0 1,071 224 20 1 0 0 460 193 12 1 0 0 2 25 0 1 1.89% 93 26.49% 1.54% 110 26.53% 1.35% 124 26.83% 2.36% 101 28.01% 2.50% 135 30.57% 2.05% 154 30.36%
Retail -Securedon real estate property- Of
h i h: n n - E54.4% 0 0 14,546 501 1,949 27 0 0 1,777 269 926 30 0 0 3 37 1 4 0.19% 116 14.98% 0.16% 141 14.69% 0.14% 168 14.89% 0.30% 150 17.88% 0.26% 193 17.48% 0.23% 230 17.13%
Retail -QualifyingRevolving 0 0 0 0 485 14 0 0 0 0 369 15 0 0 0 0 1 34 2.79% 48 69.81% 2.03% 58 69.14% 2.13% 67 68.71% 3.45% 54 74.40% 3.26% 69 74.38% 3.25% 84 73.95%
Retail -OtherRetail 0 0 2,507 287 537 161 0 0 1,165 88 437 185 0 0 3 150 1 55 1.84% 282 40.43% 1.46% 325 39.72% 1.22% 359 39.14% 2.47% 312 43.14% 2.39% 386 43.71% 1.99% 440 43.35%
Retail -Other Retail -Of Which:SME 0 0 2,030 241 84 51 0 0 880 85 86 57 0 0 3 114 0 28 2.10% 205 43.12% 1.64% 238 42.09% 1.37% 265 41.35% 2.76% 224 45.53% 2.71% 281 45.78% 2.23% 322 45.29%
Retail -Other Retail -Of Which:non-SME 0 0 477 46 453 110 0 0 285 2 352 129 0 0 0 36 1 27 1.26% 77 35.05% 1.04% 87 34.68% 0.89% 95 34.31% 1.81% 88 38.35% 1.67% 105 39.22% 1.47% 118 38.97%
Equity 0 0 0 0 166 0 0 0 0 0 207 0 0 0 0 0 0 0 0.00% 0 - 0.00% 0 - 0.00% 0 - 0.00% 0 - 0.00% 0 - 0.00% 0 -
Securitisation 612 0 0 0 47 0 422 0 0 0 32 0 4 0 0 0 0 0
Othernon-credit obligation assets 0 0 0 0 1,557 0 0 0 0 0 1,942 0 0 0 0 0 0 0
TOTAL 851 82 18,170 1,018 26,779 1,031 733 0 3,468 553 15,938 1,264 6 25 8 216 47 655 0.78% 1,548 35.75% 0.60% 1,798 35.00% 0.50% 2,012 34.58% 1.13% 1,760 38.28% 1.10% 2,248 38.73% 0.90% 2,605 38.22%Securitisation andre-securitisations positions deductedfrom capital * 0 0 0 0 0 0 0 0 0 0 0 0
(mln EUR, %)No n-d ef aul t ed De fau lt e d No n-d ef aul t ed De fau lt e d No n-d ef aul t ed De fau lt e d No n-d ef aul t e d De fau lt e d No n-d ef aul t ed De fau lt e d No n-d ef aul t e d De fau lt e d No n-d ef aul t ed De fau lt e d No n-d ef aul t ed De fau lt e d No n-d ef aul t ed De fau lt e d
Impairment
rate
Stockof
ProvisionsCoverage Ratio -
Default Stock
Impairment
rate
Stockof
Provisions
CoverageRatio-Default
Stock
Impairment
rate
Stockof
Provisions
CoverageRatio -Default
Stock
Impairment rateStockof
Provisions
CoverageRatio-Default
Stock
Impairment
rate
Stockof
Provisions
CoverageRatio-Default
Stock
Impairment
rate
Stockof
Provisions
CoverageRatio -Default
Stock Central banksandcentral governments 0 0 0 0 0 0 0 0 0 0 0 0 0 0 0 0 0 0 - 0 - - 0 - - 0 - - 0 - - 0 - - 0 -
Institutions 0 0 0 0 0 0 0 0 0 0 0 0 0 0 0 0 0 0 - 0 - - 0 - - 0 - - 0 - - 0 - - 0 -
Corporates 0 0 0 0 0 0 0 0 0 0 0 0 0 0 0 0 0 0 - 0 - - 0 - - 0 - - 0 - - 0 - - 0 -
Corporates -Of Which:SpecialisedLending 0 0 0 0 0 0 0 0 0 0 0 0 0 0 0 0 0 0 - 0 - - 0 - - 0 - - 0 - - 0 - - 0 -
Corporates -Of Which:SME 0 0 0 0 0 0 0 0 0 0 0 0 0 0 0 0 0 0 - 0 - - 0 - - 0 - - 0 - - 0 - - 0 -
Retail 0 0 0 0 0 0 0 0 0 0 0 0 0 0 0 0 0 0 - 0 - - 0 - - 0 - - 0 - - 0 - - 0 -
Retail -Securedon real estateproperty 0.0% 0 0 0 0 0 0 0 0 0 0 0 0 0 0 0 0 0 0 - 0 - - 0 - - 0 - - 0 - - 0 - - 0 -
Retail -Securedon real estate property- Of
hi h: E0.0% 0 0 0 0 0 0 0 0 0 0 0 0 0 0 0 0 0 0 - 0 - - 0 - - 0 - - 0 - - 0 - - 0 -
Retail -Securedon real estate property- Of
h i h : n n -S E0.0% 0 0 0 0 0 0 0 0 0 0 0 0 0 0 0 0 0 0 - 0 - - 0 - - 0 - - 0 - - 0 - - 0 -
Retail -QualifyingRevolving 0 0 0 0 0 0 0 0 0 0 0 0 0 0 0 0 0 0 - 0 - - 0 - - 0 - - 0 - - 0 - - 0 -
Retail -OtherRetail 0 0 0 0 0 0 0 0 0 0 0 0 0 0 0 0 0 0 - 0 - - 0 - - 0 - - 0 - - 0 - - 0 -
Retail -Other Retail -Of Which:SME 0 0 0 0 0 0 0 0 0 0 0 0 0 0 0 0 0 0 - 0 - - 0 - - 0 - - 0 - - 0 - - 0 -
Retail -Other Retail -Of Which:non-SME 0 0 0 0 0 0 0 0 0 0 0 0 0 0 0 0 0 0 - 0 - - 0 - - 0 - - 0 - - 0 - - 0 -
Equity 0 0 0 0 0 0 0 0 0 0 0 0 0 0 0 0 0 0 - 0 - - 0 - - 0 - - 0 - - 0 - - 0 -
Securitisation 0 0 0 0 0 0 0 0 0 0 0 0 0 0 0 0 0 0
Othernon-credit obligation assets 0 0 0 0 0 0 0 0 0 0 0 0 0 0 0 0 0 0
TOTAL 0 0 0 0 0 0 0 0 0 0 0 0 0 0 0 0 0 0 - 0 - - 0 - - 0 - - 0 - - 0 - - 0 -
Securitisation andre-securitisations positions deductedfrom capital * 0 0 0 0 0 0 0 0 0 0 0 0
(mln EUR, %)No n-d ef aul t ed De fau lt e d No n-d ef aul t ed De fau lt e d No n-d ef aul t ed De fau lt e d No n-d ef aul t e d De fau lt e d No n-d ef aul t ed De fau lt e d No n-d ef aul t e d De fau lt e d No n-d ef aul t ed De fau lt e d No n-d ef aul t ed De fau lt e d No n-d ef aul t ed De fau lt e d
Impairment
rate
Stockof
ProvisionsCoverage Ratio -
Default Stock
Impairment
rate
Stockof
Provisions
CoverageRatio-Default
Stock
Impairment
rate
Stockof
Provisions
CoverageRatio -Default
Stock
Impairment rateStockof
Provisions
CoverageRatio-Default
Stock
Impairment
rate
Stockof
Provisions
CoverageRatio-Default
Stock
Impairment
rate
Stockof
Provisions
CoverageRatio -Default
Stock
Central banksandcentral governments 0 0 0 0 0 0 0 0 0 0 0 0 0 0 0 0 0 0 - 0 - - 0 - - 0 - - 0 - - 0 - - 0 -Institutions 0 0 0 0 0 0 0 0 0 0 0 0 0 0 0 0 0 0 - 0 - - 0 - - 0 - - 0 - - 0 - - 0 -
Corporates 0 0 0 0 0 0 0 0 0 0 0 0 0 0 0 0 0 0 - 0 - - 0 - - 0 - - 0 - - 0 - - 0 -
Corporates -Of Which:SpecialisedLending 0 0 0 0 0 0 0 0 0 0 0 0 0 0 0 0 0 0 - 0 - - 0 - - 0 - - 0 - - 0 - - 0 -
Corporates -Of Which:SME 0 0 0 0 0 0 0 0 0 0 0 0 0 0 0 0 0 0 - 0 - - 0 - - 0 - - 0 - - 0 - - 0 -
Retail 0 0 0 0 0 0 0 0 0 0 0 0 0 0 0 0 0 0 - 0 - - 0 - - 0 - - 0 - - 0 - - 0 -
Retail -Securedon real estateproperty 0.0% 0 0 0 0 0 0 0 0 0 0 0 0 0 0 0 0 0 0 - 0 - - 0 - - 0 - - 0 - - 0 - - 0 -
Retail -Securedon real estate property- Of
hi h: E0.0% 0 0 0 0 0 0 0 0 0 0 0 0 0 0 0 0 0 0 - 0 - - 0 - - 0 - - 0 - - 0 - - 0 -
Retail -Securedon real estate property- Of
h i h: n n - E0.0% 0 0 0 0 0 0 0 0 0 0 0 0 0 0 0 0 0 0 - 0 - - 0 - - 0 - - 0 - - 0 - - 0 -
Retail -QualifyingRevolving 0 0 0 0 0 0 0 0 0 0 0 0 0 0 0 0 0 0 - 0 - - 0 - - 0 - - 0 - - 0 - - 0 -
Retail -OtherRetail 0 0 0 0 0 0 0 0 0 0 0 0 0 0 0 0 0 0 - 0 - - 0 - - 0 - - 0 - - 0 - - 0 -
Retail -Other Retail -Of Which:SME 0 0 0 0 0 0 0 0 0 0 0 0 0 0 0 0 0 0 - 0 - - 0 - - 0 - - 0 - - 0 - - 0 -
Retail -Other Retail -Of Which:non-SME 0 0 0 0 0 0 0 0 0 0 0 0 0 0 0 0 0 0 - 0 - - 0 - - 0 - - 0 - - 0 - - 0 -
Equity 0 0 0 0 0 0 0 0 0 0 0 0 0 0 0 0 0 0 - 0 - - 0 - - 0 - - 0 - - 0 - - 0 -
Securitisation 0 0 0 0 0 0 0 0 0 0 0 0 0 0 0 0 0 0
Othernon-credit obligation assets 0 0 0 0 0 0 0 0 0 0 0 0 0 0 0 0 0 0
TOTAL 0 0 0 0 0 0 0 0 0 0 0 0 0 0 0 0 0 0 - 0 - - 0 - - 0 - - 0 - - 0 - - 0 -
Securitisation andre-securitisations positions deductedfrom capital * 0 0 0 0 0 0 0 0 0 0 0 0
(mln EUR, %)No n-d ef aul t ed De fau lt e d No n-d ef aul t ed De fau lt e d No n-d ef aul t ed De fau lt e d No n-d ef aul t e d De fau lt e d No n-d ef aul t ed De fau lt e d No n-d ef aul t e d De fau lt e d No n-d ef aul t ed De fau lt e d No n-d ef aul t ed De fau lt e d No n-d ef aul t ed De fau lt e d
Impairment
rate
Stockof
ProvisionsCoverage Ratio -
Default Stock
Impairment
rate
Stockof
Provisions
CoverageRatio-Default
Stock
Impairment
rate
Stockof
Provisions
CoverageRatio -Default
Stock
Impairment rateStockof
Provisions
CoverageRatio-Default
Stock
Impairment
rate
Stockof
Provisions
CoverageRatio-Default
Stock
Impairment
rate
Stockof
Provisions
CoverageRatio -Default
Stock Central banksandcentral governments 0 0 0 0 0 0 0 0 0 0 0 0 0 0 0 0 0 0 - 0 - - 0 - - 0 - - 0 - - 0 - - 0 -
Institutions 0 0 0 0 0 0 0 0 0 0 0 0 0 0 0 0 0 0 - 0 - - 0 - - 0 - - 0 - - 0 - - 0 -
Corporates 0 0 0 0 0 0 0 0 0 0 0 0 0 0 0 0 0 0 - 0 - - 0 - - 0 - - 0 - - 0 - - 0 -
Corporates -Of Which:SpecialisedLending 0 0 0 0 0 0 0 0 0 0 0 0 0 0 0 0 0 0 - 0 - - 0 - - 0 - - 0 - - 0 - - 0 -
Corporates -Of Which:SME 0 0 0 0 0 0 0 0 0 0 0 0 0 0 0 0 0 0 - 0 - - 0 - - 0 - - 0 - - 0 - - 0 -
Retail 0 0 0 0 0 0 0 0 0 0 0 0 0 0 0 0 0 0 - 0 - - 0 - - 0 - - 0 - - 0 - - 0 -
Retail -Securedon real estateproperty 0.0% 0 0 0 0 0 0 0 0 0 0 0 0 0 0 0 0 0 0 - 0 - - 0 - - 0 - - 0 - - 0 - - 0 -
Retail -Securedon real estate property- Of
hi h: E0.0% 0 0 0 0 0 0 0 0 0 0 0 0 0 0 0 0 0 0 - 0 - - 0 - - 0 - - 0 - - 0 - - 0 -
Retail -Securedon real estate property- Of
h i h : n n -S E0.0% 0 0 0 0 0 0 0 0 0 0 0 0 0 0 0 0 0 0 - 0 - - 0 - - 0 - - 0 - - 0 - - 0 -
Retail -QualifyingRevolving 0 0 0 0 0 0 0 0 0 0 0 0 0 0 0 0 0 0 - 0 - - 0 - - 0 - - 0 - - 0 - - 0 -
Retail -OtherRetail 0 0 0 0 0 0 0 0 0 0 0 0 0 0 0 0 0 0 - 0 - - 0 - - 0 - - 0 - - 0 - - 0 -
Retail -Other Retail -Of Which:SME 0 0 0 0 0 0 0 0 0 0 0 0 0 0 0 0 0 0 - 0 - - 0 - - 0 - - 0 - - 0 - - 0 -
Retail -Other Retail -Of Which:non-SME 0 0 0 0 0 0 0 0 0 0 0 0 0 0 0 0 0 0 - 0 - - 0 - - 0 - - 0 - - 0 - - 0 -
Equity 0 0 0 0 0 0 0 0 0 0 0 0 0 0 0 0 0 0 - 0 - - 0 - - 0 - - 0 - - 0 - - 0 -
Securitisation 0 0 0 0 0 0 0 0 0 0 0 0 0 0 0 0 0 0
Othernon-credit obligation assets 0 0 0 0 0 0 0 0 0 0 0 0 0 0 0 0 0 0
TOTAL 0 0 0 0 0 0 0 0 0 0 0 0 0 0 0 0 0 0 - 0 - - 0 - - 0 - - 0 - - 0 - - 0 -
Securitisation andre-securitisations positions deductedfrom capital * 0 0 0 0 0 0 0 0 0 0 0 0
(mln EUR, %)No n-d ef aul t ed De fau lt e d No n-d ef aul t ed De fau lt e d No n-d ef aul t ed De fau lt e d No n-d ef aul t e d De fau lt e d No n-d ef aul t ed De fau lt e d No n-d ef aul t e d De fau lt e d No n-d ef aul t ed De fau lt e d No n-d ef aul t ed De fau lt e d No n-d ef aul t ed De fau lt e d
Impairment
rate
Stockof
ProvisionsCoverage Ratio -
Default Stock
Impairment
rate
Stockof
Provisions
CoverageRatio-Default
Stock
Impairment
rate
Stockof
Provisions
CoverageRatio -Default
Stock
Impairment rateStockof
Provisions
CoverageRatio-Default
Stock
Impairment
rate
Stockof
Provisions
CoverageRatio-Default
Stock
Impairment
rate
Stockof
Provisions
CoverageRatio -Default
Stock Central banksandcentral governments 0 0 0 0 0 0 0 0 0 0 0 0 0 0 0 0 0 0 - 0 - - 0 - - 0 - - 0 - - 0 - - 0 -
Institutions 0 0 0 0 0 0 0 0 0 0 0 0 0 0 0 0 0 0 - 0 - - 0 - - 0 - - 0 - - 0 - - 0 -
Corporates 0 0 0 0 0 0 0 0 0 0 0 0 0 0 0 0 0 0 - 0 - - 0 - - 0 - - 0 - - 0 - - 0 -
Corporates -Of Which:SpecialisedLending 0 0 0 0 0 0 0 0 0 0 0 0 0 0 0 0 0 0 - 0 - - 0 - - 0 - - 0 - - 0 - - 0 -
Corporates -Of Which:SME 0 0 0 0 0 0 0 0 0 0 0 0 0 0 0 0 0 0 - 0 - - 0 - - 0 - - 0 - - 0 - - 0 -
Retail 0 0 0 0 0 0 0 0 0 0 0 0 0 0 0 0 0 0 - 0 - - 0 - - 0 - - 0 - - 0 - - 0 -
Retail -Securedon real estateproperty 0.0% 0 0 0 0 0 0 0 0 0 0 0 0 0 0 0 0 0 0 - 0 - - 0 - - 0 - - 0 - - 0 - - 0 -
Retail -Securedon real estate property- Of
hi h: E0.0% 0 0 0 0 0 0 0 0 0 0 0 0 0 0 0 0 0 0 - 0 - - 0 - - 0 - - 0 - - 0 - - 0 -
Retail -Securedon real estate property- Of
h i h: n n - E0.0% 0 0 0 0 0 0 0 0 0 0 0 0 0 0 0 0 0 0 - 0 - - 0 - - 0 - - 0 - - 0 - - 0 -
Retail -QualifyingRevolving 0 0 0 0 0 0 0 0 0 0 0 0 0 0 0 0 0 0 - 0 - - 0 - - 0 - - 0 - - 0 - - 0 -
Retail -OtherRetail 0 0 0 0 0 0 0 0 0 0 0 0 0 0 0 0 0 0 - 0 - - 0 - - 0 - - 0 - - 0 - - 0 -
Retail -Other Retail -Of Which:SME 0 0 0 0 0 0 0 0 0 0 0 0 0 0 0 0 0 0 - 0 - - 0 - - 0 - - 0 - - 0 - - 0 -
Retail -Other Retail -Of Which:non-SME 0 0 0 0 0 0 0 0 0 0 0 0 0 0 0 0 0 0 - 0 - - 0 - - 0 - - 0 - - 0 - - 0 -
Equity 0 0 0 0 0 0 0 0 0 0 0 0 0 0 0 0 0 0 - 0 - - 0 - - 0 - - 0 - - 0 - - 0 -
Securitisation 0 0 0 0 0 0 0 0 0 0 0 0 0 0 0 0 0 0
Othernon-credit obligation assets 0 0 0 0 0 0 0 0 0 0 0 0 0 0 0 0 0 0
TOTAL 0 0 0 0 0 0 0 0 0 0 0 0 0 0 0 0 0 0 - 0 - - 0 - - 0 - - 0 - - 0 - - 0 -
Securitisation andre-securitisations positions deductedfrom capital * 0 0 0 0 0 0 0 0 0 0 0 0
as of 31/12/2016 as of 31/12/2014 as of 31/12/2015 as of 31/12/2016
Please, select the country
F-IRB A-IRB STA a s of 3 1/ 12 /2 01 4 a s of 3 1/ 12 /2 01 5LTV %(asof
31/12/2013)
Exposure values (as of 31/12/2013) Risk exposure amounts (as of 31/12/2013) Value adjustments and provisions (as of 31/12/2013) Baseline Scenario Adverse ScenarioF-IRB A-IRB STA F-IRB A-IRB STA
LTV %(asof
31/12/2013)
Exposure values (as of 31/12/2013) Risk exposure amounts (as of 31/12/2013) Value adjustments and provisions (as of 31/12/2013) Baseline Scenario Adverse Scenario
F-IRB A-IRB STA F-IRB A-IRB STA F-IRB a sof 31 /12 /2 01 4 a so f3 1/ 12 /2 01 5 a sof 31 /12 /2 01 6 A-IRB STA a sof 31 /1 2/ 20 14 a so f3 1/ 12 /2 01 5 a sof 31 /12 /2 01 6
LTV %(asof
31/12/2013)
Exposure values (as of 31/12/2013) Risk exposure amounts (as of 31/12/2013) Value adjustments and provisions (as of 31/12/2013) Baseline Scenario Adverse Scenario
F-IRB A-IRB STA F-IRB A-IRB STA F-IRB A-IRB a s of 3 1/ 12 /2 01 5 a s of 3 1/ 12 /2 01 6STA as of 31/12/2014 as of 31/12/2015 as of 31/12/2016 as of 31/12/2014
Risk exposureamounts(as of31/12/2013)
Baseline Scenario Adverse Scenario
F-IRB A-IRB STA F-IRB A-IRB STA F-IRB A-IRB STA as of 31/12/2014 as of 31/12/2015 as of 31/12/2016 as of 31/12/2014 as of 31/12/2015 as of 31/12/2016
Spain
LTV %(asof
31/12/2013)
E xp os ur e va lu es ( as of 3 1/ 12 /2 01 3) R is k e xp os ur e am ou nt s (a s of 3 1/ 12 /2 01 3) V al ue a dj us tm en ts a nd pr ov is io ns ( as o f3 1/ 12 /2 01 3)
AdverseScenario
F-IRB A-IRB STA F-IRB A-IRB STA F-IRB A-IRB STA as of 31/12/2014 as of 31/12/2015 as of 31/12/2016 as of 31/12/2014 as of 31/12/2015 as of 31/12/2016LTV %(asof
31/12/2013)
Exposurevalues(as of31/12/2013)
ES - Bankinter, S.A.
(*)Referstothepart ofSecuritizationexposurethat isdeductedfrom capital andisnot includedinRWA
Valueadjustmentsand provisions(asof 31/12/2013) BaselineScenario
(*)Referstothepart ofSecuritizationexposurethat isdeductedfrom capital andisnot includedinRWA
(*)Referstothepart ofSecuritizationexposurethat isdeductedfrom capital andisnot includedinRWA
(*)Referstothepart ofSecuritizationexposurethat isdeductedfrom capital andisnot includedinRWA
(*)Referstothepart ofSecuritizationexposurethat isdeductedfrom capital andisnot includedinRWA
(*)Referstothepart ofSecuritizationexposurethat isdeductedfrom capital andisnot includedinRWA
Please, select the country
Please, select the country
Please, select the country
http://www.economiaciudadana.org/

8/10/2019 Test Stress Banca Española 2014
http://slidepdf.com/reader/full/test-stress-banca-espanola-2014 68/240
2014 EU-wide Stress Test
P&L
(mln EUR) 31/12/2014 31/12/2015 31/12/2016 31/12/2014 31/12/2015 31/12/2016
Net interest income 591 591 591 591 591 591 591
31/12/2013
Baseline Scenario Adverse Scenario

8/10/2019 Test Stress Banca Española 2014
http://slidepdf.com/reader/full/test-stress-banca-espanola-2014 69/240
Net interest income 591 591 591 591 591 591 591
Net trading income 15 17 18 -3 7 11
of which trading losses from stress scenarios -5 -3 -2 -23 -14 -9
Other operating income 140 -28 -28 -28 -28 -28 -28
Operating profit before impairments 571 400 402 403 381 387 392
Impairment of financial assets (-) -420 -489 -252 -216 -702 -491 -357
Impairment of financial assets other than instruments designated at fair value
through P&L (-)-420 -488 -252 -216 -702 -491 -357
Impairment Financial assets designated at fair value through P&L (-) 0 0 0 0 0 0 0
Impairment on non financial assets (-) -93 -11 0 0 -20 -10 -1
Operating profit after impairments from stress scenarios 58 -100 149 187 -341 -114 34
Other Income and expenses 126 124 124 124 124 123 123
Pre-Tax profit 183 24 274 311 -217 9 157
Tax -52 -7 -82 -93 65 -3 -47
Net income 132 17 191 218 -152 6 110
Attributable to owners of the parent 132 17 191 218 -152 6 110
of which carried over to capital through retained earnings 78 13 144 163 -152 5 82
of which distributed as dividends 54 4 48 54 0 2 27
In the figures above, the original (official published) 2013 P&L figures may have been adjusted as part of the ECB Comprehensive Assessment join-up calculation.
http://www.economiaciudadana.org/
2014 EU-wide Stress Test
RWA
as of 31/12/2013 as of 31/12/2014 as of 31/12/2015 as of 31/12/2016 as of 31/12/2014 as of 31/12/2015 as of 31/12/2016
Baseline Scenario Adverse Scenario

8/10/2019 Test Stress Banca Española 2014
http://slidepdf.com/reader/full/test-stress-banca-espanola-2014 70/240
(mln EUR)as of 31/12/2013 as of 31/12/2014 as of 31/12/2015 as of 31/12/2016 as of 31/12/2014 as of 31/12/2015 as of 31/12/2016
Risk exposure amount for credit risk 21,922 22,565 22,574 22,766 22,607 22,581 22,696
Risk exposure amount Securitisation and re-securitisations 454 558 568 585 589 555 683
Risk exposure amount Other credit risk 21,468 22,007 22,007 22,180 22,018 22,026 22,012
Risk exposure amount for market risk 294 294 294 294 294 294 294
Risk exposure amount for operational risk 1,583 1,609 1,609 1,609 1,612 1,613 1,614
Transitional floors for Risk exposure amount 0 0 0 0 0 0 0
AQR adjustments (for SSM countries only) 32 32 32 32 32 32 32
Total Risk exposure amount 23,831 24,500 24,510 24,701 24,545 24,520 24,635
http://www.economiaciudadana.org/

8/10/2019 Test Stress Banca Española 2014
http://slidepdf.com/reader/full/test-stress-banca-espanola-2014 71/240
2014 EU-wide Stress Test - Sovereign Exposure
(mln EUR)
GROSS DIRECT LONG
EXPOSURES(accounting value gross
of provisions)
NET DIRECT POSITIONS (gross exposures (long) net of cash short
positions of sovereign debt to other counterpaties only where there
is a maturity matching)
DIRECT SOVEREIGN EXPOSURES IN DERIVATIVES (1)
VALUES AS OF 31/12/2013 VALUES AS OF 31/12/2013 VALUES AS OF 31/12/2013
INDIRECT SOVEREIGN EXPOSURES (3) (on and off balance sheet)

8/10/2019 Test Stress Banca Española 2014
http://slidepdf.com/reader/full/test-stress-banca-espanola-2014 72/240
[ 0 - 3M [ 0 0 0 0 0 0 0 0 0 0 0 0 0 0
[ 3M - 1Y [ 0 0 0 0 0 0 0 0 0 0 0 0 0 0
[ 1Y - 2Y [ 0 0 0 0 0 0 0 0 0 0 0 0 0 0
[ 2Y - 3Y [ 0 0 0 0 0 0 0 0 0 0 0 0 0 0
[3Y - 5Y [ 0 0 0 0 0 0 0 0 0 0 0 0 0 0
[5Y - 10Y [ 0 0 0 0 0 0 0 0 0 0 0 0 0 0
[10Y - more 0 0 0 0 0 0 0 0 0 0 0 0 0 0
Tot 0 0 0 0 0 0 0 0 0 0 0 0 0 0
[ 0 - 3M [ 0 0 0 0 0 0 0 0 0 0 0 0 0 0
[ 3M - 1Y [ 0 0 0 0 0 0 0 0 0 0 0 0 0 0
[ 1Y - 2Y [ 0 0 0 0 0 0 0 0 0 0 0 0 0 0
[ 2Y - 3Y [ 0 0 0 0 0 0 0 0 0 0 0 0 0 0
[3Y - 5Y [ 0 0 0 0 0 0 0 0 0 0 0 0 0 0
[5Y - 10Y [ 0 0 0 0 0 0 0 0 0 0 0 0 0 0
[10Y - more 0 0 0 0 0 0 0 0 0 0 0 0 0 0
Tot 0 0 0 0 0 0 0 0 0 0 0 0 0 0
[ 0 - 3M [ 0 0 0 0 0 0 0 0 0 0 0 0 0 0
[ 3M - 1Y [ 0 0 0 0 0 0 0 0 0 0 0 0 0 0[ 1Y - 2Y [ 0 0 0 0 0 0 0 0 0 0 0 0 0 0
[ 2Y - 3Y [ 0 0 0 0 0 0 0 0 0 0 0 0 0 0
[3Y - 5Y [ 0 0 0 0 0 0 0 0 0 0 0 0 0 0
[5Y - 10Y [ 0 0 0 0 0 0 0 0 0 0 0 0 0 0
[10Y - more 0 0 0 0 0 0 0 0 0 0 0 0 0 0
Tot 0 0 0 0 0 0 0 0 0 0 0 0 0 0
[ 0 - 3M [ 0 0 0 0 0 0 0 0 0 0 0 0 0 0
[ 3M - 1Y [ 0 0 0 0 0 0 0 0 0 0 0 0 0 0
[ 1Y - 2Y [ 0 0 0 0 0 0 0 0 0 0 0 0 0 0
[ 2Y - 3Y [ 0 0 0 0 0 0 0 0 0 0 0 0 0 0
[3Y - 5Y [ 0 0 0 0 0 0 0 0 0 0 0 0 0 0
[5Y - 10Y [ 0 0 0 0 0 0 0 0 0 0 0 0 0 0
[10Y - more 0 0 0 0 0 0 0 0 0 0 0 0 0 0
Tot 0 0 0 0 0 0 0 0 0 0 0 0 0 0
[ 0 - 3M [ 0 0 0 0 0 0 0 0 0 0 0 0 0 0
[ 3M - 1Y [ 0 0 0 0 0 0 0 0 0 0 0 0 0 0
[ 1Y - 2Y [ 0 0 0 0 0 0 0 0 0 0 0 0 0 0
[ 2Y - 3Y [ 0 0 0 0 0 0 0 0 0 0 0 0 0 0
[3Y - 5Y [ 0 0 0 0 0 0 0 0 0 0 0 0 0 0
[5Y - 10Y [ 0 0 0 0 0 0 0 0 0 0 0 0 0 0
[10Y - more 0 0 0 0 0 0 0 0 0 0 0 0 0 0
Tot 0 0 0 0 0 0 0 0 0 0 0 0 0 0
Residual Maturity Country / Region
p )
(1)
y g)
(1)
of which: loans
and advances
of which: AFS
banking book
of which: FVO
(designated at fair
value through
profit&loss)
banking book
of which: Financial
assets held for
trading
(2)
Derivatives with positive fair value at
31/12/2013
Derivatives with negative fair value at
31/12/2013
Derivatives with positive fair value
at 31/12/2013
Derivatives with negative fair
value at 31/12/2013
Fair-value at
31/12/2013 (+)Notional value
Fair-value at
31/12/2013 (-)Notional value
Fair-value at
31/12/2013 (+)Notional value
Fair-value at 31/12/2013
(-)
Austria
Belgium
Bulgaria
Cyprus
Notional value
Czech Republic
Denmark
Estonia
Finland
France
http://www.economiaciudadana.org/
2014 EU-wide Stress Test - Sovereign Exposure
(mln EUR)
GROSS DIRECT LONG
EXPOSURES(accounting value gross
of provisions)
NET DIRECT POSITIONS (gross exposures (long) net of cash short
positions of sovereign debt to other counterpaties only where there
is a maturity matching)
DIRECT SOVEREIGN EXPOSURES IN DERIVATIVES (1)
D i ti ith iti f i l t D i ti ith ti f i l t D i ti ith iti f i l D i ti ith ti f i
VALUES AS OF 31/12/2013 VALUES AS OF 31/12/2013 VALUES AS OF 31/12/2013
INDIRECT SOVEREIGN EXPOSURES (3) (on and off balance sheet)

8/10/2019 Test Stress Banca Española 2014
http://slidepdf.com/reader/full/test-stress-banca-espanola-2014 73/240
Residual Maturity Country / Region
(1) (1)
of which: loans
and advances
of which: AFS
banking book
of which: FVO
(designated at fair
value through
profit&loss)
banking book
of which: Financial
assets held for
trading
(2)
Derivatives with positive fair value at
31/12/2013
Derivatives with negative fair value at
31/12/2013
Derivatives with positive fair value
at 31/12/2013
Derivatives with negative fair
value at 31/12/2013
Fair-value at
31/12/2013 (+)Notional value
Fair-value at
31/12/2013 (-)Notional value
Fair-value at
31/12/2013 (+)Notional value
Fair-value at 31/12/2013
(-)Notional value
[ 0 - 3M [ 0 0 0 0 0 0 0 0 0 0 0 0 0 0
[ 3M - 1Y [ 0 0 0 0 0 0 0 0 0 0 0 0 0 0
[ 1Y - 2Y [ 0 0 0 0 0 0 0 0 0 0 0 0 0 0
[ 2Y - 3Y [ 0 0 0 0 0 0 0 0 0 0 0 0 0 0
[3Y - 5Y [ 0 0 0 0 0 0 0 0 0 0 0 0 0 0
[5Y - 10Y [ 0 0 0 0 0 0 0 0 0 0 0 0 0 0
[10Y - more 0 0 0 0 0 0 0 0 0 0 0 0 0 0
Tot 0 0 0 0 0 0 0 0 0 0 0 0 0 0
[ 0 - 3M [ 0 0 0 0 0 0 0 0 0 0 0 0 0 0
[ 3M - 1Y [ 0 0 0 0 0 0 0 0 0 0 0 0 0 0[ 1Y - 2Y [ 0 0 0 0 0 0 0 0 0 0 0 0 0 0
[ 2Y - 3Y [ 0 0 0 0 0 0 0 0 0 0 0 0 0 0
[3Y - 5Y [ 0 0 0 0 0 0 0 0 0 0 0 0 0 0
[5Y - 10Y [ 0 0 0 0 0 0 0 0 0 0 0 0 0 0
[10Y - more 0 0 0 0 0 0 0 0 0 0 0 0 0 0
Tot 0 0 0 0 0 0 0 0 0 0 0 0 0 0
[ 0 - 3M [ 0 0 0 0 0 0 0 0 0 0 0 0 0 0
[ 3M - 1Y [ 0 0 0 0 0 0 0 0 0 0 0 0 0 0
[ 1Y - 2Y [ 0 0 0 0 0 0 0 0 0 0 0 0 0 0
[ 2Y - 3Y [ 0 0 0 0 0 0 0 0 0 0 0 0 0 0
[3Y - 5Y [ 0 0 0 0 0 0 0 0 0 0 0 0 0 0
[5Y - 10Y [ 0 0 0 0 0 0 0 0 0 0 0 0 0 0
[10Y - more 0 0 0 0 0 0 0 0 0 0 0 0 0 0
Tot 0 0 0 0 0 0 0 0 0 0 0 0 0 0
[ 0 - 3M [ 0 0 0 0 0 0 0 0 0 0 0 0 0 0
[ 3M - 1Y [ 0 0 0 0 0 0 0 0 0 0 0 0 0 0
[ 1Y - 2Y [ 0 0 0 0 0 0 0 0 0 0 0 0 0 0
[ 2Y - 3Y [ 0 0 0 0 0 0 0 0 0 0 0 0 0 0
[3Y - 5Y [ 0 0 0 0 0 0 0 0 0 0 0 0 0 0
[5Y - 10Y [ 0 0 0 0 0 0 0 0 0 0 0 0 0 0
[10Y - more 0 0 0 0 0 0 0 0 0 0 0 0 0 0
Tot 0 0 0 0 0 0 0 0 0 0 0 0 0 0
[ 0 - 3M [ 0 0 0 0 0 0 0 0 0 0 0 0 0 0
[ 3M - 1Y [ 0 0 0 0 0 0 0 0 0 0 0 0 0 0
[ 1Y - 2Y [ 0 0 0 0 0 0 0 0 0 0 0 0 0 0
[ 2Y - 3Y [ 0 0 0 0 0 0 0 0 0 0 0 0 0 0
[3Y - 5Y [ 0 0 0 0 0 0 0 0 0 0 0 0 0 0
[5Y - 10Y [ 0 0 0 0 0 0 0 0 0 0 0 0 0 0
[10Y - more 0 0 0 0 0 0 0 0 0 0 0 0 0 0
Tot 0 0 0 0 0 0 0 0 0 0 0 0 0 0
[ 0 - 3M [ 0 0 0 0 0 0 0 0 0 0 0 0 0 0[ 3M - 1Y [ 0 0 0 0 0 0 0 0 0 0 0 0 0 0
[ 1Y - 2Y [ 0 0 0 0 0 0 0 0 0 0 0 0 0 0
[ 2Y - 3Y [ 0 0 0 0 0 0 0 0 0 0 0 0 0 0
[3Y - 5Y [ 0 0 0 0 0 0 0 0 0 0 0 0 0 0
[5Y - 10Y [ 0 0 0 0 0 0 0 0 0 0 0 0 0 0
[10Y - more 0 0 0 0 0 0 0 0 0 0 0 0 0 0
Tot 0 0 0 0 0 0 0 0 0 0 0 0 0 0
[ 0 - 3M [ 0 0 0 0 0 0 0 0 0 0 0 0 0 0
[ 3M - 1Y [ 0 0 0 0 0 0 0 0 0 0 0 0 0 0
[ 1Y - 2Y [ 0 0 0 0 0 0 0 0 0 0 0 0 0 0
[ 2Y - 3Y [ 0 0 0 0 0 0 0 0 0 0 0 0 0 0
[3Y - 5Y [ 0 0 0 0 0 0 0 0 0 0 0 0 0 0
[5Y - 10Y [ 0 0 0 0 0 0 0 0 0 0 0 0 0 0
[10Y - more 0 0 0 0 0 0 0 0 0 0 0 0 0 0
Tot 0 0 0 0 0 0 0 0 0 0 0 0 0 0
Latvia
Germany
Greece
Hungary
Iceland
Ireland
Italy
Croatia
Liechtenstein
http://www.economiaciudadana.org/
2014 EU-wide Stress Test - Sovereign Exposure
(mln EUR)
GROSS DIRECT LONG
EXPOSURES(accounting value gross
of provisions)
(1)
NET DIRECT POSITIONS (gross exposures (long) net of cash short
positions of sovereign debt to other counterpaties only where there
is a maturity matching)
(1)
DIRECT SOVEREIGN EXPOSURES IN DERIVATIVES (1)
Derivatives with positive fair value at Derivatives with negative fair value at Derivatives with positive fair value Derivatives with negative fair
VALUES AS OF 31/12/2013 VALUES AS OF 31/12/2013 VALUES AS OF 31/12/2013
INDIRECT SOVEREIGN EXPOSURES (3) (on and off balance sheet)

8/10/2019 Test Stress Banca Española 2014
http://slidepdf.com/reader/full/test-stress-banca-espanola-2014 74/240
Residual Maturity Country / Region
(1) (1)
of which: loans
and advances
of which: AFS
banking book
of which: FVO
(designated at fair
value through
profit&loss)
banking book
of which: Financial
assets held for
trading
(2)
Derivatives with positive fair value at
31/12/2013
Derivatives with negative fair value at
31/12/2013
Derivatives with positive fair value
at 31/12/2013
Derivatives with negative fair
value at 31/12/2013
Fair-value at
31/12/2013 (+)Notional value
Fair-value at
31/12/2013 (-)Notional value
Fair-value at
31/12/2013 (+)Notional value
Fair-value at 31/12/2013
(-)Notional value
[ 0 - 3M [ 0 0 0 0 0 0 0 0 0 0 0 0 0 0
[ 3M - 1Y [ 0 0 0 0 0 0 0 0 0 0 0 0 0 0
[ 1Y - 2Y [ 0 0 0 0 0 0 0 0 0 0 0 0 0 0
[ 2Y - 3Y [ 0 0 0 0 0 0 0 0 0 0 0 0 0 0
[3Y - 5Y [ 0 0 0 0 0 0 0 0 0 0 0 0 0 0
[5Y - 10Y [ 0 0 0 0 0 0 0 0 0 0 0 0 0 0
[10Y - more 0 0 0 0 0 0 0 0 0 0 0 0 0 0
Tot 0 0 0 0 0 0 0 0 0 0 0 0 0 0
[ 0 - 3M [ 0 0 0 0 0 0 0 0 0 0 0 0 0 0
[ 3M - 1Y [ 0 0 0 0 0 0 0 0 0 0 0 0 0 0
[ 1Y - 2Y [ 0 0 0 0 0 0 0 0 0 0 0 0 0 0
[ 2Y - 3Y [ 0 0 0 0 0 0 0 0 0 0 0 0 0 0
[3Y - 5Y [ 0 0 0 0 0 0 0 0 0 0 0 0 0 0
[5Y - 10Y [ 0 0 0 0 0 0 0 0 0 0 0 0 0 0
[10Y - more 0 0 0 0 0 0 0 0 0 0 0 0 0 0
Tot 0 0 0 0 0 0 0 0 0 0 0 0 0 0
[ 0 - 3M [ 0 0 0 0 0 0 0 0 0 0 0 0 0 0
[ 3M - 1Y [ 0 0 0 0 0 0 0 0 0 0 0 0 0 0
[ 1Y - 2Y [ 0 0 0 0 0 0 0 0 0 0 0 0 0 0
[ 2Y - 3Y [ 0 0 0 0 0 0 0 0 0 0 0 0 0 0
[3Y - 5Y [ 0 0 0 0 0 0 0 0 0 0 0 0 0 0
[5Y - 10Y [ 0 0 0 0 0 0 0 0 0 0 0 0 0 0
[10Y - more 0 0 0 0 0 0 0 0 0 0 0 0 0 0
Tot 0 0 0 0 0 0 0 0 0 0 0 0 0 0
[ 0 - 3M [ 0 0 0 0 0 0 0 0 0 0 0 0 0 0
[ 3M - 1Y [ 0 0 0 0 0 0 0 0 0 0 0 0 0 0[ 1Y - 2Y [ 0 0 0 0 0 0 0 0 0 0 0 0 0 0
[ 2Y - 3Y [ 0 0 0 0 0 0 0 0 0 0 0 0 0 0
[3Y - 5Y [ 0 0 0 0 0 0 0 0 0 0 0 0 0 0
[5Y - 10Y [ 0 0 0 0 0 0 0 0 0 0 0 0 0 0
[10Y - more 0 0 0 0 0 0 0 0 0 0 0 0 0 0
Tot 0 0 0 0 0 0 0 0 0 0 0 0 0 0
[ 0 - 3M [ 0 0 0 0 0 0 0 0 0 0 0 0 0 0
[ 3M - 1Y [ 0 0 0 0 0 0 0 0 0 0 0 0 0 0
[ 1Y - 2Y [ 0 0 0 0 0 0 0 0 0 0 0 0 0 0
[ 2Y - 3Y [ 0 0 0 0 0 0 0 0 0 0 0 0 0 0
[3Y - 5Y [ 0 0 0 0 0 0 0 0 0 0 0 0 0 0
[5Y - 10Y [ 0 0 0 0 0 0 0 0 0 0 0 0 0 0
[10Y - more 0 0 0 0 0 0 0 0 0 0 0 0 0 0
Tot 0 0 0 0 0 0 0 0 0 0 0 0 0 0
[ 0 - 3M [ 0 0 0 0 0 0 0 0 0 0 0 0 0 0
[ 3M - 1Y [ 0 0 0 0 0 0 0 0 0 0 0 0 0 0
[ 1Y - 2Y [ 0 0 0 0 0 0 0 0 0 0 0 0 0 0
[ 2Y - 3Y [ 0 0 0 0 0 0 0 0 0 0 0 0 0 0
[3Y - 5Y [ 0 0 0 0 0 0 0 0 0 0 0 0 0 0
[5Y - 10Y [ 0 0 0 0 0 0 0 0 0 0 0 0 0 0
[10Y - more 0 0 0 0 0 0 0 0 0 0 0 0 0 0
Tot 0 0 0 0 0 0 0 0 0 0 0 0 0 0
[ 0 - 3M [ 0 0 0 0 0 0 0 0 0 0 0 0 0 0
[ 3M - 1Y [ 0 0 0 0 0 0 0 0 0 0 0 0 0 0
[ 1Y - 2Y [ 0 0 0 0 0 0 0 0 0 0 0 0 0 0
[ 2Y - 3Y [ 0 0 0 0 0 0 0 0 0 0 0 0 0 0
[3Y - 5Y [ 0 0 0 0 0 0 0 0 0 0 0 0 0 0
[5Y - 10Y [ 0 0 0 0 0 0 0 0 0 0 0 0 0 0
[10Y - more 0 0 0 0 0 0 0 0 0 0 0 0 0 0
Tot 0 0 0 0 0 0 0 0 0 0 0 0 0 0
Lithuania
Luxembourg
Malta
Netherlands
Norway
Poland
Portugal
Romania
Slovakia
http://www.economiaciudadana.org/
2014 EU-wide Stress Test - Sovereign Exposure
(mln EUR)
GROSS DIRECT LONG
EXPOSURES(accounting value gross
of provisions)
(1)
NET DIRECT POSITIONS (gross exposures (long) net of cash short
positions of sovereign debt to other counterpaties only where there
is a maturity matching)
(1)
DIRECT SOVEREIGN EXPOSURES IN DERIVATIVES (1)
Derivatives with positive fair value at Derivatives with negative fair value at Derivatives with positive fair value Derivatives with negative fair
VALUES AS OF 31/12/2013 VALUES AS OF 31/12/2013 VALUES AS OF 31/12/2013
INDIRECT SOVEREIGN EXPOSURES (3) (on and off balance sheet)

8/10/2019 Test Stress Banca Española 2014
http://slidepdf.com/reader/full/test-stress-banca-espanola-2014 75/240
Residual Maturity Country / Region
(1) (1)
of which: loans
and advances
of which: AFS
banking book
of which: FVO
(designated at fair
value through
profit&loss)
banking book
of which: Financial
assets held for
trading
(2)
Derivatives with positive fair value at
31/12/2013
Derivatives with negative fair value at
31/12/2013
Derivatives with positive fair value
at 31/12/2013
Derivatives with negative fair
value at 31/12/2013
Fair-value at
31/12/2013 (+)Notional value
Fair-value at
31/12/2013 (-)Notional value
Fair-value at
31/12/2013 (+)Notional value
Fair-value at 31/12/2013
(-)Notional value
[ 0 - 3M [ 0 0 0 0 0 0 0 0 0 0 0 0 0 0
[ 3M - 1Y [ 0 0 0 0 0 0 0 0 0 0 0 0 0 0
[ 1Y - 2Y [ 0 0 0 0 0 0 0 0 0 0 0 0 0 0
[ 2Y - 3Y [ 0 0 0 0 0 0 0 0 0 0 0 0 0 0
[3Y - 5Y [ 0 0 0 0 0 0 0 0 0 0 0 0 0 0
[5Y - 10Y [ 0 0 0 0 0 0 0 0 0 0 0 0 0 0
[10Y - more 0 0 0 0 0 0 0 0 0 0 0 0 0 0
Tot 0 0 0 0 0 0 0 0 0 0 0 0 0 0
[ 0 - 3M [ 544 156 313 17 0 -57 0 0 0 0 0 0 0 0
[ 3M - 1Y [ 550 220 314 6 0 232 0 0 0 0 0 0 0 0
[ 1Y - 2Y [ 694 123 499 0 0 96 0 0 0 0 0 0 0 0
[ 2Y - 3Y [ 809 200 419 0 0 44 0 0 0 0 0 0 0 0
[3Y - 5Y [ 2,386 1,512 433 295 0 52 0 0 0 0 0 0 0 0
[5Y - 10Y [ 2,620 100 2,323 514 0 83 0 0 0 0 0 0 0 0
[10Y - more 424 30 78 0 0 -90 0 0 0 0 0 0 0 0
Tot 8,027 2,341 4,380 832 0 359 0 0 0 0 0 0 0 0
[ 0 - 3M [ 0 0 0 0 0 0 0 0 0 0 0 0 0 0
[ 3M - 1Y [ 0 0 0 0 0 0 0 0 0 0 0 0 0 0
[ 1Y - 2Y [ 0 0 0 0 0 0 0 0 0 0 0 0 0 0
[ 2Y - 3Y [ 0 0 0 0 0 0 0 0 0 0 0 0 0 0
[3Y - 5Y [ 0 0 0 0 0 0 0 0 0 0 0 0 0 0
[5Y - 10Y [ 0 0 0 0 0 0 0 0 0 0 0 0 0 0
[10Y - more 0 0 0 0 0 0 0 0 0 0 0 0 0 0
Tot 0 0 0 0 0 0 0 0 0 0 0 0 0 0
[ 0 - 3M [ 0 0 0 0 0 0 0 0 0 0 0 0 0 0
[ 3M - 1Y [ 0 0 0 0 0 0 0 0 0 0 0 0 0 0[ 1Y - 2Y [ 0 0 0 0 0 0 0 0 0 0 0 0 0 0
[ 2Y - 3Y [ 0 0 0 0 0 0 0 0 0 0 0 0 0 0
[3Y - 5Y [ 0 0 0 0 0 0 0 0 0 0 0 0 0 0
[5Y - 10Y [ 0 0 0 0 0 0 0 0 0 0 0 0 0 0
[10Y - more 0 0 0 0 0 0 0 0 0 0 0 0 0 0
Tot 0 0 0 0 0 0 0 0 0 0 0 0 0 0
[ 0 - 3M [ 0 0 0 0 0 0 0 0 0 0 0 0 0 0
[ 3M - 1Y [ 0 0 0 0 0 0 0 0 0 0 0 0 0 0
[ 1Y - 2Y [ 0 0 0 0 0 0 0 0 0 0 0 0 0 0
[ 2Y - 3Y [ 0 0 0 0 0 0 0 0 0 0 0 0 0 0
[3Y - 5Y [ 0 0 0 0 0 0 0 0 0 0 0 0 0 0
[5Y - 10Y [ 0 0 0 0 0 0 0 0 0 0 0 0 0 0
[10Y - more 0 0 0 0 0 0 0 0 0 0 0 0 0 0
Tot 0 0 0 0 0 0 0 0 0 0 0 0 0 0
[ 0 - 3M [ 0 0 0 0 0 0 0 0 0 0 0 0 0 0
[ 3M - 1Y [ 0 0 0 0 0 0 0 0 0 0 0 0 0 0
[ 1Y - 2Y [ 0 0 0 0 0 0 0 0 0 0 0 0 0 0
[ 2Y - 3Y [ 0 0 0 0 0 0 0 0 0 0 0 0 0 0
[3Y - 5Y [ 0 0 0 0 0 0 0 0 0 0 0 0 0 0
[5Y - 10Y [ 0 0 0 0 0 0 0 0 0 0 0 0 0 0
[10Y - more 0 0 0 0 0 0 0 0 0 0 0 0 0 0
Tot 0 0 0 0 0 0 0 0 0 0 0 0 0 0
[ 0 - 3M [ 0 0 0 0 0 0 0 0 0 0 0 0 0 0
[ 3M - 1Y [ 0 0 0 0 0 0 0 0 0 0 0 0 0 0
[ 1Y - 2Y [ 0 0 0 0 0 0 0 0 0 0 0 0 0 0
[ 2Y - 3Y [ 0 0 0 0 0 0 0 0 0 0 0 0 0 0
[3Y - 5Y [ 0 0 0 0 0 0 0 0 0 0 0 0 0 0
[5Y - 10Y [ 0 0 0 0 0 0 0 0 0 0 0 0 0 0
[10Y - more 0 0 0 0 0 0 0 0 0 0 0 0 0 0
Tot 0 0 0 0 0 0 0 0 0 0 0 0 0 0
[ 0 - 3M [ 0 0 0 0 0 0 0 0 0 0 0 0 0 0
[ 3M - 1Y [ 0 0 0 0 0 0 0 0 0 0 0 0 0 0
[ 1Y - 2Y [ 0 0 0 0 0 0 0 0 0 0 0 0 0 0
[ 2Y - 3Y [ 0 0 0 0 0 0 0 0 0 0 0 0 0 0
[3Y - 5Y [ 0 0 0 0 0 0 0 0 0 0 0 0 0 0
[5Y - 10Y [ 0 0 0 0 0 0 0 0 0 0 0 0 0 0
[10Y - more 0 0 0 0 0 0 0 0 0 0 0 0 0 0
Tot 0 0 0 0 0 0 0 0 0 0 0 0 0 0
[ 0 - 3M [ 0 0 0 0 0 0 0 0 0 0 0 0 0 0
[ 3M - 1Y [ 0 0 0 0 0 0 0 0 0 0 0 0 0 0
[ 1Y - 2Y [ 0 0 0 0 0 0 0 0 0 0 0 0 0 0
[ 2Y - 3Y [ 0 0 0 0 0 0 0 0 0 0 0 0 0 0
[3Y - 5Y [ 0 0 0 0 0 0 0 0 0 0 0 0 0 0
[5Y - 10Y [ 0 0 0 0 0 0 0 0 0 0 0 0 0 0
[10Y - more 0 0 0 0 0 0 0 0 0 0 0 0 0 0
Tot 0 0 0 0 0 0 0 0 0 0 0 0 0 0
Spain
Slovenia
Sweden
United Kingdom
Australia
Canada
Hong Kong
Japan
U.S.
http://www.economiaciudadana.org/
2014 EU-wide Stress Test - Sovereign Exposure
(mln EUR)
GROSS DIRECT LONG
EXPOSURES(accounting value gross
of provisions)
(1)
NET DIRECT POSITIONS (gross exposures (long) net of cash short
positions of sovereign debt to other counterpaties only where there
is a maturity matching)
(1)
DIRECT SOVEREIGN EXPOSURES IN DERIVATIVES (1)
Derivatives with positive fair value at Derivatives with negative fair value at Derivatives with positive fair value Derivatives with negative fair
VALUES AS OF 31/12/2013 VALUES AS OF 31/12/2013 VALUES AS OF 31/12/2013
INDIRECT SOVEREIGN EXPOSURES (3) (on and off balance sheet)

8/10/2019 Test Stress Banca Española 2014
http://slidepdf.com/reader/full/test-stress-banca-espanola-2014 76/240
Residual Maturity Country / Region
( ) ( )
of which: loans
and advances
of which: AFS
banking book
of which: FVO
(designated at fair
value through
profit&loss)
banking book
of which: Financial
assets held for
trading
(2)
31/12/2013 31/12/2013 at 31/12/2013 value at 31/12/2013
Fair-value at
31/12/2013 (+)Notional value
Fair-value at
31/12/2013 (-)Notional value
Fair-value at
31/12/2013 (+)Notional value
Fair-value at 31/12/2013
(-)Notional value
[ 0 - 3M [ 0 0 0 0 0 0 0 0 0 0 0 0 0 0
[ 3M - 1Y [ 0 0 0 0 0 0 0 0 0 0 0 0 0 0
[ 1Y - 2Y [ 0 0 0 0 0 0 0 0 0 0 0 0 0 0
[ 2Y - 3Y [ 0 0 0 0 0 0 0 0 0 0 0 0 0 0
[3Y - 5Y [ 0 0 0 0 0 0 0 0 0 0 0 0 0 0
[5Y - 10Y [ 0 0 0 0 0 0 0 0 0 0 0 0 0 0
[10Y - more 0 0 0 0 0 0 0 0 0 0 0 0 0 0
Tot 0 0 0 0 0 0 0 0 0 0 0 0 0 0
[ 0 - 3M [ 0 0 0 0 0 0 0 0 0 0 0 0 0 0
[ 3M - 1Y [ 0 0 0 0 0 0 0 0 0 0 0 0 0 0[ 1Y - 2Y [ 0 0 0 0 0 0 0 0 0 0 0 0 0 0
[ 2Y - 3Y [ 0 0 0 0 0 0 0 0 0 0 0 0 0 0
[3Y - 5Y [ 0 0 0 0 0 0 0 0 0 0 0 0 0 0
[5Y - 10Y [ 0 0 0 0 0 0 0 0 0 0 0 0 0 0
[10Y - more 0 0 0 0 0 0 0 0 0 0 0 0 0 0
Tot 0 0 0 0 0 0 0 0 0 0 0 0 0 0
[ 0 - 3M [ 0 0 0 0 0 0 0 0 0 0 0 0 0 0
[ 3M - 1Y [ 0 0 0 0 0 0 0 0 0 0 0 0 0 0
[ 1Y - 2Y [ 0 0 0 0 0 0 0 0 0 0 0 0 0 0
[ 2Y - 3Y [ 0 0 0 0 0 0 0 0 0 0 0 0 0 0
[3Y - 5Y [ 0 0 0 0 0 0 0 0 0 0 0 0 0 0
[5Y - 10Y [ 0 0 0 0 0 0 0 0 0 0 0 0 0 0
[10Y - more 0 0 0 0 0 0 0 0 0 0 0 0 0 0
Tot 0 0 0 0 0 0 0 0 0 0 0 0 0 0
[ 0 - 3M [ 0 0 0 0 0 0 0 0 0 0 0 0 0 0
[ 3M - 1Y [ 0 0 0 0 0 0 0 0 0 0 0 0 0 0
[ 1Y - 2Y [ 0 0 0 0 0 0 0 0 0 0 0 0 0 0
[ 2Y - 3Y [ 0 0 0 0 0 0 0 0 0 0 0 0 0 0
[3Y - 5Y [ 0 0 0 0 0 0 0 0 0 0 0 0 0 0
[5Y - 10Y [ 0 0 0 0 0 0 0 0 0 0 0 0 0 0
[10Y - more 0 0 0 0 0 0 0 0 0 0 0 0 0 0
Tot 0 0 0 0 0 0 0 0 0 0 0 0 0 0
[ 0 - 3M [ 0 0 0 0 0 0 0 0 0 0 0 0 0 0
[ 3M - 1Y [ 0 0 0 0 0 0 0 0 0 0 0 0 0 0
[ 1Y - 2Y [ 0 0 0 0 0 0 0 0 0 0 0 0 0 0
[ 2Y - 3Y [ 0 0 0 0 0 0 0 0 0 0 0 0 0 0
[3Y - 5Y [ 0 0 0 0 0 0 0 0 0 0 0 0 0 0
[5Y - 10Y [ 0 0 0 0 0 0 0 0 0 0 0 0 0 0
[10Y - more 0 0 0 0 0 0 0 0 0 0 0 0 0 0
Tot 0 0 0 0 0 0 0 0 0 0 0 0 0 0
[ 0 - 3M [ 0 0 0 0 0 0 0 0 0 0 0 0 0 0
[ 3M - 1Y [ 0 0 0 0 0 0 0 0 0 0 0 0 0 0
[ 1Y - 2Y [ 0 0 0 0 0 0 0 0 0 0 0 0 0 0
[ 2Y - 3Y [ 0 0 0 0 0 0 0 0 0 0 0 0 0 0
[3Y - 5Y [ 0 0 0 0 0 0 0 0 0 0 0 0 0 0
[5Y - 10Y [ 0 0 0 0 0 0 0 0 0 0 0 0 0 0
[10Y - more 0 0 0 0 0 0 0 0 0 0 0 0 0 0Tot 0 0 0 0 0 0 0 0 0 0 0 0 0 0
Notes and definitions
(1) The exposures reported cover only exposures to central, regional and local governments on immediate borrower basis, and do not include exposures to other counterparts with full or partial government guarantees
(2) The banks disclose the exposures in the "Financial assets held for trading" portfolio after offsetting the cash short positions having the same maturities.
(3) The exposures reported include the positions towards counterparts (other than sovereign) on sovereign credit risk (i.e. CDS, financial guarantees) booked in all the accounting portfolio (on-off balance sheet).'Irrespective of the denomination and or accounting classification of the positions the economic substance over the form must be used as a criteria for the identification of the exposures to be included in this column. This item does not include exposures to counterparts (other than sovereign) with full or partial government guarantees by central, regional and local governments
Latin America and the
Caribbean
Africa
Others
Middle East
China
Switzerland
Other advanced economies
non EEA
Other Central and eastern
Europe countries non EEA
http://www.economiaciudadana.org/

8/10/2019 Test Stress Banca Española 2014
http://slidepdf.com/reader/full/test-stress-banca-espanola-2014 77/240

8/10/2019 Test Stress Banca Española 2014
http://slidepdf.com/reader/full/test-stress-banca-espanola-2014 78/240
2014 EU-wide Stress Test
Outcome of the Stress Test based on the Restructuring plan for banks whose plan was formally agreed with the European Commission after 31 December 2013
Baseline scenario Adverse scenario

8/10/2019 Test Stress Banca Española 2014
http://slidepdf.com/reader/full/test-stress-banca-espanola-2014 79/240
(mln EUR)
As of
31/12/2013
As of
31/12/2014
As of
31/12/2015
As of
31/12/2016
As of
31/12/2014
As of
31/12/2015
As of
31/12/2016
COMMON EQUITY TIER 1 CAPITAL (net of deductions and after applying transitional adjustments)
TOTAL RISK EXPOSURE AMOUNT
COMMON EQUITY TIER 1 RATIO #DIV/0! #DIV/0! #DIV/0! #DIV/0! #DIV/0! #DIV/0! #DIV/0!
Baseline scenario Adverse scenario
http://www.economiaciudadana.org/

8/10/2019 Test Stress Banca Española 2014
http://slidepdf.com/reader/full/test-stress-banca-espanola-2014 80/240
2014 EU wide Stress Test

8/10/2019 Test Stress Banca Española 2014
http://slidepdf.com/reader/full/test-stress-banca-espanola-2014 81/240
Bank Name ES - Banco Popular Español, S.A.
LEI Code 80H66LPTVDLM0P28XF25
ES
NUK_WL_NR_XX
version
1809014
No restructuring
2014 EU-wide Stress Test
http://www.economiaciudadana.org/
Actual figures as of 31 December 2013 mln EUR, % Actual figures as of 31 December 2013 mln EUR, %
Operating profit before impairments 2,771 Operating profit before impairments 2,771
I i l fi i l d fi i l i h b ki b k 3 034 I i l fi i l d fi i l i h b ki b k 3 034
2014 EU-wide Stress Test 2014 EU-wide Stress TestSummary Baseline Scenario
ES - Banco Popular Español, S.A.
Summary Adverse Scenario
ES - Banco Popular Español, S.A.

8/10/2019 Test Stress Banca Española 2014
http://slidepdf.com/reader/full/test-stress-banca-espanola-2014 82/240
Impairment losses on financial and non-financial assets in the banking book 3,034 Impairment losses on financial and non-financial assets in the banking book 3,034
Common Equity Tier 1 capital (1) 8,481 Common Equity Tier 1 capital (1) 8,481
Total Risk Exposure (1) 84,293 Total Risk Exposure (1) 84,293
Common Equity Tier 1 ratio, % (1) 10.1% Common Equity Tier 1 ratio, % (1) 10.1%
Outcome of the adverse scenario as of 31 December 2016 mln EUR, % Outcome of the baseline scenario as of 31 December 2016 mln EUR, %
3 yr cumulative operating profit before impairments 2,867 3 yr cumulative operating profit before impairments 4,924
3 yr cumulative impairment losses on financial and non-financial assets in the banking book 5,194 3 yr cumulative impairment losses on financial and non-financial assets in the banking book 3,065
3 yr cumulative losses from the stress in the trading book 107 3 yr cumulative losses from the stress in the trading book 69
Valuation losses due to sovereign shock after tax and prudential filters 342 Common Equity Tier 1 capital (1) 9,258
Common Equity Tier 1 capital (1) 6,434 Total Risk Exposure (1) 84,664
Total Risk Exposure (1) 85,052 Common Equity Tier 1 ratio, % (1) 10.9%
Common Equity Tier 1 ratio, % (1) 7.6%
Memorandum items mln EUR
Memorandum items mln EUR Common EU wide CET1 Threshold (8.0%) 6,773
Common EU wide CET1 Threshold (5.5%) 4,678
Total amount of instruments with mandatory conversion into ordinary shares upon a fixed date in
the 2014 -2016 period (cumulative conversions) (2)773
Total Additional Tier 1 and Tier 2 instruments eligible as regulatory capital under the CRR provisions
that convert into Common Equity Tier 1 or are written down upon a trigger event (3)500
Of which: eligible instruments whose trigger is above CET1 capital ratio in the adverse
scenario (3)
0
(2) Conversions not considered for CET1 computation
(3) Excluding instruments with mandatory conversion into ordinary shares upon a fixed date in the 2014 -2016 period
(1) According to CRR/CRD4 definition transitional arrangements as per reporting date. Figures as of 31/12/2013 computed as of first day of application:
01/01/2014.
(1) According to CRR/CRD4 definition transitional arrangements as per reporting date. Figures as of 31/12/2013 computed as of first day of application:
01/01/2014.
http://www.economiaciudadana.org/
2014 EU-wide Stress TestCredit Risk
(mln EUR, %)
N o n-d ef aul t ed D e fau lt ed N o n-d ef aul t ed D e fau lt ed N o n-d ef aul t ed D e fau lt ed N o n-d ef aul t ed D e fau lt ed N o n-d ef aul t ed D e fau lt ed N o n-d ef aul t ed D e fau lt ed N o n-d ef aul t ed D e fau lt ed N o n-d ef aul t ed D e fau lt ed N o n-d ef aul t ed D e fau lt edImpairment
rate
Stocko f
ProvisionsCoverage Ratio -
Default Stock
Impairment
rate
Stocko f
Provisions
Coverage
Ratio-DefaultStock
Impairment
rate
Stocko f
Provisions
Coverage
Ratio -DefaultStock
Impairment rateStocko f
Provisions
Coverage
Ratio-DefaultStock
Impairment
rate
Stocko f
Provisions
Coverage
Ratio-DefaultStock
Impairment
rate
Stocko f
Provisions
Coverage
Ratio -DefaultStock
Central banksandcentral governments 0 0 0 0 16,120 22 0 0 0 0 281 8 0 0 0 0 1 0 0.07% 14 44.16% 0.07% 18 44.39% 0.07% 21 44.25% 0.41% 31 42.03% 0.40% 50 41.62% 0.39% 69 41.31%
Institutions 2,959 2 0 0 7,659 30 669 0 0 0 2,251 30 0 0 0 0 9 4 0.38% 45 30.70% 0.30% 67 31.94% 0.26% 85 32.43% 0.67% 66 33.72% 0.67% 114 34.72% 0.59% 155 34.99%
Corporates 10,725 588 17,571 7,511 10,946 4,830 7,989 147 12,686 1,263 9,949 5,437 120 210 337 2,828 392 3,226 1.65% 8,517 38.01% 1.08% 9,064 38.02% 0.84% 9,446 37.82% 2.02% 8,952 39.56% 1.87% 9,921 39.94% 1.49% 10,506 39.51%
Corporates -Of Which:SpecialisedLending 0 0 0 0 1,949 103 0 0 0 0 1,914 103 0 0 0 0 3 37 - 0 - - 0 - - 0 - - 0 - - 0 - - 0 -
Corporates -OfWhich:SME 1,341 230 13,428 6,811 4,972 3,293 1,101 0 9,495 1,191 4,532 3,811 25 86 297 2,499 289 2,367 - 0 - - 0 - - 0 - - 0 - - 0 - - 0 -
Retail 0 0 28,261 3,333 18,154 1,263 0 0 9,477 317 9,270 1,307 0 0 31 829 33 479 0.80% 2,079 26.52% 0.57% 2,379 26.07% 0.43% 2,596 25.61% 0.95% 2,191 27.49% 0.86% 2,639 27.20% 0.69% 2,969 26.60%
Retail -Securedon real estateproperty 63.7% 0 0 22,215 2,745 10,669 1,063 0 0 7,540 292 4,228 1,096 0 0 28 406 21 208 0.58% 1,080 16.49% 0.39% 1,234 16.51% 0.28% 1,337 16.31% 0.69% 1,147 17.38% 0.61% 1,384 17.68% 0.47% 1,550 17.46%
Retail -Securedon real estate property- Of
h i h : S E56.7% 0 0 3,241 1,145 2,772 598 0 0 1,660 135 1,186 616 0 0 17 245 11 117 1.22% 665 21.36% 0.86% 741 21.95% 0.66% 791 22.06% 1.46% 697 22.28% 1.40% 813 23.31% 1.13% 890 23.48%
Retail -Securedon real estate property- Of
h i h: n n - E65.4% 0 0 18,975 1,600 7,897 465 0 0 5,880 157 3,041 479 0 0 11 160 10 91 0.43% 414 12.87% 0.28% 493 12.75% 0.20% 546 12.50% 0.51% 449 13.73% 0.44% 571 13.82% 0.34% 659 13.58%
Retail -QualifyingRevolving 0 0 0 0 469 10 0 0 0 0 352 10 0 0 0 0 0 10 1.29% 21 68.38% 1.12% 26 65.24% 0.97% 30 62.66% 1.44% 22 69.94% 1.35% 28 67.73% 1.18% 34 65.64%
Retail -Other Retail 0 0 6,046 588 7,016 189 0 0 1,937 25 4,690 201 0 0 3 424 12 261 1.33% 978 62.25% 0.99% 1,119 58.73% 0.80% 1,228 56.30% 1.60% 1,023 62.98% 1.46% 1,226 58.82% 1.22% 1,386 55.72%
Retai l -OtherRetai l - OfWhich:SME 0 0 6,046 588 4,497 129 0 0 1,937 25 2,786 134 0 0 3 424 4 206 1.36% 846 61.76% 0.97% 960 58.02% 0.77% 1,045 55.50% 1.66% 886 62.38% 1.50% 1,056 57.84% 1.25% 1,186 54.54%
Retail -Other Retail -Of Which:non-SME 0 0 0 0 2,519 60 0 0 0 0 1,904 67 0 0 0 0 8 56 1.22% 132 66.08% 1.05% 159 63.89% 0.92% 183 61.85% 1.36% 137 67.77% 1.27% 170 66.37% 1.11% 199 64.71%
Equity 0 0 0 0 400 0 0 0 0 0 540 0 0 0 0 0 0 0 0.00% 0 - 0.00% 0 - 0.00% 0 - 0.00% 0 - 0.00% 0 - 0.00% 0 -
Securitisation 0 0 363 0 97 0 0 0 283 0 121 0 0 0 0 12 0 4
Othernon-credit obligation assets 0 0 0 0 13,506 0 0 0 0 0 14,853 0 0 0 0 0 0 0
asof 31/12/2016
ES - Banco Popular Español,S.A.
LTV %(asof
31/12/2013)
Exposure values (as of 31/12/2013) Risk exposure amounts (as of 31/12/2013) Value adjustments and provisions (as of 31/12/2013) Adverse Scenario
F-IRB A-IRB STA F-IRB A-IRB STA F-IRB A-IRB STA
BaselineScenario
as of 31/12/2014 as of 31/12/2015 as of 31/12/2016 as of 31/12/2014 as of 31/12/2015

8/10/2019 Test Stress Banca Española 2014
http://slidepdf.com/reader/full/test-stress-banca-espanola-2014 83/240
O e o c ed o ga o asse s 0 0 0 0 13,506 0 0 0 0 0 14,853 0 0 0 0 0 0 0
TOTAL 13,684 591 46,195 10,844 66,884 6,145 8,657 148 22,446 1,579 37,265 6,782 120 210 368 3,669 434 3,714 1.06% 10,654 35.07% 0.71% 11,528 34.73% 0.55% 12,148 34.32% 1.32% 11,240 36.46% 1.20% 12,724 36.39% 0.96% 13,700 35.73%
Securitisation andre-securitisations positions deductedfrom capital * 0 0 27 0 28 0 0 0 0 0 0 0
(mln EUR, %)N o n-d ef aul t ed D e fau lt ed N o n-d ef aul t ed D e fau lt ed N o n-d ef aul t ed D e fau lt ed N o n-d ef aul t ed D e fau lt ed N o n-d ef aul t ed D e fau lt ed N o n-d ef aul t ed D e fau lt ed N o n-d ef aul t ed D e fau lt ed N o n-d ef aul t ed D e fau lt ed N o n-d ef aul t ed D e fau lt ed
Impairment
rate
Stocko f
ProvisionsCoverage Ratio -
Default Stock
Impairment
rate
Stocko f
Provisions
CoverageRatio-Default
Stock
Impairment
rate
Stocko f
Provisions
CoverageRatio -Default
Stock
Impairment rateStocko f
Provisions
CoverageRatio-Default
Stock
Impairment
rate
Stocko f
Provisions
CoverageRatio-Default
Stock
Impairment
rate
Stocko f
Provisions
CoverageRatio -Default
Stock
Central banksandcentral governments 0 0 0 0 14,570 22 0 0 0 0 281 8 0 0 0 0 1 0 0.07% 14 44.17% 0.07% 18 44.41% 0.07% 21 44.26% 0.41% 31 42.04% 0.40% 50 41.63% 0.39% 69 41.32%
Institutions 2,079 2 0 0 6,980 30 520 0 0 0 2,033 30 0 0 0 0 9 4 0.40% 43 30.26% 0.32% 64 31.52% 0.27% 81 32.01% 0.72% 64 33.42% 0.72% 109 34.46% 0.64% 148 34.73%
Corporates 10,032 483 17,069 7,404 7,957 4,794 7,386 147 12,212 1,257 7,536 5,398 120 161 328 2,778 383 3,140 1.63% 8,230 37.88% 1.07% 8,726 37.97% 0.83% 9,070 37.84% 2.00% 8,644 39.46% 1.86% 9,530 40.00% 1.48% 10,055 39.67%
Corporates -Of Which:SpecialisedLending 0 0 0 0 1,613 96 0 0 0 0 1,574 96 0 0 0 0 3 35 - 0 - - 0 - - 0 - - 0 - - 0 - - 0 -
Corporates -OfWhich:SME 945 125 13,004 6,715 4,481 3,284 724 0 9,083 1,185 4,147 3,785 25 37 288 2,454 279 2,358 - 0 - - 0 - - 0 - - 0 - - 0 - - 0 -
Retail 0 0 26,634 3,034 13,846 1,148 0 0 8,855 290 6,911 1,194 0 0 30 793 32 329 0.80% 1,829 25.92% 0.57% 2,091 25.60% 0.44% 2,282 25.22% 0.95% 1,925 26.87% 0.86% 2,318 26.76% 0.70% 2,609 26.27%
Retail -Securedon real estateproperty 63.2% 0 0 20,608 2,447 8,082 973 0 0 6,924 266 2,991 1,007 0 0 27 370 20 141 0.58% 944 15.85% 0.39% 1,080 16.01% 0.28% 1,172 15.89% 0.69% 1,002 16.74% 0.61% 1,212 17.22% 0.48% 1,359 17.11%Retail -Securedon real estate property- Of
h i h : S E56.2% 0 0 3,236 1,145 2,279 592 0 0 1,657 135 938 611 0 0 17 245 11 94 1.23% 635 20.64% 0.87% 706 21.34% 0.66% 753 21.53% 1.47% 665 21.56% 1.41% 774 22.75% 1.14% 847 23.03%
Retail -Securedon real estate property- Of
h i h: n n - E65.2% 0 0 17,372 1,302 5,803 381 0 0 5,268 131 2,053 397 0 0 10 125 9 47 0.43% 309 11.61% 0.28% 374 11.68% 0.20% 419 11.53% 0.50% 337 12.47% 0.43% 438 12.79% 0.33% 512 12.69%
Retail -QualifyingRevolving 0 0 0 0 423 8 0 0 0 0 318 8 0 0 0 0 0 7 1.26% 17 70.32% 1.09% 22 66.37% 0.95% 26 63.38% 1.40% 18 71.87% 1.32% 24 68.82% 1.14% 29 66.29%
Retail -Other Retail 0 0 6,027 587 5,341 167 0 0 1,931 25 3,602 178 0 0 3 423 12 181 1.33% 867 61.53% 1.00% 989 58.20% 0.81% 1,085 55.92% 1.60% 905 62.19% 1.47% 1,082 58.28% 1.23% 1,222 55.37%
Retai l -OtherRetai l - OfWhich:SME 0 0 6,027 587 3,157 114 0 0 1,931 25 1,935 119 0 0 3 423 4 142 1.36% 758 61.10% 0.99% 857 57.61% 0.79% 933 55.26% 1.66% 792 61.67% 1.52% 941 57.45% 1.27% 1,056 54.35%
Retail -Other Retail -Of Which:non-SME 0 0 0 0 2,184 53 0 0 0 0 1,667 59 0 0 0 0 7 39 1.19% 110 65.16% 1.03% 132 62.87% 0.90% 152 60.86% 1.33% 113 66.78% 1.25% 141 65.33% 1.09% 166 63.76%
Equity 0 0 0 0 343 0 0 0 0 0 496 0 0 0 0 0 0 0 0.00% 0 - 0.00% 0 - 0.00% 0 - 0.00% 0 - 0.00% 0 - 0.00% 0 -
Securitisation 0 0 363 0 87 0 0 0 283 0 115 0 0 0 0 12 0 4
Othernon-credit obligation assets 0 0 0 0 13,385 0 0 0 0 0 14,832 0 0 0 0 0 0 0
TOTAL 12,111 485 44,067 10,438 57,169 5,994 7,907 148 21,350 1,547 32,203 6,630 120 161 358 3,583 425 3,477 1.05% 10,116 35.02% 0.71% 10,899 34.78% 0.55% 11,454 34.43% 1.31% 10,664 36.43% 1.20% 12,007 36.53% 0.96% 12,881 35.96%
Securitisation andre-securitisations positions deductedfrom capital * 0 0 27 0 26 0 0 0 0 0 0 0
(mln EUR, %)N o n-d ef aul t ed D e fau lt ed N o n-d ef aul t ed D e fau lt ed N o n-d ef aul t ed D e fau lt ed N o n-d ef aul t ed D e fau lt ed N o n-d ef aul t ed D e fau lt ed N o n-d ef aul t ed D e fau lt ed N o n-d ef aul t ed D e fau lt ed N o n-d ef aul t ed D e fau lt ed N o n-d ef aul t ed D e fau lt ed
Impairment
rate
Stocko f
Provisions
Coverage Ratio -
Default Stock
Impairment
rate
Stocko f
Provisions
CoverageRatio-Default
Stock
Impairment
rate
Stocko f
Provisions
CoverageRatio -Default
Stock
Impairment rateStocko f
Provisions
CoverageRatio-Default
Stock
Impairment
rate
Stocko f
Provisions
CoverageRatio-Default
Stock
Impairment
rate
Stocko f
Provisions
CoverageRatio -Default
Stock
Central banksandcentral governments 0 0 0 0 1,282 0 0 0 0 0 0 0 0 0 0 0 0 0 0.17% 0 40.00% 0.17% 0 40.00% 0.17% 0 40.00% 1.06% 0 40.00% 1.06% 0 40.00% 1.06% 0 40.00%
Institutions 0 0 0 0 593 0 0 0 0 0 198 0 0 0 0 0 0 0 0.57% 1 40.15% 0.45% 2 40.09% 0.38% 2 40.07% 0.93% 2 40.10% 0.95% 3 40.05% 0.85% 4 40.04%
Corporates 370 0 87 7 1,851 25 316 0 76 0 1,552 25 0 0 4 7 0 80 1.71% 137 52.59% 1.07% 164 47.16% 0.83% 183 44.13% 2.13% 149 52.92% 1.78% 191 46.22% 1.43% 222 42.73%
Corporates -Of Which:SpecialisedLending 0 0 0 0 1 60 7 0 0 0 0 1 60 7 0 0 0 0 0 2 - 0 - - 0 - - 0 - - 0 - - 0 - - 0 -
Corporates -OfWhich:SME 244 0 77 4 1,500 0 223 0 70 0 1,257 0 0 0 4 4 0 3 - 0 - - 0 - - 0 - - 0 - - 0 - - 0 -
Retail 0 0 38 4 3,599 33 0 0 13 0 2,107 33 0 0 0 1 0 138 0.87% 181 57.55% 0.59% 208 50.09% 0.45% 226 45.82% 1.05% 191 58.24% 0.89% 230 49.48% 0.72% 256 44.38%
Retail -Securedon real estateproperty 70.1% 0 0 31 4 2,117 15 0 0 11 0 1,142 15 0 0 0 0 0 61 0.55% 79 46.87% 0.36% 89 38.76% 0.26% 95 34.54% 0.65% 82 47.15% 0.56% 97 37.85% 0.44% 107 33.02%
Retail -Securedon real estate property- Of
hi h: E67.8% 0 0 2 0 362 6 0 0 1 0 248 6 0 0 0 0 0 24 1.16% 30 53.06% 0.79% 34 45.41% 0.60% 36 41.30% 1.37% 31 52.72% 1.26% 37 43.97% 1.03% 40 39.37%
Retail -Securedon real estate property- Of
h i h : n n -S E70.6% 0 0 29 4 1,754 9 0 0 10 0 895 9 0 0 0 0 0 38 0.42% 49 43.74% 0.27% 55 35.58% 0.19% 59 31.40% 0.50% 51 44.29% 0.42% 60 34.89% 0.33% 67 30.08%
Retail -QualifyingRevolving 0 0 0 0 12 0 0 0 0 0 9 0 0 0 0 0 0 1 1.33% 1 75.07% 1.14% 1 72.96% 1.00% 1 70.42% 1.48% 1 77.13% 1.39% 1 75.54% 1.21% 1 72.94%
Retail -Other Retail 0 0 7 0 1,470 18 0 0 2 0 956 18 0 0 0 0 0 76 1.33% 102 69.70% 0.92% 118 63.98% 0.71% 130 60.05% 1.62% 108 70.83% 1.37% 131 63.80% 1.13% 148 58.78%
Retai l -OtherRetai l - OfWhich:SME 0 0 7 0 1,304 15 0 0 2 0 831 15 0 0 0 0 0 64 1.34% 87 67.90% 0.90% 101 61.82% 0.69% 111 57.80% 1.65% 92 68.96% 1.38% 113 61.51% 1.13% 128 56.41%
Retail -Other Retail -Of Which:non-SME 0 0 0 0 166 3 0 0 0 0 125 3 0 0 0 0 0 12 1.25% 15 82.31% 1.07% 17 80.39% 0.93% 19 77.69% 1.39% 16 84.47% 1.29% 18 82.95% 1.12% 20 79.96%
Equity 0 0 0 0 57 0 0 0 0 0 44 0 0 0 0 0 0 0 0.00% 0 - 0.00% 0 - 0.00% 0 - 0.00% 0 - 0.00% 0 - 0.00% 0 -
Securitisation 0 0 0 0 10 0 0 0 0 0 6 0 0 0 0 0 0 0
Othernon-credit obligation assets 0 0 0 0 0 0 0 0 0 0 0 0 0 0 0 0 0 0
TOTAL 370 0 124 11 7,393 57 316 0 89 1 3,906 57 0 0 4 8 0 218 1.17% 319 55.27% 0.75% 373 48.72% 0.58% 411 45.03% 1.44% 342 55.72% 1.21% 424 47.89% 0.97% 483 43.57%
Securitisation andre-securitisations positions deductedfrom capital * 0 0 0 0 2 0 0 0 0 0 0 0
(mln EUR, %)N o n-d ef aul t ed D e fau lt ed N o n-d ef aul t ed D e fau lt ed N o n-d ef aul t ed D e fau lt ed N o n-d ef aul t ed D e fau lt ed N o n-d ef aul t ed D e fau lt ed N o n-d ef aul t ed D e fau lt ed N o n-d ef aul t ed D e fau lt ed N o n-d ef aul t ed D e fau lt ed N o n-d ef aul t ed D e fau lt ed
Impairment
rate
Stocko f
Provisions
Coverage Ratio -
Default Stock
Impairment
rate
Stocko f
Provisions
CoverageRatio-Default
Stock
Impairment
rate
Stocko f
Provisions
CoverageRatio -Default
Stock
Impairment rateStocko f
Provisions
CoverageRatio-Default
Stock
Impairment
rate
Stocko f
Provisions
CoverageRatio-Default
Stock
Impairment
rate
Stocko f
Provisions
CoverageRatio -Default
Stock
Central banksandcentral governments 0 0 0 0 0 0 0 0 0 0 0 0 0 0 0 0 0 0 - 0 - - 0 - - 0 - - 0 - - 0 - - 0 -
Institutions 0 0 0 0 0 0 0 0 0 0 0 0 0 0 0 0 0 0 - 0 - - 0 - - 0 - - 0 - - 0 - - 0 -
Corporates 0 0 0 0 0 0 0 0 0 0 0 0 0 0 0 0 0 0 - 0 - - 0 - - 0 - - 0 - - 0 - - 0 -Corporates -Of Which:SpecialisedLending 0 0 0 0 0 0 0 0 0 0 0 0 0 0 0 0 0 0 - 0 - - 0 - - 0 - - 0 - - 0 - - 0 -
Corporates -OfWhich:SME 0 0 0 0 0 0 0 0 0 0 0 0 0 0 0 0 0 0 - 0 - - 0 - - 0 - - 0 - - 0 - - 0 -
Retail 0 0 0 0 0 0 0 0 0 0 0 0 0 0 0 0 0 0 - 0 - - 0 - - 0 - - 0 - - 0 - - 0 -
Retail -Securedon real estateproperty 0.0% 0 0 0 0 0 0 0 0 0 0 0 0 0 0 0 0 0 0 - 0 - - 0 - - 0 - - 0 - - 0 - - 0 -
Retail -Securedon real estate property- Of
hi h: E0.0% 0 0 0 0 0 0 0 0 0 0 0 0 0 0 0 0 0 0 - 0 - - 0 - - 0 - - 0 - - 0 - - 0 -
Retail -Securedon real estate property- Of
h i h: n n - E0.0% 0 0 0 0 0 0 0 0 0 0 0 0 0 0 0 0 0 0 - 0 - - 0 - - 0 - - 0 - - 0 - - 0 -
Retail -QualifyingRevolving 0 0 0 0 0 0 0 0 0 0 0 0 0 0 0 0 0 0 - 0 - - 0 - - 0 - - 0 - - 0 - - 0 -
Retail -Other Retail 0 0 0 0 0 0 0 0 0 0 0 0 0 0 0 0 0 0 - 0 - - 0 - - 0 - - 0 - - 0 - - 0 -
Retai l -OtherRetai l - OfWhich:SME 0 0 0 0 0 0 0 0 0 0 0 0 0 0 0 0 0 0 - 0 - - 0 - - 0 - - 0 - - 0 - - 0 -
Retail -Other Retail -Of Which:non-SME 0 0 0 0 0 0 0 0 0 0 0 0 0 0 0 0 0 0 - 0 - - 0 - - 0 - - 0 - - 0 - - 0 -
Equity 0 0 0 0 0 0 0 0 0 0 0 0 0 0 0 0 0 0 - 0 - - 0 - - 0 - - 0 - - 0 - - 0 -
Securitisation 0 0 0 0 0 0 0 0 0 0 0 0 0 0 0 0 0 0
Othernon-credit obligation assets 0 0 0 0 0 0 0 0 0 0 0 0 0 0 0 0 0 0
TOTAL 0 0 0 0 0 0 0 0 0 0 0 0 0 0 0 0 0 0 - 0 - - 0 - - 0 - - 0 - - 0 - - 0 -
Securitisation andre-securitisations positions deductedfrom capital * 0 0 0 0 0 0 0 0 0 0 0 0
(mln EUR, %)N o n-d ef aul t ed D e fau lt ed N o n-d ef aul t ed D e fau lt ed N o n-d ef aul t ed D e fau lt ed N o n-d ef aul t ed D e fau lt ed N o n-d ef aul t ed D e fau lt ed N o n-d ef aul t ed D e fau lt ed N o n-d ef aul t ed D e fau lt ed N o n-d ef aul t ed D e fau lt ed N o n-d ef aul t ed D e fau lt ed
Impairment
rate
Stocko f
Provisions
Coverage Ratio -
Default Stock
Impairment
rate
Stocko f
Provisions
Coverage
Ratio-Default
Stock
Impairment
rate
Stocko f
Provisions
Coverage
Ratio -Default
Stock
Impairment rateStocko f
Provisions
Coverage
Ratio-Default
Stock
Impairment
rate
Stocko f
Provisions
Coverage
Ratio-Default
Stock
Impairment
rate
Stocko f
Provisions
Coverage
Ratio -Default
Stock
Central banksandcentral governments 0 0 0 0 0 0 0 0 0 0 0 0 0 0 0 0 0 0 - 0 - - 0 - - 0 - - 0 - - 0 - - 0 -
Institutions 0 0 0 0 0 0 0 0 0 0 0 0 0 0 0 0 0 0 - 0 - - 0 - - 0 - - 0 - - 0 - - 0 -
Corporates 0 0 0 0 0 0 0 0 0 0 0 0 0 0 0 0 0 0 - 0 - - 0 - - 0 - - 0 - - 0 - - 0 -
Corporates -Of Which:SpecialisedLending 0 0 0 0 0 0 0 0 0 0 0 0 0 0 0 0 0 0 - 0 - - 0 - - 0 - - 0 - - 0 - - 0 -
Corporates -OfWhich:SME 0 0 0 0 0 0 0 0 0 0 0 0 0 0 0 0 0 0 - 0 - - 0 - - 0 - - 0 - - 0 - - 0 -
Retail 0 0 0 0 0 0 0 0 0 0 0 0 0 0 0 0 0 0 - 0 - - 0 - - 0 - - 0 - - 0 - - 0 -
Retail -Securedon real estateproperty 0.0% 0 0 0 0 0 0 0 0 0 0 0 0 0 0 0 0 0 0 - 0 - - 0 - - 0 - - 0 - - 0 - - 0 -
Retail -Securedon real estate property- Of
hi h: E0.0% 0 0 0 0 0 0 0 0 0 0 0 0 0 0 0 0 0 0 - 0 - - 0 - - 0 - - 0 - - 0 - - 0 -
Retail -Securedon real estate property- Of
h i h : n n -S E0.0% 0 0 0 0 0 0 0 0 0 0 0 0 0 0 0 0 0 0 - 0 - - 0 - - 0 - - 0 - - 0 - - 0 -
Retail -QualifyingRevolving 0 0 0 0 0 0 0 0 0 0 0 0 0 0 0 0 0 0 - 0 - - 0 - - 0 - - 0 - - 0 - - 0 -
Retail -Other Retail 0 0 0 0 0 0 0 0 0 0 0 0 0 0 0 0 0 0 - 0 - - 0 - - 0 - - 0 - - 0 - - 0 -
Retai l -OtherRetai l - OfWhich:SME 0 0 0 0 0 0 0 0 0 0 0 0 0 0 0 0 0 0 - 0 - - 0 - - 0 - - 0 - - 0 - - 0 -
Retail -Other Retail -Of Which:non-SME 0 0 0 0 0 0 0 0 0 0 0 0 0 0 0 0 0 0 - 0 - - 0 - - 0 - - 0 - - 0 - - 0 -
Equity 0 0 0 0 0 0 0 0 0 0 0 0 0 0 0 0 0 0 - 0 - - 0 - - 0 - - 0 - - 0 - - 0 -
Securitisation 0 0 0 0 0 0 0 0 0 0 0 0 0 0 0 0 0 0
Othernon-credit obligation assets 0 0 0 0 0 0 0 0 0 0 0 0 0 0 0 0 0 0
TOTAL 0 0 0 0 0 0 0 0 0 0 0 0 0 0 0 0 0 0 - 0 - - 0 - - 0 - - 0 - - 0 - - 0 -Securitisation andre-securitisations positions deductedfrom capital * 0 0 0 0 0 0 0 0 0 0 0 0
(mln EUR, %)N o n-d ef aul t ed D e fau lt ed N o n-d ef aul t ed D e fau lt ed N o n-d ef aul t ed D e fau lt ed N o n-d ef aul t ed D e fau lt ed N o n-d ef aul t ed D e fau lt ed N o n-d ef aul t ed D e fau lt ed N o n-d ef aul t ed D e fau lt ed N o n-d ef aul t ed D e fau lt ed N o n-d ef aul t ed D e fau lt ed
Impairment
rate
Stocko f
Provisions
Coverage Ratio -
Default Stock
Impairment
rate
Stocko f
Provisions
CoverageRatio-Default
Stock
Impairment
rate
Stocko f
Provisions
CoverageRatio -Default
Stock
Impairment rateStocko f
Provisions
CoverageRatio-Default
Stock
Impairment
rate
Stocko f
Provisions
CoverageRatio-Default
Stock
Impairment
rate
Stocko f
Provisions
CoverageRatio -Default
Stock
Central banksandcentral governments 0 0 0 0 0 0 0 0 0 0 0 0 0 0 0 0 0 0 - 0 - - 0 - - 0 - - 0 - - 0 - - 0 -
Institutions 0 0 0 0 0 0 0 0 0 0 0 0 0 0 0 0 0 0 - 0 - - 0 - - 0 - - 0 - - 0 - - 0 -
Corporates 0 0 0 0 0 0 0 0 0 0 0 0 0 0 0 0 0 0 - 0 - - 0 - - 0 - - 0 - - 0 - - 0 -
Corporates -Of Which:SpecialisedLending 0 0 0 0 0 0 0 0 0 0 0 0 0 0 0 0 0 0 - 0 - - 0 - - 0 - - 0 - - 0 - - 0 -
Corporates -OfWhich:SME 0 0 0 0 0 0 0 0 0 0 0 0 0 0 0 0 0 0 - 0 - - 0 - - 0 - - 0 - - 0 - - 0 -
Retail 0 0 0 0 0 0 0 0 0 0 0 0 0 0 0 0 0 0 - 0 - - 0 - - 0 - - 0 - - 0 - - 0 -
Retail -Securedon real estateproperty 0.0% 0 0 0 0 0 0 0 0 0 0 0 0 0 0 0 0 0 0 - 0 - - 0 - - 0 - - 0 - - 0 - - 0 -
Retail -Securedon real estate property- Of
hi h: E0.0% 0 0 0 0 0 0 0 0 0 0 0 0 0 0 0 0 0 0 - 0 - - 0 - - 0 - - 0 - - 0 - - 0 -
Retail -Securedon real estate property- Of
h i h: n n - E0.0% 0 0 0 0 0 0 0 0 0 0 0 0 0 0 0 0 0 0 - 0 - - 0 - - 0 - - 0 - - 0 - - 0 -
Retail -QualifyingRevolving 0 0 0 0 0 0 0 0 0 0 0 0 0 0 0 0 0 0 - 0 - - 0 - - 0 - - 0 - - 0 - - 0 -
Retail -Other Retail 0 0 0 0 0 0 0 0 0 0 0 0 0 0 0 0 0 0 - 0 - - 0 - - 0 - - 0 - - 0 - - 0 -
Retai l -OtherRetai l - OfWhich:SME 0 0 0 0 0 0 0 0 0 0 0 0 0 0 0 0 0 0 - 0 - - 0 - - 0 - - 0 - - 0 - - 0 -
Retail -Other Retail -Of Which:non-SME 0 0 0 0 0 0 0 0 0 0 0 0 0 0 0 0 0 0 - 0 - - 0 - - 0 - - 0 - - 0 - - 0 -
Equity 0 0 0 0 0 0 0 0 0 0 0 0 0 0 0 0 0 0 - 0 - - 0 - - 0 - - 0 - - 0 - - 0 -
Securitisation 0 0 0 0 0 0 0 0 0 0 0 0 0 0 0 0 0 0
Othernon-credit obligation assets 0 0 0 0 0 0 0 0 0 0 0 0 0 0 0 0 0 0
TOTAL 0 0 0 0 0 0 0 0 0 0 0 0 0 0 0 0 0 0 - 0 - - 0 - - 0 - - 0 - - 0 - - 0 -Securitisation andre-securitisations positions deductedfrom capital * 0 0 0 0 0 0 0 0 0 0 0 0
as of 31/12/2016 as of 31/12/2014 as of 31/12/2015 as of 31/12/2016
Please, select the country
F-IRB A-IRB STA a s of 3 1/ 12 /2 01 4 a s of 3 1/ 12 /2 01 5LTV %(asof
31/12/2013)
Exposure values (as of 31/12/2013) Risk exposure amounts (as of 31/12/2013) Value adjustments and provisions (as of 31/12/2013) Baseline Scenario Adverse Scenario
F-IRB A-IRB STA F-IRB A-IRB STA
LTV %(asof
31/12/2013)
Exposure values (as of 31/12/2013) Risk exposure amounts (as of 31/12/2013) Value adjustments and provisions (as of 31/12/2013) Baseline Scenario Adverse Scenario
F-IRB A-IRB STA F-IRB A-IRB STA F-IRB as of 31/12/2014 as of 31/12/2015 as of 31/12/2016 A-IRB STA a so f3 1/1 2/ 20 14 a so f3 1/ 12 /2 01 5 a so f3 1/ 12 /2 01 6
LTV %(asof
31/12/2013)
Exposure values (as of 31/12/2013) Risk exposure amounts (as of 31/12/2013) Value adjustments and provisions (as of 31/12/2013) Baseline Scenario Adverse Scenario
F-IRB A-IRB STA F-IRB A-IRB STA F-IRB A-IRB a s of 3 1/ 12 /2 01 5 a s of 3 1/ 12 /2 01 6STA as of 31/12/2014 as of 31/12/2015 as of 31/12/2016 as of 31/12/2014
Risk exposureamounts (asof 31/12/2013)
Baseline Scenario Adverse Scenario
F-IRB A-IRB STA F-IRB A-IRB STA F-IRB A-IRB STA as of 31/12/2014 as of 31/12/2015 as of 31/12/2016 as of 31/12/2014 as of 31/12/2015 as of 31/12/2016
Spain
LTV %(asof
31/12/2013)
E xp os ur ev al ue s( as of 31 /1 2/ 201 3) R is k e xp os ur ea mo un ts (a so f3 1/ 12 /2 01 3) V al ue adj us tme nt sa nd pr ov is io ns (a so f3 1/1 2/ 20 13 )
AdverseScenario
F-IRB A-IRB STA F-IRB A-IRB STA F-IRB A-IRB STA as of 31/12/2014 as of 31/12/2015 as of 31/12/2016 as of 31/12/2014 as of 31/12/2015 as of 31/12/2016LTV %(asof
31/12/2013)
Exposurevalues (asof 31/12/2013)
(*)Referstothepart ofSecuritizationexposurethat isdeductedfrom capital andisnot includedinRWA
Valueadjustmentsand provisions(as of31/12/2013) BaselineScenario
(*)Referstothepart ofSecuritizationexposurethat isdeductedfrom capital andisnot includedinRWA
(*)Referstothepart ofSecuritizationexposurethat isdeductedfrom capital andisnot includedinRWA
(*)Referstothepart ofSecuritizationexposurethat isdeductedfrom capital andisnot includedinRWA
(*)Referstothepart ofSecuritizationexposurethat isdeductedfrom capital andisnot includedinRWA
(*)Referstothepart ofSecuritizationexposurethat isdeductedfrom capital andisnot includedinRWA
Portugal
Please, select the country
Please, select the country
http://www.economiaciudadana.org/
2014 EU-wide Stress TestCredit Risk
31 1 13) 31 1 13) 31 1 13)
(mln EU
R, %)N o n-d ef aul t ed D e fau lt ed N o n-d ef aul t ed D e fau lt ed N o n-d ef aul t ed D e fau lt ed N o n-d ef aul t ed D e fau lt ed N o n-d ef aul t ed D e fau lt ed N o n-d ef aul t ed D e fau lt ed N o n-d ef aul t ed D e fau lt ed N o n-d ef aul t ed D e fau lt ed N o n-d ef aul t ed D e fau lt ed
Impairment
rate
Stocko f
Provisions
Coverage Ratio -
Default Stock
Impairment
rate
Stocko f
Provisions
Coverage
Ratio-Default
Stock
Impairment
rate
Stocko f
Provisions
Coverage
Ratio -Default
Stock
Impairment rateStocko f
Provisions
Coverage
Ratio-Default
Stock
Impairment
rate
Stocko f
Provisions
Coverage
Ratio-Default
Stock
Impairment
rate
Stocko f
Provisions
Coverage
Ratio -Default
Stock
Central banksandcentral governments 0 0 0 0 0 0 0 0 0 0 0 0 0 0 0 0 0 0 - 0 - - 0 - - 0 - - 0 - - 0 - - 0 -
Institutions 0 0 0 0 0 0 0 0 0 0 0 0 0 0 0 0 0 0 - 0 - - 0 - - 0 - - 0 - - 0 - - 0 -
Corporates 0 0 0 0 0 0 0 0 0 0 0 0 0 0 0 0 0 0 - 0 - - 0 - - 0 - - 0 - - 0 - - 0 -
Corporates -Of Which:SpecialisedLending 0 0 0 0 0 0 0 0 0 0 0 0 0 0 0 0 0 0 - 0 - - 0 - - 0 - - 0 - - 0 - - 0 -
Corporates -OfWhich:SME 0 0 0 0 0 0 0 0 0 0 0 0 0 0 0 0 0 0 - 0 - - 0 - - 0 - - 0 - - 0 - - 0 -
Retail 0 0 0 0 0 0 0 0 0 0 0 0 0 0 0 0 0 0 - 0 - - 0 - - 0 - - 0 - - 0 - - 0 -
Retail -Securedon real estateproperty 0.0% 0 0 0 0 0 0 0 0 0 0 0 0 0 0 0 0 0 0 - 0 - - 0 - - 0 - - 0 - - 0 - - 0 -
Retail -Securedon real estate property- Of
hi h: E0.0% 0 0 0 0 0 0 0 0 0 0 0 0 0 0 0 0 0 0 - 0 - - 0 - - 0 - - 0 - - 0 - - 0 -
Retail -Securedon real estate property- Of
h i h: n n - E0.0% 0 0 0 0 0 0 0 0 0 0 0 0 0 0 0 0 0 0 - 0 - - 0 - - 0 - - 0 - - 0 - - 0 -
Retail -QualifyingRevolving 0 0 0 0 0 0 0 0 0 0 0 0 0 0 0 0 0 0 - 0 - - 0 - - 0 - - 0 - - 0 - - 0 -
Retail -Other Retail 0 0 0 0 0 0 0 0 0 0 0 0 0 0 0 0 0 0 - 0 - - 0 - - 0 - - 0 - - 0 - - 0 -
Retai l -OtherRetai l - OfWhich:SME 0 0 0 0 0 0 0 0 0 0 0 0 0 0 0 0 0 0 - 0 - - 0 - - 0 - - 0 - - 0 - - 0 -
Retail -Other Retail -Of Which:non-SME 0 0 0 0 0 0 0 0 0 0 0 0 0 0 0 0 0 0 - 0 - - 0 - - 0 - - 0 - - 0 - - 0 -
Equity 0 0 0 0 0 0 0 0 0 0 0 0 0 0 0 0 0 0 - 0 - - 0 - - 0 - - 0 - - 0 - - 0 -
Securitisation 0 0 0 0 0 0 0 0 0 0 0 0 0 0 0 0 0 0
Othernon-credit obligation assets 0 0 0 0 0 0 0 0 0 0 0 0 0 0 0 0 0 0
TOTAL 0 0 0 0 0 0 0 0 0 0 0 0 0 0 0 0 0 0 - 0 - - 0 - - 0 - - 0 - - 0 - - 0 -Securitisation andre-securitisations positions deductedfrom capital * 0 0 0 0 0 0 0 0 0 0 0 0
AdverseScenario
F-IRB A-IRB STA F-IRB A-IRB STA F-IRB A-IRB STA as of 31/12/2014 as of 31/12/2015 as of 31/12/2016 as of 31/12/2014 as of 31/12/2015 as of 31/12/2016LTV %(asof
31/12/2013)
E xp os ur e va lu es ( as o f 31 /1 2/ 20 13 ) R is k e xp os ur e am ou nt s (a s of 3 1/ 12 /2 01 3) Valueadjustmentsand provisions(as of31/12/2013) BaselineScenario
(*)Referstothepart ofSecuritizationexposurethat isdeductedfrom capital andisnot includedinRWA
Please, select the country

8/10/2019 Test Stress Banca Española 2014
http://slidepdf.com/reader/full/test-stress-banca-espanola-2014 84/240
(mln EUR, %)N o n-d ef aul t ed D e fau lt ed N o n-d ef aul t ed D e fau lt ed N o n-d ef aul t ed D e fau lt ed N o n-d ef aul t ed D e fau lt ed N o n-d ef aul t ed D e fau lt ed N o n-d ef aul t ed D e fau lt ed N o n-d ef aul t ed D e fau lt ed N o n-d ef aul t ed D e fau lt ed N o n-d ef aul t ed D e fau lt ed
Impairment
rate
Stocko f
Provisions
Coverage Ratio -
Default Stock
Impairment
rate
Stocko f
Provisions
Coverage
Ratio-Default
Stock
Impairment
rate
Stocko f
Provisions
Coverage
Ratio -Default
Stock
Impairment rateStocko f
Provisions
Coverage
Ratio-Default
Stock
Impairment
rate
Stocko f
Provisions
Coverage
Ratio-Default
Stock
Impairment
rate
Stocko f
Provisions
Coverage
Ratio -Default
Stock
Central banksandcentral governments 0 0 0 0 0 0 0 0 0 0 0 0 0 0 0 0 0 0 - 0 - - 0 - - 0 - - 0 - - 0 - - 0 -
Institutions 0 0 0 0 0 0 0 0 0 0 0 0 0 0 0 0 0 0 - 0 - - 0 - - 0 - - 0 - - 0 - - 0 -
Corporates 0 0 0 0 0 0 0 0 0 0 0 0 0 0 0 0 0 0 - 0 - - 0 - - 0 - - 0 - - 0 - - 0 -
Corporates -Of Which:SpecialisedLending 0 0 0 0 0 0 0 0 0 0 0 0 0 0 0 0 0 0 - 0 - - 0 - - 0 - - 0 - - 0 - - 0 -
Corporates -OfWhich:SME 0 0 0 0 0 0 0 0 0 0 0 0 0 0 0 0 0 0 - 0 - - 0 - - 0 - - 0 - - 0 - - 0 -
Retail 0 0 0 0 0 0 0 0 0 0 0 0 0 0 0 0 0 0 - 0 - - 0 - - 0 - - 0 - - 0 - - 0 -
Retail -Securedon real estateproperty 0.0% 0 0 0 0 0 0 0 0 0 0 0 0 0 0 0 0 0 0 - 0 - - 0 - - 0 - - 0 - - 0 - - 0 -
Retail -Securedon real estate property- Of
h i h : S E0.0% 0 0 0 0 0 0 0 0 0 0 0 0 0 0 0 0 0 0 - 0 - - 0 - - 0 - - 0 - - 0 - - 0 -
Retail -Securedon real estate property- Of
h i h: n n - E0.0% 0 0 0 0 0 0 0 0 0 0 0 0 0 0 0 0 0 0 - 0 - - 0 - - 0 - - 0 - - 0 - - 0 -
Retail -QualifyingRevolving 0 0 0 0 0 0 0 0 0 0 0 0 0 0 0 0 0 0 - 0 - - 0 - - 0 - - 0 - - 0 - - 0 -
Retail -Other Retail 0 0 0 0 0 0 0 0 0 0 0 0 0 0 0 0 0 0 - 0 - - 0 - - 0 - - 0 - - 0 - - 0 -
Retai l -OtherRetai l - OfWhich:SME 0 0 0 0 0 0 0 0 0 0 0 0 0 0 0 0 0 0 - 0 - - 0 - - 0 - - 0 - - 0 - - 0 -Retail -Other Retail -Of Which:non-SME 0 0 0 0 0 0 0 0 0 0 0 0 0 0 0 0 0 0 - 0 - - 0 - - 0 - - 0 - - 0 - - 0 -
Equity 0 0 0 0 0 0 0 0 0 0 0 0 0 0 0 0 0 0 - 0 - - 0 - - 0 - - 0 - - 0 - - 0 -
Securitisation 0 0 0 0 0 0 0 0 0 0 0 0 0 0 0 0 0 0
Othernon-credit obligation assets 0 0 0 0 0 0 0 0 0 0 0 0 0 0 0 0 0 0
TOTAL 0 0 0 0 0 0 0 0 0 0 0 0 0 0 0 0 0 0 - 0 - - 0 - - 0 - - 0 - - 0 - - 0 -Securitisation andre-securitisations positions deductedfrom capital * 0 0 0 0 0 0 0 0 0 0 0 0
(mln EUR, %)N o n-d ef aul t ed D e fau lt ed N o n-d ef aul t ed D e fau lt ed N o n-d ef aul t ed D e fau lt ed N o n-d ef aul t ed D e fau lt ed N o n-d ef aul t ed D e fau lt ed N o n-d ef aul t ed D e fau lt ed N o n-d ef aul t ed D e fau lt ed N o n-d ef aul t ed D e fau lt ed N o n-d ef aul t ed D e fau lt ed
Impairment
rate
Stocko f
ProvisionsCoverage Ratio -
Default Stock
Impairment
rate
Stocko f
Provisions
Coverage
Ratio-DefaultStock
Impairment
rate
Stocko f
Provisions
Coverage
Ratio -DefaultStock
Impairment rateStocko f
Provisions
Coverage
Ratio-DefaultStock
Impairment
rate
Stocko f
Provisions
Coverage
Ratio-DefaultStock
Impairment
rate
Stocko f
Provisions
Coverage
Ratio -DefaultStock
Central banksandcentral governments 0 0 0 0 0 0 0 0 0 0 0 0 0 0 0 0 0 0 - 0 - - 0 - - 0 - - 0 - - 0 - - 0 -
Institutions 0 0 0 0 0 0 0 0 0 0 0 0 0 0 0 0 0 0 - 0 - - 0 - - 0 - - 0 - - 0 - - 0 -
Corporates 0 0 0 0 0 0 0 0 0 0 0 0 0 0 0 0 0 0 - 0 - - 0 - - 0 - - 0 - - 0 - - 0 -
Corporates -Of Which:SpecialisedLending 0 0 0 0 0 0 0 0 0 0 0 0 0 0 0 0 0 0 - 0 - - 0 - - 0 - - 0 - - 0 - - 0 -
Corporates -OfWhich:SME 0 0 0 0 0 0 0 0 0 0 0 0 0 0 0 0 0 0 - 0 - - 0 - - 0 - - 0 - - 0 - - 0 -
Retail 0 0 0 0 0 0 0 0 0 0 0 0 0 0 0 0 0 0 - 0 - - 0 - - 0 - - 0 - - 0 - - 0 -
Retail -Securedon real estateproperty 0.0% 0 0 0 0 0 0 0 0 0 0 0 0 0 0 0 0 0 0 - 0 - - 0 - - 0 - - 0 - - 0 - - 0 -
Retail -Securedon real estate property- Of
hi h: E0.0% 0 0 0 0 0 0 0 0 0 0 0 0 0 0 0 0 0 0 - 0 - - 0 - - 0 - - 0 - - 0 - - 0 -
Retail -Securedon real estate property- Of
h i h: n n - E0.0% 0 0 0 0 0 0 0 0 0 0 0 0 0 0 0 0 0 0 - 0 - - 0 - - 0 - - 0 - - 0 - - 0 -
Retail -QualifyingRevolving 0 0 0 0 0 0 0 0 0 0 0 0 0 0 0 0 0 0 - 0 - - 0 - - 0 - - 0 - - 0 - - 0 -
Retail -Other Retail 0 0 0 0 0 0 0 0 0 0 0 0 0 0 0 0 0 0 - 0 - - 0 - - 0 - - 0 - - 0 - - 0 -
Retai l -OtherRetai l - OfWhich:SME 0 0 0 0 0 0 0 0 0 0 0 0 0 0 0 0 0 0 - 0 - - 0 - - 0 - - 0 - - 0 - - 0 -
Retail -Other Retail -Of Which:non-SME 0 0 0 0 0 0 0 0 0 0 0 0 0 0 0 0 0 0 - 0 - - 0 - - 0 - - 0 - - 0 - - 0 -
Equity 0 0 0 0 0 0 0 0 0 0 0 0 0 0 0 0 0 0 - 0 - - 0 - - 0 - - 0 - - 0 - - 0 -
Securitisation 0 0 0 0 0 0 0 0 0 0 0 0 0 0 0 0 0 0
Othernon-credit obligation assets 0 0 0 0 0 0 0 0 0 0 0 0 0 0 0 0 0 0
TOTAL 0 0 0 0 0 0 0 0 0 0 0 0 0 0 0 0 0 0 - 0 - - 0 - - 0 - - 0 - - 0 - - 0 -Securitisation andre-securitisations positions deductedfrom capital * 0 0 0 0 0 0 0 0 0 0 0 0
(mln EUR, %)N o n-d ef aul t ed D e fau lt ed N o n-d ef aul t ed D e fau lt ed N o n-d ef aul t ed D e fau lt ed N o n-d ef aul t ed D e fau lt ed N o n-d ef aul t ed D e fau lt ed N o n-d ef aul t ed D e fau lt ed N o n-d ef aul t ed D e fau lt ed N o n-d ef aul t ed D e fau lt ed N o n-d ef aul t ed D e fau lt ed
Impairment
rate
Stocko f
ProvisionsCoverage Ratio -
Default Stock
Impairment
rate
Stocko f
Provisions
Coverage
Ratio-DefaultStock
Impairment
rate
Stocko f
Provisions
Coverage
Ratio -DefaultStock
Impairment rateStocko f
Provisions
Coverage
Ratio-DefaultStock
Impairment
rate
Stocko f
Provisions
Coverage
Ratio-DefaultStock
Impairment
rate
Stocko f
Provisions
Coverage
Ratio -DefaultStock
Central banksandcentral governments 0 0 0 0 0 0 0 0 0 0 0 0 0 0 0 0 0 0 - 0 - - 0 - - 0 - - 0 - - 0 - - 0 -
Institutions 0 0 0 0 0 0 0 0 0 0 0 0 0 0 0 0 0 0 - 0 - - 0 - - 0 - - 0 - - 0 - - 0 -
Corporates 0 0 0 0 0 0 0 0 0 0 0 0 0 0 0 0 0 0 - 0 - - 0 - - 0 - - 0 - - 0 - - 0 -
Corporates -Of Which:SpecialisedLending 0 0 0 0 0 0 0 0 0 0 0 0 0 0 0 0 0 0 - 0 - - 0 - - 0 - - 0 - - 0 - - 0 -
Corporates -OfWhich:SME 0 0 0 0 0 0 0 0 0 0 0 0 0 0 0 0 0 0 - 0 - - 0 - - 0 - - 0 - - 0 - - 0 -
Retail 0 0 0 0 0 0 0 0 0 0 0 0 0 0 0 0 0 0 - 0 - - 0 - - 0 - - 0 - - 0 - - 0 -
Retail -Securedon real estateproperty 0.0% 0 0 0 0 0 0 0 0 0 0 0 0 0 0 0 0 0 0 - 0 - - 0 - - 0 - - 0 - - 0 - - 0 -
Retail -Securedon real estate property- Of h i h : S E
0.0% 0 0 0 0 0 0 0 0 0 0 0 0 0 0 0 0 0 0 - 0 - - 0 - - 0 - - 0 - - 0 - - 0 -Retail -Securedon real estate property- Of
h i h: n n - E0.0% 0 0 0 0 0 0 0 0 0 0 0 0 0 0 0 0 0 0 - 0 - - 0 - - 0 - - 0 - - 0 - - 0 -
Retail -QualifyingRevolving 0 0 0 0 0 0 0 0 0 0 0 0 0 0 0 0 0 0 - 0 - - 0 - - 0 - - 0 - - 0 - - 0 -
Retail -Other Retail 0 0 0 0 0 0 0 0 0 0 0 0 0 0 0 0 0 0 - 0 - - 0 - - 0 - - 0 - - 0 - - 0 -
Retai l -OtherRetai l - OfWhich:SME 0 0 0 0 0 0 0 0 0 0 0 0 0 0 0 0 0 0 - 0 - - 0 - - 0 - - 0 - - 0 - - 0 -
Retail -Other Retail -Of Which:non-SME 0 0 0 0 0 0 0 0 0 0 0 0 0 0 0 0 0 0 - 0 - - 0 - - 0 - - 0 - - 0 - - 0 -
Equity 0 0 0 0 0 0 0 0 0 0 0 0 0 0 0 0 0 0 - 0 - - 0 - - 0 - - 0 - - 0 - - 0 -
Securitisation 0 0 0 0 0 0 0 0 0 0 0 0 0 0 0 0 0 0
Othernon-credit obligation assets 0 0 0 0 0 0 0 0 0 0 0 0 0 0 0 0 0 0
TOTAL 0 0 0 0 0 0 0 0 0 0 0 0 0 0 0 0 0 0 - 0 - - 0 - - 0 - - 0 - - 0 - - 0 -
Securitisation andre-securitisations positions deductedfrom capital * 0 0 0 0 0 0 0 0 0 0 0 0
(mln EUR, %)N o n-d ef aul t ed D e fau lt ed N o n-d ef aul t ed D e fau lt ed N o n-d ef aul t ed D e fau lt ed N o n-d ef aul t ed D e fau lt ed N o n-d ef aul t ed D e fau lt ed N o n-d ef aul t ed D e fau lt ed N o n-d ef aul t ed D e fau lt ed N o n-d ef aul t ed D e fau lt ed N o n-d ef aul t ed D e fau lt ed
Impairment
rate
Stocko f
ProvisionsCoverage Ratio -
Default Stock
Impairment
rate
Stocko f
Provisions
Coverage
Ratio-DefaultStock
Impairment
rate
Stocko f
Provisions
Coverage
Ratio -DefaultStock
Impairment rateStocko f
Provisions
Coverage
Ratio-DefaultStock
Impairment
rate
Stocko f
Provisions
Coverage
Ratio-DefaultStock
Impairment
rate
Stocko f
Provisions
Coverage
Ratio -DefaultStock
Central banksandcentral governments 0 0 0 0 0 0 0 0 0 0 0 0 0 0 0 0 0 0 - 0 - - 0 - - 0 - - 0 - - 0 - - 0 -
Institutions 0 0 0 0 0 0 0 0 0 0 0 0 0 0 0 0 0 0 - 0 - - 0 - - 0 - - 0 - - 0 - - 0 -
Corporates 0 0 0 0 0 0 0 0 0 0 0 0 0 0 0 0 0 0 - 0 - - 0 - - 0 - - 0 - - 0 - - 0 -
Corporates -Of Which:SpecialisedLending 0 0 0 0 0 0 0 0 0 0 0 0 0 0 0 0 0 0 - 0 - - 0 - - 0 - - 0 - - 0 - - 0 -
Corporates -OfWhich:SME 0 0 0 0 0 0 0 0 0 0 0 0 0 0 0 0 0 0 - 0 - - 0 - - 0 - - 0 - - 0 - - 0 -
Retail 0 0 0 0 0 0 0 0 0 0 0 0 0 0 0 0 0 0 - 0 - - 0 - - 0 - - 0 - - 0 - - 0 -
Retail -Securedon real estateproperty 0.0% 0 0 0 0 0 0 0 0 0 0 0 0 0 0 0 0 0 0 - 0 - - 0 - - 0 - - 0 - - 0 - - 0 -
Retail -Securedon real estate property- Of
hi h: E0.0% 0 0 0 0 0 0 0 0 0 0 0 0 0 0 0 0 0 0 - 0 - - 0 - - 0 - - 0 - - 0 - - 0 -
Retail -Securedon real estate property- Of
h i h : n n -S E0.0% 0 0 0 0 0 0 0 0 0 0 0 0 0 0 0 0 0 0 - 0 - - 0 - - 0 - - 0 - - 0 - - 0 -
Retail -QualifyingRevolving 0 0 0 0 0 0 0 0 0 0 0 0 0 0 0 0 0 0 - 0 - - 0 - - 0 - - 0 - - 0 - - 0 -
Retail -Other Retail 0 0 0 0 0 0 0 0 0 0 0 0 0 0 0 0 0 0 - 0 - - 0 - - 0 - - 0 - - 0 - - 0 -
Retai l -OtherRetai l - OfWhich:SME 0 0 0 0 0 0 0 0 0 0 0 0 0 0 0 0 0 0 - 0 - - 0 - - 0 - - 0 - - 0 - - 0 -
Retail -Other Retail -Of Which:non-SME 0 0 0 0 0 0 0 0 0 0 0 0 0 0 0 0 0 0 - 0 - - 0 - - 0 - - 0 - - 0 - - 0 -
Equity 0 0 0 0 0 0 0 0 0 0 0 0 0 0 0 0 0 0 - 0 - - 0 - - 0 - - 0 - - 0 - - 0 -
Securitisation 0 0 0 0 0 0 0 0 0 0 0 0 0 0 0 0 0 0
Othernon-credit obligation assets 0 0 0 0 0 0 0 0 0 0 0 0 0 0 0 0 0 0
TOTAL 0 0 0 0 0 0 0 0 0 0 0 0 0 0 0 0 0 0 - 0 - - 0 - - 0 - - 0 - - 0 - - 0 -
Securitisation andre-securitisations positions deductedfrom capital * 0 0 0 0 0 0 0 0 0 0 0 0
LTV %(asof
31/12/2013)
Exposure values (as of 31/12/2013) Risk exposure amounts (as of 31/12/2013) Value adjustments and provisions (as of 31/12/2013) Baseline Scenario Adverse Scenario
F-IRB A-IRB STA F-IRB A-IRB STA as of 31/12/2016 as of 31/12/2014 as of 31/12/2015 as of 31/12/2016F-IRB A-IRB STA a s of 3 1/ 12 /2 01 4 a s of 3 1/ 12 /2 01 5
LTV %(asof
31/12/2013)
Exposure values (as of 31/12/2013) Risk exposure amounts (as of 31/12/2013) Value adjustments and provisions (as of 31/12/2013) Baseline Scenario Adverse Scenario
F-IRB A-IRB STA F-IRB A-IRB STA F-IRB as of 31/12/2014 as of 31/12/2015 as of 31/12/2016 A-IRB STA a so f3 1/1 2/ 20 14 a so f3 1/ 12 /2 01 5 a so f3 1/ 12 /2 01 6
LTV %(asof
31/12/2013)
Exposure values (as of 31/12/2013) Risk exposure amounts (as of 31/12/2013) Value adjustments and provisions (as of 31/12/2013) Baseline Scenario Adverse Scenario
F-IRB A-IRB STA F-IRB A-IRB STA F-IRB A-IRB a s of 3 1/ 12 /2 01 5 a s of 3 1/ 12 /2 01 6STA as of 31/12/2014 as of 31/12/2015 as of 31/12/2016 as of 31/12/2014
AdverseScenario
F-IRB A-IRB STA F-IRB A-IRB STA F-IRB A-IRB STA as of 31/12/2014 as of 31/12/2015 as of 31/12/2016 as of 31/12/2014 as of 31/12/2015 as of 31/12/2016LTV %(asof
31/12/2013)
E xp os ur ev al ue s( as of 31 /1 2/ 201 3) R is k e xp os ur ea mo un ts (a so f3 1/ 12 /2 01 3) V al ue adj us tme nt sa nd pr ov is io ns (a so f3 1/1 2/ 20 13 ) BaselineScenario
(*)Referstothepart ofSecuritizationexposurethat isdeductedfrom capital andisnot includedinRWA
(*)Referstothepart ofSecuritizationexposurethat isdeductedfrom capital andisnot includedinRWA
(*)Referstothepart ofSecuritizationexposurethat isdeductedfrom capital andisnot includedinRWA
(*)Referstothepart ofSecuritizationexposurethat isdeductedfrom capital andisnot includedinRWA
Please, select the country
Please, select the country
Please, select the country
Please, select the country
http://www.economiaciudadana.org/
2014 EU-wide Stress Test P&L
(mln EUR) 31/12/2014 31/12/2015 31/12/2016 31/12/2014 31/12/2015 31/12/2016
Net interest income 2,410 2,250 2,392 2,367 1,861 2,103 2,004
Net trading income 55 69 75 36 57 68
31/12/2013
Baseline Scenario Adverse Scenario

8/10/2019 Test Stress Banca Española 2014
http://slidepdf.com/reader/full/test-stress-banca-espanola-2014 85/240
of which trading losses from stress scenarios -34 -21 -14 -53 -32 -21
Other operating income 1,298 212 212 212 -82 -82 -82
Operating profit before impairments 2,771 1,544 1,705 1,674 813 1,079 975
Impairment of financial assets (-) -1,890 -1,551 -883 -631 -2,142 -1,501 -992
Impairment of financial assets other than instruments designated at fair value
through P&L (-)-1,890 -1,551 -883 -631 -2,142 -1,501 -992
Impairment Financial assets designated at fair value through P&L (-) 0 0 0 0 0 0 0
Impairment on non financial assets (-) -1,144 0 0 0 -416 -86 -57
Operating profit after impairments from stress scenarios -264 -7 822 1,043 -1,745 -507 -75
Other Income and expenses 78 30 36 39 4 36 137
Pre-Tax profit -185 23 857 1,082 -1,741 -472 62
Tax 53 -1 -244 -311 511 155 3
Net income -132 22 613 771 -1,230 -316 66
Attributable to owners of the parent -135 22 613 771 -1,230 -316 66
of which carried over to capital through retained earnings -175 21 577 724 -1,230 -316 66
of which distributed as dividends 40 1 37 46 0 0 0
In the figures above, the original (official published) 2013 P&L figures may have been adjusted as part of the ECB Comprehensive Assessment join-up calculation.
http://www.economiaciudadana.org/

8/10/2019 Test Stress Banca Española 2014
http://slidepdf.com/reader/full/test-stress-banca-espanola-2014 86/240
(mln EUR) as of 31/12/2013 31/12/2014 31/12/2015 31/12/2016 31/12/2014 31/12/2015 31/12/2016
Banking Book 465
Trading Book (excl. correlation trading positions under CRM) 0
Correlation Trading Portfolio (CRM) 0
Total 465
2014 EU-wide Stress TestBaseline scenario Adverse scenario
Exposure values
Securitisation

8/10/2019 Test Stress Banca Española 2014
http://slidepdf.com/reader/full/test-stress-banca-espanola-2014 87/240
Banking Book 404 599 717 776 797 1,033 1,163
Trading Book (excl. correlation trading positions under CRM) 0 0 0 0 0 0 0
Total 404 599 717 776 797 1,033 1,163
Hold to Maturity porfolio 16 27 37 47 33 49 65
Available for Sale porfolio 0 0 0 0 0 0 0
Held for trading portfolio
Total 16 27 37 47 33 49 65
Impairments
Risk exposure values
http://www.economiaciudadana.org/
2014 EU-wide Stress Test - Sovereign Exposure
(mln EUR)
GROSS DIRECT LONG
EXPOSURES (accounting value grossof provisions)
(1)
NET DIRECT POSITIONS (gross exposures (long) net of cash short
positions of sovereign debt to other counterpaties only where there
is a maturity matching)
(1)
DIRECT SOVEREIGN EXPOSURES IN DERIVATIVES (1)
Derivatives with positive fair value at
31/12/2013
Derivatives with negative fair value at
31/12/2013
Derivatives with positive fair value
at 31/12/2013
Derivatives with negative fair
value at 31/12/2013
VALUES AS OF 31/12/2013 VALUES AS OF 31/12/2013 VALUES AS OF 31/12/2013
INDIRECT SOVEREIGN EXPOSURES (3) (on and off balance sheet)

8/10/2019 Test Stress Banca Española 2014
http://slidepdf.com/reader/full/test-stress-banca-espanola-2014 88/240
[ 0 - 3M [ 0 0 0 0 0 0 0 0 0 0 0 0 0 0[ 3M - 1Y [ 0 0 0 0 0 0 0 0 0 0 0 0 0 0[ 1Y - 2Y [ 0 0 0 0 0 0 0 0 0 0 0 0 0 0[ 2Y - 3Y [ 0 0 0 0 0 0 0 0 0 0 0 0 0 0[3Y - 5Y [ 0 0 0 0 0 0 0 0 0 0 0 0 0 0[5Y - 10Y [ 0 0 0 0 0 0 0 0 0 0 0 0 0 0[10Y - more 0 0 0 0 0 0 0 0 0 0 0 0 0 0
Tot 0 0 0 0 0 0 0 0 0 0 0 0 0 0[ 0 - 3M [ 0 0 0 0 0 0 0 0 0 0 0 0 0 0
[ 3M - 1Y [ 0 0 0 0 0 0 0 0 0 0 0 0 0 0[ 1Y - 2Y [ 0 0 0 0 0 0 0 0 0 0 0 0 0 0[ 2Y - 3Y [ 0 0 0 0 0 0 0 0 0 0 0 0 0 0[3Y - 5Y [ 0 0 0 0 0 0 0 0 0 0 0 0 0 0[5Y - 10Y [ 0 0 0 0 0 0 0 0 0 0 0 0 0 0[10Y - more 0 0 0 0 0 0 0 0 0 0 0 0 0 0
Tot 0 0 0 0 0 0 0 0 0 0 0 0 0 0[ 0 - 3M [ 0 0 0 0 0 0 0 0 0 0 0 0 0 0
[ 3M - 1Y [ 0 0 0 0 0 0 0 0 0 0 0 0 0 0
[ 1Y - 2Y [ 0 0 0 0 0 0 0 0 0 0 0 0 0 0[ 2Y - 3Y [ 0 0 0 0 0 0 0 0 0 0 0 0 0 0[3Y - 5Y [ 0 0 0 0 0 0 0 0 0 0 0 0 0 0[5Y - 10Y [ 0 0 0 0 0 0 0 0 0 0 0 0 0 0[10Y - more 0 0 0 0 0 0 0 0 0 0 0 0 0 0
Tot 0 0 0 0 0 0 0 0 0 0 0 0 0 0[ 0 - 3M [ 0 0 0 0 0 0 0 0 0 0 0 0 0 0
[ 3M - 1Y [ 0 0 0 0 0 0 0 0 0 0 0 0 0 0[ 1Y - 2Y [ 0 0 0 0 0 0 0 0 0 0 0 0 0 0[ 2Y - 3Y [ 0 0 0 0 0 0 0 0 0 0 0 0 0 0[3Y - 5Y [ 0 0 0 0 0 0 0 0 0 0 0 0 0 0[5Y - 10Y [ 0 0 0 0 0 0 0 0 0 0 0 0 0 0[10Y - more 0 0 0 0 0 0 0 0 0 0 0 0 0 0
Tot 0 0 0 0 0 0 0 0 0 0 0 0 0 0[ 0 - 3M [ 0 0 0 0 0 0 0 0 0 0 0 0 0 0
[ 3M - 1Y [ 0 0 0 0 0 0 0 0 0 0 0 0 0 0
[ 1Y - 2Y [ 0 0 0 0 0 0 0 0 0 0 0 0 0 0[ 2Y - 3Y [ 0 0 0 0 0 0 0 0 0 0 0 0 0 0[3Y - 5Y [ 0 0 0 0 0 0 0 0 0 0 0 0 0 0[5Y - 10Y [ 0 0 0 0 0 0 0 0 0 0 0 0 0 0[10Y - more 0 0 0 0 0 0 0 0 0 0 0 0 0 0
Tot 0 0 0 0 0 0 0 0 0 0 0 0 0 0[ 0 - 3M [ 0 0 0 0 0 0 0 0 0 0 0 0 0 0
[ 3M - 1Y [ 0 0 0 0 0 0 0 0 0 0 0 0 0 0[ 1Y - 2Y [ 0 0 0 0 0 0 0 0 0 0 0 0 0 0[ 2Y - 3Y [ 0 0 0 0 0 0 0 0 0 0 0 0 0 0[3Y - 5Y [ 0 0 0 0 0 0 0 0 0 0 0 0 0 0[5Y - 10Y [ 0 0 0 0 0 0 0 0 0 0 0 0 0 0[10Y - more 0 0 0 0 0 0 0 0 0 0 0 0 0 0
Tot 0 0 0 0 0 0 0 0 0 0 0 0 0 0
Residual Maturi ty Country / Region
of which: loansand advances
of which: AFSbanking book
of which: FVO(designated at fair
value throughprofit&loss)
banking book
of which: Financialassets held for
trading
(2)
Fair-value at31/12/2013 (+)
Notional valueFair-value at
31/12/2013 (-)Notional value
Fair-value at31/12/2013 (+)
Notional valueFair-value at 31/12/2013
(-)
Austria
Belgium
Bulgaria
Cyprus
Notional value
Czech Republic
Denmark
Estonia
Finland
France
http://www.economiaciudadana.org/
2014 EU-wide Stress Test - Sovereign Exposure
(mln EUR)
GROSS DIRECT LONG
EXPOSURES (accounting value grossof provisions)
(1)
NET DIRECT POSITIONS (gross exposures (long) net of cash short
positions of sovereign debt to other counterpaties only where there
is a maturity matching)
(1)
DIRECT SOVEREIGN EXPOSURES IN DERIVATIVES (1)
Derivatives with positive fair value at
31/12/2013
Derivatives with negative fair value at
31/12/2013
Derivatives with positive fair value
at 31/12/2013
Derivatives with negative fair
value at 31/12/2013
VALUES AS OF 31/12/2013 VALUES AS OF 31/12/2013 VALUES AS OF 31/12/2013
INDIRECT SOVEREIGN EXPOSURES (3) (on and off balance sheet)
8/10/2019 Test Stress Banca Española 2014
http://slidepdf.com/reader/full/test-stress-banca-espanola-2014 89/240
Residual Maturi ty Country / Region
of which: loansand advances
of which: AFSbanking book
of which: FVO(designated at fair
value throughprofit&loss)
banking book
of which: Financialassets held for
trading
(2)
Fair-value at31/12/2013 (+)
Notional valueFair-value at
31/12/2013 (-)Notional value
Fair-value at31/12/2013 (+)
Notional valueFair-value at 31/12/2013
(-)Notional value
[ 0 - 3M [ 0 0 0 0 0 0 0 0 0 0 0 0 0 0[ 3M - 1Y [ 0 0 0 0 0 0 0 0 0 0 0 0 0 0[ 1Y - 2Y [ 0 0 0 0 0 0 0 0 0 0 0 0 0 0[ 2Y - 3Y [ 0 0 0 0 0 0 0 0 0 0 0 0 0 0[3Y - 5Y [ 0 0 0 0 0 0 0 0 0 0 0 0 0 0[5Y - 10Y [ 0 0 0 0 0 0 0 0 0 0 0 0 0 0[10Y - more 0 0 0 0 0 0 0 0 0 0 0 0 0 0
Tot 0 0 0 0 0 0 0 0 0 0 0 0 0 0[ 0 - 3M [ 0 0 0 0 0 0 0 0 0 0 0 0 0 0
[ 3M - 1Y [ 0 0 0 0 0 0 0 0 0 0 0 0 0 0[ 1Y - 2Y [ 0 0 0 0 0 0 0 0 0 0 0 0 0 0[ 2Y - 3Y [ 0 0 0 0 0 0 0 0 0 0 0 0 0 0[3Y - 5Y [ 0 0 0 0 0 0 0 0 0 0 0 0 0 0[5Y - 10Y [ 0 0 0 0 0 0 0 0 0 0 0 0 0 0[10Y - more 0 0 0 0 0 0 0 0 0 0 0 0 0 0
Tot 0 0 0 0 0 0 0 0 0 0 0 0 0 0[ 0 - 3M [ 0 0 0 0 0 0 0 0 0 0 0 0 0 0
[ 3M - 1Y [ 0 0 0 0 0 0 0 0 0 0 0 0 0 0[ 1Y - 2Y [ 0 0 0 0 0 0 0 0 0 0 0 0 0 0[ 2Y - 3Y [ 0 0 0 0 0 0 0 0 0 0 0 0 0 0[3Y - 5Y [ 0 0 0 0 0 0 0 0 0 0 0 0 0 0[5Y - 10Y [ 0 0 0 0 0 0 0 0 0 0 0 0 0 0[10Y - more 0 0 0 0 0 0 0 0 0 0 0 0 0 0
Tot 0 0 0 0 0 0 0 0 0 0 0 0 0 0[ 0 - 3M [ 0 0 0 0 0 0 0 0 0 0 0 0 0 0
[ 3M - 1Y [ 0 0 0 0 0 0 0 0 0 0 0 0 0 0
[ 1Y - 2Y [ 0 0 0 0 0 0 0 0 0 0 0 0 0 0[ 2Y - 3Y [ 0 0 0 0 0 0 0 0 0 0 0 0 0 0[3Y - 5Y [ 0 0 0 0 0 0 0 0 0 0 0 0 0 0[5Y - 10Y [ 0 0 0 0 0 0 0 0 0 0 0 0 0 0[10Y - more 0 0 0 0 0 0 0 0 0 0 0 0 0 0
Tot 0 0 0 0 0 0 0 0 0 0 0 0 0 0[ 0 - 3M [ 0 0 0 0 0 0 0 0 0 0 0 0 0 0
[ 3M - 1Y [ 0 0 0 0 0 0 0 0 0 0 0 0 0 0[ 1Y - 2Y [ 0 0 0 0 0 0 0 0 0 0 0 0 0 0[ 2Y - 3Y [ 0 0 0 0 0 0 0 0 0 0 0 0 0 0[3Y - 5Y [ 0 0 0 0 0 0 0 0 0 0 0 0 0 0[5Y - 10Y [ 0 0 0 0 0 0 0 0 0 0 0 0 0 0[10Y - more 0 0 0 0 0 0 0 0 0 0 0 0 0 0
Tot 0 0 0 0 0 0 0 0 0 0 0 0 0 0[ 0 - 3M [ 0 0 0 0 0 0 0 0 0 0 0 0 0 0
[ 3M - 1Y [ 0 0 0 0 0 0 0 0 0 0 0 0 0 0[ 1Y - 2Y [ 0 0 0 0 0 0 0 0 0 0 0 0 0 0[ 2Y - 3Y [ 0 0 0 0 0 0 0 0 0 0 0 0 0 0[3Y - 5Y [ 0 0 0 0 0 0 0 0 0 0 0 0 0 0[5Y - 10Y [ 0 0 0 0 0 0 0 0 0 0 0 0 0 0[10Y - more 0 0 0 0 0 0 0 0 0 0 0 0 0 0
Tot 0 0 0 0 0 0 0 0 0 0 0 0 0 0[ 0 - 3M [ 0 0 0 0 0 0 0 0 0 0 0 0 0 0
[ 3M - 1Y [ 223 0 223 223 0 0 0 0 0 0 0 0 0 0[ 1Y - 2Y [ 0 0 0 0 0 0 0 0 0 0 0 0 0 0[ 2Y - 3Y [ 0 0 0 0 0 0 0 0 0 0 0 0 0 0[3Y - 5Y [ 0 0 0 0 0 0 0 0 0 0 0 0 0 0[5Y - 10Y [ 0 0 0 0 0 0 0 0 0 0 0 0 0 0[10Y - more 0 0 0 0 0 0 0 0 0 0 0 0 0 0
Tot 223 0 223 223 0 0 0 0 0 0 0 0 0 0[ 0 - 3M [ 0 0 0 0 0 0 0 0 0 0 0 0 0 0
[ 3M - 1Y [ 0 0 0 0 0 0 0 0 0 0 0 0 0 0
[ 1Y - 2Y [ 0 0 0 0 0 0 0 0 0 0 0 0 0 0[ 2Y - 3Y [ 0 0 0 0 0 0 0 0 0 0 0 0 0 0[3Y - 5Y [ 0 0 0 0 0 0 0 0 0 0 0 0 0 0[5Y - 10Y [ 0 0 0 0 0 0 0 0 0 0 0 0 0 0[10Y - more 0 0 0 0 0 0 0 0 0 0 0 0 0 0
Tot 0 0 0 0 0 0 0 0 0 0 0 0 0 0[ 0 - 3M [ 0 0 0 0 0 0 0 0 0 0 0 0 0 0
[ 3M - 1Y [ 0 0 0 0 0 0 0 0 0 0 0 0 0 0[ 1Y - 2Y [ 0 0 0 0 0 0 0 0 0 0 0 0 0 0[ 2Y - 3Y [ 0 0 0 0 0 0 0 0 0 0 0 0 0 0[3Y - 5Y [ 0 0 0 0 0 0 0 0 0 0 0 0 0 0[5Y - 10Y [ 0 0 0 0 0 0 0 0 0 0 0 0 0 0[10Y - more 0 0 0 0 0 0 0 0 0 0 0 0 0 0
Tot 0 0 0 0 0 0 0 0 0 0 0 0 0 0
Latvia
Germany
Greece
Hungary
Iceland
Ireland
Italy
Croatia
Liechtenstein
http://www.economiaciudadana.org/
2014 EU-wide Stress Test - Sovereign Exposure
(mln EUR)
GROSS DIRECT LONG
EXPOSURES (accounting value grossof provisions)
(1)
NET DIRECT POSITIONS (gross exposures (long) net of cash short
positions of sovereign debt to other counterpaties only where there
is a maturity matching)
(1)
DIRECT SOVEREIGN EXPOSURES IN DERIVATIVES (1)
Derivatives with positive fair value at
31/12/2013
Derivatives with negative fair value at
31/12/2013
Derivatives with positive fair value
at 31/12/2013
Derivatives with negative fair
value at 31/12/2013
VALUES AS OF 31/12/2013 VALUES AS OF 31/12/2013 VALUES AS OF 31/12/2013
INDIRECT SOVEREIGN EXPOSURES (3) (on and off balance sheet)

8/10/2019 Test Stress Banca Española 2014
http://slidepdf.com/reader/full/test-stress-banca-espanola-2014 90/240
Residual Maturi ty Country / Region
of which: loansand advances
of which: AFSbanking book
of which: FVO(designated at fair
value throughprofit&loss)
banking book
of which: Financialassets held for
trading
(2)
Fair-value at31/12/2013 (+)
Notional valueFair-value at
31/12/2013 (-)Notional value
Fair-value at31/12/2013 (+)
Notional valueFair-value at 31/12/2013
(-)Notional value
[ 0 - 3M [ 0 0 0 0 0 0 0 0 0 0 0 0 0 0[ 3M - 1Y [ 0 0 0 0 0 0 0 0 0 0 0 0 0 0[ 1Y - 2Y [ 0 0 0 0 0 0 0 0 0 0 0 0 0 0[ 2Y - 3Y [ 0 0 0 0 0 0 0 0 0 0 0 0 0 0[3Y - 5Y [ 0 0 0 0 0 0 0 0 0 0 0 0 0 0[5Y - 10Y [ 0 0 0 0 0 0 0 0 0 0 0 0 0 0[10Y - more 0 0 0 0 0 0 0 0 0 0 0 0 0 0
Tot 0 0 0 0 0 0 0 0 0 0 0 0 0 0[ 0 - 3M [ 0 0 0 0 0 0 0 0 0 0 0 0 0 0
[ 3M - 1Y [ 0 0 0 0 0 0 0 0 0 0 0 0 0 0[ 1Y - 2Y [ 0 0 0 0 0 0 0 0 0 0 0 0 0 0[ 2Y - 3Y [ 0 0 0 0 0 0 0 0 0 0 0 0 0 0[3Y - 5Y [ 0 0 0 0 0 0 0 0 0 0 0 0 0 0[5Y - 10Y [ 0 0 0 0 0 0 0 0 0 0 0 0 0 0[10Y - more 0 0 0 0 0 0 0 0 0 0 0 0 0 0
Tot 0 0 0 0 0 0 0 0 0 0 0 0 0 0[ 0 - 3M [ 0 0 0 0 0 0 0 0 0 0 0 0 0 0
[ 3M - 1Y [ 0 0 0 0 0 0 0 0 0 0 0 0 0 0[ 1Y - 2Y [ 0 0 0 0 0 0 0 0 0 0 0 0 0 0[ 2Y - 3Y [ 0 0 0 0 0 0 0 0 0 0 0 0 0 0[3Y - 5Y [ 0 0 0 0 0 0 0 0 0 0 0 0 0 0[5Y - 10Y [ 0 0 0 0 0 0 0 0 0 0 0 0 0 0[10Y - more 0 0 0 0 0 0 0 0 0 0 0 0 0 0
Tot 0 0 0 0 0 0 0 0 0 0 0 0 0 0[ 0 - 3M [ 0 0 0 0 0 0 0 0 0 0 0 0 0 0
[ 3M - 1Y [ 0 0 0 0 0 0 0 0 0 0 0 0 0 0
[ 1Y - 2Y [ 0 0 0 0 0 0 0 0 0 0 0 0 0 0[ 2Y - 3Y [ 0 0 0 0 0 0 0 0 0 0 0 0 0 0[3Y - 5Y [ 0 0 0 0 0 0 0 0 0 0 0 0 0 0[5Y - 10Y [ 0 0 0 0 0 0 0 0 0 0 0 0 0 0[10Y - more 0 0 0 0 0 0 0 0 0 0 0 0 0 0
Tot 0 0 0 0 0 0 0 0 0 0 0 0 0 0[ 0 - 3M [ 0 0 0 0 0 0 0 0 0 0 0 0 0 0
[ 3M - 1Y [ 0 0 0 0 0 0 0 0 0 0 0 0 0 0[ 1Y - 2Y [ 0 0 0 0 0 0 0 0 0 0 0 0 0 0[ 2Y - 3Y [ 0 0 0 0 0 0 0 0 0 0 0 0 0 0[3Y - 5Y [ 0 0 0 0 0 0 0 0 0 0 0 0 0 0[5Y - 10Y [ 0 0 0 0 0 0 0 0 0 0 0 0 0 0[10Y - more 0 0 0 0 0 0 0 0 0 0 0 0 0 0
Tot 0 0 0 0 0 0 0 0 0 0 0 0 0 0[ 0 - 3M [ 0 0 0 0 0 0 0 0 0 0 0 0 0 0
[ 3M - 1Y [ 0 0 0 0 0 0 0 0 0 0 0 0 0 0[ 1Y - 2Y [ 0 0 0 0 0 0 0 0 0 0 0 0 0 0[ 2Y - 3Y [ 0 0 0 0 0 0 0 0 0 0 0 0 0 0[3Y - 5Y [ 0 0 0 0 0 0 0 0 0 0 0 0 0 0[5Y - 10Y [ 0 0 0 0 0 0 0 0 0 0 0 0 0 0[10Y - more 0 0 0 0 0 0 0 0 0 0 0 0 0 0
Tot 0 0 0 0 0 0 0 0 0 0 0 0 0 0[ 0 - 3M [ 0 0 0 0 0 0 0 0 0 0 0 0 0 0
[ 3M - 1Y [ 0 0 0 0 0 0 0 0 0 0 0 0 0 0[ 1Y - 2Y [ 0 0 0 0 0 0 0 0 0 0 0 0 0 0[ 2Y - 3Y [ 0 0 0 0 0 0 0 0 0 0 0 0 0 0[3Y - 5Y [ 0 0 0 0 0 0 0 0 0 0 0 0 0 0[5Y - 10Y [ 38 0 38 38 0 0 0 0 0 0 0 0 0 0[10Y - more 0 0 0 0 0 0 0 0 0 0 0 0 0 0
Tot 38 0 38 38 0 0 0 0 0 0 0 0 0 0[ 0 - 3M [ 0 0 0 0 0 0 0 0 0 0 0 0 0 0
[ 3M - 1Y [ 0 0 0 0 0 0 0 0 0 0 0 0 0 0
[ 1Y - 2Y [ 0 0 0 0 0 0 0 0 0 0 0 0 0 0[ 2Y - 3Y [ 0 0 0 0 0 0 0 0 0 0 0 0 0 0[3Y - 5Y [ 0 0 0 0 0 0 0 0 0 0 0 0 0 0[5Y - 10Y [ 0 0 0 0 0 0 0 0 0 0 0 0 0 0[10Y - more 0 0 0 0 0 0 0 0 0 0 0 0 0 0
Tot 0 0 0 0 0 0 0 0 0 0 0 0 0 0[ 0 - 3M [ 0 0 0 0 0 0 0 0 0 0 0 0 0 0
[ 3M - 1Y [ 0 0 0 0 0 0 0 0 0 0 0 0 0 0[ 1Y - 2Y [ 0 0 0 0 0 0 0 0 0 0 0 0 0 0[ 2Y - 3Y [ 0 0 0 0 0 0 0 0 0 0 0 0 0 0[3Y - 5Y [ 0 0 0 0 0 0 0 0 0 0 0 0 0 0[5Y - 10Y [ 0 0 0 0 0 0 0 0 0 0 0 0 0 0[10Y - more 0 0 0 0 0 0 0 0 0 0 0 0 0 0
Tot 0 0 0 0 0 0 0 0 0 0 0 0 0 0
Lithuania
Luxembourg
Malta
Netherlands
Norway
Poland
Portugal
Romania
Slovakia
http://www.economiaciudadana.org/
2014 EU-wide Stress Test - Sovereign Exposure
(mln EUR)
GROSS DIRECT LONG
EXPOSURES (accounting value grossof provisions)
(1)
NET DIRECT POSITIONS (gross exposures (long) net of cash short
positions of sovereign debt to other counterpaties only where there
is a maturity matching)
(1)
DIRECT SOVEREIGN EXPOSURES IN DERIVATIVES (1)
Derivatives with positive fair value at
31/12/2013
Derivatives with negative fair value at
31/12/2013
Derivatives with positive fair value
at 31/12/2013
Derivatives with negative fair
value at 31/12/2013
VALUES AS OF 31/12/2013 VALUES AS OF 31/12/2013 VALUES AS OF 31/12/2013
INDIRECT SOVEREIGN EXPOSURES (3) (on and off balance sheet)

8/10/2019 Test Stress Banca Española 2014
http://slidepdf.com/reader/full/test-stress-banca-espanola-2014 91/240
Residual Maturi ty Country / Region
of which: loansand advances
of which: AFSbanking book
of which: FVO(designated at fair
value throughprofit&loss)
banking book
of which: Financialassets held for
trading
(2)
Fair-value at31/12/2013 (+)
Notional valueFair-value at
31/12/2013 (-)Notional value
Fair-value at31/12/2013 (+)
Notional valueFair-value at 31/12/2013
(-)Notional value
[ 0 - 3M [ 0 0 0 0 0 0 0 0 0 0 0 0 0 0[ 3M - 1Y [ 0 0 0 0 0 0 0 0 0 0 0 0 0 0[ 1Y - 2Y [ 0 0 0 0 0 0 0 0 0 0 0 0 0 0[ 2Y - 3Y [ 0 0 0 0 0 0 0 0 0 0 0 0 0 0[3Y - 5Y [ 0 0 0 0 0 0 0 0 0 0 0 0 0 0[5Y - 10Y [ 0 0 0 0 0 0 0 0 0 0 0 0 0 0[10Y - more 0 0 0 0 0 0 0 0 0 0 0 0 0 0
Tot 0 0 0 0 0 0 0 0 0 0 0 0 0 0[ 0 - 3M [ 1,149 1,019 1,149 130 0 0 0 0 0 0 0 0 0 0
[ 3M - 1Y [ 445 75 445 352 0 18 0 0 0 0 0 0 0 0[ 1Y - 2Y [ 191 154 191 37 0 0 0 0 0 0 0 0 0 0[ 2Y - 3Y [ 940 72 940 868 0 0 0 0 0 0 0 0 0 0[3Y - 5Y [ 2,029 194 2,029 1,835 0 0 0 0 0 0 0 0 0 0[5Y - 10Y [ 3,607 229 3,607 3,379 0 0 0 0 0 0 0 0 0 0[10Y - more 1,794 46 1,794 1,748 0 0 0 0 0 0 0 0 0 0
Tot 10,157 1,790 10,157 8,349 0 18 0 0 0 0 0 0 0 0[ 0 - 3M [ 0 0 0 0 0 0 0 0 0 0 0 0 0 0
[ 3M - 1Y [ 0 0 0 0 0 0 0 0 0 0 0 0 0 0[ 1Y - 2Y [ 0 0 0 0 0 0 0 0 0 0 0 0 0 0[ 2Y - 3Y [ 0 0 0 0 0 0 0 0 0 0 0 0 0 0[3Y - 5Y [ 0 0 0 0 0 0 0 0 0 0 0 0 0 0[5Y - 10Y [ 0 0 0 0 0 0 0 0 0 0 0 0 0 0[10Y - more 0 0 0 0 0 0 0 0 0 0 0 0 0 0
Tot 0 0 0 0 0 0 0 0 0 0 0 0 0 0[ 0 - 3M [ 0 0 0 0 0 0 0 0 0 0 0 0 0 0
[ 3M - 1Y [ 0 0 0 0 0 0 0 0 0 0 0 0 0 0
[ 1Y - 2Y [ 0 0 0 0 0 0 0 0 0 0 0 0 0 0[ 2Y - 3Y [ 0 0 0 0 0 0 0 0 0 0 0 0 0 0[3Y - 5Y [ 0 0 0 0 0 0 0 0 0 0 0 0 0 0[5Y - 10Y [ 0 0 0 0 0 0 0 0 0 0 0 0 0 0[10Y - more 0 0 0 0 0 0 0 0 0 0 0 0 0 0
Tot 0 0 0 0 0 0 0 0 0 0 0 0 0 0[ 0 - 3M [ 0 0 0 0 0 0 0 0 0 0 0 0 0 0
[ 3M - 1Y [ 0 0 0 0 0 0 0 0 0 0 0 0 0 0[ 1Y - 2Y [ 0 0 0 0 0 0 0 0 0 0 0 0 0 0[ 2Y - 3Y [ 0 0 0 0 0 0 0 0 0 0 0 0 0 0[3Y - 5Y [ 0 0 0 0 0 0 0 0 0 0 0 0 0 0[5Y - 10Y [ 0 0 0 0 0 0 0 0 0 0 0 0 0 0[10Y - more 0 0 0 0 0 0 0 0 0 0 0 0 0 0
Tot 0 0 0 0 0 0 0 0 0 0 0 0 0 0[ 0 - 3M [ 0 0 0 0 0 0 0 0 0 0 0 0 0 0
[ 3M - 1Y [ 0 0 0 0 0 0 0 0 0 0 0 0 0 0
[ 1Y - 2Y [ 0 0 0 0 0 0 0 0 0 0 0 0 0 0[ 2Y - 3Y [ 0 0 0 0 0 0 0 0 0 0 0 0 0 0[3Y - 5Y [ 0 0 0 0 0 0 0 0 0 0 0 0 0 0[5Y - 10Y [ 0 0 0 0 0 0 0 0 0 0 0 0 0 0[10Y - more 0 0 0 0 0 0 0 0 0 0 0 0 0 0
Tot 0 0 0 0 0 0 0 0 0 0 0 0 0 0[ 0 - 3M [ 0 0 0 0 0 0 0 0 0 0 0 0 0 0
[ 3M - 1Y [ 0 0 0 0 0 0 0 0 0 0 0 0 0 0[ 1Y - 2Y [ 0 0 0 0 0 0 0 0 0 0 0 0 0 0[ 2Y - 3Y [ 0 0 0 0 0 0 0 0 0 0 0 0 0 0[3Y - 5Y [ 2 0 2 2 0 0 0 0 0 0 0 0 0 0[5Y - 10Y [ 9 0 9 9 0 0 0 0 0 0 0 0 0 0[10Y - more 22 0 22 22 0 0 0 0 0 0 0 0 0 0
Tot 33 0 33 33 0 0 0 0 0 0 0 0 0 0
Spain
Slovenia
Sweden
United Kingdom
Australia
Canada
Hong Kong
Japan
U.S.
http://www.economiaciudadana.org/
2014 EU-wide Stress Test - Sovereign Exposure
(mln EUR)
GROSS DIRECT LONG
EXPOSURES (accounting value grossof provisions)
(1)
NET DIRECT POSITIONS (gross exposures (long) net of cash short
positions of sovereign debt to other counterpaties only where there
is a maturity matching)
(1)
DIRECT SOVEREIGN EXPOSURES IN DERIVATIVES (1)
Derivatives with positive fair value at
31/12/2013
Derivatives with negative fair value at
31/12/2013
Derivatives with positive fair value
at 31/12/2013
Derivatives with negative fair
value at 31/12/2013
VALUES AS OF 31/12/2013 VALUES AS OF 31/12/2013 VALUES AS OF 31/12/2013
INDIRECT SOVEREIGN EXPOSURES (3) (on and off balance sheet)

8/10/2019 Test Stress Banca Española 2014
http://slidepdf.com/reader/full/test-stress-banca-espanola-2014 92/240
Residual Maturi ty Country / Region
of which: loansand advances
of which: AFSbanking book
of which: FVO(designated at fair
value throughprofit&loss)
banking book
of which: Financialassets held for
trading
(2)
Fair-value at31/12/2013 (+)
Notional valueFair-value at
31/12/2013 (-)Notional value
Fair-value at31/12/2013 (+)
Notional valueFair-value at 31/12/2013
(-)Notional value
[ 0 - 3M [ 0 0 0 0 0 0 0 0 0 0 0 0 0 0[ 3M - 1Y [ 0 0 0 0 0 0 0 0 0 0 0 0 0 0[ 1Y - 2Y [ 0 0 0 0 0 0 0 0 0 0 0 0 0 0[ 2Y - 3Y [ 0 0 0 0 0 0 0 0 0 0 0 0 0 0[3Y - 5Y [ 0 0 0 0 0 0 0 0 0 0 0 0 0 0[5Y - 10Y [ 0 0 0 0 0 0 0 0 0 0 0 0 0 0[10Y - more 0 0 0 0 0 0 0 0 0 0 0 0 0 0
Tot 0 0 0 0 0 0 0 0 0 0 0 0 0 0[ 0 - 3M [ 0 0 0 0 0 0 0 0 0 0 0 0 0 0
[ 3M - 1Y [ 0 0 0 0 0 0 0 0 0 0 0 0 0 0[ 1Y - 2Y [ 0 0 0 0 0 0 0 0 0 0 0 0 0 0[ 2Y - 3Y [ 0 0 0 0 0 0 0 0 0 0 0 0 0 0[3Y - 5Y [ 0 0 0 0 0 0 0 0 0 0 0 0 0 0[5Y - 10Y [ 0 0 0 0 0 0 0 0 0 0 0 0 0 0[10Y - more 0 0 0 0 0 0 0 0 0 0 0 0 0 0
Tot 0 0 0 0 0 0 0 0 0 0 0 0 0 0[ 0 - 3M [ 0 0 0 0 0 0 0 0 0 0 0 0 0 0
[ 3M - 1Y [ 0 0 0 0 0 0 0 0 0 0 0 0 0 0
[ 1Y - 2Y [ 0 0 0 0 0 0 0 0 0 0 0 0 0 0[ 2Y - 3Y [ 0 0 0 0 0 0 0 0 0 0 0 0 0 0[3Y - 5Y [ 0 0 0 0 0 0 0 0 0 0 0 0 0 0[5Y - 10Y [ 0 0 0 0 0 0 0 0 0 0 0 0 0 0[10Y - more 0 0 0 0 0 0 0 0 0 0 0 0 0 0
Tot 0 0 0 0 0 0 0 0 0 0 0 0 0 0[ 0 - 3M [ 0 0 0 0 0 0 0 0 0 0 0 0 0 0
[ 3M - 1Y [ 0 0 0 0 0 0 0 0 0 0 0 0 0 0[ 1Y - 2Y [ 0 0 0 0 0 0 0 0 0 0 0 0 0 0[ 2Y - 3Y [ 0 0 0 0 0 0 0 0 0 0 0 0 0 0[3Y - 5Y [ 0 0 0 0 0 0 0 0 0 0 0 0 0 0[5Y - 10Y [ 0 0 0 0 0 0 0 0 0 0 0 0 0 0[10Y - more 0 0 0 0 0 0 0 0 0 0 0 0 0 0
Tot 0 0 0 0 0 0 0 0 0 0 0 0 0 0[ 0 - 3M [ 0 0 0 0 0 0 0 0 0 0 0 0 0 0
[ 3M - 1Y [ 0 0 0 0 0 0 0 0 0 0 0 0 0 0
[ 1Y - 2Y [ 0 0 0 0 0 0 0 0 0 0 0 0 0 0[ 2Y - 3Y [ 0 0 0 0 0 0 0 0 0 0 0 0 0 0[3Y - 5Y [ 0 0 0 0 0 0 0 0 0 0 0 0 0 0[5Y - 10Y [ 0 0 0 0 0 0 0 0 0 0 0 0 0 0[10Y - more 0 0 0 0 0 0 0 0 0 0 0 0 0 0
Tot 0 0 0 0 0 0 0 0 0 0 0 0 0 0
Notes and definitions(1) The exposures reported cover only exposures to central, regional and local governments on immediate borrower basis, and do not include exposures to other counterparts with full or partial government guarantees(2) The banks disclose the exposures in the "Financial assets held for trading" portfolio after offsetting the cash short positions having the same maturities.(3) The exposures reported include the positions towards counterparts (other than sovereign) on sovereign credit risk (i.e. CDS, financial guarantees) booked in all the accounting portfolio (on-off balance sheet).
'Irrespective of the denomination and or accounting classification of the positions the economic substance over the form must be used as a criteria for the identification of the exposures to be included in this column. This item does not include exposures to counterparts (other than sovereign) with full or partial government guarantees by central, regional and local governments
Latin America and the
Caribbean
Africa
Others
Middle East
China
Switzerland
Other advanced economies
non EEA
Other Central and eastern
Europe countries non EEA
http://www.economiaciudadana.org/
2014 EU-wide Stress TestCapital
(mln EUR) CRR/ CRDIV DEFINITION OFCAPITAL Asof 31/12/2013 Asof 31/12/2014 Asof 31/12/2015 Asof 31/12/2016 Asof 31/12/2014 Asof 31/12/2015 Asof 31/12/2016 COREP CODE REGULATION
A OWN FUNDS 8,844 9,184 9,446 9,751 8,127 7,494 7,001 C A 1 {1 } A rt ic le s 4 (1 18 ) a nd 7 2 of C R R
A.1COMMON EQUITYTIER 1CAPITAL(net ofdeductionsand after applying
transitional adjustments)8,481 8,616 8,864 9,258 7,555 6,903 6,434 C A 1 {1 .1 .1 } A rt ic le 5 0 of C R R
A.1.1Capitalinstruments eligible asCET1Capital (including share premium and net own
capitalinstruments)8,038 8,038 8,038 8,038 8,038 8,038 8,038 CA1 {1.1.1.1}
Articles 26(1) points (a) and(b), 27to29, 36(1) point (f)
and42ofCRR
A.1.1.1 Ofwhich: CET1instruments subscribed byGovernment 0 0 0 0 0 0 0 - -
A.1.2 Retained earnings -156 -136 441 1,165 -1,386 -1,703 -1,637 CA1 {1.1.1.2} Articles 26(1) point (c), 26(2) and36(1) points (a) and(l)
o fCRR
A.1.3 Accumulated other comprehensive income -368 -421 -453 -474 -921 -723 -830 CA1 {1.1.1.3} Articles 4(100), 26(1) point (d) and 36 (1) point (l) of CRR
A.1.3.1 Of which:arising from unrealised gains/lossesfrom Sovereign exposure in AFS
portfolio-381 -381 -381 -381 -797 -517 -570 - -
A.1.3.2 Ofwhich: arising from unrealised gains/lossesfrom the rest ofAFS portfolio 12 -40 -72 -93 -124 -205 -260 - -
Baseline Scenario Adverse Scenario

8/10/2019 Test Stress Banca Española 2014
http://slidepdf.com/reader/full/test-stress-banca-espanola-2014 93/240
A.1.4 Other Reserves 3,603 3,603 3,603 3,603 3,603 3,603 3,603 CA1 {1.1.1.4} Articles 4(117) and 26(1) po int (e) of CRR
A.1.5 Fundsfor general banking risk 0 0 0 0 0 0 0 CA1 {1.1.1.5} Articles 4(112), 26(1) point (f) and 36 (1) po int (l) o f CRR
A.1.6 Minorityin terest given recognition in CET1capital 5 5 5 5 5 5 5 CA1 {1.1.1.7} Article 84 of CRR
A.1.7 Adjustmentsto CET1due to prudentialfilters excluding those from unrealised
gains/lossesfrom AFS portfolio0 0 0 0 0 0 0 CA1 {1.1.1.9} Articles 32 to 35 of and 36 (1) point (l) of CRR
A.1.8 Adjustmentsto CET1due to prudentialfilters from unrealised gains/lossesfrom
Sovereign Exposure in AFS portfolio305 305 228 152 638 310 228 -
A.1.9 (-)Intangible assets (including Goodwill) -3,251 -3,251 -3,251 -3,251 -2,979 -2,998 -3,112CA1{1.1.1.10+1.1.1.11}
Articles 4(113), 36(1) point (b) and37ofCRR. Articles4(115), 36(1) point (b) and37point (a) o fCCR
A.1.10(-)DTAs that relyon future profitabilityand don ot arise from temporary
differencesnet ofassociated DTLs-669 -669 -669 -669 -669 -669 -669 CA1 {1.1.1.12} Articles 36(1) point (c) and 38 of CRR
A.1.11 (-)IRB shortfall ofcredit risk adjustmentsto expected losses -837 -304 -249 -215 -296 -219 -168 CA1 {1.1.1.13} Articles 36(1) point (d), 40 and 159 of CRR
A.1.12 (-)Defined benefit pension fund assets 0 0 0 0 0 0 0 CA1 {1.1.1.14} Articles 4(109), 36(1) point (e) and 41 of CRR
A.1.13 (-)Reciprocal crossholdings in CET1Capital 0 0 0 0 0 0 0 CA1 {1.1.1.15} Articles 4(122), 36(1) point (g) and 44 of CRR
A.1.14 (-)Excess deduction from AT1itemsover AT1 Capital 0 0 0 0 0 0 0 CA1 {1.1.1.16} Article 36(1) po int (j) of CRR
A.1.15(-)Deductions related toassetswhich can alternativelybe subject toa 1.250%risk
weight-55 -40 -30 -26 -24 -5 -1
CA1{1.1.1.17to
1.1.1.21}
Articles 4(36), 36(1) point (k) (i) and89to91 ofCRR;
Articles 36(1) point (k) (ii), 243(1) point (b), 244(1) point
(b) and258of CRR;Articles 36(1) point k) (iii) and379(3)
ofCRR; Articles 36(1) point k) (iv) and153(8) ofCRRand
A.1.15.1 Ofwhich: from securitisation positions(-) -55 -40 -30 -26 -24 -5 -1 CA1 {1.1.1.18.1} Articles 36(1) point (k) (ii), 243(1) point (b), 244(1) point
(b) and258ofCRR
A.1.16(-)HoldingsofCET1capitalinstrumentsoffinancialsector entitieswhere the
institiution doesnot have a significant investment0 0 0 0 0 0 0 CA1 {1.1.1.22}
Articles 4(27), 36(1) point (h);43to 46, 49(2) and(3) and
79ofCRR
A.1.17(-)Deductible DTAs that relyon future profitability and arise from temporary
differences0 0 0 0 0 0 0 CA1 {1.1.1.23}
Articles 36(1) point (c) and38;A rticles 48(1) point (a) and
48(2) ofCRR
A.1.18(-)HoldingsofCET1capitalinstrumentsoffinancialsector entitieswhere the
institiution hasa significant investment0 0 0 0 0 0 0 CA1 {1.1.1.24}
Articles 4(27);36(1) point (i);43, 45;47;48(1) point (b);
49(1) to(3) and79of CRR
A.1.19 (-)Amount exceding the 17.65%threshold 0 0 0 0 0 0 0 CA1 {1.1.1.25} Article 470 of CRR
A.1.20 Transitionaladjustments 1,866 1,485 1,199 928 1,545 1,261 975CA1{1.1.1.6+ 1.1.8+
1.1.26}-
A.1.20.1 Transitionaladjustments due tograndfathered CET1 Capitalinstruments (+/-) 0 0 0 0 0 0 0 CA1 {1.1.1.6}
Articles 483(1) to(3), and484to 487ofCR R
A.1.20.2 Transitionaladjustments due toadditional minorityinterests (+/-) 34 34 25 16 34 25 16 CA1 {1.1.1.8}
Articles 479and480 ofCRR
A.1.20.3Other transitionaladjustments toCET1 Capitalexcl. adjustmentsfor Sovereign
exposure in AFS (+/-)1,832 1,451 1,174 911 1,510 1,236 959 CA1 {1.1.1.26}
Articles 469to472, 478and 481ofCR R
A.2 ADDITIONAL TIER 1CAPITAL (net ofdeductionsand after transitional
adjustments)0 0 0 4 0 0 69 C A 1 {1 .1 .2 } A rt ic le 6 1 of C R R
A.2.1 Ofwhich: (+)Other existing support government measures 0 0 0 0 0 0 0 - -
A.3 TIER1 CAPITAL(netof deductionsandafter transitional adjustments) 8,481 8,616 8,864 9,262 7,555 6,903 6,503 C A1 { 1. 1} A rt ic le 2 5 of C RR
A.4 TIER2 CAPITAL(netof deductionsandafter transitional adjustments) 362 568 582 489 572 591 498 C A1 { 1. 2} A rt ic le 7 1 of C RR
B T OT AL R IS K EX PO SU RE A MO UN T 84,293 84,488 84,605 84,664 84,686 84,921 85,052 C A 2 {1 } A rt ic le s 92 (3 ), 95 , 9 6 an d 98 o f C RR
B.1ofwhich: stemming from exposuresthat fallbelow the 10%/ 15%limits for
CET1deduction (+)2,127 0 0 0 0 0 0
Articles 36(1) points (a) and(i);Article 38and Article 48of
CRR
B . 2 o fwhich:s tem ming f rom from CVAcap ita l requirements (+) 181 0 0 0 0 0 0 Article 381to386 ofCRR
B.3ofwhich: stemming from higher asset correlation parameter against exposures
tolarge financialinstitutions under IRB the IRB approachesto credit risk(+)368 0 0 0 0 0 0 Articles 153(2) ofCRR
B.4ofwhich: stemming from the application ofthe supporting factor toincrease
lending toSMEs(-)-226 0 0 0 0 0 0 Recital (44) ofCRR
B.5
ofwhich: stemming from the effect ofexposuresthat were previously part of
RiskExposure amount and receive a deduction treatment under CRR/CRDIV (-
)
0 0 0 0 0 0 0 -
B . 6 o fwhich:o the rs s ubje c t t o the d is cre t ion o fNa t ionalCom pe tent Author i t ie s 0 0 0 0 0 0 0 Article 124to164 ofCRR
C. 1 Common Equ ity Ti er 1 Cap i ta l rat io 10.06% 10.20% 10.48% 10.93% 8.92% 8.13% 7.56% CA3 {1} -
C .2 T ie r 1 C ap it al ra ti o 10.06% 10.20% 10.48% 10.94% 8.92% 8.13% 7.65% CA3 {3} -
C .3 T ot al C ap it al r at io 10.49% 10.87% 11.16% 11.52% 9.60% 8.82% 8.23% CA3 {5} -
D Common Equ ity Ti er 1 Cap i ta l Th r es h ol d 6,759 6,768 6,773 4,658 4,671 4,678
ETotalamount ofinstruments with mandatoryconversion intoordinary sharesupon
a fixed date in the 2014-2016period (cumulative conversions) (1)125 773 773 125 773 773
F
TotalAdditionalTier 1 and Tier 2instrumentseligible asregulatorycapitalunder
the CRR provisionsthat convert intoCommon EquityTier 1 or are written downupon a trigger event (2)
500 500 500
F.1Ofwhich: eligible instrumentswhose trigger isabove CET1capital ratioin the
adverse scenario(2)0 0 0
G F u ll y L oad ed Common Eq ui ty Ti er 1 Cap i ta l r ati o (3 ) 9.84% 6.42%
(1)Conversionsnot considered for CET1 computation (2)Excluding instrumentsincluded in E (3)Memorandum item based on a fullyimplemented CRR/CRD IV definition of Common EquityTier 1 capitalincluding 60%ofunrealised gains/lossesfrom Sovereign Exposure in AFS portfolio
Memorandumitems
OWN FUNDS
OWN FUNDSREQUIREMENTS
CAPITALRATIOS (%) -
Transitional period
http://www.economiaciudadana.org/
2014 EU-wide Stress Test - Restructuring scenarios
(mln EUR)
Effects of mandatory restructuring plans publicly announced before 31 December 2013 and formally agreed with the European Commission.
Baseline scenario Adverse scenarioNarrative description of the transactions. (type, date of
completion/commitment, portfolios, subsidiaries, branches)CET1 impact
Risk exposure
amount impactCET1 impact
Risk exposure
amount impact

8/10/2019 Test Stress Banca Española 2014
http://slidepdf.com/reader/full/test-stress-banca-espanola-2014 94/240
(mln EUR)
2013 0 0
2014 0 0 0 0
2015 0 0 0 0
2016 0 0 0 0
Total 0 0 0 0
amount impact amount impact
http://www.economiaciudadana.org/
2014 EU-wide Stress Test
Outcome of the Stress Test based on the Restructuring plan for banks whose plan was formally agreed with the European Commission after 31 December 2013
(mln EUR)
As of
31/12/2013
As of
31/12/2014
As of
31/12/2015
As of
31/12/2016
As of
31/12/2014
As of
31/12/2015
As of
31/12/2016
Baseline scenario Adverse scenario
8/10/2019 Test Stress Banca Española 2014
http://slidepdf.com/reader/full/test-stress-banca-espanola-2014 95/240
(mln EUR) 31/12/2013 31/12/2014 31/12/2015 31/12/2016 31/12/2014 31/12/2015 31/12/2016
COMMON EQUITY TIER 1 CAPITAL (net of deductions and after applying transitional adjustments)
TOTAL RISK EXPOSURE AMOUNT
COMMON EQUITY TIER 1 RATIO #DIV/0! #DIV/0! #DIV/0! #DIV/0! #DIV/0! #DIV/0! #DIV/0!
http://www.economiaciudadana.org/
2014 EU-wide Stress TestMajor Capital Measures from 1 January to 30 September 2014
Major Capital Measures Impacting Tier 1 and Tier 2 Eligible Capital from 1 January 2014 to 30 September 2014
8/10/2019 Test Stress Banca Española 2014
http://slidepdf.com/reader/full/test-stress-banca-espanola-2014 96/240
Impact on Common
Equity Tier 1
Million EUR
Raising of capital instruments eligible as CET1 capital (+) 0
Repayment of CET1 capital, buybacks (-) 0
Conversion to CET1 of hybrid instruments becoming effective between 1 January and 30 September 2014 (+) 120
Impact on Additional
Tier 1 and Tier 2
Million EUR
Net issuance of Additional Tier 1 and T2 Instruments with a trigger at or above bank's post stress test CET1 ratio in the adverse
scenario during the stress test horizon (+/-)0
Net issuance of Additional Tier 1 and T2 Instrument with a trigger below bank's post stress test CET1 ratio in the adverse
scenario during the stress test horizon (+/-)0
Million EUR
Realized fines/litigation costs from 1 January to 30 September 2014 (net of provisions) (-) 0
Other material losses and provisions from 1 January to 30 September 2014 (-) 0
Losses
Net issuance of Additional Tier 1 and T2 Instruments
Issuance of CET 1 Instruments
http://www.economiaciudadana.org/
2014 EU-wide Stress Test

8/10/2019 Test Stress Banca Española 2014
http://slidepdf.com/reader/full/test-stress-banca-espanola-2014 97/240
Bank Name ES - Banco de Sabadell, S.A.
LEI Code SI5RG2M0WQQLZCXKRM20
ES
NUK_WL_NR_XX
version
1809014
No restructuring
http://www.economiaciudadana.org/
Actual figures as of 31 December 2013 mln EUR, % Actual figures as of 31 December 2013 mln EUR, %
Operating profit before impairments 2,111 Operating profit before impairments 2,111
Impairment losses on financial and non-financial assets in the banking book 1,726 Impairment losses on financial and non-financial assets in the banking book 1,726
Common Equity Tier 1 capital (1) 8,227 Common Equity Tier 1 capital (1) 8,227
Total Risk Exposure (1) 80,189 Total Risk Exposure (1) 80,189
2014 EU-wide Stress Test 2014 EU-wide Stress TestSummary Baseline Scenario
ES - Banco de Sabadell, S.A.
Summary Adverse Scenario
ES - Banco de Sabadell, S.A.

8/10/2019 Test Stress Banca Española 2014
http://slidepdf.com/reader/full/test-stress-banca-espanola-2014 98/240
Total Risk Exposure (1) 80,189 Total Risk Exposure (1) 80,189
Common Equity Tier 1 ratio, % (1) 10.3% Common Equity Tier 1 ratio, % (1) 10.3%
Outcome of the adverse scenario as of 31 December 2016 mln EUR, % Outcome of the baseline scenario as of 31 December 2016 mln EUR, %
3 yr cumulative operating profit before impairments2,530
3 yr cumulative operating profit before impairments2,788
3 yr cumulative impairment losses on financial and non-financial assets in the banking book 3,927 3 yr cumulative impairment losses on financial and non-financial assets in the banking book 2,107
3 yr cumulative losses from the stress in the trading book 92 3 yr cumulative losses from the stress in the trading book 47
Valuation losses due to sovereign shock after tax and prudential filters 610 Common Equity Tier 1 capital (1) 8,375
Common Equity Tier 1 capital (1) 6,661 Total Risk Exposure (1) 81,997
Total Risk Exposure (1) 79,914 Common Equity Tier 1 ratio, % (1) 10.2%
Common Equity Tier 1 ratio, % (1) 8.3%
Memorandum items mln EUR
Memorandum items mln EUR Common EU wide CET1 Threshold (8.0%) 6,560
Common EU wide CET1 Threshold (5.5%) 4,395
Total amount of instruments with mandatory conversion into ordinary shares upon a fixed date in
the 2014 -2016 period (cumulative conversions) (2)842
Total Additional Tier 1 and Tier 2 instruments eligible as regulatory capital under the CRR provisions
that convert into Common Equity Tier 1 or are written down upon a trigger event (3)0
Of which: eligible instruments whose trigger is above CET1 capital ratio in the adverse
scenario (3)0
(2) Conversions not considered for CET1 computation
(3) Excluding instruments with mandatory conversion into ordinary shares upon a fixed date in the 2014 -2016 period
(1) According to CRR/CRD4 definition transitional arrangements as per reporting date. Figures as of 31/12/2013 computed as of first day of application:01/01/2014.
(1) According to CRR/CRD4 definition transitional arrangements as per reporting date. Figures as of 31/12/2013 computed as of first day of application:
01/01/2014.
http://www.economiaciudadana.org/

8/10/2019 Test Stress Banca Española 2014
http://slidepdf.com/reader/full/test-stress-banca-espanola-2014 99/240
2014 EU-wide Stress TestCredit Risk
31 1 13) 31 1 13) 31 1 13)
(mln EU
R, %)No n-d ef aul t ed De fau lt e d No n-d ef aul t ed De fau lt e d No n-d ef aul t ed De fau lt e d No n-d ef aul t e d De fau lt e d No n-d ef aul t ed De fau lt e d No n-d ef aul t e d De fau lt e d No n-d ef aul t ed De fau lt e d No n-d ef aul t ed De fau lt e d No n-d ef aul t ed De fau lt e d
Impairment
rate
Stockof
ProvisionsCoverage Ratio -
Default Stock
Impairment
rate
Stockof
Provisions
CoverageRatio-Default
Stock
Impairment
rate
Stockof
Provisions
CoverageRatio -Default
Stock
Impairment rateStockof
Provisions
CoverageRatio-Default
Stock
Impairment
rate
Stockof
Provisions
CoverageRatio-Default
Stock
Impairment
rate
Stockof
Provisions
CoverageRatio -Default
Stock Central banksandcentral governments 0 0 0 0 0 0 0 0 0 0 0 0 0 0 0 0 0 0 - 0 - - 0 - - 0 - - 0 - - 0 - - 0 -
Institutions 0 0 0 0 0 0 0 0 0 0 0 0 0 0 0 0 0 0 - 0 - - 0 - - 0 - - 0 - - 0 - - 0 -
Corporates 0 0 0 0 0 0 0 0 0 0 0 0 0 0 0 0 0 0 - 0 - - 0 - - 0 - - 0 - - 0 - - 0 -
Corporates -Of Which:SpecialisedLending 0 0 0 0 0 0 0 0 0 0 0 0 0 0 0 0 0 0 - 0 - - 0 - - 0 - - 0 - - 0 - - 0 -
Corporates -Of Which:SME 0 0 0 0 0 0 0 0 0 0 0 0 0 0 0 0 0 0 - 0 - - 0 - - 0 - - 0 - - 0 - - 0 -
Retail 0 0 0 0 0 0 0 0 0 0 0 0 0 0 0 0 0 0 - 0 - - 0 - - 0 - - 0 - - 0 - - 0 -
Retail -Securedon real estateproperty 0.0% 0 0 0 0 0 0 0 0 0 0 0 0 0 0 0 0 0 0 - 0 - - 0 - - 0 - - 0 - - 0 - - 0 -
Retail -Securedon real estate property- Of
hi h: E0.0% 0 0 0 0 0 0 0 0 0 0 0 0 0 0 0 0 0 0 - 0 - - 0 - - 0 - - 0 - - 0 - - 0 -
Retail -Securedon real estate property- Of
h i h: n n - E0.0% 0 0 0 0 0 0 0 0 0 0 0 0 0 0 0 0 0 0 - 0 - - 0 - - 0 - - 0 - - 0 - - 0 -
Retail -QualifyingRevolving 0 0 0 0 0 0 0 0 0 0 0 0 0 0 0 0 0 0 - 0 - - 0 - - 0 - - 0 - - 0 - - 0 -
Retail -OtherRetail 0 0 0 0 0 0 0 0 0 0 0 0 0 0 0 0 0 0 - 0 - - 0 - - 0 - - 0 - - 0 - - 0 -
Retail -Other Retail -Of Which:SME 0 0 0 0 0 0 0 0 0 0 0 0 0 0 0 0 0 0 - 0 - - 0 - - 0 - - 0 - - 0 - - 0 -
Retail -Other Retail -Of Which:non-SME 0 0 0 0 0 0 0 0 0 0 0 0 0 0 0 0 0 0 - 0 - - 0 - - 0 - - 0 - - 0 - - 0 -
Equity 0 0 0 0 0 0 0 0 0 0 0 0 0 0 0 0 0 0 - 0 - - 0 - - 0 - - 0 - - 0 - - 0 -
Securitisation 0 0 0 0 0 0 0 0 0 0 0 0 0 0 0 0 0 0
Othernon-credit obligation assets 0 0 0 0 0 0 0 0 0 0 0 0 0 0 0 0 0 0
TOTAL 0 0 0 0 0 0 0 0 0 0 0 0 0 0 0 0 0 0 - 0 - - 0 - - 0 - - 0 - - 0 - - 0 -
Securitisation andre-securitisations positions deductedfrom capital * 0 0 0 0 0 0 0 0 0 0 0 0
(mln EUR, %)No n-d ef aul t ed De fau lt e d No n-d ef aul t ed De fau lt e d No n-d ef aul t ed De fau lt e d No n-d ef aul t e d De fau lt e d No n-d ef aul t ed De fau lt e d No n-d ef aul t e d De fau lt e d No n-d ef aul t ed De fau lt e d No n-d ef aul t ed De fau lt e d No n-d ef aul t ed De fau lt e d
Impairment
rate
Stockof
ProvisionsCoverage Ratio -
Default Stock
Impairment
rate
Stockof
Provisions
CoverageRatio-Default
Stock
Impairment
rate
Stockof
Provisions
CoverageRatio -Default
Stock
Impairment rateStockof
Provisions
CoverageRatio-Default
Stock
Impairment
rate
Stockof
Provisions
CoverageRatio-Default
Stock
Impairment
rate
Stockof
Provisions
CoverageRatio -Default
Stock Central banksandcentral governments 0 0 0 0 0 0 0 0 0 0 0 0 0 0 0 0 0 0 - 0 - - 0 - - 0 - - 0 - - 0 - - 0 -
Institutions 0 0 0 0 0 0 0 0 0 0 0 0 0 0 0 0 0 0 - 0 - - 0 - - 0 - - 0 - - 0 - - 0 -
(*)Referstothepart ofSecuritizationexposurethat isdeductedfrom capital andisnot includedinRWA
Please, select the country
Valueadjustmentsand provisions(asof 31/12/2013) BaselineScenario
LTV %(asof
31/12/2013)
E xp os ur e va lu es ( as of 3 1/ 12 /2 01 3) R is k e xp os ur e am ou nt s (a s of 3 1/ 12 /2 01 3) V al ue a dj us tm en ts a nd pr ov is io ns ( as o f3 1/ 12 /2 01 3)
AdverseScenario
F-IRB A-IRB STA F-IRB A-IRB STA F-IRB A-IRB STA as of 31/12/2014 as of 31/12/2015 as of 31/12/2016 as of 31/12/2014 as of 31/12/2015 as of 31/12/2016LTV %(asof
31/12/2013)
E xp os ur e va lu es ( as of 3 1/ 12 /2 01 3) R is k e xp os ur e am ou nt s (a s of 3 1/ 12 /2 01 3)
Baseline Scenario Adverse Scenario
F-IRB A-IRB STA F-IRB A-IRB STA F-IRB A-IRB STA as of 31/12/2014 as of 31/12/2015 as of 31/12/2016 as of 31/12/2014 as of 31/12/2015 as of 31/12/2016

8/10/2019 Test Stress Banca Española 2014
http://slidepdf.com/reader/full/test-stress-banca-espanola-2014 100/240
0 0 0 0 0 0 0 0 0 0 0 0 0 0 0 0 0 0 0 0 0 0 0 0
Corporates 0 0 0 0 0 0 0 0 0 0 0 0 0 0 0 0 0 0 - 0 - - 0 - - 0 - - 0 - - 0 - - 0 -
Corporates -Of Which:SpecialisedLending 0 0 0 0 0 0 0 0 0 0 0 0 0 0 0 0 0 0 - 0 - - 0 - - 0 - - 0 - - 0 - - 0 -
Corporates -Of Which:SME 0 0 0 0 0 0 0 0 0 0 0 0 0 0 0 0 0 0 - 0 - - 0 - - 0 - - 0 - - 0 - - 0 -
Retail 0 0 0 0 0 0 0 0 0 0 0 0 0 0 0 0 0 0 - 0 - - 0 - - 0 - - 0 - - 0 - - 0 -
Retail -Securedon real estateproperty 0.0% 0 0 0 0 0 0 0 0 0 0 0 0 0 0 0 0 0 0 - 0 - - 0 - - 0 - - 0 - - 0 - - 0 -
Retail -Securedon real estate property- Of
h i h : S E0.0% 0 0 0 0 0 0 0 0 0 0 0 0 0 0 0 0 0 0 - 0 - - 0 - - 0 - - 0 - - 0 - - 0 -
Retail -Securedon real estate property- Of
h i h: n n - E0.0% 0 0 0 0 0 0 0 0 0 0 0 0 0 0 0 0 0 0 - 0 - - 0 - - 0 - - 0 - - 0 - - 0 -
Retail -QualifyingRevolving 0 0 0 0 0 0 0 0 0 0 0 0 0 0 0 0 0 0 - 0 - - 0 - - 0 - - 0 - - 0 - - 0 -
Retail -OtherRetail 0 0 0 0 0 0 0 0 0 0 0 0 0 0 0 0 0 0 - 0 - - 0 - - 0 - - 0 - - 0 - - 0 -
Retail -Other Retail -Of Which:SME 0 0 0 0 0 0 0 0 0 0 0 0 0 0 0 0 0 0 - 0 - - 0 - - 0 - - 0 - - 0 - - 0 -
Retail -Other Retail -Of Which:non-SME 0 0 0 0 0 0 0 0 0 0 0 0 0 0 0 0 0 0 - 0 - - 0 - - 0 - - 0 - - 0 - - 0 -
Equity 0 0 0 0 0 0 0 0 0 0 0 0 0 0 0 0 0 0 - 0 - - 0 - - 0 - - 0 - - 0 - - 0 -Securitisation 0 0 0 0 0 0 0 0 0 0 0 0 0 0 0 0 0 0
Othernon-credit obligation assets 0 0 0 0 0 0 0 0 0 0 0 0 0 0 0 0 0 0
TOTAL 0 0 0 0 0 0 0 0 0 0 0 0 0 0 0 0 0 0 - 0 - - 0 - - 0 - - 0 - - 0 - - 0 -
Securitisation andre-securitisations positions deductedfrom capital * 0 0 0 0 0 0 0 0 0 0 0 0
(mln EUR, %)No n-d ef aul t ed De fau lt e d No n-d ef aul t ed De fau lt e d No n-d ef aul t ed De fau lt e d No n-d ef aul t e d De fau lt e d No n-d ef aul t ed De fau lt e d No n-d ef aul t e d De fau lt e d No n-d ef aul t ed De fau lt e d No n-d ef aul t ed De fau lt e d No n-d ef aul t ed De fau lt e d
Impairment
rate
Stockof
ProvisionsCoverage Ratio -
Default Stock
Impairment
rate
Stockof
Provisions
Coverage
Ratio-Default
Stock
Impairment
rate
Stockof
Provisions
Coverage
Ratio -Default
Stock
Impairment rateStockof
Provisions
Coverage
Ratio-Default
Stock
Impairment
rate
Stockof
Provisions
Coverage
Ratio-Default
Stock
Impairment
rate
Stockof
Provisions
Coverage
Ratio -Default
Stock Central banksandcentral governments 0 0 0 0 0 0 0 0 0 0 0 0 0 0 0 0 0 0 - 0 - - 0 - - 0 - - 0 - - 0 - - 0 -
Institutions 0 0 0 0 0 0 0 0 0 0 0 0 0 0 0 0 0 0 - 0 - - 0 - - 0 - - 0 - - 0 - - 0 -
Corporates 0 0 0 0 0 0 0 0 0 0 0 0 0 0 0 0 0 0 - 0 - - 0 - - 0 - - 0 - - 0 - - 0 -
Corporates -Of Which:SpecialisedLending 0 0 0 0 0 0 0 0 0 0 0 0 0 0 0 0 0 0 - 0 - - 0 - - 0 - - 0 - - 0 - - 0 -
Corporates -Of Which:SME 0 0 0 0 0 0 0 0 0 0 0 0 0 0 0 0 0 0 - 0 - - 0 - - 0 - - 0 - - 0 - - 0 -
Retail 0 0 0 0 0 0 0 0 0 0 0 0 0 0 0 0 0 0 - 0 - - 0 - - 0 - - 0 - - 0 - - 0 -
Retail -Securedon real estateproperty 0.0% 0 0 0 0 0 0 0 0 0 0 0 0 0 0 0 0 0 0 - 0 - - 0 - - 0 - - 0 - - 0 - - 0 -
Retail -Securedon real estate property- Of
hi h: E0.0% 0 0 0 0 0 0 0 0 0 0 0 0 0 0 0 0 0 0 - 0 - - 0 - - 0 - - 0 - - 0 - - 0 -
Retail -Securedon real estate property- Of
h i h: n n - E0.0% 0 0 0 0 0 0 0 0 0 0 0 0 0 0 0 0 0 0 - 0 - - 0 - - 0 - - 0 - - 0 - - 0 -
Retail -QualifyingRevolving 0 0 0 0 0 0 0 0 0 0 0 0 0 0 0 0 0 0 - 0 - - 0 - - 0 - - 0 - - 0 - - 0 -
Retail -OtherRetail 0 0 0 0 0 0 0 0 0 0 0 0 0 0 0 0 0 0 - 0 - - 0 - - 0 - - 0 - - 0 - - 0 -
Retail -Other Retail -Of Which:SME 0 0 0 0 0 0 0 0 0 0 0 0 0 0 0 0 0 0 - 0 - - 0 - - 0 - - 0 - - 0 - - 0 -
Retail -Other Retail -Of Which:non-SME 0 0 0 0 0 0 0 0 0 0 0 0 0 0 0 0 0 0 - 0 - - 0 - - 0 - - 0 - - 0 - - 0 -
Equity 0 0 0 0 0 0 0 0 0 0 0 0 0 0 0 0 0 0 - 0 - - 0 - - 0 - - 0 - - 0 - - 0 -
Securitisation 0 0 0 0 0 0 0 0 0 0 0 0 0 0 0 0 0 0
Othernon-credit obligation assets 0 0 0 0 0 0 0 0 0 0 0 0 0 0 0 0 0 0
TOTAL 0 0 0 0 0 0 0 0 0 0 0 0 0 0 0 0 0 0 - 0 - - 0 - - 0 - - 0 - - 0 - - 0 -
Securitisation andre-securitisations positions deductedfrom capital * 0 0 0 0 0 0 0 0 0 0 0 0
(mln EUR, %)No n-d ef aul t ed De fau lt e d No n-d ef aul t ed De fau lt e d No n-d ef aul t ed De fau lt e d No n-d ef aul t e d De fau lt e d No n-d ef aul t ed De fau lt e d No n-d ef aul t e d De fau lt e d No n-d ef aul t ed De fau lt e d No n-d ef aul t ed De fau lt e d No n-d ef aul t ed De fau lt e d
Impairment
rate
Stockof
ProvisionsCoverage Ratio -
Default Stock
Impairment
rate
Stockof
Provisions
Coverage
Ratio-Default
Stock
Impairment
rate
Stockof
Provisions
Coverage
Ratio -Default
Stock
Impairment rateStockof
Provisions
Coverage
Ratio-Default
Stock
Impairment
rate
Stockof
Provisions
Coverage
Ratio-Default
Stock
Impairment
rate
Stockof
Provisions
Coverage
Ratio -Default
Stock Central banksandcentral governments 0 0 0 0 0 0 0 0 0 0 0 0 0 0 0 0 0 0 - 0 - - 0 - - 0 - - 0 - - 0 - - 0 -
Institutions 0 0 0 0 0 0 0 0 0 0 0 0 0 0 0 0 0 0 - 0 - - 0 - - 0 - - 0 - - 0 - - 0 -
Corporates 0 0 0 0 0 0 0 0 0 0 0 0 0 0 0 0 0 0 - 0 - - 0 - - 0 - - 0 - - 0 - - 0 -
Corporates -Of Which:SpecialisedLending 0 0 0 0 0 0 0 0 0 0 0 0 0 0 0 0 0 0 - 0 - - 0 - - 0 - - 0 - - 0 - - 0 -
Corporates -Of Which:SME 0 0 0 0 0 0 0 0 0 0 0 0 0 0 0 0 0 0 - 0 - - 0 - - 0 - - 0 - - 0 - - 0 -
Retail 0 0 0 0 0 0 0 0 0 0 0 0 0 0 0 0 0 0 - 0 - - 0 - - 0 - - 0 - - 0 - - 0 -
Retail -Securedon real estateproperty 0.0% 0 0 0 0 0 0 0 0 0 0 0 0 0 0 0 0 0 0 - 0 - - 0 - - 0 - - 0 - - 0 - - 0 -
Retail -Securedon real estate property- Of
h i h : S E0.0% 0 0 0 0 0 0 0 0 0 0 0 0 0 0 0 0 0 0 - 0 - - 0 - - 0 - - 0 - - 0 - - 0 -
Retail -Securedon real estate property- Of
h i h: n n - E
0.0% 0 0 0 0 0 0 0 0 0 0 0 0 0 0 0 0 0 0 - 0 - - 0 - - 0 - - 0 - - 0 - - 0 -
Retail -QualifyingRevolving 0 0 0 0 0 0 0 0 0 0 0 0 0 0 0 0 0 0 - 0 - - 0 - - 0 - - 0 - - 0 - - 0 -Retail -OtherRetail 0 0 0 0 0 0 0 0 0 0 0 0 0 0 0 0 0 0 - 0 - - 0 - - 0 - - 0 - - 0 - - 0 -
Retail -Other Retail -Of Which:SME 0 0 0 0 0 0 0 0 0 0 0 0 0 0 0 0 0 0 - 0 - - 0 - - 0 - - 0 - - 0 - - 0 -
Retail -Other Retail -Of Which:non-SME 0 0 0 0 0 0 0 0 0 0 0 0 0 0 0 0 0 0 - 0 - - 0 - - 0 - - 0 - - 0 - - 0 -
Equity 0 0 0 0 0 0 0 0 0 0 0 0 0 0 0 0 0 0 - 0 - - 0 - - 0 - - 0 - - 0 - - 0 -
Securitisation 0 0 0 0 0 0 0 0 0 0 0 0 0 0 0 0 0 0
Othernon-credit obligation assets 0 0 0 0 0 0 0 0 0 0 0 0 0 0 0 0 0 0
TOTAL 0 0 0 0 0 0 0 0 0 0 0 0 0 0 0 0 0 0 - 0 - - 0 - - 0 - - 0 - - 0 - - 0 -Securitisation andre-securitisations positions deductedfrom capital * 0 0 0 0 0 0 0 0 0 0 0 0
(mln EUR, %)No n-d ef aul t ed De fau lt e d No n-d ef aul t ed De fau lt e d No n-d ef aul t ed De fau lt e d No n-d ef aul t e d De fau lt e d No n-d ef aul t ed De fau lt e d No n-d ef aul t e d De fau lt e d No n-d ef aul t ed De fau lt e d No n-d ef aul t ed De fau lt e d No n-d ef aul t ed De fau lt e d
Impairment
rate
Stockof
ProvisionsCoverage Ratio -
Default Stock
Impairment
rate
Stockof
Provisions
Coverage
Ratio-DefaultStock
Impairment
rate
Stockof
Provisions
Coverage
Ratio -DefaultStock
Impairment rateStockof
Provisions
Coverage
Ratio-DefaultStock
Impairment
rate
Stockof
Provisions
Coverage
Ratio-DefaultStock
Impairment
rate
Stockof
Provisions
Coverage
Ratio -DefaultStock
Central banksandcentral governments 0 0 0 0 0 0 0 0 0 0 0 0 0 0 0 0 0 0 - 0 - - 0 - - 0 - - 0 - - 0 - - 0 -
Institutions 0 0 0 0 0 0 0 0 0 0 0 0 0 0 0 0 0 0 - 0 - - 0 - - 0 - - 0 - - 0 - - 0 -
Corporates 0 0 0 0 0 0 0 0 0 0 0 0 0 0 0 0 0 0 - 0 - - 0 - - 0 - - 0 - - 0 - - 0 -
Corporates -Of Which:SpecialisedLending 0 0 0 0 0 0 0 0 0 0 0 0 0 0 0 0 0 0 - 0 - - 0 - - 0 - - 0 - - 0 - - 0 -
Corporates -Of Which:SME 0 0 0 0 0 0 0 0 0 0 0 0 0 0 0 0 0 0 - 0 - - 0 - - 0 - - 0 - - 0 - - 0 -
Retail 0 0 0 0 0 0 0 0 0 0 0 0 0 0 0 0 0 0 - 0 - - 0 - - 0 - - 0 - - 0 - - 0 -
Retail -Securedon real estateproperty 0.0% 0 0 0 0 0 0 0 0 0 0 0 0 0 0 0 0 0 0 - 0 - - 0 - - 0 - - 0 - - 0 - - 0 -
Retail -Securedon real estate property- Of
hi h: E0.0% 0 0 0 0 0 0 0 0 0 0 0 0 0 0 0 0 0 0 - 0 - - 0 - - 0 - - 0 - - 0 - - 0 -
Retail -Securedon real estate property- Of
h i h : n n -S E0.0% 0 0 0 0 0 0 0 0 0 0 0 0 0 0 0 0 0 0 - 0 - - 0 - - 0 - - 0 - - 0 - - 0 -
Retail -QualifyingRevolving 0 0 0 0 0 0 0 0 0 0 0 0 0 0 0 0 0 0 - 0 - - 0 - - 0 - - 0 - - 0 - - 0 -
Retail -OtherRetail 0 0 0 0 0 0 0 0 0 0 0 0 0 0 0 0 0 0 - 0 - - 0 - - 0 - - 0 - - 0 - - 0 -
Retail -Other Retail -Of Which:SME 0 0 0 0 0 0 0 0 0 0 0 0 0 0 0 0 0 0 - 0 - - 0 - - 0 - - 0 - - 0 - - 0 -
Retail -Other Retail -Of Which:non-SME 0 0 0 0 0 0 0 0 0 0 0 0 0 0 0 0 0 0 - 0 - - 0 - - 0 - - 0 - - 0 - - 0 -
Equity 0 0 0 0 0 0 0 0 0 0 0 0 0 0 0 0 0 0 - 0 - - 0 - - 0 - - 0 - - 0 - - 0 -
Securitisation 0 0 0 0 0 0 0 0 0 0 0 0 0 0 0 0 0 0
Othernon-credit obligation assets 0 0 0 0 0 0 0 0 0 0 0 0 0 0 0 0 0 0
TOTAL 0 0 0 0 0 0 0 0 0 0 0 0 0 0 0 0 0 0 - 0 - - 0 - - 0 - - 0 - - 0 - - 0 -Securitisation andre-securitisations positions deductedfrom capital * 0 0 0 0 0 0 0 0 0 0 0 0
(*)Referstothepart ofSecuritizationexposurethat isdeductedfrom capital andisnot includedinRWA
(*)Referstothepart ofSecuritizationexposurethat isdeductedfrom capital andisnot includedinRWA
(*)Referstothepart ofSecuritizationexposurethat isdeductedfrom capital andisnot includedinRWA
(*)Referstothepart ofSecuritizationexposurethat isdeductedfrom capital andisnot includedinRWA
Please, select the country
Please, select the country
Please, select the country
Please, select the country
LTV %(asof
31/12/2013)
Exposure values (as of 31/12/2013) Risk exposure amounts (as of 31/12/2013) Value adjustments and provisions (as of 31/12/2013) Baseline Scenario Adverse Scenario
F-IRB A-IRB STA F-IRB A-IRB STA F-IRB A-IRB a s of 3 1/ 12 /2 01 5 a s of 3 1/ 12 /2 01 6STA as of 31/12/2014 as of 31/12/2015 as of 31/12/2016 as of 31/12/2014
LTV %(asof
31/12/2013)
Exposure values (as of 31/12/2013) Risk exposure amounts (as of 31/12/2013) Value adjustments and provisions (as of 31/12/2013) Baseline Scenario Adverse Scenario
F-IRB A-IRB STA F-IRB A-IRB STA F-IRB a sof 31 /12 /2 01 4 a so f3 1/ 12 /2 01 5 a sof 31 /12 /2 01 6 A-IRB STA a sof 31 /1 2/ 20 14 a so f3 1/ 12 /2 01 5 a sof 31 /12 /2 01 6
LTV %(asof
31/12/2013)
Exposure values (as of 31/12/2013) Risk exposure amounts (as of 31/12/2013) Value adjustments and provisions (as of 31/12/2013) Baseline Scenario Adverse Scenario
F-IRB A-IRB STA F-IRB A-IRB STA as of 31/12/2016 as of 31/12/2014 as of 31/12/2015 as of 31/12/2016F-IRB A-IRB STA a s of 3 1/ 12 /2 01 4 a s of 3 1/ 12 /2 01 5
http://www.economiaciudadana.org/
2014 EU-wide Stress Test
P&L
(mln EUR) 31/12/2014 31/12/2015 31/12/2016 31/12/2014 31/12/2015 31/12/2016
Net interest income 1,803 1,803 1,803 1,803 1,743 1,803 1,797
Net trading income 84 93 98 61 79 89
of which trading losses from stress scenarios -23 -14 -9 -46 -27 -18
Other operating income 1,467 183 183 183 183 183 183
31/12/2013
Baseline Scenario Adverse Scenario

8/10/2019 Test Stress Banca Española 2014
http://slidepdf.com/reader/full/test-stress-banca-espanola-2014 101/240
Operating profit before impairments 2,111 919 932 937 788 870 873
Impairment of financial assets (-) -1,140 -841 -629 -637 -1,517 -1,081 -990
Impairment of financial assets other than instruments designated at fair valuethrough P&L (-)
-1,140 -841 -629 -637 -1,517 -1,081 -990
Impairment Financial assets designated at fair value through P&L (-) 0 0 0 0 0 0 0
Impairment on non financial assets (-) -586 0 0 0 -170 -102 -68
Operating profit after impairments from stress scenarios 385 77 304 300 -899 -313 -185
Other Income and expenses 43 60 38 42 197 88 70
Pre-Tax profit 428 137 342 342 -702 -225 -115
Tax -128 -41 -102 -103 211 67 34
Net income 300 96 239 240 -491 -157 -80
Attributable to owners of the parent 300 96 239 240 -491 -157 -80
of which carried over to capital through retained earnings 260 72 120 120 -491 -157 -80
of which distributed as dividends 40 24 120 120 0 0 0
In the figures above, the original (official published) 2013 P&L figures may have been adjusted as part of the ECB Comprehensive Assessment join-up calculation.
http://www.economiaciudadana.org/
2014 EU-wide Stress Test
RWA
(mln EUR)as of 31/12/2013 as of 31/12/2014 as of 31/12/2015 as of 31/12/2016 as of 31/12/2014 as of 31/12/2015 as of 31/12/2016
Risk exposure amount for credit risk 72,734 73,770 74,223 74,542 72,490 72,246 72,459
Risk exposure amount Securitisation and re-securitisations 0 0 0 0 0 0 0
Risk exposure amount Other credit risk 72,734 73,770 74,223 74,542 72,490 72,246 72,459
Baseline Scenario Adverse Scenario

8/10/2019 Test Stress Banca Española 2014
http://slidepdf.com/reader/full/test-stress-banca-espanola-2014 102/240
p , , , , , , ,
Risk exposure amount for market risk 540 540 540 540 540 540 540
Risk exposure amount for operational risk 6,915 6,915 6,915 6,915 6,915 6,915 6,915
Transitional floors for Risk exposure amount 0 0 0 0 0 0 0
AQR adjustments (for SSM countries only) 0 0 0 0 0 0 0
Total Risk exposure amount 80,189 81,225 81,678 81,997 79,945 79,701 79,914
http://www.economiaciudadana.org/

8/10/2019 Test Stress Banca Española 2014
http://slidepdf.com/reader/full/test-stress-banca-espanola-2014 103/240
2014 EU-wide Stress Test - Sovereign Exposure
(mln EUR)
Derivatives with positive fair value
at 31/12/2013
Derivatives with negative fair
value at 31/12/2013
VALUES AS OF 31/12/2013 VALUES AS OF 31/12/2013 VALUES AS OF 31/12/2013
INDIRECT SOVEREIGN EXPOSURES (3) (on and off balance sheet)
Residual Maturity Country / Region
GROSS DIRECT LONG
EXPOSURES(accounting value gross
of provisions)
(1)
NET DIRECT POSITIONS (gross exposures (long) net of cash short
positions of sovereign debt to other counterpaties only where there
is a maturity matching)
(1)
DIRECT SOVEREIGN EXPOSURES IN DERIVATIVES (1)
of which: FVOf hi h Fi i l
Derivatives with positive fair value at
31/12/2013
Derivatives with negative fair value at
31/12/2013

8/10/2019 Test Stress Banca Española 2014
http://slidepdf.com/reader/full/test-stress-banca-espanola-2014 104/240
[ 0 - 3M [ 0 0 0 0 0 0 0 0 0 0 0 0 0 0
[ 3M - 1Y [ 54 0 54 54 0 0 0 0 0 0 0 0 0 0
[ 1Y - 2Y [ 0 0 0 0 0 0 0 0 0 0 0 0 0 0
[ 2Y - 3Y [ 0 0 0 0 0 0 0 0 0 0 0 0 0 0
[3Y - 5Y [ 0 0 0 0 0 0 0 0 0 0 0 0 0 0
[5Y - 10Y [ 0 0 0 0 0 0 0 0 0 0 0 0 0 0
[10Y - more 0 0 0 0 0 0 0 0 0 0 0 0 0 0
Tot 54 0 54 54 0 0 0 0 0 0 0 0 0 0
[ 0 - 3M [ 0 0 0 0 0 0 0 0 0 0 0 0 0 0
[ 3M - 1Y [ 0 0 0 0 0 0 0 0 0 0 0 0 0 0
[ 1Y - 2Y [ 0 0 0 0 0 0 0 0 0 0 0 0 0 0
[ 2Y - 3Y [ 0 0 0 0 0 0 0 0 0 0 0 0 0 0
[3Y - 5Y [ 0 0 0 0 0 0 0 0 0 0 0 0 0 0
[5Y - 10Y [ 0 0 0 0 0 0 0 0 0 0 0 0 0 0
[10Y - more 0 0 0 0 0 0 0 0 0 0 0 0 0 0
Tot 0 0 0 0 0 0 0 0 0 0 0 0 0 0
[ 0 - 3M [ 0 0 0 0 0 0 0 0 0 0 0 0 0 0
[ 3M - 1Y [ 0 0 0 0 0 0 0 0 0 0 0 0 0 0
[ 1Y - 2Y [ 0 0 0 0 0 0 0 0 0 0 0 0 0 0
[ 2Y - 3Y [ 0 0 0 0 0 0 0 0 0 0 0 0 0 0[3Y - 5Y [ 0 0 0 0 0 0 0 0 0 0 0 0 0 0
[5Y - 10Y [ 0 0 0 0 0 0 0 0 0 0 0 0 0 0
[10Y - more 0 0 0 0 0 0 0 0 0 0 0 0 0 0
Tot 0 0 0 0 0 0 0 0 0 0 0 0 0 0
[ 0 - 3M [ 0 0 0 0 0 0 0 0 0 0 0 0 0 0
[ 3M - 1Y [ 0 0 0 0 0 0 0 0 0 0 0 0 0 0
[ 1Y - 2Y [ 0 0 0 0 0 0 0 0 0 0 0 0 0 0
[ 2Y - 3Y [ 0 0 0 0 0 0 0 0 0 0 0 0 0 0
[3Y - 5Y [ 0 0 0 0 0 0 0 0 0 0 0 0 0 0
[5Y - 10Y [ 0 0 0 0 0 0 0 0 0 0 0 0 0 0
[10Y - more 0 0 0 0 0 0 0 0 0 0 0 0 0 0
Tot 0 0 0 0 0 0 0 0 0 0 0 0 0 0
[ 0 - 3M [ 0 0 0 0 0 0 0 0 0 0 0 0 0 0
[ 3M - 1Y [ 0 0 0 0 0 0 0 0 0 0 0 0 0 0
[ 1Y - 2Y [ 0 0 0 0 0 0 0 0 0 0 0 0 0 0
[ 2Y - 3Y [ 0 0 0 0 0 0 0 0 0 0 0 0 0 0[3Y - 5Y [ 0 0 0 0 0 0 0 0 0 0 0 0 0 0
[5Y - 10Y [ 0 0 0 0 0 0 0 0 0 0 0 0 0 0
[10Y - more 0 0 0 0 0 0 0 0 0 0 0 0 0 0
Tot 0 0 0 0 0 0 0 0 0 0 0 0 0 0
[ 0 - 3M [ 0 0 0 0 0 0 0 0 0 0 0 0 0 0
[ 3M - 1Y [ 0 0 0 0 0 0 0 0 0 0 0 0 0 0
[ 1Y - 2Y [ 0 0 0 0 0 0 0 0 0 0 0 0 0 0
[ 2Y - 3Y [ 0 0 0 0 0 0 0 0 0 0 0 0 0 0
[3Y - 5Y [ 0 0 0 0 0 0 0 0 0 0 0 0 0 0
[5Y - 10Y [ 0 0 0 0 0 0 0 0 0 0 0 0 0 0
[10Y - more 0 0 0 0 0 0 0 0 0 0 0 0 0 0
Tot 0 0 0 0 0 0 0 0 0 0 0 0 0 0
Czech Republic
Denmark
Estonia
Finland
France
Austria
Belgium
Bulgaria
Cyprus
Notional valueFair-value at
31/12/2013 (+)Notional value
Fair-value at
31/12/2013 (-)Notional value
Fair-value at
31/12/2013 (+)Notional value
Fair-value at 31/12/2013
(-)
of which: loans
and advances
of which: AFS
banking book
of which: FVO
(designated at fair
value through
profit&loss)
banking book
of which: Financial
assets held for
trading
(2)
http://www.economiaciudadana.org/
2014 EU-wide Stress Test - Sovereign Exposure
(mln EUR)
Derivatives with positive fair value
at 31/12/2013
Derivatives with negative fair
value at 31/12/2013
VALUES AS OF 31/12/2013 VALUES AS OF 31/12/2013 VALUES AS OF 31/12/2013
INDIRECT SOVEREIGN EXPOSURES (3) (on and off balance sheet)
Residual Maturity Country / Region
GROSS DIRECT LONG
EXPOSURES(accounting value gross
of provisions)
(1)
NET DIRECT POSITIONS (gross exposures (long) net of cash short
positions of sovereign debt to other counterpaties only where there
is a maturity matching)
(1)
DIRECT SOVEREIGN EXPOSURES IN DERIVATIVES (1)
of which: FVOof which: Financial
Derivatives with positive fair value at
31/12/2013
Derivatives with negative fair value at
31/12/2013

8/10/2019 Test Stress Banca Española 2014
http://slidepdf.com/reader/full/test-stress-banca-espanola-2014 105/240
Notional valueFair-value at
31/12/2013 (+)Notional value
Fair-value at
31/12/2013 (-)Notional value
Fair-value at
31/12/2013 (+)Notional value
Fair-value at 31/12/2013
(-)
of which: loans
and advances
of which: AFS
banking book
(designated at fair
value through
profit&loss)
banking book
of which: Financial
assets held for
trading
(2)
[ 0 - 3M [ 0 0 0 0 0 0 0 0 0 0 0 0 0 0
[ 3M - 1Y [ 0 0 0 0 0 0 0 0 0 0 0 0 0 0
[ 1Y - 2Y [ 0 0 0 0 0 0 0 0 0 0 0 0 0 0
[ 2Y - 3Y [ 0 0 0 0 0 0 0 0 0 0 0 0 0 0
[3Y - 5Y [ 0 0 0 0 0 0 0 0 0 0 0 0 0 0
[5Y - 10Y [ 0 0 0 0 0 0 0 0 0 0 0 0 0 0
[10Y - more 0 0 0 0 0 0 0 0 0 0 0 0 0 0
Tot 0 0 0 0 0 0 0 0 0 0 0 0 0 0
[ 0 - 3M [ 0 0 0 0 0 0 0 0 0 0 0 0 0 0
[ 3M - 1Y [ 0 0 0 0 0 0 0 0 0 0 0 0 0 0
[ 1Y - 2Y [ 0 0 0 0 0 0 0 0 0 0 0 0 0 0
[ 2Y - 3Y [ 0 0 0 0 0 0 0 0 0 0 0 0 0 0
[3Y - 5Y [ 0 0 0 0 0 0 0 0 0 0 0 0 0 0
[5Y - 10Y [ 0 0 0 0 0 0 0 0 0 0 0 0 0 0
[10Y - more 23 0 23 23 0 0 0 0 0 0 0 0 0 0
Tot 23 0 23 23 0 0 0 0 0 0 0 0 0 0
[ 0 - 3M [ 0 0 0 0 0 0 0 0 0 0 0 0 0 0
[ 3M - 1Y [ 0 0 0 0 0 0 0 0 0 0 0 0 0 0
[ 1Y - 2Y [ 0 0 0 0 0 0 0 0 0 0 0 0 0 0
[ 2Y - 3Y [ 0 0 0 0 0 0 0 0 0 0 0 0 0 0[3Y - 5Y [ 0 0 0 0 0 0 0 0 0 0 0 0 0 0
[5Y - 10Y [ 0 0 0 0 0 0 0 0 0 0 0 0 0 0
[10Y - more 0 0 0 0 0 0 0 0 0 0 0 0 0 0
Tot 0 0 0 0 0 0 0 0 0 0 0 0 0 0
[ 0 - 3M [ 0 0 0 0 0 0 0 0 0 0 0 0 0 0
[ 3M - 1Y [ 0 0 0 0 0 0 0 0 0 0 0 0 0 0
[ 1Y - 2Y [ 0 0 0 0 0 0 0 0 0 0 0 0 0 0
[ 2Y - 3Y [ 0 0 0 0 0 0 0 0 0 0 0 0 0 0
[3Y - 5Y [ 0 0 0 0 0 0 0 0 0 0 0 0 0 0
[5Y - 10Y [ 0 0 0 0 0 0 0 0 0 0 0 0 0 0
[10Y - more 0 0 0 0 0 0 0 0 0 0 0 0 0 0
Tot 0 0 0 0 0 0 0 0 0 0 0 0 0 0
[ 0 - 3M [ 0 0 0 0 0 0 0 0 0 0 0 0 0 0
[ 3M - 1Y [ 0 0 0 0 0 0 0 0 0 0 0 0 0 0
[ 1Y - 2Y [ 0 0 0 0 0 0 0 0 0 0 0 0 0 0
[ 2Y - 3Y [ 0 0 0 0 0 0 0 0 0 0 0 0 0 0[3Y - 5Y [ 0 0 0 0 0 0 0 0 0 0 0 0 0 0
[5Y - 10Y [ 0 0 0 0 0 0 0 0 0 0 0 0 0 0
[10Y - more 0 0 0 0 0 0 0 0 0 0 0 0 0 0
Tot 0 0 0 0 0 0 0 0 0 0 0 0 0 0
[ 0 - 3M [ 0 0 0 0 0 0 0 0 0 0 0 0 0 0
[ 3M - 1Y [ 0 0 0 0 0 0 0 0 0 0 0 0 0 0
[ 1Y - 2Y [ 0 0 0 0 0 0 0 0 0 0 0 0 0 0
[ 2Y - 3Y [ 0 0 0 0 0 0 0 0 0 0 0 0 0 0
[3Y - 5Y [ 0 0 0 0 0 0 0 0 0 0 0 0 0 0
[5Y - 10Y [ 0 0 0 0 0 0 0 0 0 0 0 0 0 0
[10Y - more 0 0 0 0 0 0 0 0 0 0 0 0 0 0
Tot 0 0 0 0 0 0 0 0 0 0 0 0 0 0
Liechtenstein
Latvia
Germany
Greece
Hungary
Iceland
Ireland
Italy
Croatia
http://www.economiaciudadana.org/

8/10/2019 Test Stress Banca Española 2014
http://slidepdf.com/reader/full/test-stress-banca-espanola-2014 106/240

8/10/2019 Test Stress Banca Española 2014
http://slidepdf.com/reader/full/test-stress-banca-espanola-2014 107/240
2014 EU-wide Stress Test - Sovereign Exposure
(mln EUR)
F i l t F i l tF i l t F i l t 31/12/2013
Derivatives with positive fair value
at 31/12/2013
Derivatives with negative fair
value at 31/12/2013
VALUES AS OF 31/12/2013 VALUES AS OF 31/12/2013 VALUES AS OF 31/12/2013
INDIRECT SOVEREIGN EXPOSURES (3) (on and off balance sheet)
Residual Maturity Country / Region
GROSS DIRECT LONG
EXPOSURES(accounting value gross
of provisions)
(1)
NET DIRECT POSITIONS (gross exposures (long) net of cash short
positions of sovereign debt to other counterpaties only where there
is a maturity matching)
(1)
DIRECT SOVEREIGN EXPOSURES IN DERIVATIVES (1)
f hi h l f hi h AFS
of which: FVO
(designatedat fairof which: Financial
t h ld f
Derivatives with positive fair value at
31/12/2013
Derivatives with negative fair value at
31/12/2013

8/10/2019 Test Stress Banca Española 2014
http://slidepdf.com/reader/full/test-stress-banca-espanola-2014 108/240
Notional valueFair-value at
31/12/2013 (+)Notional value
Fair-value at
31/12/2013 (-)Notional value
Fair-value at
31/12/2013 (+)Notional value
Fair-value at 31/12/2013
(-)
of which: loans
and advances
of which: AFS
banking book
(designated at fair
value through
profit&loss)
banking book
assets held for
trading
(2)
[ 0 - 3M [ 0 0 0 0 0 0 0 0 0 0 0 0 0 0
[ 3M - 1Y [ 0 0 0 0 0 0 0 0 0 0 0 0 0 0
[ 1Y - 2Y [ 0 0 0 0 0 0 0 0 0 0 0 0 0 0
[ 2Y - 3Y [ 0 0 0 0 0 0 0 0 0 0 0 0 0 0
[3Y - 5Y [ 0 0 0 0 0 0 0 0 0 0 0 0 0 0
[5Y - 10Y [ 0 0 0 0 0 0 0 0 0 0 0 0 0 0
[10Y - more 0 0 0 0 0 0 0 0 0 0 0 0 0 0
Tot 0 0 0 0 0 0 0 0 0 0 0 0 0 0
[ 0 - 3M [ 0 0 0 0 0 0 0 0 0 0 0 0 0 0
[ 3M - 1Y [ 0 0 0 0 0 0 0 0 0 0 0 0 0 0
[ 1Y - 2Y [ 0 0 0 0 0 0 0 0 0 0 0 0 0 0
[ 2Y - 3Y [ 0 0 0 0 0 0 0 0 0 0 0 0 0 0
[3Y - 5Y [ 0 0 0 0 0 0 0 0 0 0 0 0 0 0
[5Y - 10Y [ 0 0 0 0 0 0 0 0 0 0 0 0 0 0
[10Y - more 0 0 0 0 0 0 0 0 0 0 0 0 0 0
Tot 0 0 0 0 0 0 0 0 0 0 0 0 0 0
[ 0 - 3M [ 12 0 12 12 0 0 0 0 0 0 0 0 0 0
[ 3M - 1Y [ 2 0 2 2 0 0 0 0 0 0 0 0 0 0
[ 1Y - 2Y [ 0 0 0 0 0 0 0 0 0 0 0 0 0 0
[ 2Y - 3Y [ 1 0 1 1 0 0 0 0 0 0 0 0 0 0
[3Y - 5Y [ 0 0 0 0 0 0 0 0 0 0 0 0 0 0
[5Y - 10Y [ 0 0 0 0 0 0 0 0 0 0 0 0 0 0
[10Y - more 0 0 0 0 0 0 0 0 0 0 0 0 0 0
Tot 15 0 15 15 0 0 0 0 0 0 0 0 0 0
[ 0 - 3M [ 0 0 0 0 0 0 0 0 0 0 0 0 0 0
[ 3M - 1Y [ 0 0 0 0 0 0 0 0 0 0 0 0 0 0
[ 1Y - 2Y [ 0 0 0 0 0 0 0 0 0 0 0 0 0 0
[ 2Y - 3Y [ 0 0 0 0 0 0 0 0 0 0 0 0 0 0
[3Y - 5Y [ 0 0 0 0 0 0 0 0 0 0 0 0 0 0
[5Y - 10Y [ 0 0 0 0 0 0 0 0 0 0 0 0 0 0
[10Y - more 0 0 0 0 0 0 0 0 0 0 0 0 0 0
Tot 0 0 0 0 0 0 0 0 0 0 0 0 0 0
[ 0 - 3M [ 6 6 6 0 0 0 0 0 0 0 0 0 0 0
[ 3M - 1Y [ 0 0 0 0 0 0 0 0 0 0 0 0 0 0
[ 1Y - 2Y [ 0 0 0 0 0 0 0 0 0 0 0 0 0 0
[ 2Y - 3Y [ 0 0 0 0 0 0 0 0 0 0 0 0 0 0
[3Y - 5Y [ 0 0 0 0 0 0 0 0 0 0 0 0 0 0
[5Y - 10Y [ 0 0 0 0 0 0 0 0 0 0 0 0 0 0
[10Y - more 0 0 0 0 0 0 0 0 0 0 0 0 0 0
Tot 6 6 6 0 0 0 0 0 0 0 0 0 0 0
[ 0 - 3M [ 0 0 0 0 0 0 0 0 0 0 0 0 0 0
[ 3M - 1Y [ 1 0 1 1 0 0 0 0 0 0 0 0 0 0
[ 1Y - 2Y [ 0 0 0 0 0 0 0 0 0 0 0 0 0 0
[ 2Y - 3Y [ 0 0 0 0 0 0 0 0 0 0 0 0 0 0
[3Y - 5Y [ 0 0 0 0 0 0 0 0 0 0 0 0 0 0
[5Y - 10Y [ 0 0 0 0 0 0 0 0 0 0 0 0 0 0
[10Y - more 0 0 0 0 0 0 0 0 0 0 0 0 0 0
Tot 1 0 1 1 0 0 0 0 0 0 0 0 0 0
[ 0 - 3M [ 0 0 0 0 0 0 0 0 0 0 0 0 0 0
[ 3M - 1Y [ 0 0 0 0 0 0 0 0 0 0 0 0 0 0
[ 1Y - 2Y [ 0 0 0 0 0 0 0 0 0 0 0 0 0 0
[ 2Y - 3Y [ 0 0 0 0 0 0 0 0 0 0 0 0 0 0[3Y - 5Y [ 0 0 0 0 0 0 0 0 0 0 0 0 0 0
[5Y - 10Y [ 0 0 0 0 0 0 0 0 0 0 0 0 0 0
[10Y - more 0 0 0 0 0 0 0 0 0 0 0 0 0 0Tot 0 0 0 0 0 0 0 0 0 0 0 0 0 0
Notes and definitions
(1) The exposures reported cover only exposures to central, regional and local governments on immediate borrower basis, and do not include exposures to other counterparts with full or partial government guarantees
(2) The banks disclose the exposures in the "Financial assets held for trading" portfolio after offsetting the cash short positions having the same maturities.
(3) The exposures reported include the positions towards counterparts (other than sovereign) on sovereign credit risk (i.e. CDS, financial guarantees) booked in all the accounting portfolio (on-off balance sheet).'Irrespective of the denomination and or accounting classification of the positions the economic substance over the form must be used as a criteria for the identification of the exposures to be included in this column. This item does not include exposures to counterparts (other than sovereign) with full or partial government guarantees by central, regional and local governments
Latin America and the
Caribbean
Africa
Others
Middle East
China
Switzerland
Other advanced economies
non EEA
Other Central and eastern
Europe countries non EEA
http://www.economiaciudadana.org/
2014 EU-wide Stress TestCapital
(mln EUR) CRR/ CRDIV DEFINITION OFCAPITAL Asof31/12/2013 Asof31/12/2014 Asof31/12/2015 Asof31/12/2016 Asof31/12/2014 Asof31/12/2015 Asof31/12/2016 COREP CODE REGULATION
A OWN FUNDS 9,742 9,728 9,747 9,762 8,883 8,528 8,040 C A 1 {1 } A rt ic le s 4 (1 18 ) a nd 7 2 of C RR
A.1COMMON EQUITYTIER 1CAPITAL(net ofdeductionsandafter applying
transitional adjustments)8,227 8,273 8,300 8,375 7,432 7,088 6,661 C A 1 {1 .1 .1 } A rt ic le 5 0 of C RR
A.1.1Capitalinstrumentseligible asCET1Capital(including share premium and net own
capitalinstruments)6,205 6,164 6,132 6,132 6,205 6,205 6,205 CA1 {1.1.1.1}
Articles 26(1) points (a) and(b), 27to29, 36(1) point (f)
and42ofCRR
A.1.1.1 Ofwhich: CET1instrumentssubscribed byGovernment 0 0 0 0 0 0 0 - -
A.1.2 Retained earnings 3,036 3,108 3,227 3,347 2,544 2,387 2,307 CA1 {1.1.1.2} Articles 26(1) point (c), 26(2) and36 (1) points (a) and(l)
ofCRR
A.1.3 Accumulated other comprehensive income 168 122 94 76 -1,511 -1,019 -1,170 CA1 {1.1.1.3} Articles 4(100), 26(1) point (d) and 36 (1) point (l) of CRR
A.1.3.1 Ofwhich: arising from unrealised gains/lossesfrom Sovereign exposure in AFS
portfolio85 85 85 85 -1,477 -914 -1,018 - -
A.1.3.2 Ofwhich: arising from unrealised gains/lossesfrom the rest ofAFS portfolio 83 37 10 -9 -34 -105 -152 - -
A.1.4 Other Reserves 106 106 106 106 106 106 106 CA1 {1.1.1.4} Articles 4(117) and 26(1) point (e) of CRR
A.1.5 Fundsfor generalbanking risk 0 0 0 0 0 0 0 CA1 {1.1.1.5} Articles 4(112), 26(1) point (f) and 36 (1) point (l) of CRR
A.1.6 Minorityinterest given recognition in CET1capital 11 11 11 11 11 11 11 CA1 {1.1.1.7} Article 84 of CRR
Baseline Scenario Adverse Scenario

8/10/2019 Test Stress Banca Española 2014
http://slidepdf.com/reader/full/test-stress-banca-espanola-2014 109/240
A.1.7 AdjustmentstoCET1 due toprudentialfiltersexcluding those from unrealised
gains/lossesfrom AFS portfolio29 29 29 29 29 29 29 CA1 {1.1.1.9} Articles 32 to 35 of and 36 (1) point (l) of CRR
A.1.8 AdjustmentstoCET1 due toprudentialfiltersfrom unrealised gains/lossesfrom
Sovereign Exposure in AFS portfolio-68 -68 -51 -34 1,183 549 408 -
A.1.9 (-)Intangible assets(including Goodwill) -1,539 -1,470 -1,400 -1,331 -1,470 -1,400 -1,331CA1{1.1.1.10+
1.1.1.11}
Articles 4(113), 36(1) point (b) and37of CRR. Articles
4(115), 36(1) point (b) and37point (a) of CCR
A.1.10(-)DTAs that relyon future profitabilityand donot arise from temporary
differencesnet ofassociated DTLs-315 -315 -315 -315 -315 -315 -315 CA1 {1.1.1.12} Articles 36(1) point (c) and 38 of CRR
A.1.11 (-)IRB shortfallofcredit riskadjustmentsto expected losses 0 0 0 0 0 0 0 CA1 {1.1.1.13} Articles 36(1) point (d), 40 and 159 of CRR
A.1.12 (-)Defined benefit pension fund assets -1 -1 -1 -1 -1 -1 -1 CA1 {1.1.1.14} Articles 4(109), 36(1) point (e) and 41 of CRR
A.1.13 (-)Reciprocalcrossholdingsin CET1Capital 0 0 0 0 0 0 0 CA1 {1.1.1.15} Articles 4(122), 36(1) point (g) and 44 of CRR
A.1.14 (-)Excessdeduction from AT1itemsover AT1Capital 0 0 0 0 0 0 0 CA1 {1.1.1.16} Article 36(1) point (j) of CRR
A.1.15(-)Deductionsrelated toassets which can alternativelybe subject toa 1.250%risk
weight0 0 0 0 0 0 0
CA1{1.1.1.17to
1.1.1.21}
Articles 4(36), 36(1) point (k) (i) and89to 91ofCRR;
Articles 36(1) point (k) (ii), 243(1) point (b), 244(1) point
(b) and258of CRR;Articles 36(1) point k) (iii) and379(3)
ofCRR;Art icles 36(1) point k) (iv) and153(8) ofCRRand
A.1.15.1 Ofwhich: from securitisation positions(-) 0 0 0 0 0 0 0 CA1 {1.1.1.18.1} Articles 36(1) point (k) (ii), 243(1) point (b), 244(1) point
(b) and258of CRR
A.1.16(-)Holdingsof CET1capitalinstrumentsof financialsector entitieswhere the
institiution does not have a significant investment0 0 0 0 0 0 0 CA1 {1.1.1.22}
Articles 4(27), 36(1) point (h);43to46, 49(2) and (3) and
79ofCRR
A.1.17(-)Deductible DTAsthat rely on future profitabilityand arise from temporary
differences0 0 0 0 0 0 0 CA1 {1.1.1.23}
Articles 36(1) point (c) and38;Articles 48(1) point (a) and
48(2) ofCRR
A.1.18(-)Holdingsof CET1capitalinstrumentsof financialsector entitieswhere the
institiution has a significant investment0 0 0 0 0 0 0 CA1 {1.1.1.24}
Articles 4(27);36(1) point (i);43, 45;47; 48(1) point (b);
49(1) to(3) and79of CRR
A.1.19 (-)Amount exceding the 17.65%threshold 0 0 0 0 0 0 0 CA1 {1.1.1.25} Article 470 of CRR
A.1.20 Transitionaladjustments 596 586 468 355 651 536 413CA1{1.1.1.6+ 1.1.8+
1.1.26}-
A.1.20.1 Transitionaladjustmentsdue tograndfathered CET1Capitalinstruments(+/-) 0 0 0 0 0 0 0 CA1 {1.1.1.6}
Articles 483(1) to(3), and484to487of CRR
A.1.20.2 Transitionaladjustmentsdue toadditionalminorityinterests(+/-) 30 30 22 16 30 22 16 CA1 {1.1.1.8}
Articles 479and480of CRR
A.1.20.3 Other transitionaladjustmentsto CET1Capitalexcl. adjustmentsfor Sovereignexposure in AFS (+/-)566 557 445 340 621 514 397 CA1 {1.1.1.26}
Articles 469to472, 478and 481ofCRR
A.2 ADDITIONAL TIER 1CAPITAL (net ofdeductionsand after transitional
adjustments)624 680 783 841 680 783 841 C A 1 {1 .1 .2 } A rt ic le 6 1 of C RR
A.2.1 Ofwhich:(+) Other existing support government measures 0 0 0 0 0 0 0 - -
A.3 TIER1 CAPITAL(netofdeductionsandafter transitional adjustments) 8,852 8,952 9,084 9,216 8,112 7,871 7,501 C A1 { 1. 1} A rt ic le 2 5 of C RR
A.4 TIER2 CAPITAL(netofdeductionsandafter transitional adjustments) 890 775 663 546 772 656 539 C A1 { 1. 2} A rt ic le 7 1 of C RR
B T OT AL R IS K EX PO SU RE A M OU NT 80,189 81,225 81,678 81,997 79,945 79,701 79,914 C A 2 {1 } A rt ic le s 92 (3 ), 95 , 96 a n d 98 o f CR R
B.1ofwhich:stemming from exposuresthat fallbelow the 10%/ 15%limitsfor
CET1deduction (+)2,054 0 0 0 0 0 0
Articles 36(1) points (a) and(i);Article 38a ndArticle 48of
CRR
B. 2 ofwh ich :s temmi ng f r om fr om CVAcap ita l r eq ui r ements (+) 0 0 0 0 0 0 0 Article 381to386 ofCRR
B.3ofwhich:stemming from higher asset correlation parameter against exposures
tolarge financialinstitutionsunder IRB the IRB approachesto credit risk(+)0 0 0 0 0 0 0 Articles 153(2) ofCRR
B.4ofwhich:stemming from the application ofthe supporting factor to increase
lending toSMEs(-)0 0 0 0 0 0 0 Recital (44) ofCRR
B.5
ofwhich:stemming from the effect of exposuresthat were previouslypart of
RiskExposure amount and receive a deduction treatment under CRR/CRDIV (-
)
0 0 0 0 0 0 0 -
B.6 ofwhich:otherssubject tothe discretion ofNationalCompetent Authorities 0 0 0 0 0 0 0 Article 124to164 ofCRR
C.1 Co mm onE q ui tyTi er 1Cap i tal r ati o 10.26% 10.18% 10.16% 10.21% 9.30% 8.89% 8.33% CA3 {1} -
C .2 T ie r 1 C ap it al ra ti o 11.04% 11.02% 11.12% 11.24% 10.15% 9.88% 9.39% CA3 { 3} -
C .3 T ot al C ap it al r at io 12.15% 11.98% 11.93% 11.91% 11.11% 10.70% 10.06% CA3 { 5} -
D Co mm onE q ui tyTi er 1Cap i tal Thresho ld 6,498 6,534 6,560 4,397 4,384 4,395
ETotalamount of instrumentswith mandatoryconversion intoordinarysharesupon
a fixed date in the 2014 -2016period (cumulative conversions)(1)18 773 842 18 773 842
F
TotalAdditionalTier 1and Tier 2 instrumentseligible asregulatorycapitalunder
the CRR provisionsthat convert into Common EquityTier 1or are written down
upon a trigger event (2)
0 0 0
F.1Ofwhich: eligible instrumentswhose trigger isabove CET1capitalratio in the
adverse scenario(2)0 0 0
G FullyLoadedCommonEquityTier 1Capital ratio (3) 9.78% 7.82%
(1)Conversionsnot considered for CET1 computation (2)Excluding instrumentsincluded in E (3)Memorandum item based on a fullyimplemented CRR/CRD IV definition of Common EquityTier 1 capitalincluding 60%ofunrealised gains/lossesfrom Sovereign Exposure in AFS portfolio
Memorandumitems
OWN FUNDS
OWN FUNDS
REQUIREMENTS
CAPITALRATIOS(%) -
Transitional period
http://www.economiaciudadana.org/
2014 EU-wide Stress Test - Restructuring scenarios
(mln EUR)
2013 0 0
2014 10 244 10 244Restructuring plan in Banco Gallego (decrease in branches and offices) and
Effects of mandatory restructuring plans publicly announced before 31 December 2013 and formally agreed with the European Commission.
Baseline scenario Adverse scenarioNarrative description of the transactions. (type, date of
completion/commitment, portfolios, subsidiaries, branches)CET1 impact
Risk exposure
amount impactCET1 impact
Risk exposure
amount impact

8/10/2019 Test Stress Banca Española 2014
http://slidepdf.com/reader/full/test-stress-banca-espanola-2014 110/240
2014 10 -244 10 -244g p g ( )
restructuring plan of Banco CAM (decrease in real estate exposure)
2015 3 -244 3 -244
2016 0 0 0 0Total 13 -488 13 -488
http://www.economiaciudadana.org/
2014 EU-wide Stress Test
Outcome of the Stress Test based on the Restructuring plan for banks whose plan was formally agreed with the European Commission after 31 December 2013
(mln EUR)
As of
31/12/2013
As of
31/12/2014
As of
31/12/2015
As of
31/12/2016
As of
31/12/2014
As of
31/12/2015
As of
31/12/2016
COMMON EQUITY TIER 1 CAPITAL (net of deductions and after applying transitional adjustments)
Baseline scenario Adverse scenario

8/10/2019 Test Stress Banca Española 2014
http://slidepdf.com/reader/full/test-stress-banca-espanola-2014 111/240
TOTAL RISK EXPOSURE AMOUNT
COMMON EQUITY TIER 1 RATIO #DIV/0! #DIV/0! #DIV/0! #DIV/0! #DIV/0! #DIV/0! #DIV/0!
http://www.economiaciudadana.org/
2014 EU-wide Stress Test
Impact on Common
Equity Tier 1
Major Capital Measures from 1 January to 30 September 2014
Issuance of CET 1 Instruments
Major Capital Measures Impacting Tier 1 and Tier 2 Eligible Capital from 1 January 2014 to 30 September 2014

8/10/2019 Test Stress Banca Española 2014
http://slidepdf.com/reader/full/test-stress-banca-espanola-2014 112/240
Equity Tier 1
Million EUR
Raising of capital instruments eligible as CET1 capital (+) 0
Repayment of CET1 capital, buybacks (-) 0
Conversion to CET1 of hybrid instruments becoming effective between 1 January and 30 September 2014 (+) 6
Impact on Additional
Tier 1 and Tier 2
Million EUR
Net issuance of Additional Tier 1 and T2 Instruments with a trigger at or above bank's post stress test CET1 ratio in the adverse
scenario during the stress test horizon (+/-)0
Net issuance of Additional Tier 1 and T2 Instrument with a trigger below bank's post stress test CET1 ratio in the adverse
scenario during the stress test horizon (+/-)0
Million EUR
Realized fines/litigation costs from 1 January to 30 September 2014 (net of provisions) (-) 0
Other material losses and provisions from 1 January to 30 September 2014 (-) 0
Losses
Net issuance of Additional Tier 1 and T2 Instruments
Issuance of CET 1 Instruments
http://www.economiaciudadana.org/

8/10/2019 Test Stress Banca Española 2014
http://slidepdf.com/reader/full/test-stress-banca-espanola-2014 113/240
Actual figures as of 31 December 2013 mln EUR, % Actual figures as of 31 December 2013 mln EUR, %
Operating profit before impairments 2,336 Operating profit before impairments 2,336
Impairment losses on financial and non-financial assets in the banking book 1,450 Impairment losses on financial and non-financial assets in the banking book 1,450
Common Equity Tier 1 capital (1) 11,175 Common Equity Tier 1 capital (1) 11,175
Total Risk Exposure (1) 105,414 Total Risk Exposure (1) 105,414
Common Equity Tier 1 ratio, % (1) 10.6% Common Equity Tier 1 ratio, % (1) 10.6%
O t f th d i f 31 D b 2016 l EUR % O t f th b li i f 31 D b 2016 l EUR %
2014 EU-wide Stress Test 2014 EU-wide Stress TestSummary Baseline Scenario
ES - Banco Financiero y de Ahorros, S.A.
Summary Adverse Scenario
ES - Banco Financiero y de Ahorros, S.A.

8/10/2019 Test Stress Banca Española 2014
http://slidepdf.com/reader/full/test-stress-banca-espanola-2014 114/240
Outcome of the adverse scenario as of 31 December 2016 mln EUR, % Outcome of the baseline scenario as of 31 December 2016 mln EUR, %
3 yr cumulative operating profit before impairments 4,203 3 yr cumulative operating profit before impairments 6,155
3 yr cumulative impairment losses on financial and non-financial assets in the banking book 5,374 3 yr cumulative impairment losses on financial and non-financial assets in the banking book 3,015
3 yr cumulative losses from the stress in the trading book 456 3 yr cumulative losses from the stress in the trading book 283
Valuation losses due to sovereign shock after tax and prudential filters 535 Common Equity Tier 1 capital (1) 13,490
Common Equity Tier 1 capital (1) 10,225 Total Risk Exposure (1) 94,372
Total Risk Exposure (1) 99,309 Common Equity Tier 1 ratio, % (1) 14.3%
Common Equity Tier 1 ratio, % (1) 10.3%
Memorandum items mln EUR
Memorandum items mln EUR Common EU wide CET1 Threshold (8.0%) 7,550
Common EU wide CET1 Threshold (5.5%) 5,462
Total amount of instruments with mandatory conversion into ordinary shares upon a fixed date in
the 2014 -2016 period (cumulative conversions) (2)0
Total Additional Tier 1 and Tier 2 instruments eligible as regulatory capital under the CRR provisions
that convert into Common Equity Tier 1 or are written down upon a trigger event (3)0
Of which: eligible instruments whose trigger is above CET1 capital ratio in the adverse
scenario (3)0
(2) Conversions not considered for CET1 computation
(3) Excluding instruments with mandatory conversion into ordinary shares upon a fixed date in the 2014 -2016 period
(1) According to CRR/CRD4 definition transitional arrangements as per reporting date. Figures as of 31/12/2013 computed as of first day of application:
01/01/2014.
(1) According to CRR/CRD4 definition transitional arrangements as per reporting date. Figures as of 31/12/2013 computed as of first day of application:
01/01/2014.
http://www.economiaciudadana.org/
2014 EU-wide Stress TestCredit Risk
(mln EUR, %)
No n-d ef aul t ed De fau lt e d No n-d ef aul t ed De fau lt e d No n-d ef aul t ed De fau lt e d No n-d ef aul t e d De fau lt e d No n-d ef aul t ed De fau lt e d No n-d ef aul t e d De fau lt e d No n-d ef aul t ed De fau lt e d No n-d ef aul t ed De fau lt e d No n-d ef aul t ed De fau lt e dImpairment
rate
Stockof
ProvisionsCoverage Ratio -
Default Stock
Impairment
rate
Stockof
Provisions
Coverage
Ratio-Default
Stock
Impairment
rate
Stockof
Provisions
Coverage
Ratio -Default
Stock
Impairment rateStockof
Provisions
Coverage
Ratio-Default
Stock
Impairment
rate
Stockof
Provisions
Coverage
Ratio-Default
Stock
Impairment
rate
Stockof
Provisions
Coverage
Ratio -Default
Stock
Central banksandcentral governments 0 0 0 0 79,020 0 0 0 0 0 760 0 0 0 0 0 33 0 0.28% 136 36.25% 0.29% 241 36.21% 0.29% 343 36.18% 0.78% 322 42.55% 0.93% 650 42.43% 0.93% 972 42.46%
Institutions 2,728 212 9,030 153 7,560 43 2,270 0 3,134 71 1,232 52 22 84 4 29 14 12 0.50% 218 32.61% 0.41% 266 33.61% 0.34% 310 34.20% 0.60% 228 32.26% 0.65% 302 33.27% 0.61% 374 33.85%
Corporates 0 0 25,332 6,627 9,950 3,744 0 0 15,184 1,844 8,591 2,669 0 0 636 3,302 397 2,892 1.14% 7,606 54.54% 0.97% 7,982 52.75% 0.81% 8,321 51.14% 1.61% 7,770 53.65% 1.92% 8,428 50.89% 1.62% 8,989 48.66%
Corporates -Of Which:SpecialisedLending 0 0 0 0 6,372 1 ,214 0 0 0 0 5,439 0 0 0 0 0 113 726 - 0 - - 0 - - 0 - - 0 - - 0 - - 0 -
Corporates -Of Which:SME 0 0 6,485 3,110 2,789 1,962 0 0 4,303 729 2,007 2,076 0 0 181 1,671 216 1,819 - 0 - - 0 - - 0 - - 0 - - 0 - - 0 -
Retail 0 0 54,024 5,201 27,256 2,120 0 0 17,758 1,236 11,772 2,223 0 0 194 1,706 162 1,142 0.39% 3,637 37.48% 0.34% 3,882 36.15% 0.31% 4,112 35.15% 0.64% 3,985 38.61% 0.66% 4,460 36.72% 0.63% 4,896 35.32%
Retail -Securedon real estateproperty 59.3% 0 0 47,530 4,661 25,129 1,996 0 0 15,168 1,146 10,273 2,085 0 0 166 1,446 120 1,029 0.33% 3,080 35.64% 0.28% 3,261 34.20% 0.26% 3,430 33.12% 0.54% 3,378 36.92% 0.57% 3,747 34.86% 0.56% 4,090 33.38%
Retail -Securedon real estate property- Of
h i h : S E49.5% 0 0 1,332 618 2,173 429 0 0 533 69 1,594 451 0 0 22 224 36 250 0.20% 554 44.15% 0.31% 556 43.44% 0.27% 563 42.60% 0.36% 563 42.85% 0.63% 574 41.53% 0.63% 587 40.34%
Retail -Securedon real estate property- Of
h i h: n n - E59.9% 0 0 46,198 4,042 22,956 1,566 0 0 14,635 1,077 8,679 1,634 0 0 143 1,221 83 779 0.34% 2,527 34.20% 0.28% 2,705 32.78% 0.26% 2,867 31.75% 0.55% 2,815 35.92% 0.57% 3,173 33.87% 0.56% 3,502 32.44%
Retail -QualifyingRevolving 0 0 2,806 21 170 4 0 0 715 1 127 4 0 0 3 11 1 4 0.68% 43 55.14% 0.62% 60 53.24% 0.56% 74 52.38% 0.94% 50 54.28% 0.88% 75 52.91% 0.77% 94 52.24%
Retail -OtherRetail 0 0 3,688 519 1,957 120 0 0 1,875 89 1,372 134 0 0 25 249 42 109 1.01% 514 54.14% 1.00% 561 53.12% 0.92% 607 52.10% 1.75% 556 53.07% 1.74% 639 52.07% 1.59% 712 50.92%
Retail -Other Retail -Of Which:SME 0 0 1,694 294 1,006 83 0 0 858 73 609 94 0 0 18 141 13 83 1.07% 285 56.15% 1.13% 307 55.16% 1.06% 328 53.89% 2.26% 317 54.61% 2.18% 360 53.72% 2.03% 398 52.33%
Retail -Other Retail -Of Which:non-SME 0 0 1,994 224 952 37 0 0 1,017 16 764 39 0 0 7 108 28 26 0.96% 230 51.41% 0.89% 255 50.51% 0.80% 279 49.89% 1.28% 240 50.81% 1.39% 279 49.80% 1.26% 314 49.03%
Equity 2,107 76 0 0 0 0 5,646 193 0 0 0 0 0 0 0 0 0 0 3.90% 82 49.00% 2.47% 94 730.17% 1.81% 99 531.31% 5.06% 107 54.70% 3.86% 124 628.53% 2.84% 132 462.76%
Securitisation 2,835 0 0 0 2,010 0 770 0 0 0 1,715 0 96 0 0 0 174 0
Othernon-credit obligation assets 0 0 0 0 12,512 2,464 0 0 0 0 14,335 2,485 0 0 0 0 1,094 19
TOTAL 7,670 288 88,386 11,981 138,308 8,371 8,686 193 36,075 3,150 38,405 7,429 118 84 834 5,037 1,873 4,067 0.57% 11,679 46.85% 0.48% 12,465 45.42% 0.43% 13,185 43.98% 0.92% 12,411 46.75% 1.00% 13,964 44.66% 0.93% 15,365 42.82%
Securitisation andre-securitisations positions deductedfrom capital * 0 0 22 0 18 0 0 0 0 0 0 0
(mln EUR, %)No n-d ef aul t ed De fau lt e d No n-d ef aul t ed De fau lt e d No n-d ef aul t ed De fau lt e d No n-d ef aul t e d De fau lt e d No n-d ef aul t ed De fau lt e d No n-d ef aul t e d De fau lt e d No n-d ef aul t ed De fau lt e d No n-d ef aul t ed De fau lt e d No n-d ef aul t ed De fau lt e d
Impairment
rate
Stockof
ProvisionsCoverage Ratio -
Default Stock
Impairment
rate
Stockof
Provisions
Coverage
Ratio-DefaultStock
Impairment
rate
Stockof
Provisions
Coverage
Ratio -DefaultStock
Impairment rateStockof
Provisions
Coverage
Ratio-DefaultStock
Impairment
rate
Stockof
Provisions
Coverage
Ratio-DefaultStock
Impairment
rate
Stockof
Provisions
Coverage
Ratio -DefaultStock
Central banksandcentral governments 0 0 0 0 60,284 0 0 0 0 0 575 0 0 0 0 0 33 0 0.30% 135 36.15% 0.31% 238 36.11% 0.30% 339 36.07% 0.66% 255 37.25% 0.80% 516 37.50% 0.80% 772 37.60%
Institutions 2,728 212 4,312 141 7,525 43 2,270 0 2,631 65 1,232 52 22 84 4 20 14 12 0.79% 208 32.17% 0.64% 255 33.63% 0.54% 297 34.56% 0.93% 217 32.06% 1.02% 288 33.82% 0.97% 357 34.90%
Corporates 0 0 22,432 6,155 7,514 3,114 0 0 13,903 1,685 6,596 2,619 0 0 598 2,933 323 2,626 1.26% 6,839 54.24% 1.07% 7,204 52.39% 0.88% 7,533 50.76% 1.76% 6,989 53.34% 2.09% 7,620 50.54% 1.77% 8,162 48.31%
Corporates -Of Which:SpecialisedLending 0 0 0 0 4,160 628 0 0 0 0 3,618 0 0 0 0 0 43 494 - 0 - - 0 - - 0 - - 0 - - 0 - - 0 -
C t Of Whi h SME 0 0 6 126 2 734 2 605 1 918 0 0 4 067 610 1 871 2 028 0 0 174 1 343 212 1 784 0 0 0 0 0 0
Risk exposureamounts(as of31/12/2013)
asof 31/12/2016
AdverseScenario
F-IRB A-IRB STA F-IRB A-IRB STA F-IRB A-IRB STA as of 31/12/2014 as of 31/12/2015 as of 31/12/2016 as of 31/12/2014 as of 31/12/2015 as of 31/12/2016LTV %(asof
31/12/2013)
Exposurevalues(as of31/12/2013)
ES - Banco Financiero y de
Ahorros, S.A.
(*)Referstothepart ofSecuritizationexposurethat isdeductedfrom capital andisnot includedinRWA
Valueadjustmentsand provisions(asof 31/12/2013) BaselineScenario
LTV %(asof
31/12/2013)
Exposure values (as of 31/12/2013) Risk exposure amounts (as of 31/12/2013) Value adjustments and provisions (as of 31/12/2013) Adverse Scenario
F-IRB A-IRB STA F-IRB A-IRB STA F-IRB A-IRB STA
BaselineScenario
as of 31/12/2014 as of 31/12/2015 as of 31/12/2016 as of 31/12/2014 as of 31/12/2015

8/10/2019 Test Stress Banca Española 2014
http://slidepdf.com/reader/full/test-stress-banca-espanola-2014 115/240
Corporates -Of Which:SME 0 0 6,126 2,734 2,605 1,918 0 0 4,067 610 1,871 2,028 0 0 174 1,343 212 1,784 - 0 - - 0 - - 0 - - 0 - - 0 - - 0 -
Retail 0 0 53,615 5,134 25,482 2,038 0 0 17,636 1,216 10,997 2,139 0 0 191 1,682 148 1,109 0.40% 3,558 37.53% 0.34% 3,806 36.16% 0.31% 4,033 35.17% 0.64% 3,895 38.68% 0.66% 4,371 36.75% 0.62% 4,794 35.43%
Retail -Securedon real estateproperty 59.4% 0 0 47,149 4,596 23,643 1,915 0 0 15,058 1,126 9,641 2,003 0 0 163 1,423 109 998 0.34% 3,009 35.68% 0.28% 3,190 34.20% 0.26% 3,358 33.13% 0.54% 3,299 36.99% 0.57% 3,665 34.90% 0.55% 3,997 33.50%
Retail -Securedon real estate property- Of
h i h : S E46.9% 0 0 1,330 610 1,708 426 0 0 532 66 1,364 448 0 0 22 219 32 249 0.23% 543 44.30% 0.31% 548 43.34% 0.27% 555 42.50% 0.41% 552 43.07% 0.62% 566 41.44% 0.62% 580 40.25%
Retail -Securedon real estate property- Of
h i h: n n - E60.0% 0 0 45,819 3,986 21,935 1,489 0 0 14,525 1,060 8,278 1,555 0 0 141 1,204 77 749 0.34% 2,466 34.22% 0.28% 2,643 32.78% 0.26% 2,803 31.76% 0.55% 2,747 35.96% 0.57% 3,099 33.92% 0.55% 3,417 32.57%
Retail -QualifyingRevolving 0 0 2,793 21 169 4 0 0 711 1 127 4 0 0 3 11 1 4 0.68% 42 55.12% 0.62% 59 53.23% 0.56% 74 52.38% 0.94% 50 54.25% 0.88% 74 52.91% 0.75% 93 52.25%
Retail -OtherRetail 0 0 3,673 517 1,670 119 0 0 1,867 89 1,229 132 0 0 24 247 39 107 1.04% 506 54.17% 1.00% 556 52.82% 0.92% 601 51.84% 1.78% 546 53.13% 1.73% 631 51.73% 1.56% 704 50.67%Retail -Other Retail -Of Which:SME 0 0 1,683 294 751 82 0 0 853 73 482 93 0 0 18 141 11 82 1.14% 279 56.24% 1.13% 302 54.70% 1.06% 324 53.47% 2.38% 309 54.76% 2.18% 354 53.19% 1.99% 391 51.93%
Retail -Other Retail -Of Which:non-SME 0 0 1,990 223 919 37 0 0 1,015 15 747 39 0 0 7 107 28 26 0.95% 227 51.39% 0.89% 253 50.43% 0.80% 277 49.82% 1.27% 237 50.79% 1.39% 277 49.73% 1.24% 312 48.99%
Equity 2,107 76 0 0 0 0 5,646 193 0 0 0 0 0 0 0 0 0 0 3.90% 82 49.00% 2.47% 94 730.17% 1.81% 99 531.31% 5.06% 107 54.70% 3.86% 124 628.53% 2.84% 132 462.76%
Securitisation 1,835 0 0 0 2,010 0 693 0 0 0 1,715 0 6 0 0 0 174 0
Othernon-credit obligation assets 0 0 0 0 10,937 2,464 0 0 0 0 12,889 2,485 0 0 0 0 1,094 19
TOTAL 6,669 288 80,359 11,430 113,753 7,659 8,608 193 34,170 2,965 34,003 7,295 28 84 793 4,636 1,786 3,767 0.61% 10,821 46.36% 0.51% 11,597 44.93% 0.45% 12,300 43.52% 0.94% 11,464 46.22% 1.01% 12,919 44.06% 0.94% 14,216 42.24%Securitisation andre-securitisations positions deductedfrom capital * 0 0 22 0 18 0 0 0 0 0 0 0
(mln EUR, %)No n-d ef aul t ed De fau lt e d No n-d ef aul t ed De fau lt e d No n-d ef aul t ed De fau lt e d No n-d ef aul t e d De fau lt e d No n-d ef aul t ed De fau lt e d No n-d ef aul t e d De fau lt e d No n-d ef aul t ed De fau lt e d No n-d ef aul t ed De fau lt e d No n-d ef aul t ed De fau lt e d
Impairment
rate
Stockof
ProvisionsCoverage Ratio -
Default Stock
Impairment
rate
Stockof
Provisions
CoverageRatio-Default
Stock
Impairment
rate
Stockof
Provisions
CoverageRatio -Default
Stock
Impairment rateStockof
Provisions
CoverageRatio-Default
Stock
Impairment
rate
Stockof
Provisions
CoverageRatio-Default
Stock
Impairment
rate
Stockof
Provisions
CoverageRatio -Default
Stock Central banksandcentral governments 0 0 0 0 15,075 0 0 0 0 0 0 0 0 0 0 0 0 0 - 0 - - 0 - - 0 - - 0 - - 0 - - 0 -
Institutions 0 0 66 0 34 0 0 0 0 0 0 0 0 0 0 0 0 0 0.13% 0 32.80% 0.13% 0 32.60% 0.13% 0 32.41% 0.22% 0 34.09% 0.32% 0 34.34% 0.31% 1 34.14%
Corporates 0 0 332 33 35 0 0 0 162 8 35 0 0 0 1 25 0 0 0.48% 26 70.76% 0.49% 27 65.38% 0.46% 28 60.46% 0.71% 26 68.32% 0.91% 28 60.06% 0.88% 29 53.61%
Corporates -Of Which:SpecialisedLending 0 0 0 0 0 0 0 0 0 0 0 0 0 0 0 0 0 0 - 0 - - 0 - - 0 - - 0 - - 0 - - 0 -
Corporates -Of Which:SME 0 0 0 3 3 0 0 0 0 0 8 0 0 0 0 0 2 5 0 0 - 0 - - 0 - - 0 - - 0 - - 0 - - 0 -
Retail 0 0 1 1 1 0 0 0 0 0 1 0 0 0 0 0 0 0 0.06% 0 41.53% 0.05% 0 41.06% 0.05% 0 40.65% 0.09% 0 45.84% 0.10% 0 44.97% 0.08% 0 44.31%
Retail -Securedon real estateproperty 42.3% 0 0 1 1 1 0 0 0 0 0 1 0 0 0 0 0 0 0 0.04% 0 41.53% 0.04% 0 41.06% 0.04% 0 40.65% 0.07% 0 45.85% 0.08% 0 44.97% 0.07% 0 44.32%
Retail -Securedon real estate property- Of
hi h: E2.7% 0 0 0 0 0 0 0 0 0 0 0 0 0 0 0 0 0 0 0.12% 0 6.52% 0.12% 0 6.53% 0.11% 0 6.54% 0.20% 0 6.99% 0.23% 0 6.99% 0.21% 0 7.00%
Retail -Securedon real estate property- Of
h i h : n n -S E42.6% 0 0 1 1 1 0 0 0 0 0 0 0 0 0 0 0 0 0 0.04% 0 41.56% 0.04% 0 41.10% 0.03% 0 40.70% 0.07% 0 45.89% 0.08% 0 45.05% 0.06% 0 44.42%
Retail -QualifyingRevolving 0 0 0 0 0 0 0 0 0 0 0 0 0 0 0 0 0 0 0.59% 0 48.82% 0.55% 0 48.81% 0.51% 0 48.83% 0.69% 0 49.30% 0.79% 0 49.48% 0.67% 0 49.48%
Retail -OtherRetail 0 0 0 0 0 0 0 0 0 0 0 0 0 0 0 0 0 0 0.81% 0 28.68% 0.76% 0 26.68% 0.71% 0 25.86% 0.97% 0 29.06% 1.06% 0 27.19% 0.93% 0 26.46%
Retail -Other Retail -Of Which:SME 0 0 0 0 0 0 0 0 0 0 0 0 0 0 0 0 0 0 3.92% 0 47.08% 3.76% 0 51.25% 3.71% 0 53.88% 5.35% 0 53.54% 5.25% 0 54.32% 5.12% 0 55.22%
Retail -Other Retail -Of Which:non-SME 0 0 0 0 0 0 0 0 0 0 0 0 0 0 0 0 0 0 0.64% 0 26.17% 0.60% 0 23.51% 0.55% 0 22.39% 0.72% 0 25.44% 0.84% 0 23.43% 0.72% 0 22.58%
Equity 0 0 0 0 0 0 0 0 0 0 0 0 0 0 0 0 0 0 - 0 - - 0 - - 0 - - 0 - - 0 - - 0 -
Securitisation 0 0 0 0 0 0 0 0 0 0 0 0 0 0 0 0 0 0
Othernon-credit obligation assets 0 0 0 0 0 0 0 0 0 0 0 0 0 0 0 0 0 0
TOTAL 0 0 400 34 15,146 0 0 0 162 9 36 0 0 0 1 26 0 0 0.36% 27 69.77% 0.37% 27 64.40% 0.35% 28 59.54% 0.54% 27 67.40% 0.71% 29 59.17% 0.69% 30 52.83%
Securitisation andre-securitisations positions deductedfrom capital * 0 0 0 0 0 0 0 0 0 0 0 0
(mln EUR, %)No n-d ef aul t ed De fau lt e d No n-d ef aul t ed De fau lt e d No n-d ef aul t ed De fau lt e d No n-d ef aul t e d De fau lt e d No n-d ef aul t ed De fau lt e d No n-d ef aul t e d De fau lt e d No n-d ef aul t ed De fau lt e d No n-d ef aul t ed De fau lt e d No n-d ef aul t ed De fau lt e d
Impairment
rate
Stockof
ProvisionsCoverage Ratio -
Default Stock
Impairment
rate
Stockof
Provisions
CoverageRatio-Default
Stock
Impairment
rate
Stockof
Provisions
CoverageRatio -Default
Stock
Impairment rateStockof
Provisions
CoverageRatio-Default
Stock
Impairment
rate
Stockof
Provisions
CoverageRatio-Default
Stock
Impairment
rate
Stockof
Provisions
CoverageRatio -Default
Stock Central banksandcentral governments 0 0 0 0 1,145 0 0 0 0 0 183 0 0 0 0 0 0 0 0.01% 0 36.25% 0.01% 0 36.25% 0.01% 0 36.25% 0.01% 0 37.17% 0.02% 0 37.17% 0.02% 0 37.17%
Institutions 0 0 396 0 0 0 0 0 36 0 0 0 0 0 0 0 0 0 0.04% 0 25.33% 0.04% 0 25.69% 0.03% 0 25.29% 0.08% 0 26.17% 0.09% 1 26.59% 0.09% 1 26.32%
Corporates 0 0 48 16 450 440 0 0 23 8 366 6 0 0 1 16 15 142 0.34% 175 34.78% 0.18% 176 35.61% 0.17% 178 35.75% 0.77% 178 34.86% 0.84% 181 35.91% 0.46% 184 36.11%
Corporates -Of Which:SpecialisedLending 0 0 0 0 334 435 0 0 0 0 298 0 0 0 0 0 14 139 - 0 - - 0 - - 0 - - 0 - - 0 - - 0 -
Corporates -Of Which:SME 0 0 24 16 116 4 0 0 17 8 68 5 0 0 1 16 1 2 - 0 - - 0 - - 0 - - 0 - - 0 - - 0 -
Retail 0 0 14 0 994 7 0 0 3 0 495 7 0 0 0 0 11 3 0.16% 16 30.59% 0.27% 9 77.40% 0.25% 9 74.01% 0.34% 17 30.57% 0.45% 8 78.46% 0.38% 8 74.57%
Retail -Securedon real estateproperty 59.7% 0 0 13 0 708 7 0 0 2 0 353 6 0 0 0 0 8 2 0.01% 11 24.44% 0.15% 8 73.65% 0.14% 8 70.53% 0.01% 11 23.85% 0.25% 7 73.90% 0.21% 7 70.28%
Retail -Securedon real estate property- Of
hi h: E60.0% 0 0 0 0 459 1 0 0 0 0 229 1 0 0 0 0 4 1 0.00% 5 20.78% - 2 - - 2 - 0.00% 5 20.41% - 1 - - 1 -
Retail -Securedon real estate property- Of
h i h: n n - E59.1% 0 0 13 0 249 5 0 0 2 0 124 5 0 0 0 0 4 2 0.02% 6 29.44% 0.15% 6 73.65% 0.14% 6 70.53% 0.02% 6 30.08% 0.25% 6 73.90% 0.21% 6 70.28%
Retail -QualifyingRevolving 0 0 1 0 0 0 0 0 0 0 0 0 0 0 0 0 0 0 0.77% 0 89.13% 0.70% 0 100.00% 0.63% 0 85.86% 0.88% 0 88.09% 0.97% 0 100.00% 0.81% 0 85.96%
Retail -OtherRetail 0 0 1 0 285 1 0 0 0 0 142 1 0 0 0 0 3 0 0.56% 5 41.89% 1.67% 1 100.00% 1.57% 1 94.29% 1.19% 6 42.26% 2.82% 1 100.00% 2.51% 1 94.30%
Retail -Other Retail -Of Which:SME 0 0 0 0 254 0 0 0 0 0 126 1 0 0 0 0 2 0 0.43% 4 41.94% 1.72% 1 100.00% 1.64% 1 94.59% 1.11% 6 42.37% 3.04% 1 100.00% 2.75% 1 94.57%
Retail -Other Retail -Of Which:non-SME 0 0 0 0 32 0 0 0 0 0 16 0 0 0 0 0 0 0 1.56% 1 41.67% 1.47% 0 100.00% 1.31% 0 91.59% 1.77% 1 41.68% 1.91% 0 100.00% 1.59% 0 91.20%
Equity 0 0 0 0 0 0 0 0 0 0 0 0 0 0 0 0 0 0 - 0 - - 0 - - 0 - - 0 - - 0 - - 0 -
Securitisation 0 0 0 0 0 0 0 0 0 0 0 0 0 0 0 0 0 0
Othernon-credit obligation assets 0 0 0 0 1,574 0 0 0 0 0 1,446 0 0 0 0 0 0 0
TOTAL 0 0 458 17 4,163 447 0 0 62 8 2,489 13 0 0 1 16 26 144 0.12% 191 34.50% 0.11% 186 35.96% 0.09% 188 36.07% 0.26% 195 34.50% 0.43% 190 36.29% 0.23% 193 36.44%
Securitisation andre-securitisations positions deductedfrom capital * 0 0 0 0 0 0 0 0 0 0 0 0
(mln EUR, %)No n-d ef aul t ed De fau lt e d No n-d ef aul t ed De fau lt e d No n-d ef aul t ed De fau lt e d No n-d ef aul t e d De fau lt e d No n-d ef aul t ed De fau lt e d No n-d ef aul t e d De fau lt e d No n-d ef aul t ed De fau lt e d No n-d ef aul t ed De fau lt e d No n-d ef aul t ed De fau lt e d
Impairment
rate
Stockof
ProvisionsCoverage Ratio -
Default Stock
Impairment
rate
Stockof
Provisions
CoverageRatio-Default
Stock
Impairment
rate
Stockof
Provisions
CoverageRatio -Default
Stock
Impairment rateStockof
Provisions
CoverageRatio-Default
Stock
Impairment
rate
Stockof
Provisions
CoverageRatio-Default
Stock
Impairment
rate
Stockof
Provisions
CoverageRatio -Default
Stock Central banksandcentral governments 0 0 0 0 1,514 0 0 0 0 0 0 0 0 0 0 0 0 0 0.02% 0 45.00% 0.02% 1 45.00% 0.02% 1 45.00% 3.93% 63 98.02% 4.09% 127 98.02% 4.27% 190 98.02%
Institutions 0 0 940 0 1 0 0 0 19 0 0 0 0 0 0 0 0 0 0.01% 0 3.13% 0.01% 0 3.11% 0.01% 0 3.09% 0.01% 0 3.31% 0.02% 0 3.34% 0.02% 0 3.32%
Corporates 0 0 315 31 94 6 0 0 143 14 73 9 0 0 18 18 0 1 0.33% 40 50.07% 0.37% 43 49.15% 0.39% 46 48.10% 1.04% 41 50.10% 1.21% 47 49.12% 1.10% 51 47.74%
Corporates -Of Which:SpecialisedLending 0 0 0 0 9 4 0 0 0 0 0 7 3 0 0 0 0 0 0 0 - 0 - - 0 - - 0 - - 0 - - 0 - - 0 -
Corporates -Of Which:SME 0 0 0 0 0 6 0 0 0 0 0 9 0 0 0 0 0 1 - 0 - - 0 - - 0 - - 0 - - 0 - - 0 -
Retail 0 0 17 2 18 2 0 0 4 1 7 2 0 0 0 1 0 1 0.17% 2 41.08% 0.15% 2 39.78% 0.14% 2 38.77% 0.35% 2 41.78% 0.41% 2 38.83% 0.36% 2 37.01%
Retail -Securedon real estateproperty 51.2% 0 0 15 2 18 2 0 0 4 1 7 2 0 0 0 1 0 1 0.13% 2 40.68% 0.11% 2 39.33% 0.10% 2 38.26% 0.29% 2 41.39% 0.30% 2 38.28% 0.26% 2 36.32%
Retail -Securedon real estate property- Of
hi h: E38.5% 0 0 0 0 0 0 0 0 0 0 0 0 0 0 0 0 0 0 0.80% 0 18.71% 0.68% 0 18.53% 0.64% 0 18.41% 1.38% 0 18.50% 1.16% 0 18.27% 1.08% 0 18.11%
Retail -Securedon real estate property- Of
h i h : n n -S E51.4% 0 0 15 2 18 2 0 0 3 1 7 2 0 0 0 1 0 1 0.12% 2 40.80% 0.10% 2 39.53% 0.09% 2 38.52% 0.27% 2 41.60% 0.29% 2 38.56% 0.25% 2 36.64%
Retail -QualifyingRevolving 0 0 1 0 0 0 0 0 0 0 0 0 0 0 0 0 0 0 0.94% 0 55.52% 0.84% 0 52.77% 0.75% 0 51.73% 1.12% 0 54.93% 1.23% 0 52.59% 1.01% 0 51.76%
Retail -OtherRetail 0 0 1 0 0 0 0 0 0 0 0 0 0 0 0 0 0 0 0.76% 0 71.33% 0.91% 0 62.96% 0.94% 0 58.47% 1.58% 0 64.63% 2.86% 0 56.22% 2.88% 0 53.03%
Retail -Other Retail -Of Which:SME 0 0 1 0 0 0 0 0 0 0 0 0 0 0 0 0 0 0 0.72% 0 48.76% 0.91% 0 47.24% 0.96% 0 46.43% 1.67% 0 49.06% 3.16% 0 48.46% 3.23% 0 47.77%
Retail -Other Retail -Of Which:non-SME 0 0 0 0 0 0 0 0 0 0 0 0 0 0 0 0 0 0 0.97% 0 82.32% 0.89% 0 77.85% 0.83% 0 74.62% 1.08% 0 80.79% 1.23% 0 74.93% 1.05% 0 71.21%
Equity 0 0 0 0 0 0 0 0 0 0 0 0 0 0 0 0 0 0 - 0 - - 0 - - 0 - - 0 - - 0 - - 0 -
Securitisation 0 0 0 0 0 0 0 0 0 0 0 0 0 0 0 0 0 0
Othernon-credit obligation assets 0 0 0 0 0 0 0 0 0 0 0 0 0 0 0 0 0 0
TOTAL 0 0 1,271 33 1,627 8 0 0 167 15 80 11 0 0 18 19 0 2 0.05% 42 47.08% 0.05% 45 44.56% 0.05% 49 42.38% 2.33% 107 74.95% 2.36% 176 79.38% 2.34% 244 81.15%
Securitisation andre-securitisations positions deductedfrom capital * 0 0 0 0 0 0 0 0 0 0 0 0
(mln EUR, %)No n-d ef aul t ed De fau lt e d No n-d ef aul t ed De fau lt e d No n-d ef aul t ed De fau lt e d No n-d ef aul t e d De fau lt e d No n-d ef aul t ed De fau lt e d No n-d ef aul t e d De fau lt e d No n-d ef aul t ed De fau lt e d No n-d ef aul t ed De fau lt e d No n-d ef aul t ed De fau lt e d
Impairment
rate
Stockof
ProvisionsCoverage Ratio -
Default Stock
Impairment
rate
Stockof
Provisions
CoverageRatio-Default
Stock
Impairment
rate
Stockof
Provisions
CoverageRatio -Default
Stock
Impairment rateStockof
Provisions
CoverageRatio-Default
Stock
Impairment
rate
Stockof
Provisions
CoverageRatio-Default
Stock
Impairment
rate
Stockof
Provisions
CoverageRatio -Default
Stock Central banksandcentral governments 0 0 0 0 0 0 0 0 0 0 0 0 0 0 0 0 0 0 - 0 - - 0 - - 0 - - 0 - - 0 - - 0 -
Institutions 0 0 0 0 0 0 0 0 0 0 0 0 0 0 0 0 0 0 - 0 - - 0 - - 0 - - 0 - - 0 - - 0 -Corporates 0 0 0 0 0 0 0 0 0 0 0 0 0 0 0 0 0 0 - 0 - - 0 - - 0 - - 0 - - 0 - - 0 -
Corporates -Of Which:SpecialisedLending 0 0 0 0 0 0 0 0 0 0 0 0 0 0 0 0 0 0 - 0 - - 0 - - 0 - - 0 - - 0 - - 0 -
Corporates -Of Which:SME 0 0 0 0 0 0 0 0 0 0 0 0 0 0 0 0 0 0 - 0 - - 0 - - 0 - - 0 - - 0 - - 0 -
Retail 0 0 0 0 0 0 0 0 0 0 0 0 0 0 0 0 0 0 - 0 - - 0 - - 0 - - 0 - - 0 - - 0 -
Retail -Securedon real estateproperty 0.0% 0 0 0 0 0 0 0 0 0 0 0 0 0 0 0 0 0 0 - 0 - - 0 - - 0 - - 0 - - 0 - - 0 -
Retail -Securedon real estate property- Of
hi h: E0.0% 0 0 0 0 0 0 0 0 0 0 0 0 0 0 0 0 0 0 - 0 - - 0 - - 0 - - 0 - - 0 - - 0 -
Retail -Securedon real estate property- Of
h i h: n n - E0.0% 0 0 0 0 0 0 0 0 0 0 0 0 0 0 0 0 0 0 - 0 - - 0 - - 0 - - 0 - - 0 - - 0 -
Retail -QualifyingRevolving 0 0 0 0 0 0 0 0 0 0 0 0 0 0 0 0 0 0 - 0 - - 0 - - 0 - - 0 - - 0 - - 0 -
Retail -OtherRetail 0 0 0 0 0 0 0 0 0 0 0 0 0 0 0 0 0 0 - 0 - - 0 - - 0 - - 0 - - 0 - - 0 -
Retail -Other Retail -Of Which:SME 0 0 0 0 0 0 0 0 0 0 0 0 0 0 0 0 0 0 - 0 - - 0 - - 0 - - 0 - - 0 - - 0 -
Retail -Other Retail -Of Which:non-SME 0 0 0 0 0 0 0 0 0 0 0 0 0 0 0 0 0 0 - 0 - - 0 - - 0 - - 0 - - 0 - - 0 -
Equity 0 0 0 0 0 0 0 0 0 0 0 0 0 0 0 0 0 0 - 0 - - 0 - - 0 - - 0 - - 0 - - 0 -
Securitisation 0 0 0 0 0 0 0 0 0 0 0 0 0 0 0 0 0 0
Othernon-credit obligation assets 0 0 0 0 0 0 0 0 0 0 0 0 0 0 0 0 0 0
TOTAL 0 0 0 0 0 0 0 0 0 0 0 0 0 0 0 0 0 0 - 0 - - 0 - - 0 - - 0 - - 0 - - 0 -
Securitisation andre-securitisations positions deductedfrom capital * 0 0 0 0 0 0 0 0 0 0 0 0
as of 31/12/2016 as of 31/12/2014 as of 31/12/2015 as of 31/12/2016
0
F-IRB A-IRB STA a s of 3 1/ 12 /2 01 4 a s of 3 1/ 12 /2 01 5LTV %(asof
31/12/2013)
Exposure values (as of 31/12/2013) Risk exposure amounts (as of 31/12/2013) Value adjustments and provisions (as of 31/12/2013) Baseline Scenario Adverse Scenario
F-IRB A-IRB STA F-IRB A-IRB STA
LTV %(asof
31/12/2013)
Exposure values (as of 31/12/2013) Risk exposure amounts (as of 31/12/2013) Value adjustments and provisions (as of 31/12/2013) Baseline Scenario Adverse Scenario
F-IRB A-IRB STA F-IRB A-IRB STA F-IRB a sof 31 /12 /2 01 4 a so f3 1/ 12 /2 01 5 a sof 31 /12 /2 01 6 A-IRB STA a sof 31 /1 2/ 20 14 a so f3 1/ 12 /2 01 5 a sof 31 /12 /2 01 6
LTV %(asof
31/12/2013)
Exposure values (as of 31/12/2013) Risk exposure amounts (as of 31/12/2013) Value adjustments and provisions (as of 31/12/2013) Baseline Scenario Adverse Scenario
F-IRB A-IRB STA F-IRB A-IRB STA F-IRB A-IRB a s of 3 1/ 12 /2 01 5 a s of 3 1/ 12 /2 01 6STA as of 31/12/2014 as of 31/12/2015 as of 31/12/2016 as of 31/12/2014
Baseline Scenario Adverse Scenario
F-IRB A-IRB STA F-IRB A-IRB STA F-IRB A-IRB STA as of 31/12/2014 as of 31/12/2015 as of 31/12/2016 as of 31/12/2014 as of 31/12/2015 as of 31/12/2016
Spain
LTV %(asof
31/12/2013)
E xp os ur e va lu es ( as of 3 1/ 12 /2 01 3) R is k e xp os ur e am ou nt s (a s of 3 1/ 12 /2 01 3) V al ue a dj us tm en ts a nd pr ov is io ns ( as o f3 1/ 12 /2 01 3)
(*)Referstothepart ofSecuritizationexposurethat isdeductedfrom capital andisnot includedinRWA
(*)Referstothepart ofSecuritizationexposurethat isdeductedfrom capital andisnot includedinRWA
(*)Referstothepart ofSecuritizationexposurethat isdeductedfrom capital andisnot includedinRWA
(*)Referstothepart ofSecuritizationexposurethat isdeductedfrom capital andisnot includedinRWA
(*)Referstothepart ofSecuritizationexposurethat isdeductedfrom capital andisnot includedinRWA
Luxembourg
United States
France
http://www.economiaciudadana.org/
2014 EU-wide Stress TestCredit Risk
31 1 13) 31 1 13) 31 1 13)
(mln EU
R, %)No n-d ef aul t ed De fau lt e d No n-d ef aul t ed De fau lt e d No n-d ef aul t ed De fau lt e d No n-d ef aul t e d De fau lt e d No n-d ef aul t ed De fau lt e d No n-d ef aul t e d De fau lt e d No n-d ef aul t ed De fau lt e d No n-d ef aul t ed De fau lt e d No n-d ef aul t ed De fau lt e d
Impairment
rate
Stockof
ProvisionsCoverage Ratio -
Default Stock
Impairment
rate
Stockof
Provisions
CoverageRatio-Default
Stock
Impairment
rate
Stockof
Provisions
CoverageRatio -Default
Stock
Impairment rateStockof
Provisions
CoverageRatio-Default
Stock
Impairment
rate
Stockof
Provisions
CoverageRatio-Default
Stock
Impairment
rate
Stockof
Provisions
CoverageRatio -Default
Stock Central banksandcentral governments 0 0 0 0 0 0 0 0 0 0 0 0 0 0 0 0 0 0 - 0 - - 0 - - 0 - - 0 - - 0 - - 0 -
Institutions 0 0 0 0 0 0 0 0 0 0 0 0 0 0 0 0 0 0 - 0 - - 0 - - 0 - - 0 - - 0 - - 0 -
Corporates 0 0 0 0 0 0 0 0 0 0 0 0 0 0 0 0 0 0 - 0 - - 0 - - 0 - - 0 - - 0 - - 0 -
Corporates -Of Which:SpecialisedLending 0 0 0 0 0 0 0 0 0 0 0 0 0 0 0 0 0 0 - 0 - - 0 - - 0 - - 0 - - 0 - - 0 -
Corporates -Of Which:SME 0 0 0 0 0 0 0 0 0 0 0 0 0 0 0 0 0 0 - 0 - - 0 - - 0 - - 0 - - 0 - - 0 -
Retail 0 0 0 0 0 0 0 0 0 0 0 0 0 0 0 0 0 0 - 0 - - 0 - - 0 - - 0 - - 0 - - 0 -
Retail -Securedon real estateproperty 0.0% 0 0 0 0 0 0 0 0 0 0 0 0 0 0 0 0 0 0 - 0 - - 0 - - 0 - - 0 - - 0 - - 0 -
Retail -Securedon real estate property- Of
hi h: E0.0% 0 0 0 0 0 0 0 0 0 0 0 0 0 0 0 0 0 0 - 0 - - 0 - - 0 - - 0 - - 0 - - 0 -
Retail -Securedon real estate property- Of
h i h: n n - E0.0% 0 0 0 0 0 0 0 0 0 0 0 0 0 0 0 0 0 0 - 0 - - 0 - - 0 - - 0 - - 0 - - 0 -
Retail -QualifyingRevolving 0 0 0 0 0 0 0 0 0 0 0 0 0 0 0 0 0 0 - 0 - - 0 - - 0 - - 0 - - 0 - - 0 -
Retail -OtherRetail 0 0 0 0 0 0 0 0 0 0 0 0 0 0 0 0 0 0 - 0 - - 0 - - 0 - - 0 - - 0 - - 0 -
Retail -Other Retail -Of Which:SME 0 0 0 0 0 0 0 0 0 0 0 0 0 0 0 0 0 0 - 0 - - 0 - - 0 - - 0 - - 0 - - 0 -
Retail -Other Retail -Of Which:non-SME 0 0 0 0 0 0 0 0 0 0 0 0 0 0 0 0 0 0 - 0 - - 0 - - 0 - - 0 - - 0 - - 0 -
Equity 0 0 0 0 0 0 0 0 0 0 0 0 0 0 0 0 0 0 - 0 - - 0 - - 0 - - 0 - - 0 - - 0 -
Securitisation 0 0 0 0 0 0 0 0 0 0 0 0 0 0 0 0 0 0
Othernon-credit obligation assets 0 0 0 0 0 0 0 0 0 0 0 0 0 0 0 0 0 0
TOTAL 0 0 0 0 0 0 0 0 0 0 0 0 0 0 0 0 0 0 - 0 - - 0 - - 0 - - 0 - - 0 - - 0 -
Securitisation andre-securitisations positions deductedfrom capital * 0 0 0 0 0 0 0 0 0 0 0 0
(mln EUR, %)No n-d ef aul t ed De fau lt e d No n-d ef aul t ed De fau lt e d No n-d ef aul t ed De fau lt e d No n-d ef aul t e d De fau lt e d No n-d ef aul t ed De fau lt e d No n-d ef aul t e d De fau lt e d No n-d ef aul t ed De fau lt e d No n-d ef aul t ed De fau lt e d No n-d ef aul t ed De fau lt e d
Impairment
rate
Stockof
ProvisionsCoverage Ratio -
Default Stock
Impairment
rate
Stockof
Provisions
CoverageRatio-Default
Stock
Impairment
rate
Stockof
Provisions
CoverageRatio -Default
Stock
Impairment rateStockof
Provisions
CoverageRatio-Default
Stock
Impairment
rate
Stockof
Provisions
CoverageRatio-Default
Stock
Impairment
rate
Stockof
Provisions
CoverageRatio -Default
Stock Central banksandcentral governments 0 0 0 0 0 0 0 0 0 0 0 0 0 0 0 0 0 0 - 0 - - 0 - - 0 - - 0 - - 0 - - 0 -
Institutions 0 0 0 0 0 0 0 0 0 0 0 0 0 0 0 0 0 0 - 0 - - 0 - - 0 - - 0 - - 0 - - 0 -
Corporates 0 0 0 0 0 0 0 0 0 0 0 0 0 0 0 0 0 0 - 0 - - 0 - - 0 - - 0 - - 0 - - 0 -
Corporates -Of Which:SpecialisedLending 0 0 0 0 0 0 0 0 0 0 0 0 0 0 0 0 0 0 - 0 - - 0 - - 0 - - 0 - - 0 - - 0 -
Corporates -Of Which:SME 0 0 0 0 0 0 0 0 0 0 0 0 0 0 0 0 0 0 - 0 - - 0 - - 0 - - 0 - - 0 - - 0 -
Retail 0 0 0 0 0 0 0 0 0 0 0 0 0 0 0 0 0 0 - 0 - - 0 - - 0 - - 0 - - 0 - - 0 -
Retail -Securedon real estateproperty 0.0% 0 0 0 0 0 0 0 0 0 0 0 0 0 0 0 0 0 0 - 0 - - 0 - - 0 - - 0 - - 0 - - 0 -
Retail -Securedon real estate property- Of
h i h : S E0.0% 0 0 0 0 0 0 0 0 0 0 0 0 0 0 0 0 0 0 - 0 - - 0 - - 0 - - 0 - - 0 - - 0 -
Retail -Securedon real estate property- Of
h i h: n n - E0.0% 0 0 0 0 0 0 0 0 0 0 0 0 0 0 0 0 0 0 - 0 - - 0 - - 0 - - 0 - - 0 - - 0 -
Retail -QualifyingRevolving 0 0 0 0 0 0 0 0 0 0 0 0 0 0 0 0 0 0 - 0 - - 0 - - 0 - - 0 - - 0 - - 0 -
AdverseScenario
F-IRB A-IRB STA F-IRB A-IRB STA F-IRB A-IRB STA as of 31/12/2014 as of 31/12/2015 as of 31/12/2016 as of 31/12/2014 as of 31/12/2015 as of 31/12/2016LTV %(asof
31/12/2013)
E xp os ur e va lu es ( as of 3 1/ 12 /2 01 3) R is k e xp os ur e am ou nt s (a s of 3 1/ 12 /2 01 3) V al ue a dj us tm en ts a nd pr ov is io ns ( as o f3 1/ 12 /2 01 3)
AdverseScenario
F-IRB A-IRB STA F-IRB A-IRB STA F-IRB A-IRB STA as of 31/12/2014 as of 31/12/2015 as of 31/12/2016 as of 31/12/2014 as of 31/12/2015 as of 31/12/2016LTV %(asof
31/12/2013)
E xp os ur e va lu es ( as of 3 1/ 12 /2 01 3) R is k e xp os ur e am ou nt s (a s of 3 1/ 12 /2 01 3)
BaselineScenario
Valueadjustmentsand provisions(asof 31/12/2013) BaselineScenario
(*)Referstothepart ofSecuritizationexposurethat isdeductedfrom capital andisnot includedinRWA
0
0

8/10/2019 Test Stress Banca Española 2014
http://slidepdf.com/reader/full/test-stress-banca-espanola-2014 116/240
Retail QualifyingRevolving 0 0 0 0 0 0 0 0 0 0 0 0 0 0 0 0 0 0 0 0 0 0 0 0
Retail -OtherRetail 0 0 0 0 0 0 0 0 0 0 0 0 0 0 0 0 0 0 - 0 - - 0 - - 0 - - 0 - - 0 - - 0 -
Retail -Other Retail -Of Which:SME 0 0 0 0 0 0 0 0 0 0 0 0 0 0 0 0 0 0 - 0 - - 0 - - 0 - - 0 - - 0 - - 0 -
Retail -Other Retail -Of Which:non-SME 0 0 0 0 0 0 0 0 0 0 0 0 0 0 0 0 0 0 - 0 - - 0 - - 0 - - 0 - - 0 - - 0 -
Equity 0 0 0 0 0 0 0 0 0 0 0 0 0 0 0 0 0 0 - 0 - - 0 - - 0 - - 0 - - 0 - - 0 -
Securitisation 0 0 0 0 0 0 0 0 0 0 0 0 0 0 0 0 0 0
Othernon-credit obligation assets 0 0 0 0 0 0 0 0 0 0 0 0 0 0 0 0 0 0TOTAL 0 0 0 0 0 0 0 0 0 0 0 0 0 0 0 0 0 0 - 0 - - 0 - - 0 - - 0 - - 0 - - 0 -
Securitisation andre-securitisations positions deductedfrom capital * 0 0 0 0 0 0 0 0 0 0 0 0
(mln EUR, %)No n-d ef aul t ed De fau lt e d No n-d ef aul t ed De fau lt e d No n-d ef aul t ed De fau lt e d No n-d ef aul t e d De fau lt e d No n-d ef aul t ed De fau lt e d No n-d ef aul t e d De fau lt e d No n-d ef aul t ed De fau lt e d No n-d ef aul t ed De fau lt e d No n-d ef aul t ed De fau lt e d
Impairment
rate
Stockof
ProvisionsCoverage Ratio -
Default Stock
Impairment
rate
Stockof
Provisions
Coverage
Ratio-Default
Stock
Impairment
rate
Stockof
Provisions
Coverage
Ratio -Default
Stock
Impairment rateStockof
Provisions
Coverage
Ratio-Default
Stock
Impairment
rate
Stockof
Provisions
Coverage
Ratio-Default
Stock
Impairment
rate
Stockof
Provisions
Coverage
Ratio -Default
Stock Central banksandcentral governments 0 0 0 0 0 0 0 0 0 0 0 0 0 0 0 0 0 0 - 0 - - 0 - - 0 - - 0 - - 0 - - 0 -
Institutions 0 0 0 0 0 0 0 0 0 0 0 0 0 0 0 0 0 0 - 0 - - 0 - - 0 - - 0 - - 0 - - 0 -
Corporates 0 0 0 0 0 0 0 0 0 0 0 0 0 0 0 0 0 0 - 0 - - 0 - - 0 - - 0 - - 0 - - 0 -
Corporates -Of Which:SpecialisedLending 0 0 0 0 0 0 0 0 0 0 0 0 0 0 0 0 0 0 - 0 - - 0 - - 0 - - 0 - - 0 - - 0 -
Corporates -Of Which:SME 0 0 0 0 0 0 0 0 0 0 0 0 0 0 0 0 0 0 - 0 - - 0 - - 0 - - 0 - - 0 - - 0 -
Retail 0 0 0 0 0 0 0 0 0 0 0 0 0 0 0 0 0 0 - 0 - - 0 - - 0 - - 0 - - 0 - - 0 -
Retail -Securedon real estateproperty 0.0% 0 0 0 0 0 0 0 0 0 0 0 0 0 0 0 0 0 0 - 0 - - 0 - - 0 - - 0 - - 0 - - 0 -
Retail -Securedon real estate property- Of
hi h: E0.0% 0 0 0 0 0 0 0 0 0 0 0 0 0 0 0 0 0 0 - 0 - - 0 - - 0 - - 0 - - 0 - - 0 -
Retail -Securedon real estate property- Of
h i h: n n - E0.0% 0 0 0 0 0 0 0 0 0 0 0 0 0 0 0 0 0 0 - 0 - - 0 - - 0 - - 0 - - 0 - - 0 -
Retail -QualifyingRevolving 0 0 0 0 0 0 0 0 0 0 0 0 0 0 0 0 0 0 - 0 - - 0 - - 0 - - 0 - - 0 - - 0 -
Retail -OtherRetail 0 0 0 0 0 0 0 0 0 0 0 0 0 0 0 0 0 0 - 0 - - 0 - - 0 - - 0 - - 0 - - 0 -
Retail -Other Retail -Of Which:SME 0 0 0 0 0 0 0 0 0 0 0 0 0 0 0 0 0 0 - 0 - - 0 - - 0 - - 0 - - 0 - - 0 -
Retail -Other Retail -Of Which:non-SME 0 0 0 0 0 0 0 0 0 0 0 0 0 0 0 0 0 0 - 0 - - 0 - - 0 - - 0 - - 0 - - 0 -
Equity 0 0 0 0 0 0 0 0 0 0 0 0 0 0 0 0 0 0 - 0 - - 0 - - 0 - - 0 - - 0 - - 0 -
Securitisation 0 0 0 0 0 0 0 0 0 0 0 0 0 0 0 0 0 0
Othernon-credit obligation assets 0 0 0 0 0 0 0 0 0 0 0 0 0 0 0 0 0 0
TOTAL 0 0 0 0 0 0 0 0 0 0 0 0 0 0 0 0 0 0 - 0 - - 0 - - 0 - - 0 - - 0 - - 0 -
Securitisation andre-securitisations positions deductedfrom capital * 0 0 0 0 0 0 0 0 0 0 0 0
(mln EUR, %)No n-d ef aul t ed De fau lt e d No n-d ef aul t ed De fau lt e d No n-d ef aul t ed De fau lt e d No n-d ef aul t e d De fau lt e d No n-d ef aul t ed De fau lt e d No n-d ef aul t e d De fau lt e d No n-d ef aul t ed De fau lt e d No n-d ef aul t ed De fau lt e d No n-d ef aul t ed De fau lt e d
Impairment
rate
Stockof
ProvisionsCoverage Ratio -
Default Stock
Impairment
rate
Stockof
Provisions
Coverage
Ratio-Default
Stock
Impairment
rate
Stockof
Provisions
Coverage
Ratio -Default
Stock
Impairment rateStockof
Provisions
Coverage
Ratio-Default
Stock
Impairment
rate
Stockof
Provisions
Coverage
Ratio-Default
Stock
Impairment
rate
Stockof
Provisions
Coverage
Ratio -Default
Stock Central banksandcentral governments 0 0 0 0 0 0 0 0 0 0 0 0 0 0 0 0 0 0 - 0 - - 0 - - 0 - - 0 - - 0 - - 0 -
Institutions 0 0 0 0 0 0 0 0 0 0 0 0 0 0 0 0 0 0 - 0 - - 0 - - 0 - - 0 - - 0 - - 0 -
Corporates 0 0 0 0 0 0 0 0 0 0 0 0 0 0 0 0 0 0 - 0 - - 0 - - 0 - - 0 - - 0 - - 0 -
Corporates -Of Which:SpecialisedLending 0 0 0 0 0 0 0 0 0 0 0 0 0 0 0 0 0 0 - 0 - - 0 - - 0 - - 0 - - 0 - - 0 -
Corporates -Of Which:SME 0 0 0 0 0 0 0 0 0 0 0 0 0 0 0 0 0 0 - 0 - - 0 - - 0 - - 0 - - 0 - - 0 -
Retail 0 0 0 0 0 0 0 0 0 0 0 0 0 0 0 0 0 0 - 0 - - 0 - - 0 - - 0 - - 0 - - 0 -
Retail -Securedon real estateproperty 0.0% 0 0 0 0 0 0 0 0 0 0 0 0 0 0 0 0 0 0 - 0 - - 0 - - 0 - - 0 - - 0 - - 0 -
Retail -Securedon real estate property- Of
h i h : S E0.0% 0 0 0 0 0 0 0 0 0 0 0 0 0 0 0 0 0 0 - 0 - - 0 - - 0 - - 0 - - 0 - - 0 -
Retail -Securedon real estate property- Of
h i h: n n - E0.0% 0 0 0 0 0 0 0 0 0 0 0 0 0 0 0 0 0 0 - 0 - - 0 - - 0 - - 0 - - 0 - - 0 -
Retail -QualifyingRevolving 0 0 0 0 0 0 0 0 0 0 0 0 0 0 0 0 0 0 - 0 - - 0 - - 0 - - 0 - - 0 - - 0 -
Retail -OtherRetail 0 0 0 0 0 0 0 0 0 0 0 0 0 0 0 0 0 0 - 0 - - 0 - - 0 - - 0 - - 0 - - 0 -
Retail -Other Retail -Of Which:SME 0 0 0 0 0 0 0 0 0 0 0 0 0 0 0 0 0 0 - 0 - - 0 - - 0 - - 0 - - 0 - - 0 -
Retail -Other Retail -Of Which:non-SME 0 0 0 0 0 0 0 0 0 0 0 0 0 0 0 0 0 0 - 0 - - 0 - - 0 - - 0 - - 0 - - 0 -
Equity 0 0 0 0 0 0 0 0 0 0 0 0 0 0 0 0 0 0 - 0 - - 0 - - 0 - - 0 - - 0 - - 0 -
Securitisation 0 0 0 0 0 0 0 0 0 0 0 0 0 0 0 0 0 0
Othernon-credit obligation assets 0 0 0 0 0 0 0 0 0 0 0 0 0 0 0 0 0 0
TOTAL 0 0 0 0 0 0 0 0 0 0 0 0 0 0 0 0 0 0 - 0 - - 0 - - 0 - - 0 - - 0 - - 0 -Securitisation andre-securitisations positions deductedfrom capital * 0 0 0 0 0 0 0 0 0 0 0 0
(mln EUR, %)No n-d ef aul t ed De fau lt e d No n-d ef aul t ed De fau lt e d No n-d ef aul t ed De fau lt e d No n-d ef aul t e d De fau lt e d No n-d ef aul t ed De fau lt e d No n-d ef aul t e d De fau lt e d No n-d ef aul t ed De fau lt e d No n-d ef aul t ed De fau lt e d No n-d ef aul t ed De fau lt e d
Impairment
rate
Stockof
ProvisionsCoverage Ratio -
Default Stock
Impairment
rate
Stockof
Provisions
Coverage
Ratio-DefaultStock
Impairment
rate
Stockof
Provisions
Coverage
Ratio -DefaultStock
Impairment rateStockof
Provisions
Coverage
Ratio-DefaultStock
Impairment
rate
Stockof
Provisions
Coverage
Ratio-DefaultStock
Impairment
rate
Stockof
Provisions
Coverage
Ratio -DefaultStock
Central banksandcentral governments 0 0 0 0 0 0 0 0 0 0 0 0 0 0 0 0 0 0 - 0 - - 0 - - 0 - - 0 - - 0 - - 0 -
Institutions 0 0 0 0 0 0 0 0 0 0 0 0 0 0 0 0 0 0 - 0 - - 0 - - 0 - - 0 - - 0 - - 0 -
Corporates 0 0 0 0 0 0 0 0 0 0 0 0 0 0 0 0 0 0 - 0 - - 0 - - 0 - - 0 - - 0 - - 0 -
Corporates -Of Which:SpecialisedLending 0 0 0 0 0 0 0 0 0 0 0 0 0 0 0 0 0 0 - 0 - - 0 - - 0 - - 0 - - 0 - - 0 -
Corporates -Of Which:SME 0 0 0 0 0 0 0 0 0 0 0 0 0 0 0 0 0 0 - 0 - - 0 - - 0 - - 0 - - 0 - - 0 -
Retail 0 0 0 0 0 0 0 0 0 0 0 0 0 0 0 0 0 0 - 0 - - 0 - - 0 - - 0 - - 0 - - 0 -
Retail -Securedon real estateproperty 0.0% 0 0 0 0 0 0 0 0 0 0 0 0 0 0 0 0 0 0 - 0 - - 0 - - 0 - - 0 - - 0 - - 0 -
Retail -Securedon real estate property- Of
hi h: E0.0% 0 0 0 0 0 0 0 0 0 0 0 0 0 0 0 0 0 0 - 0 - - 0 - - 0 - - 0 - - 0 - - 0 -
Retail -Securedon real estate property- Of
h i h : n n -S E0.0% 0 0 0 0 0 0 0 0 0 0 0 0 0 0 0 0 0 0 - 0 - - 0 - - 0 - - 0 - - 0 - - 0 -
Retail -QualifyingRevolving 0 0 0 0 0 0 0 0 0 0 0 0 0 0 0 0 0 0 - 0 - - 0 - - 0 - - 0 - - 0 - - 0 -
Retail -OtherRetail 0 0 0 0 0 0 0 0 0 0 0 0 0 0 0 0 0 0 - 0 - - 0 - - 0 - - 0 - - 0 - - 0 -
Retail -Other Retail -Of Which:SME 0 0 0 0 0 0 0 0 0 0 0 0 0 0 0 0 0 0 - 0 - - 0 - - 0 - - 0 - - 0 - - 0 -
Retail -Other Retail -Of Which:non-SME 0 0 0 0 0 0 0 0 0 0 0 0 0 0 0 0 0 0 - 0 - - 0 - - 0 - - 0 - - 0 - - 0 -
Equity 0 0 0 0 0 0 0 0 0 0 0 0 0 0 0 0 0 0 - 0 - - 0 - - 0 - - 0 - - 0 - - 0 -
Securitisation 0 0 0 0 0 0 0 0 0 0 0 0 0 0 0 0 0 0
Othernon-credit obligation assets 0 0 0 0 0 0 0 0 0 0 0 0 0 0 0 0 0 0
TOTAL 0 0 0 0 0 0 0 0 0 0 0 0 0 0 0 0 0 0 - 0 - - 0 - - 0 - - 0 - - 0 - - 0 -Securitisation andre-securitisations positions deductedfrom capital * 0 0 0 0 0 0 0 0 0 0 0 0
LTV %(asof
31/12/2013)
Exposure values (as of 31/12/2013) Risk exposure amounts (as of 31/12/2013) Value adjustments and provisions (as of 31/12/2013) Baseline Scenario Adverse Scenario
F-IRB A-IRB STA F-IRB A-IRB STA as of 31/12/2016 as of 31/12/2014 as of 31/12/2015 as of 31/12/2016F-IRB A-IRB STA a s of 3 1/ 12 /2 01 4 a s of 3 1/ 12 /2 01 5
LTV %(asof
31/12/2013)
Exposure values (as of 31/12/2013) Risk exposure amounts (as of 31/12/2013) Value adjustments and provisions (as of 31/12/2013) Baseline Scenario Adverse Scenario
F-IRB A-IRB STA F-IRB A-IRB STA F-IRB a sof 31 /12 /2 01 4 a so f3 1/ 12 /2 01 5 a sof 31 /12 /2 01 6 A-IRB STA a sof 31 /1 2/ 20 14 a so f3 1/ 12 /2 01 5 a sof 31 /12 /2 01 6
LTV %(asof
31/12/2013)
Exposure values (as of 31/12/2013) Risk exposure amounts (as of 31/12/2013) Value adjustments and provisions (as of 31/12/2013) Baseline Scenario Adverse Scenario
F-IRB A-IRB STA F-IRB A-IRB STA F-IRB A-IRB a s of 3 1/ 12 /2 01 5 a s of 3 1/ 12 /2 01 6STA as of 31/12/2014 as of 31/12/2015 as of 31/12/2016 as of 31/12/2014
(*)Referstothepart ofSecuritizationexposurethat isdeductedfrom capital andisnot includedinRWA
(*)Referstothepart ofSecuritizationexposurethat isdeductedfrom capital andisnot includedinRWA
(*)Referstothepart ofSecuritizationexposurethat isdeductedfrom capital andisnot includedinRWA
(*)Referstothepart ofSecuritizationexposurethat isdeductedfrom capital andisnot includedinRWA
0
0
0
http://www.economiaciudadana.org/
2014 EU-wide Stress Test
P&L
(mln EUR) 31/12/2014 31/12/2015 31/12/2016 31/12/2014 31/12/2015 31/12/2016
Net interest income 2,533 2,936 3,129 3,144 2,533 2,533 2,533
Net trading income -171 -114 -86 -257 -166 -120
of which trading losses from stress scenarios -142 -85 -57 -228 -137 -91
Other operating income 743 -202 -193 -186 -203 -194 -187
Operating profit before impairments 2,336 1,807 2,142 2,205 1,283 1,437 1,483
Impairment of financial assets ( ) -1 393 -1 253 -830 -730 -2 017 -1 613 -1 420
31/12/2013
Baseline Scenario Adverse Scenario

8/10/2019 Test Stress Banca Española 2014
http://slidepdf.com/reader/full/test-stress-banca-espanola-2014 117/240
Impairment of financial assets (-) -1,393 -1,253 -830 -730 -2,017 -1,613 -1,420
Impairment of financial assets other than instruments designated at fair value
through P&L (-) -1,385 -1,253 -830 -730 -2,017 -1,613 -1,420
Impairment Financial assets designated at fair value through P&L (-) -8 0 0 0 0 0 0
Impairment on non financial assets (-) -57 -118 -42 -42 -171 -76 -76
Operating profit after impairments from stress scenarios 886 436 1,270 1,433 -906 -252 -13
Other Income and expenses 376 1,047 59 44 894 8 0
Pre-Tax profit 1,262 1,483 1,329 1,477 -12 -244 -13
Tax 835 -315 -386 -430 121 73 4
Net income 2,097 1,168 943 1,047 109 -171 -9
Attributable to owners of the parent 1,919 945 671 758 196 -93 36
of which carried over to capital through retained earnings 1,919 945 671 758 196 -93 36
of which distributed as dividends 0 0 0 0 0 0 0
In the figures above, the original (official published) 2013 P&L figures may have been adjusted as part of the ECB Comprehensive Assessment join-up calculation.
http://www.economiaciudadana.org/
2014 EU-wide Stress Test
RWA
(mln EUR)as of 31/12/2013 as of 31/12/2014 as of 31/12/2015 as of 31/12/2016 as of 31/12/2014 as of 31/12/2015 as of 31/12/2016
Risk exposure amount for credit risk 93,938 88,200 85,970 82,896 90,147 89,223 87,306
Risk exposure amount Securitisation and re-securitisations 2,485 3,732 4,086 4,322 5,066 6,220 6,989
Risk exposure amount Other credit risk 91,452 84,467 81,884 78,574 85,081 83,003 80,317
Risk exposure amount for market risk 2,742 2,742 2,742 2,742 3,268 3,268 3,268
Risk exposure amount for operational risk 8 666 8 666 8 666 8 666 8 666 8 666 8 666
Baseline Scenario Adverse Scenario

8/10/2019 Test Stress Banca Española 2014
http://slidepdf.com/reader/full/test-stress-banca-espanola-2014 118/240
Risk exposure amount for operational risk 8,666 8,666 8,666 8,666 8,666 8,666 8,666
Transitional floors for Risk exposure amount0 0 0 0 0 0 0
AQR adjustments (for SSM countries only) 69 69 69 69 69 69 69
Total Risk exposure amount 105,414 99,676 97,446 94,372 102,150 101,226 99,309
http://www.economiaciudadana.org/
(mln EUR) as of 31/12/2013 31/12/2014 31/12/2015 31/12/2016 31/12/2014 31/12/2015 31/12/2016
Banking Book 4,846
Trading Book (excl. correlation trading positions under CRM) 0
Correlation Trading Portfolio (CRM) 0
Total 4,846
Banking Book 2,485 3,732 4,086 4,322 5,066 6,220 6,989
Trading Book (excl. correlation trading positions under CRM) 0 0 0 0 0 0 0
Total 2,485 3,732 4,086 4,322 5,066 6,220 6,989
Hold to Maturity porfolio 270 283 295 305 291 314 334
Available for Sale porfolio 0 0 0 0 0 0 0
Held for trading portfolio
2014 EU-wide Stress Test
Impairments
Baseline scenario Adverse scenario
Exposure values
Risk exposure values
Securitisation

8/10/2019 Test Stress Banca Española 2014
http://slidepdf.com/reader/full/test-stress-banca-espanola-2014 119/240
Total 270 283 295 305 291 314 334
http://www.economiaciudadana.org/
2014 EU-wide Stress Test - Sovereign Exposure
(mln EUR)
Residual Maturity Country / Region
GROSS DIRECT LONG
EXPOSURES(accounting value gross
of provisions)
(1)
NET DIRECT POSITIONS (gross exposures (long) net of cash short
positions of sovereign debt to other counterpaties only where there
is a maturity matching)
(1)
DIRECT SOVEREIGN EXPOSURES IN DERIVATIVES (1)
of which: loans
and advances
of which: AFS
banking book
of which: FVO
(designated at fair
value through
profit&loss)
bankingbook
of which: Financial
assets held for
trading
(2)
Derivatives with positive fair value at
31/12/2013
Derivatives with negative fair value at
31/12/2013
Derivatives with positive fair value
at 31/12/2013
Derivatives with negative fair
value at 31/12/2013
VALUES AS OF 31/12/2013 VALUES AS OF 31/12/2013 VALUES AS OF 31/12/2013
INDIRECT SOVEREIGN EXPOSURES (3) (on and off balance sheet)
Fair-value at
31/12/2013 (+)Notional value
Fair-value at
31/12/2013 (-)Notional value
Fair-value at
31/12/2013 (+)Notional value
Fair-value at 31/12/2013
(-)Notional value

8/10/2019 Test Stress Banca Española 2014
http://slidepdf.com/reader/full/test-stress-banca-espanola-2014 120/240
[ 0 - 3M [ 0 0 0 0 0 0 0 0 0 0 0 0 0 0
[ 3M - 1Y [ 0 0 0 0 0 0 0 0 0 0 0 0 0 0
[ 1Y - 2Y [ 0 0 0 0 0 0 0 0 0 0 0 0 0 0
[ 2Y - 3Y [ 0 0 0 0 0 0 0 0 0 0 0 0 0 0
[3Y - 5Y [ 0 0 0 0 0 0 0 0 0 0 0 0 0 0
[5Y - 10Y [ 0 0 0 0 0 0 0 0 0 0 0 0 0 0
[10Y - more 0 0 0 0 0 0 0 0 0 0 0 0 0 0
Tot 0 0 0 0 0 0 0 0 0 0 0 0 0 0
[ 0 - 3M [ 0 0 0 0 0 0 0 0 0 0 0 0 0 0
[ 3M - 1Y [ 0 0 0 0 0 0 0 0 0 0 0 0 0 0
[ 1Y - 2Y [ 0 0 0 0 0 0 0 0 0 0 0 0 0 0
[ 2Y - 3Y [ 0 0 0 0 0 0 0 0 0 0 0 0 0 0
[3Y - 5Y [ 0 0 0 0 0 0 0 0 0 0 0 0 0 0[5Y - 10Y [ 0 0 0 0 0 0 0 0 0 0 0 0 0 0
[10Y - more 0 0 0 0 0 0 0 0 0 0 0 0 0 0
Tot 0 0 0 0 0 0 0 0 0 0 0 0 0 0
[ 0 - 3M [ 0 0 0 0 0 0 0 0 0 0 0 0 0 0
[ 3M - 1Y [ 0 0 0 0 0 0 0 0 0 0 0 0 0 0
[ 1Y - 2Y [ 0 0 0 0 0 0 0 0 0 0 0 0 0 0
[ 2Y - 3Y [ 0 0 0 0 0 0 0 0 0 0 0 0 0 0
[3Y - 5Y [ 0 0 0 0 0 0 0 0 0 0 0 0 0 0
[5Y - 10Y [ 998 0 998 0 0 0 0 0 0 0 0 0 0 0
[10Y - more 792 0 792 0 0 0 0 0 0 0 0 0 0 0
Tot 1,790 0 1,790 0 0 0 0 0 0 0 0 0 0 0
banking book
Austria
Belgium
Bulgaria
Cyprus
Czech Republic
Denmark
Estonia
Finland
France
http://www.economiaciudadana.org/
2014 EU-wide Stress Test - Sovereign Exposure
(mln EUR)
Residual Maturity Country / Region
GROSS DIRECT LONG
EXPOSURES(accounting value gross
of provisions)
(1)
NET DIRECT POSITIONS (gross exposures (long) net of cash short
positions of sovereign debt to other counterpaties only where there
is a maturity matching)
(1)
DIRECT SOVEREIGN EXPOSURES IN DERIVATIVES (1)
of which: loans
and advances
of which: AFS
banking book
of which: FVO
(designated at fair
value through
profit&loss)
banking book
of which: Financial
assets held for
trading
(2)
Derivatives with positive fair value at
31/12/2013
Derivatives with negative fair value at
31/12/2013
Derivatives with positive fair value
at 31/12/2013
Derivatives with negative fair
value at 31/12/2013
VALUES AS OF 31/12/2013 VALUES AS OF 31/12/2013 VALUES AS OF 31/12/2013
INDIRECT SOVEREIGN EXPOSURES (3) (on and off balance sheet)
Fair-value at
31/12/2013 (+)Notional value
Fair-value at
31/12/2013 (-)Notional value
Fair-value at
31/12/2013 (+)Notional value
Fair-value at 31/12/2013
(-)Notional value
8/10/2019 Test Stress Banca Española 2014
http://slidepdf.com/reader/full/test-stress-banca-espanola-2014 121/240
[ 0 - 3M [ 0 0 0 0 0 0 0 0 0 0 0 0 0 0
[ 3M - 1Y [ 0 0 0 0 0 0 0 0 0 0 0 0 0 0
[ 1Y - 2Y [ 0 0 0 0 0 0 0 0 0 0 0 0 0 0
[ 2Y - 3Y [ 0 0 0 0 0 0 0 0 0 0 0 0 0 0
[3Y - 5Y [ 0 0 0 0 0 0 0 0 0 0 0 0 0 0
[5Y - 10Y [ 0 0 0 0 0 0 0 0 0 0 0 0 0 0
[10Y - more 0 0 0 0 0 0 0 0 0 0 0 0 0 0
Tot 0 0 0 0 0 0 0 0 0 0 0 0 0 0
[ 0 - 3M [ 0 0 0 0 0 0 0 0 0 0 0 0 0 0
[ 3M - 1Y [ 0 0 0 0 0 0 0 0 0 0 0 0 0 0
[ 1Y - 2Y [ 0 0 0 0 0 0 0 0 0 0 0 0 0 0
[ 2Y - 3Y [ 0 0 0 0 0 0 0 0 0 0 0 0 0 0
[3Y - 5Y [ 0 0 0 0 0 0 0 0 0 0 0 0 0 0
[5Y - 10Y [ 0 0 0 0 0 0 0 0 0 0 0 0 0 0
[10Y - more 0 0 0 0 0 0 0 0 0 0 0 0 0 0
Tot 0 0 0 0 0 0 0 0 0 0 0 0 0 0
[ 0 - 3M [ 0 0 0 0 0 0 0 0 0 0 0 0 0 0
[ 3M - 1Y [ 0 0 0 0 0 0 0 0 0 0 0 0 0 0
[ 1Y - 2Y [ 1,038 0 1,038 0 0 0 0 0 0 0 0 0 0 0
[ 2Y - 3Y [ 0 0 0 0 0 0 0 0 0 0 0 0 0 0
[3Y - 5Y [ 0 0 0 0 0 0 0 0 0 0 0 0 0 0
[5Y - 10Y [ 0 0 0 0 0 0 0 0 0 0 0 0 0 0
[10Y - more 0 0 0 0 0 0 0 0 0 0 0 0 0 0
Tot 1,038 0 1,038 0 0 0 0 0 0 0 0 0 0 0
[ 0 - 3M [ 0 0 0 0 0 0 0 0 0 0 0 0 0 0
[ 3M - 1Y [ 0 0 0 0 0 0 0 0 0 0 0 0 0 0
[ 1Y - 2Y [ 0 0 0 0 0 0 0 0 0 0 0 0 0 0
[ 2Y - 3Y [ 0 0 0 0 0 0 0 0 0 0 0 0 0 0
[3Y - 5Y [ 0 0 0 0 0 0 0 0 0 0 0 0 0 0[5Y - 10Y [ 0 0 0 0 0 0 0 0 0 0 0 0 0 0
[10Y - more 0 0 0 0 0 0 0 0 0 0 0 0 0 0
Tot 0 0 0 0 0 0 0 0 0 0 0 0 0 0
[ 0 - 3M [ 0 0 0 0 0 0 0 0 0 0 0 0 0 0
[ 3M - 1Y [ 0 0 0 0 0 0 0 0 0 0 0 0 0 0
[ 1Y - 2Y [ 0 0 0 0 0 0 0 0 0 0 0 0 0 0
[ 2Y - 3Y [ 0 0 0 0 0 0 0 0 0 0 0 0 0 0
[3Y - 5Y [ 0 0 0 0 0 0 0 0 0 0 0 0 0 0
[5Y - 10Y [ 0 0 0 0 0 0 0 0 0 0 0 0 0 0
[10Y - more 0 0 0 0 0 0 0 0 0 0 0 0 0 0
Tot 0 0 0 0 0 0 0 0 0 0 0 0 0 0
Latvia
Germany
Greece
Hungary
Iceland
Ireland
Italy
Croatia
Liechtenstein
http://www.economiaciudadana.org/
2014 EU-wide Stress Test - Sovereign Exposure
(mln EUR)
Residual Maturity Country / Region
GROSS DIRECT LONG
EXPOSURES(accounting value gross
of provisions)
(1)
NET DIRECT POSITIONS (gross exposures (long) net of cash short
positions of sovereign debt to other counterpaties only where there
is a maturity matching)
(1)
DIRECT SOVEREIGN EXPOSURES IN DERIVATIVES (1)
of which: loans
and advances
of which: AFS
banking book
of which: FVO
(designated at fair
value through
profit&loss)
banking book
of which: Financial
assets held for
trading
(2)
Derivatives with positive fair value at
31/12/2013
Derivatives with negative fair value at
31/12/2013
Derivatives with positive fair value
at 31/12/2013
Derivatives with negative fair
value at 31/12/2013
VALUES AS OF 31/12/2013 VALUES AS OF 31/12/2013 VALUES AS OF 31/12/2013
INDIRECT SOVEREIGN EXPOSURES (3) (on and off balance sheet)
Fair-value at
31/12/2013 (+)Notional value
Fair-value at
31/12/2013 (-)Notional value
Fair-value at
31/12/2013 (+)Notional value
Fair-value at 31/12/2013
(-)Notional value

8/10/2019 Test Stress Banca Española 2014
http://slidepdf.com/reader/full/test-stress-banca-espanola-2014 122/240
[ 0 - 3M [ 0 0 0 0 0 0 0 0 0 0 0 0 0 0
[ 3M - 1Y [ 0 0 0 0 0 0 0 0 0 0 0 0 0 0
[ 1Y - 2Y [ 0 0 0 0 0 0 0 0 0 0 0 0 0 0
[ 2Y - 3Y [ 0 0 0 0 0 0 0 0 0 0 0 0 0 0
[3Y - 5Y [ 0 0 0 0 0 0 0 0 0 0 0 0 0 0
[5Y - 10Y [ 0 0 0 0 0 0 0 0 0 0 0 0 0 0
[10Y - more 0 0 0 0 0 0 0 0 0 0 0 0 0 0
Tot 0 0 0 0 0 0 0 0 0 0 0 0 0 0
[ 0 - 3M [ 0 0 0 0 0 0 0 0 0 0 0 0 0 0
[ 3M - 1Y [ 0 0 0 0 0 0 0 0 0 0 0 0 0 0
[ 1Y - 2Y [ 0 0 0 0 0 0 0 0 0 0 0 0 0 0
[ 2Y - 3Y [ 0 0 0 0 0 0 0 0 0 0 0 0 0 0
[3Y - 5Y [ 0 0 0 0 0 0 0 0 0 0 0 0 0 0[5Y - 10Y [ 0 0 0 0 0 0 0 0 0 0 0 0 0 0
[10Y - more 0 0 0 0 0 0 0 0 0 0 0 0 0 0
Tot 0 0 0 0 0 0 0 0 0 0 0 0 0 0
[ 0 - 3M [ 0 0 0 0 0 0 0 0 0 0 0 0 0 0
[ 3M - 1Y [ 0 0 0 0 0 0 0 0 0 0 0 0 0 0
[ 1Y - 2Y [ 0 0 0 0 0 0 0 0 0 0 0 0 0 0
[ 2Y - 3Y [ 0 0 0 0 0 0 0 0 0 0 0 0 0 0
[3Y - 5Y [ 0 0 0 0 0 0 0 0 0 0 0 0 0 0
[5Y - 10Y [ 0 0 0 0 0 0 0 0 0 0 0 0 0 0
[10Y - more 0 0 0 0 0 0 0 0 0 0 0 0 0 0
Tot 0 0 0 0 0 0 0 0 0 0 0 0 0 0
Lithuania
Luxembourg
Malta
Netherlands
Norway
Poland
Portugal
Romania
Slovakia
http://www.economiaciudadana.org/

8/10/2019 Test Stress Banca Española 2014
http://slidepdf.com/reader/full/test-stress-banca-espanola-2014 123/240
2014 EU-wide Stress Test - Sovereign Exposure
(mln EUR)
Residual Maturity Country / Region
GROSS DIRECT LONG
EXPOSURES(accounting value gross
of provisions)
(1)
NET DIRECT POSITIONS (gross exposures (long) net of cash short
positions of sovereign debt to other counterpaties only where there
is a maturity matching)
(1)
DIRECT SOVEREIGN EXPOSURES IN DERIVATIVES (1)
of which: loans
and advances
of which: AFS
banking book
of which: FVO
(designated at fair
value through
profit&loss)
banking book
of which: Financial
assets held for
trading
(2)
Derivatives with positive fair value at
31/12/2013
Derivatives with negative fair value at
31/12/2013
Derivatives with positive fair value
at 31/12/2013
Derivatives with negative fair
value at 31/12/2013
VALUES AS OF 31/12/2013 VALUES AS OF 31/12/2013 VALUES AS OF 31/12/2013
INDIRECT SOVEREIGN EXPOSURES (3) (on and off balance sheet)
Fair-value at
31/12/2013 (+)Notional value
Fair-value at
31/12/2013 (-)Notional value
Fair-value at
31/12/2013 (+)Notional value
Fair-value at 31/12/2013
(-)Notional value

8/10/2019 Test Stress Banca Española 2014
http://slidepdf.com/reader/full/test-stress-banca-espanola-2014 124/240
[ 0 - 3M [ 0 0 0 0 0 0 0 0 0 0 0 0 0 0
[ 3M - 1Y [ 0 0 0 0 0 0 0 0 0 0 0 0 0 0
[ 1Y - 2Y [ 0 0 0 0 0 0 0 0 0 0 0 0 0 0
[ 2Y - 3Y [ 0 0 0 0 0 0 0 0 0 0 0 0 0 0
[3Y - 5Y [ 0 0 0 0 0 0 0 0 0 0 0 0 0 0
[5Y - 10Y [ 0 0 0 0 0 0 0 0 0 0 0 0 0 0
[10Y - more 0 0 0 0 0 0 0 0 0 0 0 0 0 0
Tot 0 0 0 0 0 0 0 0 0 0 0 0 0 0
[ 0 - 3M [ 0 0 0 0 0 0 0 0 0 0 0 0 0 0
[ 3M - 1Y [ 0 0 0 0 0 0 0 0 0 0 0 0 0 0
[ 1Y - 2Y [ 0 0 0 0 0 0 0 0 0 0 0 0 0 0
[ 2Y - 3Y [ 0 0 0 0 0 0 0 0 0 0 0 0 0 0
[3Y - 5Y [ 0 0 0 0 0 0 0 0 0 0 0 0 0 0
[5Y - 10Y [ 0 0 0 0 0 0 0 0 0 0 0 0 0 0[10Y - more 0 0 0 0 0 0 0 0 0 0 0 0 0 0
Tot 0 0 0 0 0 0 0 0 0 0 0 0 0 0
[ 0 - 3M [ 0 0 0 0 0 0 0 0 0 0 0 0 0 0
[ 3M - 1Y [ 0 0 0 0 0 0 0 0 0 0 0 0 0 0
[ 1Y - 2Y [ 0 0 0 0 0 0 0 0 0 0 0 0 0 0
[ 2Y - 3Y [ 0 0 0 0 0 0 0 0 0 0 0 0 0 0
[3Y - 5Y [ 0 0 0 0 0 0 0 0 0 0 0 0 0 0
[5Y - 10Y [ 0 0 0 0 0 0 0 0 0 0 0 0 0 0
[10Y - more 0 0 0 0 0 0 0 0 0 0 0 0 0 0
Tot 0 0 0 0 0 0 0 0 0 0 0 0 0 0
[ 0 - 3M [ 0 0 0 0 0 0 0 0 0 0 0 0 0 0
[ 3M - 1Y [ 0 0 0 0 0 0 0 0 0 0 0 0 0 0
[ 1Y - 2Y [ 0 0 0 0 0 0 0 0 0 0 0 0 0 0
[ 2Y - 3Y [ 0 0 0 0 0 0 0 0 0 0 0 0 0 0
[3Y - 5Y [ 0 0 0 0 0 0 0 0 0 0 0 0 0 0
[5Y - 10Y [ 0 0 0 0 0 0 0 0 0 0 0 0 0 0
[10Y - more 0 0 0 0 0 0 0 0 0 0 0 0 0 0Tot 0 0 0 0 0 0 0 0 0 0 0 0 0 0
Notes and definitions
(1) The exposures reported cover only exposures to central, regional and local governments on immediate borrower basis, and do not include exposures to other counterparts with full or partial government guarantees
(2) The banks disclose the exposures in the "Financial assets held for trading" portfolio after offsetting the cash short positions having the same maturities.
(3) The exposures reported include the positions towards counterparts (other than sovereign) on sovereign credit risk (i.e. CDS, financial guarantees) booked in all the accounting portfolio (on-off balance sheet).'Irrespective of the denomination and or accounting classification of the positions the economic substance over the form must be used as a criteria for the identification of the exposures to be included in this column. This item does not include exposures to counterparts (other than sovereign) with full or partial government guarantees by central, regional and local governments
Latin America and the
Caribbean
Africa
Others
Middle East
China
Switzerland
Other advanced economies
non EEA
Other Central and eastern
Europe countries non EEA
http://www.economiaciudadana.org/
2014 EU-wide Stress TestCapital
(mln EUR) CRR/ CRDIV DEFINITION OFCAPITAL Asof31/12/2013 Asof31/12/2014 Asof31/12/2015 Asof31/12/2016 Asof31/12/2014 Asof31/12/2015 Asof31/12/2016 COREP CODE REGULATION
A OWN FUNDS 11,548 12,727 13,619 14,305 11,489 11,068 10,593 C A 1 {1 } A rt ic le s 4 (1 18 ) a nd 7 2 of C RR
A.1COMMON EQUITYTIER 1CAPITAL(net ofdeductionsandafter applying
transitional adjustments)11,175 12,287 12,983 13,490 11,177 10,677 10,225 C A 1 {1 .1 .1 } A rt ic le 5 0 of C RR
A.1.1Capitalinstrumentseligible asCET1Capital(including share premium and net own
capitalinstruments)17,959 17,959 17,959 17,959 17,959 17,959 17,959 CA1 {1.1.1.1}
Articles 26(1) points (a) and(b), 27to29, 36(1) point (f)
and42ofCRR
A.1.1.1 Ofwhich: CET1instrumentssubscribed byGovernment 0 0 0 0 0 0 0 - -
A.1.2 Retained earnings 1,919 2,864 3,535 4,293 2,115 2,022 2,058 CA1 {1.1.1.2} Articles 26(1) point (c), 26(2) and36 (1) points (a) and(l)
ofCRR
A.1.3 Accumulated other comprehensive income 723 725 729 732 -950 -544 -784 CA1 {1.1.1.3} Articles 4(100), 26(1) point (d) and 36 (1) point (l) of CRR
A.1.3.1 Ofwhich: arising from unrealised gains/lossesfrom Sovereign exposure in AFS
portfolio230 230 230 230 -1,248 -727 -891 - -
A.1.3.2 Ofwhich: arising from unrealised gains/lossesfrom the rest ofAFS portfolio 493 495 500 503 297 183 107 - -
A.1.4 Other Reserves -11,775 -11,751 -11,751 -11,751 -11,751 -11,751 -11,751 CA1 {1.1.1.4} Articles 4(117) and 26(1) point (e) of CRR
A.1.5 Fundsfor generalbanking risk 0 0 0 0 0 0 0 CA1 {1.1.1.5} Articles 4(112), 26(1) point (f) and 36 (1) point (l) of CRR
A.1.6 Minorityinterest given recognition in CET1capital 2,947 2,668 2,617 2,549 3,103 2,959 3,076 CA1 {1.1.1.7} Article 84 of CRR
A.1.7 AdjustmentstoCET1 due toprudentialfiltersexcluding those from unrealised
gains/lossesfrom AFS portfolio0 0 0 0 0 0 0 CA1 {1.1.1.9} Articles 32 to 35 of and 36 (1) point (l) of CRR
A.1.8 AdjustmentstoCET1 due toprudentialfiltersfrom unrealised gains/lossesfrom
Sovereign Exposure in AFS portfolio-230 -230 -138 -92 998 436 356 -
A.1.9 (-)Intangible assets(including Goodwill) -311 -228 -228 -228 -228 -228 -228CA1{1.1.1.10+
1 1 1 11}
Articles 4(113), 36(1) point (b) and37of CRR. Articles
4(115) 36(1) point (b) and37point (a) of CCR
Baseline Scenario Adverse Scenario

8/10/2019 Test Stress Banca Española 2014
http://slidepdf.com/reader/full/test-stress-banca-espanola-2014 125/240
( ) g ( g )1.1.1.11} 4(115), 36(1) point (b) and37point (a) of CCR
A.1.10
(-)DTAs that relyon future profitabilityand donot arise from temporary
differencesnet ofassociated DTLs -2,065 -2,065 -2,065 -2,065 -2,065 -2,130 -2,130 CA1 {1.1.1.12} Articles 36(1) point (c) and 38 of CRR
A.1.11 (-)IRB shortfallofcredit riskadjustmentsto expected losses 0 0 0 0 0 0 0 CA1 {1.1.1.13} Articles 36(1) point (d), 40 and 159 of CRR
A.1.12 (-)Defined benefit pension fund assets 0 0 0 0 0 0 0 CA1 {1.1.1.14} Articles 4(109), 36(1) point (e) and 41 of CRR
A.1.13 (-)Reciprocalcrossholdingsin CET1Capital 0 0 0 0 0 0 0 CA1 {1.1.1.15} Articles 4(122), 36(1) point (g) and 44 of CRR
A.1.14 (-)Excessdeduction from AT1itemsover AT1Capital -2 0 0 0 -11 0 0 CA1 {1.1.1.16} Article 36(1) point (j) of CRR
A.1.15(-)Deductionsrelated toassets which can alternativelybe subject toa 1.250%risk
weight-39 -39 -39 -39 -39 -39 -39
CA1{1.1.1.17to
1.1.1.21}
Articles 4(36), 36(1) point (k) (i) and89to 91ofCRR;
Articles 36(1) point (k) (ii), 243(1) point (b), 244(1) point
(b) and258of CRR;Articles 36(1) point k) (iii) and379(3)
ofCRR;Art icles 36(1) point k) (iv) and153(8) ofCRRand
A.1.15.1 Ofwhich: from securitisation positions(-) -39 -39 -39 -39 -39 -39 -39 CA1 {1.1.1.18.1} Articles 36(1) point (k) (ii), 243(1) point (b), 244(1) point
(b) and258of CRR
A.1.16(-)Holdingsof CET1capitalinstrumentsof financialsector entitieswhere the
institiution does not have a significant investment0 0 0 0 0 0 0 CA1 {1.1.1.22}
Articles 4(27), 36(1) point (h);43to46, 49(2) and (3) and
79ofCRR
A.1.17(-)Deductible DTAsthat rely on future profitabilityand arise from temporary
differences0 0 0 0 0 0 0 CA1 {1.1.1.23}
Articles 36(1) point (c) and38;Articles 48(1) point (a) and
48(2) ofCRR
A.1.18(-)Holdingsof CET1capitalinstrumentsof financialsector entitieswhere the
institiution has a significant investment0 0 0 0 0 0 0 CA1 {1.1.1.24}
Articles 4(27);36(1) point (i);43, 45;47; 48(1) point (b);
49(1) to(3) and79of CRR
A.1.19 (-)Amount exceding the 17.65%threshold 0 0 0 0 0 0 0 CA1 {1.1.1.25} Article 470 of CRR
A.1.20 Transitionaladjustments 2,050 2,384 2,364 2,132 2,046 1,992 1,708CA1{1.1.1.6+ 1.1.8+
1.1.26}-
A.1.20.1 Transitionaladjustmentsdue tograndfathered CET1Capitalinstruments(+/-) 0 0 0 0 0 0 0 CA1 {1.1.1.6}
Articles 483(1) to(3), and484to487of CRR
A.1.20.2 Transitionaladjustmentsdue toadditionalminorityinterests(+/-) 370 742 750 643 147 150 35 CA1 {1.1.1.8}
Articles 479and480of CRR
A.1.20.3Other transitionaladjustmentsto CET1Capitalexcl. adjustmentsfor Sovereign
exposure in AFS (+/-)1,680 1,642 1,613 1,489 1,899 1,842 1,673 CA1 {1.1.1.26}
Articles 469to472, 478and 481ofCRR
A.2 ADDITIONAL TIER 1CAPITAL (net ofdeductionsand after transitional
adjustments)0 27 131 228 0 84 69 C A 1 {1 .1 .2 } A rt ic le 6 1 of C RR
A.2.1 Ofwhich:(+) Other existing support government measures 0 0 0 0 0 0 0 - -
A.3 TIER1 CAPITAL(netofdeductionsandafter transitional adjustments) 11,175 12,315 13,114 13,718 11,177 10,761 10,295 C A1 { 1. 1} A rt ic le 2 5 of C RR
A.4 TIER2 CAPITAL(netofdeductionsandafter transitional adjustments) 373 412 505 586 312 307 298 C A1 { 1. 2} A rt ic le 7 1 of C RR
B T OT AL R IS K EX PO SU RE A M OU NT 105,414 99,676 97,446 94,372 102,150 101,226 99,309 C A 2 {1 } A rt ic le s 92 (3 ), 95 , 96 a n d 98 o f CR R
B.1ofwhich:stemming from exposuresthat fallbelow the 10%/ 15%limitsfor
CET1deduction (+)2,246 0 0 0 0 0 0
Articles 36(1) points (a) and(i);Article 38a ndArticle 48of
CRR
B. 2 ofwh ich :s temmi ng f r om fr om CVAcap ita l r eq ui r ements (+) 1,166 0 0 0 0 0 0 Article 381to386 ofCRR
B.3ofwhich:stemming from higher asset correlation parameter against exposures
tolarge financialinstitutionsunder IRB the IRB approachesto credit risk(+)750 0 0 0 0 0 0 Articles 153(2) ofCRR
B.4ofwhich:stemming from the application ofthe supporting factor to increase
lending toSMEs(-)-1,651 0 0 0 0 0 0 Recital (44) ofCRR
B.5
ofwhich:stemming from the effect of exposuresthat were previouslypart of
RiskExposure amount and receive a deduction treatment under CRR/CRDIV (-
)
0 0 0 0 0 0 0 -
B.6 ofwhich:otherssubject tothe discretion ofNationalCompetent Authorities 0 0 0 0 0 0 0 Article 124to164 ofCRR
C.1 Co mm onE q ui tyTi er 1Cap i tal r ati o 10.60% 12.33% 13.32% 14.29% 10.94% 10.55% 10.30% CA3 { 1} -
C .2 T ie r 1 C ap it al ra ti o 10.60% 12.35% 13.46% 14.54% 10.94% 10.63% 10.37% CA3 { 3} -
C .3 T ot al C ap it al r at io 10.96% 12.77% 13.98% 15.16% 11.25% 10.93% 10.67% CA3 { 5} -
D Co mm onE q ui tyTi er 1Cap i tal Thresho ld 7,974 7,796 7,550 5,618 5,567 5,462
ETotalamount of instrumentswith mandatoryconversion intoordinarysharesupon
a fixed date in the 2014 -2016period (cumulative conversions)(1)0 0 0 0 0 0
F
TotalAdditionalTier 1and Tier 2 instrumentseligible asregulatorycapitalunder
the CRR provisionsthat convert into Common EquityTier 1or are written down
upon a trigger event (2)
0 0 0
F.1Ofwhich: eligible instrumentswhose trigger isabove CET1capitalratio in the
adverse scenario(2)
0 0 0
G FullyLoadedCommonEquityTier 1Capital ratio (3) 12.04% 8.58%
(1)Conversionsnot considered for CET1 computation (2)Excluding instrumentsincluded in E (3)Memorandum item based on a fullyimplemented CRR/CRD IV definition of Common EquityTier 1 capitalincluding 60%ofunrealised gains/lossesfrom Sovereign Exposure in AFS portfolio
Memorandumitems
OWN FUNDS
OWN FUNDS
REQUIREMENTS
CAPITALRATIOS(%) -
Transitional period
http://www.economiaciudadana.org/

8/10/2019 Test Stress Banca Española 2014
http://slidepdf.com/reader/full/test-stress-banca-espanola-2014 126/240
2014 EU-wide Stress Test
Outcome of the Stress Test based on the Restructuring plan for banks whose plan was formally agreed with the European Commission after 31 December 2013
(mln EUR)
As of
31/12/2013
As of
31/12/2014
As of
31/12/2015
As of
31/12/2016
As of
31/12/2014
As of
31/12/2015
As of
31/12/2016
COMMON EQUITY TIER 1 CAPITAL (net of deductions and after applying transitional adjustments)
TOTAL RISK EXPOSURE AMOUNT
COMMON EQUITY TIER 1 RATIO #DIV/0! #DIV/0! #DIV/0! #DIV/0! #DIV/0! #DIV/0! #DIV/0!
Baseline scenario Adverse scenario

8/10/2019 Test Stress Banca Española 2014
http://slidepdf.com/reader/full/test-stress-banca-espanola-2014 127/240
COMMON EQUITY TIER 1 RATIO #DIV/0! #DIV/0! #DIV/0! #DIV/0! #DIV/0! #DIV/0! #DIV/0!
http://www.economiaciudadana.org/
2014 EU-wide Stress Test
Impact on Common
Equity Tier 1
Million EUR
Major Capital Measures from 1 January to 30 September 2014
Issuance of CET 1 Instruments
Major Capital Measures Impacting Tier 1 and Tier 2 Eligible Capital from 1 January 2014 to 30 September 2014

8/10/2019 Test Stress Banca Española 2014
http://slidepdf.com/reader/full/test-stress-banca-espanola-2014 128/240
Raising of capital instruments eligible as CET1 capital (+) 1,158
Repayment of CET1 capital, buybacks (-) -167
Conversion to CET1 of hybrid instruments becoming effective between 1 January and 30 September 2014 (+) 0
Impact on Additional
Tier 1 and Tier 2
Million EUR
Net issuance of Additional Tier 1 and T2 Instruments with a trigger at or above bank's post stress test CET1 ratio in the adverse
scenario during the stress test horizon (+/-)0
Net issuance of Additional Tier 1 and T2 Instrument with a trigger below bank's post stress test CET1 ratio in the adversescenario during the stress test horizon (+/-)
0
Million EUR
Realized fines/litigation costs from 1 January to 30 September 2014 (net of provisions) (-) 0
Other material losses and provisions from 1 January to 30 September 2014 (-) 0
Losses
Net issuance of Additional Tier 1 and T2 Instruments
http://www.economiaciudadana.org/
Bank Name ES - Liberbank, S.A.
2014 EU-wide Stress Test
8/10/2019 Test Stress Banca Española 2014
http://slidepdf.com/reader/full/test-stress-banca-espanola-2014 129/240
LEI Code 635400XT3V7WHLSFYY25
ES
NUK_WL_NR_XX
version
1809014
No restructuring
http://www.economiaciudadana.org/
Actual figures as of 31 December 2013 mln EUR, % Actual figures as of 31 December 2013 mln EUR, %
Operating profit before impairments 418 Operating profit before impairments 418
Impairment losses on financial and non-financial assets in the banking book 668 Impairment losses on financial and non-financial assets in the banking book 668
Common Equity Tier 1 capital (1) 1,419 Common Equity Tier 1 capital (1) 1,419
Total Risk Exposure (1) 18,143 Total Risk Exposure (1) 18,143
Common Equity Tier 1 ratio, % (1) 7.8% Common Equity Tier 1 ratio, % (1) 7.8%
Outcome of the adverse scenario as of 31 December 2016 mln EUR, % Outcome of the baseline scenario as of 31 December 2016 mln EUR, %
3 yr cumulative operating profit before impairments 659 3 yr cumulative operating profit before impairments 1,096
3 yr cumulative impairment losses on financial and non-financial assets in the banking book 1,092 3 yr cumulative impairment losses on financial and non-financial assets in the banking book 437
2014 EU-wide Stress Test 2014 EU-wide Stress TestSummary Baseline Scenario
ES - Liberbank, S.A.
Summary Adverse Scenario
ES - Liberbank, S.A.

8/10/2019 Test Stress Banca Española 2014
http://slidepdf.com/reader/full/test-stress-banca-espanola-2014 130/240
y p g , y p g
3 yr cumulative losses from the stress in the trading book 113 3 yr cumulative losses from the stress in the trading book 77
Valuation losses due to sovereign shock after tax and prudential filters 2 Common Equity Tier 1 capital (1) 1,762
Common Equity Tier 1 capital (1) 1,040 Total Risk Exposure (1) 18,773
Total Risk Exposure (1) 18,511 Common Equity Tier 1 ratio, % (1) 9.4%
Common Equity Tier 1 ratio, % (1) 5.6%
Memorandum items mln EUR
Memorandum items mln EUR Common EU wide CET1 Threshold (8.0%) 1,502
Common EU wide CET1 Threshold (5.5%) 1,018
Total amount of instruments with mandatory conversion into ordinary shares upon a fixed date in
the 2014 -2016 period (cumulative conversions) (2)0
Total Additional Tier 1 and Tier 2 instruments eligible as regulatory capital under the CRR provisions
that convert into Common Equity Tier 1 or are written down upon a trigger event (3)435
Of which: eligible instruments whose trigger is above CET1 capital ratio in the adverse
scenario (3)0
(2) Conversions not considered for CET1 computation
(3) Excluding instruments with mandatory conversion into ordinary shares upon a fixed date in the 2014 -2016 period
(1) According to CRR/CRD4 definition transitional arrangements as per reporting date. Figures as of 31/12/2013 computed as of first day of application:
01/01/2014.
(1) According to CRR/CRD4 definition transitional arrangements as per reporting date. Figures as of 31/12/2013 computed as of first day of application:
01/01/2014.
http://www.economiaciudadana.org/
2014 EU-wide Stress TestCredit Risk
(mln EUR, %)
No n-d ef aul t ed De fau lt e d No n-d ef aul t ed De fau lt e d No n-d ef aul t ed De fau lt e d No n-d ef aul t e d De fau lt e d No n-d ef aul t ed De fau lt e d No n-d ef aul t e d De fau lt e d No n-d ef aul t ed De fau lt e d No n-d ef aul t ed De fau lt e d No n-d ef aul t ed De fau lt e dImpairment
rate
Stockof
ProvisionsCoverage Ratio -
Default Stock
Impairment
rate
Stockof
Provisions
Coverage
Ratio-Default
Stock
Impairment
rate
Stockof
Provisions
Coverage
Ratio -Default
Stock
Impairment rateStockof
Provisions
Coverage
Ratio-Default
Stock
Impairment
rate
Stockof
Provisions
Coverage
Ratio-Default
Stock
Impairment
rate
Stockof
Provisions
Coverage
Ratio -Default
Stock
Central banksandcentral governments 0 0 0 0 15,163 2,082 0 0 0 0 270 7 0 0 0 0 45 1,566 0.00% 1,613 42.93% 0.00% 1,613 42.91% 0.00% 1,613 42.90% 1.25% 1,781 43.84% 0.68% 1,875 44.00% 1.30% 1,974 44.88%
Institutions 0 0 0 0 1,953 0 0 0 0 0 526 0 0 0 0 0 1 0 0.00% 1 0.10% 0.00% 1 0.10% 0.00% 1 0.10% 0.00% 1 0.20% 0.00% 1 0.15% 0.00% 1 0.13%
Corporates 0 0 0 0 2,898 649 0 0 0 0 2,747 656 0 0 0 0 90 674 3.65% 1,033 48.13% 2.88% 1,110 47.26% 2.34% 1,169 46.78% 5.29% 1,129 51.08% 4.66% 1,246 50.21% 4.13% 1,338 49.78%
Corporates -Of Which:SpecialisedLending 0 0 0 0 520 53 0 0 0 0 511 48 0 0 0 0 8 142 - 0 - - 0 - - 0 - - 0 - - 0 - - 0 -
Corporates -Of Which:SME 0 0 0 0 1,228 313 0 0 0 0 1,192 315 0 0 0 0 17 256 - 0 - - 0 - - 0 - - 0 - - 0 - - 0 -
Retail 0 0 0 0 17,398 963 0 0 0 0 7,461 1,024 0 0 0 0 21 373 0.31% 507 27.38% 0.18% 541 26.28% 0.14% 564 25.68% 0.51% 581 29.26% 0.37% 641 27.65% 0.29% 685 26.94%
Retail -Securedon real estateproperty 65.2% 0 0 0 0 15,552 804 0 0 0 0 6,211 854 0 0 0 0 15 207 0.16% 300 20.96% 0.08% 316 20.02% 0.05% 325 19.45% 0.29% 356 23.32% 0.20% 385 21.70% 0.12% 403 20.89%
Retail -Securedon real estate property- Of
h i h : S E53.4% 0 0 0 0 772 161 0 0 0 0 493 172 0 0 0 0 7 53 0.45% 63 19.47% 0.27% 66 17.70% 0.18% 67 16.66% 0.80% 67 19.44% 0.55% 71 17.64% 0.40% 73 16.57%
Retail -Securedon real estate property- Of
h i h: n n - E65.9% 0 0 0 0 14,779 643 0 0 0 0 5,718 682 0 0 0 0 8 154 0.14% 237 21.40% 0.08% 250 20.73% 0.05% 258 20.34% 0.26% 289 24.43% 0.18% 314 22.86% 0.11% 330 22.17%
Retail -QualifyingRevolving 0 0 0 0 152 4 0 0 0 0 113 4 0 0 0 0 0 14 1.09% 16 76.53% 0.80% 18 73.89% 0.61% 19 72.08% 1.73% 18 77.84% 1.71% 20 74.07% 1.35% 22 71.75%
Retail -OtherRetail 0 0 0 0 1,695 155 0 0 0 0 1,137 166 0 0 0 0 7 153 1.63% 191 44.91% 1.18% 207 43.07% 0.93% 220 41.83% 2.40% 207 45.58% 2.16% 235 43.95% 1.80% 259 42.90%
Retail -Other Retail -Of Which:SME 0 0 0 0 749 122 0 0 0 0 428 133 0 0 0 0 3 105 1.94% 122 40.31% 1.38% 130 38.42% 1.06% 137 37.10% 2.69% 129 40.34% 2.13% 140 38.47% 1.81% 151 37.23%
Retail -Other Retail -Of Which:non-SME 0 0 0 0 945 33 0 0 0 0 709 32 0 0 0 0 4 48 1.39% 69 56.83% 1.05% 77 54.57% 0.82% 84 53.25% 2.18% 79 58.33% 2.18% 95 55.96% 1.79% 108 54.72%
Equity 0 0 0 0 553 0 0 0 0 0 553 0 0 0 0 0 0 0 0.00% 0 - 0.00% 0 - 0.00% 0 - 0.00% 0 - 0.00% 0 - 0.00% 0 -
Securitisation 0 0 0 0 49 0 0 0 0 0 148 0 0 0 0 0 0 0
Othernon-credit obligation assets 0 0 0 0 3,514 1 0 0 0 0 2,595 1 0 0 0 0 0 0
TOTAL 0 0 0 0 41,528 3,695 0 0 0 0 14,299 1,688 0 0 0 0 157 2,614 0.44% 3,155 40.50% 0.29% 3,265 39.84% 0.27% 3,348 39.45% 1.13% 3,492 42.07% 0.77% 3,763 41.36% 0.85% 3,998 41.38%
Securitisation andre-securitisations positions deductedfrom capital * 0 0 0 0 18 0 0 0 0 0 0 0
(mln EUR, %)No n-d ef aul t ed De fau lt e d No n-d ef aul t ed De fau lt e d No n-d ef aul t ed De fau lt e d No n-d ef aul t e d De fau lt e d No n-d ef aul t ed De fau lt e d No n-d ef aul t e d De fau lt e d No n-d ef aul t ed De fau lt e d No n-d ef aul t ed De fau lt e d No n-d ef aul t ed De fau lt e d
Impairment
rate
Stockof
ProvisionsCoverage Ratio -
Default Stock
Impairment
rate
Stockof
Provisions
Coverage
Ratio-DefaultStock
Impairment
rate
Stockof
Provisions
Coverage
Ratio -DefaultStock
Impairment rateStockof
Provisions
Coverage
Ratio-DefaultStock
Impairment
rate
Stockof
Provisions
Coverage
Ratio-DefaultStock
Impairment
rate
Stockof
Provisions
Coverage
Ratio -DefaultStock
Central banksandcentral governments 0 0 0 0 0 0 0 0 0 0 0 0 0 0 0 0 0 0 0.00% 1,613 42.93% 0.00% 1,613 42.91% 0.00% 1,613 42.90% 1.25% 1,780 43.80% 0.69% 1,874 43.97% 1.31% 1,973 44.85%
Institutions 0 0 0 0 0 0 0 0 0 0 0 0 0 0 0 0 0 0 0.00% 1 0.00% 0.00% 1 0.01% 0.00% 1 0.10% 0.00% 1 0.10% 0.00% 1 0.05% 0.00% 1 0.03%
Corporates 0 0 0 0 0 0 0 0 0 0 0 0 0 0 0 0 0 0 3.65% 1,033 48.13% 2.88% 1,110 47.26% 2.34% 1,169 46.78% 5.29% 1,129 51.08% 4.66% 1,246 50.21% 4.13% 1,338 49.78%
Corporates -Of Which:SpecialisedLending 0 0 0 0 0 0 0 0 0 0 0 0 0 0 0 0 0 0 - 0 - - 0 - - 0 - - 0 - - 0 - - 0 -
Corporates -Of Which:SME 0 0 0 0 0 0 0 0 0 0 0 0 0 0 0 0 0 0 - 0 - - 0 - - 0 - - 0 - - 0 - - 0 -
Retail 0 0 0 0 0 0 0 0 0 0 0 0 0 0 0 0 0 0 0.31% 507 27.38% 0.18% 541 26.28% 0.14% 564 25.68% 0.51% 581 29.26% 0.37% 641 27.65% 0.29% 685 26.94%
Retail -Securedon real estateproperty 0.0% 0 0 0 0 0 0 0 0 0 0 0 0 0 0 0 0 0 0 0.16% 300 20.96% 0.08% 316 20.02% 0.05% 325 19.45% 0.29% 356 23.32% 0.20% 385 21.70% 0.12% 403 20.89%
Retail -Securedon real estate property- Of
h i h : S E0.0% 0 0 0 0 0 0 0 0 0 0 0 0 0 0 0 0 0 0 0.45% 63 19.47% 0.27% 66 17.70% 0.18% 67 16.66% 0.80% 67 19.44% 0.55% 71 17.64% 0.40% 73 16.57%
Retail -Securedon real estate property- Of
h i h: n n - E0.0% 0 0 0 0 0 0 0 0 0 0 0 0 0 0 0 0 0 0 0.14% 237 21.40% 0.08% 250 20.73% 0.05% 258 20.34% 0.26% 289 24.43% 0.18% 314 22.86% 0.11% 330 22.17%
Retail -QualifyingRevolving 0 0 0 0 0 0 0 0 0 0 0 0 0 0 0 0 0 0 1.09% 16 76.53% 0.80% 18 73.89% 0.61% 19 72.08% 1.73% 18 77.84% 1.71% 20 74.07% 1.35% 22 71.75%
Retail -OtherRetail 0 0 0 0 0 0 0 0 0 0 0 0 0 0 0 0 0 0 1.63% 191 44.91% 1.18% 207 43.07% 0.93% 220 41.83% 2.40% 207 45.58% 2.16% 235 43.95% 1.80% 259 42.90%
Retail -Other Retail -Of Which:SME 0 0 0 0 0 0 0 0 0 0 0 0 0 0 0 0 0 0 1.94% 122 40.31% 1.38% 130 38.42% 1.06% 137 37.10% 2.69% 129 40.34% 2.13% 140 38.47% 1.81% 151 37.23%
Risk exposureamounts(as of31/12/2013)
asof 31/12/2016
Spain
AdverseScenario
F-IRB A-IRB STA F-IRB A-IRB STA F-IRB A-IRB STA as of 31/12/2014 as of 31/12/2015 as of 31/12/2016 as of 31/12/2014 as of 31/12/2015 as of 31/12/2016LTV %(asof
31/12/2013)
Exposurevalues(as of31/12/2013)
ES - Liberbank, S.A.
(*)Referstothepart ofSecuritizationexposurethat isdeductedfrom capital andisnot includedinRWA
Valueadjustmentsand provisions(asof 31/12/2013) BaselineScenario
LTV %(asof
31/12/2013)
Exposure values (as of 31/12/2013) Risk exposure amounts (as of 31/12/2013) Value adjustments and provisions (as of 31/12/2013) Adverse Scenario
F-IRB A-IRB STA F-IRB A-IRB STA F-IRB A-IRB STA
BaselineScenario
as of 31/12/2014 as of 31/12/2015 as of 31/12/2016 as of 31/12/2014 as of 31/12/2015

8/10/2019 Test Stress Banca Española 2014
http://slidepdf.com/reader/full/test-stress-banca-espanola-2014 131/240
Retail -Other Retail -Of Which:non-SME 0 0 0 0 0 0 0 0 0 0 0 0 0 0 0 0 0 0 1.39% 69 56.83% 1.05% 77 54.57% 0.82% 84 53.25% 2.18% 79 58.33% 2.18% 95 55.96% 1.79% 108 54.72%Equity 0 0 0 0 0 0 0 0 0 0 0 0 0 0 0 0 0 0 0.00% 0 - 0.00% 0 - 0.00% 0 - 0.00% 0 - 0.00% 0 - 0.00% 0 -
Securitisation 0 0 0 0 0 0 0 0 0 0 0 0 0 0 0 0 0 0
Othernon-credit obligation assets 0 0 0 0 0 0 0 0 0 0 0 0 0 0 0 0 0 0
TOTAL 0 0 0 0 0 0 0 0 0 0 0 0 0 0 0 0 0 0 0.44% 3,155 40.50% 0.29% 3,265 39.84% 0.27% 3,348 39.45% 1.14% 3,491 42.05% 0.77% 3,762 41.35% 0.85% 3,997 41.37%Securitisation andre-securitisations positions deductedfrom capital * 0 0 0 0 0 0 0 0 0 0 0 0
(mln EUR, %)No n-d ef aul t ed De fau lt e d No n-d ef aul t ed De fau lt e d No n-d ef aul t ed De fau lt e d No n-d ef aul t e d De fau lt e d No n-d ef aul t ed De fau lt e d No n-d ef aul t e d De fau lt e d No n-d ef aul t ed De fau lt e d No n-d ef aul t ed De fau lt e d No n-d ef aul t ed De fau lt e d
Impairment
rate
Stockof
ProvisionsCoverage Ratio -
Default Stock
Impairment
rate
Stockof
Provisions
CoverageRatio-Default
Stock
Impairment
rate
Stockof
Provisions
CoverageRatio -Default
Stock
Impairment rateStockof
Provisions
CoverageRatio-Default
Stock
Impairment
rate
Stockof
Provisions
CoverageRatio-Default
Stock
Impairment
rate
Stockof
Provisions
CoverageRatio -Default
Stock Central banksandcentral governments 0 0 0 0 0 0 0 0 0 0 0 0 0 0 0 0 0 0 - 0 - - 0 - - 0 - - 0 - - 0 - - 0 -
Institutions 0 0 0 0 0 0 0 0 0 0 0 0 0 0 0 0 0 0 - 0 - - 0 - - 0 - - 0 - - 0 - - 0 -
Corporates 0 0 0 0 0 0 0 0 0 0 0 0 0 0 0 0 0 0 - 0 - - 0 - - 0 - - 0 - - 0 - - 0 -
Corporates -Of Which:SpecialisedLending 0 0 0 0 0 0 0 0 0 0 0 0 0 0 0 0 0 0 - 0 - - 0 - - 0 - - 0 - - 0 - - 0 -
Corporates -Of Which:SME 0 0 0 0 0 0 0 0 0 0 0 0 0 0 0 0 0 0 - 0 - - 0 - - 0 - - 0 - - 0 - - 0 -
Retail 0 0 0 0 0 0 0 0 0 0 0 0 0 0 0 0 0 0 - 0 - - 0 - - 0 - - 0 - - 0 - - 0 -
Retail -Securedon real estateproperty 0.0% 0 0 0 0 0 0 0 0 0 0 0 0 0 0 0 0 0 0 - 0 - - 0 - - 0 - - 0 - - 0 - - 0 -
Retail -Securedon real estate property- Of
hi h: E0.0% 0 0 0 0 0 0 0 0 0 0 0 0 0 0 0 0 0 0 - 0 - - 0 - - 0 - - 0 - - 0 - - 0 -
Retail -Securedon real estate property- Of
h i h : n n -S E0.0% 0 0 0 0 0 0 0 0 0 0 0 0 0 0 0 0 0 0 - 0 - - 0 - - 0 - - 0 - - 0 - - 0 -
Retail -QualifyingRevolving 0 0 0 0 0 0 0 0 0 0 0 0 0 0 0 0 0 0 - 0 - - 0 - - 0 - - 0 - - 0 - - 0 -
Retail -OtherRetail 0 0 0 0 0 0 0 0 0 0 0 0 0 0 0 0 0 0 - 0 - - 0 - - 0 - - 0 - - 0 - - 0 -
Retail -Other Retail -Of Which:SME 0 0 0 0 0 0 0 0 0 0 0 0 0 0 0 0 0 0 - 0 - - 0 - - 0 - - 0 - - 0 - - 0 -
Retail -Other Retail -Of Which:non-SME 0 0 0 0 0 0 0 0 0 0 0 0 0 0 0 0 0 0 - 0 - - 0 - - 0 - - 0 - - 0 - - 0 -
Equity 0 0 0 0 0 0 0 0 0 0 0 0 0 0 0 0 0 0 - 0 - - 0 - - 0 - - 0 - - 0 - - 0 -
Securitisation 0 0 0 0 0 0 0 0 0 0 0 0 0 0 0 0 0 0
Othernon-credit obligation assets 0 0 0 0 0 0 0 0 0 0 0 0 0 0 0 0 0 0
TOTAL 0 0 0 0 0 0 0 0 0 0 0 0 0 0 0 0 0 0 - 0 - - 0 - - 0 - - 0 - - 0 - - 0 -
Securitisation andre-securitisations positions deductedfrom capital * 0 0 0 0 0 0 0 0 0 0 0 0
(mln EUR, %)No n-d ef aul t ed De fau lt e d No n-d ef aul t ed De fau lt e d No n-d ef aul t ed De fau lt e d No n-d ef aul t e d De fau lt e d No n-d ef aul t ed De fau lt e d No n-d ef aul t e d De fau lt e d No n-d ef aul t ed De fau lt e d No n-d ef aul t ed De fau lt e d No n-d ef aul t ed De fau lt e d
Impairment
rate
Stockof
ProvisionsCoverage Ratio -
Default Stock
Impairment
rate
Stockof
Provisions
CoverageRatio-Default
Stock
Impairment
rate
Stockof
Provisions
CoverageRatio -Default
Stock
Impairment rateStockof
Provisions
CoverageRatio-Default
Stock
Impairment
rate
Stockof
Provisions
CoverageRatio-Default
Stock
Impairment
rate
Stockof
Provisions
CoverageRatio -Default
Stock Central banksandcentral governments 0 0 0 0 0 0 0 0 0 0 0 0 0 0 0 0 0 0 - 0 - - 0 - - 0 - - 0 - - 0 - - 0 -
Institutions 0 0 0 0 0 0 0 0 0 0 0 0 0 0 0 0 0 0 - 0 - - 0 - - 0 - - 0 - - 0 - - 0 -
Corporates 0 0 0 0 0 0 0 0 0 0 0 0 0 0 0 0 0 0 - 0 - - 0 - - 0 - - 0 - - 0 - - 0 -
Corporates -Of Which:SpecialisedLending 0 0 0 0 0 0 0 0 0 0 0 0 0 0 0 0 0 0 - 0 - - 0 - - 0 - - 0 - - 0 - - 0 -
Corporates -Of Which:SME 0 0 0 0 0 0 0 0 0 0 0 0 0 0 0 0 0 0 - 0 - - 0 - - 0 - - 0 - - 0 - - 0 -
Retail 0 0 0 0 0 0 0 0 0 0 0 0 0 0 0 0 0 0 - 0 - - 0 - - 0 - - 0 - - 0 - - 0 -
Retail -Securedon real estateproperty 0.0% 0 0 0 0 0 0 0 0 0 0 0 0 0 0 0 0 0 0 - 0 - - 0 - - 0 - - 0 - - 0 - - 0 -
Retail -Securedon real estate property- Of
hi h: E
0.0% 0 0 0 0 0 0 0 0 0 0 0 0 0 0 0 0 0 0 - 0 - - 0 - - 0 - - 0 - - 0 - - 0 -
Retail -Securedon real estate property- Of
h i h: n n - E0.0% 0 0 0 0 0 0 0 0 0 0 0 0 0 0 0 0 0 0 - 0 - - 0 - - 0 - - 0 - - 0 - - 0 -
Retail -QualifyingRevolving 0 0 0 0 0 0 0 0 0 0 0 0 0 0 0 0 0 0 - 0 - - 0 - - 0 - - 0 - - 0 - - 0 -
Retail -OtherRetail 0 0 0 0 0 0 0 0 0 0 0 0 0 0 0 0 0 0 - 0 - - 0 - - 0 - - 0 - - 0 - - 0 -
Retail -Other Retail -Of Which:SME 0 0 0 0 0 0 0 0 0 0 0 0 0 0 0 0 0 0 - 0 - - 0 - - 0 - - 0 - - 0 - - 0 -
Retail -Other Retail -Of Which:non-SME 0 0 0 0 0 0 0 0 0 0 0 0 0 0 0 0 0 0 - 0 - - 0 - - 0 - - 0 - - 0 - - 0 -
Equity 0 0 0 0 0 0 0 0 0 0 0 0 0 0 0 0 0 0 - 0 - - 0 - - 0 - - 0 - - 0 - - 0 -
Securitisation 0 0 0 0 0 0 0 0 0 0 0 0 0 0 0 0 0 0
Othernon-credit obligation assets 0 0 0 0 0 0 0 0 0 0 0 0 0 0 0 0 0 0
TOTAL 0 0 0 0 0 0 0 0 0 0 0 0 0 0 0 0 0 0 - 0 - - 0 - - 0 - - 0 - - 0 - - 0 -
Securitisation andre-securitisations positions deductedfrom capital * 0 0 0 0 0 0 0 0 0 0 0 0
(mln EUR, %)No n-d ef aul t ed De fau lt e d No n-d ef aul t ed De fau lt e d No n-d ef aul t ed De fau lt e d No n-d ef aul t e d De fau lt e d No n-d ef aul t ed De fau lt e d No n-d ef aul t e d De fau lt e d No n-d ef aul t ed De fau lt e d No n-d ef aul t ed De fau lt e d No n-d ef aul t ed De fau lt e d
Impairment
rate
Stockof
ProvisionsCoverage Ratio -
Default Stock
Impairment
rate
Stockof
Provisions
CoverageRatio-Default
Stock
Impairment
rate
Stockof
Provisions
CoverageRatio -Default
Stock
Impairment rateStockof
Provisions
CoverageRatio-Default
Stock
Impairment
rate
Stockof
Provisions
CoverageRatio-Default
Stock
Impairment
rate
Stockof
Provisions
CoverageRatio -Default
Stock Central banksandcentral governments 0 0 0 0 0 0 0 0 0 0 0 0 0 0 0 0 0 0 - 0 - - 0 - - 0 - - 0 - - 0 - - 0 -
Institutions 0 0 0 0 0 0 0 0 0 0 0 0 0 0 0 0 0 0 - 0 - - 0 - - 0 - - 0 - - 0 - - 0 -
Corporates 0 0 0 0 0 0 0 0 0 0 0 0 0 0 0 0 0 0 - 0 - - 0 - - 0 - - 0 - - 0 - - 0 -
Corporates -Of Which:SpecialisedLending 0 0 0 0 0 0 0 0 0 0 0 0 0 0 0 0 0 0 - 0 - - 0 - - 0 - - 0 - - 0 - - 0 -
Corporates -Of Which:SME 0 0 0 0 0 0 0 0 0 0 0 0 0 0 0 0 0 0 - 0 - - 0 - - 0 - - 0 - - 0 - - 0 -
Retail 0 0 0 0 0 0 0 0 0 0 0 0 0 0 0 0 0 0 - 0 - - 0 - - 0 - - 0 - - 0 - - 0 -
Retail -Securedon real estateproperty 0.0% 0 0 0 0 0 0 0 0 0 0 0 0 0 0 0 0 0 0 - 0 - - 0 - - 0 - - 0 - - 0 - - 0 -
Retail -Securedon real estate property- Of
hi h: E0.0% 0 0 0 0 0 0 0 0 0 0 0 0 0 0 0 0 0 0 - 0 - - 0 - - 0 - - 0 - - 0 - - 0 -
Retail -Securedon real estate property- Of
h i h : n n -S E0.0% 0 0 0 0 0 0 0 0 0 0 0 0 0 0 0 0 0 0 - 0 - - 0 - - 0 - - 0 - - 0 - - 0 -
Retail -QualifyingRevolving 0 0 0 0 0 0 0 0 0 0 0 0 0 0 0 0 0 0 - 0 - - 0 - - 0 - - 0 - - 0 - - 0 -
Retail -OtherRetail 0 0 0 0 0 0 0 0 0 0 0 0 0 0 0 0 0 0 - 0 - - 0 - - 0 - - 0 - - 0 - - 0 -
Retail -Other Retail -Of Which:SME 0 0 0 0 0 0 0 0 0 0 0 0 0 0 0 0 0 0 - 0 - - 0 - - 0 - - 0 - - 0 - - 0 -
Retail -Other Retail -Of Which:non-SME 0 0 0 0 0 0 0 0 0 0 0 0 0 0 0 0 0 0 - 0 - - 0 - - 0 - - 0 - - 0 - - 0 -
Equity 0 0 0 0 0 0 0 0 0 0 0 0 0 0 0 0 0 0 - 0 - - 0 - - 0 - - 0 - - 0 - - 0 -
Securitisation 0 0 0 0 0 0 0 0 0 0 0 0 0 0 0 0 0 0
Othernon-credit obligation assets 0 0 0 0 0 0 0 0 0 0 0 0 0 0 0 0 0 0
TOTAL 0 0 0 0 0 0 0 0 0 0 0 0 0 0 0 0 0 0 - 0 - - 0 - - 0 - - 0 - - 0 - - 0 -
Securitisation andre-securitisations positions deductedfrom capital * 0 0 0 0 0 0 0 0 0 0 0 0
(mln EUR, %)No n-d ef aul t ed De fau lt e d No n-d ef aul t ed De fau lt e d No n-d ef aul t ed De fau lt e d No n-d ef aul t e d De fau lt e d No n-d ef aul t ed De fau lt e d No n-d ef aul t e d De fau lt e d No n-d ef aul t ed De fau lt e d No n-d ef aul t ed De fau lt e d No n-d ef aul t ed De fau lt e d
Impairment
rate
Stockof
ProvisionsCoverage Ratio -
Default Stock
Impairment
rate
Stockof
Provisions
CoverageRatio-Default
Stock
Impairment
rate
Stockof
Provisions
CoverageRatio -Default
Stock
Impairment rateStockof
Provisions
CoverageRatio-Default
Stock
Impairment
rate
Stockof
Provisions
CoverageRatio-Default
Stock
Impairment
rate
Stockof
Provisions
CoverageRatio -Default
Stock Central banksandcentral governments 0 0 0 0 0 0 0 0 0 0 0 0 0 0 0 0 0 0 - 0 - - 0 - - 0 - - 0 - - 0 - - 0 -
Institutions 0 0 0 0 0 0 0 0 0 0 0 0 0 0 0 0 0 0 - 0 - - 0 - - 0 - - 0 - - 0 - - 0 -
Corporates 0 0 0 0 0 0 0 0 0 0 0 0 0 0 0 0 0 0 - 0 - - 0 - - 0 - - 0 - - 0 - - 0 -
Corporates -Of Which:SpecialisedLending 0 0 0 0 0 0 0 0 0 0 0 0 0 0 0 0 0 0 - 0 - - 0 - - 0 - - 0 - - 0 - - 0 -Corporates -Of Which:SME 0 0 0 0 0 0 0 0 0 0 0 0 0 0 0 0 0 0 - 0 - - 0 - - 0 - - 0 - - 0 - - 0 -
Retail 0 0 0 0 0 0 0 0 0 0 0 0 0 0 0 0 0 0 - 0 - - 0 - - 0 - - 0 - - 0 - - 0 -
Retail -Securedon real estateproperty 0.0% 0 0 0 0 0 0 0 0 0 0 0 0 0 0 0 0 0 0 - 0 - - 0 - - 0 - - 0 - - 0 - - 0 -
Retail -Securedon real estate property- Of
hi h: E0.0% 0 0 0 0 0 0 0 0 0 0 0 0 0 0 0 0 0 0 - 0 - - 0 - - 0 - - 0 - - 0 - - 0 -
Retail -Securedon real estate property- Of
h i h: n n - E0.0% 0 0 0 0 0 0 0 0 0 0 0 0 0 0 0 0 0 0 - 0 - - 0 - - 0 - - 0 - - 0 - - 0 -
Retail -QualifyingRevolving 0 0 0 0 0 0 0 0 0 0 0 0 0 0 0 0 0 0 - 0 - - 0 - - 0 - - 0 - - 0 - - 0 -
Retail -OtherRetail 0 0 0 0 0 0 0 0 0 0 0 0 0 0 0 0 0 0 - 0 - - 0 - - 0 - - 0 - - 0 - - 0 -
Retail -Other Retail -Of Which:SME 0 0 0 0 0 0 0 0 0 0 0 0 0 0 0 0 0 0 - 0 - - 0 - - 0 - - 0 - - 0 - - 0 -
Retail -Other Retail -Of Which:non-SME 0 0 0 0 0 0 0 0 0 0 0 0 0 0 0 0 0 0 - 0 - - 0 - - 0 - - 0 - - 0 - - 0 -
Equity 0 0 0 0 0 0 0 0 0 0 0 0 0 0 0 0 0 0 - 0 - - 0 - - 0 - - 0 - - 0 - - 0 -
Securitisation 0 0 0 0 0 0 0 0 0 0 0 0 0 0 0 0 0 0
Othernon-credit obligation assets 0 0 0 0 0 0 0 0 0 0 0 0 0 0 0 0 0 0
TOTAL 0 0 0 0 0 0 0 0 0 0 0 0 0 0 0 0 0 0 - 0 - - 0 - - 0 - - 0 - - 0 - - 0 -
Securitisation andre-securitisations positions deductedfrom capital * 0 0 0 0 0 0 0 0 0 0 0 0
as of 31/12/2016 as of 31/12/2014 as of 31/12/2015 as of 31/12/2016
0
F-IRB A-IRB STA a s of 3 1/ 12 /2 01 4 a s of 3 1/ 12 /2 01 5LTV %(asof
31/12/2013)
Exposure values (as of 31/12/2013) Risk exposure amounts (as of 31/12/2013) Value adjustments and provisions (as of 31/12/2013) Baseline Scenario Adverse Scenario
F-IRB A-IRB STA F-IRB A-IRB STA
LTV %(asof
31/12/2013)
Exposure values (as of 31/12/2013) Risk exposure amounts (as of 31/12/2013) Value adjustments and provisions (as of 31/12/2013) Baseline Scenario Adverse Scenario
F-IRB A-IRB STA F-IRB A-IRB STA F-IRB a sof 31 /12 /2 01 4 a so f3 1/ 12 /2 01 5 a sof 31 /12 /2 01 6 A-IRB STA a sof 31 /1 2/ 20 14 a so f3 1/ 12 /2 01 5 a sof 31 /12 /2 01 6
LTV %(asof
31/12/2013)
Exposure values (as of 31/12/2013) Risk exposure amounts (as of 31/12/2013) Value adjustments and provisions (as of 31/12/2013) Baseline Scenario Adverse Scenario
F-IRB A-IRB STA F-IRB A-IRB STA F-IRB A-IRB a s of 3 1/ 12 /2 01 5 a s of 3 1/ 12 /2 01 6STA as of 31/12/2014 as of 31/12/2015 as of 31/12/2016 as of 31/12/2014
Baseline Scenario Adverse Scenario
F-IRB A-IRB STA F-IRB A-IRB STA F-IRB A-IRB STA as of 31/12/2014 as of 31/12/2015 as of 31/12/2016 as of 31/12/2014 as of 31/12/2015 as of 31/12/2016LTV %(asof
31/12/2013)
E xp os ur e va lu es ( as of 3 1/ 12 /2 01 3) R is k e xp os ur e am ou nt s (a s of 3 1/ 12 /2 01 3) V al ue a dj us tm en ts a nd pr ov is io ns ( as o f3 1/ 12 /2 01 3)
(*)Referstothepart ofSecuritizationexposurethat isdeductedfrom capital andisnot includedinRWA
(*)Referstothepart ofSecuritizationexposurethat isdeductedfrom capital andisnot includedinRWA
(*)Referstothepart ofSecuritizationexposurethat isdeductedfrom capital andisnot includedinRWA
(*)Referstothepart ofSecuritizationexposurethat isdeductedfrom capital andisnot includedinRWA
(*)Referstothepart ofSecuritizationexposurethat isdeductedfrom capital andisnot includedinRWA
0
0
0
http://www.economiaciudadana.org/
2014 EU-wide Stress TestCredit Risk
31 1 13) 31 1 13) 31 1 13)
(mln EU
R, %)No n-d ef aul t ed De fau lt e d No n-d ef aul t ed De fau lt e d No n-d ef aul t ed De fau lt e d No n-d ef aul t e d De fau lt e d No n-d ef aul t ed De fau lt e d No n-d ef aul t e d De fau lt e d No n-d ef aul t ed De fau lt e d No n-d ef aul t ed De fau lt e d No n-d ef aul t ed De fau lt e d
Impairment
rate
Stockof
ProvisionsCoverage Ratio -
Default Stock
Impairment
rate
Stockof
Provisions
CoverageRatio-Default
Stock
Impairment
rate
Stockof
Provisions
CoverageRatio -Default
Stock
Impairment rateStockof
Provisions
CoverageRatio-Default
Stock
Impairment
rate
Stockof
Provisions
CoverageRatio-Default
Stock
Impairment
rate
Stockof
Provisions
CoverageRatio -Default
Stock Central banksandcentral governments 0 0 0 0 0 0 0 0 0 0 0 0 0 0 0 0 0 0 - 0 - - 0 - - 0 - - 0 - - 0 - - 0 -
Institutions 0 0 0 0 0 0 0 0 0 0 0 0 0 0 0 0 0 0 - 0 - - 0 - - 0 - - 0 - - 0 - - 0 -
Corporates 0 0 0 0 0 0 0 0 0 0 0 0 0 0 0 0 0 0 - 0 - - 0 - - 0 - - 0 - - 0 - - 0 -
Corporates -Of Which:SpecialisedLending 0 0 0 0 0 0 0 0 0 0 0 0 0 0 0 0 0 0 - 0 - - 0 - - 0 - - 0 - - 0 - - 0 -
Corporates -Of Which:SME 0 0 0 0 0 0 0 0 0 0 0 0 0 0 0 0 0 0 - 0 - - 0 - - 0 - - 0 - - 0 - - 0 -
Retail 0 0 0 0 0 0 0 0 0 0 0 0 0 0 0 0 0 0 - 0 - - 0 - - 0 - - 0 - - 0 - - 0 -
Retail -Securedon real estateproperty 0.0% 0 0 0 0 0 0 0 0 0 0 0 0 0 0 0 0 0 0 - 0 - - 0 - - 0 - - 0 - - 0 - - 0 -
Retail -Securedon real estate property- Of
hi h: E0.0% 0 0 0 0 0 0 0 0 0 0 0 0 0 0 0 0 0 0 - 0 - - 0 - - 0 - - 0 - - 0 - - 0 -
Retail -Securedon real estate property- Of
h i h: n n - E0.0% 0 0 0 0 0 0 0 0 0 0 0 0 0 0 0 0 0 0 - 0 - - 0 - - 0 - - 0 - - 0 - - 0 -
Retail -QualifyingRevolving 0 0 0 0 0 0 0 0 0 0 0 0 0 0 0 0 0 0 - 0 - - 0 - - 0 - - 0 - - 0 - - 0 -
Retail -OtherRetail 0 0 0 0 0 0 0 0 0 0 0 0 0 0 0 0 0 0 - 0 - - 0 - - 0 - - 0 - - 0 - - 0 -
Retail -Other Retail -Of Which:SME 0 0 0 0 0 0 0 0 0 0 0 0 0 0 0 0 0 0 - 0 - - 0 - - 0 - - 0 - - 0 - - 0 -
Retail -Other Retail -Of Which:non-SME 0 0 0 0 0 0 0 0 0 0 0 0 0 0 0 0 0 0 - 0 - - 0 - - 0 - - 0 - - 0 - - 0 -
Equity 0 0 0 0 0 0 0 0 0 0 0 0 0 0 0 0 0 0 - 0 - - 0 - - 0 - - 0 - - 0 - - 0 -
Securitisation 0 0 0 0 0 0 0 0 0 0 0 0 0 0 0 0 0 0
Othernon-credit obligation assets 0 0 0 0 0 0 0 0 0 0 0 0 0 0 0 0 0 0
TOTAL 0 0 0 0 0 0 0 0 0 0 0 0 0 0 0 0 0 0 - 0 - - 0 - - 0 - - 0 - - 0 - - 0 -
Securitisation andre-securitisations positions deductedfrom capital * 0 0 0 0 0 0 0 0 0 0 0 0
(mln EUR, %)No n-d ef aul t ed De fau lt e d No n-d ef aul t ed De fau lt e d No n-d ef aul t ed De fau lt e d No n-d ef aul t e d De fau lt e d No n-d ef aul t ed De fau lt e d No n-d ef aul t e d De fau lt e d No n-d ef aul t ed De fau lt e d No n-d ef aul t ed De fau lt e d No n-d ef aul t ed De fau lt e d
Impairment
rate
Stockof
ProvisionsCoverage Ratio -
Default Stock
Impairment
rate
Stockof
Provisions
CoverageRatio-Default
Stock
Impairment
rate
Stockof
Provisions
CoverageRatio -Default
Stock
Impairment rateStockof
Provisions
CoverageRatio-Default
Stock
Impairment
rate
Stockof
Provisions
CoverageRatio-Default
Stock
Impairment
rate
Stockof
Provisions
CoverageRatio -Default
Stock Central banksandcentral governments 0 0 0 0 0 0 0 0 0 0 0 0 0 0 0 0 0 0 - 0 - - 0 - - 0 - - 0 - - 0 - - 0 -
Institutions 0 0 0 0 0 0 0 0 0 0 0 0 0 0 0 0 0 0 - 0 - - 0 - - 0 - - 0 - - 0 - - 0 -
Corporates 0 0 0 0 0 0 0 0 0 0 0 0 0 0 0 0 0 0 - 0 - - 0 - - 0 - - 0 - - 0 - - 0 -
Corporates -Of Which:SpecialisedLending 0 0 0 0 0 0 0 0 0 0 0 0 0 0 0 0 0 0 - 0 - - 0 - - 0 - - 0 - - 0 - - 0 -
Corporates -Of Which:SME 0 0 0 0 0 0 0 0 0 0 0 0 0 0 0 0 0 0 - 0 - - 0 - - 0 - - 0 - - 0 - - 0 -
Retail 0 0 0 0 0 0 0 0 0 0 0 0 0 0 0 0 0 0 - 0 - - 0 - - 0 - - 0 - - 0 - - 0 -
Retail -Securedon real estateproperty 0.0% 0 0 0 0 0 0 0 0 0 0 0 0 0 0 0 0 0 0 - 0 - - 0 - - 0 - - 0 - - 0 - - 0 -
Retail -Securedon real estate property- Of
h i h : S E0.0% 0 0 0 0 0 0 0 0 0 0 0 0 0 0 0 0 0 0 - 0 - - 0 - - 0 - - 0 - - 0 - - 0 -
Retail -Securedon real estate property- Of
h i h: n n - E0.0% 0 0 0 0 0 0 0 0 0 0 0 0 0 0 0 0 0 0 - 0 - - 0 - - 0 - - 0 - - 0 - - 0 -
Retail -QualifyingRevolving 0 0 0 0 0 0 0 0 0 0 0 0 0 0 0 0 0 0 - 0 - - 0 - - 0 - - 0 - - 0 - - 0 -
Retail -OtherRetail 0 0 0 0 0 0 0 0 0 0 0 0 0 0 0 0 0 0 - 0 - - 0 - - 0 - - 0 - - 0 - - 0 -
Retail -Other Retail -Of Which:SME 0 0 0 0 0 0 0 0 0 0 0 0 0 0 0 0 0 0 - 0 - - 0 - - 0 - - 0 - - 0 - - 0 -
Retail -Other Retail -Of Which:non-SME 0 0 0 0 0 0 0 0 0 0 0 0 0 0 0 0 0 0 - 0 - - 0 - - 0 - - 0 - - 0 - - 0 -
Equity 0 0 0 0 0 0 0 0 0 0 0 0 0 0 0 0 0 0 - 0 - - 0 - - 0 - - 0 - - 0 - - 0 -
Securitisation 0 0 0 0 0 0 0 0 0 0 0 0 0 0 0 0 0 0
Othernon-credit obligation assets 0 0 0 0 0 0 0 0 0 0 0 0 0 0 0 0 0 0
TOTAL 0 0 0 0 0 0 0 0 0 0 0 0 0 0 0 0 0 0 - 0 - - 0 - - 0 - - 0 - - 0 - - 0 -
AdverseScenario
F-IRB A-IRB STA F-IRB A-IRB STA F-IRB A-IRB STA as of 31/12/2014 as of 31/12/2015 as of 31/12/2016 as of 31/12/2014 as of 31/12/2015 as of 31/12/2016LTV %(asof
31/12/2013)
E xp os ur e va lu es ( as of 3 1/ 12 /2 01 3) R is k e xp os ur e am ou nt s (a s of 3 1/ 12 /2 01 3) V al ue a dj us tm en ts a nd pr ov is io ns ( as o f3 1/ 12 /2 01 3)
AdverseScenarioF-IRB A-IRB STA F-IRB A-IRB STA F-IRB A-IRB STA as of 31/12/2014 as of 31/12/2015 as of 31/12/2016 as of 31/12/2014 as of 31/12/2015 as of 31/12/2016
LTV %(asof
31/12/2013)
E xp os ur e va lu es ( as of 3 1/ 12 /2 01 3) R is k e xp os ur e am ou nt s (a s of 3 1/ 12 /2 01 3)
BaselineScenario
Valueadjustmentsand provisions(asof 31/12/2013) BaselineScenario
(*)Referstothepart ofSecuritizationexposurethat isdeductedfrom capital andisnot includedinRWA
0
0

8/10/2019 Test Stress Banca Española 2014
http://slidepdf.com/reader/full/test-stress-banca-espanola-2014 132/240
Securitisation andre-securitisations positions deductedfrom capital * 0 0 0 0 0 0 0 0 0 0 0 0
(mln EUR, %)No n-d ef aul t ed De fau lt e d No n-d ef aul t ed De fau lt e d No n-d ef aul t ed De fau lt e d No n-d ef aul t e d De fau lt e d No n-d ef aul t ed De fau lt e d No n-d ef aul t e d De fau lt e d No n-d ef aul t ed De fau lt e d No n-d ef aul t ed De fau lt e d No n-d ef aul t ed De fau lt e d
Impairment
rate
Stockof
ProvisionsCoverage Ratio -
Default Stock
Impairment
rate
Stockof
Provisions
Coverage
Ratio-Default
Stock
Impairment
rate
Stockof
Provisions
Coverage
Ratio -Default
Stock
Impairment rateStockof
Provisions
Coverage
Ratio-Default
Stock
Impairment
rate
Stockof
Provisions
Coverage
Ratio-Default
Stock
Impairment
rate
Stockof
Provisions
Coverage
Ratio -Default
Stock Central banksandcentral governments 0 0 0 0 0 0 0 0 0 0 0 0 0 0 0 0 0 0 - 0 - - 0 - - 0 - - 0 - - 0 - - 0 -
Institutions 0 0 0 0 0 0 0 0 0 0 0 0 0 0 0 0 0 0 - 0 - - 0 - - 0 - - 0 - - 0 - - 0 -
Corporates 0 0 0 0 0 0 0 0 0 0 0 0 0 0 0 0 0 0 - 0 - - 0 - - 0 - - 0 - - 0 - - 0 -
Corporates -Of Which:SpecialisedLending 0 0 0 0 0 0 0 0 0 0 0 0 0 0 0 0 0 0 - 0 - - 0 - - 0 - - 0 - - 0 - - 0 -
Corporates -Of Which:SME 0 0 0 0 0 0 0 0 0 0 0 0 0 0 0 0 0 0 - 0 - - 0 - - 0 - - 0 - - 0 - - 0 -
Retail 0 0 0 0 0 0 0 0 0 0 0 0 0 0 0 0 0 0 - 0 - - 0 - - 0 - - 0 - - 0 - - 0 -
Retail -Securedon real estateproperty 0.0% 0 0 0 0 0 0 0 0 0 0 0 0 0 0 0 0 0 0 - 0 - - 0 - - 0 - - 0 - - 0 - - 0 -
Retail -Securedon real estate property- Of
hi h: E0.0% 0 0 0 0 0 0 0 0 0 0 0 0 0 0 0 0 0 0 - 0 - - 0 - - 0 - - 0 - - 0 - - 0 -
Retail -Securedon real estate property- Of
h i h: n n - E0.0% 0 0 0 0 0 0 0 0 0 0 0 0 0 0 0 0 0 0 - 0 - - 0 - - 0 - - 0 - - 0 - - 0 -
Retail -QualifyingRevolving 0 0 0 0 0 0 0 0 0 0 0 0 0 0 0 0 0 0 - 0 - - 0 - - 0 - - 0 - - 0 - - 0 -
Retail -OtherRetail 0 0 0 0 0 0 0 0 0 0 0 0 0 0 0 0 0 0 - 0 - - 0 - - 0 - - 0 - - 0 - - 0 -
Retail -Other Retail -Of Which:SME 0 0 0 0 0 0 0 0 0 0 0 0 0 0 0 0 0 0 - 0 - - 0 - - 0 - - 0 - - 0 - - 0 -
Retail -Other Retail -Of Which:non-SME 0 0 0 0 0 0 0 0 0 0 0 0 0 0 0 0 0 0 - 0 - - 0 - - 0 - - 0 - - 0 - - 0 -
Equity 0 0 0 0 0 0 0 0 0 0 0 0 0 0 0 0 0 0 - 0 - - 0 - - 0 - - 0 - - 0 - - 0 -
Securitisation 0 0 0 0 0 0 0 0 0 0 0 0 0 0 0 0 0 0
Othernon-credit obligation assets 0 0 0 0 0 0 0 0 0 0 0 0 0 0 0 0 0 0
TOTAL 0 0 0 0 0 0 0 0 0 0 0 0 0 0 0 0 0 0 - 0 - - 0 - - 0 - - 0 - - 0 - - 0 -
Securitisation andre-securitisations positions deductedfrom capital * 0 0 0 0 0 0 0 0 0 0 0 0
(mln EUR, %)No n-d ef aul t ed De fau lt e d No n-d ef aul t ed De fau lt e d No n-d ef aul t ed De fau lt e d No n-d ef aul t e d De fau lt e d No n-d ef aul t ed De fau lt e d No n-d ef aul t e d De fau lt e d No n-d ef aul t ed De fau lt e d No n-d ef aul t ed De fau lt e d No n-d ef aul t ed De fau lt e d
Impairment
rate
Stockof
ProvisionsCoverage Ratio -
Default Stock
Impairment
rate
Stockof
Provisions
Coverage
Ratio-Default
Stock
Impairment
rate
Stockof
Provisions
Coverage
Ratio -Default
Stock
Impairment rateStockof
Provisions
Coverage
Ratio-Default
Stock
Impairment
rate
Stockof
Provisions
Coverage
Ratio-Default
Stock
Impairment
rate
Stockof
Provisions
Coverage
Ratio -Default
Stock Central banksandcentral governments 0 0 0 0 0 0 0 0 0 0 0 0 0 0 0 0 0 0 - 0 - - 0 - - 0 - - 0 - - 0 - - 0 -
Institutions 0 0 0 0 0 0 0 0 0 0 0 0 0 0 0 0 0 0 - 0 - - 0 - - 0 - - 0 - - 0 - - 0 -
Corporates 0 0 0 0 0 0 0 0 0 0 0 0 0 0 0 0 0 0 - 0 - - 0 - - 0 - - 0 - - 0 - - 0 -
Corporates -Of Which:SpecialisedLending 0 0 0 0 0 0 0 0 0 0 0 0 0 0 0 0 0 0 - 0 - - 0 - - 0 - - 0 - - 0 - - 0 -
Corporates -Of Which:SME 0 0 0 0 0 0 0 0 0 0 0 0 0 0 0 0 0 0 - 0 - - 0 - - 0 - - 0 - - 0 - - 0 -
Retail 0 0 0 0 0 0 0 0 0 0 0 0 0 0 0 0 0 0 - 0 - - 0 - - 0 - - 0 - - 0 - - 0 -
Retail -Securedon real estateproperty 0.0% 0 0 0 0 0 0 0 0 0 0 0 0 0 0 0 0 0 0 - 0 - - 0 - - 0 - - 0 - - 0 - - 0 -
Retail -Securedon real estate property- Of
h i h : S E0.0% 0 0 0 0 0 0 0 0 0 0 0 0 0 0 0 0 0 0 - 0 - - 0 - - 0 - - 0 - - 0 - - 0 -
Retail -Securedon real estate property- Of
h i h: n n - E0.0% 0 0 0 0 0 0 0 0 0 0 0 0 0 0 0 0 0 0 - 0 - - 0 - - 0 - - 0 - - 0 - - 0 -
Retail -QualifyingRevolving 0 0 0 0 0 0 0 0 0 0 0 0 0 0 0 0 0 0 - 0 - - 0 - - 0 - - 0 - - 0 - - 0 -
Retail -OtherRetail 0 0 0 0 0 0 0 0 0 0 0 0 0 0 0 0 0 0 - 0 - - 0 - - 0 - - 0 - - 0 - - 0 -
Retail -Other Retail -Of Which:SME 0 0 0 0 0 0 0 0 0 0 0 0 0 0 0 0 0 0 - 0 - - 0 - - 0 - - 0 - - 0 - - 0 -
Retail -Other Retail -Of Which:non-SME 0 0 0 0 0 0 0 0 0 0 0 0 0 0 0 0 0 0 - 0 - - 0 - - 0 - - 0 - - 0 - - 0 -
Equity 0 0 0 0 0 0 0 0 0 0 0 0 0 0 0 0 0 0 - 0 - - 0 - - 0 - - 0 - - 0 - - 0 -
Securitisation 0 0 0 0 0 0 0 0 0 0 0 0 0 0 0 0 0 0
Othernon-credit obligation assets 0 0 0 0 0 0 0 0 0 0 0 0 0 0 0 0 0 0
TOTAL 0 0 0 0 0 0 0 0 0 0 0 0 0 0 0 0 0 0 - 0 - - 0 - - 0 - - 0 - - 0 - - 0 -Securitisation andre-securitisations positions deductedfrom capital * 0 0 0 0 0 0 0 0 0 0 0 0
(mln EUR, %)No n-d ef aul t ed De fau lt e d No n-d ef aul t ed De fau lt e d No n-d ef aul t ed De fau lt e d No n-d ef aul t e d De fau lt e d No n-d ef aul t ed De fau lt e d No n-d ef aul t e d De fau lt e d No n-d ef aul t ed De fau lt e d No n-d ef aul t ed De fau lt e d No n-d ef aul t ed De fau lt e d
Impairment
rate
Stockof
ProvisionsCoverage Ratio -
Default Stock
Impairment
rate
Stockof
Provisions
Coverage
Ratio-DefaultStock
Impairment
rate
Stockof
Provisions
Coverage
Ratio -DefaultStock
Impairment rateStockof
Provisions
Coverage
Ratio-DefaultStock
Impairment
rate
Stockof
Provisions
Coverage
Ratio-DefaultStock
Impairment
rate
Stockof
Provisions
Coverage
Ratio -DefaultStock
Central banksandcentral governments 0 0 0 0 0 0 0 0 0 0 0 0 0 0 0 0 0 0 - 0 - - 0 - - 0 - - 0 - - 0 - - 0 -
Institutions 0 0 0 0 0 0 0 0 0 0 0 0 0 0 0 0 0 0 - 0 - - 0 - - 0 - - 0 - - 0 - - 0 -
Corporates 0 0 0 0 0 0 0 0 0 0 0 0 0 0 0 0 0 0 - 0 - - 0 - - 0 - - 0 - - 0 - - 0 -
Corporates -Of Which:SpecialisedLending 0 0 0 0 0 0 0 0 0 0 0 0 0 0 0 0 0 0 - 0 - - 0 - - 0 - - 0 - - 0 - - 0 -
Corporates -Of Which:SME 0 0 0 0 0 0 0 0 0 0 0 0 0 0 0 0 0 0 - 0 - - 0 - - 0 - - 0 - - 0 - - 0 -
Retail 0 0 0 0 0 0 0 0 0 0 0 0 0 0 0 0 0 0 - 0 - - 0 - - 0 - - 0 - - 0 - - 0 -
Retail -Securedon real estateproperty 0.0% 0 0 0 0 0 0 0 0 0 0 0 0 0 0 0 0 0 0 - 0 - - 0 - - 0 - - 0 - - 0 - - 0 -
Retail -Securedon real estate property- Of
hi h: E0.0% 0 0 0 0 0 0 0 0 0 0 0 0 0 0 0 0 0 0 - 0 - - 0 - - 0 - - 0 - - 0 - - 0 -
Retail -Securedon real estate property- Of
h i h : n n -S E0.0% 0 0 0 0 0 0 0 0 0 0 0 0 0 0 0 0 0 0 - 0 - - 0 - - 0 - - 0 - - 0 - - 0 -
Retail -QualifyingRevolving 0 0 0 0 0 0 0 0 0 0 0 0 0 0 0 0 0 0 - 0 - - 0 - - 0 - - 0 - - 0 - - 0 -
Retail -OtherRetail 0 0 0 0 0 0 0 0 0 0 0 0 0 0 0 0 0 0 - 0 - - 0 - - 0 - - 0 - - 0 - - 0 -
Retail -Other Retail -Of Which:SME 0 0 0 0 0 0 0 0 0 0 0 0 0 0 0 0 0 0 - 0 - - 0 - - 0 - - 0 - - 0 - - 0 -
Retail -Other Retail -Of Which:non-SME 0 0 0 0 0 0 0 0 0 0 0 0 0 0 0 0 0 0 - 0 - - 0 - - 0 - - 0 - - 0 - - 0 -
Equity 0 0 0 0 0 0 0 0 0 0 0 0 0 0 0 0 0 0 - 0 - - 0 - - 0 - - 0 - - 0 - - 0 -
Securitisation 0 0 0 0 0 0 0 0 0 0 0 0 0 0 0 0 0 0
Othernon-credit obligation assets 0 0 0 0 0 0 0 0 0 0 0 0 0 0 0 0 0 0
TOTAL 0 0 0 0 0 0 0 0 0 0 0 0 0 0 0 0 0 0 - 0 - - 0 - - 0 - - 0 - - 0 - - 0 -Securitisation andre-securitisations positions deductedfrom capital * 0 0 0 0 0 0 0 0 0 0 0 0
LTV %(asof
31/12/2013)
Exposure values (as of 31/12/2013) Risk exposure amounts (as of 31/12/2013) Value adjustments and provisions (as of 31/12/2013) Baseline Scenario Adverse Scenario
F-IRB A-IRB STA F-IRB A-IRB STA as of 31/12/2016 as of 31/12/2014 as of 31/12/2015 as of 31/12/2016F-IRB A-IRB STA a s of 3 1/ 12 /2 01 4 a s of 3 1/ 12 /2 01 5
LTV %(asof
31/12/2013)
Exposure values (as of 31/12/2013) Risk exposure amounts (as of 31/12/2013) Value adjustments and provisions (as of 31/12/2013) Baseline Scenario Adverse Scenario
F-IRB A-IRB STA F-IRB A-IRB STA F-IRB a sof 31 /12 /2 01 4 a so f3 1/ 12 /2 01 5 a sof 31 /12 /2 01 6 A-IRB STA a sof 31 /1 2/ 20 14 a so f3 1/ 12 /2 01 5 a sof 31 /12 /2 01 6
LTV %(asof
31/12/2013)
Exposure values (as of 31/12/2013) Risk exposure amounts (as of 31/12/2013) Value adjustments and provisions (as of 31/12/2013) Baseline Scenario Adverse Scenario
F-IRB A-IRB STA F-IRB A-IRB STA F-IRB A-IRB a s of 3 1/ 12 /2 01 5 a s of 3 1/ 12 /2 01 6STA as of 31/12/2014 as of 31/12/2015 as of 31/12/2016 as of 31/12/2014
(*)Referstothepart ofSecuritizationexposurethat isdeductedfrom capital andisnot includedinRWA
(*)Referstothepart ofSecuritizationexposurethat isdeductedfrom capital andisnot includedinRWA
(*)Referstothepart ofSecuritizationexposurethat isdeductedfrom capital andisnot includedinRWA
(*)Referstothepart ofSecuritizationexposurethat isdeductedfrom capital andisnot includedinRWA
0
0
0
http://www.economiaciudadana.org/

8/10/2019 Test Stress Banca Española 2014
http://slidepdf.com/reader/full/test-stress-banca-espanola-2014 133/240
2014 EU-wide Stress Test
RWA
(mln EUR)as of 31/12/2013 as of 31/12/2014 as of 31/12/2015 as of 31/12/2016 as of 31/12/2014 as of 31/12/2015 as of 31/12/2016
Risk exposure amount for credit risk 16,222 16,097 16,470 17,240 16,035 16,444 17,250
Risk exposure amount Securitisation and re-securitisations 148 173 180 186 186 202 212
Risk exposure amount Other credit risk 16,074 15,924 16,289 17,054 15,849 16,242 17,038
Risk exposure amount for market risk 1 1 1 1 1 1 1
Risk exposure amount for operational risk 1,857 1,546 1,463 1,470 1,451 1,268 1,196
Transitional floors for Risk exposure amount 0 0 0 0 0 0 0
AQR adj stments (fo SSM co nt ies onl ) 63 63 63 63 63 63 63
Baseline Scenario Adverse Scenario

8/10/2019 Test Stress Banca Española 2014
http://slidepdf.com/reader/full/test-stress-banca-espanola-2014 134/240
AQR adjustments (for SSM countries only) 63 63 63 63 63 63 63
Total Risk exposure amount 18,143 17,706 17,997 18,773 17,550 17,776 18,511
http://www.economiaciudadana.org/
(mln EUR) as of 31/12/2013 31/12/2014 31/12/2015 31/12/2016 31/12/2014 31/12/2015 31/12/2016
Banking Book 49
Trading Book (excl. correlation trading positions under CRM) 0
Correlation Trading Portfolio (CRM) 0
Total 49
Banking Book 148 173 180 186 186 202 212
Trading Book (excl. correlation trading positions under CRM) 0 0 0 0 0 0 0
Total 148 173 180 186 186 202 212
Hold to Maturity porfolio 49 51 53 54 52 55 58
Available for Sale porfolio 0 0 0 0 0 0 0
Held for trading portfolio
Total 49 51 53 54 52 55 58
2014 EU-wide Stress Test
Impairments
Baseline scenario Adverse scenario
Exposure values
Risk exposure values
Securitisation

8/10/2019 Test Stress Banca Española 2014
http://slidepdf.com/reader/full/test-stress-banca-espanola-2014 135/240
http://www.economiaciudadana.org/
2014 EU-wide Stress Test - Sovereign Exposure
(mln EUR)
Residual Maturity Country / Region
GROSS DIRECT LONG
EXPOSURES(accounting value gross
of provisions)
(1)
NET DIRECT POSITIONS (gross exposures (long) net of cash short
positions of sovereign debt to other counterpaties only where there
is a maturity matching)
(1)
DIRECT SOVEREIGN EXPOSURES IN DERIVATIVES (1)
of which: loans
and advances
of which: AFS
banking book
of which: FVO
(designated at fair
value through
profit&loss)
banking book
of which: Financial
assets held for
trading
(2)
Derivatives with positive fair value at
31/12/2013
Derivatives with negative fair value at
31/12/2013
Derivatives with positive fair value
at 31/12/2013
Derivatives with negative fair
value at 31/12/2013
VALUES AS OF 31/12/2013 VALUES AS OF 31/12/2013 VALUES AS OF 31/12/2013
INDIRECT SOVEREIGN EXPOSURES (3) (on and off balance sheet)
Fair-value at
31/12/2013 (+)Notional value
Fair-value at
31/12/2013 (-)Notional value
Fair-value at
31/12/2013 (+)Notional value
Fair-value at 31/12/2013
(-)Notional value

8/10/2019 Test Stress Banca Española 2014
http://slidepdf.com/reader/full/test-stress-banca-espanola-2014 136/240
[ 0 - 3M [ 0 0 0 0 0 0 0 0 0 0 0 0 0 0
[ 3M - 1Y [ 0 0 0 0 0 0 0 0 0 0 0 0 0 0
[ 1Y - 2Y [ 0 0 0 0 0 0 0 0 0 0 0 0 0 0
[ 2Y - 3Y [ 0 0 0 0 0 0 0 0 0 0 0 0 0 0
[3Y - 5Y [ 0 0 0 0 0 0 0 0 0 0 0 0 0 0
[5Y - 10Y [ 0 0 0 0 0 0 0 0 0 0 0 0 0 0
[10Y - more 0 0 0 0 0 0 0 0 0 0 0 0 0 0
Tot 0 0 0 0 0 0 0 0 0 0 0 0 0 0
[ 0 - 3M [ 0 0 0 0 0 0 0 0 0 0 0 0 0 0
[ 3M - 1Y [ 0 0 0 0 0 0 0 0 0 0 0 0 0 0
[ 1Y - 2Y [ 0 0 0 0 0 0 0 0 0 0 0 0 0 0
[ 2Y - 3Y [ 0 0 0 0 0 0 0 0 0 0 0 0 0 0
[3Y - 5Y [ 0 0 0 0 0 0 0 0 0 0 0 0 0 0
[5Y - 10Y [ 0 0 0 0 0 0 0 0 0 0 0 0 0 0
[10Y - more 0 0 0 0 0 0 0 0 0 0 0 0 0 0Tot 0 0 0 0 0 0 0 0 0 0 0 0 0 0
[ 0 - 3M [ 0 0 0 0 0 0 0 0 0 0 0 0 0 0
[ 3M - 1Y [ 0 0 0 0 0 0 0 0 0 0 0 0 0 0
[ 1Y - 2Y [ 0 0 0 0 0 0 0 0 0 0 0 0 0 0
[ 2Y - 3Y [ 0 0 0 0 0 0 0 0 0 0 0 0 0 0
[3Y - 5Y [ 0 0 0 0 0 0 0 0 0 0 0 0 0 0
[5Y - 10Y [ 0 0 0 0 0 0 0 0 0 0 0 0 0 0
[10Y - more 0 0 0 0 0 0 0 0 0 0 0 0 0 0
Tot 0 0 0 0 0 0 0 0 0 0 0 0 0 0
[ 0 - 3M [ 0 0 0 0 0 0 0 0 0 0 0 0 0 0
[ 3M - 1Y [ 0 0 0 0 0 0 0 0 0 0 0 0 0 0
[ 1Y - 2Y [ 0 0 0 0 0 0 0 0 0 0 0 0 0 0
[ 2Y - 3Y [ 0 0 0 0 0 0 0 0 0 0 0 0 0 0
[3Y - 5Y [ 0 0 0 0 0 0 0 0 0 0 0 0 0 0
[5Y - 10Y [ 0 0 0 0 0 0 0 0 0 0 0 0 0 0
[10Y - more 0 0 0 0 0 0 0 0 0 0 0 0 0 0
Tot 0 0 0 0 0 0 0 0 0 0 0 0 0 0
Austria
Belgium
Bulgaria
Cyprus
Czech Republic
Denmark
Estonia
Finland
France
http://www.economiaciudadana.org/

8/10/2019 Test Stress Banca Española 2014
http://slidepdf.com/reader/full/test-stress-banca-espanola-2014 137/240
2014 EU-wide Stress Test - Sovereign Exposure
(mln EUR)
Residual Maturity Country / Region
GROSS DIRECT LONG
EXPOSURES(accounting value gross
of provisions)
(1)
NET DIRECT POSITIONS (gross exposures (long) net of cash short
positions of sovereign debt to other counterpaties only where there
is a maturity matching)
(1)
DIRECT SOVEREIGN EXPOSURES IN DERIVATIVES (1)
of which: loans
and advances
of which: AFS
banking book
of which: FVO
(designated at fair
value through
profit&loss)
banking book
of which: Financial
assets held for
trading
(2)
Derivatives with positive fair value at
31/12/2013
Derivatives with negative fair value at
31/12/2013
Derivatives with positive fair value
at 31/12/2013
Derivatives with negative fair
value at 31/12/2013
VALUES AS OF 31/12/2013 VALUES AS OF 31/12/2013 VALUES AS OF 31/12/2013
INDIRECT SOVEREIGN EXPOSURES (3) (on and off balance sheet)
Fair-value at
31/12/2013 (+)Notional value
Fair-value at
31/12/2013 (-)Notional value
Fair-value at
31/12/2013 (+)Notional value
Fair-value at 31/12/2013
(-)Notional value

8/10/2019 Test Stress Banca Española 2014
http://slidepdf.com/reader/full/test-stress-banca-espanola-2014 138/240
[ 0 - 3M [ 0 0 0 0 0 0 0 0 0 0 0 0 0 0
[ 3M - 1Y [ 0 0 0 0 0 0 0 0 0 0 0 0 0 0
[ 1Y - 2Y [ 0 0 0 0 0 0 0 0 0 0 0 0 0 0
[ 2Y - 3Y [ 0 0 0 0 0 0 0 0 0 0 0 0 0 0
[3Y - 5Y [ 0 0 0 0 0 0 0 0 0 0 0 0 0 0
[5Y - 10Y [ 0 0 0 0 0 0 0 0 0 0 0 0 0 0
[10Y - more 0 0 0 0 0 0 0 0 0 0 0 0 0 0
Tot 0 0 0 0 0 0 0 0 0 0 0 0 0 0
[ 0 - 3M [ 0 0 0 0 0 0 0 0 0 0 0 0 0 0
[ 3M - 1Y [ 0 0 0 0 0 0 0 0 0 0 0 0 0 0
[ 1Y - 2Y [ 0 0 0 0 0 0 0 0 0 0 0 0 0 0
[ 2Y - 3Y [ 0 0 0 0 0 0 0 0 0 0 0 0 0 0
[3Y - 5Y [ 0 0 0 0 0 0 0 0 0 0 0 0 0 0
[5Y - 10Y [ 0 0 0 0 0 0 0 0 0 0 0 0 0 0
[10Y - more 0 0 0 0 0 0 0 0 0 0 0 0 0 0Tot 0 0 0 0 0 0 0 0 0 0 0 0 0 0
[ 0 - 3M [ 0 0 0 0 0 0 0 0 0 0 0 0 0 0
[ 3M - 1Y [ 0 0 0 0 0 0 0 0 0 0 0 0 0 0
[ 1Y - 2Y [ 0 0 0 0 0 0 0 0 0 0 0 0 0 0
[ 2Y - 3Y [ 0 0 0 0 0 0 0 0 0 0 0 0 0 0
[3Y - 5Y [ 0 0 0 0 0 0 0 0 0 0 0 0 0 0
[5Y - 10Y [ 0 0 0 0 0 0 0 0 0 0 0 0 0 0
[10Y - more 0 0 0 0 0 0 0 0 0 0 0 0 0 0
Tot 0 0 0 0 0 0 0 0 0 0 0 0 0 0
[ 0 - 3M [ 0 0 0 0 0 0 0 0 0 0 0 0 0 0
[ 3M - 1Y [ 0 0 0 0 0 0 0 0 0 0 0 0 0 0
[ 1Y - 2Y [ 0 0 0 0 0 0 0 0 0 0 0 0 0 0
[ 2Y - 3Y [ 0 0 0 0 0 0 0 0 0 0 0 0 0 0
[3Y - 5Y [ 0 0 0 0 0 0 0 0 0 0 0 0 0 0
[5Y - 10Y [ 0 0 0 0 0 0 0 0 0 0 0 0 0 0
[10Y - more 0 0 0 0 0 0 0 0 0 0 0 0 0 0
Tot 0 0 0 0 0 0 0 0 0 0 0 0 0 0
[ 0 - 3M [ 0 0 0 0 0 0 0 0 0 0 0 0 0 0
[ 3M - 1Y [ 0 0 0 0 0 0 0 0 0 0 0 0 0 0
[ 1Y - 2Y [ 0 0 0 0 0 0 0 0 0 0 0 0 0 0
[ 2Y - 3Y [ 0 0 0 0 0 0 0 0 0 0 0 0 0 0
[3Y - 5Y [ 0 0 0 0 0 0 0 0 0 0 0 0 0 0
[5Y - 10Y [ 0 0 0 0 0 0 0 0 0 0 0 0 0 0
[10Y - more 0 0 0 0 0 0 0 0 0 0 0 0 0 0
Tot 0 0 0 0 0 0 0 0 0 0 0 0 0 0
[ 0 - 3M [ 0 0 0 0 0 0 0 0 0 0 0 0 0 0
[ 3M - 1Y [ 0 0 0 0 0 0 0 0 0 0 0 0 0 0
[ 1Y - 2Y [ 0 0 0 0 0 0 0 0 0 0 0 0 0 0
[ 2Y - 3Y [ 0 0 0 0 0 0 0 0 0 0 0 0 0 0
[3Y - 5Y [ 0 0 0 0 0 0 0 0 0 0 0 0 0 0
[5Y - 10Y [ 0 0 0 0 0 0 0 0 0 0 0 0 0 0
[10Y - more 0 0 0 0 0 0 0 0 0 0 0 0 0 0
Tot 0 0 0 0 0 0 0 0 0 0 0 0 0 0
[ 0 - 3M [ 0 0 0 0 0 0 0 0 0 0 0 0 0 0
[ 3M - 1Y [ 0 0 0 0 0 0 0 0 0 0 0 0 0 0
[ 1Y - 2Y [ 0 0 0 0 0 0 0 0 0 0 0 0 0 0
[ 2Y - 3Y [ 0 0 0 0 0 0 0 0 0 0 0 0 0 0
[3Y - 5Y [ 0 0 0 0 0 0 0 0 0 0 0 0 0 0
[5Y - 10Y [ 0 0 0 0 0 0 0 0 0 0 0 0 0 0
[10Y - more 0 0 0 0 0 0 0 0 0 0 0 0 0 0
Tot 0 0 0 0 0 0 0 0 0 0 0 0 0 0
Lithuania
Luxembourg
Malta
Netherlands
Norway
Poland
Portugal
Romania
Slovakia
http://www.economiaciudadana.org/
2014 EU-wide Stress Test - Sovereign Exposure
(mln EUR)
Residual Maturity Country / Region
GROSS DIRECT LONG
EXPOSURES(accounting value gross
of provisions)
(1)
NET DIRECT POSITIONS (gross exposures (long) net of cash short
positions of sovereign debt to other counterpaties only where there
is a maturity matching)
(1)
DIRECT SOVEREIGN EXPOSURES IN DERIVATIVES (1)
of which: loans
and advances
of which: AFS
banking book
of which: FVO
(designated at fair
value through
profit&loss)
banking book
of which: Financial
assets held for
trading
(2)
Derivatives with positive fair value at
31/12/2013
Derivatives with negative fair value at
31/12/2013
Derivatives with positive fair value
at 31/12/2013
Derivatives with negative fair
value at 31/12/2013
VALUES AS OF 31/12/2013 VALUES AS OF 31/12/2013 VALUES AS OF 31/12/2013
INDIRECT SOVEREIGN EXPOSURES (3) (on and off balance sheet)
Fair-value at
31/12/2013 (+)Notional value
Fair-value at
31/12/2013 (-)Notional value
Fair-value at
31/12/2013 (+)Notional value
Fair-value at 31/12/2013
(-)Notional value
[ 0 3M [ 0 0 0 0 0 0 0 0 0 0 0 0 0 0

8/10/2019 Test Stress Banca Española 2014
http://slidepdf.com/reader/full/test-stress-banca-espanola-2014 139/240
[ 0 - 3M [ 0 0 0 0 0 0 0 0 0 0 0 0 0 0
[ 3M - 1Y [ 0 0 0 0 0 0 0 0 0 0 0 0 0 0
[ 1Y - 2Y [ 0 0 0 0 0 0 0 0 0 0 0 0 0 0
[ 2Y - 3Y [ 0 0 0 0 0 0 0 0 0 0 0 0 0 0
[3Y - 5Y [ 0 0 0 0 0 0 0 0 0 0 0 0 0 0
[5Y - 10Y [ 0 0 0 0 0 0 0 0 0 0 0 0 0 0
[10Y - more 0 0 0 0 0 0 0 0 0 0 0 0 0 0
Tot 0 0 0 0 0 0 0 0 0 0 0 0 0 0
[ 0 - 3M [ 1,626 111 1,626 0 0 0 0 0 0 0 0 0 0 0
[ 3M - 1Y [ 916 196 916 91 0 0 0 0 0 0 0 0 0 0
[ 1Y - 2Y [ 3,253 127 3,253 1,260 0 0 0 0 0 0 0 0 0 0
[ 2Y - 3Y [ 1,398 100 1,398 319 0 0 0 0 0 0 0 0 0 0
[3Y - 5Y [ 2,762 234 2,762 51 0 3 0 0 0 0 0 0 0 0
[5Y - 10Y [ 2,175 311 2,175 0 0 16 0 0 0 0 0 0 0 0
[10Y - more 491 264 491 0 0 0 0 0 0 0 0 0 0 0
Tot 12,622 1,344 12,622 1,720 0 19 0 0 0 0 0 0 0 0
[ 0 - 3M [ 0 0 0 0 0 0 0 0 0 0 0 0 0 0
[ 3M - 1Y [ 0 0 0 0 0 0 0 0 0 0 0 0 0 0
[ 1Y - 2Y [ 0 0 0 0 0 0 0 0 0 0 0 0 0 0
[ 2Y - 3Y [ 0 0 0 0 0 0 0 0 0 0 0 0 0 0
[3Y - 5Y [ 0 0 0 0 0 0 0 0 0 0 0 0 0 0
[5Y - 10Y [ 0 0 0 0 0 0 0 0 0 0 0 0 0 0
[10Y - more 0 0 0 0 0 0 0 0 0 0 0 0 0 0
Tot 0 0 0 0 0 0 0 0 0 0 0 0 0 0
[ 0 - 3M [ 0 0 0 0 0 0 0 0 0 0 0 0 0 0
[ 3M - 1Y [ 0 0 0 0 0 0 0 0 0 0 0 0 0 0
[ 1Y - 2Y [ 0 0 0 0 0 0 0 0 0 0 0 0 0 0
[ 2Y - 3Y [ 0 0 0 0 0 0 0 0 0 0 0 0 0 0
[3Y - 5Y [ 0 0 0 0 0 0 0 0 0 0 0 0 0 0
[5Y - 10Y [ 0 0 0 0 0 0 0 0 0 0 0 0 0 0
[10Y - more 0 0 0 0 0 0 0 0 0 0 0 0 0 0Tot 0 0 0 0 0 0 0 0 0 0 0 0 0 0
[ 0 - 3M [ 0 0 0 0 0 0 0 0 0 0 0 0 0 0
[ 3M - 1Y [ 0 0 0 0 0 0 0 0 0 0 0 0 0 0
[ 1Y - 2Y [ 0 0 0 0 0 0 0 0 0 0 0 0 0 0
[ 2Y - 3Y [ 0 0 0 0 0 0 0 0 0 0 0 0 0 0
[3Y - 5Y [ 0 0 0 0 0 0 0 0 0 0 0 0 0 0
[5Y - 10Y [ 0 0 0 0 0 0 0 0 0 0 0 0 0 0
[10Y - more 0 0 0 0 0 0 0 0 0 0 0 0 0 0
Tot 0 0 0 0 0 0 0 0 0 0 0 0 0 0
[ 0 - 3M [ 0 0 0 0 0 0 0 0 0 0 0 0 0 0
[ 3M - 1Y [ 0 0 0 0 0 0 0 0 0 0 0 0 0 0
[ 1Y - 2Y [ 0 0 0 0 0 0 0 0 0 0 0 0 0 0
[ 2Y - 3Y [ 0 0 0 0 0 0 0 0 0 0 0 0 0 0
[3Y - 5Y [ 0 0 0 0 0 0 0 0 0 0 0 0 0 0
[5Y - 10Y [ 0 0 0 0 0 0 0 0 0 0 0 0 0 0
[10Y - more 0 0 0 0 0 0 0 0 0 0 0 0 0 0
Tot 0 0 0 0 0 0 0 0 0 0 0 0 0 0
[ 0 - 3M [ 0 0 0 0 0 0 0 0 0 0 0 0 0 0
[ 3M - 1Y [ 0 0 0 0 0 0 0 0 0 0 0 0 0 0
[ 1Y - 2Y [ 0 0 0 0 0 0 0 0 0 0 0 0 0 0
[ 2Y - 3Y [ 0 0 0 0 0 0 0 0 0 0 0 0 0 0
[3Y - 5Y [ 0 0 0 0 0 0 0 0 0 0 0 0 0 0
[5Y - 10Y [ 0 0 0 0 0 0 0 0 0 0 0 0 0 0
[10Y - more 0 0 0 0 0 0 0 0 0 0 0 0 0 0
Tot 0 0 0 0 0 0 0 0 0 0 0 0 0 0
[ 0 - 3M [ 0 0 0 0 0 0 0 0 0 0 0 0 0 0
[ 3M - 1Y [ 0 0 0 0 0 0 0 0 0 0 0 0 0 0
[ 1Y - 2Y [ 0 0 0 0 0 0 0 0 0 0 0 0 0 0
[ 2Y - 3Y [ 0 0 0 0 0 0 0 0 0 0 0 0 0 0
[3Y - 5Y [ 0 0 0 0 0 0 0 0 0 0 0 0 0 0
[5Y - 10Y [ 0 0 0 0 0 0 0 0 0 0 0 0 0 0
[10Y - more 0 0 0 0 0 0 0 0 0 0 0 0 0 0Tot 0 0 0 0 0 0 0 0 0 0 0 0 0 0
[ 0 - 3M [ 0 0 0 0 0 0 0 0 0 0 0 0 0 0
[ 3M - 1Y [ 0 0 0 0 0 0 0 0 0 0 0 0 0 0
[ 1Y - 2Y [ 0 0 0 0 0 0 0 0 0 0 0 0 0 0
[ 2Y - 3Y [ 0 0 0 0 0 0 0 0 0 0 0 0 0 0
[3Y - 5Y [ 0 0 0 0 0 0 0 0 0 0 0 0 0 0
[5Y - 10Y [ 0 0 0 0 0 0 0 0 0 0 0 0 0 0
[10Y - more 0 0 0 0 0 0 0 0 0 0 0 0 0 0
Tot 0 0 0 0 0 0 0 0 0 0 0 0 0 0
Spain
Slovenia
Sweden
United Kingdom
Australia
Canada
Hong Kong
Japan
U.S.
http://www.economiaciudadana.org/
2014 EU-wide Stress Test - Sovereign Exposure
(mln EUR)
Residual Maturity Country / Region
GROSS DIRECT LONG
EXPOSURES(accounting value gross
of provisions)
(1)
NET DIRECT POSITIONS (gross exposures (long) net of cash short
positions of sovereign debt to other counterpaties only where there
is a maturity matching)
(1)
DIRECT SOVEREIGN EXPOSURES IN DERIVATIVES (1)
of which: loans
and advances
of which: AFS
banking book
of which: FVO
(designated at fair
value through
profit&loss)
banking book
of which: Financial
assets held for
trading
(2)
Derivatives with positive fair value at
31/12/2013
Derivatives with negative fair value at
31/12/2013
Derivatives with positive fair value
at 31/12/2013
Derivatives with negative fair
value at 31/12/2013
VALUES AS OF 31/12/2013 VALUES AS OF 31/12/2013 VALUES AS OF 31/12/2013
INDIRECT SOVEREIGN EXPOSURES (3) (on and off balance sheet)
Fair-value at
31/12/2013 (+)Notional value
Fair-value at
31/12/2013 (-)Notional value
Fair-value at
31/12/2013 (+)Notional value
Fair-value at 31/12/2013
(-)Notional value
[ 0 - 3M [ 0 0 0 0 0 0 0 0 0 0 0 0 0 0

8/10/2019 Test Stress Banca Española 2014
http://slidepdf.com/reader/full/test-stress-banca-espanola-2014 140/240
[ 0 3M [ 0 0 0 0 0 0
[ 3M - 1Y [ 0 0 0 0 0 0 0 0 0 0 0 0 0 0
[ 1Y - 2Y [ 0 0 0 0 0 0 0 0 0 0 0 0 0 0
[ 2Y - 3Y [ 0 0 0 0 0 0 0 0 0 0 0 0 0 0
[3Y - 5Y [ 0 0 0 0 0 0 0 0 0 0 0 0 0 0
[5Y - 10Y [ 0 0 0 0 0 0 0 0 0 0 0 0 0 0
[10Y - more 0 0 0 0 0 0 0 0 0 0 0 0 0 0
Tot 0 0 0 0 0 0 0 0 0 0 0 0 0 0
[ 0 - 3M [ 0 0 0 0 0 0 0 0 0 0 0 0 0 0
[ 3M - 1Y [ 0 0 0 0 0 0 0 0 0 0 0 0 0 0
[ 1Y - 2Y [ 0 0 0 0 0 0 0 0 0 0 0 0 0 0
[ 2Y - 3Y [ 0 0 0 0 0 0 0 0 0 0 0 0 0 0
[3Y - 5Y [ 0 0 0 0 0 0 0 0 0 0 0 0 0 0
[5Y - 10Y [ 0 0 0 0 0 0 0 0 0 0 0 0 0 0
[10Y - more 0 0 0 0 0 0 0 0 0 0 0 0 0 0Tot 0 0 0 0 0 0 0 0 0 0 0 0 0 0
[ 0 - 3M [ 0 0 0 0 0 0 0 0 0 0 0 0 0 0
[ 3M - 1Y [ 0 0 0 0 0 0 0 0 0 0 0 0 0 0
[ 1Y - 2Y [ 0 0 0 0 0 0 0 0 0 0 0 0 0 0
[ 2Y - 3Y [ 0 0 0 0 0 0 0 0 0 0 0 0 0 0
[3Y - 5Y [ 0 0 0 0 0 0 0 0 0 0 0 0 0 0
[5Y - 10Y [ 0 0 0 0 0 0 0 0 0 0 0 0 0 0
[10Y - more 0 0 0 0 0 0 0 0 0 0 0 0 0 0
Tot 0 0 0 0 0 0 0 0 0 0 0 0 0 0
[ 0 - 3M [ 0 0 0 0 0 0 0 0 0 0 0 0 0 0
[ 3M - 1Y [ 0 0 0 0 0 0 0 0 0 0 0 0 0 0
[ 1Y - 2Y [ 0 0 0 0 0 0 0 0 0 0 0 0 0 0
[ 2Y - 3Y [ 0 0 0 0 0 0 0 0 0 0 0 0 0 0
[3Y - 5Y [ 0 0 0 0 0 0 0 0 0 0 0 0 0 0
[5Y - 10Y [ 0 0 0 0 0 0 0 0 0 0 0 0 0 0
[10Y - more 0 0 0 0 0 0 0 0 0 0 0 0 0 0Tot 0 0 0 0 0 0 0 0 0 0 0 0 0 0
Notes and definitions
(1) The exposures reported cover only exposures to central, regional and local governments on immediate borrower basis, and do not include exposures to other counterparts with full or partial government guarantees
(2) The banks disclose the exposures in the "Financial assets held for trading" portfolio after offsetting the cash short positions having the same maturities.
(3) The exposures reported include the positions towards counterparts (other than sovereign) on sovereign credit risk (i.e. CDS, financial guarantees) booked in all the accounting portfolio (on-off balance sheet).'Irrespective of the denomination and or accounting classification of the positions the economic substance over the form must be used as a criteria for the identification of the exposures to be included in this column. This item does not include exposures to counterparts (other than sovereign) with full or partial government guarantees by central, regional and local governments
Latin America and the
Caribbean
Africa
Others
Middle East
China
Switzerland
Other advanced economies
non EEA
Other Central and eastern
Europe countries non EEA
http://www.economiaciudadana.org/
2014 EU-wide Stress TestCapital
(mln EUR) CRR/ CRDIV DEFINITION OFCAPITAL Asof31/12/2013 Asof31/12/2014 Asof31/12/2015 Asof31/12/2016 Asof31/12/2014 Asof31/12/2015 Asof31/12/2016 COREP CODE REGULATION
A OWN FUNDS 1,594 1,715 1,764 2,031 1,308 1,228 1,275 C A 1 {1 } A rt ic le s 4 (1 18 ) a nd 7 2 of C RR
A.1COMMON EQUITYTIER 1CAPITAL(net ofdeductionsandafter applying
transitional adjustments)1,419 1,527 1,532 1,762 1,155 1,037 1,040 C A 1 {1 .1 .1 } A rt ic le 5 0 of C RR
A.1.1Capitalinstrumentseligible asCET1Capital(including share premium and net own
capitalinstruments)2,523 2,523 2,399 2,399 2,523 2,523 2,523 CA1 {1.1.1.1}
Articles 26(1) points (a) and(b), 27to29, 36(1) point (f)
and42ofCRR
A.1.1.1 Ofwhich: CET1instrumentssubscribed byGovernment 124 124 0 0 124 124 124 - -
A.1.2 Retained earnings -1,048 -944 -735 -434 -1,285 -1,289 -1,184 CA1 {1.1.1.2} Articles 26(1) point (c), 26(2) and36 (1) points (a) and(l)
ofCRR
A.1.3 Accumulated other comprehensive income -46 -61 -69 -75 -88 -97 -113 CA1 {1.1.1.3} Articles 4(100), 26(1) point (d) and 36 (1) point (l) of CRR
A.1.3.1 Ofwhich: arising from unrealised gains/lossesfrom Sovereign exposure in AFS
portfolio0 0 0 0 -10 0 -3 - -
A.1.3.2 Ofwhich: arising from unrealised gains/lossesfrom the rest ofAFS portfolio -52 -66 -75 -81 -84 -103 -116 - -
A.1.4 Other Reserves 0 0 0 0 0 0 0 CA1 {1.1.1.4} Articles 4(117) and 26(1) point (e) of CRR
A.1.5 Fundsfor generalbanking risk 0 0 0 0 0 0 0 CA1 {1.1.1.5} Articles 4(112), 26(1) point (f) and 36 (1) point (l) of CRR
A.1.6 Minorityinterest given recognition in CET1capital 93 93 93 93 93 93 93 CA1 {1.1.1.7} Article 84 of CRR
A.1.7 AdjustmentstoCET1 due toprudentialfiltersexcluding those from unrealised
gains/lossesfrom AFS portfolio0 0 0 0 0 0 0 CA1 {1.1.1.9} Articles 32 to 35 of and 36 (1) point (l) of CRR
A.1.8 AdjustmentstoCET1 due toprudentialfiltersfrom unrealised gains/lossesfrom
Sovereign Exposure in AFS portfolio0 0 0 0 8 0 1 -
A.1.9 (-)Intangible assets(including Goodwill) -127 -127 -127 -127 -127 -127 -127CA1{1.1.1.10+
1.1.1.11}
Articles 4(113), 36(1) point (b) and37of CRR. Articles
4(115), 36(1) point (b) and37point (a) of CCR
A.1.10(-)DTAs that relyon future profitabilityand donot arise from temporary
differencesnet ofassociated DTLs-457 -457 -457 -457 -457 -457 -457 CA1 {1.1.1.12} Articles 36(1) point (c) and 38 of CRR
A.1.11 (-)IRB shortfallofcredit riskadjustmentsto expected losses 0 0 0 0 0 0 0 CA1 {1.1.1.13} Articles 36(1) point (d), 40 and 159 of CRR
A 1 12 ( )Defined benefit pension fund assets -18 -18 -18 -18 -18 -18 -18 CA1 {1 1 1 14} Articles 4(109) 36(1) point (e) and 41 of CRR
Baseline Scenario Adverse Scenario

8/10/2019 Test Stress Banca Española 2014
http://slidepdf.com/reader/full/test-stress-banca-espanola-2014 141/240
A.1.12 (-)Defined benefit pension fund assets -18 -18 -18 -18 -18 -18 -18 CA1 {1.1.1.14} Articles 4(109), 36(1) point (e) and 41 of CRR
A.1.13 (-)Reciprocalcrossholdingsin CET1Capital 0 0 0 0 0 0 0 CA1 {1.1.1.15} Articles 4(122), 36(1) point (g) and 44 of CRR
A.1.14 (-)Excessdeduction from AT1itemsover AT1Capital 0 0 0 0 0 0 0 CA1 {1.1.1.16} Article 36(1) point (j) of CRR
A.1.15(-)Deductionsrelated toassets which can alternativelybe subject toa 1.250%risk
weight-18 -18 -18 -18 -18 -18 -18
CA1{1.1.1.17to
1.1.1.21}
Articles 4(36), 36(1) point (k) (i) and89to 91ofCRR;
Articles 36(1) point (k) (ii), 243(1) point (b), 244(1) point
(b) and258of CRR;Articles 36(1) point k) (iii) and379(3)
ofCRR;Art icles 36(1) point k) (iv) and153(8) ofCRRand
A.1.15.1 Ofwhich: from securitisation positions(-) -18 -18 -18 -18 -18 -18 -18 CA1 {1.1.1.18.1} Articles 36(1) point (k) (ii), 243(1) point (b), 244(1) point
(b) and258of CRR
A.1.16(-)Holdingsof CET1capitalinstrumentsof financialsector entitieswhere the
institiution does not have a significant investment-1 0 0 0 -8 -11 -2 CA1 {1.1.1.22}
Articles 4(27), 36(1) point (h);43to46, 49(2) and (3) and
79ofCRR
A.1.17(-)Deductible DTAsthat rely on future profitabilityand arise from temporary
differences0 0 0 0 0 0 0 CA1 {1.1.1.23}
Articles 36(1) point (c) and38;Articles 48(1) point (a) and
48(2) ofCRR
A.1.18(-)Holdingsof CET1capitalinstrumentsof financialsector entitieswhere the
institiution has a significant investment-111 -99 -79 -50 -133 -136 -127 CA1 {1.1.1.24}
Articles 4(27);36(1) point (i);43, 45;47; 48(1) point (b);
49(1) to(3) and79of CRR
A.1.19 (-)Amount exceding the 17.65%threshold -29 -22 -5 0 -52 -51 -42 CA1 {1.1.1.25} Article 470 of CRR
A.1.20 Transitionaladjustments 658 656 548 448 717 625 511CA1{1.1.1.6+ 1.1.8+
1.1.26}-
A.1.20.1 Transitionaladjustmentsdue tograndfathered CET1Capitalinstruments(+/-) 0 0 0 0 0 0 0 CA1 {1.1.1.6}
Articles 483(1) to(3), and484to487of CRR
A.1.20.2 Transitionaladjustmentsdue toadditionalminorityinterests(+/-) 0 0 0 0 0 0 0 CA1 {1.1.1.8}
Articles 479and480of CRR
A.1.20.3Other transitionaladjustmentsto CET1Capitalexcl. adjustmentsfor Sovereign
exposure in AFS (+/-)658 656 548 448 717 625 511 CA1 {1.1.1.26}
Articles 469to472, 478and 481ofCRR
A.2 ADDITIONAL TIER 1CAPITAL (net ofdeductionsand after transitional
adjustments)
175 188 232 270 154 191 235 C A 1 {1 .1 .2 } A rt ic le 6 1 of C RR
A.2.1 Ofwhich:(+) Other existing support government measures 0 0 0 0 0 0 0 - -
A.3 TIER1 CAPITAL(netofdeductionsandafter transitional adjustments) 1,594 1,715 1,764 2,031 1,308 1,228 1,275 C A1 { 1. 1} A rt ic le 2 5 of C RR
A.4 TIER2 CAPITAL(netofdeductionsandafter transitional adjustments) 0 0 0 0 0 0 0 C A1 { 1. 2} A rt ic le 7 1 of C RR
B T OT AL R IS K EX PO SU RE A M OU NT 18,143 17,706 17,997 18,773 17,550 17,776 18,511 C A 2 {1 } A rt ic le s 92 (3 ), 95 , 96 a n d 98 o f CR R
B.1ofwhich:stemming from exposuresthat fallbelow the 10%/ 15%limitsfor
CET1deduction (+)346 0 0 0 0 0 0
Articles 36(1) points (a) and(i);Article 38a ndArticle 48of
CRR
B. 2 ofwh ich :s temmi ng f r om fr om CVAcap ita l r eq ui r ements (+) 235 0 0 0 0 0 0 Article 381to386 ofCRR
B.3ofwhich:stemming from higher asset correlation parameter against exposures
tolarge financialinstitutionsunder IRB the IRB approachesto credit risk(+)0 0 0 0 0 0 0 Articles 153(2) ofCRR
B.4ofwhich:stemming from the application ofthe supporting factor to increase
lending toSMEs(-)-263 0 0 0 0 0 0 Recital (44) ofCRR
B.5
ofwhich:stemming from the effect of exposuresthat were previouslypart of
RiskExposure amount and receive a deduction treatment under CRR/CRDIV (-
)
0 0 0 0 0 0 0 -
B.6 ofwhich:otherssubject tothe discretion ofNationalCompetent Authorities 253 0 0 0 0 0 0 Article 124to164 ofCRR
C.1 Co mm onE q ui tyTi er 1Cap i tal r ati o 7.82% 8.62% 8.51% 9.38% 6.58% 5.83% 5.62% CA3 {1} -
C .2 T ie r 1 C ap it al ra ti o 8.79% 9.69% 9.80% 10.82% 7.46% 6.91% 6.89% CA3 {3} -
C .3 T ot al C ap it al r at io 8.79% 9.69% 9.80% 10.82% 7.46% 6.91% 6.89% CA3 {5} -
D Co mm onE q ui tyTi er 1Cap i tal Thresho ld 1,416 1,440 1,502 965 978 1,018
ETotalamount of instrumentswith mandatoryconversion intoordinarysharesupon
a fixed date in the 2014 -2016period (cumulative conversions)(1)0 0 0 0 0 0
F
TotalAdditionalTier 1and Tier 2 instrumentseligible asregulatorycapitalunder
the CRR provisionsthat convert into Common EquityTier 1or are written down
upon a trigger event (2)
0 0 435
F.1Ofwhich: eligible instrumentswhose trigger isabove CET1capitalratio in the
adverse scenario(2)0 0 0
G FullyLoadedCommonEquityTier 1Capital ratio (3) 7.00% 2.86%
(1)Conversionsnot considered for CET1 computation (2)Excluding instrumentsincluded in E (3)Memorandum item based on a fullyimplemented CRR/CRD IV definition of Common EquityTier 1 capitalincluding 60%ofunrealised gains/lossesfrom Sovereign Exposure in AFS portfolio
Memorandumitems
OWN FUNDS
OWN FUNDS
REQUIREMENTS
CAPITALRATIOS(%) -
Transitional period
http://www.economiaciudadana.org/
2014 EU-wide Stress Test - Restructuring scenarios
(mln EUR)
2013 0 0
2014 94 -292 54 -364Less RWAs due to Operating profit. Higher result due to reduction in
operational costs. Higher NIM due to increase in profitability
2015 104 -92 58 -191Less RWAs due to Operating profit. Higher result due to reduction in
operational costs. Higher NIM due to increase in profitability
2016 151 -9 91 -92Less RWAs due to Operating profit. Higher result due to reduction in
operational costs. Higher NIM due to increase in profitability
Total 349 -393 203 -647
Effects of mandatory restructuring plans publicly announced before 31 December 2013 and formally agreed with the European Commission.
Baseline scenario Adverse scenarioNarrative description of the transactions. (type, date of
completion/commitment, portfolios, subsidiaries, branches)CET1 impact
Risk exposure
amount impactCET1 impact
Risk exposure
amount impact

8/10/2019 Test Stress Banca Española 2014
http://slidepdf.com/reader/full/test-stress-banca-espanola-2014 142/240
http://www.economiaciudadana.org/
2014 EU-wide Stress Test
Outcome of the Stress Test based on the Restructuring plan for banks whose plan was formally agreed with the European Commission after 31 December 2013
(mln EUR)
As of
31/12/2013
As of
31/12/2014
As of
31/12/2015
As of
31/12/2016
As of
31/12/2014
As of
31/12/2015
As of
31/12/2016
COMMON EQUITY TIER 1 CAPITAL (net of deductions and after applying transitional adjustments)
TOTAL RISK EXPOSURE AMOUNT
COMMON EQUITY TIER 1 RATIO #DIV/0! #DIV/0! #DIV/0! #DIV/0! #DIV/0! #DIV/0! #DIV/0!
Baseline scenario Adverse scenario

8/10/2019 Test Stress Banca Española 2014
http://slidepdf.com/reader/full/test-stress-banca-espanola-2014 143/240
http://www.economiaciudadana.org/

8/10/2019 Test Stress Banca Española 2014
http://slidepdf.com/reader/full/test-stress-banca-espanola-2014 144/240
Bank Name ES - Banco Mare Nostrum, S.A.
LEI Code549300PY124PITBSWN73
ES
2014 EU-wide Stress Test

8/10/2019 Test Stress Banca Española 2014
http://slidepdf.com/reader/full/test-stress-banca-espanola-2014 145/240
ES
NUK_WL_NR_XX
version
1809014
No restructuring
http://www.economiaciudadana.org/
Actual figures as of 31 December 2013 mln EUR, % Actual figures as of 31 December 2013 mln EUR, %
Operating profit before impairments 718 Operating profit before impairments 718
Impairment losses on financial and non-financial assets in the banking book 653 Impairment losses on financial and non-financial assets in the banking book 653
Common Equity Tier 1 capital (1) 1,930 Common Equity Tier 1 capital (1) 1,930
Total Risk Exposure (1) 21,419 Total Risk Exposure (1) 21,419
Common Equity Tier 1 ratio, % (1) 9.0% Common Equity Tier 1 ratio, % (1) 9.0%
Outcome of the adverse scenario as of 31 December 2016 mln EUR, % Outcome of the baseline scenario as of 31 December 2016 mln EUR, %
3 yr cumulative operating profit before impairments 1,289 3 yr cumulative operating profit before impairments 1,880
3 yr cumulative impairment losses on financial and non-financial assets in the banking book 1,491 3 yr cumulative impairment losses on financial and non-financial assets in the banking book 577
3 yr cumulative losses from the stress in the trading book 73 3 yr cumulative losses from the stress in the trading book 46 Valuation losses due to sovereign shock after tax and prudential filters 107 Common Equity Tier 1 capital (1) 2,359
1 662 20 471
2014 EU-wide Stress Test 2014 EU-wide Stress TestSummary Baseline Scenario
ES - Banco Mare Nostrum, S.A.
Summary Adverse Scenario
ES - Banco Mare Nostrum, S.A.

8/10/2019 Test Stress Banca Española 2014
http://slidepdf.com/reader/full/test-stress-banca-espanola-2014 146/240
Common Equity Tier 1 capital (1) 1,662 Total Risk Exposure (1) 20,471
Total Risk Exposure (1) 20,555 Common Equity Tier 1 ratio, % (1) 11.5%
Common Equity Tier 1 ratio, % (1) 8.1%
Memorandum items mln EUR
Memorandum items mln EUR Common EU wide CET1 Threshold (8.0%) 1,638
Common EU wide CET1 Threshold (5.5%) 1,131
Total amount of instruments with mandatory conversion into ordinary shares upon a fixed date in
the 2014 -2016 period (cumulative conversions) (2)0
Total Additional Tier 1 and Tier 2 instruments eligible as regulatory capital under the CRR provisions
that convert into Common Equity Tier 1 or are written down upon a trigger event (3)0
Of which: eligible instruments whose trigger is above CET1 capital ratio in the adverse
scenario (3)0
(2) Conversions not considered for CET1 computation
(3) Excluding instruments with mandatory conversion into ordinary shares upon a fixed date in the 2014 -2016 period
(1) According to CRR/CRD4 definition transitional arrangements as per reporting date. Figures as of 31/12/2013 computed as of first day of application:
01/01/2014.
(1) According to CRR/CRD4 definition transitional arrangements as per reporting date. Figures as of 31/12/2013 computed as of first day of application:
01/01/2014.
http://www.economiaciudadana.org/
2014 EU-wide Stress TestCredit Risk
(mln EUR, %)
No n-d ef aul t ed De fau lt e d No n-d ef aul t ed De fau lt e d No n-d ef aul t ed De fau lt e d No n-d ef aul t e d De fau lt e d No n-d ef aul t ed De fau lt e d No n-d ef aul t e d De fau lt e d No n-d ef aul t ed De fau lt e d No n-d ef aul t ed De fau lt e d No n-d ef aul t ed De fau lt e dImpairment
rate
Stockof
ProvisionsCoverage Ratio -
Default Stock
Impairment
rate
Stockof
Provisions
Coverage
Ratio-Default
Stock
Impairment
rate
Stockof
Provisions
Coverage
Ratio -Default
Stock
Impairment rateStockof
Provisions
Coverage
Ratio-Default
Stock
Impairment
rate
Stockof
Provisions
Coverage
Ratio-Default
Stock
Impairment
rate
Stockof
Provisions
Coverage
Ratio -Default
Stock
Central banksandcentral governments 0 0 0 0 5,654 0 0 0 0 0 198 0 0 0 0 0 0 0 0.02% 1 100.00% 0.02% 1 100.00% 0.02% 2 100.00% 0.85% 24 101.45% 0.83% 48 100.72% 0.75% 72 100.48%
Institutions 0 0 0 0 11,227 6 0 0 0 0 1,115 9 0 0 0 0 0 3 0.02% 5 45.40% 0.02% 7 54.06% 0.02% 9 59.50% 0.69% 83 100.00% 0.69% 157 100.00% 0.83% 231 100.00%
Corporates 0 0 0 0 2,642 883 0 0 0 0 2,088 985 0 0 0 0 35 604 3.71% 884 34.71% 3.13% 973 34.41% 2.50% 1,044 34.69% 5.45% 964 36.79% 5.80% 1,130 38.04% 4.71% 1,258 39.52%
Corporates -Of Which:SpecialisedLending 0 0 0 0 0 0 0 0 0 0 0 1 0 0 0 0 0 0 - 0 - - 0 - - 0 - - 0 - - 0 - - 0 -
Corporates -Of Which:SME 0 0 0 0 2,178 793 0 0 0 0 1,740 886 0 0 0 0 18 542 - 0 - - 0 - - 0 - - 0 - - 0 - - 0 -
Retail 0 0 0 0 19,229 1,278 0 0 0 0 7,955 1,274 0 0 0 0 61 631 0.43% 798 30.51% 0.35% 879 29.52% 0.27% 944 29.06% 0.84% 892 31.98% 0.84% 1,075 31.56% 0.68% 1,221 31.59%
Retail -Securedon real estateproperty 54.9% 0 0 0 0 15,475 974 0 0 0 0 5,482 898 0 0 0 0 57 368 0.24% 464 24.84% 0.18% 493 23.47% 0.14% 515 22.68% 0.56% 519 26.17% 0.54% 603 25.30% 0.41% 666 24.93%
Retail -Securedon real estate property- Of
h i h : S E57.6% 0 0 0 0 865 174 0 0 0 0 212 146 0 0 0 0 7 128 1.39% 150 40.74% 1.18% 161 38.65% 0.99% 170 37.54% 2.24% 157 40.67% 2.20% 175 38.51% 2.06% 190 37.43%
Retail -Securedon real estate property- Of
h i h: n n - E65.4% 0 0 0 0 14,610 801 0 0 0 0 5,270 753 0 0 0 0 50 240 0.17% 315 20.56% 0.12% 332 19.34% 0.10% 345 18.62% 0.46% 362 22.37% 0.45% 428 21.98% 0.34% 476 21.82%
Retail -QualifyingRevolving 0 0 0 0 165 5 0 0 0 0 124 5 0 0 0 0 0 18 1.19% 20 73.87% 0.99% 22 71.00% 0.79% 24 68.72% 1.88% 22 73.77% 2.22% 26 71.01% 1.71% 30 68.35%
Retail -OtherRetail 0 0 0 0 3,589 299 0 0 0 0 2,349 370 0 0 0 0 3 245 1.21% 313 41.94% 1.01% 363 41.46% 0.80% 405 41.44% 1.99% 351 43.86% 2.01% 445 44.10% 1.73% 525 44.60%
Retail -Other Retail -Of Which:SME 0 0 0 0 1,571 192 0 0 0 0 845 238 0 0 0 0 1 155 1.75% 196 42.28% 1.51% 231 42.64% 1.26% 260 43.38% 2.67% 218 44.29% 2.73% 277 45.70% 2.57% 327 47.14%
Retail -Other Retail -Of Which:non-SME 0 0 0 0 2,018 106 0 0 0 0 1,504 131 0 0 0 0 3 91 0.79% 117 41.33% 0.66% 132 39.35% 0.53% 145 38.10% 1.46% 134 43.11% 1.52% 168 41.51% 1.27% 197 40.68%
Equity 0 0 0 0 795 0 0 0 0 0 907 0 0 0 0 0 0 0 2.84% 9 18.94% 2.48% 13 19.06% 1.97% 15 18.97% 4.53% 15 23.78% 4.86% 21 24.45% 4.11% 24 24.45%
Securitisation 0 0 0 0 161 0 0 0 0 0 646 0 0 0 0 0 17 0
Othernon-credit obligation assets 0 0 0 0 4,420 1 0 0 0 0 4,102 0 0 0 0 0 0 1
TOTAL 0 0 0 0 44,127 2,169 0 0 0 0 17,010 2,267 0 0 0 0 113 1,238 0.51% 1,697 32.40% 0.38% 1,873 31.73% 0.29% 2,014 31.61% 1.13% 1,978 35.51% 1.06% 2,432 36.55% 0.90% 2,806 37.76%
Securitisation andre-securitisations positions deductedfrom capital * 0 0 0 0 0 0 0 0 0 0 0 0
(mln EUR, %)No n-d ef aul t ed De fau lt e d No n-d ef aul t ed De fau lt e d No n-d ef aul t ed De fau lt e d No n-d ef aul t e d De fau lt e d No n-d ef aul t ed De fau lt e d No n-d ef aul t e d De fau lt e d No n-d ef aul t ed De fau lt e d No n-d ef aul t ed De fau lt e d No n-d ef aul t ed De fau lt e d
Impairment
rate
Stockof
ProvisionsCoverage Ratio -
Default Stock
Impairment
rate
Stockof
Provisions
Coverage
Ratio-DefaultStock
Impairment
rate
Stockof
Provisions
Coverage
Ratio -DefaultStock
Impairment rateStockof
Provisions
Coverage
Ratio-DefaultStock
Impairment
rate
Stockof
Provisions
Coverage
Ratio-DefaultStock
Impairment
rate
Stockof
Provisions
Coverage
Ratio -DefaultStock
Central banksandcentral governments 0 0 0 0 5,654 0 0 0 0 0 198 0 0 0 0 0 0 0 0.02% 1 161.01% 0.02% 1 130.10% 0.02% 2 119.32% 0.84% 24 101.45% 0.83% 48 100.72% 0.76% 72 100.48%
Institutions 0 0 0 0 11,227 6 0 0 0 0 1,115 9 0 0 0 0 0 3 0.02% 5 44.69% 0.02% 7 53.05% 0.02% 9 58.71% 0.74% 83 100.00% 0.74% 157 100.00% 0.83% 231 100.00%
Corporates 0 0 0 0 2,569 903 0 0 0 0 2,015 977 0 0 0 0 35 575 3.74% 852 33.57% 3.16% 938 33.40% 2.51% 1,007 33.74% 5.48% 930 35.63% 5.90% 1,091 37.04% 4.72% 1,214 38.55%
Corporates -Of Which:SpecialisedLending 0 0 0 0 0 0 0 0 0 0 0 0 0 0 0 0 0 0 - 0 - - 0 - - 0 - - 0 - - 0 - - 0 -
Corporates -Of Which:SME 0 0 0 0 2,101 812 0 0 0 0 1,663 878 0 0 0 0 18 514 - 0 - - 0 - - 0 - - 0 - - 0 - - 0 -
Retail 0 0 0 0 18,619 1,216 0 0 0 0 7,735 1,207 0 0 0 0 60 614 0.43% 779 30.70% 0.35% 858 29.70% 0.28% 923 29.24% 0.84% 869 32.08% 0.85% 1,048 31.67% 0.70% 1,192 31.70%
Retail -Securedon real estateproperty 55.2% 0 0 0 0 14,890 913 0 0 0 0 5,276 835 0 0 0 0 57 352 0.24% 447 24.92% 0.18% 475 23.52% 0.14% 496 22.72% 0.57% 500 26.23% 0.54% 581 25.33% 0.42% 641 24.95%
Retail -Securedon real estate property- Of
h i h : S E58.7% 0 0 0 0 860 155 0 0 0 0 210 127 0 0 0 0 7 127 1.39% 149 40.73% 1.18% 160 38.60% 0.99% 169 37.46% 2.24% 157 40.71% 2.20% 175 38.55% 2.06% 189 37.44%
Retail -Securedon real estate property- Of
h i h: n n - E54.9% 0 0 0 0 14,030 758 0 0 0 0 5,066 708 0 0 0 0 50 225 0.17% 298 20.44% 0.12% 314 19.23% 0.10% 327 18.51% 0.46% 343 22.24% 0.45% 406 21.84% 0.34% 452 21.71%
Retail -QualifyingRevolving 0 0 0 0 164 5 0 0 0 0 123 4 0 0 0 0 0 17 1.19% 19 73.03% 0.93% 21 69.86% 0.79% 23 67.65% 1.88% 20 72.99% 2.23% 25 69.75% 1.72% 29 66.76%
Retail -OtherRetail 0 0 0 0 3,565 298 0 0 0 0 2,336 369 0 0 0 0 3 244 1.21% 312 41.96% 1.01% 362 41.46% 0.80% 404 41.45% 1.94% 349 43.61% 2.02% 442 43.93% 1.73% 522 44.45%
Retail -Other Retail -Of Which:SME 0 0 0 0 1,567 192 0 0 0 0 843 238 0 0 0 0 1 155 1.75% 196 42.28% 1.50% 231 42.62% 1.26% 260 43.35% 2.67% 218 44.29% 2.73% 277 45.70% 2.57% 327 47.14%
Retail -Other Retail -Of Which:non-SME 0 0 0 0 1,998 106 0 0 0 0 1,493 130 0 0 0 0 3 90 0.79% 117 41.38% 0.66% 131 39.39% 0.53% 144 38.14% 1.37% 131 42.40% 1.53% 165 41.03% 1.27% 194 40.29%
Equity 0 0 0 0 795 0 0 0 0 0 907 0 0 0 0 0 0 0 2.84% 9 18.94% 2.48% 13 19.06% 1.97% 15 18.97% 4.53% 15 23.78% 4.86% 21 24.45% 4.11% 24 24.45%
Securitisation 0 0 0 0 161 0 0 0 0 0 646 0 0 0 0 0 17 0Othernon-credit obligation assets 0 0 0 0 4,419 19 0 0 0 0 4,101 18 0 0 0 0 0 1
TOTAL 0 0 0 0 43,443 2,143 0 0 0 0 16,717 2,211 0 0 0 0 112 1,193 0.52% 1,646 31.98% 0.39% 1,818 31.37% 0.29% 1,955 31.28% 1.15% 1,920 35.08% 1.10% 2,366 36.23% 0.91% 2,733 37.50%Securitisation andre-securitisations positions deductedfrom capital * 0 0 0 0 0 0 0 0 0 0 0 0
Risk exposureamounts(as of31/12/2013)
asof 31/12/2016
Spain
AdverseScenario
F-IRB A-IRB STA F-IRB A-IRB STA F-IRB A-IRB STA as of 31/12/2014 as of 31/12/2015 as of 31/12/2016 as of 31/12/2014 as of 31/12/2015 as of 31/12/2016LTV %(asof
31/12/2013)
Exposurevalues(as of31/12/2013)
ES - Banco Mare Nostrum, S.A.
(*)Referstothepart ofSecuritizationexposurethat isdeductedfrom capital andisnot includedinRWA
Valueadjustmentsand provisions(asof 31/12/2013) BaselineScenario
LTV %(asof
31/12/2013)
Exposure values (as of 31/12/2013) Risk exposure amounts (as of 31/12/2013) Value adjustments and provisions (as of 31/12/2013) Adverse ScenarioF-IRB A-IRB STA F-IRB A-IRB STA F-IRB A-IRB STA
BaselineScenarioas of 31/12/2014 as of 31/12/2015 as of 31/12/2016 as of 31/12/2014 as of 31/12/2015
(*)Referstothepart ofSecuritizationexposurethat isdeductedfrom capital andisnot includedinRWA

8/10/2019 Test Stress Banca Española 2014
http://slidepdf.com/reader/full/test-stress-banca-espanola-2014 147/240
(mln EUR, %)No n-d ef aul t ed De fau lt e d No n-d ef aul t ed De fau lt e d No n-d ef aul t ed De fau lt e d No n-d ef aul t e d De fau lt e d No n-d ef aul t ed De fau lt e d No n-d ef aul t e d De fau lt e d No n-d ef aul t ed De fau lt e d No n-d ef aul t ed De fau lt e d No n-d ef aul t ed De fau lt e d
Impairment
rate
Stockof
ProvisionsCoverage Ratio -
Default Stock
Impairment
rate
Stockof
Provisions
CoverageRatio-Default
Stock
Impairment
rate
Stockof
Provisions
CoverageRatio -Default
Stock
Impairment rateStockof
Provisions
CoverageRatio-Default
Stock
Impairment
rate
Stockof
Provisions
CoverageRatio-Default
Stock
Impairment
rate
Stockof
Provisions
CoverageRatio -Default
Stock Central banksandcentral governments 0 0 0 0 0 0 0 0 0 0 0 0 0 0 0 0 0 0 - 0 - - 0 - - 0 - - 0 - - 0 - - 0 -
Institutions 0 0 0 0 0 0 0 0 0 0 0 0 0 0 0 0 0 0 - 0 - - 0 - - 0 - - 0 - - 0 - - 0 -
Corporates 0 0 0 0 0 0 0 0 0 0 0 0 0 0 0 0 0 0 - 0 - - 0 - - 0 - - 0 - - 0 - - 0 -
Corporates -Of Which:SpecialisedLending 0 0 0 0 0 0 0 0 0 0 0 0 0 0 0 0 0 0 - 0 - - 0 - - 0 - - 0 - - 0 - - 0 -
Corporates -Of Which:SME 0 0 0 0 0 0 0 0 0 0 0 0 0 0 0 0 0 0 - 0 - - 0 - - 0 - - 0 - - 0 - - 0 -
Retail 0 0 0 0 0 0 0 0 0 0 0 0 0 0 0 0 0 0 - 0 - - 0 - - 0 - - 0 - - 0 - - 0 -
Retail -Securedon real estateproperty 0.0% 0 0 0 0 0 0 0 0 0 0 0 0 0 0 0 0 0 0 - 0 - - 0 - - 0 - - 0 - - 0 - - 0 -
Retail -Securedon real estate property- Of
hi h: E0.0% 0 0 0 0 0 0 0 0 0 0 0 0 0 0 0 0 0 0 - 0 - - 0 - - 0 - - 0 - - 0 - - 0 -
Retail -Securedon real estate property- Of
h i h : n n -S E0.0% 0 0 0 0 0 0 0 0 0 0 0 0 0 0 0 0 0 0 - 0 - - 0 - - 0 - - 0 - - 0 - - 0 -
Retail -QualifyingRevolving 0 0 0 0 0 0 0 0 0 0 0 0 0 0 0 0 0 0 - 0 - - 0 - - 0 - - 0 - - 0 - - 0 -
Retail -OtherRetail 0 0 0 0 0 0 0 0 0 0 0 0 0 0 0 0 0 0 - 0 - - 0 - - 0 - - 0 - - 0 - - 0 -
Retail -Other Retail -Of Which:SME 0 0 0 0 0 0 0 0 0 0 0 0 0 0 0 0 0 0 - 0 - - 0 - - 0 - - 0 - - 0 - - 0 -
Retail -Other Retail -Of Which:non-SME 0 0 0 0 0 0 0 0 0 0 0 0 0 0 0 0 0 0 - 0 - - 0 - - 0 - - 0 - - 0 - - 0 -
Equity 0 0 0 0 0 0 0 0 0 0 0 0 0 0 0 0 0 0 - 0 - - 0 - - 0 - - 0 - - 0 - - 0 -
Securitisation 0 0 0 0 0 0 0 0 0 0 0 0 0 0 0 0 0 0
Othernon-credit obligation assets 0 0 0 0 0 0 0 0 0 0 0 0 0 0 0 0 0 0
TOTAL 0 0 0 0 0 0 0 0 0 0 0 0 0 0 0 0 0 0 - 0 - - 0 - - 0 - - 0 - - 0 - - 0 -
Securitisation andre-securitisations positions deductedfrom capital * 0 0 0 0 0 0 0 0 0 0 0 0
(mln EUR, %)No n-d ef aul t ed De fau lt e d No n-d ef aul t ed De fau lt e d No n-d ef aul t ed De fau lt e d No n-d ef aul t e d De fau lt e d No n-d ef aul t ed De fau lt e d No n-d ef aul t e d De fau lt e d No n-d ef aul t ed De fau lt e d No n-d ef aul t ed De fau lt e d No n-d ef aul t ed De fau lt e d
Impairment
rate
Stockof
ProvisionsCoverage Ratio -
Default Stock
Impairment
rate
Stockof
Provisions
CoverageRatio-Default
Stock
Impairment
rate
Stockof
Provisions
CoverageRatio -Default
Stock
Impairment rateStockof
Provisions
CoverageRatio-Default
Stock
Impairment
rate
Stockof
Provisions
CoverageRatio-Default
Stock
Impairment
rate
Stockof
Provisions
CoverageRatio -Default
Stock Central banksandcentral governments 0 0 0 0 0 0 0 0 0 0 0 0 0 0 0 0 0 0 - 0 - - 0 - - 0 - - 0 - - 0 - - 0 -
Institutions 0 0 0 0 0 0 0 0 0 0 0 0 0 0 0 0 0 0 - 0 - - 0 - - 0 - - 0 - - 0 - - 0 -
Corporates 0 0 0 0 0 0 0 0 0 0 0 0 0 0 0 0 0 0 - 0 - - 0 - - 0 - - 0 - - 0 - - 0 -
Corporates -Of Which:SpecialisedLending 0 0 0 0 0 0 0 0 0 0 0 0 0 0 0 0 0 0 - 0 - - 0 - - 0 - - 0 - - 0 - - 0 -
Corporates -Of Which:SME 0 0 0 0 0 0 0 0 0 0 0 0 0 0 0 0 0 0 - 0 - - 0 - - 0 - - 0 - - 0 - - 0 -
Retail 0 0 0 0 0 0 0 0 0 0 0 0 0 0 0 0 0 0 - 0 - - 0 - - 0 - - 0 - - 0 - - 0 -
Retail -Securedon real estateproperty 0.0% 0 0 0 0 0 0 0 0 0 0 0 0 0 0 0 0 0 0 - 0 - - 0 - - 0 - - 0 - - 0 - - 0 -
Retail -Securedon real estate property- Of
hi h: E0.0% 0 0 0 0 0 0 0 0 0 0 0 0 0 0 0 0 0 0 - 0 - - 0 - - 0 - - 0 - - 0 - - 0 -
Retail -Securedon real estate property- Of
h i h: n n - E0.0% 0 0 0 0 0 0 0 0 0 0 0 0 0 0 0 0 0 0 - 0 - - 0 - - 0 - - 0 - - 0 - - 0 -
Retail -QualifyingRevolving 0 0 0 0 0 0 0 0 0 0 0 0 0 0 0 0 0 0 - 0 - - 0 - - 0 - - 0 - - 0 - - 0 -
Retail -OtherRetail 0 0 0 0 0 0 0 0 0 0 0 0 0 0 0 0 0 0 - 0 - - 0 - - 0 - - 0 - - 0 - - 0 -
Retail -Other Retail -Of Which:SME 0 0 0 0 0 0 0 0 0 0 0 0 0 0 0 0 0 0 - 0 - - 0 - - 0 - - 0 - - 0 - - 0 -
Retail -Other Retail -Of Which:non-SME 0 0 0 0 0 0 0 0 0 0 0 0 0 0 0 0 0 0 - 0 - - 0 - - 0 - - 0 - - 0 - - 0 -
Equity 0 0 0 0 0 0 0 0 0 0 0 0 0 0 0 0 0 0 - 0 - - 0 - - 0 - - 0 - - 0 - - 0 -
Securitisation 0 0 0 0 0 0 0 0 0 0 0 0 0 0 0 0 0 0
Othernon-credit obligation assets 0 0 0 0 0 0 0 0 0 0 0 0 0 0 0 0 0 0
TOTAL 0 0 0 0 0 0 0 0 0 0 0 0 0 0 0 0 0 0 - 0 - - 0 - - 0 - - 0 - - 0 - - 0 -
Securitisation andre-securitisations positions deductedfrom capital * 0 0 0 0 0 0 0 0 0 0 0 0
(mln EUR, %)No n-d ef aul t ed De fau lt e d No n-d ef aul t ed De fau lt e d No n-d ef aul t ed De fau lt e d No n-d ef aul t e d De fau lt e d No n-d ef aul t ed De fau lt e d No n-d ef aul t e d De fau lt e d No n-d ef aul t ed De fau lt e d No n-d ef aul t ed De fau lt e d No n-d ef aul t ed De fau lt e d
Impairment
rate
Stockof
ProvisionsCoverage Ratio -
Default Stock
Impairment
rate
Stockof
Provisions
CoverageRatio-Default
Stock
Impairment
rate
Stockof
Provisions
CoverageRatio -Default
Stock
Impairment rateStockof
Provisions
CoverageRatio-Default
Stock
Impairment
rate
Stockof
Provisions
CoverageRatio-Default
Stock
Impairment
rate
Stockof
Provisions
CoverageRatio -Default
Stock Central banksandcentral governments 0 0 0 0 0 0 0 0 0 0 0 0 0 0 0 0 0 0 - 0 - - 0 - - 0 - - 0 - - 0 - - 0 -
Institutions 0 0 0 0 0 0 0 0 0 0 0 0 0 0 0 0 0 0 - 0 - - 0 - - 0 - - 0 - - 0 - - 0 -
Corporates 0 0 0 0 0 0 0 0 0 0 0 0 0 0 0 0 0 0 - 0 - - 0 - - 0 - - 0 - - 0 - - 0 -
Corporates -Of Which:SpecialisedLending 0 0 0 0 0 0 0 0 0 0 0 0 0 0 0 0 0 0 - 0 - - 0 - - 0 - - 0 - - 0 - - 0 -
Corporates -Of Which:SME 0 0 0 0 0 0 0 0 0 0 0 0 0 0 0 0 0 0 - 0 - - 0 - - 0 - - 0 - - 0 - - 0 -
Retail 0 0 0 0 0 0 0 0 0 0 0 0 0 0 0 0 0 0 - 0 - - 0 - - 0 - - 0 - - 0 - - 0 -
Retail -Securedon real estateproperty 0.0% 0 0 0 0 0 0 0 0 0 0 0 0 0 0 0 0 0 0 - 0 - - 0 - - 0 - - 0 - - 0 - - 0 -
Retail -Securedon real estate property- Of
hi h: E0.0% 0 0 0 0 0 0 0 0 0 0 0 0 0 0 0 0 0 0 - 0 - - 0 - - 0 - - 0 - - 0 - - 0 -
Retail -Securedon real estate property- Of
h i h : n n -S E0.0% 0 0 0 0 0 0 0 0 0 0 0 0 0 0 0 0 0 0 - 0 - - 0 - - 0 - - 0 - - 0 - - 0 -
Retail -QualifyingRevolving 0 0 0 0 0 0 0 0 0 0 0 0 0 0 0 0 0 0 - 0 - - 0 - - 0 - - 0 - - 0 - - 0 -
Retail -OtherRetail 0 0 0 0 0 0 0 0 0 0 0 0 0 0 0 0 0 0 - 0 - - 0 - - 0 - - 0 - - 0 - - 0 -
Retail -Other Retail -Of Which:SME 0 0 0 0 0 0 0 0 0 0 0 0 0 0 0 0 0 0 - 0 - - 0 - - 0 - - 0 - - 0 - - 0 -
Retail -Other Retail -Of Which:non-SME 0 0 0 0 0 0 0 0 0 0 0 0 0 0 0 0 0 0 - 0 - - 0 - - 0 - - 0 - - 0 - - 0 -
Equity 0 0 0 0 0 0 0 0 0 0 0 0 0 0 0 0 0 0 - 0 - - 0 - - 0 - - 0 - - 0 - - 0 -
Securitisation 0 0 0 0 0 0 0 0 0 0 0 0 0 0 0 0 0 0
Othernon-credit obligation assets 0 0 0 0 0 0 0 0 0 0 0 0 0 0 0 0 0 0
TOTAL 0 0 0 0 0 0 0 0 0 0 0 0 0 0 0 0 0 0 - 0 - - 0 - - 0 - - 0 - - 0 - - 0 -
Securitisation andre-securitisations positions deductedfrom capital * 0 0 0 0 0 0 0 0 0 0 0 0
(mln EUR, %)No n-d ef aul t ed De fau lt e d No n-d ef aul t ed De fau lt e d No n-d ef aul t ed De fau lt e d No n-d ef aul t e d De fau lt e d No n-d ef aul t ed De fau lt e d No n-d ef aul t e d De fau lt e d No n-d ef aul t ed De fau lt e d No n-d ef aul t ed De fau lt e d No n-d ef aul t ed De fau lt e d
Impairment
rate
Stockof
ProvisionsCoverage Ratio -
Default Stock
Impairment
rate
Stockof
Provisions
CoverageRatio-Default
Stock
Impairment
rate
Stockof
Provisions
CoverageRatio -Default
Stock
Impairment rateStockof
Provisions
CoverageRatio-Default
Stock
Impairment
rate
Stockof
Provisions
CoverageRatio-Default
Stock
Impairment
rate
Stockof
Provisions
CoverageRatio -Default
Stock Central banksandcentral governments 0 0 0 0 0 0 0 0 0 0 0 0 0 0 0 0 0 0 - 0 - - 0 - - 0 - - 0 - - 0 - - 0 -
Institutions 0 0 0 0 0 0 0 0 0 0 0 0 0 0 0 0 0 0 - 0 - - 0 - - 0 - - 0 - - 0 - - 0 -
Corporates 0 0 0 0 0 0 0 0 0 0 0 0 0 0 0 0 0 0 - 0 - - 0 - - 0 - - 0 - - 0 - - 0 -
Corporates -Of Which:SpecialisedLending 0 0 0 0 0 0 0 0 0 0 0 0 0 0 0 0 0 0 - 0 - - 0 - - 0 - - 0 - - 0 - - 0 -
Corporates -Of Which:SME 0 0 0 0 0 0 0 0 0 0 0 0 0 0 0 0 0 0 - 0 - - 0 - - 0 - - 0 - - 0 - - 0 -
Retail 0 0 0 0 0 0 0 0 0 0 0 0 0 0 0 0 0 0 - 0 - - 0 - - 0 - - 0 - - 0 - - 0 -Retail -Securedon real estateproperty 0.0% 0 0 0 0 0 0 0 0 0 0 0 0 0 0 0 0 0 0 - 0 - - 0 - - 0 - - 0 - - 0 - - 0 -
Retail -Securedon real estate property- Of
hi h: E0.0% 0 0 0 0 0 0 0 0 0 0 0 0 0 0 0 0 0 0 - 0 - - 0 - - 0 - - 0 - - 0 - - 0 -
Retail -Securedon real estate property- Of
h i h: n n - E0.0% 0 0 0 0 0 0 0 0 0 0 0 0 0 0 0 0 0 0 - 0 - - 0 - - 0 - - 0 - - 0 - - 0 -
Retail -QualifyingRevolving 0 0 0 0 0 0 0 0 0 0 0 0 0 0 0 0 0 0 - 0 - - 0 - - 0 - - 0 - - 0 - - 0 -
Retail -OtherRetail 0 0 0 0 0 0 0 0 0 0 0 0 0 0 0 0 0 0 - 0 - - 0 - - 0 - - 0 - - 0 - - 0 -
Retail -Other Retail -Of Which:SME 0 0 0 0 0 0 0 0 0 0 0 0 0 0 0 0 0 0 - 0 - - 0 - - 0 - - 0 - - 0 - - 0 -
Retail -Other Retail -Of Which:non-SME 0 0 0 0 0 0 0 0 0 0 0 0 0 0 0 0 0 0 - 0 - - 0 - - 0 - - 0 - - 0 - - 0 -
Equity 0 0 0 0 0 0 0 0 0 0 0 0 0 0 0 0 0 0 - 0 - - 0 - - 0 - - 0 - - 0 - - 0 -
Securitisation 0 0 0 0 0 0 0 0 0 0 0 0 0 0 0 0 0 0
Othernon-credit obligation assets 0 0 0 0 0 0 0 0 0 0 0 0 0 0 0 0 0 0
TOTAL 0 0 0 0 0 0 0 0 0 0 0 0 0 0 0 0 0 0 - 0 - - 0 - - 0 - - 0 - - 0 - - 0 -
Securitisation andre-securitisations positions deductedfrom capital * 0 0 0 0 0 0 0 0 0 0 0 0
as of 31/12/2016 as of 31/12/2014 as of 31/12/2015 as of 31/12/2016
Please, select the country
F-IRB A-IRB STA a s of 3 1/ 12 /2 01 4 a s of 3 1/ 12 /2 01 5LTV %(asof
31/12/2013)
Exposure values (as of 31/12/2013) Risk exposure amounts (as of 31/12/2013) Value adjustments and provisions (as of 31/12/2013) Baseline Scenario Adverse Scenario
F-IRB A-IRB STA F-IRB A-IRB STA
LTV %(asof
31/12/2013)
Exposure values (as of 31/12/2013) Risk exposure amounts (as of 31/12/2013) Value adjustments and provisions (as of 31/12/2013) Baseline Scenario Adverse Scenario
F-IRB A-IRB STA F-IRB A-IRB STA F-IRB a sof 31 /12 /2 01 4 a so f3 1/ 12 /2 01 5 a sof 31 /12 /2 01 6 A-IRB STA a sof 31 /1 2/ 20 14 a so f3 1/ 12 /2 01 5 a sof 31 /12 /2 01 6
LTV %(asof
31/12/2013)
Exposure values (as of 31/12/2013) Risk exposure amounts (as of 31/12/2013) Value adjustments and provisions (as of 31/12/2013) Baseline Scenario Adverse Scenario
F-IRB A-IRB STA F-IRB A-IRB STA F-IRB A-IRB a s of 3 1/ 12 /2 01 5 a s of 3 1/ 12 /2 01 6STA as of 31/12/2014 as of 31/12/2015 as of 31/12/2016 as of 31/12/2014
Baseline Scenario Adverse Scenario
F-IRB A-IRB STA F-IRB A-IRB STA F-IRB A-IRB STA as of 31/12/2014 as of 31/12/2015 as of 31/12/2016 as of 31/12/2014 as of 31/12/2015 as of 31/12/2016LTV %(asof
31/12/2013)
E xp os ur e va lu es ( as of 3 1/ 12 /2 01 3) R is k e xp os ur e am ou nt s (a s of 3 1/ 12 /2 01 3) V al ue a dj us tm en ts a nd pr ov is io ns ( as o f3 1/ 12 /2 01 3)
(*)Referstothepart ofSecuritizationexposurethat isdeductedfrom capital andisnot includedinRWA
(*)Referstothepart ofSecuritizationexposurethat isdeductedfrom capital andisnot includedinRWA
(*)Referstothepart ofSecuritizationexposurethat isdeductedfrom capital andisnot includedinRWA
(*)Referstothepart ofSecuritizationexposurethat isdeductedfrom capital andisnot includedinRWA
Please, select the country
Please, select the country
Please, select the country
http://www.economiaciudadana.org/

8/10/2019 Test Stress Banca Española 2014
http://slidepdf.com/reader/full/test-stress-banca-espanola-2014 148/240

8/10/2019 Test Stress Banca Española 2014
http://slidepdf.com/reader/full/test-stress-banca-espanola-2014 149/240
2014 EU-wide Stress Test
RWA
(mln EUR)as of 31/12/2013 as of 31/12/2014 as of 31/12/2015 as of 31/12/2016 as of 31/12/2014 as of 31/12/2015 as of 31/12/2016
Risk exposure amount for credit risk 19,373 19,089 18,835 18,425 19,191 18,896 18,509
Risk exposure amount Securitisation and re-securitisations 646 681 702 716 729 779 812
Risk exposure amount Other credit risk 18,728 18,408 18,133 17,709 18,462 18,117 17,697
Risk exposure amount for market risk 127 127 127 127 127 127 127
Risk exposure amount for operational risk 1,882 1,882 1,882 1,882 1,882 1,882 1,882
Transitional floors for Risk exposure amount 0 0 0 0 0 0 0
AQR adjustments (for SSM countries only)38 38 38 38 38 38 38
Total Risk exposure amount 21,419 21,135 20,881 20,471 21,237 20,942 20,555
Baseline Scenario Adverse Scenario

8/10/2019 Test Stress Banca Española 2014
http://slidepdf.com/reader/full/test-stress-banca-espanola-2014 150/240
http://www.economiaciudadana.org/
(mln EUR) as of 31/12/2013 31/12/2014 31/12/2015 31/12/2016 31/12/2014 31/12/2015 31/12/2016
Banking Book 178
Trading Book (excl. correlation trading positions under CRM) 0
Correlation Trading Portfolio (CRM) 0
Total 178
Banking Book 646 681 702 716 729 779 812
Trading Book (excl. correlation trading positions under CRM) 0 0 0 0 0 0 0
Total 646 681 702 716 729 779 812
Hold to Maturity porfolio 0 8 8 9 13 16 18
Available for Sale porfolio 0 0 0 0 0 0 0
Held for trading portfolio
Total 0 8 8 9 13 16 18
2014 EU-wide Stress Test
Impairments
Baseline scenario Adverse scenario
Exposure values
Risk exposure values
Securitisation

8/10/2019 Test Stress Banca Española 2014
http://slidepdf.com/reader/full/test-stress-banca-espanola-2014 151/240
http://www.economiaciudadana.org/
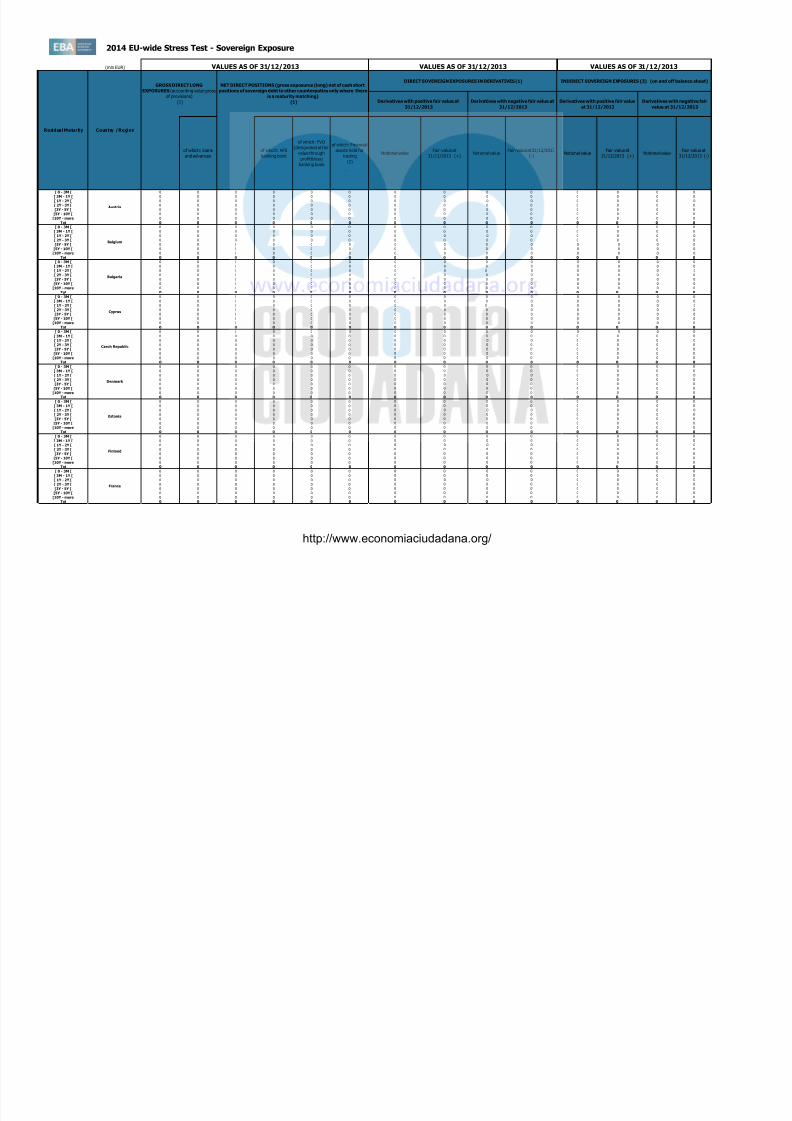
8/10/2019 Test Stress Banca Española 2014
http://slidepdf.com/reader/full/test-stress-banca-espanola-2014 152/240

8/10/2019 Test Stress Banca Española 2014
http://slidepdf.com/reader/full/test-stress-banca-espanola-2014 153/240
2014 EU-wide Stress Test - Sovereign Exposure
(mln EUR)
Residual Maturity Country / Region
GROSS DIRECT LONG
EXPOSURES(accounting value gross
of provisions)
(1)
NET DIRECT POSITIONS (gross exposures (long) net of cash short
positions of sovereign debt to other counterpaties only where there
is a maturity matching)
(1)
DIRECT SOVEREIGN EXPOSURES IN DERIVATIVES (1)
of which: loans
and advances
of which: AFS
banking book
of which: FVO
(designated at fair
value through
profit&loss)
banking book
of which: Financial
assets held for
trading
(2)
Derivatives with positive fair value at
31/12/2013
Derivatives with negative fair value at
31/12/2013
Derivatives with positive fair value
at 31/12/2013
Derivatives with negative fair
value at 31/12/2013
VALUES AS OF 31/12/2013 VALUES AS OF 31/12/2013 VALUES AS OF 31/12/2013
INDIRECT SOVEREIGN EXPOSURES (3) (on and off balance sheet)
Fair-value at
31/12/2013 (+)Notional value
Fair-value at
31/12/2013 (-)Notional value
Fair-value at
31/12/2013 (+)Notional value
Fair-value at 31/12/2013
(-)Notional value
[ 0 - 3M [ 0 0 0 0 0 0 0 0 0 0 0 0 0 0
[ 3M - 1Y [ 0 0 0 0 0 0 0 0 0 0 0 0 0 0
[ 1Y - 2Y [ 0 0 0 0 0 0 0 0 0 0 0 0 0 0
[ 2Y - 3Y [ 0 0 0 0 0 0 0 0 0 0 0 0 0 0
[3Y - 5Y [ 0 0 0 0 0 0 0 0 0 0 0 0 0 0
[5Y 10Y [ 0 0 0 0 0 0 0 0 0 0 0 0 0 0
Lithuania

8/10/2019 Test Stress Banca Española 2014
http://slidepdf.com/reader/full/test-stress-banca-espanola-2014 154/240
[5Y - 10Y [ 0 0 0 0 0 0 0 0 0 0 0 0 0 0
[10Y - more 0 0 0 0 0 0 0 0 0 0 0 0 0 0
Tot 0 0 0 0 0 0 0 0 0 0 0 0 0 0
[ 0 - 3M [ 0 0 0 0 0 0 0 0 0 0 0 0 0 0
[ 3M - 1Y [ 0 0 0 0 0 0 0 0 0 0 0 0 0 0
[ 1Y - 2Y [ 0 0 0 0 0 0 0 0 0 0 0 0 0 0
[ 2Y - 3Y [ 0 0 0 0 0 0 0 0 0 0 0 0 0 0
[3Y - 5Y [ 0 0 0 0 0 0 0 0 0 0 0 0 0 0
[5Y - 10Y [ 0 0 0 0 0 0 0 0 0 0 0 0 0 0
[10Y - more 0 0 0 0 0 0 0 0 0 0 0 0 0 0
Tot 0 0 0 0 0 0 0 0 0 0 0 0 0 0[ 0 - 3M [ 0 0 0 0 0 0 0 0 0 0 0 0 0 0
[ 3M - 1Y [ 0 0 0 0 0 0 0 0 0 0 0 0 0 0
[ 1Y - 2Y [ 0 0 0 0 0 0 0 0 0 0 0 0 0 0
[ 2Y - 3Y [ 0 0 0 0 0 0 0 0 0 0 0 0 0 0
[3Y - 5Y [ 0 0 0 0 0 0 0 0 0 0 0 0 0 0
[5Y - 10Y [ 0 0 0 0 0 0 0 0 0 0 0 0 0 0
[10Y - more 0 0 0 0 0 0 0 0 0 0 0 0 0 0
Tot 0 0 0 0 0 0 0 0 0 0 0 0 0 0
[ 0 - 3M [ 0 0 0 0 0 0 0 0 0 0 0 0 0 0
[ 3M - 1Y [ 0 0 0 0 0 0 0 0 0 0 0 0 0 0
[ 1Y - 2Y [ 0 0 0 0 0 0 0 0 0 0 0 0 0 0
[ 2Y - 3Y [ 0 0 0 0 0 0 0 0 0 0 0 0 0 0
[3Y - 5Y [ 0 0 0 0 0 0 0 0 0 0 0 0 0 0
[5Y - 10Y [ 0 0 0 0 0 0 0 0 0 0 0 0 0 0
[10Y - more 0 0 0 0 0 0 0 0 0 0 0 0 0 0
Tot 0 0 0 0 0 0 0 0 0 0 0 0 0 0[ 0 - 3M [ 0 0 0 0 0 0 0 0 0 0 0 0 0 0
[ 3M - 1Y [ 0 0 0 0 0 0 0 0 0 0 0 0 0 0
[ 1Y - 2Y [ 0 0 0 0 0 0 0 0 0 0 0 0 0 0
[ 2Y - 3Y [ 0 0 0 0 0 0 0 0 0 0 0 0 0 0
[3Y - 5Y [ 0 0 0 0 0 0 0 0 0 0 0 0 0 0
[5Y - 10Y [ 0 0 0 0 0 0 0 0 0 0 0 0 0 0
[10Y - more 0 0 0 0 0 0 0 0 0 0 0 0 0 0
Tot 0 0 0 0 0 0 0 0 0 0 0 0 0 0
Luxembourg
Malta
Netherlands
Norway
Poland
Portugal
Romania
Slovakia
http://www.economiaciudadana.org/
2014 EU-wide Stress Test - Sovereign Exposure
(mln EUR)
Residual Maturity Country / Region
GROSS DIRECT LONG
EXPOSURES(accounting value gross
of provisions)
(1)
NET DIRECT POSITIONS (gross exposures (long) net of cash short
positions of sovereign debt to other counterpaties only where there
is a maturity matching)
(1)
DIRECT SOVEREIGN EXPOSURES IN DERIVATIVES (1)
of which: loans
and advances
of which: AFS
banking book
of which: FVO
(designated at fair
value through
profit&loss)
banking book
of which: Financial
assets held for
trading
(2)
Derivatives with positive fair value at
31/12/2013
Derivatives with negative fair value at
31/12/2013
Derivatives with positive fair value
at 31/12/2013
Derivatives with negative fair
value at 31/12/2013
VALUES AS OF 31/12/2013 VALUES AS OF 31/12/2013 VALUES AS OF 31/12/2013
INDIRECT SOVEREIGN EXPOSURES (3) (on and off balance sheet)
Fair-value at
31/12/2013 (+)Notional value
Fair-value at
31/12/2013 (-)Notional value
Fair-value at
31/12/2013 (+)Notional value
Fair-value at 31/12/2013
(-)Notional value
[ 0 - 3M [ 0 0 0 0 0 0 0 0 0 0 0 0 0 0
[ 3M - 1Y [ 0 0 0 0 0 0 0 0 0 0 0 0 0 0
[ 1Y - 2Y [ 0 0 0 0 0 0 0 0 0 0 0 0 0 0
[ 2Y - 3Y [ 0 0 0 0 0 0 0 0 0 0 0 0 0 0
[3Y - 5Y [ 0 0 0 0 0 0 0 0 0 0 0 0 0 0
[5Y - 10Y [ 0 0 0 0 0 0 0 0 0 0 0 0 0 0
Slovenia

8/10/2019 Test Stress Banca Española 2014
http://slidepdf.com/reader/full/test-stress-banca-espanola-2014 155/240
[5Y 10Y [ 0 0 0 0 0 0 0 0 0 0 0 0 0 0
[10Y - more 0 0 0 0 0 0 0 0 0 0 0 0 0 0
Tot 0 0 0 0 0 0 0 0 0 0 0 0 0 0
[ 0 - 3M [ 0 0 0 0 0 0 0 0 0 0 0 0 0 0
[ 3M - 1Y [ 0 0 0 0 0 0 0 0 0 0 0 0 0 0
[ 1Y - 2Y [ 0 0 0 0 0 0 0 0 0 0 0 0 0 0
[ 2Y - 3Y [ 0 0 0 0 0 0 0 0 0 0 0 0 0 0
[3Y - 5Y [ 29 0 29 29 0 0 0 0 0 0 0 0 0 0
[5Y - 10Y [ 2,527 0 2,527 2,527 0 0 0 0 0 0 0 0 0 0
[10Y - more 0 0 0 0 0 0 0 0 0 0 0 0 0 0
Tot 2,556 0 2,556 2,556 0 0 0 0 0 0 0 0 0 0
[ 0 - 3M [ 0 0 0 0 0 0 0 0 0 0 0 0 0 0
[ 3M - 1Y [ 0 0 0 0 0 0 0 0 0 0 0 0 0 0
[ 1Y - 2Y [ 0 0 0 0 0 0 0 0 0 0 0 0 0 0
[ 2Y - 3Y [ 0 0 0 0 0 0 0 0 0 0 0 0 0 0
[3Y - 5Y [ 0 0 0 0 0 0 0 0 0 0 0 0 0 0
[5Y - 10Y [ 0 0 0 0 0 0 0 0 0 0 0 0 0 0
[10Y - more 0 0 0 0 0 0 0 0 0 0 0 0 0 0
Tot 0 0 0 0 0 0 0 0 0 0 0 0 0 0
[ 0 - 3M [ 0 0 0 0 0 0 0 0 0 0 0 0 0 0
[ 3M - 1Y [ 0 0 0 0 0 0 0 0 0 0 0 0 0 0
[ 1Y - 2Y [ 0 0 0 0 0 0 0 0 0 0 0 0 0 0
[ 2Y - 3Y [ 0 0 0 0 0 0 0 0 0 0 0 0 0 0
[3Y - 5Y [ 0 0 0 0 0 0 0 0 0 0 0 0 0 0
[5Y - 10Y [ 0 0 0 0 0 0 0 0 0 0 0 0 0 0
[10Y - more 0 0 0 0 0 0 0 0 0 0 0 0 0 0
Tot 0 0 0 0 0 0 0 0 0 0 0 0 0 0[ 0 - 3M [ 0 0 0 0 0 0 0 0 0 0 0 0 0 0
[ 3M - 1Y [ 0 0 0 0 0 0 0 0 0 0 0 0 0 0
[ 1Y - 2Y [ 0 0 0 0 0 0 0 0 0 0 0 0 0 0
[ 2Y - 3Y [ 0 0 0 0 0 0 0 0 0 0 0 0 0 0
[3Y - 5Y [ 0 0 0 0 0 0 0 0 0 0 0 0 0 0
[5Y - 10Y [ 0 0 0 0 0 0 0 0 0 0 0 0 0 0
[10Y - more 0 0 0 0 0 0 0 0 0 0 0 0 0 0
Tot 0 0 0 0 0 0 0 0 0 0 0 0 0 0
[ 0 - 3M [ 0 0 0 0 0 0 0 0 0 0 0 0 0 0
[ 3M - 1Y [ 0 0 0 0 0 0 0 0 0 0 0 0 0 0
[ 1Y - 2Y [ 0 0 0 0 0 0 0 0 0 0 0 0 0 0
[ 2Y - 3Y [ 0 0 0 0 0 0 0 0 0 0 0 0 0 0
[3Y - 5Y [ 0 0 0 0 0 0 0 0 0 0 0 0 0 0
[5Y - 10Y [ 0 0 0 0 0 0 0 0 0 0 0 0 0 0
[10Y - more 0 0 0 0 0 0 0 0 0 0 0 0 0 0
Tot 0 0 0 0 0 0 0 0 0 0 0 0 0 0[ 0 - 3M [ 0 0 0 0 0 0 0 0 0 0 0 0 0 0
[ 3M - 1Y [ 0 0 0 0 0 0 0 0 0 0 0 0 0 0
[ 1Y - 2Y [ 0 0 0 0 0 0 0 0 0 0 0 0 0 0
[ 2Y - 3Y [ 0 0 0 0 0 0 0 0 0 0 0 0 0 0
[3Y - 5Y [ 0 0 0 0 0 0 0 0 0 0 0 0 0 0
[5Y - 10Y [ 0 0 0 0 0 0 0 0 0 0 0 0 0 0
[10Y - more 0 0 0 0 0 0 0 0 0 0 0 0 0 0
Tot 0 0 0 0 0 0 0 0 0 0 0 0 0 0
Spain
Sweden
United Kingdom
Australia
Canada
Hong Kong
Japan
U.S.
http://www.economiaciudadana.org/
2014 EU-wide Stress Test - Sovereign Exposure
(mln EUR)
Residual Maturity Country / Region
GROSS DIRECT LONG
EXPOSURES(accounting value gross
of provisions)
(1)
NET DIRECT POSITIONS (gross exposures (long) net of cash short
positions of sovereign debt to other counterpaties only where there
is a maturity matching)
(1)
DIRECT SOVEREIGN EXPOSURES IN DERIVATIVES (1)
of which: loans
and advances
of which: AFS
banking book
of which: FVO
(designated at fair
value through
profit&loss)
banking book
of which: Financial
assets held for
trading
(2)
Derivatives with positive fair value at
31/12/2013
Derivatives with negative fair value at
31/12/2013
Derivatives with positive fair value
at 31/12/2013
Derivatives with negative fair
value at 31/12/2013
VALUES AS OF 31/12/2013 VALUES AS OF 31/12/2013 VALUES AS OF 31/12/2013
INDIRECT SOVEREIGN EXPOSURES (3) (on and off balance sheet)
Fair-value at
31/12/2013 (+)Notional value
Fair-value at
31/12/2013 (-)Notional value
Fair-value at
31/12/2013 (+)Notional value
Fair-value at 31/12/2013
(-)Notional value
[ 0 - 3M [ 0 0 0 0 0 0 0 0 0 0 0 0 0 0[ 3M - 1Y [ 0 0 0 0 0 0 0 0 0 0 0 0 0 0
[ 1Y - 2Y [ 0 0 0 0 0 0 0 0 0 0 0 0 0 0
[ 2Y - 3Y [ 0 0 0 0 0 0 0 0 0 0 0 0 0 0
[3Y - 5Y [ 0 0 0 0 0 0 0 0 0 0 0 0 0 0
[5Y - 10Y [ 0 0 0 0 0 0 0 0 0 0 0 0 0 0
China

8/10/2019 Test Stress Banca Española 2014
http://slidepdf.com/reader/full/test-stress-banca-espanola-2014 156/240
[ [
[10Y - more 0 0 0 0 0 0 0 0 0 0 0 0 0 0
Tot 0 0 0 0 0 0 0 0 0 0 0 0 0 0
[ 0 - 3M [ 0 0 0 0 0 0 0 0 0 0 0 0 0 0
[ 3M - 1Y [ 0 0 0 0 0 0 0 0 0 0 0 0 0 0
[ 1Y - 2Y [ 0 0 0 0 0 0 0 0 0 0 0 0 0 0
[ 2Y - 3Y [ 0 0 0 0 0 0 0 0 0 0 0 0 0 0
[3Y - 5Y [ 0 0 0 0 0 0 0 0 0 0 0 0 0 0
[5Y - 10Y [ 0 0 0 0 0 0 0 0 0 0 0 0 0 0
[10Y - more 0 0 0 0 0 0 0 0 0 0 0 0 0 0
Tot 0 0 0 0 0 0 0 0 0 0 0 0 0 0[ 0 - 3M [ 0 0 0 0 0 0 0 0 0 0 0 0 0 0
[ 3M - 1Y [ 0 0 0 0 0 0 0 0 0 0 0 0 0 0
[ 1Y - 2Y [ 0 0 0 0 0 0 0 0 0 0 0 0 0 0
[ 2Y - 3Y [ 0 0 0 0 0 0 0 0 0 0 0 0 0 0
[3Y - 5Y [ 0 0 0 0 0 0 0 0 0 0 0 0 0 0
[5Y - 10Y [ 0 0 0 0 0 0 0 0 0 0 0 0 0 0
[10Y - more 0 0 0 0 0 0 0 0 0 0 0 0 0 0
Tot 0 0 0 0 0 0 0 0 0 0 0 0 0 0
[ 0 - 3M [ 0 0 0 0 0 0 0 0 0 0 0 0 0 0
[ 3M - 1Y [ 0 0 0 0 0 0 0 0 0 0 0 0 0 0
[ 1Y - 2Y [ 0 0 0 0 0 0 0 0 0 0 0 0 0 0
[ 2Y - 3Y [ 0 0 0 0 0 0 0 0 0 0 0 0 0 0
[3Y - 5Y [ 0 0 0 0 0 0 0 0 0 0 0 0 0 0
[5Y - 10Y [ 0 0 0 0 0 0 0 0 0 0 0 0 0 0
[10Y - more 0 0 0 0 0 0 0 0 0 0 0 0 0 0
Tot 0 0 0 0 0 0 0 0 0 0 0 0 0 0
Notes and definitions
(1) The exposures reported cover only exposures to central, regional and local governments on immediate borrower basis, and do not include exposures to other counterparts with full or partial government guarantees
(2) The banks disclose the exposures in the "Financial assets held for trading" portfolio after offsetting the cash short positions having the same maturities.
(3) The exposures reported include the positions towards counterparts (other than sovereign) on sovereign credit risk (i.e. CDS, financial guarantees) booked in all the accounting portfolio (on-off balance sheet).'Irrespective of the denomination and or accounting classification of the positions the economic substance over the form must be used as a criteria for the identification of the exposures to be included in this column. This item does not include exposures to counterparts (other than sovereign) with full or partial government guarantees by central, regional and local governments
Latin America and the
Caribbean
Africa
Others
Middle East
Switzerland
Other advanced economies
non EEA
Other Central and eastern
Europe countries non EEA
http://www.economiaciudadana.org/
2014 EU-wide Stress TestCapital
(mln EUR) CRR/ CRDIV DEFINITION OFCAPITAL Asof31/12/2013 Asof31/12/2014 Asof31/12/2015 Asof31/12/2016 Asof31/12/2014 Asof31/12/2015 Asof31/12/2016 COREP CODE REGULATION
A OWN FUNDS 1,930 2,176 2,377 2,359 1,752 1,699 1,662 C A 1 {1 } A rt ic le s 4 (1 18 ) a nd 7 2 of C RR
A.1COMMON EQUITYTIER 1CAPITAL(net ofdeductionsandafter applying
transitional adjustments)1,930 2,176 2,377 2,359 1,752 1,699 1,662 C A 1 {1 .1 .1 } A rt ic le 5 0 of C RR
A.1.1Capitalinstrumentseligible asCET1Capital(including share premium and net own
capitalinstruments)2,843 2,843 2,843 2,843 2,843 2,843 2,843 CA1 {1.1.1.1}
Articles 26(1) points (a) and(b), 27to29, 36(1) point (f)
and42ofCRR
A.1.1.1 Ofwhich: CET1instrumentssubscribed byGovernment 1,645 1,645 1,645 1,645 1,645 1,645 1,645 - -
A.1.2 Retained earnings -807 -579 -355 -349 -962 -979 -945 CA1 {1.1.1.2} Articles 26(1) point (c), 26(2) and36 (1) points (a) and(l)
ofCRR
A.1.3 Accumulated other comprehensive income -80 -66 -80 -89 -326 -248 -277 CA1 {1.1.1.3} Articles 4(100), 26(1) point (d) and 36 (1) point (l) of CRR
A.1.3.1 Ofwhich: arising from unrealised gains/lossesfrom Sovereign exposure in AFS
portfolio2 2 2 2 -252 -158 -176 - -
A.1.3.2 Ofwhich: arising from unrealised gains/lossesfrom the rest ofAFS portfolio -92 -73 -83 -89 -92 -114 -128 - -
A.1.4 Other Reserves 0 0 0 0 0 0 0 CA1 {1.1.1.4} Articles 4(117) and 26(1) point (e) of CRR
A.1.5 Fundsfor generalbanking risk 0 0 0 0 0 0 0 CA1 {1.1.1.5} Articles 4(112), 26(1) point (f) and 36 (1) point (l) of CRR
A.1.6 Minorityinterest given recognition in CET1capital 3 3 3 3 3 3 3 CA1 {1.1.1.7} Article 84 of CRR
A.1.7 AdjustmentstoCET1 due toprudentialfiltersexcluding those from unrealised
gains/lossesfrom AFS portfolio0 0 0 0 0 0 0 CA1 {1.1.1.9} Articles 32 to 35 of and 36 (1) point (l) of CRR
A.1.8 AdjustmentstoCET1 due toprudentialfiltersfrom unrealised gains/lossesfrom
Sovereign Exposure in AFS portfolio-2 -2 -2 -2 201 94 69 -
A.1.9 (-)Intangible assets(including Goodwill) -85 -81 -76 -71 -81 -76 -71CA1{1.1.1.10+
1.1.1.11}
Articles 4(113), 36(1) point (b) and37of CRR. Articles
4(115), 36(1) point (b) and37point (a) of CCR
A.1.10(-)DTAs that relyon future profitabilityand donot arise from temporary
differencesnet ofassociated DTLs-56 -56 -56 -56 -56 -56 -56 CA1 {1.1.1.12} Articles 36(1) point (c) and 38 of CRR
A.1.11 (-)IRB shortfallofcredit riskadjustmentsto expected losses 0 0 0 0 0 0 0 CA1 {1.1.1.13} Articles 36(1) point (d), 40 and 159 of CRR
A.1.12 (-)Defined benefit pension fund assets 0 0 0 0 0 0 0 CA1 {1.1.1.14} Articles 4(109), 36(1) point (e) and 41 of CRR
A.1.13 (-)Reciprocalcrossholdingsin CET1Capital 0 0 0 0 0 0 0 CA1 {1.1.1.15} Articles 4(122), 36(1) point (g) and 44 of CRR
A.1.14 (-)Excessdeduction from AT1itemsover AT1Capital 0 0 0 0 0 0 0 CA1 {1.1.1.16} Article 36(1) point (j) of CRR
Baseline Scenario Adverse Scenario
OWN FUNDS

8/10/2019 Test Stress Banca Española 2014
http://slidepdf.com/reader/full/test-stress-banca-espanola-2014 157/240
A.1.15(-)Deductionsrelated toassets which can alternativelybe subject toa 1.250%risk
weight0 0 0 0 0 0 0
CA1{1.1.1.17to
1.1.1.21}
Articles 4(36), 36(1) point (k) (i) and89to 91ofCRR;
Articles 36(1) point (k) (ii), 243(1) point (b), 244(1) point
(b) and258of CRR;Articles 36(1) point k) (iii) and379(3)
ofCRR;Art icles 36(1) point k) (iv) and153(8) ofCRRand
A.1.15.1 Ofwhich: from securitisation positions(-) 0 0 0 0 0 0 0 CA1 {1.1.1.18.1} Articles 36(1) point (k) (ii), 243(1) point (b), 244(1) point
(b) and258of CRR
A.1.16(-)Holdingsof CET1capitalinstrumentsof financialsector entitieswhere the
institiution does not have a significant investment-16 0 0 0 0 0 0 CA1 {1.1.1.22}
Articles 4(27), 36(1) point (h);43to46, 49(2) and (3) and
79ofCRR
A.1.17(-)Deductible DTAsthat rely on future profitabilityand arise from temporary
differences0 0 0 0 0 0 0 CA1 {1.1.1.23}
Articles 36(1) point (c) and38;Articles 48(1) point (a) and
48(2) ofCRR
A.1.18(-)Holdingsof CET1capitalinstrumentsof financialsector entitieswhere the
institiution has a significant investment0 0 0 0 0 0 0 CA1 {1.1.1.24}
Articles 4(27);36(1) point (i);43, 45;47; 48(1) point (b);
49(1) to(3) and79of CRR
A.1.19 (-)Amount exceding the 17.65%threshold 0 0 0 0 0 0 0 CA1 {1.1.1.25} Article 470 of CRR
A.1.20 Transitionaladjustments 130 114 100 81 130 119 96CA1{1.1.1.6+ 1.1.8+
1.1.26}-
A.1.20.1 Transitionaladjustmentsdue tograndfathered CET1Capitalinstruments(+/-) 0 0 0 0 0 0 0 CA1 {1.1.1.6}
Articles 483(1) to(3), and484to487of CRR
A.1.20.2 Transitionaladjustmentsdue toadditionalminorityinterests(+/-) 0 0 0 0 0 0 0 CA1 {1.1.1.8}
Articles 479and480of CRR
A.1.20.3Other transitionaladjustmentsto CET1Capitalexcl. adjustmentsfor Sovereign
exposure in AFS (+/-)130 114 100 81 130 119 96 CA1 {1.1.1.26}
Articles 469to472, 478and 481ofCRR
A.2 ADDITIONAL TIER 1CAPITAL (net ofdeductionsand after transitional
adjustments)0 0 0 0 0 0 0 C A 1 {1 .1 .2 } A rt ic le 6 1 of C RR
A.2.1 Ofwhich:(+) Other existing support government measures 0 0 0 0 0 0 0 - -
A.3 TIER1 CAPITAL(netofdeductionsandafter transitional adjustments) 1,930 2,176 2,377 2,359 1,752 1,699 1,662 C A1 { 1. 1} A rt ic le 2 5 of C RR
A.4 TIER2 CAPITAL(netofdeductionsandafter transitional adjustments) 0 0 0 0 0 0 0 C A1 { 1. 2} A rt ic le 7 1 of C RR
B T OT AL R IS K EX PO SU RE A M OU NT 21,419 21,135 20,881 20,471 21,237 20,942 20,555 C A 2 {1 } A rt ic le s 92 (3 ), 95 , 96 a n d 98 o f CR R
B.1ofwhich:stemming from exposuresthat fallbelow the 10%/ 15%limitsfor
CET1deduction (+)66 0 0 0 0 0 0
Articles 36(1) points (a) and(i);Article 38a ndArticle 48of
CRR
B. 2 ofwh ich :s temmi ng f r om fr om CVAcap ita l r eq ui r ements (+) 96 0 0 0 0 0 0 Article 381to386 ofCRR
B.3ofwhich:stemming from higher asset correlation parameter against exposures
tolarge financialinstitutionsunder IRB the IRB approachesto credit risk(+)0 0 0 0 0 0 0 Articles 153(2) ofCRR
B.4ofwhich:stemming from the application ofthe supporting factor to increase
lending toSMEs(-)-448 0 0 0 0 0 0 Recital (44) ofCRR
B.5
ofwhich:stemming from the effect of exposuresthat were previouslypart of
RiskExposure amount and receive a deduction treatment under CRR/CRDIV (-
)
0 0 0 0 0 0 0 -
B.6 ofwhich:otherssubject tothe discretion ofNationalCompetent Authorities 0 0 0 0 0 0 0 Article 124to164 ofCRR
C.1 Co mm onE q ui tyTi er 1Cap i tal r ati o 9.01% 10.30% 11.39% 11.52% 8.25% 8.11% 8.09% CA3 {1} -
C .2 T ie r 1 C ap it al ra ti o 9.01% 10.30% 11.39% 11.52% 8.25% 8.11% 8.09% CA3 { 3} -
C .3 T ot al C ap it al r at io 9.01% 10.30% 11.39% 11.52% 8.25% 8.11% 8.09% CA3 { 5} -
D Co mm onE q ui tyTi er 1Cap i tal Thresho ld 1,691 1,670 1,638 1,168 1,152 1,131
ETotalamount of instrumentswith mandatoryconversion intoordinarysharesupon
a fixed date in the 2014 -2016period (cumulative conversions)(1)0 0 0 0 0 0
F
TotalAdditionalTier 1and Tier 2 instrumentseligible asregulatorycapitalunder
the CRR provisionsthat convert into Common EquityTier 1or are written down
upon a trigger event (2)
0 0 0
F.1Ofwhich: eligible instrumentswhose trigger isabove CET1capitalratio in the
adverse scenario(2)0 0 0
G FullyLoadedCommonEquityTier 1Capital ratio (3) 11.13% 7.62%
(1)Conversionsnot considered for CET1 computation (2)Excluding instrumentsincluded in E (3)Memorandum item based on a fullyimplemented CRR/CRD IV definition of Common EquityTier 1 capitalincluding 60%ofunrealised gains/lossesfrom Sovereign Exposure in AFS portfolio
Memorandumitems
OWN FUNDS
REQUIREMENTS
CAPITALRATIOS(%) -
Transitional period
http://www.economiaciudadana.org/
2014 EU-wide Stress Test - Restructuring scenarios
(mln EUR)
2013 0 0
2014 39 -541 23 -610
- Reduction of the Loan book size and the Balance sheet size pursuant to the
Term Sheet commitments
- Subsidiaries Portfolio divestment meeting the Term Sheet commitments
- Projections of the balance sheet items in line with those foreseen in the
Restructuring Plan timeline
- Reduction of branches, FTEs and staff expenses in line with the calendar
execution included in the Restructuring Plan- Projection of P&L positions in line with the methodology for banks exempted
from the static balance sheet assumption
- Reduction of the Loan book size and the Balance sheet size pursuant to the
T Sh t it t
Effects of mandatory restructuring plans publicly announced before 31 December 2013 and formally agreed with the European Commission.
Baseline scenario Adverse scenarioNarrative description of the transactions. (type, date of
completion/commitment, portfolios, subsidiaries, branches)CET1 impact
Risk exposure
amount impactCET1 impact
Risk exposure
amount impact
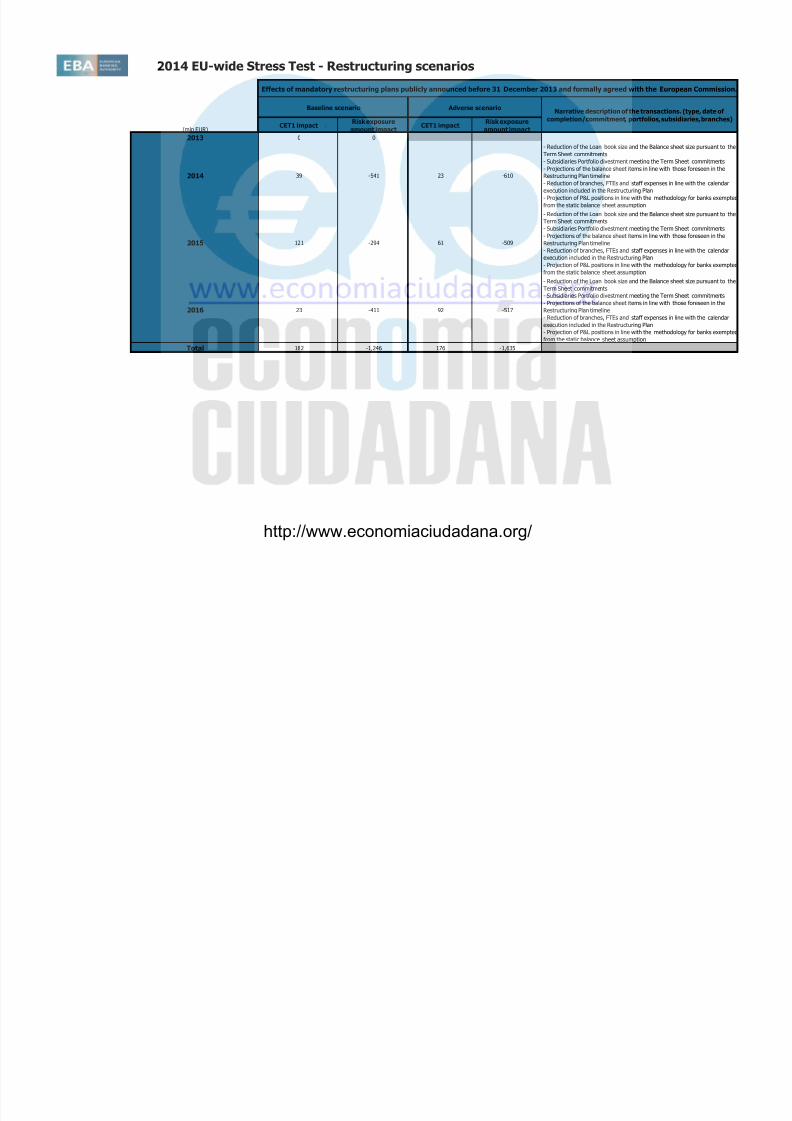
8/10/2019 Test Stress Banca Española 2014
http://slidepdf.com/reader/full/test-stress-banca-espanola-2014 158/240
2015 121 -294 61 -509
Term Sheet commitments
- Subsidiaries Portfolio divestment meeting the Term Sheet commitments
- Projections of the balance sheet items in line with those foreseen in the
Restructuring Plan timeline
- Reduction of branches, FTEs and staff expenses in line with the calendar
execution included in the Restructuring Plan
- Projection of P&L positions in line with the methodology for banks exempted
from the static balance sheet assumption
2016 23 -411 92 -517
- Reduction of the Loan book size and the Balance sheet size pursuant to the
Term Sheet commitments
- Subsidiaries Portfolio divestment meeting the Term Sheet commitments
- Projections of the balance sheet items in line with those foreseen in the
Restructuring Plan timeline
- Reduction of branches, FTEs and staff expenses in line with the calendar
execution included in the Restructuring Plan
- Projection of P&L positions in line with the methodology for banks exemptedfrom the static balance sheet assumption
Total 182 -1,246 176 -1,635
http://www.economiaciudadana.org/
2014 EU-wide Stress Test
Outcome of the Stress Test based on the Restructuring plan for banks whose plan was formally agreed with the European Commission after 31 December 2013
(mln EUR)
As of
31/12/2013
As of
31/12/2014
As of
31/12/2015
As of
31/12/2016
As of
31/12/2014
As of
31/12/2015
As of
31/12/2016
COMMON EQUITY TIER 1 CAPITAL (net of deductions and after applying transitional adjustments)
TOTAL RISK EXPOSURE AMOUNT
COMMON EQUITY TIER 1 RATIO #DIV/0! #DIV/0! #DIV/0! #DIV/0! #DIV/0! #DIV/0! #DIV/0!
Baseline scenario Adverse scenario

8/10/2019 Test Stress Banca Española 2014
http://slidepdf.com/reader/full/test-stress-banca-espanola-2014 159/240
http://www.economiaciudadana.org/

8/10/2019 Test Stress Banca Española 2014
http://slidepdf.com/reader/full/test-stress-banca-espanola-2014 160/240
Bank Name ES - Caja de Ahorros y M.P. de Zaragoza, Aragón y Rioja
LEI Code 549300OLBL49CW8CT155
ES
2014 EU-wide Stress Test

8/10/2019 Test Stress Banca Española 2014
http://slidepdf.com/reader/full/test-stress-banca-espanola-2014 161/240
NUK_WL_NR_XX
version
1809014
No restructuring
http://www.economiaciudadana.org/

8/10/2019 Test Stress Banca Española 2014
http://slidepdf.com/reader/full/test-stress-banca-espanola-2014 162/240
2014 EU-wide Stress TestCredit Risk
(mln EUR, %)
Non-defaulted Defaulted Non-defaulted Defaulted Non-defaulted Defaulted Non-defaulted Defaulted Non-defaulted Defaulted Non-defaulted Defaulted Non-defaulted Defaulted Non-defaulted Defaulted Non-defaulted Defaulted Impairmentrate
Stockof Provisions
Coverage Ratio -Default Stock
Impairmentrate
Stockof Provisions
CoverageRatio -Default
Stock
Impairmentrate
Stockof Provisions
CoverageRatio -Default
Stock
Impairment rateStockof
Provisions
CoverageRatio -Default
Stock
Impairmentrate
Stockof Provisions
CoverageRatio -Default
Stock
Impairmentrate
Stockof Provisions
CoverageRatio -Default
Stock
Central banksandcentral governments 0 0 0 0 10,757 5 0 0 0 0 170 7 0 0 0 0 0 0 0.00% 0 0.01% 0.00% 0 0.01% 0.00% 0 0.01% 1.52% 142 0.01% 0.91% 227 0.01% 0.61% 284 0.01%Institutions 0 0 0 0 4,634 4 0 0 0 0 725 4 0 0 0 0 0 19 0.03% 3 29.88% 0.03% 4 29.65% 0.03% 5 29.53% 0.09% 5 29.50% 0.07% 8 29.36% 0.06% 11 29.30%Corporates 0 0 0 0 4,771 1,077 0 0 0 0 3,895 1,122 0 0 0 0 303 1,494 1.70% 1,878 54.75% 1.70% 1,956 52.77% 1.56% 2,024 51.44% 2.35% 1,910 53.84% 3.15% 2,052 50.97% 3.17% 2,179 49.05%
Corporates - OfWhich:SpecialisedLending 0 0 0 0 59 1 0 0 0 0 59 1 0 0 0 0 0 36 3.66% 38 85.11% 3.78% 40 77.48% 3.63% 42 72.54% 4.59% 39 85.00% 6.14% 42 75.78% 6.29% 45 70.27%Corporates -OfWhich: SME 0 0 0 0 3,183 713 0 0 0 0 2,602 752 0 0 0 0 200 972 2.25% 1,248 55.21% 2.24% 1,319 53.80% 2.06% 1,379 52.89% 3.13% 1,278 54.55% 4.16% 1,405 52.51% 4.19% 1,518 51.11%
Retail 0 0 0 0 26,728 1,017 0 0 0 0 11,116 936 0 0 0 0 86 515 0.24% 663 28.87% 0.20% 715 26.64% 0.16% 758 25.42% 0.38% 702 28.71% 0.43% 813 26.20% 0.42% 920 24.66%Retail -Securedon real estateproperty 58.5% 0 0 0 0 22,777 932 0 0 0 0 8,286 841 0 0 0 0 17 202 0.13% 248 15.51% 0.09% 269 14.39% 0.07% 285 13.75% 0.24% 273 15.90% 0.23% 325 14.86% 0.23% 376 14.22%
Retail -Securedon real estate property-Of h i h : S E
47.7% 0 0 0 0 777 126 0 0 0 0 262 124 0 0 0 0 2 40 0.42% 46 22.68% 0.26% 48 21.92% 0.19% 49 21.46% 1.14% 51 22.21% 1.14% 60 21.06% 1.14% 67 20.32%Retail -Securedon real estate property-Of
h i h: n n - E59.0% 0 0 0 0 22,000 806 0 0 0 0 8,024 716 0 0 0 0 15 162 0.12% 202 14.44% 0.09% 222 13.37% 0.07% 236 12.77% 0.20% 222 14.88% 0.20% 266 13.92% 0.20% 309 13.33%
Retail -QualifyingRevolving 0 0 0 0 149 0 0 0 0 0 112 0 0 0 0 0 0 6 0.34% 7 86.13% 0.22% 7 80.86% 0.18% 7 77.36% 0.55% 7 83.94% 0.55% 8 75.67% 0.55% 9 70.15%Retail -OtherRetail 0 0 0 0 3,803 84 0 0 0 0 2,719 96 0 0 0 0 68 306 0.88% 409 66.95% 0.81% 439 60.71% 0.73% 466 56.79% 1.21% 421 66.39% 1.57% 480 58.51% 1.57% 536 53.92%
Retail -OtherRetail -OfWhich:SME 0 0 0 0 1,619 45 0 0 0 0 1,095 50 0 0 0 0 37 145 1.46% 206 63.29% 1.52% 230 56.26% 1.44% 252 52.20% 1.90% 213 63.79% 2.76% 257 55.66% 2.85% 298 51.51%Retail -OtherRetail -OfWhich:non-SME 0 0 0 0 2,184 40 0 0 0 0 1,624 46 0 0 0 0 31 162 0.44% 202 71.02% 0.29% 209 66.50% 0.24% 214 63.44% 0.70% 208 69.21% 0.70% 223 62.19% 0.70% 238 57.37%
Equity 0 0 0 0 1,200 0 0 0 0 0 1,614 0 0 0 0 0 326 0 0.00% 82 - 0.00% 82 - 0.00% 82 - 0.00% 82 - 0.00% 82 - 0.00% 82 -Securitisation 0 0 0 0 2,093 0 0 0 0 0 1,111 0 0 0 0 0 12 0Othernon-credit obligation assets 0 0 0 0 2,451 773 0 0 0 0 2,615 790 0 0 0 0 78 532TOTAL 0 0 0 0 52,635 2,875 0 0 0 0 21,247 2,859 0 0 0 0 806 2,560 0.33% 2,625 44.09% 0.29% 2,757 41.52% 0.25% 2,868 39.95% 0.80% 2,840 43.31% 0.77% 3,182 39.94% 0.68% 3,475 37.70%Securitisation andre-securitisations positions deductedfrom capital * 0 0 0 0 21 0 0 0 0 0 0 0
(mln EUR, %)Non-defaulted Defaulted Non-defaulted Defaulted Non-defaulted Defaulted Non-defaulted Defaulted Non-defaulted Defaulted Non-defaulted Defaulted Non-defaulted Defaulted Non-defaulted Defaulted Non-defaulted Defaulted Impairment
rateStockof
ProvisionsCoverage Ratio -
Default Stock
Impairmentrate
Stockof Provisions
Coverage
Ratio -Default
Stock
Impairmentrate
Stockof Provisions
Coverage
Ratio -Default
Stock
Impairment rateStockof
Provisions
Coverage
Ratio -Default
Stock
Impairmentrate
Stockof Provisions
Coverage
Ratio -Default
Stock
Impairmentrate
Stockof Provisions
Coverage
Ratio -Default
Stock
Central banksandcentral governments 0 0 0 0 10,348 5 0 0 0 0 170 7 0 0 0 0 0 0 0.00% 0 0.01% 0.00% 0 0.01% 0.00% 0 0.01% 1.59% 142 0.01% 0.95% 227 0.01% 0.64% 284 0.01%Institutions 0 0 0 0 4,539 4 0 0 0 0 700 4 0 0 0 0 0 1 0.03% 3 29.88% 0.03% 4 29.65% 0.03% 5 29.53% 0.09% 5 29.51% 0.07% 8 29.36% 0.06% 11 29.30%Corporates 0 0 0 0 4,682 1,077 0 0 0 0 3,817 1,122 0 0 0 0 303 1,478 1.70% 1,855 54.48% 1.69% 1,933 52.53% 1.56% 2,000 51.22% 2.35% 1,888 53.57% 3.15% 2,028 50.74% 3.17% 2,154 48.85%
Corporates - OfWhich:SpecialisedLending 0 0 0 0 57 1 0 0 0 0 57 1 0 0 0 0 0 36 3.66% 38 85.53% 3.78% 40 78.08% 3.63% 42 73.22% 4.59% 39 85.42% 6.14% 42 76.40% 6.29% 44 70.95%Corporates -OfWhich: SME 0 0 0 0 3,175 713 0 0 0 0 2,594 752 0 0 0 0 200 960 2.24% 1,229 54.79% 2.23% 1,299 53.41% 2.05% 1,359 52.52% 3.12% 1,258 54.14% 4.15% 1,385 52.14% 4.18% 1,497 50.78%
Retail 0 0 0 0 26,642 1,009 0 0 0 0 11,083 932 0 0 0 0 85 510 0.24% 641 28.27% 0.20% 693 26.10% 0.16% 735 24.93% 0.38% 679 28.14% 0.43% 790 25.74% 0.42% 897 24.27%Retail -Securedon real estateproperty 58.8% 0 0 0 0 22,695 925 0 0 0 0 8,256 836 0 0 0 0 17 198 0.13% 236 14.95% 0.09% 257 13.90% 0.07% 273 13.31% 0.24% 261 15.38% 0.23% 313 14.46% 0.23% 364 13.88%
Retail -Securedon real estate property-Of h i h : S E
48.0% 0 0 0 0 777 126 0 0 0 0 262 124 0 0 0 0 2 40 0.42% 40 20.31% 0.26% 42 19.72% 0.19% 43 19.35% 1.14% 45 20.15% 1.14% 54 19.37% 1.14% 61 18.87%Retail -Securedon real estate property-Of
h i h: n n - E59.2% 0 0 0 0 21,919 798 0 0 0 0 7,994 712 0 0 0 0 15 157 0.12% 197 14.17% 0.09% 216 13.13% 0.07% 230 12.55% 0.20% 216 14.63% 0.20% 260 13.72% 0.20% 303 13.16%
Retail -QualifyingRevolving 0 0 0 0 149 0 0 0 0 0 112 0 0 0 0 0 0 6 0.34% 7 86.15% 0.22% 7 80.86% 0.18% 7 77.36% 0.55% 7 83.95% 0.55% 8 75.67% 0.55% 8 70.14%Retail -OtherRetail 0 0 0 0 3,798 84 0 0 0 0 2,715 95 0 0 0 0 68 306 0.88% 398 66.52% 0.81% 428 60.27% 0.73% 455 56.35% 1.21% 411 65.97% 1.56% 469 58.09% 1.57% 525 53.54%
Retail -OtherRetail -OfWhich:SME 0 0 0 0 1,619 45 0 0 0 0 1,095 50 0 0 0 0 37 145 1.46% 196 62.36% 1.52% 220 55.36% 1.45% 242 51.36% 1.90% 204 62.91% 2.76% 247 54.87% 2.85% 288 50.82%Retail -OtherRetail -OfWhich:non-SME 0 0 0 0 2,179 39 0 0 0 0 1,620 46 0 0 0 0 31 161 0.44% 202 70.98% 0.29% 208 66.46% 0.24% 213 63.41% 0.70% 207 69.18% 0.70% 222 62.16% 0.70% 237 57.34%
Equity 0 0 0 0 1,117 0 0 0 0 0 1,493 0 0 0 0 0 318 0 0.00% 82 - 0.00% 82 - 0.00% 82 - 0.00% 82 - 0.00% 82 - 0.00% 82 -Securitisation 0 0 0 0 2,093 0 0 0 0 0 1,111 0 0 0 0 0 12 0Othernon-credit obligation assets 0 0 0 0 2,451 773 0 0 0 0 2,615 790 0 0 0 0 78 532
TOTAL 0 0 0 0 51,871 2,868 0 0 0 0 20,990 2,855 0 0 0 0 797 2,521 0.33% 2,581 43.74% 0.30% 2,711 41.19% 0.26% 2,822 39.65% 0.81% 2,796 42.96% 0.78% 3,135 39.64% 0.69% 3,427 37.43%Securitisation andre-securitisations positions deductedfrom capital * 0 0 0 0 21 0 0 0 0 0 0 0
(mln EUR, %)Non-defaulted Defaulted Non-defaulted Defaulted Non-defaulted Defaulted Non-defaulted Defaulted Non-defaulted Defaulted Non-defaulted Defaulted Non-defaulted Defaulted Non-defaulted Defaulted Non-defaulted Defaulted Impairment
rateStockof
ProvisionsCoverage Ratio -
Default Stock
Impairmentrate
Stockof Provisions
Coverage
Ratio -Default
Stock
Impairmentrate
Stockof Provisions
Coverage
Ratio -Default
Stock
Impairment rateStockof
Provisions
Coverage
Ratio -Default
Stock
Impairmentrate
Stockof Provisions
Coverage
Ratio -Default
Stock
Impairmentrate
Stockof Provisions
Coverage
Ratio -Default
Stock
Central banksandcentral governments 0 0 0 0 0 0 0 0 0 0 0 0 0 0 0 0 0 0 - 0 - - 0 - - 0 - - 0 - - 0 - - 0 -Institutions 0 0 0 0 0 0 0 0 0 0 0 0 0 0 0 0 0 0 0 0 0 0 0 0
Risk exposureamounts(asof31/12/2013)
Baseline Scenario Adverse ScenarioF-IRB A-IRB STA F-IRB A-IRB STA F-IRB A-IRB STA as of 31/12/2014 as of 31/12/2015 as of 31/12/2016 as of 31/12/2014 as of 31/12/2015 as of 31/12/2016
asof31/12/2016
Spain
LTV %(asof 31/12/2013)
E xp os ur ev al ue s( as of 3 1/ 12 /2 01 3) R is k e xp os ur e am ou nt s (a so f3 1/ 12 /2 01 3) V al ue ad ju st me nt s an dp ro vi si on s( as of 3 1/ 12 /2 01 3)
AdverseScenarioF-IRB A-IRB STA F-IRB A-IRB STA F-IRB A-IRB STA as of 31/12/2014 as of 31/12/2015 as of 31/12/2016 as of 31/12/2014 as of 31/12/2015 as of 31/12/2016LTV %(asof
31/12/2013)
Exposurevalues(asof31/12/2013)
ES - Caja de Ahorros y M.P. deZaragoza, Aragón y Rioja
(*)Referstothepart ofSecuritizationexposurethat isdeductedfrom capital andisnot includedinRWA
Valueadjustmentsandprovisions(asof 31/12/2013) BaselineScenario
LTV %(asof 31/12/2013)
Exposure values (as of 31/12/2013) Risk exposure amounts (as of 31/12/2013) Value adjustments and provisions (as of 31/12/2013) Adverse Scenario
F-IRB A-IRB STA F-IRB A-IRB STA F-IRB A-IRB STA
BaselineScenario
as of 31/12/2014 as of 31/12/2015 as of 31/12/2016 as of 31/12/2014 as of 31/12/2015
(*)Referstothepart ofSecuritizationexposurethat isdeductedfrom capital andisnot includedinRWA
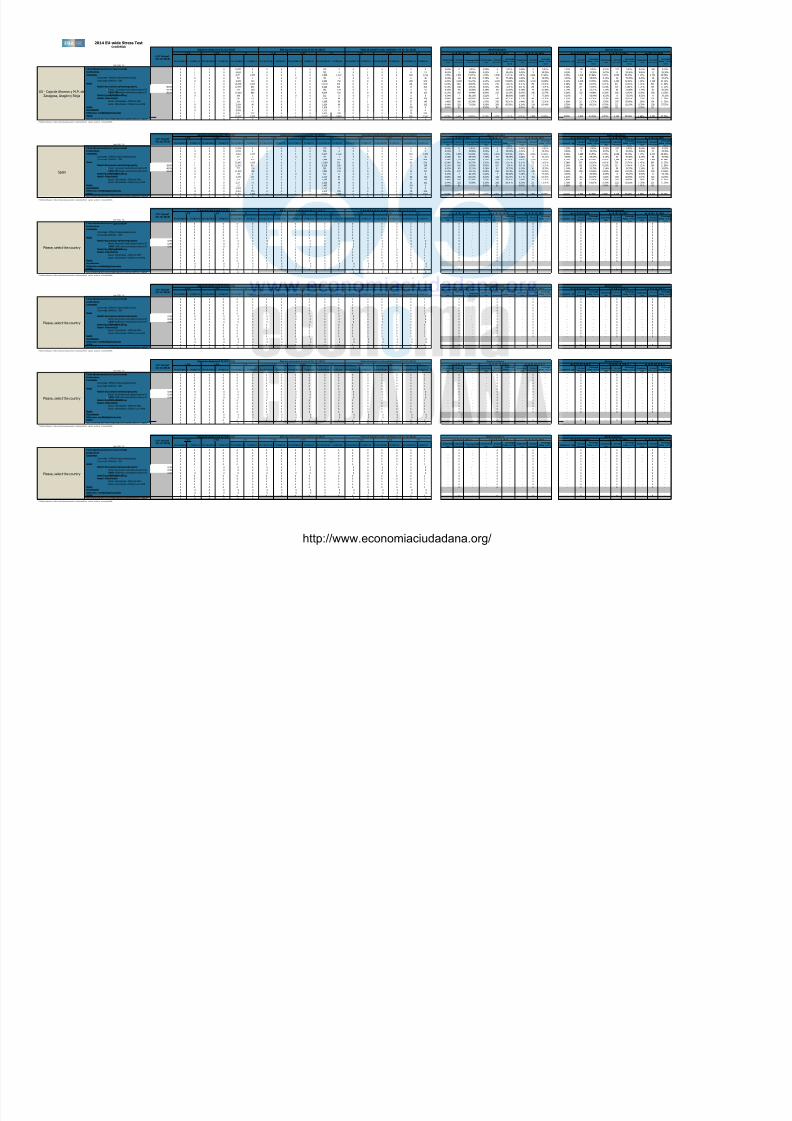
8/10/2019 Test Stress Banca Española 2014
http://slidepdf.com/reader/full/test-stress-banca-espanola-2014 163/240
Institutions 0 0 0 0 0 0 0 0 0 0 0 0 0 0 0 0 0 0 - 0 - - 0 - - 0 - - 0 - - 0 - - 0 -Corporates 0 0 0 0 0 0 0 0 0 0 0 0 0 0 0 0 0 0 - 0 - - 0 - - 0 - - 0 - - 0 - - 0 -
Corporates - OfWhich:SpecialisedLending 0 0 0 0 0 0 0 0 0 0 0 0 0 0 0 0 0 0 - 0 - - 0 - - 0 - - 0 - - 0 - - 0 -Corporates -OfWhich: SME 0 0 0 0 0 0 0 0 0 0 0 0 0 0 0 0 0 0 - 0 - - 0 - - 0 - - 0 - - 0 - - 0 -
Retail 0 0 0 0 0 0 0 0 0 0 0 0 0 0 0 0 0 0 - 0 - - 0 - - 0 - - 0 - - 0 - - 0 -Retail -Securedon real estateproperty 0.0% 0 0 0 0 0 0 0 0 0 0 0 0 0 0 0 0 0 0 - 0 - - 0 - - 0 - - 0 - - 0 - - 0 -
Retail -Securedon real estate property-Of hi h: E
0.0% 0 0 0 0 0 0 0 0 0 0 0 0 0 0 0 0 0 0 - 0 - - 0 - - 0 - - 0 - - 0 - - 0 -Retail -Securedon real estate property-Of
h i h : n n -S E0.0% 0 0 0 0 0 0 0 0 0 0 0 0 0 0 0 0 0 0 - 0 - - 0 - - 0 - - 0 - - 0 - - 0 -
Retail -QualifyingRevolving 0 0 0 0 0 0 0 0 0 0 0 0 0 0 0 0 0 0 - 0 - - 0 - - 0 - - 0 - - 0 - - 0 -Retail -OtherRetail 0 0 0 0 0 0 0 0 0 0 0 0 0 0 0 0 0 0 - 0 - - 0 - - 0 - - 0 - - 0 - - 0 -
Retail -OtherRetail -OfWhich:SME 0 0 0 0 0 0 0 0 0 0 0 0 0 0 0 0 0 0 - 0 - - 0 - - 0 - - 0 - - 0 - - 0 -Retail -OtherRetail -OfWhich:non-SME 0 0 0 0 0 0 0 0 0 0 0 0 0 0 0 0 0 0 - 0 - - 0 - - 0 - - 0 - - 0 - - 0 -
Equity 0 0 0 0 0 0 0 0 0 0 0 0 0 0 0 0 0 0 - 0 - - 0 - - 0 - - 0 - - 0 - - 0 -Securitisation 0 0 0 0 0 0 0 0 0 0 0 0 0 0 0 0 0 0Othernon-credit obligation assets 0 0 0 0 0 0 0 0 0 0 0 0 0 0 0 0 0 0TOTAL 0 0 0 0 0 0 0 0 0 0 0 0 0 0 0 0 0 0 - 0 - - 0 - - 0 - - 0 - - 0 - - 0 -Securitisation andre-securitisations positions deductedfrom capital * 0 0 0 0 0 0 0 0 0 0 0 0
(mln EUR, %)Non-defaulted Defaulted Non-defaulted Defaulted Non-defaulted Defaulted Non-defaulted Defaulted Non-defaulted Defaulted Non-defaulted Defaulted Non-defaulted Defaulted Non-defaulted Defaulted Non-defaulted Defaulted
Impairmentrate
Stockof Provisions
Coverage Ratio -
Default Stock
Impairmentrate
Stockof Provisions
Coverage
Ratio -DefaultStock
Impairmentrate
Stockof Provisions
Coverage
Ratio -DefaultStock
Impairment rateStockof
Provisions
Coverage
Ratio -DefaultStock
Impairmentrate
Stockof Provisions
Coverage
Ratio -DefaultStock
Impairmentrate
Stockof Provisions
Coverage
Ratio -DefaultStock
Central banksandcentral governments 0 0 0 0 0 0 0 0 0 0 0 0 0 0 0 0 0 0 - 0 - - 0 - - 0 - - 0 - - 0 - - 0 -Institutions 0 0 0 0 0 0 0 0 0 0 0 0 0 0 0 0 0 0 - 0 - - 0 - - 0 - - 0 - - 0 - - 0 -Corporates 0 0 0 0 0 0 0 0 0 0 0 0 0 0 0 0 0 0 - 0 - - 0 - - 0 - - 0 - - 0 - - 0 -
Corporates - OfWhich:SpecialisedLending 0 0 0 0 0 0 0 0 0 0 0 0 0 0 0 0 0 0 - 0 - - 0 - - 0 - - 0 - - 0 - - 0 -Corporates -OfWhich: SME 0 0 0 0 0 0 0 0 0 0 0 0 0 0 0 0 0 0 - 0 - - 0 - - 0 - - 0 - - 0 - - 0 -
Retail 0 0 0 0 0 0 0 0 0 0 0 0 0 0 0 0 0 0 - 0 - - 0 - - 0 - - 0 - - 0 - - 0 -Retail -Securedon real estateproperty 0.0% 0 0 0 0 0 0 0 0 0 0 0 0 0 0 0 0 0 0 - 0 - - 0 - - 0 - - 0 - - 0 - - 0 -
Retail -Securedon real estate property-Of hi h: E
0.0% 0 0 0 0 0 0 0 0 0 0 0 0 0 0 0 0 0 0 - 0 - - 0 - - 0 - - 0 - - 0 - - 0 -Retail -Securedon real estate property-Of
h i h: n n - E0.0% 0 0 0 0 0 0 0 0 0 0 0 0 0 0 0 0 0 0 - 0 - - 0 - - 0 - - 0 - - 0 - - 0 -
Retail -QualifyingRevolving 0 0 0 0 0 0 0 0 0 0 0 0 0 0 0 0 0 0 - 0 - - 0 - - 0 - - 0 - - 0 - - 0 -Retail -OtherRetail 0 0 0 0 0 0 0 0 0 0 0 0 0 0 0 0 0 0 - 0 - - 0 - - 0 - - 0 - - 0 - - 0 -
Retail -OtherRetail -OfWhich:SME 0 0 0 0 0 0 0 0 0 0 0 0 0 0 0 0 0 0 - 0 - - 0 - - 0 - - 0 - - 0 - - 0 -Retail -OtherRetail -OfWhich:non-SME 0 0 0 0 0 0 0 0 0 0 0 0 0 0 0 0 0 0 - 0 - - 0 - - 0 - - 0 - - 0 - - 0 -
Equity 0 0 0 0 0 0 0 0 0 0 0 0 0 0 0 0 0 0 - 0 - - 0 - - 0 - - 0 - - 0 - - 0 -Securitisation 0 0 0 0 0 0 0 0 0 0 0 0 0 0 0 0 0 0Othernon-credit obligation assets 0 0 0 0 0 0 0 0 0 0 0 0 0 0 0 0 0 0TOTAL 0 0 0 0 0 0 0 0 0 0 0 0 0 0 0 0 0 0 - 0 - - 0 - - 0 - - 0 - - 0 - - 0 -Securitisation andre-securitisations positions deductedfrom capital * 0 0 0 0 0 0 0 0 0 0 0 0
(mln EUR, %)Non-defaulted Defaulted Non-defaulted Defaulted Non-defaulted Defaulted Non-defaulted Defaulted Non-defaulted Defaulted Non-defaulted Defaulted Non-defaulted Defaulted Non-defaulted Defaulted Non-defaulted Defaulted
Impairmentrate
Stockof Provisions
Coverage Ratio -
Default Stock
Impairmentrate
Stockof Provisions
Coverage
Ratio -DefaultStock
Impairmentrate
Stockof Provisions
Coverage
Ratio -DefaultStock
Impairment rateStockof
Provisions
Coverage
Ratio -DefaultStock
Impairmentrate
Stockof Provisions
Coverage
Ratio -DefaultStock
Impairmentrate
Stockof Provisions
Coverage
Ratio -DefaultStock
Central banksandcentral governments 0 0 0 0 0 0 0 0 0 0 0 0 0 0 0 0 0 0 - 0 - - 0 - - 0 - - 0 - - 0 - - 0 -Institutions 0 0 0 0 0 0 0 0 0 0 0 0 0 0 0 0 0 0 - 0 - - 0 - - 0 - - 0 - - 0 - - 0 -Corporates 0 0 0 0 0 0 0 0 0 0 0 0 0 0 0 0 0 0 - 0 - - 0 - - 0 - - 0 - - 0 - - 0 -
Corporates - OfWhich:SpecialisedLending 0 0 0 0 0 0 0 0 0 0 0 0 0 0 0 0 0 0 - 0 - - 0 - - 0 - - 0 - - 0 - - 0 -Corporates -OfWhich: SME 0 0 0 0 0 0 0 0 0 0 0 0 0 0 0 0 0 0 - 0 - - 0 - - 0 - - 0 - - 0 - - 0 -
Retail 0 0 0 0 0 0 0 0 0 0 0 0 0 0 0 0 0 0 - 0 - - 0 - - 0 - - 0 - - 0 - - 0 -Retail -Securedon real estateproperty 0.0% 0 0 0 0 0 0 0 0 0 0 0 0 0 0 0 0 0 0 - 0 - - 0 - - 0 - - 0 - - 0 - - 0 -
Retail -Securedon real estate property-Of hi h: E
0.0% 0 0 0 0 0 0 0 0 0 0 0 0 0 0 0 0 0 0 - 0 - - 0 - - 0 - - 0 - - 0 - - 0 -Retail -Securedon real estate property-Of
h i h : n n -S E0.0% 0 0 0 0 0 0 0 0 0 0 0 0 0 0 0 0 0 0 - 0 - - 0 - - 0 - - 0 - - 0 - - 0 -
Retail -QualifyingRevolving 0 0 0 0 0 0 0 0 0 0 0 0 0 0 0 0 0 0 - 0 - - 0 - - 0 - - 0 - - 0 - - 0 -Retail -OtherRetail 0 0 0 0 0 0 0 0 0 0 0 0 0 0 0 0 0 0 - 0 - - 0 - - 0 - - 0 - - 0 - - 0 -
Retail -OtherRetail -OfWhich:SME 0 0 0 0 0 0 0 0 0 0 0 0 0 0 0 0 0 0 - 0 - - 0 - - 0 - - 0 - - 0 - - 0 -Retail -OtherRetail -OfWhich:non-SME 0 0 0 0 0 0 0 0 0 0 0 0 0 0 0 0 0 0 - 0 - - 0 - - 0 - - 0 - - 0 - - 0 -
Equity 0 0 0 0 0 0 0 0 0 0 0 0 0 0 0 0 0 0 - 0 - - 0 - - 0 - - 0 - - 0 - - 0 -Securitisation 0 0 0 0 0 0 0 0 0 0 0 0 0 0 0 0 0 0Othernon-credit obligation assets 0 0 0 0 0 0 0 0 0 0 0 0 0 0 0 0 0 0TOTAL 0 0 0 0 0 0 0 0 0 0 0 0 0 0 0 0 0 0 - 0 - - 0 - - 0 - - 0 - - 0 - - 0 -Securitisation andre-securitisations positions deductedfrom capital * 0 0 0 0 0 0 0 0 0 0 0 0
(mln EUR, %)Non-defaulted Defaulted Non-defaulted Defaulted Non-defaulted Defaulted Non-defaulted Defaulted Non-defaulted Defaulted Non-defaulted Defaulted Non-defaulted Defaulted Non-defaulted Defaulted Non-defaulted Defaulted
Impairmentrate
Stockof Provisions
Coverage Ratio -Default Stock
Impairmentrate
Stockof Provisions
Coverage
Ratio -DefaultStock
Impairmentrate
Stockof Provisions
Coverage
Ratio -DefaultStock
Impairment rateStockof
Provisions
Coverage
Ratio -DefaultStock
Impairmentrate
Stockof Provisions
Coverage
Ratio -DefaultStock
Impairmentrate
Stockof Provisions
Coverage
Ratio -DefaultStock
Central banksandcentral governments 0 0 0 0 0 0 0 0 0 0 0 0 0 0 0 0 0 0 - 0 - - 0 - - 0 - - 0 - - 0 - - 0 -Institutions 0 0 0 0 0 0 0 0 0 0 0 0 0 0 0 0 0 0 - 0 - - 0 - - 0 - - 0 - - 0 - - 0 -Corporates 0 0 0 0 0 0 0 0 0 0 0 0 0 0 0 0 0 0 - 0 - - 0 - - 0 - - 0 - - 0 - - 0 -
Corporates - OfWhich:SpecialisedLending 0 0 0 0 0 0 0 0 0 0 0 0 0 0 0 0 0 0 - 0 - - 0 - - 0 - - 0 - - 0 - - 0 -Corporates -OfWhich: SME 0 0 0 0 0 0 0 0 0 0 0 0 0 0 0 0 0 0 - 0 - - 0 - - 0 - - 0 - - 0 - - 0 -
Retail 0 0 0 0 0 0 0 0 0 0 0 0 0 0 0 0 0 0 - 0 - - 0 - - 0 - - 0 - - 0 - - 0 -Retail -Securedon real estateproperty 0.0% 0 0 0 0 0 0 0 0 0 0 0 0 0 0 0 0 0 0 - 0 - - 0 - - 0 - - 0 - - 0 - - 0 -
Retail -Securedon real estate property-Of hi h: E
0.0% 0 0 0 0 0 0 0 0 0 0 0 0 0 0 0 0 0 0 - 0 - - 0 - - 0 - - 0 - - 0 - - 0 -Retail -Securedon real estate property-Of
h i h: n n - E0.0% 0 0 0 0 0 0 0 0 0 0 0 0 0 0 0 0 0 0 - 0 - - 0 - - 0 - - 0 - - 0 - - 0 -
Retail -QualifyingRevolving 0 0 0 0 0 0 0 0 0 0 0 0 0 0 0 0 0 0 - 0 - - 0 - - 0 - - 0 - - 0 - - 0 -Retail -OtherRetail 0 0 0 0 0 0 0 0 0 0 0 0 0 0 0 0 0 0 - 0 - - 0 - - 0 - - 0 - - 0 - - 0 -
Retail -OtherRetail -OfWhich:SME 0 0 0 0 0 0 0 0 0 0 0 0 0 0 0 0 0 0 - 0 - - 0 - - 0 - - 0 - - 0 - - 0 -Retail -OtherRetail -OfWhich:non-SME 0 0 0 0 0 0 0 0 0 0 0 0 0 0 0 0 0 0 - 0 - - 0 - - 0 - - 0 - - 0 - - 0 -
Equity 0 0 0 0 0 0 0 0 0 0 0 0 0 0 0 0 0 0 - 0 - - 0 - - 0 - - 0 - - 0 - - 0 -Securitisation 0 0 0 0 0 0 0 0 0 0 0 0 0 0 0 0 0 0Othernon-credit obligation assets 0 0 0 0 0 0 0 0 0 0 0 0 0 0 0 0 0 0TOTAL 0 0 0 0 0 0 0 0 0 0 0 0 0 0 0 0 0 0 - 0 - - 0 - - 0 - - 0 - - 0 - - 0 -Securitisation andre-securitisations positions deductedfrom capital * 0 0 0 0 0 0 0 0 0 0 0 0
as of 31/12/2016 as of 31/12/2014 as of 31/12/2015 as of 31/12/2016
Please, select the country
F-IRB A-IRB STA a so f3 1/ 12 /2 01 4 a so f 31 /1 2/ 20 15LTV %(asof 31/12/2013)
Exposure values (as of 31/12/2013) Risk exposure amounts (as of 31/12/2013) Value adjustments and provisions (as of 31/12/2013) Baseline Scenario Adverse Scenario
F-IRB A-IRB STA F-IRB A-IRB STA
LTV %(asof 31/12/2013)
Exposure values (as of 31/12/2013) Risk exposure amounts (as of 31/12/2013) Value adjustments and provisions (as of 31/12/2013) Baseline Scenario Adverse Scenario
F-IRB A-IRB STA F-IRB A-IRB STA F-IRB as of 31 /12 /2 01 4 as of 31/ 12 /2 01 5 as of 31 /12 /2 01 6 A-IRB STA as of 31 /1 2/ 20 14 as of 31/ 12 /2 01 5 as of 31 /12 /2 01 6
LTV %(asof 31/12/2013)
Exposure values (as of 31/12/2013) Risk exposure amounts (as of 31/12/2013) Value adjustments and provisions (as of 31/12/2013) Baseline Scenario Adverse Scenario
F-IRB A-IRB STA F-IRB A-IRB STA F-IRB A-IRB a so f 31 /1 2/ 20 15 a so f3 1/ 12 /2 01 6STA as of 31/12/2014 as of 31/12/2015 as of 31/12/2016 as of 31/12/2014
(*)Referstothepart ofSecuritizationexposurethat isdeductedfrom capital andisnot includedinRWA
(*)Referstothepart ofSecuritizationexposurethat isdeductedfrom capital andisnot includedinRWA
(*)Referstothepart ofSecuritizationexposurethat isdeductedfrom capital andisnot includedinRWA
(*)Referstothepart ofSecuritizationexposurethat isdeductedfrom capital andisnot includedinRWA
Please, select the country
Please, select the country
Please, select the country
http://www.economiaciudadana.org/
2014 EU-wide Stress TestCredit Risk
31 1 13) 31 1 13) 31 1 13)
(mln EU
R, %)Non-defaulted Defaulted Non-defaulted Defaulted Non-defaulted Defaulted Non-defaulted Defaulted Non-defaulted Defaulted Non-defaulted Defaulted Non-defaulted Defaulted Non-defaulted Defaulted Non-defaulted Defaulted
Impairmentrate
Stockof Provisions
Coverage Ratio -
Default Stock
Impairmentrate
Stockof Provisions
Coverage
Ratio -Default
Stock
Impairmentrate
Stockof Provisions
Coverage
Ratio -Default
Stock
Impairment rateStockof
Provisions
Coverage
Ratio -Default
Stock
Impairmentrate
Stockof Provisions
Coverage
Ratio -Default
Stock
Impairmentrate
Stockof Provisions
Coverage
Ratio -Default
Stock Central banksandcentral governments 0 0 0 0 0 0 0 0 0 0 0 0 0 0 0 0 0 0 - 0 - - 0 - - 0 - - 0 - - 0 - - 0 -Institutions 0 0 0 0 0 0 0 0 0 0 0 0 0 0 0 0 0 0 - 0 - - 0 - - 0 - - 0 - - 0 - - 0 -Corporates 0 0 0 0 0 0 0 0 0 0 0 0 0 0 0 0 0 0 - 0 - - 0 - - 0 - - 0 - - 0 - - 0 -
Corporates - OfWhich:SpecialisedLending 0 0 0 0 0 0 0 0 0 0 0 0 0 0 0 0 0 0 - 0 - - 0 - - 0 - - 0 - - 0 - - 0 -Corporates -OfWhich: SME 0 0 0 0 0 0 0 0 0 0 0 0 0 0 0 0 0 0 - 0 - - 0 - - 0 - - 0 - - 0 - - 0 -
Retail 0 0 0 0 0 0 0 0 0 0 0 0 0 0 0 0 0 0 - 0 - - 0 - - 0 - - 0 - - 0 - - 0 -Retail -Securedon real estateproperty 0.0% 0 0 0 0 0 0 0 0 0 0 0 0 0 0 0 0 0 0 - 0 - - 0 - - 0 - - 0 - - 0 - - 0 -
Retail -Securedon real estate property-Of hi h: E
0.0% 0 0 0 0 0 0 0 0 0 0 0 0 0 0 0 0 0 0 - 0 - - 0 - - 0 - - 0 - - 0 - - 0 -Retail -Securedon real estate property-Of
h i h: n n - E0.0% 0 0 0 0 0 0 0 0 0 0 0 0 0 0 0 0 0 0 - 0 - - 0 - - 0 - - 0 - - 0 - - 0 -
Retail -QualifyingRevolving 0 0 0 0 0 0 0 0 0 0 0 0 0 0 0 0 0 0 - 0 - - 0 - - 0 - - 0 - - 0 - - 0 -Retail -OtherRetail 0 0 0 0 0 0 0 0 0 0 0 0 0 0 0 0 0 0 - 0 - - 0 - - 0 - - 0 - - 0 - - 0 -
Retail -OtherRetail -OfWhich:SME 0 0 0 0 0 0 0 0 0 0 0 0 0 0 0 0 0 0 - 0 - - 0 - - 0 - - 0 - - 0 - - 0 -Retail -OtherRetail -OfWhich:non-SME 0 0 0 0 0 0 0 0 0 0 0 0 0 0 0 0 0 0 - 0 - - 0 - - 0 - - 0 - - 0 - - 0 -
Equity 0 0 0 0 0 0 0 0 0 0 0 0 0 0 0 0 0 0 - 0 - - 0 - - 0 - - 0 - - 0 - - 0 -Securitisation 0 0 0 0 0 0 0 0 0 0 0 0 0 0 0 0 0 0Othernon-credit obligation assets 0 0 0 0 0 0 0 0 0 0 0 0 0 0 0 0 0 0TOTAL 0 0 0 0 0 0 0 0 0 0 0 0 0 0 0 0 0 0 - 0 - - 0 - - 0 - - 0 - - 0 - - 0 -Securitisation andre-securitisations positions deductedfrom capital * 0 0 0 0 0 0 0 0 0 0 0 0
(mln EUR, %)Non-defaulted Defaulted Non-defaulted Defaulted Non-defaulted Defaulted Non-defaulted Defaulted Non-defaulted Defaulted Non-defaulted Defaulted Non-defaulted Defaulted Non-defaulted Defaulted Non-defaulted Defaulted
Impairmentrate
Stockof Provisions
Coverage Ratio -Default Stock
Impairmentrate
Stockof Provisions
Coverage
Ratio -DefaultStock
Impairmentrate
Stockof Provisions
Coverage
Ratio -DefaultStock
Impairment rateStockof
Provisions
Coverage
Ratio -DefaultStock
Impairmentrate
Stockof Provisions
Coverage
Ratio -DefaultStock
Impairmentrate
Stockof Provisions
Coverage
Ratio -DefaultStock
Central banksandcentral governments 0 0 0 0 0 0 0 0 0 0 0 0 0 0 0 0 0 0 - 0 - - 0 - - 0 - - 0 - - 0 - - 0 -Institutions 0 0 0 0 0 0 0 0 0 0 0 0 0 0 0 0 0 0 - 0 - - 0 - - 0 - - 0 - - 0 - - 0 -Corporates 0 0 0 0 0 0 0 0 0 0 0 0 0 0 0 0 0 0 - 0 - - 0 - - 0 - - 0 - - 0 - - 0 -
Corporates - OfWhich:SpecialisedLending 0 0 0 0 0 0 0 0 0 0 0 0 0 0 0 0 0 0 - 0 - - 0 - - 0 - - 0 - - 0 - - 0 -Corporates -OfWhich: SME 0 0 0 0 0 0 0 0 0 0 0 0 0 0 0 0 0 0 - 0 - - 0 - - 0 - - 0 - - 0 - - 0 -
Retail 0 0 0 0 0 0 0 0 0 0 0 0 0 0 0 0 0 0 - 0 - - 0 - - 0 - - 0 - - 0 - - 0 -Retail -Securedon real estateproperty 0.0% 0 0 0 0 0 0 0 0 0 0 0 0 0 0 0 0 0 0 - 0 - - 0 - - 0 - - 0 - - 0 - - 0 -
Retail -Securedon real estate property-Of h i h : S E
0.0% 0 0 0 0 0 0 0 0 0 0 0 0 0 0 0 0 0 0 - 0 - - 0 - - 0 - - 0 - - 0 - - 0 -Retail -Securedon real estate property-Of
h i h: n n - E0.0% 0 0 0 0 0 0 0 0 0 0 0 0 0 0 0 0 0 0 - 0 - - 0 - - 0 - - 0 - - 0 - - 0 -
Retail -QualifyingRevolving 0 0 0 0 0 0 0 0 0 0 0 0 0 0 0 0 0 0 - 0 - - 0 - - 0 - - 0 - - 0 - - 0 -Retail -OtherRetail 0 0 0 0 0 0 0 0 0 0 0 0 0 0 0 0 0 0 - 0 - - 0 - - 0 - - 0 - - 0 - - 0 -
Retail -OtherRetail -OfWhich:SME 0 0 0 0 0 0 0 0 0 0 0 0 0 0 0 0 0 0 - 0 - - 0 - - 0 - - 0 - - 0 - - 0 -Retail -OtherRetail -OfWhich:non-SME 0 0 0 0 0 0 0 0 0 0 0 0 0 0 0 0 0 0 - 0 - - 0 - - 0 - - 0 - - 0 - - 0 -
Equity 0 0 0 0 0 0 0 0 0 0 0 0 0 0 0 0 0 0 - 0 - - 0 - - 0 - - 0 - - 0 - - 0 -Securitisation 0 0 0 0 0 0 0 0 0 0 0 0 0 0 0 0 0 0Othernon-credit obligation assets 0 0 0 0 0 0 0 0 0 0 0 0 0 0 0 0 0 0TOTAL 0 0 0 0 0 0 0 0 0 0 0 0 0 0 0 0 0 0 - 0 - - 0 - - 0 - - 0 - - 0 - - 0 -Securitisation andre-securitisations positions deductedfrom capital * 0 0 0 0 0 0 0 0 0 0 0 0
(mln EUR, %)Non-defaulted Defaulted Non-defaulted Defaulted Non-defaulted Defaulted Non-defaulted Defaulted Non-defaulted Defaulted Non-defaulted Defaulted Non-defaulted Defaulted Non-defaulted Defaulted Non-defaulted Defaulted Impairment
rateStockof
ProvisionsCoverage Ratio -
Default Stock
Impairmentrate
Stockof Provisions
CoverageRatio -Default
Stock
Impairmentrate
Stockof Provisions
CoverageRatio -Default
Stock
Impairment rateStockof
Provisions
CoverageRatio -Default
Stock
Impairmentrate
Stockof Provisions
CoverageRatio -Default
Stock
Impairmentrate
Stockof Provisions
CoverageRatio -Default
Stock
Central banksandcentral governments 0 0 0 0 0 0 0 0 0 0 0 0 0 0 0 0 0 0 - 0 - - 0 - - 0 - - 0 - - 0 - - 0 -Institutions 0 0 0 0 0 0 0 0 0 0 0 0 0 0 0 0 0 0 - 0 - - 0 - - 0 - - 0 - - 0 - - 0 -Corporates 0 0 0 0 0 0 0 0 0 0 0 0 0 0 0 0 0 0 - 0 - - 0 - - 0 - - 0 - - 0 - - 0 -
Corporates - OfWhich:SpecialisedLending 0 0 0 0 0 0 0 0 0 0 0 0 0 0 0 0 0 0 - 0 - - 0 - - 0 - - 0 - - 0 - - 0 -Corporates -OfWhich: SME 0 0 0 0 0 0 0 0 0 0 0 0 0 0 0 0 0 0 - 0 - - 0 - - 0 - - 0 - - 0 - - 0 -
Retail 0 0 0 0 0 0 0 0 0 0 0 0 0 0 0 0 0 0 - 0 - - 0 - - 0 - - 0 - - 0 - - 0 -Retail -Securedon real estateproperty 0.0% 0 0 0 0 0 0 0 0 0 0 0 0 0 0 0 0 0 0 - 0 - - 0 - - 0 - - 0 - - 0 - - 0 -
LTV %(asof 31/12/2013)
Exposure values (as of 31/12/2013) Risk exposure amounts (as of 31/12/2013) Value adjustments and provisions (as of 31/12/2013) Baseline Scenario Adverse ScenarioF-IRB A-IRB STA F-IRB A-IRB STA F-IRB A-IRB a so f 31 /1 2/ 20 15 a so f3 1/ 12 /2 01 6STA as of 31/12/2014 as of 31/12/2015 as of 31/12/2016 as of 31/12/2014
AdverseScenario
F-IRB A-IRB STA F-IRB A-IRB STA F-IRB A-IRB STA as of 31/12/2014 as of 31/12/2015 as of 31/12/2016 as of 31/12/2014 as of 31/12/2015 as of 31/12/2016LTV %(asof 31/12/2013)
E xp os ur ev al ue s( as of 3 1/ 12 /2 01 3) R is k e xp os ur e am ou nt s (a so f3 1/ 12 /2 01 3) V al ue ad ju st me nt s an dp ro vi si on s( as of 3 1/ 12 /2 01 3)
AdverseScenario
F-IRB A-IRB STA F-IRB A-IRB STA F-IRB A-IRB STA as of 31/12/2014 as of 31/12/2015 as of 31/12/2016 as of 31/12/2014 as of 31/12/2015 as of 31/12/2016LTV %(asof 31/12/2013)
E xp os ur ev al ue s( as of 3 1/ 12 /2 01 3) R is k ex po su re am ou nt s (a so f3 1/ 12 /2 01 3)
BaselineScenario
Valueadjustmentsandprovisions(asof 31/12/2013) BaselineScenario
(*)Referstothepart ofSecuritizationexposurethat isdeductedfrom capital andisnot includedinRWA
(*)Referstothepart ofSecuritizationexposurethat isdeductedfrom capital andisnot includedinRWA
Please, select the country
Please, select the country

8/10/2019 Test Stress Banca Española 2014
http://slidepdf.com/reader/full/test-stress-banca-espanola-2014 164/240
Retail -Securedon real estate property-Of hi h: E
0.0% 0 0 0 0 0 0 0 0 0 0 0 0 0 0 0 0 0 0 - 0 - - 0 - - 0 - - 0 - - 0 - - 0 -Retail -Securedon real estate property-Of
h i h: n n - E0.0% 0 0 0 0 0 0 0 0 0 0 0 0 0 0 0 0 0 0 - 0 - - 0 - - 0 - - 0 - - 0 - - 0 -
Retail -QualifyingRevolving 0 0 0 0 0 0 0 0 0 0 0 0 0 0 0 0 0 0 - 0 - - 0 - - 0 - - 0 - - 0 - - 0 -Retail -OtherRetail 0 0 0 0 0 0 0 0 0 0 0 0 0 0 0 0 0 0 - 0 - - 0 - - 0 - - 0 - - 0 - - 0 -
Retail -OtherRetail -OfWhich:SME 0 0 0 0 0 0 0 0 0 0 0 0 0 0 0 0 0 0 - 0 - - 0 - - 0 - - 0 - - 0 - - 0 -Retail -OtherRetail -OfWhich:non-SME 0 0 0 0 0 0 0 0 0 0 0 0 0 0 0 0 0 0 - 0 - - 0 - - 0 - - 0 - - 0 - - 0 -
Equity 0 0 0 0 0 0 0 0 0 0 0 0 0 0 0 0 0 0 - 0 - - 0 - - 0 - - 0 - - 0 - - 0 -Securitisation 0 0 0 0 0 0 0 0 0 0 0 0 0 0 0 0 0 0Othernon-credit obligation assets 0 0 0 0 0 0 0 0 0 0 0 0 0 0 0 0 0 0TOTAL 0 0 0 0 0 0 0 0 0 0 0 0 0 0 0 0 0 0 - 0 - - 0 - - 0 - - 0 - - 0 - - 0 -Securitisation andre-securitisations positions deductedfrom capital * 0 0 0 0 0 0 0 0 0 0 0 0
(mln EUR, %)Non-defaulted Defaulted Non-defaulted Defaulted Non-defaulted Defaulted Non-defaulted Defaulted Non-defaulted Defaulted Non-defaulted Defaulted Non-defaulted Defaulted Non-defaulted Defaulted Non-defaulted Defaulted Impairment
rateStockof
ProvisionsCoverage Ratio -
Default Stock
Impairmentrate
Stockof Provisions
CoverageRatio -Default
Stock
Impairmentrate
Stockof Provisions
CoverageRatio -Default
Stock
Impairment rateStockof
Provisions
CoverageRatio -Default
Stock
Impairmentrate
Stockof Provisions
CoverageRatio -Default
Stock
Impairmentrate
Stockof Provisions
CoverageRatio -Default
Stock
Central banksandcentral governments 0 0 0 0 0 0 0 0 0 0 0 0 0 0 0 0 0 0 - 0 - - 0 - - 0 - - 0 - - 0 - - 0 -Institutions 0 0 0 0 0 0 0 0 0 0 0 0 0 0 0 0 0 0 - 0 - - 0 - - 0 - - 0 - - 0 - - 0 -Corporates 0 0 0 0 0 0 0 0 0 0 0 0 0 0 0 0 0 0 - 0 - - 0 - - 0 - - 0 - - 0 - - 0 -
Corporates - OfWhich:SpecialisedLending 0 0 0 0 0 0 0 0 0 0 0 0 0 0 0 0 0 0 - 0 - - 0 - - 0 - - 0 - - 0 - - 0 -Corporates -OfWhich: SME 0 0 0 0 0 0 0 0 0 0 0 0 0 0 0 0 0 0 - 0 - - 0 - - 0 - - 0 - - 0 - - 0 -
Retail 0 0 0 0 0 0 0 0 0 0 0 0 0 0 0 0 0 0 - 0 - - 0 - - 0 - - 0 - - 0 - - 0 -Retail -Securedon real estateproperty 0.0% 0 0 0 0 0 0 0 0 0 0 0 0 0 0 0 0 0 0 - 0 - - 0 - - 0 - - 0 - - 0 - - 0 -
Retail -Securedon real estate property-Of h i h : S E
0.0% 0 0 0 0 0 0 0 0 0 0 0 0 0 0 0 0 0 0 - 0 - - 0 - - 0 - - 0 - - 0 - - 0 -Retail -Securedon real estate property-Of
h i h: n n - E0.0% 0 0 0 0 0 0 0 0 0 0 0 0 0 0 0 0 0 0 - 0 - - 0 - - 0 - - 0 - - 0 - - 0 -
Retail -QualifyingRevolving 0 0 0 0 0 0 0 0 0 0 0 0 0 0 0 0 0 0 - 0 - - 0 - - 0 - - 0 - - 0 - - 0 -Retail -OtherRetail 0 0 0 0 0 0 0 0 0 0 0 0 0 0 0 0 0 0 - 0 - - 0 - - 0 - - 0 - - 0 - - 0 -
Retail -OtherRetail -OfWhich:SME 0 0 0 0 0 0 0 0 0 0 0 0 0 0 0 0 0 0 - 0 - - 0 - - 0 - - 0 - - 0 - - 0 -Retail -OtherRetail -OfWhich:non-SME 0 0 0 0 0 0 0 0 0 0 0 0 0 0 0 0 0 0 - 0 - - 0 - - 0 - - 0 - - 0 - - 0 -
Equity 0 0 0 0 0 0 0 0 0 0 0 0 0 0 0 0 0 0 - 0 - - 0 - - 0 - - 0 - - 0 - - 0 -Securitisation 0 0 0 0 0 0 0 0 0 0 0 0 0 0 0 0 0 0Othernon-credit obligation assets 0 0 0 0 0 0 0 0 0 0 0 0 0 0 0 0 0 0TOTAL 0 0 0 0 0 0 0 0 0 0 0 0 0 0 0 0 0 0 - 0 - - 0 - - 0 - - 0 - - 0 - - 0 -Securitisation andre-securitisations positions deductedfrom capital * 0 0 0 0 0 0 0 0 0 0 0 0
(mln EUR, %)Non-defaulted Defaulted Non-defaulted Defaulted Non-defaulted Defaulted Non-defaulted Defaulted Non-defaulted Defaulted Non-defaulted Defaulted Non-defaulted Defaulted Non-defaulted Defaulted Non-defaulted Defaulted Impairment
rateStockof
ProvisionsCoverage Ratio -
Default Stock
Impairmentrate
Stockof Provisions
CoverageRatio -Default
Stock
Impairmentrate
Stockof Provisions
CoverageRatio -Default
Stock
Impairment rateStockof
Provisions
CoverageRatio -Default
Stock
Impairmentrate
Stockof Provisions
CoverageRatio -Default
Stock
Impairmentrate
Stockof Provisions
CoverageRatio -Default
Stock
Central banksandcentral governments 0 0 0 0 0 0 0 0 0 0 0 0 0 0 0 0 0 0 - 0 - - 0 - - 0 - - 0 - - 0 - - 0 -Institutions 0 0 0 0 0 0 0 0 0 0 0 0 0 0 0 0 0 0 - 0 - - 0 - - 0 - - 0 - - 0 - - 0 -Corporates 0 0 0 0 0 0 0 0 0 0 0 0 0 0 0 0 0 0 - 0 - - 0 - - 0 - - 0 - - 0 - - 0 -
Corporates - OfWhich:SpecialisedLending 0 0 0 0 0 0 0 0 0 0 0 0 0 0 0 0 0 0 - 0 - - 0 - - 0 - - 0 - - 0 - - 0 -Corporates -OfWhich: SME 0 0 0 0 0 0 0 0 0 0 0 0 0 0 0 0 0 0 - 0 - - 0 - - 0 - - 0 - - 0 - - 0 -
Retail 0 0 0 0 0 0 0 0 0 0 0 0 0 0 0 0 0 0 - 0 - - 0 - - 0 - - 0 - - 0 - - 0 -Retail -Securedon real estateproperty 0.0% 0 0 0 0 0 0 0 0 0 0 0 0 0 0 0 0 0 0 - 0 - - 0 - - 0 - - 0 - - 0 - - 0 -
Retail -Securedon real estate property-Of hi h: E
0.0% 0 0 0 0 0 0 0 0 0 0 0 0 0 0 0 0 0 0 - 0 - - 0 - - 0 - - 0 - - 0 - - 0 -Retail -Securedon real estate property-Of
h i h : n n -S E0.0% 0 0 0 0 0 0 0 0 0 0 0 0 0 0 0 0 0 0 - 0 - - 0 - - 0 - - 0 - - 0 - - 0 -
Retail -QualifyingRevolving 0 0 0 0 0 0 0 0 0 0 0 0 0 0 0 0 0 0 - 0 - - 0 - - 0 - - 0 - - 0 - - 0 -Retail -OtherRetail 0 0 0 0 0 0 0 0 0 0 0 0 0 0 0 0 0 0 - 0 - - 0 - - 0 - - 0 - - 0 - - 0 -
Retail -OtherRetail -OfWhich:SME 0 0 0 0 0 0 0 0 0 0 0 0 0 0 0 0 0 0 - 0 - - 0 - - 0 - - 0 - - 0 - - 0 -Retail -OtherRetail -OfWhich:non-SME 0 0 0 0 0 0 0 0 0 0 0 0 0 0 0 0 0 0 - 0 - - 0 - - 0 - - 0 - - 0 - - 0 -
Equity 0 0 0 0 0 0 0 0 0 0 0 0 0 0 0 0 0 0 - 0 - - 0 - - 0 - - 0 - - 0 - - 0 -Securitisation 0 0 0 0 0 0 0 0 0 0 0 0 0 0 0 0 0 0Othernon-credit obligation assets 0 0 0 0 0 0 0 0 0 0 0 0 0 0 0 0 0 0TOTAL 0 0 0 0 0 0 0 0 0 0 0 0 0 0 0 0 0 0 - 0 - - 0 - - 0 - - 0 - - 0 - - 0 -Securitisation andre-securitisations positions deductedfrom capital * 0 0 0 0 0 0 0 0 0 0 0 0
LTV %(asof 31/12/2013)
Exposure values (as of 31/12/2013) Risk exposure amounts (as of 31/12/2013) Value adjustments and provisions (as of 31/12/2013) Baseline Scenario Adverse ScenarioF-IRB A-IRB STA F-IRB A-IRB STA as of 31/12/2016 as of 31/12/2014 as of 31/12/2015 as of 31/12/2016F-IRB A-IRB STA a so f3 1/ 12 /2 01 4 a so f 31 /1 2/ 20 15
LTV %(asof 31/12/2013)
Exposure values (as of 31/12/2013) Risk exposure amounts (as of 31/12/2013) Value adjustments and provisions (as of 31/12/2013) Baseline Scenario Adverse ScenarioF-IRB A-IRB STA F-IRB A-IRB STA F-IRB as of 31 /12 /2 01 4 as of 31/ 12 /2 01 5 as of 31 /12 /2 01 6 A-IRB STA as of 31 /1 2/ 20 14 as of 31/ 12 /2 01 5 as of 31 /12 /2 01 6
(*)Referstothepart ofSecuritizationexposurethat isdeductedfrom capital andisnot includedinRWA
(*)Referstothepart ofSecuritizationexposurethat isdeductedfrom capital andisnot includedinRWA
(*)Referstothepart ofSecuritizationexposurethat isdeductedfrom capital andisnot includedinRWA
Please, select the country
Please, select the country
Please, select the country
http://www.economiaciudadana.org/

8/10/2019 Test Stress Banca Española 2014
http://slidepdf.com/reader/full/test-stress-banca-espanola-2014 165/240
2014 EU-wide Stress Test
RWA
(mln EUR)as of 31/12/2013 as of 31/12/2014 as of 31/12/2015 as of 31/12/2016 as of 31/12/2014 as of 31/12/2015 as of 31/12/2016
Risk exposure amount for credit risk 24,106 24,341 24,496 24,601 24,603 24,967 25,278
Risk exposure amount Securitisation and re-securitisations 1,111 1,226 1,295 1,340 1,406 1,583 1,701
Risk exposure amount Other credit risk 22,995 23,116 23,202 23,260 23,197 23,384 23,577
Risk exposure amount for market risk 0 0 0 0 0 0 0
Risk exposure amount for operational risk 2,369 2,369 2,369 2,369 2,369 2,369 2,369
Transitional floors for Risk exposure amount 0 0 0 0 0 0 0
AQR adjustments (for SSM countries only) 0 0 0 0 0 0 0
Total Risk exposure amount 26,475 26,711 26,865 26,970 26,972 27,336 27,647
Baseline Scenario Adverse Scenario

8/10/2019 Test Stress Banca Española 2014
http://slidepdf.com/reader/full/test-stress-banca-espanola-2014 166/240
http://www.economiaciudadana.org/

8/10/2019 Test Stress Banca Española 2014
http://slidepdf.com/reader/full/test-stress-banca-espanola-2014 167/240
2014 EU-wide Stress Test - Sovereign Exposure
(mln EUR)
[ 0 - 3M [ 0 0 0 0 0 0 0 0 0 0 0 0 0 0
[ 3M - 1Y [ 0 0 0 0 0 0 0 0 0 0 0 0 0 0[ 1Y - 2Y [ 0 0 0 0 0 0 0 0 0 0 0 0 0 0[ 2Y - 3Y [ 0 0 0 0 0 0 0 0 0 0 0 0 0 0[3Y - 5Y [ 0 0 0 0 0 0 0 0 0 0 0 0 0 0
[5Y - 10Y [ 0 0 0 0 0 0 0 0 0 0 0 0 0 0[10Y - more 0 0 0 0 0 0 0 0 0 0 0 0 0 0
Tot 0 0 0 0 0 0 0 0 0 0 0 0 0 0[ 0 - 3M [ 0 0 0 0 0 0 0 0 0 0 0 0 0 0
[ 3M - 1Y [ 0 0 0 0 0 0 0 0 0 0 0 0 0 0
Residual Maturity Country / Region
GROSS DIRECT LONG
EXPOSURES (accounting value grossof provisions)
(1)
NET DIRECT POSITIONS (gross exposures (long) net of cash short
positions of sovereign debt to other counterpaties only where thereis a maturity matching)
(1)
DIRECT SOVEREIGN EXPOSURES IN DERIVATIVES (1)
of which: loansand advances
of which: AFSbanking book
of which: FVO
(designated at fairvalue throughprofit&loss)
banking book
of which: Financial
assets held fortrading
(2)
Derivatives with positive fair value at31/12/2013
Derivatives with negative fair value at31/12/2013
Derivatives with positive fair valueat 31/12/2013
Derivatives with negative fairvalue at 31/12/2013
VALUES AS OF 31/12/2013 VALUES AS OF 31/12/2013 VALUES AS OF 31/12/2013
INDIRECT SOVEREIGN EXPOSURES (3) (on and off balance sheet)
Fair-value at31/12/2013 (+)
Notional valueFair-value at
31/12/2013 (-)Notional value
Fair-value at31/12/2013 (+)
Notional valueFair-value at 31/12/2013
(-)
Austria
Notional value

8/10/2019 Test Stress Banca Española 2014
http://slidepdf.com/reader/full/test-stress-banca-espanola-2014 168/240
[ 1Y - 2Y [ 0 0 0 0 0 0 0 0 0 0 0 0 0 0[ 2Y - 3Y [ 0 0 0 0 0 0 0 0 0 0 0 0 0 0[3Y - 5Y [ 0 0 0 0 0 0 0 0 0 0 0 0 0 0
[5Y - 10Y [ 0 0 0 0 0 0 0 0 0 0 0 0 0 0[10Y - more 0 0 0 0 0 0 0 0 0 0 0 0 0 0
Tot 0 0 0 0 0 0 0 0 0 0 0 0 0 0[ 0 - 3M [ 0 0 0 0 0 0 0 0 0 0 0 0 0 0
[ 3M - 1Y [ 0 0 0 0 0 0 0 0 0 0 0 0 0 0[ 1Y - 2Y [ 0 0 0 0 0 0 0 0 0 0 0 0 0 0[ 2Y - 3Y [ 0 0 0 0 0 0 0 0 0 0 0 0 0 0[3Y - 5Y [ 0 0 0 0 0 0 0 0 0 0 0 0 0 0
[5Y - 10Y [ 0 0 0 0 0 0 0 0 0 0 0 0 0 0[10Y - more 0 0 0 0 0 0 0 0 0 0 0 0 0 0
Tot 0 0 0 0 0 0 0 0 0 0 0 0 0 0[ 0 - 3M [ 0 0 0 0 0 0 0 0 0 0 0 0 0 0
[ 3M - 1Y [ 0 0 0 0 0 0 0 0 0 0 0 0 0 0[ 1Y - 2Y [ 0 0 0 0 0 0 0 0 0 0 0 0 0 0[ 2Y - 3Y [ 0 0 0 0 0 0 0 0 0 0 0 0 0 0[3Y - 5Y [ 0 0 0 0 0 0 0 0 0 0 0 0 0 0
[5Y - 10Y [ 0 0 0 0 0 0 0 0 0 0 0 0 0 0[10Y - more 0 0 0 0 0 0 0 0 0 0 0 0 0 0
Tot 0 0 0 0 0 0 0 0 0 0 0 0 0 0
[ 0 - 3M [ 0 0 0 0 0 0 0 0 0 0 0 0 0 0[ 3M - 1Y [ 0 0 0 0 0 0 0 0 0 0 0 0 0 0[ 1Y - 2Y [ 0 0 0 0 0 0 0 0 0 0 0 0 0 0[ 2Y - 3Y [ 0 0 0 0 0 0 0 0 0 0 0 0 0 0[3Y - 5Y [ 0 0 0 0 0 0 0 0 0 0 0 0 0 0
[5Y - 10Y [ 0 0 0 0 0 0 0 0 0 0 0 0 0 0[10Y - more 0 0 0 0 0 0 0 0 0 0 0 0 0 0
Tot 0 0 0 0 0 0 0 0 0 0 0 0 0 0
Belgium
Bulgaria
Cyprus
Czech Republic
Denmark
Estonia
Finland
France
http://www.economiaciudadana.org/

8/10/2019 Test Stress Banca Española 2014
http://slidepdf.com/reader/full/test-stress-banca-espanola-2014 169/240
2014 EU-wide Stress Test - Sovereign Exposure
(mln EUR)
Residual Maturity Country / Region
GROSS DIRECT LONG
EXPOSURES (accounting value grossof provisions)
(1)
NET DIRECT POSITIONS (gross exposures (long) net of cash short
positions of sovereign debt to other counterpaties only where thereis a maturity matching)
(1)
DIRECT SOVEREIGN EXPOSURES IN DERIVATIVES (1)
of which: loansand advances
of which: AFSbanking book
of which: FVO
(designated at fairvalue throughprofit&loss)
banking book
of which: Financial
assets held fortrading
(2)
Derivatives with positive fair value at31/12/2013
Derivatives with negative fair value at31/12/2013
Derivatives with positive fair valueat 31/12/2013
Derivatives with negative fairvalue at 31/12/2013
VALUES AS OF 31/12/2013 VALUES AS OF 31/12/2013 VALUES AS OF 31/12/2013
INDIRECT SOVEREIGN EXPOSURES (3) (on and off balance sheet)
Fair-value at31/12/2013 (+)
Notional valueFair-value at
31/12/2013 (-)Notional value
Fair-value at31/12/2013 (+)
Notional valueFair-value at 31/12/2013
(-)Notional value
[ 0 - 3M [ 0 0 0 0 0 0 0 0 0 0 0 0 0 0
[ 3M - 1Y [ 0 0 0 0 0 0 0 0 0 0 0 0 0 0[ 1Y - 2Y [ 0 0 0 0 0 0 0 0 0 0 0 0 0 0[ 2Y - 3Y [ 0 0 0 0 0 0 0 0 0 0 0 0 0 0[3Y - 5Y [ 0 0 0 0 0 0 0 0 0 0 0 0 0 0
[5Y - 10Y [ 0 0 0 0 0 0 0 0 0 0 0 0 0 0[10Y - more 0 0 0 0 0 0 0 0 0 0 0 0 0 0
Tot 0 0 0 0 0 0 0 0 0 0 0 0 0 0[ 0 - 3M [ 0 0 0 0 0 0 0 0 0 0 0 0 0 0
[ 3M - 1Y [ 0 0 0 0 0 0 0 0 0 0 0 0 0 0[ 1Y 2Y [ 0 0 0 0 0 0 0 0 0 0 0 0 0 0
Lithuania

8/10/2019 Test Stress Banca Española 2014
http://slidepdf.com/reader/full/test-stress-banca-espanola-2014 170/240
[ 1Y - 2Y [ 0 0 0 0 0 0 0 0 0 0 0 0 0 0[ 2Y - 3Y [ 0 0 0 0 0 0 0 0 0 0 0 0 0 0[3Y - 5Y [ 0 0 0 0 0 0 0 0 0 0 0 0 0 0
[5Y - 10Y [ 0 0 0 0 0 0 0 0 0 0 0 0 0 0[10Y - more 0 0 0 0 0 0 0 0 0 0 0 0 0 0
Tot 0 0 0 0 0 0 0 0 0 0 0 0 0 0[ 0 - 3M [ 0 0 0 0 0 0 0 0 0 0 0 0 0 0
[ 3M - 1Y [ 0 0 0 0 0 0 0 0 0 0 0 0 0 0[ 1Y - 2Y [ 0 0 0 0 0 0 0 0 0 0 0 0 0 0[ 2Y - 3Y [ 0 0 0 0 0 0 0 0 0 0 0 0 0 0[3Y - 5Y [ 0 0 0 0 0 0 0 0 0 0 0 0 0 0
[5Y - 10Y [ 0 0 0 0 0 0 0 0 0 0 0 0 0 0[10Y - more 0 0 0 0 0 0 0 0 0 0 0 0 0 0
Tot 0 0 0 0 0 0 0 0 0 0 0 0 0 0[ 0 - 3M [ 0 0 0 0 0 0 0 0 0 0 0 0 0 0
[ 3M - 1Y [ 0 0 0 0 0 0 0 0 0 0 0 0 0 0[ 1Y - 2Y [ 0 0 0 0 0 0 0 0 0 0 0 0 0 0[ 2Y - 3Y [ 0 0 0 0 0 0 0 0 0 0 0 0 0 0[3Y - 5Y [ 0 0 0 0 0 0 0 0 0 0 0 0 0 0
[5Y - 10Y [ 0 0 0 0 0 0 0 0 0 0 0 0 0 0[10Y - more 0 0 0 0 0 0 0 0 0 0 0 0 0 0
Tot 0 0 0 0 0 0 0 0 0 0 0 0 0 0[ 0 - 3M [ 0 0 0 0 0 0 0 0 0 0 0 0 0 0
[ 3M - 1Y [ 0 0 0 0 0 0 0 0 0 0 0 0 0 0[ 1Y - 2Y [ 0 0 0 0 0 0 0 0 0 0 0 0 0 0[ 2Y - 3Y [ 0 0 0 0 0 0 0 0 0 0 0 0 0 0[3Y - 5Y [ 0 0 0 0 0 0 0 0 0 0 0 0 0 0
[5Y - 10Y [ 0 0 0 0 0 0 0 0 0 0 0 0 0 0[10Y - more 0 0 0 0 0 0 0 0 0 0 0 0 0 0
Tot 0 0 0 0 0 0 0 0 0 0 0 0 0 0[ 0 - 3M [ 0 0 0 0 0 0 0 0 0 0 0 0 0 0
[ 3M - 1Y [ 0 0 0 0 0 0 0 0 0 0 0 0 0 0[ 1Y - 2Y [ 0 0 0 0 0 0 0 0 0 0 0 0 0 0[ 2Y - 3Y [ 0 0 0 0 0 0 0 0 0 0 0 0 0 0[3Y - 5Y [ 0 0 0 0 0 0 0 0 0 0 0 0 0 0
[5Y - 10Y [ 0 0 0 0 0 0 0 0 0 0 0 0 0 0[10Y - more 0 0 0 0 0 0 0 0 0 0 0 0 0 0
Tot 0 0 0 0 0 0 0 0 0 0 0 0 0 0[ 0 - 3M [ 0 0 0 0 0 0 0 0 0 0 0 0 0 0
[ 3M - 1Y [ 0 0 0 0 0 0 0 0 0 0 0 0 0 0[ 1Y - 2Y [ 0 0 0 0 0 0 0 0 0 0 0 0 0 0[ 2Y - 3Y [ 0 0 0 0 0 0 0 0 0 0 0 0 0 0[3Y - 5Y [ 0 0 0 0 0 0 0 0 0 0 0 0 0 0
[5Y - 10Y [ 0 0 0 0 0 0 0 0 0 0 0 0 0 0[10Y - more 0 0 0 0 0 0 0 0 0 0 0 0 0 0
Tot 0 0 0 0 0 0 0 0 0 0 0 0 0 0[ 0 - 3M [ 0 0 0 0 0 0 0 0 0 0 0 0 0 0
[ 3M - 1Y [ 0 0 0 0 0 0 0 0 0 0 0 0 0 0[ 1Y - 2Y [ 0 0 0 0 0 0 0 0 0 0 0 0 0 0[ 2Y - 3Y [ 0 0 0 0 0 0 0 0 0 0 0 0 0 0[3Y - 5Y [ 0 0 0 0 0 0 0 0 0 0 0 0 0 0
[5Y - 10Y [ 0 0 0 0 0 0 0 0 0 0 0 0 0 0[10Y - more 0 0 0 0 0 0 0 0 0 0 0 0 0 0
Tot 0 0 0 0 0 0 0 0 0 0 0 0 0 0
[ 0 - 3M [ 0 0 0 0 0 0 0 0 0 0 0 0 0 0[ 3M - 1Y [ 0 0 0 0 0 0 0 0 0 0 0 0 0 0[ 1Y - 2Y [ 0 0 0 0 0 0 0 0 0 0 0 0 0 0[ 2Y - 3Y [ 0 0 0 0 0 0 0 0 0 0 0 0 0 0[3Y - 5Y [ 0 0 0 0 0 0 0 0 0 0 0 0 0 0
[5Y - 10Y [ 0 0 0 0 0 0 0 0 0 0 0 0 0 0[10Y - more 0 0 0 0 0 0 0 0 0 0 0 0 0 0
Tot 0 0 0 0 0 0 0 0 0 0 0 0 0 0
Luxembourg
Malta
Netherlands
Norway
Poland
Portugal
Romania
Slovakia
http://www.economiaciudadana.org/
2014 EU-wide Stress Test - Sovereign Exposure
(mln EUR)
Residual Maturity Country / Region
GROSS DIRECT LONG
EXPOSURES (accounting value grossof provisions)
(1)
NET DIRECT POSITIONS (gross exposures (long) net of cash short
positions of sovereign debt to other counterpaties only where thereis a maturity matching)
(1)
DIRECT SOVEREIGN EXPOSURES IN DERIVATIVES (1)
of which: loansand advances
of which: AFSbanking book
of which: FVO
(designated at fairvalue throughprofit&loss)
banking book
of which: Financial
assets held fortrading
(2)
Derivatives with positive fair value at31/12/2013
Derivatives with negative fair value at31/12/2013
Derivatives with positive fair valueat 31/12/2013
Derivatives with negative fairvalue at 31/12/2013
VALUES AS OF 31/12/2013 VALUES AS OF 31/12/2013 VALUES AS OF 31/12/2013
INDIRECT SOVEREIGN EXPOSURES (3) (on and off balance sheet)
Fair-value at31/12/2013 (+)
Notional valueFair-value at
31/12/2013 (-)Notional value
Fair-value at31/12/2013 (+)
Notional valueFair-value at 31/12/2013
(-)Notional value
[ 0 - 3M [ 0 0 0 0 0 0 0 0 0 0 0 0 0 0
[ 3M - 1Y [ 0 0 0 0 0 0 0 0 0 0 0 0 0 0[ 1Y - 2Y [ 0 0 0 0 0 0 0 0 0 0 0 0 0 0[ 2Y - 3Y [ 0 0 0 0 0 0 0 0 0 0 0 0 0 0[3Y - 5Y [ 0 0 0 0 0 0 0 0 0 0 0 0 0 0
[5Y - 10Y [ 0 0 0 0 0 0 0 0 0 0 0 0 0 0[10Y - more 0 0 0 0 0 0 0 0 0 0 0 0 0 0
Tot 0 0 0 0 0 0 0 0 0 0 0 0 0 0[ 0 - 3M [ 67 43 24 24 0 0 0 0 0 0 0 0 0 0
[ 3M - 1Y [ 425 123 302 301 0 1 0 0 0 0 0 0 0 0[ 1Y - 2Y [ 388 43 345 345 0 0 0 0 0 0 0 0 0 0
Slovenia

8/10/2019 Test Stress Banca Española 2014
http://slidepdf.com/reader/full/test-stress-banca-espanola-2014 171/240
[ 1Y 2Y [ 388 43 345 345 0 0[ 2Y - 3Y [ 711 80 631 631 0 0 0 0 0 0 0 0 0 0[3Y - 5Y [ 241 111 131 131 0 0 0 0 0 0 0 0 0 0
[5Y - 10Y [ 152 135 17 17 0 0 0 0 0 0 0 0 0 0[10Y - more 81 80 1 1 0 0 0 0 0 0 0 0 0 0
Tot 2,065 614 1,451 1,450 0 1 0 0 0 0 0 0 0 0[ 0 - 3M [ 0 0 0 0 0 0 0 0 0 0 0 0 0 0
[ 3M - 1Y [ 0 0 0 0 0 0 0 0 0 0 0 0 0 0[ 1Y - 2Y [ 0 0 0 0 0 0 0 0 0 0 0 0 0 0[ 2Y - 3Y [ 0 0 0 0 0 0 0 0 0 0 0 0 0 0[3Y - 5Y [ 0 0 0 0 0 0 0 0 0 0 0 0 0 0
[5Y - 10Y [ 0 0 0 0 0 0 0 0 0 0 0 0 0 0[10Y - more 0 0 0 0 0 0 0 0 0 0 0 0 0 0
Tot 0 0 0 0 0 0 0 0 0 0 0 0 0 0[ 0 - 3M [ 0 0 0 0 0 0 0 0 0 0 0 0 0 0
[ 3M - 1Y [ 0 0 0 0 0 0 0 0 0 0 0 0 0 0[ 1Y - 2Y [ 0 0 0 0 0 0 0 0 0 0 0 0 0 0[ 2Y - 3Y [ 0 0 0 0 0 0 0 0 0 0 0 0 0 0[3Y - 5Y [ 0 0 0 0 0 0 0 0 0 0 0 0 0 0
[5Y - 10Y [ 0 0 0 0 0 0 0 0 0 0 0 0 0 0[10Y - more 0 0 0 0 0 0 0 0 0 0 0 0 0 0
Tot 0 0 0 0 0 0 0 0 0 0 0 0 0 0
[ 0 - 3M [ 0 0 0 0 0 0 0 0 0 0 0 0 0 0[ 3M - 1Y [ 0 0 0 0 0 0 0 0 0 0 0 0 0 0[ 1Y - 2Y [ 0 0 0 0 0 0 0 0 0 0 0 0 0 0[ 2Y - 3Y [ 0 0 0 0 0 0 0 0 0 0 0 0 0 0[3Y - 5Y [ 0 0 0 0 0 0 0 0 0 0 0 0 0 0
[5Y - 10Y [ 0 0 0 0 0 0 0 0 0 0 0 0 0 0[10Y - more 0 0 0 0 0 0 0 0 0 0 0 0 0 0
Tot 0 0 0 0 0 0 0 0 0 0 0 0 0 0
Spain
Sweden
United Kingdom
Australia
Canada
Hong Kong
Japan
U.S.
http://www.economiaciudadana.org/
2014 EU-wide Stress Test - Sovereign Exposure
(mln EUR)
Residual Maturity Country / Region
GROSS DIRECT LONG
EXPOSURES (accounting value grossof provisions)
(1)
NET DIRECT POSITIONS (gross exposures (long) net of cash short
positions of sovereign debt to other counterpaties only where thereis a maturity matching)
(1)
DIRECT SOVEREIGN EXPOSURES IN DERIVATIVES (1)
of which: loansand advances
of which: AFSbanking book
of which: FVO
(designated at fairvalue throughprofit&loss)
banking book
of which: Financial
assets held fortrading
(2)
Derivatives with positive fair value at31/12/2013
Derivatives with negative fair value at31/12/2013
Derivatives with positive fair valueat 31/12/2013
Derivatives with negative fairvalue at 31/12/2013
VALUES AS OF 31/12/2013 VALUES AS OF 31/12/2013 VALUES AS OF 31/12/2013
INDIRECT SOVEREIGN EXPOSURES (3) (on and off balance sheet)
Fair-value at31/12/2013 (+)
Notional valueFair-value at
31/12/2013 (-)Notional value
Fair-value at31/12/2013 (+)
Notional valueFair-value at 31/12/2013
(-)Notional value
[ 0 - 3M [ 0 0 0 0 0 0 0 0 0 0 0 0 0 0
[ 3M - 1Y [ 0 0 0 0 0 0 0 0 0 0 0 0 0 0[ 1Y - 2Y [ 0 0 0 0 0 0 0 0 0 0 0 0 0 0[ 2Y - 3Y [ 0 0 0 0 0 0 0 0 0 0 0 0 0 0[3Y - 5Y [ 0 0 0 0 0 0 0 0 0 0 0 0 0 0
[5Y - 10Y [ 0 0 0 0 0 0 0 0 0 0 0 0 0 0[10Y - more 0 0 0 0 0 0 0 0 0 0 0 0 0 0
Tot 0 0 0 0 0 0 0 0 0 0 0 0 0 0[ 0 - 3M [ 0 0 0 0 0 0 0 0 0 0 0 0 0 0
[ 3M - 1Y [ 0 0 0 0 0 0 0 0 0 0 0 0 0 0[ 1Y - 2Y [ 0 0 0 0 0 0 0 0 0 0 0 0 0 0
China

8/10/2019 Test Stress Banca Española 2014
http://slidepdf.com/reader/full/test-stress-banca-espanola-2014 172/240
[ 2Y - 3Y [ 0 0 0 0 0 0 0 0 0 0 0 0 0 0[3Y - 5Y [ 0 0 0 0 0 0 0 0 0 0 0 0 0 0
[5Y - 10Y [ 0 0 0 0 0 0 0 0 0 0 0 0 0 0[10Y - more 0 0 0 0 0 0 0 0 0 0 0 0 0 0
Tot 0 0 0 0 0 0 0 0 0 0 0 0 0 0[ 0 - 3M [ 0 0 0 0 0 0 0 0 0 0 0 0 0 0
[ 3M - 1Y [ 0 0 0 0 0 0 0 0 0 0 0 0 0 0[ 1Y - 2Y [ 0 0 0 0 0 0 0 0 0 0 0 0 0 0[ 2Y - 3Y [ 0 0 0 0 0 0 0 0 0 0 0 0 0 0[3Y - 5Y [ 0 0 0 0 0 0 0 0 0 0 0 0 0 0
[5Y - 10Y [ 0 0 0 0 0 0 0 0 0 0 0 0 0 0[10Y - more 0 0 0 0 0 0 0 0 0 0 0 0 0 0
Tot 0 0 0 0 0 0 0 0 0 0 0 0 0 0[ 0 - 3M [ 0 0 0 0 0 0 0 0 0 0 0 0 0 0
[ 3M - 1Y [ 0 0 0 0 0 0 0 0 0 0 0 0 0 0[ 1Y - 2Y [ 0 0 0 0 0 0 0 0 0 0 0 0 0 0[ 2Y - 3Y [ 0 0 0 0 0 0 0 0 0 0 0 0 0 0[3Y - 5Y [ 0 0 0 0 0 0 0 0 0 0 0 0 0 0
[5Y - 10Y [ 0 0 0 0 0 0 0 0 0 0 0 0 0 0[10Y - more 0 0 0 0 0 0 0 0 0 0 0 0 0 0
Tot 0 0 0 0 0 0 0 0 0 0 0 0 0 0
Notes and definitions(1) The exposures reported cover only exposures to central, regional and local governments on immediate borrower basis, and do not include exposures to other counterparts with full or partial government guarantees(2) The banks disclose the exposures in the "Financial assets held for trading" portfolio after offsetting the cash short positions having the same maturities.(3) The exposures reported include the positions towards counterparts (other than sovereign) on sovereign credit risk (i.e. CDS, financial guarantees) booked in all the accounting portfolio (on-off balance sheet).
'Irrespective of the denomination and or accounting classification of the positions the economic substance over the form must be used as a criteria for the identification of the exposures to be included in this column. This item does not include exposures to counterparts (other than sovereign) with full or partial government guarantees by central, regional and local governments
Latin America and the
Caribbean
Africa
Others
Middle East
Switzerland
Other advanced economies
non EEA
Other Central and eastern
Europe countries non EEA
http://www.economiaciudadana.org/
2014 EU-wide Stress TestCapital
(mln EUR) CRR/ CRDIV DEFINITION OFCAPITAL Asof 31/12/2013 Asof 31/12/2014 Asof 31/12/2015 Asof 31/12/2016 Asof 31/12/2014 Asof 31/12/2015 Asof 31/12/2016 COREP CODE REGULATION
A OWN FUNDS 2,832 2,922 2,943 2,933 2,702 2,505 2,258 C A1 { 1} A rt ic le s 4 (1 18 ) a nd 7 2 of C RR
A.1COMMON EQUITYTIER1CAPITAL(netofdeductionsandafter applying
transitional adjustments)2,655 2,761 2,829 2,852 2,540 2,391 2,178 C A1 { 1. 1. 1} A rt ic le 50 o f CR R
A.1.1Capitalinstruments eligible asCET1Capital (including share premium and net own
capitalinstruments)407 407 407 387 407 407 387 CA1 {1.1.1.1}
Articles 26(1) points (a) and(b), 27to29, 36(1) point (f)and42ofCRR
A.1.1.1 Ofwhich: CET1instruments subscribed byGovernment 407 407 407 387 407 407 387 - -
A.1.2 Retained earnings 2,171 2,265 2,339 2,404 2,069 1,973 1,857 CA1 {1.1.1.2} Articles 26(1) point (c), 26(2) and36(1) points (a) and(l)ofCRR
A.1.3 Accumulated other comprehensive income 113 94 82 74 47 13 -13 CA1 {1.1.1.3} Articles 4(100), 26(1) point (d) and 36 (1) point (l) of CRR
A.1.3.1 Of which:arising from unrealised gains/lossesfrom Sovereign exposure in AFS
portfolio63 63 63 63 49 47 41 - -
A.1.3.2 Ofwhich: arising from unrealised gains/lossesfrom the rest ofAFS portfolio 50 31 20 12 -2 -33 -54 - -
A.1.4 Other Reserves 17 17 17 17 17 17 17 CA1 {1.1.1.4} Articles 4(117) and 26(1) point (e) of CRR
A.1.5 Fundsfor general banking risk 0 0 0 0 0 0 0 CA1 {1.1.1.5} Articles 4(112), 26(1) point (f) and 36 (1) point (l) of CRR
A.1.6 Minority interest given recognition in CET1capital 241 243 245 249 245 251 259 CA1 {1.1.1.7} Article 84 of CRR
A.1.7 Adjustmentsto CET1due to prudentialfilters excluding those from unrealised
gains/lossesfrom AFS portfolio0 0 0 0 0 0 0 CA1 {1.1.1.9} Articles 32 to 35 of and 36 (1) point (l) of CRR
A.1.8 Adjustmentsto CET1due to prudentialfilters from unrealised gains/lossesfrom
Sovereign Exposure in AFS portfolio-63 -50 -38 -25 -39 -28 -17 -
A.1.9 (-)Intangible assets (including Goodwill) -215 -226 -215 -205 -226 -215 -205CA1{1.1.1.10+1.1.1.11}
Articles 4(113), 36(1) point (b) and37ofCRR. Articles4(115), 36(1) point (b) and37point (a) ofCCR
A.1.10(-)DTAs that relyon future profitabilityand don ot arise from temporary
differencesnet ofassociated DTLs-292 -264 -276 -286 -311 -361 -419 CA1 {1.1.1.12} Articles 36(1) point (c) and 38 of CRR
A.1.11 (-)IRB shortfall ofcredit risk adjustmentsto expected losses 0 0 0 0 0 0 0 CA1 {1.1.1.13} Articles 36(1) point (d), 40 and 159 of CRR
A.1.12 (-)Defined benefit pension fund assets 0 0 0 0 0 0 0 CA1 {1.1.1.14} Articles 4(109), 36(1) point (e) and 41 of CRR
A.1.13 (-)Reciprocal crossholdings in CET1Capital 0 0 0 0 0 0 0 CA1 {1.1.1.15} Articles 4(122), 36(1) point (g) and 44 of CRR
A.1.14 (-)Excess deduction from AT1items over AT1Capital 0 0 0 0 0 0 0 CA1 {1.1.1.16} Article 36(1) point (j) of CRR
A.1.15(-)Deductions related toassetswhich can alternativelybe subject toa 1.250%ri sk
weight-21 -21 -21 -21 -21 -21 -21
CA1{1.1.1.17to1.1.1.21}
Articles 4(36), 36(1) point (k) (i) and89to91 ofCRR; Articles 36(1) point (k) (ii), 243(1) point (b), 244(1) point(b) and258of CRR;Articles 36(1) point k) (iii) and379(3)ofCRR;Articles 36(1) point k) (iv) and153(8) ofCRRand
A.1.15.1 Ofwhich: from securitisation positions(-) -21 -21 -21 -21 -21 -21 -21 CA1 {1.1.1.18.1} Articles 36(1) point (k) (ii), 243(1) point (b), 244(1) point(b) and258of CRR
Baseline Scenario Adverse Scenario
OWN FUNDS

8/10/2019 Test Stress Banca Española 2014
http://slidepdf.com/reader/full/test-stress-banca-espanola-2014 173/240
( )
A.1.16(-)HoldingsofCET1capitalinstrumentsoff inancialsector entitieswhere the
institiution doesnot have a significant investment0 0 0 0 0 0 0 CA1 {1.1.1.22}
Articles 4(27), 36(1) point (h);43to 46, 49(2) and(3) and79ofCRR
A.1.17(-)Deductible DTAsthat rely on future profitability and arise from temporary
differences0 0 0 0 0 0 0 CA1 {1.1.1.23}
Articles 36(1) point (c) and38;Articles 48(1) point (a) and48(2) ofCRR
A.1.18(-)HoldingsofCET1capitalinstrumentsoff inancialsector entitieswhere the
institiution hasa significant investment0 0 0 0 0 0 0 CA1 {1.1.1.24}
Articles 4(27);36(1) point (i);43, 45;47;48(1) point (b);49(1) to(3) and79of CRR
A.1.19 (-)Amount exceding the 17.65% threshold 0 0 0 0 0 0 0 CA1 {1.1.1.25} Article 470 of CRR
A.1.20 Transitionaladjustments 296 296 289 258 353 355 331CA1{1.1.1.6+ 1.1.8+1.1.26}
-
A.1.20.1 Transitionaladjustments due tograndfathered CET1 Capitalinstruments (+/-) 0 0 0 0 0 0 0 CA1 {1.1.1.6} Articles 483(1) to(3), and484to 487ofCRR
A.1.20.2 Transitionaladjustments due toadditional minority interests(+/-) 50 58 49 35 35 15 0 CA1 {1.1.1.8} Articles 479and 480ofCRR
A.1.20.3Other transitionaladjustments toCET1 Capitalexcl. adjustmentsfor Sovereign
exposure in AFS (+/-)246 238 240 223 318 340 331 CA1 {1.1.1.26}
Articles 469to 472, 478and481of CRR
A.2 ADDITIONAL TIER 1CAPITAL (net of deductionsand after transitional
adjustments)0 0 0 0 0 0 0 C A1 { 1. 1. 2} A rt ic le 61 o f CR R
A.2.1 Ofwhich: (+)Other existing support government measures 0 0 0 0 0 0 0 - -
A.3 TIER1 CAPITAL(net ofdeductions andafter transitional adjustments) 2,655 2,761 2,829 2,852 2,540 2,391 2,178 C A1 { 1. 1} A rt ic le 25 of C RR
A.4 TIER2 CAPITAL(net ofdeductions andafter transitional adjustments) 177 162 114 80 162 114 80 C A1 { 1. 2} A rt ic le 71 of C RR
B T O TA L R IS K E XP OS UR E A MO U NT 26,475 26,711 26,865 26,970 26,972 27,336 27,647 C A2 { 1} A rt ic le s 92 (3 ), 9 5, 9 6 an d 98 o f CR R
B.1ofwhich:stemming from exposuresthat fallbelow the 10%/15%limitsfor
CET1deduction (+)399 0 0 0 0 0 0
Articles 36(1) points (a) and(i);Article 38and Article 48of CRR
B .2 o f wh ic h:s te mming f rom from CVAcap i ta l re qui re me nts ( + ) 198 0 0 0 0 0 0 Article 381to386ofCRR
B.3ofwhich: stemming from higher asset correlation parameter against exposures
tolarge financialinstitutions under IRB the IRB approachesto credit risk(+)0 0 0 0 0 0 0 Articles 153(2) ofCRR
B.4ofwhich: stemming from the application ofthe supporting factor toincrease
lending to SMEs(-)-423 0 0 0 0 0 0 Recital (44) ofCRR
B.5ofwhich: stemming from the effect ofexposuresthat were previouslypart of
RiskExposure amount and receive a deduction treatment under CRR/CRDIV (-
)
0 0 0 0 0 0 0 -
B .6 o f wh ic h:o the rs s ub je c t t o t he d isc ret ion o f Na t iona lCompete nt Author i t ie s 0 0 0 0 0 0 0 Article 124to164ofCRR
C . 1 C ommonEquityT ier 1C a pita l ra tio 10.03% 10.34% 10.53% 10.58% 9.42% 8.75% 7.88% CA3 {1} -
C .2 T i er 1 C ap i ta l r at i o 10.03% 10.34% 10.53% 10.58% 9.42% 8.75% 7.88% CA3 {3} -
C .3 T ot al Ca pi ta l r at io 10.70% 10.94% 10.96% 10.87% 10.02% 9.17% 8.17% CA3 { 5} -
D C ommonEquityT ier 1C a pita l Thres hold 2,137 2,149 2,158 1,483 1,504 1,521
ETotalamount ofinstruments with mandatoryconversion intoordinary sharesupon
a fixed date in the 2014-2016period (cumulative conversions) (1)0 0 0 0 0 0
F
TotalAdditionalTier 1 and Tier 2instrumentseligible as regulatorycapitalunder
the CRR provisionsthat convert intoCommon Equity Tier 1or are written down
upon a trigger event (2)
0 0 0
F.1Ofwhich: eligible instrumentswhose trigger isabove CET1capital ratioin the
adverse scenario(2)0 0 0
G F ullyLoa de dC ommonEquityT ie r 1C apital rat io ( 3) 9.62% 6.68%
(1)Conversionsnot considered for CET1 computation (2)Excluding instrumentsincluded in E (3)Memorandum item based on a fullyimplemented CRR/CRD IV definition of Common EquityTier 1 capitalincluding 60%ofunrealised gains/lossesfrom Sovereign Exposure in AFS portfolio
Memorandumitems
OWN FUNDSREQUIREMENTS
CAPITALRATIOS(%) -Transitional period
http://www.economiaciudadana.org/
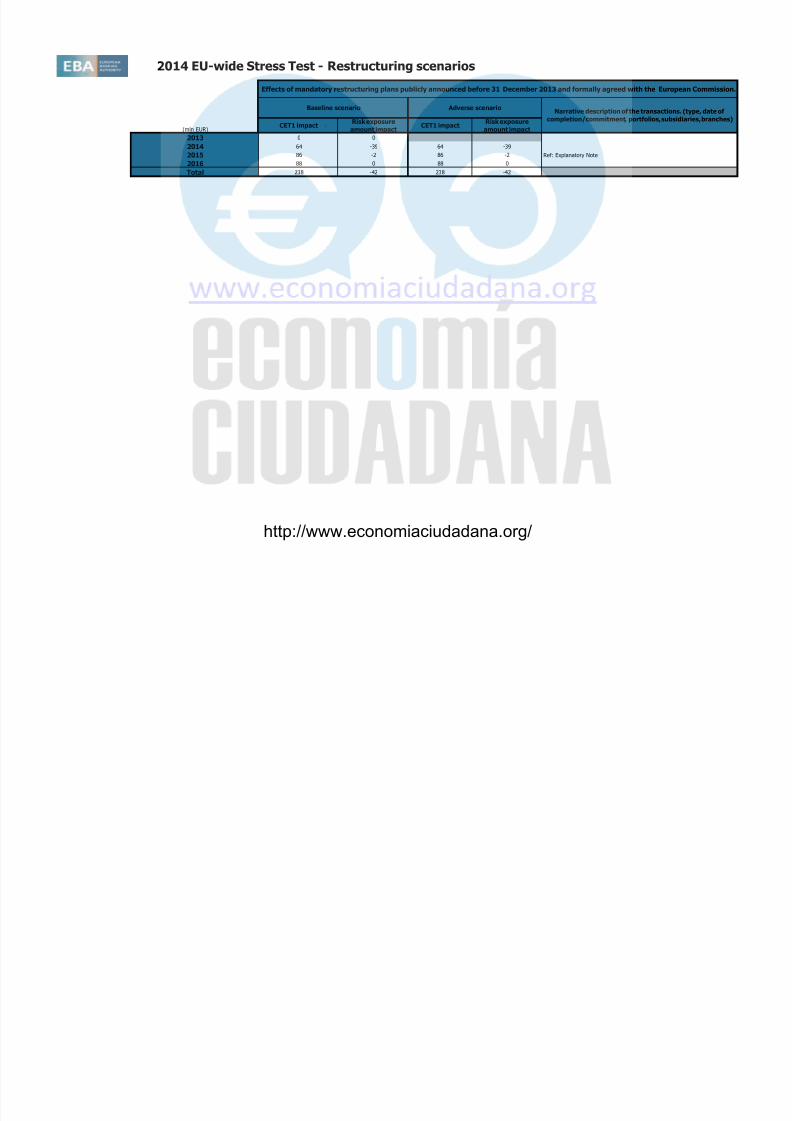
8/10/2019 Test Stress Banca Española 2014
http://slidepdf.com/reader/full/test-stress-banca-espanola-2014 174/240

8/10/2019 Test Stress Banca Española 2014
http://slidepdf.com/reader/full/test-stress-banca-espanola-2014 175/240
2014 EU-wide Stress Test
Impact on CommonEquity Tier 1Million EUR
Raising of capital instruments eligible as CET1 capital (+) 0
Repayment of CET1 capital, buybacks (-) 0
Conversion to CET1 of hybrid instruments becoming effective between 1 January and 30 September 2014 (+) 0
Major Capital Measures from 1 January to 30 September 2014
Issuance of CET 1 Instruments
Major Capital Measures Impacting Tier 1 and Tier 2 Eligible Capital from 1 January 2014 to 30 September 2014

8/10/2019 Test Stress Banca Española 2014
http://slidepdf.com/reader/full/test-stress-banca-espanola-2014 176/240
Impact on AdditionalTier 1 and Tier 2
Million EUR Net issuance of Additional Tier 1 and T2 Instruments with a trigger at or above bank's post stress test CET1 ratio in the adversescenario during the stress test horizon (+/-)
0
Net issuance of Additional Tier 1 and T2 Instrument with a trigger below bank's post stress test CET1 ratio in the adverse
scenario during the stress test horizon (+/-)0
Million EUR
Realized fines/litigation costs from 1 January to 30 September 2014 (net of provisions) (-) 0
Other material losses and provisions from 1 January to 30 September 2014 (-) 0
Losses
Net issuance of Additional Tier 1 and T2 Instruments
http://www.economiaciudadana.org/
Bank Name ES - Cajas Rurales Unidas, Sociedad Cooperativa de Crédito
LEI Code 635400CE9HHFB55PEY43
ES
NUK_WL_NR_XX
2014 EU-wide Stress Test

8/10/2019 Test Stress Banca Española 2014
http://slidepdf.com/reader/full/test-stress-banca-espanola-2014 177/240
version
1809014
No restructuring
http://www.economiaciudadana.org/
Actual figures as of 31 December 2013 mln EUR, % Actual figures as of 31 December 2013 mln EUR, %Operating profit before impairments 434 Operating profit before impairments 434
Impairment losses on financial and non-financial assets in the banking book 679 Impairment losses on financial and non-financial assets in the banking book 679
Common Equity Tier 1 capital (1) 2,198 Common Equity Tier 1 capital (1) 2,198
Total Risk Exposure (1) 22,098 Total Risk Exposure (1) 22,098
Common Equity Tier 1 ratio, % (1) 9.9% Common Equity Tier 1 ratio, % (1) 9.9%
Outcome of the adverse scenario as of 31 December 2016 mln EUR, % Outcome of the baseline scenario as of 31 December 2016 mln EUR, %
3 yr cumulative operating profit before impairments 674 3 yr cumulative operating profit before impairments 851
3 yr cumulative impairment losses on financial and non-financial assets in the banking book 1,157 3 yr cumulative impairment losses on financial and non-financial assets in the banking book 569
3 yr cumulative losses from the stress in the trading book 19 3 yr cumulative losses from the stress in the trading book 13
Valuation losses due to sovereign shock after tax and prudential filters 137 Common Equity Tier 1 capital (1) 2,382
Common Equity Tier 1 capital (1) 1,900 Total Risk Exposure (1) 23,332
Total Risk Exposure (1) 23,789 Common Equity Tier 1 ratio, % (1) 10.2%
Common Equity Tier 1 ratio, % (1) 8.0%
Memorandum items mln EUR Memorandum items mln EUR Common EU wide CET1 Threshold (8.0%) 1,867
Common EU wide CET1 Threshold (5 5%) 1 308
2014 EU-wide Stress Test 2014 EU-wide Stress TestSummary Baseline Scenario
ES - Cajas Rurales Unidas, Sociedad Cooperativa de Crédito
(1) According to CRR/CRD4 definition transitional arrangements as per reporting date. Figures as of 31/12/2013 computed as of first day of application:
Summary Adverse Scenario
ES - Cajas Rurales Unidas, Sociedad Cooperativa de Crédito
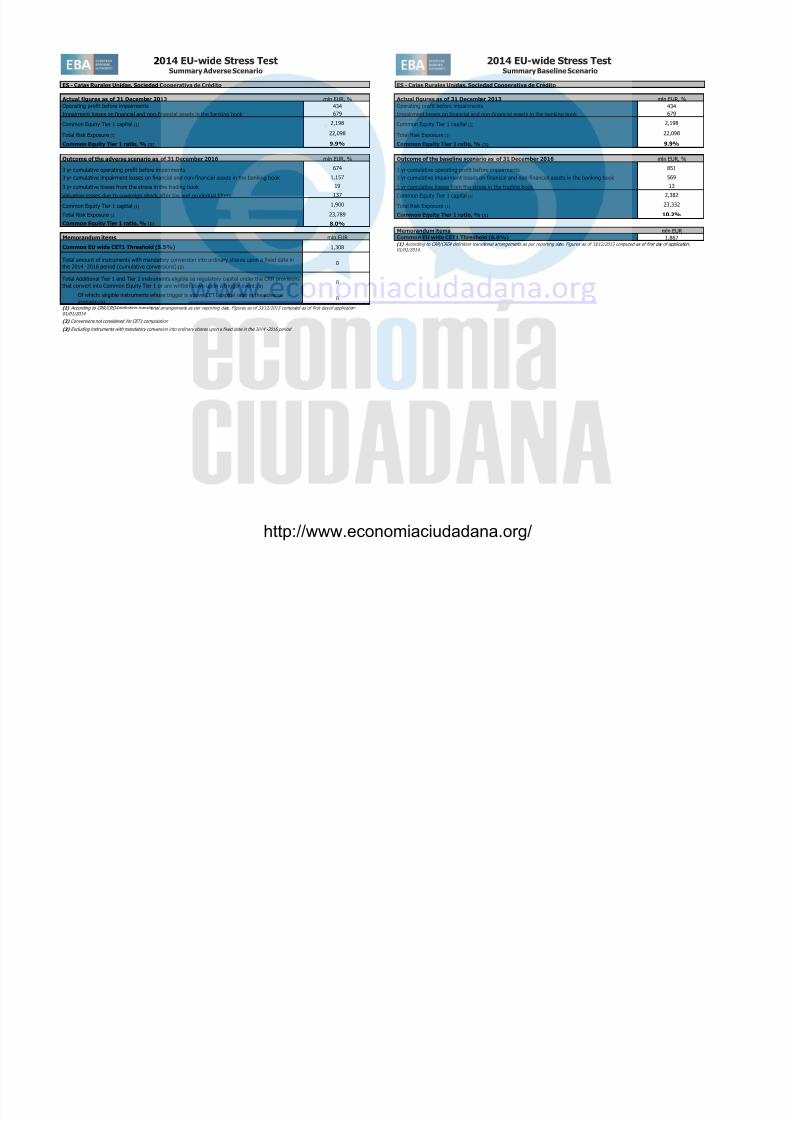
8/10/2019 Test Stress Banca Española 2014
http://slidepdf.com/reader/full/test-stress-banca-espanola-2014 178/240
Common EU wide CET1 Threshold (5.5%) 1,308
Total amount of instruments with mandatory conversion into ordinary shares upon a fixed date inthe 2014 -2016 period (cumulative conversions) (2)
0
Total Additional Tier 1 and Tier 2 instruments eligible as regulatory capital under the CRR provisions
that convert into Common Equity Tier 1 or are written down upon a trigger event (3)0
Of which: eligible instruments whose trigger is above CET1 capital ratio in the adversescenario (3)
0
(2) Conversions not considered for CET1 computation
(3) Excluding instruments with mandatory conversion into ordinary shares upon a fixed date in the 2014 -2016 period
(1) According to CRR/CRD4 definition transitional arrangements as per reporting date. Figures as of 31/12/2013 computed as of first day of application:
01/01/2014.
01/01/2014.
http://www.economiaciudadana.org/
2014 EU-wide Stress TestCredit Risk
(mln EUR, %)
Non-defaulted Defaulted Non-defaulted Defaulted Non-defaulted Defaulted Non-defaulted Defaulted Non-defaulted Defaulted Non-defaulted Defaulted Non-defaulted Defaulted Non-defaulted Defaulted Non-defaulted DefaultedImpairment
rateStockof
ProvisionsCoverage Ratio -
Default Stock
Impairmentrate
Stockof Provisions
Coverage
Ratio -DefaultStock
Impairmentrate
Stockof Provisions
Coverage
Ratio -DefaultStock
Impairment rateStockof
Provisions
Coverage
Ratio -DefaultStock
Impairmentrate
Stockof Provisions
Coverage
Ratio -DefaultStock
Impairmentrate
Stockof Provisions
Coverage
Ratio -DefaultStock
Central banksandcentral governments 0 0 0 0 3,868 3 0 0 0 0 6 5 0 0 0 0 0 0 0.01% 0 2.07% 0.01% 0 3.60% 0.01% 0 4.83% 1.06% 11 35.51% 1.06% 21 37.59% 1.06% 32 38.34%Institutions 0 0 0 0 3,895 5 0 0 0 0 113 5 0 0 0 0 0 6 0.01% 8 52.23% 0.01% 8 52.07% 0.01% 9 51.87% 0.19% 14 42.79% 0.19% 24 45.23% 0.19% 34 46.31%Corporates 0 0 0 0 3,863 2,226 0 0 0 0 3,333 3,531 0 0 0 0 184 1,710 -3.38% 1,912 39.08% 0.84% 1,950 38.91% 0.76% 1,980 38.77% -2.66% 1,974 39.95% 2.03% 2,043 39.45% 2.04% 2,110 39.13%
Corporates - OfWhich:SpecialisedLending 0 0 0 0 6 8 0 0 0 0 6 8 0 0 0 0 0 16 - 0 - - 0 - - 0 - - 0 - - 0 - - 0 -Corporates -OfWhich: SME 0 0 0 0 2,768 1,800 0 0 0 0 2,291 1,985 0 0 0 0 163 1,386 - 0 - - 0 - - 0 - - 0 - - 0 - - 0 -
Retail 0 0 0 0 21,353 1,544 0 0 0 0 9,068 1,504 0 0 0 0 76 763 0.41% 1,177 36.45% 0.34% 1,269 35.08% 0.31% 1,363 34.46% 0.65% 1,304 39.01% 0.66% 1,462 37.63% 0.65% 1,619 36.72%Retail -Securedon real estateproperty 61.6% 0 0 0 0 14,475 953 0 0 0 0 5,263 871 0 0 0 0 38 335 0.19% 440 25.72% 0.15% 474 24.85% 0.11% 514 24.89% 0.38% 483 26.80% 0.43% 556 26.43% 0.43% 632 26.45%
Retail -Securedon real estate property-Of h i h : S E
63.1% 0 0 0 0 703 129 0 0 0 0 244 127 0 0 0 0 5 63 0.63% 101 38.27% 0.45% 111 37.42% 0.36% 120 37.37% 0.88% 103 37.92% 0.74% 115 36.80% 0.60% 131 38.17%Retail -Securedon real estate property-Of
h i h: n n - E61.5% 0 0 0 0 13,772 824 0 0 0 0 5,018 743 0 0 0 0 33 273 0.17% 338 23.49% 0.13% 363 22.60% 0.10% 394 22.66% 0.36% 380 24.91% 0.42% 441 24.71% 0.42% 502 24.56%
Retail -QualifyingRevolving 0 0 0 0 115 1 0 0 0 0 86 1 0 0 0 0 0 6 0.74% 8 90.57% 0.88% 10 90.03% 0.85% 11 88.73% 1.14% 9 96.68% 1.36% 12 97.50% 1.27% 14 95.53%Retail -OtherRetail 0 0 0 0 6,763 590 0 0 0 0 3,719 633 0 0 0 0 37 421 0.87% 729 49.15% 0.76% 785 46.93% 0.73% 838 45.23% 1.23% 812 53.92% 1.13% 895 51.32% 1.13% 973 49.27%
Retail -OtherRetail -OfWhich:SME 0 0 0 0 5,238 487 0 0 0 0 2,683 515 0 0 0 0 32 330 0.95% 582 48.12% 0.84% 630 45.84% 0.82% 675 44.13% 1.32% 638 51.86% 1.24% 707 49.27% 1.26% 772 47.25%Retail -OtherRetail -OfWhich:non-SME 0 0 0 0 1,525 103 0 0 0 0 1,036 117 0 0 0 0 6 92 0.61% 147 53.75% 0.46% 155 52.00% 0.44% 163 50.57% 0.90% 174 63.09% 0.79% 188 60.79% 0.70% 201 59.03%
Equity 0 0 0 0 185 0 0 0 0 0 191 0 0 0 0 0 0 0 0.00% 0 - 0.00% 0 - 0.00% 0 - 0.00% 0 - 0.00% 0 - 0.00% 0 -Securitisation 0 0 0 0 221 0 0 0 0 0 159 0 0 0 0 0 10 0Othernon-credit obligation assets 0 0 0 0 3,698 0 0 0 0 0 2,462 0 0 0 0 0 1,085 0TOTAL 0 0 0 0 37,083 3,778 0 0 0 0 15,331 5,046 0 0 0 0 1,355 2,479 -0.14% 3,096 38.06% 0.35% 3,227 37.33% 0.31% 3,352 36.91% 0.19% 3,303 39.58% 0.78% 3,551 38.71% 0.76% 3,794 38.12%Securitisation andre-securitisations positions deductedfrom capital * 0 0 0 0 0 0 0 0 0 0 0 0
(mln EUR, %)Non-defaulted Defaulted Non-defaulted Defaulted Non-defaulted Defaulted Non-defaulted Defaulted Non-defaulted Defaulted Non-defaulted Defaulted Non-defaulted Defaulted Non-defaulted Defaulted Non-defaulted Defaulted Impairment
rateStockof
ProvisionsCoverage Ratio -
Default Stock
Impairmentrate
Stockof Provisions
Coverage
Ratio -Default
Stock
Impairmentrate
Stockof Provisions
Coverage
Ratio -Default
Stock
Impairment rateStockof
Provisions
Coverage
Ratio -Default
Stock
Impairmentrate
Stockof Provisions
Coverage
Ratio -Default
Stock
Impairmentrate
Stockof Provisions
Coverage
Ratio -Default
Stock
Central banksandcentral governments 0 0 0 0 0 0 0 0 0 0 0 0 0 0 0 0 0 0 - 0 - - 0 - - 0 - - 0 - - 0 - - 0 -Institutions 0 0 0 0 0 0 0 0 0 0 0 0 0 0 0 0 0 0 - 0 - - 0 - - 0 - - 0 - - 0 - - 0 -Corporates 0 0 0 0 0 0 0 0 0 0 0 0 0 0 0 0 0 0 - 0 - - 0 - - 0 - - 0 - - 0 - - 0 -
Corporates - OfWhich:SpecialisedLending 0 0 0 0 0 0 0 0 0 0 0 0 0 0 0 0 0 0 - 0 - - 0 - - 0 - - 0 - - 0 - - 0 -Corporates -OfWhich: SME 0 0 0 0 0 0 0 0 0 0 0 0 0 0 0 0 0 0 - 0 - - 0 - - 0 - - 0 - - 0 - - 0 -
Retail 0 0 0 0 0 0 0 0 0 0 0 0 0 0 0 0 0 0 - 0 - - 0 - - 0 - - 0 - - 0 - - 0 -Retail -Securedon real estateproperty 0.0% 0 0 0 0 0 0 0 0 0 0 0 0 0 0 0 0 0 0 - 0 - - 0 - - 0 - - 0 - - 0 - - 0 -
Retail -Securedon real estate property-Of hi h: E
0.0% 0 0 0 0 0 0 0 0 0 0 0 0 0 0 0 0 0 0 - 0 - - 0 - - 0 - - 0 - - 0 - - 0 -Retail -Securedon real estate property-Of
h i h : n n -S E0.0% 0 0 0 0 0 0 0 0 0 0 0 0 0 0 0 0 0 0 - 0 - - 0 - - 0 - - 0 - - 0 - - 0 -
Retail QualifyingRevolving 0 0 0 0 0 0 0 0 0 0 0 0 0 0 0 0 0 0 0 0 0 0 0 0
Risk exposureamounts(asof31/12/2013)
Baseline Scenario Adverse ScenarioF-IRB A-IRB STA F-IRB A-IRB STA F-IRB A-IRB STA as of 31/12/2014 as of 31/12/2015 as of 31/12/2016 as of 31/12/2014 as of 31/12/2015 as of 31/12/2016
asof31/12/2016
Spain
LTV %(asof 31/12/2013)
E xp os ur ev al ue s( as of 3 1/ 12 /2 01 3) R is k e xp os ur e am ou nt s (a so f3 1/ 12 /2 01 3) V al ue ad ju st me nt s an dp ro vi si on s( as of 3 1/ 12 /2 01 3)
AdverseScenarioF-IRB A-IRB STA F-IRB A-IRB STA F-IRB A-IRB STA as of 31/12/2014 as of 31/12/2015 as of 31/12/2016 as of 31/12/2014 as of 31/12/2015 as of 31/12/2016LTV %(asof
31/12/2013)
Exposurevalues(asof31/12/2013)
ES - Cajas Rurales Unidas,Sociedad Cooperativa de
Crédito
(*)Referstothepart ofSecuritizationexposurethat isdeductedfrom capital andisnot includedinRWA
Valueadjustmentsandprovisions(asof 31/12/2013) BaselineScenario
LTV %(asof 31/12/2013)
Exposure values (as of 31/12/2013) Risk exposure amounts (as of 31/12/2013) Value adjustments and provisions (as of 31/12/2013) Adverse Scenario
F-IRB A-IRB STA F-IRB A-IRB STA F-IRB A-IRB STA
BaselineScenario
as of 31/12/2014 as of 31/12/2015 as of 31/12/2016 as of 31/12/2014 as of 31/12/2015
(*)Referstothepart ofSecuritizationexposurethat isdeductedfrom capital andisnot includedinRWA
Please, select the country
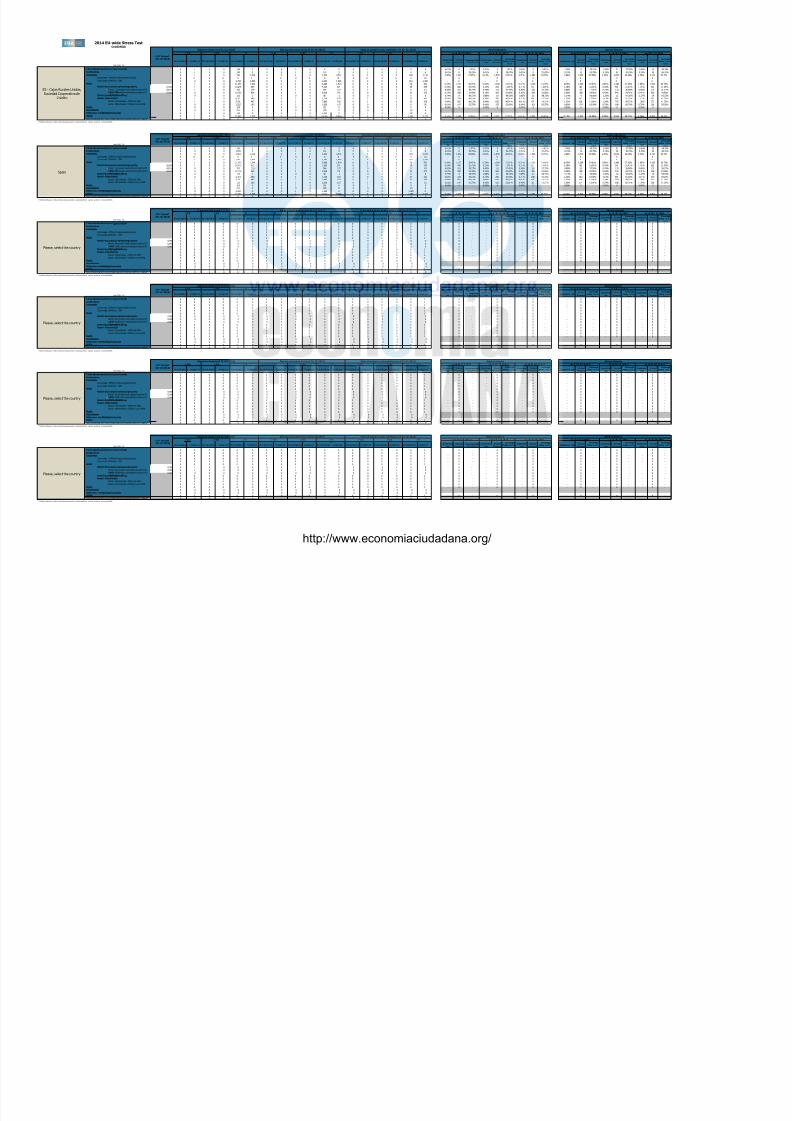
8/10/2019 Test Stress Banca Española 2014
http://slidepdf.com/reader/full/test-stress-banca-espanola-2014 179/240
h i h : n n -S ERetail -QualifyingRevolving 0 0 0 0 0 0 0 0 0 0 0 0 0 0 0 0 0 0 - 0 - - 0 - - 0 - - 0 - - 0 - - 0 -Retail -OtherRetail 0 0 0 0 0 0 0 0 0 0 0 0 0 0 0 0 0 0 - 0 - - 0 - - 0 - - 0 - - 0 - - 0 -
Retail -OtherRetail -OfWhich:SME 0 0 0 0 0 0 0 0 0 0 0 0 0 0 0 0 0 0 - 0 - - 0 - - 0 - - 0 - - 0 - - 0 -Retail -OtherRetail -OfWhich:non-SME 0 0 0 0 0 0 0 0 0 0 0 0 0 0 0 0 0 0 - 0 - - 0 - - 0 - - 0 - - 0 - - 0 -
Equity 0 0 0 0 0 0 0 0 0 0 0 0 0 0 0 0 0 0 - 0 - - 0 - - 0 - - 0 - - 0 - - 0 -Securitisation 0 0 0 0 0 0 0 0 0 0 0 0 0 0 0 0 0 0Othernon-credit obligation assets 0 0 0 0 0 0 0 0 0 0 0 0 0 0 0 0 0 0TOTAL 0 0 0 0 0 0 0 0 0 0 0 0 0 0 0 0 0 0 - 0 - - 0 - - 0 - - 0 - - 0 - - 0 -Securitisation andre-securitisations positions deductedfrom capital * 0 0 0 0 0 0 0 0 0 0 0 0
(mln EUR, %)Non-defaulted Defaulted Non-defaulted Defaulted Non-defaulted Defaulted Non-defaulted Defaulted Non-defaulted Defaulted Non-defaulted Defaulted Non-defaulted Defaulted Non-defaulted Defaulted Non-defaulted Defaulted
Impairmentrate
Stockof Provisions
Coverage Ratio -
Default Stock
Impairmentrate
Stockof Provisions
Coverage
Ratio -DefaultStock
Impairmentrate
Stockof Provisions
Coverage
Ratio -DefaultStock
Impairment rateStockof
Provisions
Coverage
Ratio -DefaultStock
Impairmentrate
Stockof Provisions
Coverage
Ratio -DefaultStock
Impairmentrate
Stockof Provisions
Coverage
Ratio -DefaultStock
Central banksandcentral governments 0 0 0 0 0 0 0 0 0 0 0 0 0 0 0 0 0 0 - 0 - - 0 - - 0 - - 0 - - 0 - - 0 -Institutions 0 0 0 0 0 0 0 0 0 0 0 0 0 0 0 0 0 0 - 0 - - 0 - - 0 - - 0 - - 0 - - 0 -Corporates 0 0 0 0 0 0 0 0 0 0 0 0 0 0 0 0 0 0 - 0 - - 0 - - 0 - - 0 - - 0 - - 0 -
Corporates - OfWhich:SpecialisedLending 0 0 0 0 0 0 0 0 0 0 0 0 0 0 0 0 0 0 - 0 - - 0 - - 0 - - 0 - - 0 - - 0 -Corporates -OfWhich: SME 0 0 0 0 0 0 0 0 0 0 0 0 0 0 0 0 0 0 - 0 - - 0 - - 0 - - 0 - - 0 - - 0 -
Retail 0 0 0 0 0 0 0 0 0 0 0 0 0 0 0 0 0 0 - 0 - - 0 - - 0 - - 0 - - 0 - - 0 -Retail -Securedon real estateproperty 0.0% 0 0 0 0 0 0 0 0 0 0 0 0 0 0 0 0 0 0 - 0 - - 0 - - 0 - - 0 - - 0 - - 0 -
Retail -Securedon real estate property-Of hi h: E
0.0% 0 0 0 0 0 0 0 0 0 0 0 0 0 0 0 0 0 0 - 0 - - 0 - - 0 - - 0 - - 0 - - 0 -Retail -Securedon real estate property-Of
h i h: n n - E0.0% 0 0 0 0 0 0 0 0 0 0 0 0 0 0 0 0 0 0 - 0 - - 0 - - 0 - - 0 - - 0 - - 0 -
Retail -QualifyingRevolving 0 0 0 0 0 0 0 0 0 0 0 0 0 0 0 0 0 0 - 0 - - 0 - - 0 - - 0 - - 0 - - 0 -Retail -OtherRetail 0 0 0 0 0 0 0 0 0 0 0 0 0 0 0 0 0 0 - 0 - - 0 - - 0 - - 0 - - 0 - - 0 -
Retail -OtherRetail -OfWhich:SME 0 0 0 0 0 0 0 0 0 0 0 0 0 0 0 0 0 0 - 0 - - 0 - - 0 - - 0 - - 0 - - 0 -Retail -OtherRetail -OfWhich:non-SME 0 0 0 0 0 0 0 0 0 0 0 0 0 0 0 0 0 0 - 0 - - 0 - - 0 - - 0 - - 0 - - 0 -
Equity 0 0 0 0 0 0 0 0 0 0 0 0 0 0 0 0 0 0 - 0 - - 0 - - 0 - - 0 - - 0 - - 0 -Securitisation 0 0 0 0 0 0 0 0 0 0 0 0 0 0 0 0 0 0Othernon-credit obligation assets 0 0 0 0 0 0 0 0 0 0 0 0 0 0 0 0 0 0TOTAL 0 0 0 0 0 0 0 0 0 0 0 0 0 0 0 0 0 0 - 0 - - 0 - - 0 - - 0 - - 0 - - 0 -Securitisation andre-securitisations positions deductedfrom capital * 0 0 0 0 0 0 0 0 0 0 0 0
(mln EUR, %)Non-defaulted Defaulted Non-defaulted Defaulted Non-defaulted Defaulted Non-defaulted Defaulted Non-defaulted Defaulted Non-defaulted Defaulted Non-defaulted Defaulted Non-defaulted Defaulted Non-defaulted Defaulted
Impairmentrate
Stockof Provisions
Coverage Ratio -
Default Stock
Impairmentrate
Stockof Provisions
Coverage
Ratio -DefaultStock
Impairmentrate
Stockof Provisions
Coverage
Ratio -DefaultStock
Impairment rateStockof
Provisions
Coverage
Ratio -DefaultStock
Impairmentrate
Stockof Provisions
Coverage
Ratio -DefaultStock
Impairmentrate
Stockof Provisions
Coverage
Ratio -DefaultStock
Central banksandcentral governments 0 0 0 0 0 0 0 0 0 0 0 0 0 0 0 0 0 0 - 0 - - 0 - - 0 - - 0 - - 0 - - 0 -Institutions 0 0 0 0 0 0 0 0 0 0 0 0 0 0 0 0 0 0 - 0 - - 0 - - 0 - - 0 - - 0 - - 0 -Corporates 0 0 0 0 0 0 0 0 0 0 0 0 0 0 0 0 0 0 - 0 - - 0 - - 0 - - 0 - - 0 - - 0 -
Corporates - OfWhich:SpecialisedLending 0 0 0 0 0 0 0 0 0 0 0 0 0 0 0 0 0 0 - 0 - - 0 - - 0 - - 0 - - 0 - - 0 -Corporates -OfWhich: SME 0 0 0 0 0 0 0 0 0 0 0 0 0 0 0 0 0 0 - 0 - - 0 - - 0 - - 0 - - 0 - - 0 -
Retail 0 0 0 0 0 0 0 0 0 0 0 0 0 0 0 0 0 0 - 0 - - 0 - - 0 - - 0 - - 0 - - 0 -Retail -Securedon real estateproperty 0.0% 0 0 0 0 0 0 0 0 0 0 0 0 0 0 0 0 0 0 - 0 - - 0 - - 0 - - 0 - - 0 - - 0 -
Retail -Securedon real estate property-Of hi h: E
0.0% 0 0 0 0 0 0 0 0 0 0 0 0 0 0 0 0 0 0 - 0 - - 0 - - 0 - - 0 - - 0 - - 0 -Retail -Securedon real estate property-Of
h i h : n n -S E0.0% 0 0 0 0 0 0 0 0 0 0 0 0 0 0 0 0 0 0 - 0 - - 0 - - 0 - - 0 - - 0 - - 0 -
Retail -QualifyingRevolving 0 0 0 0 0 0 0 0 0 0 0 0 0 0 0 0 0 0 - 0 - - 0 - - 0 - - 0 - - 0 - - 0 -Retail -OtherRetail 0 0 0 0 0 0 0 0 0 0 0 0 0 0 0 0 0 0 - 0 - - 0 - - 0 - - 0 - - 0 - - 0 -
Retail -OtherRetail -OfWhich:SME 0 0 0 0 0 0 0 0 0 0 0 0 0 0 0 0 0 0 - 0 - - 0 - - 0 - - 0 - - 0 - - 0 -Retail -OtherRetail -OfWhich:non-SME 0 0 0 0 0 0 0 0 0 0 0 0 0 0 0 0 0 0 - 0 - - 0 - - 0 - - 0 - - 0 - - 0 -
Equity 0 0 0 0 0 0 0 0 0 0 0 0 0 0 0 0 0 0 - 0 - - 0 - - 0 - - 0 - - 0 - - 0 -Securitisation 0 0 0 0 0 0 0 0 0 0 0 0 0 0 0 0 0 0Othernon-credit obligation assets 0 0 0 0 0 0 0 0 0 0 0 0 0 0 0 0 0 0TOTAL 0 0 0 0 0 0 0 0 0 0 0 0 0 0 0 0 0 0 - 0 - - 0 - - 0 - - 0 - - 0 - - 0 -Securitisation andre-securitisations positions deductedfrom capital * 0 0 0 0 0 0 0 0 0 0 0 0
(mln EUR, %)Non-defaulted Defaulted Non-defaulted Defaulted Non-defaulted Defaulted Non-defaulted Defaulted Non-defaulted Defaulted Non-defaulted Defaulted Non-defaulted Defaulted Non-defaulted Defaulted Non-defaulted Defaulted
Impairmentrate
Stockof Provisions
Coverage Ratio -Default Stock
Impairmentrate
Stockof Provisions
Coverage
Ratio -DefaultStock
Impairmentrate
Stockof Provisions
Coverage
Ratio -DefaultStock
Impairment rateStockof
Provisions
Coverage
Ratio -DefaultStock
Impairmentrate
Stockof Provisions
Coverage
Ratio -DefaultStock
Impairmentrate
Stockof Provisions
Coverage
Ratio -DefaultStock
Central banksandcentral governments 0 0 0 0 0 0 0 0 0 0 0 0 0 0 0 0 0 0 - 0 - - 0 - - 0 - - 0 - - 0 - - 0 -Institutions 0 0 0 0 0 0 0 0 0 0 0 0 0 0 0 0 0 0 - 0 - - 0 - - 0 - - 0 - - 0 - - 0 -Corporates 0 0 0 0 0 0 0 0 0 0 0 0 0 0 0 0 0 0 - 0 - - 0 - - 0 - - 0 - - 0 - - 0 -
Corporates - OfWhich:SpecialisedLending 0 0 0 0 0 0 0 0 0 0 0 0 0 0 0 0 0 0 - 0 - - 0 - - 0 - - 0 - - 0 - - 0 -Corporates -OfWhich: SME 0 0 0 0 0 0 0 0 0 0 0 0 0 0 0 0 0 0 - 0 - - 0 - - 0 - - 0 - - 0 - - 0 -
Retail 0 0 0 0 0 0 0 0 0 0 0 0 0 0 0 0 0 0 - 0 - - 0 - - 0 - - 0 - - 0 - - 0 -Retail -Securedon real estateproperty 0.0% 0 0 0 0 0 0 0 0 0 0 0 0 0 0 0 0 0 0 - 0 - - 0 - - 0 - - 0 - - 0 - - 0 -
Retail -Securedon real estate property-Of hi h: E
0.0% 0 0 0 0 0 0 0 0 0 0 0 0 0 0 0 0 0 0 - 0 - - 0 - - 0 - - 0 - - 0 - - 0 -Retail -Securedon real estate property-Of
h i h: n n - E
0.0% 0 0 0 0 0 0 0 0 0 0 0 0 0 0 0 0 0 0 - 0 - - 0 - - 0 - - 0 - - 0 - - 0 -
Retail -QualifyingRevolving 0 0 0 0 0 0 0 0 0 0 0 0 0 0 0 0 0 0 - 0 - - 0 - - 0 - - 0 - - 0 - - 0 -Retail -OtherRetail 0 0 0 0 0 0 0 0 0 0 0 0 0 0 0 0 0 0 - 0 - - 0 - - 0 - - 0 - - 0 - - 0 -
Retail -OtherRetail -OfWhich:SME 0 0 0 0 0 0 0 0 0 0 0 0 0 0 0 0 0 0 - 0 - - 0 - - 0 - - 0 - - 0 - - 0 -Retail -OtherRetail -OfWhich:non-SME 0 0 0 0 0 0 0 0 0 0 0 0 0 0 0 0 0 0 - 0 - - 0 - - 0 - - 0 - - 0 - - 0 -
Equity 0 0 0 0 0 0 0 0 0 0 0 0 0 0 0 0 0 0 - 0 - - 0 - - 0 - - 0 - - 0 - - 0 -Securitisation 0 0 0 0 0 0 0 0 0 0 0 0 0 0 0 0 0 0Othernon-credit obligation assets 0 0 0 0 0 0 0 0 0 0 0 0 0 0 0 0 0 0TOTAL 0 0 0 0 0 0 0 0 0 0 0 0 0 0 0 0 0 0 - 0 - - 0 - - 0 - - 0 - - 0 - - 0 -Securitisation andre-securitisations positions deductedfrom capital * 0 0 0 0 0 0 0 0 0 0 0 0
as of 31/12/2016 as of 31/12/2014 as of 31/12/2015 as of 31/12/2016
Please, select the country
F-IRB A-IRB STA a so f3 1/ 12 /2 01 4 a so f 31 /1 2/ 20 15LTV %(asof 31/12/2013)
Exposure values (as of 31/12/2013) Risk exposure amounts (as of 31/12/2013) Value adjustments and provisions (as of 31/12/2013) Baseline Scenario Adverse Scenario
F-IRB A-IRB STA F-IRB A-IRB STA
LTV %(asof 31/12/2013)
Exposure values (as of 31/12/2013) Risk exposure amounts (as of 31/12/2013) Value adjustments and provisions (as of 31/12/2013) Baseline Scenario Adverse Scenario
F-IRB A-IRB STA F-IRB A-IRB STA F-IRB as of 31 /12 /2 01 4 as of 31/ 12 /2 01 5 as of 31 /12 /2 01 6 A-IRB STA as of 31 /1 2/ 20 14 as of 31/ 12 /2 01 5 as of 31 /12 /2 01 6
LTV %(asof 31/12/2013)
Exposure values (as of 31/12/2013) Risk exposure amounts (as of 31/12/2013) Value adjustments and provisions (as of 31/12/2013) Baseline Scenario Adverse Scenario
F-IRB A-IRB STA F-IRB A-IRB STA F-IRB A-IRB a so f 31 /1 2/ 20 15 a so f3 1/ 12 /2 01 6STA as of 31/12/2014 as of 31/12/2015 as of 31/12/2016 as of 31/12/2014
(*)Referstothepart ofSecuritizationexposurethat isdeductedfrom capital andisnot includedinRWA
(*)Referstothepart ofSecuritizationexposurethat isdeductedfrom capital andisnot includedinRWA
(*)Referstothepart ofSecuritizationexposurethat isdeductedfrom capital andisnot includedinRWA
(*)Referstothepart ofSecuritizationexposurethat isdeductedfrom capital andisnot includedinRWA
, y
Please, select the country
Please, select the country
http://www.economiaciudadana.org/
2014 EU-wide Stress TestCredit Risk
31 1 13) 31 1 13) 31 1 13)
(mln EU
R, %)Non-defaulted Defaulted Non-defaulted Defaulted Non-defaulted Defaulted Non-defaulted Defaulted Non-defaulted Defaulted Non-defaulted Defaulted Non-defaulted Defaulted Non-defaulted Defaulted Non-defaulted Defaulted
Impairmentrate
Stockof Provisions
Coverage Ratio -
Default Stock
Impairmentrate
Stockof Provisions
Coverage
Ratio -DefaultStock
Impairmentrate
Stockof Provisions
Coverage
Ratio -DefaultStock
Impairment rateStockof
Provisions
Coverage
Ratio -DefaultStock
Impairmentrate
Stockof Provisions
Coverage
Ratio -DefaultStock
Impairmentrate
Stockof Provisions
Coverage
Ratio -DefaultStock
Central banksandcentral governments 0 0 0 0 0 0 0 0 0 0 0 0 0 0 0 0 0 0 - 0 - - 0 - - 0 - - 0 - - 0 - - 0 -
Institutions 0 0 0 0 0 0 0 0 0 0 0 0 0 0 0 0 0 0 - 0 - - 0 - - 0 - - 0 - - 0 - - 0 -Corporates 0 0 0 0 0 0 0 0 0 0 0 0 0 0 0 0 0 0 - 0 - - 0 - - 0 - - 0 - - 0 - - 0 -
Corporates - OfWhich:SpecialisedLending 0 0 0 0 0 0 0 0 0 0 0 0 0 0 0 0 0 0 - 0 - - 0 - - 0 - - 0 - - 0 - - 0 -Corporates -OfWhich: SME 0 0 0 0 0 0 0 0 0 0 0 0 0 0 0 0 0 0 - 0 - - 0 - - 0 - - 0 - - 0 - - 0 -
Retail 0 0 0 0 0 0 0 0 0 0 0 0 0 0 0 0 0 0 - 0 - - 0 - - 0 - - 0 - - 0 - - 0 -Retail -Securedon real estateproperty 0.0% 0 0 0 0 0 0 0 0 0 0 0 0 0 0 0 0 0 0 - 0 - - 0 - - 0 - - 0 - - 0 - - 0 -
Retail -Securedon real estate property-Of hi h: E
0.0% 0 0 0 0 0 0 0 0 0 0 0 0 0 0 0 0 0 0 - 0 - - 0 - - 0 - - 0 - - 0 - - 0 -Retail -Securedon real estate property-Of
h i h: n n - E0.0% 0 0 0 0 0 0 0 0 0 0 0 0 0 0 0 0 0 0 - 0 - - 0 - - 0 - - 0 - - 0 - - 0 -
Retail -QualifyingRevolving 0 0 0 0 0 0 0 0 0 0 0 0 0 0 0 0 0 0 - 0 - - 0 - - 0 - - 0 - - 0 - - 0 -Retail -OtherRetail 0 0 0 0 0 0 0 0 0 0 0 0 0 0 0 0 0 0 - 0 - - 0 - - 0 - - 0 - - 0 - - 0 -
Retail -OtherRetail -OfWhich:SME 0 0 0 0 0 0 0 0 0 0 0 0 0 0 0 0 0 0 - 0 - - 0 - - 0 - - 0 - - 0 - - 0 -Retail -OtherRetail -OfWhich:non-SME 0 0 0 0 0 0 0 0 0 0 0 0 0 0 0 0 0 0 - 0 - - 0 - - 0 - - 0 - - 0 - - 0 -
Equity 0 0 0 0 0 0 0 0 0 0 0 0 0 0 0 0 0 0 - 0 - - 0 - - 0 - - 0 - - 0 - - 0 -Securitisation 0 0 0 0 0 0 0 0 0 0 0 0 0 0 0 0 0 0Othernon-credit obligation assets 0 0 0 0 0 0 0 0 0 0 0 0 0 0 0 0 0 0TOTAL 0 0 0 0 0 0 0 0 0 0 0 0 0 0 0 0 0 0 - 0 - - 0 - - 0 - - 0 - - 0 - - 0 -Securitisation andre-securitisations positions deductedfrom capital * 0 0 0 0 0 0 0 0 0 0 0 0
(mln EUR, %)Non-defaulted Defaulted Non-defaulted Defaulted Non-defaulted Defaulted Non-defaulted Defaulted Non-defaulted Defaulted Non-defaulted Defaulted Non-defaulted Defaulted Non-defaulted Defaulted Non-defaulted Defaulted
Impairmentrate
Stockof Provisions
Coverage Ratio -Default Stock
Impairmentrate
Stockof Provisions
Coverage
Ratio -DefaultStock
Impairmentrate
Stockof Provisions
Coverage
Ratio -DefaultStock
Impairment rateStockof
Provisions
Coverage
Ratio -DefaultStock
Impairmentrate
Stockof Provisions
Coverage
Ratio -DefaultStock
Impairmentrate
Stockof Provisions
Coverage
Ratio -DefaultStock
Central banksandcentral governments 0 0 0 0 0 0 0 0 0 0 0 0 0 0 0 0 0 0 - 0 - - 0 - - 0 - - 0 - - 0 - - 0 -Institutions 0 0 0 0 0 0 0 0 0 0 0 0 0 0 0 0 0 0 - 0 - - 0 - - 0 - - 0 - - 0 - - 0 -Corporates 0 0 0 0 0 0 0 0 0 0 0 0 0 0 0 0 0 0 - 0 - - 0 - - 0 - - 0 - - 0 - - 0 -
Corporates - OfWhich:SpecialisedLending 0 0 0 0 0 0 0 0 0 0 0 0 0 0 0 0 0 0 - 0 - - 0 - - 0 - - 0 - - 0 - - 0 -Corporates -OfWhich: SME 0 0 0 0 0 0 0 0 0 0 0 0 0 0 0 0 0 0 - 0 - - 0 - - 0 - - 0 - - 0 - - 0 -
Retail 0 0 0 0 0 0 0 0 0 0 0 0 0 0 0 0 0 0 - 0 - - 0 - - 0 - - 0 - - 0 - - 0 -Retail -Securedon real estateproperty 0.0% 0 0 0 0 0 0 0 0 0 0 0 0 0 0 0 0 0 0 - 0 - - 0 - - 0 - - 0 - - 0 - - 0 -
Retail -Securedon real estate property-Of h i h : S E
0.0% 0 0 0 0 0 0 0 0 0 0 0 0 0 0 0 0 0 0 - 0 - - 0 - - 0 - - 0 - - 0 - - 0 -Retail -Securedon real estate property-Of
h i h: n n - E0.0% 0 0 0 0 0 0 0 0 0 0 0 0 0 0 0 0 0 0 - 0 - - 0 - - 0 - - 0 - - 0 - - 0 -
Retail -QualifyingRevolving 0 0 0 0 0 0 0 0 0 0 0 0 0 0 0 0 0 0 - 0 - - 0 - - 0 - - 0 - - 0 - - 0 -Retail -OtherRetail 0 0 0 0 0 0 0 0 0 0 0 0 0 0 0 0 0 0 - 0 - - 0 - - 0 - - 0 - - 0 - - 0 -
Retail -OtherRetail -OfWhich:SME 0 0 0 0 0 0 0 0 0 0 0 0 0 0 0 0 0 0 - 0 - - 0 - - 0 - - 0 - - 0 - - 0 -Retail -OtherRetail -OfWhich:non-SME 0 0 0 0 0 0 0 0 0 0 0 0 0 0 0 0 0 0 - 0 - - 0 - - 0 - - 0 - - 0 - - 0 -
Equity 0 0 0 0 0 0 0 0 0 0 0 0 0 0 0 0 0 0 - 0 - - 0 - - 0 - - 0 - - 0 - - 0 -Securitisation 0 0 0 0 0 0 0 0 0 0 0 0 0 0 0 0 0 0Othernon-credit obligation assets 0 0 0 0 0 0 0 0 0 0 0 0 0 0 0 0 0 0TOTAL 0 0 0 0 0 0 0 0 0 0 0 0 0 0 0 0 0 0 - 0 - - 0 - - 0 - - 0 - - 0 - - 0 -Securitisation andre-securitisations positions deductedfrom capital * 0 0 0 0 0 0 0 0 0 0 0 0
(mln EUR, %)Non-defaulted Defaulted Non-defaulted Defaulted Non-defaulted Defaulted Non-defaulted Defaulted Non-defaulted Defaulted Non-defaulted Defaulted Non-defaulted Defaulted Non-defaulted Defaulted Non-defaulted Defaulted Impairment
rateStockof
ProvisionsCoverage Ratio -
Default Stock
Impairmentrate
Stockof Provisions
CoverageRatio -Default
Stock
Impairmentrate
Stockof Provisions
CoverageRatio -Default
Stock
Impairment rateStockof
Provisions
CoverageRatio -Default
Stock
Impairmentrate
Stockof Provisions
CoverageRatio -Default
Stock
Impairmentrate
Stockof Provisions
CoverageRatio -Default
Stock
Central banksandcentral governments 0 0 0 0 0 0 0 0 0 0 0 0 0 0 0 0 0 0 - 0 - - 0 - - 0 - - 0 - - 0 - - 0 -Institutions 0 0 0 0 0 0 0 0 0 0 0 0 0 0 0 0 0 0 - 0 - - 0 - - 0 - - 0 - - 0 - - 0 -Corporates 0 0 0 0 0 0 0 0 0 0 0 0 0 0 0 0 0 0 - 0 - - 0 - - 0 - - 0 - - 0 - - 0 -
Corporates - OfWhich:SpecialisedLending 0 0 0 0 0 0 0 0 0 0 0 0 0 0 0 0 0 0 - 0 - - 0 - - 0 - - 0 - - 0 - - 0 -Corporates -OfWhich: SME 0 0 0 0 0 0 0 0 0 0 0 0 0 0 0 0 0 0 - 0 - - 0 - - 0 - - 0 - - 0 - - 0 -
Retail 0 0 0 0 0 0 0 0 0 0 0 0 0 0 0 0 0 0 - 0 - - 0 - - 0 - - 0 - - 0 - - 0 -Retail -Securedon real estateproperty 0.0% 0 0 0 0 0 0 0 0 0 0 0 0 0 0 0 0 0 0 - 0 - - 0 - - 0 - - 0 - - 0 - - 0 -
Retail -Securedon real estate property-Of hi h: E
0.0% 0 0 0 0 0 0 0 0 0 0 0 0 0 0 0 0 0 0 - 0 - - 0 - - 0 - - 0 - - 0 - - 0 -Retail -Securedon real estate property-Of
h i h: n n - E0.0% 0 0 0 0 0 0 0 0 0 0 0 0 0 0 0 0 0 0 - 0 - - 0 - - 0 - - 0 - - 0 - - 0 -
Retail -QualifyingRevolving 0 0 0 0 0 0 0 0 0 0 0 0 0 0 0 0 0 0 - 0 - - 0 - - 0 - - 0 - - 0 - - 0 -Retail -OtherRetail 0 0 0 0 0 0 0 0 0 0 0 0 0 0 0 0 0 0 - 0 - - 0 - - 0 - - 0 - - 0 - - 0 -
Retail -OtherRetail -OfWhich:SME 0 0 0 0 0 0 0 0 0 0 0 0 0 0 0 0 0 0 - 0 - - 0 - - 0 - - 0 - - 0 - - 0 -Retail -OtherRetail -OfWhich:non-SME 0 0 0 0 0 0 0 0 0 0 0 0 0 0 0 0 0 0 - 0 - - 0 - - 0 - - 0 - - 0 - - 0 -
Equity 0 0 0 0 0 0 0 0 0 0 0 0 0 0 0 0 0 0 - 0 - - 0 - - 0 - - 0 - - 0 - - 0 -Securitisation 0 0 0 0 0 0 0 0 0 0 0 0 0 0 0 0 0 0
LTV %(asof 31/12/2013)
Exposure values (as of 31/12/2013) Risk exposure amounts (as of 31/12/2013) Value adjustments and provisions (as of 31/12/2013) Baseline Scenario Adverse Scenario
F-IRB A-IRB STA F-IRB A-IRB STA F-IRB A-IRB a so f 31 /1 2/ 20 15 a so f3 1/ 12 /2 01 6STA as of 31/12/2014 as of 31/12/2015 as of 31/12/2016 as of 31/12/2014
AdverseScenario
F-IRB A-IRB STA F-IRB A-IRB STA F-IRB A-IRB STA as of 31/12/2014 as of 31/12/2015 as of 31/12/2016 as of 31/12/2014 as of 31/12/2015 as of 31/12/2016LTV %(asof 31/12/2013)
E xp os ur ev al ue s( as of 3 1/ 12 /2 01 3) R is k e xp os ur e am ou nt s (a so f3 1/ 12 /2 01 3) V al ue ad ju st me nt s an dp ro vi si on s( as of 3 1/ 12 /2 01 3)
AdverseScenario
F-IRB A-IRB STA F-IRB A-IRB STA F-IRB A-IRB STA as of 31/12/2014 as of 31/12/2015 as of 31/12/2016 as of 31/12/2014 as of 31/12/2015 as of 31/12/2016LTV %(asof 31/12/2013)
E xp os ur ev al ue s( as of 3 1/ 12 /2 01 3) R is k ex po su re am ou nt s (a so f3 1/ 12 /2 01 3)
BaselineScenario
Valueadjustmentsandprovisions(asof 31/12/2013) BaselineScenario
(*)Referstothepart ofSecuritizationexposurethat isdeductedfrom capital andisnot includedinRWA
(*)Referstothepart ofSecuritizationexposurethat isdeductedfrom capital andisnot includedinRWA
Please, select the country
Please, select the country
Please, select the country

8/10/2019 Test Stress Banca Española 2014
http://slidepdf.com/reader/full/test-stress-banca-espanola-2014 180/240
0 0 0 0 0 0 0 0 0 0 0 0 0 0 0 0 0 0Othernon-credit obligation assets 0 0 0 0 0 0 0 0 0 0 0 0 0 0 0 0 0 0TOTAL 0 0 0 0 0 0 0 0 0 0 0 0 0 0 0 0 0 0 - 0 - - 0 - - 0 - - 0 - - 0 - - 0 -Securitisation andre-securitisations positions deductedfrom capital * 0 0 0 0 0 0 0 0 0 0 0 0
(mln EUR, %)Non-defaulted Defaulted Non-defaulted Defaulted Non-defaulted Defaulted Non-defaulted Defaulted Non-defaulted Defaulted Non-defaulted Defaulted Non-defaulted Defaulted Non-defaulted Defaulted Non-defaulted Defaulted Impairment
rateStockof
ProvisionsCoverage Ratio -
Default Stock
Impairmentrate
Stockof Provisions
CoverageRatio -Default
Stock
Impairmentrate
Stockof Provisions
CoverageRatio -Default
Stock
Impairment rateStockof
Provisions
CoverageRatio -Default
Stock
Impairmentrate
Stockof Provisions
CoverageRatio -Default
Stock
Impairmentrate
Stockof Provisions
CoverageRatio -Default
Stock
Central banksandcentral governments 0 0 0 0 0 0 0 0 0 0 0 0 0 0 0 0 0 0 - 0 - - 0 - - 0 - - 0 - - 0 - - 0 -Institutions 0 0 0 0 0 0 0 0 0 0 0 0 0 0 0 0 0 0 - 0 - - 0 - - 0 - - 0 - - 0 - - 0 -Corporates 0 0 0 0 0 0 0 0 0 0 0 0 0 0 0 0 0 0 - 0 - - 0 - - 0 - - 0 - - 0 - - 0 -
Corporates - OfWhich:SpecialisedLending 0 0 0 0 0 0 0 0 0 0 0 0 0 0 0 0 0 0 - 0 - - 0 - - 0 - - 0 - - 0 - - 0 -Corporates -OfWhich: SME 0 0 0 0 0 0 0 0 0 0 0 0 0 0 0 0 0 0 - 0 - - 0 - - 0 - - 0 - - 0 - - 0 -
Retail 0 0 0 0 0 0 0 0 0 0 0 0 0 0 0 0 0 0 - 0 - - 0 - - 0 - - 0 - - 0 - - 0 -Retail -Securedon real estateproperty 0.0% 0 0 0 0 0 0 0 0 0 0 0 0 0 0 0 0 0 0 - 0 - - 0 - - 0 - - 0 - - 0 - - 0 -
Retail -Securedon real estate property-Of h i h : S E
0.0% 0 0 0 0 0 0 0 0 0 0 0 0 0 0 0 0 0 0 - 0 - - 0 - - 0 - - 0 - - 0 - - 0 -Retail -Securedon real estate property-Of
h i h: n n - E0.0% 0 0 0 0 0 0 0 0 0 0 0 0 0 0 0 0 0 0 - 0 - - 0 - - 0 - - 0 - - 0 - - 0 -
Retail -QualifyingRevolving 0 0 0 0 0 0 0 0 0 0 0 0 0 0 0 0 0 0 - 0 - - 0 - - 0 - - 0 - - 0 - - 0 -Retail -OtherRetail 0 0 0 0 0 0 0 0 0 0 0 0 0 0 0 0 0 0 - 0 - - 0 - - 0 - - 0 - - 0 - - 0 -
Retail -OtherRetail -OfWhich:SME 0 0 0 0 0 0 0 0 0 0 0 0 0 0 0 0 0 0 - 0 - - 0 - - 0 - - 0 - - 0 - - 0 -Retail -OtherRetail -OfWhich:non-SME 0 0 0 0 0 0 0 0 0 0 0 0 0 0 0 0 0 0 - 0 - - 0 - - 0 - - 0 - - 0 - - 0 -
Equity 0 0 0 0 0 0 0 0 0 0 0 0 0 0 0 0 0 0 - 0 - - 0 - - 0 - - 0 - - 0 - - 0 -Securitisation 0 0 0 0 0 0 0 0 0 0 0 0 0 0 0 0 0 0Othernon-credit obligation assets 0 0 0 0 0 0 0 0 0 0 0 0 0 0 0 0 0 0TOTAL 0 0 0 0 0 0 0 0 0 0 0 0 0 0 0 0 0 0 - 0 - - 0 - - 0 - - 0 - - 0 - - 0 -Securitisation andre-securitisations positions deductedfrom capital * 0 0 0 0 0 0 0 0 0 0 0 0
(mln EUR, %)Non-defaulted Defaulted Non-defaulted Defaulted Non-defaulted Defaulted Non-defaulted Defaulted Non-defaulted Defaulted Non-defaulted Defaulted Non-defaulted Defaulted Non-defaulted Defaulted Non-defaulted Defaulted Impairment
rateStockof
ProvisionsCoverage Ratio -
Default Stock
Impairmentrate
Stockof Provisions
CoverageRatio -Default
Stock
Impairmentrate
Stockof Provisions
CoverageRatio -Default
Stock
Impairment rateStockof
Provisions
CoverageRatio -Default
Stock
Impairmentrate
Stockof Provisions
CoverageRatio -Default
Stock
Impairmentrate
Stockof Provisions
CoverageRatio -Default
Stock
Central banksandcentral governments 0 0 0 0 0 0 0 0 0 0 0 0 0 0 0 0 0 0 - 0 - - 0 - - 0 - - 0 - - 0 - - 0 -Institutions 0 0 0 0 0 0 0 0 0 0 0 0 0 0 0 0 0 0 - 0 - - 0 - - 0 - - 0 - - 0 - - 0 -Corporates 0 0 0 0 0 0 0 0 0 0 0 0 0 0 0 0 0 0 - 0 - - 0 - - 0 - - 0 - - 0 - - 0 -
Corporates - OfWhich:SpecialisedLending 0 0 0 0 0 0 0 0 0 0 0 0 0 0 0 0 0 0 - 0 - - 0 - - 0 - - 0 - - 0 - - 0 -Corporates -OfWhich: SME 0 0 0 0 0 0 0 0 0 0 0 0 0 0 0 0 0 0 - 0 - - 0 - - 0 - - 0 - - 0 - - 0 -
Retail 0 0 0 0 0 0 0 0 0 0 0 0 0 0 0 0 0 0 - 0 - - 0 - - 0 - - 0 - - 0 - - 0 -Retail -Securedon real estateproperty 0.0% 0 0 0 0 0 0 0 0 0 0 0 0 0 0 0 0 0 0 - 0 - - 0 - - 0 - - 0 - - 0 - - 0 -
Retail -Securedon real estate property-Of hi h: E
0.0% 0 0 0 0 0 0 0 0 0 0 0 0 0 0 0 0 0 0 - 0 - - 0 - - 0 - - 0 - - 0 - - 0 -Retail -Securedon real estate property-Of
h i h : n n -S E0.0% 0 0 0 0 0 0 0 0 0 0 0 0 0 0 0 0 0 0 - 0 - - 0 - - 0 - - 0 - - 0 - - 0 -
Retail -QualifyingRevolving 0 0 0 0 0 0 0 0 0 0 0 0 0 0 0 0 0 0 - 0 - - 0 - - 0 - - 0 - - 0 - - 0 -Retail -OtherRetail 0 0 0 0 0 0 0 0 0 0 0 0 0 0 0 0 0 0 - 0 - - 0 - - 0 - - 0 - - 0 - - 0 -
Retail -OtherRetail -OfWhich:SME 0 0 0 0 0 0 0 0 0 0 0 0 0 0 0 0 0 0 - 0 - - 0 - - 0 - - 0 - - 0 - - 0 -Retail -OtherRetail -OfWhich:non-SME 0 0 0 0 0 0 0 0 0 0 0 0 0 0 0 0 0 0 - 0 - - 0 - - 0 - - 0 - - 0 - - 0 -
Equity 0 0 0 0 0 0 0 0 0 0 0 0 0 0 0 0 0 0 - 0 - - 0 - - 0 - - 0 - - 0 - - 0 -Securitisation 0 0 0 0 0 0 0 0 0 0 0 0 0 0 0 0 0 0Othernon-credit obligation assets 0 0 0 0 0 0 0 0 0 0 0 0 0 0 0 0 0 0TOTAL 0 0 0 0 0 0 0 0 0 0 0 0 0 0 0 0 0 0 - 0 - - 0 - - 0 - - 0 - - 0 - - 0 -Securitisation andre-securitisations positions deductedfrom capital * 0 0 0 0 0 0 0 0 0 0 0 0
LTV %(asof 31/12/2013)
Exposure values (as of 31/12/2013) Risk exposure amounts (as of 31/12/2013) Value adjustments and provisions (as of 31/12/2013) Baseline Scenario Adverse ScenarioF-IRB A-IRB STA F-IRB A-IRB STA as of 31/12/2016 as of 31/12/2014 as of 31/12/2015 as of 31/12/2016F-IRB A-IRB STA a so f3 1/ 12 /2 01 4 a so f 31 /1 2/ 20 15
LTV %(asof 31/12/2013)
Exposure values (as of 31/12/2013) Risk exposure amounts (as of 31/12/2013) Value adjustments and provisions (as of 31/12/2013) Baseline Scenario Adverse ScenarioF-IRB A-IRB STA F-IRB A-IRB STA F-IRB as of 31 /12 /2 01 4 as of 31/ 12 /2 01 5 as of 31 /12 /2 01 6 A-IRB STA as of 31 /1 2/ 20 14 as of 31/ 12 /2 01 5 as of 31 /12 /2 01 6
(*)Referstothepart ofSecuritizationexposurethat isdeductedfrom capital andisnot includedinRWA
(*)Referstothepart ofSecuritizationexposurethat isdeductedfrom capital andisnot includedinRWA
(*)Referstothepart ofSecuritizationexposurethat isdeductedfrom capital andisnot includedinRWA
Please, select the country
Please, select the country
http://www.economiaciudadana.org/
2014 EU-wide Stress Test P&L
(mln EUR) 31/12/2014 31/12/2015 31/12/2016 31/12/2014 31/12/2015 31/12/2016
Net interest income 626 493 521 491 463 472 468
Net trading income -4 -2 0 -7 -3 -2
of which trading losses from stress scenarios -7 -4 -3 -9 -6 -4
Other operating income 159 126 130 133 119 119 118
Operating profit before impairments 434 268 304 278 221 229 224
Impairment of financial assets (-) -557 -60 -131 -125 -267 -249 -243
Impairment of financial assets other than instruments designated at fair value
through P&L (-)-557 -60 -131 -125 -267 -249 -243
Impairment Financial assets designated at fair value through P&L (-) 0 0 0 0 0 0 0
Impairment on non financial assets (-) -122 -96 -84 -72 -151 -132 -114
Operating profit after impairments from stress scenarios -245 112 89 81 -197 -153 -133
Other Income and expenses 15 15 15 15 6 6 6
Pre-Tax profit -230 127 104 96 -191 -146 -127
31/12/2013
Baseline Scenario Adverse Scenario

8/10/2019 Test Stress Banca Española 2014
http://slidepdf.com/reader/full/test-stress-banca-espanola-2014 181/240
Tax 89 -38 -31 -29 58 44 38
Net income -141 89 72 67 -133 -102 -89
Attributable to owners of the parent -141 89 72 67 -133 -102 -89
of which carried over to capital through retained earnings -216 33 9 1 -134 -103 -90
of which distributed as dividends 75 56 63 66 1 1 1
In the figures above, the original (official published) 2013 P&L figures may have been adjusted as part of the ECB Comprehensive Assessment join-up calculation.
http://www.economiaciudadana.org/

8/10/2019 Test Stress Banca Española 2014
http://slidepdf.com/reader/full/test-stress-banca-espanola-2014 182/240

8/10/2019 Test Stress Banca Española 2014
http://slidepdf.com/reader/full/test-stress-banca-espanola-2014 183/240
2014 EU-wide Stress Test - Sovereign Exposure
(mln EUR)
[ 0 - 3M [ 0 0 0 0 0 0 0 0 0 0 0 0 0 0[ 3M - 1Y [ 0 0 0 0 0 0 0 0 0 0 0 0 0 0
[ 1Y - 2Y [ 2 0 2 2 0 0 0 0 0 0 0 0 0 0[ 2Y - 3Y [ 0 0 0 0 0 0 0 0 0 0 0 0 0 0[3Y - 5Y [ 0 0 0 0 0 0 0 0 0 0 0 0 0 0
[5Y - 10Y [ 0 0 0 0 0 0 0 0 0 0 0 0 0 0[10Y - more 0 0 0 0 0 0 0 0 0 0 0 0 0 0
Tot 2 0 2 2 0 0 0 0 0 0 0 0 0 0[ 0 - 3M [ 0 0 0 0 0 0 0 0 0 0 0 0 0 0
[ 3M - 1Y [ 0 0 0 0 0 0 0 0 0 0 0 0 0 0[ 1Y - 2Y [ 0 0 0 0 0 0 0 0 0 0 0 0 0 0[ 2Y - 3Y [ 0 0 0 0 0 0 0 0 0 0 0 0 0 0[3Y - 5Y [ 0 0 0 0 0 0 0 0 0 0 0 0 0 0
[5Y - 10Y [ 0 0 0 0 0 0 0 0 0 0 0 0 0 0[10Y - more 0 0 0 0 0 0 0 0 0 0 0 0 0 0
Residual Maturity Country / Region
GROSS DIRECT LONG
EXPOSURES (accounting value grossof provisions)
(1)
NET DIRECT POSITIONS (gross exposures (long) net of cash short
positions of sovereign debt to other counterpaties only where thereis a maturity matching)
(1)
DIRECT SOVEREIGN EXPOSURES IN DERIVATIVES (1)
of which: loansand advances
of which: AFSbanking book
of which: FVO
(designated at fairvalue throughprofit&loss)
banking book
of which: Financial
assets held fortrading
(2)
Derivatives with positive fair value at31/12/2013
Derivatives with negative fair value at31/12/2013
Derivatives with positive fair valueat 31/12/2013
Derivatives with negative fairvalue at 31/12/2013
VALUES AS OF 31/12/2013 VALUES AS OF 31/12/2013 VALUES AS OF 31/12/2013
INDIRECT SOVEREIGN EXPOSURES (3) (on and off balance sheet)
Fair-value at31/12/2013 (+)
Notional valueFair-value at
31/12/2013 (-)Notional value
Fair-value at31/12/2013 (+)
Notional valueFair-value at 31/12/2013
(-)
Austria
Belgium
Notional value

8/10/2019 Test Stress Banca Española 2014
http://slidepdf.com/reader/full/test-stress-banca-espanola-2014 184/240
Tot 0 0 0 0 0 0 0 0 0 0 0 0 0 0[ 0 - 3M [ 0 0 0 0 0 0 0 0 0 0 0 0 0 0
[ 3M - 1Y [ 0 0 0 0 0 0 0 0 0 0 0 0 0 0[ 1Y - 2Y [ 0 0 0 0 0 0 0 0 0 0 0 0 0 0[ 2Y - 3Y [ 0 0 0 0 0 0 0 0 0 0 0 0 0 0[3Y - 5Y [ 0 0 0 0 0 0 0 0 0 0 0 0 0 0
[5Y - 10Y [ 0 0 0 0 0 0 0 0 0 0 0 0 0 0[10Y - more 0 0 0 0 0 0 0 0 0 0 0 0 0 0
Tot 0 0 0 0 0 0 0 0 0 0 0 0 0 0[ 0 - 3M [ 0 0 0 0 0 0 0 0 0 0 0 0 0 0
[ 3M - 1Y [ 0 0 0 0 0 0 0 0 0 0 0 0 0 0
[ 1Y - 2Y [ 0 0 0 0 0 0 0 0 0 0 0 0 0 0[ 2Y - 3Y [ 0 0 0 0 0 0 0 0 0 0 0 0 0 0[3Y - 5Y [ 0 0 0 0 0 0 0 0 0 0 0 0 0 0
[5Y - 10Y [ 0 0 0 0 0 0 0 0 0 0 0 0 0 0[10Y - more 0 0 0 0 0 0 0 0 0 0 0 0 0 0
Tot 0 0 0 0 0 0 0 0 0 0 0 0 0 0[ 0 - 3M [ 0 0 0 0 0 0 0 0 0 0 0 0 0 0
[ 3M - 1Y [ 0 0 0 0 0 0 0 0 0 0 0 0 0 0[ 1Y - 2Y [ 0 0 0 0 0 0 0 0 0 0 0 0 0 0[ 2Y - 3Y [ 0 0 0 0 0 0 0 0 0 0 0 0 0 0[3Y - 5Y [ 0 0 0 0 0 0 0 0 0 0 0 0 0 0
[5Y - 10Y [ 0 0 0 0 0 0 0 0 0 0 0 0 0 0[10Y - more 0 0 0 0 0 0 0 0 0 0 0 0 0 0
Tot 0 0 0 0 0 0 0 0 0 0 0 0 0 0[ 0 - 3M [ 0 0 0 0 0 0 0 0 0 0 0 0 0 0
[ 3M - 1Y [ 0 0 0 0 0 0 0 0 0 0 0 0 0 0[ 1Y - 2Y [ 0 0 0 0 0 0 0 0 0 0 0 0 0 0[ 2Y - 3Y [ 0 0 0 0 0 0 0 0 0 0 0 0 0 0[3Y - 5Y [ 0 0 0 0 0 0 0 0 0 0 0 0 0 0
[5Y - 10Y [ 0 0 0 0 0 0 0 0 0 0 0 0 0 0[10Y - more 0 0 0 0 0 0 0 0 0 0 0 0 0 0
Tot 0 0 0 0 0 0 0 0 0 0 0 0 0 0[ 0 - 3M [ 0 0 0 0 0 0 0 0 0 0 0 0 0 0
[ 3M - 1Y [ 0 0 0 0 0 0 0 0 0 0 0 0 0 0[ 1Y - 2Y [ 0 0 0 0 0 0 0 0 0 0 0 0 0 0[ 2Y - 3Y [ 0 0 0 0 0 0 0 0 0 0 0 0 0 0[3Y - 5Y [ 0 0 0 0 0 0 0 0 0 0 0 0 0 0
[5Y - 10Y [ 0 0 0 0 0 0 0 0 0 0 0 0 0 0[10Y - more 0 0 0 0 0 0 0 0 0 0 0 0 0 0
Tot 0 0 0 0 0 0 0 0 0 0 0 0 0 0[ 0 - 3M [ 0 0 0 0 0 0 0 0 0 0 0 0 0 0
[ 3M - 1Y [ 0 0 0 0 0 00 0 0 0 0 0 0 0
[ 1Y - 2Y [ 0 0 0 0 0 0 0 0 0 0 0 0 0 0[ 2Y - 3Y [ 0 0 0 0 0 0 0 0 0 0 0 0 0 0[3Y - 5Y [ 0 0 0 0 0 0 0 0 0 0 0 0 0 0
[5Y - 10Y [ 0 0 0 0 0 0 0 0 0 0 0 0 0 0[10Y - more 0 0 0 0 0 0 0 0 0 0 0 0 0 0
Tot 0 0 0 0 0 0 0 0 0 0 0 0 0 0
Bulgaria
Cyprus
Czech Republic
Denmark
Estonia
Finland
France
http://www.economiaciudadana.org/

8/10/2019 Test Stress Banca Española 2014
http://slidepdf.com/reader/full/test-stress-banca-espanola-2014 185/240
2014 EU-wide Stress Test - Sovereign Exposure
(mln EUR)
Residual Maturity Country / Region
GROSS DIRECT LONG
EXPOSURES (accounting value grossof provisions)
(1)
NET DIRECT POSITIONS (gross exposures (long) net of cash short
positions of sovereign debt to other counterpaties only where thereis a maturity matching)
(1)
DIRECT SOVEREIGN EXPOSURES IN DERIVATIVES (1)
of which: loansand advances
of which: AFSbanking book
of which: FVO
(designated at fairvalue throughprofit&loss)
banking book
of which: Financial
assets held fortrading
(2)
Derivatives with positive fair value at31/12/2013
Derivatives with negative fair value at31/12/2013
Derivatives with positive fair valueat 31/12/2013
Derivatives with negative fairvalue at 31/12/2013
VALUES AS OF 31/12/2013 VALUES AS OF 31/12/2013 VALUES AS OF 31/12/2013
INDIRECT SOVEREIGN EXPOSURES (3) (on and off balance sheet)
Fair-value at31/12/2013 (+)
Notional valueFair-value at
31/12/2013 (-)Notional value
Fair-value at31/12/2013 (+)
Notional valueFair-value at 31/12/2013
(-)Notional value
[ 0 - 3M [ 0 0 0 0 0 0 0 0 0 0 0 0 0 0[ 3M - 1Y [ 0 0 0 0 0 0 0 0 0 0 0 0 0 0
[ 1Y - 2Y [ 0 0 0 0 0 0 0 0 0 0 0 0 0 0[ 2Y - 3Y [ 0 0 0 0 0 0 0 0 0 0 0 0 0 0[3Y - 5Y [ 0 0 0 0 0 0 0 0 0 0 0 0 0 0
[5Y - 10Y [ 0 0 0 0 0 0 0 0 0 0 0 0 0 0[10Y - more 0 0 0 0 0 0 0 0 0 0 0 0 0 0
Tot 0 0 0 0 0 0 0 0 0 0 0 0 0 0[ 0 - 3M [ 0 0 0 0 0 0 0 0 0 0 0 0 0 0
[ 3M - 1Y [ 0 0 0 0 0 0 0 0 0 0 0 0 0 0[ 1Y - 2Y [ 0 0 0 0 0 0 0 0 0 0 0 0 0 0[ 2Y - 3Y [ 0 0 0 0 0 0 0 0 0 0 0 0 0 0[3Y - 5Y [ 0 0 0 0 0 0 0 0 0 0 0 0 0 0
[5Y - 10Y [ 0 0 0 0 0 0 0 0 0 0 0 0 0 0[10Y - more 0 0 0 0 0 0 0 0 0 0 0 0 0 0
Tot 0 0 0 0 0 0 0 0 0 0 0 0 0 0
Lithuania
Luxembourg

8/10/2019 Test Stress Banca Española 2014
http://slidepdf.com/reader/full/test-stress-banca-espanola-2014 186/240
Tot 0 0 0 0 0 0 0 0 0 0 0 0 0 0[ 0 - 3M [ 0 0 0 0 0 0 0 0 0 0 0 0 0 0
[ 3M - 1Y [ 0 0 0 0 0 0 0 0 0 0 0 0 0 0[ 1Y - 2Y [ 0 0 0 0 0 0 0 0 0 0 0 0 0 0[ 2Y - 3Y [ 0 0 0 0 0 0 0 0 0 0 0 0 0 0[3Y - 5Y [ 0 0 0 0 0 0 0 0 0 0 0 0 0 0
[5Y - 10Y [ 0 0 0 0 0 0 0 0 0 0 0 0 0 0[10Y - more 0 0 0 0 0 0 0 0 0 0 0 0 0 0
Tot 0 0 0 0 0 0 0 0 0 0 0 0 0 0[ 0 - 3M [ 0 0 0 0 0 0 0 0 0 0 0 0 0 0
[ 3M - 1Y [ 0 0 0 0 0 0 0 0 0 0 0 0 0 0
[ 1Y - 2Y [ 0 0 0 0 0 0 0 0 0 0 0 0 0 0[ 2Y - 3Y [ 0 0 0 0 0 0 0 0 0 0 0 0 0 0[3Y - 5Y [ 0 0 0 0 0 0 0 0 0 0 0 0 0 0
[5Y - 10Y [ 0 0 0 0 0 0 0 0 0 0 0 0 0 0[10Y - more 0 0 0 0 0 0 0 0 0 0 0 0 0 0
Tot 0 0 0 0 0 0 0 0 0 0 0 0 0 0[ 0 - 3M [ 0 0 0 0 0 0 0 0 0 0 0 0 0 0
[ 3M - 1Y [ 0 0 0 0 0 0 0 0 0 0 0 0 0 0[ 1Y - 2Y [ 0 0 0 0 0 0 0 0 0 0 0 0 0 0[ 2Y - 3Y [ 0 0 0 0 0 0 0 0 0 0 0 0 0 0[3Y - 5Y [ 0 0 0 0 0 0 0 0 0 0 0 0 0 0
[5Y - 10Y [ 0 0 0 0 0 0 0 0 0 0 0 0 0 0[10Y - more 0 0 0 0 0 0 0 0 0 0 0 0 0 0
Tot 0 0 0 0 0 0 0 0 0 0 0 0 0 0[ 0 - 3M [ 0 0 0 0 0 0 0 0 0 0 0 0 0 0
[ 3M - 1Y [ 0 0 0 0 0 0 0 0 0 0 0 0 0 0[ 1Y - 2Y [ 0 0 0 0 0 0 0 0 0 0 0 0 0 0[ 2Y - 3Y [ 0 0 0 0 0 0 0 0 0 0 0 0 0 0[3Y - 5Y [ 0 0 0 0 0 0 0 0 0 0 0 0 0 0
[5Y - 10Y [ 0 0 0 0 0 0 0 0 0 0 0 0 0 0[10Y - more 0 0 0 0 0 0 0 0 0 0 0 0 0 0
Tot 0 0 0 0 0 0 0 0 0 0 0 0 0 0[ 0 - 3M [ 0 0 0 0 0 0 0 0 0 0 0 0 0 0
[ 3M - 1Y [ 0 0 0 0 0 0 0 0 0 0 0 0 0 0[ 1Y - 2Y [ 0 0 0 0 0 0 0 0 0 0 0 0 0 0[ 2Y - 3Y [ 0 0 0 0 0 0 0 0 0 0 0 0 0 0[3Y - 5Y [ 0 0 0 0 0 0 0 0 0 0 0 0 0 0
[5Y - 10Y [ 0 0 0 0 0 0 0 0 0 0 0 0 0 0[10Y - more 0 0 0 0 0 0 0 0 0 0 0 0 0 0
Tot 0 0 0 0 0 0 0 0 0 0 0 0 0 0[ 0 - 3M [ 0 0 0 0 0 0 0 0 0 0 0 0 0 0
[ 3M - 1Y [ 0 0 0 0 0 0 0 0 0 0 0 0 0 0[ 1Y - 2Y [ 0 0 0 0 0 0 0 0 0 0 0 0 0 0[ 2Y - 3Y [ 0 0 0 0 0 0 0 0 0 0 0 0 0 0[3Y - 5Y [ 0 0 0 0 0 0 0 0 0 0 0 0 0 0
[5Y - 10Y [ 0 0 0 0 0 0 0 0 0 0 0 0 0 0[10Y - more 0 0 0 0 0 0 0 0 0 0 0 0 0 0
Tot 0 0 0 0 0 0 0 0 0 0 0 0 0 0
Malta
Netherlands
Norway
Poland
Portugal
Romania
Slovakia
http://www.economiaciudadana.org/
2014 EU-wide Stress Test - Sovereign Exposure
(mln EUR)
Residual Maturity Country / Region
GROSS DIRECT LONG
EXPOSURES (accounting value grossof provisions)
(1)
NET DIRECT POSITIONS (gross exposures (long) net of cash short
positions of sovereign debt to other counterpaties only where thereis a maturity matching)
(1)
DIRECT SOVEREIGN EXPOSURES IN DERIVATIVES (1)
of which: loansand advances
of which: AFSbanking book
of which: FVO
(designated at fairvalue throughprofit&loss)
banking book
of which: Financial
assets held fortrading
(2)
Derivatives with positive fair value at31/12/2013
Derivatives with negative fair value at31/12/2013
Derivatives with positive fair valueat 31/12/2013
Derivatives with negative fairvalue at 31/12/2013
VALUES AS OF 31/12/2013 VALUES AS OF 31/12/2013 VALUES AS OF 31/12/2013
INDIRECT SOVEREIGN EXPOSURES (3) (on and off balance sheet)
Fair-value at31/12/2013 (+)
Notional valueFair-value at
31/12/2013 (-)Notional value
Fair-value at31/12/2013 (+)
Notional valueFair-value at 31/12/2013
(-)Notional value
[ 0 - 3M [ 0 0 0 0 0 0 0 0 0 0 0 0 0 0[ 3M - 1Y [ 0 0 0 0 0 0 0 0 0 0 0 0 0 0
[ 1Y - 2Y [ 0 0 0 0 0 0 0 0 0 0 0 0 0 0[ 2Y - 3Y [ 0 0 0 0 0 0 0 0 0 0 0 0 0 0[3Y - 5Y [ 0 0 0 0 0 0 0 0 0 0 0 0 0 0
[5Y - 10Y [ 0 0 0 0 0 0 0 0 0 0 0 0 0 0[10Y - more 0 0 0 0 0 0 0 0 0 0 0 0 0 0
Tot 0 0 0 0 0 0 0 0 0 0 0 0 0 0[ 0 - 3M [ 628 281 628 340 0 0 0 0 0 0 0 0 0 0
[ 3M - 1Y [ 139 115 139 13 0 0 0 0 0 0 0 0 0 0[ 1Y - 2Y [ 149 99 149 47 0 0 0 0 0 0 0 0 0 0[ 2Y - 3Y [ 42 28 42 12 0 0 0 0 0 0 0 0 0 0[3Y - 5Y [ 28 19 28 5 0 0 0 0 0 0 0 0 0 0
[5Y - 10Y [ 992 92 992 896 0 0 0 0 0 0 0 0 0 0[10Y - more 1,542 183 1,542 1,359 0 0 0 0 0 0 0 0 0 0
Tot 3,521 817 3,521 2,672 0 0 0 0 0 0 0 0 0 0
Spain
Slovenia

8/10/2019 Test Stress Banca Española 2014
http://slidepdf.com/reader/full/test-stress-banca-espanola-2014 187/240
[ 0 - 3M [ 0 0 0 0 0 0 0 0 0 0 0 0 0 0[ 3M - 1Y [ 0 0 0 0 0 0 0 0 0 0 0 0 0 0[ 1Y - 2Y [ 0 0 0 0 0 0 0 0 0 0 0 0 0 0[ 2Y - 3Y [ 0 0 0 0 0 0 0 0 0 0 0 0 0 0[3Y - 5Y [ 0 0 0 0 0 0 0 0 0 0 0 0 0 0
[5Y - 10Y [ 0 0 0 0 0 0 0 0 0 0 0 0 0 0[10Y - more 0 0 0 0 0 0 0 0 0 0 0 0 0 0
Tot 0 0 0 0 0 0 0 0 0 0 0 0 0 0[ 0 - 3M [ 0 0 0 0 0 0 0 0 0 0 0 0 0 0
[ 3M - 1Y [ 0 0 0 0 0 0 0 0 0 0 0 0 0 0[ 1Y - 2Y [ 0 0 0 0 0 0 0 0 0 0 0 0 0 0[ 2Y - 3Y [ 0 0 0 0 0 0 0 0 0 0 0 0 0 0[3Y - 5Y [ 0 0 0 0 0 0 0 0 0 0 0 0 0 0
[5Y - 10Y [ 0 0 0 0 0 0 0 0 0 0 0 0 0 0[10Y - more 0 0 0 0 0 0 0 0 0 0 0 0 0 0
Tot 0 0 0 0 0 0 0 0 0 0 0 0 0 0[ 0 - 3M [ 0 0 0 0 0 0 0 0 0 0 0 0 0 0
[ 3M - 1Y [ 0 0 0 0 0 0 0 0 0 0 0 0 0 0
[ 1Y - 2Y [ 0 0 0 0 0 0 0 0 0 0 0 0 0 0[ 2Y - 3Y [ 0 0 0 0 0 0 0 0 0 0 0 0 0 0[3Y - 5Y [ 0 0 0 0 0 0 0 0 0 0 0 0 0 0
[5Y - 10Y [ 0 0 0 0 0 0 0 0 0 0 0 0 0 0[10Y - more 0 0 0 0 0 0 0 0 0 0 0 0 0 0
Tot 0 0 0 0 0 0 0 0 0 0 0 0 0 0[ 0 - 3M [ 0 0 0 0 0 0 0 0 0 0 0 0 0 0
[ 3M - 1Y [ 0 0 0 0 0 0 0 0 0 0 0 0 0 0[ 1Y - 2Y [ 0 0 0 0 0 0 0 0 0 0 0 0 0 0[ 2Y - 3Y [ 0 0 0 0 0 0 0 0 0 0 0 0 0 0[3Y - 5Y [ 0 0 0 0 0 0 0 0 0 0 0 0 0 0
[5Y - 10Y [ 0 0 0 0 0 0 0 0 0 0 0 0 0 0[10Y - more 0 0 0 0 0 0 0 0 0 0 0 0 0 0
Tot 0 0 0 0 0 0 0 0 0 0 0 0 0 0[ 0 - 3M [ 0 0 0 0 0 0 0 0 0 0 0 0 0 0
[ 3M - 1Y [ 0 0 0 0 0 0 0 0 0 0 0 0 0 0[ 1Y - 2Y [ 0 0 0 0 0 0 0 0 0 0 0 0 0 0[ 2Y - 3Y [ 0 0 0 0 0 0 0 0 0 0 0 0 0 0[3Y - 5Y [ 0 0 0 0 0 0 0 0 0 0 0 0 0 0
[5Y - 10Y [ 0 0 0 0 0 0 0 0 0 0 0 0 0 0[10Y - more 0 0 0 0 0 0 0 0 0 0 0 0 0 0
Tot 0 0 0 0 0 0 0 0 0 0 0 0 0 0[ 0 - 3M [ 0 0 0 0 0 0 0 0 0 0 0 0 0 0
[ 3M - 1Y [ 0 0 0 0 0 0 0 0 0 0 0 0 0 0[ 1Y - 2Y [ 0 0 0 0 0 0 0 0 0 0 0 0 0 0[ 2Y - 3Y [ 0 0 0 0 0 0 0 0 0 0 0 0 0 0[3Y - 5Y [ 0 0 0 0 0 0 0 0 0 0 0 0 0 0
[5Y - 10Y [ 0 0 0 0 0 0 0 0 0 0 0 0 0 0[10Y - more 0 0 0 0 0 0 0 0 0 0 0 0 0 0
Tot 0 0 0 0 0 0 0 0 0 0 0 0 0 0[ 0 - 3M [ 0 0 0 0 0 0 0 0 0 0 0 0 0 0
[ 3M - 1Y [ 0 0 0 0 0 0 0 0 0 0 0 0 0 0[ 1Y - 2Y [ 0 0 0 0 0 0 0 0 0 0 0 0 0 0[ 2Y - 3Y [ 0 0 0 0 0 0 0 0 0 0 0 0 0 0[3Y - 5Y [ 0 0 0 0 0 0 0 0 0 0 0 0 0 0
[5Y - 10Y [ 0 0 0 0 0 0 0 0 0 0 0 0 0 0[10Y - more 0 0 0 0 0 0 0 0 0 0 0 0 0 0
Tot 0 0 0 0 0 0 0 0 0 0 0 0 0 0
Sweden
United Kingdom
Australia
Canada
Hong Kong
Japan
U.S.
http://www.economiaciudadana.org/
2014 EU-wide Stress Test - Sovereign Exposure
(mln EUR)
Residual Maturity Country / Region
GROSS DIRECT LONG
EXPOSURES (accounting value grossof provisions)
(1)
NET DIRECT POSITIONS (gross exposures (long) net of cash short
positions of sovereign debt to other counterpaties only where thereis a maturity matching)
(1)
DIRECT SOVEREIGN EXPOSURES IN DERIVATIVES (1)
of which: loansand advances
of which: AFSbanking book
of which: FVO
(designated at fairvalue throughprofit&loss)
banking book
of which: Financial
assets held fortrading
(2)
Derivatives with positive fair value at31/12/2013
Derivatives with negative fair value at31/12/2013
Derivatives with positive fair valueat 31/12/2013
Derivatives with negative fairvalue at 31/12/2013
VALUES AS OF 31/12/2013 VALUES AS OF 31/12/2013 VALUES AS OF 31/12/2013
INDIRECT SOVEREIGN EXPOSURES (3) (on and off balance sheet)
Fair-value at31/12/2013 (+)
Notional valueFair-value at
31/12/2013 (-)Notional value
Fair-value at31/12/2013 (+)
Notional valueFair-value at 31/12/2013
(-)Notional value
[ 0 - 3M [ 0 0 0 0 0 0 0 0 0 0 0 0 0 0[ 3M - 1Y [ 0 0 0 0 0 0 0 0 0 0 0 0 0 0
[ 1Y - 2Y [ 0 0 0 0 0 0 0 0 0 0 0 0 0 0[ 2Y - 3Y [ 0 0 0 0 0 0 0 0 0 0 0 0 0 0[3Y - 5Y [ 0 0 0 0 0 0 0 0 0 0 0 0 0 0
[5Y - 10Y [ 0 0 0 0 0 0 0 0 0 0 0 0 0 0[10Y - more 0 0 0 0 0 0 0 0 0 0 0 0 0 0
Tot 0 0 0 0 0 0 0 0 0 0 0 0 0 0[ 0 - 3M [ 0 0 0 0 0 0 0 0 0 0 0 0 0 0
[ 3M - 1Y [ 0 0 0 0 0 0 0 0 0 0 0 0 0 0[ 1Y - 2Y [ 0 0 0 0 0 0 0 0 0 0 0 0 0 0[ 2Y - 3Y [ 0 0 0 0 0 0 0 0 0 0 0 0 0 0[3Y - 5Y [ 0 0 0 0 0 0 0 0 0 0 0 0 0 0
[5Y - 10Y [ 0 0 0 0 0 0 0 0 0 0 0 0 0 0[10Y - more 0 0 0 0 0 0 0 0 0 0 0 0 0 0
Tot 0 0 0 0 0 0 0 0 0 0 0 0 0 0[ 0 3M [ 0 0 0 0 0 0 0 0 0 0 0 0 0 0
China
Switzerland

8/10/2019 Test Stress Banca Española 2014
http://slidepdf.com/reader/full/test-stress-banca-espanola-2014 188/240
[ 0 - 3M [ 0 0 0 0 0 0 0 0 0 0 0 0 0 0[ 3M - 1Y [ 0 0 0 0 0 0 0 0 0 0 0 0 0 0[ 1Y - 2Y [ 0 0 0 0 0 0 0 0 0 0 0 0 0 0[ 2Y - 3Y [ 0 0 0 0 0 0 0 0 0 0 0 0 0 0[3Y - 5Y [ 0 0 0 0 0 0 0 0 0 0 0 0 0 0
[5Y - 10Y [ 0 0 0 0 0 0 0 0 0 0 0 0 0 0[10Y - more 0 0 0 0 0 0 0 0 0 0 0 0 0 0
Tot 0 0 0 0 0 0 0 0 0 0 0 0 0 0[ 0 - 3M [ 0 0 0 0 0 0 0 0 0 0 0 0 0 0
[ 3M - 1Y [ 0 0 0 0 0 0 0 0 0 0 0 0 0 0[ 1Y - 2Y [ 0 0 0 0 0 0 0 0 0 0 0 0 0 0[ 2Y - 3Y [ 0 0 0 0 0 0 0 0 0 0 0 0 0 0[3Y - 5Y [ 0 0 0 0 0 0 0 0 0 0 0 0 0 0
[5Y - 10Y [ 0 0 0 0 0 0 0 0 0 0 0 0 0 0[10Y - more 0 0 0 0 0 0 0 0 0 0 0 0 0 0
Tot 0 0 0 0 0 0 0 0 0 0 0 0 0 0[ 0 - 3M [ 0 0 0 0 0 0 0 0 0 0 0 0 0 0
[ 3M - 1Y [ 0 0 0 0 0 0 0 0 0 0 0 0 0 0
[ 1Y - 2Y [ 0 0 0 0 0 0 0 0 0 0 0 0 0 0[ 2Y - 3Y [ 0 0 0 0 0 0 0 0 0 0 0 0 0 0[3Y - 5Y [ 0 0 0 0 0 0 0 0 0 0 0 0 0 0
[5Y - 10Y [ 0 0 0 0 0 0 0 0 0 0 0 0 0 0[10Y - more 0 0 0 0 0 0 0 0 0 0 0 0 0 0
Tot 0 0 0 0 0 0 0 0 0 0 0 0 0 0[ 0 - 3M [ 0 0 0 0 0 0 0 0 0 0 0 0 0 0
[ 3M - 1Y [ 0 0 0 0 0 0 0 0 0 0 0 0 0 0[ 1Y - 2Y [ 0 0 0 0 0 0 0 0 0 0 0 0 0 0[ 2Y - 3Y [ 0 0 0 0 0 0 0 0 0 0 0 0 0 0[3Y - 5Y [ 0 0 0 0 0 0 0 0 0 0 0 0 0 0
[5Y - 10Y [ 0 0 0 0 0 0 0 0 0 0 0 0 0 0[10Y - more 0 0 0 0 0 0 0 0 0 0 0 0 0 0
Tot 0 0 0 0 0 0 0 0 0 0 0 0 0 0[ 0 - 3M [ 0 0 0 0 0 0 0 0 0 0 0 0 0 0
[ 3M - 1Y [ 0 0 0 0 0 0 0 0 0 0 0 0 0 0[ 1Y - 2Y [ 0 0 0 0 0 0 0 0 0 0 0 0 0 0[ 2Y - 3Y [ 0 0 0 0 0 0 0 0 0 0 0 0 0 0[3Y - 5Y [ 0 0 0 0 0 0 0 0 0 0 0 0 0 0
[5Y - 10Y [ 0 0 0 0 0 0 0 0 0 0 0 0 0 0[10Y - more 0 0 0 0 0 0 0 0 0 0 0 0 0 0
Tot 0 0 0 0 0 0 0 0 0 0 0 0 0 0[ 0 - 3M [ 0 0 0 0 0 0 0 0 0 0 0 0 0 0
[ 3M - 1Y [ 0 0 0 0 0 0 0 0 0 0 0 0 0 0[ 1Y - 2Y [ 0 0 0 0 0 0 0 0 0 0 0 0 0 0[ 2Y - 3Y [ 0 0 0 0 0 0 0 0 0 0 0 0 0 0[3Y - 5Y [ 0 0 0 0 0 0 0 0 0 0 0 0 0 0
[5Y - 10Y [ 0 0 0 0 0 0 0 0 0 0 0 0 0 0[10Y - more 0 0 0 0 0 0 0 0 0 0 0 0 0 0
Tot 0 0 0 0 0 0 0 0 0 0 0 0 0 0
Notes and definitions(1) The exposures reported cover only exposures to central, regional and local governments on immediate borrower basis, and do not include exposures to other counterparts with full or partial government guarantees(2) The banks disclose the exposures in the "Financial assets held for trading" portfolio after offsetting the cash short positions having the same maturities.(3) The exposures reported include the positions towards counterparts (other than sovereign) on sovereign credit risk (i.e. CDS, financial guarantees) booked in all the accounting portfolio (on-off balance sheet).
'Irrespective of the denomination and or accounting classification of the positions the economic substance over the form must be used as a criteria for the identification of the exposures to be included in this column. This item does not include exposures to counterparts (other than sovereign) with full or partial government guarantees by central, regional and local governments
Latin America and the
Caribbean
Africa
Others
Middle East
Other advanced economies
non EEA
Other Central and eastern
Europe countries non EEA
http://www.economiaciudadana.org/

8/10/2019 Test Stress Banca Española 2014
http://slidepdf.com/reader/full/test-stress-banca-espanola-2014 189/240
2014 EU-wide Stress Test - Restructuring scenarios
(mln EUR)
2013 0 0
2014 0 0 0 0
2015 0 0 0 0
2016 0 0 0 0
Total 0 0 0 0
Effects of mandatory restructuring plans publicly announced before 31 December 2013 and formally agreed with the European Commission.
Baseline scenario Adverse scenarioNarrative description of the transactions. (type, date of
completion/commitment, portfolios, subsidiaries, branches)CET1 impact
Risk exposureamount impact
CET1 impactRisk exposureamount impact

8/10/2019 Test Stress Banca Española 2014
http://slidepdf.com/reader/full/test-stress-banca-espanola-2014 190/240
http://www.economiaciudadana.org/
2014 EU-wide Stress Test
Outcome of the Stress Test based on the Restructuring plan for banks whose plan was formally agreed with the European Commission after 31 December 2013
(mln EUR)
As of
31/12/2013
As of
31/12/2014
As of
31/12/2015
As of
31/12/2016
As of
31/12/2014
As of
31/12/2015
As of
31/12/2016
COMMON EQUITY TIER 1 CAPITAL (net of deductions and after applying transitional adjustments)
TOTAL RISK EXPOSURE AMOUNT
COMMON EQUITY TIER 1 RATIO #DIV/0! #DIV/0! #DIV/0! #DIV/0! #DIV/0! #DIV/0! #DIV/0!
Baseline scenario Adverse scenario

8/10/2019 Test Stress Banca Española 2014
http://slidepdf.com/reader/full/test-stress-banca-espanola-2014 191/240
http://www.economiaciudadana.org/
2014 EU-wide Stress Test
Impact on CommonEquity Tier 1Million EUR
Raising of capital instruments eligible as CET1 capital (+) 50
Repayment of CET1 capital, buybacks (-) 0
Conversion to CET1 of hybrid instruments becoming effective between 1 January and 30 September 2014 (+) 0
Impact on AdditionalTier 1 and Tier 2
Major Capital Measures from 1 January to 30 September 2014
Net issuance of Additional Tier 1 and T2 Instruments
Issuance of CET 1 Instruments
Major Capital Measures Impacting Tier 1 and Tier 2 Eligible Capital from 1 January 2014 to 30 September 2014

8/10/2019 Test Stress Banca Española 2014
http://slidepdf.com/reader/full/test-stress-banca-espanola-2014 192/240
Tier 1 and Tier 2Million EUR
Net issuance of Additional Tier 1 and T2 Instruments with a trigger at or above bank's post stress test CET1 ratio in the adversescenario during the stress test horizon (+/-)
0
Net issuance of Additional Tier 1 and T2 Instrument with a trigger below bank's post stress test CET1 ratio in the adverse
scenario during the stress test horizon (+/-)0
Million EUR
Realized fines/litigation costs from 1 January to 30 September 2014 (net of provisions) (-) 0
Other material losses and provisions from 1 January to 30 September 2014 (-) 0
Losses
Net issuance of Additional Tier 1 and T2 Instruments
http://www.economiaciudadana.org/
Bank Name ES - Catalunya Banc, S.A.
LEI Code 549300I84DXMIK4UUL30
ES
NUK_WL_NR_XX
version
1809014
No restructuring
2014 EU-wide Stress Test

8/10/2019 Test Stress Banca Española 2014
http://slidepdf.com/reader/full/test-stress-banca-espanola-2014 193/240
No restructuring
http://www.economiaciudadana.org/

8/10/2019 Test Stress Banca Española 2014
http://slidepdf.com/reader/full/test-stress-banca-espanola-2014 194/240
2014 EU-wide Stress TestCredit Risk
(mln EUR, %)
No n-d ef aul t ed De fau lt e d No n-d ef aul t ed De fau lt e d No n-d ef aul t ed De fau lt e d No n-d ef aul t e d De fau lt e d No n-d ef aul t ed De fau lt e d No n-d ef aul t e d De fau lt e d No n-d ef aul t ed De fau lt e d No n-d ef aul t ed De fau lt e d No n-d ef aul t ed De fau lt e dImpairment
rate
Stockof
ProvisionsCoverage Ratio -
Default Stock
Impairment
rate
Stockof
Provisions
Coverage
Ratio-Default
Stock
Impairment
rate
Stockof
Provisions
Coverage
Ratio -Default
Stock
Impairment rateStockof
Provisions
Coverage
Ratio-Default
Stock
Impairment
rate
Stockof
Provisions
Coverage
Ratio-Default
Stock
Impairment
rate
Stockof
Provisions
Coverage
Ratio -Default
Stock
Central banksandcentral governments 0 0 0 0 17,927 0 0 0 0 0 3,470 0 0 0 0 0 0 0 0.13% 29 42.07% 0.11% 51 44.72% 0.10% 70 46.53% 0.44% 98 40.78% 0.40% 174 44.45% 0.35% 240 47.45%
Institutions 1,264 32 0 0 9,831 68 609 0 0 0 820 70 14 13 0 0 9 40 0.84% 91 38.69% 0.54% 99 39.45% 0.45% 106 39.85% 1.14% 96 39.20% 0.99% 111 40.31% 0.72% 121 40.75%
Corporates 1,022 730 1,020 1,642 2,156 201 1,062 0 1,010 609 2,068 210 68 477 50 1,040 511 667 1.79% 2,538 68.10% 1.20% 2,603 67.59% 1.12% 2,658 67.11% 2.64% 2,583 68.07% 2.75% 2,707 67.20% 2.01% 2,790 66.61%
Corporates -Of Which:SpecialisedLending 2 1 1 2 732 46 3 0 1 2 728 45 0 0 0 2 66 158 - 0 - - 0 - - 0 - - 0 - - 0 - - 0 -
Corporates -Of Which:SME 200 93 569 399 304 48 236 0 559 109 266 51 19 69 29 209 25 150 - 0 - - 0 - - 0 - - 0 - - 0 - - 0 -
Retail 114 12 20,026 4,387 1,645 54 86 0 4,774 453 761 40 2 8 428 1,807 39 73 1.80% 2,739 34.01% 1.03% 2,923 32.92% 0.65% 3,027 32.11% 2.40% 2,864 34.21% 1.93% 3,204 33.37% 1.19% 3,381 33.10%
Retail -Securedon real estateproperty 56.3% 1 0 19,172 4,179 1,209 50 1 0 4,429 431 451 36 0 0 412 1,632 30 38 1.59% 2,413 31.50% 0.90% 2,559 30.34% 0.54% 2,635 29.48% 2.14% 2,521 31.67% 1.77% 2,808 30.78% 1.06% 2,951 30.49%
Retail -Securedon real estate property- Of
h i h : S E38.6% 1 0 554 136 54 0 1 0 344 42 28 1 0 0 11 46 1 0 0.99% 64 29.27% 0.56% 67 27.10% 0.42% 69 25.87% 1.41% 68 29.72% 1.06% 74 27.21% 0.67% 77 25.89%
Retail -Securedon real estate property- Of
h i h: n n - E56.9% 0 0 18,618 4,043 1,155 50 0 0 4,085 389 423 35 0 0 401 1,586 29 38 1.61% 2,349 31.56% 0.91% 2,491 30.44% 0.55% 2,566 29.58% 2.16% 2,453 31.72% 1.79% 2,734 30.89% 1.08% 2,874 30.63%
Retail -QualifyingRevolving 0 0 0 0 232 2 0 0 0 0 172 2 0 0 0 0 7 21 2.17% 41 77.31% 1.72% 46 72.41% 1.58% 50 69.34% 2.67% 43 77.93% 2.49% 49 73.07% 2.13% 54 70.01%
Retail -OtherRetail 113 12 854 208 204 2 85 0 345 22 138 2 2 8 16 175 2 14 5.75% 285 82.81% 3.30% 318 82.55% 2.38% 341 82.33% 7.11% 300 84.15% 4.74% 348 84.08% 3.16% 377 83.81%
Retail -Other Retail -Of Which:SME 113 12 444 34 24 0 85 0 192 7 13 0 2 8 7 23 1 0 1.80% 52 57.90% 1.29% 60 55.93% 1.05% 68 56.39% 2.45% 56 57.21% 2.41% 71 56.39% 1.74% 82 57.08%
Retail -Other Retail -Of Which:non-SME 0 0 410 174 180 2 0 0 153 15 125 2 0 0 9 152 1 14 10.55% 233 90.78% 5.88% 258 92.22% 4.13% 273 92.45% 12.78% 244 93.44% 7.71% 276 95.71% 5.00% 294 96.11%
Equity 107 0 0 0 147 0 393 0 0 0 365 0 0 0 0 0 0 0 6.47% 7 90.00% 4.81% 9 90.00% - 9 90.00% 8.31% 9 90.00% 7.94% 13 90.00% - 13 90.00%
Securitisation 0 0 13 0 1,350 0 0 0 64 0 368 0 0 0 0 0 0 0
Othernon-credit obligation assets 0 0 0 0 2,016 0 0 0 0 0 1,748 0 0 0 0 0 0 0
TOTAL 2,507 774 21,059 6,029 35,072 323 2,150 0 5,848 1,062 9,600 320 84 498 478 2,847 559 780 1.02% 5,404 44.99% 0.60% 5,685 43.56% 0.41% 5,870 42.62% 1.50% 5,649 44.84% 1.24% 6,209 43.51% 0.81% 6,545 43.05%
Securitisation andre-securitisations positions deductedfrom capital * 0 0 0 0 0 0 0 0 0 0 0 0
(mln EUR, %)No n-d ef aul t ed De fau lt e d No n-d ef aul t ed De fau lt e d No n-d ef aul t ed De fau lt e d No n-d ef aul t e d De fau lt e d No n-d ef aul t ed De fau lt e d No n-d ef aul t e d De fau lt e d No n-d ef aul t ed De fau lt e d No n-d ef aul t ed De fau lt e d No n-d ef aul t ed De fau lt e d
Impairment
rate
Stockof
ProvisionsCoverage Ratio -
Default Stock
Impairment
rate
Stockof
Provisions
Coverage
Ratio-DefaultStock
Impairment
rate
Stockof
Provisions
Coverage
Ratio -DefaultStock
Impairment rateStockof
Provisions
Coverage
Ratio-DefaultStock
Impairment
rate
Stockof
Provisions
Coverage
Ratio-DefaultStock
Impairment
rate
Stockof
Provisions
Coverage
Ratio -DefaultStock
Central banksandcentral governments 0 0 0 0 0 0 0 0 0 0 0 0 0 0 0 0 0 0 0.13% 29 42.06% 0.11% 51 44.72% 0.10% 70 46.53% 0.44% 98 40.78% 0.40% 174 44.45% 0.35% 240 47.45%
Institutions 0 0 0 0 0 0 0 0 0 0 0 0 0 0 0 0 0 0 0.84% 91 38.68% 0.54% 99 39.44% 0.44% 105 39.84% 1.14% 96 39.19% 0.98% 111 40.29% 0.72% 121 40.74%
Corporates 0 0 0 0 0 0 0 0 0 0 0 0 0 0 0 0 0 0 1.82% 2,474 68.28% 1.23% 2,537 67.79% 1.12% 2,590 67.31% 2.68% 2,517 68.26% 2.78% 2,637 67.41% 2.00% 2,716 66.82%
Corporates -Of Which:SpecialisedLending 0 0 0 0 0 0 0 0 0 0 0 0 0 0 0 0 0 0 - 0 - - 0 - - 0 - - 0 - - 0 - - 0 -
Corporates -Of Which:SME 0 0 0 0 0 0 0 0 0 0 0 0 0 0 0 0 0 0 - 0 - - 0 - - 0 - - 0 - - 0 - - 0 -
Retail 0 0 0 0 0 0 0 0 0 0 0 0 0 0 0 0 0 0 1.81% 2,713 33.94% 1.03% 2,896 32.87% 0.65% 2,999 32.06% 2.41% 2,837 34.14% 1.94% 3,174 33.32% 1.19% 3,350 33.06%
Retail -Securedon real estateproperty 0.0% 0 0 0 0 0 0 0 0 0 0 0 0 0 0 0 0 0 0 1.59% 2,388 31.42% 0.90% 2,533 30.27% 0.55% 2,608 29.42% 2.15% 2,495 31.59% 1.78% 2,779 30.72% 1.07% 2,921 30.43%
Retail -Securedon real estate property- Of
h i h : S E0.0% 0 0 0 0 0 0 0 0 0 0 0 0 0 0 0 0 0 0 0.99% 64 29.27% 0.56% 67 27.10% 0.42% 69 25.87% 1.41% 68 29.72% 1.06% 74 27.21% 0.67% 77 25.89%
Retail -Securedon real estate property- Of
h i h: n n - E0.0% 0 0 0 0 0 0 0 0 0 0 0 0 0 0 0 0 0 0 1.61% 2,324 31.48% 0.91% 2,465 30.37% 0.55% 2,539 29.52% 2.17% 2,427 31.65% 1.80% 2,705 30.82% 1.08% 2,844 30.57%
Retail -QualifyingRevolving 0 0 0 0 0 0 0 0 0 0 0 0 0 0 0 0 0 0 2.17% 41 77.24% 1.72% 46 72.35% 1.58% 50 69.29% 2.67% 42 77.86% 2.49% 49 73.02% 2.13% 54 69.96%
Retail -OtherRetail 0 0 0 0 0 0 0 0 0 0 0 0 0 0 0 0 0 0 5.74% 284 82.79% 3.30% 317 82.52% 2.38% 341 82.31% 7.10% 299 84.13% 4.74% 347 84.06% 3.16% 376 83.79%
Retail -Other Retail -Of Which:SME 0 0 0 0 0 0 0 0 0 0 0 0 0 0 0 0 0 0 1.80% 52 57.91% 1.29% 60 55.93% 1.05% 68 56.40% 2.45% 56 57.22% 2.41% 71 56.40% 1.73% 82 57.08%
Retail -Other Retail -Of Which:non-SME 0 0 0 0 0 0 0 0 0 0 0 0 0 0 0 0 0 0 10.55% 232 90.79% 5.88% 257 92.22% 4.13% 272 92.46% 12.78% 243 93.44% 7.71% 275 95.72% 5.00% 293 96.13%
Equity 0 0 0 0 0 0 0 0 0 0 0 0 0 0 0 0 0 0 6.47% 7 90.00% 4.81% 9 90.00% - 9 90.00% 8.31% 9 90.00% 7.94% 13 90.00% - 13 90.00%
Securitisation 0 0 0 0 0 0 0 0 0 0 0 0 0 0 0 0 0 0
Othernon-credit obligation assets 0 0 0 0 0 0 0 0 0 0 0 0 0 0 0 0 0 0
TOTAL 0 0 0 0 0 0 0 0 0 0 0 0 0 0 0 0 0 0 1.02% 5,314 44.92% 0.60% 5,592 43.49% 0.41% 5,773 42.55% 1.50% 5,556 44.77% 1.24% 6,108 43.44% 0.81% 6,439 42.97%Securitisation andre-securitisations positions deductedfrom capital * 0 0 0 0 0 0 0 0 0 0 0 0
(mln EUR, %)No n-d ef aul t ed De fau lt e d No n-d ef aul t ed De fau lt e d No n-d ef aul t ed De fau lt e d No n-d ef aul t e d De fau lt e d No n-d ef aul t ed De fau lt e d No n-d ef aul t e d De fau lt e d No n-d ef aul t ed De fau lt e d No n-d ef aul t ed De fau lt e d No n-d ef aul t ed De fau lt e d
Impairment
rate
Stockof
ProvisionsCoverage Ratio -
Default Stock
Impairment
rate
Stockof
Provisions
CoverageRatio-Default
Stock
Impairment
rate
Stockof
Provisions
CoverageRatio -Default
Stock
Impairment rateStockof
Provisions
CoverageRatio-Default
Stock
Impairment
rate
Stockof
Provisions
CoverageRatio-Default
Stock
Impairment
rate
Stockof
Provisions
CoverageRatio -Default
Stock Central banksandcentral governments 0 0 0 0 0 0 0 0 0 0 0 0 0 0 0 0 0 0 - 0 - - 0 - - 0 - - 0 - - 0 - - 0 -
Institutions 0 0 0 0 0 0 0 0 0 0 0 0 0 0 0 0 0 0 - 0 - - 0 - - 0 - - 0 - - 0 - - 0 -
Corporates 0 0 0 0 0 0 0 0 0 0 0 0 0 0 0 0 0 0 - 0 - - 0 - - 0 - - 0 - - 0 - - 0 -
Corporates -Of Which:SpecialisedLending 0 0 0 0 0 0 0 0 0 0 0 0 0 0 0 0 0 0 - 0 - - 0 - - 0 - - 0 - - 0 - - 0 -
Corporates -Of Which:SME 0 0 0 0 0 0 0 0 0 0 0 0 0 0 0 0 0 0 - 0 - - 0 - - 0 - - 0 - - 0 - - 0 -
Retail 0 0 0 0 0 0 0 0 0 0 0 0 0 0 0 0 0 0 - 0 - - 0 - - 0 - - 0 - - 0 - - 0 -
Retail -Securedon real estateproperty 0.0% 0 0 0 0 0 0 0 0 0 0 0 0 0 0 0 0 0 0 - 0 - - 0 - - 0 - - 0 - - 0 - - 0 -
Retail -Securedon real estate property- Of
hi h: E0.0% 0 0 0 0 0 0 0 0 0 0 0 0 0 0 0 0 0 0 - 0 - - 0 - - 0 - - 0 - - 0 - - 0 -
Retail -Securedon real estate property- Of
h i h : n n -S E0.0% 0 0 0 0 0 0 0 0 0 0 0 0 0 0 0 0 0 0 - 0 - - 0 - - 0 - - 0 - - 0 - - 0 -
Retail -QualifyingRevolving 0 0 0 0 0 0 0 0 0 0 0 0 0 0 0 0 0 0 - 0 - - 0 - - 0 - - 0 - - 0 - - 0 -
Retail -OtherRetail 0 0 0 0 0 0 0 0 0 0 0 0 0 0 0 0 0 0 - 0 - - 0 - - 0 - - 0 - - 0 - - 0 -
Retail -Other Retail -Of Which:SME 0 0 0 0 0 0 0 0 0 0 0 0 0 0 0 0 0 0 - 0 - - 0 - - 0 - - 0 - - 0 - - 0 -
Retail -Other Retail -Of Which:non-SME 0 0 0 0 0 0 0 0 0 0 0 0 0 0 0 0 0 0 - 0 - - 0 - - 0 - - 0 - - 0 - - 0 -
Equity 0 0 0 0 0 0 0 0 0 0 0 0 0 0 0 0 0 0 - 0 - - 0 - - 0 - - 0 - - 0 - - 0 -
Securitisation 0 0 0 0 0 0 0 0 0 0 0 0 0 0 0 0 0 0
Othernon-credit obligation assets 0 0 0 0 0 0 0 0 0 0 0 0 0 0 0 0 0 0
TOTAL 0 0 0 0 0 0 0 0 0 0 0 0 0 0 0 0 0 0 - 0 - - 0 - - 0 - - 0 - - 0 - - 0 -
Securitisation andre securitisations positions deductedfromcapital * 0 0 0 0 0 0 0 0 0 0 0 0
Risk exposureamounts(as of31/12/2013)
Baseline Scenario Adverse Scenario
F-IRB A-IRB STA F-IRB A-IRB STA F-IRB A-IRB STA as of 31/12/2014 as of 31/12/2015 as of 31/12/2016 as of 31/12/2014 as of 31/12/2015 as of 31/12/2016
asof 31/12/2016
Spain
LTV %(asof
31/12/2013)
E xp os ur e va lu es ( as of 3 1/ 12 /2 01 3) R is k e xp os ur e am ou nt s (a s of 3 1/ 12 /2 01 3) V al ue a dj us tm en ts a nd pr ov is io ns ( as o f3 1/ 12 /2 01 3)
AdverseScenario
F-IRB A-IRB STA F-IRB A-IRB STA F-IRB A-IRB STA as of 31/12/2014 as of 31/12/2015 as of 31/12/2016 as of 31/12/2014 as of 31/12/2015 as of 31/12/2016LTV %(asof
31/12/2013)
Exposurevalues(as of31/12/2013)
ES - Catalunya Banc, S.A.
(*)Referstothepart ofSecuritizationexposurethat isdeductedfrom capital andisnot includedinRWA
Valueadjustmentsand provisions(asof 31/12/2013) BaselineScenario
LTV %(asof
31/12/2013)
Exposure values (as of 31/12/2013) Risk exposure amounts (as of 31/12/2013) Value adjustments and provisions (as of 31/12/2013) Adverse Scenario
F-IRB A-IRB STA F-IRB A-IRB STA F-IRB A-IRB STA
BaselineScenario
as of 31/12/2014 as of 31/12/2015 as of 31/12/2016 as of 31/12/2014 as of 31/12/2015
(*)Referstothepart ofSecuritizationexposurethat isdeductedfrom capital andisnot includedinRWA
Please, select the country

8/10/2019 Test Stress Banca Española 2014
http://slidepdf.com/reader/full/test-stress-banca-espanola-2014 195/240
Securitisation andre-securitisations positions deductedfrom capital * 0 0 0 0 0 0 0 0 0 0 0 0
(mln EUR, %)No n-d ef aul t ed De fau lt e d No n-d ef aul t ed De fau lt e d No n-d ef aul t ed De fau lt e d No n-d ef aul t e d De fau lt e d No n-d ef aul t ed De fau lt e d No n-d ef aul t e d De fau lt e d No n-d ef aul t ed De fau lt e d No n-d ef aul t ed De fau lt e d No n-d ef aul t ed De fau lt e d
Impairment
rate
Stockof
ProvisionsCoverage Ratio -
Default Stock
Impairment
rate
Stockof
Provisions
CoverageRatio-Default
Stock
Impairment
rate
Stockof
Provisions
CoverageRatio -Default
Stock
Impairment rateStockof
Provisions
CoverageRatio-Default
Stock
Impairment
rate
Stockof
Provisions
CoverageRatio-Default
Stock
Impairment
rate
Stockof
Provisions
CoverageRatio -Default
Stock Central banksandcentral governments 0 0 0 0 0 0 0 0 0 0 0 0 0 0 0 0 0 0 - 0 - - 0 - - 0 - - 0 - - 0 - - 0 -
Institutions 0 0 0 0 0 0 0 0 0 0 0 0 0 0 0 0 0 0 - 0 - - 0 - - 0 - - 0 - - 0 - - 0 -
Corporates 0 0 0 0 0 0 0 0 0 0 0 0 0 0 0 0 0 0 - 0 - - 0 - - 0 - - 0 - - 0 - - 0 -
Corporates -Of Which:SpecialisedLending 0 0 0 0 0 0 0 0 0 0 0 0 0 0 0 0 0 0 - 0 - - 0 - - 0 - - 0 - - 0 - - 0 -
Corporates -Of Which:SME 0 0 0 0 0 0 0 0 0 0 0 0 0 0 0 0 0 0 - 0 - - 0 - - 0 - - 0 - - 0 - - 0 -
Retail 0 0 0 0 0 0 0 0 0 0 0 0 0 0 0 0 0 0 - 0 - - 0 - - 0 - - 0 - - 0 - - 0 -
Retail -Securedon real estateproperty 0.0% 0 0 0 0 0 0 0 0 0 0 0 0 0 0 0 0 0 0 - 0 - - 0 - - 0 - - 0 - - 0 - - 0 -
Retail -Securedon real estate property- Of
hi h: E0.0% 0 0 0 0 0 0 0 0 0 0 0 0 0 0 0 0 0 0 - 0 - - 0 - - 0 - - 0 - - 0 - - 0 -
Retail -Securedon real estate property- Of
h i h: n n - E0.0% 0 0 0 0 0 0 0 0 0 0 0 0 0 0 0 0 0 0 - 0 - - 0 - - 0 - - 0 - - 0 - - 0 -
Retail -QualifyingRevolving 0 0 0 0 0 0 0 0 0 0 0 0 0 0 0 0 0 0 - 0 - - 0 - - 0 - - 0 - - 0 - - 0 -
Retail -OtherRetail 0 0 0 0 0 0 0 0 0 0 0 0 0 0 0 0 0 0 - 0 - - 0 - - 0 - - 0 - - 0 - - 0 -
Retail -Other Retail -Of Which:SME 0 0 0 0 0 0 0 0 0 0 0 0 0 0 0 0 0 0 - 0 - - 0 - - 0 - - 0 - - 0 - - 0 -
Retail -Other Retail -Of Which:non-SME 0 0 0 0 0 0 0 0 0 0 0 0 0 0 0 0 0 0 - 0 - - 0 - - 0 - - 0 - - 0 - - 0 -
Equity 0 0 0 0 0 0 0 0 0 0 0 0 0 0 0 0 0 0 - 0 - - 0 - - 0 - - 0 - - 0 - - 0 -
Securitisation 0 0 0 0 0 0 0 0 0 0 0 0 0 0 0 0 0 0
Othernon-credit obligation assets 0 0 0 0 0 0 0 0 0 0 0 0 0 0 0 0 0 0
TOTAL 0 0 0 0 0 0 0 0 0 0 0 0 0 0 0 0 0 0 - 0 - - 0 - - 0 - - 0 - - 0 - - 0 -
Securitisation andre-securitisations positions deductedfrom capital * 0 0 0 0 0 0 0 0 0 0 0 0
(mln EUR, %)No n-d ef aul t ed De fau lt e d No n-d ef aul t ed De fau lt e d No n-d ef aul t ed De fau lt e d No n-d ef aul t e d De fau lt e d No n-d ef aul t ed De fau lt e d No n-d ef aul t e d De fau lt e d No n-d ef aul t ed De fau lt e d No n-d ef aul t ed De fau lt e d No n-d ef aul t ed De fau lt e d
Impairment
rate
Stockof
ProvisionsCoverage Ratio -
Default Stock
Impairment
rate
Stockof
Provisions
CoverageRatio-Default
Stock
Impairment
rate
Stockof
Provisions
CoverageRatio -Default
Stock
Impairment rateStockof
Provisions
CoverageRatio-Default
Stock
Impairment
rate
Stockof
Provisions
CoverageRatio-Default
Stock
Impairment
rate
Stockof
Provisions
CoverageRatio -Default
Stock Central banksandcentral governments 0 0 0 0 0 0 0 0 0 0 0 0 0 0 0 0 0 0 - 0 - - 0 - - 0 - - 0 - - 0 - - 0 -
Institutions 0 0 0 0 0 0 0 0 0 0 0 0 0 0 0 0 0 0 - 0 - - 0 - - 0 - - 0 - - 0 - - 0 -
Corporates 0 0 0 0 0 0 0 0 0 0 0 0 0 0 0 0 0 0 - 0 - - 0 - - 0 - - 0 - - 0 - - 0 -
Corporates -Of Which:SpecialisedLending 0 0 0 0 0 0 0 0 0 0 0 0 0 0 0 0 0 0 - 0 - - 0 - - 0 - - 0 - - 0 - - 0 -
Corporates -Of Which:SME 0 0 0 0 0 0 0 0 0 0 0 0 0 0 0 0 0 0 - 0 - - 0 - - 0 - - 0 - - 0 - - 0 -
Retail 0 0 0 0 0 0 0 0 0 0 0 0 0 0 0 0 0 0 - 0 - - 0 - - 0 - - 0 - - 0 - - 0 -
Retail -Securedon real estateproperty 0.0% 0 0 0 0 0 0 0 0 0 0 0 0 0 0 0 0 0 0 - 0 - - 0 - - 0 - - 0 - - 0 - - 0 -
Retail -Securedon real estate property- Of
hi h: E0.0% 0 0 0 0 0 0 0 0 0 0 0 0 0 0 0 0 0 0 - 0 - - 0 - - 0 - - 0 - - 0 - - 0 -
Retail -Securedon real estate property- Of
h i h : n n -S E0.0% 0 0 0 0 0 0 0 0 0 0 0 0 0 0 0 0 0 0 - 0 - - 0 - - 0 - - 0 - - 0 - - 0 -
Retail -QualifyingRevolving 0 0 0 0 0 0 0 0 0 0 0 0 0 0 0 0 0 0 - 0 - - 0 - - 0 - - 0 - - 0 - - 0 -
Retail -OtherRetail 0 0 0 0 0 0 0 0 0 0 0 0 0 0 0 0 0 0 - 0 - - 0 - - 0 - - 0 - - 0 - - 0 -
Retail -Other Retail -Of Which:SME 0 0 0 0 0 0 0 0 0 0 0 0 0 0 0 0 0 0 - 0 - - 0 - - 0 - - 0 - - 0 - - 0 -
Retail -Other Retail -Of Which:non-SME 0 0 0 0 0 0 0 0 0 0 0 0 0 0 0 0 0 0 - 0 - - 0 - - 0 - - 0 - - 0 - - 0 -
Equity 0 0 0 0 0 0 0 0 0 0 0 0 0 0 0 0 0 0 - 0 - - 0 - - 0 - - 0 - - 0 - - 0 -
Securitisation 0 0 0 0 0 0 0 0 0 0 0 0 0 0 0 0 0 0
Othernon-credit obligation assets 0 0 0 0 0 0 0 0 0 0 0 0 0 0 0 0 0 0
TOTAL 0 0 0 0 0 0 0 0 0 0 0 0 0 0 0 0 0 0 - 0 - - 0 - - 0 - - 0 - - 0 - - 0 -
Securitisation andre-securitisations positions deductedfrom capital * 0 0 0 0 0 0 0 0 0 0 0 0
(mln EUR, %)No n-d ef aul t ed De fau lt e d No n-d ef aul t ed De fau lt e d No n-d ef aul t ed De fau lt e d No n-d ef aul t e d De fau lt e d No n-d ef aul t ed De fau lt e d No n-d ef aul t e d De fau lt e d No n-d ef aul t ed De fau lt e d No n-d ef aul t ed De fau lt e d No n-d ef aul t ed De fau lt e d
Impairment
rate
Stockof
ProvisionsCoverage Ratio -
Default Stock
Impairment
rate
Stockof
Provisions
CoverageRatio-Default
Stock
Impairment
rate
Stockof
Provisions
CoverageRatio -Default
Stock
Impairment rateStockof
Provisions
CoverageRatio-Default
Stock
Impairment
rate
Stockof
Provisions
CoverageRatio-Default
Stock
Impairment
rate
Stockof
Provisions
CoverageRatio -Default
Stock Central banksandcentral governments 0 0 0 0 0 0 0 0 0 0 0 0 0 0 0 0 0 0 - 0 - - 0 - - 0 - - 0 - - 0 - - 0 -
Institutions 0 0 0 0 0 0 0 0 0 0 0 0 0 0 0 0 0 0 - 0 - - 0 - - 0 - - 0 - - 0 - - 0 -
Corporates 0 0 0 0 0 0 0 0 0 0 0 0 0 0 0 0 0 0 - 0 - - 0 - - 0 - - 0 - - 0 - - 0 -
Corporates -Of Which:SpecialisedLending 0 0 0 0 0 0 0 0 0 0 0 0 0 0 0 0 0 0 - 0 - - 0 - - 0 - - 0 - - 0 - - 0 -
Corporates -Of Which:SME 0 0 0 0 0 0 0 0 0 0 0 0 0 0 0 0 0 0 - 0 - - 0 - - 0 - - 0 - - 0 - - 0 -
Retail 0 0 0 0 0 0 0 0 0 0 0 0 0 0 0 0 0 0 - 0 - - 0 - - 0 - - 0 - - 0 - - 0 -
Retail -Securedon real estateproperty 0.0% 0 0 0 0 0 0 0 0 0 0 0 0 0 0 0 0 0 0 - 0 - - 0 - - 0 - - 0 - - 0 - - 0 -
Retail -Securedon real estate property- Of
hi h: E0.0% 0 0 0 0 0 0 0 0 0 0 0 0 0 0 0 0 0 0 - 0 - - 0 - - 0 - - 0 - - 0 - - 0 -
Retail -Securedon real estate property- Of
h i h: n n - E0.0% 0 0 0 0 0 0 0 0 0 0 0 0 0 0 0 0 0 0 - 0 - - 0 - - 0 - - 0 - - 0 - - 0 -
Retail -QualifyingRevolving 0 0 0 0 0 0 0 0 0 0 0 0 0 0 0 0 0 0 - 0 - - 0 - - 0 - - 0 - - 0 - - 0 -
Retail -OtherRetail 0 0 0 0 0 0 0 0 0 0 0 0 0 0 0 0 0 0 - 0 - - 0 - - 0 - - 0 - - 0 - - 0 -
Retail -Other Retail -Of Which:SME 0 0 0 0 0 0 0 0 0 0 0 0 0 0 0 0 0 0 - 0 - - 0 - - 0 - - 0 - - 0 - - 0 -Retail -Other Retail -Of Which:non-SME 0 0 0 0 0 0 0 0 0 0 0 0 0 0 0 0 0 0 - 0 - - 0 - - 0 - - 0 - - 0 - - 0 -
Equity 0 0 0 0 0 0 0 0 0 0 0 0 0 0 0 0 0 0 - 0 - - 0 - - 0 - - 0 - - 0 - - 0 -
Securitisation 0 0 0 0 0 0 0 0 0 0 0 0 0 0 0 0 0 0
Othernon-credit obligation assets 0 0 0 0 0 0 0 0 0 0 0 0 0 0 0 0 0 0
TOTAL 0 0 0 0 0 0 0 0 0 0 0 0 0 0 0 0 0 0 - 0 - - 0 - - 0 - - 0 - - 0 - - 0 -
Securitisation andre-securitisations positions deductedfrom capital * 0 0 0 0 0 0 0 0 0 0 0 0
as of 31/12/2016 as of 31/12/2014 as of 31/12/2015 as of 31/12/2016
Please, select the country
F-IRB A-IRB STA a s of 3 1/ 12 /2 01 4 a s of 3 1/ 12 /2 01 5LTV %(asof
31/12/2013)
Exposure values (as of 31/12/2013) Risk exposure amounts (as of 31/12/2013) Value adjustments and provisions (as of 31/12/2013) Baseline Scenario Adverse Scenario
F-IRB A-IRB STA F-IRB A-IRB STA
LTV %(asof
31/12/2013)
Exposure values (as of 31/12/2013) Risk exposure amounts (as of 31/12/2013) Value adjustments and provisions (as of 31/12/2013) Baseline Scenario Adverse Scenario
F-IRB A-IRB STA F-IRB A-IRB STA F-IRB a sof 31 /12 /2 01 4 a so f3 1/ 12 /2 01 5 a sof 31 /12 /2 01 6 A-IRB STA a sof 31 /1 2/ 20 14 a so f3 1/ 12 /2 01 5 a sof 31 /12 /2 01 6
LTV %(asof
31/12/2013)
Exposure values (as of 31/12/2013) Risk exposure amounts (as of 31/12/2013) Value adjustments and provisions (as of 31/12/2013) Baseline Scenario Adverse Scenario
F-IRB A-IRB STA F-IRB A-IRB STA F-IRB A-IRB a s of 3 1/ 12 /2 01 5 a s of 3 1/ 12 /2 01 6STA as of 31/12/2014 as of 31/12/2015 as of 31/12/2016 as of 31/12/2014
(*)Referstothepart ofSecuritizationexposurethat isdeductedfrom capital andisnot includedinRWA
(*)Referstothepart ofSecuritizationexposurethat isdeductedfrom capital andisnot includedinRWA
(*)Referstothepart ofSecuritizationexposurethat isdeductedfrom capital andisnot includedinRWA
(*)Referstothepart ofSecuritizationexposurethat isdeductedfrom capital andisnot includedinRWA
Please, select the country
Please, select the country
http://www.economiaciudadana.org/
2014 EU-wide Stress TestCredit Risk
31 1 13) 31 1 13) 31 1 13)
(mln EU
R, %)No n-d ef aul t ed De fau lt e d No n-d ef aul t ed De fau lt e d No n-d ef aul t ed De fau lt e d No n-d ef aul t e d De fau lt e d No n-d ef aul t ed De fau lt e d No n-d ef aul t e d De fau lt e d No n-d ef aul t ed De fau lt e d No n-d ef aul t ed De fau lt e d No n-d ef aul t ed De fau lt e d
Impairment
rate
Stockof
ProvisionsCoverage Ratio -
Default Stock
Impairment
rate
Stockof
Provisions
CoverageRatio-Default
Stock
Impairment
rate
Stockof
Provisions
CoverageRatio -Default
Stock
Impairment rateStockof
Provisions
CoverageRatio-Default
Stock
Impairment
rate
Stockof
Provisions
CoverageRatio-Default
Stock
Impairment
rate
Stockof
Provisions
CoverageRatio -Default
Stock Central banksandcentral governments 0 0 0 0 0 0 0 0 0 0 0 0 0 0 0 0 0 0 - 0 - - 0 - - 0 - - 0 - - 0 - - 0 -
Institutions 0 0 0 0 0 0 0 0 0 0 0 0 0 0 0 0 0 0 - 0 - - 0 - - 0 - - 0 - - 0 - - 0 -
Corporates 0 0 0 0 0 0 0 0 0 0 0 0 0 0 0 0 0 0 - 0 - - 0 - - 0 - - 0 - - 0 - - 0 -
Corporates -Of Which:SpecialisedLending 0 0 0 0 0 0 0 0 0 0 0 0 0 0 0 0 0 0 - 0 - - 0 - - 0 - - 0 - - 0 - - 0 -Corporates -Of Which:SME 0 0 0 0 0 0 0 0 0 0 0 0 0 0 0 0 0 0 - 0 - - 0 - - 0 - - 0 - - 0 - - 0 -
Retail 0 0 0 0 0 0 0 0 0 0 0 0 0 0 0 0 0 0 - 0 - - 0 - - 0 - - 0 - - 0 - - 0 -
Retail -Securedon real estateproperty 0.0% 0 0 0 0 0 0 0 0 0 0 0 0 0 0 0 0 0 0 - 0 - - 0 - - 0 - - 0 - - 0 - - 0 -
Retail -Securedon real estate property- Of
hi h: E0.0% 0 0 0 0 0 0 0 0 0 0 0 0 0 0 0 0 0 0 - 0 - - 0 - - 0 - - 0 - - 0 - - 0 -
Retail -Securedon real estate property- Of
h i h: n n - E0.0% 0 0 0 0 0 0 0 0 0 0 0 0 0 0 0 0 0 0 - 0 - - 0 - - 0 - - 0 - - 0 - - 0 -
Retail -QualifyingRevolving 0 0 0 0 0 0 0 0 0 0 0 0 0 0 0 0 0 0 - 0 - - 0 - - 0 - - 0 - - 0 - - 0 -
Retail -OtherRetail 0 0 0 0 0 0 0 0 0 0 0 0 0 0 0 0 0 0 - 0 - - 0 - - 0 - - 0 - - 0 - - 0 -
Retail -Other Retail -Of Which:SME 0 0 0 0 0 0 0 0 0 0 0 0 0 0 0 0 0 0 - 0 - - 0 - - 0 - - 0 - - 0 - - 0 -
Retail -Other Retail -Of Which:non-SME 0 0 0 0 0 0 0 0 0 0 0 0 0 0 0 0 0 0 - 0 - - 0 - - 0 - - 0 - - 0 - - 0 -
Equity 0 0 0 0 0 0 0 0 0 0 0 0 0 0 0 0 0 0 - 0 - - 0 - - 0 - - 0 - - 0 - - 0 -
Securitisation 0 0 0 0 0 0 0 0 0 0 0 0 0 0 0 0 0 0
Othernon-credit obligation assets 0 0 0 0 0 0 0 0 0 0 0 0 0 0 0 0 0 0
TOTAL 0 0 0 0 0 0 0 0 0 0 0 0 0 0 0 0 0 0 - 0 - - 0 - - 0 - - 0 - - 0 - - 0 -
Securitisation andre-securitisations positions deductedfrom capital * 0 0 0 0 0 0 0 0 0 0 0 0
(mln EUR, %)No n-d ef aul t ed De fau lt e d No n-d ef aul t ed De fau lt e d No n-d ef aul t ed De fau lt e d No n-d ef aul t e d De fau lt e d No n-d ef aul t ed De fau lt e d No n-d ef aul t e d De fau lt e d No n-d ef aul t ed De fau lt e d No n-d ef aul t ed De fau lt e d No n-d ef aul t ed De fau lt e d
Impairment
rate
Stockof
ProvisionsCoverage Ratio -
Default Stock
Impairment
rate
Stockof
Provisions
CoverageRatio-Default
Stock
Impairment
rate
Stockof
Provisions
CoverageRatio -Default
Stock
Impairment rateStockof
Provisions
CoverageRatio-Default
Stock
Impairment
rate
Stockof
Provisions
CoverageRatio-Default
Stock
Impairment
rate
Stockof
Provisions
CoverageRatio -Default
Stock Central banksandcentral governments 0 0 0 0 0 0 0 0 0 0 0 0 0 0 0 0 0 0 - 0 - - 0 - - 0 - - 0 - - 0 - - 0 -
Institutions 0 0 0 0 0 0 0 0 0 0 0 0 0 0 0 0 0 0 - 0 - - 0 - - 0 - - 0 - - 0 - - 0 -
Corporates 0 0 0 0 0 0 0 0 0 0 0 0 0 0 0 0 0 0 - 0 - - 0 - - 0 - - 0 - - 0 - - 0 -
Corporates -Of Which:SpecialisedLending 0 0 0 0 0 0 0 0 0 0 0 0 0 0 0 0 0 0 - 0 - - 0 - - 0 - - 0 - - 0 - - 0 -
Corporates -Of Which:SME 0 0 0 0 0 0 0 0 0 0 0 0 0 0 0 0 0 0 - 0 - - 0 - - 0 - - 0 - - 0 - - 0 -
Retail 0 0 0 0 0 0 0 0 0 0 0 0 0 0 0 0 0 0 - 0 - - 0 - - 0 - - 0 - - 0 - - 0 -
Retail -Securedon real estateproperty 0.0% 0 0 0 0 0 0 0 0 0 0 0 0 0 0 0 0 0 0 - 0 - - 0 - - 0 - - 0 - - 0 - - 0 -
Retail -Securedon real estate property- Of
h i h : S E0.0% 0 0 0 0 0 0 0 0 0 0 0 0 0 0 0 0 0 0 - 0 - - 0 - - 0 - - 0 - - 0 - - 0 -
Retail -Securedon real estate property- Of
h i h: n n - E0.0% 0 0 0 0 0 0 0 0 0 0 0 0 0 0 0 0 0 0 - 0 - - 0 - - 0 - - 0 - - 0 - - 0 -
Retail -QualifyingRevolving 0 0 0 0 0 0 0 0 0 0 0 0 0 0 0 0 0 0 - 0 - - 0 - - 0 - - 0 - - 0 - - 0 -
Retail -OtherRetail 0 0 0 0 0 0 0 0 0 0 0 0 0 0 0 0 0 0 - 0 - - 0 - - 0 - - 0 - - 0 - - 0 -
Retail -Other Retail -Of Which:SME 0 0 0 0 0 0 0 0 0 0 0 0 0 0 0 0 0 0 - 0 - - 0 - - 0 - - 0 - - 0 - - 0 -
Retail -Other Retail -Of Which:non-SME 0 0 0 0 0 0 0 0 0 0 0 0 0 0 0 0 0 0 - 0 - - 0 - - 0 - - 0 - - 0 - - 0 -
Equity 0 0 0 0 0 0 0 0 0 0 0 0 0 0 0 0 0 0 - 0 - - 0 - - 0 - - 0 - - 0 - - 0 -
Securitisation 0 0 0 0 0 0 0 0 0 0 0 0 0 0 0 0 0 0
Othernon-credit obligation assets 0 0 0 0 0 0 0 0 0 0 0 0 0 0 0 0 0 0
TOTAL 0 0 0 0 0 0 0 0 0 0 0 0 0 0 0 0 0 0 - 0 - - 0 - - 0 - - 0 - - 0 - - 0 -
Securitisation andre-securitisations positions deductedfrom capital * 0 0 0 0 0 0 0 0 0 0 0 0
(mln EUR, %) No n-d ef aul t ed De fau lt e d No n-d ef aul t ed De fau lt e d No n-d ef aul t ed De fau lt e d No n-d ef aul t e d De fau lt e d No n-d ef aul t ed De fau lt e d No n-d ef aul t e d De fau lt e d No n-d ef aul t ed De fau lt e d No n-d ef aul t ed De fau lt e d No n-d ef aul t ed De fau lt e d
Impairment
rate
Stockof
Provisions
Coverage Ratio -
Default Stock
Impairment
rate
Stockof
Provisions
Coverage
Ratio-DefaultStock
Impairment
rate
Stockof
Provisions
Coverage
Ratio -DefaultStock Impairment rate
Stockof
Provisions
Coverage
Ratio-DefaultStock
Impairment
rate
Stockof
Provisions
Coverage
Ratio-DefaultStock
Impairment
rate
Stockof
Provisions
Coverage
Ratio -DefaultStock Central banksandcentral governments 0 0 0 0 0 0 0 0 0 0 0 0 0 0 0 0 0 0 - 0 - - 0 - - 0 - - 0 - - 0 - - 0 -
Institutions 0 0 0 0 0 0 0 0 0 0 0 0 0 0 0 0 0 0 - 0 - - 0 - - 0 - - 0 - - 0 - - 0 -
Corporates 0 0 0 0 0 0 0 0 0 0 0 0 0 0 0 0 0 0 - 0 - - 0 - - 0 - - 0 - - 0 - - 0 -
Corporates -Of Which:SpecialisedLending 0 0 0 0 0 0 0 0 0 0 0 0 0 0 0 0 0 0 - 0 - - 0 - - 0 - - 0 - - 0 - - 0 -
Corporates -Of Which:SME 0 0 0 0 0 0 0 0 0 0 0 0 0 0 0 0 0 0 - 0 - - 0 - - 0 - - 0 - - 0 - - 0 -
Retail 0 0 0 0 0 0 0 0 0 0 0 0 0 0 0 0 0 0 - 0 - - 0 - - 0 - - 0 - - 0 - - 0 -
Retail -Securedon real estateproperty 0.0% 0 0 0 0 0 0 0 0 0 0 0 0 0 0 0 0 0 0 - 0 - - 0 - - 0 - - 0 - - 0 - - 0 -
Retail -Securedon real estate property- Of
hi h: E0.0% 0 0 0 0 0 0 0 0 0 0 0 0 0 0 0 0 0 0 - 0 - - 0 - - 0 - - 0 - - 0 - - 0 -
Retail -Securedon real estate property- Of
h i h: n n - E0.0% 0 0 0 0 0 0 0 0 0 0 0 0 0 0 0 0 0 0 - 0 - - 0 - - 0 - - 0 - - 0 - - 0 -
Retail -QualifyingRevolving 0 0 0 0 0 0 0 0 0 0 0 0 0 0 0 0 0 0 - 0 - - 0 - - 0 - - 0 - - 0 - - 0 -
Retail -OtherRetail 0 0 0 0 0 0 0 0 0 0 0 0 0 0 0 0 0 0 - 0 - - 0 - - 0 - - 0 - - 0 - - 0 -
Retail -Other Retail -Of Which:SME 0 0 0 0 0 0 0 0 0 0 0 0 0 0 0 0 0 0 - 0 - - 0 - - 0 - - 0 - - 0 - - 0 -
Retail -Other Retail -Of Which:non-SME 0 0 0 0 0 0 0 0 0 0 0 0 0 0 0 0 0 0 - 0 - - 0 - - 0 - - 0 - - 0 - - 0 -
Equity 0 0 0 0 0 0 0 0 0 0 0 0 0 0 0 0 0 0 - 0 - - 0 - - 0 - - 0 - - 0 - - 0 -
Securitisation 0 0 0 0 0 0 0 0 0 0 0 0 0 0 0 0 0 0
Othernon-credit obligation assets 0 0 0 0 0 0 0 0 0 0 0 0 0 0 0 0 0 0
TOTAL 0 0 0 0 0 0 0 0 0 0 0 0 0 0 0 0 0 0 - 0 - - 0 - - 0 - - 0 - - 0 - - 0 -
Securitisation andre-securitisations positions deductedfrom capital * 0 0 0 0 0 0 0 0 0 0 0 0
Exposure values (as of 31/12/2013) Risk exposure amounts (as of 31/12/2013) Value adjustments and provisions (as of 31/12/2013) Baseline Scenario Adverse Scenario
LTV %(asof
31/12/2013)
Exposure values (as of 31/12/2013) Risk exposure amounts (as of 31/12/2013) Value adjustments and provisions (as of 31/12/2013) Baseline Scenario Adverse Scenario
F-IRB A-IRB STA F-IRB A-IRB STA F-IRB A-IRB a s of 3 1/ 12 /2 01 5 a s of 3 1/ 12 /2 01 6STA as of 31/12/2014 as of 31/12/2015 as of 31/12/2016 as of 31/12/2014
AdverseScenario
F-IRB A-IRB STA F-IRB A-IRB STA F-IRB A-IRB STA as of 31/12/2014 as of 31/12/2015 as of 31/12/2016 as of 31/12/2014 as of 31/12/2015 as of 31/12/2016LTV %(asof
31/12/2013)
E xp os ur e va lu es ( as of 3 1/ 12 /2 01 3) R is k e xp os ur e am ou nt s (a s of 3 1/ 12 /2 01 3) V al ue a dj us tm en ts a nd pr ov is io ns ( as o f3 1/ 12 /2 01 3)
AdverseScenario
F-IRB A-IRB STA F-IRB A-IRB STA F-IRB A-IRB STA as of 31/12/2014 as of 31/12/2015 as of 31/12/2016 as of 31/12/2014 as of 31/12/2015 as of 31/12/2016LTV %(asof
31/12/2013)
E xp os ur e va lu es ( as of 3 1/ 12 /2 01 3) R is k e xp os ur e am ou nt s (a s of 3 1/ 12 /2 01 3)
BaselineScenario
Valueadjustmentsand provisions(asof 31/12/2013) BaselineScenario
(*)Referstothepart ofSecuritizationexposurethat isdeductedfrom capital andisnot includedinRWA
(*)Referstothepart ofSecuritizationexposurethat isdeductedfrom capital andisnot includedinRWA
(*)Referstothepart ofSecuritizationexposurethat isdeductedfrom capital andisnot includedinRWA
Please, select the country
Please, select the country
Please, select the country

8/10/2019 Test Stress Banca Española 2014
http://slidepdf.com/reader/full/test-stress-banca-espanola-2014 196/240
(mln EUR, %)No n-d ef aul t ed De fau lt e d No n-d ef aul t ed De fau lt e d No n-d ef aul t ed De fau lt e d No n-d ef aul t e d De fau lt e d No n-d ef aul t ed De fau lt e d No n-d ef aul t e d De fau lt e d No n-d ef aul t ed De fau lt e d No n-d ef aul t ed De fau lt e d No n-d ef aul t ed De fau lt e d
Impairment
rate
Stockof
ProvisionsCoverage Ratio -
Default Stock
Impairment
rate
Stockof
Provisions
Coverage
Ratio-Default
Stock
Impairment
rate
Stockof
Provisions
Coverage
Ratio -Default
Stock
Impairment rateStockof
Provisions
Coverage
Ratio-Default
Stock
Impairment
rate
Stockof
Provisions
Coverage
Ratio-Default
Stock
Impairment
rate
Stockof
Provisions
Coverage
Ratio -Default
Stock Central banksandcentral governments 0 0 0 0 0 0 0 0 0 0 0 0 0 0 0 0 0 0 - 0 - - 0 - - 0 - - 0 - - 0 - - 0 -
Institutions 0 0 0 0 0 0 0 0 0 0 0 0 0 0 0 0 0 0 - 0 - - 0 - - 0 - - 0 - - 0 - - 0 -
Corporates 0 0 0 0 0 0 0 0 0 0 0 0 0 0 0 0 0 0 - 0 - - 0 - - 0 - - 0 - - 0 - - 0 -
Corporates -Of Which:SpecialisedLending 0 0 0 0 0 0 0 0 0 0 0 0 0 0 0 0 0 0 - 0 - - 0 - - 0 - - 0 - - 0 - - 0 -
Corporates -Of Which:SME 0 0 0 0 0 0 0 0 0 0 0 0 0 0 0 0 0 0 - 0 - - 0 - - 0 - - 0 - - 0 - - 0 -
Retail 0 0 0 0 0 0 0 0 0 0 0 0 0 0 0 0 0 0 - 0 - - 0 - - 0 - - 0 - - 0 - - 0 -
Retail -Securedon real estateproperty 0.0% 0 0 0 0 0 0 0 0 0 0 0 0 0 0 0 0 0 0 - 0 - - 0 - - 0 - - 0 - - 0 - - 0 -
Retail -Securedon real estate property- Of
h i h : S E0.0% 0 0 0 0 0 0 0 0 0 0 0 0 0 0 0 0 0 0 - 0 - - 0 - - 0 - - 0 - - 0 - - 0 -
Retail -Securedon real estate property- Of
h i h: n n - E0.0% 0 0 0 0 0 0 0 0 0 0 0 0 0 0 0 0 0 0 - 0 - - 0 - - 0 - - 0 - - 0 - - 0 -
Retail -QualifyingRevolving 0 0 0 0 0 0 0 0 0 0 0 0 0 0 0 0 0 0 - 0 - - 0 - - 0 - - 0 - - 0 - - 0 -
Retail -OtherRetail 0 0 0 0 0 0 0 0 0 0 0 0 0 0 0 0 0 0 - 0 - - 0 - - 0 - - 0 - - 0 - - 0 -
Retail -Other Retail -Of Which:SME 0 0 0 0 0 0 0 0 0 0 0 0 0 0 0 0 0 0 - 0 - - 0 - - 0 - - 0 - - 0 - - 0 -
Retail -Other Retail -Of Which:non-SME 0 0 0 0 0 0 0 0 0 0 0 0 0 0 0 0 0 0 - 0 - - 0 - - 0 - - 0 - - 0 - - 0 -
Equity 0 0 0 0 0 0 0 0 0 0 0 0 0 0 0 0 0 0 - 0 - - 0 - - 0 - - 0 - - 0 - - 0 -
Securitisation 0 0 0 0 0 0 0 0 0 0 0 0 0 0 0 0 0 0
Othernon-credit obligation assets 0 0 0 0 0 0 0 0 0 0 0 0 0 0 0 0 0 0
TOTAL 0 0 0 0 0 0 0 0 0 0 0 0 0 0 0 0 0 0 - 0 - - 0 - - 0 - - 0 - - 0 - - 0 -Securitisation andre-securitisations positions deductedfrom capital * 0 0 0 0 0 0 0 0 0 0 0 0
(mln EUR, %)No n-d ef aul t ed De fau lt e d No n-d ef aul t ed De fau lt e d No n-d ef aul t ed De fau lt e d No n-d ef aul t e d De fau lt e d No n-d ef aul t ed De fau lt e d No n-d ef aul t e d De fau lt e d No n-d ef aul t ed De fau lt e d No n-d ef aul t ed De fau lt e d No n-d ef aul t ed De fau lt e d
Impairment
rate
Stockof
ProvisionsCoverage Ratio -
Default Stock
Impairment
rate
Stockof
Provisions
Coverage
Ratio-DefaultStock
Impairment
rate
Stockof
Provisions
Coverage
Ratio -DefaultStock
Impairment rateStockof
Provisions
Coverage
Ratio-DefaultStock
Impairment
rate
Stockof
Provisions
Coverage
Ratio-DefaultStock
Impairment
rate
Stockof
Provisions
Coverage
Ratio -DefaultStock
Central banksandcentral governments 0 0 0 0 0 0 0 0 0 0 0 0 0 0 0 0 0 0 - 0 - - 0 - - 0 - - 0 - - 0 - - 0 -
Institutions 0 0 0 0 0 0 0 0 0 0 0 0 0 0 0 0 0 0 - 0 - - 0 - - 0 - - 0 - - 0 - - 0 -
Corporates 0 0 0 0 0 0 0 0 0 0 0 0 0 0 0 0 0 0 - 0 - - 0 - - 0 - - 0 - - 0 - - 0 -
Corporates -Of Which:SpecialisedLending 0 0 0 0 0 0 0 0 0 0 0 0 0 0 0 0 0 0 - 0 - - 0 - - 0 - - 0 - - 0 - - 0 -
Corporates -Of Which:SME 0 0 0 0 0 0 0 0 0 0 0 0 0 0 0 0 0 0 - 0 - - 0 - - 0 - - 0 - - 0 - - 0 -
Retail 0 0 0 0 0 0 0 0 0 0 0 0 0 0 0 0 0 0 - 0 - - 0 - - 0 - - 0 - - 0 - - 0 -
Retail -Securedon real estateproperty 0.0% 0 0 0 0 0 0 0 0 0 0 0 0 0 0 0 0 0 0 - 0 - - 0 - - 0 - - 0 - - 0 - - 0 -
Retail -Securedon real estate property- Of
hi h: E0.0% 0 0 0 0 0 0 0 0 0 0 0 0 0 0 0 0 0 0 - 0 - - 0 - - 0 - - 0 - - 0 - - 0 -
Retail -Securedon real estate property- Of
h i h : n n -S E0.0% 0 0 0 0 0 0 0 0 0 0 0 0 0 0 0 0 0 0 - 0 - - 0 - - 0 - - 0 - - 0 - - 0 -
Retail -QualifyingRevolving 0 0 0 0 0 0 0 0 0 0 0 0 0 0 0 0 0 0 - 0 - - 0 - - 0 - - 0 - - 0 - - 0 -
Retail -OtherRetail 0 0 0 0 0 0 0 0 0 0 0 0 0 0 0 0 0 0 - 0 - - 0 - - 0 - - 0 - - 0 - - 0 -
Retail -Other Retail -Of Which:SME 0 0 0 0 0 0 0 0 0 0 0 0 0 0 0 0 0 0 - 0 - - 0 - - 0 - - 0 - - 0 - - 0 -
Retail -Other Retail -Of Which:non-SME 0 0 0 0 0 0 0 0 0 0 0 0 0 0 0 0 0 0 - 0 - - 0 - - 0 - - 0 - - 0 - - 0 -
Equity 0 0 0 0 0 0 0 0 0 0 0 0 0 0 0 0 0 0 - 0 - - 0 - - 0 - - 0 - - 0 - - 0 -
Securitisation 0 0 0 0 0 0 0 0 0 0 0 0 0 0 0 0 0 0
Othernon-credit obligation assets 0 0 0 0 0 0 0 0 0 0 0 0 0 0 0 0 0 0
TOTAL 0 0 0 0 0 0 0 0 0 0 0 0 0 0 0 0 0 0 - 0 - - 0 - - 0 - - 0 - - 0 - - 0 -Securitisation andre-securitisations positions deductedfrom capital * 0 0 0 0 0 0 0 0 0 0 0 0
LTV %(asof
31/12/2013)
Exposure values (as of 31/12/2013) Risk exposure amounts (as of 31/12/2013) Value adjustments and provisions (as of 31/12/2013) Baseline Scenario Adverse Scenario
F-IRB A-IRB STA F-IRB A-IRB STA as of 31/12/2016 as of 31/12/2014 as of 31/12/2015 as of 31/12/2016F-IRB A-IRB STA a s of 3 1/ 12 /2 01 4 a s of 3 1/ 12 /2 01 5
LTV %(asof
31/12/2013)
p ( / / ) p ( / / ) j p ( / / )
F-IRB A-IRB STA F-IRB A-IRB STA F-IRB a sof 31 /12 /2 01 4 a so f3 1/ 12 /2 01 5 a sof 31 /12 /2 01 6 A-IRB STA a sof 31 /1 2/ 20 14 a so f3 1/ 12 /2 01 5 a sof 31 /12 /2 01 6
(*)Referstothepart ofSecuritizationexposurethat isdeductedfrom capital andisnot includedinRWA
(*)Referstothepart ofSecuritizationexposurethat isdeductedfrom capital andisnot includedinRWA
Please, select the country
Please, select the country
http://www.economiaciudadana.org/
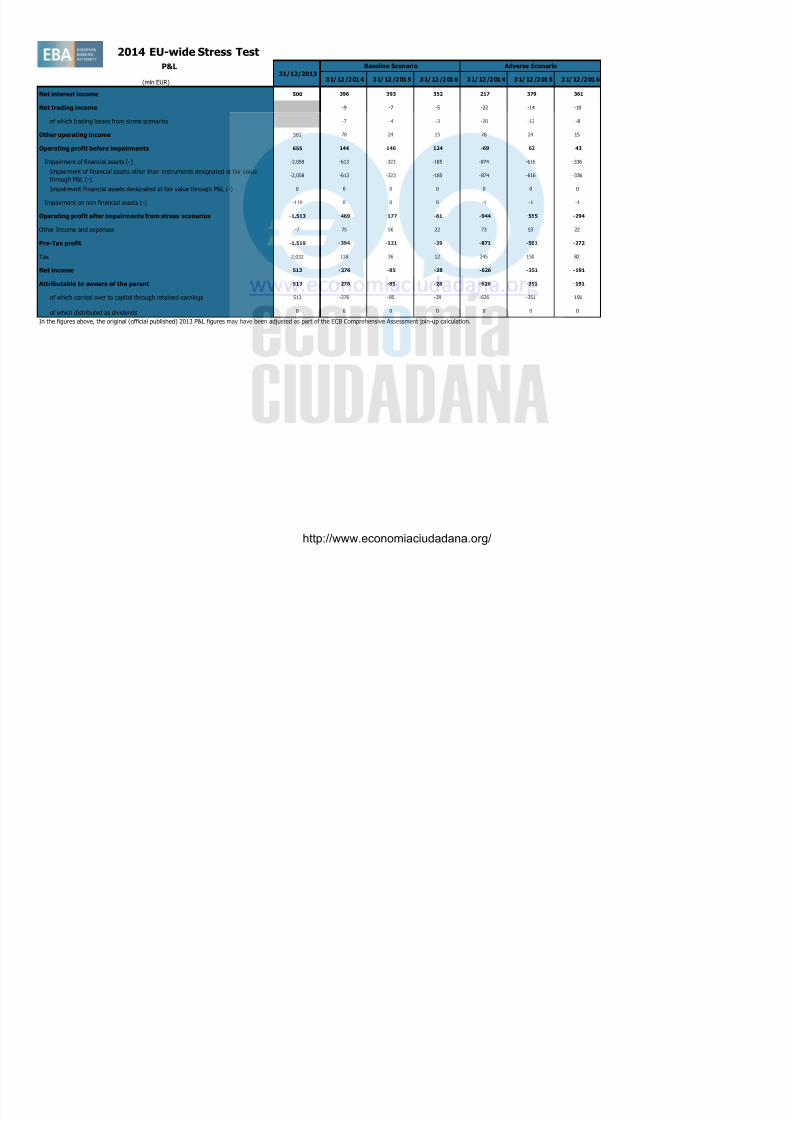
8/10/2019 Test Stress Banca Española 2014
http://slidepdf.com/reader/full/test-stress-banca-espanola-2014 197/240
2014 EU-wide Stress Test RWA
(mln EUR)as of 31/12/2013 as of 31/12/2014 as of 31/12/2015 as of 31/12/2016 as of 31/12/2014 as of 31/12/2015 as of 31/12/2016
Risk exposure amount for credit risk 18,987 17,453 15,937 15,352 17,454 15,937 15,352
Risk exposure amount Securitisation and re-securitisations 404 449 248 134 520 317 169
Risk exposure amount Other credit risk 18,583 17,004 15,689 15,218 16,934 15,620 15,183
Risk exposure amount for market risk 264 264 264 264 264 264 264
Risk exposure amount for operational risk 2,015 2,015 2,015 2,015 2,015 2,015 2,015
Transitional floors for Risk exposure amount 0 0 0 0 0 0 0
AQR adjustments (for SSM countries only) 16 16 16 16 16 16 16
Total Risk exposure amount 21,283 19,749 18,233 17,647 19,750 18,233 17,647
Baseline Scenario Adverse Scenario

8/10/2019 Test Stress Banca Española 2014
http://slidepdf.com/reader/full/test-stress-banca-espanola-2014 198/240
http://www.economiaciudadana.org/
(mln EUR) as of 31/12/2013 31/12/2014 31/12/2015 31/12/2016 31/12/2014 31/12/2015 31/12/2016
Banking Book 1,363
Trading Book (excl. correlation trading positions under CRM) 0
Correlation Trading Portfolio (CRM) 0
Total 1,363
Banking Book 404 449 248 134 520 317 169
Trading Book (excl. correlation trading positions under CRM) 0 0 0 0 0 0 0
Total 404 449 248 134 520 317 169
Hold to Maturity porfolio 0 1 1 1 1 1 1
Available for Sale porfolio 0 0 0 0 0 0 0
Held for trading portfolio
Total 0 1 1 1 1 1 1
2014 EU-wide Stress Test
Impairments
Baseline scenario Adverse scenario
Exposure values
Risk exposure values
Securitisation

8/10/2019 Test Stress Banca Española 2014
http://slidepdf.com/reader/full/test-stress-banca-espanola-2014 199/240
http://www.economiaciudadana.org/
2014 EU-wide Stress Test - Sovereign Exposure
(mln EUR)
[ 0 - 3M [ 0 0 0 0 0 0 0 0 0 0 0 0 0 0
[ 3M - 1Y [ 0 0 0 0 0 0 0 0 0 0 0 0 0 0
[ 1Y - 2Y [ 0 0 0 0 0 0 0 0 0 0 0 0 0 0
[ 2Y - 3Y [ 0 0 0 0 0 0 0 0 0 0 0 0 0 0[3Y - 5Y [ 0 0 0 0 0 0 0 0 0 0 0 0 0 0
[5Y - 10Y [ 0 0 0 0 0 0 0 0 0 0 0 0 0 0
[10Y - more 0 0 0 0 0 0 0 0 0 0 0 0 0 0
Tot 0 0 0 0 0 0 0 0 0 0 0 0 0 0
[ 0 - 3M [ 0 0 0 0 0 0 0 0 0 0 0 0 0 0
[ 3M - 1Y [ 0 0 0 0 0 0 0 0 0 0 0 0 0 0
[ 1Y - 2Y [ 0 0 0 0 0 0 0 0 0 0 0 0 0 0
[ 2Y - 3Y [ 0 0 0 0 0 0 0 0 0 0 0 0 0 0
[3Y - 5Y [ 0 0 0 0 0 0 0 0 0 0 0 0 0 0
[5Y - 10Y [ 0 0 0 0 0 0 0 0 0 0 0 0 0 0
[10Y - more 0 0 0 0 0 0 0 0 0 0 0 0 0 0
Tot 0 0 0 0 0 0 0 0 0 0 0 0 0 0
[ 0 - 3M [ 0 0 0 0 0 0 0 0 0 0 0 0 0 0
[ 3M - 1Y [ 0 0 0 0 0 0 0 0 0 0 0 0 0 0
[ 1Y - 2Y [ 0 0 0 0 0 0 0 0 0 0 0 0 0 0
[ 2Y - 3Y [ 0 0 0 0 0 0 0 0 0 0 0 0 0 0
[3Y 5Y [ 0 0 0 0 0 0 0 0 0 0 0 0 0 0
Residual Maturity Country / Region
GROSS DIRECT LONG
EXPOSURES(accounting value gross
of provisions)
(1)
NET DIRECT POSITIONS (gross exposures (long) net of cash short
positions of sovereign debt to other counterpaties only where there
is a maturity matching)
(1)
DIRECT SOVEREIGN EXPOSURES IN DERIVATIVES (1)
of which: loans
and advances
of which: AFS
banking book
of which: FVO
(designated at fair
value through
profit&loss)
banking book
of which: Financial
assets held for
trading
(2)
Derivatives with positive fair value at
31/12/2013
Derivatives with negative fair value at
31/12/2013
Derivatives with positive fair value
at 31/12/2013
Derivatives with negative fair
value at 31/12/2013
VALUES AS OF 31/12/2013 VALUES AS OF 31/12/2013 VALUES AS OF 31/12/2013
INDIRECT SOVEREIGN EXPOSURES (3) (on and off balance sheet)
Fair-value at
31/12/2013 (+)Notional value
Fair-value at
31/12/2013 (-)Notional value
Fair-value at
31/12/2013 (+)Notional value
Fair-value at 31/12/2013
(-)
Austria
Belgium
Bulgaria
Notional value

8/10/2019 Test Stress Banca Española 2014
http://slidepdf.com/reader/full/test-stress-banca-espanola-2014 200/240
[3Y - 5Y [ 0 0 0 0 0 0 0 0 0 0 0 0 0 0
[5Y - 10Y [ 0 0 0 0 0 0 0 0 0 0 0 0 0 0
[10Y - more 0 0 0 0 0 0 0 0 0 0 0 0 0 0
Tot 0 0 0 0 0 0 0 0 0 0 0 0 0 0
[ 0 - 3M [ 0 0 0 0 0 0 0 0 0 0 0 0 0 0
[ 3M - 1Y [ 0 0 0 0 0 0 0 0 0 0 0 0 0 0
[ 1Y - 2Y [ 0 0 0 0 0 0 0 0 0 0 0 0 0 0
[ 2Y - 3Y [ 0 0 0 0 0 0 0 0 0 0 0 0 0 0
[3Y - 5Y [ 0 0 0 0 0 0 0 0 0 0 0 0 0 0
[5Y - 10Y [ 0 0 0 0 0 0 0 0 0 0 0 0 0 0
[10Y - more 0 0 0 0 0 0 0 0 0 0 0 0 0 0
Tot 0 0 0 0 0 0 0 0 0 0 0 0 0 0
[ 0 - 3M [ 0 0 0 0 0 0 0 0 0 0 0 0 0 0
[ 3M - 1Y [ 0 0 0 0 0 0 0 0 0 0 0 0 0 0
[ 1Y - 2Y [ 0 0 0 0 0 0 0 0 0 0 0 0 0 0
[ 2Y - 3Y [ 0 0 0 0 0 0 0 0 0 0 0 0 0 0[3Y - 5Y [ 0 0 0 0 0 0 0 0 0 0 0 0 0 0
[5Y - 10Y [ 0 0 0 0 0 0 0 0 0 0 0 0 0 0
[10Y - more 0 0 0 0 0 0 0 0 0 0 0 0 0 0
Tot 0 0 0 0 0 0 0 0 0 0 0 0 0 0
[ 0 - 3M [ 0 0 0 0 0 0 0 0 0 0 0 0 0 0
[ 3M - 1Y [ 0 0 0 0 0 0 0 0 0 0 0 0 0 0
[ 1Y - 2Y [ 0 0 0 0 0 0 0 0 0 0 0 0 0 0
[ 2Y - 3Y [ 0 0 0 0 0 0 0 0 0 0 0 0 0 0
[3Y - 5Y [ 0 0 0 0 0 0 0 0 0 0 0 0 0 0
[5Y - 10Y [ 0 0 0 0 0 0 0 0 0 0 0 0 0 0
[10Y - more 0 0 0 0 0 0 0 0 0 0 0 0 0 0
Tot 0 0 0 0 0 0 0 0 0 0 0 0 0 0
[ 0 - 3M [ 0 0 0 0 0 0 0 0 0 0 0 0 0 0
[ 3M - 1Y [ 0 0 0 0 0 0 0 0 0 0 0 0 0 0
[ 1Y - 2Y [ 0 0 0 0 0 0 0 0 0 0 0 0 0 0
[ 2Y - 3Y [ 0 0 0 0 0 0 0 0 0 0 0 0 0 0
[3Y - 5Y [ 0 0 0 0 0 0 0 0 0 0 0 0 0 0
[5Y - 10Y [ 0 0 0 0 0 0 0 0 0 0 0 0 0 0
[10Y - more 0 0 0 0 0 0 0 0 0 0 0 0 0 0
Tot 0 0 0 0 0 0 0 0 0 0 0 0 0 0
[ 0 - 3M [ 0 0 0 0 0 0 0 0 0 0 0 0 0 0
[ 3M - 1Y [ 0 0 0 0 0 0 0 0 0 0 0 0 0 0
[ 1Y - 2Y [ 0 0 0 0 0 0 0 0 0 0 0 0 0 0
[ 2Y - 3Y [ 0 0 0 0 0 0 0 0 0 0 0 0 0 0[3Y - 5Y [ 4 4 4 0 0 0 0 0 0 0 0 0 0 0
[5Y - 10Y [ 4 4 4 0 0 0 0 0 0 0 0 0 0 0
[10Y - more 1 1 1 0 0 0 0 0 0 0 0 0 0 0
Tot 10 10 10 0 0 0 0 0 0 0 0 0 0 0
g
Cyprus
Czech Republic
Denmark
Estonia
Finland
France
http://www.economiaciudadana.org/
2014 EU-wide Stress Test - Sovereign Exposure
(mln EUR)
Residual Maturity Country / Region
GROSS DIRECT LONG
EXPOSURES(accounting value gross
of provisions)
(1)
NET DIRECT POSITIONS (gross exposures (long) net of cash short
positions of sovereign debt to other counterpaties only where there
is a maturity matching)
(1)
DIRECT SOVEREIGN EXPOSURES IN DERIVATIVES (1)
of which: loans
and advances
of which: AFS
banking book
of which: FVO
(designated at fair
value through
profit&loss)
banking book
of which: Financial
assets held for
trading
(2)
Derivatives with positive fair value at
31/12/2013
Derivatives with negative fair value at
31/12/2013
Derivatives with positive fair value
at 31/12/2013
Derivatives with negative fair
value at 31/12/2013
VALUES AS OF 31/12/2013 VALUES AS OF 31/12/2013 VALUES AS OF 31/12/2013
INDIRECT SOVEREIGN EXPOSURES (3) (on and off balance sheet)
Fair-value at
31/12/2013 (+)Notional value
Fair-value at
31/12/2013 (-)Notional value
Fair-value at
31/12/2013 (+)Notional value
Fair-value at 31/12/2013
(-)Notional value
[ 0 - 3M [ 0 0 0 0 0 0 0 0 0 0 0 0 0 0
[ 3M - 1Y [ 0 0 0 0 0 0 0 0 0 0 0 0 0 0
[ 1Y - 2Y [ 0 0 0 0 0 0 0 0 0 0 0 0 0 0
[ 2Y - 3Y [ 0 0 0 0 0 0 0 0 0 0 0 0 0 0[3Y - 5Y [ 0 0 0 0 0 0 0 0 0 0 0 0 0 0
[5Y - 10Y [ 0 0 0 0 0 0 0 0 0 0 0 0 0 0
[10Y - more 0 0 0 0 0 0 0 0 0 0 0 0 0 0
Tot 0 0 0 0 0 0 0 0 0 0 0 0 0 0
[ 0 - 3M [ 0 0 0 0 0 0 0 0 0 0 0 0 0 0
[ 3M - 1Y [ 0 0 0 0 0 0 0 0 0 0 0 0 0 0
[ 1Y - 2Y [ 0 0 0 0 0 0 0 0 0 0 0 0 0 0
[ 2Y - 3Y [ 0 0 0 0 0 0 0 0 0 0 0 0 0 0
[3Y - 5Y [ 0 0 0 0 0 0 0 0 0 0 0 0 0 0
[5Y - 10Y [ 0 0 0 0 0 0 0 0 0 0 0 0 0 0
[10Y - more 0 0 0 0 0 0 0 0 0 0 0 0 0 0
Tot 0 0 0 0 0 0 0 0 0 0 0 0 0 0
[ 0 - 3M [ 0 0 0 0 0 0 0 0 0 0 0 0 0 0
[ 3M - 1Y [ 0 0 0 0 0 0 0 0 0 0 0 0 0 0
[ 1Y - 2Y [ 0 0 0 0 0 0 0 0 0 0 0 0 0 0
[ 2Y - 3Y [ 0 0 0 0 0 0 0 0 0 0 0 0 0 0
[3Y - 5Y [ 0 0 0 0 0 0 0 0 0 0 0 0 0 0
Germany
Greece
Croatia

8/10/2019 Test Stress Banca Española 2014
http://slidepdf.com/reader/full/test-stress-banca-espanola-2014 201/240
[3Y - 5Y [ 0 0 0 0 0 0 0 0 0 0 0 0 0 0
[5Y - 10Y [ 0 0 0 0 0 0 0 0 0 0 0 0 0 0
[10Y - more 0 0 0 0 0 0 0 0 0 0 0 0 0 0
Tot 0 0 0 0 0 0 0 0 0 0 0 0 0 0
[ 0 - 3M [ 0 0 0 0 0 0 0 0 0 0 0 0 0 0
[ 3M - 1Y [ 0 0 0 0 0 0 0 0 0 0 0 0 0 0
[ 1Y - 2Y [ 0 0 0 0 0 0 0 0 0 0 0 0 0 0
[ 2Y - 3Y [ 0 0 0 0 0 0 0 0 0 0 0 0 0 0
[3Y - 5Y [ 0 0 0 0 0 0 0 0 0 0 0 0 0 0
[5Y - 10Y [ 0 0 0 0 0 0 0 0 0 0 0 0 0 0
[10Y - more 0 0 0 0 0 0 0 0 0 0 0 0 0 0
Tot 0 0 0 0 0 0 0 0 0 0 0 0 0 0
[ 0 - 3M [ 0 0 0 0 0 0 0 0 0 0 0 0 0 0
[ 3M - 1Y [ 0 0 0 0 0 0 0 0 0 0 0 0 0 0
[ 1Y - 2Y [ 0 0 0 0 0 0 0 0 0 0 0 0 0 0
[ 2Y - 3Y [ 0 0 0 0 0 0 0 0 0 0 0 0 0 0[3Y - 5Y [ 0 0 0 0 0 0 0 0 0 0 0 0 0 0
[5Y - 10Y [ 0 0 0 0 0 0 0 0 0 0 0 0 0 0
[10Y - more 0 0 0 0 0 0 0 0 0 0 0 0 0 0
Tot 0 0 0 0 0 0 0 0 0 0 0 0 0 0
[ 0 - 3M [ 0 0 0 0 0 0 0 0 0 0 0 0 0 0
[ 3M - 1Y [ 0 0 0 0 0 0 0 0 0 0 0 0 0 0
[ 1Y - 2Y [ 0 0 0 0 0 0 0 0 0 0 0 0 0 0
[ 2Y - 3Y [ 0 0 0 0 0 0 0 0 0 0 0 0 0 0
[3Y - 5Y [ 0 0 0 0 0 0 0 0 0 0 0 0 0 0
[5Y - 10Y [ 0 0 0 0 0 0 0 0 0 0 0 0 0 0
[10Y - more 0 0 0 0 0 0 0 0 0 0 0 0 0 0
Tot 0 0 0 0 0 0 0 0 0 0 0 0 0 0
[ 0 - 3M [ 0 0 0 0 0 0 0 0 0 0 0 0 0 0
[ 3M - 1Y [ 0 0 0 0 0 0 0 0 0 0 0 0 0 0
[ 1Y - 2Y [ 0 0 0 0 0 0 0 0 0 0 0 0 0 0
[ 2Y - 3Y [ 0 0 0 0 0 0 0 0 0 0 0 0 0 0
[3Y - 5Y [ 0 0 0 0 0 0 0 0 0 0 0 0 0 0
[5Y - 10Y [ 0 0 0 0 0 0 0 0 0 0 0 0 0 0
[10Y - more 0 0 0 0 0 0 0 0 0 0 0 0 0 0
Tot 0 0 0 0 0 0 0 0 0 0 0 0 0 0
Latvia
Hungary
Iceland
Ireland
Italy
Liechtenstein
http://www.economiaciudadana.org/
2014 EU-wide Stress Test - Sovereign Exposure
(mln EUR)
Residual Maturity Country / Region
GROSS DIRECT LONG
EXPOSURES(accounting value gross
of provisions)
(1)
NET DIRECT POSITIONS (gross exposures (long) net of cash short
positions of sovereign debt to other counterpaties only where there
is a maturity matching)
(1)
DIRECT SOVEREIGN EXPOSURES IN DERIVATIVES (1)
of which: loans
and advances
of which: AFS
banking book
of which: FVO
(designated at fair
value through
profit&loss)
banking book
of which: Financial
assets held for
trading
(2)
Derivatives with positive fair value at
31/12/2013
Derivatives with negative fair value at
31/12/2013
Derivatives with positive fair value
at 31/12/2013
Derivatives with negative fair
value at 31/12/2013
VALUES AS OF 31/12/2013 VALUES AS OF 31/12/2013 VALUES AS OF 31/12/2013
INDIRECT SOVEREIGN EXPOSURES (3) (on and off balance sheet)
Fair-value at
31/12/2013 (+)Notional value
Fair-value at
31/12/2013 (-)Notional value
Fair-value at
31/12/2013 (+)Notional value
Fair-value at 31/12/2013
(-)Notional value
[ 0 - 3M [ 0 0 0 0 0 0 0 0 0 0 0 0 0 0
[ 3M - 1Y [ 0 0 0 0 0 0 0 0 0 0 0 0 0 0
[ 1Y - 2Y [ 0 0 0 0 0 0 0 0 0 0 0 0 0 0
[ 2Y - 3Y [ 0 0 0 0 0 0 0 0 0 0 0 0 0 0[3Y - 5Y [ 0 0 0 0 0 0 0 0 0 0 0 0 0 0
[5Y - 10Y [ 0 0 0 0 0 0 0 0 0 0 0 0 0 0
[10Y - more 0 0 0 0 0 0 0 0 0 0 0 0 0 0
Tot 0 0 0 0 0 0 0 0 0 0 0 0 0 0
[ 0 - 3M [ 0 0 0 0 0 0 0 0 0 0 0 0 0 0
[ 3M - 1Y [ 0 0 0 0 0 0 0 0 0 0 0 0 0 0
[ 1Y - 2Y [ 0 0 0 0 0 0 0 0 0 0 0 0 0 0
[ 2Y - 3Y [ 0 0 0 0 0 0 0 0 0 0 0 0 0 0
[3Y - 5Y [ 0 0 0 0 0 0 0 0 0 0 0 0 0 0
[5Y - 10Y [ 0 0 0 0 0 0 0 0 0 0 0 0 0 0
[10Y - more 0 0 0 0 0 0 0 0 0 0 0 0 0 0
Tot 0 0 0 0 0 0 0 0 0 0 0 0 0 0
[ 0 - 3M [ 0 0 0 0 0 0 0 0 0 0 0 0 0 0
[ 3M - 1Y [ 0 0 0 0 0 0 0 0 0 0 0 0 0 0
[ 1Y - 2Y [ 0 0 0 0 0 0 0 0 0 0 0 0 0 0
[ 2Y - 3Y [ 0 0 0 0 0 0 0 0 0 0 0 0 0 0
[3Y - 5Y [ 0 0 0 0 0 0 0 0 0 0 0 0 0 0
Lithuania
Luxembourg
Malta

8/10/2019 Test Stress Banca Española 2014
http://slidepdf.com/reader/full/test-stress-banca-espanola-2014 202/240
[3 5 [ 0 0 0 0 0 0 0 0 0 0 0 0 0 0
[5Y - 10Y [ 0 0 0 0 0 0 0 0 0 0 0 0 0 0
[10Y - more 0 0 0 0 0 0 0 0 0 0 0 0 0 0
Tot 0 0 0 0 0 0 0 0 0 0 0 0 0 0
[ 0 - 3M [ 0 0 0 0 0 0 0 0 0 0 0 0 0 0
[ 3M - 1Y [ 0 0 0 0 0 0 0 0 0 0 0 0 0 0
[ 1Y - 2Y [ 0 0 0 0 0 0 0 0 0 0 0 0 0 0
[ 2Y - 3Y [ 0 0 0 0 0 0 0 0 0 0 0 0 0 0
[3Y - 5Y [ 0 0 0 0 0 0 0 0 0 0 0 0 0 0
[5Y - 10Y [ 0 0 0 0 0 0 0 0 0 0 0 0 0 0
[10Y - more 0 0 0 0 0 0 0 0 0 0 0 0 0 0
Tot 0 0 0 0 0 0 0 0 0 0 0 0 0 0
[ 0 - 3M [ 0 0 0 0 0 0 0 0 0 0 0 0 0 0
[ 3M - 1Y [ 0 0 0 0 0 0 0 0 0 0 0 0 0 0
[ 1Y - 2Y [ 0 0 0 0 0 0 0 0 0 0 0 0 0 0
[ 2Y - 3Y [ 0 0 0 0 0 0 0 0 0 0 0 0 0 0[3Y - 5Y [ 0 0 0 0 0 0 0 0 0 0 0 0 0 0
[5Y - 10Y [ 0 0 0 0 0 0 0 0 0 0 0 0 0 0
[10Y - more 0 0 0 0 0 0 0 0 0 0 0 0 0 0
Tot 0 0 0 0 0 0 0 0 0 0 0 0 0 0
[ 0 - 3M [ 0 0 0 0 0 0 0 0 0 0 0 0 0 0
[ 3M - 1Y [ 0 0 0 0 0 0 0 0 0 0 0 0 0 0
[ 1Y - 2Y [ 0 0 0 0 0 0 0 0 0 0 0 0 0 0
[ 2Y - 3Y [ 0 0 0 0 0 0 0 0 0 0 0 0 0 0
[3Y - 5Y [ 0 0 0 0 0 0 0 0 0 0 0 0 0 0
[5Y - 10Y [ 0 0 0 0 0 0 0 0 0 0 0 0 0 0
[10Y - more 0 0 0 0 0 0 0 0 0 0 0 0 0 0
Tot 0 0 0 0 0 0 0 0 0 0 0 0 0 0
[ 0 - 3M [ 0 0 0 0 0 0 0 0 0 0 0 0 0 0
[ 3M - 1Y [ 0 0 0 0 0 0 0 0 0 0 0 0 0 0
[ 1Y - 2Y [ 0 0 0 0 0 0 0 0 0 0 0 0 0 0
[ 2Y - 3Y [ 0 0 0 0 0 0 0 0 0 0 0 0 0 0
[3Y - 5Y [ 0 0 0 0 0 0 0 0 0 0 0 0 0 0
[5Y - 10Y [ 0 0 0 0 0 0 0 0 0 0 0 0 0 0
[10Y - more 0 0 0 0 0 0 0 0 0 0 0 0 0 0
Tot 0 0 0 0 0 0 0 0 0 0 0 0 0 0
[ 0 - 3M [ 0 0 0 0 0 0 0 0 0 0 0 0 0 0
[ 3M - 1Y [ 0 0 0 0 0 0 0 0 0 0 0 0 0 0
[ 1Y - 2Y [ 0 0 0 0 0 0 0 0 0 0 0 0 0 0
[ 2Y - 3Y [ 0 0 0 0 0 0 0 0 0 0 0 0 0 0[3Y - 5Y [ 0 0 0 0 0 0 0 0 0 0 0 0 0 0
[5Y - 10Y [ 0 0 0 0 0 0 0 0 0 0 0 0 0 0
[10Y - more 0 0 0 0 0 0 0 0 0 0 0 0 0 0
Tot 0 0 0 0 0 0 0 0 0 0 0 0 0 0
Netherlands
Norway
Poland
Portugal
Romania
Slovakia
http://www.economiaciudadana.org/

8/10/2019 Test Stress Banca Española 2014
http://slidepdf.com/reader/full/test-stress-banca-espanola-2014 203/240
2014 EU-wide Stress Test - Sovereign Exposure
(mln EUR)
Residual Maturity Country / Region
GROSS DIRECT LONG
EXPOSURES(accounting value gross
of provisions)
(1)
NET DIRECT POSITIONS (gross exposures (long) net of cash short
positions of sovereign debt to other counterpaties only where there
is a maturity matching)
(1)
DIRECT SOVEREIGN EXPOSURES IN DERIVATIVES (1)
of which: loans
and advances
of which: AFS
banking book
of which: FVO
(designated at fair
value through
profit&loss)
banking book
of which: Financial
assets held for
trading
(2)
Derivatives with positive fair value at
31/12/2013
Derivatives with negative fair value at
31/12/2013
Derivatives with positive fair value
at 31/12/2013
Derivatives with negative fair
value at 31/12/2013
VALUES AS OF 31/12/2013 VALUES AS OF 31/12/2013 VALUES AS OF 31/12/2013
INDIRECT SOVEREIGN EXPOSURES (3) (on and off balance sheet)
Fair-value at
31/12/2013 (+)Notional value
Fair-value at
31/12/2013 (-)Notional value
Fair-value at
31/12/2013 (+)Notional value
Fair-value at 31/12/2013
(-)Notional value
[ 0 - 3M [ 0 0 0 0 0 0 0 0 0 0 0 0 0 0
[ 3M - 1Y [ 0 0 0 0 0 0 0 0 0 0 0 0 0 0
[ 1Y - 2Y [ 0 0 0 0 0 0 0 0 0 0 0 0 0 0
[ 2Y - 3Y [ 0 0 0 0 0 0 0 0 0 0 0 0 0 0
[3Y - 5Y [ 0 0 0 0 0 0 0 0 0 0 0 0 0 0
[5Y - 10Y [ 0 0 0 0 0 0 0 0 0 0 0 0 0 0
[10Y - more 0 0 0 0 0 0 0 0 0 0 0 0 0 0
Tot 0 0 0 0 0 0 0 0 0 0 0 0 0 0
[ 0 - 3M [ 0 0 0 0 0 0 0 0 0 0 0 0 0 0
[ 3M - 1Y [ 0 0 0 0 0 0 0 0 0 0 0 0 0 0
[ 1Y - 2Y [ 0 0 0 0 0 0 0 0 0 0 0 0 0 0
[ 2Y - 3Y [ 0 0 0 0 0 0 0 0 0 0 0 0 0 0
[3Y - 5Y [ 0 0 0 0 0 0 0 0 0 0 0 0 0 0
[5Y 10Y [ 0 0 0 0 0 0 0 0 0 0 0 0 0 0
China
Switzerland
Other advanced economies
non EEA

8/10/2019 Test Stress Banca Española 2014
http://slidepdf.com/reader/full/test-stress-banca-espanola-2014 204/240
[5Y - 10Y [ 0 0 0 0 0 0 0 0 0 0 0 0 0 0
[10Y - more 0 0 0 0 0 0 0 0 0 0 0 0 0 0
Tot 0 0 0 0 0 0 0 0 0 0 0 0 0 0
[ 0 - 3M [ 0 0 0 0 0 0 0 0 0 0 0 0 0 0
[ 3M - 1Y [ 0 0 0 0 0 0 0 0 0 0 0 0 0 0
[ 1Y - 2Y [ 0 0 0 0 0 0 0 0 0 0 0 0 0 0
[ 2Y - 3Y [ 0 0 0 0 0 0 0 0 0 0 0 0 0 0
[3Y - 5Y [ 0 0 0 0 0 0 0 0 0 0 0 0 0 0
[5Y - 10Y [ 0 0 0 0 0 0 0 0 0 0 0 0 0 0
[10Y - more 0 0 0 0 0 0 0 0 0 0 0 0 0 0
Tot 0 0 0 0 0 0 0 0 0 0 0 0 0 0
[ 0 - 3M [ 0 0 0 0 0 0 0 0 0 0 0 0 0 0
[ 3M - 1Y [ 0 0 0 0 0 0 0 0 0 0 0 0 0 0
[ 1Y - 2Y [ 0 0 0 0 0 0 0 0 0 0 0 0 0 0
[ 2Y - 3Y [ 0 0 0 0 0 0 0 0 0 0 0 0 0 0[3Y - 5Y [ 0 0 0 0 0 0 0 0 0 0 0 0 0 0
[5Y - 10Y [ 0 0 0 0 0 0 0 0 0 0 0 0 0 0
[10Y - more 0 0 0 0 0 0 0 0 0 0 0 0 0 0
Tot 0 0 0 0 0 0 0 0 0 0 0 0 0 0
[ 0 - 3M [ 0 0 0 0 0 0 0 0 0 0 0 0 0 0
[ 3M - 1Y [ 0 0 0 0 0 0 0 0 0 0 0 0 0 0
[ 1Y - 2Y [ 0 0 0 0 0 0 0 0 0 0 0 0 0 0
[ 2Y - 3Y [ 0 0 0 0 0 0 0 0 0 0 0 0 0 0
[3Y - 5Y [ 0 0 0 0 0 0 0 0 0 0 0 0 0 0
[5Y - 10Y [ 0 0 0 0 0 0 0 0 0 0 0 0 0 0
[10Y - more 0 0 0 0 0 0 0 0 0 0 0 0 0 0
Tot 0 0 0 0 0 0 0 0 0 0 0 0 0 0
[ 0 - 3M [ 0 0 0 0 0 0 0 0 0 0 0 0 0 0
[ 3M - 1Y [ 0 0 0 0 0 0 0 0 0 0 0 0 0 0
[ 1Y - 2Y [ 0 0 0 0 0 0 0 0 0 0 0 0 0 0
[ 2Y - 3Y [ 0 0 0 0 0 0 0 0 0 0 0 0 0 0
[3Y - 5Y [ 0 0 0 0 0 0 0 0 0 0 0 0 0 0
[5Y - 10Y [ 0 0 0 0 0 0 0 0 0 0 0 0 0 0
[10Y - more 0 0 0 0 0 0 0 0 0 0 0 0 0 0Tot 0 0 0 0 0 0 0 0 0 0 0 0 0 0
Notes and definitions
(1) The exposures reported cover only exposures to central, regional and local governments on immediate borrower basis, and do not include exposures to other counterparts with full or partial government guarantees
(2) The banks disclose the exposures in the "Financial assets held for trading" portfolio after offsetting the cash short positions having the same maturities.(3) The exposures reported include the positions towards counterparts (other than sovereign) on sovereign credit risk (i.e. CDS, financial guarantees) booked in all the accounting portfolio (on-off balance sheet).
'Irrespective of the denomination and or accounting classification of the positions the economic substance over the form must be used as a criteria for the identification of the exposures to be included in this column. This item does not include exposures to counterparts (other than sovereign) with full or partial government guarantees by central, regional and local governments
Latin America and the
Caribbean
Africa
Others
Middle East
Other Central and eastern
Europe countries non EEA
http://www.economiaciudadana.org/
2014 EU-wide Stress TestCapital
(mln EUR) CRR/ CRDIV DEFINITION OFCAPITAL Asof31/12/2013 Asof31/12/2014 Asof31/12/2015 Asof31/12/2016 Asof31/12/2014 Asof31/12/2015 Asof31/12/2016 COREP CODE REGULATION
A OWN FUNDS 2,658 2,372 2,281 2,252 2,013 1,654 1,457 C A 1 {1 } A rt ic le s 4 (1 18 ) a nd 7 2 of C RR
A.1COMMON EQUITYTIER 1CAPITAL(net ofdeductionsandafter applying
transitional adjustments)2,599 2,323 2,239 2,211 1,965 1,612 1,415 C A 1 {1 .1 .1 } A rt ic le 5 0 of C RR
A.1.1Capitalinstrumentseligible asCET1Capital(including share premium and net own
capitalinstruments)10,286 10,286 10,286 10,286 10,286 10,286 10,286 CA1 {1.1.1.1}
Articles 26(1) points (a) and(b), 27to29, 36(1) point (f)
and42ofCRR
A.1.1.1 Ofwhich: CET1instrumentssubscribed byGovernment 0 0 0 0 0 0 0 - -
A.1.2 Retained earnings -7,668 -7,944 -8,028 -8,056 -8,294 -8,645 -8,836 CA1 {1.1.1.2} Articles 26(1) point (c), 26(2) and36 (1) points (a) and(l)
ofCRR
A.1.3 Accumulated other comprehensive income 2 -1 0 0 -41 -25 -28 CA1 {1.1.1.3} Articles 4(100), 26(1) point (d) and 36 (1) point (l) of CRR
A.1.3.1 Ofwhich: arising from unrealised gains/lossesfrom Sovereign exposure in AFS
portfolio1 1 1 1 -36 -22 -26 - -
A.1.3.2 Ofwhich: arising from unrealised gains/lossesfrom the rest ofAFS portfolio 1 -2 -1 -1 -5 -3 -2 - -
A.1.4 Other Reserves 0 0 0 0 0 0 0 CA1 {1.1.1.4} Articles 4(117) and 26(1) point (e) of CRR
A.1.5 Fundsfor generalbanking risk 0 0 0 0 0 0 0 CA1 {1.1.1.5} Articles 4(112), 26(1) point (f) and 36 (1) point (l) of CRR
A.1.6 Minorityinterest given recognition in CET1capital 0 0 0 0 0 0 0 CA1 {1.1.1.7} Article 84 of CRR
A.1.7 AdjustmentstoCET1 due toprudentialfiltersexcluding those from unrealised
gains/lossesfrom AFS portfolio0 0 0 0 0 0 0 CA1 {1.1.1.9} Articles 32 to 35 of and 36 (1) point (l) of CRR
A.1.8 AdjustmentstoCET1 due toprudentialfiltersfrom unrealised gains/lossesfrom
Sovereign Exposure in AFS portfolio-1 -1 -1 0 29 13 10 -
A.1.9 (-)Intangible assets(including Goodwill) -19 -19 -19 -19 -19 -19 -19CA1{1.1.1.10+
1.1.1.11}
Articles 4(113), 36(1) point (b) and37of CRR. Articles
4(115), 36(1) point (b) and37point (a) of CCR
A.1.10(-)DTAs that relyon future profitabilityand donot arise from temporary
differencesnet ofassociated DTLs0 0 0 0 0 0 0 CA1 {1.1.1.12} Articles 36(1) point (c) and 38 of CRR
A.1.11 (-)IRB shortfallofcredit riskadjustmentsto expected losses 0 0 0 0 0 0 0 CA1 {1.1.1.13} Articles 36(1) point (d), 40 and 159 of CRR
A.1.12 (-)Defined benefit pension fund assets 0 0 0 0 0 0 0 CA1 {1.1.1.14} Articles 4(109), 36(1) point (e) and 41 of CRR
A.1.13 (-)Reciprocalcrossholdingsin CET1Capital 0 0 0 0 0 0 0 CA1 {1.1.1.15} Articles 4(122), 36(1) point (g) and 44 of CRR
A.1.14 (-)Excessdeduction from AT1itemsover AT1Capital 0 0 0 0 0 0 0 CA1 {1.1.1.16} Article 36(1) point (j) of CRR
A.1.15(-)Deductionsrelated toassets which can alternativelybe subject toa 1.250%risk
weight0 0 0 0 0 0 0
CA1{1.1.1.17to
1.1.1.21}
Articles 4(36), 36(1) point (k) (i) and89to 91ofCRR;
Articles 36(1) point (k) (ii), 243(1) point (b), 244(1) point
(b) and258of CRR;Articles 36(1) point k) (iii) and379(3)
ofCRR;Art icles 36(1) point k) (iv) and153(8) ofCRRand
A.1.15.1 Ofwhich: from securitisation positions(-) 0 0 0 0 0 0 0 CA1 {1.1.1.18.1} Articles 36(1) point (k) (ii), 243(1) point (b), 244(1) point
(b) and258of CRR
A.1.16(-)Holdingsof CET1capitalinstrumentsof financialsector entitieswhere the
institiution does not have a significant investment0 0 0 0 0 0 0 CA1 {1.1.1.22}
Articles 4(27), 36(1) point (h);43to46, 49(2) and (3) and
79ofCRR
A.1.17(-)Deductible DTAsthat rely on future profitabilityand arise from temporary
differences0 0 0 0 0 0 0 CA1 {1.1.1.23}
Articles 36(1) point (c) and38;Articles 48(1) point (a) and
48(2) ofCRR
A.1.18(-)Holdingsof CET1capitalinstrumentsof financialsector entitieswhere the
institiution has a significant investment0 0 0 0 0 0 0 CA1 {1.1.1.24}
Articles 4(27);36(1) point (i);43, 45;47; 48(1) point (b);
49(1) to(3) and79of CRR
A.1.19 (-)Amount exceding the 17.65%threshold 0 0 0 0 0 0 0 CA1 {1.1.1.25} Article 470 of CRR
Baseline Scenario Adverse Scenario
OWN FUNDS

8/10/2019 Test Stress Banca Española 2014
http://slidepdf.com/reader/full/test-stress-banca-espanola-2014 205/240
A.1.20 Transitionaladjustments -1 2 1 0 4 2 1CA1{1.1.1.6+ 1.1.8+
1.1.26}-
A.1.20.1 Transitionaladjustmentsdue tograndfathered CET1Capitalinstruments(+/-) 0 0 0 0 0 0 0 CA1 {1.1.1.6}
Articles 483(1) to(3), and484to487of CRR
A.1.20.2 Transitionaladjustmentsdue toadditionalminorityinterests(+/-) 0 0 0 0 0 0 0 CA1 {1.1.1.8}
Articles 479and480of CRR
A.1.20.3Other transitionaladjustmentsto CET1Capitalexcl. adjustmentsfor Sovereign
exposure in AFS (+/-)-1 2 1 0 4 2 1 CA1 {1.1.1.26}
Articles 469to472, 478and 481ofCRR
A.2 ADDITIONAL TIER 1CAPITAL (net ofdeductionsand after transitional
adjustments)0 0 0 0 0 0 0 C A 1 {1 .1 .2 } A rt ic le 6 1 of C RR
A.2.1 Ofwhich:(+) Other existing support government measures 0 0 0 0 0 0 0 - -
A.3 TIER1 CAPITAL(netofdeductionsandafter transitional adjustments) 2,599 2,323 2,239 2,211 1,965 1,612 1,415 C A1 { 1. 1} A rt ic le 2 5 of C RR
A.4 TIER2 CAPITAL(netofdeductionsandafter transitional adjustments) 59 49 43 41 49 42 42 C A1 { 1. 2} A rt ic le 7 1 of C RR
B T OT AL R IS K EX PO SU RE A M OU NT 21,283 19,749 18,233 17,647 19,750 18,233 17,647 C A 2 {1 } A rt ic le s 92 (3 ), 95 , 96 a n d 98 o f CR R
B.1ofwhich:stemming from exposuresthat fallbelow the 10%/ 15%limitsfor
CET1deduction (+)366 0 0 0 0 0 0
Articles 36(1) points (a) and(i);Article 38a ndArticle 48of
CRR
B. 2 ofwh ich :s temmi ng f r om fr om CVAcap ita l r eq ui r ements (+) 90 0 0 0 0 0 0 Article 381to386 ofCRR
B.3ofwhich:stemming from higher asset correlation parameter against exposures
tolarge financialinstitutionsunder IRB the IRB approachesto credit risk(+)0 0 0 0 0 0 0 Articles 153(2) ofCRR
B.4ofwhich:stemming from the application ofthe supporting factor to increase
lending toSMEs(-)-522 0 0 0 0 0 0 Recital (44) ofCRR
B.5
ofwhich:stemming from the effect of exposuresthat were previouslypart of
RiskExposure amount and receive a deduction treatment under CRR/CRDIV (-
)
0 0 0 0 0 0 0 -
B.6 ofwhich:otherssubject tothe discretion ofNationalCompetent Authorities 0 0 0 0 0 0 0 Article 124to164 ofCRR
C.1 Co mm onE q ui tyTi er 1Cap i tal r ati o 12.21% 11.76% 12.28% 12.53% 9.95% 8.84% 8.02% CA3 {1} -
C .2 T ie r 1 C ap it al ra ti o 12.21% 11.76% 12.28% 12.53% 9.95% 8.84% 8.02% CA3 {3} -
C .3 T ot al C ap it al r at io 12.49% 12.01% 12.51% 12.76% 10.19% 9.07% 8.26% CA3 { 5} -
D Co mm onE q ui tyTi er 1Cap i tal Thresho ld 1,580 1,459 1,412 1,086 1,003 971
ETotalamount of instrumentswith mandatoryconversion intoordinarysharesupon
a fixed date in the 2014 -2016period (cumulative conversions)(1)0 0 0 0 0 0
F
TotalAdditionalTier 1and Tier 2 instrumentseligible asregulatorycapitalunder
the CRR provisionsthat convert into Common EquityTier 1or are written down
upon a trigger event (2)
0 0 0
F.1Ofwhich: eligible instrumentswhose trigger isabove CET1capitalratio in the
adverse scenario(2)0 0 0
G FullyLoadedCommonEquityTier 1Capital ratio (3) 12.53% 8.01%
(1)Conversionsnot considered for CET1 computation (2)Excluding instrumentsincluded in E (3)Memorandum item based on a fullyimplemented CRR/CRD IV definition of Common EquityTier 1 capitalincluding 60%ofunrealised gains/lossesfrom Sovereign Exposure in AFS portfolio
Memorandumitems
OWN FUNDS
REQUIREMENTS
CAPITALRATIOS(%) -
Transitional period
http://www.economiaciudadana.org/
2014 EU-wide Stress Test - Restructuring scenarios
(mln EUR)
2013 0 0
2014 -29 -1,568 -6 -1,568 Includes a mandatory reduction on the non defaulted exposure of 2013
2015 10 -1,482 215 -1,482 Includes a mandatory reduction on the non defaulted exposure of 2013
2016 -14 -585 209 -585 Includes a mandatory reduction on the non defaulted exposure of 2013
Total -34 -3,635 419 -3,635
Effects of mandatory restructuring plans publicly announced before 31 December 2013 and formally agreed with the European Commission.
Baseline scenario Adverse scenarioNarrative description of the transactions. (type, date of
completion/commitment, portfolios, subsidiaries, branches)CET1 impact
Risk exposure
amount impactCET1 impact
Risk exposure
amount impact

8/10/2019 Test Stress Banca Española 2014
http://slidepdf.com/reader/full/test-stress-banca-espanola-2014 206/240
http://www.economiaciudadana.org/
2014 EU-wide Stress Test
Outcome of the Stress Test based on the Restructuring plan for banks whose plan was formally agreed with the European Commission after 31 December 2013
(mln EUR)
As of
31/12/2013
As of
31/12/2014
As of
31/12/2015
As of
31/12/2016
As of
31/12/2014
As of
31/12/2015
As of
31/12/2016
COMMON EQUITY TIER 1 CAPITAL (net of deductions and after applying transitional adjustments)
TOTAL RISK EXPOSURE AMOUNT
COMMON EQUITY TIER 1 RATIO #DIV/0! #DIV/0! #DIV/0! #DIV/0! #DIV/0! #DIV/0! #DIV/0!
Baseline scenario Adverse scenario

8/10/2019 Test Stress Banca Española 2014
http://slidepdf.com/reader/full/test-stress-banca-espanola-2014 207/240
http://www.economiaciudadana.org/
2014 EU-wide Stress Test
Impact on Common
Equity Tier 1
Million EUR
Raising of capital instruments eligible as CET1 capital (+) 0
Repayment of CET1 capital, buybacks (-) 0
Conversion to CET1 of hybrid instruments becoming effective between 1 January and 30 September 2014 (+) 0
Impact on Additional
Tier 1 and Tier 2
Million EUR
Net issuance of Additional Tier 1 and T2 Instruments with a trigger at or above bank's post stress test CET1 ratio in the adverse
Major Capital Measures from 1 January to 30 September 2014
Net issuance of Additional Tier 1 and T2 Instruments
Issuance of CET 1 Instruments
Major Capital Measures Impacting Tier 1 and Tier 2 Eligible Capital from 1 January 2014 to 30 September 2014

8/10/2019 Test Stress Banca Española 2014
http://slidepdf.com/reader/full/test-stress-banca-espanola-2014 208/240
Net issuance of Additional Tier 1 and T2 Instruments with a trigger at or above bank's post stress test CET1 ratio in the adverse
scenario during the stress test horizon (+/-)0
Net issuance of Additional Tier 1 and T2 Instrument with a trigger below bank's post stress test CET1 ratio in the adverse
scenario during the stress test horizon (+/-)0
Million EUR
Realized fines/litigation costs from 1 January to 30 September 2014 (net of provisions) (-) -1
Other material losses and provisions from 1 January to 30 September 2014 (-) 0
Losses
http://www.economiaciudadana.org/
Bank Name ES - MPCA Ronda, Cádiz, Almería, Málaga, Antequera y Jaén
LEI Code 5493007SJLLCTM6J6M37
ES
NUK_WL_NR_XX
version
1809014
No restructuring
2014 EU-wide Stress Test

8/10/2019 Test Stress Banca Española 2014
http://slidepdf.com/reader/full/test-stress-banca-espanola-2014 209/240
http://www.economiaciudadana.org/
Actual figures as of 31 December 2013 mln EUR, % Actual figures as of 31 December 2013 mln EUR, %Operating profit before impairments 840 Operating profit before impairments 840
Impairment losses on financial and non-financial assets in the banking book 901 Impairment losses on financial and non-financial assets in the banking book 901
Common Equity Tier 1 capital (1) 3,627 Common Equity Tier 1 capital (1) 3,627
Total Risk Exposure (1) 33,351 Total Risk Exposure (1) 33,351
Common Equity Tier 1 ratio, % (1) 10.9% Common Equity Tier 1 ratio, % (1) 10.9%
Outcome of the adverse scenario as of 31 December 2016 mln EUR, % Outcome of the baseline scenario as of 31 December 2016 mln EUR, %
3 yr cumulative operating profit before impairments 905 3 yr cumulative operating profit before impairments 1,415
3 yr cumulative impairment losses on financial and non-financial assets in the banking book 1,438 3 yr cumulative impairment losses on financial and non-financial assets in the banking book 525
3 yr cumulative losses from the stress in the trading book 8 3 yr cumulative losses from the stress in the trading book 3
Valuation losses due to sovereign shock after tax and prudential filters 31 Common Equity Tier 1 capital (1) 3,942
Common Equity Tier 1 capital (1) 2,990 Total Risk Exposure (1) 33,224
Total Risk Exposure (1) 33,647 Common Equity Tier 1 ratio, % (1) 11.9%
Common Equity Tier 1 ratio, % (1) 8.9%
Memorandum items mln EUR Memorandum items mln EUR Common EU wide CET1 Threshold (8.0%) 2,658
Common EU wide CET1 Threshold (5.5%) 1,851
Total amount of instruments with mandatory conversion into ordinary shares upon a fixed date inthe 2014 -2016 period (cumulative conversions) (2)
0
Total Additional Tier 1 and Tier 2 instruments eligible as regulatory capital under the CRR provisions
that convert into Common Equity Tier 1 or are written down upon a trigger event (3)0
2014 EU-wide Stress Test 2014 EU-wide Stress Test
Summary Baseline Scenario
ES - MPCA Ronda, Cádiz, Almería, Málaga, Antequera y Jaén
(1) According to CRR/CRD4 definition transitional arrangements as per reporting date. Figures as of 31/12/2013 computed as of first day of application:
01/01/2014.
Summary Adverse Scenario
ES - MPCA Ronda, Cádiz, A lmería, Málaga, Antequera y Jaén

8/10/2019 Test Stress Banca Española 2014
http://slidepdf.com/reader/full/test-stress-banca-espanola-2014 210/240
Of which: eligible instruments whose trigger is above CET1 capital ratio in the adversescenario (3)
0
(2) Conversions not considered for CET1 computation
(3) Excluding instruments with mandatory conversion into ordinary shares upon a fixed date in the 2014 -2016 period
(1) According to CRR/CRD4 definition transitional arrangements as per reporting date. Figures as of 31/12/2013 computed as of first day of application:
01/01/2014.
http://www.economiaciudadana.org/
2014 EU-wide Stress TestCredit Risk
(mln EUR, %)
Non-defaulted Defaulted Non-defaulted Defaulted Non-defaulted Defaulted Non-defaulted Defaulted Non-defaulted Defaulted Non-defaulted Defaulted Non-defaulted Defaulted Non-defaulted Defaulted Non-defaulted Defaulted Impairmentrate
Stockof Provisions
Coverage Ratio -Default Stock
Impairmentrate
Stockof Provisions
CoverageRatio -Default
Stock
Impairmentrate
Stockof Provisions
CoverageRatio -Default
Stock
Impairment rateStockof
Provisions
CoverageRatio -Default
Stock
Impairmentrate
Stockof Provisions
CoverageRatio -Default
Stock
Impairmentrate
Stockof Provisions
CoverageRatio -Default
Stock
Central banksandcentral governments 0 0 0 0 19,316 1 0 0 0 0 199 0 0 0 0 0 0 0 0.17% 23 39.30% 0.39% 73 39.78% 0.51% 139 39.89% 0.37% 49 39.68% 0.80% 154 39.90% 1.58% 355 39.96%
Institutions 0 0 0 0 4,685 0 0 0 0 0 1,093 0 0 0 0 0 2 2 0.10% 8 21.83% 0.09% 11 20.38% 0.08% 14 19.72% 0.25% 14 20.99% 0.21% 21 20.23% 0.18% 27 19.92%Corporates 0 0 0 0 4,736 769 0 0 0 0 4,700 992 0 0 0 0 409 1,360 1.80% 1,843 53.92% 1.52% 1,875 50.87% 1.63% 1,911 49.00% 2.56% 1,878 54.43% 3.29% 1,964 51.49% 3.30% 2,040 49.53%
Corporates - OfWhich:SpecialisedLending 0 0 0 0 0 0 0 0 0 0 0 0 0 0 0 0 0 0 - 0 - - 0 - - 0 - - 0 - - 0 - - 0 -Corporates -OfWhich: SME 0 0 0 0 1,384 429 0 0 0 0 1,335 518 0 0 0 0 191 567 - 0 - - 0 - - 0 - - 0 - - 0 - - 0 -
Retail 0 0 0 0 27,105 1,302 0 0 0 0 12,804 1,117 0 0 0 0 271 947 0.41% 1,384 38.48% 0.32% 1,461 35.51% 0.27% 1,525 33.82% 0.68% 1,452 38.36% 0.72% 1,628 35.08% 0.72% 1,796 33.01%Retail -Securedon real estateproperty 49.5% 0 0 0 0 22,763 1,147 0 0 0 0 9,645 861 0 0 0 0 193 518 0.29% 833 29.69% 0.21% 877 27.23% 0.17% 911 25.86% 0.52% 882 29.78% 0.52% 987 27.19% 0.51% 1,088 25.58%
Retail -Securedon real estate property-Of h i h : S E
44.6% 0 0 0 0 944 172 0 0 0 0 488 190 0 0 0 0 52 161 0.38% 215 41.80% 0.04% 213 38.89% 0.18% 214 37.37% 1.10% 219 38.73% 1.10% 224 34.08% 1.10% 229 31.05%Retail -Securedon real estate property-Of
h i h: n n - E50.8% 0 0 0 0 21,819 975 0 0 0 0 9,157 671 0 0 0 0 141 358 0.28% 619 27.05% 0.22% 663 24.92% 0.17% 697 23.73% 0.49% 663 27.71% 0.49% 763 25.71% 0.49% 859 24.47%
Retail -QualifyingRevolving 0 0 0 0 634 7 0 0 0 0 441 31 0 0 0 0 3 56 1.63% 69 82.59% 1.10% 76 79.97% 0.91% 82 78.27% 2.50% 75 83.58% 2.49% 90 80.86% 2.48% 105 79.11%Retail -OtherRetail 0 0 0 0 3,708 148 0 0 0 0 2,717 225 0 0 0 0 75 373 0.98% 481 62.79% 0.86% 509 58.43% 0.78% 533 55.48% 1.38% 495 62.75% 1.71% 551 57.34% 1.71% 604 53.90%
Retail -OtherRetail -OfWhich:SME 0 0 0 0 1,300 101 0 0 0 0 830 143 0 0 0 0 57 259 1.63% 335 63.34% 1.70% 354 58.51% 1.61% 371 55.22% 2.13% 342 63.62% 3.07% 376 57.80% 3.17% 409 54.12%Retail -OtherRetail -OfWhich:non-SME 0 0 0 0 2,408 47 0 0 0 0 1,887 82 0 0 0 0 18 114 0.60% 146 61.58% 0.40% 155 58.25% 0.32% 162 56.09% 0.95% 154 60.96% 0.95% 175 56.39% 0.95% 195 53.44%
Equity 0 0 0 0 1,606 0 0 0 0 0 1,540 0 0 0 0 0 0 0 0.00% 0 - 0.13% 1 100.00% 0.00% 1 100.00% 6.81% 57 100.00% 4.13% 89 100.00% 3.31% 114 100.00%Securitisation 0 0 0 0 3,366 0 0 0 0 0 587 0 0 0 0 0 2 0Othernon-credit obligation assets 0 0 0 0 4,977 0 0 0 0 0 5,934 0 0 0 0 0 1,085 0TOTAL 0 0 0 0 65,791 2,072 0 0 0 0 26,857 2,109 0 0 0 0 1,769 2,309 0.44% 3,257 45.74% 0.42% 3,422 42.48% 0.42% 3,590 40.61% 0.84% 3,450 46.08% 0.97% 3,855 42.67% 1.16% 4,332 40.51%Securitisation andre-securitisations positions deductedfrom capital * 0 0 0 0 1 0 0 0 0 0 0 0
(mln EUR, %)Non-defaulted Defaulted Non-defaulted Defaulted Non-defaulted Defaulted Non-defaulted Defaulted Non-defaulted Defaulted Non-defaulted Defaulted Non-defaulted Defaulted Non-defaulted Defaulted Non-defaulted Defaulted Impairment
rateStockof
ProvisionsCoverage Ratio -
Default Stock
Impairmentrate
Stockof Provisions
Coverage
Ratio -Default
Stock
Impairmentrate
Stockof Provisions
Coverage
Ratio -Default
Stock
Impairment rateStockof
Provisions
Coverage
Ratio -Default
Stock
Impairmentrate
Stockof Provisions
Coverage
Ratio -Default
Stock
Impairmentrate
Stockof Provisions
Coverage
Ratio -Default
Stock
Central banksandcentral governments 0 0 0 0 19,316 1 0 0 0 0 199 0 0 0 0 0 0 0 0.17% 23 39.30% 0.39% 73 39.78% 0.51% 139 39.89% 0.37% 49 39.68% 0.80% 154 39.90% 1.58% 355 39.96%Institutions 0 0 0 0 4,685 0 0 0 0 0 1,093 0 0 0 0 0 2 2 0.10% 8 21.83% 0.09% 11 20.38% 0.08% 14 19.72% 0.25% 14 20.99% 0.21% 21 20.23% 0.18% 27 19.92%Corporates 0 0 0 0 4,736 769 0 0 0 0 4,700 992 0 0 0 0 409 1,360 1.80% 1,843 53.92% 1.52% 1,875 50.87% 1.63% 1,911 49.00% 2.56% 1,878 54.43% 3.29% 1,964 51.49% 3.30% 2,040 49.53%
Corporates - OfWhich:SpecialisedLending 0 0 0 0 0 0 0 0 0 0 0 0 0 0 0 0 0 0 - 0 - - 0 - - 0 - - 0 - - 0 - - 0 -Corporates -OfWhich: SME 0 0 0 0 1,384 429 0 0 0 0 1,335 518 0 0 0 0 191 567 - 0 - - 0 - - 0 - - 0 - - 0 - - 0 -
Retail 0 0 0 0 27,105 1,302 0 0 0 0 12,804 1,117 0 0 0 0 271 947 0.41% 1,384 38.48% 0.32% 1,461 35.51% 0.27% 1,525 33.82% 0.68% 1,452 38.36% 0.72% 1,628 35.08% 0.72% 1,796 33.01%Retail -Securedon real estateproperty 49.5% 0 0 0 0 22,763 1,147 0 0 0 0 9,645 861 0 0 0 0 193 518 0.29% 833 29.69% 0.21% 877 27.23% 0.17% 911 25.86% 0.52% 882 29.78% 0.52% 987 27.19% 0.51% 1,088 25.58%
Retail -Securedon real estate property-Of h i h : S E
44.6% 0 0 0 0 944 172 0 0 0 0 488 190 0 0 0 0 52 161 0.38% 215 41.80% 0.04% 213 38.89% 0.18% 214 37.37% 1.10% 219 38.73% 1.10% 224 34.08% 1.10% 229 31.05%Retail -Securedon real estate property-Of
h i h: n n - E50.8% 0 0 0 0 21,819 975 0 0 0 0 9,157 671 0 0 0 0 141 358 0.28% 619 27.05% 0.22% 663 24.92% 0.17% 697 23.73% 0.49% 663 27.71% 0.49% 763 25.71% 0.49% 859 24.47%
Retail -QualifyingRevolving 0 0 0 0 634 7 0 0 0 0 441 31 0 0 0 0 3 56 1.63% 69 82.59% 1.10% 76 79.97% 0.91% 82 78.27% 2.50% 75 83.58% 2.49% 90 80.86% 2.48% 105 79.11%Retail -OtherRetail 0 0 0 0 3,708 148 0 0 0 0 2,717 225 0 0 0 0 75 373 0.98% 481 62.79% 0.86% 509 58.43% 0.78% 533 55.48% 1.38% 495 62.75% 1.71% 551 57.34% 1.71% 604 53.90%
Retail -OtherRetail -OfWhich:SME 0 0 0 0 1,300 101 0 0 0 0 830 143 0 0 0 0 57 259 1.63% 335 63.34% 1.70% 354 58.51% 1.61% 371 55.22% 2.13% 342 63.62% 3.07% 376 57.80% 3.17% 409 54.12%Retail -OtherRetail -OfWhich:non-SME 0 0 0 0 2,408 47 0 0 0 0 1,887 82 0 0 0 0 18 114 0.60% 146 61.58% 0.40% 155 58.25% 0.32% 162 56.09% 0.95% 154 60.96% 0.95% 175 56.39% 0.95% 195 53.44%
Equity 0 0 0 0 1,606 0 0 0 0 0 1,540 0 0 0 0 0 0 0 0.00% 0 - 0.13% 1 100.00% 0.00% 1 100.00% 6.81% 57 100.00% 4.13% 89 100.00% 3.31% 114 100.00%Securitisation 0 0 0 0 3,366 0 0 0 0 0 587 0 0 0 0 0 2 0Othernon-credit obligation assets 0 0 0 0 4,977 0 0 0 0 0 5,934 0 0 0 0 0 1,085 0TOTAL 0 0 0 0 65,791 2,072 0 0 0 0 26,857 2,109 0 0 0 0 1,769 2,309 0.44% 3,257 45.74% 0.42% 3,422 42.48% 0.42% 3,590 40.61% 0.84% 3,450 46.08% 0.97% 3,855 42.67% 1.16% 4,332 40.51%Securitisation andre-securitisations positions deductedfrom capital * 0 0 0 0 1 0 0 0 0 0 0 0
(mln EUR, %)Non-defaulted Defaulted Non-defaulted Defaulted Non-defaulted Defaulted Non-defaulted Defaulted Non-defaulted Defaulted Non-defaulted Defaulted Non-defaulted Defaulted Non-defaulted Defaulted Non-defaulted Defaulted Impairment
rateStockof
ProvisionsCoverage Ratio -
Default Stock
Impairmentrate
Stockof Provisions
Coverage
Ratio -Default
Stock
Impairmentrate
Stockof Provisions
Coverage
Ratio -Default
Stock
Impairment rateStockof
Provisions
Coverage
Ratio -Default
Stock
Impairmentrate
Stockof Provisions
Coverage
Ratio -Default
Stock
Impairmentrate
Stockof Provisions
Coverage
Ratio -Default
Stock
Central banksandcentral governments 0 0 0 0 0 0 0 0 0 0 0 0 0 0 0 0 0 0 - 0 - - 0 - - 0 - - 0 - - 0 - - 0 -Institutions 0 0 0 0 0 0 0 0 0 0 0 0 0 0 0 0 0 0 - 0 - - 0 - - 0 - - 0 - - 0 - - 0 -Corporates 0 0 0 0 0 0 0 0 0 0 0 0 0 0 0 0 0 0 - 0 - - 0 - - 0 - - 0 - - 0 - - 0 -
Corporates - OfWhich:SpecialisedLending 0 0 0 0 0 0 0 0 0 0 0 0 0 0 0 0 0 0 - 0 - - 0 - - 0 - - 0 - - 0 - - 0 -Corporates -OfWhich: SME 0 0 0 0 0 0 0 0 0 0 0 0 0 0 0 0 0 0 - 0 - - 0 - - 0 - - 0 - - 0 - - 0 -
Retail 0 0 0 0 0 0 0 0 0 0 0 0 0 0 0 0 0 0 - 0 - - 0 - - 0 - - 0 - - 0 - - 0 -Retail -Securedon real estateproperty 0.0% 0 0 0 0 0 0 0 0 0 0 0 0 0 0 0 0 0 0 - 0 - - 0 - - 0 - - 0 - - 0 - - 0 -
Retail -Securedon real estate property-Of hi h: E
0.0% 0 0 0 0 0 0 0 0 0 0 0 0 0 0 0 0 0 0 - 0 - - 0 - - 0 - - 0 - - 0 - - 0 -Retail -Securedon real estate property-Of
h i h : n n -S E0.0% 0 0 0 0 0 0 0 0 0 0 0 0 0 0 0 0 0 0 - 0 - - 0 - - 0 - - 0 - - 0 - - 0 -
Retail -QualifyingRevolving 0 0 0 0 0 0 0 0 0 0 0 0 0 0 0 0 0 0 - 0 - - 0 - - 0 - - 0 - - 0 - - 0 -Retail -OtherRetail 0 0 0 0 0 0 0 0 0 0 0 0 0 0 0 0 0 0 - 0 - - 0 - - 0 - - 0 - - 0 - - 0 -
Retail -OtherRetail -OfWhich:SME 0 0 0 0 0 0 0 0 0 0 0 0 0 0 0 0 0 0 - 0 - - 0 - - 0 - - 0 - - 0 - - 0 -Retail -OtherRetail -OfWhich:non-SME 0 0 0 0 0 0 0 0 0 0 0 0 0 0 0 0 0 0 - 0 - - 0 - - 0 - - 0 - - 0 - - 0 -
Equity 0 0 0 0 0 0 0 0 0 0 0 0 0 0 0 0 0 0 - 0 - - 0 - - 0 - - 0 - - 0 - - 0 -Securitisation 0 0 0 0 0 0 0 0 0 0 0 0 0 0 0 0 0 0Othernon-credit obligation assets 0 0 0 0 0 0 0 0 0 0 0 0 0 0 0 0 0 0TOTAL 0 0 0 0 0 0 0 0 0 0 0 0 0 0 0 0 0 0 - 0 - - 0 - - 0 - - 0 - - 0 - - 0 -Securitisation andre-securitisations positions deductedfrom capital * 0 0 0 0 0 0 0 0 0 0 0 0
Non-defaulted Defaulted Non-defaulted Defaulted Non-defaulted Defaulted Non-defaulted Defaulted Non-defaulted Defaulted Non-defaulted Defaulted Non-defaulted Defaulted Non-defaulted Defaulted Non-defaulted DefaultedImpairment Stockof Coverage Ratio - Impairment Stockof Coverage
Ratio DefaultImpairment Stockof Coverage
Ratio Default Impairment rateStockof Coverage
Ratio DefaultImpairment Stockof Coverage
Ratio DefaultImpairment Stockof Coverage
Ratio Default
(*)Referstothepart ofSecuritizationexposurethat isdeductedfrom capital andisnot includedinRWA
(*)Referstothepart ofSecuritizationexposurethat isdeductedfrom capital andisnot includedinRWA
0
ES - MPCA Ronda, Cádiz, Almería, Málaga, Antequera y
Jaén
(*)Referstothepart ofSecuritizationexposurethat isdeductedfrom capital andisnot includedinRWA
Valueadjustmentsandprovisions(asof 31/12/2013) BaselineScenario
LTV %(asof 31/12/2013)
Exposure values (as of 31/12/2013) Risk exposure amounts (as of 31/12/2013) Value adjustments and provisions (as of 31/12/2013) Adverse Scenario
F-IRB A-IRB STA F-IRB A-IRB STA F-IRB A-IRB STA
BaselineScenario
as of 31/12/2014 as of 31/12/2015 as of 31/12/2016 as of 31/12/2014 as of 31/12/2015 as of 31/12/2016
Spain
LTV %(asof 31/12/2013)
E xp os ur ev al ue s( as of 3 1/ 12 /2 01 3) R is k e xp os ur e am ou nt s (a so f3 1/ 12 /2 01 3) V al ue ad ju st me nt s an dp ro vi si on s( as of 3 1/ 12 /2 01 3)
AdverseScenarioF-IRB A-IRB STA F-IRB A-IRB STA F-IRB A-IRB STA as of 31/12/2014 as of 31/12/2015 as of 31/12/2016 as of 31/12/2014 as of 31/12/2015 as of 31/12/2016LTV %(asof
31/12/2013)
E xp os ur ev al ue s( as of 3 1/ 12 /2 01 3) R is k ex po su re am ou nt s (a so f3 1/ 12 /2 01 3)
Baseline Scenario Adverse ScenarioF-IRB A-IRB STA F-IRB A-IRB STA F-IRB A-IRB STA as of 31/12/2014 as of 31/12/2015 as of 31/12/2016 as of 31/12/2014 as of 31/12/2015 as of 31/12/2016
LTV %(asof 31/12/2013)
Exposure values (as of 31/12/2013) Risk exposure amounts (as of 31/12/2013) Value adjustments and provisions (as of 31/12/2013) Baseline Scenario Adverse Scenario
F-IRB A-IRB STA F-IRB A-IRB STA F-IRB A-IRB a so f 31 /1 2/ 20 15 a so f3 1/ 12 /2 01 6STA as of 31/12/2014 as of 31/12/2015 as of 31/12/2016 as of 31/12/2014
8/10/2019 Test Stress Banca Española 2014
http://slidepdf.com/reader/full/test-stress-banca-espanola-2014 211/240
(mln EUR, %)Non-defaulted Defaulted Non-defaulted Defaulted Non-defaulted Defaulted Non-defaulted Defaulted Non-defaulted Defaulted Non-defaulted Defaulted Non-defaulted Defaulted Non-defaulted Defaulted Non-defaulted Defaulted
rate Provisionsg
Default Stock rate ProvisionsRatio -Default
Stock rate Provisions
Ratio -DefaultStock
Impairment rateProvisions
Ratio -DefaultStock
rate ProvisionsRatio -Default
Stock rate Provisions
Ratio -DefaultStock
Central banksandcentral governments 0 0 0 0 0 0 0 0 0 0 0 0 0 0 0 0 0 0 - 0 - - 0 - - 0 - - 0 - - 0 - - 0 -Institutions 0 0 0 0 0 0 0 0 0 0 0 0 0 0 0 0 0 0 - 0 - - 0 - - 0 - - 0 - - 0 - - 0 -Corporates 0 0 0 0 0 0 0 0 0 0 0 0 0 0 0 0 0 0 - 0 - - 0 - - 0 - - 0 - - 0 - - 0 -
Corporates - OfWhich:SpecialisedLending 0 0 0 0 0 0 0 0 0 0 0 0 0 0 0 0 0 0 - 0 - - 0 - - 0 - - 0 - - 0 - - 0 -Corporates -OfWhich: SME 0 0 0 0 0 0 0 0 0 0 0 0 0 0 0 0 0 0 - 0 - - 0 - - 0 - - 0 - - 0 - - 0 -
Retail 0 0 0 0 0 0 0 0 0 0 0 0 0 0 0 0 0 0 - 0 - - 0 - - 0 - - 0 - - 0 - - 0 -Retail -Securedon real estateproperty 0.0% 0 0 0 0 0 0 0 0 0 0 0 0 0 0 0 0 0 0 - 0 - - 0 - - 0 - - 0 - - 0 - - 0 -
Retail -Securedon real estate property-Of hi h: E
0.0% 0 0 0 0 0 0 0 0 0 0 0 0 0 0 0 0 0 0 - 0 - - 0 - - 0 - - 0 - - 0 - - 0 -Retail -Securedon real estate property-Of
h i h: n n - E0.0% 0 0 0 0 0 0 0 0 0 0 0 0 0 0 0 0 0 0 - 0 - - 0 - - 0 - - 0 - - 0 - - 0 -
Retail -QualifyingRevolving 0 0 0 0 0 0 0 0 0 0 0 0 0 0 0 0 0 0 - 0 - - 0 - - 0 - - 0 - - 0 - - 0 -Retail -OtherRetail 0 0 0 0 0 0 0 0 0 0 0 0 0 0 0 0 0 0 - 0 - - 0 - - 0 - - 0 - - 0 - - 0 -
Retail -OtherRetail -OfWhich:SME 0 0 0 0 0 0 0 0 0 0 0 0 0 0 0 0 0 0 - 0 - - 0 - - 0 - - 0 - - 0 - - 0 -Retail -OtherRetail -OfWhich:non-SME 0 0 0 0 0 0 0 0 0 0 0 0 0 0 0 0 0 0 - 0 - - 0 - - 0 - - 0 - - 0 - - 0 -
Equity 0 0 0 0 0 0 0 0 0 0 0 0 0 0 0 0 0 0 - 0 - - 0 - - 0 - - 0 - - 0 - - 0 -Securitisation 0 0 0 0 0 0 0 0 0 0 0 0 0 0 0 0 0 0Othernon-credit obligation assets 0 0 0 0 0 0 0 0 0 0 0 0 0 0 0 0 0 0TOTAL 0 0 0 0 0 0 0 0 0 0 0 0 0 0 0 0 0 0 - 0 - - 0 - - 0 - - 0 - - 0 - - 0 -Securitisation andre-securitisations positions deductedfrom capital * 0 0 0 0 0 0 0 0 0 0 0 0
(mln EUR, %)Non-defaulted Defaulted Non-defaulted Defaulted Non-defaulted Defaulted Non-defaulted Defaulted Non-defaulted Defaulted Non-defaulted Defaulted Non-defaulted Defaulted Non-defaulted Defaulted Non-defaulted Defaulted
Impairmentrate
Stockof Provisions
Coverage Ratio -
Default Stock
Impairmentrate
Stockof Provisions
Coverage
Ratio -DefaultStock
Impairmentrate
Stockof Provisions
Coverage
Ratio -DefaultStock
Impairment rateStockof
Provisions
Coverage
Ratio -DefaultStock
Impairmentrate
Stockof Provisions
Coverage
Ratio -DefaultStock
Impairmentrate
Stockof Provisions
Coverage
Ratio -DefaultStock
Central banksandcentral governments 0 0 0 0 0 0 0 0 0 0 0 0 0 0 0 0 0 0 - 0 - - 0 - - 0 - - 0 - - 0 - - 0 -Institutions 0 0 0 0 0 0 0 0 0 0 0 0 0 0 0 0 0 0 - 0 - - 0 - - 0 - - 0 - - 0 - - 0 -Corporates 0 0 0 0 0 0 0 0 0 0 0 0 0 0 0 0 0 0 - 0 - - 0 - - 0 - - 0 - - 0 - - 0 -
Corporates - OfWhich:SpecialisedLending 0 0 0 0 0 0 0 0 0 0 0 0 0 0 0 0 0 0 - 0 - - 0 - - 0 - - 0 - - 0 - - 0 -Corporates -OfWhich: SME 0 0 0 0 0 0 0 0 0 0 0 0 0 0 0 0 0 0 - 0 - - 0 - - 0 - - 0 - - 0 - - 0 -
Retail 0 0 0 0 0 0 0 0 0 0 0 0 0 0 0 0 0 0 - 0 - - 0 - - 0 - - 0 - - 0 - - 0 -Retail -Securedon real estateproperty 0.0% 0 0 0 0 0 0 0 0 0 0 0 0 0 0 0 0 0 0 - 0 - - 0 - - 0 - - 0 - - 0 - - 0 -
Retail -Securedon real estate property-Of hi h: E
0.0% 0 0 0 0 0 0 0 0 0 0 0 0 0 0 0 0 0 0 - 0 - - 0 - - 0 - - 0 - - 0 - - 0 -Retail -Securedon real estate property-Of
h i h : n n -S E0.0% 0 0 0 0 0 0 0 0 0 0 0 0 0 0 0 0 0 0 - 0 - - 0 - - 0 - - 0 - - 0 - - 0 -
Retail -QualifyingRevolving 0 0 0 0 0 0 0 0 0 0 0 0 0 0 0 0 0 0 - 0 - - 0 - - 0 - - 0 - - 0 - - 0 -Retail -OtherRetail 0 0 0 0 0 0 0 0 0 0 0 0 0 0 0 0 0 0 - 0 - - 0 - - 0 - - 0 - - 0 - - 0 -
Retail -OtherRetail -OfWhich:SME 0 0 0 0 0 0 0 0 0 0 0 0 0 0 0 0 0 0 - 0 - - 0 - - 0 - - 0 - - 0 - - 0 -Retail -OtherRetail -OfWhich:non-SME 0 0 0 0 0 0 0 0 0 0 0 0 0 0 0 0 0 0 - 0 - - 0 - - 0 - - 0 - - 0 - - 0 -
Equity 0 0 0 0 0 0 0 0 0 0 0 0 0 0 0 0 0 0 - 0 - - 0 - - 0 - - 0 - - 0 - - 0 -Securitisation 0 0 0 0 0 0 0 0 0 0 0 0 0 0 0 0 0 0Othernon-credit obligation assets 0 0 0 0 0 0 0 0 0 0 0 0 0 0 0 0 0 0TOTAL 0 0 0 0 0 0 0 0 0 0 0 0 0 0 0 0 0 0 - 0 - - 0 - - 0 - - 0 - - 0 - - 0 -Securitisation andre-securitisations positions deductedfrom capital * 0 0 0 0 0 0 0 0 0 0 0 0
(mln EUR, %)Non-defaulted Defaulted Non-defaulted Defaulted Non-defaulted Defaulted Non-defaulted Defaulted Non-defaulted Defaulted Non-defaulted Defaulted Non-defaulted Defaulted Non-defaulted Defaulted Non-defaulted Defaulted
Impairmentrate
Stockof Provisions
Coverage Ratio -Default Stock
Impairmentrate
Stockof Provisions
Coverage
Ratio -DefaultStock
Impairmentrate
Stockof Provisions
Coverage
Ratio -DefaultStock
Impairment rateStockof
Provisions
Coverage
Ratio -DefaultStock
Impairmentrate
Stockof Provisions
Coverage
Ratio -DefaultStock
Impairmentrate
Stockof Provisions
Coverage
Ratio -DefaultStock
Central banksandcentral governments 0 0 0 0 0 0 0 0 0 0 0 0 0 0 0 0 0 0 - 0 - - 0 - - 0 - - 0 - - 0 - - 0 -Institutions 0 0 0 0 0 0 0 0 0 0 0 0 0 0 0 0 0 0 - 0 - - 0 - - 0 - - 0 - - 0 - - 0 -Corporates 0 0 0 0 0 0 0 0 0 0 0 0 0 0 0 0 0 0 - 0 - - 0 - - 0 - - 0 - - 0 - - 0 -
Corporates - OfWhich:SpecialisedLending 0 0 0 0 0 0 0 0 0 0 0 0 0 0 0 0 0 0 - 0 - - 0 - - 0 - - 0 - - 0 - - 0 -Corporates -OfWhich: SME 0 0 0 0 0 0 0 0 0 0 0 0 0 0 0 0 0 0 - 0 - - 0 - - 0 - - 0 - - 0 - - 0 -
Retail 0 0 0 0 0 0 0 0 0 0 0 0 0 0 0 0 0 0 - 0 - - 0 - - 0 - - 0 - - 0 - - 0 -Retail -Securedon real estateproperty 0.0% 0 0 0 0 0 0 0 0 0 0 0 0 0 0 0 0 0 0 - 0 - - 0 - - 0 - - 0 - - 0 - - 0 -
Retail -Securedon real estate property-Of hi h: E
0.0% 0 0 0 0 0 0 0 0 0 0 0 0 0 0 0 0 0 0 - 0 - - 0 - - 0 - - 0 - - 0 - - 0 -Retail -Securedon real estate property-Of
h i h: n n - E0.0% 0 0 0 0 0 0 0 0 0 0 0 0 0 0 0 0 0 0 - 0 - - 0 - - 0 - - 0 - - 0 - - 0 -
Retail -QualifyingRevolving 0 0 0 0 0 0 0 0 0 0 0 0 0 0 0 0 0 0 - 0 - - 0 - - 0 - - 0 - - 0 - - 0 -Retail -OtherRetail 0 0 0 0 0 0 0 0 0 0 0 0 0 0 0 0 0 0 - 0 - - 0 - - 0 - - 0 - - 0 - - 0 -
Retail -OtherRetail -OfWhich:SME 0 0 0 0 0 0 0 0 0 0 0 0 0 0 0 0 0 0 - 0 - - 0 - - 0 - - 0 - - 0 - - 0 -Retail -OtherRetail -OfWhich:non-SME 0 0 0 0 0 0 0 0 0 0 0 0 0 0 0 0 0 0 - 0 - - 0 - - 0 - - 0 - - 0 - - 0 -
Equity 0 0 0 0 0 0 0 0 0 0 0 0 0 0 0 0 0 0 - 0 - - 0 - - 0 - - 0 - - 0 - - 0 -Securitisation 0 0 0 0 0 0 0 0 0 0 0 0 0 0 0 0 0 0Othernon-credit obligation assets 0 0 0 0 0 0 0 0 0 0 0 0 0 0 0 0 0 0TOTAL 0 0 0 0 0 0 0 0 0 0 0 0 0 0 0 0 0 0 - 0 - - 0 - - 0 - - 0 - - 0 - - 0 -Securitisation andre-securitisations positions deductedfrom capital * 0 0 0 0 0 0 0 0 0 0 0 0
(*)Referstothepart ofSecuritizationexposurethat isdeductedfrom capital andisnot includedinRWA
(*)Referstothepart ofSecuritizationexposurethat isdeductedfrom capital andisnot includedinRWA
(*)Referstothepart ofSecuritizationexposurethat isdeductedfrom capital andisnot includedinRWA
0
0
LTV %(asof 31/12/2013)
Exposure values (as of 31/12/2013) Risk exposure amounts (as of 31/12/2013) Value adjustments and provisions (as of 31/12/2013) Baseline Scenario Adverse Scenario
F-IRB A-IRB STA F-IRB A-IRB STA F-IRB as of 31 /12 /2 01 4 as of 31/ 12 /2 01 5 as of 31 /12 /2 01 6 A-IRB STA as of 31 /1 2/ 20 14 as of 31/ 12 /2 01 5 as of 31 /12 /2 01 6
as of 31/12/2016 as of 31/12/2014 as of 31/12/2015 as of 31/12/2016
0
F-IRB A-IRB STA a so f3 1/ 12 /2 01 4 a so f 31 /1 2/ 20 15LTV %(asof 31/12/2013)
Exposure values (as of 31/12/2013) Risk exposure amounts (as of 31/12/2013) Value adjustments and provisions (as of 31/12/2013) Baseline Scenario Adverse Scenario
F-IRB A-IRB STA F-IRB A-IRB STA
http://www.economiaciudadana.org/
2014 EU-wide Stress TestCredit Risk
31 1 13) 31 1 13) 31 1 13)
(mln EU
R, %)Non-defaulted Defaulted Non-defaulted Defaulted Non-defaulted Defaulted Non-defaulted Defaulted Non-defaulted Defaulted Non-defaulted Defaulted Non-defaulted Defaulted Non-defaulted Defaulted Non-defaulted Defaulted
Impairmentrate
Stockof Provisions
Coverage Ratio -
Default Stock
Impairmentrate
Stockof Provisions
Coverage
Ratio -DefaultStock
Impairmentrate
Stockof Provisions
Coverage
Ratio -DefaultStock
Impairment rateStockof
Provisions
Coverage
Ratio -DefaultStock
Impairmentrate
Stockof Provisions
Coverage
Ratio -DefaultStock
Impairmentrate
Stockof Provisions
Coverage
Ratio -DefaultStock
Central banksandcentral governments 0 0 0 0 0 0 0 0 0 0 0 0 0 0 0 0 0 0 - 0 - - 0 - - 0 - - 0 - - 0 - - 0 -Institutions 0 0 0 0 0 0 0 0 0 0 0 0 0 0 0 0 0 0 - 0 - - 0 - - 0 - - 0 - - 0 - - 0 -Corporates 0 0 0 0 0 0 0 0 0 0 0 0 0 0 0 0 0 0 - 0 - - 0 - - 0 - - 0 - - 0 - - 0 -
Corporates - OfWhich:SpecialisedLending 0 0 0 0 0 0 0 0 0 0 0 0 0 0 0 0 0 0 - 0 - - 0 - - 0 - - 0 - - 0 - - 0 -Corporates -OfWhich: SME 0 0 0 0 0 0 0 0 0 0 0 0 0 0 0 0 0 0 - 0 - - 0 - - 0 - - 0 - - 0 - - 0 -
Retail 0 0 0 0 0 0 0 0 0 0 0 0 0 0 0 0 0 0 - 0 - - 0 - - 0 - - 0 - - 0 - - 0 -Retail -Securedon real estateproperty 0.0% 0 0 0 0 0 0 0 0 0 0 0 0 0 0 0 0 0 0 - 0 - - 0 - - 0 - - 0 - - 0 - - 0 -
Retail -Securedon real estate property-Of hi h: E
0.0% 0 0 0 0 0 0 0 0 0 0 0 0 0 0 0 0 0 0 - 0 - - 0 - - 0 - - 0 - - 0 - - 0 -Retail -Securedon real estate property-Of
h i h: n n - E0.0% 0 0 0 0 0 0 0 0 0 0 0 0 0 0 0 0 0 0 - 0 - - 0 - - 0 - - 0 - - 0 - - 0 -
Retail -QualifyingRevolving 0 0 0 0 0 0 0 0 0 0 0 0 0 0 0 0 0 0 - 0 - - 0 - - 0 - - 0 - - 0 - - 0 -Retail -OtherRetail 0 0 0 0 0 0 0 0 0 0 0 0 0 0 0 0 0 0 - 0 - - 0 - - 0 - - 0 - - 0 - - 0 -
Retail -OtherRetail -OfWhich:SME 0 0 0 0 0 0 0 0 0 0 0 0 0 0 0 0 0 0 - 0 - - 0 - - 0 - - 0 - - 0 - - 0 -Retail -OtherRetail -OfWhich:non-SME 0 0 0 0 0 0 0 0 0 0 0 0 0 0 0 0 0 0 - 0 - - 0 - - 0 - - 0 - - 0 - - 0 -
Equity 0 0 0 0 0 0 0 0 0 0 0 0 0 0 0 0 0 0 - 0 - - 0 - - 0 - - 0 - - 0 - - 0 -Securitisation 0 0 0 0 0 0 0 0 0 0 0 0 0 0 0 0 0 0Othernon-credit obligation assets 0 0 0 0 0 0 0 0 0 0 0 0 0 0 0 0 0 0TOTAL 0 0 0 0 0 0 0 0 0 0 0 0 0 0 0 0 0 0 - 0 - - 0 - - 0 - - 0 - - 0 - - 0 -Securitisation andre-securitisations positions deductedfrom capital * 0 0 0 0 0 0 0 0 0 0 0 0
(mln EUR, %)Non-defaulted Defaulted Non-defaulted Defaulted Non-defaulted Defaulted Non-defaulted Defaulted Non-defaulted Defaulted Non-defaulted Defaulted Non-defaulted Defaulted Non-defaulted Defaulted Non-defaulted Defaulted
Impairmentrate
Stockof Provisions
Coverage Ratio -Default Stock
Impairmentrate
Stockof Provisions
Coverage
Ratio -DefaultStock
Impairmentrate
Stockof Provisions
Coverage
Ratio -DefaultStock
Impairment rateStockof
Provisions
Coverage
Ratio -DefaultStock
Impairmentrate
Stockof Provisions
Coverage
Ratio -DefaultStock
Impairmentrate
Stockof Provisions
Coverage
Ratio -DefaultStock
Central banksandcentral governments 0 0 0 0 0 0 0 0 0 0 0 0 0 0 0 0 0 0 - 0 - - 0 - - 0 - - 0 - - 0 - - 0 -Institutions 0 0 0 0 0 0 0 0 0 0 0 0 0 0 0 0 0 0 - 0 - - 0 - - 0 - - 0 - - 0 - - 0 -Corporates 0 0 0 0 0 0 0 0 0 0 0 0 0 0 0 0 0 0 - 0 - - 0 - - 0 - - 0 - - 0 - - 0 -
Corporates - OfWhich:SpecialisedLending 0 0 0 0 0 0 0 0 0 0 0 0 0 0 0 0 0 0 - 0 - - 0 - - 0 - - 0 - - 0 - - 0 -Corporates -OfWhich: SME 0 0 0 0 0 0 0 0 0 0 0 0 0 0 0 0 0 0 - 0 - - 0 - - 0 - - 0 - - 0 - - 0 -
Retail 0 0 0 0 0 0 0 0 0 0 0 0 0 0 0 0 0 0 - 0 - - 0 - - 0 - - 0 - - 0 - - 0 -Retail -Securedon real estateproperty 0.0% 0 0 0 0 0 0 0 0 0 0 0 0 0 0 0 0 0 0 - 0 - - 0 - - 0 - - 0 - - 0 - - 0 -
Retail -Securedon real estate property-Of h i h : S E
0.0% 0 0 0 0 0 0 0 0 0 0 0 0 0 0 0 0 0 0 - 0 - - 0 - - 0 - - 0 - - 0 - - 0 -Retail -Securedon real estate property-Of
h i h: n n - E0.0% 0 0 0 0 0 0 0 0 0 0 0 0 0 0 0 0 0 0 - 0 - - 0 - - 0 - - 0 - - 0 - - 0 -
Retail -QualifyingRevolving 0 0 0 0 0 0 0 0 0 0 0 0 0 0 0 0 0 0 - 0 - - 0 - - 0 - - 0 - - 0 - - 0 -Retail -OtherRetail 0 0 0 0 0 0 0 0 0 0 0 0 0 0 0 0 0 0 - 0 - - 0 - - 0 - - 0 - - 0 - - 0 -
Retail -OtherRetail -OfWhich:SME 0 0 0 0 0 0 0 0 0 0 0 0 0 0 0 0 0 0 - 0 - - 0 - - 0 - - 0 - - 0 - - 0 -Retail -OtherRetail -OfWhich:non-SME 0 0 0 0 0 0 0 0 0 0 0 0 0 0 0 0 0 0 - 0 - - 0 - - 0 - - 0 - - 0 - - 0 -
Equity 0 0 0 0 0 0 0 0 0 0 0 0 0 0 0 0 0 0 - 0 - - 0 - - 0 - - 0 - - 0 - - 0 -Securitisation 0 0 0 0 0 0 0 0 0 0 0 0 0 0 0 0 0 0Othernon-credit obligation assets 0 0 0 0 0 0 0 0 0 0 0 0 0 0 0 0 0 0TOTAL 0 0 0 0 0 0 0 0 0 0 0 0 0 0 0 0 0 0 - 0 - - 0 - - 0 - - 0 - - 0 - - 0 -Securitisation andre-securitisations positions deductedfrom capital * 0 0 0 0 0 0 0 0 0 0 0 0
(mln EUR, %)Non-defaulted Defaulted Non-defaulted Defaulted Non-defaulted Defaulted Non-defaulted Defaulted Non-defaulted Defaulted Non-defaulted Defaulted Non-defaulted Defaulted Non-defaulted Defaulted Non-defaulted Defaulted Impairment
rateStockof
ProvisionsCoverage Ratio -
Default Stock
Impairmentrate
Stockof Provisions
CoverageRatio -Default
Stock
Impairmentrate
Stockof Provisions
CoverageRatio -Default
Stock
Impairment rateStockof
Provisions
CoverageRatio -Default
Stock
Impairmentrate
Stockof Provisions
CoverageRatio -Default
Stock
Impairmentrate
Stockof Provisions
CoverageRatio -Default
Stock
Central banksandcentral governments 0 0 0 0 0 0 0 0 0 0 0 0 0 0 0 0 0 0 - 0 - - 0 - - 0 - - 0 - - 0 - - 0 -Institutions 0 0 0 0 0 0 0 0 0 0 0 0 0 0 0 0 0 0 - 0 - - 0 - - 0 - - 0 - - 0 - - 0 -Corporates 0 0 0 0 0 0 0 0 0 0 0 0 0 0 0 0 0 0 - 0 - - 0 - - 0 - - 0 - - 0 - - 0 -
Corporates - OfWhich:SpecialisedLending 0 0 0 0 0 0 0 0 0 0 0 0 0 0 0 0 0 0 - 0 - - 0 - - 0 - - 0 - - 0 - - 0 -Corporates -OfWhich: SME 0 0 0 0 0 0 0 0 0 0 0 0 0 0 0 0 0 0 - 0 - - 0 - - 0 - - 0 - - 0 - - 0 -
Retail 0 0 0 0 0 0 0 0 0 0 0 0 0 0 0 0 0 0 - 0 - - 0 - - 0 - - 0 - - 0 - - 0 -Retail -Securedon real estateproperty 0.0% 0 0 0 0 0 0 0 0 0 0 0 0 0 0 0 0 0 0 - 0 - - 0 - - 0 - - 0 - - 0 - - 0 -
Retail -Securedon real estate property-Of hi h: E
0.0% 0 0 0 0 0 0 0 0 0 0 0 0 0 0 0 0 0 0 - 0 - - 0 - - 0 - - 0 - - 0 - - 0 -Retail -Securedon real estate property-Of
h i h: n n - E0.0% 0 0 0 0 0 0 0 0 0 0 0 0 0 0 0 0 0 0 - 0 - - 0 - - 0 - - 0 - - 0 - - 0 -
Retail -QualifyingRevolving 0 0 0 0 0 0 0 0 0 0 0 0 0 0 0 0 0 0 - 0 - - 0 - - 0 - - 0 - - 0 - - 0 -Retail -OtherRetail 0 0 0 0 0 0 0 0 0 0 0 0 0 0 0 0 0 0 - 0 - - 0 - - 0 - - 0 - - 0 - - 0 -
Retail -OtherRetail -OfWhich:SME 0 0 0 0 0 0 0 0 0 0 0 0 0 0 0 0 0 0 - 0 - - 0 - - 0 - - 0 - - 0 - - 0 -Retail -OtherRetail -OfWhich:non-SME 0 0 0 0 0 0 0 0 0 0 0 0 0 0 0 0 0 0 - 0 - - 0 - - 0 - - 0 - - 0 - - 0 -
Equity 0 0 0 0 0 0 0 0 0 0 0 0 0 0 0 0 0 0 - 0 - - 0 - - 0 - - 0 - - 0 - - 0 -Securitisation 0 0 0 0 0 0 0 0 0 0 0 0 0 0 0 0 0 0Othernon-credit obligation assets 0 0 0 0 0 0 0 0 0 0 0 0 0 0 0 0 0 0TOTAL 0 0 0 0 0 0 0 0 0 0 0 0 0 0 0 0 0 0 - 0 - - 0 - - 0 - - 0 - - 0 - - 0 -Securitisation andre-securitisations positions deductedfrom capital * 0 0 0 0 0 0 0 0 0 0 0 0
(mln EUR, %)Non-defaulted Defaulted Non-defaulted Defaulted Non-defaulted Defaulted Non-defaulted Defaulted Non-defaulted Defaulted Non-defaulted Defaulted Non-defaulted Defaulted Non-defaulted Defaulted Non-defaulted Defaulted Impairment
rateStockof
ProvisionsCoverage Ratio -
Default Stock
Impairmentrate
Stockof Provisions
CoverageRatio -Default
Stock
Impairmentrate
Stockof Provisions
CoverageRatio -Default
Stock
Impairment rateStockof
Provisions
CoverageRatio -Default
Stock
Impairmentrate
Stockof Provisions
CoverageRatio -Default
Stock
Impairmentrate
Stockof Provisions
CoverageRatio -Default
Stock
Central banksandcentral governments 0 0 0 0 0 0 0 0 0 0 0 0 0 0 0 0 0 0 - 0 - - 0 - - 0 - - 0 - - 0 - - 0 -Institutions 0 0 0 0 0 0 0 0 0 0 0 0 0 0 0 0 0 0 - 0 - - 0 - - 0 - - 0 - - 0 - - 0 -Corporates 0 0 0 0 0 0 0 0 0 0 0 0 0 0 0 0 0 0 - 0 - - 0 - - 0 - - 0 - - 0 - - 0 -
Corporates - OfWhich:SpecialisedLending 0 0 0 0 0 0 0 0 0 0 0 0 0 0 0 0 0 0 - 0 - - 0 - - 0 - - 0 - - 0 - - 0 -C OfWhi h SME
(*)Referstothepart ofSecuritizationexposurethat isdeductedfrom capital andisnot includedinRWA
(*)Referstothepart ofSecuritizationexposurethat isdeductedfrom capital andisnot includedinRWA
(*)Referstothepart ofSecuritizationexposurethat isdeductedfrom capital andisnot includedinRWA
0
0
0
Valueadjustmentsandprovisions(asof 31/12/2013) BaselineScenario
LTV %(asof 31/12/2013)
E xp os ur ev al ue s( as of 3 1/ 12 /2 01 3) R is k e xp os ur e am ou nt s (a so f3 1/ 12 /2 01 3) V al ue ad ju st me nt s an dp ro vi si on s( as of 3 1/ 12 /2 01 3)
AdverseScenario
F-IRB A-IRB STA F-IRB A-IRB STA F-IRB A-IRB STA as of 31/12/2014 as of 31/12/2015 as of 31/12/2016 as of 31/12/2014 as of 31/12/2015 as of 31/12/2016LTV %(asof 31/12/2013)
E xp os ur ev al ue s( as of 3 1/ 12 /2 01 3) R is k ex po su re am ou nt s (a so f3 1/ 12 /2 01 3)
Baseline Scenario Adverse Scenario
F-IRB A-IRB STA F-IRB A-IRB STA F-IRB A-IRB STA as of 31/12/2014 as of 31/12/2015 as of 31/12/2016 as of 31/12/2014 as of 31/12/2015 as of 31/12/2016
LTV %(asof 31/12/2013)
Exposure values (as of 31/12/2013) Risk exposure amounts (as of 31/12/2013) Value adjustments and provisions (as of 31/12/2013) Baseline Scenario Adverse ScenarioF-IRB A-IRB STA F-IRB A-IRB STA F-IRB A-IRB a so f 31 /1 2/ 20 15 a so f3 1/ 12 /2 01 6STA as of 31/12/2014 as of 31/12/2015 as of 31/12/2016 as of 31/12/2014
LTV %(asof 31/12/2013)
Exposure values (as of 31/12/2013) Risk exposure amounts (as of 31/12/2013) Value adjustments and provisions (as of 31/12/2013) Baseline Scenario Adverse ScenarioF-IRB A-IRB STA F-IRB A-IRB STA F-IRB as of 31 /12 /2 01 4 as of 31/ 12 /2 01 5 as of 31 /12 /2 01 6 A-IRB STA as of 31 /1 2/ 20 14 as of 31/ 12 /2 01 5 as of 31 /12 /2 01 6
8/10/2019 Test Stress Banca Española 2014
http://slidepdf.com/reader/full/test-stress-banca-espanola-2014 212/240
Corporates -OfWhich: SME 0 0 0 0 0 0 0 0 0 0 0 0 0 0 0 0 0 0 - 0 - - 0 - - 0 - - 0 - - 0 - - 0 -Retail 0 0 0 0 0 0 0 0 0 0 0 0 0 0 0 0 0 0 - 0 - - 0 - - 0 - - 0 - - 0 - - 0 -
Retail -Securedon real estateproperty 0.0% 0 0 0 0 0 0 0 0 0 0 0 0 0 0 0 0 0 0 - 0 - - 0 - - 0 - - 0 - - 0 - - 0 -Retail -Securedon real estate property-Of
h i h : S E0.0% 0 0 0 0 0 0 0 0 0 0 0 0 0 0 0 0 0 0 - 0 - - 0 - - 0 - - 0 - - 0 - - 0 -
Retail -Securedon real estate property-Of h i h: n n - E
0.0% 0 0 0 0 0 0 0 0 0 0 0 0 0 0 0 0 0 0 - 0 - - 0 - - 0 - - 0 - - 0 - - 0 -Retail -QualifyingRevolving 0 0 0 0 0 0 0 0 0 0 0 0 0 0 0 0 0 0 - 0 - - 0 - - 0 - - 0 - - 0 - - 0 -Retail -OtherRetail 0 0 0 0 0 0 0 0 0 0 0 0 0 0 0 0 0 0 - 0 - - 0 - - 0 - - 0 - - 0 - - 0 -
Retail -OtherRetail -OfWhich:SME 0 0 0 0 0 0 0 0 0 0 0 0 0 0 0 0 0 0 - 0 - - 0 - - 0 - - 0 - - 0 - - 0 -Retail -OtherRetail -OfWhich:non-SME 0 0 0 0 0 0 0 0 0 0 0 0 0 0 0 0 0 0 - 0 - - 0 - - 0 - - 0 - - 0 - - 0 -
Equity 0 0 0 0 0 0 0 0 0 0 0 0 0 0 0 0 0 0 - 0 - - 0 - - 0 - - 0 - - 0 - - 0 -Securitisation 0 0 0 0 0 0 0 0 0 0 0 0 0 0 0 0 0 0Othernon-credit obligation assets 0 0 0 0 0 0 0 0 0 0 0 0 0 0 0 0 0 0TOTAL 0 0 0 0 0 0 0 0 0 0 0 0 0 0 0 0 0 0 - 0 - - 0 - - 0 - - 0 - - 0 - - 0 -Securitisation andre-securitisations positions deductedfrom capital * 0 0 0 0 0 0 0 0 0 0 0 0
(mln EUR, %)Non-defaulted Defaulted Non-defaulted Defaulted Non-defaulted Defaulted Non-defaulted Defaulted Non-defaulted Defaulted Non-defaulted Defaulted Non-defaulted Defaulted Non-defaulted Defaulted Non-defaulted Defaulted Impairment
rateStockof
ProvisionsCoverage Ratio -
Default Stock
Impairmentrate
Stockof Provisions
CoverageRatio -Default
Stock
Impairmentrate
Stockof Provisions
CoverageRatio -Default
Stock
Impairment rateStockof
Provisions
CoverageRatio -Default
Stock
Impairmentrate
Stockof Provisions
CoverageRatio -Default
Stock
Impairmentrate
Stockof Provisions
CoverageRatio -Default
Stock
Central banksandcentral governments 0 0 0 0 0 0 0 0 0 0 0 0 0 0 0 0 0 0 - 0 - - 0 - - 0 - - 0 - - 0 - - 0 -Institutions 0 0 0 0 0 0 0 0 0 0 0 0 0 0 0 0 0 0 - 0 - - 0 - - 0 - - 0 - - 0 - - 0 -Corporates 0 0 0 0 0 0 0 0 0 0 0 0 0 0 0 0 0 0 - 0 - - 0 - - 0 - - 0 - - 0 - - 0 -
Corporates - OfWhich:SpecialisedLending 0 0 0 0 0 0 0 0 0 0 0 0 0 0 0 0 0 0 - 0 - - 0 - - 0 - - 0 - - 0 - - 0 -Corporates -OfWhich: SME 0 0 0 0 0 0 0 0 0 0 0 0 0 0 0 0 0 0 - 0 - - 0 - - 0 - - 0 - - 0 - - 0 -
Retail 0 0 0 0 0 0 0 0 0 0 0 0 0 0 0 0 0 0 - 0 - - 0 - - 0 - - 0 - - 0 - - 0 -Retail -Securedon real estateproperty 0.0% 0 0 0 0 0 0 0 0 0 0 0 0 0 0 0 0 0 0 - 0 - - 0 - - 0 - - 0 - - 0 - - 0 -
Retail -Securedon real estate property-Of hi h: E
0.0% 0 0 0 0 0 0 0 0 0 0 0 0 0 0 0 0 0 0 - 0 - - 0 - - 0 - - 0 - - 0 - - 0 -Retail -Securedon real estate property-Of
h i h : n n -S E0.0% 0 0 0 0 0 0 0 0 0 0 0 0 0 0 0 0 0 0 - 0 - - 0 - - 0 - - 0 - - 0 - - 0 -
Retail -QualifyingRevolving 0 0 0 0 0 0 0 0 0 0 0 0 0 0 0 0 0 0 - 0 - - 0 - - 0 - - 0 - - 0 - - 0 -Retail -OtherRetail 0 0 0 0 0 0 0 0 0 0 0 0 0 0 0 0 0 0 - 0 - - 0 - - 0 - - 0 - - 0 - - 0 -
Retail -OtherRetail -OfWhich:SME 0 0 0 0 0 0 0 0 0 0 0 0 0 0 0 0 0 0 - 0 - - 0 - - 0 - - 0 - - 0 - - 0 -Retail -OtherRetail -OfWhich:non-SME 0 0 0 0 0 0 0 0 0 0 0 0 0 0 0 0 0 0 - 0 - - 0 - - 0 - - 0 - - 0 - - 0 -
Equity 0 0 0 0 0 0 0 0 0 0 0 0 0 0 0 0 0 0 - 0 - - 0 - - 0 - - 0 - - 0 - - 0 -Securitisation 0 0 0 0 0 0 0 0 0 0 0 0 0 0 0 0 0 0Othernon-credit obligation assets 0 0 0 0 0 0 0 0 0 0 0 0 0 0 0 0 0 0TOTAL 0 0 0 0 0 0 0 0 0 0 0 0 0 0 0 0 0 0 - 0 - - 0 - - 0 - - 0 - - 0 - - 0 -Securitisation andre-securitisations positions deductedfrom capital * 0 0 0 0 0 0 0 0 0 0 0 0
(*)Referstothepart ofSecuritizationexposurethat isdeductedfrom capital andisnot includedinRWA
(*)Referstothepart ofSecuritizationexposurethat isdeductedfrom capital andisnot includedinRWA
0
0
LTV %(asof 31/12/2013)
Exposure values (as of 31/12/2013) Risk exposure amounts (as of 31/12/2013) Value adjustments and provisions (as of 31/12/2013) Baseline Scenario Adverse ScenarioF-IRB A-IRB STA F-IRB A-IRB STA as of 31/12/2016 as of 31/12/2014 as of 31/12/2015 as of 31/12/2016F-IRB A-IRB STA a so f3 1/ 12 /2 01 4 a so f 31 /1 2/ 20 15
http://www.economiaciudadana.org/
2014 EU-wide Stress Test P&L
(mln EUR) 31/12/2014 31/12/2015 31/12/2016 31/12/2014 31/12/2015 31/12/2016
Net interest income 988 722 790 805 651 722 773
Net trading income 0 0 1 -3 -1 0
of which trading losses from stress scenarios -2 -1 -1 -4 -2 -2
Other operating income 301 85 85 85 -7 -7 -7
Operating profit before impairments 840 411 503 502 226 322 357
Impairment of financial assets (-) -860 -184 -170 -170 -401 -426 -499
Impairment of financial assets other than instruments designated at fair value
through P&L (-)-863 -184 -170 -170 -401 -426 -499
Impairment Financial assets designated at fair value through P&L (-) 3 0 0 0 0 0 0
Impairment on non financial assets (-) -42 0 0 0 -50 -35 -27
Operating profit after impairments from stress scenarios -61 227 333 332 -226 -140 -168
Other Income and expenses -77 46 45 42 36 29 20
Pre-Tax profit -138 272 378 373 -190 -111 -148
Tax 64 -82 -113 -112 57 33 45
Net income -75 191 265 261 -133 -78 -104
Attributable to owners of the parent -75 178 235 228 -133 -77 -103
of which carried over to capital through retained earnings 75 159 214 204 133 77 103
31/12/2013
Baseline Scenario Adverse Scenario

8/10/2019 Test Stress Banca Española 2014
http://slidepdf.com/reader/full/test-stress-banca-espanola-2014 213/240
of which carried over to capital through retained earnings -75 159 214 204 -133 -77 -103
of which distributed as dividends 0 18 21 24 0 0 0
In the figures above, the original (official published) 2013 P&L figures may have been adjusted as part of the ECB Comprehensive Assessment join-up calculation.
http://www.economiaciudadana.org/
2014 EU-wide Stress Test
RWA
(mln EUR)as of 31/12/2013 as of 31/12/2014 as of 31/12/2015 as of 31/12/2016 as of 31/12/2014 as of 31/12/2015 as of 31/12/2016
Risk exposure amount for credit risk 30,093 30,284 30,240 29,965 30,460 30,498 30,388
Risk exposure amount Securitisation and re-securitisations 1,231 1,325 1,381 1,418 1,518 1,691 1,806
Risk exposure amount Other credit risk 28,862 28,960 28,860 28,547 28,942 28,807 28,582
Risk exposure amount for market risk 118 118 118 118 118 118 118
Risk exposure amount for operational risk 3,110 3,110 3,113 3,110 3,110 3,112 3,111
Transitional floors for Risk exposure amount 0 0 0 0 0 0 0
AQR adjustments (for SSM countries only) 30 30 30 30 30 30 30
Total Risk exposure amount 33,351 33,543 33,501 33,224 33,718 33,758 33,647
Baseline Scenario Adverse Scenario

8/10/2019 Test Stress Banca Española 2014
http://slidepdf.com/reader/full/test-stress-banca-espanola-2014 214/240
http://www.economiaciudadana.org/
(mln EUR) as of 31/12/2013 31/12/2014 31/12/2015 31/12/2016 31/12/2014 31/12/2015 31/12/2016
Banking Book 3,713
Trading Book (excl. correlation trading positions under CRM) 21
Correlation Trading Portfolio (CRM) 0
Total 3,734
Banking Book 1,221 1,313 1,368 1,405 1,504 1,673 1,787
Trading Book (excl. correlation trading positions under CRM) 10 12 12 13 15 17 19
Total 1,231 1,325 1,381 1,418 1,518 1,691 1,806
Hold to Maturity porfolio 0 5 8 11 30 48 69
Available for Sale porfolio 22 22 22 22 22 22 22
Held for trading portfolio
Total 22 27 30 33 52 69 91
2014 EU-wide Stress Test
Impairments
Baseline scenario Adverse scenario
Exposure values
Risk exposure values
Securitisation

8/10/2019 Test Stress Banca Española 2014
http://slidepdf.com/reader/full/test-stress-banca-espanola-2014 215/240
http://www.economiaciudadana.org/
2014 EU-wide Stress Test - Sovereign Exposure
(mln EUR)
[ 0 - 3M [ 0 0 0 0 0 0 0 0 0 0 0 0 0 0[ 3M - 1Y [ 0 0 0 0 0 0 0 0 0 0 0 0 0 0[ 1Y - 2Y [ 0 0 0 0 0 0 0 0 0 0 0 0 0 0[ 2Y - 3Y [ 0 0 0 0 0 0 0 0 0 0 0 0 0 0[3Y - 5Y [ 0 0 0 0 0 0 0 0 0 0 0 0 0 0
[5Y - 10Y [ 0 0 0 0 0 0 0 0 0 0 0 0 0 0[10Y - more 0 0 0 0 0 0 0 0 0 0 0 0 0 0
Tot 0 0 0 0 0 0 0 0 0 0 0 0 0 0[ 0 - 3M [ 0 0 0 0 0 0 0 0 0 0 0 0 0 0
[ 3M - 1Y [ 0 0 0 0 0 0 0 0 0 0 0 0 0 0[ 1Y - 2Y [ 0 0 0 0 0 0 0 0 0 0 0 0 0 0[ 2Y - 3Y [ 0 0 0 0 0 0 0 0 0 0 0 0 0 0[3Y - 5Y [ 0 0 0 0 0 0 0 0 0 0 0 0 0 0
[5Y - 10Y [ 0 0 0 0 0 0 0 0 0 0 0 0 0 0[10Y - more 0 0 0 0 0 0 0 0 0 0 0 0 0 0
Tot 0 0 0 0 0 0 0 0 0 0 0 0 0 0[ 0 - 3M [ 0 0 0 0 0 0 0 0 0 0 0 0 0 0
[ 3M - 1Y [ 0 0 0 0 0 0 0 0 0 0 0 0 0 0
Austria
Belgium
Bulgaria
Notional valueFair-value at
31/12/2013 (+)Notional value
Fair-value at31/12/2013 (-)
Notional valueFair-value at
31/12/2013 (+)Notional value
Fair-value at 31/12/2013(-)
Derivatives with positive fair valueat 31/12/2013
Derivatives with negative fairvalue at 31/12/2013
VALUES AS OF 31/12/2013 VALUES AS OF 31/12/2013 VALUES AS OF 31/12/2013
INDIRECT SOVEREIGN EXPOSURES (3) (on and off balance sheet)
Residual Maturity Country / Region
GROSS DIRECT LONG
EXPOSURES (accounting value grossof provisions)
(1)
NET DIRECT POSITIONS (gross exposures (long) net of cash short
positions of sovereign debt to other counterpaties only where thereis a maturity matching)
(1)
DIRECT SOVEREIGN EXPOSURES IN DERIVATIVES (1)
of which: loansand advances
of which: AFSbanking book
of which: FVO
(designated at fairvalue throughprofit&loss)
banking book
of which: Financial
assets held fortrading
(2)
Derivatives with positive fair value at31/12/2013
Derivatives with negative fair value at31/12/2013
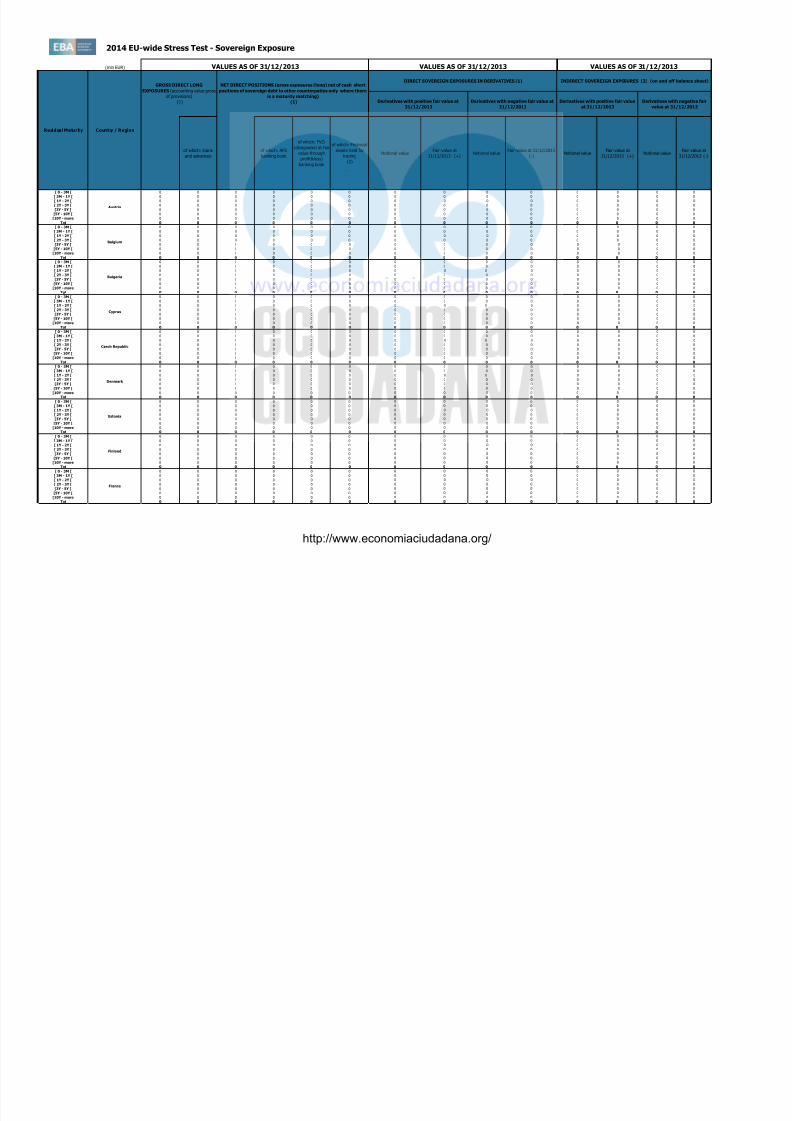
8/10/2019 Test Stress Banca Española 2014
http://slidepdf.com/reader/full/test-stress-banca-espanola-2014 216/240
[ 3M - 1Y [ 0 0 0 0 0 0 0 0 0 0 0 0 0 0[ 1Y - 2Y [ 0 0 0 0 0 0 0 0 0 0 0 0 0 0[ 2Y - 3Y [ 0 0 0 0 0 0 0 0 0 0 0 0 0 0[3Y - 5Y [ 0 0 0 0 0 0 0 0 0 0 0 0 0 0
[5Y - 10Y [ 0 0 0 0 0 0 0 0 0 0 0 0 0 0[10Y - more 0 0 0 0 0 0 0 0 0 0 0 0 0 0
Tot 0 0 0 0 0 0 0 0 0 0 0 0 0 0[ 0 - 3M [ 0 0 0 0 0 0 0 0 0 0 0 0 0 0
[ 3M - 1Y [ 0 0 0 0 0 0 0 0 0 0 0 0 0 0[ 1Y - 2Y [ 0 0 0 0 0 0 0 0 0 0 0 0 0 0[ 2Y - 3Y [ 0 0 0 0 0 0 0 0 0 0 0 0 0 0
[3Y - 5Y [ 0 0 0 0 0 0 0 0 0 0 0 0 0 0[5Y - 10Y [ 0 0 0 0 0 0 0 0 0 0 0 0 0 0[10Y - more 0 0 0 0 0 0 0 0 0 0 0 0 0 0
Tot 0 0 0 0 0 0 0 0 0 0 0 0 0 0[ 0 - 3M [ 0 0 0 0 0 0 0 0 0 0 0 0 0 0
[ 3M - 1Y [ 0 0 0 0 0 0 0 0 0 0 0 0 0 0[ 1Y - 2Y [ 0 0 0 0 0 0 0 0 0 0 0 0 0 0[ 2Y - 3Y [ 0 0 0 0 0 0 0 0 0 0 0 0 0 0[3Y - 5Y [ 0 0 0 0 0 0 0 0 0 0 0 0 0 0
[5Y - 10Y [ 0 0 0 0 0 0 0 0 0 0 0 0 0 0[10Y - more 0 0 0 0 0 0 0 0 0 0 0 0 0 0
Tot 0 0 0 0 0 0 0 0 0 0 0 0 0 0[ 0 - 3M [ 0 0 0 0 0 0 0 0 0 0 0 0 0 0
[ 3M - 1Y [ 0 0 0 0 0 0 0 0 0 0 0 0 0 0[ 1Y - 2Y [ 0 0 0 0 0 0 0 0 0 0 0 0 0 0[ 2Y - 3Y [ 0 0 0 0 0 0 0 0 0 0 0 0 0 0
[3Y - 5Y [ 0 0 0 0 0 0 0 0 0 0 0 0 0 0[5Y - 10Y [ 0 0 0 0 0 0 0 0 0 0 0 0 0 0
[10Y - more 0 0 0 0 0 0 0 0 0 0 0 0 0 0Tot 0 0 0 0 0 0 0 0 0 0 0 0 0 0
Czech Republic
Denmark
Estonia
Finland
France
Cyprus
http://www.economiaciudadana.org/
2014 EU-wide Stress Test - Sovereign Exposure
(mln EUR)
Notional valueFair-value at
31/12/2013 (+)Notional value
Fair-value at31/12/2013 (-)
Notional valueFair-value at
31/12/2013 (+)Notional value
Fair-value at 31/12/2013(-)
Derivatives with positive fair valueat 31/12/2013
Derivatives with negative fairvalue at 31/12/2013
VALUES AS OF 31/12/2013 VALUES AS OF 31/12/2013 VALUES AS OF 31/12/2013
INDIRECT SOVEREIGN EXPOSURES (3) (on and off balance sheet)
Residual Maturity Country / Region
GROSS DIRECT LONG
EXPOSURES (accounting value grossof provisions)
(1)
NET DIRECT POSITIONS (gross exposures (long) net of cash short
positions of sovereign debt to other counterpaties only where thereis a maturity matching)
(1)
DIRECT SOVEREIGN EXPOSURES IN DERIVATIVES (1)
of which: loansand advances
of which: AFSbanking book
of which: FVO
(designated at fairvalue throughprofit&loss)
banking book
of which: Financial
assets held fortrading
(2)
Derivatives with positive fair value at31/12/2013
Derivatives with negative fair value at31/12/2013
[ 0 - 3M [ 0 0 0 0 0 0 0 0 0 0 0 0 0 0[ 3M - 1Y [ 0 0 0 0 0 0 0 0 0 0 0 0 0 0[ 1Y - 2Y [ 0 0 0 0 0 0 0 0 0 0 0 0 0 0[ 2Y - 3Y [ 0 0 0 0 0 0 0 0 0 0 0 0 0 0[3Y - 5Y [ 0 0 0 0 0 0 0 0 0 0 0 0 0 0
[5Y - 10Y [ 0 0 0 0 0 0 0 0 0 0 0 0 0 0[10Y - more 0 0 0 0 0 0 0 0 0 0 0 0 0 0
Tot 0 0 0 0 0 0 0 0 0 0 0 0 0 0[ 0 - 3M [ 0 0 0 0 0 0 0 0 0 0 0 0 0 0
[ 3M - 1Y [ 0 0 0 0 0 0 0 0 0 0 0 0 0 0[ 1Y - 2Y [ 0 0 0 0 0 0 0 0 0 0 0 0 0 0[ 2Y - 3Y [ 0 0 0 0 0 0 0 0 0 0 0 0 0 0[3Y - 5Y [ 0 0 0 0 0 0 0 0 0 0 0 0 0 0
[5Y - 10Y [ 0 0 0 0 0 0 0 0 0 0 0 0 0 0[10Y - more 0 0 0 0 0 0 0 0 0 0 0 0 0 0
Tot 0 0 0 0 0 0 0 0 0 0 0 0 0 0[ 0 - 3M [ 0 0 0 0 0 0 0 0 0 0 0 0 0 0
[ 3M - 1Y [ 0 0 0 0 0 0 0 0 0 0 0 0 0 0[ 1Y - 2Y [ 0 0 0 0 0 0 0 0 0 0 0 0 0 0[ 2Y - 3Y [ 0 0 0 0 0 0 0 0 0 0 0 0 0 0[3Y - 5Y [ 0 0 0 0 0 0 0 0 0 0 0 0 0 0
[5Y - 10Y [ 0 0 0 0 0 0 0 0 0 0 0 0 0 0[10Y - more 0 0 0 0 0 0 0 0 0 0 0 0 0 0
Tot 0 0 0 0 0 0 0 0 0 0 0 0 0 0[ 0 - 3M [ 0 0 0 0 0 0 0 0 0 0 0 0 0 0
[ 3M - 1Y [ 0 0 0 0 0 0 0 0 0 0 0 0 0 0
Germany
Greece
Croatia

8/10/2019 Test Stress Banca Española 2014
http://slidepdf.com/reader/full/test-stress-banca-espanola-2014 217/240
[ 3M 1Y [ 0 0 0 0 0 0 0 0 0 0 0 0 0 0[ 1Y - 2Y [ 0 0 0 0 0 0 0 0 0 0 0 0 0 0[ 2Y - 3Y [ 0 0 0 0 0 0 0 0 0 0 0 0 0 0[3Y - 5Y [ 0 0 0 0 0 0 0 0 0 0 0 0 0 0
[5Y - 10Y [ 0 0 0 0 0 0 0 0 0 0 0 0 0 0[10Y - more 0 0 0 0 0 0 0 0 0 0 0 0 0 0
Tot 0 0 0 0 0 0 0 0 0 0 0 0 0 0[ 0 - 3M [ 0 0 0 0 0 0 0 0 0 0 0 0 0 0
[ 3M - 1Y [ 0 0 0 0 0 0 0 0 0 0 0 0 0 0[ 1Y - 2Y [ 0 0 0 0 0 0 0 0 0 0 0 0 0 0[ 2Y - 3Y [ 0 0 0 0 0 0 0 0 0 0 0 0 0 0
[3Y - 5Y [ 0 0 0 0 0 0 0 0 0 0 0 0 0 0[5Y - 10Y [ 0 0 0 0 0 0 0 0 0 0 0 0 0 0[10Y - more 0 0 0 0 0 0 0 0 0 0 0 0 0 0
Tot 0 0 0 0 0 0 0 0 0 0 0 0 0 0[ 0 - 3M [ 0 0 0 0 0 0 0 0 0 0 0 0 0 0
[ 3M - 1Y [ 0 0 0 0 0 0 0 0 0 0 0 0 0 0[ 1Y - 2Y [ 0 0 0 0 0 0 0 0 0 0 0 0 0 0[ 2Y - 3Y [ 0 0 0 0 0 0 0 0 0 0 0 0 0 0[3Y - 5Y [ 0 0 0 0 0 0 0 0 0 0 0 0 0 0
[5Y - 10Y [ 0 0 0 0 0 0 0 0 0 0 0 0 0 0[10Y - more 0 0 0 0 0 0 0 0 0 0 0 0 0 0
Tot 0 0 0 0 0 0 0 0 0 0 0 0 0 0[ 0 - 3M [ 0 0 0 0 0 0 0 0 0 0 0 0 0 0
[ 3M - 1Y [ 0 0 0 0 0 0 0 0 0 0 0 0 0 0[ 1Y - 2Y [ 322 0 322 322 0 0 0 0 0 0 0 0 0 0[ 2Y - 3Y [ 0 0 0 0 0 0 0 0 0 0 0 0 0 0[3Y - 5Y [ 0 0 0 0 0 0 0 0 0 0 0 0 0 0
[5Y - 10Y [ 0 0 0 0 0 0 0 0 0 0 0 0 0 0[10Y - more 0 0 0 0 0 0 0 0 0 0 0 0 0 0
Tot 322 0 322 322 0 0 0 0 0 0 0 0 0 0[ 0 - 3M [ 0 0 0 0 0 0 0 0 0 0 0 0 0 0
[ 3M - 1Y [ 0 0 0 0 0 0 0 0 0 0 0 0 0 0[ 1Y - 2Y [ 0 0 0 0 0 0 0 0 0 0 0 0 0 0[ 2Y - 3Y [ 0 0 0 0 0 0 0 0 0 0 0 0 0 0[3Y - 5Y [ 0 0 0 0 0 0 0 0 0 0 0 0 0 0
[5Y - 10Y [ 0 0 0 0 0 0 0 0 0 0 0 0 0 0[10Y - more 0 0 0 0 0 0 0 0 0 0 0 0 0 0
Tot 0 0 0 0 0 0 0 0 0 0 0 0 0 0[ 0 - 3M [ 0 0 0 0 0 0 0 0 0 0 0 0 0 0
[ 3M - 1Y [ 0 0 0 0 0 0 0 0 0 0 0 0 0 0[ 1Y - 2Y [ 0 0 0 0 0 0 0 0 0 0 0 0 0 0[ 2Y - 3Y [ 0 0 0 0 0 0 0 0 0 0 0 0 0 0
[3Y - 5Y [ 0 0 0 0 0 0 0 0 0 0 0 0 0 0[5Y - 10Y [ 0 0 0 0 0 0 0 0 0 0 0 0 0 0
[10Y - more 0 0 0 0 0 0 0 0 0 0 0 0 0 0Tot 0 0 0 0 0 0 0 0 0 0 0 0 0 0
Liechtenstein
Latvia
Hungary
Iceland
Ireland
Italy
http://www.economiaciudadana.org/
2014 EU-wide Stress Test - Sovereign Exposure
(mln EUR)
Notional valueFair-value at
31/12/2013 (+)Notional value
Fair-value at31/12/2013 (-)
Notional valueFair-value at
31/12/2013 (+)Notional value
Fair-value at 31/12/2013(-)
Derivatives with positive fair valueat 31/12/2013
Derivatives with negative fairvalue at 31/12/2013
VALUES AS OF 31/12/2013 VALUES AS OF 31/12/2013 VALUES AS OF 31/12/2013
INDIRECT SOVEREIGN EXPOSURES (3) (on and off balance sheet)
Residual Maturity Country / Region
GROSS DIRECT LONG
EXPOSURES (accounting value grossof provisions)
(1)
NET DIRECT POSITIONS (gross exposures (long) net of cash short
positions of sovereign debt to other counterpaties only where thereis a maturity matching)
(1)
DIRECT SOVEREIGN EXPOSURES IN DERIVATIVES (1)
of which: loansand advances
of which: AFSbanking book
of which: FVO
(designated at fairvalue throughprofit&loss)
banking book
of which: Financial
assets held fortrading
(2)
Derivatives with positive fair value at31/12/2013
Derivatives with negative fair value at31/12/2013
[ 0 - 3M [ 0 0 0 0 0 0 0 0 0 0 0 0 0 0[ 3M - 1Y [ 0 0 0 0 0 0 0 0 0 0 0 0 0 0[ 1Y - 2Y [ 0 0 0 0 0 0 0 0 0 0 0 0 0 0[ 2Y - 3Y [ 0 0 0 0 0 0 0 0 0 0 0 0 0 0[3Y - 5Y [ 0 0 0 0 0 0 0 0 0 0 0 0 0 0
[5Y - 10Y [ 0 0 0 0 0 0 0 0 0 0 0 0 0 0[10Y - more 0 0 0 0 0 0 0 0 0 0 0 0 0 0
Tot 0 0 0 0 0 0 0 0 0 0 0 0 0 0[ 0 - 3M [ 0 0 0 0 0 0 0 0 0 0 0 0 0 0
[ 3M - 1Y [ 0 0 0 0 0 0 0 0 0 0 0 0 0 0[ 1Y - 2Y [ 0 0 0 0 0 0 0 0 0 0 0 0 0 0[ 2Y - 3Y [ 0 0 0 0 0 0 0 0 0 0 0 0 0 0[3Y - 5Y [ 0 0 0 0 0 0 0 0 0 0 0 0 0 0
[5Y - 10Y [ 0 0 0 0 0 0 0 0 0 0 0 0 0 0[10Y - more 0 0 0 0 0 0 0 0 0 0 0 0 0 0
Tot 0 0 0 0 0 0 0 0 0 0 0 0 0 0[ 0 - 3M [ 0 0 0 0 0 0 0 0 0 0 0 0 0 0
[ 3M - 1Y [ 0 0 0 0 0 0 0 0 0 0 0 0 0 0[ 1Y - 2Y [ 0 0 0 0 0 0 0 0 0 0 0 0 0 0[ 2Y - 3Y [ 0 0 0 0 0 0 0 0 0 0 0 0 0 0[3Y - 5Y [ 0 0 0 0 0 0 0 0 0 0 0 0 0 0
[5Y - 10Y [ 0 0 0 0 0 0 0 0 0 0 0 0 0 0[10Y - more 0 0 0 0 0 0 0 0 0 0 0 0 0 0
Tot 0 0 0 0 0 0 0 0 0 0 0 0 0 0[ 0 - 3M [ 0 0 0 0 0 0 0 0 0 0 0 0 0 0
[ 3M - 1Y [ 0 0 0 0 0 0 0 0 0 0 0 0 0 0
Lithuania
Luxembourg
Malta

8/10/2019 Test Stress Banca Española 2014
http://slidepdf.com/reader/full/test-stress-banca-espanola-2014 218/240
[ 1Y - 2Y [ 0 0 0 0 0 0 0 0 0 0 0 0 0 0[ 2Y - 3Y [ 0 0 0 0 0 0 0 0 0 0 0 0 0 0[3Y - 5Y [ 0 0 0 0 0 0 0 0 0 0 0 0 0 0
[5Y - 10Y [ 0 0 0 0 0 0 0 0 0 0 0 0 0 0[10Y - more 0 0 0 0 0 0 0 0 0 0 0 0 0 0
Tot 0 0 0 0 0 0 0 0 0 0 0 0 0 0[ 0 - 3M [ 0 0 0 0 0 0 0 0 0 0 0 0 0 0
[ 3M - 1Y [ 0 0 0 0 0 0 0 0 0 0 0 0 0 0[ 1Y - 2Y [ 0 0 0 0 0 0 0 0 0 0 0 0 0 0[ 2Y - 3Y [ 0 0 0 0 0 0 0 0 0 0 0 0 0 0
[3Y - 5Y [ 0 0 0 0 0 0 0 0 0 0 0 0 0 0[5Y - 10Y [ 0 0 0 0 0 0 0 0 0 0 0 0 0 0[10Y - more 0 0 0 0 0 0 0 0 0 0 0 0 0 0
Tot 0 0 0 0 0 0 0 0 0 0 0 0 0 0[ 0 - 3M [ 0 0 0 0 0 0 0 0 0 0 0 0 0 0
[ 3M - 1Y [ 0 0 0 0 0 0 0 0 0 0 0 0 0 0[ 1Y - 2Y [ 0 0 0 0 0 0 0 0 0 0 0 0 0 0[ 2Y - 3Y [ 0 0 0 0 0 0 0 0 0 0 0 0 0 0[3Y - 5Y [ 0 0 0 0 0 0 0 0 0 0 0 0 0 0
[5Y - 10Y [ 0 0 0 0 0 0 0 0 0 0 0 0 0 0[10Y - more 0 0 0 0 0 0 0 0 0 0 0 0 0 0
Tot 0 0 0 0 0 0 0 0 0 0 0 0 0 0[ 0 - 3M [ 0 0 0 0 0 0 0 0 0 0 0 0 0 0
[ 3M - 1Y [ 0 0 0 0 0 0 0 0 0 0 0 0 0 0[ 1Y - 2Y [ 0 0 0 0 0 0 0 0 0 0 0 0 0 0[ 2Y - 3Y [ 0 0 0 0 0 0 0 0 0 0 0 0 0 0
[3Y - 5Y [ 0 0 0 0 0 0 0 0 0 0 0 0 0 0[5Y - 10Y [ 0 0 0 0 0 0 0 0 0 0 0 0 0 0
[10Y - more 0 0 0 0 0 0 0 0 0 0 0 0 0 0Tot 0 0 0 0 0 0 0 0 0 0 0 0 0 0
Netherlands
Norway
Poland
Portugal
Romania
Slovakia
http://www.economiaciudadana.org/
2014 EU-wide Stress Test - Sovereign Exposure
(mln EUR)
Notional valueFair-value at
31/12/2013 (+)Notional value
Fair-value at31/12/2013 (-)
Notional valueFair-value at
31/12/2013 (+)Notional value
Fair-value at 31/12/2013(-)
Derivatives with positive fair valueat 31/12/2013
Derivatives with negative fairvalue at 31/12/2013
VALUES AS OF 31/12/2013 VALUES AS OF 31/12/2013 VALUES AS OF 31/12/2013
INDIRECT SOVEREIGN EXPOSURES (3) (on and off balance sheet)
Residual Maturity Country / Region
GROSS DIRECT LONG
EXPOSURES (accounting value grossof provisions)
(1)
NET DIRECT POSITIONS (gross exposures (long) net of cash short
positions of sovereign debt to other counterpaties only where thereis a maturity matching)
(1)
DIRECT SOVEREIGN EXPOSURES IN DERIVATIVES (1)
of which: loansand advances
of which: AFSbanking book
of which: FVO
(designated at fairvalue throughprofit&loss)
banking book
of which: Financial
assets held fortrading
(2)
Derivatives with positive fair value at31/12/2013
Derivatives with negative fair value at31/12/2013
[ 0 - 3M [ 0 0 0 0 0 0 0 0 0 0 0 0 0 0[ 3M - 1Y [ 0 0 0 0 0 0 0 0 0 0 0 0 0 0[ 1Y - 2Y [ 0 0 0 0 0 0 0 0 0 0 0 0 0 0[ 2Y - 3Y [ 0 0 0 0 0 0 0 0 0 0 0 0 0 0[3Y - 5Y [ 0 0 0 0 0 0 0 0 0 0 0 0 0 0
[5Y - 10Y [ 0 0 0 0 0 0 0 0 0 0 0 0 0 0[10Y - more 0 0 0 0 0 0 0 0 0 0 0 0 0 0
Tot 0 0 0 0 0 0 0 0 0 0 0 0 0 0[ 0 - 3M [ 2,809 1,880 2,809 822 0 1 0 0 0 0 0 0 0 0
[ 3M - 1Y [ 2,302 122 2,302 1,775 0 0 0 0 0 0 0 0 0 0[ 1Y - 2Y [ 3,078 89 3,078 1,208 0 1 0 0 0 0 0 0 0 0[ 2Y - 3Y [ 1,097 91 1,097 283 0 0 0 0 0 0 0 0 0 0[3Y - 5Y [ 966 115 966 265 0 228 0 0 0 0 0 0 0 0
[5Y - 10Y [ 2,648 256 2,634 329 0 14 0 0 0 0 0 0 0 0[10Y - more 1,464 298 1,464 47 0 0 0 0 0 0 0 0 0 0
Tot 14,364 2,852 14,350 4,729 0 244 0 0 0 0 0 0 0 0[ 0 - 3M [ 0 0 0 0 0 0 0 0 0 0 0 0 0 0
[ 3M - 1Y [ 0 0 0 0 0 0 0 0 0 0 0 0 0 0[ 1Y - 2Y [ 0 0 0 0 0 0 0 0 0 0 0 0 0 0[ 2Y - 3Y [ 0 0 0 0 0 0 0 0 0 0 0 0 0 0[3Y - 5Y [ 0 0 0 0 0 0 0 0 0 0 0 0 0 0
[5Y - 10Y [ 0 0 0 0 0 0 0 0 0 0 0 0 0 0[10Y - more 0 0 0 0 0 0 0 0 0 0 0 0 0 0
Tot 0 0 0 0 0 0 0 0 0 0 0 0 0 0[ 0 - 3M [ 0 0 0 0 0 0 0 0 0 0 0 0 0 0
[ 3M - 1Y [ 0 0 0 0 0 0 0 0 0 0 0 0 0 0[ 1Y 2Y [ 0 0 0 0 0 0 0 0 0 0 0 0 0 0
Sweden
Spain
Slovenia

8/10/2019 Test Stress Banca Española 2014
http://slidepdf.com/reader/full/test-stress-banca-espanola-2014 219/240
[ 1Y - 2Y [ 0 0 0 0 0 0 0 0 0 0 0 0 0 0[ 2Y - 3Y [ 0 0 0 0 0 0 0 0 0 0 0 0 0 0[3Y - 5Y [ 0 0 0 0 0 0 0 0 0 0 0 0 0 0
[5Y - 10Y [ 0 0 0 0 0 0 0 0 0 0 0 0 0 0[10Y - more 0 0 0 0 0 0 0 0 0 0 0 0 0 0
Tot 0 0 0 0 0 0 0 0 0 0 0 0 0 0[ 0 - 3M [ 0 0 0 0 0 0 0 0 0 0 0 0 0 0
[ 3M - 1Y [ 0 0 0 0 0 0 0 0 0 0 0 0 0 0[ 1Y - 2Y [ 0 0 0 0 0 0 0 0 0 0 0 0 0 0[ 2Y - 3Y [ 0 0 0 0 0 0 0 0 0 0 0 0 0 0
[3Y - 5Y [ 0 0 0 0 0 0 0 0 0 0 0 0 0 0[5Y - 10Y [ 0 0 0 0 0 0 0 0 0 0 0 0 0 0[10Y - more 0 0 0 0 0 0 0 0 0 0 0 0 0 0
Tot 0 0 0 0 0 0 0 0 0 0 0 0 0 0[ 0 - 3M [ 0 0 0 0 0 0 0 0 0 0 0 0 0 0
[ 3M - 1Y [ 0 0 0 0 0 0 0 0 0 0 0 0 0 0[ 1Y - 2Y [ 0 0 0 0 0 0 0 0 0 0 0 0 0 0[ 2Y - 3Y [ 0 0 0 0 0 0 0 0 0 0 0 0 0 0[3Y - 5Y [ 0 0 0 0 0 0 0 0 0 0 0 0 0 0
[5Y - 10Y [ 0 0 0 0 0 0 0 0 0 0 0 0 0 0[10Y - more 0 0 0 0 0 0 0 0 0 0 0 0 0 0
Tot 0 0 0 0 0 0 0 0 0 0 0 0 0 0[ 0 - 3M [ 0 0 0 0 0 0 0 0 0 0 0 0 0 0
[ 3M - 1Y [ 0 0 0 0 0 0 0 0 0 0 0 0 0 0[ 1Y - 2Y [ 0 0 0 0 0 0 0 0 0 0 0 0 0 0[ 2Y - 3Y [ 0 0 0 0 0 0 0 0 0 0 0 0 0 0[3Y - 5Y [ 0 0 0 0 0 0 0 0 0 0 0 0 0 0
[5Y - 10Y [ 0 0 0 0 0 0 0 0 0 0 0 0 0 0[10Y - more 0 0 0 0 0 0 0 0 0 0 0 0 0 0
Tot 0 0 0 0 0 0 0 0 0 0 0 0 0 0[ 0 - 3M [ 0 0 0 0 0 0 0 0 0 0 0 0 0 0
[ 3M - 1Y [ 0 0 0 0 0 0 0 0 0 0 0 0 0 0[ 1Y - 2Y [ 0 0 0 0 0 0 0 0 0 0 0 0 0 0[ 2Y - 3Y [ 0 0 0 0 0 0 0 0 0 0 0 0 0 0[3Y - 5Y [ 0 0 0 0 0 0 0 0 0 0 0 0 0 0
[5Y - 10Y [ 0 0 0 0 0 0 0 0 0 0 0 0 0 0[10Y - more 0 0 0 0 0 0 0 0 0 0 0 0 0 0
Tot 0 0 0 0 0 0 0 0 0 0 0 0 0 0[ 0 - 3M [ 0 0 0 0 0 0 0 0 0 0 0 0 0 0
[ 3M - 1Y [ 0 0 0 0 0 0 0 0 0 0 0 0 0 0[ 1Y - 2Y [ 0 0 0 0 0 0 0 0 0 0 0 0 0 0[ 2Y - 3Y [ 0 0 0 0 0 0 0 0 0 0 0 0 0 0
[3Y - 5Y [ 0 0 0 0 0 0 0 0 0 0 0 0 0 0[5Y - 10Y [ 0 0 0 0 0 0 0 0 0 0 0 0 0 0
[10Y - more 0 0 0 0 0 0 0 0 0 0 0 0 0 0Tot 0 0 0 0 0 0 0 0 0 0 0 0 0 0
United Kingdom
Australia
Canada
Hong Kong
Japan
U.S.
http://www.economiaciudadana.org/
2014 EU-wide Stress Test - Sovereign Exposure
(mln EUR)
Notional valueFair-value at
31/12/2013 (+)Notional value
Fair-value at31/12/2013 (-)
Notional valueFair-value at
31/12/2013 (+)Notional value
Fair-value at 31/12/2013(-)
Derivatives with positive fair valueat 31/12/2013
Derivatives with negative fairvalue at 31/12/2013
VALUES AS OF 31/12/2013 VALUES AS OF 31/12/2013 VALUES AS OF 31/12/2013
INDIRECT SOVEREIGN EXPOSURES (3) (on and off balance sheet)
Residual Maturity Country / Region
GROSS DIRECT LONG
EXPOSURES (accounting value grossof provisions)
(1)
NET DIRECT POSITIONS (gross exposures (long) net of cash short
positions of sovereign debt to other counterpaties only where thereis a maturity matching)
(1)
DIRECT SOVEREIGN EXPOSURES IN DERIVATIVES (1)
of which: loansand advances
of which: AFSbanking book
of which: FVO
(designated at fairvalue throughprofit&loss)
banking book
of which: Financial
assets held fortrading
(2)
Derivatives with positive fair value at31/12/2013
Derivatives with negative fair value at31/12/2013
[ 0 - 3M [ 0 0 0 0 0 0 0 0 0 0 0 0 0 0[ 3M - 1Y [ 0 0 0 0 0 0 0 0 0 0 0 0 0 0[ 1Y - 2Y [ 0 0 0 0 0 0 0 0 0 0 0 0 0 0[ 2Y - 3Y [ 0 0 0 0 0 0 0 0 0 0 0 0 0 0[3Y - 5Y [ 0 0 0 0 0 0 0 0 0 0 0 0 0 0
[5Y - 10Y [ 0 0 0 0 0 0 0 0 0 0 0 0 0 0[10Y - more 0 0 0 0 0 0 0 0 0 0 0 0 0 0
Tot 0 0 0 0 0 0 0 0 0 0 0 0 0 0[ 0 - 3M [ 0 0 0 0 0 0 0 0 0 0 0 0 0 0
[ 3M - 1Y [ 0 0 0 0 0 0 0 0 0 0 0 0 0 0[ 1Y - 2Y [ 0 0 0 0 0 0 0 0 0 0 0 0 0 0[ 2Y - 3Y [ 0 0 0 0 0 0 0 0 0 0 0 0 0 0[3Y - 5Y [ 0 0 0 0 0 0 0 0 0 0 0 0 0 0
[5Y - 10Y [ 0 0 0 0 0 0 0 0 0 0 0 0 0 0[10Y - more 0 0 0 0 0 0 0 0 0 0 0 0 0 0
Tot 0 0 0 0 0 0 0 0 0 0 0 0 0 0[ 0 - 3M [ 0 0 0 0 0 0 0 0 0 0 0 0 0 0
[ 3M - 1Y [ 0 0 0 0 0 0 0 0 0 0 0 0 0 0[ 1Y - 2Y [ 0 0 0 0 0 0 0 0 0 0 0 0 0 0
China
Switzerland
Other advanced economies
non EEA

8/10/2019 Test Stress Banca Española 2014
http://slidepdf.com/reader/full/test-stress-banca-espanola-2014 220/240
[ 1Y 2Y [ 0 0 0 0 0 0 0 0 0 0 0 0 0 0[ 2Y - 3Y [ 0 0 0 0 0 0 0 0 0 0 0 0 0 0[3Y - 5Y [ 0 0 0 0 0 0 0 0 0 0 0 0 0 0
[5Y - 10Y [ 0 0 0 0 0 0 0 0 0 0 0 0 0 0[10Y - more 0 0 0 0 0 0 0 0 0 0 0 0 0 0
Tot 0 0 0 0 0 0 0 0 0 0 0 0 0 0[ 0 - 3M [ 0 0 0 0 0 0 0 0 0 0 0 0 0 0
[ 3M - 1Y [ 0 0 0 0 0 0 0 0 0 0 0 0 0 0[ 1Y - 2Y [ 0 0 0 0 0 0 0 0 0 0 0 0 0 0[ 2Y - 3Y [ 0 0 0 0 0 0 0 0 0 0 0 0 0 0[3Y - 5Y [ 0 0 0 0 0 0 0 0 0 0 0 0 0 0
[5Y - 10Y [ 0 0 0 0 0 0 0 0 0 0 0 0 0 0[10Y - more 0 0 0 0 0 0 0 0 0 0 0 0 0 0
Tot 0 0 0 0 0 0 0 0 0 0 0 0 0 0[ 0 - 3M [ 0 0 0 0 0 0 0 0 0 0 0 0 0 0
[ 3M - 1Y [ 0 0 0 0 0 0 0 0 0 0 0 0 0 0[ 1Y - 2Y [ 0 0 0 0 0 0 0 0 0 0 0 0 0 0[ 2Y - 3Y [ 0 0 0 0 0 0 0 0 0 0 0 0 0 0[3Y - 5Y [ 0 0 0 0 0 0 0 0 0 0 0 0 0 0
[5Y - 10Y [ 0 0 0 0 0 0 0 0 0 0 0 0 0 0[10Y - more 0 0 0 0 0 0 0 0 0 0 0 0 0 0
Tot 0 0 0 0 0 0 0 0 0 0 0 0 0 0
Notes and definitions(1) The exposures reported cover only exposures to central, regional and local governments on immediate borrower basis, and do not include exposures to other counterparts with full or partial government guarantees(2) The banks disclose the exposures in the "Financial assets held for trading" portfolio after offsetting the cash short positions having the same maturities.
(3) The exposures reported include the positions towards counterparts (other than sovereign) on sovereign credit risk (i.e. CDS, financial guarantees) booked in all the accounting portfolio (on-off balance sheet).'Irrespective of the denomination and or accounting classification of the positions the economic substance over the form must be used as a criteria for the identification of the exposures to be included in this column. This item does not include exposures to counterparts (other than sovereign) with full or partial government guarantees by central, regional and local governments
Latin America and the
Caribbean
Africa
Others
Middle East
Other Central and eastern
Europe countries non EEA
http://www.economiaciudadana.org/
2014 EU-wide Stress TestCapital
(mln EUR) CRR/ CRDIV DEFINITION OFCAPITAL Asof 31/12/2013 Asof 31/12/2014 Asof 31/12/2015 Asof 31/12/2016 Asof 31/12/2014 Asof 31/12/2015 Asof 31/12/2016 COREP CODE REGULATION
A OWN FUNDS 3,764 3,865 3,985 4,079 3,526 3,333 3,097 C A1 { 1} A rt ic le s 4 (1 18 ) a nd 7 2 of C RR
A.1 COMMON EQUITYTIER1CAPITAL(netofdeductionsandafter applyingtransitional adjustments)
3,627 3,731 3,848 3,942 3,416 3,228 2,990 C A1 { 1. 1. 1} A rt ic le 50 o f CR R
A.1.1Capitalinstruments eligible asCET1Capital (including share premium and net own
capitalinstruments)621 621 621 621 621 621 621 CA1 {1.1.1.1}
Articles 26(1) points (a) and(b), 27to29, 36(1) point (f)and42ofCRR
A.1.1.1 Ofwhich: CET1instruments subscribed byGovernment 604 604 604 604 604 604 604 - -
A.1.2 Retained earnings -75 84 298 502 -209 -286 -388 CA1 {1.1.1.2} Articles 26(1) point (c), 26(2) and36(1) points (a) and(l)ofCRR
A.1.3 Accumulated other comprehensive income 17 15 11 7 -171 -191 -238 CA1 {1.1.1.3} Articles 4(100), 26(1) point (d) and 36 (1) point (l) of CRR
A.1.3.1 Of which:arising from unrealised gains/lossesfrom Sovereign exposure in AFS
portfolio18 18 18 18 -77 -42 -51 - -
A.1.3.2 Ofwhich: arising from unrealised gains/lossesfrom the rest ofAFS portfolio -1 -3 -7 -10 -93 -148 -186 - -
A.1.4 Other Reserves 2,434 2,434 2,434 2,434 2,434 2,434 2,434 CA1 {1.1.1.4} Articles 4(117) and 26(1) point (e) of CRR
A.1.5 Fundsfor general banking risk 0 0 0 0 0 0 0 CA1 {1.1.1.5} Articles 4(112), 26(1) point (f) and 36 (1) point (l) of CRR
A.1.6 Minority interest given recognition in CET1capital 408 387 353 309 492 561 613 CA1 {1.1.1.7} Article 84 of CRR
A.1.7 Adjustmentsto CET1due to prudentialfilters excluding those from unrealised
gains/lossesfrom AFS portfolio0 0 0 0 0 0 0 CA1 {1.1.1.9} Articles 32 to 35 of and 36 (1) point (l) of CRR
A.1.8 Adjustmentsto CET1due to prudentialfilters from unrealised gains/lossesfrom
Sovereign Exposure in AFS portfolio-18 -15 -11 -7 62 25 20 -
A.1.9 (-)Intangible assets (including Goodwill) -40 -38 -36 -34 -38 -36 -34CA1{1.1.1.10+1.1.1.11}
Articles 4(113), 36(1) point (b) and37ofCRR. Articles4(115), 36(1) point (b) and37point (a) ofCCR
A.1.10(-)DTAs that relyon future profitabilityand don ot arise from temporary
differencesnet ofassociated DTLs-344 -313 -269 -229 -368 -386 -409 CA1 {1.1.1.12} Articles 36(1) point (c) and 38 of CRR
A.1.11 (-)IRB shortfall ofcredit risk adjustmentsto expected losses 0 0 0 0 0 0 0 CA1 {1.1.1.13} Articles 36(1) point (d), 40 and 159 of CRR
A.1.12 (-)Defined benefit pension fund assets 0 0 0 0 0 0 0 CA1 {1.1.1.14} Articles 4(109), 36(1) point (e) and 41 of CRR
A.1.13 (-)Reciprocal crossholdings in CET1Capital 0 0 0 0 0 0 0 CA1 {1.1.1.15} Articles 4(122), 36(1) point (g) and 44 of CRR
A.1.14 (-)Excess deduction from AT1items over AT1Capital 0 0 0 0 0 0 0 CA1 {1.1.1.16} Article 36(1) point (j) of CRR
A.1.15(-)Deductions related toassetswhich can alternativelybe subject toa 1.250%ri sk
weight0 0 0 0 0 0 0
CA1{1.1.1.17to1.1.1.21}
Articles 4(36), 36(1) point (k) (i) and89to91 ofCRR; Articles 36(1) point (k) (ii), 243(1) point (b), 244(1) point(b) and258of CRR;Articles 36(1) point k) (iii) and379(3)ofCRR;Articles 36(1) point k) (iv) and153(8) ofCRRand
A.1.15.1 Ofwhich: from securitisation positions(-) 0 0 0 0 0 0 0 CA1 {1.1.1.18.1} Articles 36(1) point (k) (ii), 243(1) point (b), 244(1) point(b) and258of CRR
A.1.16(-)HoldingsofCET1capitalinstrumentsoff inancialsector entitieswhere the
institiution doesnot have a significant investment0 0 0 0 0 0 0 CA1 {1.1.1.22}
Articles 4(27), 36(1) point (h);43to 46, 49(2) and(3) and79ofCRR
A.1.17(-)Deductible DTAsthat rely on future profitability and arise from temporary
differences0 0 0 0 0 0 0 CA1 {1.1.1.23}
Articles 36(1) point (c) and38;Articles 48(1) point (a) and48(2) ofCRR
A.1.18(-)HoldingsofCET1capitalinstrumentsoff inancialsector entitieswhere the
institiution hasa significant investment-13 -4 0 0 -34 -52 -75 CA1 {1.1.1.24}
Articles 4(27);36(1) point (i);43, 45;47;48(1) point (b);49(1) to(3) and79of CRR
A.1.19 (-)Amount exceding the 17.65% threshold -34 -22 0 0 -50 -62 -78 CA1 {1.1.1.25} Article 470 of CRR
A.1.20 Transitionaladjustments 671 582 448 339 677 600 525CA1{1.1.1.6+ 1.1.8+1.1.26}
-
A.1.20.1 Transitionaladjustments due tograndfathered CET1 Capitalinstruments (+/-) 0 0 0 0 0 0 0 CA1 {1.1.1.6} Articles 483(1) to(3), and484to 487ofCRR
A.1.20.2 Transitionaladjustments due toadditional minority interests(+/-) 280 241 202 152 157 76 30 CA1 {1.1.1.8}Articles 479and 480ofCRR
Baseline Scenario Adverse Scenario
OWN FUNDS

8/10/2019 Test Stress Banca Española 2014
http://slidepdf.com/reader/full/test-stress-banca-espanola-2014 221/240
Articles 479and 480ofCRR
A.1.20.3Other transitionaladjustments toCET1 Capitalexcl. adjustmentsfor Sovereign
exposure in AFS (+/-)391 340 246 187 520 524 494 CA1 {1.1.1.26}
Articles 469to 472, 478and481of CRR
A.2 ADDITIONAL TIER 1CAPITAL (net of deductionsand after transitional
adjustments)90 88 90 90 76 74 75 C A1 { 1. 1. 2} A rt ic le 61 o f CR R
A.2.1 Ofwhich: (+)Other existing support government measures 0 0 0 0 0 0 0 - -
A.3 TIER1 CAPITAL(net ofdeductions andafter transitional adjustments) 3,717 3,819 3,938 4,032 3,491 3,302 3,065 C A1 { 1. 1} A rt ic le 25 of C RR
A.4 TIER2 CAPITAL(net ofdeductions andafter transitional adjustments) 47 46 47 47 34 31 32 C A1 { 1. 2} A rt ic le 71 of C RR
B T O TA L R IS K E XP OS UR E A MO U NT 33,351 33,543 33,501 33,224 33,718 33,758 33,647 C A2 { 1} A rt ic le s 92 (3 ), 9 5, 9 6 an d 98 o f CR R
B.1ofwhich:stemming from exposuresthat fallbelow the 10%/15%limitsfor
CET1deduction (+)2,950 0 0 0 0 0 0
Articles 36(1) points (a) and(i);Article 38and Article 48of CRR
B .2 o f wh ic h:s te mming f rom from CVAcap i ta l re qui re me nts ( + ) 2 0 0 0 0 0 0 Article 381to386ofCRR
B.3ofwhich: stemming from higher asset correlation parameter against exposures
tolarge financialinstitutions under IRB the IRB approachesto credit risk(+)0 0 0 0 0 0 0 Articles 153(2) ofCRR
B.4ofwhich: stemming from the application ofthe supporting factor toincrease
lending to SMEs(-)-460 0 0 0 0 0 0 Recital (44) ofCRR
B.5ofwhich: stemming from the effect ofexposuresthat were previouslypart of
RiskExposure amount and receive a deduction treatment under CRR/CRDIV (-
)
0 0 0 0 0 0 0 -
B .6 o f wh ic h:o the rs s ub je c t t o t he d isc ret ion o f Na t iona lCompete nt Author i t ie s 0 0 0 0 0 0 0 Article 124to164ofCRR
C . 1 C ommonEquityT ier 1C a pita l ra tio 10.88% 11.12% 11.49% 11.87% 10.13% 9.56% 8.89% CA3 {1} -
C .2 T i er 1 C ap i ta l r at i o 11.15% 11.39% 11.75% 12.14% 10.35% 9.78% 9.11% CA3 { 3} -
C .3 T ot al Ca pi ta l r at io 11.29% 11.52% 11.89% 12.28% 10.46% 9.87% 9.20% CA3 { 5} -
D C ommonEquityT ier 1C a pita l Thres hold 2,683 2,680 2,658 1,855 1,857 1,851
ETotalamount ofinstruments with mandatoryconversion intoordinary sharesupon
a fixed date in the 2014-2016period (cumulative conversions) (1)0 0 0 0 0 0
F
TotalAdditionalTier 1 and Tier 2instrumentseligible as regulatorycapitalunder
the CRR provisionsthat convert intoCommon Equity Tier 1or are written down
upon a trigger event (2)
0 0 0
F.1Ofwhich: eligible instrumentswhose trigger isabove CET1capital ratioin the
adverse scenario(2)0 0 0
G F ullyLoa de dC ommonEquityT ie r 1C apital rat io ( 3) 10.85% 7.33%
(1)Conversionsnot considered for CET1 computation (2)Excluding instrumentsincluded in E (3)Memorandum item based on a fullyimplemented CRR/CRD IV definition of Common EquityTier 1 capitalincluding 60%ofunrealised gains/lossesfrom Sovereign Exposure in AFS portfolio
Memorandumitems
OWN FUNDSREQUIREMENTS
CAPITALRATIOS(%) -Transitional period
http://www.economiaciudadana.org/
2014 EU-wide Stress Test - Restructuring scenarios
(mln EUR)
2013 0 0
2014 45 -336 -1 -343Reduction of Branches and FTE, Portfolio Disvestments, No new loans in
legacy Unit
2015 78 -213 69 -222Reduction of Branches and FTE, Portfolio Disvestments, No new loans in
legacy Unit
2016 75 -345 73 -347 Portfolio Disvestments No new loans in legacy Unit
Total 198 -894 141 -913
Effects of mandatory restructuring plans publicly announced before 31 December 2013 and formally agreed with the European Commission.
Baseline scenario Adverse scenarioNarrative description of the transactions. (type, date of
completion/commitment, portfolios, subsidiaries, branches)CET1 impact
Risk exposureamount impact
CET1 impactRisk exposureamount impact

8/10/2019 Test Stress Banca Española 2014
http://slidepdf.com/reader/full/test-stress-banca-espanola-2014 222/240
http://www.economiaciudadana.org/
2014 EU-wide Stress Test
Outcome of the Stress Test based on the Restructuring plan for banks whose plan was formally agreed with the European Commission after 31 December 2013
(mln EUR)
As of
31/12/2013
As of
31/12/2014
As of
31/12/2015
As of
31/12/2016
As of
31/12/2014
As of
31/12/2015
As of
31/12/2016
COMMON EQUITY TIER 1 CAPITAL (net of deductions and after applying transitional adjustments)
TOTAL RISK EXPOSURE AMOUNT
COMMON EQUITY TIER 1 RATIO #DIV/0! #DIV/0! #DIV/0! #DIV/0! #DIV/0! #DIV/0! #DIV/0!
Baseline scenario Adverse scenario

8/10/2019 Test Stress Banca Española 2014
http://slidepdf.com/reader/full/test-stress-banca-espanola-2014 223/240
http://www.economiaciudadana.org/
2014 EU-wide Stress Test
Impact on CommonEquity Tier 1Million EUR
Raising of capital instruments eligible as CET1 capital (+) 0
Repayment of CET1 capital, buybacks (-) 0
Conversion to CET1 of hybrid instruments becoming effective between 1 January and 30 September 2014 (+) 0
Impact on AdditionalTier 1 and Tier 2
Million EUR Net issuance of Additional Tier 1 and T2 Instruments with a trigger at or above bank's post stress test CET1 ratio in the adversescenario during the stress test horizon (+/-)
0
Major Capital Measures from 1 January to 30 September 2014
Net issuance of Additional Tier 1 and T2 Instruments
Issuance of CET 1 Instruments
Major Capital Measures Impacting Tier 1 and Tier 2 Eligible Capital from 1 January 2014 to 30 September 2014

8/10/2019 Test Stress Banca Española 2014
http://slidepdf.com/reader/full/test-stress-banca-espanola-2014 224/240
Net issuance of Additional Tier 1 and T2 Instrument with a trigger below bank's post stress test CET1 ratio in the adverse
scenario during the stress test horizon (+/-)0
Million EUR
Realized fines/litigation costs from 1 January to 30 September 2014 (net of provisions) (-) 0
Other material losses and provisions from 1 January to 30 September 2014 (-) 0
Losses
http://www.economiaciudadana.org/

8/10/2019 Test Stress Banca Española 2014
http://slidepdf.com/reader/full/test-stress-banca-espanola-2014 225/240
Actual figures as of 31 December 2013 mln EUR, % Actual figures as of 31 December 2013 mln EUR, %
Operating profit before impairments 855 Operating profit before impairments 855
Impairment losses on financial and non-financial assets in the banking book 974 Impairment losses on financial and non-financial assets in the banking book 974
Common Equity Tier 1 capital (1) 2,643 Common Equity Tier 1 capital (1) 2,643
Total Risk Exposure (1) 25,958 Total Risk Exposure (1) 25,958
Common Equity Tier 1 ratio, % (1) 10.2% Common Equity Tier 1 ratio, % (1) 10.2%
Outcome of the adverse scenario as of 31 December 2016 mln EUR, % Outcome of the baseline scenario as of 31 December 2016 mln EUR, %
3 yr cumulative operating profit before impairments 747 3 yr cumulative operating profit before impairments 1,207
3 yr cumulative impairment losses on financial and non-financial assets in the banking book 1,506 3 yr cumulative impairment losses on financial and non-financial assets in the banking book 726
3 yr cumulative losses from the stress in the trading book 13 3 yr cumulative losses from the stress in the trading book 6
Valuation losses due to sovereign shock after tax and prudential filters 4 Common Equity Tier 1 capital (1) 2,981
Common Equity Tier 1 capital (1) 2,043 Total Risk Exposure (1) 21,467
Total Risk Exposure (1) 22,340 Common Equity Tier 1 ratio, % (1) 13.9%Common Equity Tier 1 ratio, % (1) 9.1%
Memorandum items mln EUR
Memorandum items mln EUR Common EU wide CET1 Threshold (8.0%) 1,717
Common EU wide CET1 Threshold (5.5%) 1,229
Total amount of instruments with mandatory conversion into ordinary shares upon a fixed date in
the 2014 -2016 period (cumulative conversions) (2)0
Total Additional Tier 1 and Tier 2 instruments eligible as regulatory capital under the CRR provisions
that convert into Common Equity Tier 1 or are written down upon a trigger event (3)0
Of which: eligible instruments whose trigger is above CET1 capital ratio in the adverse
scenario (3)0
(1) According to CRR/CRD4 definition transitional arrangements as per reporting date. Figures as of 31/12/2013 computed as of first day of application:
01/01/2014.
2014 EU-wide Stress Test 2014 EU-wide Stress TestSummary Baseline Scenario
ES - NCG Banco, S.A.
(1) According to CRR/CRD4 definition transitional arrangements as per reporting date. Figures as of 31/12/2013 computed as of first day of application:
01/01/2014.
Summary Adverse Scenario
ES - NCG Banco, S.A.

8/10/2019 Test Stress Banca Española 2014
http://slidepdf.com/reader/full/test-stress-banca-espanola-2014 226/240
(2) Conversions not considered for CET1 computation
(3) Excluding instruments with mandatory conversion into ordinary shares upon a fixed date in the 2014 -2016 period
01/01/2014.
http://www.economiaciudadana.org/

8/10/2019 Test Stress Banca Española 2014
http://slidepdf.com/reader/full/test-stress-banca-espanola-2014 227/240
2014 EU-wide Stress TestCredit Risk
31 1 13) 31 1 13) 31 1 13)
(mln EU
R, %)No n-d ef aul t ed De fau lt e d No n-d ef aul t ed De fau lt e d No n-d ef aul t ed De fau lt e d No n-d ef aul t e d De fau lt e d No n-d ef aul t ed De fau lt e d No n-d ef aul t e d De fau lt e d No n-d ef aul t ed De fau lt e d No n-d ef aul t ed De fau lt e d No n-d ef aul t ed De fau lt e d
Impairment
rate
Stockof
ProvisionsCoverage Ratio -
Default Stock
Impairment
rate
Stockof
Provisions
CoverageRatio-Default
Stock
Impairment
rate
Stockof
Provisions
CoverageRatio -Default
Stock
Impairment rateStockof
Provisions
CoverageRatio-Default
Stock
Impairment
rate
Stockof
Provisions
CoverageRatio-Default
Stock
Impairment
rate
Stockof
Provisions
CoverageRatio -Default
Stock Central banksandcentral governments 0 0 0 0 0 0 0 0 0 0 0 0 0 0 0 0 0 0 - 0 - - 0 - - 0 - - 0 - - 0 - - 0 -
Institutions 0 0 0 0 0 0 0 0 0 0 0 0 0 0 0 0 0 0 - 0 - - 0 - - 0 - - 0 - - 0 - - 0 -
Corporates 0 0 0 0 0 0 0 0 0 0 0 0 0 0 0 0 0 0 - 0 - - 0 - - 0 - - 0 - - 0 - - 0 -
Corporates -Of Which:SpecialisedLending 0 0 0 0 0 0 0 0 0 0 0 0 0 0 0 0 0 0 - 0 - - 0 - - 0 - - 0 - - 0 - - 0 -
Corporates -Of Which:SME 0 0 0 0 0 0 0 0 0 0 0 0 0 0 0 0 0 0 - 0 - - 0 - - 0 - - 0 - - 0 - - 0 -
Retail 0 0 0 0 0 0 0 0 0 0 0 0 0 0 0 0 0 0 - 0 - - 0 - - 0 - - 0 - - 0 - - 0 -
Retail -Securedon real estateproperty 0.0% 0 0 0 0 0 0 0 0 0 0 0 0 0 0 0 0 0 0 - 0 - - 0 - - 0 - - 0 - - 0 - - 0 -
Retail -Securedon real estate property- Of hi h: E
0.0% 0 0 0 0 0 0 0 0 0 0 0 0 0 0 0 0 0 0 - 0 - - 0 - - 0 - - 0 - - 0 - - 0 -Retail -Securedon real estate property- Of
h i h: n n - E0.0% 0 0 0 0 0 0 0 0 0 0 0 0 0 0 0 0 0 0 - 0 - - 0 - - 0 - - 0 - - 0 - - 0 -
Retail -QualifyingRevolving 0 0 0 0 0 0 0 0 0 0 0 0 0 0 0 0 0 0 - 0 - - 0 - - 0 - - 0 - - 0 - - 0 -
Retail -OtherRetail 0 0 0 0 0 0 0 0 0 0 0 0 0 0 0 0 0 0 - 0 - - 0 - - 0 - - 0 - - 0 - - 0 -
Retail -Other Retail -Of Which:SME 0 0 0 0 0 0 0 0 0 0 0 0 0 0 0 0 0 0 - 0 - - 0 - - 0 - - 0 - - 0 - - 0 -
Retail -Other Retail -Of Which:non-SME 0 0 0 0 0 0 0 0 0 0 0 0 0 0 0 0 0 0 - 0 - - 0 - - 0 - - 0 - - 0 - - 0 -
Equity 0 0 0 0 0 0 0 0 0 0 0 0 0 0 0 0 0 0 - 0 - - 0 - - 0 - - 0 - - 0 - - 0 -
Securitisation 0 0 0 0 0 0 0 0 0 0 0 0 0 0 0 0 0 0
Othernon-credit obligation assets 0 0 0 0 0 0 0 0 0 0 0 0 0 0 0 0 0 0
TOTAL 0 0 0 0 0 0 0 0 0 0 0 0 0 0 0 0 0 0 - 0 - - 0 - - 0 - - 0 - - 0 - - 0 -
Securitisation andre-securitisations positions deductedfrom capital * 0 0 0 0 0 0 0 0 0 0 0 0
(mln EUR, %)No n-d ef aul t ed De fau lt e d No n-d ef aul t ed De fau lt e d No n-d ef aul t ed De fau lt e d No n-d ef aul t e d De fau lt e d No n-d ef aul t ed De fau lt e d No n-d ef aul t e d De fau lt e d No n-d ef aul t ed De fau lt e d No n-d ef aul t ed De fau lt e d No n-d ef aul t ed De fau lt e d
Impairment
rate
Stockof
ProvisionsCoverage Ratio -
Default Stock
Impairment
rate
Stockof
Provisions
CoverageRatio-Default
Stock
Impairment
rate
Stockof
Provisions
CoverageRatio -Default
Stock
Impairment rateStockof
Provisions
CoverageRatio-Default
Stock
Impairment
rate
Stockof
Provisions
CoverageRatio-Default
Stock
Impairment
rate
Stockof
Provisions
CoverageRatio -Default
Stock Central banksandcentral governments 0 0 0 0 0 0 0 0 0 0 0 0 0 0 0 0 0 0 - 0 - - 0 - - 0 - - 0 - - 0 - - 0 -
Institutions 0 0 0 0 0 0 0 0 0 0 0 0 0 0 0 0 0 0 - 0 - - 0 - - 0 - - 0 - - 0 - - 0 -
Corporates 0 0 0 0 0 0 0 0 0 0 0 0 0 0 0 0 0 0 - 0 - - 0 - - 0 - - 0 - - 0 - - 0 -
Corporates -Of Which:SpecialisedLending 0 0 0 0 0 0 0 0 0 0 0 0 0 0 0 0 0 0 - 0 - - 0 - - 0 - - 0 - - 0 - - 0 -
Corporates -Of Which:SME 0 0 0 0 0 0 0 0 0 0 0 0 0 0 0 0 0 0 - 0 - - 0 - - 0 - - 0 - - 0 - - 0 -
Retail 0 0 0 0 0 0 0 0 0 0 0 0 0 0 0 0 0 0 - 0 - - 0 - - 0 - - 0 - - 0 - - 0 -
Retail -Securedon real estateproperty 0.0% 0 0 0 0 0 0 0 0 0 0 0 0 0 0 0 0 0 0 - 0 - - 0 - - 0 - - 0 - - 0 - - 0 -
Retail -Securedon real estate property- Of
h i h : S E0.0% 0 0 0 0 0 0 0 0 0 0 0 0 0 0 0 0 0 0 - 0 - - 0 - - 0 - - 0 - - 0 - - 0 -
Retail -Securedon real estate property- Of
h i h: n n - E0.0% 0 0 0 0 0 0 0 0 0 0 0 0 0 0 0 0 0 0 - 0 - - 0 - - 0 - - 0 - - 0 - - 0 -
Retail -QualifyingRevolving 0 0 0 0 0 0 0 0 0 0 0 0 0 0 0 0 0 0 - 0 - - 0 - - 0 - - 0 - - 0 - - 0 -
Retail -OtherRetail 0 0 0 0 0 0 0 0 0 0 0 0 0 0 0 0 0 0 - 0 - - 0 - - 0 - - 0 - - 0 - - 0 -
Retail -Other Retail -Of Which:SME 0 0 0 0 0 0 0 0 0 0 0 0 0 0 0 0 0 0 - 0 - - 0 - - 0 - - 0 - - 0 - - 0 -
Retail -Other Retail -Of Which:non-SME 0 0 0 0 0 0 0 0 0 0 0 0 0 0 0 0 0 0 - 0 - - 0 - - 0 - - 0 - - 0 - - 0 -
Equity 0 0 0 0 0 0 0 0 0 0 0 0 0 0 0 0 0 0 - 0 - - 0 - - 0 - - 0 - - 0 - - 0 -
Securitisation 0 0 0 0 0 0 0 0 0 0 0 0 0 0 0 0 0 0
Othernon-credit obligation assets 0 0 0 0 0 0 0 0 0 0 0 0 0 0 0 0 0 0
TOTAL 0 0 0 0 0 0 0 0 0 0 0 0 0 0 0 0 0 0 - 0 - - 0 - - 0 - - 0 - - 0 - - 0 -
Securitisation andre-securitisations positions deductedfrom capital * 0 0 0 0 0 0 0 0 0 0 0 0
(mln EUR, %)No n-d ef aul t ed De fau lt e d No n-d ef aul t ed De fau lt e d No n-d ef aul t ed De fau lt e d No n-d ef aul t e d De fau lt e d No n-d ef aul t ed De fau lt e d No n-d ef aul t e d De fau lt e d No n-d ef aul t ed De fau lt e d No n-d ef aul t ed De fau lt e d No n-d ef aul t ed De fau lt e d
Impairment
rate
Stockof
ProvisionsCoverage Ratio -
Default Stock
Impairment
rate
Stockof
Provisions
Coverage
Ratio-Default
Stock
Impairment
rate
Stockof
Provisions
Coverage
Ratio -Default
Stock
Impairment rateStockof
Provisions
Coverage
Ratio-Default
Stock
Impairment
rate
Stockof
Provisions
Coverage
Ratio-Default
Stock
Impairment
rate
Stockof
Provisions
Coverage
Ratio -Default
Stock Central banksandcentral governments 0 0 0 0 0 0 0 0 0 0 0 0 0 0 0 0 0 0 - 0 - - 0 - - 0 - - 0 - - 0 - - 0 -
Institutions 0 0 0 0 0 0 0 0 0 0 0 0 0 0 0 0 0 0 - 0 - - 0 - - 0 - - 0 - - 0 - - 0 -
Corporates 0 0 0 0 0 0 0 0 0 0 0 0 0 0 0 0 0 0 - 0 - - 0 - - 0 - - 0 - - 0 - - 0 -
Corporates -Of Which:SpecialisedLending 0 0 0 0 0 0 0 0 0 0 0 0 0 0 0 0 0 0 - 0 - - 0 - - 0 - - 0 - - 0 - - 0 -
Corporates -Of Which:SME 0 0 0 0 0 0 0 0 0 0 0 0 0 0 0 0 0 0 - 0 - - 0 - - 0 - - 0 - - 0 - - 0 -
Retail 0 0 0 0 0 0 0 0 0 0 0 0 0 0 0 0 0 0 - 0 - - 0 - - 0 - - 0 - - 0 - - 0 -
Retail -Securedon real estateproperty 0.0% 0 0 0 0 0 0 0 0 0 0 0 0 0 0 0 0 0 0 - 0 - - 0 - - 0 - - 0 - - 0 - - 0 -
Retail -Securedon real estate property- Of
hi h: E0.0% 0 0 0 0 0 0 0 0 0 0 0 0 0 0 0 0 0 0 - 0 - - 0 - - 0 - - 0 - - 0 - - 0 -
Retail -Securedon real estate property- Of
h i h: n n - E0.0% 0 0 0 0 0 0 0 0 0 0 0 0 0 0 0 0 0 0 - 0 - - 0 - - 0 - - 0 - - 0 - - 0 -
Retail -QualifyingRevolving 0 0 0 0 0 0 0 0 0 0 0 0 0 0 0 0 0 0 - 0 - - 0 - - 0 - - 0 - - 0 - - 0 -
Retail -OtherRetail 0 0 0 0 0 0 0 0 0 0 0 0 0 0 0 0 0 0 - 0 - - 0 - - 0 - - 0 - - 0 - - 0 -
Retail -Other Retail -Of Which:SME 0 0 0 0 0 0 0 0 0 0 0 0 0 0 0 0 0 0 - 0 - - 0 - - 0 - - 0 - - 0 - - 0 -
Retail -Other Retail -Of Which:non-SME 0 0 0 0 0 0 0 0 0 0 0 0 0 0 0 0 0 0 - 0 - - 0 - - 0 - - 0 - - 0 - - 0 -
Equity 0 0 0 0 0 0 0 0 0 0 0 0 0 0 0 0 0 0 - 0 - - 0 - - 0 - - 0 - - 0 - - 0 -
Securitisation 0 0 0 0 0 0 0 0 0 0 0 0 0 0 0 0 0 0
Othernon-credit obligation assets 0 0 0 0 0 0 0 0 0 0 0 0 0 0 0 0 0 0
TOTAL 0 0 0 0 0 0 0 0 0 0 0 0 0 0 0 0 0 0 - 0 - - 0 - - 0 - - 0 - - 0 - - 0 -
Securitisation andre-securitisations positions deductedfrom capital * 0 0 0 0 0 0 0 0 0 0 0 0
(mln EUR, %)No n-d ef aul t ed De fau lt e d No n-d ef aul t ed De fau lt e d No n-d ef aul t ed De fau lt e d No n-d ef aul t e d De fau lt e d No n-d ef aul t ed De fau lt e d No n-d ef aul t e d De fau lt e d No n-d ef aul t ed De fau lt e d No n-d ef aul t ed De fau lt e d No n-d ef aul t ed De fau lt e d
Impairment
rate
Stockof
ProvisionsCoverage Ratio -
Default Stock
Impairment
rate
Stockof
Provisions
Coverage
Ratio-Default
Stock
Impairment
rate
Stockof
Provisions
Coverage
Ratio -Default
Stock
Impairment rateStockof
Provisions
Coverage
Ratio-Default
Stock
Impairment
rate
Stockof
Provisions
Coverage
Ratio-Default
Stock
Impairment
rate
Stockof
Provisions
Coverage
Ratio -Default
Stock Central banksandcentral governments 0 0 0 0 0 0 0 0 0 0 0 0 0 0 0 0 0 0 - 0 - - 0 - - 0 - - 0 - - 0 - - 0 -
Institutions 0 0 0 0 0 0 0 0 0 0 0 0 0 0 0 0 0 0 - 0 - - 0 - - 0 - - 0 - - 0 - - 0 -
Corporates 0 0 0 0 0 0 0 0 0 0 0 0 0 0 0 0 0 0 - 0 - - 0 - - 0 - - 0 - - 0 - - 0 -
Corporates -Of Which:SpecialisedLending 0 0 0 0 0 0 0 0 0 0 0 0 0 0 0 0 0 0 - 0 - - 0 - - 0 - - 0 - - 0 - - 0 -
Corporates -Of Which:SME 0 0 0 0 0 0 0 0 0 0 0 0 0 0 0 0 0 0 - 0 - - 0 - - 0 - - 0 - - 0 - - 0 -
Retail 0 0 0 0 0 0 0 0 0 0 0 0 0 0 0 0 0 0 - 0 - - 0 - - 0 - - 0 - - 0 - - 0 -
Retail -Securedon real estateproperty 0.0% 0 0 0 0 0 0 0 0 0 0 0 0 0 0 0 0 0 0 - 0 - - 0 - - 0 - - 0 - - 0 - - 0 -
Retail -Securedon real estate property- Of
h i h : S E0.0% 0 0 0 0 0 0 0 0 0 0 0 0 0 0 0 0 0 0 - 0 - - 0 - - 0 - - 0 - - 0 - - 0 -
Retail -Securedon real estate property- Of
h i h: n n - E0.0% 0 0 0 0 0 0 0 0 0 0 0 0 0 0 0 0 0 0 - 0 - - 0 - - 0 - - 0 - - 0 - - 0 -
Retail -QualifyingRevolving 0 0 0 0 0 0 0 0 0 0 0 0 0 0 0 0 0 0 - 0 - - 0 - - 0 - - 0 - - 0 - - 0 -
Retail -OtherRetail 0 0 0 0 0 0 0 0 0 0 0 0 0 0 0 0 0 0 - 0 - - 0 - - 0 - - 0 - - 0 - - 0 -
Retail -Other Retail -Of Which:SME 0 0 0 0 0 0 0 0 0 0 0 0 0 0 0 0 0 0 - 0 - - 0 - - 0 - - 0 - - 0 - - 0 -
LTV %(asof
31/12/2013)
Exposure values (as of 31/12/2013) Risk exposure amounts (as of 31/12/2013) Value adjustments and provisions (as of 31/12/2013) Baseline Scenario Adverse Scenario
F-IRB A-IRB STA F-IRB A-IRB STA F-IRB a sof 31 /12 /2 01 4 a so f3 1/ 12 /2 01 5 a sof 31 /12 /2 01 6 A-IRB STA a sof 31 /1 2/ 20 14 a so f3 1/ 12 /2 01 5 a sof 31 /12 /2 01 6
LTV %(asof
31/12/2013)
Exposure values (as of 31/12/2013) Risk exposure amounts (as of 31/12/2013) Value adjustments and provisions (as of 31/12/2013) Baseline Scenario Adverse Scenario
F-IRB A-IRB STA F-IRB A-IRB STA F-IRB A-IRB a s of 3 1/ 12 /2 01 5 a s of 3 1/ 12 /2 01 6STA as of 31/12/2014 as of 31/12/2015 as of 31/12/2016 as of 31/12/2014
AdverseScenario
F-IRB A-IRB STA F-IRB A-IRB STA F-IRB A-IRB STA as of 31/12/2014 as of 31/12/2015 as of 31/12/2016 as of 31/12/2014 as of 31/12/2015 as of 31/12/2016LTV %(asof
31/12/2013)
E xp os ur e va lu es ( as of 3 1/ 12 /2 01 3) R is k e xp os ur e am ou nt s (a s of 3 1/ 12 /2 01 3) V al ue a dj us tm en ts a nd pr ov is io ns ( as o f3 1/ 12 /2 01 3)
AdverseScenario
F-IRB A-IRB STA F-IRB A-IRB STA F-IRB A-IRB STA as of 31/12/2014 as of 31/12/2015 as of 31/12/2016 as of 31/12/2014 as of 31/12/2015 as of 31/12/2016LTV %(asof
31/12/2013)
E xp os ur e va lu es ( as of 3 1/ 12 /2 01 3) R is k e xp os ur e am ou nt s (a s of 3 1/ 12 /2 01 3)
BaselineScenario
Valueadjustmentsand provisions(asof 31/12/2013) BaselineScenario
(*)Referstothepart ofSecuritizationexposurethat isdeductedfrom capital andisnot includedinRWA
(*)Referstothepart ofSecuritizationexposurethat isdeductedfrom capital andisnot includedinRWA
(*)Referstothepart ofSecuritizationexposurethat isdeductedfrom capital andisnot includedinRWA
0
0
0
0

8/10/2019 Test Stress Banca Española 2014
http://slidepdf.com/reader/full/test-stress-banca-espanola-2014 228/240
Retail -Other Retail -Of Which:non-SME 0 0 0 0 0 0 0 0 0 0 0 0 0 0 0 0 0 0 - 0 - - 0 - - 0 - - 0 - - 0 - - 0 -
Equity 0 0 0 0 0 0 0 0 0 0 0 0 0 0 0 0 0 0 - 0 - - 0 - - 0 - - 0 - - 0 - - 0 -
Securitisation 0 0 0 0 0 0 0 0 0 0 0 0 0 0 0 0 0 0
Othernon-credit obligation assets 0 0 0 0 0 0 0 0 0 0 0 0 0 0 0 0 0 0
TOTAL 0 0 0 0 0 0 0 0 0 0 0 0 0 0 0 0 0 0 - 0 - - 0 - - 0 - - 0 - - 0 - - 0 -Securitisation andre-securitisations positions deductedfrom capital * 0 0 0 0 0 0 0 0 0 0 0 0
(mln EUR, %)No n-d ef aul t ed De fau lt e d No n-d ef aul t ed De fau lt e d No n-d ef aul t ed De fau lt e d No n-d ef aul t e d De fau lt e d No n-d ef aul t ed De fau lt e d No n-d ef aul t e d De fau lt e d No n-d ef aul t ed De fau lt e d No n-d ef aul t ed De fau lt e d No n-d ef aul t ed De fau lt e d Impairment
rateStockof
ProvisionsCoverage Ratio -
Default Stock Impairment
rateStockof
Provisions
Coverage
Ratio-DefaultStock
Impairmentrate
Stockof Provisions
Coverage
Ratio -DefaultStock
Impairment rate Stockof Provisions
Coverage
Ratio-DefaultStock
Impairmentrate
Stockof Provisions
Coverage
Ratio-DefaultStock
Impairmentrate
Stockof Provisions
Coverage
Ratio -DefaultStock
Central banksandcentral governments 0 0 0 0 0 0 0 0 0 0 0 0 0 0 0 0 0 0 - 0 - - 0 - - 0 - - 0 - - 0 - - 0 -
Institutions 0 0 0 0 0 0 0 0 0 0 0 0 0 0 0 0 0 0 - 0 - - 0 - - 0 - - 0 - - 0 - - 0 -
Corporates 0 0 0 0 0 0 0 0 0 0 0 0 0 0 0 0 0 0 - 0 - - 0 - - 0 - - 0 - - 0 - - 0 -
Corporates -Of Which:SpecialisedLending 0 0 0 0 0 0 0 0 0 0 0 0 0 0 0 0 0 0 - 0 - - 0 - - 0 - - 0 - - 0 - - 0 -
Corporates -Of Which:SME 0 0 0 0 0 0 0 0 0 0 0 0 0 0 0 0 0 0 - 0 - - 0 - - 0 - - 0 - - 0 - - 0 -
Retail 0 0 0 0 0 0 0 0 0 0 0 0 0 0 0 0 0 0 - 0 - - 0 - - 0 - - 0 - - 0 - - 0 -
Retail -Securedon real estateproperty 0.0% 0 0 0 0 0 0 0 0 0 0 0 0 0 0 0 0 0 0 - 0 - - 0 - - 0 - - 0 - - 0 - - 0 -
Retail -Securedon real estate property- Of
hi h: E0.0% 0 0 0 0 0 0 0 0 0 0 0 0 0 0 0 0 0 0 - 0 - - 0 - - 0 - - 0 - - 0 - - 0 -
Retail -Securedon real estate property- Of
h i h : n n -S E0.0% 0 0 0 0 0 0 0 0 0 0 0 0 0 0 0 0 0 0 - 0 - - 0 - - 0 - - 0 - - 0 - - 0 -
Retail -QualifyingRevolving 0 0 0 0 0 0 0 0 0 0 0 0 0 0 0 0 0 0 - 0 - - 0 - - 0 - - 0 - - 0 - - 0 -
Retail -OtherRetail 0 0 0 0 0 0 0 0 0 0 0 0 0 0 0 0 0 0 - 0 - - 0 - - 0 - - 0 - - 0 - - 0 -
Retail -Other Retail -Of Which:SME 0 0 0 0 0 0 0 0 0 0 0 0 0 0 0 0 0 0 - 0 - - 0 - - 0 - - 0 - - 0 - - 0 -
Retail -Other Retail -Of Which:non-SME 0 0 0 0 0 0 0 0 0 0 0 0 0 0 0 0 0 0 - 0 - - 0 - - 0 - - 0 - - 0 - - 0 -
Equity 0 0 0 0 0 0 0 0 0 0 0 0 0 0 0 0 0 0 - 0 - - 0 - - 0 - - 0 - - 0 - - 0 -
Securitisation 0 0 0 0 0 0 0 0 0 0 0 0 0 0 0 0 0 0
Othernon-credit obligation assets 0 0 0 0 0 0 0 0 0 0 0 0 0 0 0 0 0 0
TOTAL 0 0 0 0 0 0 0 0 0 0 0 0 0 0 0 0 0 0 - 0 - - 0 - - 0 - - 0 - - 0 - - 0 -Securitisation andre-securitisations positions deductedfrom capital * 0 0 0 0 0 0 0 0 0 0 0 0
LTV %(asof
31/12/2013)
Exposure values (as of 31/12/2013) Risk exposure amounts (as of 31/12/2013) Value adjustments and provisions (as of 31/12/2013) Baseline Scenario Adverse Scenario
F-IRB A-IRB STA F-IRB A-IRB STA as of 31/12/2016 as of 31/12/2014 as of 31/12/2015 as of 31/12/2016F-IRB A-IRB STA a s of 3 1/ 12 /2 01 4 a s of 3 1/ 12 /2 01 5
(*)Referstothepart ofSecuritizationexposurethat isdeductedfrom capital andisnot includedinRWA
(*)Referstothepart ofSecuritizationexposurethat isdeductedfrom capital andisnot includedinRWA
0
http://www.economiaciudadana.org/
2014 EU-wide Stress Test
P&L
(mln EUR) 31/12/2014 31/12/2015 31/12/2016 31/12/2014 31/12/2015 31/12/2016
Net interest income 635 590 613 620 453 533 506
Net trading income -5 -3 -3 -8 -5 -4
of which trading losses from stress scenarios -3 -2 -1 -6 -4 -3
Other operating income 655 90 85 75 55 52 44
Operating profit before impairments 855 372 407 428 189 284 274
Impairment of financial assets (-) -844 -234 -264 -229 -615 -500 -386
Impairment of financial assets other than instruments designated at fair value
through P&L (-)-619 -234 -264 -229 -615 -500 -386
Impairment Financial assets designated at fair value through P&L (-) -225 0 0 0 0 0 0
Impairment on non financial assets (-) -130 0 0 0 -2 -2 -2
Operating profit after impairments from stress scenarios -119 138 144 199 -428 -218 -114
Other Income and expenses -322 0 0 0 -1 -1 -1
Pre-Tax profit -441 138 144 199 -429 -219 -115
Tax 441 -41 -43 -60 129 66 34
Net income 1 97 101 139 -300 -153 -80
Attributable to owners of the parent 1 97 101 139 -300 -153 -80
of which carried over to capital through retained earnings 1 97 101 139 -300 -153 -80
of which distributed as dividends 0 0 0 0 0 0 0
I th fi b th i i l ( ffi i l bli h d) 2013 P&L fi h b dj t d t f th ECB C h i A t j i l l ti
31/12/2013
Baseline Scenario Adverse Scenario

8/10/2019 Test Stress Banca Española 2014
http://slidepdf.com/reader/full/test-stress-banca-espanola-2014 229/240
In the figures above, the original (official published) 2013 P&L figures may have been adjusted as part of the ECB Comprehensive Assessment join-up calculation.
http://www.economiaciudadana.org/
2014 EU-wide Stress Test
RWA
(mln EUR)as of 31/12/2013 as of 31/12/2014 as of 31/12/2015 as of 31/12/2016 as of 31/12/2014 as of 31/12/2015 as of 31/12/2016
Risk exposure amount for credit risk 24,175 22,028 21,000 19,684 22,567 21,758 20,557
Risk exposure amount Securitisation and re-securitisations 1,288 1,341 1,368 1,384 1,486 1,598 1,669
Risk exposure amount Other credit risk 22,887 20,688 19,632 18,300 21,081 20,160 18,888
Risk exposure amount for market risk 38 38 38 38 38 38 38
Risk exposure amount for operational risk 1,731 1,731 1,731 1,731 1,731 1,731 1,731
Transitional floors for Risk exposure amount 0 0 0 0 0 0 0
AQR adjustments (for SSM countries only) 14 14 14 14 14 14 14
Total Risk exposure amount 25,958 23,811 22,782 21,467 24,350 23,541 22,340
Baseline Scenario Adverse Scenario

8/10/2019 Test Stress Banca Española 2014
http://slidepdf.com/reader/full/test-stress-banca-espanola-2014 230/240
http://www.economiaciudadana.org/
(mln EUR) as of 31/12/2013 31/12/2014 31/12/2015 31/12/2016 31/12/2014 31/12/2015 31/12/2016
Banking Book 870
Trading Book (excl. correlation trading positions under CRM) 0
Correlation Trading Portfolio (CRM) 0
Total 871
Banking Book 1,288 1,340 1,367 1,384 1,486 1,598 1,669
Trading Book (excl. correlation trading positions under CRM) 0 0 0 0 0 0 0
Total 1,288 1,341 1,368 1,384 1,486 1,598 1,669
Hold to Maturity porfolio 0 3 5 7 3 6 9
Available for Sale porfolio 0 1 2 3 1 3 4
Held for trading portfolio
Total 0 4 7 10 4 9 13
2014 EU-wide Stress Test
Impairments
Baseline scenario Adverse scenario
Exposure values
Risk exposure values
Securitisation

8/10/2019 Test Stress Banca Española 2014
http://slidepdf.com/reader/full/test-stress-banca-espanola-2014 231/240
http://www.economiaciudadana.org/
2014 EU-wide Stress Test - Sovereign Exposure
(mln EUR)
[ 0 - 3M [ 0 0 0 0 0 0 0 0 0 0 0 0 0 0
[ 3M - 1Y [ 0 0 0 0 0 0 0 0 0 0 0 0 0 0
[ 1Y - 2Y [ 0 0 0 0 0 0 0 0 0 0 0 0 0 0
[ 2Y - 3Y [ 0 0 0 0 0 0 0 0 0 0 0 0 0 0
[3Y - 5Y [ 0 0 0 0 0 0 0 0 0 0 0 0 0 0
[5Y - 10Y [ 0 0 0 0 0 0 0 0 0 0 0 0 0 0
[10Y - more 0 0 0 0 0 0 0 0 0 0 0 0 0 0Tot 0 0 0 0 0 0 0 0 0 0 0 0 0 0
[ 0 - 3M [ 0 0 0 0 0 0 0 0 0 0 0 0 0 0
[ 3M - 1Y [ 0 0 0 0 0 0 0 0 0 0 0 0 0 0
[ 1Y - 2Y [ 0 0 0 0 0 0 0 0 0 0 0 0 0 0
[ 2Y - 3Y [ 0 0 0 0 0 0 0 0 0 0 0 0 0 0
[3Y - 5Y [ 0 0 0 0 0 0 0 0 0 0 0 0 0 0
[5Y - 10Y [ 0 0 0 0 0 0 0 0 0 0 0 0 0 0
[10Y - more 0 0 0 0 0 0 0 0 0 0 0 0 0 0
Tot 0 0 0 0 0 0 0 0 0 0 0 0 0 0
[ 0 - 3M [ 0 0 0 0 0 0 0 0 0 0 0 0 0 0
[ 3M - 1Y [ 0 0 0 0 0 0 0 0 0 0 0 0 0 0
[ 1Y - 2Y [ 0 0 0 0 0 0 0 0 0 0 0 0 0 0
[ 2Y - 3Y [ 0 0 0 0 0 0 0 0 0 0 0 0 0 0
[3Y - 5Y [ 0 0 0 0 0 0 0 0 0 0 0 0 0 0
[5Y - 10Y [ 0 0 0 0 0 0 0 0 0 0 0 0 0 0
[10Y - more 0 0 0 0 0 0 0 0 0 0 0 0 0 0
Residual Maturity Country / Region
GROSS DIRECT LONG
EXPOSURES(accounting value gross
of provisions)
(1)
NET DIRECT POSITIONS (gross exposures (long) net of cash short
positions of sovereign debt to other counterpaties only where there
is a maturity matching)
(1)
DIRECT SOVEREIGN EXPOSURES IN DERIVATIVES (1)
of which: loans
and advances
of which: AFS
banking book
of which: FVO
(designated at fair
value through
profit&loss)
banking book
of which: Financial
assets held for
trading
(2)
Derivatives with positive fair value at
31/12/2013
Derivatives with negative fair value at
31/12/2013
Derivatives with positive fair value
at 31/12/2013
Derivatives with negative fair
value at 31/12/2013
VALUES AS OF 31/12/2013 VALUES AS OF 31/12/2013 VALUES AS OF 31/12/2013
INDIRECT SOVEREIGN EXPOSURES (3) (on and off balance sheet)
Fair-value at
31/12/2013 (+)Notional value
Fair-value at
31/12/2013 (-)Notional value
Fair-value at
31/12/2013 (+)Notional value
Fair-value at 31/12/2013
(-)
Austria
Belgium
Bulgaria
Cyprus
Notional value

8/10/2019 Test Stress Banca Española 2014
http://slidepdf.com/reader/full/test-stress-banca-espanola-2014 232/240
[10Y more 0 0 0 0 0 0 0 0 0 0 0 0 0 0
Tot 0 0 0 0 0 0 0 0 0 0 0 0 0 0
[ 0 - 3M [ 0 0 0 0 0 0 0 0 0 0 0 0 0 0
[ 3M - 1Y [ 0 0 0 0 0 0 0 0 0 0 0 0 0 0
[ 1Y - 2Y [ 0 0 0 0 0 0 0 0 0 0 0 0 0 0
[ 2Y - 3Y [ 0 0 0 0 0 0 0 0 0 0 0 0 0 0
[3Y - 5Y [ 0 0 0 0 0 0 0 0 0 0 0 0 0 0
[5Y - 10Y [ 0 0 0 0 0 0 0 0 0 0 0 0 0 0
[10Y - more 0 0 0 0 0 0 0 0 0 0 0 0 0 0
Tot 0 0 0 0 0 0 0 0 0 0 0 0 0 0
[ 0 - 3M [ 0 0 0 0 0 0 0 0 0 0 0 0 0 0
[ 3M - 1Y [ 0 0 0 0 0 0 0 0 0 0 0 0 0 0
[ 1Y - 2Y [ 0 0 0 0 0 0 0 0 0 0 0 0 0 0
[ 2Y - 3Y [ 0 0 0 0 0 0 0 0 0 0 0 0 0 0
[3Y - 5Y [ 0 0 0 0 0 0 0 0 0 0 0 0 0 0
[5Y - 10Y [ 0 0 0 0 0 0 0 0 0 0 0 0 0 0[10Y - more 0 0 0 0 0 0 0 0 0 0 0 0 0 0
Tot 0 0 0 0 0 0 0 0 0 0 0 0 0 0
Czech Republic
Denmark
Estonia
Finland
France
http://www.economiaciudadana.org/

8/10/2019 Test Stress Banca Española 2014
http://slidepdf.com/reader/full/test-stress-banca-espanola-2014 233/240

8/10/2019 Test Stress Banca Española 2014
http://slidepdf.com/reader/full/test-stress-banca-espanola-2014 234/240
2014 EU-wide Stress Test - Sovereign Exposure
(mln EUR)
Residual Maturity Country / Region
GROSS DIRECT LONG
EXPOSURES(accounting value gross
of provisions)
(1)
NET DIRECT POSITIONS (gross exposures (long) net of cash short
positions of sovereign debt to other counterpaties only where there
is a maturity matching)
(1)
DIRECT SOVEREIGN EXPOSURES IN DERIVATIVES (1)
of which: loans
and advances
of which: AFS
banking book
of which: FVO
(designated at fair
value through
profit&loss)
banking book
of which: Financial
assets held for
trading
(2)
Derivatives with positive fair value at
31/12/2013
Derivatives with negative fair value at
31/12/2013
Derivatives with positive fair value
at 31/12/2013
Derivatives with negative fair
value at 31/12/2013
VALUES AS OF 31/12/2013 VALUES AS OF 31/12/2013 VALUES AS OF 31/12/2013
INDIRECT SOVEREIGN EXPOSURES (3) (on and off balance sheet)
Fair-value at
31/12/2013 (+)Notional value
Fair-value at
31/12/2013 (-)Notional value
Fair-value at
31/12/2013 (+)Notional value
Fair-value at 31/12/2013
(-)Notional value
[ 0 - 3M [ 0 0 0 0 0 0 0 0 0 0 0 0 0 0
[ 3M - 1Y [ 0 0 0 0 0 0 0 0 0 0 0 0 0 0
[ 1Y - 2Y [ 0 0 0 0 0 0 0 0 0 0 0 0 0 0
[ 2Y - 3Y [ 0 0 0 0 0 0 0 0 0 0 0 0 0 0
[3Y - 5Y [ 0 0 0 0 0 0 0 0 0 0 0 0 0 0
[5Y - 10Y [ 0 0 0 0 0 0 0 0 0 0 0 0 0 0
[10Y - more 0 0 0 0 0 0 0 0 0 0 0 0 0 0Tot 0 0 0 0 0 0 0 0 0 0 0 0 0 0
[ 0 - 3M [ 1,092 187 1,092 77 0 0 0 0 0 0 0 0 0 0
[ 3M - 1Y [ 3,415 284 3,415 211 0 0 0 0 0 0 0 0 0 0
[ 1Y - 2Y [ 994 83 994 310 0 0 0 0 0 0 0 0 0 0
[ 2Y - 3Y [ 2,086 63 2,086 661 0 0 0 0 0 0 0 0 0 0
[3Y - 5Y [ 1,283 258 1,283 54 0 0 0 0 0 0 0 0 0 0
[5Y - 10Y [ 546 263 546 228 0 0 0 0 0 0 0 0 0 0
[10Y - more 130 97 130 3 0 0 0 0 0 0 0 0 0 0
Tot 9,546 1,233 9,546 1,544 0 0 0 0 0 0 0 0 0 0
[ 0 - 3M [ 0 0 0 0 0 0 0 0 0 0 0 0 0 0
[ 3M - 1Y [ 0 0 0 0 0 0 0 0 0 0 0 0 0 0
[ 1Y - 2Y [ 0 0 0 0 0 0 0 0 0 0 0 0 0 0
[ 2Y - 3Y [ 0 0 0 0 0 0 0 0 0 0 0 0 0 0
[3Y - 5Y [ 0 0 0 0 0 0 0 0 0 0 0 0 0 0
[5Y - 10Y [ 0 0 0 0 0 0 0 0 0 0 0 0 0 0
[10Y - more 0 0 0 0 0 0 0 0 0 0 0 0 0 0
Tot 0 0 0 0 0 0 0 0 0 0 0 0 0 0
[ 0 - 3M [ 0 0 0 0 0 0 0 0 0 0 0 0 0 0
[ 3M - 1Y [ 0 0 0 0 0 0 0 0 0 0 0 0 0 0
[ 1Y - 2Y [ 0 0 0 0 0 0 0 0 0 0 0 0 0 0
[ 2Y - 3Y [ 0 0 0 0 0 0 0 0 0 0 0 0 0 0
[3Y - 5Y [ 0 0 0 0 0 0 0 0 0 0 0 0 0 0
[5Y - 10Y [ 0 0 0 0 0 0 0 0 0 0 0 0 0 0
[10Y - more 0 0 0 0 0 0 0 0 0 0 0 0 0 0
Tot 0 0 0 0 0 0 0 0 0 0 0 0 0 0
Spain
Slovenia
Sweden
United Kingdom

8/10/2019 Test Stress Banca Española 2014
http://slidepdf.com/reader/full/test-stress-banca-espanola-2014 235/240
Tot 0 0 0 0 0 0 0 0 0 0 0 0 0 0
[ 0 - 3M [ 0 0 0 0 0 0 0 0 0 0 0 0 0 0
[ 3M - 1Y [ 0 0 0 0 0 0 0 0 0 0 0 0 0 0
[ 1Y - 2Y [ 0 0 0 0 0 0 0 0 0 0 0 0 0 0
[ 2Y - 3Y [ 0 0 0 0 0 0 0 0 0 0 0 0 0 0
[3Y - 5Y [ 0 0 0 0 0 0 0 0 0 0 0 0 0 0
[5Y - 10Y [ 0 0 0 0 0 0 0 0 0 0 0 0 0 0
[10Y - more 0 0 0 0 0 0 0 0 0 0 0 0 0 0Tot 0 0 0 0 0 0 0 0 0 0 0 0 0 0
[ 0 - 3M [ 0 0 0 0 0 0 0 0 0 0 0 0 0 0
[ 3M - 1Y [ 0 0 0 0 0 0 0 0 0 0 0 0 0 0
[ 1Y - 2Y [ 0 0 0 0 0 0 0 0 0 0 0 0 0 0
[ 2Y - 3Y [ 0 0 0 0 0 0 0 0 0 0 0 0 0 0
[3Y - 5Y [ 0 0 0 0 0 0 0 0 0 0 0 0 0 0
[5Y - 10Y [ 0 0 0 0 0 0 0 0 0 0 0 0 0 0
[10Y - more 0 0 0 0 0 0 0 0 0 0 0 0 0 0
Tot 0 0 0 0 0 0 0 0 0 0 0 0 0 0
[ 0 - 3M [ 0 0 0 0 0 0 0 0 0 0 0 0 0 0
[ 3M - 1Y [ 0 0 0 0 0 0 0 0 0 0 0 0 0 0
[ 1Y - 2Y [ 0 0 0 0 0 0 0 0 0 0 0 0 0 0
[ 2Y - 3Y [ 0 0 0 0 0 0 0 0 0 0 0 0 0 0
[3Y - 5Y [ 0 0 0 0 0 0 0 0 0 0 0 0 0 0
[5Y - 10Y [ 0 0 0 0 0 0 0 0 0 0 0 0 0 0[10Y - more 0 0 0 0 0 0 0 0 0 0 0 0 0 0
Tot 0 0 0 0 0 0 0 0 0 0 0 0 0 0
Australia
Canada
Hong Kong
Japan
U.S.
http://www.economiaciudadana.org/
2014 EU-wide Stress Test - Sovereign Exposure
(mln EUR)
Residual Maturity Country / Region
GROSS DIRECT LONG
EXPOSURES(accounting value gross
of provisions)
(1)
NET DIRECT POSITIONS (gross exposures (long) net of cash short
positions of sovereign debt to other counterpaties only where there
is a maturity matching)
(1)
DIRECT SOVEREIGN EXPOSURES IN DERIVATIVES (1)
of which: loans
and advances
of which: AFS
banking book
of which: FVO
(designated at fair
value through
profit&loss)
banking book
of which: Financial
assets held for
trading
(2)
Derivatives with positive fair value at
31/12/2013
Derivatives with negative fair value at
31/12/2013
Derivatives with positive fair value
at 31/12/2013
Derivatives with negative fair
value at 31/12/2013
VALUES AS OF 31/12/2013 VALUES AS OF 31/12/2013 VALUES AS OF 31/12/2013
INDIRECT SOVEREIGN EXPOSURES (3) (on and off balance sheet)
Fair-value at
31/12/2013 (+)Notional value
Fair-value at
31/12/2013 (-)Notional value
Fair-value at
31/12/2013 (+)Notional value
Fair-value at 31/12/2013
(-)Notional value
[ 0 - 3M [ 0 0 0 0 0 0 0 0 0 0 0 0 0 0
[ 3M - 1Y [ 0 0 0 0 0 0 0 0 0 0 0 0 0 0
[ 1Y - 2Y [ 0 0 0 0 0 0 0 0 0 0 0 0 0 0
[ 2Y - 3Y [ 0 0 0 0 0 0 0 0 0 0 0 0 0 0
[3Y - 5Y [ 0 0 0 0 0 0 0 0 0 0 0 0 0 0
[5Y - 10Y [ 0 0 0 0 0 0 0 0 0 0 0 0 0 0
[10Y - more 0 0 0 0 0 0 0 0 0 0 0 0 0 0Tot 0 0 0 0 0 0 0 0 0 0 0 0 0 0
[ 0 - 3M [ 0 0 0 0 0 0 0 0 0 0 0 0 0 0
[ 3M - 1Y [ 0 0 0 0 0 0 0 0 0 0 0 0 0 0
[ 1Y - 2Y [ 0 0 0 0 0 0 0 0 0 0 0 0 0 0
[ 2Y - 3Y [ 0 0 0 0 0 0 0 0 0 0 0 0 0 0
[3Y - 5Y [ 0 0 0 0 0 0 0 0 0 0 0 0 0 0
[5Y - 10Y [ 0 0 0 0 0 0 0 0 0 0 0 0 0 0
[10Y - more 0 0 0 0 0 0 0 0 0 0 0 0 0 0
Tot 0 0 0 0 0 0 0 0 0 0 0 0 0 0
[ 0 - 3M [ 0 0 0 0 0 0 0 0 0 0 0 0 0 0
[ 3M - 1Y [ 0 0 0 0 0 0 0 0 0 0 0 0 0 0
[ 1Y - 2Y [ 0 0 0 0 0 0 0 0 0 0 0 0 0 0
[ 2Y - 3Y [ 0 0 0 0 0 0 0 0 0 0 0 0 0 0
[3Y - 5Y [ 0 0 0 0 0 0 0 0 0 0 0 0 0 0
[5Y - 10Y [ 0 0 0 0 0 0 0 0 0 0 0 0 0 0
[10Y - more 0 0 0 0 0 0 0 0 0 0 0 0 0 0
Tot 0 0 0 0 0 0 0 0 0 0 0 0 0 0
China
Switzerland
Other advanced economies
non EEA
Other Central and eastern
Europe countries non EEA

8/10/2019 Test Stress Banca Española 2014
http://slidepdf.com/reader/full/test-stress-banca-espanola-2014 236/240
Tot 0 0 0 0 0 0 0 0 0 0 0 0 0 0
[ 0 - 3M [ 0 0 0 0 0 0 0 0 0 0 0 0 0 0
[ 3M - 1Y [ 0 0 0 0 0 0 0 0 0 0 0 0 0 0
[ 1Y - 2Y [ 0 0 0 0 0 0 0 0 0 0 0 0 0 0
[ 2Y - 3Y [ 0 0 0 0 0 0 0 0 0 0 0 0 0 0
[3Y - 5Y [ 0 0 0 0 0 0 0 0 0 0 0 0 0 0
[5Y - 10Y [ 0 0 0 0 0 0 0 0 0 0 0 0 0 0
[10Y - more 0 0 0 0 0 0 0 0 0 0 0 0 0 0Tot 0 0 0 0 0 0 0 0 0 0 0 0 0 0
[ 0 - 3M [ 0 0 0 0 0 0 0 0 0 0 0 0 0 0
[ 3M - 1Y [ 0 0 0 0 0 0 0 0 0 0 0 0 0 0
[ 1Y - 2Y [ 0 0 0 0 0 0 0 0 0 0 0 0 0 0
[ 2Y - 3Y [ 0 0 0 0 0 0 0 0 0 0 0 0 0 0
[3Y - 5Y [ 0 0 0 0 0 0 0 0 0 0 0 0 0 0
[5Y - 10Y [ 0 0 0 0 0 0 0 0 0 0 0 0 0 0
[10Y - more 0 0 0 0 0 0 0 0 0 0 0 0 0 0
Tot 0 0 0 0 0 0 0 0 0 0 0 0 0 0
[ 0 - 3M [ 0 0 0 0 0 0 0 0 0 0 0 0 0 0
[ 3M - 1Y [ 0 0 0 0 0 0 0 0 0 0 0 0 0 0
[ 1Y - 2Y [ 0 0 0 0 0 0 0 0 0 0 0 0 0 0
[ 2Y - 3Y [ 0 0 0 0 0 0 0 0 0 0 0 0 0 0
[3Y - 5Y [ 0 0 0 0 0 0 0 0 0 0 0 0 0 0
[5Y - 10Y [ 0 0 0 0 0 0 0 0 0 0 0 0 0 0
[10Y - more 0 0 0 0 0 0 0 0 0 0 0 0 0 0
Tot 0 0 0 0 0 0 0 0 0 0 0 0 0 0
[ 0 - 3M [ 0 0 0 0 0 0 0 0 0 0 0 0 0 0
[ 3M - 1Y [ 0 0 0 0 0 0 0 0 0 0 0 0 0 0
[ 1Y - 2Y [ 0 0 0 0 0 0 0 0 0 0 0 0 0 0
[ 2Y - 3Y [ 0 0 0 0 0 0 0 0 0 0 0 0 0 0
[3Y - 5Y [ 0 0 0 0 0 0 0 0 0 0 0 0 0 0
[5Y - 10Y [ 0 0 0 0 0 0 0 0 0 0 0 0 0 0
[10Y - more 0 0 0 0 0 0 0 0 0 0 0 0 0 0Tot 0 0 0 0 0 0 0 0 0 0 0 0 0 0
Notes and definitions
(1) The exposures reported cover only exposures to central, regional and local governments on immediate borrower basis, and do not include exposures to other counterparts with full or partial government guarantees
(2) The banks disclose the exposures in the "Financial assets held for trading" portfolio after offsetting the cash short positions having the same maturities.
(3) The exposures reported include the positions towards counterparts (other than sovereign) on sovereign credit risk (i.e. CDS, financial guarantees) booked in all the accounting portfolio (on-off balance sheet).
'Irrespective of the denomination and or accounting classification of the positions the economic substance over the form must be used as a criteria for the identification of the exposures to be included in this column. This item does not include exposures to counterparts (other than sovereign) with full or partial government guarantees by central, regional and local governments
Latin America and the
Caribbean
Africa
Others
Middle East
http://www.economiaciudadana.org/
2014 EU-wide Stress TestCapital
(mln EUR) CRR/ CRDIV DEFINITION OFCAPITAL Asof31/12/2013 Asof31/12/2014 Asof31/12/2015 Asof31/12/2016 Asof31/12/2014 Asof31/12/2015 Asof31/12/2016 COREP CODE REGULATION
A OWN FUNDS 2,643 2,739 2,845 2,981 2,330 2,155 2,043 C A 1 {1 } A rt ic le s 4 (1 18 ) a nd 7 2 of C RR
A.1COMMON EQUITYTIER 1CAPITAL(net ofdeductionsandafter applying
transitional adjustments)2,643 2,739 2,845 2,981 2,330 2,155 2,043 C A 1 {1 .1 .1 } A rt ic le 5 0 of C RR
A.1.1Capitalinstrumentseligible asCET1Capital(including share premium and net own
capitalinstruments)7,848 7,848 7,848 7,848 7,848 7,848 7,848 CA1 {1.1.1.1}
Articles 26(1) points (a) and(b), 27to29, 36(1) point (f)
and42ofCRR
A.1.1.1 Ofwhich: CET1instrumentssubscribed byGovernment 0 0 0 0 0 0 0 - -
A.1.2 Retained earnings 1 97 198 337 -300 -453 -533 CA1 {1.1.1.2} Articles 26(1) point (c), 26(2) and36 (1) points (a) and(l)
ofCRR
A.1.3 Accumulated other comprehensive income 16 4 -3 -8 -86 -100 -121 CA1 {1.1.1.3} Articles 4(100), 26(1) point (d) and 36 (1) point (l) of CRR
A.1.3.1 Ofwhich: arising from unrealised gains/lossesfrom Sovereign exposure in AFS
portfolio21 21 21 21 -26 -5 -4 - -
A.1.3.2 Ofwhich: arising from unrealised gains/lossesfrom the rest ofAFS portfolio 41 30 22 18 -15 -48 -71 - -
A.1.4 Other Reserves -5,190 -5,190 -5,190 -5,190 -5,190 -5,190 -5,190 CA1 {1.1.1.4} Articles 4(117) and 26(1) point (e) of CRR
A.1.5 Fundsfor generalbanking risk 0 0 0 0 0 0 0 CA1 {1.1.1.5} Articles 4(112), 26(1) point (f) and 36 (1) point (l) of CRR
A.1.6 Minorityinterest given recognition in CET1capital 23 23 23 23 23 23 23 CA1 {1.1.1.7} Article 84 of CRR
A.1.7 AdjustmentstoCET1 due toprudentialfiltersexcluding those from unrealised
gains/lossesfrom AFS portfolio55 55 55 55 55 55 55 CA1 {1.1.1.9} Articles 32 to 35 of and 36 (1) point (l) of CRR
A.1.8 AdjustmentstoCET1 due toprudentialfiltersfrom unrealised gains/lossesfrom
Sovereign Exposure in AFS portfolio0 0 0 0 0 0 0 -
A.1.9 (-)Intangible assets(including Goodwill) -44 -44 -44 -44 -44 -44 -44CA1{1.1.1.10+
1.1.1.11}
Articles 4(113), 36(1) point (b) and37of CRR. Articles
4(115), 36(1) point (b) and37point (a) of CCR
A.1.10(-)DTAs that relyon future profitabilityand donot arise from temporary
differencesnet ofassociated DTLs0 0 0 0 0 0 0 CA1 {1.1.1.12} Articles 36(1) point (c) and 38 of CRR
A.1.11 (-)IRB shortfallofcredit riskadjustmentsto expected losses 0 0 0 0 0 0 0 CA1 {1.1.1.13} Articles 36(1) point (d), 40 and 159 of CRR
A.1.12 (-)Defined benefit pension fund assets -20 -20 -20 -20 -20 -20 -20 CA1 {1.1.1.14} Articles 4(109), 36(1) point (e) and 41 of CRR
A.1.13 (-)Reciprocalcrossholdingsin CET1Capital 0 0 0 0 0 0 0 CA1 {1.1.1.15} Articles 4(122), 36(1) point (g) and 44 of CRR
A.1.14 (-)Excessdeduction from AT1itemsover AT1Capital 0 0 0 0 0 0 0 CA1 {1.1.1.16} Article 36(1) point (j) of CRR
A.1.15(-)Deductionsrelated toassets which can alternativelybe subject toa 1.250%risk
weight0 0 0 0 0 0 0
CA1{1.1.1.17to
1.1.1.21}
Articles 4(36), 36(1) point (k) (i) and89to 91ofCRR;
Articles 36(1) point (k) (ii), 243(1) point (b), 244(1) point
(b) and258of CRR;Articles 36(1) point k) (iii) and379(3)
ofCRR;Art icles 36(1) point k) (iv) and153(8) ofCRRand
A.1.15.1 Ofwhich: from securitisation positions(-) 0 0 0 0 0 0 0 CA1 {1.1.1.18.1} Articles 36(1) point (k) (ii), 243(1) point (b), 244(1) point
(b) and258of CRR
A.1.16(-)Holdingsof CET1capitalinstrumentsof financialsector entitieswhere the
institiution does not have a significant investment0 0 0 0 0 0 0 CA1 {1.1.1.22}
Articles 4(27), 36(1) point (h);43to46, 49(2) and (3) and
79ofCRR
A.1.17(-)Deductible DTAsthat rely on future profitabilityand arise from temporary
differences0 0 0 0 0 0 0 CA1 {1.1.1.23}
Articles 36(1) point (c) and38;Articles 48(1) point (a) and
48(2) ofCRR
A.1.18(-)Holdingsof CET1capitalinstrumentsof financialsector entitieswhere the
institiution has a significant investment0 0 0 0 0 0 0 CA1 {1.1.1.24}
Articles 4(27);36(1) point (i);43, 45;47; 48(1) point (b);
49(1) to(3) and79of CRR
A.1.19 (-)Amount exceding the 17.65%threshold 0 0 0 0 0 0 0 CA1 {1.1.1.25} Article 470 of CRR
A.1.20 Transitionaladjustments -47 -35 -23 -21 44 35 24CA1{1.1.1.6+ 1.1.8+
1.1.26}-
A.1.20.1 Transitionaladjustmentsdue tograndfathered CET1Capitalinstruments(+/-) 0 0 0 0 0 0 0 CA1 {1.1.1.6}
Articles 483(1) to(3), and484to487of CRR
A.1.20.2 Transitionaladjustmentsdue toadditionalminorityinterests(+/-) -5 -5 -9 -14 -5 -9 -14 CA1 {1.1.1.8}
Articles 479and480of CRR
A.1.20.3Other transitionaladjustmentsto CET1Capitalexcl. adjustmentsfor Sovereign
exposure in AFS (+/-)-42 -30 -14 -7 48 44 38 CA1 {1.1.1.26}
Articles 469to472, 478and 481ofCRR
A.2 ADDITIONAL TIER 1CAPITAL (net ofdeductionsand after transitional
adjustments)0 0 0 0 0 0 0 C A 1 {1 .1 .2 } A rt ic le 6 1 of C RR
A.2.1 Ofwhich:(+) Other existing support government measures 0 0 0 0 0 0 0 - -
Baseline Scenario Adverse Scenario
OWN FUNDS

8/10/2019 Test Stress Banca Española 2014
http://slidepdf.com/reader/full/test-stress-banca-espanola-2014 237/240
( ) g pp g
A.3 TIER1 CAPITAL(netofdeductionsandafter transitional adjustments) 2,643 2,739 2,845 2,981 2,330 2,155 2,043 C A1 { 1. 1} A rt ic le 2 5 of C RR
A.4 TIER2 CAPITAL(netofdeductionsandafter transitional adjustments) 0 0 0 0 0 0 0 C A1 { 1. 2} A rt ic le 7 1 of C RR
B T OT AL R IS K EX PO SU RE A M OU NT 25,958 23,811 22,782 21,467 24,350 23,541 22,340 C A 2 {1 } A rt ic le s 92 (3 ), 95 , 96 a n d 98 o f CR R
B.1ofwhich:stemming from exposuresthat fallbelow the 10%/ 15%limitsfor
CET1deduction (+)0 0 0 0 0 0 0
Articles 36(1) points (a) and(i);Article 38a ndArticle 48of
CRR
B. 2 ofwh ich :s temmi ng f r om fr om CVAcap ita l r eq ui r ements (+) 154 0 0 0 0 0 0 Article 381to386 ofCRR
B.3ofwhich:stemming from higher asset correlation parameter against exposures
tolarge financialinstitutionsunder IRB the IRB approachesto credit risk(+)0 0 0 0 0 0 0 Articles 153(2) ofCRR
B.4ofwhich:stemming from the application ofthe supporting factor to increase
lending toSMEs(-)-164 0 0 0 0 0 0 Recital (44) ofCRR
B.5
ofwhich:stemming from the effect of exposuresthat were previouslypart of
RiskExposure amount and receive a deduction treatment under CRR/CRDIV (-
)
0 0 0 0 0 0 0 -
B.6 ofwhich:otherssubject tothe discretion ofNationalCompetent Authorities 0 0 0 0 0 0 0 Article 124to164 ofCRR
C.1 Co mm onE q ui tyTi er 1Cap i tal r ati o 10.18% 11.50% 12.49% 13.89% 9.57% 9.15% 9.14% CA3 {1} -
C .2 T ie r 1 C ap it al ra ti o 10.18% 11.50% 12.49% 13.89% 9.57% 9.15% 9.14% CA3 {3} -
C .3 T ot al C ap it al r at io 10.18% 11.50% 12.49% 13.89% 9.57% 9.15% 9.14% CA3 {5} -
D Co mm onE q ui tyTi er 1Cap i tal Thresho ld 1,905 1,823 1,717 1,339 1,295 1,229
ETotalamount of instrumentswith mandatoryconversion intoordinarysharesupon
a fixed date in the 2014 -2016period (cumulative conversions)(1)0 0 0 0 0 0
F
TotalAdditionalTier 1and Tier 2 instrumentseligible asregulatorycapitalunder
the CRR provisionsthat convert into Common EquityTier 1or are written down
upon a trigger event (2)
0 0 0
F.1Ofwhich: eligible instrumentswhose trigger isabove CET1capitalratio in the
adverse scenario(2)0 0 0
G FullyLoadedCommonEquityTier 1Capital ratio (3) 13.99% 9.03%
(1)Conversionsnot considered for CET1 computation (2)Excluding instrumentsincluded in E (3)Memorandum item based on a fullyimplemented CRR/CRD IV definition of Common EquityTier 1 capitalincluding 60%ofunrealised gains/lossesfrom Sovereign Exposure in AFS portfolio
Memorandumitems
OWN FUNDS
REQUIREMENTS
CAPITALRATIOS(%) -
Transitional period
http://www.economiaciudadana.org/
2014 EU-wide Stress Test - Restructuring scenarios
(mln EUR)
2013 0 0
2014 44 -2,773 62 -2,748
There are three limits on the Restructuring Plan approved by the European
Commission which affect directly the stress test exercise: Total balance sheet,
gross loans and RWA. Impact in 2014
2015 8 -916 80 -908
There are three limits on the Restructuring Plan approved by the European
Commission which affect directly the stress test exercise: Total balance sheet,
ross loans and RWA. Im act in 2015
2016 113 -1,263 99 -1,229
There are three limits on the Restructuring Plan approved by the European
Commission which affect directly the stress test exercise: Total balance sheet,
gross loans and RWA. Impact in 2016
Total 164 -4,953 241 -4,885
Effects of mandatory restructuring plans publicly announced before 31 December 2013 and formally agreed with the European Commission.
Baseline scenario Adverse scenarioNarrative description of the transactions. (type, date of
completion/commitment, portfolios, subsidiaries, branches)CET1 impact
Risk exposure
amount impactCET1 impact
Risk exposure
amount impact
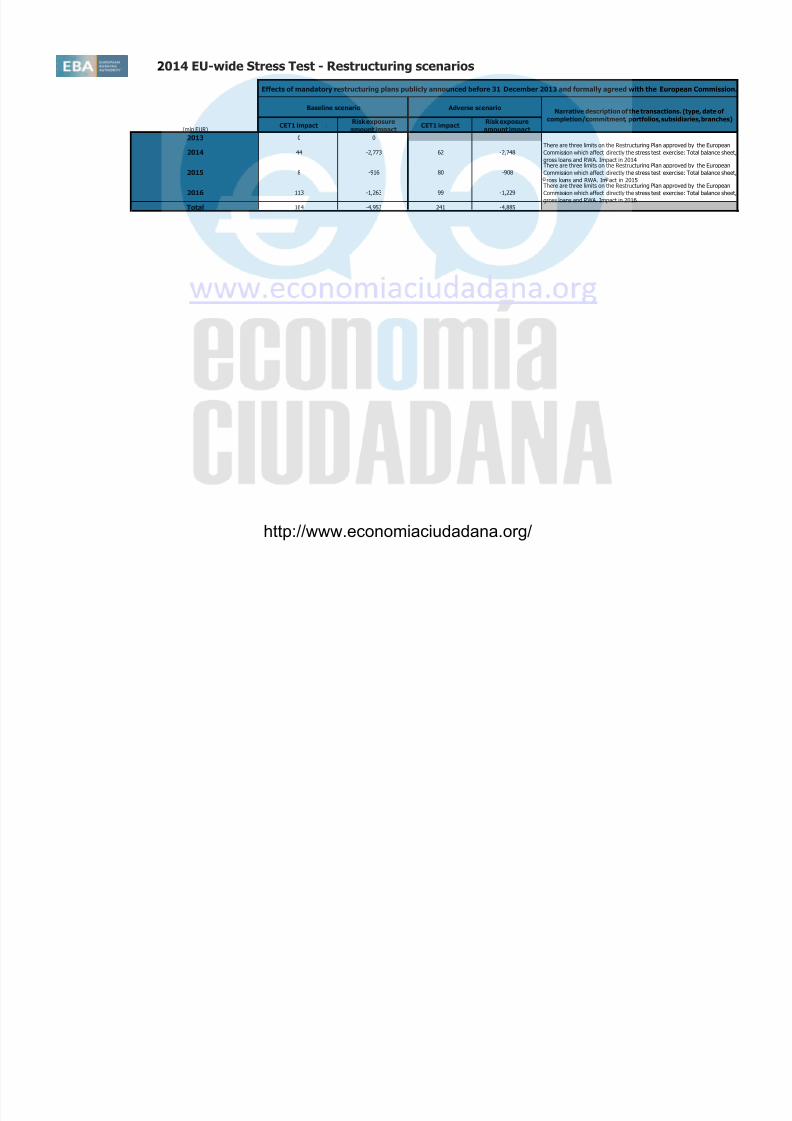
8/10/2019 Test Stress Banca Española 2014
http://slidepdf.com/reader/full/test-stress-banca-espanola-2014 238/240
http://www.economiaciudadana.org/
2014 EU-wide Stress Test
Outcome of the Stress Test based on the Restructuring plan for banks whose plan was formally agreed with the European Commission after 31 December 2013
(mln EUR)
As of
31/12/2013
As of
31/12/2014
As of
31/12/2015
As of
31/12/2016
As of
31/12/2014
As of
31/12/2015
As of
31/12/2016
COMMON EQUITY TIER 1 CAPITAL (net of deductions and after applying transitional adjustments)
TOTAL RISK EXPOSURE AMOUNT
COMMON EQUITY TIER 1 RATIO #DIV/0! #DIV/0! #DIV/0! #DIV/0! #DIV/0! #DIV/0! #DIV/0!
Baseline scenario Adverse scenario

8/10/2019 Test Stress Banca Española 2014
http://slidepdf.com/reader/full/test-stress-banca-espanola-2014 239/240
http://www.economiaciudadana.org/
2014 EU-wide Stress Test
Impact on Common
Equity Tier 1
Million EUR
Raising of capital instruments eligible as CET1 capital (+) 0
Repayment of CET1 capital, buybacks (-) 0
Conversion to CET1 of hybrid instruments becoming effective between 1 January and 30 September 2014 (+) 0
Impact on Additional
Tier 1 and Tier 2
Million EUR
Net issuance of Additional Tier 1 and T2 Instruments with a trigger at or above bank's post stress test CET1 ratio in the adverse
scenario during the stress test horizon (+/-)0
Net issuance of Additional Tier 1 and T2 Instrument with a trigger below bank's post stress test CET1 ratio in the adverse
scenario during the stress test horizon (+/-)0
Major Capital Measures from 1 January to 30 September 2014
Net issuance of Additional Tier 1 and T2 Instruments
Issuance of CET 1 Instruments
Major Capital Measures Impacting Tier 1 and Tier 2 Eligible Capital from 1 January 2014 to 30 September 2014

8/10/2019 Test Stress Banca Española 2014
http://slidepdf.com/reader/full/test-stress-banca-espanola-2014 240/240
g ( / )
Million EUR
Realized fines/litigation costs from 1 January to 30 September 2014 (net of provisions) (-) 0
Other material losses and provisions from 1 January to 30 September 2014 (-) 0
Losses
http://www.economiaciudadana.org/